UNITED STATES
SECURITIES AND EXCHANGE COMMISSION
Washington, D.C. 20549
FORM N-CSR
CERTIFIED SHAREHOLDER REPORT OF REGISTERED
MANAGEMENT INVESTMENT COMPANIES
Investment Company Act file number 811-05583
|
Franklin Templeton Variable Insurance Products Trust |
(Exact name of registrant as specified in charter)
|
| One Franklin Parkway, San Mateo, CA 94403-1906 |
(Address of principal executive offices) (Zip code)
|
| Craig S. Tyle, One Franklin Parkway, San Mateo, CA 94403-1906 |
(Name and address of agent for service)
Registrant’s telephone number, including area code: (650) 312-2000
Date of fiscal year end: 12/31
Date of reporting period: 12/31/10
| Item 1. | Reports to Stockholders. |

DECEMBER 31, 2010
FRANKLIN TEMPLETON
VARIABLE INSURANCE PRODUCTS TRUST
ANNUAL
REPORT

FRANKLIN TEMPLETON VARIABLE INSURANCE PRODUCTS TRUST ANNUAL REPORT
TABLEOF CONTENTS
*Not part of the annual report
NOT FDIC INSURED | MAY LOSE VALUE | NO BANK GUARANTEE
MASTER CLASS – 4
IMPORTANT NOTESTO PERFORMANCE INFORMATION
Performance data is historical and cannot predict or guarantee future results. Principal value and investment return will fluctuate with market conditions, and you may have a gain or loss when you withdraw your money. Inception dates of the funds may have preceded the effective dates of the subaccounts, contracts, or their availability in all states.
When reviewing the index comparisons, please keep in mind that indexes have a number of inherent performance differentials over the funds. First, unlike the funds, which must hold a minimum amount of cash to maintain liquidity, indexes do not have a cash component. Second, the funds are actively managed and, thus, are subject to management fees to cover salaries of securities analysts or portfolio managers in addition to other expenses. Indexes are unmanaged and do not include any commissions or other expenses typically associated with investing in securities. Third, indexes often contain a different mix of securities than the fund to which they are compared. Additionally, please remember that indexes are simply a measure of performance and cannot be invested in directly.
i
FRANKLIN FLEX CAP GROWTH SECURITIES FUND
This annual report for Franklin Flex Cap Growth Securities Fund covers the fiscal year ended December 31, 2010.
Performance Summary as of 12/31/10
Average annual total return of Class 4 shares* represents the average annual change in value, assuming reinvestment of dividends and capital gains. Average returns smooth out variations in returns, which can be significant; they are not the same as year-by-year results.
Periods ended 12/31/10
| | | | | | | | | | | | |
| | | 1-Year | | | 5-Year | | | Since Inception
(3/1/05) | |
Average Annual Total Return | | | +16.08% | | | | +3.68% | | | | +4.18% | |
*For the period beginning 2/29/08, Class 4 performance reflects a 12b-1 fee expense of 0.35% per year, which affects future performance. Class 4 performance prior to 2/29/08 reflects historical Class 2 performance, which includes a 12b-1 fee expense of +0.25% per year. Since 2/29/08 (effective date), the average annual total return of Class 4 shares was +4.38%. The investment manager and administrator have contractually agreed to waive or assume certain expenses so that common expenses of the Fund (excluding Rule 12b-1 fees and acquired fund fees and expenses) do not exceed 0.68% (other than certain nonroutine expenses), until 4/30/11. If the manager and administrator had not waived fees, the Fund’s total returns would have been lower.
Total Return Index Comparison
for a Hypothetical $10,000 Investment (3/1/05–12/31/10)
The graph below shows the change in value of a hypothetical $10,000 investment in the Fund over the indicated period and includes reinvestment of any income or distributions. The Fund’s performance* is compared to the performance of the Russell 1000® Growth Index and the Russell 3000® Growth Index. One cannot invest directly in an index, and an index is not representative of the Fund’s portfolio. Please see Important Notes to Performance Information preceding the Fund Summaries.
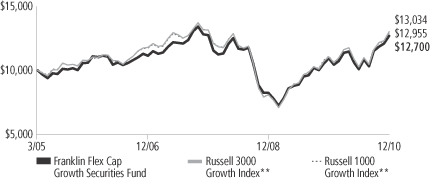
**Source: © 2011 Morningstar. Please see Index Descriptions following the Fund Summaries.
Franklin Flex Cap Growth Securities Fund – Class 4
Performance reflects the Fund’s Class 4 operating expenses, but does not include any contract fees, expenses or sales charges. If they had been included, performance would be lower. These charges and deductions, particularly for variable life policies, can have a significant effect on contract values and insurance benefits. See the contract prospectus for a complete description of these expenses, including sales charges.
Performance data represent past performance, which does not guarantee future results. Investment return and principal value will fluctuate, and you may have a gain or loss when you sell your shares.
Current performance may differ from figures shown.
FFC-1
Fund Goal and Main Investments: Franklin Flex Cap Growth Securities Fund seeks capital appreciation. The Fund normally invests predominantly in equity securities of companies that the manager believes have the potential for capital appreciation.
Performance Overview
You can find the Fund’s one-year total return in the Performance Summary. The Fund performed comparably with the Russell 1000 Growth Index, which had a +16.71% total return, but underperformed the Russell 3000 Growth Index, which had a +17.64% total return, for the same period.1
Economic and Market Overview
During the 12-month period ended December 31, 2010, the U.S. economy grew unevenly, supported by a combination of fundamental business improvement and government intervention. Economic activity as measured by gross domestic product expanded at an annualized 3.7% pace in 2010’s first quarter and then downshifted to 1.7% annualized in the second quarter. Consumer spending picked up, likely due to pent-up post-recession demand, and the pace of growth rose at annualized rates of 2.6% in the third quarter and an estimated 3.2% in the fourth quarter.
Challenges such as mixed economic data, elevated debt concerns surrounding the U.S. budget deficit and a lack of job prospects for the unemployed hindered consumer confidence and the economy’s advance. During the early part of the annual period, home prices rose in many regions due to low interest rates, a first-time homebuyer tax credit program, and prices dipping to levels that lured buyers. Later in the period, home sales stalled as the homebuyer tax credit program ended, foreclosures mounted and the housing sector remained weak.
Amid signs of a demand-led recovery, crude oil prices rose from $79 per barrel at the end of December 2009 to a then 17-month high of $87 in early April. But as doubts surfaced about the recovery’s sustainability, oil prices dipped to $66 in late May. Prices rebounded to $91 per barrel by the end of December 2010 largely due to accelerating global demand. The pace of inflation slowed during the year, and in December 2010 the inflation rate was an annualized 1.5%.2 Similarly, core inflation, which excludes volatile food and energy costs, slowed to a 0.8%
1. Source: © 2011 Morningstar. One cannot invest directly in an index, and an index is not representative of the Fund’s portfolio. Please see Index Descriptions following the Fund Summaries.
2. Source: Bureau of Labor Statistics.
Fund Risks: The Fund’s investments in stocks may offer the potential for long-term gains but can be subject to short-term price fluctuations. Smaller and midsize company securities can increase the risk of greater price fluctuations, particularly over the short term. Smaller, newer or unseasoned companies can also be particularly sensitive to changing economic conditions, and their prospects for growth are less certain than those of larger, more established companies. Foreign investing, especially in emerging markets, involves additional risks, including currency fluctuations, economic instability, market volatility, and political and social instability. The Fund may from time to time have significant investments in particular sectors such as technology, which can be highly volatile. The manager applies various techniques and analyses in making investment decisions for the Fund, but there can be no guarantee that these decisions will produce the desired results. The Fund’s prospectus also includes a description of the main investment risks.
FFC-2
annualized rate.2 Companies added jobs throughout the period, and the unemployment rate fell from 10.0% in December 2009 to 9.4% at period-end.2 The decline was attributable in part to a shrinking labor force as some unemployed workers stopped looking for jobs.
Given few inflationary pressures and uncertainty surrounding the economic recovery, the Federal Open Market Committee (FOMC) made no major changes to its monetary policy for most of the period. The FOMC repeatedly stated it would keep the federal funds target rate within the exceptionally low 0% to 0.25% range “for an extended period” and eventually shifted its focus to its outlook and the status of its current holdings. In September, the FOMC revealed concerns about the subdued recovery and said inflation was below the pace “consistent with its mandate.” Having already lowered interest rates effectively to zero, the FOMC announced its intention to purchase government securities to stimulate the economy and promote a low level of inflation consistent with healthy economic growth.
Investor confidence shifted with each release of encouraging or discouraging economic, regulatory and political news, stoking considerable volatility among equities. Ultimately, stock indexes posted solid gains during the 12 months under review as investor risk aversion began to subside amid generally improving economic signs and rising consumer spending. Overall, the blue-chip stocks of the Dow Jones Industrial Average delivered a +14.06% total return, while the broader Standard & Poor’s 500 Index posted a +15.06% total return and the technology-heavy NASDAQ Composite Index produced a total return of +18.02%.1 During the period, growth stocks outperformed their value counterparts. Performance among the major sectors was positive, with consumer discretionary, industrials and materials making the largest gains, while health care and utilities had weaker results.
Investment Strategy
We use fundamental, bottom-up research to seek companies meeting our criteria of growth potential, quality and valuation. In seeking sustainable growth characteristics, we look for companies we believe can produce sustainable earnings and cash flow growth, evaluating the long-term market opportunity and competitive structure of an industry to target leaders and emerging leaders. We define quality companies as those with strong and improving competitive positions in attractive markets. We also believe important attributes of quality are experienced and talented management teams as well as financial strength reflected in
FFC-3
the capital structure, gross and operating margins, free cash flow generation and returns on capital employed. Our valuation analysis includes a range of potential outcomes based on an assessment of multiple scenarios. In assessing value, we consider whether security prices fully reflect the balance of the sustainable growth opportunities relative to business and financial risks.
Manager’s Discussion
From a sector perspective, stock selection in energy, information technology and industrials contributed to the Fund’s performance relative to the Russell 3000 Growth Index during the reporting period.3 Independent oil and gas production company Concho Resources and drilling equipment and services provider Smith International (merged with Schlumberger) in the energy sector had a significantly positive impact on relative results. Diesel engine manufacturer Cummins in the industrials sector aided performance. In the information technology sector, database expert Sybase, which was acquired by SAP, and network storage systems provider NetApp, were also key contributors.
In contrast, stock selection and an overweighting in the health care sector constrained relative Fund performance.4 Stock selection and an underweighting in the consumer discretionary sector, where educational service company Apollo Group (sold by period-end) was a major detractor, hurt relative results.5 Stock selection in the financials sector also had a negative impact.6 Although our energy and information technology holdings generally aided Fund results, some individual stocks were disappointments. They included MasterCard, a credit card company; QUALCOMM, a wireless telecommunication equipment technology company; Petrohawk Energy, an oil and gas exploration and production company; and FLIR Systems, a specialized imaging systems manufacturer.
3. The information technology sector comprises semiconductors and semiconductor equipment, software and services, and technology hardware and equipment in the SOI. The industrials sector comprises capital goods, commercial and professional services, and transportation in the SOI.
4. The health care sector comprises health care equipment and services; and pharmaceuticals, biotechnology and life sciences in the SOI.
5. The consumer discretionary sector comprises automobiles and components, consumer durables and apparel, consumer services, media, and retailing in the SOI.
6. The financials sector comprises banks, diversified financials and insurance in the SOI.
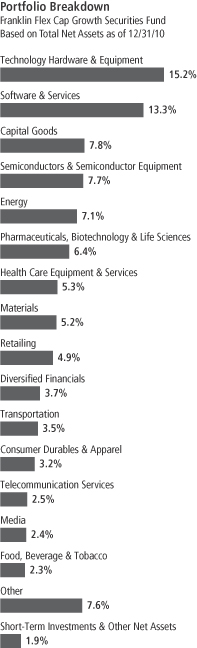
Top 10 Holdings
Franklin Flex Cap Growth
Securities Fund
12/31/10
| | | | |
Company
Sector/Industry | | % of Total
Net Assets | |
| Apple Inc. | | | 4.6% | |
Technology Hardware &
Equipment | |
| EMC Corp. | | | 2.1% | |
Technology Hardware &
Equipment | |
| Praxair Inc. | | | 2.0% | |
| Materials | | | | |
| NetApp Inc. | | | 2.0% | |
Technology Hardware &
Equipment | |
| Cummins Inc. | | | 1.9% | |
| Capital Goods | | | | |
| Concho Resources Inc. | | | 1.9% | |
| Energy | | | | |
| Johnson Controls Inc. | | | 1.8% | |
| Automobiles & Components | | | | |
| Celanese Corp. | | | 1.8% | |
| Materials | | | | |
| Polo Ralph Lauren Corp. | | | 1.7% | |
| Consumer Durables & Apparel | |
| Citrix Systems Inc. | | | 1.6% | |
| Software & Services | | | | |
The dollar value, number of shares or principal amount, and names of all portfolio holdings are listed in the Fund’s Statement of Investments (SOI).
FFC-4
Thank you for your participation in Franklin Flex Cap Growth Securities Fund. We look forward to serving your future investment needs.
The foregoing information reflects our analysis, opinions and portfolio holdings as of December 31, 2010, the end of the reporting period. The way we implement our main investment strategies and the resulting portfolio holdings may change depending on factors such as market and economic conditions. These opinions may not be relied upon as investment advice or an offer for a particular security. The information is not a complete analysis of every aspect of any market, country, industry, security or the Fund. Statements of fact are from sources considered reliable, but the investment manager makes no representation or warranty as to their completeness or accuracy. Although historical performance is no guarantee of future results, these insights may help you understand our investment management philosophy.
FFC-5
Fund Expenses
As an investor in a variable insurance contract (Contract) that indirectly provides for investment in an underlying mutual fund, you can incur transaction and/or ongoing expenses at both the Fund level and the Contract level.
| • | | Transaction expenses can include sales charges (loads) on purchases, redemption fees, surrender fees, transfer fees and premium taxes. |
| • | | Ongoing expenses can include management fees, distribution and service (12b-1) fees, contract fees, annual maintenance fees, mortality and expense risk fees and other fees and expenses. All mutual funds and Contracts have some types of ongoing expenses. |
The expenses shown in the table are meant to highlight ongoing expenses at the Fund level only and do not include ongoing expenses at the Contract level, or transaction expenses at either the Fund or Contract level. While the Fund does not have transaction expenses, if the transaction and ongoing expenses at the Contract level were included, the expenses shown below would be higher. You should consult your Contract prospectus or disclosure document for more information.
The table shows Fund-level ongoing expenses and can help you understand these expenses and compare them with those of other mutual funds offered through the Contract. The table assumes a $1,000 investment held for the six months indicated. Please refer to the Fund prospectus for additional information on operating expenses.
Actual Fund Expenses
The first line (Actual) of the table provides actual account values and expenses. The “Ending Account Value” is derived from the Fund’s actual return, which includes the effect of ongoing Fund expenses, but does not include the effect of ongoing Contract expenses.
You can estimate the Fund-level expenses you incurred during the period by following these steps. Of course, your account value and expenses will differ from those in this illustration:
| 1. | Divide your account value by $1,000. |
If an account had an $8,600 value, then $8,600 ÷ $1,000 = 8.6.
| 2. | Multiply the result by the number under the heading “Fund-Level Expenses Incurred During Period.” |
If Fund-Level Expenses Incurred During Period were $7.50, then 8.6 x $7.50 = $64.50.
In this illustration, the estimated expenses incurred this period at the Fund level are $64.50.
Franklin Flex Cap Growth Securities Fund – Class 4
FFC-6
Hypothetical Example for Comparison with Other Mutual Funds
Information in the second line (Hypothetical) of the table can help you compare ongoing expenses of the Fund with those of other mutual funds offered through the Contract. This information may not be used to estimate the actual ending account balance or expenses you incurred during the period. The hypothetical “Ending Account Value” is based on the Fund’s actual expense ratio and an assumed 5% annual rate of return before expenses, which does not represent the Fund’s actual return. The figure under the heading “Fund-Level Expenses Incurred During Period” shows the hypothetical expenses your account would have incurred under this scenario. You can compare this figure with the 5% hypothetical examples that appear in shareholder reports of other funds offered through a Contract.
| | | | | | | | | | | | |
| Class 4 | | Beginning
Account Value 7/1/10 | | | Ending
Account Value 12/31/10 | | | Fund-Level Expenses Incurred
During Period* 7/1/10–12/31/10 | |
Actual | | $ | 1,000 | | | $ | 1,256.70 | | | $ | 5.86 | |
Hypothetical (5% return before expenses) | | $ | 1,000 | | | $ | 1,020.01 | | | $ | 5.24 | |
*Expenses are calculated using the most recent six-month annualized expense ratio, net of expense waivers, for the Fund’s Class 4 shares (1.03%), which does not include any ongoing expenses of the Contract for which the Fund is an investment option, multiplied by the average account value over the period, multiplied by 184/365 to reflect the one-half year period.
FFC-7
Franklin Templeton Variable Insurance Products Trust
Financial Highlights
Franklin Flex Cap Growth Securities Fund
| | | | | | | | | | | | | | | | | | | | |
| | | Year Ended December 31, | |
| Class 2 | | 2010 | | | 2009 | | | 2008 | | | 2007 | | | 2006 | |
| | | | |
Per share operating performance | | | | | | | | | | | | | | | | | | | | |
(for a share outstanding throughout the year) | | | | | | | | | | | | | | | | | | | | |
Net asset value, beginning of year | | $ | 10.93 | | | $ | 8.22 | | | $ | 12.72 | | | $ | 11.14 | | | $ | 10.59 | |
| | | | |
Income from investment operationsa: | | | | | | | | | | | | | | | | | | | | |
Net investment income (loss)b | | | (0.02 | ) | | | (— | )c | | | — | c | | | 0.04 | | | | 0.02 | |
Net realized and unrealized gains (losses) | | | 1.79 | | | | 2.71 | | | | (4.49 | ) | | | 1.55 | | | | 0.53 | |
| | | | |
Total from investment operations | | | 1.77 | | | | 2.71 | | | | (4.49 | ) | | | 1.59 | | | | 0.55 | |
| | | | |
Less distributions from net investment income | | | — | | | | — | | | | (0.01 | ) | | | (0.01 | ) | | | (— | )c |
| | | | |
Net asset value, end of year | | $ | 12.70 | | | $ | 10.93 | | | $ | 8.22 | | | $ | 12.72 | | | $ | 11.14 | |
| | | | |
| | | | | |
Total returnd | | | 16.19% | | | | 32.97% | | | | (35.31)% | | | | 14.32% | | | | 5.20% | |
Ratios to average net assets | | | | | | | | | | | | | | | | | | | | |
Expenses before waiver and payments by affiliates | | | 1.18% | | | | 1.19% | | | | 1.21% | | | | 1.25% | | | | 1.32% | |
Expenses net of waiver and payments by affiliates | | | 0.93% | | | | 0.93% | e | | | 0.93% | | | | 0.93% | e | | | 0.93% | e |
Net investment income (loss) | | | (0.17)% | | | | (0.01)% | | | | 0.04% | | | | 0.31% | | | | 0.19% | |
| | | | | |
Supplemental data | | | | | | | | | | | | | | | | | | | | |
Net assets, end of year (000’s) | | $ | 227,774 | | | $ | 244,768 | | | $ | 195,425 | | | $ | 206,218 | | | $ | 60,520 | |
Portfolio turnover rate | | | 60.00% | | | | 33.64% | | | | 32.76% | | | | 30.15% | | | | 67.01% | |
aThe amount shown for a share outstanding throughout the period may not correlate with the Statement of Operations for the period due to the timing of sales and repurchases of the Fund shares in relation to income earned and/or fluctuating market value of the investments of the Fund.
bBased on average daily shares outstanding.
cAmount rounds to less than $0.01 per share.
dTotal return does not include fees, charges or expenses imposed by the variable annuity and life insurance contracts for which the Franklin Templeton Variable Insurance Products Trust serves as an underlying investment vehicle.
eBenefit of expense reduction rounds to less than 0.01%.
The accompanying notes are an integral part of these financial statements.
FFC-8
Franklin Templeton Variable Insurance Products Trust
Financial Highlights (continued)
Franklin Flex Cap Growth Securities Fund
| | | | | | | | | | | | |
| | | Year Ended December 31, | |
| Class 4 | | 2010 | | | 2009 | | | 2008a | |
| | | | |
Per share operating performance | | | | | | | | | | | | |
(for a share outstanding throughout the year) | | | | | | | | | | | | |
Net asset value, beginning of year | | $ | 10.88 | | | $ | 8.21 | | | $ | 11.22 | |
| | | | |
Income from investment operationsb: | | | | | | | | | | | | |
Net investment income (loss)c | | | (0.03 | ) | | | (0.01 | ) | | | — | d |
Net realized and unrealized gains (losses) | | | 1.78 | | | | 2.69 | | | | (2.98 | ) |
| | | | |
Total from investment operations | | | 1.75 | | | | 2.68 | | | | (2.98 | ) |
| | | | |
Less distributions from net investment income | | | — | | | | (0.01 | ) | | | (0.03 | ) |
| | | | |
Net asset value, end of year | | $ | 12.63 | | | $ | 10.88 | | | $ | 8.21 | |
| | | | |
| | | |
Total returne | | | 16.08% | | | | 32.69% | | | | (26.68)% | |
Ratios to average net assetsf | | | | | | | | | | | | |
Expenses before waiver and payments by affiliates | | | 1.28% | | | | 1.29% | | | | 1.31% | |
Expenses net of waiver and payments by affiliates | | | 1.03% | | | | 1.03% | g | | | 1.03% | |
Net investment income (loss) | | | (0.27)% | | | | (0.11)% | | | | (0.06)% | |
| | | |
Supplemental data | | | | | | | | | | | | |
Net assets, end of year (000’s) | | $ | 263,746 | | | $ | 218,798 | | | $ | 50,268 | |
Portfolio turnover rate | | | 60.00% | | | | 33.64% | | | | 32.76% | |
aFor the period February 29, 2008 (effective date) to December 31, 2008.
bThe amount shown for a share outstanding throughout the period may not correlate with the Statement of Operations for the period due to the timing of sales and repurchases of the Fund shares in relation to income earned and/or fluctuating market value of the investments of the Fund.
cBased on average daily shares outstanding.
dAmount rounds to less than $0.01 per share.
eTotal return does not include fees, charges or expenses imposed by the variable annuity and life insurance contracts for which the Franklin Templeton Variable Insurance Products Trust serves as an underlying investment vehicle. Total return is not annualized for periods less than one year.
fRatios are annualized for periods less than one year.
gBenefit of expense reduction rounds to less than 0.01%.
The accompanying notes are an integral part of these financial statements.
FFC-9
Franklin Templeton Variable Insurance Products Trust
Statement of Investments, December 31, 2010
| | | | | | | | | | | | |
| Franklin Flex Cap Growth Securities Fund | | | | | Shares | | | Value | |
Common Stocks 98.1% | | | | | | | | | | | | |
Automobiles & Components 1.8% | | | | | | | | | | | | |
Johnson Controls Inc. | | | | | | | 230,000 | | | $ | 8,786,000 | |
| | | | | | | | | | | | |
Banks 0.7% | | | | | | | | | | | | |
Wells Fargo & Co. | | | | | | | 108,500 | | | | 3,362,415 | |
| | | | | | | | | | | | |
Capital Goods 7.8% | | | | | | | | | | | | |
Cummins Inc. | | | | | | | 87,000 | | | | 9,570,870 | |
Danaher Corp. | | | | | | | 101,300 | | | | 4,778,321 | |
Flowserve Corp. | | | | | | | 35,000 | | | | 4,172,700 | |
General Electric Co. | | | | | | | 350,000 | | | | 6,401,500 | |
Precision Castparts Corp. | | | | | | | 35,000 | | | | 4,872,350 | |
Rockwell Automation Inc. | | | | | | | 55,000 | | | | 3,944,050 | |
United Technologies Corp. | | | | | | | 56,300 | | | | 4,431,936 | |
| | | | | | | | | | | | |
| | | | | | | | | | | 38,171,727 | |
| | | | | | | | | | | | |
Commercial & Professional Services 1.4% | | | | | | | | | | | | |
aStericycle Inc. | | | | | | | 85,000 | | | | 6,878,200 | |
| | | | | | | | | | | | |
Consumer Durables & Apparel 3.2% | | | | | | | | | | | | |
NIKE Inc., B | | | | | | | 85,000 | | | | 7,260,700 | |
Polo Ralph Lauren Corp. | | | | | | | 75,000 | | | | 8,319,000 | |
| | | | | | | | | | | | |
| | | | | | | | | | | 15,579,700 | |
| | | | | | | | | | | | |
Consumer Services 1.5% | | | | | | | | | | | | |
Marriott International Inc., A | | | | | | | 185,000 | | | | 7,684,900 | |
| | | | | | | | | | | | |
Diversified Financials 3.7% | | | | | | | | | | | | |
BlackRock Inc. | | | | | | | 22,000 | | | | 4,192,760 | |
JPMorgan Chase & Co. | | | | | | | 80,400 | | | | 3,410,568 | |
Lazard Ltd., A | | | | | | | 140,000 | | | | 5,528,600 | |
T. Rowe Price Group Inc. | | | | | | | 80,000 | | | | 5,163,200 | |
| | | | | | | | | | | | |
| | | | | | | | | | | 18,295,128 | |
| | | | | | | | | | | | |
Energy 7.1% | | | | | | | | | | | | |
aAlpha Natural Resources Inc. | | | | | | | 75,000 | | | | 4,502,250 | |
aCameron International Corp. | | | | | | | 155,000 | | | | 7,863,150 | |
aConcho Resources Inc. | | | | | | | 105,000 | | | | 9,205,350 | |
aFMC Technologies Inc. | | | | | | | 35,000 | | | | 3,111,850 | |
aPetrohawk Energy Corp. | | | | | | | 195,000 | | | | 3,558,750 | |
Schlumberger Ltd. | | | | | | | 45,000 | | | | 3,757,500 | |
SM Energy Co. | | | | | | | 48,000 | | | | 2,828,640 | |
| | | | | | | | | | | | |
| | | | | | | | | | | 34,827,490 | |
| | | | | | | | | | | | |
Food, Beverage & Tobacco 2.3% | | | | | | | | | | | | |
aHansen Natural Corp. | | | | | | | 47,500 | | | | 2,483,300 | |
Mead Johnson Nutrition Co., A | | | | | | | 63,000 | | | | 3,921,750 | |
PepsiCo Inc. | | | | | | | 78,000 | | | | 5,095,740 | |
| | | | | | | | | | | | |
| | | | | | | | | | | 11,500,790 | |
| | | | | | | | | | | | |
Health Care Equipment & Services 5.3% | | | | | | | | | | | | |
aAllscripts Healthcare Solutions Inc. | | | | | | | 86,100 | | | | 1,659,147 | |
aDaVita Inc. | | | | | | | 35,000 | | | | 2,432,150 | |
aEdwards Lifesciences Corp. | | | | | | | 55,000 | | | | 4,446,200 | |
aExpress Scripts Inc. | | | | | | | 140,000 | | | | 7,567,000 | |
aIntuitive Surgical Inc. | | | | | | | 9,000 | | | | 2,319,750 | |
FFC-10
Franklin Templeton Variable Insurance Products Trust
Statement of Investments, December 31, 2010 (continued)
| | | | | | | | | | | | |
| Franklin Flex Cap Growth Securities Fund | | | | | Shares | | | Value | |
Common Stocks (continued) | | | | | | | | | | | | |
Health Care Equipment & Services (continued) | | | | | | | | | | | | |
Universal Health Services Inc., B | | | | | | | 108,000 | | | $ | 4,689,360 | |
aVarian Medical Systems Inc. | | | | | | | 40,000 | | | | 2,771,200 | |
| | | | | | | | | | | | |
| | | | | | | | | | | 25,884,807 | |
| | | | | | | | | | | | |
Household & Personal Products 0.8% | | | | | | | | | | | | |
The Procter & Gamble Co. | | | | | | | 60,000 | | | | 3,859,800 | |
| | | | | | | | | | | | |
Insurance 1.4% | | | | | | | | | | | | |
Aflac Inc. | | | | | | | 125,000 | | | | 7,053,750 | |
| | | | | | | | | | | | |
Materials 5.2% | | | | | | | | | | | | |
Celanese Corp., A | | | | | | | 210,000 | | | | 8,645,700 | |
Ecolab Inc. | | | | | | | 140,000 | | | | 7,058,800 | |
Praxair Inc. | | | | | | | 105,000 | | | | 10,024,350 | |
| | | | | | | | | | | | |
| | | | | | | | | | | 25,728,850 | |
| | | | | | | | | | | | |
Media 2.4% | | | | | | | | | | | | |
aDiscovery Communications Inc., C | | | | | | | 200,000 | | | | 7,338,000 | |
The Walt Disney Co. | | | | | | | 116,500 | | | | 4,369,915 | |
| | | | | | | | | | | | |
| | | | | | | | | | | 11,707,915 | |
| | | | | | | | | | | | |
Pharmaceuticals, Biotechnology & Life Sciences 6.4% | | | | | | | | | | | | |
aCelgene Corp. | | | | | | | 92,400 | | | | 5,464,536 | |
aDendreon Corp. | | | | | | | 60,300 | | | | 2,105,676 | |
aGilead Sciences Inc. | | | | | | | 84,400 | | | | 3,058,656 | |
aHuman Genome Sciences Inc. | | | | | | | 105,000 | | | | 2,508,450 | |
Johnson & Johnson | | | | | | | 36,200 | | | | 2,238,970 | |
Merck & Co. Inc. | | | | | | | 160,800 | | | | 5,795,232 | |
aSalix Pharmaceuticals Ltd. | | | | | | | 90,000 | | | | 4,226,400 | |
aWaters Corp. | | | | | | | 80,000 | | | | 6,216,800 | |
| | | | | | | | | | | | |
| | | | | | | | | | | 31,614,720 | |
| | | | | | | | | | | | |
Retailing 4.9% | | | | | | | | | | | | |
aAmazon.com Inc. | | | | | | | 23,000 | | | | 4,140,000 | |
aDollar General Corp. | | | | | | | 150,000 | | | | 4,600,500 | |
aKohl’s Corp. | | | | | | | 60,300 | | | | 3,276,702 | |
aPriceline.com Inc. | | | | | | | 12,500 | | | | 4,994,375 | |
Target Corp. | | | | | | | 63,000 | | | | 3,788,190 | |
aUrban Outfitters Inc. | | | | | | | 95,000 | | | | 3,401,950 | |
| | | | | | | | | | | | |
| | | | | | | | | | | 24,201,717 | |
| | | | | | | | | | | | |
Semiconductors & Semiconductor Equipment 7.7% | | | | | | | | | | | | |
Broadcom Corp., A | | | | | | | 82,000 | | | | 3,571,100 | |
aCree Inc. | | | | | | | 45,000 | | | | 2,965,050 | |
aFirst Solar Inc. | | | | | | | 28,000 | | | | 3,643,920 | |
Intel Corp. | | | | | | | 115,000 | | | | 2,418,450 | |
aLam Research Corp. | | | | | | | 120,000 | | | | 6,213,600 | |
Microchip Technology Inc. | | | | | | | 215,000 | | | | 7,355,150 | |
aSilicon Laboratories Inc. | | | | | | | 115,000 | | | | 5,292,300 | |
Xilinx Inc. | | | | | | | 215,000 | | | | 6,230,700 | |
| | | | | | | | | | | | |
| | | | | | | | | | | 37,690,270 | |
| | | | | | | | | | | | |
Software & Services 13.3% | | | | | | | | | | | | |
aBottomline Technologies Inc. | | | | | | | 75,000 | | | | 1,628,250 | |
aCitrix Systems Inc. | | | | | | | 115,000 | | | | 7,867,150 | |
FFC-11
Franklin Templeton Variable Insurance Products Trust
Statement of Investments, December 31, 2010 (continued)
| | | | | | | | | | | | |
| Franklin Flex Cap Growth Securities Fund | | | | | Shares | | | Value | |
Common Stocks (continued) | | | | | | | | | | | | |
Software & Services (continued) | | | | | | | | | | | | |
aConcur Technologies Inc. | | | | | | | 52,200 | | | $ | 2,710,746 | |
FactSet Research Systems Inc. | | | | | | | 40,200 | | | | 3,769,152 | |
aGoogle Inc., A | | | | | | | 11,000 | | | | 6,533,670 | |
aInformatica Corp. | | | | | | | 90,000 | | | | 3,962,700 | |
International Business Machines Corp. | | | | | | | 26,500 | | | | 3,889,140 | |
MasterCard Inc., A | | | | | | | 29,000 | | | | 6,499,190 | |
aNuance Communications Inc. | | | | | | | 320,000 | | | | 5,817,600 | |
Oracle Corp. | | | | | | | 245,000 | | | | 7,668,500 | |
aRed Hat Inc. | | | | | | | 166,000 | | | | 7,577,900 | |
aTaleo Corp., A | | | | | | | 115,000 | | | | 3,179,750 | |
Visa Inc., A | | | | | | | 62,000 | | | | 4,363,560 | |
| | | | | | | | | | | | |
| | | | | | | | | | | 65,467,308 | |
| | | | | | | | | | | | |
Technology Hardware & Equipment 15.2% | | | | | | | | | | | | |
aApple Inc. | | | | | | | 70,000 | | | | 22,579,200 | |
aCisco Systems Inc. | | | | | | | 300,000 | | | | 6,069,000 | |
aEMC Corp. | | | | | | | 450,000 | | | | 10,305,000 | |
aFLIR Systems Inc. | | | | | | | 160,000 | | | | 4,760,000 | |
aJuniper Networks Inc. | | | | | | | 105,000 | | | | 3,876,600 | |
National Instruments Corp. | | | | | | | 108,500 | | | | 4,083,940 | |
aNetApp Inc. | | | | | | | 180,000 | | | | 9,892,800 | |
QUALCOMM Inc. | | | | | | | 125,000 | | | | 6,186,250 | |
aTrimble Navigation Ltd. | | | | | | | 171,900 | | | | 6,863,967 | |
| | | | | | | | | | | | |
| | | | | | | | | | | 74,616,757 | |
| | | | | | | | | | | | |
Telecommunication Services 2.5% | | | | | | | | | | | | |
aAmerican Tower Corp., A | | | | | | | 140,000 | | | | 7,229,600 | |
aNII Holdings Inc. | | | | | | | 110,000 | | | | 4,912,600 | |
| | | | | | | | | | | | |
| | | | | | | | | | | 12,142,200 | |
| | | | | | | | | | | | |
Transportation 3.5% | | | | | | | | | | | | |
C.H. Robinson Worldwide Inc. | | | | | | | 36,200 | | | | 2,902,878 | |
Expeditors International of Washington Inc. | | | | | | | 95,000 | | | | 5,187,000 | |
FedEx Corp. | | | | | | | 60,000 | | | | 5,580,600 | |
aKansas City Southern | | | | | | | 75,000 | | | | 3,589,500 | |
| | | | | | | | | | | | |
| | | | | | | | | | | 17,259,978 | |
| | | | | | | | | | | | |
Total Common Stocks (Cost $350,146,915) | | | | | | | | | | | 482,314,422 | |
| | | | | | | | | | | | |
Short Term Investments (Cost $20,099,340) 4.1% | | | | | | | | | | | | |
Money Market Funds 4.1% | | | | | | | | | | | | |
a,bInstitutional Fiduciary Trust Money Market Portfolio | | | | | | | 20,099,340 | | | | 20,099,340 | |
| | | | | | | | | | | | |
Total Investments (Cost $370,246,255) 102.2% | | | | | | | | | | | 502,413,762 | |
Other Assets, less Liabilities (2.2)% | | | | | | | | | | | (10,894,028 | ) |
| | | | | | | | | | | | |
Net Assets 100.0% | | | | | | | | | | $ | 491,519,734 | |
| | | | | | | | | | | | |
aNon-income producing.
bSee Note 7 regarding investments in the Institutional Fiduciary Trust Money Market Portfolio.
The accompanying notes are an integral part of these financial statements.
FFC-12
Franklin Templeton Variable Insurance Products Trust
Financial Statements
Statement of Assets and Liabilities
December 31, 2010
| | | | |
| | | Franklin Flex
Cap Growth
Securities Fund | |
Assets: | | | | |
Investments in securities: | | | | |
Cost - Unaffiliated issuers | | $ | 350,146,915 | |
Cost - Sweep Money Fund (Note 7) | | | 20,099,340 | |
| | | | |
Total cost of investments | | $ | 370,246,255 | |
| | | | |
Value - Unaffiliated issuers | | $ | 482,314,422 | |
Value - Sweep Money Fund (Note 7) | | | 20,099,340 | |
| | | | |
Total value of investments | | | 502,413,762 | |
Receivables: | | | | |
Capital shares sold | | | 300,038 | |
Dividends | | | 330,921 | |
Other assets | | | 15,749 | |
| | | | |
Total assets | | | 503,060,470 | |
| | | | |
Liabilities: | | | | |
Payables: | | | | |
Investment securities purchased | | | 8,005 | |
Capital shares redeemed | | | 10,948,911 | |
Affiliates | | | 484,614 | |
Accrued expenses and other liabilities | | | 99,206 | |
| | | | |
Total liabilities | | | 11,540,736 | |
| | | | |
Net assets, at value | | $ | 491,519,734 | |
| | | | |
Net assets consist of: | | | | |
Paid-in capital | | $ | 415,185,725 | |
Net unrealized appreciation (depreciation) | | | 132,167,507 | |
Accumulated net realized gain (loss) | | | (55,833,498 | ) |
| | | | |
Net assets, at value | | $ | 491,519,734 | |
| | | | |
Class 2: | | | | |
Net assets, at value | | $ | 227,773,726 | |
| | | | |
Shares outstanding | | | 17,938,980 | |
| | | | |
Net asset value and maximum offering price per share | | $ | 12.70 | |
| | | | |
Class 4: | | | | |
Net assets, at value | | $ | 263,746,008 | |
| | | | |
Shares outstanding | | | 20,879,056 | |
| | | | |
Net asset value and maximum offering price per share | | $ | 12.63 | |
| | | | |
The accompanying notes are an integral part of these financial statements.
FFC-13
Franklin Templeton Variable Insurance Products Trust
Financial Statements (continued)
Statement of Operations
for the year ended December 31, 2010
| | | | |
| | | Franklin Flex
Cap Growth
Securities Fund | |
Investment income: | | | | |
Dividends | | $ | 3,510,501 | |
| | | | |
Expenses: | | | | |
Management fees (Note 3a) | | | 2,966,485 | |
Administrative fees (Note 3b) | | | 1,159,148 | |
Distribution fees: (Note 3c) | | | | |
Class 2 | | | 565,354 | |
Class 4 | | | 829,735 | |
Unaffiliated transfer agent fees | | | 466 | |
Custodian fees (Note 4) | | | 6,985 | |
Reports to shareholders | | | 134,167 | |
Professional fees | | | 36,423 | |
Trustees’ fees and expenses | | | 2,076 | |
Other | | | 24,113 | |
| | | | |
Total expenses | | | 5,724,952 | |
Expenses waived/paid by affiliates (Note 3e) | | | (1,176,952 | ) |
| | | | |
Net expenses | | | 4,548,000 | |
| | | | |
Net investment income (loss) | | | (1,037,499 | ) |
| | | | |
Realized and unrealized gains (losses): | | | | |
Net realized gain (loss) from investments | | | (4,167,287 | ) |
Net change in unrealized appreciation (depreciation) on investments | | | 66,627,082 | |
| | | | |
Net realized and unrealized gain (loss) | | | 62,459,795 | |
| | | | |
Net increase (decrease) in net assets resulting from operations | | $ | 61,422,296 | |
| | | | |
The accompanying notes are an integral part of these financial statements.
FFC-14
Franklin Templeton Variable Insurance Products Trust
Financial Statements (continued)
Statements of Changes in Net Assets
| | | | | | | | |
| | | Franklin Flex Cap Growth
Securities Fund | |
| | | Year Ended December 31, | |
| | | 2010 | | | 2009 | |
| | | | |
Increase (decrease) in net assets: | | | | | | | | |
Operations: | | | | | | | | |
Net investment income (loss) | | $ | (1,037,499 | ) | | $ | (180,105 | ) |
Net realized gain (loss) from investments | | | (4,167,287 | ) | | | (29,161,047 | ) |
Net change in unrealized appreciation (depreciation) on investments | | | 66,627,082 | | | | 135,604,614 | |
| | | | |
Net increase (decrease) in net assets resulting from operations | | | 61,422,296 | | | | 106,263,462 | |
| | | | |
Distributions to shareholders from net investment income: | | | | | | | | |
Class 4 | | | — | | | | (158,474 | ) |
| | | | |
Capital share transactions: (Note 2) | | | | | | | | |
Class 2 | | | (46,447,755 | ) | | | (12,333,249 | ) |
Class 4 | | | 12,979,114 | | | | 124,101,792 | |
| | | | |
Total capital share transactions | | | (33,468,641 | ) | | | 111,768,543 | |
| | | | |
Net increase (decrease) in net assets | | | 27,953,655 | | | | 217,873,531 | |
Net assets (there is no undistributed net investment income at the beginning or end of year): | | | | | | | | |
Beginning of year | | | 463,566,079 | | | | 245,692,548 | |
| | | | |
End of year | | $ | 491,519,734 | | | $ | 463,566,079 | |
| | | | |
The accompanying notes are an integral part of these financial statements.
FFC-15
Franklin Templeton Variable Insurance Products Trust
Notes to Financial Statements
Franklin Flex Cap Growth Securities Fund
1. ORGANIZATION AND SIGNIFICANT ACCOUNTING POLICIES
Franklin Templeton Variable Insurance Products Trust (Trust) is registered under the Investment Company Act of 1940, as amended, (1940 Act) as an open-end investment company, consisting of twenty separate funds. The Franklin Flex Cap Growth Securities Fund (Fund) is included in this report. The financial statements of the remaining funds in the Trust are presented separately. Shares of the Fund are generally sold only to insurance company separate accounts to fund the benefits of variable life insurance policies or variable annuity contracts. At December 31, 2010, 78.30% of the Fund’s shares were held through one insurance company. The Fund offers two classes of shares: Class 2 and Class 4. Each class of shares differs by its distribution fees, voting rights on matters affecting a single class and its exchange privilege.
The following summarizes the Fund’s significant accounting policies.
a. Financial Instrument Valuation
The Fund values its investments in securities and other assets and liabilities carried at fair value daily. Fair value is the price that would be received to sell an asset or paid to transfer a liability in an orderly transaction between market participants on the measurement date. Under procedures approved by the Trust’s Board of Trustees, the Fund may utilize independent pricing services, quotations from securities and financial instrument dealers, and other market sources to determine fair value.
Equity securities listed on an exchange or on the NASDAQ National Market System are valued at the last quoted sale price or the official closing price of the day, respectively. Over-the-counter securities are valued within the range of the most recent quoted bid and ask prices. Securities that trade in multiple markets or on multiple exchanges are valued according to the broadest and most representative market. Certain equity securities are valued based upon fundamental characteristics or relationships to similar securities. Investments in open-end mutual funds are valued at the closing net asset value.
The Fund has procedures to determine the fair value of securities and other financial instruments for which market prices are not readily available or which may not be reliably priced. Under these procedures, the Fund primarily employs a market-based approach which may use related or comparable assets or liabilities, recent transactions, market multiples, book values, and other relevant information for the investment to determine the fair value of the investment. The Fund may also use an income-based valuation approach in which the anticipated future cash flows of the investment are discounted to calculate fair value. Discounts may also be applied due to the nature or duration of any restrictions on the disposition of the investments. Due to the inherent uncertainty of valuations of such investments, the fair values may differ significantly from the values that would have been used had an active market existed.
b. Income Taxes
It is the Fund’s policy to qualify as a regulated investment company under the Internal Revenue Code. The Fund intends to distribute to shareholders substantially all of its taxable income and net realized gains to relieve it from federal income and excise taxes. As a result, no provision for U.S. federal income taxes is required. The Fund files U.S. income tax returns as well as tax returns in certain other jurisdictions. The Fund’s application of those tax rules is subject to its understanding. The Fund records a provision for taxes in its financial statements including penalties and interest, if any, for a tax position taken on a tax return (or expected to be taken) when it fails to meet the more likely than not (a greater than 50% probability) threshold and based on the technical merits, the tax position may not be sustained upon examination by the tax authorities. As of December 31, 2010, and for all open tax years, the Fund has determined that no provision for income tax is required in the Fund’s financial statements. Open tax years are those that remain subject to examination and are based on each tax jurisdiction statute of limitation. The Fund is not aware of any tax position for which it is reasonably possible that the total amounts of unrecognized tax effects will significantly change in the next twelve months.
FFC-16
Franklin Templeton Variable Insurance Products Trust
Notes to Financial Statements (continued)
Franklin Flex Cap Growth Securities Fund
1. ORGANIZATION AND SIGNIFICANT ACCOUNTING POLICIES (continued)
c. Security Transactions, Investment Income, Expenses and Distributions
Security transactions are accounted for on trade date. Realized gains and losses on security transactions are determined on a specific identification basis. Estimated expenses are accrued daily. Dividend income is recorded on the ex-dividend date. Distributions to shareholders are recorded on the ex-dividend date and are determined according to income tax regulations (tax basis). Distributable earnings determined on a tax basis may differ from earnings recorded in accordance with accounting principles generally accepted in the United States of America. These differences may be permanent or temporary. Permanent differences are reclassified among capital accounts to reflect their tax character. These reclassifications have no impact on net assets or the results of operations. Temporary differences are not reclassified, as they may reverse in subsequent periods.
Common expenses incurred by the Trust are allocated among the funds based on the ratio of net assets of each fund to the combined net assets of the Trust. Fund specific expenses are charged directly to the fund that incurred the expense.
Realized and unrealized gains and losses and net investment income, not including class specific expenses, are allocated daily to each class of shares based upon the relative proportion of net assets of each class. Differences in per share distributions, by class, are generally due to differences in class specific expenses.
d. Accounting Estimates
The preparation of financial statements in accordance with accounting principles generally accepted in the United States of America requires management to make estimates and assumptions that affect the reported amounts of assets and liabilities at the date of the financial statements and the amounts of income and expenses during the reporting period. Actual results could differ from those estimates.
e. Guarantees and Indemnifications
Under the Trust’s organizational documents, its officers and trustees are indemnified by the Trust against certain liabilities arising out of the performance of their duties to the Trust. Additionally, in the normal course of business, the Trust, on behalf of the Fund, enters into contracts with service providers that contain general indemnification clauses. The Trust’s maximum exposure under these arrangements is unknown as this would involve future claims that may be made against the Trust that have not yet occurred. Currently, the Trust expects the risk of loss to be remote.
2. SHARES OF BENEFICIAL INTEREST
At December 31, 2010, there were an unlimited number of shares authorized (without par value). Transactions in the Fund’s shares were as follows:
| | | | | | | | | | | | | | | | |
| | | Year Ended December 31, | |
| | | 2010 | | | 2009 | |
| Class 2 Shares: | | Shares | | | Amount | | | Shares | | | Amount | |
Shares sold | | | 2,712,486 | | | $ | 30,583,993 | | | | 4,431,644 | | | $ | 39,989,400 | |
Shares redeemed | | | (7,177,369 | ) | | | (77,031,748 | ) | | | (5,802,635 | ) | | | (52,322,649 | ) |
| | | | |
Net increase (decrease) | | | (4,464,883 | ) | | $ | (46,447,755 | ) | | | (1,370,991 | ) | | $ | (12,333,249 | ) |
| | | | |
Class 4 Shares: | | | | | | | | | | | | | | | | |
Shares sold | | | 9,474,153 | | | $ | 105,454,276 | | | | 18,820,498 | | | $ | 169,410,832 | |
Shares issued on reinvestment of distributions | | | — | | | | — | | | | 17,968 | | | | 158,474 | |
Shares redeemed | | | (8,700,670 | ) | | | (92,475,162 | ) | | | (4,859,046 | ) | | | (45,467,514 | ) |
| | | | |
Net increase (decrease) | | | 773,483 | | | $ | 12,979,114 | | | | 13,979,420 | | | $ | 124,101,792 | |
| | | | |
FFC-17
Franklin Templeton Variable Insurance Products Trust
Notes to Financial Statements (continued)
Franklin Flex Cap Growth Securities Fund
3. TRANSACTIONS WITH AFFILIATES
Franklin Resources, Inc. is the holding company for various subsidiaries that together are referred to as Franklin Templeton Investments. Certain officers and trustees of the Fund are also officers and/or directors of the following subsidiaries:
| | |
| Subsidiary | | Affiliation |
Franklin Advisers, Inc. (Advisers) | | Investment manager |
Franklin Templeton Services, LLC (FT Services) | | Administrative manager |
Franklin Templeton Distributors, Inc. (Distributors) | | Principal underwriter |
Franklin Templeton Investor Services, LLC (Investor Services) | | Transfer agent |
a. Management Fees
The Fund pays an investment management fee to Advisers based on the average daily net assets of the Fund as follows:
| | |
| Annualized Fee Rate | | Net Assets |
| 0.750% | | Up to and including $100 million |
| 0.650% | | Over $100 million, up to and including $250 million |
| 0.600% | | Over $250 million, up to and including $10 billion |
| 0.550% | | Over $10 billion, up to and including $12.5 billion |
| 0.525% | | Over $12.5 billion, up to and including $15 billion |
| 0.500% | | In excess of $15 billion |
b. Administrative Fees
The Fund pays an administrative fee to FT Services of 0.25% per year of the average daily net assets of the Fund.
c. Distribution Fees
The Trust’s Board of Trustees has adopted distribution plans for Class 2 and Class 4 shares pursuant to Rule 12b-1 under the 1940 Act. Under the Fund’s compensation distribution plans, the Fund pays Distributors for costs incurred in connection with the servicing, sale and distribution of the Fund’s shares up to 0.35% per year of its average daily net assets of each class. The Board of Trustees has agreed to limit the current rate to 0.25% per year for Class 2.
d. Transfer Agent Fees
Investor Services, under terms of an agreement, performs shareholder servicing for the Fund and is not paid by the Fund for the services.
e. Waiver and Expense Reimbursements
FT Services and Advisers have contractually agreed in advance to waive or limit their respective fees and to assume as their own expense certain expenses otherwise payable by the fund so that the common expenses (i.e. a combination of management fees, administrative fees, and other expenses, but excluding distribution fees and acquired fund fees and expenses) for each class of the Fund do not exceed 0.68% (other than certain non-routine expenses or costs, including those relating to litigation, indemnification, reorganizations, and liquidations) until April 30, 2011.
FFC-18
Franklin Templeton Variable Insurance Products Trust
Notes to Financial Statements (continued)
Franklin Flex Cap Growth Securities Fund
4. EXPENSE OFFSET ARRANGEMENT
The Fund has entered into an arrangement with its custodian whereby credits realized as a result of uninvested cash balances are used to reduce a portion of the Fund’s custodian expenses. During the year ended December 31, 2010, there were no credits earned.
5. INCOME TAXES
For tax purposes, capital losses may be carried over to offset future capital gains, if any. At December 31, 2010, the capital loss carryforwards were as follows:
| | | | |
Capital loss carryforwards expiring in: | | | | |
2013 | | $ | 233,183 | |
2014 | | | 2,517,251 | |
2015 | | | 777,263 | |
2016 | | | 15,495,131 | |
2017 | | | 30,645,725 | |
2018 | | | 4,113,202 | |
| | | | |
| | $ | 53,781,755 | |
| | | | |
The tax character of distributions paid during the years ended December 31, 2010 and 2009, was as follows:
| | | | | | | | |
| | | 2010 | | | 2009 | |
Distributions paid from ordinary income | | $ | — | | | $ | 158,474 | |
| | | | |
At December 31, 2010, the cost of investments and net unrealized appreciation (depreciation) for income tax purposes were as follows:
| | | | |
Cost of investments | | $ | 372,297,998 | |
| | | | |
| |
Unrealized appreciation | | $ | 132,588,627 | |
Unrealized depreciation | | | (2,472,863 | ) |
| | | | |
Net unrealized appreciation (depreciation) | | $ | 130,115,764 | |
| | | | |
Net realized gains (losses) differ for financial statement and tax purposes primarily due to differing treatment of wash sales.
6. INVESTMENT TRANSACTIONS
Purchases and sales of investments (excluding short term securities) for the year ended December 31, 2010, aggregated $266,919,331 and $294,819,016, respectively.
7. INVESTMENTS IN INSTITUTIONAL FIDUCIARY TRUST MONEY MARKET PORTFOLIO
The Fund may invest in the Institutional Fiduciary Trust Money Market Portfolio (Sweep Money Fund), an open-end investment company managed by Advisers. Management fees paid by the Fund are reduced on assets invested in the Sweep Money Fund, in an amount not to exceed the management and administrative fees paid by the Sweep Money Fund.
FFC-19
Franklin Templeton Variable Insurance Products Trust
Notes to Financial Statements (continued)
Franklin Flex Cap Growth Securities Fund
8. CREDIT FACILITY
The Fund, together with other U.S. registered and foreign investment funds (collectively “Borrowers”), managed by Franklin Templeton Investments, are borrowers in a joint syndicated senior unsecured credit facility totaling $750 million (Global Credit Facility) which matures on January 21, 2011. This Global Credit Facility provides a source of funds to the Borrowers for temporary and emergency purposes, including the ability to meet future unanticipated or unusually large redemption requests.
Under the terms of the Global Credit Facility, the Fund shall, in addition to interest charged on any borrowings made by the Fund and other costs incurred by the Fund, pay its share of fees and expenses incurred in connection with the implementation and maintenance of the Global Credit Facility, based upon its relative share of the aggregate net assets of all of the Borrowers, including an annual commitment fee of 0.10% based upon the unused portion of the Global Credit Facility, which is reflected in other expenses on the Statement of Operations. During the year ended December 31, 2010, the Fund did not use the Global Credit Facility.
Effective January 21, 2011, the Borrowers renewed the Global Credit Facility for a total of $750 million, maturing January 20, 2012.
9. FAIR VALUE MEASUREMENTS
The Fund follows a fair value hierarchy that distinguishes between market data obtained from independent sources (observable inputs) and the Fund’s own market assumptions (unobservable inputs). These inputs are used in determining the value of the Fund’s investments and are summarized in the following fair value hierarchy:
| | • | | Level 1 – quoted prices in active markets for identical securities |
| | • | | Level 2 – other significant observable inputs (including quoted prices for similar securities, interest rates, prepayment speed, credit risk, etc.) |
| | • | | Level 3 – significant unobservable inputs (including the Fund’s own assumptions in determining the fair value of investments) |
The inputs or methodology used for valuing securities are not an indication of the risk associated with investing in those securities.
For movements between the levels within the fair value hierarchy, the Fund has adopted a policy of recognizing the transfers as of the date of the underlying event which caused the movement.
At December 31, 2010, all of the Fund’s investments in securities carried at fair value were in Level 1 inputs. For detailed industry descriptions, see the accompanying Statement of Investments.
10. SUBSEQUENT EVENTS
The Fund has evaluated subsequent events through the issuance of the financial statements and determined that no events have occurred that require disclosure other than those already disclosed in the financial statements.
FFC-20
Franklin Templeton Variable Insurance Products Trust
Franklin Flex Cap Growth Securities Fund
Report of Independent Registered Public Accounting Firm
To the Board of Trustees and Shareholders of
Franklin Templeton Variable Insurance Products Trust
In our opinion, the accompanying statement of assets and liabilities, including the statement of investments, and the related statements of operations and of changes in net assets and the financial highlights present fairly, in all material respects, the financial position of Franklin Flex Cap Growth Securities Fund (the “Fund”) at December 31, 2010, the results of its operations for the year then ended, the changes in its net assets for each of the two years in the period then ended and the financial highlights for each of the periods presented, in conformity with accounting principles generally accepted in the United States of America. These financial statements and financial highlights (hereafter referred to as “financial statements”) are the responsibility of the Fund’s management. Our responsibility is to express an opinion on these financial statements based on our audits. We conducted our audits of these financial statements in accordance with the standards of the Public Company Accounting Oversight Board (United States). Those standards require that we plan and perform the audit to obtain reasonable assurance about whether the financial statements are free of material misstatement. An audit includes examining, on a test basis, evidence supporting the amounts and disclosures in the financial statements, assessing the accounting principles used and significant estimates made by management, and evaluating the overall financial statement presentation. We believe that our audits, which included confirmation of securities at December 31, 2010 by correspondence with the custodian and brokers, provide a reasonable basis for our opinion.
PricewaterhouseCoopers LLP
San Francisco, California
February 10, 2011
FFC-21
FRANKLIN GLOBAL REAL ESTATE SECURITIES FUND
This annual report for Franklin Global Real Estate Securities Fund covers the fiscal year ended December 31, 2010.
Performance Summary as of 12/31/10
Average annual total return of Class 4 shares* represents the average annual change in value, assuming reinvestment of dividends and capital gains. Average returns smooth out variations in returns, which can be significant; they are not the same as year-by-year results.
Periods ended 12/31/10
| | | | | | | | | | | | |
| | | 1-Year | | | 5-Year | | | 10-Year | |
Average Annual Total Return | | | +20.85% | | | | -4.50% | | | | +6.04% | |
*For the period beginning 2/29/08, Class 4 performance reflects a 12b-1 fee expense of 0.35% per year, which affects future performance. Class 4 performance prior to 2/29/08 reflects historical Class 1 performance, which does not have a 12b-1 fee expense. Since 2/29/08 (effective date), the average annual total return of Class 4 shares was -3.57%. The investment manager and administrator have contractually agreed to waive or limit their respective fees so that the increase in investment management and fund administration fees paid by the Fund is phased in over a five-year period, starting on 5/1/07, with there being no increase in the rate of such fees for the first year ended 4/30/08. For each of four years thereafter through 4/30/12, the investment manager and administrator will receive one-fifth of the increase in the rate of fees. Beginning 5/1/12, the full new investment management and administration fees will then be in effect. If the manager and administrator had not waived fees, the Fund’s total returns would have been lower.
Total Return Index Comparison for a Hypothetical $10,000 Investment (1/1/01–12/31/10)
The graph below shows the change in value of a hypothetical $10,000 investment in the Fund over the indicated period and includes reinvestment of any income or distributions. The Fund’s performance* is compared to the performance of the Standard & Poor’s (S&P) Global REIT Index and the FTSE EPRA/NAREIT Developed Index. One cannot invest directly in an index, and an index is not representative of the Fund’s portfolio. Please see Important Notes to Performance Information preceding the Fund Summaries.

**Source: © 2011 Morningstar. Please see Index Descriptions following the Fund Summaries.
Franklin Global Real Estate Securities Fund Class 4
Performance reflects the Fund’s Class 4 operating expenses, but does not include any contract fees, expenses or sales charges. If they had been included, performance would be lower. These charges and deductions, particularly for variable life policies, can have a significant effect on contract values and insurance benefits. See the contract prospectus for a complete description of these expenses, including sales charges.
Performance data represent past performance, which does not guarantee future results. Investment return and principal value will fluctuate, and you may have a gain or loss when you sell your shares.
Current performance may differ from figures shown.
FGR-1
Fund Goal and Main Investments: Franklin Global Real Estate Securities Fund seeks high total return. The Fund normally invests at least 80% of its net assets in investments of companies located anywhere in the world that operate in the real estate sector.
Performance Overview
You can find the Fund’s one-year total return in the Performance Summary. The Fund underperformed its benchmark, the S&P Global REIT Index, which delivered a +23.44% total return. For comparison, the Fund performed comparably to the FTSE EPRA/NAREIT Developed Index’s +20.40% total return for the same period.1
Economic and Market Overview
During the year under review, equities advanced against a backdrop of heightened volatility and uneven global economic recovery. Emerging market regions primarily led growth, as they were generally unconstrained by the debt overhang burdening western economies and benefited from strong intrinsic demand and significant capital inflows. Policymakers in these regions began raising interest rates toward period-end to combat inflation and speculative investment. Developed economies grew at a more subdued pace, with demand recovery and asset price reflation heavily underpinned by government-sponsored, liquidity-enhancing measures. The U.S. Federal Reserve Board (Fed), having already brought official interest rates close to zero, began directly purchasing government securities as part of an extreme policy measure known as quantitative easing. Further promoting the U.S. recovery, the traditionally pro-business Republican Party gained control of the House of Representatives in mid-term elections and President Obama extended Bush-era tax cuts. In Europe, ballooning fiscal deficits took their toll on peripheral nations and growing concerns of potential sovereign defaults significantly roiled equity markets on several occasions during the period. The European Central Bank responded by pledging 750 billion euros in the spring with the intent to forestall defaults, stabilize markets and restore confidence in the euro currency, followed by further backstops in the autumn as Ireland and the rest of the periphery came under renewed duress.
1. Source: © 2011 Morningstar. One cannot invest directly in an index, and an index is not representative of the Fund’s portfolio. Please see Index Descriptions following the Fund Summaries.
Fund Risks: As a nondiversified Fund that invests at least 80% of its assets in companies located anywhere in the world that operate in the real estate sector, the Fund carries much greater risk of adverse developments affecting that sector than a fund that invests more broadly. REITs may be affected by any change in the value of the properties owned and by their location, rental income, financing and management. The Fund’s investments in stocks may offer the potential for long-term gains but can be subject to short-term price fluctuations. Foreign investing, especially in emerging markets, involves additional risks, including currency fluctuations, economic instability, market volatility, and political and social instability. Derivative instruments may be volatile and illiquid, may give rise to leverage and may involve a small investment relative to the risk assumed. The manager applies various techniques and analyses in making investment decisions for the Fund, but there can be no guarantee that these decisions will produce the desired results. The Fund’s prospectus also includes a description of the main investment risks.
FGR-2
The combination of intrinsic growth drivers in emerging markets and stimulus-induced support in the developed world encouraged the global economic recovery, and equity markets responded favorably. By the end of 2010, global equity markets recouped all losses suffered since Lehman Brothers Holdings’ 2008 bankruptcy. Commodities surged in the second half of 2010 due to near-term supply constraints and emerging market demand increases, as well as longer term fears that overly accommodative monetary policies would ultimately have negative inflationary consequences. The dollar strengthened relative to the euro, which bore the burden of the region’s fiscal crisis, but weakened against the yen, which hit multi-decade highs amid persistent deflationary pressures. Meanwhile, U.S. Treasuries and corporate bonds finished the year with gains, though Treasury prices declined considerably in the final quarter as Fed policies appeared to improve growth expectations. Although market conditions remained accommodative and corporate profitability improved, critical economic fundamentals such as employment, home prices and credit creation remained substantially depressed at period-end, leading many investors to question the true health of the global economy and the sustainability of the recovery.
Global Real Estate Market Overview
Most global real estate markets rose during the reporting period as investors responded to positive economic data. In the beginning of the year, the market surged, but declined in May and June, due to ongoing concerns about the European debt crisis. REIT values rose again in the fourth quarter on better-than-expected U.S. economic news, finishing the year strongly after a brief decline in November when renewed sovereign debt fears arose in Europe. According to the S&P Global REIT Index, in U.S. dollar terms, Japan (+53.81%) and South Africa (+41.41%) led country real estate markets.1 Other markets that posted positive results included Germany (+38.83%) and Canada (+31.14%).1 Some markets represented by the index lost value, however, such as Greece (-27.40%) and Italy (-8.79%), mainly due to sovereign debt concerns.1
Investment Strategy
We are research-driven, fundamental investors. We seek to limit price volatility by investing across markets and property types. We also seek strong total return performance. We center our active investment strategy
FGR-3
on the belief that unsynchronized regional economic activity within the global economy can provide consistent, attractive return opportunities in the global real estate markets. We use a bottom-up, value-oriented stock selection process that incorporates macro-level views in the evaluation process. We use top-down macro overlays to provide country/regional, property type, and company size perspectives in identifying international/local cyclical and thematic trends that highlight investment opportunities. We may use forward currency exchange contracts from time to time to help manage currency risk and the Fund’s exposure to various currencies.
Manager’s Discussion
During the 12 months under review, significant contributors to Fund performance relative to the S&P Global REIT Index included Host Hotels & Resorts, Starwood Hotels & Resorts Worldwide and apartment REIT Equity Residential. In the first half of the year, shares of Host Hotels & Resorts rose after its management projected that revenue per available room (RevPAR), an important hotel industry performance metric, would jump between 1% and 4% in 2010, due to growing demand from large groups and conferences. Host Hotels & Resorts’ share price climbed higher during the second half of the year as demand for hotel rooms continued to recover and management reported strong third quarter RevPAR and raised estimates for RevPAR for fiscal year 2010. Another top performer, hotel/resort property company Starwood Hotels & Resorts Worldwide,2 also benefited from these trends and from robust growth at its Asia and New York City hotels. The share prices of many residential REITs, including Equity Residential, were boosted during the year by improved investor sentiment and an increase in demand as U.S. economic recovery continued. As evidence of the improving rental market, Equity Residential’s apartment occupancy rose to 95% in the third quarter of 2010, a 1.3% increase from a year earlier.
It is also important to recognize the effect of currency movements on the Fund’s performance. In general, if the value of the U.S. dollar goes up compared with a foreign currency, an investment traded in that foreign currency will go down in value because it will be worth fewer U.S. dollars. This can have a negative effect on Fund performance. Conversely, when the U.S. dollar weakens in relation to a foreign currency,
2. This holding is not an index component.
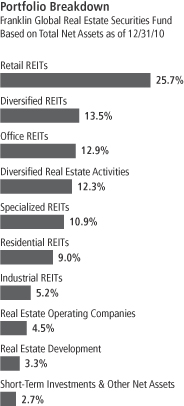
Top 10 Holdings
Franklin Global Real Estate Securities Fund
12/31/10
| | | | |
Company
Sector/Industry,
Country | | % of Total
Net Assets | |
| Sun Hung Kai Properties Ltd. | | | 4.5% | |
| Diversified Real Estate Activities, Hong Kong | |
| Unibail-Rodamco SE | | | 4.4% | |
| Retail REITs, France | |
| Simon Property Group Inc. | | | 4.0% | |
| Retail REITs, U.S. | |
| Host Hotels & Resorts Inc. | | | 2.8% | |
| Specialized REITs, U.S. | |
| Boston Properties Inc. | | | 2.8% | |
| Office REITs, U.S. | |
| Equity Residential | | | 2.5% | |
| Residential REITs, U.S. | |
| Vornado Realty Trust | | | 2.5% | |
| Diversified REITs, U.S. | |
| Hang Lung Properties Ltd. | | | 2.2% | |
| Diversified Real Estate Activities, Hong Kong | |
| Stockland | | | 2.0% | |
| Diversified REITs, Australia | |
| Mitsui Fudosan Co. Ltd. | | | 2.0% | |
| Diversified Real Estate Activities, Japan | |
The dollar value, number of shares or principal amount, and names of all portfolio holdings are listed in the Fund’s Statement of Investments.
FGR-4
an investment traded in that foreign currency will increase in value, which can contribute to Fund performance. For the 12 months ended December 31, 2010, the U.S. dollar declined in value relative to most non-U.S. currencies. As a result, the Fund’s performance was positively affected by the portfolio’s significant investment in securities with non-U.S. currency exposure. However, one cannot expect the same results in future periods.
Significant detractors from relative Fund performance during the period included our positions in Sun Hung Kai Properties,2 CapitaMalls Asia and no holding in CBL & Associates Properties. The share price of Hong Kong-based Sun Hung Kai, Asia’s largest property developer by market value, fell sharply in August after the government enacted new regulations to slow short-term market speculation. Investors sold Sun Hung Kai and other property stocks because of worries that real estate transactions would decline as buyers become wary of new regulations. Singapore-based property developer CapitaMalls Asia underperformed during the period after its management reported a major drop in profits for 2010’s third quarter due to lower rental income from shopping malls and residential projects in Singapore and China. The Fund did not own shares of retail REIT CBL & Associates Properties and, thus, did not benefit when this REIT generated one of the highest total returns within the index during the 12-month period.
Thank you for your participation in Franklin Global Real Estate Securities Fund. We look forward to serving your future investment needs.
The foregoing information reflects our analysis, opinions and portfolio holdings as of December 31, 2010, the end of the reporting period. The way we implement our main investment strategies and the resulting portfolio holdings may change depending on factors such as market and economic conditions. These opinions may not be relied upon as investment advice or an offer for a particular security. The information is not a complete analysis of every aspect of any market, country, industry, security or the Fund. Statements of fact are from sources considered reliable, but the investment manager makes no representation or warranty as to their completeness or accuracy. Although historical performance is no guarantee of future results, these insights may help you understand our investment management philosophy.
FGR-5
Fund Expenses
As an investor in a variable insurance contract (Contract) that indirectly provides for investment in an underlying mutual fund, you can incur transaction and/or ongoing expenses at both the Fund level and the Contract level.
| • | | Transaction expenses can include sales charges (loads) on purchases, redemption fees, surrender fees, transfer fees and premium taxes. |
| • | | Ongoing expenses can include management fees, distribution and service (12b-1) fees, contract fees, annual maintenance fees, mortality and expense risk fees and other fees and expenses. All mutual funds and Contracts have some types of ongoing expenses. |
The expenses shown in the table are meant to highlight ongoing expenses at the Fund level only and do not include ongoing expenses at the Contract level, or transaction expenses at either the Fund or Contract level. While the Fund does not have transaction expenses, if the transaction and ongoing expenses at the Contract level were included, the expenses shown would be higher. You should consult your Contract prospectus or disclosure document for more information.
The table shows Fund-level ongoing expenses and can help you understand these expenses and compare them with those of other mutual funds offered through the Contract. The table assumes a $1,000 investment held for the six months indicated. Please refer to the Fund prospectus for additional information on operating expenses.
Actual Fund Expenses
The first line (Actual) of the table provides actual account values and expenses. The “Ending Account Value” is derived from the Fund’s actual return, which includes the effect of ongoing Fund expenses, but does not include the effect of ongoing Contract expenses.
You can estimate the Fund-level expenses you incurred during the period by following these steps. Of course, your account value and expenses will differ from those in this illustration:
| 1. | Divide your account value by $1,000. |
If an account had an $8,600 value, then $8,600 ÷ $1,000 = 8.6.
| 2. | Multiply the result by the number under the heading “Fund-Level Expenses Incurred During Period.” |
If Fund-Level Expenses Incurred During Period were $7.50, then 8.6 x $7.50 = $64.50.
In this illustration, the estimated expenses incurred this period at the Fund level are $64.50.
Franklin Global Real Estate Securities Fund Class 4
FGR-6
Hypothetical Example for Comparison with Other Mutual Funds
Information in the second line (Hypothetical) of the table can help you compare ongoing expenses of the Fund with those of other mutual funds offered through the Contract. This information may not be used to estimate the actual ending account balance or expenses you incurred during the period. The hypothetical “Ending Account Value” is based on the Fund’s actual expense ratio and an assumed 5% annual rate of return before expenses, which does not represent the Fund’s actual return. The figure under the heading “Fund-Level Expenses Incurred During Period” shows the hypothetical expenses your account would have incurred under this scenario. You can compare this figure with the 5% hypothetical examples that appear in shareholder reports of other funds offered through a Contract.
| | | | | | | | | | | | |
| Class 4 | | Beginning
Account Value 7/1/10 | | | Ending
Account Value 12/31/10 | | | Fund-Level Expenses Incurred
During Period* 7/1/10–12/31/10 | |
Actual | | $ | 1,000 | | | $ | 1,231.40 | | | $ | 7.26 | |
Hypothetical (5% return before expenses) | | $ | 1,000 | | | $ | 1,018.70 | | | $ | 6.56 | |
*Expenses are calculated using the most recent six-month annualized expense ratio, net of expense waivers, for the Fund’s Class 4 shares 1.26%, which does not include any ongoing expenses of the Contract for which the Fund is an investment option, multiplied by the average account value over the period, multiplied 184/365 by to reflect the one-half year period.
FGR-7
Franklin Templeton Variable Insurance Products Trust
Financial Highlights
Franklin Global Real Estate Securities Fund
| | | | | | | | | | | | | | | | | | | | |
| | | Year Ended December 31, | |
| Class 1 | | 2010 | | | 2009 | | | 2008 | | | 2007 | | | 2006 | |
| | | | |
Per share operating performance | | | | | | | | | | | | | | | | | | | | |
(for a share outstanding throughout the year) | | | | | | | | | | | | | | | | | | | | |
Net asset value, beginning of year | | $ | 11.16 | | | $ | 10.84 | | | $ | 25.42 | | | $ | 35.25 | | | $ | 32.55 | |
| | | | |
Income from investment operationsa: | | | | | | | | | | | | | | | | | | | | |
Net investment incomeb | | | 0.38 | | | | 0.30 | | | | 0.62 | | | | 0.80 | | | | 0.67 | |
Net realized and unrealized gains (losses) | | | 1.94 | | | | 1.36 | | | | (9.10 | ) | | | (7.56 | ) | | | 5.40 | |
| | | | |
Total from investment operations | | | 2.32 | | | | 1.66 | | | | (8.48 | ) | | | (6.76 | ) | | | 6.07 | |
| | | | |
Less distributions from: | | | | | | | | | | | | | | | | | | | | |
Net investment income and net foreign currency gains | | | (0.36 | ) | | | (1.34 | ) | | | (0.32 | ) | | | (0.81 | ) | | | (0.75 | ) |
Net realized gains | | | — | | | | — | | | | (5.78 | ) | | | (2.26 | ) | | | (2.62 | ) |
| | | | |
Total distributions | | | (0.36 | ) | | | (1.34 | ) | | | (6.10 | ) | | | (3.07 | ) | | | (3.37 | ) |
| | | | |
Net asset value, end of year | | $ | 13.12 | | | $ | 11.16 | | | $ | 10.84 | | | $ | 25.42 | | | $ | 35.25 | |
| | | | |
| | | | | |
Total returnc | | | 21.24% | | | | 19.41% | | | | (42.22)% | | | | (20.65)% | | | | 20.87% | |
Ratios to average net assets | | | | | | | | | | | | | | | | | | | | |
Expenses before waiver and payments by affiliates | | | 1.11% | | | | 1.11% | | | | 1.08% | | | | 0.84% | | | | 0.50% | |
Expenses net of waiver and payments by affiliates | | | 0.86% | | | | 0.76% | d | | | 0.60% | d | | | 0.52% | d | | | 0.50% | d |
Net investment income | | | 3.24% | | | | 3.13% | | | | 3.41% | | | | 2.57% | | | | 2.04% | |
| | | | | |
Supplemental data | | | | | | | | | | | | | | | | | | | | |
Net assets, end of year (000’s) | | $ | 40,430 | | | $ | 38,486 | | | $ | 39,018 | | | $ | 83,250 | | | $ | 140,487 | |
Portfolio turnover rate | | | 76.52% | | | | 87.34% | | | | 77.28% | | | | 121.84% | | | | 31.39% | |
aThe amount shown for a share outstanding throughout the period may not correlate with the Statement of Operations for the period due to the timing of sales and repurchases of the Fund shares in relation to income earned and/or fluctuating market value of the investments of the Fund.
bBased on average daily shares outstanding.
cTotal return does not include any fees, charges or expenses imposed by the variable annuity and life insurance contracts for which the Franklin Templeton Variable Insurance Products Trust serves as an underlying investment vehicle.
dBenefit of expense reduction rounds to less than 0.01%.
The accompanying notes are an integral part of these financial statements.
FGR-8
Franklin Templeton Variable Insurance Products Trust
Financial Highlights (continued)
Franklin Global Real Estate Securities Fund
| | | | | | | | | | | | | | | | | | | | |
| | | Year Ended December 31, | |
| Class 2 | | 2010 | | | 2009 | | | 2008 | | | 2007 | | | 2006 | |
| | | | |
Per share operating performance | | | | | | | | | | | | | | | | | | | | |
(for a share outstanding throughout the year) | | | | | | | | | | | | | | | | | | | | |
Net asset value, beginning of year | | $ | 10.92 | | | $ | 10.61 | | | $ | 24.97 | | | $ | 34.67 | | | $ | 32.08 | |
| | | | |
Income from investment operationsa: | | | | | | | | | | | | | | | | | | | | |
Net investment incomeb | | | 0.34 | | | | 0.27 | | | | 0.56 | | | | 0.72 | | | | 0.58 | |
Net realized and unrealized gains (losses) | | | 1.90 | | | | 1.33 | | | | (8.93 | ) | | | (7.43 | ) | | | 5.31 | |
| | | | |
Total from investment operations | | | 2.24 | | | | 1.60 | | | | (8.37 | ) | | | (6.71 | ) | | | 5.89 | |
| | | | |
Less distributions from: | | | | | | | | | | | | | | | | | | | | |
Net investment income and net foreign currency gains | | | (0.33 | ) | | | (1.29 | ) | | | (0.21 | ) | | | (0.73 | ) | | | (0.68 | ) |
Net realized gains | | | — | | | | — | | | | (5.78 | ) | | | (2.26 | ) | | | (2.62 | ) |
| | | | |
Total distributions | | | (0.33 | ) | | | (1.29 | ) | | | (5.99 | ) | | | (2.99 | ) | | | (3.30 | ) |
| | | | |
Net asset value, end of year | | $ | 12.83 | | | $ | 10.92 | | | $ | 10.61 | | | $ | 24.97 | | | $ | 34.67 | |
| | | | |
| | | | | |
Total returnc | | | 20.97% | | | | 19.08% | | | | (42.39)% | | | | (20.86)% | | | | 20.58% | |
Ratios to average net assets | | | | | | | | | | | | | | | | | | | | |
Expenses before waiver and payments by affiliates | | | 1.36% | | | | 1.36% | | | | 1.33% | | | | 1.09% | | | | 0.75% | |
Expenses net of waiver and payments by affiliates | | | 1.11% | | | | 1.01% | d | | | 0.85% | d | | | 0.77% | d | | | 0.75% | d |
Net investment income | | | 2.99% | | | | 2.88% | | | | 3.16% | | | | 2.32% | | | | 1.79% | |
| | | | | |
Supplemental data | | | | | | | | | | | | | | | | | | | | |
Net assets, end of year (000’s) | | $ | 352,854 | | | $ | 345,445 | | | $ | 343,701 | | | $ | 893,837 | | | $ | 1,491,571 | |
Portfolio turnover rate | | | 76.52% | | | | 87.34% | | | | 77.28% | | | | 121.84% | | | | 31.39% | |
aThe amount shown for a share outstanding throughout the period may not correlate with the Statement of Operations for the period due to the timing of sales and repurchases of the Fund shares in relation to income earned and/or fluctuating market value of the investments of the Fund.
bBased on average daily shares outstanding.
cTotal return does not include any fees, charges or expenses imposed by the variable annuity and life insurance contracts for which the Franklin Templeton Variable Insurance Products Trust serves as an underlying investment vehicle.
dBenefit of expense reduction rounds to less than 0.01%.
The accompanying notes are an integral part of these financial statements.
FGR-9
Franklin Templeton Variable Insurance Products Trust
Financial Highlights (continued)
Franklin Global Real Estate Securities Fund
| | | | | | | | | | | | |
| | | Year Ended December 31, | |
| Class 4 | | 2010 | | | 2009 | | | 2008a | |
| | | | |
Per share operating performance | | | | | | | | | | | | |
(for a share outstanding throughout the year) | | | | | | | | | | | | |
Net asset value, beginning of year | | $ | 11.14 | | | $ | 10.80 | | | $ | 23.34 | |
| | | | |
Income from investment operationsb: | | | | | | | | | | | | |
Net investment incomec | | | 0.35 | | | | 0.27 | | | | 0.45 | |
Net realized and unrealized gains (losses) | | | 1.94 | | | | 1.36 | | | | (6.89 | ) |
| | | | |
Total from investment operations | | | 2.29 | | | | 1.63 | | | | (6.44 | ) |
| | | | |
Less distributions from: | | | | | | | | | | | | |
Net investment income and net foreign currency gains | | | (0.33 | ) | | | (1.29 | ) | | | (0.32 | ) |
Net realized gains | | | — | | | | — | | | | (5.78 | ) |
| | | | |
Total distributions | | | (0.33 | ) | | | (1.29 | ) | | | (6.10 | ) |
| | | | |
Net asset value, end of year | | $ | 13.10 | | | $ | 11.14 | | | $ | 10.80 | |
| | | | |
| | | |
Total returnd | | | 20.85% | | | | 19.01% | | | | (37.28)% | |
Ratios to average net assetse | | | | | | | | | | | | |
Expenses before waiver and payments by affiliates | | | 1.46% | | | | 1.46% | | | | 1.43% | |
Expenses net of waiver and payments by affiliates | | | 1.21% | | | | 1.11% | f | | | 0.95% | f |
Net investment income | | | 2.89% | | | | 2.78% | | | | 3.06% | |
| | | |
Supplemental data | | | | | | | | | | | | |
Net assets, end of year (000’s) | | $ | 3 | | | $ | 2 | | | $ | 2 | |
Portfolio turnover rate | | | 76.52% | | | | 87.34% | | | | 77.28% | |
aFor the period February 29, 2008 (effective date) to December 31, 2008.
bThe amount shown for a share outstanding throughout the period may not correlate with the Statement of Operations for the period due to the timing of sales and repurchases of the Fund shares in relation to income earned and/or fluctuating market value of the investments of the Fund.
cBased on average daily shares outstanding.
dTotal return does not include any fees, charges or expenses imposed by the variable annuity and life insurance contracts for which the Franklin Templeton
Variable Insurance Products Trust serves as an underlying investment vehicle. Total return is not annualized for periods less than one year.
eRatios are annualized for periods less than one year.
fBenefit of expense reduction rounds to less than 0.01%.
The accompanying notes are an integral part of these financial statements.
FGR-10
Franklin Templeton Variable Insurance Products Trust
Statement of Investments, December 31, 2010
| | | | | | | | | | | | |
| Franklin Global Real Estate Securities Fund | | Country | | | Shares | | | Value | |
Common Stocks 97.3% | | | | | | | | | | | | |
Diversified Real Estate Activities 12.3% | | | | | | | | | | | | |
City Developments Ltd. | | | Singapore | | | | 79,000 | | | $ | 773,375 | |
aHang Lung Properties Ltd. | | | Hong Kong | | | | 1,883,000 | | | | 8,757,858 | |
aMitsubishi Estate Co. Ltd. | | | Japan | | | | 369,500 | | | | 6,855,152 | |
aMitsui Fudosan Co. Ltd. | | | Japan | | | | 397,000 | | | | 7,917,992 | |
aSun Hung Kai Properties Ltd. | | | Hong Kong | | | | 1,066,000 | | | | 17,637,517 | |
aWharf (Holdings) Ltd. | | | Hong Kong | | | | 814,000 | | | | 6,262,747 | |
| | | | | | | | | | | | |
| | | | | | | | | | | 48,204,641 | |
| | | | | | | | | | | | |
Diversified REITs 13.5% | | | | | | | | | | | | |
British Land Co. PLC | | | United Kingdom | | | | 672,400 | | | | 5,517,976 | |
Canadian REIT | | | Canada | | | | 79,200 | | | | 2,466,065 | |
Colonial Properties Trust | | | United States | | | | 164,200 | | | | 2,963,810 | |
GPT Group | | | Australia | | | | 1,943,169 | | | | 5,837,173 | |
H&R REIT | | | Canada | | | | 86,400 | | | | 1,683,466 | |
Kenedix Realty Investment Corp. | | | Japan | | | | 670 | | | | 3,148,814 | |
Land Securities Group PLC | | | United Kingdom | | | | 730,662 | | | | 7,666,112 | |
Liberty Property Trust | | | United States | | | | 40,100 | | | | 1,279,992 | |
Mirvac Group | | | Australia | | | | 1,274,369 | | | | 1,595,056 | |
Stockland | | | Australia | | | | 2,181,416 | | | | 8,023,902 | |
United Urban Investment Corp. | | | Japan | | | | 2,454 | | | | 3,137,976 | |
Vornado Realty Trust | | | United States | | | | 118,027 | | | | 9,835,190 | |
| | | | | | | | | | | | |
| | | | | | | | | | | 53,155,532 | |
| | | | | | | | | | | | |
Industrial REITs 5.2% | | | | | | | | | | | | |
AMB Property Corp. | | | United States | | | | 188,300 | | | | 5,970,993 | |
Ascendas REIT | | | Singapore | | | | 466,000 | | | | 751,847 | |
Goodman Group | | | Australia | | | | 5,955,226 | | | | 3,955,089 | |
Japan Logistics Fund Inc. | | | Japan | | | | 220 | | | | 2,076,009 | |
Mapletree Logistics Trust | | | Singapore | | | | 1,499,280 | | | | 1,127,673 | |
bMapletree Logistics Trust, 144A | | | Singapore | | | | 1,115,100 | | | | 838,715 | |
ProLogis | | | United States | | | | 409,400 | | | | 5,911,736 | |
| | | | | | | | | | | | |
| | | | | | | | | | | 20,632,062 | |
| | | | | | | | | | | | |
Office REITs 12.9% | | | | | | | | | | | | |
Alexandria Real Estate Equities Inc. | | | United States | | | | 54,600 | | | | 3,999,996 | |
Boston Properties Inc. | | | United States | | | | 126,700 | | | | 10,908,870 | |
CapitaCommercial Trust | | | Singapore | | | | 3,481,000 | | | | 4,069,758 | |
Champion REIT | | | Hong Kong | | | | 5,048,196 | | | | 2,981,180 | |
Commonwealth Property Office Fund | | | Australia | | | | 1,442,589 | | | | 1,223,391 | |
Daiwa Office Investment Corp. | | | Japan | | | | 292 | | | | 1,038,502 | |
Derwent London PLC | | | United Kingdom | | | | 54,060 | | | | 1,317,418 | |
cDouglas Emmett Inc. | | | United States | | | | 84,900 | | | | 1,409,340 | |
Great Portland Estates PLC | | | United Kingdom | | | | 556,736 | | | | 3,126,061 | |
Highwoods Properties Inc. | | | United States | | | | 62,000 | | | | 1,974,700 | |
ING Office Fund | | | Australia | | | | 2,740,458 | | | | 1,554,035 | |
Japan Real Estate Investment Co. | | | Japan | | | | 382 | | | | 3,962,353 | |
Kilroy Realty Corp. | | | United States | | | | 64,700 | | | | 2,359,609 | |
Nippon Building Fund Inc. | | | Japan | | | | 76 | | | | 779,895 | |
ORIX JREIT Inc. | | | Japan | | | | 416 | | | | 2,705,858 | |
Silic | | | France | | | | 14,200 | | | | 1,760,364 | |
SL Green Realty Corp. | | | United States | | | | 82,400 | | | | 5,562,824 | |
| | | | | | | | | | | | |
| | | | | | | | | | | 50,734,154 | |
| | | | | | | | | | | | |
FGR-11
Franklin Templeton Variable Insurance Products Trust
Statement of Investments, December 31, 2010 (continued)
| | | | | | | | | | | | |
| Franklin Global Real Estate Securities Fund | | Country | | | Shares | | | Value | |
Common Stocks (continued) | | | | | | | | | | | | |
Real Estate Development 3.3% | | | | | | | | | | | | |
Agile Property Holdings Ltd. | | | China | | | | 1,328,000 | | | $ | 1,964,876 | |
aChina Overseas Land & Investment Ltd. | | | Hong Kong | | | | 1,048,000 | | | | 1,941,615 | |
Evergrande Real Estate Group Ltd. | | | China | | | | 3,814,000 | | | | 1,864,677 | |
Keppel Land Ltd. | | | Singapore | | | | 1,095,000 | | | | 4,096,648 | |
a,cKWG Property Holdings Ltd. | | | China | | | | 1,357,617 | | | | 1,048,016 | |
aSoho China Ltd. | | | China | | | | 2,590,500 | | | | 1,913,087 | |
| | | | | | | | | | | | |
| | | | | | | | | | | 12,828,919 | |
| | | | | | | | | | | | |
Real Estate Operating Companies 4.5% | | | | | | | | | | | | |
aBrookfield Properties Corp. | | | Canada | | | | 111,900 | | | | 1,970,481 | |
aFastighets AB Hufvudstaden, A | | | Sweden | | | | 322,397 | | | | 3,772,312 | |
b,cGlobal Logistic Properties Ltd., 144A | | | Singapore | | | | 1,106,000 | | | | 1,862,011 | |
Hong Kong Land Holdings Ltd. | | | Hong Kong | | | | 548,000 | | | | 3,956,560 | |
Hysan Development Co. Ltd. | | | Hong Kong | | | | 1,069,000 | | | | 5,047,578 | |
Sponda OYJ | | | Finland | | | | 236,640 | | | | 1,228,273 | |
| | | | | | | | | | | | |
| | | | | | | | | | | 17,837,215 | |
| | | | | | | | | | | | |
Residential REITs 9.0% | | | | | | | | | | | | |
American Campus Communities Inc. | | | United States | | | | 78,800 | | | | 2,502,688 | |
Apartment Investment & Management Co., A | | | United States | | | | 109,500 | | | | 2,829,480 | |
AvalonBay Communities Inc. | | | United States | | | | 32,990 | | | | 3,713,024 | |
Boardwalk REIT | | | Canada | | | | 89,200 | | | | 3,689,833 | |
BRE Properties Inc. | | | United States | | | | 36,000 | | | | 1,566,000 | |
Camden Property Trust | | | United States | | | | 37,000 | | | | 1,997,260 | |
Equity Lifestyle Properties Inc. | | | United States | | | | 20,900 | | | | 1,168,937 | |
Equity Residential | | | United States | | | | 191,700 | | | | 9,958,815 | |
Essex Property Trust Inc. | | | United States | | | | 17,180 | | | | 1,962,300 | |
Nippon Accommodations Fund Inc. | | | Japan | | | | 261 | | | | 2,019,193 | |
UDR Inc. | | | United States | | | | 166,570 | | | | 3,917,726 | |
| | | | | | | | | | | | |
| | | | | | | | | | | 35,325,256 | |
| | | | | | | | | | | | |
Retail REITs 25.7% | | | | | | | | | | | | |
bCapitaMalls Asia Ltd., 144A | | | Singapore | | | | 561,000 | | | | 848,278 | |
CFS Retail Property Trust | | | Australia | | | | 527,514 | | | | 948,618 | |
Charter Hall Retail | | | Australia | | | | 710,332 | | | | 2,133,798 | |
Corio NV | | | Netherlands | | | | 61,331 | | | | 3,939,417 | |
Developers Diversified Realty Corp. | | | United States | | | | 281,876 | | | | 3,971,633 | |
Eurocommercial Properties NV | | | Netherlands | | | | 58,470 | | | | 2,694,228 | |
Federal Realty Investment Trust | | | United States | | | | 50,100 | | | | 3,904,293 | |
Frontier Real Estate Investment Corp. | | | Japan | | | | 214 | | | | 2,043,117 | |
Hammerson PLC | | | United Kingdom | | | | 632,860 | | | | 4,124,188 | |
Japan Retail Fund Investment Corp. | | | Japan | | | | 1,472 | | | | 2,823,411 | |
Kimco Realty Corp. | | | United States | | | | 166,200 | | | | 2,998,248 | |
Klepierre | | | France | | | | 42,900 | | | | 1,549,229 | |
The Link REIT | | | Hong Kong | | | | 2,142,600 | | | | 6,657,290 | |
The Macerich Co. | | | United States | | | | 124,990 | | | | 5,920,776 | |
National Retail Properties Inc. | | | United States | | | | 127,600 | | | | 3,381,400 | |
Realty Income Corp. | | | United States | | | | 56,200 | | | | 1,922,040 | |
Regency Centers Corp. | | | United States | | | | 69,900 | | | | 2,952,576 | |
RioCan REIT | | | Canada | | | | 115,900 | | | | 2,556,960 | |
Simon Property Group Inc. | | | United States | | | | 157,544 | | | | 15,674,053 | |
Suntec REIT | | | Singapore | | | | 2,100,000 | | | | 2,455,183 | |
Taubman Centers Inc. | | | United States | | | | 35,200 | | | | 1,776,896 | |
Unibail-Rodamco SE | | | France | | | | 87,093 | | | | 17,243,282 | |
FGR-12
Franklin Templeton Variable Insurance Products Trust
Statement of Investments, December 31, 2010 (continued)
| | | | | | | | | | | | |
| Franklin Global Real Estate Securities Fund | | Country | | | Shares | | | Value | |
Common Stocks (continued) | | | | | | | | | | | | |
Retail REITs (continued) | | | | | | | | | | | | |
Westfield Group | | | Australia | | | | 635,432 | | | $ | 6,219,840 | |
cWestfield Retail Trust | | | Australia | | | | 954,062 | | | | 2,505,269 | |
| | | | | | | | | | | | |
| | | | | | | | | | | 101,244,023 | |
| | | | | | | | | | | | |
Specialized REITs 10.9% | | | | | | | | | | | | |
CDL Hospitality Trusts | | | Singapore | | | | 1,687,000 | | | | 2,734,965 | |
HCP Inc. | | | United States | | | | 147,100 | | | | 5,411,809 | |
Health Care REIT Inc. | | | United States | | | | 41,900 | | | | 1,996,116 | |
Hersha Hospitality Trust | | | United States | | | | 224,300 | | | | 1,480,380 | |
Host Hotels & Resorts Inc. | | | United States | | | | 625,339 | | | | 11,174,808 | |
cHyatt Hotels Corp. | | | United States | | | | 50,820 | | | | 2,325,523 | |
Pebblebrook Hotel Trust | | | United States | | | | 57,630 | | | | 1,171,042 | |
Public Storage | | | United States | | | | 57,700 | | | | 5,851,934 | |
Starwood Hotels & Resorts Worldwide Inc. | | | United States | | | | 45,200 | | | | 2,747,256 | |
Ventas Inc. | | | United States | | | | 150,000 | | | | 7,872,000 | |
| | | | | | | | | | | | |
| | | | | | | | | | | 42,765,833 | |
| | | | | | | | | | | | |
Total Common Stocks (Cost $277,350,932) | | | | | | | | | | | 382,727,635 | |
| | | | | | | | | | | | |
| | | |
| | | | | | Principal
Amount | | | | |
Short Term Investments (Cost $18,861,662) 4.8% | | | | | | | | | | | | |
Repurchase Agreements 4.8% | | | | | | | | | | | | |
dJoint Repurchase Agreement, 0.141%, 1/03/11 (Maturity Value $18,861,884) | | | United States | | | $ | 18,861,662 | | | | 18,861,662 | |
Barclays Capital Inc. (Maturity Value $3,247,451) | | | | | | | | | | | | |
BNP Paribas Securities Corp. (Maturity Value $3,340,063) | | | | | | | | | | | | |
Credit Suisse Securities (USA) LLC (Maturity Value $1,855,632) | | | | | | | | | | | | |
Deutsche Bank Securities Inc. (Maturity Value $2,996,022) | | | | | | | | | | | | |
HSBC Securities (USA) Inc. (Maturity Value $2,319,634) | | | | | | | | | | | | |
Merrill Lynch, Pierce, Fenner & Smith Inc. (Maturity Value $1,855,632) | | | | | | | | | | | | |
Morgan Stanley & Co. Inc. (Maturity Value $2,319,634) | | | | | | | | | | | | |
UBS Securities LLC (Maturity Value $927,816) | | | | | | | | | | | | |
Collateralized by U.S. Government Agency Securities, 0.50% - 5.75%, 1/07/11 - 10/26/15;
eU.S. Treasury Bills, 5/12/11 - 7/28/11; and U.S. Treasury Notes, 0.375% - 1.875%,
9/30/11 - 9/30/17 (valued at $19,269,512) | | | | | | | | | | | | |
| | | | | | | | | | | | |
Total Investments (Cost $296,212,594) 102.1% | | | | | | | | | | | 401,589,297 | |
Other Assets, less Liabilities (2.1)% | | | | | | | | | | | (8,302,899 | ) |
| | | | | | | | | | | | |
Net Assets 100.0% | | | | | | | | | | $ | 393,286,398 | |
| | | | | | | | | | | | |
See Abbreviations on page FGR-24.
aA portion or all of the security purchased on a delayed delivery basis.
bSecurity was purchased pursuant to Rule 144A under the Securities Act of 1933 and may be sold in transactions exempt from registration only to qualified institutional buyers or in a public offering registered under the Securities Act of 1933. These securities have been deemed liquid under guidelines approved by the Trust’s Board of Trustees. At December 31, 2010, the aggregate value of these securities was $3,549,004, representing 0.90% of net assets.
cNon-income producing.
dSee Note 1(c) regarding joint repurchase agreement.
eThe security is traded on a discount basis with no stated coupon rate.
The accompanying notes are an integral part of these financial statements.
FGR-13
Franklin Templeton Variable Insurance Products Trust
Financial Statements
Statement of Assets and Liabilities
December 31, 2010
| | | | |
| | | Franklin Global
Real Estate
Securities Fund | |
Assets: | | | | |
Investments in securities: | | | | |
Cost - Unaffiliated issuers | | $ | 277,350,932 | |
Cost - Repurchase agreements | | | 18,861,662 | |
| | | | |
Total cost of investments | | $ | 296,212,594 | |
| | | | |
Value - Unaffiliated issuers | | $ | 382,727,635 | |
Value - Repurchase agreements | | | 18,861,662 | |
| | | | |
Total value of investments | | | 401,589,297 | |
Receivables: | | | | |
Investment securities sold | | | 7,404,558 | |
Capital shares sold | | | 30,875 | |
Dividends | | | 1,826,150 | |
Other assets | | | 71 | |
| | | | |
Total assets | | | 410,850,951 | |
| | | | |
Liabilities: | | | | |
Payables: | | | | |
Investment securities purchased | | | 16,594,635 | |
Capital shares redeemed | | | 392,439 | |
Affiliates | | | 417,866 | |
Accrued expenses and other liabilities | | | 159,613 | |
| | | | |
Total liabilities | | | 17,564,553 | |
| | | | |
Net assets, at value | | $ | 393,286,398 | |
| | | | |
Net assets consist of: | | | | |
Paid-in capital | | $ | 662,706,912 | |
Undistributed net investment income | | | 9,740,793 | |
Net unrealized appreciation (depreciation) | | | 105,353,624 | |
Accumulated net realized gain (loss) | | | (384,514,931 | ) |
| | | | |
Net assets, at value | | $ | 393,286,398 | |
| | | | |
Class 1: | | | | |
Net assets, at value | | $ | 40,429,951 | |
| | | | |
Shares outstanding | | | 3,082,498 | |
| | | | |
Net asset value and maximum offering price per share | | $ | 13.12 | |
| | | | |
Class 2: | | | | |
Net assets, at value | | $ | 352,853,643 | |
| | | | |
Shares outstanding | | | 27,501,844 | |
| | | | |
Net asset value and maximum offering price per share | | $ | 12.83 | |
| | | | |
Class 4: | | | | |
Net assets, at value | | $ | 2,804 | |
| | | | |
Shares outstanding | | | 214 | |
| | | | |
Net asset value and maximum offering price per share | | $ | 13.10 | |
| | | | |
The accompanying notes are an integral part of these financial statements.
FGR-14
Franklin Templeton Variable Insurance Products Trust
Financial Statements (continued)
Statement of Operations
for the year ended December 31, 2010
| | | | |
| | | Franklin Global
Real Estate
Securities Fund | |
Investment income: | | | | |
Dividends (net of foreign taxes of $615,147) | | $ | 15,456,936 | |
Interest | | | 12,365 | |
| | | | |
Total investment income | | | 15,469,301 | |
| | | | |
Expenses: | | | | |
Management fees (Note 3a) | | | 3,012,970 | |
Administrative fees (Note 3b) | | | 941,553 | |
Distribution fees: (Note 3c) | | | | |
Class 2 | | | 844,870 | |
Class 4 | | | 9 | |
Unaffiliated transfer agent fees | | | 1,179 | |
Custodian fees (Note 4) | | | 46,454 | |
Reports to shareholders | | | 114,131 | |
Professional fees | | | 51,555 | |
Trustees’ fees and expenses | | | 1,701 | |
Other | | | 28,009 | |
| | | | |
Total expenses | | | 5,042,431 | |
Expenses waived/paid by affiliates (Note 3e) | | | (941,811 | ) |
| | | | |
Net expenses | | | 4,100,620 | |
| | | | |
Net investment income | | | 11,368,681 | |
| | | | |
Realized and unrealized gains (losses): | | | | |
Net realized gain (loss) from: | | | | |
Investments | | | 24,973,306 | |
Realized gain distributions from REITs | | | 1,493,537 | |
Foreign currency transactions | | | 3,859,184 | |
| | | | |
Net realized gain (loss) | | | 30,326,027 | |
| | | | |
Net change in unrealized appreciation (depreciation) on: | | | | |
Investments | | | 31,972,646 | |
Translation of other assets and liabilities denominated in foreign currencies | | | (1,961,372 | ) |
| | | | |
Net change in unrealized appreciation (depreciation) | | | 30,011,274 | |
| | | | |
Net realized and unrealized gain (loss) | | | 60,337,301 | |
| | | | |
Net increase (decrease) in net assets resulting from operations | | $ | 71,705,982 | |
| | | | |
The accompanying notes are an integral part of these financial statements.
FGR-15
Franklin Templeton Variable Insurance Products Trust
Financial Statements (continued)
Statements of Changes in Net Assets
| | | | | | | | |
| | | Franklin Global Real Estate
Securities Fund | |
| | | Year Ended December 31, | |
| | | 2010 | | | 2009 | |
| | | | |
Increase (decrease) in net assets: | | | | | | | | |
Operations: | | | | | | | | |
Net investment income | | $ | 11,368,681 | | | $ | 9,772,462 | |
Net realized gain (loss) from investments, realized gain distributions from REITs and foreign currency transactions | | | 30,326,027 | | | | (166,331,137 | ) |
Net change in unrealized appreciation (depreciation) on investments and translation of other assets and liabilities denominated in foreign currencies | | | 30,011,274 | | | | 215,645,516 | |
| | | | |
Net increase (decrease) in net assets resulting from operations | | | 71,705,982 | | | | 59,086,841 | |
| | | | |
Distributions to shareholders from net investment income and net foreign currency gains: | | | | | | | | |
Class 1 | | | (1,153,555 | ) | | | (4,292,176 | ) |
Class 2 | | | (9,661,113 | ) | | | (39,137,801 | ) |
Class 4 | | | (70 | ) | | | (277 | ) |
| | | | |
Total distributions to shareholders | | | (10,814,738 | ) | | | (43,430,254 | ) |
| | | | |
Capital share transactions: (Note 2) | | | | | | | | |
Class 1 | | | (4,330,791 | ) | | | (1,895,657 | ) |
Class 2 | | | (47,207,542 | ) | | | (12,548,461 | ) |
| | | | |
Total capital share transactions | | | (51,538,333 | ) | | | (14,444,118 | ) |
| | | | |
Net increase (decrease) in net assets | | | 9,352,911 | | | | 1,212,469 | |
Net assets: | | | | | | | | |
Beginning of year | | | 383,933,487 | | | | 382,721,018 | |
| | | | |
End of year | | $ | 393,286,398 | | | $ | 383,933,487 | |
| | | | |
Undistributed net investment income (distributions in excess of net investment income) included in net assets: | | | | | | | | |
End of year | | $ | 9,740,793 | | | $ | (2,713,247 | ) |
| | | | |
The accompanying notes are an integral part of these financial statements.
FGR-16
Franklin Templeton Variable Insurance Products Trust
Notes to Financial Statements
Franklin Global Real Estate Securities Fund
1. ORGANIZATION AND SIGNIFICANT ACCOUNTING POLICIES
Franklin Templeton Variable Insurance Products Trust (Trust) is registered under the Investment Company Act of 1940, as amended, (1940 Act) as an open-end investment company, consisting of twenty separate funds. The Franklin Global Real Estate Securities Fund (Fund) is included in this report. The financial statements of the remaining funds in the Trust are presented separately. Shares of the Fund are generally sold only to insurance company separate accounts to fund the benefits of variable life insurance policies or variable annuity contracts. At December 31, 2010, 60.47% of the Fund’s shares were held through one insurance company. The Fund offers three classes of shares: Class 1, Class 2, and Class 4. Each class of shares differs by its distribution fees, voting rights on matters affecting a single class and its exchange privilege.
The following summarizes the Fund’s significant accounting policies.
a. Financial Instrument Valuation
The Fund values its investments in securities and other assets and liabilities carried at fair value daily. Fair value is the price that would be received to sell an asset or paid to transfer a liability in an orderly transaction between market participants on the measurement date. Under procedures approved by the Trust’s Board of Trustees, the Fund may utilize independent pricing services, quotations from securities and financial instrument dealers, and other market sources to determine fair value.
Equity securities listed on an exchange or on the NASDAQ National Market System are valued at the last quoted sale price or the official closing price of the day, respectively. Foreign equity securities are valued as of the close of trading on the foreign stock exchange on which the security is primarily traded, or the NYSE, whichever is earlier. The value is then converted into its U.S. dollar equivalent at the foreign exchange rate in effect at the close of the NYSE on the day that the value of the security is determined. Over-the-counter securities are valued within the range of the most recent quoted bid and ask prices. Securities that trade in multiple markets or on multiple exchanges are valued according to the broadest and most representative market. Certain equity securities are valued based upon fundamental characteristics or relationships to similar securities. Repurchase agreements are valued at cost, which approximates market value.
The Fund has procedures to determine the fair value of securities and other financial instruments for which market prices are not readily available or which may not be reliably priced. Under these procedures, the Fund primarily employs a market-based approach which may use related or comparable assets or liabilities, recent transactions, market multiples, book values, and other relevant information for the investment to determine the fair value of the investment. The Fund may also use an income-based valuation approach in which the anticipated future cash flows of the investment are discounted to calculate fair value. Discounts may also be applied due to the nature or duration of any restrictions on the disposition of the investments. Due to the inherent uncertainty of valuations of such investments, the fair values may differ significantly from the values that would have been used had an active market existed.
Trading in securities on foreign securities stock exchanges and over-the-counter markets may be completed before the daily close of business on the NYSE. Occasionally, events occur between the time at which trading in a foreign security is completed and the close of the NYSE that might call into question the reliability of the value of a portfolio security held by the Fund. As a result, differences may arise between the value of the Fund’s portfolio securities as determined at the foreign market close and the latest indications of value at the close of the NYSE. In order to minimize the potential for these differences, the investment manager monitors price movements following the close of trading in foreign stock markets through a series of country specific market proxies (such as baskets of American Depository Receipts, futures contracts and exchange traded funds). These price movements are measured against established trigger thresholds for each specific market proxy to assist in determining if an event has occurred that may call into question the reliability of the values of the foreign securities held by the Fund. If such an event occurs, the securities may be valued using fair value procedures, which may include the use of independent pricing services.
FGR-17
Franklin Templeton Variable Insurance Products Trust
Notes to Financial Statements (continued)
Franklin Global Real Estate Securities Fund
1. ORGANIZATION AND SIGNIFICANT ACCOUNTING POLICIES (continued)
b. Foreign Currency Translation
Portfolio securities and other assets and liabilities denominated in foreign currencies are translated into U.S. dollars based on the exchange rate of such currencies against U.S. dollars on the date of valuation. The Fund may enter into foreign currency exchange contracts to facilitate transactions denominated in a foreign currency. Purchases and sales of securities, income and expense items denominated in foreign currencies are translated into U.S. dollars at the exchange rate in effect on the transaction date. Portfolio securities and assets and liabilities denominated in foreign currencies contain risks that those currencies will decline in value relative to the U.S. dollar. Occasionally, events may impact the availability or reliability of foreign exchange rates used to convert the U.S. dollar equivalent value. If such an event occurs, the foreign exchange rate will be valued at fair value using procedures established and approved by the Trust’s Board of Trustees.
The Fund does not separately report the effect of changes in foreign exchange rates from changes in market prices on securities held. Such changes are included in net realized and unrealized gain or loss from investments on the Statement of Operations.
Realized foreign exchange gains or losses arise from sales of foreign currencies, currency gains or losses realized between the trade and settlement dates on securities transactions and the difference between the recorded amounts of dividends, interest, and foreign withholding taxes and the U.S. dollar equivalent of the amounts actually received or paid. Net unrealized foreign exchange gains and losses arise from changes in foreign exchange rates on foreign denominated assets and liabilities other than investments in securities held at the end of the reporting period.
c. Joint Repurchase Agreement
The Fund may enter into a joint repurchase agreement whereby its uninvested cash balance is deposited into a joint cash account with other funds managed by the investment manager or an affiliate of the investment manager and is used to invest in one or more repurchase agreements. The value and face amount of the joint repurchase agreement are allocated to the funds based on their pro-rata interest. A repurchase agreement is accounted for as a loan by the fund to the seller, collateralized by securities which are delivered to the fund’s custodian. The market value, including accrued interest, of the initial collateralization is required to be at least 102% of the dollar amount invested by the funds, with the value of the underlying securities marked to market daily to maintain coverage of at least 100%. The joint repurchase agreement held by the Fund at year end had been entered into on December 31, 2010.
d. Derivative Financial Instruments
The Fund invested in derivative financial instruments (derivatives) in order to manage risk or gain exposure to various other investments or markets. Derivatives are financial contracts based on an underlying or notional amount, require no initial investment or an initial net investment that is smaller than would normally be required to have a similar response to changes in market factors, and require or permit net settlement. Derivatives contain various risks including the potential inability of the counterparty to fulfill their obligations under the terms of the contract, the potential for an illiquid secondary market, and/or the potential for market movements which expose the Fund to gains or losses in excess of the amounts shown on the Statement of Assets and Liabilities. Realized gain and loss and unrealized appreciation and depreciation on these contracts for the period are included in the Statement of Operations.
The Fund entered into forward exchange contracts primarily to manage and/or gain exposure to certain foreign currencies. A forward exchange contract is an agreement between the Fund and a counterparty to buy or sell a foreign currency for a specific exchange rate on a future date. Pursuant to the terms of the forward exchange contracts, cash or securities may be required to be deposited as collateral. Unrestricted cash may be invested according to the Fund’s investment objectives.
See Note 7 regarding other derivative information.
FGR-18
Franklin Templeton Variable Insurance Products Trust
Notes to Financial Statements (continued)
Franklin Global Real Estate Securities Fund
1. ORGANIZATION AND SIGNIFICANT ACCOUNTING POLICIES (continued)
e. Securities Purchased on a Delayed Delivery Basis
The Fund may purchase securities on a delayed delivery basis, with payment and delivery scheduled for a future date. These transactions are subject to market fluctuations and are subject to the risk that the value at delivery may be more or less than the trade date purchase price. Although the Fund will generally purchase these securities with the intention of holding the securities, it may sell the securities before the settlement date. Sufficient assets have been segregated for these securities.
f. Income Taxes
It is the Fund’s policy to qualify as a regulated investment company under the Internal Revenue Code. The Fund intends to distribute to shareholders substantially all of its taxable income and net realized gains to relieve it from federal income and excise taxes. As a result, no provision for U.S. federal income taxes is required. The Fund files U.S. income tax returns as well as tax returns in certain other jurisdictions. The Fund’s application of those tax rules is subject to its understanding. The Fund records a provision for taxes in its financial statements including penalties and interest, if any, for a tax position taken on a tax return (or expected to be taken) when it fails to meet the more likely than not (a greater than 50% probability) threshold and based on the technical merits, the tax position may not be sustained upon examination by the tax authorities. As of December 31, 2010, and for all open tax years, the Fund has determined that no provision for income tax is required in the Fund’s financial statements. Open tax years are those that remain subject to examination and are based on each tax jurisdiction statute of limitation. The Fund is not aware of any tax position for which it is reasonably possible that the total amounts of unrecognized tax effects will significantly change in the next twelve months.
The Fund may be subject to foreign taxation related to income received, capital gains on the sale of securities and certain foreign currency transactions in the foreign jurisdictions in which it invests. Foreign taxes, if any, are recorded based on the tax regulations and rates that exist in the foreign markets in which the Fund invests. When a capital gain tax is determined to apply the Fund records an estimated deferred tax liability for net unrealized gains on these securities in an amount that would be payable if the securities were disposed of on the valuation date.
g. Security Transactions, Investment Income, Expenses and Distributions
Security transactions are accounted for on trade date. Realized gains and losses on security transactions are determined on a specific identification basis. Interest income and estimated expenses are accrued daily. Dividend income is recorded on the ex-dividend date except that certain dividends from foreign securities are recognized as soon as the Fund is notified of the ex-dividend date. Distributions to shareholders are recorded on the ex-dividend date and are determined according to income tax regulations (tax basis). Distributable earnings determined on a tax basis may differ from earnings recorded in accordance with accounting principles generally accepted in the United States of America. These differences may be permanent or temporary. Permanent differences are reclassified among capital accounts to reflect their tax character. These reclassifications have no impact on net assets or the results of operations. Temporary differences are not reclassified, as they may reverse in subsequent periods.
Common expenses incurred by the Trust are allocated among the funds based on the ratio of net assets of each fund to the combined net assets of the Trust. Fund specific expenses are charged directly to the fund that incurred the expense.
Realized and unrealized gains and losses and net investment income, not including class specific expenses, are allocated daily to each class of shares based upon the relative proportion of net assets of each class. Differences in per share distributions, by class, are generally due to differences in class specific expenses.
Distributions received by the Fund from certain securities may be a return of capital (ROC). Such distributions reduce the cost basis of the securities, and any distributions in excess of the cost basis are recognized as capital gains.
FGR-19
Franklin Templeton Variable Insurance Products Trust
Notes to Financial Statements (continued)
Franklin Global Real Estate Securities Fund
1. ORGANIZATION AND SIGNIFICANT ACCOUNTING POLICIES (continued)
h. Accounting Estimates
The preparation of financial statements in accordance with accounting principles generally accepted in the United States of America requires management to make estimates and assumptions that affect the reported amounts of assets and liabilities at the date of the financial statements and the amounts of income and expenses during the reporting period. Actual results could differ from those estimates.
i. Guarantees and Indemnifications
Under the Trust’s organizational documents, its officers and trustees are indemnified by the Trust against certain liabilities arising out of the performance of their duties to the Trust. Additionally, in the normal course of business, the Trust, on behalf of the Fund, enters into contracts with service providers that contain general indemnification clauses. The Trust’s maximum exposure under these arrangements is unknown as this would involve future claims that may be made against the Trust that have not yet occurred. Currently, the Trust expects the risk of loss to be remote.
2. SHARES OF BENEFICIAL INTEREST
At December 31, 2010, there were an unlimited number of shares authorized (without par value). Transactions in the Fund’s shares were as follows:
| | | | | | | | | | | | | | | | |
| | | Year Ended December 31, | |
| | | 2010a | | | 2009a | |
| Class 1 Shares: | | Shares | | | Amount | | | Shares | | | Amount | |
Shares sold | | | 33,091 | | | $ | 392,138 | | | | 44,534 | | | $ | 426,475 | |
Shares issued in reinvestment of distributions | | | 100,659 | | | | 1,153,555 | | | | 510,366 | | | | 4,292,176 | |
Shares redeemed | | | (500,801 | ) | | | (5,876,484 | ) | | | (705,877 | ) | | | (6,614,308 | ) |
| | | | |
Net increase (decrease) | | | (367,051 | ) | | $ | (4,330,791 | ) | | | (150,977 | ) | | $ | (1,895,657 | ) |
| | | | |
Class 2 Shares: | | | | | | | | | | | | | | | | |
Shares sold | | | 398,129 | | | $ | 4,697,314 | | | | 1,108,202 | | | $ | 9,575,869 | |
Shares issued in reinvestment of distributions | | | 860,295 | | | | 9,661,113 | | | | 4,749,733 | | | | 39,137,801 | |
Shares redeemed | | | (5,381,053 | ) | | | (61,565,969 | ) | | | (6,626,769 | ) | | | (61,262,131 | ) |
| | | | |
Net increase (decrease) | | | (4,122,629 | ) | | $ | (47,207,542 | ) | | | (768,834 | ) | | $ | (12,548,461 | ) |
| | | | |
aDuring the year Class 4 did not report any share transactions.
3. TRANSACTIONS WITH AFFILIATES
Franklin Resources, Inc. is the holding company for various subsidiaries that together are referred to as Franklin Templeton Investments. Certain officers and trustees of the Fund are also officers and/or directors of the following subsidiaries:
| | |
| Subsidiary | | Affiliation |
Franklin Templeton Institutional, LLC (FT Institutional) | | Investment manager |
Franklin Templeton Services, LLC (FT Services) | | Administrative manager |
Franklin Templeton Distributors, Inc. (Distributors) | | Principal underwriter |
Franklin Templeton Investor Services, LLC (Investor Services) | | Transfer agent |
FGR-20
Franklin Templeton Variable Insurance Products Trust
Notes to Financial Statements (continued)
Franklin Global Real Estate Securities Fund
3. TRANSACTIONS WITH AFFILIATES (continued)
a. Management Fees
The Fund pays an investment management fee to FT Institutional based on the average daily net assets of the Fund as follows:
| | |
| Annualized Fee Rate | | Net Assets |
| 0.800% | | Up to and including $500 million |
| 0.700% | | Over $500 million, up to and including $1 billion |
| 0.650% | | Over $1 billion, up to and including $1.5 billion |
| 0.600% | | Over $1.5 billion, up to and including $6.5 billion |
| 0.580% | | Over $6.5 billion, up to and including $11.5 billion |
| 0.560% | | Over $11.5 billion, up to and including $16.5 billion |
| 0.540% | | Over $16.5 billion, up to and including $19 billion |
| 0.530% | | Over $19 billion, up to and including $21.5 billion |
| 0.520% | | In excess of $21.5 billion |
b. Administrative Fees
The Fund pays an administrative fee to FT Services of 0.25% per year of the average daily net assets of the Fund.
c. Distribution Fees
The Trust’s Board of Trustees has adopted distribution plans for Class 2 and Class 4 shares pursuant to Rule 12b-1 under the 1940 Act. Under the Fund’s compensation distribution plans, the Fund pays Distributors for costs incurred in connection with the servicing, sale and distribution of the Fund’s shares up to 0.35% per year of its average daily net assets of each class. The Board of Trustees has agreed to limit the current rate to 0.25% per year for Class 2.
d. Transfer Agent Fees
Investor Services, under terms of an agreement, performs shareholder servicing for the Fund and is not paid by the Fund for the services.
e. Waiver and Expense Reimbursements
FT Services and FT Institutional have contractually agreed in advance to waive or limit their respective fees so that the increase in the Fund’s investment management and fund administration fees that became effective May 1, 2007 is phased in over a five year period, with there being no increase in the rate of such fees for the first year ending April 30, 2008. For each of the four years thereafter through April 30, 2012, the manager and administrator will receive one-fifth of the increase in the rate of fees. Beginning May 1, 2012, the full new investment management and administration fees will then be in effect.
f. Other Affiliated Transactions
At December 31, 2010, Franklin Advisers, Inc. owned 100% of the Fund’s Class 4 outstanding shares.
4. EXPENSE OFFSET ARRANGEMENT
The Fund has entered into an arrangement with its custodian whereby credits realized as a result of uninvested cash balances are used to reduce a portion of the Fund’s custodian expenses. During the year ended December 31, 2010, there were no credits earned.
FGR-21
Franklin Templeton Variable Insurance Products Trust
Notes to Financial Statements (continued)
Franklin Global Real Estate Securities Fund
5. INCOME TAXES
For tax purposes, capital losses may be carried over to offset future capital gains, if any. At December 31, 2010, the capital loss carryforwards were as follows:
| | | | |
Capital loss carryforwards expiring in: | | | | |
2016 | | $ | 151,234,938 | |
2017 | | | 207,448,609 | |
2018 | | | 4,202,616 | |
| | | | |
| | | $362,886,163 | |
| | | | |
The tax character of distributions paid during the years ended December 31, 2010 and 2009, was as follows:
| | | | | | | | |
| | | 2010 | | | 2009 | |
Distributions paid from ordinary income | | $ | 10,814,738 | | | $ | 43,430,254 | |
At December 31, 2010, the cost of investments and net unrealized appreciation (depreciation), and undistributed ordinary income for income tax purposes were as follows:
| | | | |
Cost of investments | | $ | 337,380,260 | |
| | | | |
| |
Unrealized appreciation | | $ | 73,915,470 | |
Unrealized depreciation | | | (9,706,433 | ) |
| | | | |
Net unrealized appreciation (depreciation) | | $ | 64,209,037 | |
| | | | |
Distributable earnings - undistributed ordinary income | | $ | 29,247,586 | |
| | | | |
Net investment income differs for financial statement and tax purposes primarily due to differing treatments of foreign currency transactions and passive foreign investment company shares.
Net realized gains (losses) differ for financial statement and tax purposes primarily due to differing treatments of wash sales, foreign currency transactions and passive foreign investment company shares.
6. INVESTMENT TRANSACTIONS
Purchases and sales of investments (excluding short term securities) for the year ended December 31, 2010, aggregated $279,061,742 and $322,047,647, respectively.
7. OTHER DERIVATIVE INFORMATION
For the period ended December 31, 2010, the effect of derivative contracts on the Fund’s Statement of Operations was as follows:
| | | | | | | | | | | | | | |
Derivative Contracts Not Accounted
for as Hedging Instruments | | Statement of Operations Locations | | Realized Gain
(Loss) for the
Year | | | Change in
Unrealized
Appreciation
(Depreciation)
for the Year | | | Average
Amount
Outstanding
During the
Yeara | |
Foreign exchange contracts | | Net realized gain (loss) from foreign currency transactions / Net change in unrealized appreciation (depreciation) on translation of other assets and liabilities denominated in foreign currencies | | $ | 3,710,842 | | | $ | (1,957,852 | ) | | | 67,273,048 | |
aRepresents the average notional amount for other derivative contracts outstanding during the period. For derivative contracts denominated in foreign currencies, notional amounts are converted in U.S. dollars.
See Note 1(d) regarding derivative financial instruments.
FGR-22
Franklin Templeton Variable Insurance Products Trust
Notes to Financial Statements (continued)
Franklin Global Real Estate Securities Fund
8. CREDIT FACILITY
The Fund, together with other U.S. registered and foreign investment funds (collectively “Borrowers”), managed by Franklin Templeton Investments, are borrowers in a joint syndicated senior unsecured credit facility totaling $750 million (Global Credit Facility) which matures on January 21, 2011. This Global Credit Facility provides a source of funds to the Borrowers for temporary and emergency purposes, including the ability to meet future unanticipated or unusually large redemption requests.
Under the terms of the Global Credit Facility, the Fund shall, in addition to interest charged on any borrowings made by the Fund and other costs incurred by the Fund, pay its share of fees and expenses incurred in connection with the implementation and maintenance of the Global Credit Facility, based upon its relative share of the aggregate net assets of all of the Borrowers, including an annual commitment fee of 0.10% based upon the unused portion of the Global Credit Facility, which is reflected in other expenses on the Statement of Operations. During the year ended December 31, 2010, the Fund did not use the Global Credit Facility.
Effective January 21, 2011, the Borrowers renewed the Global Credit Facility for a total of $750 million, maturing January 20, 2012.
9. FAIR VALUE MEASUREMENTS
The Fund follows a fair value hierarchy that distinguishes between market data obtained from independent sources (observable inputs) and the Fund’s own market assumptions (unobservable inputs). These inputs are used in determining the value of the Fund’s investments and are summarized in the following fair value hierarchy:
| | • | | Level 1 – quoted prices in active markets for identical securities |
| | • | | Level 2 – other significant observable inputs (including quoted prices for similar securities, interest rates, prepayment speed, credit risk, etc.) |
| | • | | Level 3 – significant unobservable inputs (including the Fund’s own assumptions in determining the fair value of investments) |
The inputs or methodology used for valuing securities are not an indication of the risk associated with investing in those securities.
For movements between the levels within the fair value hierarchy, the Fund has adopted a policy of recognizing the transfers as of the date of the underlying event which caused the movement.
The following is a summary of the inputs used as of December 31, 2010, in valuing the Fund’s assets and liabilities carried at fair value:
| | | | | | | | | | | | | | | | |
| | | Level 1 | | | Level 2 | | | Level 3 | | | Total | |
| | | | |
Assets: | | | | | | | | | | | | | | | | |
Investments in Securities | | | | | | | | | | | | | | | | |
Equity Investmentsa | | $ | 382,727,635 | | | $ | — | | | $ | — | | | $ | 382,727,635 | |
Short Term Investments | | | — | | | | 18,861,662 | | | | — | | | | 18,861,662 | |
| | | | |
Total Investments in Securities | | $ | 382,727,635 | | | $ | 18,861,662 | | | $ | — | | | $ | 401,589,297 | |
| | | | |
aFor detailed industry descriptions, see the accompanying Statement of Investments.
10. SUBSEQUENT EVENTS
The Fund has evaluated subsequent events through the issuance of the financial statements and determined that no events have occurred that require disclosure other than those already disclosed in the financial statements.
FGR-23
Franklin Templeton Variable Insurance Products Trust
Notes to Financial Statements (continued)
Franklin Global Real Estate Securities Fund
| | |
ABBREVIATIONS | | |
| Selected Portfolio | | |
| | |
| REIT - Real Estate Investment Trust | | |
FGR-24
Franklin Templeton Variable Insurance Products Trust
Franklin Global Real Estate Securities Fund
Report of Independent Registered Public Accounting Firm
To the Board of Trustees and Shareholders of Franklin Templeton Variable Insurance Products Trust
In our opinion, the accompanying statement of assets and liabilities, including the statement of investments, and the related statements of operations and of changes in net assets and the financial highlights present fairly, in all material respects, the financial position of Franklin Global Real Estate Securities Fund (the “Fund”) at December 31, 2010, the results of its operations for the year then ended, the changes in its net assets for each of the two years in the period then ended and the financial highlights for each of the periods presented, in conformity with accounting principles generally accepted in the United States of America. These financial statements and financial highlights (hereafter referred to as “financial statements”) are the responsibility of the Fund’s management. Our responsibility is to express an opinion on these financial statements based on our audits. We conducted our audits of these financial statements in accordance with the standards of the Public Company Accounting Oversight Board (United States). Those standards require that we plan and perform the audit to obtain reasonable assurance about whether the financial statements are free of material misstatement. An audit includes examining, on a test basis, evidence supporting the amounts and disclosures in the financial statements, assessing the accounting principles used and significant estimates made by management, and evaluating the overall financial statement presentation. We believe that our audits, which included confirmation of securities at December 31, 2010 by correspondence with the custodian and brokers, provide a reasonable basis for our opinion.
PricewaterhouseCoopers LLP
San Francisco, California
February 10, 2011
FGR-25
Franklin Templeton Variable Insurance Products Trust
Tax Designation (unaudited)
Franklin Global Real Estate Securities Fund
At December 31, 2010, more than 50% of the Fund’s total assets were invested in securities of foreign issuers. In most instances, foreign taxes were withheld from income paid to the Fund on these investments. The Fund elects to treat foreign taxes paid as allowed under Section 853 of the Internal Revenue Code. This election will allow shareholders of record as of the 2011 distribution date, to treat their proportionate share of foreign taxes paid by the Fund as having been paid directly by them. The shareholder shall consider these amounts as foreign taxes paid in the tax year in which they receive the Fund distribution.
FGR-26
FRANKLIN GROWTHAND INCOME SECURITIES FUND
We are pleased to bring you Franklin Growth and Income Securities Fund’s annual report for the fiscal year ended December 31, 2010.
Performance Summary as of 12/31/10
Average annual total return of Class 4 shares* represents the average annual change in value, assuming reinvestment of dividends and capital gains. Average returns smooth out variations in returns, which can be significant; they are not the same as year-by-year results.
Periods ended 12/31/10
| | | | | | | | | | | | |
| | | 1-Year | | | 5-Year | | | 10-Year | |
Average Annual Total Return | | | +16.41% | | | | +1.53% | | | | +2.62% | |
*For the period beginning 2/29/08, Class 4 performance reflects a 12b-1 fee expense of 0.35% per year, which affects future performance. Class 4 performance prior to 2/29/08 reflects historical Class 1 performance, which does not have a 12b-1 fee expense. Since 2/29/08 (effective date), the average annual total return of Class 4 shares was +0.57%.
Total Return Index Comparison
for a Hypothetical $10,000 Investment (1/1/01–12/31/10)
The graph below shows the change in value of a hypothetical $10,000 investment in the Fund over the indicated period and includes reinvestment of any income or distributions. The Fund’s performance* is compared to the performance of the Standard & Poor’s 500 Index (S&P 500), the Lipper VIP Equity Income Funds Classification Average and the Consumer Price Index (CPI). One cannot invest directly in an index, and an index is not representative of the Fund’s portfolio. Please see Important Notes to Performance Information preceding the Fund Summaries.
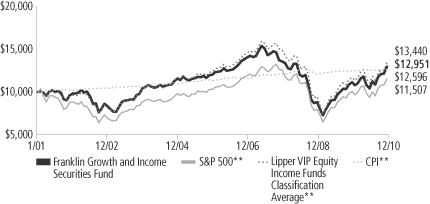
**Sources: © 2011 Morningstar; Lipper Inc. Please see Index Descriptions following the Fund Summaries.
Franklin Growth and Income Securities Fund Class 4
Performance reflects the Fund’s Class 4 operating expenses, but does not include any contract fees, expenses or sales charges. If they had been included, performance would be lower. These charges and deductions, particularly for variable life policies, can have a significant effect on contract values and insurance benefits. See the contract prospectus for a complete description of these expenses, including sales charges.
Performance data represent past performance, which does not guarantee future results. Investment return and principal value will fluctuate, and you may have a gain or loss when you sell your shares.
Current performance may differ from figures shown.
FGI-1
Fund Goals and Main Investments: Franklin Growth and Income Securities Fund seeks capital appreciation with current income as a secondary goal. The Fund normally invests predominantly in equity securities, including securities convertible into common stock.
Performance Overview
You can find the Fund’s one-year total return in the Performance Summary. The Fund outperformed its benchmark, the S&P 500, which delivered a +15.06% total return.1 The Fund also outperformed its peers as measured by the Lipper VIP Equity Income Funds Classification Average, which posted a +14.97% total return for the same period.2 Please note the Fund invests primarily in stocks with above average dividend yields. As a result, its holdings and returns may differ from those of the S&P 500, which include nondividend-paying stocks and do not focus on dividend yield.
Economic and Market Overview
During the 12-month period ended December 31, 2010, the U.S. economy grew unevenly, supported by a combination of fundamental business improvement and government intervention. Economic activity as measured by gross domestic product expanded at an annualized 3.7% pace in 2010’s first quarter and then downshifted to 1.7% annualized in the second quarter. Consumer spending picked up, likely due to pent-up post-recession demand, and the pace of growth rose at annualized rates of 2.6% in the third quarter and an estimated 3.2% in the fourth quarter.
Challenges such as mixed economic data, elevated debt concerns surrounding the U.S. budget deficit and a lack of job prospects for the unemployed hindered consumer confidence and the economy’s advance. During the early part of the annual period, home prices rose in many regions due to low interest rates, a first-time homebuyer tax credit program, and prices dipping to levels that lured buyers. Later in the period, home sales stalled as the homebuyer tax credit program ended, foreclosures mounted and the housing sector remained weak.
Amid signs of a demand-led recovery, crude oil prices rose from $79 per barrel at the end of December 2009 to a then 17-month high of $87 in early April. But as doubts surfaced about the recovery’s sustainability, oil prices dipped to $66 in late May. Prices rebounded to $91 per barrel
1. Source: © 2011 Morningstar.
2. Source: Lipper Inc.
One cannot invest directly in an index, and an index is not representative of the Fund’s portfolio. Please see Index Descriptions following the Fund Summaries.
Fund Risks: The Fund’s investments in stocks may offer the potential for long-term gains but can be subject to short-term price fluctuations. The value of convertible securities may rise and fall with the market value of the underlying stock or, like a debt security, vary with changes in interest rates and the credit quality of the issuer. The Fund may have significant investments in particular sectors from time to time, such as financial services, energy, health care/pharmaceuticals, technology and telecommunications, and may be at greater risk of adverse developments in a sector than a fund that invests more broadly. Changes in the financial strength of a debt issuer or in the rating of its securities may affect the securities’ value and, as a result, impact Fund performance. Foreign investing, especially in emerging markets, involves additional risks, including currency fluctuations, economic instability, market volatility, and political and social instability. Investments in high yield, lower rated (junk) bonds generally have greater price swings and higher risk of default and loss of principal than investment-grade bonds. The manager applies various techniques and analyses in making investment decisions for the Fund, but there can be no guarantee that these decisions will produce the desired results. The Fund’s prospectus also includes a description of the main investment risks.
FGI-2
by the end of December 2010 largely due to accelerating global demand. The pace of inflation slowed during the year, and in December 2010 the inflation rate was an annualized 1.5%.3 Similarly, core inflation, which excludes volatile food and energy costs, slowed to a 0.8% annualized rate.3 Companies added jobs throughout the period, and the unemployment rate fell from 10.0% in December 2009 to 9.4% at period-end.3 The decline was attributable in part to a shrinking labor force as some unemployed workers stopped looking for jobs.
Given few inflationary pressures and uncertainty surrounding the economic recovery, the Federal Open Market Committee (FOMC) made no major changes to its monetary policy for most of the period. The FOMC repeatedly stated it would keep the federal funds target rate within the exceptionally low 0% to 0.25% range “for an extended period” and eventually shifted its focus to its outlook and the status of its current holdings. In September, the FOMC revealed concerns about the subdued recovery and said inflation was below the pace “consistent with its mandate.” Having already lowered interest rates effectively to zero, the FOMC announced its intention to purchase government securities to stimulate the economy and promote a low level of inflation consistent with healthy economic growth.
Investor confidence shifted with each release of encouraging or discouraging economic, regulatory and political news, stoking considerable volatility among equities. Ultimately, stock indexes posted solid gains during the 12 months under review as investor risk aversion began to subside amid generally improving economic signs and rising consumer spending. Overall, the blue-chip stocks of the Dow Jones Industrial Average delivered a +14.06% total return, while the broader S&P 500 posted a +15.06% total return and the technology-heavy NASDAQ Composite Index produced a total return of +18.02%.1 During the period, growth stocks outperformed their value counterparts. Performance among the major sectors was positive, with consumer discretionary, industrials and materials making the largest gains, while health care and utilities had weaker results.
3. Source: Bureau of Labor Statistics.
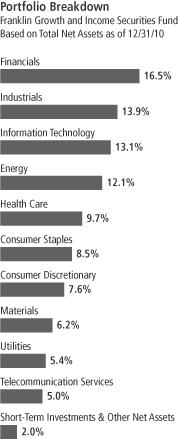
FGI-3
Investment Strategy
We invest in a broadly diversified portfolio of equity securities that we consider to be financially strong. To help identify such companies, we use a current relative yield analysis that focuses on a company’s dividend yield (calculated by dividing a stock’s annual per share dividends by its per share market price). This results in a relative yield range for each company that can assist us in determining whether we believe a stock is attractively priced for purchase or sale. A higher relative dividend yield is frequently accompanied by a lower stock price. Therefore, we seek to buy a stock when its relative dividend yield is high and to sell a stock when its relative dividend yield is low, which may be caused by an increase in the price of the stock.
Manager’s Discussion
During a year in which broad-based stock markets improved across most sectors and industries, nearly all of the Fund’s holdings rose in value. Our investments in more economically sensitive sectors — financials, information technology, materials and energy — fared best as many economies around the globe signaled recovery and expansion from 2009’s recessionary lows.
Caterpillar, the world’s top manufacturer of earth-moving equipment and a big supplier of agricultural machinery, was among the Fund’s top performers for 2010. Orders for the company’s heavy equipment — particularly from overseas — rose substantially, enhanced by growing industrial demand in China and other developing nations. The convertible preferred stock of Autoliv,4 a Swedish manufacturer of automobile safety equipment, also appreciated nicely during the year. As manufacturing activity and industrial demand picked up around the world, the Fund’s investment in chemical and materials conglomerate E.I. DuPont de Nemours & Co. rose substantially. Also lifting the Fund’s results were several financials sector holdings, particularly convertible preferred stocks of diversified financial services companies Citigroup and Bank of America, as well as the common stock of asset manager T. Rowe Price Group.
The Fund also had a few disappointments from a variety of sectors and industries. For example, our position in software giant Microsoft lost value and was a major detractor. Despite a noticeable rebound in steel
4. Sold by period-end.
Top 10 Holdings
Franklin Growth and Income
Securities Fund
12/31/10
| | | | |
Company Sector/Industry | | % of Total
Net Assets | |
| Wells Fargo & Co. | | | 3.1% | |
| Financials | | | | |
| JPMorgan Chase & Co. | | | 3.0% | |
| Financials | | | | |
| Merck & Co. | | | 2.4% | |
| Health Care | | | | |
| Caterpillar Inc. | | | 2.3% | |
| Industrials | | | | |
| T. Rowe Price Group Inc. | | | 2.3% | |
| Financials | | | | |
| Microchip Technology Inc. | | | 2.2% | |
| Information Technology | | | | |
| General Electric Co. | | | 2.2% | |
| Industrials | | | | |
| E.I. DuPont de Nemours & Co. | | | 2.1% | |
| Materials | | | | |
| Microsoft Corp. | | | 2.1% | |
| Information Technology | | | | |
| The Coca-Cola Co. | | | 2.1% | |
| Consumer Staples | | | | |
The dollar value, number of shares or principal amount, and names of all portfolio holdings are listed in the Fund’s Statement of Investments.
FGI-4
demand and prices during 2010, the Fund’s convertible bonds of Luxembourg-based steelmaker ArcelorMittal weighed on Fund performance. Within the health care sector, which was generally out of favor for most of 2010 and provided sub-par results, shares of health care products and pharmaceuticals companies such as Roche Holding (Switzerland), Abbott Laboratories and Johnson & Johnson lost value and hindered the Fund’s overall advance.
Thank you for your participation in Franklin Growth and Income Securities Fund. We look forward to serving your future investment needs.
The foregoing information reflects our analysis, opinions and portfolio holdings as of
December 31, 2010, the end of the reporting period. The way we implement our main investment strategies and the resulting portfolio holdings may change depending on factors such as market and economic conditions. These opinions may not be relied upon as investment advice or an offer for a particular security. The information is not a complete analysis of every aspect of any market, country, industry, security or the Fund. Statements of fact are from sources considered reliable, but the investment manager makes no representation or warranty as to their completeness or accuracy. Although historical performance is no guarantee of future results, these insights may help you understand our investment management philosophy.
FGI-5
Fund Expenses
As an investor in a variable insurance contract (Contract) that indirectly provides for investment in an underlying mutual fund, you can incur transaction and/or ongoing expenses at both the Fund level and the Contract level.
| • | | Transaction expenses can include sales charges (loads) on purchases, redemption fees, surrender fees, transfer fees and premium taxes. |
| • | | Ongoing expenses can include management fees, distribution and service (12b-1) fees, contract fees, annual maintenance fees, mortality and expense risk fees and other fees and expenses. All mutual funds and Contracts have some types of ongoing expenses. |
The expenses shown in the table are meant to highlight ongoing expenses at the Fund level only and do not include ongoing expenses at the Contract level, or transaction expenses at either the Fund or Contract level. While the Fund does not have transaction expenses, if the transaction and ongoing expenses at the Contract level were included, the expenses shown below would be higher. You should consult your Contract prospectus or disclosure document for more information.
The table shows Fund-level ongoing expenses and can help you understand these expenses and compare them with those of other mutual funds offered through the Contract. The table assumes a $1,000 investment held for the six months indicated. Please refer to the Fund prospectus for additional information on operating expenses.
Actual Fund Expenses
The first line (Actual) of the table provides actual account values and expenses. The “Ending Account Value” is derived from the Fund’s actual return, which includes the effect of ongoing Fund expenses, but does not include the effect of ongoing Contract expenses.
You can estimate the Fund-level expenses you incurred during the period by following these steps. Of course, your account value and expenses will differ from those in this illustration:
| 1. | Divide your account value by $1,000. |
If an account had an $8,600 value, then $8,600 ÷ $1,000 = 8.6.
| 2. | Multiply the result by the number under the heading “Fund-Level Expenses Incurred During Period.” |
If Fund-Level Expenses Incurred During Period were $7.50, then 8.6 x $7.50 = $64.50.
In this illustration, the estimated expenses incurred this period at the Fund level are $64.50.
Franklin Growth and Income Securities Fund Class 4
FGI-6
Hypothetical Example for Comparison with Other Mutual Funds
Information in the second line (Hypothetical) of the table can help you compare ongoing expenses of the Fund with those of other mutual funds offered through the Contract. This information may not be used to estimate the actual ending account balance or expenses you incurred during the period. The hypothetical “Ending Account Value” is based on the Fund’s actual expense ratio and an assumed 5% annual rate of return before expenses, which does not represent the Fund’s actual return. The figure under the heading “Fund-Level Expenses Incurred During Period” shows the hypothetical expenses your account would have incurred under this scenario. You can compare this figure with the 5% hypothetical examples that appear in shareholder reports of other funds offered through a Contract.
| | | | | | | | | | | | |
| Class 4 | | Beginning
Account Value 7/1/10 | | | Ending
Account Value 12/31/10 | | | Fund-Level Expenses Incurred
During Period* 7/1/10–12/31/10 | |
Actual | | $ | 1,000 | | | $ | 1,245.50 | | | $ | 5.38 | |
Hypothetical (5% return before expenses) | | $ | 1,000 | | | $ | 1,020.42 | | | $ | 4.84 | |
*Expenses are calculated using the most recent six-month annualized expense ratio for the Fund’s Class 4 shares (0.95%), which does not include any ongoing expenses of the Contract for which the Fund is an investment option, multiplied by the average account value over the period, multiplied by 184/365 to reflect the one-half year period.
FGI-7
Franklin Templeton Variable Insurance Products Trust
Financial Highlights
Franklin Growth and Income Securities Fund
| | | | | | | | | | | | | | | | | | | | |
| | | Year Ended December 31, | |
| Class 1 | | 2010 | | | 2009 | | | 2008 | | | 2007 | | | 2006 | |
| | | | |
Per share operating performance | | | | | | | | | | | | | | | | | | | | |
(for a share outstanding throughout the year) | | | | | | | | | | | | | | | | | | | | |
Net asset value, beginning of year | | $ | 10.47 | | | $ | 8.72 | | | $ | 15.07 | | | $ | 16.83 | | | $ | 15.60 | |
| | | | |
Income from investment operationsa: | | | | | | | | | | | | | | | | | | | | |
Net investment incomeb | | | 0.38 | | | | 0.31 | | | | 0.39 | | | | 0.41 | | | | 0.42 | |
Net realized and unrealized gains (losses) | | | 1.32 | | | | 1.92 | | | | (5.17 | ) | | | (0.82 | ) | | | 2.05 | |
| | | | |
Total from investment operations | | | 1.70 | | | | 2.23 | | | | (4.78 | ) | | | (0.41 | ) | | | 2.47 | |
| | | | |
Less distributions from: | | | | | | | | | | | | | | | | | | | | |
Net investment income | | | (0.41 | ) | | | (0.48 | ) | | | (0.45 | ) | | | (0.42 | ) | | | (0.43 | ) |
Net realized gains | | | — | | | | — | | | | (1.12 | ) | | | (0.93 | ) | | | (0.81 | ) |
| | | | |
Total distributions | | | (0.41 | ) | | | (0.48 | ) | | | (1.57 | ) | | | (1.35 | ) | | | (1.24 | ) |
| | | | |
Net asset value, end of year | | $ | 11.76 | | | $ | 10.47 | | | $ | 8.72 | | | $ | 15.07 | | | $ | 16.83 | |
| | | | |
| | | | | |
Total returnc | | | 16.93% | | | | 26.82% | | | | (34.95)% | | | | (3.46)% | | | | 17.05% | |
Ratios to average net assets | | | | | | | | | | | | | | | | | | | | |
Expenses | | | 0.59% | | | | 0.60% | d | | | 0.55% | d | | | 0.52% | d | | | 0.54% | d |
Net investment income | | | 3.62% | | | | 3.46% | | | | 3.17% | | | | 2.47% | | | | 2.63% | |
| | | | | |
Supplemental data | | | | | | | | | | | | | | | | | | | | |
Net assets, end of year (000’s) | | $ | 176,590 | | | $ | 174,403 | | | $ | 162,936 | | | $ | 306,691 | | | $ | 388,751 | |
Portfolio turnover rate | | | 26.83% | | | | 51.05% | | | | 30.66% | | | | 36.66% | | | | 23.05% | |
aThe amount shown for a share outstanding throughout the period may not correlate with the Statement of Operations for the period due to the timing of sales and repurchases of the Fund shares in relation to income earned and/or fluctuating market value of the investments of the Fund.
bBased on average daily shares outstanding.
cTotal return does not include fees, charges or expenses imposed by the variable annuity and life insurance contracts for which the Franklin Templeton Variable Insurance Products Trust serves as an underlying investment vehicle.
dBenefit of expense reduction rounds to less than 0.01%.
The accompanying notes are an integral part of these financial statements.
FGI-8
Franklin Templeton Variable Insurance Products Trust
Financial Highlights (continued)
Franklin Growth and Income Securities Fund
| | | | | | | | | | | | | | | | | | | | |
| | | Year Ended December 31, | |
| Class 2 | | 2010 | | | 2009 | | | 2008 | | | 2007 | | | 2006 | |
| | | | |
Per share operating performance | | | | | | | | | | | | | | | | | | | | |
(for a share outstanding throughout the year) | | | | | | | | | | | | | | | | | | | | |
Net asset value, beginning of year | | $ | 10.33 | | | $ | 8.59 | | | $ | 14.86 | | | $ | 16.62 | | | $ | 15.42 | |
| | | | |
Income from investment operationsa: | | | | | | | | | | | | | | | | | | | | |
Net investment incomeb | | | 0.35 | | | | 0.28 | | | | 0.35 | | | | 0.37 | | | | 0.37 | |
Net realized and unrealized gains (losses) | | | 1.31 | | | | 1.90 | | | | (5.10 | ) | | | (0.82 | ) | | | 2.03 | |
| | | | |
Total from investment operations | | | 1.66 | | | | 2.18 | | | | (4.75 | ) | | | (0.45 | ) | | | 2.40 | |
| | | | |
Less distributions from: | | | | | | | | | | | | | | | | | | | | |
Net investment income | | | (0.39 | ) | | | (0.44 | ) | | | (0.40 | ) | | | (0.38 | ) | | | (0.39 | ) |
Net realized gains | | | — | | | | — | | | | (1.12 | ) | | | (0.93 | ) | | | (0.81 | ) |
| | | | |
Total distributions | | | (0.39 | ) | | | (0.44 | ) | | | (1.52 | ) | | | (1.31 | ) | | | (1.20 | ) |
| | | | |
Net asset value, end of year | | $ | 11.60 | | | $ | 10.33 | | | $ | 8.59 | | | $ | 14.86 | | | $ | 16.62 | |
| | | | |
| | | | | |
Total returnc | | | 16.68% | | | | 26.55% | | | | (35.14)% | | | | (3.71)% | | | | 16.76% | |
Ratios to average net assets | | | | | | | | | | | | | | | | | | | | |
Expenses | | | 0.84% | | | | 0.85% | d | | | 0.80% | d | | | 0.77% | d | | | 0.79% | d |
Net investment income | | | 3.37% | | | | 3.21% | | | | 2.92% | | | | 2.22% | | | | 2.38% | |
| | | | | |
Supplemental data | | | | | | | | | | | | | | | | | | | | |
Net assets, end of year (000’s) | | $ | 151,481 | | | $ | 152,077 | | | $ | 141,359 | | | $ | 312,692 | | | $ | 348,724 | |
Portfolio turnover rate | | | 26.83% | | | | 51.05% | | | | 30.66% | | | | 36.66% | | | | 23.05% | |
aThe amount shown for a share outstanding throughout the period may not correlate with the Statement of Operations for the period due to the timing of sales and repurchases of the Fund shares in relation to income earned and/or fluctuating market value of the investments of the Fund.
bBased on average daily shares outstanding.
cTotal return does not include fees, charges or expenses imposed by the variable annuity and life insurance contracts for which the Franklin Templeton Variable Insurance Products Trust serves as an underlying investment vehicle.
dBenefit of expense reduction rounds to less than 0.01%.
The accompanying notes are an integral part of these financial statements.
FGI-9
Franklin Templeton Variable Insurance Products Trust
Financial Highlights (continued)
Franklin Growth and Income Securities Fund
| | | | | | | | | | | | |
| | | Year Ended December 31, | |
| Class 4 | | 2010 | | | 2009 | | | 2008a | |
| | | | |
Per share operating performance | | | | | | | | | | | | |
(for a share outstanding throughout the year) | | | | | | | | | | | | |
Net asset value, beginning of year | | $ | 10.45 | | | $ | 8.70 | | | $ | 14.16 | |
| | | | |
Income from investment operationsb: | | | | | | | | | | | | |
Net investment incomec | | | 0.34 | | | | 0.28 | | | | 0.29 | |
Net realized and unrealized gains (losses) | | | 1.32 | | | | 1.92 | | | | (4.18 | ) |
| | | | |
Total from investment operations | | | 1.66 | | | | 2.20 | | | | (3.89 | ) |
| | | | |
Less distributions from: | | | | | | | | | | | | |
Net investment income | | | (0.38 | ) | | | (0.45 | ) | | | (0.45 | ) |
Net realized gains | | | — | | | | — | | | | (1.12 | ) |
| | | | |
Total distributions | | | (0.38 | ) | | | (0.45 | ) | | | (1.57 | ) |
| | | | |
Net asset value, end of year | | $ | 11.73 | | | $ | 10.45 | | | $ | 8.70 | |
| | | | |
| | | |
Total returnd | | | 16.41% | | | | 26.54% | | | | (31.00)% | |
Ratios to average net assetse | | | | | | | | | | | | |
Expenses | | | 0.94% | | | | 0.95% | f | | | 0.90% | f |
Net investment income | | | 3.27% | | | | 3.11% | | | | 2.82% | |
| | | |
Supplemental data | | | | | | | | | | | | |
Net assets, end of year (000’s) | | $ | 4 | | | $ | 4 | | | $ | 3 | |
Portfolio turnover rate | | | 26.83% | | | | 51.05% | | | | 30.66% | |
aFor the period February 29, 2008 (effective date) to December 31, 2008.
bThe amount shown for a share outstanding throughout the period may not correlate with the Statement of Operations for the period due to the timing of sales and repurchases of the Fund shares in relation to income earned and/or fluctuating market value of the investments of the Fund.
cBased on average daily shares outstanding.
dTotal return does not include any fees, charges or expenses imposed by the variable annuity and life insurance contracts for which the Franklin Templeton Variable Insurance Products Trust serves as an underlying investment vehicle. Total return is not annualized for periods less than one year.
eRatios are annualized for periods less than one year.
fBenefit of expense reduction rounds to less than 0.01%.
The accompanying notes are an integral part of these financial statements.
FGI-10
Franklin Templeton Variable Insurance Products Trust
Statement of Investments, December 31, 2010
| | | | | | | | | | | | |
| Franklin Growth and Income Securities Fund | | Country | | | Shares | | | Value | |
Common Stocks 82.1% | | | | | | | | | | | | |
Consumer Discretionary 6.9% | | | | | | | | | | | | |
Best Buy Co. Inc. | | | United States | | | | 102,300 | | | $ | 3,507,867 | |
Comcast Corp., A | | | United States | | | | 203,680 | | | | 4,474,850 | |
The Home Depot Inc. | | | United States | | | | 140,700 | | | | 4,932,942 | |
Limited Brands Inc. | | | United States | | | | 160,000 | | | | 4,916,800 | |
Target Corp. | | | United States | | | | 82,300 | | | | 4,948,699 | |
| | | | | | | | | | | | |
| | | | | | | | | | | 22,781,158 | |
| | | | | | | | | | | | |
Consumer Staples 8.5% | | | | | | | | | | | | |
The Coca-Cola Co. | | | United States | | | | 105,000 | | | | 6,905,850 | |
Diageo PLC, ADR | | | United Kingdom | | | | 77,700 | | | | 5,775,441 | |
PepsiCo Inc. | | | United States | | | | 90,500 | | | | 5,912,365 | |
The Procter & Gamble Co. | | | United States | | | | 61,400 | | | | 3,949,862 | |
Unilever NV, N.Y. shs. | | | Netherlands | | | | 168,200 | | | | 5,281,480 | |
| | | | | | | | | | | | |
| | | | | | | | | | | 27,824,998 | |
| | | | | | | | | | | | |
Energy 10.4% | | | | | | | | | | | | |
Chevron Corp. | | | United States | | | | 75,000 | | | | 6,843,750 | |
ConocoPhillips | | | United States | | | | 90,000 | | | | 6,129,000 | |
Exxon Mobil Corp. | | | United States | | | | 80,444 | | | | 5,882,065 | |
Halliburton Co. | | | United States | | | | 145,000 | | | | 5,920,350 | |
Spectra Energy Corp. | | | United States | | | | 224,900 | | | | 5,620,251 | |
aWeatherford International Ltd. | | | United States | | | | 156,600 | | | | 3,570,480 | |
| | | | | | | | | | | | |
| | | | | | | | | | | 33,965,896 | |
| | | | | | | | | | | | |
Financials 9.3% | | | | | | | | | | | | |
Aflac Inc. | | | United States | | | | 105,000 | | | | 5,925,150 | |
JPMorgan Chase & Co. | | | United States | | | | 118,270 | | | | 5,017,014 | |
Marsh & McLennan Cos. Inc. | | | United States | | | | 168,400 | | | | 4,604,056 | |
T. Rowe Price Group Inc. | | | United States | | | | 116,400 | | | | 7,512,456 | |
Wells Fargo & Co. | | | United States | | | | 195,400 | | | | 6,055,446 | |
Weyerhaeuser Co. | | | United States | | | | 80,027 | | | | 1,514,911 | |
| | | | | | | | | | | | |
| | | | | | | | | | | 30,629,033 | |
| | | | | | | | | | | | |
Health Care 8.6% | | | | | | | | | | | | |
Abbott Laboratories | | | United States | | | | 94,000 | | | | 4,503,540 | |
Johnson & Johnson | | | United States | | | | 105,700 | | | | 6,537,545 | |
Merck & Co. Inc. | | | United States | | | | 220,061 | | | | 7,930,998 | |
Pfizer Inc. | | | United States | | | | 235,400 | | | | 4,121,854 | |
Roche Holding AG | | | Switzerland | | | | 34,500 | | | | 5,060,493 | |
| | | | | | | | | | | | |
| | | | | | | | | | | 28,154,430 | |
| | | | | | | | | | | | |
Industrials 13.9% | | | | | | | | | | | | |
3M Co. | | | United States | | | | 73,200 | | | | 6,317,160 | |
The Boeing Co. | | | United States | | | | 45,800 | | | | 2,988,908 | |
Caterpillar Inc. | | | United States | | | | 80,700 | | | | 7,558,362 | |
General Dynamics Corp. | | | United States | | | | 83,300 | | | | 5,910,968 | |
General Electric Co. | | | United States | | | | 395,600 | | | | 7,235,524 | |
J.B. Hunt Transport Services Inc. | | | United States | | | | 94,800 | | | | 3,868,788 | |
Republic Services Inc. | | | United States | | | | 178,000 | | | | 5,315,080 | |
United Parcel Service Inc., B | | | United States | | | | 87,100 | | | | 6,321,718 | |
| | | | | | | | | | | | |
| | | | | | | | | | | 45,516,508 | |
| | | | | | | | | | | | |
FGI-11
Franklin Templeton Variable Insurance Products Trust
Statement of Investments, December 31, 2010 (continued)
| | | | | | | | | | | | |
| Franklin Growth and Income Securities Fund | | Country | | | Shares | | | Value | |
Common Stocks (continued) | | | | | | | | | | | | |
Information Technology 11.3% | | | | | | | | | | | | |
Intel Corp. | | | United States | | | | 300,600 | | | $ | 6,321,618 | |
International Business Machines Corp. | | | United States | | | | 45,000 | | | | 6,604,200 | |
Microchip Technology Inc. | | | United States | | | | 215,000 | | | | 7,355,150 | |
Microsoft Corp. | | | United States | | | | 250,000 | | | | 6,980,000 | |
Paychex Inc. | | | United States | | | | 150,400 | | | | 4,648,864 | |
Xerox Corp. | | | United States | | | | 433,500 | | | | 4,993,920 | |
| | | | | | | | | | | | |
| | | | | | | | | | | 36,903,752 | |
| | | | | | | | | | | | |
Materials 4.1% | | | | | | | | | | | | |
E. I. du Pont de Nemours and Co. | | | United States | | | | 140,000 | | | | 6,983,200 | |
Freeport-McMoRan Copper & Gold Inc., B | | | United States | | | | 54,169 | | | | 6,505,155 | |
| | | | | | | | | | | | |
| | | | | | | | | | | 13,488,355 | |
| | | | | | | | | | | | |
Telecommunication Services 5.0% | | | | | | | | | | | | |
AT&T Inc. | | | United States | | | | 207,597 | | | | 6,099,200 | |
Verizon Communications Inc. | | | United States | | | | 145,200 | | | | 5,195,256 | |
Vodafone Group PLC | | | United Kingdom | | | | 1,948,100 | | | | 5,042,245 | |
| | | | | | | | | | | | |
| | | | | | | | | | | 16,336,701 | |
| | | | | | | | | | | | |
Utilities 4.1% | | | | | | | | | | | | |
PG&E Corp. | | | United States | | | | 87,200 | | | | 4,171,648 | |
PPL Corp. | | | United States | | | | 24,300 | | | | 639,576 | |
Sempra Energy | | | United States | | | | 67,542 | | | | 3,544,604 | |
The Southern Co. | | | United States | | | | 137,100 | | | | 5,241,333 | |
| | | | | | | | | | | | |
| | | | | | | | | | | 13,597,161 | |
| | | | | | | | | | | | |
Total Common Stocks (Cost $214,226,161) | | | | | | | | | | | 269,197,992 | |
| | | | | | | | | | | | |
bEquity-Linked Securities (Cost $4,823,720) 1.8% | | | | | | | | | | | | |
Information Technology 1.8% | | | | | | | | | | | | |
cGoldman Sachs Group Inc. into Apple Inc., 5.50%, 144A | | | United States | | | | 19,000 | | | | 5,958,077 | |
| | | | | | | | | | | | |
Convertible Preferred Stocks 11.8% | | | | | | | | | | | | |
Consumer Discretionary 0.7% | | | | | | | | | | | | |
General Motors Co., 4.75%, cvt. pfd., B | | | United States | | | | 44,200 | | | | 2,391,662 | |
| | | | | | | | | | | | |
Energy 1.7% | | | | | | | | | | | | |
cChesapeake Energy Corp., 5.75%, cvt. pfd., 144A | | | United States | | | | 5,000 | | | | 5,619,500 | |
| | | | | | | | | | | | |
Financials 5.7% | | | | | | | | | | | | |
Bank of America Corp., 7.25%, cvt. pfd., L | | | United States | | | | 6,100 | | | | 5,837,517 | |
Citigroup Inc., 7.50%, cvt. pfd. | | | United States | | | | 37,900 | | | | 5,180,551 | |
Hartford Financial Services Group Inc., 7.25%, cvt. pfd. | | | United States | | | | 130,000 | | | | 3,329,300 | |
Wells Fargo & Co., 7.50%, cvt. pfd., A | | | United States | | | | 4,200 | | | | 4,202,310 | |
| | | | | | | | | | | | |
| | | | | | | | | | | 18,549,678 | |
| | | | | | | | | | | | |
Health Care 1.1% | | | | | | | | | | | | |
Tenet Healthcare Corp., 7.00%, cvt. pfd. | | | United States | | | | 3,200 | | | | 3,496,000 | |
| | | | | | | | | | | | |
Materials 1.3% | | | | | | | | | | | | |
Anglogold Ashanti Holdings Finance PLC, 6.00%, cvt. pfd. | | | South Africa | | | | 80,000 | | | | 4,438,400 | |
| | | | | | | | | | | | |
Utilities 1.3% | | | | | | | | | | | | |
Great Plains Energy Inc., 12.00%, cvt. pfd. | | | United States | | | | 65,000 | | | | 4,192,500 | |
| �� | | | | | | | | | | | |
Total Convertible Preferred Stocks (Cost $32,075,934) | | | | | | | | | | | 38,687,740 | |
| | | | | | | | | | | | |
FGI-12
Franklin Templeton Variable Insurance Products Trust
Statement of Investments, December 31, 2010 (continued)
| | | | | | | | | | | | |
| Franklin Growth and Income Securities Fund | | Country | | | Shares | | | Value | |
Preferred Stocks (Cost $8,133,100) 0.1% | | | | | | | | | | | | |
Financials 0.1% | | | | | | | | | | | | |
aFannie Mae, 8.25%, pfd. | | | United States | | | | 325,000 | | | $ | 182,000 | |
| | | | | | | | | | | | |
| | | |
| | | | | | Principal
Amount* | | | | |
Convertible Bonds (Cost $1,750,000) 0.8% | | | | | | | | | | | | |
Materials 0.8% | | | | | | | | | | | | |
ArcelorMittal, cvt., senior note, 5.00%, 5/15/14 | | | Luxembourg | | | $ | 1,750,000 | | | | 2,537,500 | |
| | | | | | | | | | | | |
Corporate Bonds (Cost $3,913,272) 1.4% | | | | | | | | | | | | |
Financials 1.4% | | | | | | | | | | | | |
dJPMorgan Chase & Co., junior sub. note, 1, 7.90% to 4/30/18, FRN thereafter, Perpetual | | | United States | | | | 4,400,000 | | | | 4,692,913 | |
| | | | | | | | | | | | |
Total Investments before Short Term Investments
(Cost $264,922,187) | | | | | | | | | | | 321,256,222 | |
| | | | | | | | | | | | |
Short Term Investments (Cost $6,354,113) 1.9% | | | | | | | | | | | | |
Repurchase Agreements 1.9% | | | | | | | | | | | | |
eJoint Repurchase Agreement, 0.141%, 1/03/11 (Maturity Value $6,354,188) | | | United States | | | | 6,354,113 | | | | 6,354,113 | |
Barclays Capital Inc. (Maturity Value $1,094,001) | | | | | | | | | | | | |
BNP Paribas Securities Corp. (Maturity Value $1,125,199) | | | | | | | | | | | | |
Credit Suisse Securities (USA) LLC (Maturity Value $625,125) | | | | | | | | | | | | |
Deutsche Bank Securities Inc. (Maturity Value $1,009,299) | | | | | | | | | | | | |
HSBC Securities (USA) Inc. (Maturity Value $781,438) | | | | | | | | | | | | |
Merrill Lynch, Pierce, Fenner & Smith Inc. (Maturity Value $625,125) | | | | | | | | | | | | |
Morgan Stanley & Co. Inc. (Maturity Value $781,438) | | | | | | | | | | | | |
UBS Securities LLC (Maturity Value $312,563) | | | | | | | | | | | | |
Collateralized by U.S. Government Agency Securities, 0.50% - 5.75%, 1/07/11 - 10/26/15, fU.S. Treasury Bills, 5/12/11 - 7/28/11; and U.S.Treasury Notes, 0.375% - 1.875%,
9/30/11 - 9/30/17 (valued at $6,491,510) | | | | | | | | | | | | |
| | | | | | | | | | | | |
Total Investments (Cost $271,276,300) 99.9% | | | | | | | | | | | 327,610,335 | |
Other Assets, less Liabilities 0.1% | | | | | | | | | | | 464,729 | |
| | | | | | | | | | | | |
Net Assets 100.0% | | | | | | | | | | $ | 328,075,064 | |
| | | | | | | | | | | | |
See Abbreviations on page FGI-24.
*The principal amount is stated in U.S. dollars unless otherwise indicated.
aNon-income producing.
bSee Note 1(d) regarding equity-linked securities.
cSecurity was purchased pursuant to Rule 144A under the Securities Act of 1933 and may be sold in transactions exempt from registration only to qualified institutional buyers or in a public offering registered under the Securities Act of 1933. These securities have been deemed liquid under guidelines approved by the Trust’s Board of Trustees. At December 31, 2010, the aggregate value of these securities was $11,577,577, representing 3.53% of net assets.
dPerpetual security with no stated maturity date.
eSee Note 1(c) regarding joint repurchase agreement.
fThe security is traded on a discount basis with no stated coupon rate.
The accompanying notes are an integral part of these financial statements.
FGI-13
Franklin Templeton Variable Insurance Products Trust
Financial Statements
Statement of Assets and Liabilities
December 31, 2010
| | | | |
| | | Franklin Growth
and Income
Securities Fund | |
Assets: | | | | |
Investments in securities: | | | | |
Cost - Unaffiliated issuers | | $ | 264,922,187 | |
Cost - Repurchase agreements | | | 6,354,113 | |
| | | | |
Total cost of investments | | $ | 271,276,300 | |
| | | | |
Value - Unaffiliated issuers | | $ | 321,256,222 | |
Value - Repurchase agreements | | | 6,354,113 | |
| | | | |
Total value of investments | | | 327,610,335 | |
Receivables: | | | | |
Capital shares sold | | | 88,738 | |
Dividends and interest | | | 750,238 | |
Other assets | | | 62 | |
| | | | |
Total assets | | | 328,449,373 | |
| | | | |
Liabilities: | | | | |
Payables: | | | | |
Capital shares redeemed | | | 38,674 | |
Affiliates | | | 207,896 | |
Reports to shareholders | | | 95,155 | |
Professional fees | | | 28,367 | |
Accrued expenses and other liabilities | | | 4,217 | |
| | | | |
Total liabilities | | | 374,309 | |
| | | | |
Net assets, at value | | $ | 328,075,064 | |
| | | | |
Net assets consist of: | | | | |
Paid-in capital | | $ | 342,535,178 | |
Undistributed net investment income | | | 11,818,534 | |
Net unrealized appreciation (depreciation) | | | 56,336,943 | |
Accumulated net realized gain (loss) | | | (82,615,591 | ) |
| | | | |
Net assets, at value | | $ | 328,075,064 | |
| | | | |
Class 1: | | | | |
Net assets, at value | | $ | 176,589,750 | |
| | | | |
Shares outstanding | | | 15,012,045 | |
| | | | |
Net asset value and maximum offering price per share | | $ | 11.76 | |
| | | | |
Class 2: | | | | |
Net assets, at value | | $ | 151,481,174 | |
| | | | |
Shares outstanding | | | 13,058,787 | |
| | | | |
Net asset value and maximum offering price per share | | $ | 11.60 | |
| | | | |
Class 4: | | | | |
Net assets, at value | | $ | 4,140 | |
| | | | |
Shares outstanding | | | 353 | |
| | | | |
Net asset value and maximum offering price per share | | $ | 11.73 | |
| | | | |
The accompanying notes are an integral part of these financial statements.
FGI-14
Franklin Templeton Variable Insurance Products Trust
Financial Statements (continued)
Statement of Operations
for the year ended December 31, 2010
| | | | |
| | | Franklin Growth
and Income
Securities Fund | |
Investment income: | | | | |
Dividends | | $ | 12,334,530 | |
Interest | | | 872,822 | |
| | | | |
Total investment income | | | 13,207,352 | |
| | | | |
Expenses: | | | | |
Management fees (Note 3a) | | | 1,659,403 | |
Distribution fees: (Note 3c) | | | | |
Class 2 | | | 362,393 | |
Class 4 | | | 13 | |
Unaffiliated transfer agent fees | | | 354 | |
Custodian fees (Note 4) | | | 4,957 | |
Reports to shareholders | | | 131,888 | |
Professional fees | | | 43,494 | |
Trustees’ fees and expenses | | | 1,433 | |
Other | | | 17,382 | |
| | | | |
Total expenses | | | 2,221,317 | |
| | | | |
Net investment income | | | 10,986,035 | |
| | | | |
Realized and unrealized gains (losses): | | | | |
Net realized gain (loss) from: | | | | |
Investments | | | 12,730,048 | |
Foreign currency transactions | | | (32,093 | ) |
| | | | |
Net realized gain (loss) | | | 12,697,955 | |
| | | | |
Net change in unrealized appreciation (depreciation) on: | | | | |
Investments | | | 25,063,524 | |
Translation of other assets and liabilities denominated in foreign currencies | | | (4,515 | ) |
| | | | |
Net change in unrealized appreciation (depreciation) | | | 25,059,009 | |
| | | | |
Net realized and unrealized gain (loss) | | | 37,756,964 | |
| | | | |
Net increase (decrease) in net assets resulting from operations | | $ | 48,742,999 | |
| | | | |
The accompanying notes are an integral part of these financial statements.
FGI-15
Franklin Templeton Variable Insurance Products Trust
Financial Statements (continued)
Statements of Changes in Net Assets
| | | | | | | | |
| | | Franklin Growth and Income
Securities Fund | |
| | | Year Ended December 31, | |
| | | 2010 | | | 2009 | |
| | | | |
Increase (decrease) in net assets: | | | | | | | | |
Operations: | | | | | | | | |
Net investment income | | $ | 10,986,035 | | | $ | 9,759,311 | |
Net realized gain (loss) from investments and foreign currency transactions | | | 12,697,955 | | | | (57,669,814 | ) |
Net change in unrealized appreciation (depreciation) on investments and translation of other assets and liabilities denominated in foreign currencies | | | 25,059,009 | | | | 117,578,917 | |
| | | | |
Net increase (decrease) in net assets resulting from operations | | | 48,742,999 | | | | 69,668,414 | |
| | | | |
Distributions to shareholders from: | | | | | | | | |
Net investment income: | | | | | | | | |
Class 1 | | | (6,417,296 | ) | | | (8,187,942 | ) |
Class 2 | | | (5,249,987 | ) | | | (6,640,173 | ) |
Class 4 | | | (134 | ) | | | (158 | ) |
| | | | |
Total distributions to shareholders | | | (11,667,417 | ) | | | (14,828,273 | ) |
| | | | |
Capital share transactions: (Note 2) | | | | | | | | |
Class 1 | | | (17,785,745 | ) | | | (17,856,351 | ) |
Class 2 | | | (17,698,877 | ) | | | (14,797,923 | ) |
| | | | |
Total capital share transactions | | | (35,484,622 | ) | | | (32,654,274 | ) |
| | | | |
Net increase (decrease) in net assets | | | 1,590,960 | | | | 22,185,867 | |
Net assets: | | | | | | | | |
Beginning of year | | | 326,484,104 | | | | 304,298,237 | |
| | | | |
End of year | | $ | 328,075,064 | | | $ | 326,484,104 | |
| | | | |
Undistributed net investment income included in net assets: | | | | | | | | |
End of year | | $ | 11,818,534 | | | $ | 11,425,179 | |
| | | | |
The accompanying notes are an integral part of these financial statements.
FGI-16
Franklin Templeton Variable Insurance Products Trust
Notes to Financial Statements
Franklin Growth and Income Securities Fund
1. ORGANIZATION AND SIGNIFICANT ACCOUNTING POLICIES
Franklin Templeton Variable Insurance Products Trust (Trust) is registered under the Investment Company Act of 1940, as amended, (1940 Act) as an open-end investment company, consisting of twenty separate funds. The Franklin Growth and Income Securities Fund (Fund) is included in this report. The financial statements of the remaining funds in the Trust are presented separately. Shares of the Fund are generally sold only to insurance company separate accounts to fund the benefits of variable life insurance policies or variable annuity contracts. At December 31, 2010, 74.60% of the Fund’s shares were held through one insurance company. The Fund offers three classes of shares: Class 1, Class 2, and Class 4. Each class of shares differs by its distribution fees, voting rights on matters affecting a single class and its exchange privilege.
The following summarizes the Fund’s significant accounting policies.
a. Financial Instrument Valuation
The Fund values its investments in securities and other assets and liabilities carried at fair value daily. Fair value is the price that would be received to sell an asset or paid to transfer a liability in an orderly transaction between market participants on the measurement date. Under procedures approved by the Trust’s Board of Trustees, the Fund may utilize independent pricing services, quotations from securities and financial instrument dealers, and other market sources to determine fair value.
Equity securities listed on an exchange or on the NASDAQ National Market System are valued at the last quoted sale price or the official closing price of the day, respectively. Foreign equity securities are valued as of the close of trading on the foreign stock exchange on which the security is primarily traded, or the NYSE, whichever is earlier. The value is then converted into its U.S. dollar equivalent at the foreign exchange rate in effect at the close of the NYSE on the day that the value of the security is determined. Over-the-counter securities are valued within the range of the most recent quoted bid and ask prices. Securities that trade in multiple markets or on multiple exchanges are valued according to the broadest and most representative market. Certain equity securities are valued based upon fundamental characteristics or relationships to similar securities.
Debt and certain preferred securities generally trade in the over-the-counter market rather than on a securities exchange. The Fund’s pricing services use multiple valuation techniques to determine fair value. In instances where sufficient market activity exists, the pricing services may utilize a market-based approach through which quotes from market makers are used to determine fair value. In instances where sufficient market activity may not exist or is limited, the pricing services also utilize proprietary valuation models which may consider market characteristics such as benchmark yield curves, option-adjusted spreads, credit spreads, estimated default rates, coupon rates, anticipated timing of principal repayments, underlying collateral, and other unique security features in order to estimate the relevant cash flows, which are then discounted to calculate the fair value. Securities denominated in a foreign currency are converted into their U.S. dollar equivalent at the foreign exchange rate in effect at the close of the NYSE on the date that the values of the foreign debt securities are determined. Repurchase agreements are valued at cost, which approximates market value.
The Fund has procedures to determine the fair value of securities and other financial instruments for which market prices are not readily available or which may not be reliably priced. Under these procedures, the Fund primarily employs a market-based approach which may use related or comparable assets or liabilities, recent transactions, market multiples, book values, and other relevant information for the investment to determine the fair value of the investment. The Fund may also use an income-based valuation approach in which the anticipated future cash flows of the investment are discounted to calculate fair value. Discounts may also be applied due to the nature or duration of any restrictions on the disposition of the investments. Due to the inherent uncertainty of valuations of such investments, the fair values may differ significantly from the values that would have been used had an active market existed.
Trading in securities on foreign securities stock exchanges and over-the-counter markets may be completed before the daily close of business on the NYSE. Occasionally, events occur between the time at which trading in a foreign security is completed and the close of the NYSE that might call into question the reliability of the value of a portfolio security held by the Fund. As a result,
FGI-17
Franklin Templeton Variable Insurance Products Trust
Notes to Financial Statements (continued)
Franklin Growth and Income Securities Fund
1. ORGANIZATION AND SIGNIFICANT ACCOUNTING POLICIES (continued)
a. Financial Instrument Valuation (continued)
differences may arise between the value of the Fund’s portfolio securities as determined at the foreign market close and the latest indications of value at the close of the NYSE. In order to minimize the potential for these differences, the investment manager monitors price movements following the close of trading in foreign stock markets through a series of country specific market proxies (such as baskets of American Depository Receipts, futures contracts and exchange traded funds). These price movements are measured against established trigger thresholds for each specific market proxy to assist in determining if an event has occurred that may call into question the reliability of the values of the foreign securities held by the Fund. If such an event occurs, the securities may be valued using fair value procedures, which may include the use of independent pricing services.
b. Foreign Currency Translation
Portfolio securities and other assets and liabilities denominated in foreign currencies are translated into U.S. dollars based on the exchange rate of such currencies against U.S. dollars on the date of valuation. The Fund may enter into foreign currency exchange contracts to facilitate transactions denominated in a foreign currency. Purchases and sales of securities, income and expense items denominated in foreign currencies are translated into U.S. dollars at the exchange rate in effect on the transaction date. Portfolio securities and assets and liabilities denominated in foreign currencies contain risks that those currencies will decline in value relative to the U.S. dollar. Occasionally, events may impact the availability or reliability of foreign exchange rates used to convert the U.S. dollar equivalent value. If such an event occurs, the foreign exchange rate will be valued at fair value using procedures established and approved by the Trust’s Board of Trustees.
The Fund does not separately report the effect of changes in foreign exchange rates from changes in market prices on securities held. Such changes are included in net realized and unrealized gain or loss from investments on the Statement of Operations.
Realized foreign exchange gains or losses arise from sales of foreign currencies, currency gains or losses realized between the trade and settlement dates on securities transactions and the difference between the recorded amounts of dividends, interest, and foreign withholding taxes and the U.S. dollar equivalent of the amounts actually received or paid. Net unrealized foreign exchange gains and losses arise from changes in foreign exchange rates on foreign denominated assets and liabilities other than investments in securities held at the end of the reporting period.
c. Joint Repurchase Agreement
The Fund may enter into a joint repurchase agreement whereby its uninvested cash balance is deposited into a joint cash account with other funds managed by the investment manager or an affiliate of the investment manager and is used to invest in one or more repurchase agreements. The value and face amount of the joint repurchase agreement are allocated to the funds based on their pro-rata interest. A repurchase agreement is accounted for as a loan by the fund to the seller, collateralized by securities which are delivered to the fund’s custodian. The market value, including accrued interest, of the initial collateralization is required to be at least 102% of the dollar amount invested by the funds, with the value of the underlying securities marked to market daily to maintain coverage of at least 100%. The joint repurchase agreement held by the Fund at year end had been entered into on December 31, 2010.
d. Equity-Linked Securities
The Fund may invest in equity-linked securities. Equity-linked securities are hybrid financial instruments that generally combine both debt and equity characteristics into a single note form. Income received from equity linked securities is recorded as realized gains in the Statement of Operations and may be based on the performance of an underlying equity security, an equity index, or an option position. The risks of investing in equity-linked securities include unfavorable price movements in the underlying
FGI-18
Franklin Templeton Variable Insurance Products Trust
Notes to Financial Statements (continued)
Franklin Growth and Income Securities Fund
1. ORGANIZATION AND SIGNIFICANT ACCOUNTING POLICIES (continued)
d. Equity-Linked Securities (continued)
security and the credit risk of the issuing financial institution. There may be no guarantee of a return of principal with equity linked securities and the appreciation potential may be limited. Equity-linked securities may be more volatile and less liquid than other investments held by the Fund.
e. Income Taxes
It is the Fund’s policy to qualify as a regulated investment company under the Internal Revenue Code. The Fund intends to distribute to shareholders substantially all of its taxable income and net realized gains to relieve it from federal income and excise taxes. As a result, no provision for U.S. federal income taxes is required. The Fund files U.S. income tax returns as well as tax returns in certain other jurisdictions. The Fund’s application of those tax rules is subject to its understanding. The Fund records a provision for taxes in its financial statements including penalties and interest, if any, for a tax position taken on a tax return (or expected to be taken) when it fails to meet the more likely than not (a greater than 50% probability) threshold and based on the technical merits, the tax position may not be sustained upon examination by the tax authorities. As of December 31, 2010, and for all open tax years, the Fund has determined that no provision for income tax is required in the Fund’s financial statements. Open tax years are those that remain subject to examination and are based on each tax jurisdiction statute of limitation. The Fund is not aware of any tax position for which it is reasonably possible that the total amounts of unrecognized tax effects will significantly change in the next twelve months.
f. Security Transactions, Investment Income, Expenses and Distributions
Security transactions are accounted for on trade date. Realized gains and losses on security transactions are determined on a specific identification basis. Interest income and estimated expenses are accrued daily. Amortization of premium and accretion of discount on debt securities are included in interest income. Dividend income is recorded on the ex-dividend date except that certain dividends from foreign securities are recognized as soon as the Fund is notified of the ex-dividend date. Distributions to shareholders are recorded on the ex-dividend date and are determined according to income tax regulations (tax basis). Distributable earnings determined on a tax basis may differ from earnings recorded in accordance with accounting principles generally accepted in the United States of America. These differences may be permanent or temporary. Permanent differences are reclassified among capital accounts to reflect their tax character. These reclassifications have no impact on net assets or the results of operations. Temporary differences are not reclassified, as they may reverse in subsequent periods.
Common expenses incurred by the Trust are allocated among the funds based on the ratio of net assets of each fund to the combined net assets of the Trust. Fund specific expenses are charged directly to the fund that incurred the expense.
Realized and unrealized gains and losses and net investment income, not including class specific expenses, are allocated daily to each class of shares based upon the relative proportion of net assets of each class. Differences in per share distributions, by class, are generally due to differences in class specific expenses.
g. Accounting Estimates
The preparation of financial statements in accordance with accounting principles generally accepted in the United States of America requires management to make estimates and assumptions that affect the reported amounts of assets and liabilities at the date of the financial statements and the amounts of income and expenses during the reporting period. Actual results could differ from those estimates.
FGI-19
Franklin Templeton Variable Insurance Products Trust
Notes to Financial Statements (continued)
Franklin Growth and Income Securities Fund
1. ORGANIZATION AND SIGNIFICANT ACCOUNTING POLICIES (continued)
h. Guarantees and Indemnifications
Under the Trust’s organizational documents, its officers and trustees are indemnified by the Trust against certain liabilities arising out of the performance of their duties to the Trust. Additionally, in the normal course of business, the Trust, on behalf of the Fund, enters into contracts with service providers that contain general indemnification clauses. The Trust’s maximum exposure under these arrangements is unknown as this would involve future claims that may be made against the Trust that have not yet occurred. Currently, the Trust expects the risk of loss to be remote.
2. SHARES OF BENEFICIAL INTEREST
At December 31, 2010, there were an unlimited number of shares authorized (without par value). Transactions in the Fund’s shares were as follows:
| | | | | | | | | | | | | | | | |
| | | Year Ended December 31, | |
| | | 2010a | | | 2009a | |
| Class 1 Shares: | | Shares | | | Amount | | | Shares | | | Amount | |
Shares sold | | | 71,404 | | | $ | 762,743 | | | | 19,644 | | | $ | 180,736 | |
Shares issued in reinvestment of distributions | | | 641,089 | | | | 6,417,296 | | | | 956,535 | | | | 8,187,942 | |
Shares redeemed | | | (2,352,373 | ) | | | (24,965,784 | ) | | | (3,016,988 | ) | | | (26,225,029 | ) |
| | | | |
Net increase (decrease) | | | (1,639,880 | ) | | $ | (17,785,745 | ) | | | (2,040,809 | ) | | $ | (17,856,351 | ) |
| | | | |
Class 2 Shares: | | | | | | | | | | | | | | | | |
Shares sold | | | 846,978 | | | $ | 8,699,858 | | | | 951,710 | | | $ | 8,248,590 | |
Shares issued in reinvestment of distributions | | | 530,838 | | | | 5,249,987 | | | | 784,890 | | | | 6,640,173 | |
Shares redeemed | | | (3,035,560 | ) | | | (31,648,722 | ) | | | (3,475,755 | ) | | | (29,686,686 | ) |
| | | | |
Net increase (decrease) | | | (1,657,744 | ) | | $ | (17,698,877 | ) | | | (1,739,155 | ) | | $ | (14,797,923 | ) |
| | | | |
| aDuring | the period Class 4 did not report any share transactions. |
3. TRANSACTIONS WITH AFFILIATES
Franklin Resources, Inc. is the holding company for various subsidiaries that together are referred to as Franklin Templeton Investments. Certain officers and trustees of the Fund are also officers and/or directors of the following subsidiaries:
| | |
| Subsidiary | | Affiliation |
Franklin Advisers, Inc. (Advisers) | | Investment manager |
Franklin Templeton Services, LLC (FT Services) | | Administrative manager |
Franklin Templeton Distributors, Inc. (Distributors) | | Principal underwriter |
Franklin Templeton Investor Services, LLC (Investor Services) | | Transfer agent |
FGI-20
Franklin Templeton Variable Insurance Products Trust
Notes to Financial Statements (continued)
Franklin Growth and Income Securities Fund
3. TRANSACTIONS WITH AFFILIATES (continued)
a. Management Fees
The Fund pays an investment management fee to Advisers based on the average daily net assets of the Fund as follows:
| | |
| Annualized Fee Rate | | Net Assets |
| 0.625% | | Up to and including $100 million |
| 0.500% | | Over $100 million, up to and including $250 million |
| 0.450% | | Over $250 million, up to and including $7.5 billion |
| 0.440% | | Over $7.5 billion, up to and including $10 billion |
| 0.430% | | Over $10 billion, up to and including $12.5 billion |
| 0.420% | | Over $12.5 billion, up to and including $15 billion |
| 0.400% | | In excess of $15 billion |
b. Administrative Fees
Under an agreement with Advisers, FT Services provides administrative services to the Fund. The fee is paid by Advisers based on average daily net assets, and is not an additional expense of the Fund.
c. Distribution Fees
The Trust’s Board of Trustees has adopted distribution plans for Class 2 and Class 4 shares pursuant to Rule 12b-1 under the 1940 Act. Under the Fund’s compensation distribution plans, the Fund pays Distributors for costs incurred in connection with the servicing, sale and distribution of the Fund’s shares up to 0.35% per year of its average daily net assets of each class. The Board of Trustees has agreed to limit the current rate to 0.25% per year for Class 2.
d. Transfer Agent Fees
Investor Services, under terms of an agreement, performs shareholder servicing for the Fund and is not paid by the Fund for the services.
e. Other Affiliated Transactions
At December 31, 2010, Advisers owned 100% of the Fund’s Class 4 outstanding shares.
4. EXPENSE OFFSET ARRANGEMENT
The Fund has entered into an arrangement with its custodian whereby credits realized as a result of uninvested cash balances are used to reduce a portion of the Fund’s custodian expenses. During the year ended December 31, 2010, there were no credits earned.
5. INCOME TAXES
For tax purposes, capital losses may be carried over to offset future capital gains, if any. At December 31, 2010, the capital loss carryforwards were as follows:
| | | | |
Capital loss carryforwards expiring in: | | | | |
2016 | | $ | 8,790,704 | |
2017 | | | 73,467,163 | |
| | | | |
| | $ | 82,257,867 | |
| | | | |
FGI-21
Franklin Templeton Variable Insurance Products Trust
Notes to Financial Statements (continued)
Franklin Growth and Income Securities Fund
5. INCOME TAXES (continued)
During the year ended December 31, 2010, the Fund utilized $11,709,634 of capital loss carryforwards.
The tax character of distributions paid during the years ended December 31, 2010 and 2009, was as follows:
| | | | | | | | |
| | | 2010 | | | 2009 | |
Distributions paid from ordinary income | | $ | 11,667,417 | | | $ | 14,828,273 | |
| | | | |
At December 31, 2010, the cost of investments, net unrealized appreciation (depreciation), and undistributed ordinary income for income tax purposes were as follows:
| | | | |
Cost of investments | | $ | 271,475,995 | |
| | | | |
| |
Unrealized appreciation | | $ | 70,160,839 | |
Unrealized depreciation | | | (14,026,499 | ) |
| | | | |
Net unrealized appreciation (depreciation) | | $ | 56,134,340 | |
| | | | |
Distributable earnings - undistributed ordinary income | | $ | 11,643,498 | |
| | | | |
Net investment income differs for financial statement and tax purposes primarily due to differing treatments of foreign currency transactions and bond discounts and premiums.
Net realized gains (losses) differ for financial statement and tax purposes primarily due to differing treatments of wash sales, foreign currency transactions, and bond discounts and premiums.
6. INVESTMENT TRANSACTIONS
Purchases and sales of investments (excluding short term securities) for the year ended December 31, 2010, aggregated $81,607,319 and $111,830,441, respectively.
7. CREDIT RISK
At December 31, 2010, the Fund had 12.35% of its portfolio invested in high yield, senior secured floating rate notes, or other securities rated below investment grade. These securities may be more sensitive to economic conditions causing greater price volatility and are potentially subject to a greater risk of loss due to default than higher rated securities.
8. CREDIT FACILITY
The Fund, together with other U.S. registered and foreign investment funds (collectively “Borrowers”), managed by Franklin Templeton Investments, are borrowers in a joint syndicated senior unsecured credit facility totaling $750 million (Global Credit Facility) which matures on January 21, 2011. This Global Credit Facility provides a source of funds to the Borrowers for temporary and emergency purposes, including the ability to meet future unanticipated or unusually large redemption requests.
Under the terms of the Global Credit Facility, the Fund shall, in addition to interest charged on any borrowings made by the Fund and other costs incurred by the Fund, pay its share of fees and expenses incurred in connection with the implementation and maintenance of the Global Credit Facility, based upon its relative share of the aggregate net assets of all of the Borrowers, including an annual commitment fee of 0.10% based upon the unused portion of the Global Credit Facility, which is reflected in other expenses on the Statement of Operations. During the year ended December 31, 2010, the Fund did not use the Global Credit Facility.
FGI-22
Franklin Templeton Variable Insurance Products Trust
Notes to Financial Statements (continued)
Franklin Growth and Income Securities Fund
8. CREDIT FACILITY (continued)
Effective January 21, 2011, the Borrowers renewed the Global Credit Facility for a total of $750 million, maturing January 20, 2012.
9. FAIR VALUE MEASUREMENTS
The Fund follows a fair value hierarchy that distinguishes between market data obtained from independent sources (observable inputs) and the Fund’s own market assumptions (unobservable inputs). These inputs are used in determining the value of the Fund’s investments and are summarized in the following fair value hierarchy:
| | • | | Level 1 – quoted prices in active markets for identical securities |
| | • | | Level 2 – other significant observable inputs (including quoted prices for similar securities, interest rates, prepayment speed, credit risk, etc.) |
| | • | | Level 3 – significant unobservable inputs (including the Fund’s own assumptions in determining the fair value of investments) |
The inputs or methodology used for valuing securities are not an indication of the risk associated with investing in those securities.
For movements between the levels within the fair value hierarchy, the Fund has adopted a policy of recognizing the transfers as of the date of the underlying event which caused the movement.
The following is a summary of the inputs used as of December 31, 2010, in valuing the Fund’s assets and liabilities carried at fair value:
| | | | | | | | | | | | | | | | |
| | | Level 1 | | | Level 2 | | | Level 3 | | | Total | |
| | | | |
Assets: | | | | | | | | | | | | | | | | |
Investments in Securities | | | | | | | | | | | | | | | | |
Equity Investments:a | | | | | | | | | | | | | | | | |
Energy | | $ | 33,965,896 | | | $ | 5,619,500 | | | $ | — | | | $ | 39,585,396 | |
Health Care | | | 28,154,430 | | | | 3,496,000 | | | | — | | | | 31,650,430 | |
Utilities | | | 13,597,161 | | | | 4,192,500 | | | | — | | | | 17,789,661 | |
Other Equity Investmentsb | | | 219,042,245 | | | | — | | | | — | | | | 219,042,245 | |
Equity-Linked Securities | | | — | | | | 5,958,077 | | | | | | | | 5,958,077 | |
Convertible Bonds | | | — | | | | 2,537,500 | | | | — | | | | 2,537,500 | |
Corporate Bonds | | | — | | | | 4,692,913 | | | | — | | | | 4,692,913 | |
Short Term Investments | | | — | | | | 6,354,113 | | | | — | | | | 6,354,113 | |
| | | | |
Total Investments in Securities | | $ | 294,759,732 | | | $ | 32,850,603 | | | $ | — | | | $ | 327,610,335 | |
| | | | |
a Includes common, preferred and convertible preferred stocks as well as other equity investments.
bFor detailed industry descriptions, see the accompanying Statement of Investments.
10. SUBSEQUENT EVENTS
The Fund has evaluated subsequent events through the issuance of the financial statements and determined that no events have occurred that require disclosure other than those already disclosed in the financial statements.
FGI-23
Franklin Templeton Variable Insurance Products Trust
Notes to Financial Statements (continued)
Franklin Growth and Income Securities Fund
| | |
ABBREVIATIONS | | |
| Selected Portfolio | | |
| | |
| ADR - American Depository Receipt | | |
| FRN - Floating Rate Note | | |
FGI-24
Franklin Templeton Variable Insurance Products Trust
Franklin Growth and Income Securities Fund
Report of Independent Registered Public Accounting Firm
To the Board of Trustees and Shareholders of
Franklin Templeton Variable Insurance Products Trust
In our opinion, the accompanying statement of assets and liabilities, including the statement of investments, and the related statements of operations and of changes in net assets and the financial highlights present fairly, in all material respects, the financial position of Franklin Growth and Income Securities Fund (the “Fund”) at December 31, 2010, the results of its operations for the year then ended, the changes in its net assets for each of the two years in the period then ended and the financial highlights for each of the periods presented, in conformity with accounting principles generally accepted in the United States of America. These financial statements and financial highlights (hereafter referred to as “financial statements”) are the responsibility of the Fund’s management. Our responsibility is to express an opinion on these financial statements based on our audits. We conducted our audits of these financial statements in accordance with the standards of the Public Company Accounting Oversight Board (United States). Those standards require that we plan and perform the audit to obtain reasonable assurance about whether the financial statements are free of material misstatement. An audit includes examining, on a test basis, evidence supporting the amounts and disclosures in the financial statements, assessing the accounting principles used and significant estimates made by management, and evaluating the overall financial statement presentation. We believe that our audits, which included confirmation of securities at December 31, 2010 by correspondence with the custodian and brokers, provide a reasonable basis for our opinion.
PricewaterhouseCoopers LLP
San Francisco, California
February 10, 2011
FGI-25
Franklin Templeton Variable Insurance Products Trust
Tax Designation (unaudited)
Franklin Growth and Income Securities Fund
Under Section 854(b)(2) of the Internal Revenue Code, the Fund designates 88.32% of the ordinary income dividends as income qualifying for the dividends received deduction for the fiscal year ended December 31, 2010.
FGI-26
FRANKLIN HIGH INCOME SECURITIES FUND
This annual report for Franklin High Income Securities Fund covers the fiscal year ended December 31, 2010.
Performance Summary as of 12/31/10
Average annual total return of Class 4 shares* represents the average annual change in value, assuming reinvestment of dividends and capital gains. Average returns smooth out variations in returns, which can be significant; they are not the same as year-by-year results.
Periods ended 12/31/10
| | | | | | | | | | | | |
| | | 1-Year | | | 5-Year | | | 10-Year | |
Average Annual Total Return | | | +13.31% | | | | +6.88% | | | | +7.04% | |
*For the period beginning 2/29/08, Class 4 performance reflects a 12b-1 fee expense of 0.35% per year, which affects future performance. Class 4 performance prior to 2/29/08 reflects historical Class 1 performance, which does not have a 12b-1 fee expense. Since 2/29/08 (effective date), the average annual total return of Class 4 shares was +8.75%.
Total Return Index Comparison for a Hypothetical $10,000 Investment (1/1/01–12/31/10)
The graph below shows the change in value of a hypothetical $10,000 investment in the Fund over the indicated period and includes reinvestment of any income or distributions. The Fund’s performance* is compared to the performance of the Credit Suisse (CS) High Yield Index and the Lipper VIP High Current Yield Funds Classification Average. One cannot invest directly in an index, and an index is not representative of the Fund’s portfolio. Please see Important Notes to Performance Information preceding the Fund Summaries.
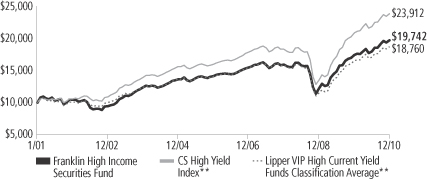
**Sources: © 2011 Morningstar; Lipper Inc. Please see Index Descriptions following the Fund Summaries.
Franklin High Income Securities Fund – Class 4
Performance reflects the Fund’s Class 4 operating expenses, but does not include any contract fees, expenses or sales charges. If they had been included, performance would be lower. These charges and deductions, particularly for variable life policies, can have a significant effect on contract values and insurance benefits. See the contract prospectus for a complete description of these expenses, including sales charges.
Performance data represent past performance, which does not guarantee future results. Investment return and principal value will fluctuate, and you may have a gain or loss when you sell your shares.
Current performance may differ from figures shown.
FH-1
Fund Goals and Main Investments: Franklin High Income Securities Fund seeks a high level of current income with capital appreciation as a secondary goal. The Fund normally invests substantially in high yield, lower rated debt securities and preferred stocks.
Performance Overview
You can find the Fund’s one-year total return in the Performance Summary. The Fund underperformed its benchmark, the CS High Yield Index, which posted a +14.42% total return for the period under review.1 The Fund performed comparably to its peers, as measured by the +13.61% total return of the Lipper VIP High Current Yield Funds Classification Average.2
Economic and Market Overview
The U.S. economy expanded unevenly during the 12-month reporting period. The nation’s economic activity as measured by gross domestic product registered annualized growth rates of 3.7%, 1.7%, 2.6% and an estimated 3.2% in the first, second, third and fourth quarters of 2010, respectively. In the fourth quarter, rising exports, shrinking imports and greater consumer and business spending supported growth. The job market remained sluggish, however, and the unemployment rate was 9.4% in December.3 Challenges to sustained economic recovery include elevated debt concerns and a struggling housing sector.
Crude oil prices began the reporting period at $79 per barrel, but abruptly fell in May when a European debt crisis threatened the global recovery. After a brief rally, prices retreated again in August due to slumping stock prices, reduced demand and abundant inventory levels. Prices quickly recovered after receiving a boost from the falling U.S. dollar and positive economic data and reached a 12-month high of $91 in late December. The pace of inflation slowed during the year, and December’s inflation rate was an annualized 1.5%.3 Similarly, core inflation, which excludes food and energy costs, slowed to a 0.8% annualized rate.3
Early in the year, economic improvement and benign inflation trends prompted Federal Reserve Board (Fed) policymakers to maintain record-low interest rates within a 0% to 0.25% range and discontinue
1. Source: © 2011 Morningstar.
2. Source: Lipper Inc. One cannot invest directly in an index, and an index is not representative of the Fund’s portfolio. Please see Index Descriptions following the Fund Summaries.
3. Source: Bureau of Labor Statistics.
Fund Risks: Because the Fund invests in bonds and other debt obligations, its share price and yield will be affected by interest rate movements. Bond prices generally move in the opposite direction of interest rates. Thus, as prices of bonds in the Fund adjust to a rise in interest rates, the Fund’s share price may decline. The Fund invests substantially in high yield, lower rated (junk) bonds, which generally have greater price swings and higher risk of default and loss of principal than investment-grade bonds. Bank loans and loan participations involve credit, interest rate and illiquidity risks. Foreign investing, especially in emerging markets, involves additional risks including currency fluctuations, economic instability, market volatility, and political and social instability. Derivative instruments may be volatile and illiquid, may give rise to leverage and may involve a small investment relative to the risk assumed. The manager applies various techniques and analyses in making investment decisions for the Fund, but there can be no guarantee that these decisions will produce the desired results. The Fund’s prospectus also includes a description of the main investment risks.
FH-2
certain stimulus plans. In June, the Fed offered a more restrained view of the economy largely because of developments in Europe and signs the U.S. economic expansion lacked momentum. Consumer confidence tumbled due to disappointing employment numbers, a plunge in home sales spurred by the expiration of a homebuyer tax credit, and fears of a renewed economic slowdown. On several occasions, the Fed reiterated it would maintain the federal funds target rate within a range of 0% to 0.25% for an extended period. In November, concerned about the slowing pace of recovery as well as inflation, which had dipped to a level below its mandate to foster maximum employment and price stability, the Fed said it intended to buy $600 billion of government debt in an effort to correct these conditions.
Investor concerns about weak economic data and the potential spillover effects of the European debt crisis led to market volatility. At times, wary investors favored short-term Treasuries, and Treasury yields dipped to very low levels during the year. Late in the year, encouraging corporate earnings reports, the prospect of Fed intervention and extension of Bush-era tax cuts boosted investor confidence and fueled an equity market rally, which dampened Treasury prices. For the 12 months under review, however, Treasury prices rose and yields declined, reflecting general investor uncertainty. The two-year Treasury bill yield decreased from 1.14% to 0.61% over the 12-month period, while the 10-year Treasury note yield fell from 3.85% to 3.30%.
Investment Strategy
We are research-driven, fundamental investors who rely on a team of analysts to provide in-depth industry expertise and use qualitative and quantitative analyses to evaluate companies. As bottom-up investors, we focus primarily on individual securities. We also consider sectors when choosing investments. In selecting securities for the Fund’s investment portfolio, we do not rely principally on ratings assigned by rating agencies, but perform our own independent analysis to evaluate an issuer’s creditworthiness. We consider a variety of factors, including an issuer’s experience and managerial strength, its sensitivity to economic conditions and its current financial condition. We may also enter into various transactions involving certain currency-, interest rate- or credit-related derivative instruments for hedging purposes, to enhance returns or to obtain exposure to various market sectors.
Manager’s Discussion
Following the high yield market’s record results in 2009, investors enjoyed another double-digit positive return for the year ended December 31, 2010. Although the Fund trailed its benchmark, the
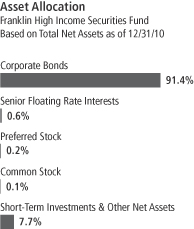
FH-3
CS High Yield Index, it performed roughly in line with its peer group, the Lipper VIP High Current Yield Funds Classification Average. Despite pockets of volatility during the year, driven by fluctuations in the U.S. economic outlook and significant problems in the European financial sector, the high yield market generally maintained a positive tone. With interest rates still very low for government securities, and equity markets somewhat skittish, many investors looked to the high yield market for its premium yield relative to other fixed income alternatives. This demand allowed numerous corporations to refinance near-term debt maturities and thereby stabilize or improve their balance sheets. In addition, earnings results for most sectors improved year-over-year, further strengthening many issuers’ fundamentals. These factors contributed to some tightening of high yield spreads above Treasury securities.
Based on our assessment of the market’s valuation going into 2010, we sought to somewhat increase the Fund’s beta. As the year progressed, we targeted a more neutral beta positioning versus the benchmark index and our peers, although on average the Fund’s positioning was slightly more conservative over the course of the year. Consequently, with the market maintaining a higher risk appetite, this stance detracted from relative performance, particularly earlier in 2010.
In addition to our top-down efforts, we typically draw on our fundamental research process to drive the Fund’s industry positioning. Within that framework, we over- and underweighted certain industries relative to the benchmark index in an effort to outperform. For instance, as the year progressed, we increased our auto sector weighting.4 With consumer demand slowly returning and the supplier base mainly restructured, the industry’s fundamentals improved, and the auto sector notably outperformed the overall index. Since the Fund ended the year overweighted versus the index, this positioning helped relative performance, although our higher quality positioning in the industry hindered relative results. Conversely, we were underweighted in forest products due to continued oversupply issues and still weak demand.5 This positioning also helped relative performance as the industry underperformed the index; however, our forest products holdings underperformed those of the index. Similarly, we underweighted the food retailing industry given ongoing competitive and food inflation pressures on profit margins for supermarket operators.6 With the industry’s weak return, our positioning aided performance versus the benchmark index.
4. Auto sector holdings are in automobiles and components in the SOI.
5. Forest products holdings are in materials in the SOI.
6. Food retailing holdings are in food and staples retailing in the SOI.
Top 10 Sectors/Industries
Franklin High Income Securities Fund
12/31/10
| | | | |
| | | % of Total
Net Assets | |
| Energy | | | 16.7% | |
| Media | | | 8.2% | |
| Telecommunication Services | | | 8.1% | |
| Materials | | | 7.8% | |
| Consumer Services | | | 7.4% | |
| Health Care Equipment & Services | | | 7.2% | |
| Capital Goods | | | 6.4% | |
| Diversified Financials | | | 5.4% | |
| Utilities | | | 5.1% | |
| Automobiles & Components | | | 3.2% | |
The dollar value, number of shares or principal amount, and names of all portfolio holdings are listed in the Fund’s Statement of Investments (SOI).
FH-4
Although some of the Fund’s positioning enhanced relative performance versus the benchmark index, certain weightings had a negative impact. For example, after a very turbulent 2009, the financials sector rallied significantly as some stability returned, and the sector outperformed the overall index.7 Although we nearly doubled our exposure during the year, our underweighted position earlier in 2010 detracted from relative performance. In contrast, we decreased our holdings in the utilities sector but remained overweighted. Given ongoing pricing pressures for independent power producers, the utilities sector was one of the index’s worst performing, thereby hindering our performance versus the benchmark. Finally, the pay television industry modestly underperformed the index and the Fund had an overweighted position.8 As a lower beta sector, the industry’s performance lagged the overall market, and our overweighted positioning was a drag on relative returns.
Thank you for your participation in Franklin High Income Securities Fund. We look forward to serving your future investment needs.
7. Financials holdings are in banks and diversified financials in the SOI.
8. Pay television holdings are in media in the SOI.
The foregoing information reflects our analysis, opinions and portfolio holdings as of December 31, 2010, the end of the reporting period. The way we implement our main investment strategies and the resulting portfolio holdings may change depending on factors such as market and economic conditions. These opinions may not be relied upon as investment advice or an offer for a particular security. The information is not a complete analysis of every aspect of any market, country, industry, security or the Fund. Statements of fact are from sources considered reliable, but the investment manager makes no representation or warranty as to their completeness or accuracy. Although historical performance is no guarantee of future results, these insights may help you understand our investment management philosophy.
FH-5
Fund Expenses
As an investor in a variable insurance contract (Contract) that indirectly provides for investment in an underlying mutual fund, you can incur transaction and/or ongoing expenses at both the Fund level and the Contract level.
| • | | Transaction expenses can include sales charges (loads) on purchases, redemption fees, surrender fees, transfer fees and premium taxes. |
| • | | Ongoing expenses can include management fees, distribution and service (12b-1) fees, contract fees, annual maintenance fees, mortality and expense risk fees and other fees and expenses. All mutual funds and Contracts have some types of ongoing expenses. |
The expenses shown in the table are meant to highlight ongoing expenses at the Fund level only and do not include ongoing expenses at the Contract level, or transaction expenses at either the Fund or Contract level. While the Fund does not have transaction expenses, if the transaction and ongoing expenses at the Contract level were included, the expenses shown would be higher. You should consult your Contract prospectus or disclosure document for more information.
The table shows Fund-level ongoing expenses and can help you understand these expenses and compare them with those of other mutual funds offered through the Contract. The table assumes a $1,000 investment held for the six months indicated. Please refer to the Fund prospectus for additional information on operating expenses.
Actual Fund Expenses
The first line (Actual) of the table provides actual account values and expenses. The “Ending Account Value” is derived from the Fund’s actual return, which includes the effect of ongoing Fund expenses, but does not include the effect of ongoing Contract expenses.
You can estimate the Fund-level expenses you incurred during the period by following these steps. Of course, your account value and expenses will differ from those in this illustration:
| 1. | Divide your account value by $1,000. |
If an account had an $8,600 value, then $8,600 ÷ $1,000 = 8.6.
| 2. | Multiply the result by the number under the heading “Fund-Level Expenses Incurred During Period.” |
If Fund-Level Expenses Incurred During Period were $7.50, then 8.6 x $7.50 = $64.50.
In this illustration, the estimated expenses incurred this period at the Fund level are $64.50.
Franklin High Income Securities Fund – Class 4
FH-6
Hypothetical Example for Comparison with Other Mutual Funds
Information in the second line (Hypothetical) of the table can help you compare ongoing expenses of the Fund with those of other mutual funds offered through the Contract. This information may not be used to estimate the actual ending account balance or expenses you incurred during the period. The hypothetical “Ending Account Value” is based on the Fund’s actual expense ratio and an assumed 5% annual rate of return before expenses, which does not represent the Fund’s actual return. The figure under the heading “Fund-Level Expenses Incurred During Period” shows the hypothetical expenses your account would have incurred under this scenario. You can compare this figure with the 5% hypothetical examples that appear in shareholder reports of other funds offered through a Contract.
| | | | | | | | | | | | |
| Class 4 | | Beginning
Account Value 7/1/10 | | | Ending
Account
Value 12/31/10 | | | Fund-Level Expenses Incurred
During Period* 7/1/10–12/31/10 | |
Actual | | $ | 1,000 | | | $ | 1,096.80 | | | $ | 5.07 | |
Hypothetical (5% return before expenses) | | $ | 1,000 | | | $ | 1,020.37 | | | $ | 4.89 | |
*Expenses are calculated using the most recent six-month annualized expense ratio for the Fund’s Class 4 shares (0.96%), which does not include any ongoing expenses of the Contract for which the Fund is an investment option, multiplied by the average account value over the period, multiplied by 184/365 to reflect the one-half year period.
FH-7
Franklin Templeton Variable Insurance Products Trust
Financial Highlights
Franklin High Income Securities Fund
| | | | | | | | | | | | | | | | | | | | |
| | | Year Ended December 31, | |
| Class 1 | | 2010 | | | 2009 | | | 2008 | | | 2007 | | | 2006 | |
| | | | |
Per share operating performance | | | | | | | | | | | | | | | | | | | | |
(for a share outstanding throughout the year) | | | | | | | | | | | | | | | | | | | | |
Net asset value, beginning of year | | $ | 6.26 | | | $ | 4.68 | | | $ | 6.72 | | | $ | 6.96 | | | $ | 6.82 | |
| | | | |
Income from investment operationsa: | | | | | | | | | | | | | | | | | | | | |
Net investment incomeb | | | 0.49 | | | | 0.46 | | | | 0.50 | | | | 0.51 | | | | 0.49 | |
Net realized and unrealized gains (losses) | | | 0.32 | | | | 1.50 | | | | (1.92 | ) | | | (0.30 | ) | | | 0.12 | |
| | | | |
Total from investment operations | | | 0.81 | | | | 1.96 | | | | (1.42 | ) | | | 0.21 | | | | 0.61 | |
| | | | |
Less distributions from net investment income | | | (0.44 | ) | | | (0.38 | ) | | | (0.62 | ) | | | (0.45 | ) | | | (0.47 | ) |
| | | | |
Net asset value, end of year | | $ | 6.63 | | | $ | 6.26 | | | $ | 4.68 | | | $ | 6.72 | | | $ | 6.96 | |
| | | | |
| | | | | |
Total returnc | | | 13.71% | | | | 42.99% | | | | (23.16)% | | | | 3.02% | | | | 9.48% | |
Ratios to average net assets | | | | | | | | | | | | | | | | | | | | |
Expenses before expense reduction | | | 0.61% | | | | 0.63% | | | | 0.66% | | | | 0.61% | | | | 0.64% | |
Expenses net of expense reduction | | | 0.61% | | | | 0.63% | d | | | 0.66% | d | | | 0.61% | d | | | 0.63% | |
Net investment income | | | 7.71% | | | | 8.33% | | | | 8.30% | | | | 7.38% | | | | 7.14% | |
| | | | | |
Supplemental data | | | | | | | | | | | | | | | | | | | | |
Net assets, end of year (000’s) | | $ | 48,051 | | | $ | 48,855 | | | $ | 38,225 | | | $ | 61,286 | | | $ | 77,641 | |
Portfolio turnover rate | | | 60.80% | | | | 26.41% | | | | 21.75% | | | | 40.65% | | | | 37.99% | |
aThe amount shown for a share outstanding throughout the period may not correlate with the Statement of Operations for the period due to the timing of sales and repurchases of the Fund shares in relation to income earned and/or fluctuating market value of the investments of the Fund.
bBased on average daily shares outstanding.
cTotal return does not include fees, charges or expenses imposed by the variable annuity and life insurance contracts for which the Franklin Templeton Variable Insurance Products Trust serves as an underlying investment vehicle.
dBenefit of expense reduction rounds to less than 0.01%.
The accompanying notes are an integral part of these financial statements.
FH-8
Franklin Templeton Variable Insurance Products Trust
Financial Highlights (continued)
Franklin High Income Securities Fund
| | | | | | | | | | | | | | | | | | | | |
| | | Year Ended December 31, | |
| Class 2 | | 2010 | | | 2009 | | | 2008 | | | 2007 | | | 2006 | |
| | | | |
Per share operating performance | | | | | | | | | | | | | | | | | | | | |
(for a share outstanding throughout the year) | | | | | | | | | | | | | | | | | | | | |
Net asset value, beginning of year | | $ | 6.13 | | | $ | 4.59 | | | $ | 6.60 | | | $ | 6.85 | | | $ | 6.71 | |
| | | | |
Income from investment operationsa: | | | | | | | | | | | | | | | | | | | | |
Net investment incomeb | | | 0.47 | | | | 0.44 | | | | 0.47 | | | | 0.48 | | | | 0.46 | |
Net realized and unrealized gains (losses) | | | 0.30 | | | | 1.47 | | | | (1.88 | ) | | | (0.29 | ) | | | 0.13 | |
| | | | |
Total from investment operations | | | 0.77 | | | | 1.91 | | | | (1.41 | ) | | | 0.19 | | | | 0.59 | |
| | | | |
Less distributions from net investment income | | | (0.43 | ) | | | (0.37 | ) | | | (0.60 | ) | | | (0.44 | ) | | | (0.45 | ) |
| | | | |
Net asset value, end of year | | $ | 6.47 | | | $ | 6.13 | | | $ | 4.59 | | | $ | 6.60 | | | $ | 6.85 | |
| | | | |
| | | | | |
Total returnc | | | 13.26% | | | | 42.70% | | | | (23.38)% | | | | 2.72% | | | | 9.36% | |
Ratios to average net assets | | | | | | | | | | | | | | | | | | | | |
Expenses before expense reduction | | | 0.86% | | | | 0.88% | | | | 0.91% | | | | 0.86% | | | | 0.89% | |
Expenses net of expense reduction | | | 0.86% | | | | 0.88% | d | | | 0.91% | d | | | 0.86% | d | | | 0.88% | |
Net investment income | | | 7.46% | | | | 8.08% | | | | 8.05% | | | | 7.13% | | | | 6.89% | |
| | | | | |
Supplemental data | | | | | | | | | | | | | | | | | | | | |
Net assets, end of year (000’s) | | $ | 239,824 | | | $ | 198,567 | | | $ | 84,396 | | | $ | 155,777 | | | $ | 166,318 | |
Portfolio turnover rate | | | 60.80% | | | | 26.41% | | | | 21.75% | | | | 40.65% | | | | 37.99% | |
aThe amount shown for a share outstanding throughout the period may not correlate with the Statement of Operations for the period due to the timing of sales and repurchases of the Fund shares in relation to income earned and/or fluctuating market value of the investments of the Fund.
bBased on average daily shares outstanding.
cTotal return does not include fees, charges or expenses imposed by the variable annuity and life insurance contracts for which the Franklin Templeton Variable Insurance Products Trust serves as an underlying investment vehicle.
dBenefit of expense reduction rounds to less than 0.01%.
The accompanying notes are an integral part of these financial statements.
FH-9
Franklin Templeton Variable Insurance Products Trust
Financial Highlights (continued)
Franklin High Income Securities Fund
| | | | | | | | | | | | |
| | | Year Ended December 31, | |
| Class 4 | | 2010 | | | 2009 | | | 2008a | |
| | | | |
Per share operating performance | | | | | | | | | | | | |
(for a share outstanding throughout the year) | | | | | | | | | | | | |
Net asset value, beginning of year | | $ | 6.22 | | | $ | 4.67 | | | $ | 6.55 | |
| | | | |
Income from investment operationsb: | | | | | | | | | | | | |
Net investment incomec | | | 0.47 | | | | 0.45 | | | | 0.39 | |
Net realized and unrealized gains (losses) | | | 0.31 | | | | 1.48 | | | | (1.65 | ) |
| | | | |
Total from investment operations | | | 0.78 | | | | 1.93 | | | | (1.26 | ) |
| | | | |
Less distributions from net investment income | | | (0.43 | ) | | | (0.38 | ) | | | (0.62 | ) |
| | | | |
Net asset value, end of year | | $ | 6.57 | | | $ | 6.22 | | | $ | 4.67 | |
| | | | |
| | | |
Total returnd | | | 13.31% | | | | 42.36% | | | | (21.34)% | |
Ratios to average net assetse | | | | | | | | | | | | |
Expenses | | | 0.96% | | | | 0.98% | f | | | 1.01% | f |
Net investment income | | | 7.36% | | | | 7.98% | | | | 7.95% | |
| | | |
Supplemental data | | | | | | | | | | | | |
Net assets, end of year (000’s) | | $ | 25,934 | | | $ | 15,105 | | | $ | 2,244 | |
Portfolio turnover rate | | | 60.80% | | | | 26.41% | | | | 21.75% | |
aFor the period February 29, 2008 (effective date) to December 31, 2008.
bThe amount shown for a share outstanding throughout the period may not correlate with the Statement of Operations for the period due to the timing of sales and repurchases of the Fund shares in relation to income earned and/or fluctuating market value of the investments of the Fund.
cBased on average daily shares outstanding.
dTotal return does not include fees, charges or expenses imposed by the variable annuity and life insurance contracts for which the Franklin Templeton Variable Insurance Products Trust serves as an underlying investment vehicle. Total return is not annualized for periods less than one year.
eRatios are annualized for periods less than one year.
fBenefit of expense reduction rounds to less than 0.01%.
The accompanying notes are an integral part of these financial statements.
FH-10
Franklin Templeton Variable Insurance Products Trust
Statement of Investments, December 31, 2010
| | | | | | | | | | | | |
| Franklin High Income Securities Fund | | Country | | | Shares | | | Value | |
Common Stocks (Cost $865,221) 0.1% | | | | | | | | | | | | |
Media 0.1% | | | | | | | | | | | | |
aDex One Corp. | | | United States | | | | 27,909 | | | $ | 208,201 | |
| | | | | | | | | | | | |
Preferred Stocks (Cost $195,250) 0.2% | | | | | | | | | | | | |
Diversified Financials 0.2% | | | | | | | | | | | | |
bGMAC Inc., 7.00%, pfd.,, 144A, 7.00% | | | United States | | | | 550 | | | | 519,836 | |
| | | | | | | | | | | | |
| | | |
| | | | | | Principal
Amount* | | | | |
Corporate Bonds 91.4% | | | | | | | | | | | | |
Automobiles & Components 3.2% | | | | | | | | | | | | |
Ford Motor Credit Co. LLC,
7.80%, 6/01/12 | | | United States | | | | 1,500,000 | | | | 1,595,225 | |
senior note, 7.00%, 4/15/15 | | | United States | | | | 2,000,000 | | | | 2,151,212 | |
senior note, 6.625%, 8/15/17 | | | United States | | | | 1,000,000 | | | | 1,052,396 | |
senior note, 8.125%, 1/15/20 | | | United States | | | | 1,000,000 | | | | 1,165,329 | |
The Goodyear Tire & Rubber Co., senior note, 8.25%, 8/15/20 | | | United States | | | | 2,100,000 | | | | 2,184,000 | |
bTRW Automotive Inc., senior note, 144A, 7.25%, 3/15/17 | | | United States | | | | 1,700,000 | | | | 1,844,500 | |
| | | | | | | | | | | | |
| | | | | | | | | | | 9,992,662 | |
| | | | | | | | | | | | |
Banks 0.9% | | | | | | | | | | | | |
Regions Bank, sub. note, 7.50%, 5/15/18 | | | United States | | | | 500,000 | | | | 515,725 | |
cWells Fargo Capital XV, pfd., 9.75% to 9/26/13, FRN thereafter, Perpetual | | | United States | | | | 2,000,000 | | | | 2,235,000 | |
| | | | | | | | | | | | |
| | | | | | | | | | | 2,750,725 | |
| | | | | | | | | | | | |
Capital Goods 6.4% | | | | | | | | | | | | |
bAbengoa Finance SAU, senior note, 144A, 8.875%, 11/01/17 | | | Spain | | | | 2,400,000 | | | | 2,286,744 | |
Arvinmeritor Inc., senior note, 10.625%, 3/15/18 | | | United States | | | | 1,900,000 | | | | 2,137,500 | |
BE Aerospace Inc., senior note, 6.875%, 10/01/20 | | | United States | | | | 400,000 | | | | 415,000 | |
bCase New Holland Inc., senior note, 144A, 7.875%, 12/01/17 | | | United States | | | | 2,100,000 | | | | 2,320,500 | |
GeoEye Inc., senior secured note, 8.625%, 10/01/16 | | | United States | | | | 2,900,000 | | | | 3,045,000 | |
The Manitowoc Co. Inc., senior note,
9.50%, 2/15/18 | | | United States | | | | 1,400,000 | | | | 1,540,000 | |
8.50%, 11/01/20 | | | United States | | | | 500,000 | | | | 533,750 | |
bPinafore LLC/Inc., senior secured note, 144A, 9.00%, 10/01/18 | | | United States | | | | 400,000 | | | | 434,000 | |
RBS Global & Rexnord Corp., senior note, 8.50%, 5/01/18 | | | United States | | | | 2,300,000 | | | | 2,455,250 | |
RSC Equipment Rental Inc. and RSC Holdings III LLC, senior note, 10.25%, 11/15/19 | | | United States | | | | 2,500,000 | | | | 2,775,000 | |
United Rentals North America Inc., senior sub. note, 8.375%, 9/15/20 | | | United States | | | | 2,000,000 | | | | 2,045,000 | |
| | | | | | | | | | | | |
| | | | | | | | | | | 19,987,744 | |
| | | | | | | | | | | | |
Commercial & Professional Services 0.9% | | | | | | | | | | | | |
dDiversey Holdings Inc., senior note, PIK, 10.50%, 5/15/20 | | | United States | | | | 2,100,000 | | | | 2,325,750 | |
e,fGoss Graphic Systems Inc., senior sub. note, 12.25%, 11/19/05 | | | United States | | | | 1,912,374 | | | | 191 | |
bInteractive Data Corp., senior note, 144A, 10.25%, 8/01/18 | | | United States | | | | 500,000 | | | | 550,000 | |
| | | | | | | | | | | | |
| | | | | | | | | | | 2,875,941 | |
| | | | | | | | | | | | |
Consumer Durables & Apparel 2.4% | | | | | | | | | | | | |
Jarden Corp.,
senior note, 6.125%, 11/15/22 | | | United States | | | | 500,000 | | | | 479,375 | |
senior sub. note, 7.50%, 5/01/17 | | | United States | | | | 2,200,000 | | | | 2,329,250 | |
KB Home, senior note, 6.25%, 6/15/15 | | | United States | | | | 2,400,000 | | | | 2,388,000 | |
bLibbey Glass Inc., senior secured note, 144A, 10.00%, 2/15/15 | | | United States | | | | 1,000,000 | | | | 1,080,000 | |
bM/I Homes Inc., senior note, 144A, 8.625%, 11/15/18 | | | United States | | | | 1,300,000 | | | | 1,317,875 | |
| | | | | | | | | | | | |
| | | | | | | | | | | 7,594,500 | |
| | | | | | | | | | | | |
FH-11
Franklin Templeton Variable Insurance Products Trust
Statement of Investments, December 31, 2010 (continued)
| | | | | | | | | | | | |
| Franklin High Income Securities Fund | | Country | | | Principal
Amount* | | | Value | |
Corporate Bonds (continued) | | | | | | | | | | | | |
Consumer Services 7.4% | | | | | | | | | | | | |
CKE Restaurants Inc., senior secured note, 11.375%, 7/15/18 | | | United States | | | | 2,200,000 | | | $ | 2,447,500 | |
bClubCorp Club Operations Inc., senior note, 144A, 10.00%, 12/01/18 | | | United States | | | | 1,700,000 | | | | 1,623,500 | |
b,eFontainebleau Las Vegas, 144A, 11.00%, 6/15/15 | | | United States | | | | 1,700,000 | | | | 14,450 | |
Harrah’s Operating Co. Inc., senior secured note, 11.25%, 6/01/17 | | | United States | | | | 3,000,000 | | | | 3,390,000 | |
bMarina District Finance Co. Inc., senior secured note, 144A,
9.50%, 10/15/15 | | | United States | | | | 400,000 | | | | 395,000 | |
9.875%, 8/15/18 | | | United States | | | | 200,000 | | | | 198,000 | |
MGM Resorts International,
senior note, 6.625%, 7/15/15 | | | United States | | | | 2,500,000 | | | | 2,303,125 | |
senior note, 6.875%, 4/01/16 | | | United States | | | | 1,200,000 | | | | 1,075,500 | |
bsenior secured note, 144A, 9.00%, 3/15/20 | | | United States | | | | 600,000 | | | | 663,000 | |
bNCL Corp. Ltd., senior note, 144A, 9.50%, 11/15/18 | | | United States | | | | 500,000 | | | | 517,500 | |
Norwegian Cruise Line Ltd., senior secured note, 11.75%, 11/15/16 | | | United States | | | | 2,000,000 | | | | 2,323,750 | |
Pinnacle Entertainment Inc.,
senior note, 8.625%, 8/01/17 | | | United States | | | | 2,200,000 | | | | 2,409,000 | |
senior sub. note, 7.50%, 6/15/15 | | | United States | | | | 400,000 | | | | 403,000 | |
bShingle Springs Tribal Gaming Authority, senior note, 144A, 9.375%, 6/15/15 | | | United States | | | | 1,000,000 | | | | 695,000 | |
eStation Casinos Inc.,
senior note, 6.00%, 4/01/12 | | | United States | | | | 200,000 | | | | 20 | |
senior note, 7.75%, 8/15/16 | | | United States | | | | 1,000,000 | | | | 100 | |
senior sub. note, 6.50%, 2/01/14 | | | United States | | | | 100,000 | | | | 10 | |
senior sub. note, 6.875%, 3/01/16 | | | United States | | | | 1,000,000 | | | | 100 | |
Universal City Development,
senior note, 8.875%, 11/15/15 | | | United States | | | | 1,500,000 | | | | 1,601,250 | |
senior sub. note, 10.875%, 11/15/16 | | | United States | | | | 200,000 | | | | 219,500 | |
bVisant Corp., senior note, 144A, 10.00%, 10/01/17 | | | United States | | | | 2,800,000 | | | | 2,982,000 | |
| | | | | | | | | | | | |
| | | | | | | | | | | 23,261,305 | |
| | | | | | | | | | | | |
Diversified Financials 5.2% | | | | | | | | | | | | |
bAlly Financial Inc., senior bond, 144A, 7.50%, 9/15/20 | | | United States | | | | 500,000 | | | | 526,875 | |
cBank of America Corp., pfd., sub. bond, M, 8.125% to 5/15/18, FRN thereafter, Perpetual | | | United States | | | | 2,500,000 | | | | 2,522,625 | |
CIT Group Inc., senior secured sub. bond, 7.00%, 5/01/17 | | | United States | | | | 4,000,000 | | | | 4,020,000 | |
GMAC Inc.,
senior note, 6.875%, 8/28/12 | | | United States | | | | 3,000,000 | | | | 3,150,000 | |
sub. note, 8.00%, 12/31/18 | | | United States | | | | 1,000,000 | | | | 1,067,500 | |
International Lease Finance Corp., senior note, 8.25%, 12/15/20 | | | United States | | | | 400,000 | | | | 412,500 | |
senior note, R, 5.65%, 6/01/14 | | | United States | | | | 2,800,000 | | | | 2,793,000 | |
bsenior secured note, 144A, 6.75%, 9/01/16 | | | United States | | | | 1,200,000 | | | | 1,287,000 | |
bTransUnion LLC/TransUnion Corp., senior note, 144A, 11.375%, 6/15/18 | | | United States | | | | 600,000 | | | | 687,000 | |
| | | | | | | | | | | | |
| | | | | | | | | | | 16,466,500 | |
| | | | | | | | | | | | |
Energy 16.7% | | | | | | | | | | | | |
Anadarko Petroleum Corp., senior note, 8.70%, 3/15/19 | | | United States | | | | 2,000,000 | | | | 2,446,140 | |
Antero Resources Finance, senior note, 9.375%, 12/01/17 | | | United States | | | | 2,600,000 | | | | 2,733,250 | |
Berry Petroleum Co., senior note, 6.75%, 11/01/20 | | | United States | | | | 500,000 | | | | 503,750 | |
bBreitBurn Energy Partners LP, senior note, 144A, 8.625%, 10/15/20 | | | United States | | | | 1,200,000 | | | | 1,212,000 | |
bBrigham Exploration Co., senior note, 144A, 8.75%, 10/01/18 | | | United States | | | | 2,800,000 | | | | 3,024,000 | |
bCarrizo Oil & Gas Inc., senior note, 144A, 8.625%, 10/15/18 | | | United States | | | | 800,000 | | | | 828,000 | |
bChaparral Energy Inc., senior note, 144A, 9.875%, 10/01/20 | | | United States | | | | 1,400,000 | | | | 1,480,500 | |
bCHC Helicopter SA, senior secured note, 144A, 9.25%, 10/15/20 | | | Canada | | | | 3,000,000 | | | | 3,120,000 | |
Chesapeake Energy Corp., senior note, 6.625%, 8/15/20 | | | United States | | | | 2,900,000 | | | | 2,871,000 | |
FH-12
Franklin Templeton Variable Insurance Products Trust
Statement of Investments, December 31, 2010 (continued)
| | | | | | | | | | | | |
| Franklin High Income Securities Fund | | Country | | | Principal
Amount* | | | Value | |
Corporate Bonds (continued) | | | | | | | | | | | | |
Energy (continued) | | | | | | | | | | | | |
bConsol Energy Inc., senior note, 144A,
8.00%, 4/01/17 | | | United States | | | | 500,000 | | | $ | 535,000 | |
8.25%, 4/01/20 | | | United States | | | | 500,000 | | | | 542,500 | |
Crosstex Energy LP/Crosstex Energy Finance Corp., senior note, 8.875%, 2/15/18 | | | United States | | | | 500,000 | | | | 538,125 | |
El Paso Corp., senior note,
6.875%, 6/15/14 | | | United States | | | | 2,000,000 | | | | 2,134,960 | |
b144A, 6.50%, 9/15/20 | | | United States | | | | 400,000 | | | | 404,000 | |
bEnergy XXI Gulf Coast Inc., senior note, 144A, 9.25%, 12/15/17 | | | United States | | | | 2,500,000 | | | | 2,606,250 | |
gEnterprise Products Operating LLC, junior sub. note, FRN, 7.034%, 1/15/68 | | | United States | | | | 1,900,000 | | | | 1,973,971 | |
bExpro Finance Luxembourg, senior secured note, 144A, 8.50%, 12/15/16 | | | United Kingdom | | | | 2,000,000 | | | | 1,932,290 | |
General Maritime Corp., senior note, 12.00%, 11/15/17 | | | United States | | | | 400,000 | | | | 388,000 | |
Holly Corp., senior note, 9.875%, 6/15/17 | | | United States | | | | 700,000 | | | | 766,500 | |
bLinn Energy Corp., senior note, 144A,
8.625%, 4/15/20 | | | United States | | | | 2,000,000 | | | | 2,165,000 | |
7.75%, 2/01/21 | | | United States | | | | 700,000 | | | | 721,000 | |
MarkWest Energy Partners LP/Finance Corp., senior note, 6.75%, 11/01/20 | | | United States | | | | 1,500,000 | | | | 1,507,500 | |
Martin Midstream Partners LP, senior note, 8.875%, 4/01/18 | | | United States | | | | 1,500,000 | | | | 1,552,500 | |
bOPTI Canada Inc., senior secured note, 144A, 9.75%, 8/15/13 | | | Canada | | | | 1,400,000 | | | | 1,407,000 | |
Peabody Energy Corp., senior note, 6.50%, 9/15/20 | | | United States | | | | 1,700,000 | | | | 1,823,250 | |
Petrohawk Energy Corp., senior note,
7.875%, 6/01/15 | | | United States | | | | 1,800,000 | | | | 1,883,250 | |
7.25%, 8/15/18 | | | United States | | | | 300,000 | | | | 304,500 | |
bPetroplus Finance Ltd., senior note, 144A, 6.75%, 5/01/14 | | | Switzerland | | | | 1,600,000 | | | | 1,480,000 | |
Plains Exploration & Production Co., senior note, 7.625%, 6/01/18 | | | United States | | | | 2,200,000 | | | | 2,318,250 | |
Pride International Inc., senior note, 6.875%, 8/15/20 | | | United States | | | | 300,000 | | | | 312,750 | |
Quicksilver Resources Inc., senior note, | | | | | | | | | | | | |
8.25%, 8/01/15 | | | United States | | | | 2,000,000 | | | | 2,085,000 | |
9.125%, 8/15/19 | | | United States | | | | 300,000 | | | | 330,750 | |
SandRidge Energy Inc., senior note, | | | | | | | | | | | | |
8.75%, 1/15/20 | | | United States | | | | 300,000 | | | | 309,750 | |
b144A, 8.00%, 6/01/18 | | | United States | | | | 2,500,000 | | | | 2,550,000 | |
hPIK, 8.625%, 4/01/15 | | | United States | | | | 100,000 | | | | 102,875 | |
bVantage Drilling Co., senior secured note, 144A, 11.50%, 8/01/15 | | | United States | | | | 1,300,000 | | | | 1,417,000 | |
| | | | | | | | | | | | |
| | | | | | | | | | | 52,310,611 | |
| | | | | | | | | | | | |
Food & Staples Retailing 0.9% | | | | | | | | | | | | |
Rite Aid Corp., senior secured note, | | | | | | | | | | | | |
9.75%, 6/12/16 | | | United States | | | | 1,800,000 | | | | 1,991,250 | |
8.00%, 8/15/20 | | | United States | | | | 900,000 | | | | 941,625 | |
| | | | | | | | | | | | |
| | | | | | | | | | | 2,932,875 | |
| | | | | | | | | | | | |
Food, Beverage & Tobacco 2.2% | | | | | | | | | | | | |
bCEDC Finance Corp. International Inc., senior secured note, 144A, 9.125%, 12/01/16 | | | United States | | | | 900,000 | | | | 960,750 | |
bDean Foods Co., senior note, 144A, 9.75%, 12/15/18 | | | United States | | | | 1,600,000 | | | | 1,620,000 | |
JBS USA LLC, senior note, 11.625%, 5/01/14 | | | United States | | | | 1,800,000 | | | | 2,110,500 | |
Pinnacle Foods Finance LLC, senior note, | | | | | | | | | | | | |
9.25%, 4/01/15 | | | United States | | | | 1,300,000 | | | | 1,360,125 | |
8.25%, 9/01/17 | | | United States | | | | 700,000 | | | | 719,250 | |
| | | | | | | | | | | | |
| | | | | | | | | | | 6,770,625 | |
| | | | | | | | | | | | |
Health Care Equipment & Services 7.2% | | | | | | | | | | | | |
Boston Scientific Corp., senior note, 6.00%, 1/15/20 | | | United States | | | | 1,500,000 | | | | 1,566,321 | |
FH-13
Franklin Templeton Variable Insurance Products Trust
Statement of Investments, December 31, 2010 (continued)
| | | | | | | | | | | | |
| Franklin High Income Securities Fund | | Country | | | Principal
Amount* | | | Value | |
Corporate Bonds (continued) | | | | | | | | | | | | |
Health Care Equipment & Services (continued) | | | | | | | | | | | | |
DaVita Inc., senior note, | | | | | | | | | | | | |
6.375%, 11/01/18 | | | United States | | | | 800,000 | | | $ | 798,000 | |
6.625%, 11/01/20 | | | United States | | | | 600,000 | | | | 595,500 | |
FMC Finance III SA, senior note, 6.875%, 7/15/17 | | | Germany | | | | 2,200,000 | | | | 2,343,000 | |
bFresenius US Finance II, senior note, 144A, 9.00%, 7/15/15 | | | Germany | | | | 1,000,000 | | | | 1,150,000 | |
HCA Inc., senior secured bond,
7.25%, 9/15/20 | | | United States | | | | 900,000 | | | | 945,000 | |
senior secured note, 9.125%, 11/15/14 | | | United States | | | | 4,000,000 | | | | 4,205,000 | |
senior secured note, 7.875%, 2/15/20 | | | United States | | | | 1,500,000 | | | | 1,612,500 | |
bMedAssets Inc., senior note, 144A, 8.00%, 11/15/18 | | | United States | | | | 2,000,000 | | | | 2,020,000 | |
bTenet Healthcare Corp., senior note, 144A, 8.00%, 8/01/20 | | | United States | | | | 900,000 | | | | 915,750 | |
bUHS Escrow Corp., senior note, 144A, 7.00%, 10/01/18 | | | United States | | | | 2,600,000 | | | | 2,684,500 | |
hUnited Surgical Partners International Inc., senior sub. note, PIK, 9.25%, 5/01/17 | | | United States | | | | 2,300,000 | | | | 2,403,500 | |
Vanguard Health Holding Co. II LLC, senior note, 8.00%, 2/01/18 | | | United States | | | | 1,300,000 | | | | 1,339,000 | |
| | | | | | | | | | | | |
| | | | | | | | | | | 22,578,071 | |
| | | | | | | | | | | | |
Materials 7.8% | | | | | | | | | | | | |
bArdagh Packaging Finance PLC,
senior note, 144A, 9.125%, 10/15/20 | | | Ireland | | | | 500,000 | | | | 522,500 | |
senior secured note, 144A, 7.375%, 10/15/17 | | | Ireland | | | | 1,200,000 | | | | 1,248,000 | |
bAtkore International Inc., senior secured note, 144A, 9.875%, 1/01/18 | | | United States | | | | 900,000 | | | | 940,500 | |
bBuilding Materials Corp. of America, senior note, 144A, | | | | | | | | | | | | |
6.875%, 8/15/18 | | | United States | | | | 1,200,000 | | | | 1,194,000 | |
7.50%, 3/15/20 | | | United States | | | | 800,000 | | | | 818,000 | |
bFMG Finance Pty. Ltd., senior note, 144A, 7.00%, 11/01/15 | | | Australia | | | | 800,000 | | | | 818,000 | |
bFMG Resources Aug 2006, senior note, 144A, 6.875%, 2/01/18 | | | Australia | | | | 1,400,000 | | | | 1,400,000 | |
bHuntsman International LLC, senior sub. note, 144A, 8.625%, 3/15/21 | | | United States | | | | 300,000 | | | | 325,500 | |
bIneos Finance PLC, senior secured note, 144A, 9.00%, 5/15/15 | | | United Kingdom | | | | 200,000 | | | | 215,000 | |
bIneos Group Holdings PLC, senior secured note, 144A, 8.50%, 2/15/16 | | | United Kingdom | | | | 2,000,000 | | | | 1,915,000 | |
bMacDermid Inc., senior sub. note, 144A, 9.50%, 4/15/17 | | | United States | | | | 2,200,000 | | | | 2,332,000 | |
NewPage Corp., senior secured note, 11.375%, 12/31/14 | | | United States | | | | 2,500,000 | | | | 2,362,500 | |
bNovelis Inc., senior note, 144A, 8.75%, 12/15/20 | | | India | | | | 1,300,000 | | | | 1,355,250 | |
bOMNOVA Solutions Inc., senior note, 144A, 7.875%, 11/01/18 | | | United States | | | | 2,100,000 | | | | 2,126,250 | |
Owens-Illinois Inc., senior note, 7.80%, 5/15/18 | | | United States | | | | 800,000 | | | | 854,000 | |
bReynolds Group Issuer Inc./LLC/SA, senior note, 144A, | | | | | | | | | | | | |
8.50%, 5/15/18 | | | United States | | | | 2,800,000 | | | | 2,828,000 | |
9.00%, 4/15/19 | | | United States | | | | 200,000 | | | | 208,250 | |
Solo Cup Co.,
senior secured note, 10.50%, 11/01/13 | | | United States | | | | 400,000 | | | | 420,000 | |
senior sub. note, 8.50%, 2/15/14 | | | United States | | | | 1,700,000 | | | | 1,538,500 | |
bTPC Group LLC, senior secured note, 144A, 8.25%, 10/01/17 | | | United States | | | | 900,000 | | | | 945,000 | |
| | | | | | | | | | | | |
| | | | | | | | | | | 24,366,250 | |
| | | | | | | | | | | | |
Media 7.9% | | | | | | | | | | | | |
bBresnan Broadband Holdings LLC, senior note, 144A, 8.00%, 12/15/18 | | | United States | | | | 700,000 | | | | 724,500 | |
Cablevision Systems Corp., senior note, | | | | | | | | | | | | |
8.625%, 9/15/17 | | | United States | | | | 1,000,000 | | | | 1,093,750 | |
7.75%, 4/15/18 | | | United States | | | | 1,000,000 | | | | 1,052,500 | |
CCH II LLC/CCH II Capital Corp., senior note, 13.50%, 11/30/16 | | | United States | | | | 2,566,823 | | | | 3,073,771 | |
CCO Holdings LLC, senior note, 8.125%, 4/30/20 | | | United States | | | | 200,000 | | | | 211,500 | |
bCitadel Broadcasting Corp., senior note, 144A, 7.75%, 12/15/18 | | | United States | | | | 700,000 | | | | 728,000 | |
Clear Channel Worldwide Holdings Inc., senior note, | | | | | | | | | | | | |
A, 9.25%, 12/15/17 | | | United States | | | | 300,000 | | | | 327,750 | |
B, 9.25%, 12/15/17 | | | United States | | | | 2,300,000 | | | | 2,530,000 | |
FH-14
Franklin Templeton Variable Insurance Products Trust
Statement of Investments, December 31, 2010 (continued)
| | | | | | | | | | | | |
| Franklin High Income Securities Fund | | Country | | | Principal
Amount* | | | Value | |
Corporate Bonds (continued) | | | | | | | | | | | | |
Media (continued) | | | | | | | | | | | | |
EchoStar DBS Corp., senior note, 7.125%, 2/01/16 | | | United States | | | | 2,500,000 | | | $ | 2,593,750 | |
Lamar Media Corp., senior sub. note, 7.875%, 4/15/18 | | | United States | | | | 900,000 | | | | 960,750 | |
bLive Nation Entertainment Inc., senior note, 144A, 8.125%, 5/15/18 | | | United States | | | | 2,500,000 | | | | 2,543,750 | |
Media General Inc., senior secured note, 11.75%, 2/15/17 | | | United States | | | | 1,100,000 | | | | 1,161,875 | |
b,hRadio One Inc., senior sub. note, 144A, PIK, 15.00%, 5/24/16 | | | United States | | | | 1,900,000 | | | | 1,873,174 | |
bUnivision Communications Inc.,
hsenior note, 144A, PIK, 10.50%, 3/15/15 | | | United States | | | | 211,838 | | | | 223,295 | |
senior secured note, 144A, 7.875%, 11/01/20 | | | United States | | | | 700,000 | | | | 738,500 | |
bUPC Germany GmbH, senior secured note, 144A, 8.125%, 12/01/17 | | | Germany | | | | 1,500,000 | | | | 1,590,937 | |
bUPC Holding BV, senior note, 144A, 9.875%, 4/15/18 | | | Netherlands | | | | 1,500,000 | | | | 1,650,000 | |
WMG Acquisition Corp., senior secured note, 9.50%, 6/15/16 | | | United States | | | | 1,600,000 | | | | 1,724,000 | |
| | | | | | | | | | | | |
| | | | | | | | | | | 24,801,802 | |
| | | | | | | | | | | | |
Pharmaceuticals, Biotechnology & Life Sciences 1.2% | | | | | | | | | | | | |
bEndo Pharmaceuticals Holdings Inc., senior note, 144A, 7.00%, 12/15/20 | | | United States | | | | 700,000 | | | | 717,500 | |
binVentiv Health Inc., senior note, 144A, 10.00%, 8/15/18 | | | United States | | | | 700,000 | | | | 703,500 | |
bMylan Inc., senior note, 144A, 7.875%, 7/15/20 | | | United States | | | | 2,200,000 | | | | 2,381,500 | |
| | | | | | | | | | | | |
| | | | | | | | | | | 3,802,500 | |
| | | | | | | | | | | | |
Real Estate 0.7% | | | | | | | | | | | | |
Forest City Enterprises Inc., senior note, | | | | | | | | | | | | |
7.625%, 6/01/15 | | | United States | | | | 2,000,000 | | | | 1,880,000 | |
6.50%, 2/01/17 | | | United States | | | | 300,000 | | | | 262,500 | |
| | | | | | | | | | | | |
| | | | | | | | | | | 2,142,500 | |
| | | | | | | | | | | | |
Retailing 1.8% | | | | | | | | | | | | |
bAsbury Automotive Group Inc., senior sub. note, 144A, 8.375%, 11/15/20 | | | United States | | | | 1,400,000 | | | | 1,452,500 | |
bMichaels Stores Inc., senior note, 144A, 7.75%, 11/01/18 | | | United States | | | | 2,300,000 | | | | 2,305,750 | |
bPetco Animal Supplies Inc., senior note, 144A, 9.25%, 12/01/18 | | | United States | | | | 1,900,000 | | | | 2,011,625 | |
| | | | | | | | | | | | |
| | | | | | | | | | | 5,769,875 | |
| | | | | | | | | | | | |
Semiconductors & Semiconductor Equipment 1.4% | | | | | | | | | | | | |
Advanced Micro Devices Inc., senior note, | | | | | | | | | | | | |
8.125%, 12/15/17 | | | United States | | | | 500,000 | | | | 532,500 | |
b144A, 7.75%, 8/01/20 | | | United States | | | | 300,000 | | | | 312,750 | |
Freescale Semiconductor Inc., senior note, | | | | | | | | | | | | |
8.875%, 12/15/14 | | | United States | | | | 1,200,000 | | | | 1,260,000 | |
10.125%, 12/15/16 | | | United States | | | | 200,000 | | | | 211,500 | |
b144A, 10.75%, 8/01/20 | | | United States | | | | 1,300,000 | | | | 1,426,750 | |
bNXP BV/NXP Funding LLC, senior secured note, 144A, 9.75%, 8/01/18 | | | Netherlands | | | | 600,000 | | | | 669,375 | |
| | | | | | | | | | | | |
| | | | | | | | | | | 4,412,875 | |
| | | | | | | | | | | | |
Software & Services 1.6% | | | | | | | | | | | | |
First Data Corp.,
bsenior bond, 144A, 12.625%, 1/15/21 | | | United States | | | | 808,000 | | | | 775,680 | |
senior note, 9.875%, 9/24/15 | | | United States | | | | 111,000 | | | | 106,282 | |
senior note, 9.875%, 9/24/15 | | | United States | | | | 71,000 | | | | 67,628 | |
bsenior secured bond, 144A, 8.25%, 1/15/21 | | | United States | | | | 808,000 | | | | 779,720 | |
bSitel LLC, senior note, 144A, 11.50%, 4/01/18 | | | United States | | | | 1,300,000 | | | | 1,079,000 | |
SunGard Data Systems Inc.,
bsenior note, 144A, 7.625%, 11/15/20 | | | United States | | | | 1,700,000 | | | | 1,729,750 | |
senior sub. note, 10.25%, 8/15/15 | | | United States | | | | 600,000 | | | | 632,250 | |
| | | | | | | | | | | | |
| | | | | | | | | | | 5,170,310 | |
| | | | | | | | | | | | |
FH-15
Franklin Templeton Variable Insurance Products Trust
Statement of Investments, December 31, 2010 (continued)
| | | | | | | | | | | | |
| Franklin High Income Securities Fund | | Country | | | Principal
Amount* | | | Value | |
Corporate Bonds (continued) | | | | | | | | | | | | |
Technology Hardware & Equipment 1.0% | | | | | | | | | | | | |
Sanmina-SCI Corp., senior sub. note, | | | | | | | | | | | | |
6.75%, 3/01/13 | | | United States | | | | 1,200,000 | | | $ | 1,203,000 | |
8.125%, 3/01/16 | | | United States | | | | 1,300,000 | | | | 1,319,500 | |
ViaSat Inc., senior note, 8.875%, 9/15/16 | | | United States | | | | 500,000 | | | | 535,000 | |
| | | | | | | | | | | | |
| | | | | | | | | | | 3,057,500 | |
| | | | | | | | | | | | |
Telecommunication Services 8.1% | | | | | | | | | | | | |
bCricket Communications Inc., senior note, 144A, 7.75%, 10/15/20 | | | United States | | | | 3,000,000 | | | | 2,865,000 | |
Crown Castle International Corp., | | | | | | | | | | | | |
senior bond, 7.125%, 11/01/19 | | | United States | | | | 600,000 | | | | 637,500 | |
senior note, 9.00%, 1/15/15 | | | United States | | | | 2,000,000 | | | | 2,215,000 | |
bDigicel Group Ltd., senior note, 144A, 8.875%, 1/15/15 | | | Jamaica | | | | 2,600,000 | | | | 2,639,000 | |
Frontier Communications Corp., senior note, | | | | | | | | | | | | |
8.25%, 4/15/17 | | | United States | | | | 400,000 | | | | 441,000 | |
8.50%, 4/15/20 | | | United States | | | | 400,000 | | | | 439,000 | |
8.75%, 4/15/22 | | | United States | | | | 900,000 | | | | 985,500 | |
bIntegra Telecom Inc., senior secured note, 144A, 10.75%, 4/15/16 | | | United States | | | | 1,100,000 | | | | 1,144,000 | |
bIntelsat Jackson Holding Ltd., senior note, 144A, 7.25%, 10/15/20 | | | Luxembourg | | | | 400,000 | | | | 406,000 | |
Intelsat Subsidiary Holding Co. Ltd., senior note, | | | | | | | | | | | | |
8.50%, 1/15/13 | | | Luxembourg | | | | 2,000,000 | | | | 2,012,500 | |
b144A, 8.875%, 1/15/15 | | | Luxembourg | | | | 2,000,000 | | | | 2,055,000 | |
MetroPCS Wireless Inc., senior note, 7.875%, 9/01/18 | | | United States | | | | 1,500,000 | | | | 1,563,750 | |
Qwest Communications International Inc., senior note, B, 7.50%, 2/15/14 | | | United States | | | | 1,000,000 | | | | 1,017,500 | |
SBA Telecommunications Inc., senior note, 8.25%, 8/15/19 | | | United States | | | | 2,600,000 | | | | 2,853,500 | |
Sprint Nextel Corp., senior note, 8.375%, 8/15/17 | | | United States | | | | 1,500,000 | | | | 1,616,250 | |
bWest Corp., senior note, 144A, 7.875%, 1/15/19 | | | United States | | | | 1,900,000 | | | | 1,938,000 | |
b,hWind Acquisition Holdings Finance SA, senior secured note, 144A, PIK, 12.25%, 7/15/17 | | | Italy | | | | 428,583 | EUR | | | 620,502 | |
| | | | | | | | | | | | |
| | | | | | | | | | | 25,449,002 | |
| | | | | | | | | | | | |
Transportation 1.7% | | | | | | | | | | | | |
bAir Canada, senior secured note, 144A, 9.25%, 8/01/15 | | | Canada | | | | 1,500,000 | | | | 1,582,500 | |
bCeva Group PLC, senior secured note, 144A, | | | | | | | | | | | | |
8.375%, 12/01/17 | | | United Kingdom | | | | 500,000 | | | | 504,687 | |
11.625%, 10/01/16 | | | United Kingdom | | | | 200,000 | | | | 217,678 | |
11.50%, 4/01/18 | | | United Kingdom | | | | 1,800,000 | | | | 1,965,607 | |
bHertz Corp., senior note, 144A, 7.50%, 10/15/18 | | | United States | | | | 1,100,000 | | | | 1,146,750 | |
| | | | | | | | | | | | |
| | | | | | | | | | | 5,417,222 | |
| | | | | | | | | | | | |
Utilities 4.8% | | | | | | | | | | | | |
Ameren Corp., senior note, 8.875%, 5/15/14 | | | United States | | | | 800,000 | | | | 900,797 | |
bCalpine Corp., senior secured note, 144A, | | | | | | | | | | | | |
7.875%, 7/31/20 | | | United States | | | | 800,000 | | | | 814,000 | |
7.50%, 2/15/21 | | | United States | | | | 1,500,000 | | | | 1,485,000 | |
CMS Energy Corp., senior note, 8.75%, 6/15/19 | | | United States | | | | 2,000,000 | | | | 2,362,424 | |
Dynegy Holdings Inc., senior note, 8.375%, 5/01/16 | | | United States | | | | 2,000,000 | | | | 1,505,000 | |
bIntergen NV, senior secured note, 144A, 9.00%, 6/30/17 | | | Netherlands | | | | 2,000,000 | | | | 2,130,000 | |
bKinder Morgan Finance Co. ULC, secured senior note, 144A, 6.00%, 1/15/18 | | | United States | | | | 1,400,000 | | | | 1,382,500 | |
NRG Energy Inc., senior note, | | | | | | | | | | | | |
7.25%, 2/01/14 | | | United States | | | | 200,000 | | | | 204,500 | |
7.375%, 2/01/16 | | | United States | | | | 2,600,000 | | | | 2,671,500 | |
bTexas Competitive Electric Holdings Co. LLC/Texas Competitive Electric Holdings | | | | | | | | | | | | |
Finance Inc., senior secured note, 144A, 15.00%, 4/01/21 | | | United States | | | | 852,000 | | | | 771,060 | |
FH-16
Franklin Templeton Variable Insurance Products Trust
Statement of Investments, December 31, 2010 (continued)
| | | | | | | | | | | | |
| Franklin High Income Securities Fund | | Country | | | Principal
Amount* | | | Value | |
Corporate Bonds (continued) | | | | | | | | | | | | |
Utilities (continued) | | | | | | | | | | | | |
Texas Competitive Electric Holdings Co. LLC, senior note, A, 10.25%, 11/01/15 | | | United States | | | | 1,300,000 | | | $ | 724,750 | |
| | | | | | | | | | | | |
| | | | | | | | | | | 14,951,531 | |
| | | | | | | | | | | | |
Total Corporate Bonds (Cost $275,205,438) | | | | | | | | | | | 286,862,926 | |
| | | | | | | | | | | | |
g,iSenior Floating Rate Interests 0.6% | | | | | | | | | | | | |
Media 0.3% | | | | | | | | | | | | |
Univision Communications Inc., Initial Term Loan, 2.511%, 9/29/14 | | | United States | | | | 881,899 | | | | 844,249 | |
| | | | | | | | | | | | |
| | | |
Utilities 0.3% | | | | | | | | | | | | |
Texas Competitive Electric Holdings Co. LLC, Delayed Draw Term Loan, 3.764%, 10/10/14 | | | United States | | | | 1,488,693 | | | | 1,144,226 | |
| | | | | | | | | | | | |
Total Senior Floating Rate Interests (Cost $1,959,657) | | | | | | | | | | | 1,988,475 | |
| | | | | | | | | | | | |
Total Investments before Short Term Investments (Cost $278,225,566) | | | | | | | | | | | 289,579,438 | |
| | | | | | | | | | | | |
Short Term Investments (Cost $20,082,686) 6.4% | | | | | | | | | | | | |
Repurchase Agreements 6.4% | | | | | | | | | | | | |
jJoint Repurchase Agreement, 0.141%, 1/03/11 (Maturity Value $20,082,922) | | | United States | | | | 20,082,686 | | | | 20,082,686 | |
Barclays Capital Inc. (Maturity Value $3,457,677) BNP Paribas Securities Corp. (Maturity Value $3,556,283) Credit Suisse Securities (USA) LLC (Maturity Value $1,975,758) Deutsche Bank Securities Inc. (Maturity Value $3,189,971) HSBC Securities (USA) Inc. (Maturity Value $2,469,798) Merrill Lynch, Pierce, Fenner & Smith Inc. (Maturity Value $1,975,758) Morgan Stanley & Co. Inc. (Maturity Value $2,469,798) UBS Securities LLC (Maturity Value $987,879) | | | | | | | | | | | | |
Collateralized by U.S. Government Agency Securities, 0.50% - 5.75%, 1/07/11 - 10/26/15; kU.S. Treasury Bills, 5/12/11 - 7/28/11; and U.S. Treasury Notes, 0.375% - 1.875%, 9/30/11 - 9/30/17 (valued at $20,516,939) | | | | | | | | | | | | |
| | | | | | | | | | | | |
Total Investments (Cost $298,308,252) 98.7% | | | | | | | | | | | 309,662,124 | |
Other Assets, less Liabilities 1.3% | | | | | | | | | | | 4,146,292 | |
| | | | | | | | | | | | |
Net Assets 100.0% | | | | | | | | | | $ | 313,808,416 | |
| | | | | | | | | | | | |
*The principal amount is stated in U.S. dollars unless otherwise indicated.
aNon-income producing.
bSecurity was purchased pursuant to Rule 144A under the Securities Act of 1933 and may be sold in transactions exempt from registration only to qualified institutional buyers or in a public offering registered under the Securities Act of 1933. These securities have been deemed liquid under guidelines approved by the Trust’s Board of Trustees. At December 31, 2010, the aggregate value of these securities was $123,994,410, representing 39.51% of net assets.
cPerpetual security with no stated maturity date.
dIncome may be reflected in the redemption value or received in additional securities and/or cash.
eSee Note 7 regarding defaulted securities.
fSecurity has been deemed illiquid because it may not be able to be sold within seven days. At December 31, 2010, the value of this security was $191, representing less than 0.01% of net assets.
gThe coupon rate shown represents the rate at period end.
hIncome may be received in additional securities and/or cash.
iSee Note 1(e) regarding senior floating rate interests.
jSee Note 1(c) regarding joint repurchase agreement.
kThe security is traded on a discount basis with no stated coupon rate.
FH-17
Franklin Templeton Variable Insurance Products Trust
Statement of Investments, December 31, 2010 (continued)
| | | | | | |
| Franklin High Income Securities Fund | | | | | | |
At December 31, 2010, the Fund had the following forward exchange contracts outstanding. See Note 1(d).
| | | | | | | | | | | | | | | | | | | | | | | | | | | | |
| Currency | | Counterparty | | | Type | | | Quantity | | | Contract
Amount | | | Settlement
Date | | | Unrealized
Appreciation | | | Unrealized
Depreciation | |
Euro | | | DBAB | | | | Sell | | | | 389,500 | | | $ | 519,274 | | | | 12/15/11 | | | $ | — | | | $ | (924 | ) |
| | | | | | | | | | | | | | | | | | | | | | | | |
See Abbreviations on page FH-30.
The accompanying notes are an integral part of these financial statements.
FH-18
Franklin Templeton Variable Insurance Products Trust
Financial Statements
Statement of Assets and Liabilities
December 31, 2010
| | | | |
| | | Franklin High
Income Securities
Fund | |
Assets: | | | | |
Investments in securities: | | | | |
Cost - Unaffiliated issuers | | $ | 278,225,566 | |
Cost - Repurchase agreements | | | 20,082,686 | |
| | | | |
Total cost of investments | | $ | 298,308,252 | |
| | | | |
Value - Unaffiliated issuers | | $ | 289,579,438 | |
Value - Repurchase agreements | | | 20,082,686 | |
| | | | |
Total value of investments | | | 309,662,124 | |
Cash | | | 6,583 | |
Foreign currency, at value (cost $3,124) | | | 2,867 | |
Receivables: | | | | |
Investment securities sold | | | 206,794 | |
Capital shares sold | | | 66,873 | |
Interest | | | 5,267,835 | |
Other assets | | | 109,538 | |
| | | | |
Total assets | | | 315,322,614 | |
| | | | |
Liabilities: | | | | |
Payables: | | | | |
Investment securities purchased | | | 1,070,021 | |
Capital shares redeemed | | | 69,053 | |
Affiliates | | | 246,602 | |
Reports to shareholders | | | 85,534 | |
Unrealized depreciation on forward exchange contracts | | | 924 | |
Accrued expenses and other liabilities | | | 42,064 | |
| | | | |
Total liabilities | | | 1,514,198 | |
| | | | |
Net assets, at value | | $ | 313,808,416 | |
| | | | |
Net assets consist of: | | | | |
Paid-in capital | | $ | 346,104,100 | |
Undistributed net investment income | | | 19,700,126 | |
Net unrealized appreciation (depreciation) | | | 11,352,690 | |
Accumulated net realized gain (loss) | | | (63,348,500 | ) |
| | | | |
Net assets, at value | | $ | 313,808,416 | |
| | | | |
The accompanying notes are an integral part of these financial statements.
FH-19
Franklin Templeton Variable Insurance Products Trust
Financial Statements (continued)
Statement of Assets and Liabilities (continued)
December 31, 2010
| | | | |
| | | Franklin High
Income Securities
Fund | |
Class 1: | | | | |
Net assets, at value | | $ | 48,051,160 | |
| | | | |
Shares outstanding | | | 7,249,003 | |
| | | | |
Net asset value and maximum offering price per share | | $ | 6.63 | |
| | | | |
Class 2: | | | | |
Net assets, at value | | $ | 239,823,547 | |
| | | | |
Shares outstanding | | | 37,040,273 | |
| | | | |
Net asset value and maximum offering price per share | | $ | 6.47 | |
| | | | |
Class 4: | | | | |
Net assets, at value | | $ | 25,933,709 | |
| | | | |
Shares outstanding | | | 3,945,629 | |
| | | | |
Net asset value and maximum offering price per share | | $ | 6.57 | |
| | | | |
The accompanying notes are an integral part of these financial statements.
FH-20
Franklin Templeton Variable Insurance Products Trust
Financial Statements (continued)
Statement of Operations
for the year ended December 31, 2010
| | | | |
| | | Franklin High
Income Securities
Fund | |
Investment income: | | | | |
Dividends | | $ | 41,231 | |
Interest | | | 22,567,208 | |
| | | | |
Total investment income | | | 22,608,439 | |
| | | | |
Expenses: | | | | |
Management fees (Note 3a) | | | 1,472,066 | |
Distribution fees: (Note 3c) | | | | |
Class 2 | | | 506,607 | |
Class 4 | | | 73,938 | |
Unaffiliated transfer agent fees | | | 342 | |
Custodian fees (Note 4) | | | 4,118 | |
Reports to shareholders | | | 126,321 | |
Professional fees | | | 43,995 | |
Trustees’ fees and expenses | | | 1,183 | |
Other | | | 12,165 | |
| | | | |
Total expenses | | | 2,240,735 | |
| | | | |
Net investment income | | | 20,367,704 | |
| | | | |
Realized and unrealized gains (losses): | | | | |
Net realized gain (loss) from: | | | | |
Investments | | | 8,201,504 | |
Foreign currency transactions | | | 47,218 | |
| | | | |
Net realized gain (loss) | | | 8,248,722 | |
| | | | |
Net change in unrealized appreciation (depreciation) on: | | | | |
Investments | | | 5,480,732 | |
Translation of other assets and liabilities denominated in foreign currencies | | | (12,393 | ) |
| | | | |
Net change in unrealized appreciation (depreciation) | | | 5,468,339 | |
| | | | |
Net realized and unrealized gain (loss) | | | 13,717,061 | |
| | | | |
Net increase (decrease) in net assets resulting from operations | | $ | 34,084,765 | |
| | | | |
The accompanying notes are an integral part of these financial statements.
FH-21
Franklin Templeton Variable Insurance Products Trust
Financial Statements (continued)
Statements of Changes in Net Assets
| | | | | | | | |
| | | Franklin High Income
Securities Fund | |
| | | Year Ended December 31, | |
| | | 2010 | | | 2009 | |
| | | | |
Increase (decrease) in net assets: | | | | | | | | |
Operations: | | | | | | | | |
Net investment income | | $ | 20,367,704 | | | $ | 16,443,726 | |
Net realized gain (loss) from investments and foreign currency transactions | | | 8,248,722 | | | | (6,274,381 | ) |
Net change in unrealized appreciation (depreciation) on investments and translation of other assets and liabilities denominated in foreign currencies | | | 5,468,339 | | | | 60,042,146 | |
| | | | |
Net increase (decrease) in net assets resulting from operations | | | 34,084,765 | | | | 70,211,491 | |
| | | | |
Distributions to shareholders from:
Net investment income: | | | | | | | | |
Class 1 | | | (3,172,829 | ) | | | (2,944,930 | ) |
Class 2 | | | (12,418,978 | ) | | | (10,742,997 | ) |
Class 4 | | | (1,394,573 | ) | | | (471,677 | ) |
| | | | |
Total distributions to shareholders | | | (16,986,380 | ) | | | (14,159,604 | ) |
| | | | |
Capital share transactions: (Note 2) | | | | | | | | |
Class 1 | | | (3,710,324 | ) | | | (2,028,103 | ) |
Class 2 | | | 28,368,422 | | | | 72,968,916 | |
Class 4 | | | 9,525,024 | | | | 10,669,989 | |
| | | | |
Total capital share transactions | | | 34,183,122 | | | | 81,610,802 | |
| | | | |
Net increase (decrease) in net assets | | | 51,281,507 | | | | 137,662,689 | |
Net assets: | | | | | | | | |
Beginning of year | | | 262,526,909 | | | | 124,864,220 | |
| | | | |
End of year | | $ | 313,808,416 | | | $ | 262,526,909 | |
| | | | |
Undistributed net investment income included in net assets: | | | | | | | | |
End of year | | $ | 19,700,126 | | | $ | 15,889,751 | |
| | | | |
The accompanying notes are an integral part of these financial statements.
FH-22
Franklin Templeton Variable Insurance Products Trust
Notes to Financial Statements
Franklin High Income Securities Fund
1. ORGANIZATION AND SIGNIFICANT ACCOUNTING POLICIES
Franklin Templeton Variable Insurance Products Trust (Trust) is registered under the Investment Company Act of 1940, as amended, (1940 Act) as an open-end investment company, consisting of twenty separate funds. The Franklin High Income Securities Fund (Fund) is included in this report. The financial statements of the remaining funds in the Trust are presented separately. Shares of the Fund are generally sold only to insurance company separate accounts to fund the benefits of variable life insurance policies or variable annuity contracts. At December 31, 2010, 87.22% of the Fund’s shares were held through one insurance company. The Fund offers three classes of shares: Class 1, Class 2, and Class 4. Each class of shares differs by its distribution fees, voting rights on matters affecting a single class and its exchange privilege.
The following summarizes the Fund’s significant accounting policies.
a. Financial Instrument Valuation
The Fund values its investments in securities and other assets and liabilities carried at fair value daily. Fair value is the price that would be received to sell an asset or paid to transfer a liability in an orderly transaction between market participants on the measurement date. Under procedures approved by the Trust’s Board of Trustees, the Fund may utilize independent pricing services, quotations from securities and financial instrument dealers, and other market sources to determine fair value.
Equity securities listed on an exchange or on the NASDAQ National Market System are valued at the last quoted sale price or the official closing price of the day, respectively. Over-the-counter securities are valued within the range of the most recent quoted bid and ask prices. Securities that trade in multiple markets or on multiple exchanges are valued according to the broadest and most representative market. Certain equity securities are valued based upon fundamental characteristics or relationships to similar securities.
Debt securities generally trade in the over-the-counter market rather than on a securities exchange. The Fund’s pricing services use multiple valuation techniques to determine fair value. In instances where sufficient market activity exists, the pricing services may utilize a market-based approach through which quotes from market makers are used to determine fair value. In instances where sufficient market activity may not exist or is limited, the pricing services also utilize proprietary valuation models which may consider market characteristics such as benchmark yield curves, option-adjusted spreads, credit spreads, estimated default rates, coupon rates, anticipated timing of principal repayments, underlying collateral, and other unique security features in order to estimate the relevant cash flows, which are then discounted to calculate the fair value. Securities denominated in a foreign currency are converted into their U.S. dollar equivalent at the foreign exchange rate in effect at the close of the NYSE on the date that the values of the foreign debt securities are determined. Repurchase agreements are valued at cost, which approximates market value.
Certain derivative financial instruments (derivatives) trade in the over-the-counter market. The Fund’s pricing services use various techniques including industry standard option pricing models and proprietary discounted cash flow models to determine the fair value of those instruments. The Fund’s net benefit or obligation under the derivative contract, as measured by the fair market value of the contract, is included in net assets.
The Fund has procedures to determine the fair value of securities and other financial instruments for which market prices are not readily available or which may not be reliably priced. Under these procedures, the Fund primarily employs a market-based approach which may use related or comparable assets or liabilities, recent transactions, market multiples, book values, and other relevant information for the investment to determine the fair value of the investment. The Fund may also use an income-based valuation approach in which the anticipated future cash flows of the investment are discounted to calculate fair value. Discounts may also be applied due to the nature or duration of any restrictions on the disposition of the investments. Due to the inherent uncertainty of valuations of such investments, the fair values may differ significantly from the values that would have been used had an active market existed.
FH-23
Franklin Templeton Variable Insurance Products Trust
Notes to Financial Statements (continued)
Franklin High Income Securities Fund
1. ORGANIZATION AND SIGNIFICANT ACCOUNTING POLICIES (continued)
b. Foreign Currency Translation
Portfolio securities and other assets and liabilities denominated in foreign currencies are translated into U.S. dollars based on the exchange rate of such currencies against U.S. dollars on the date of valuation. The Fund may enter into foreign currency exchange contracts to facilitate transactions denominated in a foreign currency. Purchases and sales of securities, income and expense items denominated in foreign currencies are translated into U.S. dollars at the exchange rate in effect on the transaction date. Portfolio securities and assets and liabilities denominated in foreign currencies contain risks that those currencies will decline in value relative to the U.S. dollar. Occasionally, events may impact the availability or reliability of foreign exchange rates used to convert the U.S. dollar equivalent value. If such an event occurs, the foreign exchange rate will be valued at fair value using procedures established and approved by the Trust’s Board of Trustees.
The Fund does not separately report the effect of changes in foreign exchange rates from changes in market prices on securities held. Such changes are included in net realized and unrealized gain or loss from investments on the Statement of Operations.
Realized foreign exchange gains or losses arise from sales of foreign currencies, currency gains or losses realized between the trade and settlement dates on securities transactions and the difference between the recorded amounts of dividends, interest, and foreign withholding taxes and the U.S. dollar equivalent of the amounts actually received or paid. Net unrealized foreign exchange gains and losses arise from changes in foreign exchange rates on foreign denominated assets and liabilities other than investments in securities held at the end of the reporting period.
c. Joint Repurchase Agreement
The Fund may enter into a joint repurchase agreement whereby its uninvested cash balance is deposited into a joint cash account with other funds managed by the investment manager or an affiliate of the investment manager and is used to invest in one or more repurchase agreements. The value and face amount of the joint repurchase agreement are allocated to the funds based on their pro-rata interest. A repurchase agreement is accounted for as a loan by the fund to the seller, collateralized by securities which are delivered to the fund’s custodian. The market value, including accrued interest, of the initial collateralization is required to be at least 102% of the dollar amount invested by the funds, with the value of the underlying securities marked to market daily to maintain coverage of at least 100%. The joint repurchase agreement held by the Fund at year end had been entered into on December 31, 2010.
d. Derivative Financial Instruments
The Fund invested in derivatives in order to manage risk or gain exposure to various other investments or markets. Derivatives are financial contracts based on an underlying or notional amount, require no initial investment or an initial net investment that is smaller than would normally be required to have a similar response to changes in market factors, and require or permit net settlement. Derivatives contain various risks including the potential inability of the counterparty to fulfill their obligations under the terms of the contract, the potential for an illiquid secondary market, and/or the potential for market movements which expose the Fund to gains or losses in excess of the amounts shown on the Statement of Assets and Liabilities. Realized gain and loss and unrealized appreciation and depreciation on these contracts for the period are included in the Statement of Operations.
The Fund entered into forward exchange contracts primarily to manage and/or gain exposure to certain foreign currencies. A forward exchange contract is an agreement between the Fund and a counterparty to buy or sell a foreign currency for a specific exchange rate on a future date. Pursuant to the terms of the forward exchange contracts, cash or securities may be required to be deposited as collateral. Unrestricted cash may be invested according to the Fund’s investment objectives.
See Note 8 regarding other derivative information.
FH-24
Franklin Templeton Variable Insurance Products Trust
Notes to Financial Statements (continued)
Franklin High Income Securities Fund
1. ORGANIZATION AND SIGNIFICANT ACCOUNTING POLICIES (continued)
e. Senior Floating Rate Interests
Senior secured corporate loans pay interest at rates which are periodically reset by reference to a base lending rate plus a spread. These base lending rates are generally the prime rate offered by a designated U.S. bank or the London InterBank Offered Rate (LIBOR). Senior secured corporate loans often require prepayment of principal from excess cash flows or at the discretion of the borrower. As a result, actual maturity may be substantially less than the stated maturity.
Senior secured corporate loans in which the Fund invests are generally readily marketable, but may be subject to some restrictions on resale.
f. Income Taxes
It is the Fund’s policy to qualify as a regulated investment company under the Internal Revenue Code. The Fund intends to distribute to shareholders substantially all of its taxable income and net realized gains to relieve it from federal income and excise taxes. As a result, no provision for U.S. federal income taxes is required. The Fund files U.S. income tax returns as well as tax returns in certain other jurisdictions. The Fund’s application of those tax rules is subject to its understanding. The Fund records a provision for taxes in its financial statements including penalties and interest, if any, for a tax position taken on a tax return (or expected to be taken) when it fails to meet the more likely than not (a greater than 50% probability) threshold and based on the technical merits, the tax position may not be sustained upon examination by the tax authorities. As of December 31, 2010, and for all open tax years, the Fund has determined that no provision for income tax is required in the Fund’s financial statements. Open tax years are those that remain subject to examination and are based on each tax jurisdiction statute of limitation. The Fund is not aware of any tax position for which it is reasonably possible that the total amounts of unrecognized tax effects will significantly change in the next twelve months.
g. Security Transactions, Investment Income, Expenses and Distributions
Security transactions are accounted for on trade date. Realized gains and losses on security transactions are determined on a specific identification basis. Interest income and estimated expenses are accrued daily. Amortization of premium and accretion of discount on debt securities are included in interest income. Facility fees are recognized as income over the expected term of the loan. Dividend income is recorded on the ex-dividend date. Distributions to shareholders are recorded on the ex-dividend date and are determined according to income tax regulations (tax basis). Distributable earnings determined on a tax basis may differ from earnings recorded in accordance with accounting principles generally accepted in the United States of America. These differences may be permanent or temporary. Permanent differences are reclassified among capital accounts to reflect their tax character. These reclassifications have no impact on net assets or the results of operations. Temporary differences are not reclassified, as they may reverse in subsequent periods.
Common expenses incurred by the Trust are allocated among the funds based on the ratio of net assets of each fund to the combined net assets of the Trust. Fund specific expenses are charged directly to the fund that incurred the expense.
Realized and unrealized gains and losses and net investment income, not including class specific expenses, are allocated daily to each class of shares based upon the relative proportion of net assets of each class. Differences in per share distributions, by class, are generally due to differences in class specific expenses.
h. Accounting Estimates
The preparation of financial statements in accordance with accounting principles generally accepted in the United States of America requires management to make estimates and assumptions that affect the reported amounts of assets and liabilities at the date of the financial statements and the amounts of income and expenses during the reporting period. Actual results could differ from those estimates.
FH-25
Franklin Templeton Variable Insurance Products Trust
Notes to Financial Statements (continued)
Franklin High Income Securities Fund
1. ORGANIZATION AND SIGNIFICANT ACCOUNTING POLICIES (continued)
i. Guarantees and Indemnifications
Under the Trust’s organizational documents, its officers and trustees are indemnified by the Trust against certain liabilities arising out of the performance of their duties to the Trust. Additionally, in the normal course of business, the Trust, on behalf of the Fund, enters into contracts with service providers that contain general indemnification clauses. The Trust’s maximum exposure under these arrangements is unknown as this would involve future claims that may be made against the Trust that have not yet occurred. Currently, the Trust expects the risk of loss to be remote.
2. SHARES OF BENEFICIAL INTEREST
At December 31, 2010, there were an unlimited number of shares authorized (without par value). Transactions in the Fund’s shares were as follows:
| | | | | | | | | | | | | | | | |
| | | Year Ended December 31, | |
| | | 2010 | | | 2009 | |
| Class 1 Shares: | | Shares | | | Amount | | | Shares | | | Amount | |
Shares sold | | | 472,188 | | | $ | 3,062,794 | | | | 682,625 | | | $ | 3,526,494 | |
Shares issued in reinvestment of distributions | | | 533,249 | | | | 3,172,829 | | | | 549,427 | | | | 2,944,930 | |
Shares redeemed | | | (1,559,378 | ) | | | (9,945,947 | ) | | | (1,598,576 | ) | | | (8,499,527 | ) |
| | | | |
Net increase (decrease) | | | (553,941 | ) | | $ | (3,710,324 | ) | | | (366,524 | ) | | $ | (2,028,103 | ) |
| | | | |
Class 2 Shares: | | | | | | | | | | | | | | | | |
Shares sold | | | 12,032,804 | | | $ | 75,255,716 | | | | 22,446,477 | | | $ | 116,193,323 | |
Shares issued in reinvestment of distributions | | | 2,133,845 | | | | 12,418,978 | | | | 2,046,285 | | | | 10,742,997 | |
Shares redeemed | | | (9,532,012 | ) | | | (59,306,272 | ) | | | (10,479,398 | ) | | | (53,967,404 | ) |
| | | | |
Net increase (decrease) | | | 4,634,637 | | | $ | 28,368,422 | | | | 14,013,364 | | | $ | 72,968,916 | |
| | | | |
Class 4 Shares: | | | | | | | | | | | | | | | | |
Shares sold | | | 1,337,992 | | | $ | 8,481,976 | | | | 1,889,708 | | | $ | 10,380,779 | |
Shares issued on reinvestment of distributions | | | 235,968 | | | | 1,394,573 | | | | 88,329 | | | | 471,677 | |
Shares redeemed | | | (55,035 | ) | | | (351,525 | ) | | | (32,164 | ) | | | (182,467 | ) |
| | | | |
Net increase (decrease) | | | 1,518,925 | | | $ | 9,525,024 | | | | 1,945,873 | | | $ | 10,669,989 | |
| | | | |
3. TRANSACTIONS WITH AFFILIATES
Franklin Resources, Inc. is the holding company for various subsidiaries that together are referred to as Franklin Templeton Investments. Certain officers and trustees of the Fund are also officers and/or directors of the following subsidiaries:
| | |
| Subsidiary | | Affiliation |
Franklin Advisers, Inc. (Advisers) | | Investment manager |
Franklin Templeton Services, LLC (FT Services) | | Administrative manager |
Franklin Templeton Distributors, Inc. (Distributors) | | Principal underwriter |
Franklin Templeton Investor Services, LLC (Investor Services) | | Transfer agent |
FH-26
Franklin Templeton Variable Insurance Products Trust
Notes to Financial Statements (continued)
Franklin High Income Securities Fund
2. SHARES OF BENEFICIAL INTEREST (continued)
a. Management Fees
The Fund pays an investment management fee to Advisers based on the average daily net assets of the Fund as follows:
| | |
| Annualized Fee Rate | | Net Assets |
| 0.625% | | Up to and including $100 million |
| 0.500% | | Over $100 million, up to and including $250 million |
| 0.450% | | Over $250 million, up to and including $7.5 billion |
| 0.440% | | Over $7.5 billion, up to and including $10 billion |
| 0.430% | | Over $10 billion, up to and including $12.5 billion |
| 0.420% | | Over $12.5 billion, up to and including $15 billion |
| 0.400% | | In excess of $15 billion |
b. Administrative Fees
Under an agreement with Advisers, FT Services provides administrative services to the Fund. The fee is paid by Advisers based on average daily net assets, and is not an additional expense of the Fund.
c. Distribution Fees
The Trust’s Board of Trustees has adopted distribution plans for Class 2 and Class 4 shares pursuant to Rule 12b-1 under the 1940 Act. Under the Fund’s compensation distribution plans, the Fund pays Distributors for costs incurred in connection with the servicing, sale and distribution of the Fund’s shares up to 0.35% per year of its average daily net assets of each class. The Board of Trustees has agreed to limit the current rate to 0.25% per year for Class 2.
d. Transfer Agent Fees
Investor Services, under terms of an agreement, performs shareholder servicing for the Fund and is not paid by the Fund for the services.
4. EXPENSE OFFSET ARRANGEMENT
The Fund has entered into an arrangement with its custodian whereby credits realized as a result of uninvested cash balances are used to reduce a portion of the Fund’s custodian expenses. During the year ended December 31, 2010, there were no credits earned.
5. INCOME TAXES
For tax purposes, capital losses may be carried over to offset future capital gains, if any. At December 31, 2010, the capital loss carryforwards were as follows:
| | | | |
Capital loss carryforwards expiring in: | | | | |
2011 | | $ | 24,711,916 | |
2012 | | | 9,009,590 | |
2013 | | | 6,321,190 | |
2014 | | | 40,420 | |
2015 | | | 4,493,289 | |
2016 | | | 8,150,741 | |
2017 | | | 10,621,353 | |
| | | | |
| | $ | 63,348,499 | |
| | | | |
FH-27
Franklin Templeton Variable Insurance Products Trust
Notes to Financial Statements (continued)
Franklin High Income Securities Fund
5. INCOME TAXES (continued)
During the year ended December 31, 2010, the Fund utilized $7,795,851 of capital loss carryforwards.
On December 31, 2010, the Fund had expired capital loss carryforwards of $38,570,463, which were reclassified to paid-in capital.
The tax character of distributions paid during the years ended December 31, 2010 and 2009, was as follows:
| | | | | | | | |
| | | 2010 | | | 2009 | |
Distributions paid from ordinary income | | $ | 16,986,380 | | | $ | 14,159,604 | |
At December 31, 2010, the cost of investments, net unrealized appreciation (depreciation), and undistributed ordinary income for income tax purposes were as follows:
| | | | |
Cost of investments | | $ | 298,841,488 | |
| | | | |
| |
Unrealized appreciation | | $ | 18,123,255 | |
Unrealized depreciation | | | (7,302,619 | ) |
| | | | |
Net unrealized appreciation (depreciation) | | $ | 10,820,636 | |
| | | | |
Distributable earnings - undistributed ordinary income | | $ | 20,429,128 | |
| | | | |
Net investment income (loss) differs for financial statement and tax purposes primarily due to differing treatments of defaulted securities, foreign currency transactions, payments-in-kind, and bond discounts and premiums.
Net realized gains (losses) differ for financial statement and tax purposes primarily due to differing treatments of wash sales, defaulted securities, foreign currency transactions, payments-in-kind, and bond discounts and premiums.
6. INVESTMENT TRANSACTIONS
Purchases and sales of investments (excluding short term securities) for the year ended December 31, 2010, aggregated $182,370,845 and $157,663,796, respectively.
7. CREDIT RISK AND DEFAULTED SECURITIES
At December 31, 2010, the Fund had 91.08% of its portfolio invested in high yield, senior secured floating rate notes, or other securities rated below investment grade. These securities may be more sensitive to economic conditions causing greater price volatility and are potentially subject to a greater risk of loss due to default than higher rated securities.
The Fund held defaulted securities and/or other securities for which the income has been deemed uncollectible. At December 31, 2010, the aggregate value of these securities represents less than 0.05% of the Fund’s net assets. The Fund discontinues accruing income on securities for which income has been deemed uncollectible and provides an estimate for losses on interest receivable. The securities have been identified on the accompanying Statement of Investments.
FH-28
Franklin Templeton Variable Insurance Products Trust
Notes to Financial Statements (continued)
Franklin High Income Securities Fund
8. OTHER DERIVATIVE INFORMATION
At December 31, 2010, the Fund has invested in derivative contracts which are reflected on the Statement of Assets and Liabilities as follows:
| | | | | | | | | | | | |
| | | Asset Derivatives | | | Liability Derivatives | |
Derivative Contracts Not Accounted
for as Hedging Instruments | | Statement of Assets and
Liabilities Location | | Fair
Value
Amount | | | Statement of Assets and
Liabilities Location | | Fair
Value
Amount | |
Foreign exchange contracts | | Unrealized appreciation on forward exchange contracts | | $ | — | | | Unrealized depreciation on forward exchange contracts | | $ | 924 | |
For the year ended December 31, 2010, the effect of derivative contracts on the Fund’s Statement of Operations was as follows:
| | | | | | | | | | | | | | |
Derivative Contracts Not
Accounted
for as Hedging Instruments | | Statement of Operations Locations | | Realized Gain
(Loss) for the
Year | | | Change in Unrealized
Appreciation (Depreciation)
for the Year | | | Average Amount
Outstanding
During the Yeara | |
Foreign exchange contracts | | Net realized gain (loss) from foreign currency transactions / Net change in unrealized appreciation (depreciation) on translation of other assets and liabilities denominated in foreign currencies | | $ | 47,207 | | | $ | (12,138 | ) | | | 522,504 | |
aRepresents the average notional amount for other derivative contracts outstanding during the year. For derivative contracts denominated in foreign currencies, notional amounts are converted into U.S. dollars.
See Note 1(d) regarding derivative financial instruments.
9. CREDIT FACILITY
The Fund, together with other U.S. registered and foreign investment funds (collectively “Borrowers”), managed by Franklin Templeton Investments, are borrowers in a joint syndicated senior unsecured credit facility totaling $750 million (Global Credit Facility) which matures on January 21, 2011. This Global Credit Facility provides a source of funds to the Borrowers for temporary and emergency purposes, including the ability to meet future unanticipated or unusually large redemption requests.
Under the terms of the Global Credit Facility, the Fund shall, in addition to interest charged on any borrowings made by the Fund and other costs incurred by the Fund, pay its share of fees and expenses incurred in connection with the implementation and maintenance of the Global Credit Facility, based upon its relative share of the aggregate net assets of all of the Borrowers, including an annual commitment fee of 0.10% based upon the unused portion of the Global Credit Facility, which is reflected in other expenses on the Statement of Operations. During the year ended December 31, 2010, the Fund did not use the Global Credit Facility.
Effective January 21, 2011, the Borrowers renewed the Global Credit Facility for a total of $750 million, maturing January 20, 2012.
10. FAIR VALUE MEASUREMENTS
The Fund follows a fair value hierarchy that distinguishes between market data obtained from independent sources (observable inputs) and the Fund’s own market assumptions (unobservable inputs). These inputs are used in determining the value of the Fund’s investments and are summarized in the following fair value hierarchy:
| | • | | Level 1 – quoted prices in active markets for identical securities |
FH-29
Franklin Templeton Variable Insurance Products Trust
Notes to Financial Statements (continued)
Franklin High Income Securities Fund
10. FAIR VALUE MEASUREMENTS (continued)
| | • | | Level 2 – other significant observable inputs (including quoted prices for similar securities, interest rates, prepayment speed, credit risk, etc.) |
| | • | | Level 3 – significant unobservable inputs (including the Fund’s own assumptions in determining the fair value of investments) |
The inputs or methodology used for valuing securities are not an indication of the risk associated with investing in those securities.
For movements between the levels within the fair value hierarchy, the Fund has adopted a policy of recognizing the transfers as of the date of the underlying event which caused the movement.
The following is a summary of the inputs used as of December 31, 2010, in valuing the Fund’s assets and liabilities carried at fair value:
| | | | | | | | | | | | | | | | |
| | | Level 1 | | | Level 2 | | | Level 3 | | | Total | |
| | | | |
Assets: | | | | | | | | | | | | | | | | |
Investments in Securities: | | | | | | | | | | | | | | | | |
Equity Investments:a | | | | | | | | | | | | | | | | |
Diversified Financials | | $ | — | | | $ | 519,836 | | | $ | — | | | $ | 519,836 | |
Media | | | 208,201 | | | | — | | | | — | | | | 208,201 | |
Corporate Bonds | | | — | | | | 286,862,735 | | | | 191 | | | | 286,862,926 | |
Senior Floating Rate Interests | | | — | | | | 1,988,475 | | | | — | | | | 1,988,475 | |
Short Term Investments | | | — | | | | 20,082,686 | | | | — | | | | 20,082,686 | |
| | | | |
Total Investments in Securities | | $ | 208,201 | | | $ | 309,453,732 | | | $ | 191 | | | $ | 309,662,124 | |
| | | | |
Liabilities: | | | | | | | | | | | | | | | | |
Forward Exchange Contracts | | | — | | | | 924 | | | | — | | | | 924 | |
aIncludes common and preferred stocks.
11. SUBSEQUENT EVENTS
The Fund has evaluated subsequent events through the issuance of the financial statements and determined that no events have occurred that require disclosure other than those already disclosed in the financial statements.
| | | | |
ABBREVIATIONS | | | | |
| Counterparty | | Currency | | Selected Portfolio |
| | | | |
| DBAB - Deutsche Bank AG | | EUR - Euro | | FRN - Floating Rate Note |
| | | | PIK - Payment-In-Kind |
FH-30
Franklin Templeton Variable Insurance Products Trust
Franklin High Income Securities Fund
Report of Independent Registered Public Accounting Firm
To the Board of Trustees and Shareholders of Franklin Templeton Variable Insurance Products Trust
In our opinion, the accompanying statement of assets and liabilities, including the statement of investments, and the related statements of operations and of changes in net assets and the financial highlights present fairly, in all material respects, the financial position of Franklin High Income Securities Fund (the “Fund”) at December 31, 2010, the results of its operations for the year then ended, the changes in its net assets for each of the two years in the period then ended and the financial highlights for each of the periods presented, in conformity with accounting principles generally accepted in the United States of America. These financial statements and financial highlights (hereafter referred to as “financial statements”) are the responsibility of the Fund’s management. Our responsibility is to express an opinion on these financial statements based on our audits. We conducted our audits of these financial statements in accordance with the standards of the Public Company Accounting Oversight Board (United States). Those standards require that we plan and perform the audit to obtain reasonable assurance about whether the financial statements are free of material misstatement. An audit includes examining, on a test basis, evidence supporting the amounts and disclosures in the financial statements, assessing the accounting principles used and significant estimates made by management, and evaluating the overall financial statement presentation. We believe that our audits, which included confirmation of securities at December 31, 2010 by correspondence with the custodian and brokers, provide a reasonable basis for our opinion.
PricewaterhouseCoopers LLP
San Francisco, California
February 10, 2011
FH-31
FRANKLIN INCOME SECURITIES FUND
This annual report for Franklin Income Securities Fund covers the fiscal year ended December 31, 2010.
Performance Summary as of 12/31/10
Average annual total return of Class 4 shares* represents the average annual change in value, assuming reinvestment of dividends and capital gains. Average returns smooth out variations in returns, which can be significant; they are not the same as year-by-year results.
Periods ended 12/31/10
| | | | | | | | | | | | |
| | | 1-Year | | | 5-Year | | | 10-Year | |
Average Annual Total Return | | | +12.54% | | | | +5.72% | | | | +7.39% | |
*For the period beginning 2/29/08, Class 4 performance reflects a 12b-1 fee expense of 0.35% per year, which affects future performance. Class 4 performance prior to 2/29/08 reflects historical Class 1 performance, which does not have a 12b-1 fee expense. Since 2/29/08 (effective date), the average annual total return of Class 4 shares was +4.01%.
Total Return Index Comparison
for a Hypothetical $10,000 Investment (1/1/01–12/31/10)
The graph below shows the change in value of a hypothetical $10,000 investment in the Fund over the indicated period and includes reinvestment of any income or distributions. The Fund’s performance* is compared to the performance of the Standard & Poor’s 500 Index (S&P 500) and the Barclays Capital (BC) U.S. Aggregate Index. One cannot invest directly in an index, and an index is not representative of the Fund’s portfolio. Please see Important Notes to Performance Information preceding the Fund Summaries.
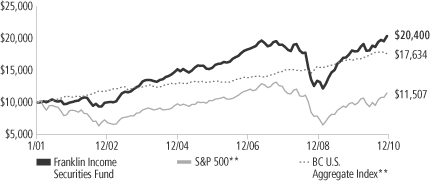
**Source: © 2011 Morningstar. Please see Index Descriptions following the Fund Summaries.
Franklin Income Securities Fund – Class 4
Performance reflects the Fund’s Class 4 operating expenses, but does not include any contract fees, expenses or sales charges. If they had been included, performance would be lower. These charges and deductions, particularly for variable life policies, can have a significant effect on contract values and insurance benefits. See the contract prospectus for a complete description of these expenses, including sales charges.
Performance data represent past performance, which does not guarantee future results. Investment return and principal value will fluctuate, and you may have a gain or loss when you sell your shares.
Current performance may differ from figures shown.
FI-1
Fund Goal and Main Investments: Franklin Income Securities Fund seeks to maximize income while maintaining prospects for capital appreciation. The Fund normally invests in equity and debt securities.
Performance Overview
You can find the Fund’s one-year total return in the Performance Summary. The Fund underperformed its equity benchmark, the S&P 500, which posted a +15.06% total return, and outperformed its fixed income benchmark, the BC U.S. Aggregate Index, which produced a +6.54% total return for the same period.1
Economic and Market Overview
During the 12-month period ended December 31, 2010, the U.S. economy grew unevenly, supported by a combination of fundamental business improvement and government intervention. Economic activity as measured by gross domestic product expanded at an annualized 3.7% pace in 2010’s first quarter and then downshifted to 1.7% annualized in the second quarter. Consumer spending picked up, likely due to pent-up post-recession demand, and the pace of growth rose at annualized rates of 2.6% in the third quarter and an estimated 3.2% in the fourth quarter.
Challenges such as mixed economic data, elevated debt concerns surrounding the U.S. budget deficit and a lack of job prospects for the unemployed hindered consumer confidence and the economy’s advance. During the early part of the annual period, home prices rose in many regions due to low interest rates, a first-time homebuyer tax credit program, and prices dipping to levels that lured buyers. Later in the period, home sales stalled as the homebuyer tax credit program ended, foreclosures mounted and the housing sector remained weak.
Amid signs of a demand-led recovery, crude oil prices rose from $79 per barrel at the end of December 2009 to a then 17-month high of $87 in early April. But as doubts surfaced about the recovery’s sustainability, oil prices dipped to $66 in late May. Prices rebounded to $91 per barrel by the end of December 2010 largely due to accelerating global demand. The pace of inflation slowed during the year, and in December 2010 the inflation rate was an annualized 1.5%.2 Similarly, core inflation, which excludes volatile food and energy costs, slowed to a 0.8%
1. Source: © 2011 Morningstar. One cannot invest directly in an index, and an index is not representative of the Fund’s portfolio. Please see Index Descriptions following the Fund Summaries.
2. Source: Bureau of Labor Statistics.
Fund Risks: The Fund’s investments in stocks may offer the potential for long-term gains but can be subject to short-term price fluctuations. Changes in the financial strength of a debt issuer or in the rating of its securities may affect the securities’ value and, as a result, impact Fund performance. Because the Fund invests in bonds and other debt obligations, its share price and yield will be affected by interest rate movements. Bond prices generally move in the opposite direction of interest rates. Thus, as prices of bonds in the Fund adjust to a rise in interest rates, the Fund’s share price may decline. The Fund may invest all of its assets in high yield, lower rated (junk) bonds, which generally have greater price swings and higher risk of default and loss of principal than investment-grade bonds. The Fund may from time to time have significant investments in particular sectors, such as utilities, which can be highly volatile. Foreign investing involves additional risks, including currency fluctuations, economic instability, market volatility, and political and social instability. Derivative instruments may be volatile and illiquid, may give rise to leverage and may involve a small investment relative to the risk assumed. The manager applies various techniques and analyses in making investment decisions for the Fund, but there can be no guarantee that these decisions will produce the desired results. The Fund’s prospectus also includes a description of the main investment risks.
FI-2
annualized rate.2 Companies added jobs throughout the period, and the unemployment rate fell from 10.0% in December 2009 to 9.4% at period-end.2 The decline was attributable in part to a shrinking labor force as some unemployed workers stopped looking for jobs.
Given few inflationary pressures and uncertainty surrounding the economic recovery, the Federal Open Market Committee (FOMC) made no major changes to its monetary policy for most of the period. The FOMC repeatedly stated it would keep the federal funds target rate within the exceptionally low 0% to 0.25% range “for an extended period” and eventually shifted its focus to its outlook and the status of its current holdings. In September, the FOMC revealed concerns about the subdued recovery and said inflation was below the pace “consistent with its mandate.” Having already lowered interest rates effectively to zero, the FOMC announced its intention to purchase government securities to stimulate the economy and promote a low level of inflation consistent with healthy economic growth.
Investor confidence shifted with each release of encouraging or discouraging economic, regulatory and political news, stoking considerable volatility among equities. Ultimately, stock indexes posted solid gains during the 12 months under review as investor risk aversion began to subside amid generally improving economic signs and rising consumer spending. Overall, the blue-chip stocks of the Dow Jones Industrial Average delivered a +14.06% total return, while the broader S&P 500 posted a +15.06% total return and the technology-heavy NASDAQ Composite Index produced a total return of +18.02%.1 During the period, growth stocks outperformed their value counterparts. Performance among the major sectors was positive, with consumer discretionary, industrials and materials making the largest gains, while health care and utilities had weaker results.
At times during the year, wary investors favored short-term Treasuries, and Treasury yields dipped to very low levels during the year. Late in the year, encouraging corporate earnings reports, the prospect of Federal Reserve Board intervention and extension of Bush-era tax cuts, boosted investor confidence and fueled an equity market rally, which dampened Treasury prices. For the 12 months under review, however, Treasury prices rose and yields declined, reflecting general investor uncertainty. The two-year Treasury bill yield decreased from 1.14% to 0.61% over the 12-month period, while the 10-year Treasury note yield fell from 3.85% to 3.30%.
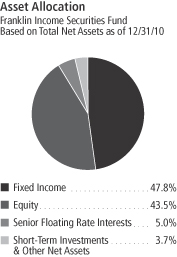
FI-3
Corporate bonds performed well during the year as many companies’ fundamentals were strong. In addition, many investors looked to the high yield market for its premium yield relative to other fixed income alternatives. This demand allowed many corporations to refinance near-term debt maturities and thereby stabilize or improve their balance sheets. In addition, earnings results for most sectors improved year-over-year, further strengthening many issuers’ fundamentals. Investment-grade corporate bond spreads fell from 172 basis points (bps; 100 basis points equal one percentage point) at the beginning of the year to 156 bps on December 31, 2010, while high yield corporate bond credit spreads declined from 634 bps to 571 bps.3
Investment Strategy
We search for undervalued or out-of-favor securities we believe offer opportunities for income today and growth tomorrow. We generally perform independent analysis of the debt securities being considered for the Fund’s portfolio, rather than relying principally on ratings assigned by rating agencies. In analyzing debt and equity securities, we consider a variety of factors, including: a security’s relative value based on such factors as anticipated cash flow, interest or dividend coverage, asset coverage, and earnings prospects; the experience and strength of a company’s management; a company’s sensitivity to changes in interest rates and business conditions; a company’s debt maturity schedules and borrowing requirements; and a company’s changing financial condition and market recognition of the change.
Manager’s Discussion
During the period, the Fund benefited from strong performance from both equity and fixed income securities. The Fund’s overall asset allocation gradually shifted as we reduced fixed income exposure and increased exposure to equities. At period-end, the Fund held 47.8% of total net assets in fixed income securities, 43.5% in equity securities, 5.0% in senior floating rate investments and 3.7% in cash equivalents. As of December 31, 2009, the Fund held 52.8% of total net assets in fixed income securities, 34.6% in equity securities, 5.8% in senior floating rate investments and 6.8% in cash equivalents.
3. Sources: Barclays Capital; Credit Suisse.
Top Five Equity Holdings
Franklin Income Securities Fund
12/31/10
| | | | |
Company Sector/Industry | | % of Total
Net Assets | |
| Exxon Mobil Corp. | | | 2.0% | |
| Energy | | | | |
| Merck & Co. Inc. | | | 1.7% | |
| Health Care | | | | |
| Roche Holding AG (Switzerland) | | | 1.5% | |
| Health Care | | | | |
| The Southern Co. | | | 1.4% | |
| Utilities | | | | |
| ConocoPhillips | | | 1.2% | |
| Energy | | | | |
Top Five Fixed Income and Senior Floating Rate Interests Holdings*
Franklin Income Securities Fund
12/31/10
| | | | |
Issuer Sector/Industry | | % of Total
Net Assets | |
| CIT Group Inc. | | | 4.2% | |
| Financials | | | | |
| Texas Competitive Electric Holdings Co. LLC | | | 3.8% | |
| Utilities | | | | |
| First Data Corp. | | | 3.4% | |
| Information Technology | | | | |
| Freescale Semiconductor Inc. | | | 2.4% | |
| Information Technology | | | | |
| Tenet Healthcare Corp. | | | 1.6% | |
| Health Care | | | | |
*Does not include convertible bonds.
The dollar value, number of shares or principal amount, and names of all portfolio holdings are listed in the Fund’s Statement of Investments (SOI).
FI-4
Among equity holdings, major contributors to performance in 2010 included the energy, financials and utilities sectors. Energy sector positions ConocoPhillips, Exxon Mobil and Spectra Energy helped results. Financials sector contributors included iStar Financial (sold by period-end), Wells Fargo and Citigroup, while in the utilities sector, The Southern Co. performed well. Newmont Mining and Barrick Gold in the materials sector also aided Fund returns. Conversely, Dex One, the successor company to publishing solutions provider R. H. Donnelley, was a significant detractor from performance among equity investments.
Significant fixed income contributors to performance included holdings in the information technology, financials and energy sectors. Individual contributors to performance included high yield bonds from Freescale Semiconductor, CIT Group, First Data and Ford Motor Credit Company (FMCC). In contrast, electric utilities including Energy Future Holdings and Dynegy detracted from performance largely due to the negative impact of lower power prices on profitability.
We increased the Fund’s exposure to several equity sectors during the year, with some of the largest increases to energy, health care and telecommunication services. In the energy sector, we increased holdings in integrated oil companies Exxon Mobil and ConocoPhillips and independent oil and gas producers Chesapeake Energy and Sandridge Energy. We initiated positions in integrated oil holding BP (U.K.) and oilfield services companies Schlumberger and Baker Hughes. We initiated a new health care position in Roche Holding (Switzerland) and added to Pfizer because we believed the companies offered a combination of attractive dividends and valuations. We increased the telecommunication services sector’s international exposure by adding to our existing position in Vodafone Group (U.K.) and initiating a new position in Telstra (Australia).
Within fixed income, we reduced holdings in communications, consumer non-cyclical and consumer cyclical companies and increased holdings in financials and information technology.4 Within financials, we initiated a position in bank holding company CIT Group. In information technology, we added investments across electronic payment company First Data’s capital structure by purchasing bank debt and subordinated debt securities.
4. Communications fixed income holdings are in telecommunication services in the SOI. Consumer non-cyclical holdings include consumer discretionary and telecommunication services holdings in the SOI. Consumer cyclical holdings include consumer discretionary and industrials holdings in the SOI.
FI-5
Thank you for your participation in Franklin Income Securities Fund. We look forward to serving your future investment needs.
The foregoing information reflects our analysis, opinions and portfolio holdings as of December 31, 2010, the end of the reporting period. The way we implement our main investment strategies and the resulting portfolio holdings may change depending on factors such as market and economic conditions. These opinions may not be relied upon as investment advice or an offer for a particular security. The information is not a complete analysis of every aspect of any market, country, industry, security or the Fund. Statements of fact are from sources considered reliable, but the investment manager makes no representation or warranty as to their completeness or accuracy. Although historical performance is no guarantee of future results, these insights may help you understand our investment management philosophy.
FI-6
Fund Expenses
As an investor in a variable insurance contract (Contract) that indirectly provides for investment in an underlying mutual fund, you can incur transaction and/or ongoing expenses at both the Fund level and the Contract level.
| • | | Transaction expenses can include sales charges (loads) on purchases, redemption fees, surrender fees, transfer fees and premium taxes. |
| • | | Ongoing expenses can include management fees, distribution and service (12b-1) fees, contract fees, annual maintenance fees, mortality and expense risk fees and other fees and expenses. All mutual funds and Contracts have some types of ongoing expenses. |
The expenses shown in the table are meant to highlight ongoing expenses at the Fund level only and do not include ongoing expenses at the Contract level, or transaction expenses at either the Fund or Contract level. While the Fund does not have transaction expenses, if the transaction and ongoing expenses at the Contract level were included, the expenses shown would be higher. You should consult your Contract prospectus or disclosure document for more information.
The table shows Fund-level ongoing expenses and can help you understand these expenses and compare them with those of other mutual funds offered through the Contract. The table assumes a $1,000 investment held for the six months indicated. Please refer to the Fund prospectus for additional information on operating expenses.
Actual Fund Expenses
The first line (Actual) of the table provides actual account values and expenses. The “Ending Account Value” is derived from the Fund’s actual return, which includes the effect of ongoing Fund expenses, but does not include the effect of ongoing Contract expenses.
You can estimate the Fund-level expenses you incurred during the period by following these steps. Of course, your account value and expenses will differ from those in this illustration:
| 1. | Divide your account value by $1,000. |
If an account had an $8,600 value, then $8,600 ÷ $1,000 = 8.6.
| 2. | Multiply the result by the number under the heading “Fund-Level Expenses Incurred During Period.” |
If Fund-Level Expenses Incurred During Period were $7.50, then 8.6 x $7.50 = $64.50.
In this illustration, the estimated expenses incurred this period at the Fund level are $64.50.
Franklin Income Securities Fund – Class 4
FI-7
Hypothetical Example for Comparison with Other Mutual Funds
Information in the second line (Hypothetical) of the table can help you compare ongoing expenses of the Fund with those of other mutual funds offered through the Contract. This information may not be used to estimate the actual ending account balance or expenses you incurred during the period. The hypothetical “Ending Account Value” is based on the Fund’s actual expense ratio and an assumed 5% annual rate of return before expenses, which does not represent the Fund’s actual return. The figure under the heading “Fund-Level Expenses Incurred During Period” shows the hypothetical expenses your account would have incurred under this scenario. You can compare this figure with the 5% hypothetical examples that appear in shareholder reports of other funds offered through a Contract.
| | | | | | | | | | | | |
| Class 4 | | Beginning
Account Value 7/1/10 | | | Ending
Account
Value 12/31/10 | | | Fund-Level
Expenses Incurred
During Period*
7/1/10–12/31/10 | |
Actual | | $ | 1,000 | | | $ | 1,125.70 | | | $ | 4.45 | |
Hypothetical (5% return before expenses) | | $ | 1,000 | | | $ | 1,021.02 | | | $ | 4.23 | |
*Expenses are calculated using the most recent six-month annualized expense ratio for the Fund’s Class 4 shares (0.83%), which does not include any ongoing expenses of the Contract for which the Fund is an investment option, multiplied by the average account value over the period, multiplied by 184/365 to reflect the one-half year period.
FI-8
Franklin Templeton Variable Insurance Products Trust
Financial Highlights
Franklin Income Securities Fund
| | | | | | | | | | | | | | | | | | | | |
| | | Year Ended December 31, | |
| Class 1 | | 2010 | | | 2009 | | | 2008 | | | 2007 | | | 2006 | |
| | | | |
Per share operating performance | | | | | | | | | | | | | | | | | | | | |
(for a share outstanding throughout the year) | | | | | | | | | | | | | | | | | | | | |
Net asset value, beginning of year | | $ | 14.43 | | | $ | 11.53 | | | $ | 17.63 | | | $ | 17.65 | | | $ | 15.56 | |
| | | | |
Income from investment operationsa: | | | | | | | | | | | | | | | | | | | | |
Net investment incomeb | | | 0.89 | | | | 0.91 | | | | 1.10 | | | | 1.03 | | | | 0.94 | |
Net realized and unrealized gains (losses) | | | 0.85 | | | | 3.08 | | | | (5.99 | ) | | | (0.31 | ) | | | 1.85 | |
| | | | |
Total from investment operations | | | 1.74 | | | | 3.99 | | | | (4.89 | ) | | | 0.72 | | | | 2.79 | |
| | | | |
Less distributions from: | | | | | | | | | | | | | | | | | | | | |
Net investment income | | | (1.01 | ) | | | (1.09 | ) | | | (0.86 | ) | | | (0.63 | ) | | | (0.62 | ) |
Net realized gains | | | — | | | | — | | | | (0.35 | ) | | | (0.11 | ) | | | (0.08 | ) |
| | | | |
Total distributions | | | (1.01 | ) | | | (1.09 | ) | | | (1.21 | ) | | | (0.74 | ) | | | (0.70 | ) |
| | | | |
Net asset value, end of year | | $ | 15.16 | | | $ | 14.43 | | | $ | 11.53 | | | $ | 17.63 | | | $ | 17.65 | |
| | | | |
| | | | | |
Total returnc | | | 12.87% | | | | 35.88% | | | | (29.41)% | | | | 4.01% | | | | 18.47% | |
Ratios to average net assets | | | | | | | | | | | | | | | | | | | | |
Expensesd | | | 0.47% | | | | 0.47% | | | | 0.47% | | | | 0.47% | | | | 0.47% | |
Net investment income | | | 6.28% | | | | 7.23% | | | | 7.28% | | | | 5.77% | | | | 5.70% | |
| | | | | |
Supplemental data | | | | | | | | | | | | | | | | | | | | |
Net assets, end of year (000’s) | | $ | 1,449,028 | | | $ | 910,504 | | | $ | 433,370 | | | $ | 455,932 | | | $ | 458,613 | |
Portfolio turnover rate | | | 41.65% | | | | 42.30% | | | | 43.89% | | | | 32.11% | | | | 25.05% | |
aThe amount shown for a share outstanding throughout the period may not correlate with the Statement of Operations for the period due to the timing of sales and repurchases of the Fund shares in relation to income earned and/or fluctuating market value of the investments of the Fund.
bBased on average daily shares outstanding.
cTotal return does not include fees, charges or expenses imposed by the variable annuity and life insurance contracts for which the Franklin Templeton Variable Insurance Products Trust serves as an underlying investment vehicle.
dBenefit of expense reduction rounds to less than 0.01%.
The accompanying notes are an integral part of these financial statements.
FI-9
Franklin Templeton Variable Insurance Products Trust
Financial Highlights (continued)
Franklin Income Securities Fund
| | | | | | | | | | | | | | | | | | | | |
| | | Year Ended December 31, | |
| Class 2 | | 2010 | | | 2009 | | | 2008 | | | 2007 | | | 2006 | |
| | | | |
Per share operating performance | | | | | | | | | | | | | | | | | | | | |
(for a share outstanding throughout the year) | | | | | | | | | | | | | | | | | | | | |
Net asset value, beginning of year | | $ | 14.12 | | | $ | 11.30 | | | $ | 17.31 | | | $ | 17.36 | | | $ | 15.32 | |
| | | | |
Income from investment operationsa: | | | | | | | | | | | | | | | | | | | | |
Net investment incomeb | | | 0.86 | | | | 0.86 | | | | 1.04 | | | | 0.97 | | | | 0.89 | |
Net realized and unrealized gains (losses) | | | 0.82 | | | | 3.01 | | | | (5.87 | ) | | | (0.30 | ) | | | 1.82 | |
| | | | |
Total from investment operations | | | 1.68 | | | | 3.87 | | | | (4.83 | ) | | | 0.67 | | | | 2.71 | |
| | | | |
Less distributions from: | | | | | | | | | | | | | | | | | | | | |
Net investment income | | | (0.98 | ) | | | (1.05 | ) | | | (0.83 | ) | | | (0.61 | ) | | | (0.59 | ) |
Net realized gains | | | — | | | | — | | | | (0.35 | ) | | | (0.11 | ) | | | (0.08 | ) |
| | | | |
Total distributions | | | (0.98 | ) | | | (1.05 | ) | | | (1.18 | ) | | | (0.72 | ) | | | (0.67 | ) |
| | | | |
Net asset value, end of year | | $ | 14.82 | | | $ | 14.12 | | | $ | 11.30 | | | $ | 17.31 | | | $ | 17.36 | |
| | | | |
| | | | | |
Total returnc | | | 12.67% | | | | 35.59% | | | | (29.66)% | | | | 3.76% | | | | 18.24% | |
Ratios to average net assets | | | | | | | | | | | | | | | | | | | | |
Expensesd | | | 0.72% | | | | 0.72% | | | | 0.72% | | | | 0.72% | | | | 0.72% | |
Net investment income | | | 6.03% | | | | 6.98% | | | | 7.03% | | | | 5.52% | | | | 5.45% | |
| | | | | |
Supplemental data | | | | | | | | | | | | | | | | | | | | |
Net assets, end of year (000’s) | | $ | 6,309,207 | | | $ | 6,114,898 | | | $ | 4,944,457 | | | $ | 7,429,064 | | | $ | 5,109,373 | |
Portfolio turnover rate | | | 41.65% | | | | 42.30% | | | | 43.89% | | | | 32.11% | | | | 25.05% | |
aThe amount shown for a share outstanding throughout the period may not correlate with the Statement of Operations for the period due to the timing of sales and repurchases of the Fund shares in relation to income earned and/or fluctuating market value of the investments of the Fund.
bBased on average daily shares outstanding.
cTotal return does not reflect sales commissions or contingent deferred sales charges, if applicable.
dBenefit of expense reduction rounds to less than 0.01%.
The accompanying notes are an integral part of these financial statements.
FI-10
Franklin Templeton Variable Insurance Products Trust
Financial Highlights (continued)
Franklin Income Securities Fund
| | | | | | | | | | | | |
| | | Year Ended December 31, | |
| Class 4 | | 2010 | | | 2009 | | | 2008a | |
| | | | |
Per share operating performance | | | | | | | | | | | | |
(for a share outstanding throughout the year) | | | | | | | | | | | | |
Net asset value, beginning of year | | $ | 14.33 | | | $ | 11.49 | | | $ | 16.90 | |
| | | | |
Income from investment operationsb: | | | | | | | | | | | | |
Net investment incomec | | | 0.85 | | | | 0.86 | | | | 0.87 | |
Net realized and unrealized gains (losses) | | | 0.84 | | | | 3.06 | | | | (5.07 | ) |
| | | | |
Total from investment operations | | | 1.69 | | | | 3.92 | | | | (4.20 | ) |
| | | | |
Less distributions from: | | | | | | | | | | | | |
Net investment income | | | (0.98 | ) | | | (1.08 | ) | | | (0.86 | ) |
Net realized gains | | | — | | | | — | | | | (0.35 | ) |
| | | | |
Total distributions | | | (0.98 | ) | | | (1.08 | ) | | | (1.21 | ) |
| | | | |
Net asset value, end of year | | $ | 15.04 | | | $ | 14.33 | | | $ | 11.49 | |
| | | | |
| | | |
Total returnd | | | 12.54% | | | | 35.37% | | | | (26.61)% | |
Ratios to average net assetse | | | | | | | | | | | | |
Expensesf | | | 0.82% | | | | 0.82% | | | | 0.82% | |
Net investment income | | | 5.93% | | | | 6.88% | | | | 6.93% | |
| | | |
Supplemental data | | | | | | | | | | | | |
Net assets, end of year (000’s) | | $ | 415,541 | | | $ | 347,733 | | | $ | 135,360 | |
Portfolio turnover rate | | | 41.65% | | | | 42.30% | | | | 43.89% | |
aFor the period February 29, 2008 (effective date) to December 31, 2008.
bThe amount shown for a share outstanding throughout the period may not correlate with the Statement of Operations for the period due to the timing of sales and repurchases of the Fund shares in relation to income earned and/or fluctuating market value of the investments of the Fund.
cBased on average daily shares outstanding.
dTotal return does not include fees, charges or expenses imposed by the variable annuity and life insurance contracts for which the Franklin Templeton Variable Insurance Products Trust serves as an underlying investment vehicle. Total return is not annualized for periods less than one year.
eRatios are annualized for periods less than one year.
fBenefit of expense reduction rounds to less than 0.01%.
The accompanying notes are an integral part of these financial statements.
FI-11
Franklin Templeton Variable Insurance Products Trust
Statement of Investments, December 31, 2010
| | | | | | | | | | | | |
| Franklin Income Securities Fund | | Country | | | Shares/
Warrants | | | Value | |
Common Stocks and Other Equity Interests 38.7% | | | | | | | | | | | | |
Consumer Discretionary 1.8% | | | | | | | | | | | | |
aCharter Communications Inc. | | | United States | | | | 1,747,500 | | | $ | 68,047,650 | |
aCharter Communications Inc., A | | | United States | | | | 316,609 | | | | 12,328,754 | |
aCharter Communications Inc., wts., 11/30/14 | | | United States | | | | 311,018 | | | | 2,565,899 | |
Comcast Corp., A | | | United States | | | | 1,035,000 | | | | 22,738,950 | |
a,bDex One Corp. | | | United States | | | | 2,642,381 | | | | 19,712,162 | |
The Home Depot Inc. | | | United States | | | | 615,800 | | | | 21,589,948 | |
a,cSuperMedia Inc., Litigation Trust | | | United States | | | | 3,472,135 | | | | 34,721 | |
| | | | | | | | | | | | |
| | | | | | | | | | | 147,018,084 | |
| | | | | | | | | | | | |
Consumer Staples 0.8% | | | | | | | | | | | | |
Diageo PLC | | | United Kingdom | | | | 1,150,000 | | | | 21,314,770 | |
PepsiCo Inc. | | | United States | | | | 672,500 | | | | 43,934,425 | |
| | | | | | | | | | | | |
| | | | | | | | | | | 65,249,195 | |
| | | | | | | | | | | | |
Energy 7.2% | | | | | | | | | | | | |
Baker Hughes Inc. | | | United States | | | | 250,000 | | | | 14,292,500 | |
BP PLC, ADR | | | United Kingdom | | | | 1,300,000 | | | | 57,421,000 | |
aCallon Petroleum Co. | | | United States | | | | 782,594 | | | | 4,632,957 | |
Canadian Oil Sands Trust | | | Canada | | | | 3,700,000 | | | | 98,139,791 | |
Chesapeake Energy Corp. | | | United States | | | | 900,000 | | | | 23,319,000 | |
Chevron Corp. | | | United States | | | | 250,000 | | | | 22,812,500 | |
ConocoPhillips | | | United States | | | | 1,500,000 | | | | 102,150,000 | |
Exxon Mobil Corp. | | | United States | | | | 2,282,350 | | | | 166,885,432 | |
dSchlumberger Ltd. | | | United States | | | | 251,000 | | | | 20,958,500 | |
Spectra Energy Corp. | | | United States | | | | 2,243,200 | | | | 56,057,568 | |
aWeatherford International Ltd. | | | United States | | | | 1,000,000 | | | | 22,800,000 | |
| | | | | | | | | | | | |
| | | | | | | | | | | 589,469,248 | |
| | | | | | | | | | | | |
Financials 4.9% | | | | | | | | | | | | |
Banco Santander SA | | | Spain | | | | 1,600,000 | | | | 16,969,092 | |
Bank of America Corp. | | | United States | | | | 5,000,000 | | | | 66,700,000 | |
Barclays PLC | | | United Kingdom | | | | 2,000,000 | | | | 8,197,028 | |
aCIT Group Inc. | | | United States | | | | 500,000 | | | | 23,550,000 | |
aCitigroup Inc. | | | United States | | | | 7,800,000 | | | | 36,894,000 | |
HSBC Holdings PLC | | | United Kingdom | | | | 3,500,000 | | | | 35,580,781 | |
JPMorgan Chase & Co. | | | United States | | | | 1,500,000 | | | | 63,630,000 | |
M&T Bank Corp. | | | United States | | | | 500,000 | | | | 43,525,000 | |
Wells Fargo & Co. | | | United States | | | | 2,750,000 | | | | 85,222,500 | |
aWestfield Retail Trust | | | Australia | | | | 6,384,600 | | | | 16,765,305 | |
| | | | | | | | | | | | |
| | | | | | | | | | | 397,033,706 | |
| | | | | | | | | | | | |
Health Care 5.0% | | | | | | | | | | | | |
Johnson & Johnson | | | United States | | | | 1,500,000 | | | | 92,775,000 | |
Merck & Co. Inc. | | | United States | | | | 3,750,000 | | | | 135,150,000 | |
Pfizer Inc. | | | United States | | | | 3,000,000 | | | | 52,530,000 | |
Roche Holding AG | | | Switzerland | | | | 850,000 | | | | 124,678,801 | |
| | | | | | | | | | | | |
| | | | | | | | | | | 405,133,801 | |
| | | | | | | | | | | | |
Industrials 0.5% | | | | | | | | | | | | |
General Electric Co. | | | United States | | | | 2,250,000 | | | | 41,152,500 | |
| | | | | | | | | | | | |
Information Technology 1.8% | | | | | | | | | | | | |
Intel Corp. | | | United States | | | | 3,000,000 | | | | 63,090,000 | |
Maxim Integrated Products Inc. | | | United States | | | | 2,500,000 | | | | 59,050,000 | |
Xerox Corp. | | | United States | | | | 850,000 | | | | 9,792,000 | |
FI-12
Franklin Templeton Variable Insurance Products Trust
Statement of Investments, December 31, 2010 (continued)
| | | | | | | | | | | | |
| Franklin Income Securities Fund | | Country | | | Shares/
Warrants | | | Value | |
Common Stocks and Other Equity Interests (continued) | | | | | | | | | | | | |
Information Technology (continued) | | | | | | | | | | | | |
Xilinx Inc. | | | United States | | | | 600,000 | | | $ | 17,388,000 | |
| | | | | | | | | | | | |
| | | | | | | | | | | 149,320,000 | |
| | | | | | | | | | | | |
Materials 1.9% | | | | | | | | | | | | |
Barrick Gold Corp. | | | Canada | | | | 1,100,000 | | | | 58,498,000 | |
dFreeport-McMoRan Copper & Gold Inc., B | | | United States | | | | 118,643 | | | | 14,247,838 | |
Newmont Mining Corp. | | | United States | | | | 1,100,000 | | | | 67,573,000 | |
Nucor Corp. | | | United States | | | | 400,000 | | | | 17,528,000 | |
| | | | | | | | | | | | |
| | | | | | | | | | | 157,846,838 | |
| | | | | | | | | | | | |
Telecommunication Services 3.0% | | | | | | | | | | | | |
AT&T Inc. | | | United States | | | | 2,500,000 | | | | 73,450,000 | |
CenturyLink Inc. | | | United States | | | | 500,000 | | | | 23,085,000 | |
Frontier Communications Corp. | | | United States | | | | 988,047 | | | | 9,613,697 | |
Telstra Corp. Ltd. | | | Australia | | | | 10,000,000 | | | | 28,506,825 | |
Verizon Communications Inc. | | | United States | | | | 1,200,000 | | | | 42,936,000 | |
Vodafone Group PLC | | | United Kingdom | | | | 27,500,000 | | | | 71,177,945 | |
| | | | | | | | | | | | |
| | | | | | | | | | | 248,769,467 | |
| | | | | | | | | | | | |
Utilities 11.8% | | | | | | | | | | | | |
AGL Resources Inc. | | | United States | | | | 550,000 | | | | 19,717,500 | |
American Electric Power Co. Inc. | | | United States | | | | 1,523,800 | | | | 54,826,324 | |
CenterPoint Energy Inc. | | | United States | | | | 850,000 | | | | 13,362,000 | |
Consolidated Edison Inc. | | | United States | | | | 750,000 | | | | 37,177,500 | |
Dominion Resources Inc. | | | United States | | | | 1,600,000 | | | | 68,352,000 | |
DTE Energy Co. | | | United States | | | | 240,000 | | | | 10,876,800 | |
Duke Energy Corp. | | | United States | | | | 5,000,000 | | | | 89,050,000 | |
Entergy Corp. | | | United States | | | | 500,000 | | | | 35,415,000 | |
FirstEnergy Corp. | | | United States | | | | 750,000 | | | | 27,765,000 | |
NextEra Energy Inc. | | | United States | | | | 1,075,000 | | | | 55,889,250 | |
NiSource Inc. | | | United States | | | | 600,000 | | | | 10,572,000 | |
PG&E Corp. | | | United States | | | | 2,000,000 | | | | 95,680,000 | |
Pinnacle West Capital Corp. | | | United States | | | | 300,000 | | | | 12,435,000 | |
PPL Corp. | | | United States | | | | 669,500 | | | | 17,621,240 | |
Progress Energy Inc. | | | United States | | | | 1,400,000 | | | | 60,872,000 | |
Public Service Enterprise Group Inc. | | | United States | | | | 2,500,000 | | | | 79,525,000 | |
Sempra Energy | | | United States | | | | 1,000,000 | | | | 52,480,000 | |
The Southern Co. | | | United States | | | | 3,000,000 | | | | 114,690,000 | |
TECO Energy Inc. | | | United States | | | | 2,500,000 | | | | 44,500,000 | |
Xcel Energy Inc. | | | United States | | | | 2,670,464 | | | | 62,889,427 | |
| | | | | | | | | | | | |
| | | | | | | | | | | 963,696,041 | |
| | | | | | | | | | | | |
Total Common Stocks and Other Equity Interests
(Cost $2,844,951,971) | | | | | | | | | | | 3,164,688,880 | |
| | | | | | | | | | | | |
eEquity-Linked Securities 1.1% | | | | | | | | | | | | |
Consumer Discretionary 0.1% | | | | | | | | | | | | |
Credit Suisse into Lowe’s Cos. Inc., 7.00% | | | United States | | | | 400,000 | | | | 9,244,000 | |
| | | | | | | | | | | | |
Energy 0.1% | | | | | | | | | | | | |
Credit Suisse into Schlumberger Ltd., 8.00% | | | United States | | | | 100,000 | | | | 7,143,000 | |
| | | | | | | | | | | | |
Financials 0.2% | | | | | | | | | | | | |
fJPMorgan Chase & Co. into Bank of America, 9.00%, 144A | | | United States | | | | 1,100,000 | | | | 15,246,000 | |
| | | | | | | | | | | | |
Information Technology 0.6% | | | | | | | | | | | | |
fThe Goldman Sachs Group Inc. into Xerox Corp., 8.00%, 144A | | | United States | | | | 1,260,000 | | | | 14,715,918 | |
FI-13
Franklin Templeton Variable Insurance Products Trust
Statement of Investments, December 31, 2010 (continued)
| | | | | | | | | | | | |
| Franklin Income Securities Fund | | Country | | | Shares/
Warrants | | | Value | |
eEquity-Linked Securities (continued) | | | | | | | | | | | | |
Information Technology (continued) | | | | | | | | | | | | |
fThe Goldman Sachs Group Inc. into Research In Motion Ltd., 8.00%, 144A | | | United States | | | | 200,000 | | | $ | 11,213,000 | |
fMorgan Stanley into Xilinx Inc., 8.00%, 144A | | | United States | | | | 906,000 | | | | 25,295,248 | |
| | | | | | | | | | | | |
| | | | | | | | | | | 51,224,166 | |
| | | | | | | | | | | | |
Utilities 0.1% | | | | | | | | | | | | |
Credit Suisse into Calpine Corp., 8.00% | | | United States | | | | 550,000 | | | | 7,041,595 | |
| | | | | | | | | | | | |
Total Equity-Linked Securities (Cost $86,864,960) | | | | | | | | | | | 89,898,761 | |
| | | | | | | | | | | | |
Convertible Preferred Stocks 3.2% | | | | | | | | | | | | |
Consumer Discretionary 0.3% | | | | | | | | | | | | |
aGeneral Motors Co., 4.75%, cvt. pfd., B | | | United States | | | | 294,300 | | | | 15,924,573 | |
aMotors Liquidation Co., 6.25%, cvt. pfd., C | | | United States | | | | 1,400,000 | | | | 11,130,000 | |
| | | | | | | | | | | | |
| | | | | | | | | | | 27,054,573 | |
| | | | | | | | | | | | |
Energy 0.7% | | | | | | | | | | | | |
fChesapeake Energy Corp., 5.75%, cvt. pfd., 144A | | | United States | | | | 30,000 | | | | 33,717,000 | |
fSandridge Energy Inc., 7.00%, cvt. pfd., 144A | | | United States | | | | 200,000 | | | | 23,995,400 | |
| | | | | | | | | | | | |
| | | | | | | | | | | 57,712,400 | |
| | | | | | | | | | | | |
Financials 1.9% | | | | | | | | | | | | |
Bank of America Corp., 7.25%, cvt. pfd., L | | | United States | | | | 86,000 | | | | 82,299,420 | |
aFannie Mae, 5.375%, cvt. pfd. | | | United States | | | | 600 | | | | 1,124,844 | |
aFannie Mae, 8.75%, cvt. pfd. | | | United States | | | | 1,060,400 | | | | 636,240 | |
aFelcor Lodging Trust Inc., 7.80%, cvt. pfd., A | | | United States | | | | 400,000 | | | | 9,960,000 | |
Wells Fargo & Co., 7.50%, cvt. pfd., A | | | United States | | | | 61,000 | | | | 61,033,550 | |
| | | | | | | | | | | | |
| | | | | | | | | | | 155,054,054 | |
| | | | | | | | | | | | |
Health Care 0.2% | | | | | | | | | | | | |
Tenet Healthcare Corp., 7.00%, cvt. pfd. | | | United States | | | | 13,500 | | | | 14,748,750 | |
| | | | | | | | | | | | |
Materials 0.1% | | | | | | | | | | | | |
Anglogold Ashanti Holdings Finance PLC, 6.00%, cvt. pfd. | | | South Africa | | | | 150,000 | | | | 8,322,000 | |
| | | | | | | | | | | | |
Total Convertible Preferred Stocks (Cost $352,403,927) | | | | | | | | | | | 262,891,777 | |
| | | | | | | | | | | | |
Preferred Stocks 0.5% | | | | | | | | | | | | |
Financials 0.5% | | | | | | | | | | | | |
aFannie Mae, 6.75%, pfd. | | | United States | | | | 500,000 | | | | 275,000 | |
aFannie Mae, 7.625%, pfd., R | | | United States | | | | 800,000 | | | | 408,000 | |
aFannie Mae, 8.25%, pfd. | | | United States | | | | 851,500 | | | | 476,840 | |
aFreddie Mac, 8.375%, pfd., Z | | | United States | | | | 1,549,200 | | | | 974,447 | |
fGMAC Inc., 7.00%, pfd., 144A | | | United States | | | | 36,265 | | | | 34,276,093 | |
| | | | | | | | | | | | |
Total Preferred Stocks (Cost $105,391,575) | | | | | | | | | | | 36,410,380 | |
| | | | | | | | | | | | |
| | | |
| | | | | | Principal
Amount* | | | | |
Convertible Bonds 0.8% | | | | | | | | | | | | |
Financials 0.8% | | | | | | | | | | | | |
CapitalSource Inc., cvt., senior sub. note, 4.00%, 7/15/34 | | | United States | | | | 15,000,000 | | | | 14,981,250 | |
giStar Financial Inc., cvt., senior note, FRN, 0.79%, 10/01/12 | | | United States | | | | 57,500,000 | | | | 51,175,000 | |
| | | | | | | | | | | | |
| | | | | | | | | | | 66,156,250 | |
| | | | | | | | | | | | |
Information Technology 0.0%† | | | | | | | | | | | | |
Advanced Micro Devices Inc., cvt., senior note, 6.00%, 5/01/15 | | | United States | | | | 2,383,000 | | | | 2,412,788 | |
| | | | | | | | | | | | |
Total Convertible Bonds (Cost $63,890,369) | | | | | | | | | | | 68,569,038 | |
| | | | | | | | | | | | |
FI-14
Franklin Templeton Variable Insurance Products Trust
Statement of Investments, December 31, 2010 (continued)
| | | | | | | | | | | | |
| Franklin Income Securities Fund | | Country | | | Principal
Amount* | | | Value | |
Corporate Bonds 46.1% | | | | | | | | | | | | |
Consumer Discretionary 6.3% | | | | | | | | | | | | |
Cablevision Systems Corp., senior note, | | | | | | | | | | | | |
8.625%, 9/15/17 | | | United States | | | | 5,000,000 | | | $ | 5,468,750 | |
7.75%, 4/15/18 | | | United States | | | | 35,000,000 | | | | 36,837,500 | |
8.00%, 4/15/20 | | | United States | | | | 35,000,000 | | | | 37,625,000 | |
CCH II LLC/CCH II Capital Corp., senior note, 13.50%, 11/30/16 | | | United States | | | | 42,829,272 | | | | 51,288,053 | |
CCO Holdings LLC, senior note, 8.125%, 4/30/20 | | | United States | | | | 22,200,000 | | | | 23,476,500 | |
fCequel Communications Holdings I LLC, senior note, 144A, 8.625%, 11/15/17 | | | United States | | | | 10,000,000 | | | | 10,500,000 | |
CKE Restaurants Inc., senior secured note, 11.375%, 7/15/18 | | | United States | | | | 8,500,000 | | | | 9,456,250 | |
Clear Channel Worldwide Holdings Inc., senior note, B, 9.25%, 12/15/17 | | | United States | | | | 17,000,000 | | | | 18,700,000 | |
fClubCorp Club Operations Inc., senior note, 144A, 10.00%, 12/01/18 | | | United States | | | | 15,000,000 | | | | 14,325,000 | |
b,hDex One Corp., senior sub. note, PIK, 12.00%, 1/29/17 | | | United States | | | | 32,511,674 | | | | 22,107,938 | |
EchoStar DBS Corp., senior note, 7.125%, 2/01/16 | | | United States | | | | 12,000,000 | | | | 12,450,000 | |
Ford Motor Credit Co. LLC, | | | | | | | | | | | | |
8.00%, 6/01/14 | | | United States | | | | 25,000,000 | | | | 27,563,300 | |
senior note, 7.00%, 4/15/15 | | | United States | | | | 25,000,000 | | | | 26,890,150 | |
senior note, 12.00%, 5/15/15 | | | United States | | | | 15,000,000 | | | | 18,975,000 | |
The Goodyear Tire & Rubber Co., senior note, 8.25%, 8/15/20 | | | United States | | | | 9,700,000 | | | | 10,088,000 | |
Harrah’s Operating Co. Inc., senior secured note, 11.25%, 6/01/17 | | | United States | | | | 10,000,000 | | | | 11,300,000 | |
Host Hotels & Resorts LP, senior note, T, 9.00%, 5/15/17 | | | United States | | | | 12,900,000 | | | | 14,383,500 | |
KB Home, senior note, | | | | | | | | | | | | |
5.75%, 2/01/14 | | | United States | | | | 6,500,000 | | | | 6,532,500 | |
6.25%, 6/15/15 | | | United States | | | | 15,000,000 | | | | 14,925,000 | |
7.25%, 6/15/18 | | | United States | | | | 10,600,000 | | | | 10,123,000 | |
MGM Resorts International, senior note, | | | | | | | | | | | | |
6.75%, 4/01/13 | | | United States | | | | 10,000,000 | | | | 9,990,000 | |
f144A, 10.00%, 11/01/16 | | | United States | �� | | | 20,000,000 | | | | 20,600,000 | |
f,hUnivision Communications Inc., senior note, 144A, PIK, 10.50%, 3/15/15 | | | United States | | | | 28,245,025 | | | | 29,772,601 | |
fUPC Germany GmbH, senior secured note, 144A, | | | | | | | | | | | | |
8.125%, 12/01/17 | | | Germany | | | | 6,300,000 | | | | 6,681,937 | |
8.125%, 12/01/17 | | | Germany | | | | 5,500,000 | EUR | | | 7,801,711 | |
9.625%, 12/01/19 | | | Germany | | | | 3,000,000 | EUR | | | 4,404,542 | |
Virgin Media Secured Finance, senior secured note, 7.00%, 1/15/18 | | | United Kingdom | | | | 10,000,000 | GBP | | | 16,479,085 | |
fVisant Corp., senior note, 144A, 10.00%, 10/01/17 | | | United States | | | | 32,800,000 | | | | 34,932,000 | |
| | | | | | | | | | | | |
| | | | | | | | | | | 513,677,317 | |
| | | | | | | | | | | | |
Consumer Staples 0.4% | | | | | | | | | | | | |
fDean Foods Co., senior note, 144A, 9.75%, 12/15/18 | | | United States | | | | 7,900,000 | | | | 7,998,750 | |
JBS USA LLC, senior note, 11.625%, 5/01/14 | | | United States | | | | 11,000,000 | | | | 12,897,500 | |
SUPERVALU Inc., senior note, 8.00%, 5/01/16 | | | United States | | | | 11,200,000 | | | | 10,780,000 | |
| | | | | | | | | | | | |
| | | | | | | | | | | 31,676,250 | |
| | | | | | | | | | | | |
Energy 7.9% | | | | | | | | | | | | |
Antero Resources Finance, senior note, 9.375%, 12/01/17 | | | United States | | | | 14,600,000 | | | | 15,348,250 | |
fATP Oil & Gas Corp., senior secured note, 144A, 11.875%, 5/01/15 | | | United States | | | | 15,000,000 | | | | 14,250,000 | |
Callon Petroleum Co., senior secured note, 13.00%, 9/15/16 | | | United States | | | | 10,000,000 | | | | 10,150,000 | |
fCHC Helicopter SA, senior secured note, 144A, 9.25%, 10/15/20 | | | Canada | | | | 32,500,000 | | | | 33,800,000 | |
Chesapeake Energy Corp., senior note, | | | | | | | | | | | | |
9.50%, 2/15/15 | | | United States | | | | 10,000,000 | | | | 11,325,000 | |
6.50%, 8/15/17 | | | United States | | | | 34,000,000 | | | | 34,340,000 | |
6.875%, 8/15/18 | | | United States | | | | 16,200,000 | | | | 16,524,000 | |
7.25%, 12/15/18 | | | United States | | | | 33,000,000 | | | | 34,278,750 | |
fConsol Energy Inc., senior note, 144A, | | | | | | | | | | | | |
8.00%, 4/01/17 | | | United States | | | | 11,300,000 | | | | 12,091,000 | |
8.25%, 4/01/20 | | | United States | | | | 6,800,000 | | | | 7,378,000 | |
FI-15
Franklin Templeton Variable Insurance Products Trust
Statement of Investments, December 31, 2010 (continued)
| | | | | | | | | | | | |
| Franklin Income Securities Fund | | Country | | | Principal
Amount* | | | Value | |
Corporate Bonds (continued) | | | | | | | | | | | | |
Energy (continued) | | | | | | | | | | | | |
Denbury Resources Inc., senior sub. note, 8.25%, 2/15/20 | | | United States | | | | 4,368,000 | | | $ | 4,761,120 | |
El Paso Corp., senior note, MTN, 7.75%, 1/15/32 | | | United States | | | | 22,000,000 | | | | 21,945,000 | |
Energy Transfer Equity LP, senior note, 7.50%, 10/15/20 | | | United States | | | | 10,400,000 | | | | 10,764,000 | |
fEnergy XXI Gulf Coast Inc., senior note, 144A, 9.25%, 12/15/17 | | | United States | | | | 15,000,000 | | | | 15,637,500 | |
EXCO Resources Inc., senior note, 7.50%, 9/15/18 | | | United States | | | | 10,500,000 | | | | 10,290,000 | |
fExpro Finance Luxembourg, senior secured note, 144A, 8.50%, 12/15/16 | | | United Kingdom | | | | 10,000,000 | | | | 9,661,453 | |
Holly Corp., senior note, 9.875%, 6/15/17 | | | United States | | | | 10,000,000 | | | | 10,950,000 | |
fLinn Energy Corp., senior note, 144A, 8.625%, 4/15/20 | | | United States | | | | 20,000,000 | | | | 21,650,000 | |
OPTI Canada Inc., senior note, 7.875%, 12/15/14 | | | Canada | | | | 7,500,000 | | | | 5,334,375 | |
Petrohawk Energy Corp., senior note, | | | | | | | | | | | | |
10.50%, 8/01/14 | | | United States | | | | 20,200,000 | | | | 23,103,750 | |
7.875%, 6/01/15 | | | United States | | | | 26,000,000 | | | | 27,202,500 | |
fPetroplus Finance Ltd., senior note, 144A, | | | | | | | | | | | | |
6.75%, 5/01/14 | | | Switzerland | | | | 14,365,000 | | | | 13,287,625 | |
7.00%, 5/01/17 | | | Switzerland | | | | 30,000,000 | | | | 26,700,000 | |
Pioneer Natural Resources Co., senior bond, 6.875%, 5/01/18 | | | United States | | | | 12,965,000 | | | | 13,847,968 | |
Plains Exploration & Production Co., senior note, 7.75%, 6/15/15 | | | United States | | | | 15,000,000 | | | | 15,712,500 | |
Quicksilver Resources Inc., senior note, 9.125%, 8/15/19 | | | United States | | | | 20,000,000 | | | | 22,050,000 | |
Sabine Pass LNG LP, senior secured note, | | | | | | | | | | | | |
7.25%, 11/30/13 | | | United States | | | | 10,000,000 | | | | 9,775,000 | |
7.50%, 11/30/16 | | | United States | | | | 40,000,000 | | | | 37,700,000 | |
SandRidge Energy Inc., senior note, | | | | | | | | | | | | |
8.75%, 1/15/20 | | | United States | | | | 23,500,000 | | | | 24,263,750 | |
f144A, 9.875%, 5/15/16 | | | United States | | | | 20,000,000 | | | | 21,250,000 | |
f144A, 8.00%, 6/01/18 | | | United States | | | | 21,000,000 | | | | 21,420,000 | |
hPIK, 8.625%, 4/01/15 | | | United States | | | | 5,700,000 | | | | 5,863,875 | |
SESI LLC, senior note, 6.875%, 6/01/14 | | | United States | | | | 18,500,000 | | | | 18,870,000 | |
Tesoro Corp., senior note, 9.75%, 6/01/19 | | | United States | | | | 10,400,000 | | | | 11,570,000 | |
fW&T Offshore Inc., senior note, 144A, 8.25%, 6/15/14 | | | United States | | | | 40,000,000 | | | | 38,800,000 | |
fWestern Refining Inc., | | | | | | | | | | | | |
gsenior note, 144A, FRN, 10.75%, 6/15/14 | | | United States | | | | 5,000,000 | | | | 5,350,000 | |
senior secured note, 144A, 11.25%, 6/15/17 | | | United States | | | | 5,000,000 | | | | 5,425,000 | |
| | | | | | | | | | | | |
| | | | | | | | | | | 642,670,416 | |
| | | | | | | | | | | | |
Financials 8.7% | | | | | | | | | | | | |
iBank of America Corp., pfd., sub. bond, M, 8.125% to 5/15/18, FRN thereafter,
Perpetual | | | United States | | | | 5,000,000 | | | | 5,045,250 | |
CIT Group Inc., senior secured sub. bond, 7.00%, | | | | | | | | | | | | |
5/01/14 | | | United States | | | | 35,000,000 | | | | 35,350,000 | |
5/01/15 | | | United States | | | | 72,500,000 | | | | 73,043,750 | |
5/01/16 | | | United States | | | | 128,828,000 | | | | 129,633,175 | |
5/01/17 | | | United States | | | | 102,500,000 | | | | 103,012,500 | |
FelCor Lodging LP, senior secured note, 10.00%, 10/01/14 | | | United States | | | | 12,900,000 | | | | 14,512,500 | |
GMAC Inc., senior note, 8.00%, 3/15/20 | | | United States | | | | 25,000,000 | | | | 27,375,000 | |
Hexion U.S. Finance Corp., senior secured note, 8.875%, 2/01/18 | | | United States | | | | 8,000,000 | | | | 8,590,000 | |
International Lease Finance Corp., | | | | | | | | | | | | |
senior note, 8.875%, 9/01/17 | | | United States | | | | 20,000,000 | | | | 21,675,000 | |
fsenior note, 144A, 8.625%, 9/15/15 | | | United States | | | | 7,000,000 | | | | 7,542,500 | |
fsenior note, 144A, 8.75%, 3/15/17 | | | United States | | | | 20,000,000 | | | | 21,500,000 | |
fsenior secured note, 144A, 7.125%, 9/01/18 | | | United States | | | | 30,000,000 | | | | 32,025,000 | |
iStar Financial Inc., senior secured note, 10.00%, 6/15/14 | | | United States | | | | 16,000,000 | | | | 16,040,000 | |
iJPMorgan Chase & Co., junior sub. note, 1, 7.90% to 4/30/18, FRN thereafter, Perpetual | | | United States | | | | 110,000,000 | | | | 117,322,810 | |
FI-16
Franklin Templeton Variable Insurance Products Trust
Statement of Investments, December 31, 2010 (continued)
| | | | | | | | | | | | |
| Franklin Income Securities Fund | | Country | | | Principal
Amount* | | | Value | |
Corporate Bonds (continued) | | | | | | | | | | | | |
Financials (continued) | | | | | | | | | | | | |
f,gLiberty Mutual Group, junior sub. note, 144A, FRN, 10.75%, 6/15/88 | | | United States | | | | 25,000,000 | | | $ | 30,500,000 | |
iWells Fargo Capital XIII, pfd., 7.70% to 3/26/13, FRN thereafter, Perpetual | | | United States | | | | 5,600,000 | | | | 5,817,000 | |
iWells Fargo Capital XV, pfd., 9.75% to 9/26/13, FRN thereafter, Perpetual | | | United States | | | | 55,000,000 | | | | 61,462,500 | |
| | | | | | | | | | | | |
| | | | | | | | | | | 710,446,985 | |
| | | | | | | | | | | | |
Health Care 4.9% | | | | | | | | | | | | |
Community Health Systems Inc., senior sub. note, 8.875%, 7/15/15 | | | United States | | | | 55,000,000 | | | | 57,887,500 | |
fHCA Holdings Inc., senior note, 144A, 7.75%, 5/15/21 | | | United States | | | | 10,000,000 | | | | 10,025,000 | |
HCA Inc., | | | | | | | | | | | | |
6.75%, 7/15/13 | | | United States | | | | 2,000,000 | | | | 2,065,000 | |
senior note, 6.375%, 1/15/15 | | | United States | | | | 5,000,000 | | | | 4,937,500 | |
senior note, 6.50%, 2/15/16 | | | United States | | | | 20,000,000 | | | | 19,650,000 | |
senior secured note, 9.25%, 11/15/16 | | | United States | | | | 20,000,000 | | | | 21,387,500 | |
senior secured note, 8.50%, 4/15/19 | | | United States | | | | 20,000,000 | | | | 22,000,000 | |
senior secured note, 7.875%, 2/15/20 | | | United States | | | | 40,000,000 | | | | 43,000,000 | |
fMylan Inc., senior note, 144A, 6.00%, 11/15/18 | | | United States | | | | 10,000,000 | | | | 9,850,000 | |
f,hQuintiles Transnational Corp., senior note, 144A, PIK, 9.50%, 12/30/14 | | | United States | | | | 30,000,000 | | | | 30,825,000 | |
Tenet Healthcare Corp., | | | | | | | | | | | | |
fsenior note, 144A, 8.00%, 8/01/20 | | | United States | | | | 24,600,000 | | | | 25,030,500 | |
gsenior note, FRN, 9.25%, 2/01/15 | | | United States | | | | 13,500,000 | | | | 14,445,000 | |
senior secured note, 9.00%, 5/01/15 | | | United States | | | | 40,000,000 | | | | 44,600,000 | |
senior secured note, 10.00%, 5/01/18 | | | United States | | | | 41,250,000 | | | | 48,262,500 | |
g,hUS Oncology Holdings Inc., senior note, PIK, FRN, 6.737%, 3/15/12 | | | United States | | | | 24,788,000 | | | | 24,606,131 | |
Vanguard Health Holding Co. II LLC, senior note, 8.00%, 2/01/18 | | | United States | | | | 23,100,000 | | | | 23,793,000 | |
| | | | | | | | | | | | |
| | | | | | | | | | | 402,364,631 | |
| | | | | | | | | | | | |
Industrials 4.2% | | | | | | | | | | | | |
fAbengoa Finance SAU, senior note, 144A, 8.875%, 11/01/17 | | | Spain | | | | 11,900,000 | | | | 11,338,439 | |
fCase New Holland Inc., senior note, 144A, 7.875%, 12/01/17 | | | United States | | | | 15,000,000 | | | | 16,575,000 | |
CDW LLC/CDW Finance Corp., | | | | | | | | | | | | |
senior note, 11.00%, 10/12/15 | | | United States | | | | 5,000,000 | | | | 5,212,500 | |
senior sub. note, 12.535%, 10/12/17 | | | United States | | | | 5,000,000 | | | | 4,975,000 | |
fCeva Group PLC, senior secured note, 144A, | | | | | | | | | | | | |
8.375%, 12/01/17 | | | United Kingdom | | | | 6,800,000 | | | | 6,863,750 | |
11.50%, 4/01/18 | | | United Kingdom | | | | 30,300,000 | | | | 33,087,724 | |
fDelta Air Lines Inc., senior secured note, 144A, 9.50%, 9/15/14 | | | United States | | | | 10,860,000 | | | | 11,864,550 | |
jDiversey Holdings Inc., senior note, PIK, 10.50%, 5/15/20 | | | United States | | | | 16,400,000 | | | | 18,163,000 | |
Diversey Inc., senior note, 8.25%, 11/15/19 | | | United States | | | | 10,000,000 | | | | 10,900,000 | |
Hertz Corp., | | | | | | | | | | | | |
senior note, 8.875%, 1/01/14 | | | United States | | | | 75,335,000 | | | | 77,406,712 | |
senior sub. note, 10.50%, 1/01/16 | | | United States | | | | 17,000,000 | | | | 18,020,000 | |
fInteractive Data Corp., senior note, 144A, 10.25%, 8/01/18 | | | United States | | | | 6,900,000 | | | | 7,590,000 | |
The Manitowoc Co. Inc., senior note, 9.50%, 2/15/18 | | | United States | | | | 10,000,000 | | | | 11,000,000 | |
Nortek Inc., senior secured note, 11.00%, 12/01/13 | | | United States | | | | 4,821,333 | | | | 5,158,826 | |
fPinafore LLC/Inc., senior secured note, 144A, 9.00%, 10/01/18 | | | United States | | | | 3,600,000 | | | | 3,906,000 | |
RBS Global & Rexnord Corp., | | | | | | | | | | | | |
senior note, 8.50%, 5/01/18 | | | United States | | | | 26,900,000 | | | | 28,715,750 | |
senior sub. note, 11.75%, 8/01/16 | | | United States | | | | 13,500,000 | | | | 14,546,250 | |
Terex Corp., senior sub. note, 8.00%, 11/15/17 | | | United States | | | | 45,000,000 | | | | 45,675,000 | |
United Rentals North America Inc., senior sub. note, 8.375%, 9/15/20 | | | United States | | | | 9,800,000 | | | | 10,020,500 | |
| | | | | | | | | | | | |
| | | | | | | | | | | 341,019,001 | |
| | | | | | | | | | | | |
FI-17
Franklin Templeton Variable Insurance Products Trust
Statement of Investments, December 31, 2010 (continued)
| | | | | | | | | | | | |
| Franklin Income Securities Fund | | Country | | | Principal
Amount* | | | Value | |
Corporate Bonds (continued) | | | | | | | | | | | | |
Information Technology 5.8% | | | | | | | | | | | | |
Advanced Micro Devices Inc., senior note, 8.125%, 12/15/17 | | | United States | | | | 5,000,000 | | | $ | 5,325,000 | |
Ceridian Corp., senior note, 11.25%, 11/15/15 | | | United States | | | | 20,000,000 | | | | 19,900,000 | |
First Data Corp., | | | | | | | | | | | | |
fsenior bond, 144A, 12.625%, 1/15/21 | | | United States | | | | 66,298,000 | | | | 63,646,080 | |
senior note, 9.875%, 9/24/15 | | | United States | | | | 4,758,000 | | | | 4,555,785 | |
senior note, 9.875%, 9/24/15 | | | United States | | | | 2,115,000 | | | | 2,014,538 | |
hsenior note, PIK, 10.55%, 9/24/15 | | | United States | | | | 529,000 | | | | 490,924 | |
fsenior secured bond, 144A, 8.25%, 1/15/21 | | | United States | | | | 33,107,000 | | | | 31,948,255 | |
f,hsenior secured note, 144A, PIK, 10.00%, 1/15/22 | | | United States | | | | 33,188,000 | | | | 32,150,311 | |
senior sub. note, 11.25%, 3/31/16 | | | United States | | | | 45,000,000 | | | | 39,600,000 | |
Freescale Semiconductor Inc., | | | | | | | | | | | | |
senior note, 10.125%, 12/15/16 | | | United States | | | | 20,000,000 | | | | 21,150,000 | |
fsenior note, 144A, 10.75%, 8/01/20 | | | United States | | | | 96,750,000 | | | | 106,183,125 | |
fsenior secured note, 144A, 10.125%, 3/15/18 | | | United States | | | | 5,000,000 | | | | 5,637,500 | |
fsenior secured note, 144A, 9.25%, 4/15/18 | | | United States | | | | 51,700,000 | | | | 57,128,500 | |
fNXP BV/NXP Funding LLC, senior secured note, 144A, 9.75%, 8/01/18 | | | Netherlands | | | | 8,600,000 | | | | 9,594,375 | |
Sanmina-SCI Corp., senior sub. note, | | | | | | | | | | | | |
6.75%, 3/01/13 | | | United States | | | | 20,000,000 | | | | 20,050,000 | |
8.125%, 3/01/16 | | | United States | | | | 18,100,000 | | | | 18,371,500 | |
fSeagate HDD Cayman, senior note, 144A, 7.75%, 12/15/18 | | | United States | | | | 5,000,000 | | | | 5,087,500 | |
SunGard Data Systems Inc., | | | | | | | | | | | | |
senior note, 10.625%, 5/15/15 | | | United States | | | | 7,500,000 | | | | 8,306,250 | |
fsenior note, 144A, 7.625%, 11/15/20 | | | United States | | | | 10,000,000 | | | | 10,175,000 | |
senior sub. note, 10.25%, 8/15/15 | | | United States | | | | 14,500,000 | | | | 15,279,375 | |
| | | | | | | | | | | | |
| | | | | | | | | | | 476,594,018 | |
| | | | | | | | | | | | |
Materials 1.4% | | | | | | | | | | | | |
fBerry Plastics Corp., senior secured note, 144A, 9.75%, 1/15/21 | | | United States | | | | 5,000,000 | | | | 4,975,000 | |
fFMG Finance Pty. Ltd., senior note, 144A, 7.00%, 11/01/15 | | | Australia | | | | 14,000,000 | | | | 14,315,000 | |
fFMG Resources Aug 2006, senior note, 144A, 6.875%, 2/01/18 | | | Australia | | | | 11,900,000 | | | | 11,900,000 | |
Huntsman International LLC, | | | | | | | | | | | | |
senior note, 5.50%, 6/30/16 | | | United States | | | | 1,750,000 | | | | 1,701,875 | |
senior sub. note, 7.375%, 1/01/15 | | | United States | | | | 15,500,000 | | | | 15,926,250 | |
fsenior sub. note, 144A, 8.625%, 3/15/21 | | | United States | | | | 2,100,000 | | | | 2,278,500 | |
fIneos Group Holdings PLC, | | | | | | | | | | | | |
senior secured note, 144A, 8.50%, 2/15/16 | | | United Kingdom | | | | 5,000,000 | | | | 4,787,500 | |
senior sub. note, 144A, 7.875%, 2/15/16 | | | United Kingdom | | | | 30,000,000 | EUR | | | 36,819,898 | |
fKerling PLC, senior secured note, 144A, 10.625%, 1/28/17 | | | United Kingdom | | | | 9,400,000 | EUR | | | 13,800,898 | |
NewPage Corp., senior secured note, | | | | | | | | | | | | |
10.00%, 5/01/12 | | | United States | | | | 10,800,000 | | | | 6,210,000 | |
11.375%, 12/31/14 | | | United States | | | | 6,000,000 | | | | 5,670,000 | |
| | | | | | | | | | | | |
| | | | | | | | | | | 118,384,921 | |
| | | | | | | | | | | | |
Telecommunication Services 1.4% | | | | | | | | | | | | |
fClearwire Communications LLC/Finance, senior secured note, 144A, 12.00%, 12/01/17 | | | United States | | | | 4,700,000 | | | | 4,876,250 | |
fClearwire Corp., senior secured note, 144A, 12.00%, 12/01/15 | | | United States | | | | 28,100,000 | | | | 30,418,250 | |
Cricket Communications Inc., | | | | | | | | | | | | |
fsenior note, 144A, 7.75%, 10/15/20 | | | United States | | | | 40,000,000 | | | | 38,200,000 | |
senior secured note, 7.75%, 5/15/16 | | | United States | | | | 3,600,000 | | | | 3,753,000 | |
Frontier Communications Corp., senior note, | | | | | | | | | | | | |
8.25%, 4/15/17 | | | United States | | | | 11,600,000 | | | | 12,789,000 | |
8.50%, 4/15/20 | | | United States | | | | 12,900,000 | | | | 14,157,750 | |
Sprint Nextel Corp., senior note, 8.375%, 8/15/17 | | | United States | | | | 7,700,000 | | | | 8,296,750 | |
| | | | | | | | | | | | |
| | | | | | | | | | | 112,491,000 | |
| | | | | | | | | | | | |
FI-18
Franklin Templeton Variable Insurance Products Trust
Statement of Investments, December 31, 2010 (continued)
| | | | | | | | | | | | |
| Franklin Income Securities Fund | | Country | | | Principal
Amount* | | | Value | |
Corporate Bonds (continued) | | | | | | | | | | | | |
Utilities 5.1% | | | | | | | | | | | | |
The AES Corp., senior note, 8.00%, 10/15/17 | | | United States | | | | 2,300,000 | | | $ | 2,443,750 | |
fCalpine Construction Finance, senior secured note, 144A, 8.00%, 6/01/16 | | | United States | | | | 17,500,000 | | | | 18,681,250 | |
fCalpine Corp., senior secured note, 144A, | | | | | | | | | | | | |
7.25%, 10/15/17 | | | United States | | | | 5,000,000 | | | | 5,025,000 | |
7.875%, 7/31/20 | | | United States | | | | 10,700,000 | | | | 10,887,250 | |
7.50%, 2/15/21 | | | United States | | | | 15,000,000 | | | | 14,850,000 | |
Dynegy Holdings Inc., senior note, | | | | | | | | | | | | |
7.50%, 6/01/15 | | | United States | | | | 35,000,000 | | | | 26,600,000 | |
8.375%, 5/01/16 | | | United States | | | | 80,699,000 | | | | 60,725,997 | |
7.75%, 6/01/19 | | | United States | | | | 3,000,000 | | | | 2,017,500 | |
Energy Future Holdings Corp., senior note, | | | | | | | | | | | | |
hPIK, 12.00%, 11/01/17 | | | United States | | | | 3,029,622 | | | | 1,796,981 | |
R, 6.55%, 11/15/34 | | | United States | | | | 55,000,000 | | | | 18,975,000 | |
GenOn Energy Inc., senior note, | | | | | | | | | | | | |
7.625%, 6/15/14 | | | United States | | | | 19,500,000 | | | | 20,036,250 | |
7.875%, 6/15/17 | | | United States | | | | 25,000,000 | | | | 24,375,000 | |
fIntergen NV, senior secured note, 144A, 9.00%, 6/30/17 | | | Netherlands | | | | 7,500,000 | | | | 7,987,500 | |
fNiska Gas Storage U.S./Canada, senior note, 144A, 8.875%, 3/15/18 | | | United States | | | | 15,000,000 | | | | 16,125,000 | |
Public Service Co. of New Mexico, senior note, 7.95%, 5/15/18 | | | United States | | | | 11,400,000 | | | | 12,779,217 | |
fTexas Competitive Electric Holdings Co. LLC/Texas Competitive Electric Holdings Finance Inc., senior secured note, 144A, 15.00%, 4/01/21 | | | United States | | | | 125,125,000 | | | | 113,238,125 | |
Texas Competitive Electric Holdings Co. LLC, senior note, | | | | | | | | | | | | |
A, 10.25%, 11/01/15 | | | United States | | | | 100,000,000 | | | | 55,750,000 | |
hPIK, 11.25%, 11/01/16 | | | United States | | | | 13,000,014 | | | | 6,444,185 | |
| | | | | | | | | | | | |
| | | | | | | | | | | 418,738,005 | |
| | | | | | | | | | | | |
Total Corporate Bonds (Cost $3,576,537,385) | | | | | | | | | | | 3,768,062,544 | |
| | | | | | | | | | | | |
g,kSenior Floating Rate Interests 5.0% | | | | | | | | | | | | |
Consumer Discretionary 1.0% | | | | | | | | | | | | |
Clear Channel Communications Inc., Term Loan B, 3.911%, 1/29/16 | | | United States | | | | 74,951,317 | | | | 64,444,716 | |
ClubCorp Club Operations Inc., Term Loan B, 6.00%, 11/30/16 | | | United States | | | | 10,000,000 | | | | 10,081,250 | |
bDex Media West LLC, Term Loan B, 7.00%, 10/24/14 | | | United States | | | | 4,783,951 | | | | 4,372,191 | |
SuperMedia Inc., Exit Term Loan, 11.00%, 12/31/15 | | | United States | | | | 2,780,008 | | | | 1,915,890 | |
| | | | | | | | | | | | |
| | | | | | | | | | | 80,814,047 | |
| | | | | | | | | | | | |
Industrials 1.1% | | | | | | | | | | | | |
Allison Transmission Inc., Term Loan B, 3.02% - 3.04%, 8/07/14 | | | United States | | | | 27,762,450 | | | | 27,184,075 | |
Altegrity Inc., | | | | | | | | | | | | |
Term Loan B, 3.054%, 2/21/15 | | | United States | | | | 17,413,881 | | | | 16,717,326 | |
Tranche D Term Loan, 7.75%, 2/21/15 | | | United States | | | | 14,925,000 | | | | 14,999,625 | |
Ceva Group PLC, | | | | | | | | | | | | |
Dollar Pre-Refunded L/C Commitment, 3.303%, 8/01/12 | | | United States | | | | 2,105,263 | | | | 1,994,737 | |
EGL Term Loans, 5.303%, 8/01/12 | | | United States | | | | 12,291,882 | | | | 11,646,558 | |
Interactive Data Corp., Term Loan B, 6.75%, 1/29/17 | | | United States | | | | 14,925,000 | | | | 15,158,143 | |
| | | | | | | | | | | | |
| | | | | | | | | | | 87,700,464 | |
| | | | | | | | | | | | |
Information Technology 1.3% | | | | | | | | | | | | |
First Data Corp., | | | | | | | | | | | | |
Term Loan B-1, 3.011%, 9/24/14 | | | United States | | | | 14,543,487 | | | | 13,440,232 | |
Term Loan B-2, 3.011%, 9/24/14 | | | United States | | | | 68,867,428 | | | | 63,643,214 | |
Term Loan B-3, 3.011%, 9/24/14 | | | United States | | | | 26,448,252 | | | | 24,473,811 | |
Freescale Semiconductor Inc., Extended Term Loan, 4.508%, 12/01/16 | | | United States | | | | 2,607,263 | | | | 2,532,304 | |
| | | | | | | | | | | | |
| | | | | | | | | | | 104,089,561 | |
| | | | | | | | | | | | |
FI-19
Franklin Templeton Variable Insurance Products Trust
Statement of Investments, December 31, 2010 (continued)
| | | | | | | | | | | | |
| Franklin Income Securities Fund | | Country | | | Principal
Amount* | | | Value | |
g,kSenior Floating Rate Interests (continued) | | | | | | | | | | | | |
Utilities 1.6% | | | | | | | | | | | | |
Texas Competitive Electric Holdings Co. LLC, | | | | | | | | | | | | |
Delayed Draw Term Loan, 3.764%, 10/10/14 | | | United States | | | | 44,536,684 | | | $ | 34,231,385 | |
lTerm Loan B-1, 3.764%, 10/10/14 | | | United States | | | | 24,935,567 | | | | 19,323,643 | |
Term Loan B-2, 3.764%, 10/10/14 | | | United States | | | | 56,472,052 | | | | 43,743,365 | |
Term Loan B-3, 3.764%, 10/10/14 | | | United States | | | | 46,074,390 | | | | 35,636,974 | |
| | | | | | | | | | | | |
| | | | | | | | | | | 132,935,367 | |
| | | | | | | | | | | | |
Total Senior Floating Rate Interests (Cost $422,275,314) | | | | | | | | | | | 405,539,439 | |
| | | | | | | | | | | | |
Asset-Backed Securities and Commercial Mortgage-Backed Securities (Cost $34,698,824) 0.4% | | | | | | | | | | | | |
Financials 0.4% | | | | | | | | | | | | |
fBanc of America Large Loan, 2010-HLTN, 144A, 2.01%, 11/15/15 | | | United States | | | | 39,883,706 | | | | 35,613,310 | |
| | | | | | | | | | | | |
Municipal Bonds 0.5% | | | | | | | | | | | | |
California State GO, | | | | | | | | | | | | |
7.95%, 3/01/36 | | | United States | | | | 25,000,000 | | | | 25,665,250 | |
Build America Bonds, 7.60%, 11/01/40 | | | United States | | | | 13,920,000 | | | | 14,509,512 | |
| | | | | | | | | | | | |
Total Municipal Bonds (Cost $39,080,248) | | | | | | | | | | | 40,174,762 | |
| | | | | | | | | | | | |
Total Investments before Short Term Investments
(Cost $7,526,094,573) | | | | | | | | | | | 7,871,848,891 | |
| | | | | | | | | | | | |
Short Term Investments (Cost $243,387,001) 3.0% | | | | | | | | | | | | |
Repurchase Agreements 3.0% | | | | | | | | | | | | |
mJoint Repurchase Agreement, 0.141%, 1/03/11 (Maturity Value $243,389,868) | | | United States | | | | 243,387,001 | | | | 243,387,001 | |
Barclays Capital Inc. (Maturity Value $41,904,434) | | | | | | | | | | | | |
BNP Paribas Securities Corp. (Maturity Value $43,099,477) | | | | | | | | | | | | |
Credit Suisse Securities (USA) LLC (Maturity Value $23,944,695) | | | | | | | | | | | | |
Deutsche Bank Securities Inc. (Maturity Value $38,660,047) | | | | | | | | | | | | |
HSBC Securities (USA) Inc. (Maturity Value $29,932,086) | | | | | | | | | | | | |
Merrill Lynch, Pierce, Fenner & Smith Inc. (Maturity Value $23,944,695) | | | | | | | | | | | | |
Morgan Stanley & Co. Inc. (Maturity Value $29,932,086) | | | | | | | | | | | | |
UBS Securities LLC (Maturity Value $11,972,348) | | | | | | | | | | | | |
Collateralized by U.S. Government Agency Securities, 0.50% - 5.75%, 1/07/11 - 10/26/15; nU.S. Treasury Bills, 5/12/11 - 7/28/11; and U.S. Treasury
Notes, 0.375% - 1.875%, 9/30/11 - 9/30/17 (valued at $248,649,823) | | | | | | | | | | | | |
| | | | | | | | | | | | |
Total Investments (Cost $7,769,481,574) 99.3% | | | | | | | | | | | 8,115,235,892 | |
Options Written (0.0)%† | | | | | | | | | | | (419,000 | ) |
Other Assets, less Liabilities 0.7% | | | | | | | | | | | 58,958,487 | |
| | | | | | | | | | | | |
Net Assets 100.0% | | | | | | | | | | $ | 8,173,775,379 | |
| | | | | | | | | | | | |
FI-20
Franklin Templeton Variable Insurance Products Trust
Statement of Investments, December 31, 2010 (continued)
| | | | | | | | | | | | |
| Franklin Income Securities Fund | | Country | | | Contracts | | | Value | |
oOptions Written (0.0)%† | | | | | | | | | | | | |
Call Options (0.0)%† | | | | | | | | | | | | |
Materials (0.0)%† | | | | | | | | | | | | |
Freeport-McMoRan Copper & Gold Inc., B, Feb. $130 Calls, 2/19/11 | | | United States | | | | 1,180 | | | $ | (318,600 | ) |
Energy (0.0)%† | | | | | | | | | | | | |
Schlumberger Ltd., Jan. $90 Calls, 1/22/11 | | | United States | | | | 2,510 | | | | (100,400 | ) |
| | | | | | | | | | | | |
Total Options Written (Premiums Received $415,499) | | | | | | | | | | $ | (419,000 | ) |
| | | | | | | | | | | | |
See Abbreviations on page FI-35.
†Rounds to less than 0.1% of net assets.
*The principal amount is stated in U.S. dollars unless otherwise indicated.
aNon-income producing.
bSee Note 9 regarding holdings of 5% voting securities.
cSecurity has been deemed illiquid because it may not be able to be sold within seven days. At December 31, 2010, the value of this security was $34,721, representing less than 0.01% of net assets.
dA portion or all of the security is held in connection with written option contracts open at year end.
eSee Note 1(f) regarding equity-linked securities.
fSecurity was purchased pursuant to Rule 144A under the Securities Act of 1933 and may be sold in transactions exempt from registration only to qualified institutional buyers or in a public offering registered under the Securities Act of 1933. These securities have been deemed liquid under guidelines approved by the Trust’s Board of Trustees. At December 31, 2010, the aggregate value of these securities was $1,507,028,618, representing 18.44% of net assets.
gThe coupon rate shown represents the rate at period end.
hIncome may be received in additional securities and/or cash.
iPerpetual security with no stated maturity date.
jIncome may be reflected in the redemption value or received in additional securities and/or cash.
kSee Note 1(g) regarding senior floating rate interests.
lA portion or all of the security purchased on a delayed delivery basis. See Note 1(d).
mSee Note 1(c) regarding joint repurchase agreement.
nThe security is traded on a discount basis with no stated coupon rate.
oSee Note 1(e) regarding written options.
The accompanying notes are an integral part of these financial statements.
FI-21
Franklin Templeton Variable Insurance Products Trust
Financial Statements
Statement of Assets and Liabilities
December 31, 2010
| | | | |
| | | Franklin Income
Securities Fund | |
Assets: | | | | |
Investments in securities: | | | | |
Cost - Unaffiliated issuers | | $ | 7,381,337,324 | |
Cost - Non-controlled affiliated issuers (Note 9) | | | 144,757,249 | |
Cost - Repurchase agreements | | | 243,387,001 | |
| | | | |
Total cost of investments | | $ | 7,769,481,574 | |
| | | | |
Value - Unaffiliated issuers | | $ | 7,825,656,600 | |
Value - Non-controlled affiliated issuers (Note 9) | | | 46,192,291 | |
Value - Repurchase agreements | | | 243,387,001 | |
| | | | |
Total value of investments | | | 8,115,235,892 | |
Cash | | | 1,434,400 | |
Receivables: | | | | |
Capital shares sold | | | 1,624,395 | |
Dividends and interest | | | 77,893,516 | |
Other assets | | | 1,103,492 | |
| | | | |
Total assets | | | 8,197,291,695 | |
| | | | |
Liabilities: | | | | |
Payables: | | | | |
Investment securities purchased | | | 11,725,950 | |
Capital shares redeemed | | | 4,521,720 | |
Affiliates | | | 5,925,756 | |
Options written, at value (premiums received $415,499) | | | 419,000 | |
Accrued expenses and other liabilities | | | 923,890 | |
| | | | |
Total liabilities | | | 23,516,316 | |
| | | | |
Net assets, at value | | $ | 8,173,775,379 | |
| | | | |
Net assets consist of: | | | | |
Paid-in capital | | $ | 8,572,286,625 | |
Undistributed net investment income | | | 459,449,020 | |
Net unrealized appreciation (depreciation) | | | 345,712,719 | |
Accumulated net realized gain (loss) | | | (1,203,672,985 | ) |
| | | | |
Net assets, at value | | $ | 8,173,775,379 | |
| | | | |
The accompanying notes are an integral part of these financial statements.
FI-22
Franklin Templeton Variable Insurance Products Trust
Financial Statements (continued)
Statement of Assets and Liabilities (continued)
December 31, 2010
| | | | |
| | | Franklin Income
Securities Fund | |
Class 1: | | | | |
Net assets, at value | | $ | 1,449,028,052 | |
| | | | |
Shares outstanding | | | 95,558,907 | |
| | | | |
Net asset value and maximum offering price per share | | $ | 15.16 | |
| | | | |
Class 2: | | | | |
Net assets, at value | | $ | 6,309,206,764 | |
| | | | |
Shares outstanding | | | 425,857,914 | |
| | | | |
Net asset value and maximum offering price per share | | $ | 14.82 | |
| | | | |
Class 4: | | | | |
Net assets, at value | | $ | 415,540,563 | |
| | | | |
Shares outstanding | | | 27,626,288 | |
| | | | |
Net asset value and maximum offering price per share | | $ | 15.04 | |
| | | | |
The accompanying notes are an integral part of these financial statements.
FI-23
Franklin Templeton Variable Insurance Products Trust
Financial Statements (continued)
Statement of Operations
for the year ended December 31, 2010
| | | | |
| | | Franklin Income
Securities Fund | |
Investment income: | | | | |
Dividends | | $ | 105,433,471 | |
Interest: | | | | |
Unaffiliated issuers | | | 402,812,595 | |
Non-controlled affiliated issuers (Note 9) | | | 3,919,304 | |
| | | | |
Total investment income | | | 512,165,370 | |
| | | | |
Expenses: | | | | |
Management fees (Note 3a) | | | 34,343,156 | |
Distribution fees: (Note 3c) | | | | |
Class 2 | | | 15,173,007 | |
Class 4 | | | 1,313,386 | |
Unaffiliated transfer agent fees | | | 2,571 | |
Custodian fees (Note 4) | | | 152,430 | |
Reports to shareholders | | | 967,821 | |
Professional fees | | | 176,219 | |
Trustees’ fees and expenses | | | 33,459 | |
Other | | | 172,049 | |
| | | | |
Total expenses | | | 52,334,098 | |
Expense reductions (Note 4) | | | (47 | ) |
| | | | |
Net expenses | | | 52,334,051 | |
| | | | |
Net investment income | | | 459,831,319 | |
| | | | |
Realized and unrealized gains (losses): | | | | |
Net realized gain (loss) from: | | | | |
Investments: | | | | |
Unaffiliated issuers | | | 89,449,748 | |
Non-controlled affiliated issuers (Note 9) | | | (88,042,902 | ) |
Foreign currency transactions | | | 159,170 | |
| | | | |
Net realized gain (loss) | | | 1,566,016 | |
| | | | |
Net change in unrealized appreciation (depreciation) on: | | | | |
Investments | | | 446,637,084 | |
Translation of other assets and liabilities denominated in foreign currencies | | | 21,127 | |
| | | | |
Net change in unrealized appreciation (depreciation) | | | 446,658,211 | |
| | | | |
Net realized and unrealized gain (loss) | | | 448,224,227 | |
| | | | |
Net increase (decrease) in net assets resulting from operations | | $ | 908,055,546 | |
| | | | |
The accompanying notes are an integral part of these financial statements.
FI-24
Franklin Templeton Variable Insurance Products Trust
Financial Statements (continued)
Statements of Changes in Net Assets
| | | | | | | | |
| | | Franklin Income Securities Fund | |
| | | Year Ended December 31, | |
| | | 2010 | | | 2009 | |
| | | | |
Increase (decrease) in net assets: | | | | | | | | |
Operations: | | | | | | | | |
Net investment income | | $ | 459,831,319 | | | $ | 431,531,209 | |
Net realized gain (loss) from investments and foreign currency transactions | | | 1,566,016 | | | | (456,942,376 | ) |
Net change in unrealized appreciation (depreciation) on investments and translation of other assets and liabilities denominated in foreign currencies | | | 446,658,211 | | | | 1,964,691,384 | |
| | | | |
Net increase (decrease) in net assets resulting from operations | | | 908,055,546 | | | | 1,939,280,217 | |
| | | | |
Distributions to shareholders from: | | | | | | | | |
Net investment income: | | | | | | | | |
Class 1 | | | (70,751,613 | ) | | | (46,648,798 | ) |
Class 2 | | | (403,393,475 | ) | | | (437,720,445 | ) |
Class 4 | | | (24,551,628 | ) | | | (19,056,945 | ) |
| | | | |
Total distributions to shareholders | | | (498,696,716 | ) | | | (503,426,188 | ) |
| | | | |
Capital share transactions: (note 2) | | | | | | | | |
Class 1 | | | 469,690,616 | | | | 328,438,277 | |
Class 2 | | | (125,499,592 | ) | | | (55,863,777 | ) |
Class 4 | | | 47,090,132 | | | | 151,520,403 | |
| | | | |
Total capital share transactions | | | 391,281,156 | | | | 424,094,903 | |
| | | | |
Net increase (decrease) in net assets | | | 800,639,986 | | | | 1,859,948,932 | |
Net assets: | | | | | | | | |
Beginning of year | | | 7,373,135,393 | | | | 5,513,186,461 | |
| | | | |
End of year | | $ | 8,173,775,379 | | | $ | 7,373,135,393 | |
| | | | |
Undistributed net investment income included in net assets: | | | | | | | | |
End of year | | $ | 459,449,020 | | | $ | 448,201,048 | |
| | | | |
The accompanying notes are an integral part of these financial statements.
FI-25
Franklin Templeton Variable Insurance Products Trust
Notes to Financial Statements
Franklin Income Securities Fund
1. ORGANIZATION AND SIGNIFICANT ACCOUNTING POLICIES
Franklin Templeton Variable Insurance Products Trust (Trust) is registered under the Investment Company Act of 1940, as amended, (1940 Act) as an open-end investment company, consisting of twenty separate funds. The Franklin Income Securities Fund (Fund) is included in this report. The financial statements of the remaining funds in the Trust are presented separately. Shares of the Fund are generally sold only to insurance company separate accounts to fund the benefits of variable life insurance policies or variable annuity contracts. The Fund offers three classes of shares: Class 1, Class 2, and Class 4. Each class of shares differs by its distribution fees, voting rights on matters affecting a single class and its exchange privilege.
The following summarizes the Fund’s significant accounting policies.
a. Financial Instrument Valuation
The Fund values its investments in securities and other assets and liabilities carried at fair value daily. Fair value is the price that would be received to sell an asset or paid to transfer a liability in an orderly transaction between market participants on the measurement date. Under procedures approved by the Trust’s Board of Trustees, the Fund may utilize independent pricing services, quotations from securities and financial instrument dealers, and other market sources to determine fair value.
Equity securities and derivative financial instruments listed on an exchange or on the NASDAQ National Market System are valued at the last quoted sale price or the official closing price of the day, respectively. Foreign equity securities are valued as of the close of trading on the foreign stock exchange on which the security is primarily traded, or the NYSE, whichever is earlier. The value is then converted into its U.S. dollar equivalent at the foreign exchange rate in effect at the close of the NYSE on the day that the value of the security is determined. Over-the-counter securities are valued within the range of the most recent quoted bid and ask prices. Securities that trade in multiple markets or on multiple exchanges are valued according to the broadest and most representative market. Certain equity securities are valued based upon fundamental characteristics or relationships to similar securities.
Debt securities generally trade in the over-the-counter market rather than on a securities exchange. The Fund’s pricing services use multiple valuation techniques to determine fair value. In instances where sufficient market activity exists, the pricing services may utilize a market-based approach through which quotes from market makers are used to determine fair value. In instances where sufficient market activity may not exist or is limited, the pricing services also utilize proprietary valuation models which may consider market characteristics such as benchmark yield curves, option-adjusted spreads, credit spreads, estimated default rates, coupon rates, anticipated timing of principal repayments, underlying collateral, and other unique security features in order to estimate the relevant cash flows, which are then discounted to calculate the fair value. Securities denominated in a foreign currency are converted into their U.S. dollar equivalent at the foreign exchange rate in effect at the close of the NYSE on the date that the values of the foreign debt securities are determined. Repurchase agreements are valued at cost, which approximates market value.
The Fund has procedures to determine the fair value of securities and other financial instruments for which market prices are not readily available or which may not be reliably priced. Under these procedures, the Fund primarily employs a market-based approach which may use related or comparable assets or liabilities, recent transactions, market multiples, book values, and other relevant information for the investment to determine the fair value of the investment. The Fund may also use an income-based valuation approach in which the anticipated future cash flows of the investment are discounted to calculate fair value. Discounts may also be applied due to the nature or duration of any restrictions on the disposition of the investments. Due to the inherent uncertainty of valuations of such investments, the fair values may differ significantly from the values that would have been used had an active market existed.
Trading in securities on foreign securities stock exchanges and over-the-counter markets may be completed before the daily close of business on the NYSE. Occasionally, events occur between the time at which trading in a foreign security is completed and the close of the NYSE that might call into question the reliability of the value of a portfolio security held by the Fund. As a result, differences
FI-26
Franklin Templeton Variable Insurance Products Trust
Notes to Financial Statements (continued)
Franklin Income Securities Fund
1. ORGANIZATION AND SIGNIFICANT ACCOUNTING POLICIES (continued)
a. Financial Instrument Valuation (continued)
may arise between the value of the Fund’s portfolio securities as determined at the foreign market close and the latest indications of value at the close of the NYSE. In order to minimize the potential for these differences, the investment manager monitors price movements following the close of trading in foreign stock markets through a series of country specific market proxies (such as baskets of American Depository Receipts, futures contracts and exchange traded funds). These price movements are measured against established trigger thresholds for each specific market proxy to assist in determining if an event has occurred that may call into question the reliability of the values of the foreign securities held by the Fund. If such an event occurs, the securities may be valued using fair value procedures, which may include the use of independent pricing services.
b. Foreign Currency Translation
Portfolio securities and other assets and liabilities denominated in foreign currencies are translated into U.S. dollars based on the exchange rate of such currencies against U.S. dollars on the date of valuation. The Fund may enter into foreign currency exchange contracts to facilitate transactions denominated in a foreign currency. Purchases and sales of securities, income and expense items denominated in foreign currencies are translated into U.S. dollars at the exchange rate in effect on the transaction date. Portfolio securities and assets and liabilities denominated in foreign currencies contain risks that those currencies will decline in value relative to the U.S. dollar. Occasionally, events may impact the availability or reliability of foreign exchange rates used to convert the U.S. dollar equivalent value. If such an event occurs, the foreign exchange rate will be valued at fair value using procedures established and approved by the Trust’s Board of Trustees.
The Fund does not separately report the effect of changes in foreign exchange rates from changes in market prices on securities held. Such changes are included in net realized and unrealized gain or loss from investments on the Statement of Operations.
Realized foreign exchange gains or losses arise from sales of foreign currencies, currency gains or losses realized between the trade and settlement dates on securities transactions and the difference between the recorded amounts of dividends, interest, and foreign withholding taxes and the U.S. dollar equivalent of the amounts actually received or paid. Net unrealized foreign exchange gains and losses arise from changes in foreign exchange rates on foreign denominated assets and liabilities other than investments in securities held at the end of the reporting period.
c. Joint Repurchase Agreement
The Fund may enter into a joint repurchase agreement whereby its uninvested cash balance is deposited into a joint cash account with other funds managed by the investment manager or an affiliate of the investment manager and is used to invest in one or more repurchase agreements. The value and face amount of the joint repurchase agreement are allocated to the funds based on their pro-rata interest. A repurchase agreement is accounted for as a loan by the fund to the seller, collateralized by securities which are delivered to the fund’s custodian. The market value, including accrued interest, of the initial collateralization is required to be at least 102% of the dollar amount invested by the funds, with the value of the underlying securities marked to market daily to maintain coverage of at least 100%. The joint repurchase agreement held by the Fund at year end had been entered into on December 31, 2010.
d. Securities Purchased on a Delayed Delivery Basis
The Fund may purchase securities on a delayed delivery basis, with payment and delivery scheduled for a future date. These transactions are subject to market fluctuations and are subject to the risk that the value at delivery may be more or less than the trade date purchase price. Although the Fund will generally purchase these securities with the intention of holding the securities, it may sell the securities before the settlement date. Sufficient assets have been segregated for these securities.
FI-27
Franklin Templeton Variable Insurance Products Trust
Notes to Financial Statements (continued)
Franklin Income Securities Fund
1. ORGANIZATION AND SIGNIFICANT ACCOUNTING POLICIES (continued)
e. Derivative Financial Instruments
The Fund invested in derivative financial instruments (derivatives) in order to manage risk or gain exposure to various other investments or markets. Derivatives are financial contracts based on an underlying or notional amount, require no initial investment or an initial net investment that is smaller than would normally be required to have a similar response to changes in market factors, and require or permit net settlement. Derivatives contain various risks including the potential inability of the counterparty to fulfill their obligations under the terms of the contract, the potential for an illiquid secondary market, and/or the potential for market movements which expose the Fund to gains or losses in excess of the amounts shown on the Statement of Assets and Liabilities. Realized gain and loss and unrealized appreciation and depreciation on these contracts for the period are included in the Statement of Operations.
The Fund purchased or wrote option contracts primarily to manage and/or gain exposure to equity price risk. An option is a contract entitling the holder to purchase or sell a specific amount of shares or units of a particular security, currency or index, or notional amount of a swap (swaption), at a specified price. Options purchased are recorded as an asset while options written are recorded as a liability. Upon exercise of an option, the acquisition cost or sales proceeds of the security is adjusted by any premium paid or received. Upon expiration of an option, any premium paid or received is recorded as a realized loss or gain. Upon closing an option other than through expiration or exercise, the difference between the premium and the cost to close the position is recorded as a realized gain or loss.
See Note 8 regarding other derivative information.
f. Equity-Linked Securities
The Fund may invest in equity-linked securities. Equity-linked securities are hybrid financial instruments that generally combine both debt and equity characteristics into a single note form. Income received from equity linked securities is recorded as realized gains in the Statement of Operations and may be based on the performance of an underlying equity security, an equity index, or an option position. The risks of investing in equity-linked securities include unfavorable price movements in the underlying security and the credit risk of the issuing financial institution. There may be no guarantee of a return of principal with equity linked securities and the appreciation potential may be limited. Equity-linked securities may be more volatile and less liquid than other investments held by the Fund.
g. Senior Floating Rate Interests
Senior secured corporate loans pay interest at rates which are periodically reset by reference to a base lending rate plus a spread. These base lending rates are generally the prime rate offered by a designated U.S. bank or the London InterBank Offered Rate (LIBOR). Senior secured corporate loans often require prepayment of principal from excess cash flows or at the discretion of the borrower. As a result, actual maturity may be substantially less than the stated maturity.
Senior secured corporate loans in which the Fund invests are generally readily marketable, but may be subject to some restrictions on resale.
h. Income Taxes
It is the Fund’s policy to qualify as a regulated investment company under the Internal Revenue Code. The Fund intends to distribute to shareholders substantially all of its taxable income and net realized gains to relieve it from federal income and excise taxes. As a result, no provision for U.S. federal income taxes is required. The Fund files U.S. income tax returns as well as tax returns in certain other jurisdictions. The Fund’s application of those tax rules is subject to its understanding. The Fund records a provision for taxes in its financial statements including penalties and interest, if any, for a tax position taken on a tax return (or
FI-28
Franklin Templeton Variable Insurance Products Trust
Notes to Financial Statements (continued)
Franklin Income Securities Fund
1. ORGANIZATION AND SIGNIFICANT ACCOUNTING POLICIES (continued)
h. Income Taxes (continued)
expected to be taken) when it fails to meet the more likely than not (a greater than 50% probability) threshold and based on the technical merits, the tax position may not be sustained upon examination by the tax authorities. As of December 31, 2010, and for all open tax years, the Fund has determined that no provision for income tax is required in the Fund’s financial statements. Open tax years are those that remain subject to examination and are based on each tax jurisdiction statute of limitation. The Fund is not aware of any tax position for which it is reasonably possible that the total amounts of unrecognized tax effects will significantly change in the next twelve months.
The Fund may be subject to foreign taxation related to income received, capital gains on the sale of securities and certain foreign currency transactions in the foreign jurisdictions in which it invests. Foreign taxes, if any, are recorded based on the tax regulations and rates that exist in the foreign markets in which the Fund invests. When a capital gain tax is determined to apply the Fund records an estimated deferred tax liability for net unrealized gains on these securities in an amount that would be payable if the securities were disposed of on the valuation date.
i. Security Transactions, Investment Income, Expenses and Distributions
Security transactions are accounted for on trade date. Realized gains and losses on security transactions are determined on a specific identification basis. Interest income and estimated expenses are accrued daily. Amortization of premium and accretion of discount on debt securities are included in interest income. Facility fees are recognized as income over the expected term of the loan. Dividend income is recorded on the ex-dividend date except that certain dividends from foreign securities are recognized as soon as the Fund is notified of the ex-dividend date. Distributions to shareholders are recorded on the ex-dividend date and are determined according to income tax regulations (tax basis). Distributable earnings determined on a tax basis may differ from earnings recorded in accordance with accounting principles generally accepted in the United States of America. These differences may be permanent or temporary. Permanent differences are reclassified among capital accounts to reflect their tax character. These reclassifications have no impact on net assets or the results of operations. Temporary differences are not reclassified, as they may reverse in subsequent periods.
Common expenses incurred by the Trust are allocated among the funds based on the ratio of net assets of each fund to the combined net assets of the Trust. Fund specific expenses are charged directly to the fund that incurred the expense.
Realized and unrealized gains and losses and net investment income, not including class specific expenses, are allocated daily to each class of shares based upon the relative proportion of net assets of each class. Differences in per share distributions, by class, are generally due to differences in class specific expenses.
j. Accounting Estimates
The preparation of financial statements in accordance with accounting principles generally accepted in the United States of America requires management to make estimates and assumptions that affect the reported amounts of assets and liabilities at the date of the financial statements and the amounts of income and expenses during the reporting period. Actual results could differ from those estimates.
k. Guarantees and Indemnifications
Under the Trust’s organizational documents, its officers and trustees are indemnified by the Trust against certain liabilities arising out of the performance of their duties to the Trust. Additionally, in the normal course of business, the Trust, on behalf of the Fund, enters into contracts with service providers that contain general indemnification clauses. The Trust’s maximum exposure under these arrangements is unknown as this would involve future claims that may be made against the Trust that have not yet occurred. Currently, the Trust expects the risk of loss to be remote.
FI-29
Franklin Templeton Variable Insurance Products Trust
Notes to Financial Statements (continued)
Franklin Income Securities Fund
2. SHARES OF BENEFICIAL INTEREST
At December 31, 2010, there were an unlimited number of shares authorized (without par value). Transactions in the Fund’s shares were as follows:
| | | | | | | | | | | | | | | | |
| | | Year Ended December 31, | |
| | | 2010 | | | 2009 | |
| Class 1 Shares: | | Shares | | | Amount | | | Shares | | | Amount | |
Shares sold | | | 44,758,864 | | | $ | 645,042,814 | | | | 27,450,254 | | | $ | 349,770,752 | |
Shares issued in reinvestment of distributions | | | 5,206,153 | | | | 70,751,613 | | | | 3,884,163 | | | | 46,648,798 | |
Shares redeemed | | | (17,515,669 | ) | | | (246,103,811 | ) | | | (5,820,524 | ) | | | (67,981,273 | ) |
| | | | |
Net increase (decrease) | | | 32,449,348 | | | $ | 469,690,616 | | | | 25,513,893 | | | $ | 328,438,277 | |
| | | | |
Class 2 Shares: | | | | | | | | | | | | | | | | |
Shares sold | | | 26,818,536 | | | $ | 380,019,084 | | | | 28,676,075 | | | $ | 352,470,139 | |
Shares issued in reinvestment of distributions | | | 30,330,336 | | | | 403,393,475 | | | | 37,189,503 | | | | 437,720,445 | |
Shares redeemed | | | (64,334,274 | ) | | | (908,912,151 | ) | | | (70,577,619 | ) | | | (846,054,361 | ) |
| | | | |
Net increase (decrease) | | | (7,185,402 | ) | | $ | (125,499,592 | ) | | | (4,712,041 | ) | | $ | (55,863,777 | ) |
| | | | |
Class 4 Shares: | | | | | | | | | | | | | | | | |
Shares sold | | | 4,608,224 | | | $ | 66,369,834 | | | | 12,441,769 | | | $ | 152,226,979 | |
Shares issued on reinvestment of distributions | | | 1,817,293 | | | | 24,551,628 | | | | 1,593,390 | | | | 19,056,945 | |
Shares redeemed | | | (3,057,456 | ) | | | (43,831,330 | ) | | | (1,557,805 | ) | | | (19,763,521 | ) |
| | | | |
Net increase (decrease) | | | 3,368,061 | | | $ | 47,090,132 | | | | 12,477,354 | | | $ | 151,520,403 | |
| | | | |
3. TRANSACTIONS WITH AFFILIATES
Franklin Resources, Inc. is the holding company for various subsidiaries that together are referred to as Franklin Templeton Investments. Certain officers and trustees of the Trust are also officers and/or directors of the following subsidiaries:
| | |
| Subsidiary | | Affiliation |
Franklin Advisers, Inc. (Advisers) | | Investment manager |
Franklin Templeton Services, LLC (FT Services) | | Administrative manager |
Franklin Templeton Distributors, Inc. (Distributors) | | Principal underwriter |
Franklin Templeton Investor Services, LLC (Investor Services) | | Transfer agent |
a. Management Fees
The Fund pays an investment management fee to Advisers based on the average daily net assets of the Fund as follows:
| | |
| Annualized Fee Rate | | Net Assets |
| 0.625% | | Up to and including $100 million |
| 0.500% | | Over $100 million, up to and including $250 million |
| 0.450% | | Over $250 million, up to and including $7.5 billion |
| 0.440% | | Over $7.5 billion, up to and including $10 billion |
| 0.430% | | Over $10 billion, up to and including $12.5 billion |
| 0.420% | | Over $12.5 billion, up to and including $15 billion |
| 0.400% | | In excess of $15 billion |
FI-30
Franklin Templeton Variable Insurance Products Trust
Notes to Financial Statements (continued)
Franklin Income Securities Fund
3. TRANSACTIONS WITH AFFILIATES (continued)
b. Administrative Fees
Under an agreement with Advisers, FT Services provides administrative services to the Fund. The fee is paid by Advisers based on average daily net assets, and is not an additional expense of the Fund.
c. Distribution Fees
The Trust’s Board of Trustees has adopted distribution plans for Class 2 and Class 4 shares pursuant to Rule 12b-1 under the 1940 Act. Under the Fund’s compensation distribution plans, the Fund pays Distributors for costs incurred in connection with the servicing, sale and distribution of the Fund’s shares up to 0.35% per year of its average daily net assets of each class. The Board of Trustees has agreed to limit the current rate to 0.25% per year for Class 2.
d. Transfer Agent Fees
Investor Services, under terms of an agreement, performs shareholder servicing for the Fund and is not paid by the Fund for the services.
e. Other Affiliated Transactions
At December 31, 2010, Franklin Templeton Variable Insurance Products Trust — Franklin Templeton VIP Founding Funds Allocation Fund owned 14.03% of the Fund’s outstanding shares.
4. EXPENSE OFFSET ARRANGEMENT
The Fund has entered into an arrangement with its custodian whereby credits realized as a result of uninvested cash balances are used to reduce a portion of the Fund’s custodian expenses. During the year ended December 31, 2010, the custodian fees were reduced as noted in the Statement of Operations.
5. INCOME TAXES
For tax purposes, capital losses may be carried over to offset future capital gains, if any. At December 31, 2010, the capital loss carryforwards were as follows:
| | | | |
Capital loss carryforwards expiring in: | | | | |
2016 | | $ | 524,982,657 | |
2017 | | | 521,405,875 | |
2018 | | | 157,360,428 | |
| | | | |
| | | $1,203,748,960 | |
| | | | |
The tax character of distributions paid during the years ended December 31, 2010 and 2009, was as follows:
| | | | | | | | |
| | | 2010 | | | 2009 | |
Distributions paid from ordinary income | | $ | 498,696,716 | | | $ | 503,426,188 | |
FI-31
Franklin Templeton Variable Insurance Products Trust
Notes to Financial Statements (continued)
Franklin Income Securities Fund
5. INCOME TAXES (continued)
At December 31, 2010, the cost of investments, net unrealized appreciation (depreciation), and undistributed ordinary income for income tax purposes were as follows:
| | | | |
Cost of investments | | $ | 7,786,172,473 | |
| | | | |
| |
Unrealized appreciation | | $ | 843,077,498 | |
Unrealized depreciation | | | (514,014,079 | ) |
| | | | |
Net unrealized appreciation (depreciation) | | $ | 329,063,419 | |
| | | | |
Distributable earnings – undistributed ordinary income | | $ | 476,289,695 | |
| | | | |
Net investment income differs for financial statement and tax purposes primarily due to differing treatments of defaulted securities, foreign currency transactions, payments-in-kind, corporate actions, and bond discounts and premiums.
Net realized gains (losses) differ for financial statement and tax purposes primarily due to differing treatments of defaulted securities, wash sales, foreign currency transactions, payments-in-kind, corporate actions, and bond discounts and premiums.
6. INVESTMENT TRANSACTIONS
Purchases and sales of investments (excluding short term securities) for the year ended December 31, 2010, aggregated $3,639,629,355 and $3,027,046,361, respectively.
Transactions in options written during the year ended December 31, 2010, were as follows:
| | | | | | | | |
| | | Number of
Contracts | | | Premiums
Received | |
Options outstanding at December 31, 2009 | | | — | | | $ | — | |
Options written | | | 3,690 | | | | 415,499 | |
Options expired | | | — | | | | — | |
Options exercised | | | — | | | | — | |
Options closed | | | — | | | | — | |
| | | | |
Options outstanding at December 31, 2010 | | | 3,690 | | | $ | 415,499 | |
| | | | |
7. CREDIT RISK
At December 31, 2010, the Fund had 48.76% of its portfolio invested in high yield securities, senior secured floating rate notes, or other securities rated below investment grade. These securities may be more sensitive to economic conditions causing greater price volatility and are potentially subject to a greater risk of loss due to default than higher rated securities.
8. OTHER DERIVATIVE INFORMATION
At December 31, 2010, the Fund has invested in derivative contracts which are reflected on the Statement of Assets and Liabilities as follows:
| | | | | | | | | | | | |
| | | Asset Derivatives | | | Liability Derivatives | |
Derivative Contracts Not Accounted
for as Hedging Instruments | | Statement of Assets and
Liabilities Location | | Fair
Value
Amount | | | Statement of Assets and
Liabilities Location | | Fair
Value
Amount | |
Equity contracts | | Investments, at value | | $ | — | | | Options written, at value | | $ | 419,000 | |
FI-32
Franklin Templeton Variable Insurance Products Trust
Notes to Financial Statements (continued)
Franklin Income Securities Fund
8. OTHER DERIVATIVE INFORMATION (continued)
For the year ended December 31, 2010, the effect of derivative contracts on the Fund’s Statement of Operations was as follows:
| | | | | | | | | | | | | | |
Derivative Contracts Not
Accounted for as Hedging
Instruments | | Statement of Operations Locations | | Realized Gain
(Loss) for the
Year | | | Change in Unrealized
Appreciation (Depreciation)
for the Year | | | Average Amount
Outstanding
During the Yeara | |
Equity contracts | | Net realized gain (loss) from written options / Net change in unrealized appreciation (depreciation) on investments | | $ | — | | | $ | (3,501 | ) | | | 180 | |
aRepresents the average number of option contracts outstanding during the year.
See Note 1(e) regarding derivative financial instruments.
9. HOLDINGS OF 5% VOTING SECURITIES OF PORTFOLIO COMPANIES
The 1940 Act defines “affiliated companies” to include investments in portfolio companies in which a fund owns 5% or more of the outstanding voting securities. Investments in “affiliated companies” for the Fund for the year ended December 31, 2010, were as shown below.
| | | | | | | | | | | | | | | | | | | | | | | | | | | | |
| Name of Issuer | | Number of Shares
Held at Beginning
of Year | | | Gross
Additions | | | Gross
Reductions | | | Number of
Shares
Held at End of
Year | | | Value at
End of
Year | | | Investment
Income | | | Realized Capital
Gain (Loss) | |
Non-Controlled Affiliates | | | | | | | | | | | | | | | | | | | | | | | | | | | | |
aDex Media West LLC, Term Loan B, 7.00%, 10/24/14 | | | — | | | | 6,217,056 | | | | 1,433,105 | | | | 4,783,951 | | | $ | 4,372,191 | | | $ | 310,508 | | | $ | 474,111 | |
Dex One Corp. | | | — | | | | 2,867,386 | | | | 225,005 | | | | 2,642,381 | | | | 19,712,162 | | | | — | | | | (88,517,013 | ) |
Dex One Corp., senior sub. note, PIK, 12.00%, 1/29/17 | | | — | | | | 32,511,674 | | | | — | | | | 32,511,674 | | | | 22,107,938 | | | | 3,608,796 | | | | — | |
| | | | | | | | | | | | | | | | | | | | |
Total Affiliated Securities (0.57% of Net Assets) | | | | | | | | | | | | | | | | | | $ | 46,192,291 | | | $ | 3,919,304 | | | $ | (88,042,902 | ) |
| | | | | | | | | | | | | | | | | | | | |
aCompany is a wholly owned subsidiary of Dex One Corp.
10. CREDIT FACILITY
The Fund, together with other U.S. registered and foreign investment funds (collectively “Borrowers”), managed by Franklin Templeton Investments, are borrowers in a joint syndicated senior unsecured credit facility totaling $750 million (Global Credit Facility) which matures on January 21, 2011. This Global Credit Facility provides a source of funds to the Borrowers for temporary and emergency purposes, including the ability to meet future unanticipated or unusually large redemption requests.
Under the terms of the Global Credit Facility, the Fund shall, in addition to interest charged on any borrowings made by the Fund and other costs incurred by the Fund, pay its share of fees and expenses incurred in connection with the implementation and maintenance of the Global Credit Facility, based upon its relative share of the aggregate net assets of all of the Borrowers, including an annual commitment fee of 0.10% based upon the unused portion of the Global Credit Facility, which is reflected in other expenses on the Statement of Operations. During the year ended December 31, 2010, the Fund did not use the Global Credit Facility.
Effective January 21, 2011, the Borrowers renewed the Global Credit Facility for a total of $750 million, maturing January 20, 2012.
FI-33
Franklin Templeton Variable Insurance Products Trust
Notes to Financial Statements (continued)
Franklin Income Securities Fund
11. FAIR VALUE MEASUREMENTS
The Fund follows a fair value hierarchy that distinguishes between market data obtained from independent sources (observable inputs) and the Fund’s own market assumptions (unobservable inputs). These inputs are used in determining the value of the Fund’s investments and are summarized in the following fair value hierarchy:
| | • | | Level 1 – quoted prices in active markets for identical securities |
| | • | | Level 2 – other significant observable inputs (including quoted prices for similar securities, interest rates, prepayment speed, credit risk, etc.) |
| | • | | Level 3 – significant unobservable inputs (including the Fund’s own assumptions in determining the fair value of investments) |
The inputs or methodology used for valuing securities are not an indication of the risk associated with investing in those securities.
For movements between the levels within the fair value hierarchy, the Fund has adopted a policy of recognizing the transfers as of the date of the underlying event which caused the movement.
The following is a summary of the inputs used as of December 31, 2010, in valuing the Fund’s assets and liabilities carried at fair value:
| | | | | | | | | | | | | | | | |
| | | Level 1 | | | Level 2 | | | Level 3 | | | Total | |
| | | | |
Assets: | | | | | | | | | | | | | | | | |
Investments in Securities: | | | | | | | | | | | | | | | | |
Equity Investments:a | | | | | | | | | | | | | | | | |
Consumer Discretionary | | $ | 160,342,037 | | | $ | 13,695,899 | | | $ | 34,721 | | | $ | 174,072,657 | |
Energy | | | 589,469,248 | | | | 57,712,400 | | | | — | | | | 647,181,648 | |
Financials | | | 552,460,963 | | | | 36,037,177 | | | | — | | | | 588,498,140 | |
Health Care | | | 405,133,801 | | | | 14,748,750 | | | | — | | | | 419,882,551 | |
All Other Equity Investmentsb | | | 1,634,356,041 | | | | — | | | | — | | | | 1,634,356,041 | |
Equity-Linked Securities | | | | | | | 89,898,761 | | | | — | | | | 89,898,761 | |
Convertible Bonds | | | — | | | | 68,569,038 | | | | — | | | | 68,569,038 | |
Corporate Bonds | | | — | | | | 3,768,062,544 | | | | — | | | | 3,768,062,544 | |
Senior Floating Rate Interests | | | — | | | | 405,539,439 | | | | — | | | | 405,539,439 | |
Asset-Backed Securities and Commercial Mortgage-Backed Securities | | | — | | | | 35,613,310 | | | | — | | | | 35,613,310 | |
Municipal Bonds | | | — | | | | 40,174,762 | | | | — | | | | 40,174,762 | |
Short Term Investments | | | — | | | | 243,387,001 | | | | — | | | | 243,387,001 | |
| | | | |
Total Investments in Securities | | $ | 3,341,762,090 | | | $ | 4,773,439,081 | | | $ | 34,721 | | | $ | 8,115,235,892 | |
| | | | |
Liabilities: | | | | | | | | | | | | | | | | |
Options Written | | | 419,000 | | | | — | | | | — | | | | 419,000 | |
aIncludes common, preferred, and convertible preferred stocks as well as other equity investments.
bFor detailed industry descriptions, see the accompanying Statement of Investments.
12. SUBSEQUENT EVENTS
The Fund has evaluated subsequent events through the issuance of the financial statements and determined that no events have occurred that require disclosure other than those already disclosed in the financial statements.
FI-34
Franklin Templeton Variable Insurance Products Trust
Notes to Financial Statements (continued)
Franklin Income Securities Fund
| | |
ABBREVIATIONS | | |
| Currency | | Selected Portfolio |
| | |
| Euro - Euro | | ADR - American Depository Receipt |
| GBP - British Pound | | FRN - Floating Rate Note |
| | GO - General Obligation |
| | L/C - Letter of Credit |
| | MTN - Medium Term Note |
| | PIK - Payment-In-Kind |
FI-35
Franklin Templeton Variable Insurance Products Trust
Franklin Income Securities Fund
Report of Independent Registered Public Accounting Firm
To the Board of Trustees and Shareholders of Franklin Templeton Variable Insurance Products Trust
In our opinion, the accompanying statement of assets and liabilities, including the statement of investments, and the related statements of operations and of changes in net assets and the financial highlights present fairly, in all material respects, the financial position of Franklin Income Securities Fund (the “Fund”) at December 31, 2010, the results of its operations for the year then ended, the changes in its net assets for each of the two years in the period then ended and the financial highlights for each of the periods presented, in conformity with accounting principles generally accepted in the United States of America. These financial statements and financial highlights (hereafter referred to as “financial statements”) are the responsibility of the Fund’s management. Our responsibility is to express an opinion on these financial statements based on our audits. We conducted our audits of these financial statements in accordance with the standards of the Public Company Accounting Oversight Board (United States). Those standards require that we plan and perform the audit to obtain reasonable assurance about whether the financial statements are free of material misstatement. An audit includes examining, on a test basis, evidence supporting the amounts and disclosures in the financial statements, assessing the accounting principles used and significant estimates made by management, and evaluating the overall financial statement presentation. We believe that our audits, which included confirmation of securities at December 31, 2010 by correspondence with the custodian and brokers, provide a reasonable basis for our opinion.
PricewaterhouseCoopers LLP
San Francisco, California
February 10, 2011
FI-36
Franklin Templeton Variable Insurance Products Trust
Tax Designation (unaudited)
Franklin Income Securities Fund
Under Section 854(b)(2) of the Internal Revenue Code, the Fund designates 18.38% of the ordinary income dividends as income qualifying for the dividends received deduction for the fiscal year ended December 31, 2010.
FI-37
FRANKLIN LARGE CAP GROWTH SECURITIES FUND
This annual report for Franklin Large Cap Growth Securities Fund covers the fiscal year ended December 31, 2010.
Performance Summary as of 12/31/10
Average annual total return of Class 4 shares* represents the average annual change in value, assuming reinvestment of dividends and capital gains. Average returns smooth out variations in returns, which can be significant; they are not the same as year-by-year results.
Periods ended 12/31/10
| | | | | | | | | | | | |
| | | 1-Year | | | 5-Year | | | 10-Year | |
Average Annual Total Return | | | +11.55% | | | | +2.28% | | | | +0.65% | |
*For the period beginning 2/29/08, Class 4 performance reflects a 12b-1 fee expense of 0.35% per year, which affects future performance. Class 4 performance prior to 2/29/08 reflects historical Class 1 performance, which does not have a 12b-1 fee expense. Since 2/29/08 (effective date), the average annual total return of Class 4 shares was +1.08%.
Total Return Index Comparison
for a Hypothetical $10,000 Investment (1/1/01–12/31/10)
The graph below shows the change in value of a hypothetical $10,000 investment in the Fund over the indicated period and includes reinvestment of any income or distributions. The Fund’s performance* is compared to the performance of the Standard & Poor’s 500 Index (S&P 500) and the Russell 1000® Growth Index. One cannot invest directly in an index, and an index is not representative of the Fund’s portfolio. Please see Important Notes to Performance Information preceding the Fund Summaries.
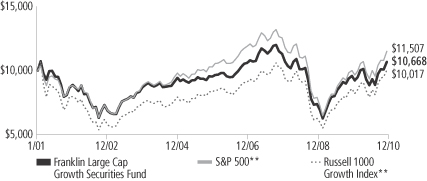
**Source: © 2011 Morningstar. Please see Index Descriptions following the Fund Summaries.
Franklin Large Cap Growth Securities Fund Class 4
Performance reflects the Fund’s Class 4 operating expenses, but does not include any contract fees, expenses or sales charges. If they had been included, performance would be lower. These charges and deductions, particularly for variable life policies, can have a significant effect on contract values and insurance benefits. See the contract prospectus for a complete description of these expenses, including sales charges.
Performance data represent past performance, which does not guarantee future results. Investment return and principal value will fluctuate, and you may have a gain or loss when you sell your shares.
Current performance may differ from figures shown.
FLG-1
Fund Goal and Main Investments: Franklin Large Cap Growth Securities Fund seeks capital appreciation. The Fund normally invests at least 80% of its net assets in investments of large-capitalization companies. For this Fund, large-capitalization companies are those with market capitalization values within those of the top 50% of companies in the Russell 1000 Index at the time of purchase.1
Performance Overview
You can find the Fund’s one-year total return in the Performance Summary. The Fund underperformed its primary benchmark, the S&P 500, which posted a +15.06% total return.2 The Fund also underperformed its secondary benchmark, the Russell 1000 Growth Index, which delivered a +16.71% total return for the same period.2
Economic and Market Overview
During the 12-month period ended December 31, 2010, the U.S. economy grew unevenly, supported by a combination of fundamental business improvement and government intervention. Economic activity as measured by gross domestic product expanded at an annualized 3.7% pace in 2010’s first quarter and then downshifted to 1.7% annualized in the second quarter. Consumer spending picked up, likely due to pent-up post-recession demand, and the pace of growth rose at annualized rates of 2.6% in the third quarter and an estimated 3.2% in the fourth quarter.
Challenges such as mixed economic data, elevated debt concerns surrounding the U.S. budget deficit and a lack of job prospects for the unemployed hindered consumer confidence and the economy’s advance. During the early part of the annual period, home prices rose in many regions due to low interest rates, a first-time homebuyer tax credit program, and prices dipping to levels that lured buyers. Later in the period, home sales stalled as the homebuyer tax credit program ended, foreclosures mounted and the housing sector remained weak.
Amid signs of a demand-led recovery, crude oil prices rose from $79 per barrel at the end of December 2009 to a then 17-month high of $87 in early April. But as doubts surfaced about the recovery’s sustainability, oil prices dipped to $66 in late May. Prices rebounded to $91 per barrel by the end of December 2010 largely due to accelerating global
1. Please see Index Descriptions following the Fund Summaries.
2. Source: © 2011 Morningstar. One cannot invest directly in an index, and an index is not representative of the Fund’s portfolio. Please see Index Descriptions following the Fund Summaries.
Fund Risks: The Fund’s investments in stocks may offer the potential for long-term gains but can be subject to short-term price fluctuations. The Fund may have substantial investments in particular sectors from time to time, such as the technology sector (including health care technology, electronic technology and technology services), which has been among the most volatile sectors in the market, as well as the communications and financial services sectors, and may be at greater risk from adverse developments in a sector than a fund that invests more broadly. Smaller and midsize company securities can increase the risk of greater price fluctuations, particularly over the short term. Foreign investing involves additional risks, including currency fluctuations, economic instability, market volatility, and political and social instability. The manager applies various techniques and analyses in making investment decisions for the Fund, but there can be no guarantee that these decisions will produce the desired results. The Fund’s prospectus also includes a description of the main investment risks.
FLG-2
demand. The pace of inflation slowed during the year, and in December 2010 the inflation rate was an annualized 1.5%.3 Similarly, core inflation, which excludes volatile food and energy costs, slowed to a 0.8% annualized rate.3 Companies added jobs throughout the period, and the unemployment rate fell from 10.0% in December 2009 to 9.4% at period-end.3 The decline was attributable in part to a shrinking labor force as some unemployed workers stopped looking for jobs.
Given few inflationary pressures and uncertainty surrounding the economic recovery, the Federal Open Market Committee (FOMC) made no major changes to its monetary policy for most of the period. The FOMC repeatedly stated it would keep the federal funds target rate within the exceptionally low 0% to 0.25% range “for an extended period” and eventually shifted its focus to its outlook and the status of its current holdings. In September, the FOMC revealed concerns about the subdued recovery and said inflation was below the pace “consistent with its mandate.” Having already lowered interest rates effectively to zero, the FOMC announced its intention to purchase government securities to stimulate the economy and promote a low level of inflation consistent with healthy economic growth.
Investor confidence shifted with each release of encouraging or discouraging economic, regulatory and political news, stoking considerable volatility among equities. Ultimately, stock indexes posted solid gains during the 12 months under review as investor risk aversion began to subside amid generally improving economic signs and rising consumer spending. Overall, the blue-chip stocks of the Dow Jones Industrial Average delivered a +14.06% total return, while the broader S&P 500 posted a +15.06% total return and the technology-heavy NASDAQ Composite Index produced a total return of +18.02%.2 During the period, growth stocks outperformed their value counterparts. Performance among the major sectors was positive, with consumer discretionary, industrials and materials making the largest gains, while health care and utilities had weaker results.
3. Source: Bureau of Labor Statistics.
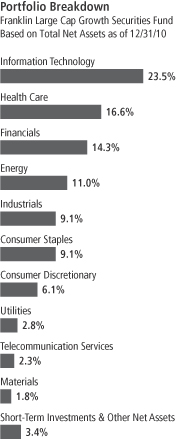
FLG-3
Investment Strategy
We employ our long-held strategy: bottom-up, individual-company, fundamental research aimed at opportunistically finding what we believe to be outstanding large-cap companies across all sectors, at valuations we believe understate their fair worth, with future growth potential being a key driver of estimated worth. In doing so, we work hard to ensure we are being adequately compensated for the risks that are inherent to all forecasting efforts, aiming to own those stocks that make the most sense from a risk/return perspective. We believe this disciplined, bottom-up analysis of future growth potential, current valuation and other risks on a stock-by-stock basis best supports our efforts to maintain a portfolio with superior risk/return characteristics and thus affords us the best prospects for strong performance over the long term.
Manager’s Discussion
Looking back on the key factors impacting the Fund’s returns during the year under review, we would like to remind shareholders that our investment strategy is primarily bottom-up and driven by individual stock selection. However, we recognize that a sector-based discussion can be a helpful way to organize a portfolio review of key performance drivers.
From a sector perspective, our underweighted allocation and stock selection in the financials sector helped the Fund’s performance relative to the S&P 500. In particular, our positions in financial services company Bank of America and conglomerate holding company Berkshire Hathaway boosted performance. Stock selection in the consumer staples sector also aided relative results partly due to our holdings in beverage maker Hansen Natural,4 supermarket chain Safeway and membership warehouse chain Costco Wholesale.
Other key contributors to relative Fund returns included data management company NetApp, chemical producer Celanese4 and communications equipment manufacturer Polycom.4
In contrast, the Fund’s overweighted allocation and stock selection in health care relative to the S&P 500 hampered performance, particularly our positions in medical device manufacturer Medtronic, biotechnology firm Gilead Sciences, and pharmaceutical companies Roche Holding4
4. This holding is not an index component.
Top 10 Holdings
Franklin Large Cap Growth
Securities Fund
12/31/10
| | | | |
Company
Sector/Industry | | % of Total
Net Assets | |
| Exxon Mobil Corp. | | | 3.5% | |
| Energy | | | | |
| Wells Fargo & Co. | | | 2.7% | |
| Financials | | | | |
| Apple Inc. | | | 2.7% | |
| Information Technology | | | | |
| JPMorgan Chase & Co. | | | 2.3% | |
| Financials | | | | |
| General Electric Co. | | | 2.1% | |
| Industrials | | | | |
| International Business Machines Corp. | | | 2.1% | |
| Information Technology | | | | |
| Google Inc. | | | 2.0% | |
| Information Technology | | | | |
| Kohl’s Corp. | | | 1.8% | |
| Consumer Discretionary | | | | |
| U.S. Bancorp | | | 1.8% | |
| Financials | | | | |
| Schlumberger Ltd. | | | 1.8% | |
| Energy | | | | |
The dollar value, number of shares or principal amount, and names of all portfolio holdings are listed in the Fund’s Statement of Investments.
FLG-4
and Teva Pharmaceutical Industries.4 The consumer discretionary sector also weighed on results, largely due to underweighting and stock selection. Kohl’s, a department store operator, underperformed.
Other key detractors from relative Fund returns included electronic equipment manufacturer Hewlett-Packard, electricity and natural gas provider Exelon and health insurer Aetna.
Thank you for your participation in Franklin Large Cap Growth Securities Fund. We look forward to serving your future investment needs.
The foregoing information reflects our analysis, opinions and portfolio holdings as of December 31, 2010, the end of the reporting period. The way we implement our main investment strategies and the resulting portfolio holdings may change depending on factors such as market and economic conditions. These opinions may not be relied upon as investment advice or an offer for a particular security. The information is not a complete analysis of every aspect of any market, country, industry, security or the Fund. Statements of fact are from sources considered reliable, but the investment manager makes no representation or warranty as to their completeness or accuracy. Although historical performance is no guarantee of future results, these insights may help you understand our investment management philosophy.
FLG-5
Fund Expenses
As an investor in a variable insurance contract (Contract) that indirectly provides for investment in an underlying mutual fund, you can incur transaction and/or ongoing expenses at both the Fund level and the Contract level.
| • | | Transaction expenses can include sales charges (loads) on purchases, redemption fees, surrender fees, transfer fees and premium taxes. |
| • | | Ongoing expenses can include management fees, distribution and service (12b-1) fees, contract fees, annual maintenance fees, mortality and expense risk fees and other fees and expenses. All mutual funds and Contracts have some types of ongoing expenses. |
The expenses shown in the table are meant to highlight ongoing expenses at the Fund level only and do not include ongoing expenses at the Contract level, or transaction expenses at either the Fund or Contract level. While the Fund does not have transaction expenses, if the transaction and ongoing expenses at the Contract level were included, the expenses shown would be higher. You should consult your Contract prospectus or disclosure document for more information.
The table shows Fund-level ongoing expenses and can help you understand these expenses and compare them with those of other mutual funds offered through the Contract. The table assumes a $1,000 investment held for the six months indicated. Please refer to the Fund prospectus for additional information on operating expenses.
Actual Fund Expenses
The first line (Actual) of the table provides actual account values and expenses. The “Ending Account Value” is derived from the Fund’s actual return, which includes the effect of ongoing Fund expenses, but does not include the effect of ongoing Contract expenses.
You can estimate the Fund-level expenses you incurred during the period by following these steps. Of course, your account value and expenses will differ from those in this illustration:
| 1. | Divide your account value by $1,000. |
If an account had an $8,600 value, then $8,600 ÷ $1,000 = 8.6.
| 2. | Multiply the result by the number under the heading “Fund-Level Expenses Incurred During Period.” |
If Fund-Level Expenses Incurred During Period were $7.50, then 8.6 x $7.50 = $64.50.
In this illustration, the estimated expenses incurred this period at the Fund level are $64.50.
Franklin Large Cap Growth Securities Fund Class 4
FLG-6
Hypothetical Example for Comparison with Other Mutual Funds
Information in the second line (Hypothetical) of the table can help you compare ongoing expenses of the Fund with those of other mutual funds offered through the Contract. This information may not be used to estimate the actual ending account balance or expenses you incurred during the period. The hypothetical “Ending Account Value” is based on the Fund’s actual expense ratio and an assumed 5% annual rate of return before expenses, which does not represent the Fund’s actual return. The figure under the heading “Fund-Level Expenses Incurred During Period” shows the hypothetical expenses your account would have incurred under this scenario. You can compare this figure with the 5% hypothetical examples that appear in shareholder reports of other funds offered through a Contract.
| | | | | | | | | | | | |
| Class 4 | | Beginning
Account Value 7/1/10 | | | Ending
Account
Value 12/31/10 | | | Fund-Level
Expenses Incurred
During Period*
7/1/10–12/31/10 | |
Actual | | $ | 1,000 | | | $ | 1,204.50 | | | $ | 6.50 | |
Hypothetical (5% return before expenses) | | $ | 1,000 | | | $ | 1,019.31 | | | $ | 5.96 | |
*Expenses are calculated using the most recent six-month annualized expense ratio for the Fund’s Class 4 shares (1.17%), which does not include any ongoing expenses of the Contract for which the Fund is an investment option, multiplied by the average account value over the period, multiplied by 184/365 to reflect the one-half year period.
FLG-7
Franklin Templeton Variable Insurance Products Trust
Financial Highlights
Franklin Large Cap Growth Securities Fund
| | | | | | | | | | | | | | | | | | | | |
| | | Year Ended December 31, | |
| Class 1 | | 2010 | | | 2009 | | | 2008 | | | 2007 | | | 2006 | |
| | | | |
Per share operating performance | | | | | | | | | | | | | | | | | | | | |
(for a share outstanding throughout the year) | | | | | | | | | | | | | | | | | | | | |
Net asset value, beginning of year | | $ | 13.62 | | | $ | 10.66 | | | $ | 17.51 | | | $ | 16.70 | | | $ | 15.17 | |
| | | | |
Income from investment operationsa: | | | | | | | | | | | | | | | | | | | | |
Net investment incomeb | | | 0.12 | | | | 0.12 | | | | 0.17 | | | | 0.21 | | | | 0.17 | |
Net realized and unrealized gains (losses) | | | 1.48 | | | | 3.04 | | | | (5.82 | ) | | | 0.89 | | | | 1.51 | |
| | | | |
Total from investment operations | | | 1.60 | | | | 3.16 | | | | (5.65 | ) | | | 1.10 | | | | 1.68 | |
| | | | |
Less distributions from: | | | | | | | | | | | | | | | | | | | | |
Net investment income | | | (0.15 | ) | | | (0.20 | ) | | | (0.24 | ) | | | (0.16 | ) | | | (0.15 | ) |
Net realized gains | | | — | | | | — | | | | (0.96 | ) | | | (0.13 | ) | | | — | |
| | | | |
Total distributions | | | (0.15 | ) | | | (0.20 | ) | | | (1.20 | ) | | | (0.29 | ) | | | (0.15 | ) |
| | | | |
Net asset value, end of year | | $ | 15.07 | | | $ | 13.62 | | | $ | 10.66 | | | $ | 17.51 | | | $ | 16.70 | |
| | | | |
| | | | | |
Total returnc | | | 11.85% | | | | 30.04% | | | | (34.39)% | | | | 6.53% | | | | 11.17% | |
Ratios to average net assets | | | | | | | | | | | | | | | | | | | | |
Expenses | | | 0.79% | | | | 0.81% | d | | | 0.77% | d | | | 0.74% | d | | | 0.76% | d |
Net investment income | | | 0.86% | | | | 1.03% | | | | 1.19% | | | | 1.21% | | | | 1.11% | |
| | | | | |
Supplemental data | | | | | | | | | | | | | | | | | | | | |
Net assets, end of year (000’s) | | $ | 58,265 | | | $ | 58,287 | | | $ | 51,651 | | | $ | 96,920 | | | $ | 114,929 | |
Portfolio turnover rate | | | 46.75% | | | | 71.95% | | | | 66.04% | | | | 50.67% | | | | 50.97% | |
aThe amount shown for a share outstanding throughout the period may not correlate with the Statement of Operations for the period due to the timing of sales and repurchases of the Fund shares in relation to income earned and/or fluctuating market value of the investments of the Fund.
bBased on average daily shares outstanding.
cTotal return does not include fees, charges or expenses imposed by the variable annuity and life insurance contracts for which the Franklin Templeton Variable Insurance Products Trust serves as an underlying investment vehicle.
dBenefit of expense reduction rounds to less than 0.01%.
The accompanying notes are an integral part of these financial statements.
FLG-8
Franklin Templeton Variable Insurance Products Trust
Financial Highlights (continued)
Franklin Large Cap Growth Securities Fund
| | | | | | | | | | | | | | | | | | | | |
| | | Year Ended December 31, | |
| Class 2 | | 2010 | | | 2009 | | | 2008 | | | 2007 | | | 2006 | |
| | | | |
Per share operating performance | | | | | | | | | | | | | | | | | | | | |
(for a share outstanding throughout the year) | | | | | | | | | | | | | | | | | | | | |
Net asset value, beginning of year | | $ | 13.43 | | | $ | 10.50 | | | $ | 17.25 | | | $ | 16.47 | | | $ | 14.97 | |
| | | | |
Income from investment operationsa: | | | | | | | | | | | | | | | | | | | | |
Net investment incomeb | | | 0.08 | | | | 0.09 | | | | 0.13 | | | | 0.17 | | | | 0.13 | |
Net realized and unrealized gains (losses) | | | 1.46 | | | | 3.00 | | | | (5.73 | ) | | | 0.87 | | | | 1.49 | |
| | | | |
Total from investment operations | | | 1.54 | | | | 3.09 | | | | (5.60 | ) | | | 1.04 | | | | 1.62 | |
| | | | |
Less distributions from: | | | | | | | | | | | | | | | | | | | | |
Net investment income | | | (0.11 | ) | | | (0.16 | ) | | | (0.19 | ) | | | (0.13 | ) | | | (0.12 | ) |
Net realized gains | | | — | | | | — | | | | (0.96 | ) | | | (0.13 | ) | | | — | |
| | | | |
Total distributions | | | (0.11 | ) | | | (0.16 | ) | | | (1.15 | ) | | | (0.26 | ) | | | (0.12 | ) |
| | | | |
Net asset value, end of year | | $ | 14.86 | | | $ | 13.43 | | | $ | 10.50 | | | $ | 17.25 | | | $ | 16.47 | |
| | | | |
| | | | | |
Total returnc | | | 11.59% | | | | 29.73% | | | | (34.53)% | | | | 6.23% | | | | 10.90% | |
Ratios to average net assets | | | | | | | | | | | | | | | | | | | | |
Expenses | | | 1.04% | | | | 1.06% | d | | | 1.02% | d | | | 0.99% | d | | | 1.01% | d |
Net investment income | | | 0.61% | | | | 0.78% | | | | 0.94% | | | | 0.96% | | | | 0.86% | |
| | | | | |
Supplemental data | | | | | | | | | | | | | | | | | | | | |
Net assets, end of year (000’s) | | $ | 357,405 | | | $ | 373,821 | | | $ | 328,597 | | | $ | 642,351 | | | $ | 636,592 | |
Portfolio turnover rate | | | 46.75% | | | | 71.95% | | | | 66.04% | | | | 50.67% | | | | 50.97% | |
aThe amount shown for a share outstanding throughout the period may not correlate with the Statement of Operations for the period due to the timing of sales and repurchases of the Fund shares in relation to income earned and/or fluctuating market value of the investments of the Fund.
bBased on average daily shares outstanding.
cTotal return does not include fees, charges or expenses imposed by the variable annuity and life insurance contracts for which the Franklin Templeton Variable Insurance Products Trust serves as an underlying investment vehicle.
dBenefit of expense reduction rounds to less than 0.01%.
The accompanying notes are an integral part of these financial statements.
FLG-9
Franklin Templeton Variable Insurance Products Trust
Financial Highlights (continued)
Franklin Large Cap Growth Securities Fund
| | | | | | | | | | | | |
| | | Year Ended December 31, | |
| Class 4 | | 2010 | | | 2009 | | | 2008a | |
| | | | |
Per share operating performance | | | | | | | | | | | | |
(for a share outstanding throughout the year) | | | | | | | | | | | | |
Net asset value, beginning of year | | $ | 13.57 | | | $ | 10.62 | | | $ | 16.05 | |
| | | | |
Income from investment operationsb: | | | | | | | | | | | | |
Net investment incomec | | | 0.07 | | | | 0.09 | | | | 0.11 | |
Net realized and unrealized gains (losses) | | | 1.48 | | | | 3.02 | | | | (4.34 | ) |
| | | | |
Total from investment operations | | | 1.55 | | | | 3.11 | | | | (4.23 | ) |
| | | | |
Less distributions from: | | | | | | | | | | | | |
Net investment income | | | (0.10 | ) | | | (0.16 | ) | | | (0.24 | ) |
Net realized gains | | | — | | | | — | | | | (0.96 | ) |
| | | | |
Total distributions | | | (0.10 | ) | | | (0.16 | ) | | | (1.20 | ) |
| | | | |
Net asset value, end of year | | $ | 15.02 | | | $ | 13.57 | | | $ | 10.62 | |
| | | | |
| | | |
Total returnd | | | 11.55% | | | | 29.58% | | | | (28.68)% | |
Ratios to average net assetse | | | | | | | | | | | | |
Expenses | | | 1.14% | | | | 1.16%f | | | | 1.12%f | |
Net investment income | | | 0.51% | | | | 0.68% | | | | 0.84% | |
| | | |
Supplemental data | | | | | | | | | | | | |
Net assets, end of year (000’s) | | $ | 5 | | | $ | 4 | | | $ | 3 | |
Portfolio turnover rate | | | 46.75% | | | | 71.95% | | | | 66.04% | |
aFor the period February 29, 2008 (effective date) to December 31, 2008.
bThe amount shown for a share outstanding throughout the period may not correlate with the Statement of Operations for the period due to the timing of sales and repurchases of the Fund shares in relation to income earned and/or fluctuating market value of the investments of the Fund.
cBased on average daily shares outstanding.
dTotal return does not include fees, charges or expenses imposed by the variable annuity and life insurance contracts for which the Franklin Templeton Variable Insurance Products Trust serves as an underlying investment vehicle. Total return is not annualized for periods less than one year.
eRatios are annualized for periods less than one year.
fBenefit of expense reduction rounds to less than 0.01%.
The accompanying notes are an integral part of these financial statements.
FLG-10
Franklin Templeton Variable Insurance Products Trust
Statement of Investments, December 31, 2010
| | | | | | | | | | | | |
| Franklin Large Cap Growth Securities Fund | | Country | | | Shares | | | Value | |
Common Stocks 96.6% | | | | | | | | | | | | |
Consumer Discretionary 6.1% | | | | | | | | | | | | |
Best Buy Co. Inc. | | | United States | | | | 70,903 | | | $ | 2,431,265 | |
aGeneral Motors Co. | | | United States | | | | 66,100 | | | | 2,436,446 | |
Guess? Inc. | | | United States | | | | 55,300 | | | | 2,616,796 | |
aKohl’s Corp. | | | United States | | | | 138,800 | | | | 7,542,392 | |
Marriott International Inc., A | | | United States | | | | 83,300 | | | | 3,460,282 | |
Target Corp. | | | United States | | | | 77,900 | | | | 4,684,127 | |
The Walt Disney Co. | | | United States | | | | 61,200 | | | | 2,295,612 | |
| | | | | | | | | | | | |
| | | | | | | | | | | 25,466,920 | |
| | | | | | | | | | | | |
Consumer Staples 9.1% | | | | | | | | | | | | |
Costco Wholesale Corp. | | | United States | | | | 63,600 | | | | 4,592,556 | |
CVS Caremark Corp. | | | United States | | | | 146,300 | | | | 5,086,851 | |
aHansen Natural Corp. | | | United States | | | | 56,400 | | | | 2,948,592 | |
PepsiCo Inc. | | | United States | | | | 78,000 | | | | 5,095,740 | |
Philip Morris International Inc. | | | United States | | | | 71,000 | | | | 4,155,630 | |
The Procter & Gamble Co. | | | United States | | | | 97,945 | | | | 6,300,802 | |
Wal-Mart Stores Inc. | | | United States | | | | 74,200 | | | | 4,001,606 | |
Walgreen Co. | | | United States | | | | 139,154 | | | | 5,421,439 | |
| | | | | | | | | | | | |
| | | | | | | | | | | 37,603,216 | |
| | | | | | | | | | | | |
Energy 11.0% | | | | | | | | | | | | |
Chevron Corp. | | | United States | | | | 59,900 | | | | 5,465,875 | |
ConocoPhillips | | | United States | | | | 75,300 | | | | 5,127,930 | |
Devon Energy Corp. | | | United States | | | | 91,500 | | | | 7,183,665 | |
Exxon Mobil Corp. | | | United States | | | | 199,800 | | | | 14,609,376 | |
Marathon Oil Corp. | | | United States | | | | 48,500 | | | | 1,795,955 | |
aPetrohawk Energy Corp. | | | United States | | | | 231,500 | | | | 4,224,875 | |
Schlumberger Ltd. | | | United States | | | | 87,670 | | | | 7,320,445 | |
| | | | | | | | | | | | |
| | | | | | | | | | | 45,728,121 | |
| | | | | | | | | | | | |
Financials 14.3% | | | | | | | | | | | | |
Aflac Inc. | | | United States | | | | 36,700 | | | | 2,070,981 | |
The Allstate Corp. | | | United States | | | | 128,109 | | | | 4,084,115 | |
Bank of America Corp. | | | United States | | | | 266,200 | | | | 3,551,108 | |
aBerkshire Hathaway Inc., B | | | United States | | | | 21,700 | | | | 1,738,387 | |
BlackRock Inc. | | | United States | | | | 7,400 | | | | 1,410,292 | |
aCitigroup Inc. | | | United States | | | | 617,000 | | | | 2,918,410 | |
Invesco Ltd. | | | United States | | | | 115,700 | | | | 2,783,742 | |
Janus Capital Group Inc. | | | United States | | | | 106,800 | | | | 1,385,196 | |
JPMorgan Chase & Co. | | | United States | | | | 222,840 | | | | 9,452,873 | |
Northern Trust Corp. | | | United States | | | | 119,400 | | | | 6,615,954 | |
State Street Corp. | | | United States | | | | 55,600 | | | | 2,576,504 | |
T. Rowe Price Group Inc. | | | United States | | | | 36,600 | | | | 2,362,164 | |
U.S. Bancorp | | | United States | | | | 274,527 | | | | 7,403,993 | |
Wells Fargo & Co. | | | United States | | | | 360,200 | | | | 11,162,598 | |
| | | | | | | | | | | | |
| | | | | | | | | | | 59,516,317 | |
| | | | | | | | | | | | |
Health Care 16.6% | | | | | | | | | | | | |
Abbott Laboratories | | | United States | | | | 91,690 | | | | 4,392,868 | |
Aetna Inc. | | | United States | | | | 182,100 | | | | 5,555,871 | |
aAgilent Technologies Inc. | | | United States | | | | 109,600 | | | | 4,540,728 | |
Baxter International Inc. | | | United States | | | | 67,300 | | | | 3,406,726 | |
aCelgene Corp. | | | United States | | | | 103,500 | | | | 6,120,990 | |
aExpress Scripts Inc. | | | United States | | | | 82,800 | | | | 4,475,340 | |
FLG-11
Franklin Templeton Variable Insurance Products Trust
Statement of Investments, December 31, 2010 (continued)
| | | | | | | | | | | | |
| Franklin Large Cap Growth Securities Fund | | Country | | | Shares | | | Value | |
Common Stocks (continued) | | | | | | | | | | | | |
Health Care (continued) | | | | | | | | | | | | |
aGilead Sciences Inc. | | | United States | | | | 137,200 | | | $ | 4,972,128 | |
Johnson & Johnson | | | United States | | | | 97,000 | | | | 5,999,450 | |
Medtronic Inc. | | | United States | | | | 176,600 | | | | 6,550,094 | |
Merck & Co. Inc. | | | United States | | | | 201,575 | | | | 7,264,763 | |
Roche Holding AG, ADR | | | Switzerland | | | | 190,900 | | | | 6,996,485 | |
Teva Pharmaceutical Industries Ltd., ADR | | | Israel | | | | 122,800 | | | | 6,401,564 | |
aThoratec Corp. | | | United States | | | | 86,700 | | | | 2,455,344 | |
| | | | | | | | | | | | |
| | | | | | | | | | | 69,132,351 | |
| | | | | | | | | | | | |
Industrials 9.1% | | | | | | | | | | | | |
The Boeing Co. | | | United States | | | | 34,900 | | | | 2,277,574 | |
Caterpillar Inc. | | | United States | | | | 29,600 | | | | 2,772,336 | |
Expeditors International of Washington Inc. | | | United States | | | | 69,400 | | | | 3,789,240 | |
FedEx Corp. | | | United States | | | | 70,600 | | | | 6,566,506 | |
General Dynamics Corp. | | | United States | | | | 62,900 | | | | 4,463,384 | |
General Electric Co. | | | United States | | | | 483,100 | | | | 8,835,899 | |
Precision Castparts Corp. | | | United States | | | | 15,300 | | | | 2,129,913 | |
Union Pacific Corp. | | | United States | | | | 29,200 | | | | 2,705,672 | |
United Technologies Corp. | | | United States | | | | 52,000 | | | | 4,093,440 | |
| | | | | | | | | | | | |
| | | | | | | | | | | 37,633,964 | |
| | | | | | | | | | | | |
Information Technology 23.5% | | | | | | | | | | | | |
aApple Inc. | | | United States | | | | 34,400 | | | | 11,096,064 | |
aAtheros Communications Inc. | | | United States | | | | 64,001 | | | | 2,298,916 | |
aCisco Systems Inc. | | | United States | | | | 249,000 | | | | 5,037,270 | |
aCree Inc. | | | United States | | | | 33,300 | | | | 2,194,137 | |
aDell Inc. | | | United States | | | | 104,500 | | | | 1,415,975 | |
aEMC Corp. | | | United States | | | | 236,300 | | | | 5,411,270 | |
aFirst Solar Inc. | | | United States | | | | 17,630 | | | | 2,294,368 | |
aFLIR Systems Inc. | | | United States | | | | 150,600 | | | | 4,480,350 | |
aGoogle Inc., A | | | United States | | | | 14,100 | | | | 8,374,977 | |
Hewlett-Packard Co. | | | United States | | | | 144,000 | | | | 6,062,400 | |
Intel Corp. | | | United States | | | | 285,100 | | | | 5,995,653 | |
International Business Machines Corp. | | | United States | | | | 59,300 | | | | 8,702,868 | |
MasterCard Inc., A | | | United States | | | | 22,430 | | | | 5,026,787 | |
Microsoft Corp. | | | United States | | | | 240,000 | | | | 6,700,800 | |
aNetApp Inc. | | | United States | | | | 109,400 | | | | 6,012,624 | |
Oracle Corp. | | | United States | | | | 106,500 | | | | 3,333,450 | |
aPMC-Sierra Inc. | | | United States | | | | 243,360 | | | | 2,090,463 | |
QUALCOMM Inc. | | | United States | | | | 120,000 | | | | 5,938,800 | |
aSilicon Laboratories Inc. | | | United States | | | | 35,900 | | | | 1,652,118 | |
Visa Inc., A | | | United States | | | | 40,500 | | | | 2,850,390 | |
Xilinx Inc. | | | United States | | | | 29,200 | | | | 846,216 | |
| | | | | | | | | | | | |
| | | | | | | | | | | 97,815,896 | |
| | | | | | | | | | | | |
Materials 1.8% | | | | | | | | | | | | |
Celanese Corp., A | | | United States | | | | 122,900 | | | | 5,059,793 | |
Randgold Resources Ltd., ADR | | | United Kingdom | | | | 26,000 | | | | 2,140,580 | |
| | | | | | | | | | | | |
| | | | | | | | | | | 7,200,373 | |
| | | | | | | | | | | | |
Telecommunication Services 2.3% | | | | | | | | | | | | |
AT&T Inc. | | | United States | | | | 143,900 | | | | 4,227,782 | |
Vodafone Group PLC, ADR | | | United Kingdom | | | | 200,200 | | | | 5,291,286 | |
| | | | | | | | | | | | |
| | | | | | | | | | | 9,519,068 | |
| | | | | | | | | | | | |
FLG-12
Franklin Templeton Variable Insurance Products Trust
Statement of Investments, December 31, 2010 (continued)
| | | | | | | | | | | | |
| Franklin Large Cap Growth Securities Fund | | Country | | | Shares | | | Value | |
Common Stocks (continued) | | | | | | | | | | | | |
Utilities 2.8% | | | | | | | | | | | | |
Entergy Corp. | | | United States | | | | 17,700 | | | $ | 1,253,691 | |
Exelon Corp. | | | United States | | | | 51,580 | | | | 2,147,791 | |
FirstEnergy Corp. | | | United States | | | | 39,800 | | | | 1,473,396 | |
Public Service Enterprise Group Inc. | | | United States | | | | 43,400 | | | | 1,380,554 | |
Sempra Energy | | | United States | | | | 56,900 | | | | 2,986,112 | |
The Southern Co. | | | United States | | | | 65,500 | | | | 2,504,065 | |
| | | | | | | | | | | | |
| | | | | | | | | | | 11,745,609 | |
| | | | | | | | | | | | |
Total Common Stocks (Cost $290,086,725) | | | | | | | | | | | 401,361,835 | |
| | | | | | | | | | | | |
| | | |
| | | | | | Principal
Amount | | | | |
Short Term Investments (Cost $14,639,227) 3.5% | |
Repurchase Agreements 3.5% | |
bJoint Repurchase Agreement, 0.141%, 1/03/11 (Maturity Value $14,639,400) | | | United States | | | $ | 14,639,227 | | | | 14,639,227 | |
Barclays Capital Inc. (Maturity Value $2,520,466) | | | | | | | | | | | | |
BNP Paribas Securities Corp. (Maturity Value $2,592,346) | | | | | | | | | | | | |
Credit Suisse Securities (USA) LLC (Maturity Value $1,440,224) | | | | | | | | | | | | |
Deutsche Bank Securities Inc. (Maturity Value $2,325,322) | | | | | | | | | | | | |
HSBC Securities (USA) Inc. (Maturity Value $1,800,353) | | | | | | | | | | | | |
Merrill Lynch, Pierce, Fenner & Smith Inc. (Maturity Value $1,440,224) | | | | | | | | | | | | |
Morgan Stanley & Co. Inc. (Maturity Value $1,800,353) | | | | | | | | | | | | |
UBS Securities LLC (Maturity Value $720,112) | | | | | | | | | | | | |
Collateralized by U.S. Government Agency Securities, 0.50% - 5.75%, 1/07/11 - 10/26/15; cU.S. Treasury Bills, 5/12/11 - 7/28/11; and U.S. Treasury Notes, 0.375% - 1.875%, 9/30/11 - 9/30/17 (valued at $14,955,775) | | | | | | | | | | | | |
| | | | | | | | | | | | |
Total Investments (Cost $304,725,952) 100.1% | | | | | | | | | | | 416,001,062 | |
Other Assets, less Liabilities (0.1)% | | | | | | | | | | | (327,201 | ) |
| | | | | | | | | | | | |
Net Assets 100.0% | | | | | | | | | | $ | 415,673,861 | |
| | | | | | | | | | | | |
See Abbreviations on page FLG-22.
aNon-income producing.
bSee Note 1(c) regarding joint repurchase agreement.
cThe security is traded on a discount basis with no stated coupon rate.
The accompanying notes are an integral part of these financial statements.
FLG-13
Franklin Templeton Variable Insurance Products Trust
Financial Statements
Statement of Assets and Liabilities
December 31, 2010
| | | | |
| | | Franklin
Large Cap Growth
Securities Fund | |
Assets: | | | | |
Investments in securities: | | | | |
Cost - Unaffiliated issuers | | $ | 290,086,725 | |
Cost - Repurchase agreements | | | 14,639,227 | |
| | | | |
Total cost of investments | | $ | 304,725,952 | |
| | | | |
Value - Unaffiliated issuers | | $ | 401,361,835 | |
Value - Repurchase agreements | | | 14,639,227 | |
| | | | |
Total value of investments | | | 416,001,062 | |
Receivables: | | | | |
Capital shares sold | | | 1,315 | |
Dividends | | | 540,857 | |
Other assets | | | 81 | |
| | | | |
Total assets | | | 416,543,315 | |
| | | | |
Liabilities: | | | | |
Payables: | | | | |
Capital shares redeemed | | | 294,518 | |
Affiliates | | | 412,332 | |
Reports to shareholders | | | 130,677 | |
Accrued expenses and other liabilities | | | 31,927 | |
| | | | |
Total liabilities | | | 869,454 | |
| | | | |
Net assets, at value | | $ | 415,673,861 | |
| | | | |
Net assets consist of: | | | | |
Paid-in capital | | $ | 414,014,160 | |
Undistributed net investment income | | | 2,644,532 | |
Net unrealized appreciation (depreciation) | | | 111,275,110 | |
Accumulated net realized gain (loss) | | | (112,259,941 | ) |
| | | | |
Net assets, at value | | $ | 415,673,861 | |
| | | | |
Class 1: | | | | |
Net assets, at value | | $ | 58,264,602 | |
| | | | |
Shares outstanding | | | 3,865,572 | |
| | | | |
Net asset value and maximum offering price per share | | $ | 15.07 | |
| | | | |
Class 2: | | | | |
Net assets, at value | | $ | 357,404,573 | |
| | | | |
Shares outstanding | | | 24,053,423 | |
| | | | |
Net asset value and maximum offering price per share | | $ | 14.86 | |
| | | | |
Class 4: | | | | |
Net assets, at value | | $ | 4,686 | |
| | | | |
Shares outstanding | | | 312 | |
| | | | |
Net asset value and maximum offering price per share | | $ | 15.02 | |
| | | | |
The accompanying notes are an integral part of these financial statements.
FLG-14
Franklin Templeton Variable Insurance Products Trust
Financial Statements (continued)
Statement of Operations
for the year ended December 31, 2010
| | | | |
| | | Franklin
Large Cap Growth
Securities Fund | |
Investment income: | | | | |
Dividends | | $ | 6,731,830 | |
Interest | | | 29,581 | |
| | | | |
Total investment income | | | 6,761,411 | |
| | | | |
Expenses: | | | | |
Management fees (Note 3a) | | | 3,057,988 | |
Distribution fees: (Note 3c) | | | | |
Class 2 | | | 876,867 | |
Class 4 | | | 15 | |
Unaffiliated transfer agent fees | | | 427 | |
Custodian fees (Note 4) | | | 5,792 | |
Reports to shareholders | | | 115,966 | |
Professional fees | | | 33,442 | |
Trustees’ fees and expenses | | | 1,878 | |
Other | | | 23,608 | |
| | | | |
Total expenses | | | 4,115,983 | |
| | | | |
Net investment income | | | 2,645,428 | |
| | | | |
Realized and unrealized gains (losses): | | | | |
Net realized gain (loss) from investments | | | 25,795,539 | |
Net change in unrealized appreciation (depreciation) on investments | | | 16,339,203 | |
| | | | |
Net realized and unrealized gain (loss) | | | 42,134,742 | |
| | | | |
Net increase (decrease) in net assets resulting from operations | | $ | 44,780,170 | |
| | | | |
The accompanying notes are an integral part of these financial statements.
FLG-15
Franklin Templeton Variable Insurance Products Trust
Financial Statements (continued)
Statements of Changes in Net Assets
| | | | | | | | |
| | | Franklin Large Cap
Growth Securities Fund | |
| | | Year Ended December 31, | |
| | | 2010 | | | 2009 | |
| | | | |
Increase (decrease) in net assets: | | | | | | | | |
Operations: | | | | | | | | |
Net investment income | | $ | 2,645,428 | | | $ | 3,159,481 | |
Net realized gain (loss) from investments and foreign currency transactions | | | 25,795,539 | | | | (51,443,844 | ) |
Net change in unrealized appreciation (depreciation) on investments | | | 16,339,203 | | | | 150,444,919 | |
| | | | |
Net increase (decrease) in net assets resulting from operations | | | 44,780,170 | | | | 102,160,556 | |
| | | | |
Distributions to shareholders from: | | | | | | | | |
Net investment income: | | | | | | | | |
Class 1 | | | (595,893 | ) | | | (896,286 | ) |
Class 2 | | | (2,876,875 | ) | | | (4,724,247 | ) |
Class 4 | | | (33 | ) | | | (49 | ) |
| | | | |
Total distributions to shareholders | | | (3,472,801 | ) | | | (5,620,582 | ) |
| | | | |
Capital share transactions: (Note 2) | | | | | | | | |
Class 1 | | | (5,756,855 | ) | | | (6,256,675 | ) |
Class 2 | | | (51,989,055 | ) | | | (38,422,446 | ) |
| | | | |
Total capital share transactions | | | (57,745,910 | ) | | | (44,679,121 | ) |
| | | | |
Net increase (decrease) in net assets | | | (16,438,541 | ) | | | 51,860,853 | |
Net assets: | | | | | | | | |
Beginning of year | | | 432,112,402 | | | | 380,251,549 | |
| | | | |
End of year | | $ | 415,673,861 | | | $ | 432,112,402 | |
| | | | |
Undistributed net investment income included in net assets: | | | | | | | | |
End of year | | $ | 2,644,532 | | | $ | 3,407,918 | |
| | | | |
The accompanying notes are an integral part of these financial statements.
FLG-16
Franklin Templeton Variable Insurance Products Trust
Notes to Financial Statements
Franklin Large Cap Growth Securities Fund
1. ORGANIZATION AND SIGNIFICANT ACCOUNTING POLICIES
Franklin Templeton Variable Insurance Products Trust (Trust) is registered under the Investment Company Act of 1940, as amended, (1940 Act) as an open-end investment company, consisting of twenty separate funds. The Franklin Large Cap Growth Securities Fund (Fund) is included in this report. The financial statements of the remaining funds in the Trust are presented separately. Shares of the Fund are generally sold only to insurance company separate accounts to fund the benefits of variable life insurance policies or variable annuity contracts. The Fund offers three classes of shares: Class 1, Class 2, and Class 4. Each class of shares differs by its distribution fees, voting rights on matters affecting a single class and its exchange privilege.
The following summarizes the Fund’s significant accounting policies.
a. Financial Instrument Valuation
The Fund values its investments in securities and other assets and liabilities carried at fair value daily. Fair value is the price that would be received to sell an asset or paid to transfer a liability in an orderly transaction between market participants on the measurement date. Under procedures approved by the Trust’s Board of Trustees, the Fund may utilize independent pricing services, quotations from securities and financial instrument dealers, and other market sources to determine fair value.
Equity securities listed on an exchange or on the NASDAQ National Market System are valued at the last quoted sale price or the official closing price of the day, respectively. Foreign equity securities are valued as of the close of trading on the foreign stock exchange on which the security is primarily traded, or the NYSE, whichever is earlier. The value is then converted into its U.S. dollar equivalent at the foreign exchange rate in effect at the close of the NYSE on the day that the value of the security is determined. Over-the-counter securities are valued within the range of the most recent quoted bid and ask prices. Securities that trade in multiple markets or on multiple exchanges are valued according to the broadest and most representative market. Certain equity securities are valued based upon fundamental characteristics or relationships to similar securities. Repurchase agreements are valued at cost, which approximates market value.
The Fund has procedures to determine the fair value of securities and other financial instruments for which market prices are not readily available or which may not be reliably priced. Under these procedures, the Fund primarily employs a market-based approach which may use related or comparable assets or liabilities, recent transactions, market multiples, book values, and other relevant information for the investment to determine the fair value of the investment. The Fund may also use an income-based valuation approach in which the anticipated future cash flows of the investment are discounted to calculate fair value. Discounts may also be applied due to the nature or duration of any restrictions on the disposition of the investments. Due to the inherent uncertainty of valuations of such investments, the fair values may differ significantly from the values that would have been used had an active market existed.
Trading in securities on foreign securities stock exchanges and over-the-counter markets may be completed before the daily close of business on the NYSE. Occasionally, events occur between the time at which trading in a foreign security is completed and the close of the NYSE that might call into question the reliability of the value of a portfolio security held by the Fund. As a result, differences may arise between the value of the Fund’s portfolio securities as determined at the foreign market close and the latest indications of value at the close of the NYSE. In order to minimize the potential for these differences, the investment manager monitors price movements following the close of trading in foreign stock markets through a series of country specific market proxies (such as baskets of American Depository Receipts, futures contracts and exchange traded funds). These price movements are measured against established trigger thresholds for each specific market proxy to assist in determining if an event has occurred that may call into question the reliability of the values of the foreign securities held by the Fund. If such an event occurs, the securities may be valued using fair value procedures, which may include the use of independent pricing services.
FLG-17
Franklin Templeton Variable Insurance Products Trust
Notes to Financial Statements (continued)
Franklin Large Cap Growth Securities Fund
1. ORGANIZATION AND SIGNIFICANT ACCOUNTING POLICIES (continued)
b. Foreign Currency Translation
Portfolio securities and other assets and liabilities denominated in foreign currencies are translated into U.S. dollars based on the exchange rate of such currencies against U.S. dollars on the date of valuation. The Fund may enter into foreign currency exchange contracts to facilitate transactions denominated in a foreign currency. Purchases and sales of securities, income and expense items denominated in foreign currencies are translated into U.S. dollars at the exchange rate in effect on the transaction date. Portfolio securities and assets and liabilities denominated in foreign currencies contain risks that those currencies will decline in value relative to the U.S. dollar. Occasionally, events may impact the availability or reliability of foreign exchange rates used to convert the U.S. dollar equivalent value. If such an event occurs, the foreign exchange rate will be valued at fair value using procedures established and approved by the Trust’s Board of Trustees.
The Fund does not separately report the effect of changes in foreign exchange rates from changes in market prices on securities held. Such changes are included in net realized and unrealized gain or loss from investments on the Statement of Operations.
Realized foreign exchange gains or losses arise from sales of foreign currencies, currency gains or losses realized between the trade and settlement dates on securities transactions and the difference between the recorded amounts of dividends, interest, and foreign withholding taxes and the U.S. dollar equivalent of the amounts actually received or paid. Net unrealized foreign exchange gains and losses arise from changes in foreign exchange rates on foreign denominated assets and liabilities other than investments in securities held at the end of the reporting period.
c. Joint Repurchase Agreement
The Fund may enter into a joint repurchase agreement whereby its uninvested cash balance is deposited into a joint cash account with other funds managed by the investment manager or an affiliate of the investment manager and is used to invest in one or more repurchase agreements. The value and face amount of the joint repurchase agreement are allocated to the funds based on their pro-rata interest. A repurchase agreement is accounted for as a loan by the fund to the seller, collateralized by securities which are delivered to the fund’s custodian. The market value, including accrued interest, of the initial collateralization is required to be at least 102% of the dollar amount invested by the funds, with the value of the underlying securities marked to market daily to maintain coverage of at least 100%. The joint repurchase agreement held by the Fund at year end had been entered into on December 31, 2010.
d. Income Taxes
It is the Fund’s policy to qualify as a regulated investment company under the Internal Revenue Code. The Fund intends to distribute to shareholders substantially all of its taxable income and net realized gains to relieve it from federal income and excise taxes. As a result, no provision for U.S. federal income taxes is required. The Fund files U.S. income tax returns as well as tax returns in certain other jurisdictions. The Fund’s application of those tax rules is subject to its understanding. The Fund records a provision for taxes in its financial statements including penalties and interest, if any, for a tax position taken on a tax return (or expected to be taken) when it fails to meet the more likely than not (a greater than 50% probability) threshold and based on the technical merits, the tax position may not be sustained upon examination by the tax authorities. As of December 31, 2010, and for all open tax years, the Fund has determined that no provision for income tax is required in the Fund’s financial statements. Open tax years are those that remain subject to examination and are based on each tax jurisdiction statute of limitation. The Fund is not aware of any tax position for which it is reasonably possible that the total amounts of unrecognized tax effects will significantly change in the next twelve months.
FLG-18
Franklin Templeton Variable Insurance Products Trust
Notes to Financial Statements (continued)
Franklin Large Cap Growth Securities Fund
1. ORGANIZATION AND SIGNIFICANT ACCOUNTING POLICIES (continued)
e. Security Transactions, Investment Income, Expenses and Distributions
Security transactions are accounted for on trade date. Realized gains and losses on security transactions are determined on a specific identification basis. Interest income and estimated expenses are accrued daily. Dividend income is recorded on the ex-dividend date. Distributions to shareholders are recorded on the ex-dividend date and are determined according to income tax regulations (tax basis). Distributable earnings determined on a tax basis may differ from earnings recorded in accordance with accounting principles generally accepted in the United States of America. These differences may be permanent or temporary. Permanent differences are reclassified among capital accounts to reflect their tax character. These reclassifications have no impact on net assets or the results of operations. Temporary differences are not reclassified, as they may reverse in subsequent periods.
Common expenses incurred by the Trust are allocated among the funds based on the ratio of net assets of each fund to the combined net assets of the Trust. Fund specific expenses are charged directly to the fund that incurred the expense.
Realized and unrealized gains and losses and net investment income, not including class specific expenses, are allocated daily to each class of shares based upon the relative proportion of net assets of each class. Differences in per share distributions, by class, are generally due to differences in class specific expenses.
f. Accounting Estimates
The preparation of financial statements in accordance with accounting principles generally accepted in the United States of America requires management to make estimates and assumptions that affect the reported amounts of assets and liabilities at the date of the financial statements and the amounts of income and expenses during the reporting period. Actual results could differ from those estimates.
g. Guarantees and Indemnifications
Under the Trust’s organizational documents, its officers and trustees are indemnified by the Trust against certain liabilities arising out of the performance of their duties to the Trust. Additionally, in the normal course of business, the Trust, on behalf of the Fund, enters into contracts with service providers that contain general indemnification clauses. The Trust’s maximum exposure under these arrangements is unknown as this would involve future claims that may be made against the Trust that have not yet occurred. Currently, the Trust expects the risk of loss to be remote.
2. SHARES OF BENEFICIAL INTEREST
At December 31, 2010, there were an unlimited number of shares authorized (without par value). Transactions in the Fund’s shares were as follows:
| | | | | | | | | | | | | | | | |
| | | Year Ended December 31, | |
| | | 2010a | | | 2009a | |
| Class 1 Shares: | | Shares | | | Amount | | | Shares | | | Amount | |
Shares sold | | | 68,402 | | | $ | 948,510 | | | | 92,858 | | | $ | 1,084,582 | |
Shares issued in reinvestment of distributions | | | 44,470 | | | | 595,893 | | | | 79,458 | | | | 896,286 | |
Shares redeemed | | | (527,249 | ) | | | (7,301,258 | ) | | | (739,154 | ) | | | (8,237,543 | ) |
| | | | |
Net increase (decrease) | | | (414,377 | ) | | $ | (5,756,855 | ) | | | (566,838 | ) | | $ | (6,256,675 | ) |
| | | | |
FLG-19
Franklin Templeton Variable Insurance Products Trust
Notes to Financial Statements (continued)
Franklin Large Cap Growth Securities Fund
2. SHARES OF BENEFICIAL INTEREST (continued)
| | | | | | | | | | | | | | | | |
| | | Year Ended December 31, | |
| | | 2010a | | | 2009a | |
| Class 2 Shares: | | Shares | | | Amount | | | Shares | | | Amount | |
Shares sold | | | 1,051,169 | | | $ | 13,759,246 | | | | 1,484,116 | | | $ | 16,174,927 | |
Shares issued in reinvestment of distributions | | | 217,451 | | | | 2,876,875 | | | | 424,080 | | | | 4,724,247 | |
Shares redeemed | | | (5,055,225 | ) | | | (68,625,176 | ) | | | (5,372,705 | ) | | | (59,321,620 | ) |
| | | | |
Net increase (decrease) | | | (3,786,605 | ) | | $ | (51,989,055 | ) | | | (3,464,509 | ) | | $ | (38,422,446 | ) |
| | | | |
| aDuring | the year Class 4 did not report any share transactions. |
3. TRANSACTIONS WITH AFFILIATES
Franklin Resources, Inc. is the holding company for various subsidiaries that together are referred to as Franklin Templeton Investments. Certain officers and trustees of the Fund are also officers and/or directors of the following subsidiaries:
| | |
| Subsidiary | | Affiliation |
Franklin Advisers, Inc. (Advisers) | | Investment manager |
Franklin Templeton Services, LLC (FT Services) | | Administrative manager |
Franklin Templeton Distributors, Inc. (Distributors) | | Principal underwriter |
Franklin Templeton Investor Services, LLC (Investor Services) | | Transfer agent |
a. Management Fees
The Fund pays an investment management fee to Advisers based on the average daily net assets of the Fund as follows:
| | |
| Annualized Fee Rate | | Net Assets |
| 0.750% | | Up to and including $500 million |
| 0.625% | | Over $500 million, up to and including $1 billion |
| 0.500% | | In excess of $1 billion |
b. Administrative Fees
Under an agreement with Advisers, FT Services provides administrative services to the Fund. The fee is paid by Advisers based on average daily net assets, and is not an additional expense of the Fund.
c. Distribution Fees
The Trust’s Board of Trustees has adopted distribution plans for Class 2 and Class 4 shares pursuant to Rule 12b-1 under the 1940 Act. Under the Fund’s compensation distribution plans, the Fund pays Distributors for costs incurred in connection with the servicing, sale and distribution of the Fund’s shares up to 0.35% per year of its average daily net assets of each class. The Board of Trustees has agreed to limit the current rate to 0.25% per year for Class 2.
d. Transfer Agent Fees
Investor Services, under terms of an agreement, performs shareholder servicing for the Fund and is not paid by the Fund for the services.
e. Other Affiliated Transactions
At December 31, 2010, Advisers owned 100% of the Fund’s Class 4 outstanding shares.
FLG-20
Franklin Templeton Variable Insurance Products Trust
Notes to Financial Statements (continued)
Franklin Large Cap Growth Securities Fund
4. EXPENSE OFFSET ARRANGEMENT
The Fund has entered into an arrangement with its custodian whereby credits realized as a result of uninvested cash balances are used to reduce a portion of the Fund’s custodian expenses. During the year ended December 31, 2010, there were no credits earned.
5. INCOME TAXES
For tax purposes, capital losses may be carried over to offset future capital gains, if any. At December 31, 2010, the capital loss carryforwards were as follows:
| | | | |
Capital loss carryforwards expiring in: | | | | |
2016 | | $ | 43,737,615 | |
2017 | | | 62,499,598 | |
| | | | |
| | $ | 106,237,213 | |
| | | | |
During the year ended December 31, 2010, the Fund utilized $23,807,373 of capital loss carryforwards.
The tax character of distributions paid during the years ended December 31, 2010 and 2009, was as follows:
| | | | | | | | |
| | | 2010 | | | 2009 | |
| | | | | | | | |
Distributions paid from ordinary income | | $ | 3,472,801 | | | $ | 5,620,582 | |
| | | | |
At December 31, 2010, the cost of investments, net unrealized appreciation (depreciation) and undistributed ordinary income for income tax purposes were as follows:
| | | | |
Cost of investments | | $ | 310,748,679 | |
| | | | |
Unrealized appreciation | | $ | 108,438,349 | |
Unrealized depreciation | | | (3,185,966 | ) |
| | | | |
Net unrealized appreciation (depreciation) | | $ | 105,252,383 | |
| | | | |
Distributable earnings—undistributed ordinary income | | $ | 2,644,535 | |
| | | | |
Net realized gains (losses) differ for financial statement and tax purposes primarily due to differing treatment of wash sales.
6. INVESTMENT TRANSACTIONS
Purchases and sales of investments (excluding short term securities) for the year ended December 31, 2010, aggregated $180,259,721 and $234,894,302, respectively.
7. CREDIT FACILITY
The Fund, together with other U.S. registered and foreign investment funds (collectively “Borrowers”), managed by Franklin Templeton Investments, are borrowers in a joint syndicated senior unsecured credit facility totaling $750 million (Global Credit Facility) which matures on January 21, 2011. This Global Credit Facility provides a source of funds to the Borrowers for temporary and emergency purposes, including the ability to meet future unanticipated or unusually large redemption requests.
Under the terms of the Global Credit Facility, the Fund shall, in addition to interest charged on any borrowings made by the Fund and other costs incurred by the Fund, pay its share of fees and expenses incurred in connection with the implementation and maintenance of the Global Credit Facility, based upon its relative share of the aggregate net assets of all of the Borrowers,
FLG-21
Franklin Templeton Variable Insurance Products Trust
Notes to Financial Statements (continued)
Franklin Large Cap Growth Securities Fund
7. CREDIT FACILITY (continued)
including an annual commitment fee of 0.10% based upon the unused portion of the Global Credit Facility, which is reflected in other expenses on the Statement of Operations. During the year ended December 31, 2010, the Fund did not use the Global Credit Facility.
Effective January 21, 2011, the Borrowers renewed the Global Credit Facility for a total of $750 million, maturing January 20, 2012.
8. FAIR VALUE MEASUREMENTS
The Fund follows a fair value hierarchy that distinguishes between market data obtained from independent sources (observable inputs) and the Fund’s own market assumptions (unobservable inputs). These inputs are used in determining the value of the Fund’s investments and are summarized in the following fair value hierarchy:
| | • | | Level 1 – quoted prices in active markets for identical securities |
| | • | | Level 2 – other significant observable inputs (including quoted prices for similar securities, interest rates, prepayment speed, credit risk, etc.) |
| | • | | Level 3 – significant unobservable inputs (including the Fund’s own assumptions in determining the fair value of investments) |
The inputs or methodology used for valuing securities are not an indication of the risk associated with investing in those securities.
For movements between the levels within the fair value hierarchy, the Fund has adopted a policy of recognizing the transfers as of the date of the underlying event which caused the movement.
The following is a summary of the inputs used as of December 31, 2010, in valuing the Fund’s assets and liabilities carried at fair value:
| | | | | | | | | | | | | | | | |
| | | Level 1 | | | Level 2 | | | Level 3 | | | Total | |
| | | | |
Assets: | | | | | | | | | | | | | | | | |
Investments in Securities: | | | | | | | | | | | | | | | | |
Equity Investmentsa | | $ | 401,361,835 | | | $ | — | | | $ | — | | | $ | 401,361,835 | |
Short Term Investments | | | — | | | | 14,639,227 | | | | — | | | | 14,639,227 | |
| | | | |
Total Investments in Securities | | $ | 401,361,835 | | | $ | 14,639,227 | | | $ | — | | | $ | 416,001,062 | |
| | | | |
aFor detailed industry descriptions, see the accompanying Statement of Investments.
9. SUBSEQUENT EVENTS
The Fund has evaluated subsequent events through the issuance of the financial statements and determined that no events have occurred that require disclosure other than those already disclosed in the financial statements.
| | | | |
ABBREVIATIONS | | | | |
| Selected Portfolio | | | | |
| | | | |
| ADR - American Depository Receipt | | | | |
FLG-22
Franklin Templeton Variable Insurance Products Trust
Franklin Large Cap Growth Securities Fund
Report of Independent Registered Public Accounting Firm
To the Board of Trustees and Shareholders of Franklin Templeton Variable Insurance Products Trust
In our opinion, the accompanying statement of assets and liabilities, including the statement of investments, and the related statements of operations and of changes in net assets and the financial highlights present fairly, in all material respects, the financial position of Franklin Large Cap Growth Securities Fund (the “Fund”) at December 31, 2010, the results of its operations for the year then ended, the changes in its net assets for each of the two years in the period then ended and the financial highlights for each of the periods presented, in conformity with accounting principles generally accepted in the United States of America. These financial statements and financial highlights (hereafter referred to as “financial statements”) are the responsibility of the Fund’s management. Our responsibility is to express an opinion on these financial statements based on our audits. We conducted our audits of these financial statements in accordance with the standards of the Public Company Accounting Oversight Board (United States). Those standards require that we plan and perform the audit to obtain reasonable assurance about whether the financial statements are free of material misstatement. An audit includes examining, on a test basis, evidence supporting the amounts and disclosures in the financial statements, assessing the accounting principles used and significant estimates made by management, and evaluating the overall financial statement presentation. We believe that our audits, which included confirmation of securities at December 31, 2010 by correspondence with the custodian and brokers, provide a reasonable basis for our opinion.
PricewaterhouseCoopers LLP
San Francisco, California
February 10, 2011
FLG-23
Franklin Templeton Variable Insurance Products Trust
Tax Designation (unaudited)
Franklin Large Cap Growth Securities Fund
Under Section 854(b)(2) of the Internal Revenue Code (Code), the Fund designates 100% of the ordinary income dividends as income qualifying for the dividends received deduction for the fiscal year ended December 31, 2010.
FLG-24
FRANKLIN LARGE CAP VALUE SECURITIES FUND
This annual report for Franklin Large Cap Value Securities Fund covers the fiscal year ended December 31, 2010.
Performance Summary as of 12/31/10
Average annual total return of Class 4 shares* represents the average annual change in value, assuming reinvestment of dividends and capital gains. Average returns smooth out variations in returns, which can be significant; they are not the same as year-by-year results.
Periods ended 12/31/10
| | | | | | | | | | | | |
| | | 1-Year | | | 5-Year | | | Since Inception
(3/1/05) | |
Average Annual Total Return | | | +14.20% | | | | +1.63% | | | | +2.13% | |
*For the period beginning 2/29/08, Class 4 performance reflects a 12b-1 fee expense of 0.35% per year, which affects future performance. Class 4 performance prior to 2/29/08 reflects historical Class 2 performance, which includes a 12b-1 fee expense of 0.25% per year. Since 2/29/08 (effective date), the average annual total return of Class 4 shares was -0.60%. The investment manager and administrator have contractually agreed to waive or assume certain expenses so that common expenses of the Fund (excluding Rule 12b-1 fees and acquired fund fees and expenses) do not exceed 0.65% (other than certain nonroutine expenses) until 4/30/11. If the manager and administrator had not waived fees, the Fund’s total returns would have been lower.
Total Return Index Comparison
for a Hypothetical $10,000 Investment (3/1/05–12/31/10)
The graph below shows the change in value of a hypothetical $10,000 investment in the Fund over the indicated period and includes reinvestment of any income or distributions. The Fund’s performance* is compared to the performance of the Russell 1000® Value Index. One cannot invest directly in an index, and an index is not representative of the Fund’s portfolio. Please see Important Notes to Performance Information preceding the Fund Summaries.
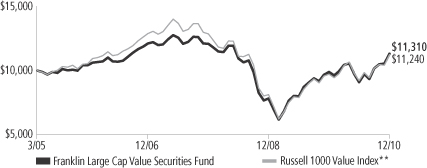
**Source: © 2011 Morningstar. Please see Index Descriptions following the Fund Summaries.
Franklin Large Cap Value Securities Fund – Class 4
Performance reflects the Fund’s Class 4 operating expenses, but does not include any contract fees, expenses or sales charges. If they had been included, performance would be lower. These charges and deductions, particularly for variable life policies, can have a significant effect on contract values and insurance benefits. See the contract prospectus for a complete description of these expenses, including sales charges.
Performance data represent past performance, which does not guarantee future results. Investment return and principal value will fluctuate, and you may have a gain or loss when you sell your shares.
Current performance may differ from figures shown.
FLV-1
Fund Goal and Main Investments: Franklin Large Cap Value Securities Fund seeks long-term capital appreciation. The Fund normally invests at least 80% of its net assets in investments of large-capitalization companies, focusing on those the manager believes are undervalued.
Performance Overview
You can find the Fund’s one-year total return in the Performance Summary. The Fund underperformed its benchmark, the Russell 1000 Value Index, which rose 15.51% for the same period.1 Please note the Fund employs a bottom-up stock selection process and the managers invest in securities without regard to benchmark comparisons.
Economic and Market Overview
During the 12-month period ended December 31, 2010, the U.S. economy grew unevenly, supported by a combination of fundamental business improvement and government intervention. Economic activity as measured by gross domestic product expanded at an annualized 3.7% pace in 2010’s first quarter and then downshifted to 1.7% annualized in the second quarter. Consumer spending picked up, likely due to pent-up post-recession demand, and the pace of growth rose at annualized rates of 2.6% in the third quarter and an estimated 3.2% in the fourth quarter.
Challenges such as mixed economic data, elevated debt concerns surrounding the U.S. budget deficit and a lack of job prospects for the unemployed hindered consumer confidence and the economy’s advance. During the early part of the annual period, home prices rose in many regions due to low interest rates, a first-time homebuyer tax credit program, and prices dipping to levels that lured buyers. Later in the period, home sales stalled as the homebuyer tax credit program ended, foreclosures mounted and the housing sector remained weak.
Amid signs of a demand-led recovery, crude oil prices rose from $79 per barrel at the end of December 2009 to a then 17-month high of $87 in early April. But as doubts surfaced about the recovery’s sustainability, oil prices dipped to $66 in late May. Prices rebounded to $91 per barrel by the end of December 2010 largely due to accelerating global demand. The pace of inflation slowed during the year, and in December 2010 the inflation rate was an annualized 1.5%.2 Similarly, core
1. Source: © 2011 Morningstar. One cannot invest directly in an index, and an index is not representative of the Fund’s portfolio. Please see Index Descriptions following the Fund Summaries.
2. Source: Bureau of Labor Statistics.
Fund Risks: The Fund’s investments in stocks may offer the potential for long-term gains but can be subject to short-term price fluctuations. Foreign investing, especially in emerging markets, involves additional risks, including currency fluctuations, economic instability, market volatility, and political and social instability. The manager applies various techniques and analyses in making investment decisions for the Fund, but there can be no guarantee that these decisions will produce the desired results. The Fund’s prospectus also includes a description of the main investment risks.
FLV-2
inflation, which excludes volatile food and energy costs, slowed to a 0.8% annualized rate.2 Companies added jobs throughout the period, and the unemployment rate fell from 10.0% in December 2009 to 9.4% at period-end.2 The decline was attributable in part to a shrinking labor force as some unemployed workers stopped looking for jobs.
Given few inflationary pressures and uncertainty surrounding the economic recovery, the Federal Open Market Committee (FOMC) made no major changes to its monetary policy for most of the period. The FOMC repeatedly stated it would keep the federal funds target rate within the exceptionally low 0% to 0.25% range “for an extended period” and eventually shifted its focus to its outlook and the status of its current holdings. In September, the FOMC revealed concerns about the subdued recovery and said inflation was below the pace “consistent with its mandate.” Having already lowered interest rates effectively to zero, the FOMC announced its intention to purchase government securities to stimulate the economy and promote a low level of inflation consistent with healthy economic growth.
Investor confidence shifted with each release of encouraging or discouraging economic, regulatory and political news, stoking considerable volatility among equities. Ultimately, stock indexes posted solid gains during the 12 months under review as investor risk aversion began to subside amid generally improving economic signs and rising consumer spending. Overall, the blue-chip stocks of the Dow Jones Industrial Average rose 14.06%, the broader Standard & Poor’s 500 Index increased 15.06%, and the technology-heavy NASDAQ Composite Index appreciated 18.02%.1 During the period, growth stocks outperformed their value counterparts. Performance among the major sectors was positive, with consumer discretionary, industrials and materials making the largest gains, while health care and utilities had weaker results.
Investment Strategy
Although this report covers a 12-month period, our investment horizon aims for longer term results. We seek to invest in securities of large-capitalization companies that we determine are selling below their underlying worth and hold them until they reach what we believe is their fair market value. Our aim is to construct a diversified portfolio of fundamentally sound companies purchased at attractive prices, often when they are out of favor with other investors for reasons we believe are temporary. Portfolio securities are selected without regard to benchmark
2. Source: Bureau of Labor Statistics.
FLV-3
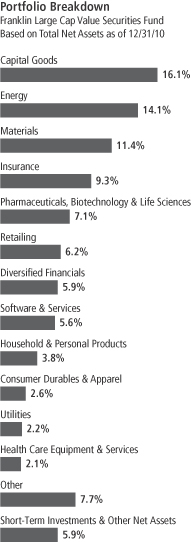
comparisons and are chosen based on fundamental, bottom-up research focusing on several criteria, such as low price relative to earnings, cash flow or book value. We also consider stocks with recent sharp price declines that we feel still have significant growth potential or that possess valuable intangibles not reflected in the stock price.
Manager’s Discussion
During the 12 months under review, significant contributors to Fund performance included several positions in the industrials and financials sectors.3 Holdings that performed well included industrial goods manufacturers Eaton, Dover and Parker Hannifin in the industrials sector, and insurers Chubb, Aflac and MetLife in financials. Other key contributors included consumer goods manufacturer Fortune Brands, industrial gases manufacturer Praxair, athletic footwear and apparel maker Nike, and chemicals company Dow Chemical.
Our information technology sector holdings detracted from performance, largely due to Hewlett-Packard and Microsoft.4 We sold our Hewlett-Packard position by period-end. Offshore contract drilling services firm Transocean and steel company Nucor also hurt performance. Other detractors included building products company Masco, electric utility Entergy and biopharmaceutical company Gilead Sciences, a new holding.
In addition to purchasing Gilead Sciences, the Fund initiated 10 positions during the year in what we considered attractively valued securities: agricultural products processor Archer-Daniels-Midland, health care products manufacturer Covidien, offshore drilling contractor Ensco, aerospace and defense company General Dynamics, health care products manufacturer Johnson & Johnson, medical device manufacturer Medtronic, offshore contract drilling services company Noble, financial services firm Northern Trust, business document systems and services company Xerox and offshore contract drilling services firm Transocean, which we sold by period-end as questions arose regarding its fundamentals. We also added to several existing positions including financial services firm Bank of America, insurer Chubb and utilities company Sempra Energy. In addition to eliminating Hewlett-Packard,
3.The industrials sector comprises aerospace and defense, building products, industrial conglomerates, machinery, and road and rail in the SOI. The financials sector comprises capital markets, commercial banks, diversified financial services and insurance in the SOI.
4.The information technology sector comprises computers and peripherals, office electronics, and software in the SOI.
Top 10 Holdings
Franklin Large Cap Value Securities Fund
12/31/10
| | | | |
Company
Sector/Industry | | % of Total Net Assets | |
| Nucor Corp. | | | 3.2% | |
| Materials | | | | |
| International Business Machines Corp. | | | 3.0% | |
| Software & Services | | | | |
| Praxair Inc. | | | 2.7% | |
| Materials | | | | |
| State Street Corp. | | | 2.7% | |
| Diversified Financials | | | | |
| Alcoa Inc. | | | 2.6% | |
| Materials | | | | |
| Microsoft Corp. | | | 2.6% | |
| Software & Services | | | | |
| Chubb Corp. | | | 2.5% | |
| Insurance | | | | |
| General Electric Co. | | | 2.3% | |
| Capital Goods | | | | |
| Eaton Corp. | | | 2.3% | |
| Capital Goods | | | | |
| Merck & Co. Inc. | | | 2.2% | |
| Pharmaceuticals, Biotechnology & Life Sciences | |
The dollar value, number of shares or principal amount, and names of all portfolio holdings are listed in the Fund’s Statement of Investments (SOI).
FLV-4
we liquidated our position in homebuilder D. R. Horton. We also reduced several holdings including Aflac, Fortune Brands, International Business Machines and Merck.
Thank you for your participation in Franklin Large Cap Value Securities Fund. We look forward to serving your future investment needs.
The foregoing information reflects our analysis, opinions and portfolio holdings as of December 31, 2010, the end of the reporting period. The way we implement our main investment strategies and the resulting portfolio holdings may change depending on factors such as market and economic conditions. These opinions may not be relied upon as investment advice or an offer for a particular security. The information is not a complete analysis of every aspect of any market, country, industry, security or the Fund. Statements of fact are from sources considered reliable, but the investment manager makes no representation or warranty as to their completeness or accuracy. Although historical performance is no guarantee of future results, these insights may help you understand our investment management philosophy.
FLV-5
Fund Expenses
As an investor in a variable insurance contract (Contract) that indirectly provides for investment in an underlying mutual fund, you can incur transaction and/or ongoing expenses at both the Fund level and the Contract level.
| • | | Transaction expenses can include sales charges (loads) on purchases, redemption fees, surrender fees, transfer fees and premium taxes. |
| • | | Ongoing expenses can include management fees, distribution and service (12b-1) fees, contract fees, annual maintenance fees, mortality and expense risk fees and other fees and expenses. All mutual funds and Contracts have some types of ongoing expenses. |
The expenses shown in the table are meant to highlight ongoing expenses at the Fund level only and do not include ongoing expenses at the Contract level, or transaction expenses at either the Fund or Contract level. While the Fund does not have transaction expenses, if the transaction and ongoing expenses at the Contract level were included, the expenses shown would be higher. You should consult your Contract prospectus or disclosure document for more information.
The table shows Fund-level ongoing expenses and can help you understand these expenses and compare them with those of other mutual funds offered through the Contract. The table assumes a $1,000 investment held for the six months indicated. Please refer to the Fund prospectus for additional information on operating expenses.
Actual Fund Expenses
The first line (Actual) of the table provides actual account values and expenses. The “Ending Account Value” is derived from the Fund’s actual return, which includes the effect of ongoing Fund expenses, but does not include the effect of ongoing Contract expenses.
You can estimate the Fund-level expenses you incurred during the period by following these steps. Of course, your account value and expenses will differ from those in this illustration:
| 1. | Divide your account value by $1,000. |
If an account had an $8,600 value, then $8,600 ÷ $1,000 = 8.6.
| 2. | Multiply the result by the number under the heading “Fund-Level Expenses Incurred During Period.” |
If Fund-Level Expenses Incurred During Period were $7.50, then 8.6 x $7.50 = $64.50.
In this illustration, the estimated expenses incurred this period at the Fund level are $64.50.
Franklin Large Cap Value Securities Fund – Class 4
FLV-6
Hypothetical Example for Comparison with Other Mutual Funds
Information in the second line (Hypothetical) of the table can help you compare ongoing expenses of the Fund with those of other mutual funds offered through the Contract. This information may not be used to estimate the actual ending account balance or expenses you incurred during the period. The hypothetical “Ending Account Value” is based on the Fund’s actual expense ratio and an assumed 5% annual rate of return before expenses, which does not represent the Fund’s actual return. The figure under the heading “Fund-Level Expenses Incurred During Period” shows the hypothetical expenses your account would have incurred under this scenario. You can compare this figure with the 5% hypothetical examples that appear in shareholder reports of other funds offered through a Contract.
| | | | | | | | | | | | |
| Class 4 | | Beginning
Account Value 7/1/10 | | | Ending
Account
Value 12/31/10 | | | Fund-Level
Expenses Incurred
During Period*
7/1/10–12/31/10 | |
Actual | | $ | 1,000 | | | $ | 1,243.20 | | | $ | 5.65 | |
Hypothetical (5% return before expenses) | | $ | 1,000 | | | $ | 1,020.16 | | | $ | 5.09 | |
*Expenses are calculated using the most recent six-month annualized expense ratio, net of expense waivers, for the Fund’s Class 4 shares (1.00%), which does not include any ongoing expenses of the Contract for which the Fund is an investment option, multiplied by the average account value over the period, multiplied by 184/365 to reflect the one-half year period.
FLV-7
Franklin Templeton Variable Insurance Products Trust
Financial Highlights
Franklin Large Cap Value Securities Fund
| | | | | | | | | | | | | | | | | | | | |
| | | Year Ended December 31, | |
| Class 2 | | 2010 | | | 2009 | | | 2008 | | | 2007 | | | 2006 | |
| | | | |
Per share operating performance | | | | | | | | | | | | | | | | | | | | |
(for a share outstanding throughout the year) | | | | | | | | | | | | | | | | | | | | |
Net asset value, beginning of year | | $ | 9.36 | | | $ | 7.54 | | | $ | 11.63 | | | $ | 11.86 | | | $ | 10.37 | |
| | | | |
Income from investment operationsa: | | | | | | | | | | | | | | | | | | | | |
Net investment incomeb | | | 0.12 | | | | 0.17 | | | | 0.19 | | | | 0.22 | | | | 0.21 | |
Net realized and unrealized gains (losses) | | | 1.19 | | | | 1.81 | | | | (4.28 | ) | | | (0.25 | ) | | | 1.46 | |
| | | | |
Total from investment operations | | | 1.31 | | | | 1.98 | | | | (4.09 | ) | | | (0.03 | ) | | | 1.67 | |
| | | | |
Less distributions from: | | | | | | | | | | | | | | | | | | | | |
Net investment income | | | (0.17 | ) | | | (0.16 | ) | | | — | | | | (0.19 | ) | | | (0.15 | ) |
Net realized gains | | | — | | | | — | | | | — | | | | (0.01 | ) | | | (0.03 | ) |
| | | | |
Total distributions | | | (0.17 | ) | | | (0.16 | ) | | | — | | | | (0.20 | ) | | | (0.18 | ) |
| | | | |
Net asset value, end of year | | $ | 10.50 | | | $ | 9.36 | | | $ | 7.54 | | | $ | 11.63 | | | $ | 11.86 | |
| | | | |
| | | | | |
Total returnc | | | 14.27% | | | | 26.76% | | | | (35.17)% | | | | (0.26)% | | | | 16.19% | |
Ratios to average net assets | | | | | | | | | | | | | | | | | | | | |
Expenses before waiver and payments by affiliates | | | 1.40% | | | | 1.38% | | | | 1.34% | | | | 1.36% | | | | 1.41% | |
Expenses net of waiver and payments by affiliates | | | 0.90% | | | | 0.90% | | | | 0.90% | | | | 0.90% | d | | | 0.90% | d |
Net investment income | | | 1.25% | | | | 2.15% | | | | 1.93% | | | | 1.82% | | | | 1.93% | |
| | | | | |
Supplemental data | | | | | | | | | | | | | | | | | | | | |
Net assets, end of year (000’s) | | $ | 40,183 | | | $ | 35,892 | | | $ | 26,776 | | | $ | 37,797 | | | $ | 26,069 | |
Portfolio turnover rate | | | 13.91% | | | | 15.64% | | | | 12.92% | | | | 15.80% | | | | 24.71% | |
aThe amount shown for a share outstanding throughout the period may not correlate with the Statement of Operations for the period due to the timing of sales and repurchases of the Fund shares in relation to income earned and/or fluctuating market value of the investments of the Fund.
bBased on average daily shares outstanding.
cTotal return does not include fees, charges or expenses imposed by the variable annuity and life insurance contracts for which the Franklin Templeton Variable Insurance Products Trust serves as an underlying investment vehicle.
dBenefit of expense reduction rounds to less than 0.01%.
The accompanying notes are an integral part of these financial statements.
FLV-8
Franklin Templeton Variable Insurance Products Trust
Financial Highlights (continued)
Franklin Large Cap Value Securities Fund
| | | | | | | | | | | | |
| | | Year Ended December 31, | |
| Class 4 | | 2010 | | | 2009 | | | 2008a | |
| | | | |
Per share operating performance | | | | | | | | | | | | |
(for a share outstanding throughout the year) | | | | | | | | | | | | |
Net asset value, beginning of year | | $ | 9.34 | | | $ | 7.53 | | | $ | 11.07 | |
| | | | |
Income from investment operationsb: | | | | | | | | | | | | |
Net investment incomec | | | 0.11 | | | | 0.16 | | | | 0.15 | |
Net realized and unrealized gains (losses) | | | 1.18 | | | | 1.80 | | | | (3.69 | ) |
| | | | |
Total from investment operations | | | 1.29 | | | | 1.96 | | | | (3.54 | ) |
| | | | |
Less distributions from net investment income | | | (0.16 | ) | | | (0.15 | ) | | | — | |
| | | | |
Net asset value, end of year | | $ | 10.47 | | | $ | 9.34 | | | $ | 7.53 | |
| | | | |
| | | |
Total returnd | | | 14.20% | | | | 26.54% | | | | (31.98)% | |
Ratios to average net assetse | | | | | | | | | | | | |
Expenses before waiver and payments by affiliates | | | 1.50% | | | | 1.48% | | | | 1.44% | |
Expenses net of waiver and payments by affiliates | | | 1.00% | | | | 1.00% | | | | 1.00% | |
Net investment income | | | 1.15% | | | | 2.05% | | | | 1.83% | |
| | | |
Supplemental data | | | | | | | | | | | | |
Net assets, end of year (000’s) | | $ | 5 | | | $ | 4 | | | $ | 3 | |
Portfolio turnover rate | | | 13.91% | | | | 15.64% | | | | 12.92% | |
aFor the period February 29, 2008 (effective date) to December 31, 2008.
bThe amount shown for a share outstanding throughout the period may not correlate with the Statement of Operations for the period due to the timing of sales and repurchases of the Fund shares in relation to income earned and/or fluctuating market value of the investments of the Fund.
cBased on average daily shares outstanding.
dTotal return does not include fees, charges or expenses imposed by the variable annuity and life insurance contracts for which the Franklin Templeton Variable Insurance Products Trust serves as an underlying investment vehicle. Total return is not annualized for periods less than one year.
eRatios are annualized for periods less than one year.
The accompanying notes are an integral part of these financial statements.
FLV-9
Franklin Templeton Variable Insurance Products Trust
Statement of Investments, December 31, 2010
| | | | | | | | |
| Franklin Large Cap Value Securities Fund | | Shares | | | Value | |
Common Stocks 94.1% | | | | | | | | |
Banks 1.2% | | | | | | | | |
U.S. Bancorp | | | 17,400 | | | $ | 469,278 | |
| | | | | | | | |
Capital Goods 16.1% | | | | | | | | |
3M Co. | | | 8,800 | | | | 759,440 | |
Dover Corp. | | | 13,900 | | | | 812,455 | |
Eaton Corp. | | | 9,000 | | | | 913,590 | |
General Dynamics Corp. | | | 7,100 | | | | 503,816 | |
General Electric Co. | | | 51,500 | | | | 941,935 | |
Illinois Tool Works Inc. | | | 15,000 | | | | 801,000 | |
Masco Corp. | | | 29,100 | | | | 368,406 | |
Parker Hannifin Corp. | | | 7,000 | | | | 604,100 | |
United Technologies Corp. | | | 10,000 | | | | 787,200 | |
| | | | | | | | |
| | | | | | | 6,491,942 | |
| | | | | | | | |
Consumer Durables & Apparel 2.6% | | | | | | | | |
Fortune Brands Inc. | | | 4,600 | | | | 277,150 | |
NIKE Inc., B | | | 9,100 | | | | 777,322 | |
| | | | | | | | |
| | | | | | | 1,054,472 | |
| | | | | | | | |
Consumer Services 1.7% | | | | | | | | |
McDonald’s Corp. | | | 8,800 | | | | 675,488 | |
| | | | | | | | |
Diversified Financials 5.9% | | | | | | | | |
Bank of America Corp. | | | 31,400 | | | | 418,876 | |
The Bank of New York Mellon Corp. | | | 14,600 | | | | 440,920 | |
aCitigroup Inc. | | | 13,500 | | | | 63,855 | |
Morgan Stanley | | | 5,500 | | | | 149,655 | |
Northern Trust Corp. | | | 3,800 | | | | 210,558 | |
State Street Corp. | | | 23,500 | | | | 1,088,990 | |
| | | | | | | | |
| | | | | | | 2,372,854 | |
| | | | | | | | |
Energy 14.1% | | | | | | | | |
Apache Corp. | | | 5,900 | | | | 703,457 | |
Chesapeake Energy Corp. | | | 9,300 | | | | 240,963 | |
ConocoPhillips | | | 10,000 | | | | 681,000 | |
Devon Energy Corp. | | | 7,600 | | | | 596,676 | |
Ensco PLC, ADR | | | 12,500 | | | | 667,250 | |
Exxon Mobil Corp. | | | 11,300 | | | | 826,256 | |
Noble Corp. | | | 11,000 | | | | 393,470 | |
Occidental Petroleum Corp. | | | 8,900 | | | | 873,090 | |
Peabody Energy Corp. | | | 10,600 | | | | 678,188 | |
| | | | | | | | |
| | | | | | | 5,660,350 | |
| | | | | | | | |
Food & Staples Retailing 1.8% | | | | | | | | |
Wal-Mart Stores Inc. | | | 13,700 | | | | 738,841 | |
| | | | | | | | |
Food, Beverage & Tobacco 1.0% | | | | | | | | |
Archer-Daniels-Midland Co. | | | 13,000 | | | | 391,040 | |
| | | | | | | | |
Health Care Equipment & Services 2.1% | | | | | | | | |
Becton, Dickinson and Co. | | | 6,700 | | | | 566,284 | |
Covidien PLC | | | 4,600 | | | | 210,036 | |
Medtronic Inc. | | | 1,400 | | | | 51,926 | |
| | | | | | | | |
| | | | | | | 828,246 | |
| | | | | | | | |
FLV-10
Franklin Templeton Variable Insurance Products Trust
Statement of Investments, December 31, 2010 (continued)
| | | | | | | | |
| Franklin Large Cap Value Securities Fund | | Shares | | | Value | |
Common Stocks (continued) | | | | | | | | |
Household & Personal Products 3.8% | | | | | | | | |
Kimberly-Clark Corp. | | | 10,500 | | | $ | 661,920 | |
The Procter & Gamble Co. | | | 13,500 | | | | 868,455 | |
| | | | | | | | |
| | | | | | | 1,530,375 | |
| | | | | | | | |
Insurance 9.3% | | | | | | | | |
Aflac Inc. | | | 13,000 | | | | 733,590 | |
The Allstate Corp. | | | 25,000 | | | | 797,000 | |
aBerkshire Hathaway Inc., A | | | 3 | | | | 361,350 | |
Chubb Corp. | | | 17,000 | | | | 1,013,880 | |
MetLife Inc. | | | 18,300 | | | | 813,252 | |
| | | | | �� | | | |
| | | | | | | 3,719,072 | |
| | | | | | | | |
Materials 11.4% | | | | | | | | |
Air Products and Chemicals Inc. | | | 3,000 | | | | 272,850 | |
Alcoa Inc. | | | 68,900 | | | | 1,060,371 | |
The Dow Chemical Co. | | | 25,700 | | | | 877,398 | |
Nucor Corp. | | | 29,000 | | | | 1,270,780 | |
Praxair Inc. | | | 11,500 | | | | 1,097,905 | |
| | | | | | | | |
| | | | | | | 4,579,304 | |
| | | | | | | | |
Pharmaceuticals, Biotechnology & Life Sciences 7.1% | | | | | | | | |
Abbott Laboratories | | | 7,600 | | | | 364,116 | |
aGilead Sciences Inc. | | | 14,200 | | | | 514,608 | |
Johnson & Johnson | | | 4,300 | | | | 265,955 | |
Merck & Co. Inc. | | | 25,000 | | | | 901,000 | |
Pfizer Inc. | | | 46,300 | | | | 810,713 | |
| | | | | | | | |
| | | | | | | 2,856,392 | |
| | | | | | | | |
Retailing 6.2% | | | | | | | | |
The Home Depot Inc. | | | 23,600 | | | | 827,416 | |
J.C. Penney Co. Inc. | | | 25,000 | | | | 807,750 | |
Nordstrom Inc. | | | 17,100 | | | | 724,698 | |
aOffice Depot Inc. | | | 23,000 | | | | 124,200 | |
| | | | | | | | |
| | | | | | | 2,484,064 | |
| | | | | | | | |
Software & Services 5.6% | | | | | | | | |
International Business Machines Corp. | | | 8,200 | | | | 1,203,432 | |
Microsoft Corp. | | | 37,800 | | | | 1,055,376 | |
| | | | | | | | |
| | | | | | | 2,258,808 | |
| | | | | | | | |
Technology Hardware & Equipment 0.5% | | | | | | | | |
Xerox Corp. | | | 17,500 | | | | 201,600 | |
| | | | | | | | |
Transportation 1.5% | | | | | | | | |
Norfolk Southern Corp. | | | 9,600 | | | | 603,072 | |
| | | | | | | | |
Utilities 2.2% | | | | | | | | |
Entergy Corp. | | | 5,200 | | | | 368,316 | |
Sempra Energy | | | 10,000 | | | | 524,800 | |
| | | | | | | | |
| | | | | | | 893,116 | |
| | | | | | | | |
Total Common Stocks (Cost $31,940,081) | | | | | | | 37,808,314 | |
| | | | | | | | |
FLV-11
Franklin Templeton Variable Insurance Products Trust
Statement of Investments, December 31, 2010 (continued)
| | | | | | | | |
| Franklin Large Cap Value Securities Fund | | Shares | | | Value | |
Short Term Investments (Cost $2,405,935) 6.0% | | | | | | | | |
Money Market Funds 6.0% | | | | | | | | |
a,bInstitutional Fiduciary Trust Money Market Portfolio | | | 2,405,935 | | | $ | 2,405,935 | |
| | | | | | | | |
Total Investments (Cost $34,346,016) 100.1% | | | | | | | 40,214,249 | |
Other Assets, less Liabilities (0.1)% | | | | | | | (26,648 | ) |
| | | | | | | | |
Net Assets 100.0% | | | | | | $ | 40,187,601 | |
| | | | | | | | |
See abbreviations on page FLV-21.
aNon-income producing.
bSee Note 7 regarding investments in the Institutional Fiduciary Trust Money Market Portfolio.
The accompanying notes are an integral part of these financial statements.
FLV-12
Franklin Templeton Variable Insurance Products Trust
Financial Statements
Statement of Assets and Liabilities
December 31, 2010
| | | | |
| | | Franklin Large
Cap Value
Securities Fund | |
Assets: | | | | |
Investments in securities: | | | | |
Cost - Unaffiliated issuers | | $ | 31,940,081 | |
Cost - Sweep Money Fund (Note 7) | | | 2,405,935 | |
| | | | |
Total cost of investments | | $ | 34,346,016 | |
| | | | |
Value - Unaffiliated issuers | | $ | 37,808,314 | |
Value - Sweep Money Fund (Note 7) | | | 2,405,935 | |
| | | | |
Total value of investments | | | 40,214,249 | |
Receivables: | | | | |
Capital shares sold | | | 8,374 | |
Dividends | | | 70,911 | |
| | | | |
Total assets | | | 40,293,534 | |
| | | | |
Liabilities: | | | | |
Payables: | | | | |
Capital shares redeemed | | | 39,509 | |
Affiliates | | | 30,521 | |
Reports to shareholders | | | 10,119 | |
Professional fees | | | 25,170 | |
Accrued expenses and other liabilities | | | 614 | |
| | | | |
Total liabilities | | | 105,933 | |
| | | | |
Net assets, at value | | $ | 40,187,601 | |
| | | | |
Net assets consist of: | | | | |
Paid-in capital | | $ | 42,195,190 | |
Undistributed net investment income | | | 463,376 | |
Net unrealized appreciation (depreciation) | | | 5,868,233 | |
Accumulated net realized gain (loss) | | | (8,339,198 | ) |
| | | | |
Net assets, at value | | $ | 40,187,601 | |
| | | | |
Class 2: | | | | |
Net assets, at value | | $ | 40,182,867 | |
| | | | |
Shares outstanding | | | 3,828,236 | |
| | | | |
Net asset value and maximum offering price per share | | $ | 10.50 | |
| | | | |
Class 4: | | | | |
Net assets, at value | | $ | 4,734 | |
| | | | |
Shares outstanding | | | 452 | |
| | | | |
Net asset value and maximum offering price per share | | $ | 10.47 | |
| | | | |
The accompanying notes are an integral part of these financial statements.
FLV-13
Franklin Templeton Variable Insurance Products Trust
Financial Statements (continued)
Statement of Operations
for the year ended December 31, 2010
| | | | |
| | | Franklin Large
Cap Value
Securities Fund | |
Investment income: | | | | |
Dividends | | $ | 796,705 | |
| | | | |
Expenses: | | | | |
Management fees (Note 3a) | | | 274,378 | |
Administrative fees (Note 3b) | | | 92,513 | |
Distribution fees: (Note 3c) | | | | |
Class 2 | | | 92,409 | |
Class 4 | | | 15 | |
Unaffiliated transfer agent fees | | | 86 | |
Custodian fees (Note 4) | | | 519 | |
Reports to shareholders | | | 19,414 | |
Professional fees | | | 29,351 | |
Other | | | 10,386 | |
| | | | |
Total expenses | | | 519,071 | |
Expenses waived/paid by affiliates (Note 3e) | | | (186,113 | ) |
| | | | |
Net expenses | | | 332,958 | |
| | | | |
Net investment income | | | 463,747 | |
| | | | |
Realized and unrealized gains (losses): | | | | |
Net realized gain (loss) from investments | | | (506,354 | ) |
Net change in unrealized appreciation (depreciation) on investments | | | 4,751,349 | |
| | | | |
Net realized and unrealized gain (loss) | | | 4,244,995 | |
| | | | |
Net increase (decrease) in net assets resulting from operations | | $ | 4,708,742 | |
| | | | |
The accompanying notes are an integral part of these financial statements.
FLV-14
Franklin Templeton Variable Insurance Products Trust
Financial Statements (continued)
Statements of Changes in Net Assets
| | | | | | | | |
| | | Franklin Large Cap Value
Securities Fund | |
| | | Year Ended December 31, | |
| | | 2010 | | | 2009 | |
| | | | |
Increase (decrease) in net assets: | | | | | | | | |
Operations: | | | | | | | | |
Net investment income | | $ | 463,747 | | | $ | 686,308 | |
Net realized gain (loss) from investments | | | (506,354 | ) | | | (3,133,157 | ) |
Net change in unrealized appreciation (depreciation) on investments | | | 4,751,349 | | | | 10,565,216 | |
| | | | |
Net increase (decrease) in net assets resulting from operations | | | 4,708,742 | | | | 8,118,367 | |
| | | | |
Distributions to shareholders from: | | | | | | | | |
Net investment income: | | | | | | | | |
Class 2 | | | (686,563 | ) | | | (701,566 | ) |
Class 4 | | | (74 | ) | | | (70 | ) |
| | | | |
Total distributions to shareholders | | | (686,637 | ) | | | (701,636 | ) |
| | | | |
Capital share transactions - Class 2: (Note 2) | | | 269,173 | | | | 1,699,737 | |
| | | | |
Net increase (decrease) in net assets | | | 4,291,278 | | | | 9,116,468 | |
Net assets: | | | | | | | | |
Beginning of year | | | 35,896,323 | | | | 26,779,855 | |
| | | | |
End of year | | $ | 40,187,601 | | | $ | 35,896,323 | |
| | | | |
Undistributed net investment income included in net assets: | | | | | | | | |
End of year | | $ | 463,376 | | | $ | 686,266 | |
| | | | |
The accompanying notes are an integral part of these financial statements.
FLV-15
Franklin Templeton Variable Insurance Products Trust
Notes to Financial Statements
Franklin Large Cap Value Securities Fund
1. ORGANIZATION AND SIGNIFICANT ACCOUNTING POLICIES
Franklin Templeton Variable Insurance Products Trust (Trust) is registered under the Investment Company Act of 1940, as amended, (1940 Act) as an open-end investment company, consisting of twenty separate funds. The Franklin Large Cap Value Securities Fund (Fund) is included in this report. The financial statements of the remaining funds in the Trust are presented separately. Shares of the Fund are generally sold only to insurance company separate accounts to fund the benefits of variable life insurance policies or variable annuity contracts. At December 31, 2010, 99.72% of the Fund’s shares were held through one insurance company. The Fund offers two classes of shares: Class 2 and Class 4. Each class of shares differs by its distribution fees, voting rights on matters affecting a single class and its exchange privilege.
The following summarizes the Fund’s significant accounting policies.
a. Financial Instrument Valuation
The Fund’s investments in securities and other financial instruments are carried at fair value daily. Fair value is the price that would be received to sell an asset or paid to transfer a liability in an orderly transaction between market participants on the measurement date. Under procedures approved by the Trust’s Board of Trustees, the Fund may utilize independent pricing services, quotations from securities and financial instrument dealers, and other market sources to determine fair value.
Equity securities listed on an exchange or on the NASDAQ National Market System are valued at the last quoted sale price or the official closing price of the day, respectively. Foreign equity securities are valued as of the close of trading on the foreign stock exchange on which the security is primarily traded, or the NYSE, whichever is earlier. The value is then converted into its U.S. dollar equivalent at the foreign exchange rate in effect at the close of the NYSE on the day that the value of the security is determined. Over-the-counter securities are valued within the range of the most recent quoted bid and ask prices. Securities that trade in multiple markets or on multiple exchanges are valued according to the broadest and most representative market. Certain equity securities are valued based upon fundamental characteristics or relationships to similar securities. Investments in open-end mutual funds are valued at the closing net asset value.
The Fund has procedures to determine the fair value of securities and other financial instruments for which market prices are not readily available or which may not be reliably priced. Under these procedures, the Fund primarily employs a market-based approach which may use related or comparable assets or liabilities, recent transactions, market multiples, book values, and other relevant information for the investment to determine the fair value of the investment. The Fund may also use an income-based valuation approach in which the anticipated future cash flows of the investment are discounted to calculate fair value. Discounts may also be applied due to the nature or duration of any restrictions on the disposition of the investments. Due to the inherent uncertainty of valuations of such investments, the fair values may differ significantly from the values that would have been used had an active market existed.
b. Securities Lending
The Fund participates in a principal based security lending program. The Fund receives cash collateral against the loaned securities in an amount equal to at least 102% of the market value of the loaned securities. Collateral is maintained over the life of the loan in an amount not less than 100% of the market value of loaned securities, as determined at the close of Fund business each day; any additional collateral required due to changes in security values is delivered to the Fund on the next business day. The collateral is invested in repurchase agreements by the Fund’s custodian on the Fund’s behalf. The Fund receives income from the investment of cash collateral, in addition to lending fees and rebates paid by the borrower. The Fund bears the market risk with respect to the collateral investment, securities loaned, and the risk that the principal may default on its obligations to the Fund. At December 31, 2010, the Fund had no securities on loan.
FLV-16
Franklin Templeton Variable Insurance Products Trust
Notes to Financial Statements (continued)
Franklin Large Cap Value Securities Fund
1. ORGANIZATION AND SIGNIFICANT ACCOUNTING POLICIES (continued)
c. Income Taxes
It is the Fund’s policy to qualify as a regulated investment company under the Internal Revenue Code. The Fund intends to distribute to shareholders substantially all of its taxable income and net realized gains to relieve it from federal income and excise taxes. As a result, no provision for U.S. federal income taxes is required. The Fund files U.S. income tax returns as well as tax returns in certain other jurisdictions. The Fund’s application of those tax rules is subject to its understanding. The Fund records a provision for taxes in its financial statements including penalties and interest, if any, for a tax position taken on a tax return (or expected to be taken) when it fails to meet the more likely than not (a greater than 50% probability) threshold and based on the technical merits, the tax position may not be sustained upon examination by the tax authorities. As of December 31, 2010, and for all open tax years, the Fund has determined that no provision for income tax is required in the Fund’s financial statements. Open tax years are those that remain subject to examination and are based on each tax jurisdiction statute of limitation. The Fund is not aware of any tax position for which it is reasonably possible that the total amounts of unrecognized tax effects will significantly change in the next twelve months.
d. Security Transactions, Investment Income, Expenses and Distributions
Security transactions are accounted for on trade date. Realized gains and losses on security transactions are determined on a specific identification basis. Estimated expenses are accrued daily. Dividend income is recorded on the ex-dividend date. Distributions to shareholders are recorded on the ex-dividend date and are determined according to income tax regulations (tax basis). Distributable earnings determined on a tax basis may differ from earnings recorded in accordance with accounting principles generally accepted in the United States of America. These differences may be permanent or temporary. Permanent differences are reclassified among capital accounts to reflect their tax character. These reclassifications have no impact on net assets or the results of operations. Temporary differences are not reclassified, as they may reverse in subsequent periods.
Common expenses incurred by the Trust are allocated among the funds based on the ratio of net assets of each fund to the combined net assets of the Trust. Fund specific expenses are charged directly to the fund that incurred the expense.
Realized and unrealized gains and losses and net investment income, not including class specific expenses, are allocated daily to each class of shares based upon the relative proportion of net assets of each class. Differences in per share distributions, by class, are generally due to differences in class specific expenses.
e. Accounting Estimates
The preparation of financial statements in accordance with accounting principles generally accepted in the United States of America requires management to make estimates and assumptions that affect the reported amounts of assets and liabilities at the date of the financial statements and the amounts of income and expenses during the reporting period. Actual results could differ from those estimates.
f. Guarantees and Indemnifications
Under the Trust’s organizational documents, its officers and trustees are indemnified by the Trust against certain liabilities arising out of the performance of their duties to the Trust. Additionally, in the normal course of business, the Trust, on behalf of the Fund, enters into contracts with service providers that contain general indemnification clauses. The Trust’s maximum exposure under these arrangements is unknown as this would involve future claims that may be made against the Trust that have not yet occurred. Currently, the Trust expects the risk of loss to be remote.
FLV-17
Franklin Templeton Variable Insurance Products Trust
Notes to Financial Statements (continued)
Franklin Large Cap Value Securities Fund
2. SHARES OF BENEFICIAL INTEREST
At December 31, 2010, there were an unlimited number of shares authorized (without par value). Transactions in the Fund’s shares were as follows:
| | | | | | | | | | | | | | | | |
| | | Year Ended December 31, | |
| | | 2010a | | | 2009a | |
| Class 2 Shares: | | Shares | | | Amount | | | Shares | | | Amount | |
Shares sold | | | 794,109 | | | $ | 7,755,860 | | | | 1,384,166 | | | $ | 10,151,286 | |
Shares issued in reinvestment of distributions | | | 74,627 | | | | 686,563 | | | | 91,707 | | | | 701,566 | |
Shares redeemed | | | (876,898 | ) | | | (8,173,250 | ) | | | (1,192,993 | ) | | | (9,153,115 | ) |
| | | | |
Net increase (decrease) | | | (8,162 | ) | | $ | 269,173 | | | | 282,880 | | | $ | 1,699,737 | |
| | | | |
| aDuring | the year Class 4 did not report any share transactions. |
3. TRANSACTIONS WITH AFFILIATES
Franklin Resources, Inc. is the holding company for various subsidiaries that together are referred to as Franklin Templeton Investments. Certain officers and trustees of the Trust are also officers, and/or directors of the following subsidiaries:
| | |
| Subsidiary | | Affiliation |
Franklin Advisory Services, LLC (Advisory Services) | | Investment manager |
Franklin Templeton Services, LLC (FT Services) | | Administrative manager |
Franklin Templeton Distributors, Inc. (Distributors) | | Principal underwriter |
Franklin Templeton Investor Services, LLC (Investor Services) | | Transfer agent |
a. Management Fees
The Fund pays an investment management fee to Advisory Services based on the average daily net assets of the Fund as follows:
| | |
Annualized
Fee Rate | | Net Assets |
| 0.750% | | Up to and including $500 million |
| 0.650% | | Over $500 million, up to and including $1 billion |
| 0.600% | | Over $1 billion, up to and including $1.5 billion |
| 0.550% | | Over $1.5 billion, up to and including $6.5 billion |
| 0.525% | | Over $6.5 billion, up to and including $11.5 billion |
| 0.500% | | Over $11.5 billion, up to and including $16.5 billion |
| 0.490% | | Over $16.5 billion, up to and including $19 billion |
| 0.480% | | Over $19 billion, up to and including $21.5 billion |
| 0.470% | | In excess of $21.5 billion |
b. Administrative Fees
The Fund pays an administrative fee to FT Services of 0.25% per year of the average daily net assets of the Fund.
c. Distribution Fees
The Trust’s Board of Trustees has adopted distribution plans for Class 2 and Class 4 shares pursuant to Rule 12b-1 under the 1940 Act. Under the Fund’s compensation distribution plans, the Fund pays Distributors for costs incurred in connection with
FLV-18
Franklin Templeton Variable Insurance Products Trust
Notes to Financial Statements (continued)
Franklin Large Cap Value Securities Fund
3. TRANSACTIONS WITH AFFILIATES (continued)
c. Distribution Fees (continued)
the servicing, sale and distribution of the Fund’s shares up to 0.35% per year of its average daily net assets of each class. The Board of Trustees has agreed to limit the current rate to 0.25% per year for Class 2.
d. Transfer Agent Fees
Investor Services, under terms of an agreement, performs shareholder servicing for the Fund and is not paid by the Fund for the services.
e. Waiver and Expense Reimbursements
Advisory Services and FT Services have contractually agreed in advance to waive or limit their respective fees and to assume as their own expense certain expenses otherwise payable by the Fund so that the common expenses (i.e. a combination of management fees, administrative fees, and other expenses, but excluding distribution fees and acquired fund fees and expenses) for each class of the Fund do not exceed 0.65% (other than certain non-routine expenses or costs, including those relating to litigation, indemnification, reorganizations, and liquidations) until April 30, 2011.
f. Other Affiliated Transactions
At December 31, 2010, Franklin Advisers, Inc. owned 100% of the Fund’s Class 4 outstanding shares.
4. EXPENSE OFFSET ARRANGEMENT
The Fund has entered into an arrangement with its custodian whereby credits realized as a result of uninvested cash balances are used to reduce a portion of the Fund’s custodian expenses. During the year ended December 31, 2010, there were no credits earned.
5. INCOME TAXES
For tax purposes, capital losses may be carried over to offset future capital gains, if any. At December 31, 2010, the capital loss carryforwards were as follows:
| | | | |
| Capital loss carryforwards expiring in: | | | | |
2016 | | $ | 4,455,608 | |
2017 | | | 2,320,965 | |
2018 | | | 1,173,534 | |
| | | | |
| | | $7,950,107 | |
| | | | |
For tax purposes, realized capital losses occurring subsequent to October 31 may be deferred and treated as occurring on the first day of the following fiscal year. At December 31, 2010, the Fund deferred realized capital losses of $231,311.
The tax character of distributions paid during the years ended December 31, 2010 and 2009, was as follows:
| | | | | | | | |
| | | 2010 | | | 2009 | |
Distributions paid from ordinary income | | $ | 686,637 | | | $ | 701,636 | |
| | | | |
FLV-19
Franklin Templeton Variable Insurance Products Trust
Notes to Financial Statements (continued)
Franklin Large Cap Value Securities Fund
5. INCOME TAXES (continued)
At December 31, 2010, the cost of investments, net unrealized appreciation (depreciation) and undistributed ordinary income for income tax purposes were as follows:
| | | | |
Cost of investments | | $ | 34,503,796 | |
| | | | |
Unrealized appreciation | | $ | 8,419,833 | |
Unrealized depreciation | | | (2,709,380 | ) |
| | | | |
Net unrealized appreciation (depreciation) | | $ | 5,710,453 | |
| | | | |
Distributable earnings – undistributed ordinary income | | $ | 463,376 | |
| | | | |
Net realized gains (losses) differ for financial statement and tax purposes primarily due to differing treatment of wash sales.
6. INVESTMENT TRANSACTIONS
Purchases and sales of investments (excluding short term securities) for the year ended December 31, 2010, aggregated $4,855,156 and $5,970,273, respectively.
7. INVESTMENTS IN INSTITUTIONAL FIDUCIARY TRUST MONEY MARKET PORTFOLIO
The Fund may invest in the Institutional Fiduciary Trust Money Market Portfolio (Sweep Money Fund), an open-end investment company managed by Franklin Advisers, Inc. (an affiliate of the investment manager). Management fees paid by the Fund are reduced on assets invested in the Sweep Money Fund, in an amount not to exceed the management and administrative fees paid by the Sweep Money Fund.
8. CREDIT FACILITY
The Fund, together with other U.S. registered and foreign investment funds (collectively “Borrowers”), managed by Franklin Templeton Investments, are borrowers in a joint syndicated senior unsecured credit facility totaling $750 million (Global Credit Facility) which matures on January 21, 2011. This Global Credit Facility provides a source of funds to the Borrowers for temporary and emergency purposes, including the ability to meet future unanticipated or unusually large redemption requests.
Under the terms of the Global Credit Facility, the Fund shall, in addition to interest charged on any borrowings made by the Fund and other costs incurred by the Fund, pay its share of fees and expenses incurred in connection with the implementation and maintenance of the Global Credit Facility, based upon its relative share of the aggregate net assets of all of the Borrowers, including an annual commitment fee of 0.10% based upon the unused portion of the Global Credit Facility, which is reflected in other expenses on the Statement of Operations. During the year ended December 31, 2010, the Fund did not use the Global Credit Facility.
Effective January 21, 2011, the Borrowers renewed the Global Credit Facility for a total of $750 million, maturing January 20, 2012.
9. FAIR VALUE MEASUREMENTS
The Fund follows a fair value hierarchy that distinguishes between market data obtained from independent sources (observable inputs) and the Fund’s own market assumptions (unobservable inputs). These inputs are used in determining the value of the Fund’s investments and are summarized in the following fair value hierarchy:
| | • | | Level 1 – quoted prices in active markets for identical securities |
FLV-20
Franklin Templeton Variable Insurance Products Trust
Notes to Financial Statements (continued)
Franklin Large Cap Value Securities Fund
9. FAIR VALUE MEASUREMENTS (continued)
| | • | | Level 2 – other significant observable inputs (including quoted prices for similar securities, interest rates, prepayment speed, credit risk, etc.) |
| | • | | Level 3 – significant unobservable inputs (including the Fund’s own assumptions in determining the fair value of investments) |
The inputs or methodology used for valuing securities are not an indication of the risk associated with investing in those securities.
For movements between the levels within the fair value hierarchy, the Fund has adopted a policy of recognizing the transfers as of the date of the underlying event which caused the movement.
At December 31, 2010, all of the Fund’s investments in securities carried at fair value were in Level 1 inputs. For detailed industry descriptions, see the accompanying Statement of Investments.
10. SUBSEQUENT EVENTS
The Fund has evaluated subsequent events through the issuance of the financial statements and determined that no events have occurred that require disclosure other than those already disclosed in the financial statements.
| | | | |
ABBREVIATIONS | | | | |
| Selected Portfolio | | | | |
| | | | |
| ADR - American Depository Receipt | | | | |
FLV-21
Franklin Templeton Variable Insurance Products Trust
Franklin Large Cap Value Securities Fund
Report of Independent Registered Public Accounting Firm
To the Board of Trustees and Shareholders of Franklin Templeton Variable Insurance Products Trust
In our opinion, the accompanying statement of assets and liabilities, including the statement of investments, and the related statements of operations and of changes in net assets and the financial highlights present fairly, in all material respects, the financial position of Franklin Large Cap Value Securities Fund (one of the funds constituting the Franklin Templeton Variable Insurance Products Trust, hereafter referred to as the “Fund”) at December 31, 2010, the results of its operations for the year then ended, the changes in its net assets for each of the two years in the period then ended and the financial highlights for each of the periods presented, in conformity with accounting principles generally accepted in the United States of America. These financial statements and financial highlights (hereafter referred to as “financial statements”) are the responsibility of the Fund’s management. Our responsibility is to express an opinion on these financial statements based on our audits. We conducted our audits of these financial statements in accordance with the standards of the Public Company Accounting Oversight Board (United States). Those standards require that we plan and perform the audit to obtain reasonable assurance about whether the financial statements are free of material misstatement. An audit includes examining, on a test basis, evidence supporting the amounts and disclosures in the financial statements, assessing the accounting principles used and significant estimates made by management, and evaluating the overall financial statement presentation. We believe that our audits, which included confirmation of securities at December 31, 2010 by correspondence with the custodian and brokers, provide a reasonable basis for our opinion.
PricewaterhouseCoopers LLP
San Francisco, California
February 10, 2011
FLV-22
Franklin Templeton Variable Insurance Products Trust
Tax Designation (unaudited)
Franklin Large Cap Value Securities Fund
Under Section 854(b)(2) of the Internal Revenue Code, the Fund designates 100% of the ordinary income dividends as income qualifying for the dividends received deduction for the fiscal year ended December 31, 2010.
FLV-23
FRANKLIN RISING DIVIDENDS SECURITIES FUND
We are pleased to bring you Franklin Rising Dividends Securities Fund’s annual report for the fiscal year ended December 31, 2010.
Performance Summary as of 12/31/10
Average annual total return of Class 4 shares* represents the average annual change in value, assuming reinvestment of dividends and capital gains. Average returns smooth out variations in returns, which can be significant; they are not the same as year-by-year results.
Periods ended 12/31/10
| | | | | | | | | | | | |
| | | 1-Year | | | 5-Year | | | 10-Year | |
Average Annual Total Return | | | +20.62% | | | | +3.37% | | | | +6.69% | |
*For the period beginning 2/29/08, Class 4 performance reflects a 12b-1 fee expense of 0.35% per year, which affects future performance. Class 4 performance prior to 2/29/08 reflects historical Class 1 performance, which does not have a 12b-1 fee expense. Since 2/29/08 (effective date), the average annual total return of Class 4 shares was +3.13%.
Total Return Index Comparison
for a Hypothetical $10,000 Investment (1/1/01–12/31/10)
The graph below shows the change in value of a hypothetical $10,000 investment in the Fund over the indicated period and includes reinvestment of any income or distributions. The Fund’s performance* is compared to the performance of the Standard & Poor’s 500 Index (S&P 500). One cannot invest directly in an index, and an index is not representative of the Fund’s portfolio. Please see Important Notes to Performance Information preceding the Fund Summaries.
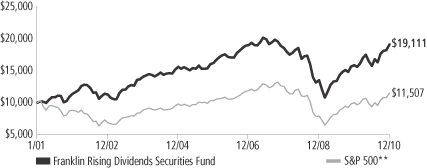
**Source: © 2011 Morningstar. Please see Index Descriptions following the Fund Summaries.
Franklin Rising Dividends Securities Fund – Class 4
Performance reflects the Fund’s Class 4 operating expenses, but does not include any contract fees, expenses or sales charges. If they had been included, performance would be lower. These charges and deductions, particularly for variable life policies, can have a significant effect on contract values and insurance benefits. See the contract prospectus for a complete description of these expenses, including sales charges.
Performance data represent past performance, which does not guarantee future results. Investment return and principal value will fluctuate, and you may have a gain or loss when you sell your shares.
Current performance may differ from figures shown.
FRD-1
Fund Goal and Main Investments: Franklin Rising Dividends Securities Fund seeks long-term capital appreciation, with preservation of capital as an important consideration. The Fund normally invests at least 80% of its net assets in investments of companies that have paid rising dividends.
Performance Overview
You can find the Fund’s one-year total return in the Performance Summary. The Fund outperformed its benchmark, the S&P 500, which rose 15.06% for the same period.1 Please note the Fund employs a bottom-up stock selection process, and the managers invest in securities without regard to benchmark comparisons.
Economic and Market Overview
During the 12-month period ended December 31, 2010, the U.S. economy grew unevenly, supported by a combination of fundamental business improvement and government intervention. Economic activity as measured by gross domestic product expanded at an annualized 3.7% pace in 2010’s first quarter and then downshifted to 1.7% annualized in the second quarter. Consumer spending picked up, likely due to pent-up post-recession demand, and the pace of growth rose at annualized rates of 2.6% in the third quarter and an estimated 3.2% in the fourth quarter.
Challenges such as mixed economic data, elevated debt concerns surrounding the U.S. budget deficit and a lack of job prospects for the unemployed hindered consumer confidence and the economy’s advance. During the early part of the annual period, home prices rose in many regions due to low interest rates, a first-time homebuyer tax credit program, and prices dipping to levels that lured buyers. Later in the period, home sales stalled as the homebuyer tax credit program ended, foreclosures mounted and the housing sector remained weak.
Amid signs of a demand-led recovery, crude oil prices rose from $79 per barrel at the end of December 2009 to a then 17-month high of $87 in early April. But as doubts surfaced about the recovery’s sustainability, oil prices dipped to $66 in late May. Prices rebounded to $91 per barrel by the end of December 2010 largely due to accelerating global demand. The pace of inflation slowed during the year, and in December 2010 the inflation rate was an annualized 1.5%.2 Similarly, core inflation, which excludes volatile food and energy costs, slowed to a 0.8%
1. Source: © 2011 Morningstar. One cannot invest directly in an index, and an index is not representative of the Fund’s portfolio. Please see Index Descriptions following the Fund Summaries.
2. Source: Bureau of Labor Statistics.
Fund Risks: The Fund’s investments in stocks may offer the potential for long-term gains but can be subject to short-term price fluctuations. Smaller and midsize company securities can increase the risk of greater price fluctuations, particularly over the short term. The Fund may have significant investments in particular sectors from time to time, such as financial services and health care, and may be at greater risk of adverse developments in a sector than a fund that invests more broadly. The manager applies various techniques and analyses in making investment decisions for the Fund, but there can be no guarantee that these decisions will produce the desired results. The Fund’s prospectus also includes a description of the main investment risks.
FRD-2
annualized rate.2 Companies added jobs throughout the period, and the unemployment rate fell from 10.0% in December 2009 to 9.4% at period-end.2 The decline was attributable in part to a shrinking labor force as some unemployed workers stopped looking for jobs.
Given few inflationary pressures and uncertainty surrounding the economic recovery, the Federal Open Market Committee (FOMC) made no major changes to its monetary policy for most of the period. The FOMC repeatedly stated it would keep the federal funds target rate within the exceptionally low 0% to 0.25% range “for an extended period” and eventually shifted its focus to its outlook and the status of its current holdings. In September, the FOMC revealed concerns about the subdued recovery and said inflation was below the pace “consistent with its mandate.” Having already lowered interest rates effectively to zero, the FOMC announced its intention to purchase government securities to stimulate the economy and promote a low level of inflation consistent with healthy economic growth.
Investor confidence shifted with each release of encouraging or discouraging economic, regulatory and political news, stoking considerable volatility among equities. Ultimately, stock indexes posted solid gains during the 12 months under review as investor risk aversion began to subside amid generally improving economic signs and rising consumer spending. Overall, the blue-chip stocks of the Dow Jones Industrial Average rose 14.06%, the broader S&P 500 increased 15.06%, and the technology-heavy NASDAQ Composite Index appreciated 18.02%.1 During the period, growth stocks outperformed their value counterparts. Performance among the major sectors was positive, with consumer discretionary, industrials and materials making the largest gains, while health care and utilities had weaker results.
Investment Strategy
We are a research-driven, fundamental investment adviser, pursuing a disciplined value-oriented strategy. As bottom-up investors concentrating primarily on individual securities, we seek fundamentally sound companies that we believe meet our screening criteria, which include consistent, substantial dividend increases; reinvested earnings; and strong balance sheets. We attempt to acquire such stocks at attractive prices, often when they are out of favor with other investors. In following these criteria, we do not necessarily focus on companies whose securities pay a high dividend but rather on companies that consistently raise their dividends.
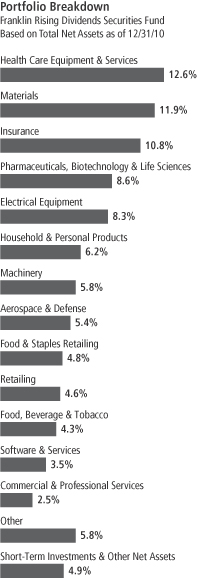
FRD-3
Manager’s Discussion
During the 12 months under review, significant contributors to performance included Family Dollar Stores, Erie Indemnity and Roper Industries. In addition to reporting strong operating results, Family Dollar announced a significant new share repurchase program. The company has increased its dividend for 34 consecutive years. Erie Indemnity, the management company for the Erie Insurance Exchange, entered into a definitive agreement with the exchange for the sale of its three property and casualty subsidiaries. Erie has 31 years of dividend increases. Industrial products manufacturer Roper performed particularly well following a speech in late August by the U.S. Federal Reserve Board chairman that outlined monetary policy changes that were implemented in November. Roper increased its dividend for the 18th year in a row.
Detractors from Fund performance included Abbott Laboratories, Nucor and Hudson City Bancorp. Shares of medical products manufacturer Abbott declined as concern grew among investors that the company’s market-leading rheumatology drug, Humira, would face significant competition within several years. Abbott has 38 years of dividend increases. Steel company Nucor’s quarterly earnings declined largely due to higher scrap metal costs. Nucor has raised its dividend for 38 years. Declining mortgage rates for most of 2010 put downward pressure on Hudson City Bancorp’s net interest margin. The company has 11 years of dividend increases.
We initiated positions in Archer-Daniels-Midland, General Dynamics, Johnson & Johnson, McDonald’s, Medtronic and Pepsico during the fiscal year. Agricultural products processor Archer-Daniels-Midland, aerospace and defense company General Dynamics, and health care products manufacturer Johnson & Johnson have increased their dividends for the past 35, 18 and 48 years, respectively. Restaurant operator McDonald’s has 34 years of dividend increases, while Medtronic, a medical device manufacturer, has raised its dividend for 33 consecutive years, and food and beverage maker Pepsico has 38 years of dividend increases. We made additions to 12 other positions. We liquidated our positions in Beckman Coulter, Graco and Sally Beauty Holdings and significantly reduced positions in Aflac and Family Dollar Stores. We made smaller reductions to 23 other positions.
Our 10 largest positions on December 31, 2010, represented 47.7% of the Fund’s total net assets. It is interesting to note how these 10 companies would respond, in aggregate, to the Fund’s screening criteria
Top 10 Holdings
Franklin Rising Dividends Securities Fund
12/31/10
| | | | |
Company
Sector/Industry | | % of Total
Net Assets | |
| United Technologies Corp. | | | 5.3% | |
| Aerospace & Defense | | | | |
| Becton, Dickinson and Co. | | | 5.2% | |
Health Care Equipment &
Services | |
| Praxair Inc. | | | 5.1% | |
| Materials | | | | |
| Roper Industries Inc. | | | 5.1% | |
| Electrical Equipment | | | | |
| The Procter & Gamble Co. | | | 4.8% | |
| Household & Personal Products | |
| Wal-Mart Stores Inc. | | | 4.8% | |
| Food & Staples Retailing | | | | |
| Family Dollar Stores Inc. | | | 4.6% | |
| Retailing | | | | |
| Dover Corp. | | | 4.3% | |
| Machinery | | | | |
| Abbott Laboratories | | | 4.3% | |
Pharmaceuticals, Biotechnology
& Life Sciences | |
| Erie Indemnity Co., A | | | 4.2% | |
| Insurance | | | | |
The dollar value, number of shares or principal amount, and names of all portfolio holdings are listed in the Fund’s Statement of Investments.
FRD-4
based on a simple average of statistical measures. On average, these 10 companies have raised their dividends 34 years in a row and by 257% in the past 10 years. Their most recent year-over-year dividend increases averaged 10.8% with a yield of 2.2% on December 31, 2010, and a dividend payout ratio of 36.6%, based on estimates of calendar year 2010 operating earnings. The average price/earnings ratio was 17.6 times calendar year 2010 estimates versus 15.0 for that of the unmanaged S&P 500.
Thank you for your participation in Franklin Rising Dividends Securities Fund. We look forward to serving your future investment needs.
The foregoing information reflects our analysis, opinions and portfolio holdings as of December 31, 2010, the end of the reporting period. The way we implement our main investment strategies and the resulting portfolio holdings may change depending on factors such as market and economic conditions. These opinions may not be relied upon as investment advice or an offer for a particular security. The information is not a complete analysis of every aspect of any market, country, industry, security or the Fund. Statements of fact are from sources considered reliable, but the investment manager makes no representation or warranty as to their completeness or accuracy. Although historical performance is no guarantee of future results, these insights may help you understand our investment management philosophy.
FRD-5
Fund Expenses
As an investor in a variable insurance contract (Contract) that indirectly provides for investment in an underlying mutual fund, you can incur transaction and/or ongoing expenses at both the Fund level and the Contract level.
| • | | Transaction expenses can include sales charges (loads) on purchases, redemption fees, surrender fees, transfer fees and premium taxes. |
| • | | Ongoing expenses can include management fees, distribution and service (12b-1) fees, contract fees, annual maintenance fees, mortality and expense risk fees and other fees and expenses. All mutual funds and Contracts have some types of ongoing expenses. |
The expenses shown in the table are meant to highlight ongoing expenses at the Fund level only and do not include ongoing expenses at the Contract level, or transaction expenses at either the Fund or Contract level. While the Fund does not have transaction expenses, if the transaction and ongoing expenses at the Contract level were included, the expenses shown would be higher. You should consult your Contract prospectus or disclosure document for more information.
The table shows Fund-level ongoing expenses and can help you understand these expenses and compare them with those of other mutual funds offered through the Contract. The table assumes a $1,000 investment held for the six months indicated. Please refer to the Fund prospectus for additional information on operating expenses.
Actual Fund Expenses
The first line (Actual) of the table provides actual account values and expenses. The “Ending Account Value” is derived from the Fund’s actual return, which includes the effect of ongoing Fund expenses, but does not include the effect of ongoing Contract expenses.
You can estimate the Fund-level expenses you incurred during the period by following these steps. Of course, your account value and expenses will differ from those in this illustration:
| 1. | Divide your account value by $1,000. |
If an account had an $8,600 value, then $8,600 ÷ $1,000 = 8.6.
| 2. | Multiply the result by the number under the heading “Fund-Level Expenses Incurred During Period.” |
If Fund-Level Expenses Incurred During Period were $7.50, then 8.6 x $7.50 = $64.50.
In this illustration, the estimated expenses incurred this period at the Fund level are $64.50.
Franklin Rising Dividends Securities Fund – Class 4
FRD-6
Hypothetical Example for Comparison with Other Mutual Funds
Information in the second line (Hypothetical) of the table can help you compare ongoing expenses of the Fund with those of other mutual funds offered through the Contract. This information may not be used to estimate the actual ending account balance or expenses you incurred during the period. The hypothetical “Ending Account Value” is based on the Fund’s actual expense ratio and an assumed 5% annual rate of return before expenses, which does not represent the Fund’s actual return. The figure under the heading “Fund-Level Expenses Incurred During Period” shows the hypothetical expenses your account would have incurred under this scenario. You can compare this figure with the 5% hypothetical examples that appear in shareholder reports of other funds offered through a Contract.
| | | | | | | | | | | | |
| Class 4 | | Beginning
Account Value 7/1/10 | | | Ending
Account
Value 12/31/10 | | | Fund-Level Expenses Incurred
During Period* 7/1/10–12/31/10 | |
Actual | | $ | 1,000 | | | $ | 1,215.80 | | | $ | 5.59 | |
Hypothetical (5% return before expenses) | | $ | 1,000 | | | $ | 1,020.16 | | | $ | 5.09 | |
*Expenses are calculated using the most recent six-month annualized expense ratio for the Fund’s Class 4 shares (1.00%), which does not include any ongoing expenses of the Contract for which the Fund is an investment option, multiplied by the average account value over the period, multiplied by 184/365 to reflect the one-half year period.
FRD-7
Franklin Templeton Variable Insurance Products Trust
Financial Highlights
Franklin Rising Dividends Securities Fund
| | | | | | | | | | | | | | | | | | | | |
| | | Year Ended December 31, | |
| Class 1 | | 2010 | | | 2009 | | | 2008 | | | 2007 | | | 2006 | |
| | | | |
Per share operating performance | | | | | | | | | | | | | | | | | | | | |
(for a share outstanding throughout the year) | | | | | | | | | | | | | | | | | | | | |
Net asset value, beginning of year | | $ | 16.13 | | | $ | 13.96 | | | $ | 19.61 | | | $ | 20.88 | | | $ | 18.11 | |
| | | | |
Income from investment operationsa: | | | | | | | | | | | | | | | | | | | | |
Net investment incomeb | | | 0.32 | | | | 0.14 | c | | | 0.35 | | | | 0.36 | | | | 0.58 | d |
Net realized and unrealized gains (losses) | | | 3.01 | | | | 2.28 | | | | (5.51 | ) | | | (0.80 | ) | | | 2.53 | |
| | | | |
Total from investment operations | | | 3.33 | | | | 2.42 | | | | (5.16 | ) | | | (0.44 | ) | | | 3.11 | |
| | | | |
Less distributions from: | | | | | | | | | | | | | | | | | | | | |
Net investment income | | | (0.31 | ) | | | (0.25 | ) | | | (0.36 | ) | | | (0.53 | ) | | | (0.24 | ) |
Net realized gains | | | — | | | | — | | | | (0.13 | ) | | | (0.30 | ) | | | (0.10 | ) |
| | | | |
Total distributions | | | (0.31 | ) | | | (0.25 | ) | | | (0.49 | ) | | | (0.83 | ) | | | (0.34 | ) |
| | | | |
Net asset value, end of year | | $ | 19.15 | | | $ | 16.13 | | | $ | 13.96 | | | $ | 19.61 | | | $ | 20.88 | |
| | | | |
| | | | | |
Total returne | | | 20.94% | | | | 17.67% | | | | (26.94)% | | | | (2.41)% | | | | 17.43% | |
Ratios to average net assets | | | | | | | | | | | | | | | | | | | | |
Expenses | | | 0.64% | | | | 0.65% | f | | | 0.61% | f | | | 0.59% | f | | | 0.61% | f |
Net investment income | | | 1.88% | | | | 0.99% | c | | | 2.05% | | | | 1.72% | | | | 3.15%d | |
| | | | | |
Supplemental data | | | | | | | | | | | | | | | | | | | | |
Net assets, end of year (000’s) | | $ | 148,544 | | | $ | 139,816 | | | $ | 142,862 | | | $ | 235,946 | | | $ | 288,303 | |
Portfolio turnover rate | | | 8.97% | | | | 16.99% | | | | 5.39% | | | | 3.29% | | | | 6.19% | |
aThe amount shown for a share outstanding throughout the period may not correlate with the Statement of Operations for the period due to the timing of sales and repurchases of the Fund shares in relation to income earned and/or fluctuating market value of the investments of the Fund.
bBased on average daily shares outstanding.
cNet investment income per share includes approximately $(0.15) per share as a return of capital adjustment to a previously recorded special dividend received by the Fund. Excluding this non-recurring amount, the ratio of net investment income to average net assets would have been 2.07%.
dNet investment income per share includes approximately $0.30 per share received in the form of a special dividend paid in connection with a corporate spin-off. Excluding this non-recurring amount, the ratio of net investment income to average net assets would have been 1.57%.
eTotal return does not include fees, charges or expenses imposed by the variable annuity and life insurance contracts for which the Franklin Templeton Variable Insurance Products Trust serves as an underlying investment vehicle
fBenefit of expense reduction rounds to less than 0.01%.
The accompanying notes are an integral part of these financial statements.
FRD-8
Franklin Templeton Variable Insurance Products Trust
Financial Highlights (continued)
Franklin Rising Dividends Securities Fund
| | | | | | | | | | | | | | | | | | | | |
| | | Year Ended December 31, | |
| Class 2 | | 2010 | | | 2009 | | | 2008 | | | 2007 | | | 2006 | |
| | | | |
Per share operating performance | | | | | | | | | | | | | | | | | | | | |
(for a share outstanding throughout the year) | | | | | | | | | | | | | | | | | | | | |
Net asset value, beginning of year | | $ | 15.86 | | | $ | 13.72 | | | $ | 19.27 | | | $ | 20.55 | | | $ | 17.84 | |
| | | | |
Income from investment operationsa: | | | | | | | | | | | | | | | | | | | | |
Net investment incomeb | | | 0.28 | | | | 0.10 | c | | | 0.31 | | | | 0.30 | | | | 0.56 | d |
Net realized and unrealized gains (losses) | | | 2.95 | | | | 2.24 | | | | (5.42 | ) | | | (0.79 | ) | | | 2.46 | |
| | | | |
Total from investment operations | | | 3.23 | | | | 2.34 | | | | (5.11 | ) | | | (0.49 | ) | | | 3.02 | |
| | | | |
Less distributions from: | | | | | | | | | | | | | | | | | | | | |
Net investment income | | | (0.27 | ) | | | (0.20 | ) | | | (0.31 | ) | | | (0.49 | ) | | | (0.21 | ) |
Net realized gains | | | — | | | | — | | | | (0.13 | ) | | | (0.30 | ) | | | (0.10 | ) |
| | | | |
Total distributions | | | (0.27 | ) | | | (0.20 | ) | | | (0.44 | ) | | | (0.79 | ) | | | (0.31 | ) |
| | | | |
Net asset value, end of year | | $ | 18.82 | | | $ | 15.86 | | | $ | 13.72 | | | $ | 19.27 | | | $ | 20.55 | |
| | | | |
| | | | | |
Total returne | | | 20.64% | | | | 17.34% | | | | (27.10)% | | | | (2.69)% | | | | 17.12% | |
Ratios to average net assets | | | | | | | | | | | | | | | | | | | | |
Expenses | | | 0.89% | | | | 0.90% | f | | | 0.86% | f | | | 0.84% | f | | | 0.86% | f |
Net investment income | | | 1.63% | | | | 0.74% | c | | | 1.80% | | | | 1.47% | | | | 2.90% | d |
| | | | | |
Supplemental data | | | | | | | | | | | | | | | | | | | | |
Net assets, end of year (000’s) | | $ | 1,572,732 | | | $ | 1,371,351 | | | $ | 1,286,878 | | | $ | 2,079,366 | | | $ | 1,981,240 | |
Portfolio turnover rate | | | 8.97% | | | | 16.99% | | | | 5.39% | | | | 3.29% | | | | 6.19% | |
aThe amount shown for a share outstanding throughout the period may not correlate with the Statement of Operations for the period due to the timing of sales and repurchases of the Fund shares in relation to income earned and/or fluctuating market value of the investments of the Fund.
bBased on average daily shares outstanding.
cNet investment income per share includes approximately $(0.15) per share as a return of capital adjustment to a previously recorded special dividend received by the Fund. Excluding this non-recurring amount, the ratio of net investment income to average net assets would have been 1.82%.
dNet investment income per share includes approximately $0.30 per share received in the form of a special dividend paid in connection with a corporate spin-off. Excluding this non-recurring amount, the ratio of net investment income to average net assets would have been 1.32%.
eTotal return does not include fees, charges or expenses imposed by the variable annuity and life insurance contracts for which the Franklin Templeton Variable Insurance Products Trust serves as an underlying investment vehicle.
fBenefit of expense reduction rounds to less than 0.01%.
The accompanying notes are an integral part of these financial statements.
FRD-9
Franklin Templeton Variable Insurance Products Trust
Financial Highlights (continued)
Franklin Rising Dividends Securities Fund
| | | | | | | | | | | | |
| | | Year Ended December 31, | |
| Class 4 | | 2010 | | | 2009 | | | 2008a | |
| | | | |
Per share operating performance | | | | | | | | | | | | |
(for a share outstanding throughout the year) | | | | | | | | | | | | |
Net asset value, beginning of year | | $ | 16.09 | | | $ | 13.92 | | | $ | 18.51 | |
| | | | |
Income from investment operationsb: | | | | | | | | | | | | |
Net investment incomec | | | 0.32 | | | | 0.13 | d | | | 0.26 | |
Net realized and unrealized gains (losses) | | | 2.94 | | | | 2.24 | | | | (4.36 | ) |
| | | | |
Total from investment operations | | | 3.26 | | | | 2.37 | | | | (4.10 | ) |
| | | | |
Less distributions from: | | | | | | | | | | | | |
Net investment income | | | (0.31 | ) | | | (0.20 | ) | | | (0.36 | ) |
Net realized gains | | | — | | | | — | | | | (0.13 | ) |
| | | | |
Total distributions | | | (0.31 | ) | | | (0.20 | ) | | | (0.49 | ) |
| | | | |
Net asset value, end of year | | $ | 19.04 | | | $ | 16.09 | | | $ | 13.92 | |
| | | | |
| | | |
Total returne | | | 20.62% | | | | 17.22% | | | | (22.82)% | |
Ratios to average net assetsf | | | | | | | | | | | | |
Expenses | | | 0.99% | | | | 1.00% | g | | | 0.96% | g |
Net investment income | | | 1.53% | | | | 0.64% | d | | | 1.70% | |
| | | |
Supplemental data | | | | | | | | | | | | |
Net assets, end of year (000’s) | | $ | 1,007 | | | $ | 15 | | | $ | 4 | |
Portfolio turnover rate | | | 8.97% | | | | 16.99% | | | | 5.39% | |
aFor the period February 29, 2008 (effective date) to December 31, 2008.
bThe amount shown for a share outstanding throughout the period may not correlate with the Statement of Operations for the period due to the timing of sales and repurchases of the Fund shares in relation to income earned and/or fluctuating market value of the investments of the Fund.
cBased on average daily shares outstanding.
dNet investment income per share includes approximately $(0.15) per share as a return of capital adjustment to a previously recorded special dividend received by the Fund. Excluding this non-recurring amount, the ratio of net investment income to average net assets would have been 1.72%.
eTotal return does not include fees, charges or expenses imposed by the variable annuity and life insurance contracts for which the Franklin Templeton Variable Insurance Products Trust serves as an underlying investment vehicle. Total return is not annualized for periods less than one year.
fRatios are annualized for periods less than one year.
gBenefit of expense reduction rounds to less than 0.01%.
The accompanying notes are an integral part of these financial statements.
FRD-10
\
Franklin Templeton Variable Insurance Products Trust
Statement of Investments, December 31, 2010
| | | | | | | | |
| Franklin Rising Dividends Securities Fund | | Shares | | | Value | |
Common Stocks 95.1% | | | | | | | | |
Aerospace & Defense 5.4% | | | | | | | | |
General Dynamics Corp. | | | 28,000 | | | $ | 1,986,880 | |
United Technologies Corp. | | | 1,149,900 | | | | 90,520,128 | |
| | | | | | | | |
| | | | | | | 92,507,008 | |
| | | | | | | | |
Banks 1.6% | | | | | | | | |
Hudson City Bancorp Inc. | | | 1,560,300 | | | | 19,878,222 | |
Peoples Bancorp Inc. | | | 102,065 | | | | 1,597,317 | |
aTrustCo Bank Corp. NY | | | 299,985 | | | | 1,901,905 | |
U.S. Bancorp | | | 146,449 | | | | 3,949,730 | |
| | | | | | | | |
| | | | | | | 27,327,174 | |
| | | | | | | | |
Commercial & Professional Services 2.5% | | | | | | | | |
ABM Industries Inc. | | | 951,288 | | | | 25,018,874 | |
Cintas Corp. | | | 525,200 | | | | 14,684,592 | |
Superior Uniform Group Inc. | | | 237,100 | | | | 2,608,100 | |
| | | | | | | | |
| | | | | | | 42,311,566 | |
| | | | | | | | |
Consumer Durables & Apparel 1.2% | | | | | | | | |
bKid Brands Inc. | | | 265,947 | | | | 2,273,847 | |
Leggett & Platt Inc. | | | 775,800 | | | | 17,657,208 | |
| | | | | | | | |
| | | | | | | 19,931,055 | |
| | | | | | | | |
Consumer Services 1.5% | | | | | | | | |
Hillenbrand Inc. | | | 1,191,300 | | | | 24,790,953 | |
McDonald’s Corp. | | | 11,000 | | | | 844,360 | |
| | | | | | | | |
| | | | | | | 25,635,313 | |
| | | | | | | | |
Diversified Financials 0.9% | | | | | | | | |
State Street Corp. | | | 324,500 | | | | 15,037,330 | |
| | | | | | | | |
Electrical Equipment 8.3% | | | | | | | | |
Brady Corp., A | | | 1,723,579 | | | | 56,205,911 | |
Roper Industries Inc. | | | 1,144,450 | | | | 87,470,314 | |
| | | | | | | | |
| | | | | | | 143,676,225 | |
| | | | | | | | |
Food & Staples Retailing 4.8% | | | | | | | | |
Wal-Mart Stores Inc. | | | 1,519,100 | | | | 81,925,063 | |
| | | | | | | | |
Food, Beverage & Tobacco 4.3% | | | | | | | | |
Archer-Daniels-Midland Co. | | | 85,500 | | | | 2,571,840 | |
McCormick & Co. Inc. | | | 1,389,095 | | | | 64,634,590 | |
PepsiCo Inc. | | | 104,000 | | | | 6,794,320 | |
| | | | | | | | |
| | | | | | | 74,000,750 | |
| | | | | | | | |
Health Care Equipment & Services 12.6% | | | | | | | | |
Becton, Dickinson and Co. | | | 1,056,643 | | | | 89,307,467 | |
Hill-Rom Holdings Inc. | | | 477,103 | | | | 18,783,545 | |
Medtronic Inc. | | | 280,000 | | | | 10,385,200 | |
Stryker Corp. | | | 423,500 | | | | 22,741,950 | |
Teleflex Inc. | | | 530,753 | | | | 28,559,819 | |
West Pharmaceutical Services Inc. | | | 1,165,600 | | | | 48,022,720 | |
| | | | | | | | |
| | | | | | | 217,800,701 | |
| | | | | | | | |
Household & Personal Products 6.2% | | | | | | | | |
Alberto-Culver Co. | | | 640,350 | | | | 23,718,564 | |
The Procter & Gamble Co. | | | 1,281,600 | | | | 82,445,328 | |
| | | | | | | | |
| | | | | | | 106,163,892 | |
| | | | | | | | |
FRD-11
Franklin Templeton Variable Insurance Products Trust
Statement of Investments, December 31, 2010 (continued)
| | | | | | | | |
| Franklin Rising Dividends Securities Fund | | Shares | | | Value | |
Common Stocks (continued) | | | | | | | | |
Industrial Conglomerates 0.6% | | | | | | | | |
Carlisle Cos. Inc. | | | 260,261 | | | $ | 10,342,772 | |
| | | | | | | | |
Insurance 10.8% | | | | | | | | |
Aflac Inc. | | | 358,700 | | | | 20,241,441 | |
Arthur J. Gallagher & Co. | | | 753,000 | | | | 21,897,240 | |
Erie Indemnity Co., A | | | 1,109,733 | | | | 72,654,220 | |
Mercury General Corp. | | | 154,200 | | | | 6,632,142 | |
Old Republic International Corp. | | | 3,429,708 | | | | 46,746,920 | |
RLI Corp. | | | 335,848 | | | | 17,655,529 | |
| | | | | | | | |
| | | | | | | 185,827,492 | |
| | | | | | | | |
Machinery 5.8% | | | | | | | | |
Donaldson Co. Inc. | | | 319,500 | | | | 18,620,460 | |
Dover Corp. | | | 1,276,200 | | | | 74,593,890 | |
Nordson Corp. | | | 66,691 | | | | 6,127,569 | |
| | | | | | | | |
| | | | | | | 99,341,919 | |
| | | | | | | | |
Materials 11.9% | | | | | | | | |
Air Products and Chemicals Inc. | | | 521,500 | | | | 47,430,425 | |
Bemis Co. Inc. | | | 1,231,300 | | | | 40,214,258 | |
Nucor Corp. | | | 699,002 | | | | 30,630,268 | |
Praxair Inc. | | | 916,260 | | | | 87,475,342 | |
| | | | | | | | |
| | | | | | | 205,750,293 | |
| | | | | | | | |
Pharmaceuticals, Biotechnology & Life Sciences 8.6% | | | | | | | | |
Abbott Laboratories | | | 1,556,300 | | | | 74,562,333 | |
Johnson & Johnson | | | 551,000 | | | | 34,079,350 | |
Pfizer Inc. | | | 2,255,100 | | | | 39,486,801 | |
| | | | | | | | |
| | | | | | | 148,128,484 | |
| | | | | | | | |
Retailing 4.6% | | | | | | | | |
Family Dollar Stores Inc. | | | 1,608,330 | | | | 79,950,084 | |
| | | | | | | | |
Semiconductors & Semiconductor Equipment 0.0%† | | | | | | | | |
Cohu Inc. | | | 50,300 | | | | 833,974 | |
| | | | | | | | |
Software & Services 3.5% | | | | | | | | |
International Business Machines Corp. | | | 415,100 | | | | 60,920,076 | |
| | | | | | | | |
Total Common Stocks (Cost $1,131,590,496) | | | | | | | 1,637,411,171 | |
| | | | | | | | |
Short Term Investments 4.9% | | | | | | | | |
Money Market Funds (Cost $84,758,643) 4.9% | | | | | | | | |
b,cInstitutional Fiduciary Trust Money Market Portfolio | | | 84,758,643 | | | | 84,758,643 | |
| | | | | | | | |
dInvestments from Cash Collateral Received for Loaned Securities 0.0%† | | | | | | | | |
Money Market Funds (Cost $632,226) 0.0%† | | | | | | | | |
bBank of New York Institutional Cash Reserve Fund, Series B | | | 632,226 | | | | 505,780 | |
| | | | | | | | |
Total Investments (Cost $1,216,981,365) 100.0% | | | | | | | 1,722,675,594 | |
Other Assets, less Liabilities (0.0)%† | | | | | | | (392,442 | ) |
| | | | | | | | |
Net Assets 100.0% | | | | | | $ | 1,722,283,152 | |
| | | | | | | | |
†Rounds to less than 0.1% of net assets.
aA portion or all of the security is on loan at December 31, 2010. See Note 1(b).
bNon-income producing.
cSee Note 7 regarding investments in the Institutional Fiduciary Trust Money Market Portfolio.
dSee Note 1(b) regarding securities on loan.
The accompanying notes are an integral part of these financial statements.
FRD-12
Franklin Templeton Variable Insurance Products Trust
Financial Statements
Statement of Assets and Liabilities
December 31, 2010
| | | | |
| | | Franklin Rising
Dividends
Securities Fund | |
Assets: | | | | |
Investments in securities: | | | | |
Cost - Unaffiliated issuers | | $ | 1,132,222,722 | |
Cost - Sweep Money Fund (Note 7) | | | 84,758,643 | |
| | | | |
Total cost of investments | | $ | 1,216,981,365 | |
| | | | |
Value - Unaffiliated issuers | | $ | 1,637,916,951 | |
Value - Sweep Money Fund (Note 7) | | | 84,758,643 | |
| | | | |
Total value of investments (includes securities loaned in the amount of $554,116) | | | 1,722,675,594 | |
Receivables: | | | | |
Capital shares sold | | | 336,268 | |
Dividends | | | 2,205,137 | |
Other assets | | | 280 | |
| | | | |
Total assets | | | 1,725,217,279 | |
| | | | |
Liabilities: | | | | |
Payables: | | | | |
Capital shares redeemed | | | 478,027 | |
Affiliates | | | 1,507,459 | |
Reports to shareholders | | | 261,751 | |
Funds advanced by custodian | | | 42,276 | |
Payable upon return of securities loaned | | | 589,950 | |
Accrued expenses and other liabilities | | | 54,664 | |
| | | | |
Total liabilities | | | 2,934,127 | |
| | | | |
Net assets, at value | | $ | 1,722,283,152 | |
| | | | |
Net assets consist of: | | | | |
Paid-in capital | | $ | 1,437,000,834 | |
Undistributed net investment income | | | 25,805,386 | |
Net unrealized appreciation (depreciation) | | | 505,694,229 | |
Accumulated net realized gain (loss) | | | (246,217,297 | ) |
| | | | |
Net assets, at value | | $ | 1,722,283,152 | |
| | | | |
Class 1: | | | | |
Net assets, at value | | $ | 148,544,148 | |
| | | | |
Shares outstanding | | | 7,756,942 | |
| | | | |
Net asset value and maximum offering price per share | | $ | 19.15 | |
| | | | |
Class 2: | | | | |
Net assets, at value | | $ | 1,572,732,380 | |
| | | | |
Shares outstanding | | | 83,561,758 | |
| | | | |
Net asset value and maximum offering price per share | | $ | 18.82 | |
| | | | |
Class 4: | | | | |
Net assets, at value | | $ | 1,006,624 | |
| | | | |
Shares outstanding | | | 52,882 | |
| | | | |
Net asset value and maximum offering price per share | | $ | 19.04 | |
| | | | |
The accompanying notes are an integral part of these financial statements.
FRD-13
Franklin Templeton Variable Insurance Products Trust
Financial Statements (continued)
Statement of Operations
for the year ended December 31, 2010
| | | | |
| | | Franklin Rising
Dividends
Securities Fund | |
Investment income: | | | | |
Dividends | | $ | 39,404,110 | |
| | | | |
Expenses: | | | | |
Management fees (Note 3a) | | | 9,530,994 | |
Distribution fees: (Note 3c) | | | | |
Class 2 | | | 3,544,013 | |
Class 4 | | | 1,091 | |
Unaffiliated transfer agent fees | | | 1,091 | |
Custodian fees (Note 4) | | | 22,389 | |
Reports to shareholders | | | 404,591 | |
Professional fees | | | 50,226 | |
Trustees’ fees and expenses | | | 5,086 | |
Other | | | 31,293 | |
| | | | |
Total expenses | | | 13,590,774 | |
| | | | |
Net investment income | | | 25,813,336 | |
| | | | |
Realized and unrealized gains (losses): | | | | |
Net realized gain (loss) from investments | | | 67,941,220 | |
Net change in unrealized appreciation (depreciation) on investments | | | 203,294,325 | |
| | | | |
Net realized and unrealized gain (loss) | | | 271,235,545 | |
| | | | |
Net increase (decrease) in net assets resulting from operations | | $ | 297,048,881 | |
| | | | |
The accompanying notes are an integral part of these financial statements.
FRD-14
Franklin Templeton Variable Insurance Products Trust
Financial Statements (continued)
Statements of Changes in Net Assets
| | | | | | | | |
| | | Franklin Rising Dividends
Securities Fund | |
| | | Year Ended December 31, | |
| | | 2010 | | | 2009 | |
| | | | |
Increase (decrease) in net assets: | | | | | | | | |
Operations: | | | | | | | | |
Net investment income | | $ | 25,813,336 | | | $ | 10,527,347 | |
Net realized gain (loss) from investments | | | 67,941,220 | | | | (78,434,293 | ) |
Net change in unrealized appreciation (depreciation) on investments | | | 203,294,325 | | | | 289,247,239 | |
| | | | |
Net increase (decrease) in net assets resulting from operations | | | 297,048,881 | | | | 221,340,293 | |
| | | | |
Distributions to shareholders from net investment income: | | | | | | | | |
Class 1 | | | (2,516,672 | ) | | | (2,324,786 | ) |
Class 2 | | | (22,710,892 | ) | | | (18,134,021 | ) |
Class 4 | | | (5,357 | ) | | | (54 | ) |
| | | | |
Total distributions to shareholders | | | (25,232,921 | ) | | | (20,458,861 | ) |
| | | | |
Capital share transactions: (Note 2) | | | | | | | | |
Class 1 | | | (15,601,529 | ) | | | (21,307,918 | ) |
Class 2 | | | (46,034,000 | ) | | | (98,146,365 | ) |
Class 4 | | | 920,381 | | | | 11,072 | |
| | | | |
Total capital share transactions | | | (60,715,148 | ) | | | (119,443,211 | ) |
| | | | |
Net increase (decrease) in net assets | | | 211,100,812 | | | | 81,438,221 | |
Net assets: | | | | | | | | |
Beginning of year | | | 1,511,182,340 | | | | 1,429,744,119 | |
| | | | |
End of year | | $ | 1,722,283,152 | | | $ | 1,511,182,340 | |
| | | | |
Undistributed net investment income included in net assets: | | | | | | | | |
End of year | | $ | 25,805,386 | | | $ | 25,224,971 | |
| | | | |
The accompanying notes are an integral part of these financial statements.
FRD-15
Franklin Templeton Variable Insurance Products Trust
Notes to Financial Statements
Franklin Rising Dividends Securities Fund
1. ORGANIZATION AND SIGNIFICANT ACCOUNTING POLICIES
Franklin Templeton Variable Insurance Products Trust (Trust) is registered under the Investment Company Act of 1940, as amended, (1940 Act) as an open-end investment company, consisting of twenty separate funds. The Franklin Rising Dividends Securities Fund (Fund) is included in this report. The financial statements of the remaining funds in the Trust are presented separately. Shares of the Fund are generally sold only to insurance company separate accounts to fund the benefits of variable life insurance policies or variable annuity contracts. At December 31, 2010, 62.80% of the Fund’s shares were held through one insurance company. The Fund offers three classes of shares: Class 1, Class 2, and Class 4. Each class of shares differs by its distribution fees, voting rights on matters affecting a single class and its exchange privilege.
The following summarizes the Fund’s significant accounting policies.
a. Financial Instrument Valuation
The Fund’s investments in securities and other financial instruments are carried at fair value daily. Fair value is the price that would be received to sell an asset or paid to transfer a liability in an orderly transaction between market participants on the measurement date. Under procedures approved by the Trust’s Board of Trustees, the Fund may utilize independent pricing services, quotations from securities and financial instrument dealers, and other market sources to determine fair value.
Equity securities listed on an exchange or on the NASDAQ National Market System are valued at the last quoted sale price or the official closing price of the day, respectively. Over-the-counter securities are valued within the range of the most recent quoted bid and ask prices. Securities that trade in multiple markets or on multiple exchanges are valued according to the broadest and most representative market. Certain equity securities are valued based upon fundamental characteristics or relationships to similar securities. Investments in open-end mutual funds are valued at the closing net asset value.
The Fund has procedures to determine the fair value of securities and other financial instruments for which market prices are not readily available or which may not be reliably priced. Under these procedures, the Fund primarily employs a market-based approach which may use related or comparable assets or liabilities, recent transactions, market multiples, book values, and other relevant information for the investment to determine the fair value of the investment. The Fund may also use an income-based valuation approach in which the anticipated future cash flows of the investment are discounted to calculate fair value. Discounts may also be applied due to the nature or duration of any restrictions on the disposition of the investments. Due to the inherent uncertainty of valuations of such investments, the fair values may differ significantly from the values that would have been used had an active market existed.
b. Securities Lending
The Fund participates in a principal based security lending program. The Fund receives cash collateral against the loaned securities in an amount equal to at least 102% of the market value of the loaned securities. Collateral is maintained over the life of the loan in an amount not less than 100% of the market value of loaned securities, as determined at the close of Fund business each day; any additional collateral required due to changes in security values is delivered to the Fund on the next business day. The collateral is invested in repurchase agreements or in a non-registered money fund managed by the Fund’s custodian on the Fund’s behalf. The Fund receives income from the investment of cash collateral, in addition to lending fees and rebates paid by the borrower. The Fund bears the market risk with respect to the collateral investment, securities loaned, and the risk that the principal may default on its obligations to the Fund.
FRD-16
Franklin Templeton Variable Insurance Products Trust
Notes to Financial Statements (continued)
Franklin Rising Dividends Securities Fund
1. ORGANIZATION AND SIGNIFICANT ACCOUNTING POLICIES (continued)
c. Income Taxes
It is the Fund’s policy to qualify as a regulated investment company under the Internal Revenue Code. The Fund intends to distribute to shareholders substantially all of its taxable income and net realized gains to relieve it from federal income and excise taxes. As a result, no provision for U.S. federal income taxes is required. The Fund files U.S. income tax returns as well as tax returns in certain other jurisdictions. The Fund’s application of those tax rules is subject to its understanding. The Fund records a provision for taxes in its financial statements including penalties and interest, if any, for a tax position taken on a tax return (or expected to be taken) when it fails to meet the more likely than not (a greater than 50% probability) threshold and based on the technical merits, the tax position may not be sustained upon examination by the tax authorities. As of December 31, 2010, and for all open tax years, the Fund has determined that no provision for income tax is required in the Fund’s financial statements. Open tax years are those that remain subject to examination and are based on each tax jurisdiction statute of limitation. The Fund is not aware of any tax position for which it is reasonably possible that the total amounts of unrecognized tax effects will significantly change in the next twelve months.
d. Security Transactions, Investment Income, Expenses and Distributions
Security transactions are accounted for on trade date. Realized gains and losses on security transactions are determined on a specific identification basis. Estimated expenses are accrued daily. Dividend income is recorded on the ex-dividend date. Distributions to shareholders are recorded on the ex-dividend date and are determined according to income tax regulations (tax basis). Distributable earnings determined on a tax basis may differ from earnings recorded in accordance with accounting principles generally accepted in the United States of America. These differences may be permanent or temporary. Permanent differences are reclassified among capital accounts to reflect their tax character. These reclassifications have no impact on net assets or the results of operations. Temporary differences are not reclassified, as they may reverse in subsequent periods.
Common expenses incurred by the Trust are allocated among the funds based on the ratio of net assets of each fund to the combined net assets of the Trust. Fund specific expenses are charged directly to the fund that incurred the expense.
Realized and unrealized gains and losses and net investment income, not including class specific expenses, are allocated daily to each class of shares based upon the relative proportion of net assets of each class. Differences in per share distributions, by class, are generally due to differences in class specific expenses.
Distributions received by the Fund from certain securities may be a return of capital (ROC). Such distributions reduce the cost basis of the securities, and any distributions in excess of the cost basis are recognized as capital gains.
e. Accounting Estimates
The preparation of financial statements in accordance with accounting principles generally accepted in the United States of America requires management to make estimates and assumptions that affect the reported amounts of assets and liabilities at the date of the financial statements and the amounts of income and expenses during the reporting period. Actual results could differ from those estimates.
f. Guarantees and Indemnifications
Under the Trust’s organizational documents, its officers and trustees are indemnified by the Trust against certain liabilities arising out of the performance of their duties to the Trust. Additionally, in the normal course of business, the Trust, on behalf of the Fund, enters into contracts with service providers that contain general indemnification clauses. The Trust’s maximum exposure under these arrangements is unknown as this would involve future claims that may be made against the Trust that have not yet occurred. Currently, the Trust expects the risk of loss to be remote.
FRD-17
Franklin Templeton Variable Insurance Products Trust
Notes to Financial Statements (continued)
Franklin Rising Dividends Securities Fund
2. SHARES OF BENEFICIAL INTEREST
At December 31, 2010, there were an unlimited number of shares authorized (without par value). Transactions in the Fund’s shares were as follows:
| | | | | | | | | | | | | | | | |
| | | Year Ended December 31, | |
| | | 2010 | | | 2009 | |
| Class 1 Shares: | | Shares | | | Amount | | | Shares | | | Amount | |
Shares sold | | | 257,133 | | | $ | 4,557,190 | | | | 342,788 | | | $ | 4,710,091 | |
Shares issued in reinvestment of distributions | | | 150,879 | | | | 2,516,672 | | | | 170,689 | | | | 2,324,786 | |
Shares redeemed | | | (1,321,083 | ) | | | (22,675,391 | ) | | | (2,076,650 | ) | | | (28,342,795 | ) |
| | | | |
Net increase (decrease) | | | (913,071 | ) | | $ | (15,601,529 | ) | | | (1,563,173 | ) | | $ | (21,307,918 | ) |
| | | | |
Class 2 Shares: | | | | |
Shares sold | | | 5,148,488 | | | $ | 89,372,157 | | | | 3,853,342 | | | $ | 52,313,933 | |
Shares issued in reinvestment of distributions | | | 1,383,124 | | | | 22,710,892 | | | | 1,352,276 | | | | 18,134,021 | |
Shares redeemed | | | (9,446,580 | ) | | | (158,117,049 | ) | | | (12,538,092 | ) | | | (168,594,319 | ) |
| | | | |
Net increase (decrease) | | | (2,914,968 | ) | | $ | (46,034,000 | ) | | | (7,332,474 | ) | | $ | (98,146,365 | ) |
| | | | |
Class 4 Shares: | | | | |
Shares sold | | | 55,672 | | | $ | 986,798 | | | | 691 | | | $ | 11,072 | |
Shares issued on reinvestment of distributions | | | 317 | | | | 5,273 | | | | — | | | | — | |
Shares redeemed | | | (4,068 | ) | | | (71,690 | ) | | | — | | | | — | |
| | | | |
Net increase (decrease) | | | 51,921 | | | $ | 920,381 | | | | 691 | | | $ | 11,072 | |
| | | | |
3. TRANSACTIONS WITH AFFILIATES
Franklin Resources, Inc. is the holding company for various subsidiaries that together are referred to as Franklin Templeton Investments. Certain officers and trustees of the Trust are also officers, and/or directors of the following subsidiaries:
| | |
| Subsidiary | | Affiliation |
Franklin Advisory Services, LLC (Advisory Services) | | Investment manager |
Franklin Templeton Services, LLC (FT Services) | | Administrative manager |
Franklin Templeton Distributors, Inc. (Distributors) | | Principal underwriter |
Franklin Templeton Investor Services, LLC (Investor Services) | | Transfer agent |
a. Management Fees
The Fund pays an investment management fee to Advisory Services based on the average daily net assets of the Fund as follows:
| | |
| Annualized Fee Rate | | Net Assets |
| 0.750% | | Up to and including $500 million |
| 0.625% | | Over $500 million, up to and including $1 billion |
| 0.500% | | In excess of $1 billion |
b. Administrative Fees
Under an agreement with Advisory Services, FT Services provides administrative services to the Fund. The fee is paid by Advisory Services based on average daily net assets, and is not an additional expense of the Fund.
FRD-18
Franklin Templeton Variable Insurance Products Trust
Notes to Financial Statements (continued)
Franklin Rising Dividends Securities Fund
3. TRANSACTIONS WITH AFFILIATES (continued)
c. Distribution Fees
The Trust’s Board of Trustees has adopted distribution plans for Class 2 and Class 4 shares pursuant to Rule 12b-1 under the 1940 Act. Under the Fund’s compensation distribution plans, the Fund pays Distributors for costs incurred in connection with the servicing, sale and distribution of the Fund’s shares up to 0.35% per year of its average daily net assets of each class. The Board of Trustees has agreed to limit the current rate to 0.25% per year for Class 2.
d. Transfer Agent Fees
Investor Services, under terms of an agreement, performs shareholder servicing for the Fund and is not paid by the Fund for the services.
4. EXPENSE OFFSET ARRANGEMENT
The Fund has entered into an arrangement with its custodian whereby credits realized as a result of uninvested cash balances are used to reduce a portion of the Fund’s custodian expenses. During the year ended December 31, 2010, there were no credits earned.
5. INCOME TAXES
For tax purposes, capital losses may be carried over to offset future capital gains, if any. At December 31, 2010, the capital loss carryforwards were as follows:
| | | | |
Capital loss carryforwards expiring in: | | | | |
2016 | | $ | 136,099,518 | |
2017 | | | 107,931,803 | |
| | | | |
| | $ | 244,031,321 | |
| | | | |
During the year ended December 31, 2010, the Fund utilized $67,941,220 of capital loss carryforwards.
The tax character of distributions paid during the years ended December 31, 2010 and 2009, was as follows:
| | | | | | | | |
| | | 2010 | | | 2009 | |
Distributions paid from ordinary income | | $ | 25,232,921 | | | $ | 20,458,861 | |
At December 31, 2010, the cost of investments, net unrealized appreciation (depreciation) and undistributed ordinary income for income tax purposes were as follows:
| | | | |
Cost of investments | | $ | 1,219,167,339 | |
| | | | |
| |
Unrealized appreciation | | $ | 554,665,024 | |
Unrealized depreciation | | | (51,156,769 | ) |
| | | | |
Net unrealized appreciation (depreciation) | | $ | 503,508,255 | |
| | | | |
Distributable earnings–undistributed ordinary income | | $ | 25,805,386 | |
| | | | |
Net realized gains (losses) differ for financial statement and tax purposes primarily due to differing treatment of wash sales.
FRD-19
Franklin Templeton Variable Insurance Products Trust
Notes to Financial Statements (continued)
Franklin Rising Dividends Securities Fund
6. INVESTMENT TRANSACTIONS
Purchases and sales of investments (excluding short term securities) for the year ended December 31, 2010, aggregated $132,832,648 and $219,068,160, respectively.
7. INVESTMENTS IN INSTITUTIONAL FIDUCIARY TRUST MONEY MARKET PORTFOLIO
The Fund may invest in the Institutional Fiduciary Trust Money Market Portfolio (Sweep Money Fund), an open-end investment company managed by Franklin Advisers, Inc. (an affiliate of the investment manager). Management fees paid by the Fund are reduced on assets invested in the Sweep Money Fund, in an amount not to exceed the management and administrative fees paid by the Sweep Money Fund.
8. CREDIT FACILITY
The Fund, together with other U.S. registered and foreign investment funds (collectively “Borrowers”), managed by Franklin Templeton Investments, are borrowers in a joint syndicated senior unsecured credit facility totaling $750 million (Global Credit Facility) which matures on January 21, 2011. This Global Credit Facility provides a source of funds to the Borrowers for temporary and emergency purposes, including the ability to meet future unanticipated or unusually large redemption requests.
Under the terms of the Global Credit Facility, the Fund shall, in addition to interest charged on any borrowings made by the Fund and other costs incurred by the Fund, pay its share of fees and expenses incurred in connection with the implementation and maintenance of the Global Credit Facility, based upon its relative share of the aggregate net assets of all of the Borrowers, including an annual commitment fee of 0.10% based upon the unused portion of the Global Credit Facility, which is reflected in other expenses on the Statement of Operations. During the year ended December 31, 2010, the Fund did not use the Global Credit Facility.
Effective January 21, 2011, the Borrowers renewed the Global Credit Facility for a total of $750 million, maturing January 20, 2012.
9. FAIR VALUE MEASUREMENTS
The Fund follows a fair value hierarchy that distinguishes between market data obtained from independent sources (observable inputs) and the Fund’s own market assumptions (unobservable inputs). These inputs are used in determining the value of the Fund’s investments and are summarized in the following fair value hierarchy:
| | • | | Level 1 – quoted prices in active markets for identical securities |
| | • | | Level 2 – other significant observable inputs (including quoted prices for similar securities, interest rates, prepayment speed, credit risk, etc.) |
| | • | | Level 3 – significant unobservable inputs (including the Fund’s own assumptions in determining the fair value of investments) |
The inputs or methodology used for valuing securities are not an indication of the risk associated with investing in those securities.
For movements between the levels within the fair value hierarchy, the Fund has adopted a policy of recognizing the transfers as of the date of the underlying event which caused the movement.
FRD-20
Franklin Templeton Variable Insurance Products Trust
Notes to Financial Statements (continued)
Franklin Rising Dividends Securities Fund
9. FAIR VALUE MEASUREMENTS (continued)
The following is a summary of the inputs used as of December 31, 2010, in valuing the Fund’s assets carried at fair value:
| | | | | | | | | | | | | | | | |
| | | Level 1 | | | Level 2 | | | Level 3 | | | Total | |
| | | | |
Assets: | | | | | | | | | | | | | | | | |
Investments in Securities: | | | | | | | | | | | | | | | | |
Equity Investmentsa | | $ | 1,637,411,171 | | | $ | — | | | $ | — | | | $ | 1,637,411,171 | |
Short Term Investments | | | 84,758,643 | | | | 505,780 | | | | — | | | | 85,264,423 | |
| | | | |
Total Investments in Securities | | $ | 1,722,169,814 | | | $ | 505,780 | | | $ | — | | | $ | 1,722,675,594 | |
| | | | |
aFor detailed industry descriptions, see the accompanying Statement of Investments.
10. SUBSEQUENT EVENTS
The Fund has evaluated subsequent events through the issuance of the financial statements and determined that no events have occurred that require disclosure other than those already disclosed in the financial statements.
FRD-21
Franklin Templeton Variable Insurance Products Trust
Franklin Rising Dividends Securities Fund
Report of Independent Registered Public Accounting Firm
To the Board of Trustees and Shareholders of
Franklin Templeton Variable Insurance Products Trust
In our opinion, the accompanying statement of assets and liabilities, including the statement of investments, and the related statements of operations and of changes in net assets and the financial highlights present fairly, in all material respects, the financial position of Franklin Rising Dividends Securities Fund (one of the funds constituting the Franklin Templeton Variable Insurance Products Trust, hereafter referred to as the “Fund”) at December 31, 2010, the results of its operations for the year then ended, the changes in its net assets for each of the two years in the period then ended and the financial highlights for each of the periods presented, in conformity with accounting principles generally accepted in the United States of America. These financial statements and financial highlights (hereafter referred to as “financial statements”) are the responsibility of the Fund’s management. Our responsibility is to express an opinion on these financial statements based on our audits. We conducted our audits of these financial statements in accordance with the standards of the Public Company Accounting Oversight Board (United States). Those standards require that we plan and perform the audit to obtain reasonable assurance about whether the financial statements are free of material misstatement. An audit includes examining, on a test basis, evidence supporting the amounts and disclosures in the financial statements, assessing the accounting principles used and significant estimates made by management, and evaluating the overall financial statement presentation. We believe that our audits, which included confirmation of securities at December 31, 2010 by correspondence with the custodian and brokers, provide a reasonable basis for our opinion.
PricewaterhouseCoopers LLP
San Francisco, California
February 10, 2011
FRD-22
Franklin Templeton Variable Insurance Products Trust
Tax Designation (unaudited)
Franklin Rising Dividends Securities Fund
Under Section 854(b)(2) of the Internal Revenue Code, the Fund designates 100% of the ordinary income dividends as income qualifying for the dividends received deduction for the fiscal year ended December 31, 2010.
FRD-23
FRANKLIN SMALL CAP VALUE SECURITIES FUND
We are pleased to bring you Franklin Small Cap Value Securities Fund’s annual report for the fiscal year ended December 31, 2010.
Performance Summary as of 12/31/10
Average annual total return of Class 4 shares* represents the average annual change in value, assuming reinvestment of dividends and capital gains. Average returns smooth out variations in returns, which can be significant; they are not the same as year-by-year results.
Periods ended 12/31/10
| | | | | | | | | | | | |
| | | 1-Year | | | 5-Year | | | 10-Year | |
Average Annual Total Return | | | +28.14% | | | | +4.91% | | | | +8.99% | |
*For the period beginning 2/29/08, Class 4 performance reflects a 12b-1 fee expense of 0.35% per year, which affects future performance. Class 4 performance prior to 2/29/08 reflects historical Class 1 performance, which does not have a 12b-1 fee expense. Since 2/29/08 (effective date), the average annual total return of Class 4 shares was +5.74%.
Total Return Index Comparison
for a Hypothetical $10,000 Investment (1/1/01–12/31/10)
The graph below shows the change in value of a hypothetical $10,000 investment in the Fund over the indicated period and includes reinvestment of any income or distributions. The Fund’s performance* is compared to the performance of the Russell 2500™ Value Index. One cannot invest directly in an index, and an index is not representative of the Fund’s portfolio. Please see Important Notes to Performance Information preceding the Fund Summaries.
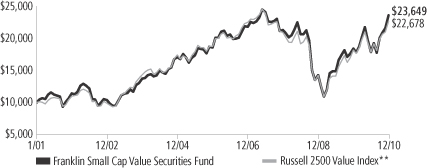
**Source: © 2011 Morningstar. Please see Index Descriptions following the Fund Summaries.
Franklin Small Cap Value Securities Fund – Class 4
Performance reflects the Fund’s Class 4 operating expenses, but does not include any contract fees, expenses or sales charges. If they had been included, performance would be lower. These charges and deductions, particularly for variable life policies, can have a significant effect on contract values and insurance benefits. See the contract prospectus for a complete description of these expenses, including sales charges.
Performance data represent past performance, which does not guarantee future results. Investment return and principal value will fluctuate, and you may have a gain or loss when you sell your shares.
Current performance may differ from figures shown.
FSV-1
Fund Goal and Main Investments: Franklin Small Cap Value Securities Fund seeks long-term total return. The Fund normally invests at least 80% of its net assets in investments of small-capitalization companies. For this Fund, small-capitalization companies are those with market capitalization values not exceeding $3.5 billion at the time of purchase. The Fund invests generally in equity securities of companies that the manager believes are currently undervalued and have the potential for capital appreciation.
Performance Overview
You can find the Fund’s one-year total return in the Performance Summary. The Fund outperformed its benchmark, the Russell 2500 Value Index, which rose 24.82% for the same period.1 Please note the Fund employs a bottom-up stock selection process and the managers invest in securities without regard to benchmark comparisons.
Economic and Market Overview
During the 12-month period ended December 31, 2010, the U.S. economy grew unevenly, supported by a combination of fundamental business improvement and government intervention. Economic activity as measured by gross domestic product expanded at an annualized 3.7% pace in 2010’s first quarter and then downshifted to 1.7% annualized in the second quarter. Consumer spending picked up, likely due to pent-up post-recession demand, and the pace of growth rose at annualized rates of 2.6% in the third quarter and an estimated 3.2% in the fourth quarter.
Challenges such as mixed economic data, elevated debt concerns surrounding the U.S. budget deficit and a lack of job prospects for the unemployed hindered consumer confidence and the economy’s advance. During the early part of the annual period, home prices rose in many regions due to low interest rates, a first-time homebuyer tax credit program, and prices dipping to levels that lured buyers. Later in the period, home sales stalled as the homebuyer tax credit program ended, foreclosures mounted and the housing sector remained weak.
Amid signs of a demand-led recovery, crude oil prices rose from $79 per barrel at the end of December 2009 to a then 17-month high of $87 in early April. But as doubts surfaced about the recovery’s sustainability, oil prices dipped to $66 in late May. Prices rebounded to $91 per barrel by the end of December 2010 largely due to accelerating global
1. Source: © 2011 Morningstar. One cannot invest directly in an index, and an index is not representative of the Fund’s portfolio. Please see Index Descriptions following the Fund Summaries.
Fund Risks: The Fund’s investments in stocks may offer the potential for long-term gains but can be subject to short-term price fluctuations. Smaller company securities can increase the risk of greater price volatility, particularly over the short term. Smaller or relatively new or unseasoned companies can also be particularly sensitive to changing economic conditions, and their prospects for growth are less certain than those of larger, more established companies. Foreign investing involves additional risks, including currency fluctuations, economic instability, market volatility, and political and social instability. The manager applies various techniques and analyses in making investment decisions for the Fund, but there can be no guarantee that these decisions will produce the desired results. The Fund’s prospectus also includes a description of the main investment risks.
FSV-2
demand. The pace of inflation slowed during the year, and in December 2010 the inflation rate was an annualized 1.5%.2 Similarly, core inflation, which excludes volatile food and energy costs, slowed to a 0.8% annualized rate.2 Companies added jobs throughout period, and the unemployment rate fell from 10.0% in December 2009 to 9.4% at period-end.2 The decline was attributable in part to a shrinking labor force as some unemployed workers stopped looking for jobs.
Given few inflationary pressures and uncertainty surrounding the economic recovery, the Federal Open Market Committee (FOMC) made no major changes to its monetary policy for most of the period. The FOMC repeatedly stated it would keep the federal funds target rate within the exceptionally low 0% to 0.25% range “for an extended period” and eventually shifted its focus to its outlook and the status of its current holdings. In September, the FOMC revealed concerns about the subdued recovery and said inflation was below the pace “consistent with its mandate.” Having already lowered interest rates effectively to zero, the FOMC announced its intention to purchase government securities to stimulate the economy and promote a low level of inflation consistent with healthy economic growth.
Investor confidence shifted with each release of encouraging or discouraging economic, regulatory and political news, stoking considerable volatility among equities. Ultimately, stock indexes posted solid gains during the 12 months under review as investor risk aversion began to subside amid generally improving economic signs and rising consumer spending. Overall, the blue-chip stocks of the Dow Jones Industrial Average rose 14.06%, the broader Standard & Poor’s 500 Index increased 15.06%, and the technology-heavy NASDAQ Composite Index appreciated 18.02%.1 During the period, growth stocks outperformed their value counterparts. Performance among the major sectors was positive, with consumer discretionary, industrials and materials making the largest gains, while health care and utilities had weaker results.
Investment Strategy
We are a research-driven, fundamental investment adviser, pursuing a disciplined, value-oriented strategy for the Fund. As a bottom-up adviser concentrating primarily on individual securities, we focus on
2. Source: Bureau of Labor Statistics.
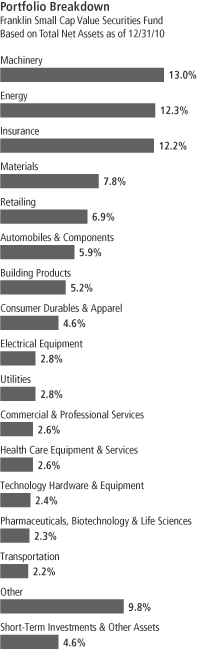
FSV-3
the market price of a company’s securities relative to our evaluation of the company’s potential long-term earnings, asset value or cash flow. We seek bargains among the “unloved,” out-of-favor companies that offer, in our opinion, attractive long-term potential. These might include current growth companies that are being ignored by the market, former growth companies that have stumbled recently, dropping sharply in price but that still have significant growth potential, in our opinion, or companies that may be potential turnaround candidates or takeover targets.
Manager’s Discussion
During the 12 months under review, all sectors represented in the Fund helped results, with the industrials and consumer discretionary sectors among the largest contributors to Fund performance.3 In the industrials sector, transportation equipment manufacturer Wabash National, industrial goods company Nordson, industrial machinery provider Gardner Denver and railroad car manufacturer Trinity Industries boosted returns. Automotive safety systems manufacturer Autoliv, automotive components supplier Gentex and automobile dealership operator Group 1 Automotive were among consumer discretionary holdings that benefited performance. The energy sector, where contract drilling services provider Rowan performed well, also helped results.4 Other contributors to performance included insurer Protective Life and basic chemicals company Westlake Chemical.
Detractors from performance included some holdings in the industrials sector such as building products manufacturer Gibraltar Industries and construction materials producer and contractor Granite Construction, a new holding. In the financials sector, insurance company American National Insurance and regional commercial banking services provider Chemical Financial hindered results.5 Other key detractors from performance included specialty retailer Christopher & Banks, oil tanker company Overseas Shipholding Group and electronics manufacturing service company Benchmark Electronics.
3. The industrials sector comprises aerospace and defense, airlines, building products, commercial services and supplies, construction and engineering, electrical equipment, industrial conglomerates, machinery, professional services, road and rail, and trading companies and distributors in the SOI. The consumer discretionary sector comprises auto components; automobiles; diversified consumer services; household durables; leisure equipment and products; multiline retail; specialty retail; and textiles, apparel and luxury goods in the SOI.
4. The energy sector comprises energy equipment and services; and oil, gas and consumable fuels in the SOI.
5. The financials sector comprises commercial banks, insurance, and thrifts and mortgage finance in the SOI.
FSV-4
In addition to purchasing shares of Granite Construction, the Fund initiated 12 positions during the period in what we considered attractively valued securities: comprehensive human resources provider Administaff, women’s apparel and accessories retailer Cato, burial casket provider Hillenbrand, specialty food manufacturer Lancaster Colony, electric utility company PNM Resources, plastic compounds and resins producer A. Schulman, food and beverage products manufacturer Sensient Technologies, property and casualty insurers HCC Insurance Holdings, The Hanover Insurance Group, Tower Group and Transatlantic Holdings, and biomedical testing systems and supplies manufacturer Beckman Coulter, which we sold near period-end as its shares appreciated sharply after takeover rumors emerged. We liquidated 12 other positions during the fiscal year: Airgas, Atmos Energy, Carbo Ceramics, Diebold, Gerdau Ameristeel, Gymboree, Kansas City Southern, OmniVision Technologies, Timberland Company, Zale, Zenith National Insurance, and Furiex Pharmaceuticals, which we received as a spin-off from Pharmaceutical Product Development.
Thank you for your participation in Franklin Small Cap Value Securities Fund. We look forward to serving your future investment needs.
The foregoing information reflects our analysis, opinions and portfolio holdings as of December 31, 2010, the end of the reporting period. The way we implement our main investment strategies and the resulting portfolio holdings may change depending on factors such as market and economic conditions. These opinions may not be relied upon as investment advice or an offer for a particular security. The information is not a complete analysis of every aspect of any market, country, industry, security or the Fund. Statements of fact are from sources considered reliable, but the investment manager makes no representation or warranty as to their completeness or accuracy. Although historical performance is no guarantee of future results, these insights may help you understand our investment management philosophy.
Top 10 Holdings
Franklin Small Cap Value Securities Fund
12/31/10
| | | | |
Company Sector/Industry | | % of Total Net Assets | |
| Protective Life Corp. | | | 2.0% | |
| Insurance | | | | |
| Autoliv Inc. (Sweden) | | | 2.0% | |
| Automobiles & Components | | | | |
| Thor Industries Inc. | | | 1.9% | |
| Automobiles & Components | | | | |
| Rowan Cos. Inc. | | | 1.7% | |
| Energy | | | | |
| Tidewater Inc. | | | 1.7% | |
| Energy | | | | |
| Bristow Group Inc. | | | 1.7% | |
| Energy | | | | |
| Trinity Industries Inc. | | | 1.6% | |
| Machinery | | | | |
| Group 1 Automotive Inc. | | | 1.6% | |
| Retailing | | | | |
| Old Republic International Corp. | | | 1.5% | |
| Insurance | | | | |
| Mueller Industries Inc. | | | 1.5% | |
Machinery | | | | |
The dollar value, number of shares or principal amount, and names of all portfolio holdings are listed in the Fund’s Statement of Investments (SOI).
FSV-5
Fund Expenses
As an investor in a variable insurance contract (Contract) that indirectly provides for investment in an underlying mutual fund, you can incur transaction and/or ongoing expenses at both the Fund level and the Contract level.
| • | | Transaction expenses can include sales charges (loads) on purchases, redemption fees, surrender fees, transfer fees and premium taxes. |
| • | | Ongoing expenses can include management fees, distribution and service (12b-1) fees, contract fees, annual maintenance fees, mortality and expense risk fees and other fees and expenses. All mutual funds and Contracts have some types of ongoing expenses. |
The expenses shown in the table are meant to highlight ongoing expenses at the Fund level only and do not include ongoing expenses at the Contract level, or transaction expenses at either the Fund or Contract level. While the Fund does not have transaction expenses, if the transaction and ongoing expenses at the Contract level were included, the expenses shown below would be higher. You should consult your Contract prospectus or disclosure document for more information.
The table shows Fund-level ongoing expenses and can help you understand these expenses and compare them with those of other mutual funds offered through the Contract. The table assumes a $1,000 investment held for the six months indicated. Please refer to the Fund prospectus for additional information on operating expenses.
Actual Fund Expenses
The first line (Actual) of the table provides actual account values and expenses. The “Ending Account Value” is derived from the Fund’s actual return, which includes the effect of ongoing Fund expenses, but does not include the effect of ongoing Contract expenses.
You can estimate the Fund-level expenses you incurred during the period by following these steps. Of course, your account value and expenses will differ from those in this illustration:
| 1. | Divide your account value by $1,000. |
If an account had an $8,600 value, then $8,600 ÷ $1,000 = 8.6.
| 2. | Multiply the result by the number under the heading “Fund-Level Expenses Incurred During Period.” |
If Fund-Level Expenses Incurred During Period were $7.50, then 8.6 x $7.50 = $64.50.
In this illustration, the estimated expenses incurred this period at the Fund level are $64.50.
Franklin Small Cap Value Securities Fund – Class 4
FSV-6
Hypothetical Example for Comparison with Other Mutual Funds
Information in the second line (Hypothetical) of the table can help you compare ongoing expenses of the Fund with those of other mutual funds offered through the Contract. This information may not be used to estimate the actual ending account balance or expenses you incurred during the period. The hypothetical “Ending Account Value” is based on the Fund’s actual expense ratio and an assumed 5% annual rate of return before expenses, which does not represent the Fund’s actual return. The figure under the heading “Fund-Level Expenses Incurred During Period” shows the hypothetical expenses your account would have incurred under this scenario. You can compare this figure with the 5% hypothetical examples that appear in shareholder reports of other funds offered through a Contract.
| | | | | | | | | | | | |
| Class 4 | | Beginning
Account Value 7/1/10 | | | Ending
Account
Value 12/31/10 | | | Fund-Level Expenses Incurred
During Period* 7/1/10–12/31/10 | |
Actual | | $ | 1,000 | | | $ | 1,322.60 | | | $ | 6.03 | |
Hypothetical (5% return before expenses) | | $ | 1,000 | | | $ | 1,020.01 | | | $ | 5.24 | |
*Expenses are calculated using the most recent six-month annualized expense ratio for the Fund’s Class 4 shares (1.03%), which does not include any ongoing expenses of the Contract for which the Fund is an investment option, multiplied by the average account value over the period, multiplied by 184/365 to reflect the one-half year period.
FSV-7
Franklin Templeton Variable Insurance Products Trust
Financial Highlights
Franklin Small Cap Value Securities Fund
| | | | | | | | | | | | | | | | | | | | |
| | | Year Ended December 31, | |
| Class 1 | | 2010 | | | 2009 | | | 2008 | | | 2007 | | | 2006 | |
| | | | |
Per share operating performance | | | | | | | | | | | | | | | | | | | | |
(for a share outstanding throughout the year) | | | | | | | | | | | | | | | | | | | | |
Net asset value, beginning of year | | $ | 13.00 | | | $ | 10.73 | | | $ | 17.38 | | | $ | 19.07 | | | $ | 17.02 | |
| | | | |
Income from investment operationsa: | | | | | | | | | | | | | | | | | | | | |
Net investment incomeb | | | 0.14 | | | | 0.15 | | | | 0.24 | | | | 0.22 | | | | 0.18 | |
Net realized and unrealized gains (losses) | | | 3.54 | | | | 2.86 | | | | (5.44 | ) | | | (0.44 | ) | | | 2.69 | |
| | | | |
Total from investment operations | | | 3.68 | | | | 3.01 | | | | (5.20 | ) | | | (0.22 | ) | | | 2.87 | |
| | | | |
Less distributions from: | | | | | | | | | | | | | | | | | | | | |
Net investment income | | | (0.13 | ) | | | (0.22 | ) | | | (0.23 | ) | | | (0.17 | ) | | | (0.16 | ) |
Net realized gains | | | — | | | | (0.52 | ) | | | (1.22 | ) | | | (1.30 | ) | | | (0.66 | ) |
| | | | |
Total distributions | | | (0.13 | ) | | | (0.74 | ) | | | (1.45 | ) | | | (1.47 | ) | | | (0.82 | ) |
| | | | |
Net asset value, end of year | | $ | 16.55 | | | $ | 13.00 | | | $ | 10.73 | | | $ | 17.38 | | | $ | 19.07 | |
| | | | |
| | | | | |
Total returnc | | | 28.49% | | | | 29.54% | | | | (32.87)% | | | | (2.14)% | | | | 17.30% | |
Ratios to average net assets | | | | | | | | | | | | | | | | | | | | |
Expenses | | | 0.67% | | | | 0.68% | d | | | 0.67% | d | | | 0.64% | d | | | 0.65% | d |
Net investment income | | | 0.98% | | | | 1.29% | | | | 1.62% | | | | 1.13% | | | | 0.97% | |
| | | | | |
Supplemental data | | | | | | | | | | | | | | | | | | | | |
Net assets, end of year (000's) | | $ | 47,300 | | | $ | 42,428 | | | $ | 34,901 | | | $ | 57,045 | | | $ | 73,154 | |
Portfolio turnover rate | | | 15.92% | | | | 6.68% | | | | 16.98% | | | | 16.27% | | | | 16.43% | e |
aThe amount shown for a share outstanding throughout the period may not correlate with the Statement of Operations for the period due to the timing of sales and repurchases of the Fund shares in relation to income earned and/or fluctuating market value of the investments of the Fund.
bBased on average daily shares outstanding.
cTotal return does not include fees, charges or expenses imposed by the variable annuity and life insurance contracts for which the Franklin Templeton Variable Insurance Products Trust serves as an underlying investment vehicle.
dBenefit of expense reduction rounds to less than 0.01%.
eExcludes the value of portfolio securities delivered as a result of a redemption in-kind.
The accompanying notes are an integral part of these financial statements.
FSV-8
Franklin Templeton Variable Insurance Products Trust
Financial Highlights (continued)
Franklin Small Cap Value Securities Fund
| | | | | | | | | | | | | | | | | | | | |
| | | Year Ended December 31, | |
| Class 2 | | 2010 | | | 2009 | | | 2008 | | | 2007 | | | 2006 | |
| | | | |
Per share operating performance | | | | | | | | | | | | | | | | | | | | |
(for a share outstanding throughout the year) | | | | | | | | | | | | | | | | | | | | |
Net asset value, beginning of year | | $ | 12.77 | | | $ | 10.55 | | | $ | 17.10 | | | $ | 18.79 | | | $ | 16.79 | |
| | | | |
Income from investment operationsa: | | | | | | | | | | | | | | | | | | | | |
Net investment incomeb | | | 0.10 | | | | 0.12 | | | | 0.20 | | | | 0.17 | | | | 0.13 | |
Net realized and unrealized gains (losses) | | | 3.48 | | | | 2.81 | | | | (5.35 | ) | | | (0.43 | ) | | | 2.65 | |
| | | | |
Total from investment operations | | | 3.58 | | | | 2.93 | | | | (5.15 | ) | | | (0.26 | ) | | | 2.78 | |
| | | | |
Less distributions from: | | | | | | | | | | | | | | | | | | | | |
Net investment income | | | (0.10 | ) | | | (0.19 | ) | | | (0.18 | ) | | | (0.13 | ) | | | (0.12 | ) |
Net realized gains | | | — | | | | (0.52 | ) | | | (1.22 | ) | | | (1.30 | ) | | | (0.66 | ) |
| | | | |
Total distributions | | | (0.10 | ) | | | (0.71 | ) | | | (1.40 | ) | | | (1.43 | ) | | | (0.78 | ) |
| | | | |
Net asset value, end of year | | $ | 16.25 | | | $ | 12.77 | | | $ | 10.55 | | | $ | 17.10 | | | $ | 18.79 | |
| | | | |
| | | | | |
Total returnc | | | 28.22% | | | | 29.16% | | | | (33.02)% | | | | (2.38)% | | | | 16.98% | |
Ratios to average net assets | | | | | | | | | | | | | | | | | | | | |
Expenses | | | 0.92% | | | | 0.93% | d | | | 0.92% | d | | | 0.89% | d | | | 0.90% | d |
Net investment income | | | 0.73% | | | | 1.04% | | | | 1.37% | | | | 0.88% | | | | 0.72% | |
| | | | | |
Supplemental data | | | | | | | | | | | | | | | | | | | | |
Net assets, end of year (000's) | | $ | 1,362,292 | | | $ | 1,109,855 | | | $ | 784,773 | | | $ | 1,177,367 | | | $ | 1,240,892 | |
Portfolio turnover rate | | | 15.92% | | | | 6.68% | | | | 16.98% | | | | 16.27% | | | | 16.43% | e |
aThe amount shown for a share outstanding throughout the period may not correlate with the Statement of Operations for the period due to the timing of sales and repurchases of the Fund shares in relation to income earned and/or fluctuating market value of the investments of the Fund.
bBased on average daily shares outstanding.
cTotal return does not include fees, charges or expenses imposed by the variable annuity and life insurance contracts for which the Franklin Templeton Variable Insurance Products Trust serves as an underlying investment vehicle.
dBenefit of expense reduction rounds to less than 0.01%.
eExcludes the value of portfolio securities delivered as a result of a redemption in-kind.
The accompanying notes are an integral part of these financial statements.
FSV-9
Franklin Templeton Variable Insurance Products Trust
Financial Highlights (continued)
Franklin Small Cap Value Securities Fund
| | | | | | | | | | | | |
| | | Year Ended December 31 | |
| Class 4 | | 2010 | | | 2009 | | | 2008a | |
| | | | |
Per share operating performance | | | | | | | | | | | | |
(for a share outstanding throughout the year) | | | | | | | | | | | | |
Net asset value, beginning of year | | $ | 12.92 | | | $ | 10.70 | | | $ | 16.42 | |
| | | | |
Income from investment operationsb: | | | | | | | | | | | | |
Net investment incomec | | | 0.09 | | | | 0.11 | | | | 0.15 | |
Net realized and unrealized gains (losses) | | | 3.53 | | | | 2.84 | | | | (4.42 | ) |
| | | | |
Total from investment operations | | | 3.62 | | | | 2.95 | | | | (4.27 | ) |
| | | | |
Less distributions from: | | | | | | | | | | | | |
Net investment income | | | (0.10 | ) | | | (0.21 | ) | | | (0.23 | ) |
Net realized gains | | | — | | | | (0.52 | ) | | | (1.22 | ) |
| | | | |
Total distributions | | | (0.10 | ) | | | (0.73 | ) | | | (1.45 | ) |
| | | | |
Net asset value, end of year | | $ | 16.44 | | | $ | 12.92 | | | $ | 10.70 | |
| | | | |
| | | |
Total returnd | | | 28.14% | | | | 29.04% | | | | (29.14)% | |
Ratios to average net assetse | | | | | | | | | | | | |
Expenses | | | 1.02% | | | | 1.03%f | | | | 1.02% | f |
Net investment income | | | 0.63% | | | | 0.94% | | | | 1.27% | |
| | | |
Supplemental data | | | | | | | | | | | | |
Net assets, end of year (000's) | | $ | 39,075 | | | $ | 28,599 | | | $ | 14,850 | |
Portfolio turnover rate | | | 15.92% | | | | 6.68% | | | | 16.98% | |
aFor the period February 29, 2008 (effective date) to December 31, 2008.
bThe amount shown for a share outstanding throughout the period may not correlate with the Statement of Operations for the period due to the timing of sales and repurchases of the Fund shares in relation to income earned and/or fluctuating market value of the investments of the Fund.
cBased on average daily shares outstanding.
dTotal return does not include fees, charges or expenses imposed by the variable annuity and life insurance contracts for which the Franklin Templeton Variable Insurance Products Trust serves as an underlying investment vehicle. Total return is not annualized for periods less than one year.
eRatios are annualized for periods less than one year.
fBenefit of expense reduction rounds to less than 0.01%.
The accompanying notes are an integral part of these financial statements.
FSV-10
Franklin Templeton Variable Insurance Products Trust
Statement of Investments, December 31, 2010
| | | | | | | | |
| Franklin Small Cap Value Securities Fund | | Shares | | | Value | |
Common Stocks 95.3% | | | | | | | | |
Aerospace & Defense 0.8% | | | | | | | | |
aCeradyne Inc. | | | 349,000 | | | $ | 11,003,970 | |
| | | | | | | | |
Automobiles & Components 5.9% | | | | | | | | |
Autoliv Inc. (Sweden) | | | 359,500 | | | | 28,378,931 | |
Drew Industries Inc. | | | 90,700 | | | | 2,060,704 | |
Gentex Corp. | | | 714,100 | | | | 21,108,796 | |
Thor Industries Inc. | | | 800,000 | | | | 27,168,000 | |
aWinnebago Industries Inc. | | | 485,000 | | | | 7,372,000 | |
| | | | | | | | |
| | | | | | | 86,088,431 | |
| | | | | | | | |
Banks 1.6% | | | | | | | | |
Chemical Financial Corp. | | | 405,554 | | | | 8,983,021 | |
Peoples Bancorp Inc. | | | 158,000 | | | | 2,472,700 | |
bTrustCo Bank Corp. NY | | | 1,889,400 | | | | 11,978,796 | |
| | | | | | | | |
| | | | | | | 23,434,517 | |
| | | | | | | | |
Building Products 5.2% | | | | | | | | |
A.O. Smith Corp. | | | 141,000 | | | | 5,369,280 | |
American Woodmark Corp. | | | 421,800 | | | | 10,350,972 | |
Apogee Enterprises Inc. | | | 864,000 | | | | 11,638,080 | |
aGibraltar Industries Inc. | | | 900,100 | | | | 12,214,357 | |
Simpson Manufacturing Co. Inc. | | | 485,500 | | | | 15,006,805 | |
Universal Forest Products Inc. | | | 517,500 | | | | 20,130,750 | |
| | | | | | | | |
| | | | | | | 74,710,244 | |
| | | | | | | | |
Commercial & Professional Services 2.6% | | | | | | | | |
ABM Industries Inc. | | | 712,000 | | | | 18,725,600 | |
Administaff Inc. | | | 319,300 | | | | 9,355,490 | |
Mine Safety Appliances Co. | | | 328,300 | | | | 10,219,979 | |
| | | | | | | | |
| | | | | | | 38,301,069 | |
| | | | | | | | |
Construction & Engineering 1.6% | | | | | | | | |
aEMCOR Group Inc. | | | 296,870 | | | | 8,603,293 | |
Granite Construction Inc. | | | 553,000 | | | | 15,168,790 | |
| | | | | | | | |
| | | | | | | 23,772,083 | |
| | | | | | | | |
Consumer Durables & Apparel 4.6% | | | | | | | | |
aBassett Furniture Industries Inc. | | | 172,854 | | | | 725,987 | |
Brunswick Corp. | | | 550,000 | | | | 10,307,000 | |
D.R. Horton Inc. | | | 496,700 | | | | 5,925,631 | |
Ethan Allen Interiors Inc. | | | 159,000 | | | | 3,181,590 | |
Hooker Furniture Corp. | | | 510,700 | | | | 7,216,191 | |
aLa-Z-Boy Inc. | | | 1,247,000 | | | | 11,247,940 | |
M.D.C. Holdings Inc. | | | 240,700 | | | | 6,924,939 | |
aM/I Homes Inc. | | | 500,000 | | | | 7,690,000 | |
aThe Warnaco Group Inc. | | | 243,000 | | | | 13,382,010 | |
| | | | | | | | |
| | | | | | | 66,601,288 | |
| | | | | | | | |
Consumer Services 1.4% | | | | | | | | |
Hillenbrand Inc. | | | 322,300 | | | | 6,707,063 | |
Regis Corp. | | | 833,200 | | | | 13,831,120 | |
| | | | | | | | |
| | | | | | | 20,538,183 | |
| | | | | | | | |
Electrical Equipment 2.8% | | | | | | | | |
Brady Corp., A | | | 420,400 | | | | 13,709,244 | |
FSV-11
Franklin Templeton Variable Insurance Products Trust
Statement of Investments, December 31, 2010 (continued)
| | | | | | | | |
| Franklin Small Cap Value Securities Fund | | Shares | | | Value | |
Common Stocks (continued) | | | | | | | | |
Electrical Equipment (continued) | | | | | | | | |
Franklin Electric Co. Inc. | | | 215,432 | | | $ | 8,384,613 | |
aPowell Industries Inc. | | | 145,000 | | | | 4,767,600 | |
Roper Industries Inc. | | | 186,900 | | | | 14,284,767 | |
| | | | | | | | |
| | | | | | | 41,146,224 | |
| | | | | | | | |
Energy 12.3% | | | | | | | | |
Arch Coal Inc. | | | 111,500 | | | | 3,909,190 | |
aAtwood Oceanics Inc. | | | 439,100 | | | | 16,409,167 | |
aBristow Group Inc. | | | 518,600 | | | | 24,555,710 | |
CONSOL Energy Inc. | | | 79,700 | | | | 3,884,578 | |
aGlobal Industries Ltd. | | | 1,575,600 | | | | 10,918,908 | |
aHelix Energy Solutions Group Inc. | | | 832,000 | | | | 10,100,480 | |
aOil States International Inc. | | | 285,900 | | | | 18,323,331 | |
bOverseas Shipholding Group Inc. | | | 298,000 | | | | 10,555,160 | |
Peabody Energy Corp. | | | 103,200 | | | | 6,602,736 | |
aRowan Cos. Inc. | | | 710,000 | | | | 24,786,100 | |
Teekay Corp. (Canada) | | | 245,431 | | | | 8,118,857 | |
Tidewater Inc. | | | 457,000 | | | | 24,604,880 | |
aUnit Corp. | | | 336,000 | | | | 15,617,280 | |
| | | | | | | | |
| | | | | | | 178,386,377 | |
| | | | | | | | |
Food & Staples Retailing 0.7% | | | | | | | | |
Casey's General Stores Inc. | | | 239,500 | | | | 10,181,145 | |
| | | | | | | | |
Food, Beverage & Tobacco 1.1% | | | | | | | | |
Lancaster Colony Corp. | | | 265,000 | | | | 15,158,000 | |
| | | | | | | | |
Health Care Equipment & Services 2.6% | | | | | | | | |
STERIS Corp. | | | 456,900 | | | | 16,658,574 | |
Teleflex Inc. | | | 252,400 | | | | 13,581,644 | |
West Pharmaceutical Services Inc. | | | 178,500 | | | | 7,354,200 | |
| | | | | | | | |
| | | | | | | 37,594,418 | |
| | | | | | | | |
Industrial Conglomerates 1.1% | | | | | | | | |
Carlisle Cos. Inc. | | | 400,100 | | | | 15,899,974 | |
| | | | | | | | |
Insurance 12.2% | | | | | | | | |
American National Insurance Co. | | | 79,000 | | | | 6,763,980 | |
Arthur J. Gallagher & Co. | | | 168,200 | | | | 4,891,256 | |
Aspen Insurance Holdings Ltd. | | | 550,100 | | | | 15,743,862 | |
Erie Indemnity Co., A | | | 124,600 | | | | 8,157,562 | |
The Hanover Insurance Group Inc. | | | 155,000 | | | | 7,241,600 | |
HCC Insurance Holdings Inc. | | | 209,900 | | | | 6,074,506 | |
Montpelier Re Holdings Ltd. (Bermuda) | | | 686,900 | | | | 13,696,786 | |
Old Republic International Corp. | | | 1,583,400 | | | | 21,581,742 | |
Protective Life Corp. | | | 1,110,000 | | | | 29,570,400 | |
RLI Corp. | | | 150,000 | | | | 7,885,500 | |
StanCorp Financial Group Inc. | | | 318,200 | | | | 14,363,548 | |
Tower Group Inc. | | | 612,200 | | | | 15,660,076 | |
Transatlantic Holdings Inc. | | | 183,200 | | | | 9,456,784 | |
Validus Holdings Ltd. (Bermuda) | | | 488,295 | | | | 14,946,710 | |
| | | | | | | | |
| | | | | | | 176,034,312 | |
| | | | | | | | |
Machinery 12.9% | | | | | | | | |
aAstec Industries Inc. | | | 349,300 | | | | 11,320,813 | |
Briggs & Stratton Corp. | | | 533,000 | | | | 10,494,770 | |
CIRCOR International Inc. | | | 148,302 | | | | 6,270,209 | |
FSV-12
Franklin Templeton Variable Insurance Products Trust
Statement of Investments, December 31, 2010 (continued)
| | | | | | | | |
| Franklin Small Cap Value Securities Fund | | Shares | | | Value | |
Common Stocks (continued) | | | | | | | | |
Machinery (continued) | | | | | | | | |
aCNH Global NV (Netherlands) | | | 72,700 | | | $ | 3,470,698 | |
Gardner Denver Inc. | | | 285,700 | | | | 19,661,874 | |
Graco Inc. | | | 430,000 | | | | 16,963,500 | |
Kennametal Inc. | | | 455,000 | | | | 17,954,300 | |
Lincoln Electric Holdings Inc. | | | 194,300 | | | | 12,681,961 | |
Mueller Industries Inc. | | | 611,000 | | | | 19,979,700 | |
Nordson Corp. | | | 203,500 | | | | 18,697,580 | |
Timken Co. | | | 110,000 | | | | 5,250,300 | |
Trinity Industries Inc. | | | 854,200 | | | | 22,730,262 | |
aWabash National Corp. | | | 923,300 | | | | 10,941,105 | |
Watts Water Technologies Inc., A | | | 277,400 | | | | 10,150,066 | |
| | | | | | | | |
| | | | | | | 186,567,138 | |
| | | | | | | | |
Materials 7.8% | | | | | | | | |
A. Schulman Inc. | | | 33,300 | | | | 762,237 | |
AptarGroup Inc. | | | 223,200 | | | | 10,617,624 | |
Cabot Corp. | | | 364,600 | | | | 13,727,190 | |
Glatfelter | | | 347,900 | | | | 4,268,733 | |
Reliance Steel & Aluminum Co. | | | 418,700 | | | | 21,395,570 | |
RPM International Inc. | | | 821,900 | | | | 18,163,990 | |
Sensient Technologies Corp. | | | 230,000 | | | | 8,447,900 | |
Steel Dynamics Inc. | | | 981,600 | | | | 17,963,280 | |
United States Steel Corp. | | | 43,600 | | | | 2,547,112 | |
Westlake Chemical Corp. | | | 332,900 | | | | 14,471,163 | |
| | | | | | | | |
| | | | | | | 112,364,799 | |
| | | | | | | | |
Pharmaceuticals, Biotechnology & Life Sciences 2.3% | | | | | | | | |
aMettler-Toledo International Inc. | | | 129,500 | | | | 19,581,695 | |
Pharmaceutical Product Development Inc. | | | 521,800 | | | | 14,161,652 | |
| | | | | | | | |
| | | | | | | 33,743,347 | |
| | | | | | | | |
Retailing 6.9% | | | | | | | | |
Brown Shoe Co. Inc. | | | 794,000 | | | | 11,060,420 | |
The Cato Corp., A | | | 52,200 | | | | 1,430,802 | |
Christopher & Banks Corp. | | | 1,260,000 | | | | 7,749,000 | |
Fred's Inc. | | | 818,300 | | | | 11,259,808 | |
Group 1 Automotive Inc. | | | 538,700 | | | | 22,496,112 | |
J.C. Penney Co. Inc. | | | 273,000 | | | | 8,820,630 | |
The Men's Wearhouse Inc. | | | 592,917 | | | | 14,811,067 | |
aPier 1 Imports Inc. | | | 700,500 | | | | 7,355,250 | |
a,bSaks Inc. | | | 532,548 | | | | 5,698,263 | |
aTuesday Morning Corp. | | | 507,900 | | | | 2,681,712 | |
aWest Marine Inc. | | | 678,900 | | | | 7,182,762 | |
| | | | | | | | |
| | | | | | | 100,545,826 | |
| | | | | | | | |
Semiconductors & Semiconductor Equipment 1.0% | | | | | | | | |
Cohu Inc. | | | 826,500 | | | | 13,703,370 | |
| | | | | | | | |
Technology Hardware & Equipment 2.4% | | | | | | | | |
aBenchmark Electronics Inc. | | | 1,132,000 | | | | 20,557,120 | |
aRofin-Sinar Technologies Inc. | | | 411,200 | | | | 14,572,928 | |
| | | | | | | | |
| | | | | | | 35,130,048 | |
| | | | | | | | |
Trading Companies & Distributors 0.5% | | | | | | | | |
Applied Industrial Technologies Inc. | | | 211,200 | | | | 6,859,776 | |
| | | | | | | | |
Transportation 2.2% | | | | | | | | |
aGenesee & Wyoming Inc. | | | 330,200 | | | | 17,484,090 | |
SkyWest Inc. | | | 953,500 | | | | 14,893,670 | |
| | | | | | | | |
| | | | | | | 32,377,760 | |
| | | | | | | | |
FSV-13
Franklin Templeton Variable Insurance Products Trust
Statement of Investments, December 31, 2010 (continued)
| | | | | | | | |
| Franklin Small Cap Value Securities Fund | | Shares | | | Value | |
Common Stocks (continued) | | | | | | | | |
Utilities 2.8% | | | | | | | | |
Energen Corp. | | | 239,800 | | | $ | 11,572,748 | |
NV Energy Inc. | | | 1,284,200 | | | | 18,043,010 | |
PNM Resources Inc. | | | 825,000 | | | | 10,741,500 | |
| | | | | | | | |
| | | | | | | 40,357,258 | |
| | | | | | | | |
Total Common Stocks (Cost $1,028,166,129) | | | | | | | 1,380,499,557 | |
| | | | | | | | |
| | |
| | | Principal
Amount | | | | |
Corporate Bonds (Cost $1,483,734) 0.1% | | | | | | | | |
Machinery 0.1% | | | | | | | | |
Mueller Industries Inc., 6.00%, 11/01/14 | | $ | 1,494,000 | | | | 1,488,398 | |
| | | | | | | | |
Total Investments before Short Term Investments (Cost $1,029,649,863) | | | | | | | 1,381,987,955 | |
| | | | | | | | |
| | |
| | | Shares | | | | |
Short Term Investments 5.6% | | | | | | | | |
Money Market Funds (Cost $67,497,420) 4.7% | | | | | | | | |
a,cInstitutional Fiduciary Trust Money Market Portfolio | | | 67,497,420 | | | | 67,497,420 | |
| | | | | | | | |
dInvestments from Cash Collateral Received for Loaned Securities 0.9% | | | | | | | | |
Money Market Funds (Cost $2,536,889) 0.1% | | | | | | | | |
aBank of New York Institutional Cash Reserve Fund, Series B | | | 2,536,889 | | | | 2,029,511 | |
| | | | | | | | |
| | |
| | | Principal
Amount | | | | |
eRepurchase Agreements 0.8% | | | | | | | | |
Barclays Capital Inc., 0.20%, 1/03/11 (Maturity Value $2,433,041)
Collateralized by U.S. Treasury Notes, 0.38% - 0.63%, 6/30/2012 - 9/30/12 (valued at $2,481,660) | | $ | 2,433,000 | | | | 2,433,000 | |
BNP Paribas Securities Corp., 0.17%, 1/03/11 (Maturity Value $2,498,035)
Collateralized by U.S. Government Agency Securities, zero cpn. - - 10.35%, 1/10/11 - 2/09/40; fU.S. Government Agency Discount Notes, 1/04/11 - 6/22/11 (valued at $2,547,960) | | | 2,498,000 | | | | 2,498,000 | |
Deutsche Bank Securities Inc., 0.22%, 1/03/11 (Maturity Value $2,268,042)
Collateralized by fU.S. Government Agency Discount Notes, 4/26/11 (valued at $2,313,360) | | | 2,268,000 | | | | 2,268,000 | |
Merrill Lynch, Pierce, Fenner & Smith Inc., 0.17%, 1/03/11 (Maturity Value $2,000,028)
Collateralized by U.S. Government Agency Securities, 2.63% - 9.50%, 10/15/11 - 4/15/53 (valued at $2,040,000) | | | 2,000,000 | | | | 2,000,000 | |
RBS Securities Inc., 0.25%, 1/03/11 (Maturity Value $2,057,043)
Collateralized by U.S. Government Agency Securities, 0.55% - 5.95%, 1/20/11 - 6/07/27 (valued at $2,098,147) | | | 2,057,000 | | | | 2,057,000 | |
| | | | | | | | |
Total Repurchase Agreements (Cost $11,256,000) | | | | | | | 11,256,000 | |
| | | | | | | | |
Total Investments from Cash Collateral Received for Loaned Securities
(Cost $13,792,889) | | | | | | | 13,285,511 | |
| | | | | | | | |
Total Investments (Cost $1,110,940,172) 101.0% | | | | | | | 1,462,770,886 | |
Other Assets, less Liabilities (1.0)% | | | | | | | (14,104,253 | ) |
| | | | | | | | |
Net Assets 100.0% | | | | | | $ | 1,448,666,633 | |
| | | | | | | | |
aNon-income producing.
bA portion or all of the security is on loan at December 31, 2010. See Note 1(c).
cSee Note 7 regarding investments in the Institutional Fiduciary Trust Money Market Portfolio.
dSee Note 1(c) regarding securities on loan.
eSee Note 1(b) regarding repurchase agreements.
fThe security is traded on a discount basis with no stated coupon rate.
FSV-14
Franklin Templeton Variable Insurance Products Trust
Financial Statements
Statement of Assets and Liabilities
December 31, 2010
| | | | |
| | | Franklin Small
Cap Value
Securities Fund | |
Assets: | | | | |
Investments in securities: | | | | |
Cost - Unaffiliated issuers | | $ | 1,032,186,752 | |
Cost - Sweep Money Fund (Note 7) | | | 67,497,420 | |
Cost - Repurchase agreements | | | 11,256,000 | |
| | | | |
Total cost of investments | | $ | 1,110,940,172 | |
| | | | |
Value - Unaffiliated issuers | | $ | 1,384,017,466 | |
Value - Sweep Money Fund (Note 7) | | | 67,497,420 | |
Value - Repurchase agreements | | | 11,256,000 | |
| | | | |
Total value of investments (includes securities loaned in the amount of $13,278,994) | | | 1,462,770,886 | |
Receivables: | | | | |
Investment securities sold | | | 516,929 | |
Capital shares sold | | | 875,080 | |
Dividends and interest | | | 857,608 | |
Other assets | | | 220 | |
| | | | |
Total assets | | | 1,465,020,723 | |
| | | | |
Liabilities: | | | | |
Payables: | | | | |
Capital shares redeemed | | | 984,851 | |
Affiliates | | | 1,288,699 | |
Payable upon return of securities loaned | | | 13,792,889 | |
Accrued expenses and other liabilities | | | 287,651 | |
| | | | |
Total liabilities | | | 16,354,090 | |
| | | | |
Net assets, at value | | $ | 1,448,666,633 | |
| | | | |
Net assets consist of: | | | | |
Paid-in capital | | $ | 1,186,015,236 | |
Undistributed net investment income | | | 9,373,123 | |
Net unrealized appreciation (depreciation) | | | 351,830,714 | |
Accumulated net realized gain (loss) | | | (98,552,440 | ) |
| | | | |
Net assets, at value | | $ | 1,448,666,633 | |
| | | | |
The accompanying notes are an integral part of these financial statements.
FSV-15
Franklin Templeton Variable Insurance Products Trust
Financial Statements (continued)
Statement of Assets and Liabilities (continued)
December 31, 2010
| | | | |
| | | Franklin Small
Cap Value
Securities Fund | |
Class 1: | | | | |
Net assets, at value | | $ | 47,300,420 | |
| | | | |
Shares outstanding | | | 2,857,185 | |
| | | | |
Net asset value and maximum offering price per share | | $ | 16.55 | |
| | | | |
Class 2: | | | | |
Net assets, at value | | $ | 1,362,291,689 | |
| | | | |
Shares outstanding | | | 83,833,970 | |
| | | | |
Net asset value and maximum offering price per share | | $ | 16.25 | |
| | | | |
Class 4: | | | | |
Net assets, at value | | $ | 39,074,524 | |
| | | | |
Shares outstanding | | | 2,376,588 | |
| | | | |
Net asset value and maximum offering price per share | | $ | 16.44 | |
| | | | |
The accompanying notes are an integral part of these financial statements.
FSV-16
Franklin Templeton Variable Insurance Products Trust
Financial Statements (continued)
Statement of Operations
for the year ended December 31, 2010
| | | | |
| | | Franklin Small
Cap Value
Securities Fund | |
Investment income: | | | | |
Dividends: | | | | |
Unaffiliated issuers | | $ | 20,676,872 | |
Non-controlled affiliated issuers (Note 8) | | | 166,530 | |
Interest | | | 91,929 | |
Income from securities loaned | | | 45,585 | |
| | | | |
Total investment income | | | 20,980,916 | |
| | | | |
Expenses: | | | | |
Management fees (Note 3a) | | | 6,434,339 | |
Administrative fees (Note 3b) | | | 1,529,685 | |
Distribution fees: (Note 3c) | | | | |
Class 2 | | | 2,981,764 | |
Class 4 | | | 113,385 | |
Unaffiliated transfer agent fees | | | 3,323 | |
Custodian fees (Note 4) | | | 19,083 | |
Reports to shareholders | | | 437,824 | |
Registration and filing fees | | | 2,057 | |
Professional fees | | | 47,159 | |
Trustees' fees and expenses | | | 4,612 | |
Other | | | 36,752 | |
| | | | |
Total expenses | | | 11,609,983 | |
| | | | |
Net investment income | | | 9,370,933 | |
| | | | |
Realized and unrealized gains (losses): | | | | |
Net realized gain (loss) from: | | | | |
Investments: | | | | |
Unaffiliated issuers | | | (8,758,099 | ) |
Non-controlled affiliated issuers (Note 8) | | | (363,097 | ) |
| | | | |
Net realized gain (loss) | | | (9,121,196 | ) |
| | | | |
Net change in unrealized appreciation (depreciation) on investments | | | 315,120,022 | |
| | | | |
Net realized and unrealized gain (loss) | | | 305,998,826 | |
| | | | |
Net increase (decrease) in net assets resulting from operations | | $ | 315,369,759 | |
| | | | |
The accompanying notes are an integral part of these financial statements.
FSV-17
Franklin Templeton Variable Insurance Products Trust
Financial Statements (continued)
Statements of Changes in Net Assets
| | | | | | | | |
| | | Franklin Small Cap Value
Securities Fund | |
| | | Year Ended December 31, | |
| | | 2010 | | | 2009 | |
| | | | |
Increase (decrease) in net assets: | | | | | | | | |
Operations: | | | | | | | | |
Net investment income | | $ | 9,370,933 | | | $ | 9,986,631 | |
Net realized gain (loss) from investments | | | (9,121,196 | ) | | | (86,881,008 | ) |
Net change in unrealized appreciation (depreciation) on investments | | | 315,120,022 | | | | 345,475,195 | |
| | | | |
Net increase (decrease) in net assets resulting from operations | | | 315,369,759 | | | | 268,580,818 | |
| | | | |
Distributions to shareholders from: | | | | | | | | |
Net investment income: | | | | | | | | |
Class 1 | | | (391,013 | ) | | | (665,043 | ) |
Class 2 | | | (9,354,014 | ) | | | (13,687,826 | ) |
Class 4 | | | (225,374 | ) | | | (385,972 | ) |
Net realized gains: | | | | | | | | |
Class 1 | | | — | | | | (1,544,298 | ) |
Class 2 | | | — | | | | (37,694,393 | ) |
Class 4 | | | — | | | | (931,849 | ) |
| | | | |
Total distributions to shareholders | | | (9,970,401 | ) | | | (54,909,381 | ) |
| | | | |
Capital share transactions: (Note 2) | | | | | | | | |
Class 1 | | | (5,400,815 | ) | | | 209,708 | |
Class 2 | | | (34,566,603 | ) | | | 123,378,715 | |
Class 4 | | | 2,352,541 | | | | 9,098,546 | |
| | | | |
Total capital share transactions | | | (37,614,877 | ) | | | 132,686,969 | |
| | | | |
Net increase (decrease) in net assets | | | 267,784,481 | | | | 346,358,406 | |
Net assets: | | | | | | | | |
Beginning of year | | | 1,180,882,152 | | | | 834,523,746 | |
| | | | |
End of year | | $ | 1,448,666,633 | | | $ | 1,180,882,152 | |
| | | | |
Undistributed net investment income included in net assets: | | | | | | | | |
End of year | | $ | 9,373,123 | | | $ | 9,972,591 | |
| | | | |
The accompanying notes are an integral part of these financial statements.
FSV-18
Franklin Templeton Variable Insurance Products Trust
Notes to Financial Statements
Franklin Small Cap Value Securities Fund
1. ORGANIZATION AND SIGNIFICANT ACCOUNTING POLICIES
Franklin Templeton Variable Insurance Products Trust (Trust) is registered under the Investment Company Act of 1940, as amended, (1940 Act) as an open-end investment company, consisting of twenty separate funds. The Franklin Small Cap Value Securities Fund (Fund) is included in this report. The financial statements of the remaining funds in the Trust are presented separately. Shares of the Fund are generally sold only to insurance company separate accounts to fund the benefits of variable life insurance policies or variable annuity contracts. The Fund offers three classes of shares: Class 1, Class 2 and Class 4. Each class of shares differs by its distribution fees, voting rights on matters affecting a single class and its exchange privilege.
The following summarizes the Fund's significant accounting policies.
a. Financial Instrument Valuation
The Fund’s investments in securities and other financial instruments are carried at fair value daily. Fair value is the price that would be received to sell an asset or paid to transfer a liability in an orderly transaction between market participants on the measurement date. Under procedures approved by the Trust’s Board of Trustees, the Fund may utilize independent pricing services, quotations from securities and financial instrument dealers, and other market sources to determine fair value.
Equity securities listed on an exchange or on the NASDAQ National Market System are valued at the last quoted sale price or the official closing price of the day, respectively. Over-the-counter securities are valued within the range of the most recent quoted bid and ask prices. Securities that trade in multiple markets or on multiple exchanges are valued according to the broadest and most representative market. Certain equity securities are valued based upon fundamental characteristics or relationships to similar securities. Investments in open-end mutual funds are valued at the closing net asset value.
Debt securities generally trade in the over-the-counter market rather than on a securities exchange. The Fund's pricing services use multiple valuation techniques to determine fair value. In instances where sufficient market activity exists, the pricing services may utilize a market-based approach through which quotes from market makers are used to determine fair value. In instances where sufficient market activity may not exist or is limited, the pricing services also utilize proprietary valuation models which may consider market characteristics such as benchmark yield curves, option-adjusted spreads, credit spreads, estimated default rates, coupon rates, anticipated timing of principal repayments, underlying collateral, and other unique security features in order to estimate the relevant cash flows, which are then discounted to calculate the fair value. Repurchase agreements are valued at cost, which approximates market value.
The Fund has procedures to determine the fair value of securities and other financial instruments for which market prices are not readily available or which may not be reliably priced. Under these procedures, the Fund primarily employs a market-based approach which may use related or comparable assets or liabilities, recent transactions, market multiples, book values, and other relevant information for the investment to determine the fair value of the investment. The Fund may also use an income-based valuation approach in which the anticipated future cash flows of the investment are discounted to calculate fair value. Discounts may also be applied due to the nature or duration of any restrictions on the disposition of the investments. Due to the inherent uncertainty of valuations of such investments, the fair values may differ significantly from the values that would have been used had an active market existed.
b. Repurchase Agreements
The Fund may enter into repurchase agreements, which are accounted for as a loan by the Fund to the seller, collateralized by securities which are delivered to the Fund's custodian. The market value, including accrued interest, of the initial collateralization is required to be at least 102% of the dollar amount invested by the Fund, with the value of the underlying securities marked to market daily to maintain coverage of at least 100%. All repurchase agreements held by the Fund at year end had been entered into on December 31, 2010.
FSV-19
Franklin Templeton Variable Insurance Products Trust
Notes to Financial Statements (continued)
Franklin Small Cap Value Securities Fund
1. ORGANIZATION AND SIGNIFICANT ACCOUNTING POLICIES (continued)
c. Securities Lending
The Fund participates in a principal based security lending program. The Fund receives cash collateral against the loaned securities in an amount equal to at least 102% of the market value of the loaned securities. Collateral is maintained over the life of the loan in an amount not less than 100% of the market value of loaned securities, as determined at the close of Fund business each day; any additional collateral required due to changes in security values is delivered to the Fund on the next business day. The collateral is invested in repurchase agreements or in a non-registered money fund, managed by the Fund’s custodian on the Fund’s behalf. The Fund receives income from the investment of cash collateral, in addition to lending fees and rebates paid by the borrower. The Fund bears the market risk with respect to the collateral investment, securities loaned, and the risk that the principal may default on its obligations to the Fund.
d. Income Taxes
It is the Fund's policy to qualify as a regulated investment company under the Internal Revenue Code. The Fund intends to distribute to shareholders substantially all of its taxable income and net realized gains to relieve it from federal income and excise taxes. As a result, no provision for U.S. federal income taxes is required. The Fund files U.S. income tax returns as well as tax returns in certain other jurisdictions. The Fund's application of those tax rules is subject to its understanding. The Fund records a provision for taxes in its financial statements including penalties and interest, if any, for a tax position taken on a tax return (or expected to be taken) when it fails to meet the more likely than not (a greater than 50% probability) threshold and based on the technical merits, the tax position may not be sustained upon examination by the tax authorities. As of December 31, 2010, and for all open tax years, the Fund has determined that no provision for income tax is required in the Fund's financial statements. Open tax years are those that remain subject to examination and are based on each tax jurisdiction statute of limitation. The Fund is not aware of any tax position for which it is reasonably possible that the total amounts of unrecognized tax effects will significantly change in the next twelve months.
e. Security Transactions, Investment Income, Expenses and Distributions
Security transactions are accounted for on trade date. Realized gains and losses on security transactions are determined on a specific identification basis. Interest income and estimated expenses are accrued daily. Dividend income is recorded on the ex-dividend date. Distributions to shareholders are recorded on the ex-dividend date and are determined according to income tax regulations (tax basis). Distributable earnings determined on a tax basis may differ from earnings recorded in accordance with accounting principles generally accepted in the United States of America. These differences may be permanent or temporary. Permanent differences are reclassified among capital accounts to reflect their tax character. These reclassifications have no impact on net assets or the results of operations. Temporary differences are not reclassified, as they may reverse in subsequent periods.
Common expenses incurred by the Trust are allocated among the funds based on the ratio of net assets of each fund to the combined net assets of the Trust. Fund specific expenses are charged directly to the fund that incurred the expense.
Realized and unrealized gains and losses and net investment income, not including class specific expenses, are allocated daily to each class of shares based upon the relative proportion of net assets of each class. Differences in per share distributions, by class, are generally due to differences in class specific expenses.
f. Accounting Estimates
The preparation of financial statements in accordance with accounting principles generally accepted in the United States of America requires management to make estimates and assumptions that affect the reported amounts of assets and liabilities at the date of the financial statements and the amounts of income and expenses during the reporting period. Actual results could differ from those estimates.
FSV-20
Franklin Templeton Variable Insurance Products Trust
Notes to Financial Statements (continued)
Franklin Small Cap Value Securities Fund
1. ORGANIZATION AND SIGNIFICANT ACCOUNTING POLICIES (continued)
g. Guarantees and Indemnifications
Under the Trust's organizational documents, its officers and trustees are indemnified by the Trust against certain liabilities arising out of the performance of their duties to the Trust. Additionally, in the normal course of business, the Trust, on behalf of the Fund, enters into contracts with service providers that contain general indemnification clauses. The Trust's maximum exposure under these arrangements is unknown as this would involve future claims that may be made against the Trust that have not yet occurred. Currently, the Trust expects the risk of loss to be remote.
2. SHARES OF BENEFICIAL INTEREST
At December 31, 2010, there were an unlimited number of shares authorized (without par value). Transactions in the Fund's shares were as follows:
| | | | | | | | | | | | | | | | |
| | | Year Ended December 31, | |
| | | 2010 | | | 2009 | |
| Class 1 Shares: | | Shares | | | Amount | | | Shares | | | Amount | |
Shares sold | | | 487,990 | | | $ | 7,004,812 | | | | 756,038 | | | $ | 8,112,443 | |
Shares issued in reinvestment of distributions | | | 28,110 | | | | 391,013 | | | | 206,867 | | | | 2,209,341 | |
Shares redeemed | | | (923,527 | ) | | | (12,796,640 | ) | | | (950,287 | ) | | | (10,112,076 | ) |
| | | | |
Net increase (decrease) | | | (407,427 | ) | | $ | (5,400,815 | ) | | | 12,618 | | | $ | 209,708 | |
| | | | |
Class 2 Shares: | | | | | | | | | | | | | | | | |
Shares sold | | | 16,505,195 | | | $ | 234,092,954 | | | | 25,275,286 | | | $ | 260,568,778 | |
Shares issued in reinvestment of distributions | | | 684,273 | | | | 9,354,014 | | | | 4,888,889 | | | | 51,382,219 | |
Shares redeemed | | | (20,285,779 | ) | | | (278,013,571 | ) | | | (17,632,475 | ) | | | (188,572,282 | ) |
| | | | |
Net increase (decrease) | | | (3,096,311 | ) | | $ | (34,566,603 | ) | | | 12,531,700 | | | $ | 123,378,715 | |
| | | | |
Class 4 Shares: | | | | | | | | | | | | | | | | |
Shares sold | | | 706,330 | | | $ | 9,842,641 | | | | 1,211,897 | | | $ | 12,938,698 | |
Shares issued on reinvestment of distributions | | | 16,284 | | | | 225,374 | | | | 123,855 | | | | 1,317,821 | |
Shares redeemed | | | (558,980 | ) | | | (7,715,474 | ) | | | (510,091 | ) | | | (5,157,973 | ) |
| | | | |
Net increase (decrease) | | | 163,634 | | | $ | 2,352,541 | | | | 825,661 | | | $ | 9,098,546 | |
| | | | |
3. TRANSACTIONS WITH AFFILIATES
Franklin Resources, Inc. is the holding company for various subsidiaries that together are referred to as Franklin Templeton Investments. Certain officers and trustees of the Fund are also officers and/or directors of the following subsidiaries:
| | |
| Subsidiary | | Affiliation |
Franklin Advisory Services, LLC (Advisory Services) | | Investment manager |
Franklin Templeton Services, LLC (FT Services) | | Administrative manager |
Franklin Templeton Distributors, Inc. (Distributors) | | Principal underwriter |
Franklin Templeton Investor Services, LLC (Investor Services) | | Transfer agent |
FSV-21
Franklin Templeton Variable Insurance Products Trust
Notes to Financial Statements (continued)
Franklin Small Cap Value Securities Fund
3. TRANSACTIONS WITH AFFILIATES (continued)
a. Management Fees
The Fund pays an investment management fee to Advisory Services based on the average daily net assets of the Fund as follows:
| | |
| Annualized Fee Rate | | Net Assets |
| 0.600% | | Up to and including $200 million |
| 0.500% | | Over $200 million, up to and including $1.3 billion |
| 0.400% | | In excess of $1.3 billion |
b. Administrative Fees
The Fund pays an administrative fee to FT Services based on the Fund's average daily net assets as follows:
| | |
| Annualized Fee Rate | | Net Assets |
| 0.150% | | Up to and including $200 million |
| 0.135% | | Over $200 million, up to and including $700 million |
| 0.100% | | Over $700 million, up to and including $1.2 billion |
| 0.075% | | In excess of $1.2 billion |
c. Distribution Fees
The Trust’s Board of Trustees has adopted distribution plans for Class 2 and Class 4 shares pursuant to Rule 12b-1 under the 1940 Act. Under the Fund's compensation distribution plans, the Fund pays Distributors for costs incurred in connection with the servicing, sale and distribution of the Fund's shares up to 0.35% per year of its average daily net assets of each class. The Board of Trustees has agreed to limit the current rate to 0.25% per year for Class 2.
d. Transfer Agent Fees
Investor Services, under terms of an agreement, performs shareholder servicing for the Fund and is not paid by the Fund for the services.
4. EXPENSE OFFSET ARRANGEMENT
The Fund has entered into an arrangement with its custodian whereby credits realized as a result of uninvested cash balances are used to reduce a portion of the Fund’s custodian expenses. During the year ended December 31, 2010, there were no credits earned.
5. INCOME TAXES
For tax purposes, capital losses may be carried over to offset future capital gains, if any. At December 31, 2010, the capital loss carryforwards were as follows:
| | | | |
Capital loss carryforwards expiring in: | | | | |
2017 | | $ | 76,440,230 | |
2018 | | | 22,008,308 | |
| | | | |
| | $ | 98,448,538 | |
| | | | |
FSV-22
Franklin Templeton Variable Insurance Products Trust
Notes to Financial Statements (continued)
Franklin Small Cap Value Securities Fund
5. INCOME TAXES (continued)
The tax character of distributions paid during the years ended December 31, 2010 and 2009, was as follows:
| | | | | | | | |
| | | 2010 | | | 2009 | |
Distributions paid from: | | | | | | | | |
Ordinary income | | $ | 9,970,401 | | | $ | 14,739,921 | |
Long term capital gain | | | — | | | | 40,169,460 | |
| | | | |
| | $ | 9,970,401 | | | $ | 54,909,381 | |
| | | | |
At December 31, 2010, the cost of investments, net unrealized appreciation (depreciation) and undistributed ordinary income for income tax purposes were as follows:
| | | | |
Cost of investments | | $ | 1,111,031,929 | |
| | | | |
| |
Unrealized appreciation | | $ | 429,031,374 | |
Unrealized depreciation | | | (77,292,417 | ) |
| | | | |
Net unrealized appreciation (depreciation) | | $ | 351,738,957 | |
| | | | |
Distributable earnings – undistributed ordinary income | | $ | 9,360,980 | |
| | | | |
Net investment income differs for financial statement and tax purposes primarily due to differing treatments of bond discounts and premiums.
Net realized gains (losses) differ for financial statement and tax purposes primarily due to differing treatment of wash sales.
6. INVESTMENT TRANSACTIONS
Purchases and sales of investments (excluding short term securities) for the year ended December 31, 2010, aggregated $191,569,719 and $227,668,824, respectively.
7. INVESTMENTS IN INSTITUTIONAL FIDUCIARY TRUST MONEY MARKET PORTFOLIO
The Fund may invest in the Institutional Fiduciary Trust Money Market Portfolio (Sweep Money Fund), an open-end investment company managed by Franklin Advisers, Inc. (an affiliate of the investment manager). Management fees paid by the Fund are reduced on assets invested in the Sweep Money Fund, in an amount not to exceed the management and administrative fees paid by the Sweep Money Fund.
8. HOLDINGS OF 5% VOTING SECURITIES OF PORTFOLIO COMPANIES
The 1940 Act defines "affiliated companies" to include investments in portfolio companies in which a fund owns 5% or more of the outstanding voting securities. Investments in "affiliated companies" for the Fund for the year ended December 31, 2010, were as shown below.
| | | | | | | | | | | | | | | | | | | | | | | | | | | | |
| Name of Issuer | | Number of Shares
Held at Beginning
of Year | | | Gross
Additions | | | Gross
Reductions | | | Number of Shares
Held at End of
Year | | | Value at
End of
Year | | | Investment
Income | | | Realized Capital
Gain (Loss) | |
Non-Controlled Affiliates | | | | | | | | | | | | | | | | | | | | | | | | | | | | |
Hooker Furniture Corp. | | | 555,100 | | | | — | | | | 44,400 | | | | 510,700 | | | | —a | | | $ | 166,530 | | | $ | (363,097 | ) |
| | | | | | | | | | | | | | | | |
aAs of December 31,2010 no longer an affiliate.
FSV-23
Franklin Templeton Variable Insurance Products Trust
Notes to Financial Statements (continued)
Franklin Small Cap Value Securities Fund
9. CREDIT FACILITY
The Fund, together with other U.S. registered and foreign investment funds (collectively “Borrowers”), managed by Franklin Templeton Investments, are borrowers in a joint syndicated senior unsecured credit facility totaling $750 million (Global Credit Facility) which matures on January 21, 2011. This Global Credit Facility provides a source of funds to the Borrowers for temporary and emergency purposes, including the ability to meet future unanticipated or unusually large redemption requests.
Under the terms of the Global Credit Facility, the Fund shall, in addition to interest charged on any borrowings made by the Fund and other costs incurred by the Fund, pay its share of fees and expenses incurred in connection with the implementation and maintenance of the Global Credit Facility, based upon its relative share of the aggregate net assets of all of the Borrowers, including an annual commitment fee of 0.10% based upon the unused portion of the Global Credit Facility, which is reflected in other expenses on the Statement of Operations. During the year ended December 31, 2010, the Fund did not use the Global Credit Facility.
Effective January 21, 2011, the Borrowers renewed the Global Credit Facility for a total of $750 million, maturing January 20, 2012.
10. FAIR VALUE MEASUREMENTS
The Fund follows a fair value hierarchy that distinguishes between market data obtained from independent sources (observable inputs) and the Fund's own market assumptions (unobservable inputs). These inputs are used in determining the value of the Fund’s investments and are summarized in the following fair value hierarchy:
| | • | | Level 1 – quoted prices in active markets for identical securities |
| | • | | Level 2 – other significant observable inputs (including quoted prices for similar securities, interest rates, prepayment speed, credit risk, etc.) |
| | • | | Level 3 – significant unobservable inputs (including the Fund’s own assumptions in determining the fair value of investments) |
The inputs or methodology used for valuing securities are not an indication of the risk associated with investing in those securities.
For movements between the levels within the fair value hierarchy, the Fund has adopted a policy of recognizing the transfers as of the date of the underlying event which caused the movement.
The following is a summary of the inputs used as of December 31, 2010, in valuing the Fund’s assets carried at fair value:
| | | | | | | | | | | | | | | | |
| | | Level 1 | | | Level 2 | | | Level 3 | | | Total | |
| | | | |
Assets: | | | | | | | | | | | | | | | | |
Investments in Securities | | | | | | | | | | | | | | | | |
Equity Investmentsa | | $ | 1,380,499,557 | | | $ | — | | | $ | — | | | $ | 1,380,499,557 | |
Corporate Bonds | | | — | | | | 1,488,398 | | | | — | | | | 1,488,398 | |
Short Term Investments | | | 67,497,420 | | | | 13,285,511 | | | | — | | | | 80,782,931 | |
| | | | |
Total Investments in Securities | | $ | 1,447,996,977 | | | $ | 14,773,909 | | | $ | — | | | $ | 1,462,770,886 | |
| | | | |
a For detailed industry descriptions, see the accompanying Statement of Investments.
11. SUBSEQUENT EVENTS
The Fund has evaluated subsequent events through the issuance of the financial statements and determined that no events have occurred that require disclosure other than those already disclosed in the financial statements.
FSV-24
Franklin Templeton Variable Insurance Products Trust
Franklin Small Cap Value Securities Fund
Report of Independent Registered Public Accounting Firm
To the Board of Trustees and Shareholders of Franklin Templeton Variable Insurance Products Trust
In our opinion, the accompanying statement of assets and liabilities, including the statement of investments, and the related statements of operations and of changes in net assets and the financial highlights present fairly, in all material respects, the financial position of Franklin Small Cap Value Securities Fund (one of the funds constituting the Franklin Templeton Variable Insurance Products Trust, hereafter referred to as the "Fund") at December 31, 2010, the results of its operations for the year then ended, the changes in its net assets for each of the two years in the period then ended and the financial highlights for each of the periods presented, in conformity with accounting principles generally accepted in the United States of America. These financial statements and financial highlights (hereafter referred to as "financial statements") are the responsibility of the Fund's management. Our responsibility is to express an opinion on these financial statements based on our audits. We conducted our audits of these financial statements in accordance with the standards of the Public Company Accounting Oversight Board (United States). Those standards require that we plan and perform the audit to obtain reasonable assurance about whether the financial statements are free of material misstatement. An audit includes examining, on a test basis, evidence supporting the amounts and disclosures in the financial statements, assessing the accounting principles used and significant estimates made by management, and evaluating the overall financial statement presentation. We believe that our audits, which included confirmation of securities at December 31, 2010 by correspondence with the custodian and brokers, provide a reasonable basis for our opinion.
PricewaterhouseCoopers LLP
San Francisco, California
February 10, 2011
FSV-25
Franklin Templeton Variable Insurance Products Trust
Tax Designation (unaudited)
Franklin Small Cap Value Securities Fund
Under Section 854(b)(2) of the Internal Revenue Code, the Fund designates 100% of the ordinary income dividends as income qualifying for the dividends received deduction for the fiscal year ended December 31, 2010.
FSV-26
FRANKLIN SMALL-MID CAP GROWTH SECURITIES FUND
We are pleased to bring you Franklin Small-Mid Cap Growth Securities Fund’s annual report for the fiscal year ended December 31, 2010.
Performance Summary as of 12/31/10
Average annual total return of Class 4 shares* represents the average annual change in value, assuming reinvestment of dividends and capital gains. Average returns smooth out variations in returns, which can be significant; they are not the same as year-by-year results.
Periods ended 12/31/10
| | | | | | | | | | | | | | | | |
| | | | | | 1-Year | | | 5-Year | | | 10-Year | |
Average Annual Total Return | | | | | | | +27.49% | | | | +5.01% | | | | +2.28% | |
*For the period beginning 2/29/08, Class 4 performance reflects a 12b-1 fee expense of 0.35% per year, which affects future performance. Class 4 performance prior to 2/29/08 reflects historical Class 1 performance, which does not have a 12b-1 fee expense. Since 2/29/08 (effective date), the average annual total return of Class 4 shares was +6.43%.
Total Return Index Comparison
for a Hypothetical $10,000 Investment (1/1/01–12/31/10)
The graph below shows the change in value of a hypothetical $10,000 investment in the Fund over the indicated period and includes reinvestment of any income or distributions. The Fund’s performance* is compared to the performance of the Standard & Poor’s 500 Index (S&P 500) and the Russell Midcap® Growth Index. One cannot invest directly in an index, and an index is not representative of the Fund’s portfolio. Please see Important Notes to Performance Information preceding the Fund Summaries.
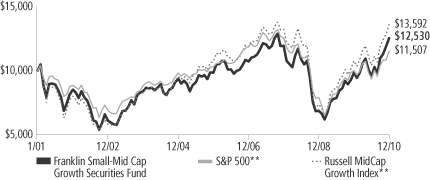
**Source: © 2011 Morningstar. Please see Index Descriptions following the Fund Summaries.
Franklin Small-Mid Cap Growth Securities Fund Class 4
Performance reflects the Fund’s Class 4 operating expenses, but does not include any contract fees, expenses or sales charges. If they had been included, performance would be lower. These charges and deductions, particularly for variable life policies, can have a significant effect on contract values and insurance benefits. See the contract prospectus for a complete description of these expenses, including sales charges.
Performance data represent past performance, which does not guarantee future results. Investment return and principal value will fluctuate, and you may have a gain or loss when you sell your shares.
Current performance may differ from figures shown.
FSC-1
Fund Goal and Main Investments: Franklin Small-Mid Cap Growth Securities Fund seeks long-term capital growth. The Fund normally invests at least 80% of its net assets in investments of small-capitalization (small cap) and mid-capitalization (midcap) companies. For this Fund, small cap companies are those within the market capitalization range of companies in the Russell 2500TM Index at the time of purchase, and midcap companies are companies within the market capitalization range of companies in the Russell Midcap Index at the time of purchase.1
Performance Overview
You can find the Fund’s one-year total return in the Performance Summary. The Fund performed comparably with its narrow benchmark, the Russell Midcap Growth Index, which delivered a +26.38% total return, and outperformed its broad benchmark, the S&P 500, which posted a +15.06% total return, for the same period.2
Economic and Market Overview
During the 12-month period ended December 31, 2010, the U.S. economy grew unevenly, supported by a combination of fundamental business improvement and government intervention. Economic activity as measured by gross domestic product expanded at an annualized 3.7% pace in 2010’s first quarter and then downshifted to 1.7% annualized in the second quarter. Consumer spending picked up, likely due to pent-up post-recession demand, and the pace of growth rose at annualized rates of 2.6% in the third quarter and an estimated 3.2% in the fourth quarter.
Challenges such as mixed economic data, elevated debt concerns surrounding the U.S. budget deficit and a lack of job prospects for the unemployed hindered consumer confidence and the economy’s advance. During the early part of the annual period, home prices rose in many regions due to low interest rates, a first-time homebuyer tax credit program, and prices dipping to levels that lured buyers. Later in the period, home sales stalled as the homebuyer tax credit program ended, foreclosures mounted and the housing sector remained weak.
Amid signs of a demand-led recovery, crude oil prices rose from $79 per barrel at the end of December 2009 to a then 17-month high of $87 in early April. But as doubts surfaced about the recovery’s sustainability, oil prices dipped to $66 in late May. Prices rebounded to $91 per barrel
1. Please see Index Descriptions following the Fund Summaries.
2. Source: © 2011 Morningstar. One cannot invest directly in an index, and an index is not representative of the Fund’s portfolio. Please see Index Descriptions following the Fund Summaries.
Fund Risks: The Fund’s investments in stocks may offer the potential for long-term gains but can be subject to short-term price fluctuations. Smaller and midsize company securities can increase the risk of greater price fluctuations, particularly over the short term. Smaller or relatively new or unseasoned companies can also be particularly sensitive to changing economic conditions, and their prospects for growth are less certain than those of larger, more established companies. The Fund may have significant investments in particular sectors from time to time, such as technology, which has been among the market’s most volatile sectors and involves special risks. The manager applies various techniques and analyses in making investment decisions for the Fund, but there can be no guarantee that these decisions will produce the desired results. The Fund’s prospectus also includes a description of the main investment risks.
FSC-2
by the end of December 2010 largely due to accelerating global demand. The pace of inflation slowed during the year, and in December 2010 the inflation rate was an annualized 1.5%.3 Similarly, core inflation, which excludes volatile food and energy costs, slowed to a 0.8% annualized rate.3 Companies added jobs throughout the period, and the unemployment rate fell from 10.0% in December 2009 to 9.4% at period-end.3 The decline was attributable in part to a shrinking labor force as some unemployed workers stopped looking for jobs.
Given few inflationary pressures and uncertainty surrounding the economic recovery, the Federal Open Market Committee (FOMC) made no major changes to its monetary policy for most of the period. The FOMC repeatedly stated it would keep the federal funds target rate within the exceptionally low 0% to 0.25% range “for an extended period” and eventually shifted its focus to its outlook and the status of its current holdings. In September, the FOMC revealed concerns about the subdued recovery and said inflation was below the pace “consistent with its mandate.” Having already lowered interest rates effectively to zero, the FOMC announced its intention to purchase government securities to stimulate the economy and promote a low level of inflation consistent with healthy economic growth.
Investor confidence shifted with each release of encouraging or discouraging economic, regulatory and political news, stoking considerable volatility among equities. Ultimately, stock indexes posted solid gains during the 12 months under review as investor risk aversion began to subside amid generally improving economic signs and rising consumer spending. Overall, the blue-chip stocks of the Dow Jones Industrial Average delivered a +14.06% total return, while the broader S&P 500 posted a +15.06% total return and the technology-heavy NASDAQ Composite Index produced a total return of +18.02%.2 During the period, growth stocks outperformed their value counterparts. Performance among the major sectors was positive, with consumer discretionary, industrials and materials making the largest gains, while health care and utilities had weaker results.
3. Source: Bureau of Labor Statistics.
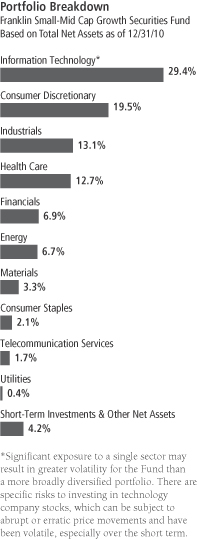
FSC-3
Investment Strategy
We use fundamental, bottom-up research to seek companies meeting our criteria of growth potential, quality and valuation. In seeking sustainable growth characteristics, we look for companies we believe can produce sustainable earnings and cash flow growth, evaluating the long-term market opportunity and competitive structure of an industry to target leaders and emerging leaders. We define quality companies as those with strong and improving competitive positions in attractive markets. We also believe important attributes of quality are experienced and talented management teams as well as financial strength reflected in the capital structure, gross and operating margins, free cash flow generation and returns on capital employed. Our valuation analysis includes a range of potential outcomes based on an assessment of multiple scenarios. In assessing value, we consider whether security prices fully reflect the balance of the sustainable growth opportunities relative to business and financial risks.
Manager’s Discussion
During the 12 months under review, stock selection in the energy sector, where our position in independent oil and gas company Concho Resources rose strongly in value, supported the Fund’s performance relative to the Russell Midcap Growth Index. Underweighting in the poor-performing utilities sector, particularly no exposure to electric utilities, helped relative results, as did stock selection and an underweighted allocation to the consumer staples sector. In addition, significant individual contributors came from the consumer discretionary sector, notably fast-food operator Chipotle Mexican Grill, automotive parts manufacturer BorgWarner and sporting goods and apparel maker Under Armour.4 Information technology holding Sybase,5 an enterprise software and services company, also boosted relative Fund performance, as SAP announced its intention to acquire Sybase in May.
In contrast, stock selection in the financials sector, where brokerage house Charles Schwab4,5 was an underperformer, detracted from the Fund’s relative performance. An underweighted position in the materials sector, more specifically stock selection in chemicals companies and no investments in metals and mining, also hurt relative Fund results. Stock selection in the health care sector, with weak returns from rural hospital operator Community Health Systems and health insurer
4. This holding is not an index component.
5. No longer held at period-end.
Top 10 Holdings
Franklin Small-Mid Cap Growth Securities Fund 12/31/10
| | | | |
Company Sector/Industry | | % of Total
Net Assets | |
| SM Energy Co. | | | 1.8% | |
| Energy | | | | |
| Celanese Corp. | | | 1.7% | |
| Materials | | | | |
| SBA Communications Corp. | | | 1.7% | |
| Telecommunication Services | | | | |
| Citrix Systems Inc. | | | 1.6% | |
| Information Technology | | | | |
| Mettler-Toledo International Inc. | | | 1.6% | |
| Health Care | | | | |
| Cameron International Corp. | | | 1.4% | |
| Energy | | | | |
| Sensata Technologies Holding NV | | | 1.4% | |
| Information Technology | | | | |
| AMETEK Inc. | | | 1.4% | |
| Industrials | | | | |
| BorgWarner Inc. | | | 1.4% | |
| Consumer Discretionary | | | | |
| Trimble Navigation Ltd. | | | 1.4% | |
| Information Technology | | | | |
The dollar value, number of shares or principal amount, and names of all portfolio holdings are listed in the Fund’s Statement of Investments.
FSC-4
Aetna,4,5 hindered relative performance. Outside of these sectors, major individual detractors included semiconductor company Silicon Laboratories, credit card company MasterCard4,5 and department store chain Kohl’s.4
Thank you for your participation in Franklin Small-Mid Cap Growth Securities Fund. We look forward to serving your future investment needs.
The foregoing information reflects our analysis, opinions and portfolio holdings as of December 31, 2010, the end of the reporting period. The way we implement our main investment strategies and the resulting portfolio holdings may change depending on factors such as market and economic conditions. These opinions may not be relied upon as investment advice or an offer for a particular security. The information is not a complete analysis of every aspect of any market, country, industry, security or the Fund. Statements of fact are from sources considered reliable, but the investment manager makes no representation or warranty as to their completeness or accuracy. Although historical performance is no guarantee of future results, these insights may help you understand our investment management philosophy.
FSC-5
Fund Expenses
As an investor in a variable insurance contract (Contract) that indirectly provides for investment in an underlying mutual fund, you can incur transaction and/or ongoing expenses at both the Fund level and the Contract level.
| • | | Transaction expenses can include sales charges (loads) on purchases, redemption fees, surrender fees, transfer fees and premium taxes. |
| • | | Ongoing expenses can include management fees, distribution and service (12b-1) fees, contract fees, annual maintenance fees, mortality and expense risk fees and other fees and expenses. All mutual funds and Contracts have some types of ongoing expenses. |
The expenses shown in the table are meant to highlight ongoing expenses at the Fund level only and do not include ongoing expenses at the Contract level, or transaction expenses at either the Fund or Contract level. While the Fund does not have transaction expenses, if the transaction and ongoing expenses at the Contract level were included, the expenses shown below would be higher. You should consult your Contract prospectus or disclosure document for more information.
The table shows Fund-level ongoing expenses and can help you understand these expenses and compare them with those of other mutual funds offered through the Contract. The table assumes a $1,000 investment held for the six months indicated. Please refer to the Fund prospectus for additional information on operating expenses.
Actual Fund Expenses
The first line (Actual) of the table provides actual account values and expenses. The “Ending Account Value” is derived from the Fund’s actual return, which includes the effect of ongoing Fund expenses, but does not include the effect of ongoing Contract expenses.
You can estimate the Fund-level expenses you incurred during the period by following these steps. Of course, your account value and expenses will differ from those in this illustration:
| 1. | Divide your account value by $1,000. |
If an account had an $8,600 value, then $8,600 ÷ $1,000 = 8.6.
| 2. | Multiply the result by the number under the heading “Fund-Level Expenses Incurred During Period.” |
If Fund-Level Expenses Incurred During Period were $7.50, then 8.6 x $7.50 = $64.50.
In this illustration, the estimated expenses incurred this period at the Fund level are $64.50.
Franklin Small-Mid Cap Growth Securities Fund Class 4
FSC-6
Hypothetical Example for Comparison with Other Mutual Funds
Information in the second line (Hypothetical) of the table can help you compare ongoing expenses of the Fund with those of other mutual funds offered through the Contract. This information may not be used to estimate the actual ending account balance or expenses you incurred during the period. The hypothetical “Ending Account Value” is based on the Fund’s actual expense ratio and an assumed 5% annual rate of return before expenses, which does not represent the Fund’s actual return. The figure under the heading “Fund-Level Expenses Incurred During Period” shows the hypothetical expenses your account would have incurred under this scenario. You can compare this figure with the 5% hypothetical examples that appear in shareholder reports of other funds offered through a Contract.
| | | | | | | | | | | | |
| Class 4 | | Beginning
Account Value 7/1/10 | | | Ending
Account Value 12/31/10 | | | Fund-Level Expenses Incurred
During Period* 7/1/10–12/31/10 | |
Actual | | $ | 1,000 | | | $ | 1,314.60 | | | $ | 6.65 | |
Hypothetical (5% return before expenses) | | $ | 1,000 | | | $ | 1,019.46 | | | $ | 5.80 | |
*Expenses are calculated using the most recent six-month annualized expense ratio for the Fund’s Class 4 shares (1.14%), which does not include any ongoing expenses of the Contract for which the Fund is an investment option, multiplied by the average account value over the period, multiplied by 184/365 to reflect the one-half year period.
FSC-7
Franklin Templeton Variable Insurance Products Trust
Financial Highlights
Franklin Small-Mid Cap Growth Securities Fund
| | | | | | | | | | | | | | | | | | | | |
| | | Year Ended December 31, | |
| Class 1 | | 2010 | | | 2009 | | | 2008 | | | 2007 | | | 2006 | |
| | | | |
Per share operating performance | | | | | | | | | | | | | | | | | | | | |
(for a share outstanding throughout the year) | | | | | | | | | | | | | | | | | | | | |
Net asset value, beginning of year | | $ | 17.36 | | | $ | 12.06 | | | $ | 23.39 | | | $ | 22.51 | | | $ | 20.66 | |
| | | | |
Income from investment operationsa: | | | | | | | | | | | | | | | | | | | | |
Net investment income (loss)b | | | (0.01 | ) | | | (0.10 | )c | | | 0.01 | | | | (0.02 | ) | | | —d | |
Net realized and unrealized gains (losses) | | | 4.86 | | | | 5.40 | | | | (8.98 | ) | | | 2.65 | | | | 1.85 | |
| | | | |
Total from investment operations | | | 4.85 | | | | 5.30 | | | | (8.97 | ) | | | 2.63 | | | | 1.85 | |
| | | | |
Less distributions from net realized gains | | | — | | | | — | | | | (2.36 | ) | | | (1.75 | ) | | | — | |
| | | | |
Net asset value, end of year | | $ | 22.21 | | | $ | 17.36 | | | $ | 12.06 | | | $ | 23.39 | | | $ | 22.51 | |
| | | | |
| | | | | |
Total returne | | | 27.94% | | | | 43.95% | | | | (42.34)% | | | | 11.51% | | | | 8.95% | |
Ratios to average net assets | | | | | | | | | | | | | | | | | | | | |
Expenses | | | 0.79% | | | | 0.80%f | | | | 0.76%f | | | | 0.74%f | | | | 0.76%f | |
Net investment income (loss) | | | (0.07)% | | | | (0.72)%c | | | | 0.06% | | | | (0.10)% | | | | (0.02)% | |
| | | | | |
Supplemental data | | | | | | | | | | | | | | | | | | | | |
Net assets, end of year (000’s) | | $ | 89,826 | | | $ | 79,670 | | | $ | 63,531 | | | $ | 127,602 | | | $ | 135,402 | |
Portfolio turnover rate | | | 46.69% | | | | 63.93% | | | | 60.12% | | | | 66.94% | | | | 50.08% | |
aThe amount shown for a share outstanding throughout the period may not correlate with the Statement of Operations for the period due to the timing of sales and repurchases of the Fund shares in relation to income earned and/or fluctuating market value of the investments of the Fund.
bBased on average daily shares outstanding.
cNet investment income per share includes approximately $(0.06) per share as a return of capital and capital gain adjustment to previously recorded dividends received by the Fund. Excluding this non-recurring amount, the ratio of net investment income to average net assets would have been (0.22)%.
dAmount rounds to less than $0.01 per share.
eTotal return does not include any fees, charges or expenses imposed by the variable annuity and life insurance contracts for which the Franklin Templeton Variable Insurance Products Trust serves as an underlying investment vehicle.
fBenefit of expense reduction rounds to less than 0.01%.
The accompanying notes are an integral part of these financial statements.
FSC-8
Franklin Templeton Variable Insurance Products Trust
Financial Highlights (continued)
Franklin Small-Mid Cap Growth Securities Fund
| | | | | | | | | | | | | | | | | | | | |
| | | Year Ended December 31, | |
| Class 2 | | 2010 | | | 2009 | | | 2008 | | | 2007 | | | 2006 | |
| | | | |
Per share operating performance | | | | | | | | | | | | | | | | | | | | |
(for a share outstanding throughout the year) | | | | | | | | | | | | | | | | | | | | |
Net asset value, beginning of year | | $ | 16.87 | | | $ | 11.75 | | | $ | 22.91 | | | $ | 22.13 | | | $ | 20.36 | |
| | | | |
Income from investment operationsa: | | | | | | | | | | | | | | | | | | | | |
Net investment income (loss)b | | | (0.06 | ) | | | (0.13 | )c | | | (0.03 | ) | | | (0.08 | ) | | | (0.06 | ) |
Net realized and unrealized gains (losses) | | | 4.73 | | | | 5.25 | | | | (8.77 | ) | | | 2.61 | | | | 1.83 | |
| | | | |
Total from investment operations | | | 4.67 | | | | 5.12 | | | | (8.80 | ) | | | 2.53 | | | | 1.77 | |
| | | | |
Less distributions from net realized gains | | | — | | | | — | | | | (2.36 | ) | | | (1.75 | ) | | | — | |
| | | | |
Net asset value, end of year | | $ | 21.54 | | | $ | 16.87 | | | $ | 11.75 | | | $ | 22.91 | | | $ | 22.13 | |
| | | | |
| | | | | |
Total returnd | | | 27.68% | | | | 43.57% | | | | (42.49)% | | | | 11.24% | | | | 8.69% | |
Ratios to average net assets | | | | | | | | | | | | | | | | | | | | |
Expenses | | | 1.04% | | | | 1.05%e | | | | 1.01%e | | | | 0.99%e | | | | 1.01%e | |
Net investment income (loss) | | | (0.32)% | | | | (0.97)%c | | | | (0.19)% | | | | (0.35)% | | | | (0.27)% | |
| | | | | |
Supplemental data | | | | | | | | | | | | | | | | | | | | |
Net assets, end of year (000’s) | | $ | 939,481 | | | $ | 813,480 | | | $ | 614,053 | | | $ | 1,217,177 | | | $ | 1,184,521 | |
Portfolio turnover rate | | | 46.69% | | | | 63.93% | | | | 60.12% | | | | 66.94% | | | | 50.08% | |
aThe amount shown for a share outstanding throughout the period may not correlate with the Statement of Operations for the period due to the timing of sales and repurchases of the Fund shares in relation to income earned and/or fluctuating market value of the investments of the Fund.
bBased on average daily shares outstanding.
cNet investment income per share includes approximately $(0.06) per share as a return of capital and capital gain adjustment to previously recorded dividends received by the Fund. Excluding this non-recurring amount, the ratio of net investment income to average net assets would have been (0.47)%.
dTotal return does not include any fees, charges or expenses imposed by the variable annuity and life insurance contracts for which the Franklin Templeton Variable Insurance Products Trust serves as an underlying investment vehicle.
eBenefit of expense reduction rounds to less than 0.01%.
The accompanying notes are an integral part of these financial statements.
FSC-9
Franklin Templeton Variable Insurance Products Trust
Financial Highlights (continued)
Franklin Small-Mid Cap Growth Securities Fund
| | | | | | | | | | | | |
| | | Year Ended December 31, | |
| Class 4 | | 2010 | | | 2009 | | | 2008a | |
| | | | |
Per share operating performance | | | | | | | | | | | | |
(for a share outstanding throughout the year) | | | | | | | | | | | | |
Net asset value, beginning of year | | $ | 17.24 | | | $ | 12.02 | | | $ | 20.60 | |
| | | | |
Income from investment operationsb: | | | | | | | | | | | | |
Net investment income (loss)c | | | (0.07 | ) | | | (0.15 | )d | | | 0.02 | |
Net realized and unrealized gains (losses) | | | 4.81 | | | | 5.37 | | | | (6.24 | ) |
| | | | |
Total from investment operations | | | 4.74 | | | | 5.22 | | | | (6.22 | ) |
| | | | |
Less distributions from net realized gains | | | — | | | | — | | | | (2.36 | ) |
| | | | |
Net asset value, end of year | | $ | 21.98 | | | $ | 17.24 | | | $ | 12.02 | |
| | | | |
| | | |
Total returne | | | 27.49% | | | | 43.43% | | | | (34.74)% | |
Ratios to average net assetsf | | | | | | | | | | | | |
Expenses | | | 1.14% | | | | 1.15%g | | | | 1.11%g | |
Net investment income (loss) | | | (0.42)% | | | | (1.07)%d | | | | (0.29)% | |
| | | |
Supplemental data | | | | | | | | | | | | |
Net assets, end of year (000’s) | | $ | 15,413 | | | $ | 11,029 | | | $ | 3,538 | |
Portfolio turnover rate | | | 46.69% | | | | 63.93% | | | | 60.12% | |
aFor the period February 29, 2008 (effective date) to December 31, 2008.
bThe amount shown for a share outstanding throughout the period may not correlate with the Statement of Operations for the period due to the timing of sales and repurchases of the Fund shares in relation to income earned and/or fluctuating market value of the investments of the Fund.
cBased on average daily shares outstanding.
dNet investment income per share includes approximately $(0.06) per share as a return of capital and capital gain adjustment to previously recorded dividends received by the Fund. Excluding this non-recurring amount, the ratio of net investment income to average net assets would have been (0.57)%.
eTotal return does not include any fees, charges or expenses imposed by the variable annuity and life insurance contracts for which the Franklin Templeton Variable Insurance Products Trust serves as an underlying investment vehicle. Total return is not annualized for periods less than one year.
fRatios are annualized for periods less than one year.
gBenefit of expense reduction rounds to less than 0.01%.
The accompanying notes are an integral part of these financial statements.
FSC-10
Franklin Templeton Variable Insurance Products Trust
Statement of Investments, December 31, 2010
| | | | | | | | | | | | |
| Franklin Small-Mid Cap Growth Securities Fund | | Country | | | Shares | | | Value | |
Common Stocks 95.8% | | | | | | | | | | | | |
Consumer Discretionary 19.5% | | | | | | | | | | | | |
Advance Auto Parts Inc. | | | United States | | | | 101,000 | | | $ | 6,681,150 | |
Autoliv Inc. | | | Sweden | | | | 50,000 | | | | 3,947,000 | |
a,bBlue Nile Inc. | | | United States | | | | 90,000 | | | | 5,135,400 | |
aBorgWarner Inc. | | | United States | | | | 200,000 | | | | 14,472,000 | |
aBuffalo Wild Wings Inc. | | | United States | | | | 145,000 | | | | 6,358,250 | |
aChipotle Mexican Grill Inc. | | | United States | | | | 25,000 | | | | 5,316,500 | |
aDick’s Sporting Goods Inc. | | | United States | | | | 215,000 | | | | 8,062,500 | |
aDiscovery Communications Inc., A | | | United States | | | | 148,500 | | | | 6,192,450 | |
aDollar General Corp. | | | United States | | | | 235,000 | | | | 7,207,450 | |
aDreamWorks Animation SKG Inc., A | | | United States | | | | 125,000 | | | | 3,683,750 | |
a,bE-Commerce China Dangdang Inc., ADR | | | China | | | | 15,600 | | | | 422,292 | |
Expedia Inc. | | | United States | | | | 250,000 | | | | 6,272,500 | |
Guess? Inc. | | | United States | | | | 250,000 | | | | 11,830,000 | |
Jarden Corp. | | | United States | | | | 262,400 | | | | 8,100,288 | |
Johnson Controls Inc. | | | United States | | | | 319,300 | | | | 12,197,260 | |
aKohl’s Corp. | | | United States | | | | 217,800 | | | | 11,835,252 | |
Limited Brands Inc. | | | United States | | | | 260,000 | | | | 7,989,800 | |
aPeet’s Coffee & Tea Inc. | | | United States | | | | 136,500 | | | | 5,697,510 | |
Polo Ralph Lauren Corp. | | | United States | | | | 110,000 | | | | 12,201,200 | |
Starwood Hotels & Resorts Worldwide Inc. | | | United States | | | | 183,200 | | | | 11,134,896 | |
aTenneco Inc. | | | United States | | | | 209,900 | | | | 8,639,484 | |
aUlta Salon Cosmetics & Fragrance Inc. | | | United States | | | | 134,500 | | | | 4,573,000 | |
aUnder Armour Inc., A | | | United States | | | | 115,000 | | | | 6,306,600 | |
aUrban Outfitters Inc. | | | United States | | | | 310,000 | | | | 11,101,100 | |
aWMS Industries Inc. | | | United States | | | | 168,300 | | | | 7,613,892 | |
Wolverine World Wide Inc. | | | United States | | | | 340,676 | | | | 10,860,751 | |
| | | | | | | | | | | | |
| | | | | | | | | | | 203,832,275 | |
| | | | | | | | | | | | |
Consumer Staples 2.1% | | | | | | | | | | | | |
aHansen Natural Corp. | | | United States | | | | 150,000 | | | | 7,842,000 | |
Mead Johnson Nutrition Co., A | | | United States | | | | 115,000 | | | | 7,158,750 | |
aTreeHouse Foods Inc. | | | United States | | | | 135,000 | | | | 6,897,150 | |
| | | | | | | | | | | | |
| | | | | | | | | | | 21,897,900 | |
| | | | | | | | | | | | |
Energy 6.7% | | | | | | | | | | | | |
aAlpha Natural Resources Inc. | | | United States | | | | 150,000 | | | | 9,004,500 | |
aCameron International Corp. | | | United States | | | | 296,900 | | | | 15,061,737 | |
aConcho Resources Inc. | | | United States | | | | 90,000 | | | | 7,890,300 | |
aFMC Technologies Inc. | | | United States | | | | 155,000 | | | | 13,781,050 | |
aPetrohawk Energy Corp. | | | United States | | | | 297,000 | | | | 5,420,250 | |
SM Energy Co. | | | United States | | | | 325,000 | | | | 19,152,250 | |
| | | | | | | | | | | | |
| | | | | | | | | | | 70,310,087 | |
| | | | | | | | | | | | |
Financials 6.9% | | | | | | | | | | | | |
aAffiliated Managers Group Inc. | | | United States | | | | 100,000 | | | | 9,922,000 | |
aCapitol Federal Financial Inc. | | | United States | | | | 17,400 | | | | 207,234 | |
First Niagara Financial Group Inc. | | | United States | | | | 321,700 | | | | 4,497,366 | |
aIntercontinentalExchange Inc. | | | United States | | | | 44,600 | | | | 5,314,090 | |
Janus Capital Group Inc. | | | United States | | | | 346,500 | | | | 4,494,105 | |
Lazard Ltd., A | | | United States | | | | 287,800 | | | | 11,365,222 | |
aMSCI Inc., A | | | United States | | | | 135,000 | | | | 5,259,600 | |
Northern Trust Corp. | | | United States | | | | 104,000 | | | | 5,762,640 | |
aSignature Bank | | | United States | | | | 125,000 | | | | 6,250,000 | |
T. Rowe Price Group Inc. | | | United States | | | | 195,865 | | | | 12,641,127 | |
W. R. Berkley Corp. | | | United States | | | | 222,800 | | | | 6,100,264 | |
| | | | | | | | | | | | |
| | | | | | | | | | | 71,813,648 | |
| | | | | | | | | | | | |
FSC-11
Franklin Templeton Variable Insurance Products Trust
Statement of Investments, December 31, 2010 (continued)
| | | | | | | | | | | | |
| Franklin Small-Mid Cap Growth Securities Fund | | Country | | | Shares | | | Value | |
Common Stocks (continued) | | | | | | | | | | | | |
Health Care 12.7% | | | | | | | | | | | | |
aAllscripts Healthcare Solutions Inc. | | | United States | | | | 286,900 | | | $ | 5,528,563 | |
aArQule Inc. | | | United States | | | | 414,300 | | | | 2,431,941 | |
C. R. Bard Inc. | | | United States | | | | 110,000 | | | | 10,094,700 | |
aCerner Corp. | | | United States | | | | 75,000 | | | | 7,105,500 | |
aCommunity Health Systems Inc. | | | United States | | | | 340,100 | | | | 12,709,537 | |
aCoventry Health Care Inc. | | | United States | | | | 169,000 | | | | 4,461,600 | |
aDaVita Inc. | | | United States | | | | 116,300 | | | | 8,081,687 | |
aDendreon Corp. | | | United States | | | | 100,000 | | | | 3,492,000 | |
aEdwards Lifesciences Corp. | | | United States | | | | 155,000 | | | | 12,530,200 | |
aHeartWare International Inc. | | | United States | | | | 38,000 | | | | 3,327,660 | |
aHuman Genome Sciences Inc. | | | United States | | | | 225,000 | | | | 5,375,250 | |
aIntuitive Surgical Inc. | | | United States | | | | 10,000 | | | | 2,577,500 | |
aMettler-Toledo International Inc. | | | United States | | | | 108,900 | | | | 16,466,769 | |
Pharmaceutical Product Development Inc. | | | United States | | | | 257,400 | | | | 6,985,836 | |
aSalix Pharmaceuticals Ltd. | | | United States | | | | 130,000 | | | | 6,104,800 | |
aSavient Pharmaceuticals Inc. | | | United States | | | | 158,400 | | | | 1,764,576 | |
aStereotaxis Inc. | | | United States | | | | 657,000 | | | | 2,516,310 | |
aThoratec Corp. | | | United States | | | | 75,000 | | | | 2,124,000 | |
aVarian Medical Systems Inc. | | | United States | | | | 100,000 | | | | 6,928,000 | |
aWaters Corp. | | | United States | | | | 150,000 | | | | 11,656,500 | |
| | | | | | | | | | | | |
| | | | | | | | | | | 132,262,929 | |
| | | | | | | | | | | | |
Industrials 13.1% | | | | | | | | | | | | |
Allegiant Travel Co. | | | United States | | | | 107,900 | | | | 5,312,996 | |
AMETEK Inc. | | | United States | | | | 375,000 | | | | 14,718,750 | |
C.H. Robinson Worldwide Inc. | | | United States | | | | 65,000 | | | | 5,212,350 | |
Cooper Industries PLC, A | | | United States | | | | 88,866 | | | | 5,179,999 | |
Cummins Inc. | | | United States | | | | 120,000 | | | | 13,201,200 | |
aEsterline Technologies Corp. | | | United States | | | | 40,557 | | | | 2,781,805 | |
Expeditors International of Washington Inc. | | | United States | | | | 88,400 | | | | 4,826,640 | |
Fastenal Co. | | | United States | | | | 50,000 | | | | 2,995,500 | |
Flowserve Corp. | | | United States | | | | 70,000 | | | | 8,345,400 | |
Fluor Corp. | | | United States | | | | 94,100 | | | | 6,235,066 | |
Gardner Denver Inc. | | | United States | | | | 125,000 | | | | 8,602,500 | |
Heico Corp. | | | United States | | | | 50,000 | | | | 2,551,500 | |
J.B. Hunt Transport Services Inc. | | | United States | | | | 129,400 | | | | 5,280,814 | |
Joy Global Inc. | | | United States | | | | 100,000 | | | | 8,675,000 | |
aKansas City Southern | | | United States | | | | 75,000 | | | | 3,589,500 | |
Knight Transportation Inc. | | | United States | | | | 200,000 | | | | 3,800,000 | |
Marten Transport Ltd. | | | United States | | | | 100,000 | | | | 2,138,000 | |
Robert Half International Inc. | | | United States | | | | 237,600 | | | | 7,270,560 | |
Rockwell Automation Inc. | | | United States | | | | 75,000 | | | | 5,378,250 | |
Rockwell Collins Inc. | | | United States | | | | 160,000 | | | | 9,321,600 | |
Roper Industries Inc. | | | United States | | | | 75,000 | | | | 5,732,250 | |
Ryanair Holdings PLC, ADR | | | Ireland | | | | 185,000 | | | | 5,690,600 | |
| | | | | | | | | | | | |
| | | | | | | | | | | 136,840,280 | |
| | | | | | | | | | | | |
Information Technology 29.4% | | | | | | | | | | | | |
Activision Blizzard Inc. | | | United States | | | | 627,700 | | | | 7,808,588 | |
aAlliance Data Systems Corp. | | | United States | | | | 151,700 | | | | 10,775,251 | |
Analog Devices Inc. | | | United States | | | | 290,000 | | | | 10,924,300 | |
aANSYS Inc. | | | United States | | | | 203,600 | | | | 10,601,452 | |
aAtheros Communications Inc. | | | United States | | | | 325,000 | | | | 11,674,000 | |
Avago Technologies Ltd. | | | Singapore | | | | 200,000 | | | | 5,694,000 | |
FSC-12
Franklin Templeton Variable Insurance Products Trust
Statement of Investments, December 31, 2010 (continued)
| | | | | | | | | | | | |
| Franklin Small-Mid Cap Growth Securities Fund | | Country | | | Shares | | | Value | |
Common Stocks (continued) | | | | | | | | | | | | |
Information Technology (continued) | | | | | | | | | | | | |
aBottomline Technologies Inc. | | | United States | | | | 58,347 | | | $ | 1,266,713 | |
aChinaCache International Holdings Ltd., ADR | | | China | | | | 9,600 | | | | 199,680 | |
aCitrix Systems Inc. | | | United States | | | | 250,000 | | | | 17,102,500 | |
aCree Inc. | | | United States | | | | 94,900 | | | | 6,252,961 | |
aF5 Networks Inc. | | | United States | | | | 60,000 | | | | 7,809,600 | |
FactSet Research Systems Inc. | | | United States | | | | 125,100 | | | | 11,729,376 | |
a,bFirst Solar Inc. | | | United States | | | | 71,300 | | | | 9,278,982 | |
aFleetcor Technologies Inc. | | | United States | | | | 52,300 | | | | 1,617,116 | |
aFLIR Systems Inc. | | | United States | | | | 270,000 | | | | 8,032,500 | |
Global Payments Inc. | | | United States | | | | 240,000 | | | | 11,090,400 | |
aGSI Commerce Inc. | | | United States | | | | 260,000 | | | | 6,032,000 | |
aHittite Microwave Corp. | | | United States | | | | 167,500 | | | | 10,224,200 | |
aInformatica Corp. | | | United States | | | | 75,000 | | | | 3,302,250 | |
aJuniper Networks Inc. | | | United States | | | | 260,000 | | | | 9,599,200 | |
aLam Research Corp. | | | United States | | | | 178,200 | | | | 9,227,196 | |
aNetApp Inc. | | | United States | | | | 130,000 | | | | 7,144,800 | |
aNetlogic Microsystems Inc. | | | United States | | | | 260,000 | | | | 8,166,600 | |
aNuance Communications Inc. | | | United States | | | | 765,000 | | | | 13,907,700 | |
aNXP Semiconductors NV | | | Netherlands | | | | 293,300 | | | | 6,138,769 | |
aPolycom Inc. | | | United States | | | | 175,000 | | | | 6,821,500 | |
aRed Hat Inc. | | | United States | | | | 275,000 | | | | 12,553,750 | |
aSemiLEDs Corp. | | | Taiwan | | | | 22,600 | | | | 656,530 | |
aSensata Technologies Holding NV | | | United States | | | | 500,000 | | | | 15,055,000 | |
aSilicon Laboratories Inc. | | | United States | | | | 300,000 | | | | 13,806,000 | |
aSmart Technologies Inc., A | | | Canada | | | | 570,600 | | | | 5,386,464 | |
aTaleo Corp., A | | | United States | | | | 180,000 | | | | 4,977,000 | |
aTrimble Navigation Ltd. | | | United States | | | | 358,900 | | | | 14,330,877 | |
aVarian Semiconductor Equipment Associates Inc. | | | United States | | | | 250,000 | | | | 9,242,500 | |
aViaSat Inc. | | | United States | | | | 104,100 | | | | 4,623,081 | |
Xerox Corp. | | | United States | | | | 329,531 | | | | 3,796,197 | |
Xilinx Inc. | | | United States | | | | 335,000 | | | | 9,708,300 | |
aYouku.com Inc., ADR | | | China | | | | 7,500 | | | | 262,575 | |
| | | | | | | | | | | | |
| | | | | | | | | | | 306,819,908 | |
| | | | | | | | | | | | |
Materials 3.3% | | | | | | | | | | | | |
Celanese Corp., A | | | United States | | | | 440,000 | | | | 18,114,800 | |
Ecolab Inc. | | | United States | | | | 135,000 | | | | 6,806,700 | |
The Scotts Miracle-Gro Co., A | | | United States | | | | 143,800 | | | | 7,300,726 | |
aSTR Holdings Inc. | | | United States | | | | 128,800 | | | | 2,576,000 | |
| | | | | | | | | | | | |
| | | | | | | | | | | 34,798,226 | |
| | | | | | | | | | | | |
Telecommunication Services 1.7% | | | | | | | | | | | | |
aSBA Communications Corp. | | | United States | | | | 420,700 | | | | 17,223,458 | |
| | | | | | | | | | | | |
Utilities 0.4% | | | | | | | | | | | | |
aCalpine Corp. | | | United States | | | | 350,000 | | | | 4,669,000 | |
| | | | | | | | | | | | |
Total Common Stocks (Cost $690,667,533) | | | | | | | | | | | 1,000,467,711 | |
| | | | | | | | | | | | |
FSC-13
Franklin Templeton Variable Insurance Products Trust
Statement of Investments, December 31, 2010 (continued)
| | | | | | | | | | | | |
| Franklin Small-Mid Cap Growth Securities Fund | | Country | | | Shares | | | Value | |
Short Term Investments 5.8% | | | | | | | | | | | | |
Money Market Funds (Cost $46,615,901) 4.5% | | | | | | | | | | | | |
a,cInstitutional Fiduciary Trust Money Market Portfolio | | | United States | | | | 46,615,901 | | | $ | 46,615,901 | |
| | | | | | | | | | | | |
| | | |
| | | | | | Principal
Amount | | | | |
dInvestments from Cash Collateral Received for Loaned Securities 1.3% | | | | | | | | | |
eRepurchase Agreements 1.3% | | | | | | | | | | | | |
Barclays Capital Inc., 0.20%, 1/03/11 (Maturity Value $2,637,044) Collateralized by U.S. Treasury Notes, 0.38% - 0.63%, 6/30/12 - 9/30/12 (valued at $2,689,740) | | | United States | | | $ | 2,637,000 | | | | 2,637,000 | |
BNP Paribas Securities Corp., 0.17%, 1/03/11 (Maturity Value $3,747,053) Collateralized by U.S. Government Agency Securities, 0.23% - 10.35%, 1/10/11 - 6/11/38; fU.S. Government Agency Discount Notes, 1/04/11 - 2/09/40 (valued at $3,821,940) | | | United States | | | | 3,747,000 | | | | 3,747,000 | |
Deutsche Bank Securities Inc., 0.22%, 1/03/11 (Maturity Value $3,000,055) Collateralized by fU.S. Government Agency Discount Notes, 4/26/11 (valued at $3,060,000) | | | United States | | | | 3,000,000 | | | | 3,000,000 | |
Merrill Lynch, Pierce, Fenner & Smith Inc., 0.17%, 1/03/11 (Maturity Value $2,543,036) Collateralized by U.S. Government Agency Securities, 2.63% - 9.50%, 10/15/11 - 4/15/53 (valued at $2,593,860) | | | United States | | | | 2,543,000 | | | | 2,543,000 | |
RBS Securities Inc., 0.25%, 1/03/11 (Maturity Value $2,000,042) Collateralized by U.S. Government Agency Securities, 0.55% - 5.95%, 1/20/11 - - 6/07/27 (valued at $2,040,007) | | | United States | | | | 2,000,000 | | | | 2,000,000 | |
| | | | | | | | | | | | |
Total Repurchase Agreements (Cost $13,927,000) | | | | | | | | | | | 13,927,000 | |
| | | | | | | | | | | | |
Total Investments (Cost $751,210,434) 101.6% | | | | | | | | | | | 1,061,010,612 | |
Other Assets, less Liabilities (1.6)% | | | | | | | | | | | (16,290,073 | ) |
| | | | | | | | | | | | |
Net Assets 100.0% | | | | | | | | | | $ | 1,044,720,539 | |
| | | | | | | | | | | | |
See Abbreviations on page FSC-24.
aNon-income producing.
bA portion or all of the security is on loan at December 31, 2010. See Note 1(d).
cSee Note 7 regarding investments in the Institutional Fiduciary Trust Money Market Portfolio.
dSee Note 1(d) regarding securities on loan.
eSee Note 1(c) regarding repurchase agreements.
fThe security is traded on a discount basis with no stated coupon rate.
FSC-14
Franklin Templeton Variable Insurance Products Trust
Financial Statements
Statement of Assets and Liabilities
December 31, 2010
| | | | |
| | | Franklin
Small-Mid Cap
Growth
Securities Fund | |
Assets: | | | | |
Investments in securities: | | | | |
Cost - Unaffiliated issuers | | $ | 704,594,533 | |
Cost - Sweep Money Fund (Note 7) | | | 46,615,901 | |
| | | | |
Total cost of investments | | $ | 751,210,434 | |
| | | | |
Value - Unaffiliated issuers | | $ | 1,014,394,711 | |
Value - Sweep Money Fund (Note 7) | | | 46,615,901 | |
| | | | |
Total value of investments (includes securities loaned in the amount of $13,478,516) | | | 1,061,010,612 | |
Receivables: | | | | |
Investment securities sold | | | 187,102 | |
Capital shares sold | | | 287,656 | |
Dividends and interest | | | 306,062 | |
Other assets | | | 161,625 | |
| | | | |
Total assets | | | 1,061,953,057 | |
| | | | |
Liabilities: | | | | |
Payables: | | | | |
Investment securities purchased | | | 860,057 | |
Capital shares redeemed | | | 1,136,513 | |
Affiliates | | | 1,024,367 | |
Payable upon return of securities loaned | | | 13,927,000 | |
Accrued expenses and other liabilities | | | 284,581 | |
| | | | |
Total liabilities | | | 17,232,518 | |
| | | | |
Net assets, at value | | $ | 1,044,720,539 | |
| | | | |
Net assets consist of: | | | | |
Paid-in capital | | $ | 773,985,883 | |
Net unrealized appreciation (depreciation) | | | 309,800,178 | |
Accumulated net realized gain (loss) | | | (39,065,522 | ) |
| | | | |
Net assets, at value | | $ | 1,044,720,539 | |
| | | | |
The accompanying notes are an integral part of these financial statements.
FSC-15
Franklin Templeton Variable Insurance Products Trust
Financial Statements (continued)
Statement of Assets and Liabilities (continued)
December 31, 2010
| | | | |
| | | Franklin
Small-Mid Cap
Growth
Securities Fund | |
Class 1: | | | | |
Net assets, at value | | $ | 89,826,487 | |
| | | | |
Shares outstanding | | | 4,043,544 | |
| | | | |
Net asset value and maximum offering price per share | | $ | 22.21 | |
| | | | |
Class 2: | | | | |
Net assets, at value | | $ | 939,481,024 | |
| | | | |
Shares outstanding | | | 43,625,403 | |
| | | | |
Net asset value and maximum offering price per share | | $ | 21.54 | |
| | | | |
Class 4: | | | | |
Net assets, at value | | $ | 15,413,028 | |
| | | | |
Shares outstanding | | | 701,209 | |
| | | | |
Net asset value and maximum offering price per share | | $ | 21.98 | |
| | | | |
The accompanying notes are an integral part of these financial statements.
FSC-16
Franklin Templeton Variable Insurance Products Trust
Financial Statements (continued)
Statement of Operations
for the year ended December 31, 2010
| | | | |
| | | Franklin
Small-Mid Cap
Growth
Securities Fund | |
Investment income: | | | | |
Dividends | | $ | 6,526,624 | |
Interest | | | 20,816 | |
Income from securities loaned | | | 51,649 | |
| | | | |
Total investment income | | | 6,599,089 | |
| | | | |
Expenses: | | | | |
Management fees (Note 3a) | | | 4,540,681 | |
Administrative fees (Note 3b) | | | 2,272,237 | |
Distribution fees: (Note 3c) | | | | |
Class 2 | | | 2,039,281 | |
Class 4 | | | 40,207 | |
Unaffiliated transfer agent fees | | | 2,244 | |
Custodian fees (Note 4) | | | 11,817 | |
Reports to shareholders | | | 292,725 | |
Professional fees | | | 44,068 | |
Trustees’ fees and expenses | | | 3,986 | |
Other | | | 31,944 | |
| | | | |
Total expenses | | | 9,279,190 | |
| | | | |
Net investment income (loss) | | | (2,680,101 | ) |
| | | | |
Realized and unrealized gains (losses): | | | | |
Net realized gain (loss) from: | | | | |
Investments | | | 110,749,832 | |
Foreign currency transactions | | | (4,210 | ) |
| | | | |
Net realized gain (loss) | | | 110,745,622 | |
| | | | |
Net change in unrealized appreciation (depreciation) on investments | | | 119,428,953 | |
| | | | |
Net realized and unrealized gain (loss) | | | 230,174,575 | |
| | | | |
Net increase (decrease) in net assets resulting from operations | | $ | 227,494,474 | |
| | | | |
The accompanying notes are an integral part of these financial statements.
FSC-17
Franklin Templeton Variable Insurance Products Trust
Financial Statements (continued)
Statements of Changes in Net Assets
| | | | | | | | |
| | | Franklin Small-Mid Cap Growth
Securities Fund | |
| | | Year Ended December 31, | |
| | | 2010 | | | 2009 | |
| | | | |
Increase (decrease) in net assets: | | | | | | | | |
Operations: | | | | | | | | |
Net investment income (loss) | | $ | (2,680,101 | ) | | $ | (7,248,055 | ) |
Net realized gain (loss) from investments and foreign currency transactions | | | 110,745,622 | | | | (15,270,498 | ) |
Net change in unrealized appreciation (depreciation) on investments | | | 119,428,953 | | | | 304,247,899 | |
| | | | |
Net increase (decrease) in net assets resulting from operations | | | 227,494,474 | | | | 281,729,346 | |
| | | | |
Capital share transactions: (Note 2) | | | | | | | | |
Class 1 | | | (10,074,842 | ) | | | (9,085,824 | ) |
Class 2 | | | (78,124,046 | ) | | | (54,143,599 | ) |
Class 4 | | | 1,246,003 | | | | 4,556,653 | |
| | | | |
Total capital share transactions | | | (86,952,885 | ) | | | (58,672,770 | ) |
| | | | |
Net increase (decrease) in net assets | | | 140,541,589 | | | | 223,056,576 | |
Net assets (there is no undistributed net investment income at beginning or end of year): | | | | | | | | |
Beginning of year | | | 904,178,950 | | | | 681,122,374 | |
| | | | |
End of year | | $ | 1,044,720,539 | | | $ | 904,178,950 | |
| | | | |
The accompanying notes are an integral part of these financial statements.
FSC-18
Franklin Templeton Variable Insurance Products Trust
Notes to Financial Statements
Franklin Small-Mid Cap Growth Securities Fund
1. ORGANIZATION AND SIGNIFICANT ACCOUNTING POLICIES
Franklin Templeton Variable Insurance Products Trust (Trust) is registered under the Investment Company Act of 1940, as amended, (1940 Act) as an open-end investment company, consisting of twenty separate funds. The Franklin Small-Mid Cap Growth Securities Fund (Fund) is included in this report. The financial statements of the remaining funds in the Trust are presented separately. Shares of the Fund are generally sold only to insurance company separate accounts to fund the benefits of variable life insurance policies or variable annuity contracts. The Fund offers three classes of shares: Class 1, Class 2, and Class 4. Each class of shares differs by its distribution fees, voting rights on matters affecting a single class and its exchange privilege.
The following summarizes the Fund’s significant accounting policies.
a. Financial Instrument Valuation
The Fund values its investments in securities and other assets and liabilities carried at fair value daily. Fair value is the price that would be received to sell an asset or paid to transfer a liability in an orderly transaction between market participants on the measurement date. Under procedures approved by the Trust’s Board of Trustees, the Fund may utilize independent pricing services, quotations from securities and financial instrument dealers, and other market sources to determine fair value.
Equity securities listed on an exchange or on the NASDAQ National Market System are valued at the last quoted sale price or the official closing price of the day, respectively. Foreign equity securities are valued as of the close of trading on the foreign stock exchange on which the security is primarily traded, or the NYSE, whichever is earlier. The value is then converted into its U.S. dollar equivalent at the foreign exchange rate in effect at the close of the NYSE on the day that the value of the security is determined. Over-the-counter securities are valued within the range of the most recent quoted bid and ask prices. Securities that trade in multiple markets or on multiple exchanges are valued according to the broadest and most representative market. Certain equity securities are valued based upon fundamental characteristics or relationships to similar securities. Investments in open-end mutual funds are valued at the closing net asset value. Repurchase agreements are valued at cost, which approximates market value.
The Fund has procedures to determine the fair value of securities and other financial instruments for which market prices are not readily available or which may not be reliably priced. Under these procedures, the Fund primarily employs a market-based approach which may use related or comparable assets or liabilities, recent transactions, market multiples, book values, and other relevant information for the investment to determine the fair value of the investment. The Fund may also use an income-based valuation approach in which the anticipated future cash flows of the investment are discounted to calculate fair value. Discounts may also be applied due to the nature or duration of any restrictions on the disposition of the investments. Due to the inherent uncertainty of valuations of such investments, the fair values may differ significantly from the values that would have been used had an active market existed.
Trading in securities on foreign securities stock exchanges and over-the-counter markets may be completed before the daily close of business on the NYSE. Occasionally, events occur between the time at which trading in a foreign security is completed and the close of the NYSE that might call into question the reliability of the value of a portfolio security held by the Fund. As a result, differences may arise between the value of the Fund’s portfolio securities as determined at the foreign market close and the latest indications of value at the close of the NYSE. In order to minimize the potential for these differences, the investment manager monitors price movements following the close of trading in foreign stock markets through a series of country specific market proxies (such as baskets of American Depository Receipts, futures contracts and exchange traded funds). These price movements are measured against established trigger thresholds for each specific market proxy to assist in determining if an event has occurred that may call into question the reliability of the values of the foreign securities held by the Fund. If such an event occurs, the securities may be valued using fair value procedures, which may include the use of independent pricing services.
FSC-19
Franklin Templeton Variable Insurance Products Trust
Notes to Financial Statements (continued)
Franklin Small-Mid Cap Growth Securities Fund
1. ORGANIZATION AND SIGNIFICANT ACCOUNTING POLICIES (continued)
b. Foreign Currency Translation
Portfolio securities and other assets and liabilities denominated in foreign currencies are translated into U.S. dollars based on the exchange rate of such currencies against U.S. dollars on the date of valuation. The Fund may enter into foreign currency exchange contracts to facilitate transactions denominated in a foreign currency. Purchases and sales of securities, income and expense items denominated in foreign currencies are translated into U.S. dollars at the exchange rate in effect on the transaction date. Portfolio securities and assets and liabilities denominated in foreign currencies contain risks that those currencies will decline in value relative to the U.S. dollar. Occasionally, events may impact the availability or reliability of foreign exchange rates used to convert the U.S. dollar equivalent value. If such an event occurs, the foreign exchange rate will be valued at fair value using procedures established and approved by the Trust’s Board of Trustees.
The Fund does not separately report the effect of changes in foreign exchange rates from changes in market prices on securities held. Such changes are included in net realized and unrealized gain or loss from investments on the Statement of Operations.
Realized foreign exchange gains or losses arise from sales of foreign currencies, currency gains or losses realized between the trade and settlement dates on securities transactions and the difference between the recorded amounts of dividends, interest, and foreign withholding taxes and the U.S. dollar equivalent of the amounts actually received or paid. Net unrealized foreign exchange gains and losses arise from changes in foreign exchange rates on foreign denominated assets and liabilities other than investments in securities held at the end of the reporting period.
c. Repurchase Agreements
The Fund may enter into repurchase agreements, which are accounted for as a loan by the Fund to the seller, collateralized by securities which are delivered to the Fund’s custodian. The market value, including accrued interest, of the initial collateralization is required to be at least 102% of the dollar amount invested by the Fund, with the value of the underlying securities marked to market daily to maintain coverage of at least 100%. All repurchase agreements held by the Fund at year end had been entered into on December 31, 2010.
d. Securities Lending
The Fund participates in an agency based security lending program. The fund receives cash collateral against the loaned securities in an amount equal to at least 102% of the market value of the loaned securities. Collateral is maintained over the life of the loan in an amount not less than 100% of the market value of loaned securities, as determined at the close of fund business each day; any additional collateral required due to changes in security values is delivered to the fund on the next business day. The collateral is invested in repurchase agreements managed by the fund’s custodian on the fund’s behalf. The fund receives income from the investment of cash collateral, in addition to lending fees and rebates paid by the borrower. The fund bears the market risk with respect to the collateral investment, securities loaned, and the risk that the agent may default on its obligations to the fund. The securities lending agent has agreed to indemnify the fund in the event of default by a third party borrower.
e. Income Taxes
It is the Fund’s policy to qualify as a regulated investment company under the Internal Revenue Code. The Fund intends to distribute to shareholders substantially all of its taxable income and net realized gains to relieve it from federal income and excise taxes. As a result, no provision for U.S. federal income taxes is required. The Fund files U.S. income tax returns as well as tax returns in certain other jurisdictions. The Fund’s application of those tax rules is subject to its understanding. The Fund records a provision for taxes in its financial statements including penalties and interest, if any, for a tax position taken on a tax return (or expected to be taken) when it fails to meet the more likely than not (a greater than 50% probability) threshold and based on the
FSC-20
Franklin Templeton Variable Insurance Products Trust
Notes to Financial Statements (continued)
Franklin Small-Mid Cap Growth Securities Fund
1. ORGANIZATION AND SIGNIFICANT ACCOUNTING POLICIES (continued)
e. Income Taxes (continued)
technical merits, the tax position may not be sustained upon examination by the tax authorities. As of December 31, 2010, and for all open tax years, the Fund has determined that no provision for income tax is required in the Fund’s financial statements. Open tax years are those that remain subject to examination and are based on each tax jurisdiction statute of limitation. The Fund is not aware of any tax position for which it is reasonably possible that the total amounts of unrecognized tax effects will significantly change in the next twelve months.
f. Security Transactions, Investment Income, Expenses and Distributions
Security transactions are accounted for on trade date. Realized gains and losses on security transactions are determined on a specific identification basis. Interest income and estimated expenses are accrued daily. Dividend income is recorded on the ex-dividend date except that certain dividends from foreign securities are recognized as soon as the Fund is notified of the ex-dividend date. Distributions to shareholders are recorded on the ex-dividend date and are determined according to income tax regulations (tax basis). Distributable earnings determined on a tax basis may differ from earnings recorded in accordance with accounting principles generally accepted in the United States of America. These differences may be permanent or temporary. Permanent differences are reclassified among capital accounts to reflect their tax character. These reclassifications have no impact on net assets or the results of operations. Temporary differences are not reclassified, as they may reverse in subsequent periods.
Common expenses incurred by the Trust are allocated among the funds based on the ratio of net assets of each fund to the combined net assets of the Trust. Fund specific expenses are charged directly to the fund that incurred the expense.
Realized and unrealized gains and losses and net investment income, not including class specific expenses, are allocated daily to each class of shares based upon the relative proportion of net assets of each class. Differences in per share distributions, by class, are generally due to differences in class specific expenses.
g. Accounting Estimates
The preparation of financial statements in accordance with accounting principles generally accepted in the United States of America requires management to make estimates and assumptions that affect the reported amounts of assets and liabilities at the date of the financial statements and the amounts of income and expenses during the reporting period. Actual results could differ from those estimates.
h. Guarantees and Indemnifications
Under the Trust’s organizational documents, its officers and trustees are indemnified by the Trust against certain liabilities arising out of the performance of their duties to the Trust. Additionally, in the normal course of business, the Trust, on behalf of the Fund, enters into contracts with service providers that contain general indemnification clauses. The Trust’s maximum exposure under these arrangements is unknown as this would involve future claims that may be made against the Trust that have not yet occurred. Currently, the Trust expects the risk of loss to be remote.
FSC-21
Franklin Templeton Variable Insurance Products Trust
Notes to Financial Statements (continued)
Franklin Small-Mid Cap Growth Securities Fund
2. SHARES OF BENEFICIAL INTEREST
At December 31, 2010, there were an unlimited number of shares authorized (without par value). Transactions in the Fund’s shares were as follows:
| | | | | | | | | | | | | | | | |
| | | Year Ended December 31, | |
| | | 2010 | | | 2009 | |
| Class 1 Shares: | | Shares | | | Amount | | | Shares | | | Amount | |
Shares sold | | | 293,329 | | | $ | 5,660,759 | | | | 360,719 | | | $ | 4,738,225 | |
Shares redeemed | | | (838,792 | ) | | | (15,735,601 | ) | | | (1,039,202 | ) | | | (13,824,049 | ) |
| | | | |
Net increase (decrease) | | | (545,463 | ) | | $ | (10,074,842 | ) | | | (678,483 | ) | | $ | (9,085,824 | ) |
| | | | |
Class 2 Shares: | | | | | | | | | | | | | | | | |
Shares sold | | | 4,961,508 | | | $ | 92,319,522 | | | | 5,849,260 | | | $ | 79,159,779 | |
Shares redeemed | | | (9,551,006 | ) | | | (170,443,568 | ) | | | (9,890,944 | ) | | | (133,303,378 | ) |
| | | | |
Net increase (decrease) | | | (4,589,498 | ) | | $ | (78,124,046 | ) | | | (4,041,684 | ) | | $ | (54,143,599 | ) |
| | | | |
Class 4 Shares: | | | | | | | | | | | | | | | | |
Shares sold | | | 320,420 | | | $ | 6,087,006 | | | | 430,752 | | | $ | 5,835,810 | |
Shares redeemed | | | (258,807 | ) | | | (4,841,003 | ) | | | (85,450 | ) | | | (1,279,157 | ) |
| | | | |
Net increase (decrease) | | | 61,613 | | | $ | 1,246,003 | | | | 345,302 | | | $ | 4,556,653 | |
| | | | |
3. TRANSACTIONS WITH AFFILIATES
Franklin Resources, Inc. is the holding company for various subsidiaries that together are referred to as Franklin Templeton Investments. Certain officers and trustees of the Fund are also officers and/or directors of the following subsidiaries:
| | |
| Subsidiary | | Affiliation |
Franklin Advisers, Inc. (Advisers) | | Investment manager |
Franklin Templeton Services, LLC (FT Services) | | Administrative manager |
Franklin Templeton Distributors, Inc. (Distributors) | | Principal underwriter |
Franklin Templeton Investor Services, LLC (Investor Services) | | Transfer agent |
a. Management Fees
The Fund pays an investment management fee to Advisers based on the average daily net assets of the Fund as follows:
| | |
| Annualized Fee Rate | | Net Assets |
| 0.550% | | Up to and including $500 million |
| 0.450% | | Over $500 million, up to and including $1 billion |
| 0.400% | | Over $1 billion, up to and including $1.5 billion |
| 0.350% | | Over $1.5 billion, up to and including $6.5 billion |
| 0.325% | | Over $6.5 billion, up to and including $11.5 billion |
| 0.300% | | Over $11.5 billion, up to and including $16.5 billion |
| 0.290% | | Over $16.5 billion, up to and including $19 billion |
| 0.280% | | Over $19 billion, up to and including $21.5 billion |
| 0.270% | | In excess of $21.5 billion |
b. Administrative Fees
The Fund pays an administrative fee to FT Services of 0.25% per year of the average daily net assets of the Fund.
FSC-22
Franklin Templeton Variable Insurance Products Trust
Notes to Financial Statements (continued)
Franklin Small-Mid Cap Growth Securities Fund
3. TRANSACTIONS WITH AFFILIATES (continued)
c. Distribution Fees
The Trust’s Board of Trustees has adopted distribution plans for Class 2 and Class 4 shares pursuant to Rule 12b-1 under the 1940 Act. Under the Fund’s compensation distribution plans, the Fund pays Distributors for costs incurred in connection with the servicing, sale and distribution of the Fund’s shares up to 0.35% per year of its average daily net assets of each class. The Board of Trustees has agreed to limit the current rate to 0.25% per year for Class 2.
d. Transfer Agent Fees
Investor Services, under terms of an agreement, performs shareholder servicing for the Fund and is not paid by the Fund for the services.
4. EXPENSE OFFSET ARRANGEMENT
The Fund has entered into an arrangement with its custodian whereby credits realized as a result of uninvested cash balances are used to reduce a portion of the Fund’s custodian expenses. During the year ended December 31, 2010, there were no credits earned.
5. INCOME TAXES
For tax purposes, capital losses may be carried over to offset future capital gains, if any. At December 31, 2010, the Fund had tax basis capital losses of $38,029,637 expiring in 2017. During the year ended December 31, 2010, the Fund utilized $111,761,533 of capital loss carryforwards.
At December 31, 2010, the cost of investments and net unrealized appreciation (depreciation) for income tax purposes were as follows:
| | | | |
Cost of investments | | $ | 752,245,931 | |
| | | | |
Unrealized appreciation | | $ | 313,779,857 | |
Unrealized depreciation | | | (5,015,176 | ) |
| | | | |
Net unrealized appreciation (depreciation) | | $ | 308,764,681 | |
| | | | |
Net investment income (loss) differs for financial statement and tax purposes primarily due to differing treatment of foreign currency transactions.
Net realized gains (losses) differ for financial statement and tax purposes primarily due to differing treatments of wash sales and foreign currency transactions.
6. INVESTMENT TRANSACTIONS
Purchases and sales of investments (excluding short term securities) for the year ended December 31, 2010, aggregated $410,743,241 and $519,901,620, respectively.
7. INVESTMENTS IN INSTITUTIONAL FIDUCIARY TRUST MONEY MARKET PORTFOLIO
The Fund may invest in the Institutional Fiduciary Trust Money Market Portfolio (Sweep Money Fund), an open-end investment company managed by Advisers. Management fees paid by the Fund are reduced on assets invested in the Sweep Money Fund, in an amount not to exceed the management and administrative fees paid by the Sweep Money Fund.
FSC-23
Franklin Templeton Variable Insurance Products Trust
Notes to Financial Statements (continued)
Franklin Small-Mid Cap Growth Securities Fund
8. CREDIT FACILITY
The Fund, together with other U.S. registered and foreign investment funds (collectively “Borrowers”), managed by Franklin Templeton Investments, are borrowers in a joint syndicated senior unsecured credit facility totaling $750 million (Global Credit Facility) which matures on January 21, 2011. This Global Credit Facility provides a source of funds to the Borrowers for temporary and emergency purposes, including the ability to meet future unanticipated or unusually large redemption requests.
Under the terms of the Global Credit Facility, the Fund shall, in addition to interest charged on any borrowings made by the Fund and other costs incurred by the Fund, pay its share of fees and expenses incurred in connection with the implementation and maintenance of the Global Credit Facility, based upon its relative share of the aggregate net assets of all of the Borrowers, including an annual commitment fee of 0.10% based upon the unused portion of the Global Credit Facility, which is reflected in other expenses on the Statement of Operations. During the year ended December 31, 2010, the Fund did not use the Global Credit Facility.
Effective January 21, 2011, the Borrowers renewed the Global Credit Facility for a total of $750 million, maturing January 20, 2012.
9. FAIR VALUE MEASUREMENTS
The Fund follows a fair value hierarchy that distinguishes between market data obtained from independent sources (observable inputs) and the Fund’s own market assumptions (unobservable inputs). These inputs are used in determining the value of the Fund’s investments and are summarized in the following fair value hierarchy:
| | • | | Level 1 – quoted prices in active markets for identical securities |
| | • | | Level 2 – other significant observable inputs (including quoted prices for similar securities, interest rates, prepayment speed, credit risk, etc.) |
| | • | | Level 3 – significant unobservable inputs (including the Fund’s own assumptions in determining the fair value of investments) |
The inputs or methodology used for valuing securities are not an indication of the risk associated with investing in those securities.
For movements between the levels within the fair value hierarchy, the Fund has adopted a policy of recognizing the transfers as of the date of the underlying event which caused the movement.
The following is a summary of the inputs used as of December 31, 2010, in valuing the Fund’s assets carried at fair value:
| | | | | | | | | | | | | | | | |
| | | Level 1 | | | Level 2 | | | Level 3 | | | Total | |
| | | | |
Assets: | | | | | | | | | | | | | | | | |
Investments in Securities: | | | | | | | | | | | | | | | | |
Equity Investmentsa | | $ | 1,000,467,711 | | | $ | — | | | $ | — | | | $ | 1,000,467,711 | |
Short Term Investments | | | 46,615,901 | | | | 13,927,000 | | | | — | | | | 60,542,901 | |
| | | | |
Total Investments in Securities | | $ | 1,047,083,612 | | | $ | 13,927,000 | | | $ | — | | | $ | 1,061,010,612 | |
| | | | |
a For detailed industry descriptions, see the accompanying Statement of Investments.
10. SUBSEQUENT EVENTS
The Fund has evaluated subsequent events through the issuance of the financial statements and determined that no events have occurred that require disclosure other than those already disclosed in the financial statements.
| | | | |
ABBREVIATIONS | | | | |
| Selected Portfolio | | | | |
| | | | |
| ADR - American Depository Receipt | | | | |
FSC-24
Franklin Templeton Variable Insurance Products Trust
Franklin Small-Mid Cap Growth Securities Fund
Report of Independent Registered Public Accounting Firm
To the Board of Trustees and Shareholders of
Franklin Templeton Variable Insurance Products Trust
In our opinion, the accompanying statement of assets and liabilities, including the statement of investments, and the related statements of operations and of changes in net assets and the financial highlights present fairly, in all material respects, the financial position of Franklin Small-Mid Cap Growth Securities Fund (the “Fund”) at December 31, 2010, the results of its operations for the year then ended, the changes in its net assets for each of the two years in the period then ended and the financial highlights for each of the periods presented, in conformity with accounting principles generally accepted in the United States of America. These financial statements and financial highlights (hereafter referred to as “financial statements”) are the responsibility of the Fund’s management. Our responsibility is to express an opinion on these financial statements based on our audits. We conducted our audits of these financial statements in accordance with the standards of the Public Company Accounting Oversight Board (United States). Those standards require that we plan and perform the audit to obtain reasonable assurance about whether the financial statements are free of material misstatement. An audit includes examining, on a test basis, evidence supporting the amounts and disclosures in the financial statements, assessing the accounting principles used and significant estimates made by management, and evaluating the overall financial statement presentation. We believe that our audits, which included confirmation of securities at December 31, 2010 by correspondence with the custodian and brokers, provide a reasonable basis for our opinion.
PricewaterhouseCoopers LLP
San Francisco, California
February 10, 2011
FSC-25
FRANKLIN STRATEGIC INCOME SECURITIES FUND
We are pleased to bring you Franklin Strategic Income Securities Fund’s annual report for the fiscal year ended December 31, 2010.
Performance Summary as of 12/31/10
Average annual total return of Class 4 shares* represents the average annual change in value, assuming reinvestment of dividends and capital gains. Average returns smooth out variations in returns, which can be significant; they are not the same as year-by-year results.
Periods ended 12/31/10
| | | | | | | | | | | | |
| | | 1-Year | | | 5-Year | | | 10-Year | |
Average Annual Total Return | | | +10.88% | | | | +7.31% | | | | +7.73% | |
*For the period beginning 2/29/08, Class 4 performance reflects a 12b-1 fee expense of 0.35% per year, which affects future performance. Class 4 performance prior to 2/29/08 reflects historical Class 1 performance, which does not have a 12b-1 fee expense. Since 2/29/08 (effective date), the average annual total return of Class 4 shares was +7.54%.
Total Return Index Comparison for a Hypothetical $10,000 Investment (1/1/01–12/31/10)
The graph below shows the change in value of a hypothetical $10,000 investment in the Fund over the indicated period and includes reinvestment of any income or distributions. The Fund’s performance* is compared to the performance of the Barclays Capital (BC) U.S. Aggregate Index and the Lipper Multi-Sector Income Funds Classification Average. One cannot invest directly in an index, and an index is not representative of the Fund’s portfolio. Please see Important Notes to Performance Information preceding the Fund Summaries.
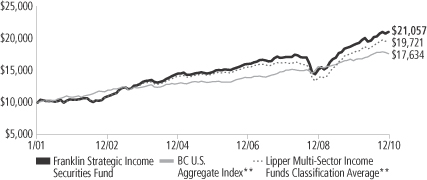
**Sources: © 2011 Morningstar; Lipper Inc. Please see Index Descriptions following the Fund Summaries.
Franklin Strategic Income Securities Fund – Class 4
Performance reflects the Fund’s Class 4 operating expenses, but does not include any contract fees, expenses or sales charges. If they had been included, performance would be lower. These charges and deductions, particularly for variable life policies, can have a significant effect on contract values and insurance benefits. See the contract prospectus for a complete description of these expenses, including sales charges.
Performance data represent past performance, which does not guarantee future results. Investment return and principal value will fluctuate, and you may have a gain or loss when you sell your shares.
Current performance may differ from figures shown.
FSI-1
Fund Goals and Main Investments: Franklin Strategic Income Securities Fund seeks a high level of current income, with capital appreciation over the long term as a secondary goal. The Fund normally invests at least 65% of its assets in U.S. and foreign debt securities, including those in emerging markets.
Performance Overview
You can find the Fund’s one-year total return in the Performance Summary. Compared with its benchmarks for the same period, the Fund outperformed the BC U.S. Aggregate Index’s +6.54% total return, and performed comparably to the Lipper Multi-Sector Income Funds Classification Average’s +10.83% total return.1
Economic and Market Overview
The U.S. economy expanded unevenly during the 12-month reporting period. The nation’s economic activity as measured by gross domestic product registered annualized growth rates of 3.7%, 1.7%, 2.6% and an estimated 3.2% in the first, second, third and fourth quarters of 2010, respectively. In the fourth quarter, rising exports, shrinking imports and greater consumer and business spending supported growth. The job market remained sluggish, however, and the unemployment rate was 9.4% in December.2 Challenges to sustained economic recovery include elevated debt concerns and a struggling housing sector.
Crude oil prices began the reporting period at $79 per barrel, but abruptly fell in May when a European debt crisis threatened the global recovery. After a brief rally, prices retreated again in August due to slumping stock prices, reduced demand and abundant inventory levels. Prices quickly recovered after receiving a boost from the falling U.S. dollar and positive economic data and reached a 12-month high of $91 in late December. The pace of inflation slowed during the year, and December’s inflation rate was an annualized 1.5%.2 Similarly, core inflation, which excludes food and energy costs, slowed to a 0.8% annualized rate.2
Early in the year, economic improvement and benign inflation trends prompted Federal Reserve Board (Fed) policymakers to maintain record-low interest rates within a 0% to 0.25% range and discontinue certain stimulus plans. In June, the Fed offered a more restrained view of the economy largely because of developments in Europe and signs
1. Sources: © 2011 Morningstar; Lipper Inc. One cannot invest directly in an index, and an index is not representative of the Fund’s portfolio. Please see Index Descriptions following the Fund Summaries.
2. Source: Bureau of Labor Statistics.
Fund Risks: Because the Fund invests in bonds and other debt obligations, its share price and yield will be affected by interest rate movements. Bond prices generally move in the opposite direction of interest rates. Thus, as prices of bonds in the Fund adjust to a rise in interest rates, the Fund’s share price may decline. High yield, lower rated (junk) bonds generally have greater price swings and higher default risks than investment-grade bonds. Bank loans and loan participations involve credit, interest rate and illiquidity risks. Foreign investing, especially in emerging markets, involves additional risks, including currency fluctuations, economic instability, market volatility, and political and social instability. Mortgage- and asset-backed securities are subject to prepayment and extension risks. The value of convertible securities may rise and fall with the market value of the underlying stock or, like a debt security, vary with changes in interest rates and the credit quality of the issuer. The Fund may also use certain derivative instruments, which may be volatile and illiquid, may give rise to leverage and may involve a small investment relative to the risk assumed. The manager applies various techniques and analyses in making investment decisions for the Fund, but there can be no guarantee that these decisions will produce the desired results. The Fund’s prospectus also includes a description of the main investment risks.
FSI-2
the U.S. economic expansion lacked momentum. Consumer confidence tumbled due to disappointing employment numbers, a plunge in home sales spurred by the expiration of a homebuyer tax credit, and fears of a renewed economic slowdown. On several occasions, the Fed reiterated it would maintain the federal funds target rate within a range of 0% to 0.25% for an extended period. In November, concerned about the slowing pace of recovery as well as inflation, which had dipped to a level below its mandate to foster maximum employment and price stability, the Fed said it intended to buy $600 billion of government debt in an effort to correct these conditions.
Investor concerns about weak economic data and the potential spillover effects of the European debt crisis led to market volatility. At times, wary investors favored short-term Treasuries, and Treasury yields dipped to very low levels during the year. Late in the year, encouraging corporate earnings reports, the prospect of Fed intervention and extension of Bush-era tax cuts boosted investor confidence and fueled an equity market rally, which dampened Treasury prices. For the 12 months under review, however, Treasury prices rose and yields declined, reflecting general investor uncertainty. The two-year Treasury bill yield decreased from 1.14% to 0.61% over the 12-month period, while the 10-year Treasury note yield fell from 3.85% to 3.30%.
The global recovery strengthened, albeit at an uneven pace. Emerging market economies generally enjoyed solid growth as they were less exposed than developed markets to many of the causes of the financial crisis, particularly an overreliance on leverage. Many developing economies returned to trend growth levels, particularly in Asia, prompting some officials there to tighten fiscal and monetary policies. In contrast, the G-3 (U.S., eurozone and Japan) continued to struggle with recoveries that were not as robust as in previous episodes. Labor markets remained weak, and concerns regarding public sector balances led to periods of volatility during the year. For example, although 2010’s first quarter was broadly positive for most risk assets and currencies, concerns regarding the Greek government’s ability to meet its financing needs, combined with heightened geopolitical tensions in the Korean Peninsula and fears of a hard landing in China, contributed to a less favorable second quarter. The second half of the year followed broadly similar trends because the third quarter was favorable for risk assets following strong support for Greece from the European Union and International Monetary Fund. However, renewed concerns in the eurozone, this time centered on Ireland, led to more market volatility in
FSI-3
Portfolio Breakdown
Franklin Strategic Income Securities Fund
Based on Total Net Assets
| | | | |
| | | 12/31/10 | |
| High Yield Corporate Bonds & Preferred Securities | | | 29.6% | |
| International Government & Agency Bonds (non-$US) | | | 21.9% | |
| Floating Rate Bank Loans | | | 15.7% | |
| Investment Grade Corporate Bonds & Preferred Securities | | | 7.1% | |
| Mortgage-Backed Securities | | | 6.9% | |
| Municipal Bonds | | | 5.8% | |
| Commercial Mortgage-Backed Securities | | | 3.6% | |
| International Government & Agency Bonds ($US) | | | 3.2% | |
| Asset-Backed Securities | | | 1.9% | |
| U.S. Treasury Securities | | | 1.3% | |
| Equities | | | 0.2% | |
| Convertible Securities | | | 0.0% | * |
| Short-Term Investments & Other Net Assets** | | | 2.8% | |
*Rounds to less than 0.1% of total net assets.
**Includes unrealized gains/losses on forward currency contracts. Does not include short-term foreign government securities.
The dollar value, number of shares or principal amount, and names of all portfolio holdings are listed in the Fund’s Statement of Investments.
the fourth quarter. In addition, after reaching the lowest levels of the year early in the fourth quarter in anticipation of the Fed’s announcing its second quantitative easing program, U.S. Treasury yields rose meaningfully near period-end, which created problems for many traditional fixed income investors.
Investment Strategy
We allocate our investments among the various types of debt available based on our assessment of changing economic, global market, industry and issuer conditions. We use a top-down analysis of macroeconomic trends, combined with a bottom-up fundamental analysis of market sectors, industries and issuers, seeking to take advantage of varying sector reactions to economic events. For example, we may evaluate business cycles, yield curves, country risk, and the relative interest rates among currencies, and values between and within markets. In selecting debt securities, we generally conduct our own analysis of the security’s intrinsic value rather than simply relying on the coupon rate or rating. We may also enter into various transactions involving certain currency-, interest rate- or credit-related derivative instruments for hedging purposes, to enhance returns or to obtain exposure to various market sectors.
FSI-4
Manager’s Discussion
During the fiscal year’s first half, concerns surrounding the financial and economic stresses emanating from Greece and other parts of Europe led to heightened financial market risk aversion. Partly as a result, long-term U.S. interest rates declined, equity markets fell, and performance lagged for many of the fixed income market’s spread sectors. However, by late summer 2010, financial markets began to ignore concerns regarding Europe and focus instead on healthy global economic growth, some signs of U.S. economic improvement, and another round of expected quantitative easing from the U.S. Fed. Moreover, in a low short-term interest rate environment, investors exhibited significant demand for higher yielding investments, which supported performance for several fixed income sectors. Although toward year-end concerns regarding the European region reemerged, led by an Irish banking system crisis, such fears largely remained in Europe, allowing U.S. equity markets to move higher along with an upward movement in longer term interest rates.
In this environment, Franklin Strategic Income Securities Fund outperformed its benchmark index, the BC U.S. Aggregate Index, and performed in line with its peers as measured by the Lipper Multi-Sector Income Funds Classification Average. Given the rise in U.S. interest rates toward period-end, the Fund’s lower weighting in longer duration U.S. interest rate-sensitive fixed income sectors (Treasuries and agency bonds) positively impacted performance compared to the benchmark index. The Fund’s exposure to noninvestment-grade credit (high yield corporate bonds and leveraged loans) delivered strong performance over the year. Although high yield corporate bonds represented the Fund’s largest sector weighting and provided some of the highest total returns for the year, a lower weighting versus those of certain peer funds constrained performance versus the Lipper average. Certain of the Fund’s non-U.S. dollar holdings provided positive returns due to currency appreciation relative to the U.S. dollar. However, the Fund’s lower weighting in emerging market, hard-currency sovereign bonds relative to certain of its peers limited the relative benefit of holding such securities.
During the year, U.S. Treasuries posted positive results, above their coupon income, but lagged many other fixed income sectors. Considering their shorter duration, agency mortgage-backed securities (MBS) generally lagged the overall Treasury market; however, relative to Treasuries of comparable duration, they outperformed. Although the
FSI-5
Fund added to its agency MBS exposure in 2010, it still maintained relatively low exposure to U.S. government and agency debt largely due to the historically low yields offered by these instruments and the market’s longer term concerns surrounding the country’s deficit funding needs, as well as an improved U.S. economic outlook. The commercial mortgage-backed securities (CMBS) sector was one of the fixed income market’s best performing during the year. The outlook for commercial property remained weak, with a potential for high delinquency rates; however, the security backing many of the Fund’s CMBS holdings generally supported pricing for these securities. The Fund pared its CMBS exposure during the period given the strong price rebound that certain securities experienced over the past two years. The Fund added to its municipal bond positions, with a focus on certain Build America Bonds (BAB), which generally provide a higher level of income to investors than traditional tax-free municipal bonds. With the discontinuance of the BAB program expected for 2011, a lack of future BAB issuance led to better relative performance for such securities near period-end.
Despite some weakness during the period’s first half, investment-grade and noninvestment-grade corporate markets posted healthy performance for the overall period. Fundamentally, quarterly corporate earnings generally exceeded expectations, driven by cost controls, some top-line revenue growth, and healthy gains for international companies from their emerging market operations. In this environment, the noninvestment-grade default rate dropped dramatically over the course of the year, ending 2010 well below its longer term average. We maintained significant exposure to the corporate credit market. However, we continued to take some gains in investment-grade corporate bonds, while adding exposure to noninvestment-grade bank loans and maintaining a large weighting in high yield corporate bonds, which we believe could benefit from an improvement in fundamental credit trends. Even with higher prices in these sectors, the Fund maintained significant exposure at period-end given valuations that we believed still offered good long-term value considering an outlook for better credit fundamentals.
With the U.S. dollar weaker against a trade-weighted basket of foreign currencies during the period, the Fund generally benefited from its non-U.S. dollar positions. The Fund’s long positions in Asian foreign currency bonds and forward currency exchange contracts helped results, with currencies from countries such as South Korea, Malaysia and Australia appreciating versus the U.S. dollar. However, the Fund’s short position in the Japanese yen, through the use of forward contracts,
FSI-6
hindered performance given the yen’s strength relative to the U.S. dollar. Although currencies from certain non-eurozone European countries, such as Sweden, Norway and Poland, had mixed performances versus the U.S. dollar, the Fund’s proxy hedge short position in the euro, through the use of forward contracts, helped results given the euro’s relative weakness. Similar to other spread sectors, the Fund’s hard-currency, U.S. dollar-denominated emerging market allocation performed well during the fiscal year largely due to a healthy fundamental growth outlook for many developing markets. However, the Fund’s sector weighting was relatively small, considering yield spread valuations, so the positive impact on overall Fund returns was limited.
Thank you for your participation in Franklin Strategic Income Securities Fund. We look forward to serving your future investment needs.
The foregoing information reflects our analysis, opinions and portfolio holdings as of December 31, 2010, the end of the reporting period. The way we implement our main investment strategies and the resulting portfolio holdings may change depending on factors such as market and economic conditions. These opinions may not be relied upon as investment advice or an offer for a particular security. The information is not a complete analysis of every aspect of any market, country, industry, security or the Fund. Statements of fact are from sources considered reliable, but the investment manager makes no representation or warranty as to their completeness or accuracy. Although historical performance is no guarantee of future results, these insights may help you understand our investment management philosophy.
FSI-7
Fund Expenses
As an investor in a variable insurance contract (Contract) that indirectly provides for investment in an underlying mutual fund, you can incur transaction and/or ongoing expenses at both the Fund level and the Contract level.
| • | | Transaction expenses can include sales charges (loads) on purchases, redemption fees, surrender fees, transfer fees and premium taxes. |
| • | | Ongoing expenses can include management fees, distribution and service (12b-1) fees, contract fees, annual maintenance fees, mortality and expense risk fees and other fees and expenses. All mutual funds and Contracts have some types of ongoing expenses. |
The expenses shown in the table are meant to highlight ongoing expenses at the Fund level only and do not include ongoing expenses at the Contract level, or transaction expenses at either the Fund or Contract level. While the Fund does not have transaction expenses, if the transaction and ongoing expenses at the Contract level were included, the expenses shown below would be higher. You should consult your Contract prospectus or disclosure document for more information.
The table shows Fund-level ongoing expenses and can help you understand these expenses and compare them with those of other mutual funds offered through the Contract. The table assumes a $1,000 investment held for the six months indicated. Please refer to the Fund prospectus for additional information on operating expenses.
Actual Fund Expenses
The first line (Actual) of the table provides actual account values and expenses. The “Ending Account Value” is derived from the Fund’s actual return, which includes the effect of ongoing Fund expenses, but does not include the effect of ongoing Contract expenses.
You can estimate the Fund-level expenses you incurred during the period by following these steps. Of course, your account value and expenses will differ from those in this illustration:
| 1. | Divide your account value by $1,000. |
If an account had an $8,600 value, then $8,600 ÷ $1,000 = 8.6.
| 2. | Multiply the result by the number under the heading “Fund-Level Expenses Incurred During Period.” |
If Fund-Level Expenses Incurred During Period were $7.50, then 8.6 x $7.50 = $64.50.
In this illustration, the estimated expenses incurred this period at the Fund level are $64.50.
Franklin Strategic Income Securities Fund – Class 4
FSI-8
Hypothetical Example for Comparison with Other Mutual Funds
Information in the second line (Hypothetical) of the table can help you compare ongoing expenses of the Fund with those of other mutual funds offered through the Contract. This information may not be used to estimate the actual ending account balance or expenses you incurred during the period. The hypothetical “Ending Account Value” is based on the Fund’s actual expense ratio and an assumed 5% annual rate of return before expenses, which does not represent the Fund’s actual return. The figure under the heading “Fund-Level Expenses Incurred During Period” shows the hypothetical expenses your account would have incurred under this scenario. You can compare this figure with the 5% hypothetical examples that appear in shareholder reports of other funds offered through a Contract.
| | | | | | | | | | | | |
| Class 4 | | Beginning
Account Value 7/1/10 | | | Ending
Account
Value 12/31/10 | | | Fund-Level Expenses Incurred
During Period* 7/1/10–12/31/10 | |
Actual | | $ | 1,000 | | | $ | 1,068.90 | | | $ | 4.95 | |
Hypothetical (5% return before expenses) | | $ | 1,000 | | | $ | 1,020.42 | | | $ | 4.84 | |
*Expenses are calculated using the most recent six-month annualized expense ratio for the Fund’s Class 4 shares (0.95%), which does not include any ongoing expenses of the Contract for which the Fund is an investment option, multiplied by the average account value over the period, multiplied by 184/365 to reflect the one-half year period.
FSI-9
Franklin Templeton Variable Insurance Products Trust
Financial Highlights
Franklin Strategic Income Securities Fund
| | | | | | | | | | | | | | | | | | | | |
| | | Year Ended December 31, | |
| Class 1 | | 2010 | | | 2009 | | | 2008 | | | 2007 | | | 2006 | |
| | | | |
Per share operating performance | | | | | | | | | | | | | | | | | | | | |
(for a share outstanding throughout the year) | | | | | | | | | | | | | | | | | | | | |
Net asset value, beginning of year | | $ | 12.28 | | | $ | 10.58 | | | $ | 12.78 | | | $ | 12.73 | | | $ | 12.43 | |
| | | | |
Income from investment operationsa: | | | | | | | | | | | | | | | | | | | | |
Net investment incomeb | | | 0.72 | | | | 0.70 | | | | 0.69 | | | | 0.73 | | | | 0.69 | |
Net realized and unrealized gains (losses) | | | 0.61 | | | | 1.95 | | | | (1.99 | ) | | | 0.04 | | | | 0.32 | |
| | | | |
Total from investment operations | | | 1.33 | | | | 2.65 | | | | (1.30 | ) | | | 0.77 | | | | 1.01 | |
| | | | |
Less distributions from: | | | | | | | | | | | | | | | | | | | | |
Net investment income and net foreign currency gains | | | (0.62 | ) | | | (0.95 | ) | | | (0.87 | ) | | | (0.68 | ) | | | (0.63 | ) |
Net realized gains | | | — | | | | — | | | | (0.03 | ) | | | (0.04 | ) | | | (0.08 | ) |
| | | | |
Total distributions | | | (0.62 | ) | | | (0.95 | ) | | | (0.90 | ) | | | (0.72 | ) | | | (0.71 | ) |
| | | | |
Net asset value, end of year | | $ | 12.99 | | | $ | 12.28 | | | $ | 10.58 | | | $ | 12.78 | | | $ | 12.73 | |
| | | | |
| | | | | |
Total returnc | | | 11.21% | | | | 26.11% | | | | (11.03)% | | | | 6.20% | | | | 8.51% | |
Ratios to average net assets | | | | | | | | | | | | | | | | | | | | |
Expensesd | | | 0.59% | | | | 0.58% | | | | 0.61% | | | | 0.62% | | | | 0.62% | |
Net investment income | | | 5.71% | | | | 6.13% | | | | 5.83% | | | | 5.72% | | | | 5.51% | |
| | | | | |
Supplemental data | | | | | | | | | | | | | | | | | | | | |
Net assets, end of year (000’s) | | $ | 1,195,149 | | | $ | 1,173,313 | | | $ | 903,358 | | | $ | 1,086,850 | | | $ | 902,071 | |
Portfolio turnover rate | | | 56.46% | | | | 56.19% | | | | 47.68% | | | | 46.88% | | | | 47.88% | |
Portfolio turnover rate excluding mortgage dollar rollse | | | 56.46% | | | | 56.19% | | | | 47.68% | | | | 46.43% | | | | 44.58% | |
aThe amount shown for a share outstanding throughout the period may not correlate with the Statement of Operations for the period due to the timing of sales and repurchases of the Fund shares in relation to income earned and/or fluctuating market value of the investments of the Fund.
bBased on average daily shares outstanding.
cTotal return does not include any fees, charges or expenses imposed by the variable annuity and life insurance contracts for which the Franklin Templeton Variable Insurance Products Trust serves as an underlying investment vehicle.
dBenefit of expense reduction rounds to less than 0.01%.
eSee Note 1(f) regarding mortgage dollar rolls.
The accompanying notes are an integral part of these financial statements.
FSI-10
Franklin Templeton Variable Insurance Products Trust
Financial Highlights (continued)
Franklin Strategic Income Securities Fund
| | | | | | | | | | | | | | | | | | | | |
| | | Year Ended December 31, | |
| Class 2 | | 2010 | | | 2009 | | | 2008 | | | 2007 | | | 2006 | |
| | | | |
Per share operating performance | | | | | | | | | | | | | | | | | | | | |
(for a share outstanding throughout the year) | | | | | | | | | | | | | | | | | | | | |
Net asset value, beginning of year | | $ | 12.05 | | | $ | 10.41 | | | $ | 12.60 | | | $ | 12.56 | | | $ | 12.27 | |
| | | | |
Income from investment operationsa: | | | | | | | | | | | | | | | | | | | | |
Net investment incomeb | | | 0.68 | | | | 0.66 | | | | 0.65 | | | | 0.69 | | | | 0.65 | |
Net realized and unrealized gains (losses) | | | 0.59 | | | | 1.91 | | | | (1.96 | ) | | | 0.05 | | | | 0.31 | |
| | | | |
Total from investment operations | | | 1.27 | | | | 2.57 | | | | (1.31 | ) | | | 0.74 | | | | 0.96 | |
| | | | |
Less distributions from: | | | | | | | | | | | | | | | | | | | | |
Net investment income and net foreign currency gains | | | (0.60 | ) | | | (0.93 | ) | | | (0.85 | ) | | | (0.66 | ) | | | (0.59 | ) |
Net realized gains | | | — | | | | — | | | | (0.03 | ) | | | (0.04 | ) | | | (0.08 | ) |
| | | | |
Total distributions | | | (0.60 | ) | | | (0.93 | ) | | | (0.88 | ) | | | (0.70 | ) | | | (0.67 | ) |
| | | | |
Net asset value, end of year | | $ | 12.72 | | | $ | 12.05 | | | $ | 10.41 | | | $ | 12.60 | | | $ | 12.56 | |
| | | | |
| | | | | |
Total returnc | | | 10.91% | | | | 25.75% | | | | (11.24)% | | | | 5.91% | | | | 8.24% | |
Ratios to average net assets | | | | | | | | | | | | | | | | | | | | |
Expensesd | | | 0.84% | | | | 0.83% | | | | 0.86% | | | | 0.87% | | | | 0.87% | |
Net investment income | | | 5.46% | | | | 5.88% | | | | 5.58% | | | | 5.47% | | | | 5.26% | |
| | | | | |
Supplemental data | | | | | | | | | | | | | | | | | | | | |
Net assets, end of year (000’s) | | $ | 101,347 | | | $ | 68,240 | | | $ | 33,155 | | | $ | 24,613 | | | $ | 11,753 | |
Portfolio turnover rate | | | 56.46% | | | | 56.19% | | | | 47.68% | | | | 46.88% | | | | 47.88% | |
Portfolio turnover rate excluding mortgage dollar rollse | | | 56.46% | | | | 56.19% | | | | 47.68% | | | | 46.43% | | | | 44.58% | |
aThe amount shown for a share outstanding throughout the period may not correlate with the Statement of Operations for the period due to the timing of sales and repurchases of the Fund shares in relation to income earned and/or fluctuating market value of the investments of the Fund.
bBased on average daily shares outstanding.
cTotal return does not include any fees, charges or expenses imposed by the variable annuity and life insurance contracts for which the Franklin Templeton Variable Insurance Products Trust serves as an underlying investment vehicle.
dBenefit of expense reduction rounds to less than 0.01%.
eSee Note 1(f) regarding mortgage dollar rolls.
The accompanying notes are an integral part of these financial statements.
FSI-11
Franklin Templeton Variable Insurance Products Trust
Financial Highlights (continued)
Franklin Strategic Income Securities Fund
| | | | | | | | | | | | |
| | | Year Ended December 31, | |
| Class 4 | | 2010 | | | 2009 | | | 2008a | |
| | | | |
Per share operating performance | | | | | | | | | | | | |
(for a share outstanding throughout the year) | | | | | | | | | | | | |
Net asset value, beginning of year | | $ | 12.20 | | | $ | 10.54 | | | $ | 12.84 | |
| | | | |
Income from investment operationsb: | | | | | | | | | | | | |
Net investment incomec | | | 0.67 | | | | 0.66 | | | | 0.53 | |
Net realized and unrealized gains (losses) | | | 0.60 | | | | 1.94 | | | | (1.93 | ) |
| | | | |
Total from investment operations | | | 1.27 | | | | 2.60 | | | | (1.40 | ) |
| | | | |
Less distributions from: | | | | | | | | | | | | |
Net investment income and net foreign currency gains | | | (0.59 | ) | | | (0.94 | ) | | | (0.87 | ) |
Net realized gains | | | — | | | | — | | | | (0.03 | ) |
| | | | |
Total distributions | | | (0.59 | ) | | | (0.94 | ) | | | (0.90 | ) |
| | | | |
Net asset value, end of year | | $ | 12.88 | | | $ | 12.20 | | | $ | 10.54 | |
| | | | |
| | | |
Total returnd | | | 10.88% | | | | 25.52% | | | | (11.69)% | |
Ratios to average net assetse | | | | | | | | | | | | |
Expensesf | | | 0.94% | | | | 0.93% | | | | 0.96% | |
Net investment income | | | 5.36% | | | | 5.78% | | | | 5.48% | |
| | | |
Supplemental data | | | | | | | | | | | | |
Net assets, end of year (000’s) | | $ | 188,178 | | | $ | 162,074 | | | $ | 59,766 | |
Portfolio turnover rate | | | 56.46% | | | | 56.19% | | | | 47.68% | |
aFor the period February 29, 2008 (effective date) to December 31, 2008.
bThe amount shown for a share outstanding throughout the period may not correlate with the Statement of Operations for the period due to the timing of sales and repurchases of the Fund shares in relation to income earned and/or fluctuating market value of the investments of the Fund.
cBased on average daily shares outstanding.
dTotal return does not include fees, charges or expenses imposed by the variable annuity and life insurance contracts for which the Franklin Templeton Variable Insurance Products Trust serves as an underlying investment vehicle. Total return is not annualized for periods less than one year.
eRatios are annualized for periods less than one year.
fBenefit of expense reduction rounds to less than 0.01%.
The accompanying notes are an integral part of these financial statements.
FSI-12
Franklin Templeton Variable Insurance Products Trust
Statement of Investments, December 31, 2010
| | | | | | | | | | | | |
| Franklin Strategic Income Securities Fund | | Country | | | Shares | | | Value | |
Common Stocks 0.2% | | | | | | | | | | | | |
Consumer Durables & Apparel 0.0% | | | | | | | | | | | | |
a,bComfort Co. Inc. | | | United States | | | | 6,137 | | | $ | — | |
| | | | | | | | | | | | |
Consumer Services 0.1% | | | | | | | | | | | | |
a,c,d,eTurtle Bay Resort | | | United States | | | | 1,901,449 | | | | 1,901,449 | |
| | | | | | | | | | | | |
Media 0.1% | | | | | | | | | | | | |
aCharter Communications Inc., A | | | United States | | | | 7,456 | | | | 290,337 | |
aDex One Corp. | | | United States | | | | 40,000 | | | | 298,400 | |
| | | | | | | | | | | | |
| | | | | | | | | | | 588,737 | |
| | | | | | | | | | | | |
Total Common Stocks (Cost $3,539,029) | | | | | | | | | | | 2,490,186 | |
| | | | | | | | | | | | |
Convertible Preferred Stocks (Cost $2,200,000) 0.0%† | | | | | | | | | | | | |
Banks 0.0%† | | | | | | | | | | | | |
aFannie Mae, 8.75%, cvt. pfd. | | | United States | | | | 44,000 | | | | 26,400 | |
| | | | | | | | | | | | |
Preferred Stocks 0.1% | | | | | | | | | | | | |
Banks 0.0%† | | | | | | | | | | | | |
aFreddie Mac, 8.375%, pfd., Z | | | United States | | | | 70,000 | | | | 44,030 | |
| | | | | | | | | | | | |
Diversified Financials 0.1% | | | | | | | | | | | | |
fGMAC Inc., 7.00%, pfd., 144A, 7.00% | | | United States | | | | 804 | | | | 759,906 | |
| | | | | | | | | | | | |
Total Preferred Stocks (Cost $2,035,420) | | | | | | | | | | | 803,936 | |
| | | | | | | | | | | | |
| | | |
| | | | | | Principal
Amount* | | | | |
Corporate Bonds 36.6% | | | | | | | | | | | | |
Automobiles & Components 1.1% | | | | | | | | | | | | |
fConti-Gummi Finance BV, senior secured note, 144A, | | | | | | | | | | | | |
8.50%, 7/15/15 | | | Germany | | | | 1,500,000 | EUR | | | 2,182,205 | |
7.50%, 9/15/17 | | | Germany | | | | 1,000,000 | EUR | | | 1,386,243 | |
Ford Motor Credit Co. LLC, senior note, | | | | | | | | | | | | |
7.50%, 8/01/12 | | | United States | | | | 1,500,000 | | | | 1,590,000 | |
7.00%, 4/15/15 | | | United States | | | | 2,000,000 | | | | 2,151,212 | |
6.625%, 8/15/17 | | | United States | | | | 1,000,000 | | | | 1,052,396 | |
8.125%, 1/15/20 | | | United States | | | | 1,200,000 | | | | 1,398,395 | |
The Goodyear Tire & Rubber Co., senior note, 8.25%, 8/15/20 | | | United States | | | | 3,100,000 | | | | 3,224,000 | |
fTRW Automotive Inc., senior note, 144A, 7.25%, 3/15/17 | | | United States | | | | 2,900,000 | | | | 3,146,500 | |
| | | | | | | | | | | | |
| | | | | | | | | | | 16,130,951 | |
| | | | | | | | | | | | |
Banks 2.1% | | | | | | | | | | | | |
BB&T Capital Trust IV, junior sub. bond, 6.82%, 6/12/77 | | | United States | | | | 3,000,000 | | | | 2,997,968 | |
f,gBNP Paribas, 144A, 7.195% to 6/25/37, FRN thereafter, Perpetual | | | France | | | | 2,100,000 | | | | 2,026,500 | |
HSBC USA Inc., sub. note, 5.00%, 9/27/20 | | | United States | | | | 4,500,000 | | | | 4,364,145 | |
fLloyds TSB Bank PLC, | | | | | | | | | | | | |
144A, 5.80%, 1/13/20 | | | United Kingdom | | | | 3,500,000 | | | | 3,447,825 | |
senior sub. note, 144A, 6.50%, 9/14/20 | | | United Kingdom | | | | 1,000,000 | | | | 920,390 | |
Regions Bank, sub. note, 7.50%, 5/15/18 | | | United States | | | | 100,000 | | | | 103,145 | |
Regions Financial Corp., senior note, | | | | | | | | | | | | |
7.75%, 11/10/14 | | | United States | | | | 3,500,000 | | | | 3,643,010 | |
5.75%, 6/15/15 | | | United States | | | | 300,000 | | | | 293,909 | |
Royal Bank of Scotland Group PLC, senior note, 6.40%, 10/21/19 | | | United Kingdom | | | | 4,000,000 | | | | 4,028,600 | |
UBS AG Stamford, senior note, 5.875%, 12/20/17 | | | United States | | | | 3,000,000 | | | | 3,304,224 | |
Wells Fargo & Co., senior note, 5.625%, 12/11/17 | | | United States | | | | 1,500,000 | | | | 1,663,180 | |
gWells Fargo Capital XIII, pfd., 7.70% to 3/26/13, FRN thereafter, Perpetual | | | United States | | | | 2,000,000 | | | | 2,077,500 | |
FSI-13
Franklin Templeton Variable Insurance Products Trust
Statement of Investments, December 31, 2010 (continued)
| | | | | | | | | | | | |
| Franklin Strategic Income Securities Fund | | Country | | | Principal
Amount* | | | Value | |
Corporate Bonds (continued) | | | | | | | | | | | | |
Banks (continued) | | | | | | | | | | | | |
gWells Fargo Capital XV, pfd., 9.75% to 9/26/13, FRN thereafter, Perpetual | | | United States | | | | 2,300,000 | | | $ | 2,570,250 | |
| | | | | | | | | | | | |
| | | | | | | | | | | 31,440,646 | |
| | | | | | | | | | | | |
Capital Goods 1.3% | | | | | | | | | | | | |
fAbengoa Finance SAU, senior note, 144A, 8.875%, 11/01/17 | | | Spain | | | | 3,100,000 | | | | 2,953,711 | |
Arvinmeritor Inc., senior note, 10.625%, 3/15/18 | | | United States | | | | 3,000,000 | | | | 3,375,000 | |
Case New Holland Inc., senior note, 7.75%, 9/01/13 | | | United States | | | | 500,000 | | | | 540,000 | |
The Manitowoc Co. Inc., senior note, | | | | | | | | | | | | |
9.50%, 2/15/18 | | | United States | | | | 3,400,000 | | | | 3,740,000 | |
8.50%, 11/01/20 | | | United States | | | | 300,000 | | | | 320,250 | |
fPinafore LLC/Inc., senior secured note, 144A, 9.00%, 10/01/18 | | | United States | | | | 700,000 | | | | 759,500 | |
RBS Global & Rexnord Corp., senior note, 8.50%, 5/01/18 | | | United States | | | | 3,800,000 | | | | 4,056,500 | |
RSC Equipment Rental Inc. and RSC Holdings III LLC, senior note, 9.50%, 12/01/14 | | | United States | | | | 2,400,000 | | | | 2,532,000 | |
United Rentals North America Inc., senior sub. note, 8.375%, 9/15/20 | | | United States | | | | 900,000 | | | | 920,250 | |
| | | | | | | | | | | | |
| | | | | | | | | | | 19,197,211 | |
| | | | | | | | | | | | |
Commercial & Professional Services 0.2% | | | | | | | | | | | | |
hDiversey Holdings Inc., senior note, PIK, 10.50%, 5/15/20 | | | United States | | | | 2,400,000 | | | | 2,658,000 | |
fInteractive Data Corp., senior note, 144A, 10.25%, 8/01/18 | | | United States | | | | 700,000 | | | | 770,000 | |
| | | | | | | | | | | | |
| | | | | | | | | | | 3,428,000 | |
| | | | | | | | | | | | |
Consumer Durables & Apparel 0.7% | | | | | | | | | | | | |
Jarden Corp., senior sub. note, 7.50%, | | | | | | | | | | | | |
5/01/17 | | | United States | | | | 3,400,000 | | | | 3,599,750 | |
1/15/20 | | | United States | | | | 500,000 | | | | 517,500 | |
KB Home, senior note, | | | | | | | | | | | | |
6.25%, 6/15/15 | | | United States | | | | 2,900,000 | | | | 2,885,500 | |
7.25%, 6/15/18 | | | United States | | | | 500,000 | | | | 477,500 | |
fM/I Homes Inc., senior note, 144A, 8.625%, 11/15/18 | | | United States | | | | 2,300,000 | | | | 2,331,625 | |
| | | | | | | | | | | | |
| | | | | | | | | | | 9,811,875 | |
| | | | | | | | | | | | |
Consumer Services 3.0% | | | | | | | | | | | | |
fCirsa Funding Luxembourg SA, senior note, 144A, 8.75%, 5/15/18 | | | Spain | | | | 900,000 | EUR | | | 1,237,084 | |
CKE Restaurants Inc., senior secured note, 11.375%, 7/15/18 | | | United States | | | | 3,300,000 | | | | 3,671,250 | |
fClubCorp Club Operations Inc., senior note, 144A, 10.00%, 12/01/18 | | | United States | | | | 2,500,000 | | | | 2,387,500 | |
fCodere Finance SA, senior note, 144A, 8.25%, 6/15/15 | | | Spain | | | | 1,500,000 | EUR | | | 2,005,998 | |
f,iFontainebleau Las Vegas, 144A, 11.00%, 6/15/15 | | | United States | | | | 2,500,000 | | | | 21,250 | |
Harrah’s Operating Co. Inc., senior secured note, 11.25%, 6/01/17 | | | United States | | | | 6,000,000 | | | | 6,780,000 | |
fMarina District Finance Co. Inc., senior secured note, 144A, | | | | | | | | | | | | |
9.50%, 10/15/15 | | | United States | | | | 500,000 | | | | 493,750 | |
9.875%, 8/15/18 | | | United States | | | | 400,000 | | | | 396,000 | |
MGM Resorts International, senior note, 6.625%, 7/15/15 | | | United States | | | | 6,000,000 | | | | 5,527,500 | |
Norwegian Cruise Line Ltd., senior secured note, 11.75%, 11/15/16 | | | United States | | | | 3,000,000 | | | | 3,485,625 | |
Pinnacle Entertainment Inc.,
senior note, 8.625%, 8/01/17 | | | United States | | | | 2,400,000 | | | | 2,628,000 | |
senior sub. note, 7.50%, 6/15/15 | | | United States | | | | 1,000,000 | | | | 1,007,500 | |
Royal Caribbean Cruises Ltd., senior deb., 7.25%, 3/15/18 | | | United States | | | | 3,300,000 | | | | 3,514,500 | |
fShingle Springs Tribal Gaming Authority, senior note, 144A, 9.375%, 6/15/15 | | | United States | | | | 2,200,000 | | | | 1,529,000 | |
Starwood Hotels & Resorts Worldwide Inc., senior note, | | | | | | | | | | | | |
6.75%, 5/15/18 | | | United States | | | | 2,000,000 | | | | 2,200,000 | |
7.15%, 12/01/19 | | | United States | | | | 500,000 | | | | 555,000 | |
iStation Casinos Inc.,
senior note, 6.00%, 4/01/12 | | | United States | | | | 500,000 | | | | 50 | |
FSI-14
Franklin Templeton Variable Insurance Products Trust
Statement of Investments, December 31, 2010 (continued)
| | | | | | | | | | | | |
| Franklin Strategic Income Securities Fund | | Country | | | Principal
Amount* | | | Value | |
Corporate Bonds (continued) | | | | | | | | | | | | |
Consumer Services (continued) | | | | | | | | | | | | |
iStation Casinos Inc., (continued)
senior note, 7.75%, 8/15/16 | | | United States | | | | 1,000,000 | | | $ | 100 | |
senior sub. note, 6.50%, 2/01/14 | | | United States | | | | 300,000 | | | | 30 | |
senior sub. note, 6.875%, 3/01/16 | | | United States | | | | 1,000,000 | | | | 100 | |
Universal City Development,
senior note, 8.875%, 11/15/15 | | | United States | | | | 2,200,000 | | | | 2,348,500 | |
senior sub. note, 10.875%, 11/15/16 | | | United States | | | | 400,000 | | | | 439,000 | |
fVisant Corp., senior note, 144A, 10.00%, 10/01/17 | | | United States | | | | 3,800,000 | | | | 4,047,000 | |
| | | | | | | | | | | | |
| | | | | | | | | | | 44,274,737 | |
| | | | | | | | | | | | |
Diversified Financials 4.7% | | | | | | | | | | | | |
fAlly Financial Inc., senior bond, 144A, 7.50%, 9/15/20 | | | United States | | | | 500,000 | | | | 526,875 | |
Bank of America Corp.,
gpfd., sub. bond, M, 8.125% to 5/15/18, FRN thereafter, Perpetual | | | United States | | | | 5,000,000 | | | | 5,045,250 | |
senior note, 5.65%, 5/01/18 | | | United States | | | | 1,500,000 | | | | 1,534,941 | |
Capital One Capital VI, pfd., junior sub. bond, 8.875%, 5/15/40 | | | United States | | | | 3,000,000 | | | | 3,146,250 | |
CIT Group Inc., senior secured sub. bond, 7.00%, 5/01/17 | | | United States | | | | 4,500,000 | | | | 4,522,500 | |
Citigroup Inc.,
senior note, 6.125%, 11/21/17 | | | United States | | | | 1,500,000 | | | | 1,646,153 | |
senior note, 5.375%, 8/09/20 | | | United States | | | | 1,500,000 | | | | 1,561,428 | |
sub. note, 5.00%, 9/15/14 | | | United States | | | | 3,000,000 | | | | 3,106,038 | |
The Export-Import Bank of Korea, senior note, 8.125%, 1/21/14 | | | South Korea | | | | 2,770,000 | | | | 3,173,002 | |
General Electric Capital Corp., senior note, A, 8.50%, 4/06/18 | | | United States | | | | 64,000,000 | MXN | | | 4,739,060 | |
GMAC Inc.,
senior note, 7.25%, 3/02/11 | | | United States | | | | 1,000,000 | | | | 1,010,000 | |
senior note, 6.875%, 9/15/11 | | | United States | | | | 1,400,000 | | | | 1,443,750 | |
senior note, 6.875%, 8/28/12 | | | United States | | | | 2,000,000 | | | | 2,100,000 | |
sub. note, 8.00%, 12/31/18 | | | United States | | | | 1,000,000 | | | | 1,067,500 | |
The Goldman Sachs Group Inc., senior bond, 5.375%, 3/15/20 | | | United States | | | | 4,500,000 | | | | 4,658,539 | |
International Lease Finance Corp., | | | | | | | | | | | | |
senior note, 8.25%, 12/15/20 | | | United States | | | | 900,000 | | | | 928,125 | |
fsenior secured note, 144A, 6.75%, 9/01/16 | | | United States | | | | 4,000,000 | | | | 4,290,000 | |
JPMorgan Chase & Co.,
6.00%, 1/15/18 | | | United States | | | | 1,500,000 | | | | 1,677,547 | |
gjunior sub. note, 1, 7.90% to 4/30/18, FRN thereafter, Perpetual | | | United States | | | | 1,800,000 | | | | 1,919,828 | |
senior note, 4.25%, 10/15/20 | | | United States | | | | 1,000,000 | | | | 978,581 | |
JPMorgan Chase Capital XXII, sub. bond, 6.45%, 2/02/37 | | | United States | | | | 4,000,000 | | | | 4,006,581 | |
fKKR Group Finance Co., senior note, 144A, 6.375%, 9/29/20 | | | United States | | | | 4,000,000 | | | | 3,990,048 | |
Merrill Lynch & Co. Inc., senior note, 6.40%, 8/28/17 | | | United States | | | | 3,000,000 | | | | 3,176,106 | |
Moody’s Corp., senior note, 5.50%, 9/01/20 | | | United States | | | | 3,500,000 | | | | 3,464,125 | |
Morgan Stanley, senior note,
6.00%, 4/28/15 | | | United States | | | | 4,000,000 | | | | 4,336,140 | |
5.50%, 7/24/20 | | | United States | | | | 500,000 | | | | 506,069 | |
fTransUnion LLC/TransUnion Corp., senior note, 144A, 11.375%, 6/15/18 | | | United States | | | | 1,000,000 | | | | 1,145,000 | |
| | | | | | | | | | | | |
| | | | | | | | | | | 69,699,436 | |
| | | | | | | | | | | | |
Energy 6.7% | | | | | | | | | | | | |
Anadarko Petroleum Corp., senior note, 8.70%, 3/15/19 | | | United States | | | | 3,000,000 | | | | 3,669,210 | |
Antero Resources Finance, senior note, 9.375%, 12/01/17 | | | United States | | | | 3,000,000 | | | | 3,153,750 | |
Berry Petroleum Co., senior note,
10.25%, 6/01/14 | | | United States | | | | 2,200,000 | | | | 2,535,500 | |
6.75%, 11/01/20 | | | United States | | | | 300,000 | | | | 302,250 | |
fCarrizo Oil & Gas Inc., senior note, 144A, 8.625%, 10/15/18 | | | United States | | | | 1,000,000 | | | | 1,035,000 | |
fChaparral Energy Inc., senior note, 144A, 9.875%, 10/01/20 | | | United States | | | | 2,400,000 | | | | 2,538,000 | |
fCHC Helicopter SA, senior secured note, 144A, 9.25%, 10/15/20 | | | Canada | | | | 4,400,000 | | | | 4,576,000 | |
FSI-15
Franklin Templeton Variable Insurance Products Trust
Statement of Investments, December 31, 2010 (continued)
| | | | | | | | | | | | |
| Franklin Strategic Income Securities Fund | | Country | | | Principal
Amount* | | | Value | |
Corporate Bonds (continued) | | | | | | | | | | | | |
Energy (continued) | | | | | | | | | | | | |
Chesapeake Energy Corp., senior note,
7.625%, 7/15/13 | | | United States | | | | 700,000 | | | $ | 762,125 | |
7.25%, 12/15/18 | | | United States | | | | 300,000 | | | | 311,625 | |
6.625%, 8/15/20 | | | United States | | | | 3,300,000 | | | | 3,267,000 | |
Compagnie Generale de Geophysique-Veritas, senior note,
7.50%, 5/15/15 | | | France | | | | 2,300,000 | | | | 2,351,750 | |
9.50%, 5/15/16 | | | France | | | | 100,000 | | | | 109,500 | |
7.75%, 5/15/17 | | | France | | | | 1,800,000 | | | | 1,854,000 | |
fConsol Energy Inc., senior note, 144A,
8.00%, 4/01/17 | | | United States | | | | 1,800,000 | | | | 1,926,000 | |
8.25%, 4/01/20 | | | United States | | | | 800,000 | | | | 868,000 | |
Copano Energy LLC, senior note,
8.125%, 3/01/16 | | | United States | | | | 3,500,000 | | | | 3,622,500 | |
7.75%, 6/01/18 | | | United States | | | | 200,000 | | | | 205,000 | |
Crosstex Energy LP/Crosstex Energy Finance Corp., senior note, 8.875%, 2/15/18 | | | United States | | | | 3,500,000 | | | | 3,766,875 | |
El Paso Corp., senior note,
7.00%, 6/15/17 | | | United States | | | | 1,000,000 | | | | 1,060,315 | |
f144A, 6.50%, 9/15/20 | | | United States | | | | 2,300,000 | | | | 2,323,000 | |
Energy Transfer Equity LP, senior note, 7.50%, 10/15/20 | | | United States | | | | 2,500,000 | | | | 2,587,500 | |
fEnergy XXI Gulf Coast Inc., senior note, 144A, 9.25%, 12/15/17 | | | United States | | | | 3,500,000 | | | | 3,648,750 | |
jEnterprise Products Operating LLC, junior sub. note, FRN, 7.034%, 1/15/68 | | | United States | | | | 2,000,000 | | | | 2,077,864 | |
fExpro Finance Luxembourg, senior secured note, 144A, 8.50%, 12/15/16 | | | United Kingdom | | | | 4,000,000 | | | | 3,864,581 | |
fGaz Capital SA, senior note, 144A, 5.092%, 11/29/15 | | | Russia | | | | 2,240,000 | | | | 2,303,582 | |
General Maritime Corp., senior note, 12.00%, 11/15/17 | | | United States | | | | 800,000 | | | | 776,000 | |
Holly Corp., senior note, 9.875%, 6/15/17 | | | United States | | | | 1,900,000 | | | | 2,080,500 | |
fLinn Energy Corp., senior note, 144A,
8.625%, 4/15/20 | | | United States | | | | 3,000,000 | | | | 3,247,500 | |
7.75%, 2/01/21 | | | United States | | | | 1,000,000 | | | | 1,030,000 | |
MarkWest Energy Partners LP/Finance Corp., senior note, 6.75%, 11/01/20 | | | United States | | | | 2,500,000 | | | | 2,512,500 | |
Martin Midstream Partners LP, senior note, 8.875%, 4/01/18 | | | United States | | | | 2,300,000 | | | | 2,380,500 | |
fOPTI Canada Inc., senior secured note, 144A,
9.00%, 12/15/12 | | | Canada | | | | 1,000,000 | | | | 1,007,500 | |
9.75%, 8/15/13 | | | Canada | | | | 1,200,000 | | | | 1,206,000 | |
Peabody Energy Corp., senior note,
7.375%, 11/01/16 | | | United States | | | | 500,000 | | | | 557,500 | |
6.50%, 9/15/20 | | | United States | | | | 2,500,000 | | | | 2,681,250 | |
Petrohawk Energy Corp., senior note,
10.50%, 8/01/14 | | | United States | | | | 3,300,000 | | | | 3,774,375 | |
7.25%, 8/15/18 | | | United States | | | | 200,000 | | | | 203,000 | |
Petroleos de Venezuela SA, senior bond, zero cpn., 7/10/11 | | | Venezuela | | | | 6,625,000 | | | | 6,320,754 | |
fPetroplus Finance Ltd., senior note, 144A, 6.75%, 5/01/14 | | | Switzerland | | | | 2,100,000 | | | | 1,942,500 | |
Plains Exploration & Production Co., senior note,
7.75%, 6/15/15 | | | United States | | | | 500,000 | | | | 523,750 | |
10.00%, 3/01/16 | | | United States | | | | 500,000 | | | | 561,250 | |
7.625%, 6/01/18 | | | United States | | | | 3,200,000 | | | | 3,372,000 | |
Pride International Inc., senior note, 6.875%, 8/15/20 | | | United States | | | | 500,000 | | | | 521,250 | |
Quicksilver Resources Inc., senior note,
8.25%, 8/01/15 | | | United States | | | | 3,500,000 | | | | 3,648,750 | |
11.75%, 1/01/16 | | | United States | | | | 100,000 | | | | 117,000 | |
9.125%, 8/15/19 | | | United States | | | | 300,000 | | | | 330,750 | |
FSI-16
Franklin Templeton Variable Insurance Products Trust
Statement of Investments, December 31, 2010 (continued)
| | | | | | | | | | | | |
| Franklin Strategic Income Securities Fund | | Country | | | Principal
Amount* | | | Value | |
Corporate Bonds (continued) | | | | | | | | | | | | |
Energy (continued) | | | | | | | | | | | | |
SandRidge Energy Inc., senior note,
8.75%, 1/15/20 | | | United States | | | | 500,000 | | | $ | 516,250 | |
f144A, 8.00%, 6/01/18 | | | United States | | | | 3,500,000 | | | | 3,570,000 | |
fVantage Drilling Co., senior secured note, 144A, 11.50%, 8/01/15 | | | United States | | | | 1,800,000 | | | | 1,962,000 | |
| | | | | | | | | | | | |
| | | | | | | | | | | 99,562,556 | |
| | | | | | | | | | | | |
Food & Staples Retailing 0.3% | | | | | | | | | | | | |
Rite Aid Corp., senior secured note,
9.75%, 6/12/16 | | | United States | | | | 2,700,000 | | | | 2,986,875 | |
8.00%, 8/15/20 | | | United States | | | | 1,000,000 | | | | 1,046,250 | |
| | | | | | | | | | | | |
| | | | | | | | | | | 4,033,125 | |
| | | | | | | | | | | | |
Food, Beverage & Tobacco 1.0% | | | | | | | | | | | | |
fCampofrio Food Group SA, senior note, 144A, 8.25%, 10/31/16 | | | Spain | | | | 1,600,000 | EUR | | | 2,209,952 | |
fCEDC Finance Corp. International Inc., senior secured note, 144A, 9.125%, 12/01/16 | | | United States | | | | 2,100,000 | | | | 2,241,750 | |
Cott Beverages Inc., senior note, 8.375%, 11/15/17 | | | United States | | | | 1,500,000 | | | | 1,627,500 | |
fDean Foods Co., senior note, 144A, 9.75%, 12/15/18 | | | United States | | | | 2,100,000 | | | | 2,126,250 | |
JBS USA LLC, senior note, 11.625%, 5/01/14 | | | United States | | | | 3,000,000 | | | | 3,517,500 | |
Pinnacle Foods Finance LLC, senior note, 9.25%, 4/01/15 | | | United States | | | | 3,000,000 | | | | 3,138,750 | |
| | | | | | | | | | | | |
| | | | | | | | | | | 14,861,702 | |
| | | | | | | | | | | | |
Health Care Equipment & Services 2.0% | | | | | | | | | | | | |
Boston Scientific Corp., senior note, 6.00%, 1/15/20 | | | United States | | | | 4,000,000 | | | | 4,176,856 | |
Coventry Health Care Inc., senior note,
6.30%, 8/15/14 | | | United States | | | | 1,000,000 | | | | 1,056,785 | |
5.95%, 3/15/17 | | | United States | | | | 2,000,000 | | | | 2,035,980 | |
DaVita Inc., senior note,
6.375%, 11/01/18 | | | United States | | | | 1,000,000 | | | | 997,500 | |
6.625%, 11/01/20 | | | United States | | | | 800,000 | | | | 794,000 | |
FMC Finance III SA, senior note, 6.875%, 7/15/17 | | | Germany | | | | 2,500,000 | | | | 2,662,500 | |
fFresenius US Finance II, senior note, 144A, 9.00%, 7/15/15 | | | Germany | | | | 1,000,000 | | | | 1,150,000 | |
HCA Inc., senior note, 6.50%, 2/15/16 | | | United States | | | | 800,000 | | | | 786,000 | |
senior secured bond, 7.25%, 9/15/20 | | | United States | | | | 300,000 | | | | 315,000 | |
senior secured note, 9.125%, 11/15/14 | | | United States | | | | 4,000,000 | | | | 4,205,000 | |
ksenior secured note, PIK, 9.625%, 11/15/16 | | | United States | | | | 2,000,000 | | | | 2,147,500 | |
Tenet Healthcare Corp., senior secured note,
9.00%, 5/01/15 | | | United States | | | | 1,150,000 | | | | 1,282,250 | |
10.00%, 5/01/18 | | | United States | | | | 1,700,000 | | | | 1,989,000 | |
kUnited Surgical Partners International Inc., senior sub. note, PIK, 9.25%, 5/01/17 | | | United States | | | | 3,000,000 | | | | 3,135,000 | |
Vanguard Health Holding Co. II LLC, senior note, 8.00%, 2/01/18 | | | United States | | | | 3,000,000 | | | | 3,090,000 | |
| | | | | | | | | | | | |
| | | | | | | | | | | 29,823,371 | |
| | | | | | | | | | | | |
Insurance 0.3% | | | | | | | | | | | | |
Aflac Inc., senior note, 6.45%, 8/15/40 | | | United States | | | | 2,200,000 | | | | 2,260,713 | |
jMetLife Inc., junior sub. note, FRN, 6.40%, 12/15/66 | | | United States | | | | 2,000,000 | | | | 1,911,349 | |
| | | | | | | | | | | | |
| | | | | | | | | | | 4,172,062 | |
| | | | | | | | | | | | |
Materials 2.5% | | | | | | | | | | | | |
fArdagh Packaging Finance PLC,
senior note, 144A, 9.125%, 10/15/20 | | | Ireland | | | | 700,000 | | | | 731,500 | |
senior secured note, 144A, 7.375%, 10/15/17 | | | Ireland | | | | 300,000 | | | | 312,000 | |
fAtkore International Inc., senior secured note, 144A, 9.875%, 1/01/18 | | | United States | | | | 1,200,000 | | | | 1,254,000 | |
FSI-17
Franklin Templeton Variable Insurance Products Trust
Statement of Investments, December 31, 2010 (continued)
| | | | | | | | | | | | |
| Franklin Strategic Income Securities Fund | | Country | | | Principal
Amount* | | | Value | |
Corporate Bonds (continued) | | | | | | | | | | | | |
Materials (continued) | | | | | | | | | | | | |
Ball Corp., senior note,
7.125%, 9/01/16 | | | United States | | | | 500,000 | | | $ | 541,250 | |
7.375%, 9/01/19 | | | United States | | | | 500,000 | | | | 540,000 | |
fBuilding Materials Corp. of America, senior note, 144A,
6.875%, 8/15/18 | | | United States | | | | 2,000,000 | | | | 1,990,000 | |
7.50%, 3/15/20 | | | United States | | | | 1,300,000 | | | | 1,329,250 | |
fFMG Finance Pty. Ltd., senior note, 144A, 7.00%, 11/01/15 | | | Australia | | | | 1,200,000 | | | | 1,227,000 | |
fFMG Resources Aug 2006, senior note, 144A, 6.875%, 2/01/18 | | | Australia | | | | 2,000,000 | | | | 2,000,000 | |
Huntsman International LLC,
senior note, 5.50%, 6/30/16 | | | United States | | | | 200,000 | | | | 194,500 | |
fsenior sub. note, 144A, 8.625%, 3/15/21 | | | United States | | | | 500,000 | | | | 542,500 | |
fIneos Finance PLC, senior secured note, 144A, 9.25%, 5/15/15 | | | United Kingdom | | | | 100,000 | EUR | | | 143,132 | |
fIneos Group Holdings PLC, senior secured note, 144A, 8.50%, 2/15/16 | | | United Kingdom | | | | 3,500,000 | | | | 3,351,250 | |
fKerling PLC, senior secured note, 144A, 10.625%, 1/28/17 | | | United Kingdom | | | | 2,900,000 | EUR | | | 4,257,724 | |
fMacDermid Inc., senior sub. note, 144A, 9.50%, 4/15/17 | | | United States | | | | 3,400,000 | | | | 3,604,000 | |
NewPage Corp., senior secured note, 11.375%, 12/31/14 | | | United States | | | | 4,000,000 | | | | 3,780,000 | |
fNovelis Inc., senior note, 144A, 8.75%, 12/15/20 | | | India | | | | 1,600,000 | | | | 1,668,000 | |
fReynolds Group Issuer Inc./LLC/SA, senior note, 144A,
8.50%, 5/15/18 | | | United States | | | | 4,000,000 | | | | 4,040,000 | |
9.00%, 4/15/19 | | | United States | | | | 300,000 | | | | 312,375 | |
Solo Cup Co.,
senior secured note, 10.50%, 11/01/13 | | | United States | | | | 500,000 | | | | 525,000 | |
senior sub. note, 8.50%, 2/15/14 | | | United States | | | | 2,300,000 | | | | 2,081,500 | |
fTPC Group LLC, senior secured note, 144A, 8.25%, 10/01/17 | | | United States | | | | 1,200,000 | | | | 1,260,000 | |
fXstrata Finance Canada Ltd., 144A, 5.80%, 11/15/16 | | | United Kingdom | | | | 1,500,000 | | | | 1,647,466 | |
| | | | | | | | | | | | |
| | | | | | | | | | | 37,332,447 | |
| | | | | | | | | | | | |
Media 3.4% | | | | | | | | | | | | |
Cablevision Systems Corp., senior note, 8.625%, 9/15/17 | | | United States | | | | 500,000 | | | | 546,875 | |
CCH II LLC/CCH II Capital Corp., senior note, 13.50%, 11/30/16 | | | United States | | | | 3,713,498 | | | | 4,446,914 | |
CCO Holdings LLC, senior note, 8.125%, 4/30/20 | | | United States | | | | 900,000 | | | | 951,750 | |
Clear Channel Worldwide Holdings Inc., senior note, A,
9.25%, 12/15/17 | | | United States | | | | 400,000 | | | | 437,000 | |
B, 9.25%, 12/15/17 | | | United States | | | | 1,600,000 | | | | 1,760,000 | |
CSC Holdings Inc., senior deb., 7.625%, 7/15/18 | | | United States | | | | 2,100,000 | | | | 2,289,000 | |
DIRECTV Holdings LLC/DIRECTV Financing Co. Inc., senior note, 4.60%, 2/15/21 | | | United States | | | | 4,500,000 | | | | 4,450,356 | |
EchoStar DBS Corp., senior note,
7.75%, 5/31/15 | | | United States | | | | 1,500,000 | | | | 1,601,250 | |
7.125%, 2/01/16 | | | United States | | | | 4,000,000 | | | | 4,150,000 | |
Lamar Media Corp.,
senior note, 9.75%, 4/01/14 | | | United States | | | | 300,000 | | | | 346,500 | |
senior sub. note, 7.875%, 4/15/18 | | | United States | | | | 1,300,000 | | | | 1,387,750 | |
senior sub. note, B, 6.625%, 8/15/15 | | | United States | | | | 400,000 | | | | 408,000 | |
Media General Inc., senior secured note, 11.75%, 2/15/17 | | | United States | | | | 2,000,000 | | | | 2,112,500 | |
fMyriad International Holding BV, senior note, 144A, 6.375%, 7/28/17 | | | South Africa | | | | 1,700,000 | | | | 1,800,184 | |
f,kRadio One Inc., senior sub. note, 144A, PIK, 15.00%, 5/24/16 | | | United States | | | | 2,661,911 | | | | 2,624,327 | |
fSeat Pagine Gialle SpA, senior secured note, 144A, 10.50%, 1/31/17 | | | Italy | | | | 2,600,000 | EUR | | | 2,930,342 | |
Time Warner Inc.,
7.625%, 4/15/31 | | | United States | | | | 3,200,000 | | | | 3,901,098 | |
6.10%, 7/15/40 | | | United States | | | | 1,000,000 | | | | 1,052,961 | |
fUnivision Communications Inc., senior secured note, 144A, 7.875%, 11/01/20 | | | United States | | | | 2,000,000 | | | | 2,110,000 | |
fUPC Germany GmbH, senior secured note, 144A, 9.625%, 12/01/19 | | | Germany | | | | 700,000 | EUR | | | 1,027,726 | |
FSI-18
Franklin Templeton Variable Insurance Products Trust
Statement of Investments, December 31, 2010 (continued)
| | | | | | | | | | | | |
| Franklin Strategic Income Securities Fund | | Country | | | Principal
Amount* | | | Value | |
Corporate Bonds (continued) | | | | | | | | | | | | |
Media (continued) | | | | | | | | | | | | |
fUPC Holding BV, senior note, 144A, 9.875%, 4/15/18 | | | Netherlands | | | | 1,200,000 | | | $ | 1,320,000 | |
Virgin Media Secured Finance, senior secured note, 6.50%, 1/15/18 | | | United Kingdom | | | | 1,800,000 | | | | 1,903,500 | |
WMG Acquisition Corp., senior secured note, 9.50%, 6/15/16 | | | United States | | | | 3,500,000 | | | | 3,771,250 | |
fZiggo Bond Co., senior bond, 144A, 8.00%, 5/15/18 | | | Netherlands | | | | 2,500,000 | EUR | | | 3,458,641 | |
| | | | | | | | | | | | |
| | | | | | | | | | | 50,787,924 | |
| | | | | | | | | | | | |
Pharmaceuticals, Biotechnology & Life Sciences 0.3% | | | | | | | | | | | | |
fEndo Pharmaceuticals Holdings Inc., senior note, 144A, 7.00%, 12/15/20 | | | United States | | | | 900,000 | | | | 922,500 | |
fMylan Inc., senior note, 144A,
6.00%, 11/15/18 | | | United States | | | | 600,000 | | | | 591,000 | |
7.875%, 7/15/20 | | | United States | | | | 3,500,000 | | | | 3,788,750 | |
| | | | | | | | | | | | |
| | | | | | | | | | | 5,302,250 | |
| | | | | | | | | | | | |
Real Estate 0.5% | | | | | | | | | | | | |
Digital Realty Trust LP, 5.875%, 2/01/20 | | | United States | | | | 3,000,000 | | | | 3,057,393 | |
Forest City Enterprises Inc., senior note, 7.625%, 6/01/15 | | | United States | | | | 3,100,000 | | | | 2,914,000 | |
Simon Property Group LP, senior note, 4.375%, 3/01/21 | | | United States | | | | 2,000,000 | | | | 1,980,480 | |
| | | | | | | | | | | | |
| | | | | | | | | | | 7,951,873 | |
| | | | | | | | | | | | |
Retailing 0.7% | | | | | | | | | | | | |
Dollar General Corp., senior note, 10.625%, 7/15/15 | | | United States | | | | 2,000,000 | | | | 2,185,000 | |
f,jEdcon Proprietary Ltd., senior secured note, 144A, FRN, 4.276%, 6/15/14 | | | South Africa | | | | 3,500,000 | EUR | | | 3,979,807 | |
fMichaels Stores Inc., senior note, 144A, 7.75%, 11/01/18 | | | United States | | | | 3,100,000 | | | | 3,107,750 | |
fPetco Animal Supplies Inc., senior note, 144A, 9.25%, 12/01/18 | | | United States | | | | 1,200,000 | | | | 1,270,500 | |
| | | | | | | | | | | | |
| | | | | | | | | | | 10,543,057 | |
| | | | | | | | | | | | |
Semiconductors & Semiconductor Equipment 0.4% | | | | | | | | | | | | |
Advanced Micro Devices Inc., senior note,
8.125%, 12/15/17 | | | United States | | | | 800,000 | | | | 852,000 | |
f144A, 7.75%, 8/01/20 | | | United States | | | | 400,000 | | | | 417,000 | |
Freescale Semiconductor Inc., senior note,
8.875%, 12/15/14 | | | United States | | | | 2,000,000 | | | | 2,100,000 | |
10.125%, 12/15/16 | | | United States | | | | 100,000 | | | | 105,750 | |
f144A, 10.75%, 8/01/20 | | | United States | | | | 2,000,000 | | | | 2,195,000 | |
fNXP BV/NXP Funding LLC, senior secured note, 144A, 9.75%, 8/01/18 | | | Netherlands | | | | 900,000 | | | | 1,004,063 | |
| | | | | | | | | | | | |
| | | | | | | | | | | 6,673,813 | |
| | | | | | | | | | | | |
Software & Services 0.4% | | | | | | | | | | | | |
fSitel LLC, senior note, 144A, 11.50%, 4/01/18 | | | United States | | | | 3,000,000 | | | | 2,490,000 | |
SunGard Data Systems Inc.,
fsenior note, 144A, 7.625%, 11/15/20 | | | United States | | | | 2,500,000 | | | | 2,543,750 | |
senior sub. note, 10.25%, 8/15/15 | | | United States | | | | 800,000 | | | | 843,000 | |
| | | | | | | | | | | | |
| | | | | | | | | | | 5,876,750 | |
| | | | | | | | | | | | |
Technology Hardware & Equipment 0.3% | | | | | | | | | | | | |
Sanmina-SCI Corp.,
f,jsenior note, 144A, FRN, 3.052%, 6/15/14 | | | United States | | | | 500,000 | | | | 475,000 | |
senior sub. note, 6.75%, 3/01/13 | | | United States | | | | 2,300,000 | | | | 2,305,750 | |
senior sub. note, 8.125%, 3/01/16 | | | United States | | | | 1,000,000 | | | | 1,015,000 | |
ViaSat Inc., senior note, 8.875%, 9/15/16 | | | United States | | | | 700,000 | | | | 749,000 | |
| | | | | | | | | | | | |
| | | | | | | | | | | 4,544,750 | |
| | | | | | | | | | | | |
Telecommunication Services 2.4% | | | | | | | | | | | | |
fCricket Communications Inc., senior note, 144A, 7.75%, 10/15/20 | | | United States | | | | 4,000,000 | | | | 3,820,000 | |
Crown Castle International Corp.,
senior bond, 7.125%, 11/01/19 | | | United States | | | | 200,000 | | | | 212,500 | |
FSI-19
Franklin Templeton Variable Insurance Products Trust
Statement of Investments, December 31, 2010 (continued)
| | | | | | | | | | | | |
| Franklin Strategic Income Securities Fund | | Country | | | Principal
Amount* | | | Value | |
Corporate Bonds (continued) | | | | | | | | | | | | |
Telecommunication Services 2.4% | | | | | | | | | | | | |
Crown Castle International Corp., (continued)
senior note, 9.00%, 1/15/15 | | | United States | | | | 3,000,000 | | | $ | 3,322,500 | |
fDigicel Group Ltd., senior note, 144A,
8.875%, 1/15/15 | | | Jamaica | | | | 3,700,000 | | | | 3,755,500 | |
8.25%, 9/01/17 | | | Jamaica | | | | 300,000 | | | | 309,000 | |
Frontier Communications Corp., senior note,
8.25%, 4/15/17 | | | United States | | | | 600,000 | | | | 661,500 | |
8.50%, 4/15/20 | | | United States | | | | 2,000,000 | | | | 2,195,000 | |
8.75%, 4/15/22 | | | United States | | | | 1,400,000 | | | | 1,533,000 | |
fIntegra Telecom Inc., senior secured note, 144A, 10.75%, 4/15/16 | | | United States | | | | 1,700,000 | | | | 1,768,000 | |
Intelsat Bermuda Ltd., senior note, 11.25%, 6/15/16 | | | Luxembourg | | | | 3,000,000 | | | | 3,247,500 | |
Intelsat Subsidiary Holding Co. Ltd., senior note, 8.50%, 1/15/13 | | | Luxembourg | | | | 3,500,000 | | | | 3,521,875 | |
MetroPCS Wireless Inc., senior note, 7.875%, 9/01/18 | | | United States | | | | 2,000,000 | | | | 2,085,000 | |
Sprint Nextel Corp., senior note, 8.375%, 8/15/17 | | | United States | | | | 4,000,000 | | | | 4,310,000 | |
fSunrise Communications Holdings, senior note, 144A, 8.50%, 12/31/18 | | | Luxembourg | | | | 600,000 | EUR | | | 843,585 | |
fWest Corp., senior note, 144A, 7.875%, 1/15/19 | | | United States | | | | 2,600,000 | | | | 2,652,000 | |
f,kWind Acquisition Holdings Finance SA, senior secured note, 144A, PIK, 12.25%, 7/15/17 | | | Italy | | | | 535,729 | EUR | | | 775,628 | |
| | | | | | | | | | | | |
| | | | | | | | | | | 35,012,588 | |
| | | | | | | | | | | | |
Transportation 0.3% | | | | | | | | | | | | |
fCeva Group PLC, senior secured note, 144A,
11.625%, 10/01/16 | | | United Kingdom | | | | 200,000 | | | | 217,678 | |
8.375%, 12/01/17 | | | United Kingdom | | | | 500,000 | | | | 504,687 | |
11.50%, 4/01/18 | | | United Kingdom | | | | 2,900,000 | | | | 3,166,812 | |
| | | | | | | | | | | | |
| | | | | | | | | | | 3,889,177 | |
| | | | | | | | | | | | |
Utilities 2.0% | | | | | | | | | | | | |
Ameren Corp., senior note, 8.875%, 5/15/14 | | | United States | | | | 1,600,000 | | | | 1,801,594 | |
fCalpine Corp., senior secured note, 144A,
7.875%, 7/31/20 | | | United States | | | | 1,100,000 | | | | 1,119,250 | |
7.50%, 2/15/21 | | | United States | | | | 2,500,000 | | | | 2,475,000 | |
CenterPoint Energy Inc., senior note,
6.125%, 11/01/17 | | | United States | | | | 1,500,000 | | | | 1,676,426 | |
6.50%, 5/01/18 | | | United States | | | | 1,000,000 | | | | 1,115,062 | |
CMS Energy Corp., senior note, 8.75%, 6/15/19 | | | United States | | | | 2,500,000 | | | | 2,953,030 | |
Dynegy Holdings Inc., senior note, 8.375%, 5/01/16 | | | United States | | | | 3,000,000 | | | | 2,257,500 | |
fInfinis PLC, senior note, 144A, 9.125%, 12/15/14 | | | United Kingdom | | | | 600,000 | GBP | | | 987,965 | |
fIntergen NV, senior secured note, 144A, 9.00%, 6/30/17 | | | Netherlands | | | | 4,000,000 | | | | 4,260,000 | |
fKinder Morgan Finance Co. ULC, secured senior note, 144A, 6.00%, 1/15/18 | | | United States | | | | 2,100,000 | | | | 2,073,750 | |
NRG Energy Inc., senior note,
7.25%, 2/01/14 | | | United States | | | | 200,000 | | | | 204,500 | |
7.375%, 2/01/16 | | | United States | | | | 4,500,000 | | | | 4,623,750 | |
fTexas Competitive Electric Holdings Co. LLC/Texas Competitive Electric Holdings Finance Inc., senior secured note, 144A, 15.00%, 4/01/21 | | | United States | | | | 2,130,000 | | | | 1,927,650 | |
Texas Competitive Electric Holdings Co. LLC, senior note, A, 10.25%, 11/01/15 | | | United States | | | | 3,000,000 | | | | 1,672,500 | |
| | | | | | | | | | | | |
| | | | | | | | | | | 29,147,977 | |
| | | | | | | | | | | | |
Total Corporate Bonds (Cost $514,465,058) | | | | | | | | | | | 543,498,278 | |
| | | | | | | | | | | | |
FSI-20
Franklin Templeton Variable Insurance Products Trust
Statement of Investments, December 31, 2010 (continued)
| | | | | | | | | | | | |
| Franklin Strategic Income Securities Fund | | Country | | | Principal
Amount* | | | Value | |
j,lSenior Floating Rate Interests 15.7% | | | | | | | | | | | | |
Automobiles & Components 0.6% | | | | | | | | | | | | |
Federal-Mogul Corp.,
Term Loan B, 2.198% - 2.208%, 12/27/14 | | | United States | | | | 6,835,703 | | | $ | 6,392,606 | |
Term Loan C, 2.198% - 2.208%, 12/27/15 | | | United States | | | | 1,742,379 | | | | 1,629,436 | |
Key Safety Systems Inc., Term Loan B, 2.518% - 2.521%, 3/10/14 | | | United States | | | | 1,612,974 | | | | 1,508,131 | |
| | | | | | | | | | | | |
| | | | | | | | | | | 9,530,173 | |
| | | | | | | | | | | | |
Capital Goods 0.8% | | | | | | | | | | | | |
Pinafore LLC/Inc., Term Loan B, 6.25%, 9/21/16 | | | United States | | | | 2,549,280 | | | | 2,588,203 | |
RBS Global Inc. (Rexnord),
Incremental Tranche B-2, 2.563%, 7/22/13 | | | United States | | | | 2,308,822 | | | | 2,257,836 | |
Tranche B-1 Term B Loan, 2.813%, 7/22/13 | | | United States | | | | 4,561,406 | | | | 4,502,966 | |
Transdigm Inc., Term Loan, 5.00%, 12/06/16 | | | United States | | | | 2,258,123 | | | | 2,284,234 | |
| | | | | | | | | | | | |
| | | | | | | | | | | 11,633,239 | |
| | | | | | | | | | | | |
Commercial & Professional Services 0.7% | | | | | | | | | | | | |
ARAMARK Corp.,
Extended Synthetic L/C, 3.361%, 7/26/16 | | | United States | | | | 161,807 | | | | 161,919 | |
Synthetic L/C, 1.986%, 1/26/14 | | | United States | | | | 130,799 | | | | 129,947 | |
Term Loan B, 2.178%, 1/26/14 | | | United States | | | | 1,623,664 | | | | 1,613,080 | |
Term Loan B Extended, 3.553%, 7/26/16 | | | United States | | | | 2,460,379 | | | | 2,462,086 | |
Diversey Inc., Tranche B Dollar Term Loan, 5.25%, 11/24/15 | | | United States | | | | 1,982,771 | | | | 2,001,360 | |
i,kEnviroSolutions Inc., Initial Term Loan, PIK, 4.75%, 7/07/12 | | | United States | | | | 1,627,616 | | | | 1,180,022 | |
mInteractive Data Corp., Term Loan B, 6.75%, 1/29/17 | | | United States | | | | 2,427,489 | | | | 2,465,409 | |
| | | | | | | | | | | | |
| | | | | | | | | | | 10,013,823 | |
| | | | | | | | | | | | |
Consumer Durables & Apparel 0.3% | | | | | | | | | | | | |
Jarden Corp.,
Term Loan B4, 3.553%, 1/26/15 | | | United States | | | | 2,004,753 | | | | 2,020,416 | |
Term Loan B5, 3.553%, 1/25/15 | | | United States | | | | 1,121,154 | | | | 1,129,914 | |
b,kSleep Innovations Inc., Term Loan, PIK, 11.50%, 3/05/15 | | | United States | | | | 833,328 | | | | 835,411 | |
| | | | | | | | | | | | |
| | | | | | | | | | | 3,985,741 | |
| | | | | | | | | | | | |
Consumer Services 2.3% | | | | | | | | | | | | |
Burger King Holdings Inc., Tranche B Term Loan, 6.25%, 10/19/16 | | | United States | | | | 5,648,197 | | | | 5,737,461 | |
CCM Merger Inc. (MotorCity Casino), Term Loan B, 8.50%, 7/13/12 | | | United States | | | | 3,503,794 | | | | 3,514,015 | |
mDineEquity Inc., Term Facility, 6.00%, 10/19/17 | | | United States | | | | 2,406,138 | | | | 2,447,855 | |
Education Management LLC, Tranche C-2 Term Loan 4.313%, 6/01/16 | | | United States | | | | 5,083,713 | | | | 4,970,387 | |
mPenn National Gaming Inc., Term Loan B, 2.01% - 2.04%, 10/03/12 | | | United States | | | | 4,134,506 | | | | 4,125,894 | |
eTurtle Bay Holdings LLC,
Term Loan A, 10.375%, 3/01/13 | | | United States | | | | 1,912,047 | | | | 1,883,367 | |
kTerm Loan B, PIK, 3.125%, 2/09/15 | | | United States | | | | 3,928,305 | | | | 3,339,059 | |
mVisant Corp. (Jostens), Tranche B Term Loan, 7.00%, 12/22/16 | | | United States | | | | 8,135,534 | | | | 8,238,074 | |
| | | | | | | | | | | | |
| | | | | | | | | | | 34,256,112 | |
| | | | | | | | | | | | |
Diversified Financials 0.5% | | | | | | | | | | | | |
MSCI Inc., Term Loan, 4.75%, 6/01/16 | | | United States | | | | 2,136,470 | | | | 2,154,497 | |
TransUnion LLC, Term Loan B, 6.75%, 6/15/17 | | | United States | | | | 5,776,495 | | | | 5,867,475 | |
| | | | | | | | | | | | |
| | | | | | | | | | | 8,021,972 | |
| | | | | | | | | | | | |
Food & Staples Retailing 0.5% | | | | | | | | | | | | |
SUPERVALU Inc.,
Term Loan B, 1.538%, 6/02/12 | | | United States | | | | 1,553,304 | | | | 1,534,590 | |
mTerm Loan B-2, 3.038%, 10/05/15 | | | United States | | | | 5,641,599 | | | | 5,582,012 | |
| | | | | | | | | | | | |
| | | | | | | | | | | 7,116,602 | |
| | | | | | | | | | | | |
FSI-21
Franklin Templeton Variable Insurance Products Trust
Statement of Investments, December 31, 2010 (continued)
| | | | | | | | | | | | |
| Franklin Strategic Income Securities Fund | | Country | | | Principal
Amount* | | | Value | |
Senior Floating Rate Interests (continued) | | | | | | | | | | | | |
Food, Beverage & Tobacco 0.3% | | | | | | | | | | | | |
Dean Foods Co., 2016 Tranche B TL, 3.31%, 4/02/16 | | | United States | | | | 2,657,337 | | | $ | 2,594,225 | |
Michael Foods Group Inc., Term Loan B, 6.25% - 6.75%, 6/29/16 | | | United States | | | | 1,649,306 | | | | 1,675,420 | |
| | | | | | | | | | | | |
| | | | | | | | | | | 4,269,645 | |
| | | | | | | | | | | | |
Health Care Equipment & Services 1.9% | | | | | | | | | | | | |
mBausch & Lomb Inc.,
Delayed Draw Term Loan, 5.5%, 4/28/15 | | | United States | | | | 129,743 | | | | 129,477 | |
Parent Term Loan, 5.5%, 4/28/15 | | | United States | | | | 534,352 | | | | 532,681 | |
Carestream Health Inc., Second Lien Term Loan, 5.511%, 10/30/13 | | | United States | | | | 404,040 | | | | 397,306 | |
Community Health Systems Inc.,
Delayed Draw Term Loan, 2.544%, 7/25/14 | | | United States | | | | 299,087 | | | | 292,115 | |
Term Loan, 2.544%, 7/25/14 | | | United States | | | | 5,817,144 | | | | 5,681,535 | |
mDaVita Inc., Tranche B Term Loan, 4.50%, 10/20/16 | | | United States | | | | 3,748,885 | | | | 3,789,388 | |
HCA Inc.,
Term Loan A-1, 1.553%, 11/19/12 | | | United States | | | | 1,279,280 | | | | 1,262,290 | |
Term Loan B-1, 2.553%, 11/18/13 | | | United States | | | | 2,479,660 | | | | 2,458,583 | |
lTranche B-2 Term Loan, 3.553%, 3/31/17 | | | United States | | | | 5,031,995 | | | | 5,030,948 | |
mUniversal Health Services Inc., Tranche B Term Loan, 5.50%, 11/15/16 | | | United States | | | | 8,709,461 | | | | 8,837,708 | |
| | | | | | | | | | | | |
| | | | | | | | | | | 28,412,031 | |
| | | | | | | | | | | | |
Materials 1.9% | | | | | | | | | | | | |
Anchor Glass Container Corp., Second Lien Term Loan, 10.00%, 9/02/16 | | | United States | | | | 5,813,900 | | | | 5,792,098 | |
Celanese U.S. Holdings LLC,
mDollar Term Loan, 3.75%, 4/02/14 | | | United States | | | | 928,571 | | | | 928,829 | |
Term Loan C, 3.29%, 10/31/16 | | | United States | | | | 1,791,928 | | | | 1,804,248 | |
Consolidated Container Co. LLC, Second-Lien Term Loan, 5.75%, 9/28/14 | | | United States | | | | 1,933,702 | | | | 1,633,978 | |
Georgia-Pacific LLC,
Term Loan B, 2.302% - 2.303%, 12/20/12 | | | United States | | | | 1,297,512 | | | | 1,298,471 | |
Term Loan C, 3.552% - 3.553%, 12/23/14 | | | United States | | | | 2,554,662 | | | | 2,568,434 | |
Nalco Co.,
Term Loan B-1, 4.50%, 10/05/17 | | | United States | | | | 4,364,420 | | | | 4,409,155 | |
Term Loan C-1, 2.016% - 2.036%, 5/13/16 | | | United States | | | | 592,323 | | | | 592,076 | |
mReynolds Group Holdings Inc., U.S. Tranche D Term Loan, 6.50%, 5/05/16 | | | United States | | | | 2,369,149 | | | | 2,395,465 | |
Rockwood Specialties Group Inc., Term Loan H, 6.00%, 5/15/14 | | | United States | | | | 6,823,637 | | | | 6,876,234 | |
| | | | | | | | | | | | |
| | | | | | | | | | | 28,298,988 | |
| | | | | | | | | | | | |
Media 2.9% | | | | | | | | | | | | |
Cinemark USA Inc., Extended Term Loan, 3.52% - 3.56%, 4/30/16 | | | United States | | | | 2,501,494 | | | | 2,517,911 | |
CSC Holdings Inc. (Cablevision), Incremental Term Loan B-2, 2.01% - 4.00%, 3/29/16 | | | United States | | | | 8,733,395 | | | | 8,787,979 | |
mIntelsat Jackson Holdings SA, Tranche B Term Loan, 6.00%, 4/02/18 | | | Luxembourg | | | | 8,178,733 | | | | 8,269,255 | |
iMetro-Goldwyn-Mayer Inc., Term Loan B, 20.5%, 4/08/12 | | | United States | | | | 13,312,357 | | | | 5,914,760 | |
R.H. Donnelley Inc., Term Loan B, 9.00%, 10/24/14 | | | United States | | | | 7,835,011 | | | | 6,212,044 | |
Regal Cinemas Corp., Term Loan, 3.803%, 11/17/16 | | | United States | | | | 2,376,079 | | | | 2,390,324 | |
Univision Communications Inc., Extended First Lien Term Loan, 4.511%, 3/31/17 | | | United States | | | | 7,160,303 | | | | 6,820,189 | |
UPC Financing Partnership, Term Loan T, 4.251%, 12/31/16 | | | Netherlands | | | | 2,892,130 | | | | 2,869,716 | |
| | | | | | | | | | | | |
| | | | | | | | | | | 43,782,178 | |
| | | | | | | | | | | | |
Pharmaceuticals, Biotechnology & Life Sciences 0.4% | | | | | | | | | | | | |
Mylan Inc., Term Loan B, 3.563%, 10/02/14 | | | United States | | | | 741,001 | | | | 744,356 | |
WC Luxco S.A.R.L., Term B-3 Loan, 6.50%, 2/20/16 | | | Luxembourg | | | | 4,452,056 | | | | 4,500,387 | |
| | | | | | | | | | | | |
| | | | | | | | | | | 5,244,743 | |
| | | | | | | | | | | | |
FSI-22
Franklin Templeton Variable Insurance Products Trust
Statement of Investments, December 31, 2010 (continued)
| | | | | | | | | | | | |
| Franklin Strategic Income Securities Fund | | Country | | | Principal
Amount* | | | Value | |
Senior Floating Rate Interests (continued) | | | | | | | | | | | | |
Retailing 0.1% | | | | | | | | | | | | |
Dollar General Corp., Tranche B-1 Term Loan, 3.011% - 3.038%, 7/07/14 | | | United States | | | | 2,203,266 | | | $ | 2,207,518 | |
| | | | | | | | | | | | |
Software & Services 0.8% | | | | | | | | | | | | |
Fidelity National Information Services Inc., Term Loan B, 5.25%, 7/18/16 | | | United States | | | | 2,279,525 | | | | 2,311,097 | |
First Data Corp.,
Term Loan B-1, 3.011%, 9/24/14 | | | United States | | | | 4,163,462 | | | | 3,847,626 | |
Term Loan B-2, 3.011%, 9/24/14 | | | United States | | | | 1,323,258 | | | | 1,222,878 | |
Term Loan B-3, 3.011%, 9/24/14 | | | United States | | | | 1,323,258 | | | | 1,224,473 | |
SunGard Data Systems Inc., Tranche B U.S. Term Loan, 3.907% - 3.911%, 2/28/16 | | | United States | | | | 2,129,645 | | | | 2,117,001 | |
Vertafore Inc., 2nd Lien Term Loan, 9.75%, 10/27/17 | | | United States | | | | 1,832,000 | | | | 1,851,465 | |
| | | | | | | | | | | | |
| | | | | | | | | | | 12,574,540 | |
| | | | | | | | | | | | |
Technology Hardware & Equipment 0.2% | | | | | | | | | | | | |
Flextronics International USA Inc.,
A Closing Date Loan, 2.508% - 2.511%, 10/01/14 | | | United States | | | | 1,117,637 | | | | 1,104,784 | |
A-1-A Delayed Draw Term Loan, 2.511%, 10/01/14 | | | United States | | | | 105,081 | | | | 103,872 | |
A-1-B Delayed Draw Term Loan, 2.511%, 10/01/14 | | | United States | | | | 572,253 | | | | 565,672 | |
A-3 Delayed Draw Term Loan, 2.508%, 10/01/14 | | | United States | | | | 800,403 | | | | 790,398 | |
| | | | | | | | | | | | |
| | | | | | | | | | | 2,564,726 | |
| | | | | | | | | | | | |
Telecommunication Services 0.7% | | | | | | | | | | | | |
Intelsat Corp. (PanAmSat),
Incremental B-2-A, 2.79%, 1/03/14 | | | United States | | | | 250,515 | | | | 250,515 | |
Incremental B-2-B, 2.79%, 1/03/14 | | | United States | | | | 250,437 | | | | 250,437 | |
Incremental B-2-C, 2.79%, 1/03/14 | | | United States | | | | 250,437 | | | | 250,437 | |
Tranche B-2-A, 2.79%, 1/03/14 | | | United States | | | | 2,607,177 | | | | 2,607,177 | |
Tranche B-2-B, 2.79%, 1/03/14 | | | United States | | | | 2,606,372 | | | | 2,606,372 | |
Tranche B-2-C, 2.79%, 1/03/14 | | | United States | | | | 2,606,371 | | | | 2,606,371 | |
Windstream Corp., Tranche B-2 Term Loan, 3.04%, 12/17/15 | | | United States | | | | 2,192,661 | | | | 2,206,365 | |
| | | | | | | | | | | | |
| | | | | | | | | | | 10,777,674 | |
| | | | | | | | | | | | |
Utilities 0.8% | | | | | | | | | | | | |
NRG Energy Inc.,
Credit Link, 2.053%, 2/01/13 | | | United States | | | | 2,088,740 | | | | 2,079,788 | |
Term Loan, 2.011% - 2.053%, 2/01/13 | | | United States | | | | 2,145,877 | | | | 2,136,680 | |
Texas Competitive Electric Holdings Co. LLC, Term Loan B-2, 3.764%, 10/10/14 | | | United States | | | | 9,103,585 | | | | 7,051,655 | |
| | | | | | | | | | | | |
| | | | | | | | | | | 11,268,123 | |
| | | | | | | | | | | | |
Total Senior Floating Rate Interests (Cost $229,336,247) | | | | | | | | | | | 233,957,828 | |
| | | | | | | | | | | | |
Foreign Government and Agency Securities 22.3% | | | | | | | | | | | | |
fArab Republic of Egypt, 144A, 5.75%, 4/29/20 | | | Egypt | | | | 2,500,000 | | | | 2,600,000 | |
j,nGovernment of Argentina, senior bond, FRN, 0.677%, 8/03/12 | | | Argentina | | | | 35,000,000 | | | | 8,384,250 | |
Government of Australia, TB123, 5.75%, 4/15/12 | | | Australia | | | | 20,350,000 | AUD | | | 20,998,730 | |
Government of Hungary,
5.50%, 2/12/16 | | | Hungary | | | | 529,700,000 | HUF | | | 2,299,518 | |
7.50%, 11/12/20 | | | Hungary | | | | 312,600,000 | HUF | | | 1,457,631 | |
14/C, 5.50%, 2/12/14 | | | Hungary | | | | 1,119,700,000 | HUF | | | 5,060,031 | |
19/A, 6.50%, 6/24/19 | | | Hungary | | | | 206,000,000 | HUF | | | 903,228 | |
senior note, 6.25%, 1/29/20 | | | Hungary | | | | 6,230,000 | | | | 6,074,250 | |
Government of Indonesia,
FR19, 14.25%, 6/15/13 | | | Indonesia | | | | 35,480,000,000 | IDR | | | 4,659,752 | |
FR20, 14.275%, 12/15/13 | | | Indonesia | | | | 23,637,000,000 | IDR | | | 3,179,697 | |
FR26, 11.00%, 10/15/14 | | | Indonesia | | | | 1,800,000,000 | IDR | | | 228,879 | |
FSI-23
Franklin Templeton Variable Insurance Products Trust
Statement of Investments, December 31, 2010 (continued)
| | | | | | | | | | | | |
| Franklin Strategic Income Securities Fund | | Country | | | Principal
Amount* | | | Value | |
Foreign Government and Agency Securities (continued) | | | | | | | | | | | | |
Government of Indonesia (continued) | | | | | | | | | | | | |
FR34, 12.80%, 6/15/21 | | | Indonesia | | | | 49,955,000,000 | IDR | | $ | 7,567,448 | |
FR42, 10.25%, 7/15/27 | | | Indonesia | | | | 28,000,000,000 | IDR | | | 3,420,777 | |
FR44, 10.00%, 9/15/24 | | | Indonesia | | | | 23,400,000,000 | IDR | | | 2,861,247 | |
Government of Israel, 2680, 7.00%, 4/29/11 | | | Israel | | | | 12,235,000 | ILS | | | 3,522,341 | |
Government of Malaysia, senior bond,
3.756%, 4/28/11 | | | Malaysia | | | | 48,970,000 | MYR | | | 15,948,720 | |
3.833%, 9/28/11 | | | Malaysia | | | | 31,790,000 | MYR | | | 10,396,944 | |
2.711%, 2/14/12 | | | Malaysia | | | | 90,000 | MYR | | | 29,144 | |
2.509%, 8/27/12 | | | Malaysia | | | | 3,600,000 | MYR | | | 1,159,076 | |
3.461%, 7/31/13 | | | Malaysia | | | | 6,400,000 | MYR | | | 2,092,575 | |
3.814%, 2/15/17 | | | Malaysia | | | | 11,400,000 | MYR | | | 3,743,611 | |
4.24%, 2/07/18 | | | Malaysia | | | | 600,000 | MYR | | | 200,325 | |
Government of Mexico,
M 10, 8.00%, 12/17/15 | | | Mexico | | | | 350,000 | oMXN | | | 3,032,866 | |
M 20, 10.00%, 12/05/24 | | | Mexico | | | | 1,216,000 | oMXN | | | 12,309,589 | |
Government of Norway, 6.00%, 5/16/11 | | | Norway | | | | 153,570,000 | NOK | | | 26,733,513 | |
Government of Poland,
4.25%, 5/24/11 | | | Poland | | | | 1,230,000 | PLN | | | 415,307 | |
4.75%, 4/25/12 | | | Poland | | | | 41,490,000 | PLN | | | 14,062,745 | |
6.25%, 10/24/15 | | | Poland | | | | 9,100,000 | PLN | | | 3,182,001 | |
5.75%, 4/25/14 - 9/23/22 | | | Poland | | | | 27,110,000 | PLN | | | 9,025,170 | |
senior note, 6.375%, 7/15/19 | | | Poland | | | | 4,000,000 | | | | 4,492,176 | |
fGovernment of Russia, 144A, 7.50%, 3/31/30 | | | Russia | | | | 9,125,420 | | | | 10,540,316 | |
Government of Sri Lanka,
A, 12.00%, 7/15/11 | | | Sri Lanka | | | | 14,460,000 | LKR | | | 133,519 | |
A, 6.90%, 8/01/12 | | | Sri Lanka | | | | 1,900,000 | LKR | | | 16,931 | |
A, 8.50%, 1/15/13 | | | Sri Lanka | | | | 50,900,000 | LKR | | | 464,153 | |
A, 13.50%, 2/01/13 | | | Sri Lanka | | | | 59,500,000 | LKR | | | 591,789 | |
A, 7.00%, 3/01/14 | | | Sri Lanka | | | | 7,020,000 | LKR | | | 60,194 | |
A, 11.25%, 7/15/14 | | | Sri Lanka | | | | 176,100,000 | LKR | | | 1,692,412 | |
A, 6.50%, 7/15/15 | | | Sri Lanka | | | | 2,350,000 | LKR | | | 19,058 | |
A, 11.00%, 8/01/15 | | | Sri Lanka | | | | 200,400,000 | LKR | | | 1,918,957 | |
B, 6.60%, 6/01/14 | | | Sri Lanka | | | | 7,100,000 | LKR | | | 59,858 | |
Government of Sweden,
5.25%, 3/15/11 | | | Sweden | | | | 161,460,000 | SEK | | | 24,241,128 | |
5.50%, 10/08/12 | | | Sweden | | | | 13,990,000 | SEK | | | 2,214,953 | |
fGovernment of Ukraine, 144A, 7.75%, 9/23/20 | | | Ukraine | | | | 4,500,000 | | | | 4,590,000 | |
Government of Venezuela,
10.75%, 9/19/13 | | | Venezuela | | | | 5,500,000 | | | | 5,284,675 | |
j,pReg S, FRN, 1.288%, 4/20/11 | | | Venezuela | | | | 1,265,000 | | | | 1,249,188 | |
fGovernment of Vietnam, 144A, 6.75%, 1/29/20 | | | Vietnam | | | | 4,500,000 | | | | 4,584,375 | |
Korea Treasury Bond,
4.75%, 12/10/11 | | | South Korea | | | | 18,681,350,000 | KRW | | | 16,961,265 | |
4.25%, 12/10/12 | | | South Korea | | | | 3,560,000,000 | KRW | | | 3,228,203 | |
5.25%, 9/10/12 - 3/10/13 | | | South Korea | | | | 31,96,570,000 | KRW | | | 2,944,602 | |
senior bond, 5.50%, 6/10/11 | | | South Korea | | | | 1,411,820,000 | KRW | | | 1,274,578 | |
senior bond, 4.00%, 6/10/12 | | | South Korea | | | | 31,013,880,000 | KRW | | | 27,967,470 | |
New South Wales Treasury Corp., senior note, 5.50%, 3/01/17 | | | Australia | | | | 3,540,000 | AUD | | | 3,561,192 | |
Nota Do Tesouro Nacional,
10.00%, 1/01/12 | | | Brazil | | | | 6,910 | qBRL | | | 4,089,525 | |
10.00%, 1/01/14 | | | Brazil | | | | 2,700 | qBRL | | | 1,540,158 | |
10.00%, 1/01/17 | | | Brazil | | | | 16,400 | qBRL | | | 9,066,175 | |
FSI-24
Franklin Templeton Variable Insurance Products Trust
Statement of Investments, December 31, 2010 (continued)
| | | | | | | | | | | | |
| Franklin Strategic Income Securities Fund | | Country | | | Principal
Amount* | | | Value | |
Foreign Government and Agency Securities (continued) | | | | | | | | | | | | |
Nota Do Tesouro Nacional (continued) | | | | | | | | | | | | |
rIndex Linked, 6.00%, 5/15/15 | | | Brazil | | | | 3,890 | qBRL | | $ | 4,610,272 | |
rIndex Linked, 6.00%, 5/15/45 | | | Brazil | | | | 1,725 | qBRL | | | 2,206,621 | |
Queensland Treasury Corp.,
6.00%, 6/14/11 | | | Australia | | | | 5,090,000 | AUD | | | 5,225,265 | |
6.00%, 8/14/13 | | | Australia | | | | 600,000 | AUD | | | 622,786 | |
6.00%, 9/14/17 | | | Australia | | | | 1,200,000 | AUD | | | 1,238,080 | |
f144A, 7.125%, 9/18/17 | | | Australia | | | | 740,000 | NZD | | | 616,374 | |
Western Australia Treasury Corp., 5.50%, 7/17/12 | | | Australia | | | | 8,010,000 | AUD | | | 8,212,748 | |
| | | | | | | | | | | | |
Total Foreign Government and Agency Securities
(Cost $302,463,501) | | | | | | | | | | | 331,068,361 | |
| | | | | | | | | | | | |
U.S. Government and Agency Securities 1.3% | | | | | | | | | | | | |
U.S. Treasury Bond,
4.50%, 2/15/16 - 5/15/17 | | | United States | | | | 4,000,000 | | | | 4,478,829 | |
7.125%, 2/15/23 | | | United States | | | | 1,980,000 | | | | 2,659,696 | |
7.875%, 2/15/21 | | | United States | | | | 2,600,000 | | | | 3,627,406 | |
U.S. Treasury Note,
2.375%, 3/31/16 | | | United States | | | | 4,800,000 | | | | 4,861,502 | |
4.625%, 2/15/17 | | | United States | | | | 600,000 | | | | 675,610 | |
4.75%, 8/15/17 | | | United States | | | | 2,900,000 | | | | 3,289,009 | |
| | | | | | | | | | | | |
Total U.S. Government and Agency Securities
(Cost $18,692,731) | | | | | | | | | | | 19,592,052 | |
| | | | | | | | | | | | |
Asset-Backed Securities and Commercial Mortgage-Backed Securities 5.5% | | | | | | | | | | | | |
Banks 2.4% | | | | | | | | | | | | |
fBanc of America Large Loan, 2010-HLTN, 144A, 2.01%, 11/15/15 | | | United States | | | | 4,486,917 | | | | 4,006,497 | |
Countrywide Asset-Backed Certificates, 2005-11, AF4, 5.21%, 3/25/34 | | | United States | | | | 1,275,000 | | | | 844,649 | |
GE Capital Commercial Mortgage Corp., 2003-C1, A4, 4.819%, 1/10/38 | | | United States | | | | 10,000 | | | | 10,503 | |
Greenwich Capital Commercial Funding Corp.,
2005-GG5, A5, 5.224%, 4/10/37 | | | United States | | | | 3,695,000 | | | | 3,925,359 | |
j2006-GG7, A4, FRN, 5.913%, 7/10/38 | | | United States | | | | 4,000,000 | | | | 4,369,362 | |
jGS Mortgage Securities Corp. II, 2006-GG6, A4, FRN, 5.553%, 4/10/38 | | | United States | | | | 5,605,000 | | | | 6,027,531 | |
jHomebanc Mortgage Trust, 2005-4, A1, FRN, 0.531%, 10/25/35 | | | United States | | | | 2,273,618 | | | | 1,716,886 | |
f,jSchiller Park CLO Ltd., 2007-1A, A2, 144A, FRN, 0.528%, 4/25/21 | | | United States | | | | 2,566,666 | | | | 2,389,617 | |
f,jWachovia Bank Commercial Mortgage Trust, 2007-WHL8, A1, 144A, FRN,
0.34%, 6/15/20 | | | United States | | | | 6,932,516 | | | | 6,487,901 | |
Wells Fargo Mortgage Backed Securities Trust,
j2004-W, A9, FRN, 2.994%, 11/25/34 | | | United States | | | | 2,450,000 | | | | 2,350,557 | |
2007-3, 3A1, 5.50%, 4/25/37 | | | United States | | | | 4,214,822 | | | | 4,362,042 | |
| | | | | | | | | | | | |
| | | | | | | | | | | 36,490,904 | |
| | | | | | | | | | | | |
Diversified Financials 3.0% | | | | | | | | | | | | |
f,jARES CLO Funds, 2007-12A, B, 144A, FRN, 1.288%, 11/25/20 | | | Cayman Islands | | | | 1,380,000 | | | | 1,198,199 | |
f,jArmstrong Loan Funding Ltd., 2008-1A, B, 144A, FRN, 1.287%, 8/01/16 | | | Cayman Islands | | | | 5,361,142 | | | | 5,117,693 | |
f,jBabson CLO Ltd., 2005-2A, A1, 144A, FRN, 0.539%, 7/20/19 | | | Cayman Islands | | | | 2,045,349 | | | | 1,918,906 | |
f,jCent CDO Ltd., 2007-15A, A2B, 144A, FRN, 0.642%, 3/11/21 | | | Cayman Islands | | | | 1,251,000 | | | | 1,011,928 | |
Citigroup Commercial Mortgage Trust,
f,j144A, FRN, 0.33%, 4/15/22 | | | United States | | | | 1,030,522 | | | | 982,195 | |
j2007-C6, AM, FRN, 5.888%, 6/10/17 | | | United States | | | | 1,200,000 | | | | 1,192,991 | |
2008-C7, A4, 6.299%, 12/10/49 | | | United States | | | | 8,700,000 | | | | 9,366,691 | |
FSI-25
Franklin Templeton Variable Insurance Products Trust
Statement of Investments, December 31, 2010 (continued)
| | | | | | | | | | | | |
| Franklin Strategic Income Securities Fund | | Country | | | Principal
Amount* | | | Value | |
Asset-Backed Securities and Commercial Mortgage-Backed Securities (continued) | | | | | | | | | | | | |
Citigroup/Deutsche Bank Commercial Mortgage Trust, 2006-CD3, A5, 5.617%, 10/15/48 | | | United States | | | | 9,800,000 | | | $ | 10,525,743 | |
f,jColumbus Nova CLO Ltd., 2007-2A, A2, 144A, FRN, 1.289%, 10/15/21 | | | Cayman Islands | | | | 860,000 | | | | 747,723 | |
Foxe Basin CLO Ltd., 2003-1A, A2, 1.202%, 12/15/15 | | | Cayman Islands | | | | 790,000 | | | | 757,871 | |
JPMorgan Chase Commercial Mortgage Securities Corp.,
j2004-CB9, A4, FRN, 5.558%, 6/12/41 | | | United States | | | | 1,096,445 | | | | 1,173,844 | |
2005-LDP2, AM, 4.78%, 7/15/42 | | | United States | | | | 775,000 | | | | 784,336 | |
f,jMAPS CLO Fund LLC, 2005-1A, B, 144A, FRN, 0.804%, 12/21/17 | | | United States | | | | 1,400,000 | | | | 1,210,307 | |
jMorgan Stanley Capital I Trust, 2004-IQ7, A4, FRN, 5.404%, 6/15/38 | | | United States | | | | 4,000,000 | | | | 4,275,575 | |
Residential Asset Securities Corp., 2004-KS1, AI4, 4.213%, 4/25/32 | | | United States | | | | 73,468 | | | | 72,712 | |
f,jWestchester CLO Ltd., 2007-1A, A1A, 144A, FRN, 0.512%, 8/01/22 | | | Cayman Islands | | | | 4,863,429 | | | | 4,360,186 | |
| | | | | | | | | | | | |
| | | | | | | | | | | 44,696,900 | |
| | | | | | | | | | | | |
Real Estate 0.1% | | | | | | | | | | | | |
f,jCredit Suisse Mortgage Capital Certificates, 2006-TF2A, A2, 144A, FRN, 0.43%, 10/15/21 | | | United States | | | | 978,667 | | | | 937,206 | |
| | | | | | | | | | | | |
Total Asset-Backed Securities and Commercial Mortgage-Backed Securities (Cost $77,645,034) | | | | | | | | | | | 82,125,010 | |
| | | | | | | | | | | | |
Mortgage-Backed Securities 6.9% | | | | | | | | | | | | |
jFederal Home Loan Mortgage Corp. (FHLMC) Adjustable Rate 0.0%† | | | | | | | | | | | | |
FHLMC, 2.598%, 1/01/33 | | | United States | | | | 114,757 | | | | 118,732 | |
| | | | | | | | | | | | |
Federal Home Loan Mortgage Corp. (FHLMC) Fixed Rate 2.1% | | | | | | | | | | | | |
FHLMC Gold 15 Year, 4.50%, 10/01/18 - 6/01/19 | | | United States | | | | 1,555,577 | | | | 1,641,585 | |
FHLMC Gold 15 Year, 5.00%, 12/01/17 - 9/01/19 | | | United States | | | | 1,784,324 | | | | 1,904,171 | |
FHLMC Gold 15 Year, 5.50%, 7/01/17 - 7/01/19 | | | United States | | | | 482,716 | | | | 520,528 | |
FHLMC Gold 15 Year, 6.00%, 5/01/17 | | | United States | | | | 18,231 | | | | 19,900 | |
FHLMC Gold 15 Year, 6.50%, 5/01/16 | | | United States | | | | 6,146 | | | | 6,701 | |
FHLMC Gold 30 Year, 4.00%, 10/01/40 | | | United States | | | | 4,000,000 | | | | 3,976,311 | |
FHLMC Gold 30 Year, 4.50%, 9/01/40 - 10/01/40 | | | United States | | | | 6,392,879 | | | | 6,559,081 | |
FHLMC Gold 30 Year, 5.00%, 4/01/34 - 6/01/37 | | | United States | | | | 4,697,279 | | | | 4,940,213 | |
FHLMC Gold 30 Year, 5.50%, 3/01/33 - 6/01/36 | | | United States | | | | 4,571,957 | | | | 4,914,150 | |
FHLMC Gold 30 Year, 6.00%, 4/01/33 - 6/01/37 | | | United States | | | | 5,030,405 | | | | 5,479,617 | |
FHLMC Gold 30 Year, 6.50%, 12/01/23 - 6/01/36 | | | United States | | | | 342,674 | | | | 382,908 | |
FHLMC Gold 30 Year, 7.00%, 9/01/21 - 4/01/30 | | | United States | | | | 79,634 | | | | 90,744 | |
FHLMC Gold 30 Year, 7.50%, 3/01/30 - 7/01/31 | | | United States | | | | 2,229 | | | | 2,559 | |
| | | | | | | | | | | | |
| | | | | | | | | | | 30,438,468 | |
| | | | | | | | | | | | |
jFederal National Mortgage Association (FNMA) Adjustable Rate 0.0%† | | | | | | | | | | | | |
FNMA, 2.441%, 12/01/34 | | | United States | | | | 371,195 | | | | 386,198 | |
FNMA, 2.637%, 4/01/20 | | | United States | | | | 71,248 | | | | 74,562 | |
| | | | | | | | | | | | |
| | | | | | | | | | | 460,760 | |
| | | | | | | | | | | | |
Federal National Mortgage Association (FNMA) Fixed Rate 4.5% | | | | | | | | | | | | |
FNMA 15 Year, 4.50%, 6/01/19 - 3/01/20 | | | United States | | | | 379,295 | | | | 401,134 | |
FNMA 15 Year, 5.00%, 10/01/17 - 6/01/18 | | | United States | | | | 446,110 | | | | 477,697 | |
FNMA 15 Year, 5.50%, 2/01/11 - 1/01/25 | | | United States | | | | 11,536,235 | | | | 12,410,631 | |
FNMA 15 Year, 6.00%, 4/01/16 - 7/01/16 | | | United States | | | | 7,477 | | | | 8,140 | |
FNMA 15 Year, 7.00%, 5/01/12 | | | United States | | | | 506 | | | | 516 | |
mFNMA 30 Year, 4.00%, 7/01/39 - 1/01/41 | | | United States | | | | 14,348,801 | | | | 14,291,964 | |
FNMA 30 Year, 4.50%, 4/01/39 - 8/01/40 | | | United States | | | | 11,273,776 | | | | 11,587,297 | |
FNMA 30 Year, 5.00%, 4/01/34 - 6/01/40 | | | United States | | | | 5,294,633 | | | | 5,583,521 | |
FNMA 30 Year, 5.50%, 8/01/33 - 9/01/35 | | | United States | | | | 2,682,907 | | | | 2,888,820 | |
FNMA 30 Year, 6.00%, 6/01/34 - 10/01/38 | | | United States | | | | 16,079,232 | | | | 17,522,011 | |
FNMA 30 Year, 6.50%, 6/01/28 - 10/01/37 | | | United States | | | | 1,887,899 | | | | 2,109,050 | |
| | | | | | | | | | | | |
| | | | | | | | | | | 67,280,781 | |
| | | | | | | | | | | | |
FSI-26
Franklin Templeton Variable Insurance Products Trust
Statement of Investments, December 31, 2010 (continued)
| | | | | | | | | | | | |
| Franklin Strategic Income Securities Fund | | Country | | | Principal
Amount* | | | Value | |
Mortgage-Backed Securities (continued) | | | | | | | | | | | | |
Government National Mortgage Association (GNMA) Fixed Rate 0.3% | | | | | | | | | | | | |
GNMA I SF 30 Year, 5.00%, 11/15/33 - 7/15/34 | | | United States | | | | 1,197,598 | | | $ | 1,277,510 | |
GNMA I SF 30 Year, 5.50%, 12/15/32 - 6/15/36 | | | United States | | | | 1,224,832 | | | | 1,332,187 | |
GNMA I SF 30 Year, 6.50%, 11/15/31 - 2/15/32 | | | United States | | | | 6,855 | | | | 7,784 | |
GNMA I SF 30 Year, 7.00%, 10/15/28 - 6/15/32 | | | United States | | | | 99,879 | | | | 114,523 | |
GNMA I SF 30 Year, 7.50%, 9/15/30 | | | United States | | | | 2,201 | | | | 2,548 | |
GNMA II SF 30 Year, 5.00%, 9/20/33 - 11/20/33 | | | United States | | | | 341,289 | | | | 365,360 | |
GNMA II SF 30 Year, 6.00%, 11/20/34 | | | United States | | | | 376,720 | | | | 416,078 | |
GNMA II SF 30 Year, 6.50%, 4/20/31 - 2/20/34 | | | United States | | | | 141,978 | | | | 160,498 | |
GNMA II SF 30 Year, 7.50%, 1/20/28 - 4/20/32 | | | United States | | | | 38,800 | | | | 44,840 | |
| | | | | | | | | | | | |
| | | | | | | | | | | 3,721,328 | |
| | | | | | | | | | | | |
Total Mortgage-Backed Securities (Cost $100,257,628) | | | | | | | | | | | 102,020,069 | |
| | | | | | | | | | | | |
Municipal Bonds 5.8% | | | | | | | | | | | | |
Bay Area Toll Authority Toll Bridge Revenue, Build America Bonds, Series S1, 7.043%, 4/01/50 | | | United States | | | | 7,000,000 | | | | 7,085,050 | |
California State GO,
7.625%, 3/01/40 | | | United States | | | | 2,400,000 | | | | 2,506,584 | |
Build America Bonds, 7.60%, 11/01/40 | | | United States | | | | 4,770,000 | | | | 4,972,009 | |
Build America Bonds, Various Purpose, 7.55%, 4/01/39 | | | United States | | | | 8,500,000 | | | | 8,824,190 | |
Refunding, 5.00%, 4/01/38 | | | United States | | | | 10,000,000 | | | | 8,985,900 | |
Various Purpose, 6.00%, 4/01/38 | | | United States | | | | 3,500,000 | | | | 3,570,210 | |
Various Purpose, Refunding, 5.25%, 3/01/38 | | | United States | | | | 2,335,000 | | | | 2,178,345 | |
Clovis USD, GO, Capital Appreciation, Election of 2004, Series A, NATL RE, FGIC Insured, zero cpn.,
8/01/25 | | | United States | | | | 2,500,000 | | | | 1,035,650 | |
8/01/26 | | | United States | | | | 1,290,000 | | | | 490,845 | |
8/01/27 | | | United States | | | | 1,720,000 | | | | 605,870 | |
8/01/29 | | | United States | | | | 1,720,000 | | | | 511,253 | |
Cook County GO, Build America Bonds, Series D, 6.229%, 11/15/34 | | | United States | | | | 3,200,000 | | | | 3,054,304 | |
Detroit School District GO, Qualified School Construction Bonds, 6.645%, 5/01/29 | | | United States | | | | 8,000,000 | | | | 7,764,400 | |
Illinois State GO, Build America Bonds, 7.35%, 7/01/35 | | | United States | | | | 4,600,000 | | | | 4,510,208 | |
Los Angeles Community College District GO, Build America Bonds, 6.75%, 8/01/49 | | | United States | | | | 5,000,000 | | | | 5,164,950 | |
Los Angeles County Public Works Financing Authority Lease Revenue, Build America Bonds-Recovery Zone Economic Development, Refunding, 7.488%, 8/01/33 | | | United States | | | | 4,075,000 | | | | 4,005,929 | |
Los Angeles Department of Water and Power Revenue, Build America Bonds, 6.574%, 7/01/45 | | | United States | | | | 4,500,000 | | | | 4,594,050 | |
fNew York City IDA, 144A, 11.00%, 3/01/29 | | | United States | | | | 600,000 | | | | 758,832 | |
New York City Municipal Water Finance Authority Water and Sewer System Revenue, | | | | | | | | | | | | |
Build America Bonds, Second General, Refunding, Series EE, 6.491%, 6/15/42 | | | United States | | | | 2,000,000 | | | | 2,021,120 | |
Second General Resolution, Build America Bonds, Series CC, 6.282%, 6/15/42 | | | United States | | | | 5,830,000 | | | | 5,807,496 | |
Poway USD, GO, Election of 2008, ID 07-1-A, zero cpn., | | | | | | | | | | | | |
8/01/27 | | | United States | | | | 370,000 | | | | 129,008 | |
8/01/30 | | | United States | | | | 370,000 | | | | 100,144 | |
8/01/32 | | | United States | | | | 460,000 | | | | 105,142 | |
8/01/33 | | | United States | | | | 245,000 | | | | 51,617 | |
Redondo Beach USD, GO, Build America Bonds, Election of 2008, Direct Payment to District,
Series D, 6.461%, 8/01/40 | | | United States | | | | 1,510,000 | | | | 1,461,831 | |
San Francisco City and County GO, Build America Bonds, | | | | | | | | | | | | |
5.75%, 6/15/27 | | | United States | | | | 1,700,000 | | | | 1,769,955 | |
5.93%, 6/15/28 | | | United States | | | | 1,520,000 | | | | 1,599,177 | |
FSI-27
Franklin Templeton Variable Insurance Products Trust
Statement of Investments, December 31, 2010 (continued)
| | | | | | | | | | | | |
| Franklin Strategic Income Securities Fund | | Country | | | Principal
Amount* | | | Value | |
Municipal Bonds (continued) | | | | | | | | | | | | |
San Mateo County Community College District GO, Election of 2001, Series C, NATL Insured, zero cpn., | | | | | | | | | | | | |
9/01/30 | | | United States | | | | 895,000 | | | $ | 271,095 | |
3/01/31 | | | United States | | | | 245,000 | | | | 70,690 | |
Sonoma County Pension Obligation Revenue, Series A, 6.00%, 12/01/29 | | | United States | | | | 2,100,000 | | | | 1,963,206 | |
| | | | | | | | | | | | |
Total Municipal Bonds (Cost $86,151,788) | | | | | | | | | | | 85,969,060 | |
| | | | | | | | | | | | |
Total Investments before Short Term Investments
(Cost $1,336,776,436) | | | | | | | | | | | 1,401,551,180 | |
| | | | | | | | | | | | |
Short Term Investments 5.2% | | | | | | | | | | | | |
Foreign Government and Agency Securities 2.8% | | | | | | | | | | | | |
sBank of Negara Monetary Note, 1/06/11 - 7/28/11 | | | Malaysia | | | | 8,085,000 | MYR | | | 2,607,509 | |
sEgypt Treasury Bills, 2/08/11 - 12/06/11 | | | Egypt | | | | 137,600,000 | EGP | | | 22,597,258 | |
sIsrael Treasury Bills, 1/05/11 - 10/05/11 | | | Israel | | | | 55,161,300 | ILS | | | 15,556,905 | |
sMalaysia Treasury Bills, 4/05/11 - 5/18/11 | | | Malaysia | | | | 610,000 | MYR | | | 196,263 | |
sSri Lanka Treasury Bills, 7/08/11 - 9/16/11 | | | Sri Lanka | | | | 8,280,000 | LKR | | | 71,735 | |
| | | | | | | | | | | | |
Total Foreign Government and Agency Securities (Cost $40,745,664) | | | | | | | | | | | 41,029,670 | |
| | | | | | | | | | | | |
Total Investments before Money Market Funds
(Cost $1,377,522,100) | | | | | | | | | | | 1,442,580,850 | |
| | | | | | | | | | | | |
| | | |
| | | | | | Shares | | | | |
Money Market Funds (Cost $36,427,159) 2.4% | | | | | | | | | | | | |
a,tInstitutional Fiduciary Trust Money Market Portfolio | | | United States | | | | 36,427,159 | | | | 36,427,159 | |
| | | | | | | | | | | | |
Total Investments (Cost $1,413,949,259) 99.6% | | | | | | | | | | | 1,479,008,009 | |
Other Assets, less Liabilities 0.4% | | | | | | | | | | | 5,666,501 | |
| | | | | | | | | | | | |
Net Assets 100.0% | | | | | | | | | | $ | 1,484,674,510 | |
| | | | | | | | | | | | |
See Abbreviations on page FSI-46.
FSI-28
Franklin Templeton Variable Insurance Products Trust
Statement of Investments, December 31, 2010 (continued)
|
| Franklin Strategic Income Securities Fund |
†Rounds to less than 0.1% of net assets.
*The principal amount is stated in U.S. dollars unless otherwise indicated.
aNon-income producing.
bSecurity has been deemed illiquid because it may not be able to be sold within seven days. At December 31, 2010, the aggregate value of these securities was $835,411, representing 0.06% of net assets.
cSee Note 1(e) regarding investment in FT Holdings Corporation III.
dSee Note 9 regarding restricted securities.
eAt December 31, 2010, pursuant to the Fund’s policies and the requirements of applicable securities law, the Fund may be restricted from trading these securities for a limited or extended period of time due to ownership limits and/or potential possession of material non-public information.
fSecurity was purchased pursuant to Rule 144A under the Securities Act of 1933 and may be sold in transactions exempt from registration only to qualified institutional buyers or in a public offering registered under the Securities Act of 1933. These securities have been deemed liquid under guidelines approved by the Trust’s Board of Trustees. At December 31, 2010, the aggregate value of these securities was $239,971,572, representing 16.20% of net assets.
gPerpetual security with no stated maturity date.
hIncome may be reflected in the redemption value or received in additional securities and/or cash.
iSee Note 8 regarding defaulted securities.
jThe coupon rate shown represents the rate at period end.
kIncome may be received in additional securities and/or cash.
lSee Note 1(g) regarding senior floating rate interests.
mA portion or all of the security purchased on a delayed delivery or to-be-announced basis. See Note 1(c).
nThe principal amount is stated in original face, and scheduled paydowns are reflected in the market price on ex-date.
oPrincipal amount is stated in 100 Mexican Peso Units.
pSecurity was purchased pursuant to Regulation S under the Securities Act of 1933, which exempts from registration securities offered and sold outside of the United States. Such a security cannot be sold in the United States without either an effective registration statement filed pursuant to the Securities Act of 1933, or pursuant to an exemption from registration. This security has been deemed liquid under guidelines approved by the Trust’s Board of Trustees. At December 31, 2010, the value of this security was $1,249,188, representing 0.08% of net assets.
qPrincipal amount is stated in 1,000 Brazilian Real Units.
rRedemption price at maturity is adjusted for inflation. See Note 1(i).
sThe security is traded on a discount basis with no stated coupon rate.
tSee Note 7 regarding investments in the Institutional Fiduciary Trust Money Market Portfolio.
The accompanying notes are an integral part of these financial statements.
FSI-29
Franklin Templeton Variable Insurance Products Trust
Statement of Investments, December 31, 2010 (continued)
|
| Franklin Strategic Income Securities Fund |
At December 31, 2010, the Fund had the following forward exchange contracts outstanding. See Note 1(d).
| | | | | | | | | | | | | | | | | | | | | | | | | | | | |
| Currency | | Counterparty | | | Type | | | Quantity | | | Contract
Amount* | | | Settlement
Date | | | Unrealized
Appreciation | | | Unrealized
Depreciation | |
Japanese Yen | | | HSBC | | | | Sell | | | | 183,560,000 | | | | 2,000,000 | | | | 1/07/11 | | | $ | — | | | $ | (261,471 | ) |
Chilean Peso | | | DBAB | | | | Buy | | | | 2,449,000,000 | | | | 5,000,000 | | | | 1/10/11 | | | | 228,623 | | | | — | |
Euro | | | UBSW | | | | Sell | | | | 4,890,000 | | | | 7,027,664 | | | | 1/10/11 | | | | 486,172 | | | | — | |
Indian Rupee | | | HSBC | | | | Buy | | | | 139,650,000 | | | | 3,000,000 | | | | 1/10/11 | | | | 117,535 | | | | — | |
Euro | | | BZWS | | | | Sell | | | | 1,691,484 | | | | 2,434,046 | | | | 1/12/11 | | | | 171,307 | | | | — | |
Euro | | | DBAB | | | | Sell | | | | 2,187,000 | | | | 3,124,130 | | | | 1/12/11 | | | | 198,527 | | | | — | |
Euro | | | JPHQ | | | | Sell | | | | 1,802,953 | | | | 2,609,820 | | | | 1/13/11 | | | | 197,970 | | | | — | |
Japanese Yen | | | BZWS | | | | Sell | | | | 460,675,000 | | | | 5,000,000 | | | | 1/13/11 | | | | — | | | | (675,939 | ) |
Philippine Peso | | | JPHQ | | | | Buy | | | | 35,843,000 | | | | 770,705 | | | | 1/13/11 | | | | 50,657 | | | | — | |
Philippine Peso | | | HSBC | | | | Buy | | | | 5,750,000 | | | | 122,942 | | | | 1/14/11 | | | | 8,824 | | | | — | |
Euro | | | BZWS | | | | Sell | | | | 2,912,410 | | | | 4,177,415 | | | | 1/19/11 | | | | 281,458 | | | | — | |
Japanese Yen | | | DBAB | | | | Sell | | | | 271,680,000 | | | | 3,000,000 | | | | 1/19/11 | | | | — | | | | (347,580 | ) |
Euro | | | BZWS | | | | Sell | | | | 1,007,118 | | | | 1,420,610 | | | | 1/26/11 | | | | 73,395 | | | | — | |
Euro | | | DBAB | | | | Buy | | | | 1,570,000 | | | | 2,042,099 | | | | 1/27/11 | | | | 58,077 | | | | — | |
Euro | | | DBAB | | | | Sell | | | | 3,157,264 | | | | 4,457,899 | | | | 1/27/11 | | | | 234,453 | | | | — | |
Euro | | | DBAB | | | | Sell | | | | 3,014,151 | | | | 4,199,617 | | | | 2/04/11 | | | | 167,722 | | | | — | |
Chilean Peso | | | BZWS | | | | Buy | | | | 486,100,000 | | | | 896,781 | | | | 2/08/11 | | | | 138,587 | | | | — | |
Chilean Peso | | | DBAB | | | | Buy | | | | 725,000,000 | | | | 1,345,083 | | | | 2/08/11 | | | | 199,129 | | | | — | |
Chilean Peso | | | JPHQ | | | | Buy | | | | 482,900,000 | | | | 896,734 | | | | 2/08/11 | | | | 131,818 | | | | — | |
Indian Rupee | | | HSBC | | | | Buy | | | | 186,760,000 | | | | 4,000,086 | | | | 2/08/11 | | | | 147,187 | | | | — | |
Chilean Peso | | | BZWS | | | | Buy | | | | 1,001,200,000 | | | | 1,865,300 | | | | 2/09/11 | | | | 267,030 | | | | — | |
Euro | | | UBSW | | | | Sell | | | | 2,151,000 | | | | 2,944,719 | | | | 2/11/11 | | | | 67,513 | | | | — | |
Euro | | | DBAB | | | | Sell | | | | 1,250,438 | | | | 1,706,597 | | | | 2/16/11 | | | | 34,033 | | | | — | |
Euro | | | UBSW | | | | Sell | | | | 3,690,000 | | | | 4,985,375 | | | | 3/01/11 | | | | 49,981 | | | | — | |
Japanese Yen | | | UBSW | | | | Sell | | | | 95,700,000 | | | | 1,075,789 | | | | 3/01/11 | | | | — | | | | (103,899 | ) |
Japanese Yen | | | JPHQ | | | | Sell | | | | 85,800,000 | | | | 960,290 | | | | 3/01/11 | | | | — | | | | (97,361 | ) |
Japanese Yen | | | HSBC | | | | Sell | | | | 85,800,000 | | | | 960,839 | | | | 3/01/11 | | | | — | | | | (96,812 | ) |
Indian Rupee | | | DBAB | | | | Buy | | | | 20,841,000 | | | | 459,205 | | | | 4/11/11 | | | | — | | | | (1,875 | ) |
Indian Rupee | | | DBAB | | | | Buy | | | | 44,691,000 | | | | 984,600 | | | | 4/12/11 | | | | — | | | | (4,086 | ) |
Indian Rupee | | | JPHQ | | | | Buy | | | | 30,019,000 | | | | 663,257 | | | | 4/13/11 | | | | — | | | | (4,761 | ) |
Indian Rupee | | | JPHQ | | | | Buy | | | | 29,466,000 | | | | 651,038 | | | | 4/15/11 | | | | - | | | | (4,901 | ) |
Indian Rupee | | | JPHQ | | | | Buy | | | | 14,719,000 | | | | 323,850 | | | | 4/19/11 | | | | — | | | | (1,317 | ) |
Indian Rupee | | | DBAB | | | | Buy | | | | 10,360,000 | | | | 228,194 | | | | 4/19/11 | | | | — | | | | (1,178 | ) |
Euro | | | DBAB | | | | Sell | | | | 3,362,808 | | | | 4,461,815 | | | | 4/21/11 | | | | — | | | | (34,980 | ) |
Chilean Peso | | | MSCO | | | | Buy | | | | 220,380,000 | | | | 419,564 | | | | 4/25/11 | | | | 46,785 | | | | — | |
Indian Rupee | | | DBAB | | | | Buy | | | | 20,931,000 | | | | 462,155 | | | | 4/26/11 | | | | — | | | | (4,066 | ) |
Chilean Peso | | | JPHQ | | | | Buy | | | | 234,301,000 | | | | 446,075 | | | | 4/27/11 | | | | 49,640 | | | | — | |
Indian Rupee | | | JPHQ | | | | Buy | | | | 2,986,000 | | | | 65,887 | | | | 4/27/11 | | | | — | | | | (548 | ) |
Chilean Peso | | | CITI | | | | Buy | | | | 377,668,000 | | | | 723,502 | | | | 4/28/11 | | | | 75,464 | | | | — | |
Indian Rupee | | | JPHQ | | | | Buy | | | | 14,815,000 | | | | 326,898 | | | | 4/28/11 | | | | — | | | | (2,775 | ) |
Indian Rupee | | | JPHQ | | | | Buy | | | | 14,829,000 | | | | 327,351 | | | | 4/29/11 | | | | — | | | | (2,980 | ) |
Chilean Peso | | | DBAB | | | | Buy | | | | 1,554,000,000 | | | | 3,000,000 | | | | 5/04/11 | | | | 285,706 | | | | — | |
Euro | | | DBAB | | | | Sell | | | | 3,010,000 | | | | 3,997,581 | | | | 5/04/11 | | | | — | | | | (27,191 | ) |
Philippine Peso | | | JPHQ | | | | Buy | | | | 91,360,000 | | | | 2,000,000 | | | | 5/04/11 | | | | 89,003 | | | | — | |
Euro | | | DBAB | | | | Sell | | | | 100,000 | | | | 126,466 | | | | 5/10/11 | | | | — | | | | (7,244 | ) |
Euro | | | DBAB | | | | Sell | | | | 683,564 | | | | 841,331 | | | | 5/20/11 | | | | — | | | | (72,618 | ) |
Indian Rupee | | | DBAB | | | | Buy | | | | 28,359,000 | | | | 596,780 | | | | 6/01/11 | | | | 19,962 | | | | — | |
Indian Rupee | | | HSBC | | | | Buy | | | | 32,771,000 | | | | 680,842 | | | | 6/03/11 | | | | 31,601 | | | | — | |
Indian Rupee | | | DBAB | | | | Buy | | | | 20,889,000 | | | | 432,127 | | | | 6/07/11 | | | | 21,683 | | | | — | |
Indian Rupee | | | HSBC | | | | Buy | | | | 5,576,000 | | | | 117,069 | | | | 6/08/11 | | | | 4,047 | | | | — | |
Indian Rupee | | | DBAB | | | | Buy | | | | 5,655,000 | | | | 117,641 | | | | 6/10/11 | | | | 5,149 | | | | — | |
FSI-30
Franklin Templeton Variable Insurance Products Trust
Statement of Investments, December 31, 2010 (continued)
|
| Franklin Strategic Income Securities Fund |
| | | | | | | | | | | | | | | | | | | | | | | | | | | | | | | | |
| Currency | | Counterparty | | | Type | | | Quantity | | | Contract
Amount* | | | Settlement Date | | | Unrealized
Appreciation | | | Unrealized
Depreciation | |
Indian Rupee | | | HSBC | | | | Buy | | | | 14,080,000 | | | | 292,955 | | | | | | | | 6/13/11 | | | $ | 12,610 | | | $ | — | |
Indian Rupee | | | DBAB | | | | Buy | | | | 14,156,000 | | | | 296,958 | | | | | | | | 6/16/11 | | | | 10,095 | | | | — | |
Indian Rupee | | | DBAB | | | | Buy | | | | 12,894,000 | | | | 270,825 | | | | | | | | 6/20/11 | | | | 8,659 | | | | — | |
Euro | | | DBAB | | | | Sell | | | | 1,768,675 | | | | 2,164,858 | | | | | | | | 6/27/11 | | | | — | | | | (199,502 | ) |
Euro | | | UBSW | | | | Sell | | | | 4,274,000 | | | | 5,266,936 | | | | | | | | 6/29/11 | | | | — | | | | (446,484 | ) |
Euro | | | DBAB | | | | Sell | | | | 1,245,890 | | | | 1,542,411 | | | | | | | | 6/29/11 | | | | — | | | | (123,075 | ) |
Euro | | | DBAB | | | | Sell | | | | 1,485,071 | | | | 1,870,595 | | | | | | | | 7/07/11 | | | | — | | | | (114,544 | ) |
Indian Rupee | | | JPHQ | | | | Buy | | | | 192,280,000 | | | | 4,000,000 | | | | | | | | 7/14/11 | | | | 152,729 | | | | — | |
Euro | | | DBAB | | | | Sell | | | | 1,056,111 | | | | 1,384,562 | | | | | | | | 8/08/11 | | | | — | | | | (26,943 | ) |
Chilean Peso | | | JPHQ | | | | Buy | | | | 1,543,470,600 | | | | 2,982,552 | | | | | | | | 8/18/11 | | | | 249,020 | | | | — | |
Japanese Yen | | | UBSW | | | | Sell | | | | 32,055,000 | | | | 377,220 | | | | | | | | 8/18/11 | | | | — | | | | (18,939 | ) |
Japanese Yen | | | DBAB | | | | Sell | | | | 19,550,000 | | | | 230,068 | | | | | | | | 8/18/11 | | | | — | | | | (11,545 | ) |
Japanese Yen | | | JPHQ | | | | Sell | | | | 15,928,000 | | | | 186,467 | | | | | | | | 8/18/11 | | | | — | | | | (10,383 | ) |
Chilean Peso | | | JPHQ | | | | Buy | | | | 509,866,000 | | | | 983,822 | | | | | | | | 8/19/11 | | | | 83,587 | | | | — | |
Japanese Yen | | | HSBC | | | | Sell | | | | 15,854,000 | | | | 186,546 | | | | | | | | 8/19/11 | | | | - | | | | (9,393 | ) |
Euro | | | BZWS | | | | Sell | | | | 2,124,000 | | | | 2,728,809 | | | | | | | | 8/22/11 | | | | — | | | | (109,739 | ) |
Euro | | | UBSW | | | | Sell | | | | 1,750,000 | | | | 2,253,510 | | | | | | | | 8/22/11 | | | | — | | | | (85,218 | ) |
Japanese Yen | | | BZWS | | | | Sell | | | | 15,895,000 | | | | 187,119 | | | | | | | | 8/22/11 | | | | — | | | | (9,338 | ) |
Japanese Yen | | | DBAB | | | | Sell | | | | 15,915,000 | | | | 187,588 | | | | | | | | 8/22/11 | | | | — | | | | (9,116 | ) |
Japanese Yen | | | MSCO | | | | Sell | | | | 12,500,000 | | | | 147,156 | | | | | | | | 8/22/11 | | | | — | | | | (7,340 | ) |
Euro | | | UBSW | | | | Sell | | | | 1,750,000 | | | | 2,249,835 | | | | | | | | 8/23/11 | | | | — | | | | (88,881 | ) |
Japanese Yen | | | FBCO | | | | Sell | | | | 31,524,000 | | | | 370,871 | | | | | | | | 8/23/11 | | | | — | | | | (18,763 | ) |
Japanese Yen | | | CITI | | | | Sell | | | | 31,757,000 | | | | 374,480 | | | | | | | | 8/23/11 | | | | — | | | | (18,033 | ) |
Japanese Yen | | | DBAB | | | | Sell | | | | 15,708,000 | | | | 185,538 | | | | | | | | 8/23/11 | | | | — | | | | (8,611 | ) |
Japanese Yen | | | JPHQ | | | | Sell | | | | 31,689,000 | | | | 373,471 | | | | | | | | 8/24/11 | | | | — | | | | (18,209 | ) |
Japanese Yen | | | BZWS | | | | Sell | | | | 31,584,000 | | | | 373,175 | | | | | | | | 8/24/11 | | | | — | | | | (17,208 | ) |
Euro | | | BZWS | | | | Sell | | | | 2,785,000 | | | | 3,524,418 | | | | | | | | 8/25/11 | | | | — | | | | (197,444 | ) |
Euro | | | DBAB | | | | Sell | | | | 993,304 | | | | 1,275,551 | | | | | | | | 8/25/11 | | | | — | | | | (51,896 | ) |
Japanese Yen | | | DBAB | | | | Sell | | | | 660,099,000 | | | | 7,771,673 | | | | | | | | 8/25/11 | | | | — | | | | (387,389 | ) |
Japanese Yen | | | BZWS | | | | Sell | | | | 12,568,000 | | | | 148,103 | | | | | | | | 8/25/11 | | | | — | | | | (7,242 | ) |
Japanese Yen | | | HSBC | | | | Sell | | | | 100,248,000 | | | | 1,199,235 | | | | | | | | 8/26/11 | | | | — | | | | (39,890 | ) |
Japanese Yen | | | UBSW | | | | Sell | | | | 34,903,000 | | | | 415,794 | | | | | | | | 8/26/11 | | | | — | | | | (15,628 | ) |
Japanese Yen | | | JPHQ | | | | Sell | | | | 15,991,000 | | | | 188,831 | | | | | | | | 8/26/11 | | | | — | | | | (8,827 | ) |
United States Dollar | | | UBSW | | | | Buy | | | | 3,000,000 | | | | 2,370,230 | | | | EUR | | | | 8/26/11 | | | | — | | | | (167,548 | ) |
Japanese Yen | | | BZWS | | | | Sell | | | | 37,600,000 | | | | 446,588 | | | | | | | | 8/30/11 | | | | — | | | | (18,206 | ) |
Japanese Yen | | | JPHQ | | | | Sell | | | | 15,743,000 | | | | 185,561 | | | | | | | | 9/01/11 | | | | — | | | | (9,054 | ) |
Philippine Peso | | | HSBC | | | | Buy | | | | 16,853,000 | | | | 373,963 | | | | | | | | 10/04/11 | | | | 10,212 | | | | — | |
Philippine Peso | | | DBAB | | | | Buy | | | | 21,010,000 | | | | 466,930 | | | | | | | | 10/04/11 | | | | 12,005 | | | | — | |
Euro | | | UBSW | | | | Sell | | | | 2,850,000 | | | | 3,899,028 | | | | | | | | 10/05/11 | | | | 91,122 | | | | — | |
Philippine Peso | | | HSBC | | | | Buy | | | | 25,126,000 | | | | 561,375 | | | | | | | | 10/05/11 | | | | 11,382 | | | | — | |
Philippine Peso | | | DBAB | | | | Buy | | | | 25,119,000 | | | | 560,905 | | | | | | | | 10/05/11 | | | | 11,692 | | | | — | |
Philippine Peso | | | JPHQ | | | | Buy | | | | 6,636,000 | | | | 148,244 | | | | | | | | 10/06/11 | | | | 3,024 | | | | — | |
Euro | | | BZWS | | | | Sell | | | | 2,749,000 | | | | 3,825,508 | | | | | | | | 10/07/11 | | | | 152,592 | | | | — | |
Philippine Peso | | | DBAB | | | | Buy | | | | 20,621,000 | | | | 463,539 | | | | | | | | 10/07/11 | | | | 6,515 | | | | — | |
Philippine Peso | | | CITI | | | | Buy | | | | 8,254,000 | | | | 186,624 | | | | | | | | 10/11/11 | | | | 1,518 | | | | — | |
Philippine Peso | | | JPHQ | | | | Buy | | | | 8,232,000 | | | | 185,828 | | | | | | | | 10/11/11 | | | | 1,812 | | | | — | |
Philippine Peso | | | DBAB | | | | Buy | | | | 16,501,000 | | | | 372,660 | | | | | | | | 10/11/11 | | | | 3,464 | | | | — | |
Philippine Peso | | | HSBC | | | | Buy | | | | 16,532,000 | | | | 372,771 | | | | | | | | 10/11/11 | | | | 4,060 | | | | — | |
Philippine Peso | | | DBAB | | | | Buy | | | | 4,913,000 | | | | 111,492 | | | | | | | | 10/12/11 | | | | 494 | | | | - | |
Euro | | | DBAB | | | | Sell | | | | 595,343 | | | | 823,419 | | | | | | | | 10/13/11 | | | | 28,014 | | | | — | |
Philippine Peso | | | HSBC | | | | Buy | | | | 8,192,000 | | | | 184,525 | | | | | | | | 10/13/11 | | | | 2,199 | | | | — | |
Philippine Peso | | | JPHQ | | | | Buy | | | | 18,311,000 | | | | 413,201 | | | | | | | | 10/13/11 | | | | 4,171 | | | | — | |
FSI-31
Franklin Templeton Variable Insurance Products Trust
Statement of Investments, December 31, 2010 (continued)
|
| Franklin Strategic Income Securities Fund |
| | | | | | | | | | | | | | | | | | | | | | | | | | | | |
| Currency | | Counterparty | | | Type | | | Quantity | | | Contract
Amount* | | | Settlement
Date | | | Unrealized
Appreciation | | | Unrealized
Depreciation | |
Japanese Yen | | | DBAB | | | | Sell | | | | 382,080,000 | | | | 4,725,379 | | | | 10/20/11 | | | $ | — | | | $ | (2,873 | ) |
Philippine Peso | | | JPHQ | | | | Buy | | | | 237,550,000 | | | | 5,353,601 | | | | 10/21/11 | | | | 60,561 | | | | — | |
Japanese Yen | | | JPHQ | | | | Sell | | | | 270,990,000 | | | | 3,355,498 | | | | 10/25/11 | | | | 1,577 | | | | — | |
Euro | | | BZWS | | | | Sell | | | | 1,993,000 | | | | 2,780,235 | | | | 10/26/11 | | | | 117,701 | | | | — | |
Euro | | | UBSW | | | | Sell | | | | 2,679,000 | | | | 3,731,177 | | | | 10/27/11 | | | | 152,206 | | | | — | |
Japanese Yen | | | JPHQ | | | | Sell | | | | 360,360,000 | | | | 4,441,076 | | | | 10/31/11 | | | | — | | | | (19,591 | ) |
Euro | | | UBSW | | | | Sell | | | | 1,480,440 | | | | 2,005,404 | | | | 11/17/11 | | | | 27,876 | | | | — | |
Philippine Peso | | | JPHQ | | | | Buy | | | | 191,280,000 | | | | 4,322,712 | | | | 11/25/11 | | | | 35,335 | | | | — | |
Japanese Yen | | | BOFA | | | | Sell | | | | 620,288,000 | | | | 7,491,401 | | | | 11/28/11 | | | | — | | | | (192,010 | ) |
Euro | | | UBSW | | | | Sell | | | | 3,920,000 | | | | 5,143,236 | | | | 12/01/11 | | | | — | | | | (92,555 | ) |
Japanese Yen | | | BZWS | | | | Sell | | | | 257,790,000 | | | | 3,082,875 | | | | 12/05/11 | | | | — | | | | (110,877 | ) |
Euro | | | DBAB | | | | Sell | | | | 3,210,000 | | | | 4,245,546 | | | | 12/08/11 | | | | — | | | | (41,749 | ) |
Euro | | | DBAB | | | | Sell | | | | 2,870,000 | | | | 3,822,697 | | | | 12/09/11 | | | | — | | | | (10,470 | ) |
Euro | | | UBSW | | | | Sell | | | | 3,400,000 | | | | 4,491,128 | | | | 12/12/11 | | | | — | | | | (49,826 | ) |
Euro | | | DBAB | | | | Sell | | | | 1,410,000 | | | | 1,858,380 | | | | 12/12/11 | | | | — | | | | (24,780 | ) |
Japanese Yen | | | UBSW | | | | Sell | | | | 351,760,000 | | | | 4,208,159 | | | | 12/12/11 | | | | — | | | | (150,531 | ) |
Euro | | | CITI | | | | Sell | | | | 3,868,000 | | | | 5,157,398 | | | | 12/15/11 | | | | — | | | | (8,514 | ) |
Euro | | | DBAB | | | | Sell | | | | 486,875 | | | | 649,092 | | | | 12/15/11 | | | | — | | | | (1,153 | ) |
British Pound | | | DBAB | | | | Sell | | | | 600,000 | | | | 943,620 | | | | 12/16/11 | | | | 11,282 | | | | — | |
Euro | | | UBSW | | | | Sell | | | | 2,137,312 | | | | 2,847,413 | | | | 12/19/11 | | | | — | | | | (7,010 | ) |
| | | | | | | | | | | | | | | | | | | | | | | | |
Unrealized appreciation (depreciation) | | | | | | | | | | | | | | | | 5,206,552 | | | | (4,719,909 | ) |
| | | | | | | | | | | | | | | | | | | | | | | | |
Net unrealized appreciation (depreciation) | | | | | | | | | | | | | | | $ | 486,643 | | | | | |
| | | | | | | | | | | | | | | | | | | | | | | | | | | | |
*In U.S. dollars unless otherwise indicated.
See Abbreviations on page FSI-46
FSI-32
Franklin Templeton Variable Insurance Products Trust
Financial Statements
Statement of Assets and Liabilities
December 31, 2010
| | | | |
| | | Franklin
Strategic Income
Securities Fund | |
Assets: | | | | |
Investments in securities: | | | | |
Cost - Unaffiliated issuers | | $ | 1,377,522,100 | |
Cost - Sweep Money Fund (Note 7) | | | 36,427,159 | |
| | | | |
Total cost of investments | | $ | 1,413,949,259 | |
| | | | |
Value - Unaffiliated issuers | | $ | 1,442,580,850 | |
Value - Sweep Money Fund (Note 7) | | | 36,427,159 | |
| | | | |
Total value of investments | | | 1,479,008,009 | |
Cash | | | 5,769,902 | |
Foreign currency, at value (cost $57,551) | | | 57,593 | |
Receivables: | | | | |
Investment securities sold | | | 4,983,588 | |
Capital shares sold | | | 219,953 | |
Interest | | | 19,208,551 | |
Unrealized appreciation on forward exchange contracts | | | 5,206,552 | |
Other assets | | | 24,645 | |
| | | | |
Total assets | | | 1,514,478,793 | |
| | | | |
Liabilities: | | | | |
Payables: | | | | |
Investment securities purchased | | | 20,123,060 | |
Capital shares redeemed | | | 3,720,044 | |
Affiliates | | | 835,321 | |
Unrealized depreciation on forward exchange contracts | | | 4,719,909 | |
Unrealized depreciation on unfunded loan commitments (Note 10) | | | 3,519 | |
Accrued expenses and other liabilities | | | 402,430 | |
| | | | |
Total liabilities | | | 29,804,283 | |
| | | | |
Net assets, at value | | $ | 1,484,674,510 | |
| | | | |
Net assets consist of: | | | | |
Paid-in capital | | $ | 1,355,243,154 | |
Undistributed net investment income | | | 83,363,411 | |
Net unrealized appreciation (depreciation) | | | 65,718,559 | |
Accumulated net realized gain (loss) | | | (19,650,614 | ) |
| | | | |
Net assets, at value | | $ | 1,484,674,510 | |
| | | | |
The accompanying notes are an integral part of these financial statements.
FSI-33
Franklin Templeton Variable Insurance Products Trust
Financial Statements (continued)
Statement of Assets and Liabilities (continued)
December 31, 2010
| | | | |
| | | Franklin
Strategic Income
Securities Fund | |
Class 1: | | | | |
Net assets, at value | | $ | 1,195,149,487 | |
| | | | |
Shares outstanding | | | 91,980,791 | |
| | | | |
Net asset value and maximum offering price per share | | $ | 12.99 | |
| | | | |
Class 2: | | | | |
Net assets, at value | | $ | 101,347,492 | |
| | | | |
Shares outstanding | | | 7,964,706 | |
| | | | |
Net asset value and maximum offering price per share | | $ | 12.72 | |
| | | | |
Class 4: | | | | |
Net assets, at value | | $ | 188,177,531 | |
| | | | |
Shares outstanding | | | 14,605,660 | |
| | | | |
Net asset value and maximum offering price per share | | $ | 12.88 | |
| | | | |
The accompanying notes are an integral part of these financial statements.
FSI-34
Franklin Templeton Variable Insurance Products Trust
Financial Statements (continued)
Statement of Operations
for the year ended December 31, 2010
| | | | |
| | | Franklin
Strategic Income
Securities Fund | |
Investment income: | | | | |
Dividends | | $ | 408,637 | |
Interest | | | 91,880,796 | |
| | | | |
Total investment income | | | 92,289,433 | |
| | | | |
Expenses: | | | | |
Management fees (Note 3a) | | | 4,989,196 | |
Administrative fees (Note 3b) | | | 2,928,291 | |
Distribution fees: (Note 3c) | | | | |
Class 2 | | | 210,569 | |
Class 4 | | | 627,253 | |
Unaffiliated transfer agent fees | | | 944 | |
Custodian fees (Note 4) | | | 265,785 | |
Reports to shareholders | | | 246,492 | |
Professional fees | | | 127,214 | |
Trustees’ fees and expenses | | | 6,581 | |
Other | | | 86,939 | |
| | | | |
Total expenses | | | 9,489,264 | |
Expense reductions (Note 4) | | | (918 | ) |
| | | | |
Net expenses | | | 9,488,346 | |
| | | | |
Net investment income | | | 82,801,087 | |
| | | | |
Realized and unrealized gains (losses): | | | | |
Net realized gain (loss) from: | | | | |
Investments | | | 54,975,046 | |
Foreign currency transactions | | | 2,973,607 | |
| | | | |
Net realized gain (loss) | | | 57,948,653 | |
| | | | |
Net change in unrealized appreciation (depreciation) on: | | | | |
Investments | | | 12,666,507 | |
Translation of other assets and liabilities denominated in foreign currencies | | | 1,063,494 | |
| | | | |
Net change in unrealized appreciation (depreciation) | | | 13,730,001 | |
| | | | |
Net realized and unrealized gain (loss) | | | 71,678,654 | |
| | | | |
Net increase (decrease) in net assets resulting from operations | | $ | 154,479,741 | |
| | | | |
The accompanying notes are an integral part of these financial statements.
FSI-35
Franklin Templeton Variable Insurance Products Trust
Financial Statements (continued)
Statements of Changes in Net Assets
| | | | | | | | |
| | | Franklin Strategic Income
Securities Fund | |
| | | Year Ended December 31, | |
| | | 2010 | | | 2009 | |
| | | | |
Increase (decrease) in net assets: | | | | | | | | |
Operations: | | | | | | | | |
Net investment income | | $ | 82,801,087 | | | $ | 73,041,521 | |
Net realized gain (loss) from investments and foreign currency transactions | | | 57,948,653 | | | | (1,836,787 | ) |
Net change in unrealized appreciation (depreciation) on investments and translation of other assets and liabilities denominated in foreign currencies | | | 13,730,001 | | | | 204,099,469 | |
| | | | |
Net increase (decrease) in net assets resulting from operations | | | 154,479,741 | | | | 275,304,203 | |
| | | | |
Distributions to shareholders from and net foreign currency gains: | | | | | | | | |
Net investment income: | | | | | | | | |
Class 1 | | | (57,255,268 | ) | | | (82,420,054 | ) |
Class 2 | | | (3,841,288 | ) | | | (3,695,069 | ) |
Class 4 | | | (8,302,315 | ) | | | (8,181,980 | ) |
| | | | |
Total distributions to shareholders | | | (69,398,871 | ) | | | (94,297,103 | ) |
| | | | |
Capital share transactions: (Note 2) | | | | | | | | |
Class 1 | | | (48,613,654 | ) | | | 112,467,004 | |
Class 2 | | | 28,343,361 | | | | 27,727,705 | |
Class 4 | | | 16,237,324 | | | | 86,145,347 | |
| | | | |
Total capital share transactions | | | (4,032,969 | ) | | | 226,340,056 | |
| | | | |
Net increase (decrease) in net assets | | | 81,047,901 | | | | 407,347,156 | |
Net assets: | | | | | | | | |
Beginning of year | | | 1,403,626,609 | | | | 996,279,453 | |
| | | | |
End of year | | $ | 1,484,674,510 | | | $ | 1,403,626,609 | |
| | | | |
Undistributed net investment income included in net assets: | | | | | | | | |
End of year | | $ | 83,363,411 | | | $ | 66,211,757 | |
| | | | |
The accompanying notes are an integral part of these financial statements.
FSI-36
Franklin Templeton Variable Insurance Products Trust
Notes to Financial Statements
Franklin Strategic Income Securities Fund
1. ORGANIZATION AND SIGNIFICANT ACCOUNTING POLICIES
Franklin Templeton Variable Insurance Products Trust (Trust) is registered under the Investment Company Act of 1940, as amended, (1940 Act) as an open-end investment company, consisting of twenty separate funds. The Franklin Strategic Income Securities Fund (Fund) is included in this report. The financial statements of the remaining funds in the Trust are presented separately. Shares of the Fund are generally sold only to insurance company separate accounts to fund the benefits of variable life insurance policies or variable annuity contracts. At December 31, 2010, 94.31% of the Fund’s shares were held through one insurance company. The Fund offers three classes of shares: Class 1, Class 2 and Class 4. Each class of shares differs by its distribution fees, voting rights on matters affecting a single class and its exchange privilege.
The following summarizes the Fund’s significant accounting policies.
a. Financial Instrument Valuation
The Fund values its investments in securities and other assets and liabilities carried at fair value daily. Fair value is the price that would be received to sell an asset or paid to transfer a liability in an orderly transaction between market participants on the measurement date. Under procedures approved by the Trust’s Board of Trustees, the Fund may utilize independent pricing services, quotations from securities and financial instrument dealers, and other market sources to determine fair value.
Equity securities listed on an exchange or on the NASDAQ National Market System are valued at the last quoted sale price or the official closing price of the day, respectively. Over-the-counter securities are valued within the range of the most recent quoted bid and ask prices. Securities that trade in multiple markets or on multiple exchanges are valued according to the broadest and most representative market. Certain equity securities are valued based upon fundamental characteristics or relationships to similar securities. Investments in open-end mutual funds are valued at closing net asset value.
Debt securities generally trade in the over-the-counter market rather than on a securities exchange. The Fund’s pricing services use multiple valuation techniques to determine fair value. In instances where sufficient market activity exists, the pricing services may utilize a market-based approach through which quotes from market makers are used to determine fair value. In instances where sufficient market activity may not exist or is limited, the pricing services also utilize proprietary valuation models which may consider market characteristics such as benchmark yield curves, option-adjusted spreads, credit spreads, estimated default rates, coupon rates, anticipated timing of principal repayments, underlying collateral, and other unique security features in order to estimate the relevant cash flows, which are then discounted to calculate the fair value. Securities denominated in a foreign currency are converted into their U.S. dollar equivalent at the foreign exchange rate in effect at the close of the NYSE on the date that the values of the foreign debt securities are determined.
Certain derivative financial instruments (derivatives) trade in the over-the-counter market. The Fund’s pricing services use various techniques including industry standard option pricing models and proprietary discounted cash flow models to determine the fair value of those instruments. The Fund’s net benefit or obligation under the derivative contract, as measured by the fair market value of the contract, is included in net assets.
The Fund has procedures to determine the fair value of securities and other financial instruments for which market prices are not readily available or which may not be reliably priced. Under these procedures, the Fund primarily employs a market-based approach which may use related or comparable assets or liabilities, recent transactions, market multiples, book values, and other relevant information for the investment to determine the fair value of the investment. The Fund may also use an income-based valuation approach in which the anticipated future cash flows of the investment are discounted to calculate fair value. Discounts may also be applied due to the nature or duration of any restrictions on the disposition of the investments. Due to the inherent uncertainty of valuations of such investments, the fair values may differ significantly from the values that would have been used had an active market existed.
FSI-37
Franklin Templeton Variable Insurance Products Trust
Notes to Financial Statements (continued)
Franklin Strategic Income Securities Fund
1. ORGANIZATION AND SIGNIFICANT ACCOUNTING POLICIES (continued)
b. Foreign Currency Translation
Portfolio securities and other assets and liabilities denominated in foreign currencies are translated into U.S. dollars based on the exchange rate of such currencies against U.S. dollars on the date of valuation. The Fund may enter into foreign currency exchange contracts to facilitate transactions denominated in a foreign currency. Purchases and sales of securities, income and expense items denominated in foreign currencies are translated into U.S. dollars at the exchange rate in effect on the transaction date. Portfolio securities and assets and liabilities denominated in foreign currencies contain risks that those currencies will decline in value relative to the U.S. dollar. Occasionally, events may impact the availability or reliability of foreign exchange rates used to convert the U.S. dollar equivalent value. If such an event occurs, the foreign exchange rate will be valued at fair value using procedures established and approved by the Trust’s Board of Trustees.
The Fund does not separately report the effect of changes in foreign exchange rates from changes in market prices on securities held. Such changes are included in net realized and unrealized gain or loss from investments on the Statement of Operations.
Realized foreign exchange gains or losses arise from sales of foreign currencies, currency gains or losses realized between the trade and settlement dates on securities transactions and the difference between the recorded amounts of dividends, interest, and foreign withholding taxes and the U.S. dollar equivalent of the amounts actually received or paid. Net unrealized foreign exchange gains and losses arise from changes in foreign exchange rates on foreign denominated assets and liabilities other than investments in securities held at the end of the reporting period.
c. Securities Purchased on a Delayed Delivery and TBA Basis
The Fund may purchase securities on a delayed delivery and to-be-announced (TBA) basis, with payment and delivery scheduled for a future date. These transactions are subject to market fluctuations and are subject to the risk that the value at delivery may be more or less than the trade date purchase price. Although the Fund will generally purchase these securities with the intention of holding the securities, it may sell the securities before the settlement date. Sufficient assets have been segregated for these securities.
d. Derivative Financial Instruments
The Fund invested in derivatives in order to manage risk or gain exposure to various other investments or markets. Derivatives are financial contracts based on an underlying or notional amount, require no initial investment or an initial net investment that is smaller than would normally be required to have a similar response to changes in market factors, and require or permit net settlement. Derivatives contain various risks including the potential inability of the counterparty to fulfill their obligations under the terms of the contract, the potential for an illiquid secondary market, and/or the potential for market movements which expose the Fund to gains or losses in excess of the amounts shown on the Statement of Assets and Liabilities. Realized gain and loss and unrealized appreciation and depreciation on these contracts for the period are included in the Statement of Operations.
The Fund entered into forward exchange contracts primarily to manage and/or gain exposure to certain foreign currencies. A forward exchange contract is an agreement between the Fund and a counterparty to buy or sell a foreign currency for a specific exchange rate on a future date. Pursuant to the terms of the forward exchange contracts, cash or securities may be required to be deposited as collateral. Unrestricted cash may be invested according to the Fund’s investment objectives.
See Note 11 regarding other derivative information.
FSI-38
Franklin Templeton Variable Insurance Products Trust
Notes to Financial Statements (continued)
Franklin Strategic Income Securities Fund
1. ORGANIZATION AND SIGNIFICANT ACCOUNTING POLICIES (continued)
e. FT Holdings Corporation III
The Fund invests in certain securities through its investment in FT Holdings Corporation III, a Delaware limited liability company and a wholly-owned subsidiary (Subsidiary) of the Fund. The Subsidiary has the ability to invest in securities consistent with the investment objective of the Fund. At December 31, 2010, all Subsidiary investments as well as any other assets and liabilities are reflected in the Fund’s Statement of Investments and Statement of Assets and Liabilities. All income and expenses of the Subsidiary during the period ended December 31, 2010, have been included in the Fund’s Statement of Operations.
f. Mortgage Dollar Rolls
The Fund may enter into mortgage dollar rolls, typically on a TBA basis. Mortgage dollar rolls are agreements between the Fund and a financial institution to simultaneously sell and repurchase mortgage-backed securities at a future date. Gains or losses are realized on the initial sale, and the difference between the repurchase price and the sale price is recorded as an unrealized gain or loss to the fund upon entering into the mortgage dollar roll. In addition, the Fund may invest the cash proceeds that are received from the initial sale. During the period between the sale and repurchase, the Fund is not entitled to principal and interest paid on the mortgage backed securities. The risks of mortgage dollar roll transactions include the potential inability of the counterparty to fulfill its obligations.
g. Senior Floating Rate Interests
Senior secured corporate loans pay interest at rates which are periodically reset by reference to a base lending rate plus a spread. These base lending rates are generally the prime rate offered by a designated U.S. bank or the London InterBank Offered Rate (LIBOR). Senior secured corporate loans often require prepayment of principal from excess cash flows or at the discretion of the borrower. As a result, actual maturity may be substantially less than the stated maturity.
Senior secured corporate loans in which the Fund invests are generally readily marketable, but may be subject to some restrictions on resale.
h. Income Taxes
It is the Fund’s policy to qualify as a regulated investment company under the Internal Revenue Code. The Fund intends to distribute to shareholders substantially all of its taxable income and net realized gains to relieve it from federal income and excise taxes. As a result, no provision for U.S. federal income taxes is required. The Fund files U.S. income tax returns as well as tax returns in certain other jurisdictions. The Fund’s application of those tax rules is subject to its understanding. The Fund records a provision for taxes in its financial statements including penalties and interest, if any, for a tax position taken on a tax return (or expected to be taken) when it fails to meet the more likely than not (a greater than 50% probability) threshold and based on the technical merits, the tax position may not be sustained upon examination by the tax authorities. As of December 31, 2010, and for all open tax years, the Fund has determined that no provision for income tax is required in the Fund’s financial statements. Open tax years are those that remain subject to examination and are based on each tax jurisdiction statute of limitation. The Fund is not aware of any tax position for which it is reasonably possible that the total amounts of unrecognized tax effects will significantly change in the next twelve months.
The Fund may be subject to foreign taxation related to income received, capital gains on the sale of securities and certain foreign currency transactions in the foreign jurisdictions in which it invests. Foreign taxes, if any, are recorded based on the tax regulations and rates that exist in the foreign markets in which the Fund invests. When a capital gain tax is determined to apply the Fund records an estimated deferred tax liability for net unrealized gains on these securities in an amount that would be payable if the securities were disposed of on the valuation date.
FSI-39
Franklin Templeton Variable Insurance Products Trust
Notes to Financial Statements (continued)
Franklin Strategic Income Securities Fund
1. ORGANIZATION AND SIGNIFICANT ACCOUNTING POLICIES (continued)
i. Security Transactions, Investment Income, Expenses and Distributions
Security transactions are accounted for on trade date. Realized gains and losses on security transactions are determined on a specific identification basis. Interest income and estimated expenses are accrued daily. Amortization of premium and accretion of discount on debt securities are included in interest income. Facility fees are recognized as income over the expected term of the loan. Dividend income is recorded on the ex-dividend date. Distributions to shareholders are recorded on the ex-dividend date and are determined according to income tax regulations (tax basis). Distributable earnings determined on a tax basis may differ from earnings recorded in accordance with accounting principles generally accepted in the United States of America. These differences may be permanent or temporary. Permanent differences are reclassified among capital accounts to reflect their tax character. These reclassifications have no impact on net assets or the results of operations. Temporary differences are not reclassified, as they may reverse in subsequent periods.
Common expenses incurred by the Trust are allocated among the funds based on the ratio of net assets of each fund to the combined net assets of the Trust. Fund specific expenses are charged directly to the fund that incurred the expense.
Realized and unrealized gains and losses and net investment income, not including class specific expenses, are allocated daily to each class of shares based upon the relative proportion of net assets of each class. Differences in per share distributions, by class, are generally due to differences in class specific expenses.
Inflation-indexed bonds are adjusted for inflation through periodic increases or decreases in the security’s interest accruals, face amount, or principal redemption value, by amounts corresponding to the rate of inflation as measured by an index. Any increase or decrease in the face amount or principal redemption value will be included as interest income on the Statement of Operations.
j. Accounting Estimates
The preparation of financial statements in accordance with accounting principles generally accepted in the United States of America requires management to make estimates and assumptions that affect the reported amounts of assets and liabilities at the date of the financial statements and the amounts of income and expenses during the reporting period. Actual results could differ from those estimates.
k. Guarantees and Indemnifications
Under the Trust’s organizational documents, its officers and trustees are indemnified by the Trust against certain liabilities arising out of the performance of their duties to the Trust. Additionally, in the normal course of business, the Trust, on behalf of the Fund, enters into contracts with service providers that contain general indemnification clauses. The Trust’s maximum exposure under these arrangements is unknown as this would involve future claims that may be made against the Trust that have not yet occurred. Currently, the Trust expects the risk of loss to be remote.
2. SHARES OF BENEFICIAL INTEREST
At December 31, 2010, there were an unlimited number of shares authorized (without par value). Transactions in the Fund’s shares were as follows:
| | | | | | | | | | | | | | | | |
| | | Year Ended December 31, | |
| | | 2010 | | | 2009 | |
| Class 1 Shares: | | Shares | | | Amount | | | Shares | | | Amount | |
Shares sold | | | 4,513,968 | | | $ | 56,940,927 | | | | 9,412,738 | | | $ | 106,695,495 | |
Shares issued in reinvestment of distributions | | | 4,747,535 | | | | 57,255,268 | | | | 7,520,078 | | | | 82,420,054 | |
Shares redeemed | | | (12,820,410 | ) | | | (162,809,849 | ) | | | (6,784,394 | ) | | | (76,648,545 | ) |
| | | | |
Net increase (decrease) | | | (3,558,907 | ) | | $ | (48,613,654 | ) | | | 10,148,422 | | | $ | 112,467,004 | |
| | | | |
FSI-40
Franklin Templeton Variable Insurance Products Trust
Notes to Financial Statements (continued)
Franklin Strategic Income Securities Fund
2. SHARES OF BENEFICIAL INTEREST (continued)
| | | | | | | | | | | | | | | | |
| | | Year Ended December 31, | |
| | | 2010 | | | 2009 | |
| Class 2 Shares: | | Shares | | | Amount | | | Shares | | | Amount | |
Shares sold | | | 3,451,058 | | | $ | 42,785,482 | | | | 2,996,388 | | | $ | 33,743,716 | |
Shares issued in reinvestment of distributions | | | 324,982 | | | | 3,841,288 | | | | 343,408 | | | | 3,695,069 | |
Shares redeemed | | | (1,474,432 | ) | | | (18,283,409 | ) | | | (862,128 | ) | | | (9,711,080 | ) |
| | | | |
Net increase (decrease) | | | 2,301,608 | | | $ | 28,343,361 | | | | 2,477,668 | | | $ | 27,727,705 | |
| | | | |
Class 4 Shares: | | | | | | | | | | | | | | | | |
Shares sold | | | 2,251,182 | | | $ | 28,170,784 | | | | 7,159,387 | | | $ | 81,195,127 | |
Shares issued on reinvestment of distributions | | | 693,015 | | | | 8,302,315 | | | | 750,640 | | | | 8,181,980 | |
Shares redeemed | | | (1,626,043 | ) | | | (20,235,775 | ) | | | (291,537 | ) | | | (3,231,760 | ) |
| | | | |
Net increase (decrease) | | | 1,318,154 | | | $ | 16,237,324 | | | | 7,618,490 | | | $ | 86,145,347 | |
| | | | |
3. TRANSACTIONS WITH AFFILIATES
Franklin Resources, Inc. is the holding company for various subsidiaries that together are referred to as Franklin Templeton Investments. Certain officers and trustees of the Fund are also officers and/or directors of the following subsidiaries:
| | |
| Subsidiary | | Affiliation |
Franklin Advisers, Inc. (Advisers) | | Investment manager |
Franklin Templeton Services, LLC (FT Services) | | Administrative manager |
Franklin Templeton Distributors, Inc. (Distributors) | | Principal underwriter |
Franklin Templeton Investor Services, LLC (Investor Services) | | Transfer agent |
a. Management Fees
The Fund pays an investment management fee to Advisers based on the average daily net assets of the Fund as follows:
| | |
| Annualized Fee Rate | | Net Assets |
| 0.425% | | Up to and including $500 million |
| 0.325% | | Over $500 million, up to and including $1 billion |
| 0.280% | | Over $1 billion, up to and including $1.5 billion |
| 0.235% | | Over $1.5 billion, up to and including $6.5 billion |
| 0.215% | | Over $6.5 billion, up to and including $11.5 billion |
| 0.200% | | Over $11.5 billion, up to and including $16.5 billion |
| 0.190% | | Over $16.5 billion, up to and including $19 billion |
| 0.180% | | Over $19 billion, up to and including $21.5 billion |
| 0.170% | | In excess of $21.5 billion |
b. Administrative Fees
The Fund pays an administrative fee to FT Services of 0.20% per year of the average daily net assets of the Fund.
FSI-41
Franklin Templeton Variable Insurance Products Trust
Notes to Financial Statements (continued)
Franklin Strategic Income Securities Fund
3. TRANSACTIONS WITH AFFILIATES (continued)
c. Distribution Fees
The Trust’s Board of Trustees has adopted distribution plans for Class 2 and Class 4 shares pursuant to Rule 12b-1 under the 1940 Act. Under the Fund’s compensation distribution plans, the Fund pays Distributors for costs incurred in connection with the servicing, sale and distribution of the Fund’s shares up to 0.25% and 0.35% per year of its average daily net assets of Class 2 and Class 4, respectively.
d. Transfer Agent Fees
Investor Services, under terms of an agreement, performs shareholder servicing for the Fund and is not paid by the Fund for the services.
4. EXPENSE OFFSET ARRANGEMENT
The Fund has entered into an arrangement with its custodian whereby credits realized as a result of uninvested cash balances are used to reduce a portion of the Fund’s custodian expenses. During the year ended December 31, 2010, the custodian fees were reduced as noted in the Statement of Operations.
5. INCOME TAXES
For tax purposes, capital losses may be carried over to offset future capital gains, if any. At December 31, 2010, the Fund had tax basis capital losses of $19,427,750 expiring in 2017. During the year ended December 31, 2010, the Fund utilized $53,939,771 of capital loss carryforwards.
The tax character of distributions paid during the years ended December 31, 2010 and 2009, was as follows:
| | | | | | | | |
| | | 2010 | | | 2009 | |
Distributions paid from ordinary income | | $ | 69,467,803 | | | $ | 94,297,103 | |
At December 31, 2010, the cost of investments, net unrealized appreciation (depreciation), and undistributed ordinary income for income tax purposes were as follows:
| | | | |
Cost of investments | | $ | 1,419,420,368 | |
| | | | |
| |
Unrealized appreciation | | $ | 83,329,512 | |
Unrealized depreciation | | | (23,741,871 | ) |
| | | | |
Net unrealized appreciation (depreciation) | | $ | 59,587,641 | |
| | | | |
Distributable earnings - undistributed ordinary income | | $ | 87,334,160 | |
| | | | |
Net investment income (loss) differs for financial statement and tax purposes primarily due to differing treatments of defaulted securities, foreign currency transactions, mortgage dollar rolls, paydown losses, payments-in-kind, bond discounts and premiums, tax straddles, non-deductible expenses and inflation related adjustments on foreign securities.
Net realized gains (losses) differ for financial statement and tax purposes primarily due to differing treatments of defaulted securities, wash sales, foreign currency transactions, mortgage dollar rolls, paydown losses, payments-in-kind, bond discounts and premiums, tax straddles and inflation related adjustments on foreign securities.
FSI-42
Franklin Templeton Variable Insurance Products Trust
Notes to Financial Statements (continued)
Franklin Strategic Income Securities Fund
6. INVESTMENT TRANSACTIONS
Purchases and sales of investments (excluding short term securities) for the year ended December 31, 2010, aggregated $785,272,350 and $832,473,216, respectively.
7. INVESTMENTS IN INSTITUTIONAL FIDUCIARY TRUST MONEY MARKET PORTFOLIO
The Fund may invest in the Institutional Fiduciary Trust Money Market Portfolio (Sweep Money Fund), an open-end investment company managed by Advisers. Management fees paid by the Fund are reduced on assets invested in the Sweep Money Fund, in an amount not to exceed the management and administrative fees paid by the Sweep Money Fund.
8. CREDIT RISK AND DEFAULTED SECURITIES
At December 31, 2010, the Fund had 48.17% of its portfolio invested in high yield securities, senior secured floating rate notes, or other securities rated below investment grade. These securities may be more sensitive to economic conditions causing greater price volatility and are potentially subject to a greater risk of loss due to default than higher rated securities.
The Fund held defaulted securities and/or other securities for which the income has been deemed uncollectible. At December 31, 2010, the aggregate value of these securities was $7,116,312, representing 0.48% of the Fund’s net assets. The Fund discontinues accruing income on securities for which income has been deemed uncollectible and provides an estimate for losses on interest receivable. The securities have been identified on the accompanying Statement of Investments.
9. RESTRICTED SECURITIES
The Fund may invest in securities that are restricted under the Securities Act of 1933 (1933 Act) or which are subject to legal, contractual, or other agreed upon restrictions on resale. Restricted securities are often purchased in private placement transactions, and cannot be sold without prior registration unless the sale is pursuant to an exemption under the 1933 Act. Disposal of these securities may require greater effort and expense, and prompt sale at an acceptable price may be difficult. The Fund may have registration rights for restricted securities. The issuer generally incurs all registration costs.
At December 31, 2010, the Fund held investments in restricted securities, excluding certain securities exempt from registration under the 1933 Act deemed to be liquid, as follows:
| | | | | | | | | | | | | | | | |
| Shares | | | Issuer | | Acquisition
Dates | | | Cost | | | Value | |
| | 1,901,449 | | | aTurtle Bay Resort | | | 8/18/08 - 6/3/09 | | | $ | 2,042,976 | | | $ | 1,901,449 | |
| | | | | | | | | | | | | | | | |
| | | | Total Restricted Securities (0.13%a of Net Assets) | | | | | | | | | | | | |
aThe Fund also invests in unrestricted securities of the issuer, valued at $5,222,427 as of December 31, 2010.
10. UNFUNDED LOAN COMMITMENTS
The Fund may enter into certain credit agreements, all or a portion of which may be unfunded. The Fund is obligated to fund these loan commitments at the borrowers’ discretion. Funded portions of credit agreements are presented on the Statement of Investments.
FSI-43
Franklin Templeton Variable Insurance Products Trust
Notes to Financial Statements (continued)
Franklin Strategic Income Securities Fund
10. UNFUNDED LOAN COMMITMENTS (continued)
At December 31, 2010, unfunded commitments were as follows:
| | | | |
| Borrower | | Unfunded
Commitment | |
EnviroSolutions Real Property Holdings Inc., DIP Revolver,
FRN, 6.50%, 11/09/10 | | $ | 703,908 | |
| | | | |
Unfunded loan commitments and funded portions of credit agreements are marked to market daily and any unrealized appreciation or depreciation is included in the Statement of Assets and Liabilities and Statement of Operations.
11. OTHER DERIVATIVE INFORMATION
At December 31, 2010, the Fund has invested in derivative contracts which are reflected on the Statement of Assets and Liabilities as follows:
| | | | | | | | | | | | |
| | | Asset Derivatives | | | Liability Derivatives | |
Derivative Contracts Not Accounted
for as Hedging Instruments | | Statement of Assets and
Liabilities Location | | Fair Value
Amount | | | Statement of Assets and
Liabilities Location | | Fair Value
Amount | |
Foreign exchange contracts | | Unrealized appreciation on forward exchange contracts | | $ | 5,206,552 | | | Unrealized depreciation on forward exchange contracts | | $ | 4,719,909 | |
For the year ended December 31, 2010, the effect of derivative contracts on the Fund’s Statement of Operations was as follows:
| | | | | | | | | | | | | | |
Derivative Contracts Not Accounted
for as Hedging Instruments | | Statement of Operations Locations | | Realized Gain
(Loss) for the
Year | | | Change in
Unrealized
Appreciation
(Depreciation)
for the Year | | | Average
Amount
Outstanding
During the
Yeara | |
Foreign exchange contracts | | Net realized gain (loss) from foreign currency transactions / Net change in unrealized appreciation (depreciation) on translation of other assets and liabilities denominated in foreign currencies | | $ | 3,228,260 | | | $ | 920,965 | | | | 275,193,448 | |
aRepresents the average notional amount for derivative contracts outstanding during the year. For derivative contracts denominated in foreign currencies, notional amounts are converted into U.S. dollars.
See Note 1(d) regarding derivative financial instruments.
12. CREDIT FACILITY
The Fund, together with other U.S. registered and foreign investment funds (collectively “Borrowers”), managed by Franklin Templeton Investments, are borrowers in a joint syndicated senior unsecured credit facility totaling $750 million (Global Credit Facility) which matures on January 21, 2011. This Global Credit Facility provides a source of funds to the Borrowers for temporary and emergency purposes, including the ability to meet future unanticipated or unusually large redemption requests.
Under the terms of the Global Credit Facility, the Fund shall, in addition to interest charged on any borrowings made by the Fund and other costs incurred by the Fund, pay its share of fees and expenses incurred in connection with the implementation and maintenance of the Global Credit Facility, based upon its relative share of the aggregate net assets of all of the Borrowers, including an annual commitment fee of 0.10% based upon the unused portion of the Global Credit Facility, which is reflected in
FSI-44
Franklin Templeton Variable Insurance Products Trust
Notes to Financial Statements (continued)
Franklin Strategic Income Securities Fund
12. CREDIT FACILITY (continued)
other expenses on the Statement of Operations. During the year ended December 31, 2010, the Fund did not use the Global Credit Facility.
Effective January 21, 2011, the Borrowers renewed the Global Credit Facility for a total of $750 million, maturing January 20, 2012.
13. FAIR VALUE MEASUREMENTS
The Fund follows a fair value hierarchy that distinguishes between market data obtained from independent sources (observable inputs) and the Fund’s own market assumptions (unobservable inputs). These inputs are used in determining the value of the Fund’s investments and are summarized in the following fair value hierarchy:
| | • | | Level 1 – quoted prices in active markets for identical securities |
| | • | | Level 2 – other significant observable inputs (including quoted prices for similar securities, interest rates, prepayment speed, credit risk, etc.) |
| | • | | Level 3 – significant unobservable inputs (including the Fund’s own assumptions in determining the fair value of investments) |
The inputs or methodology used for valuing securities are not an indication of the risk associated with investing in those securities.
For movements between the levels within the fair value hierarchy, the Fund has adopted a policy of recognizing the transfers as of the date of the underlying event which caused the movement.
The following is a summary of the inputs used as of December 31, 2010, in valuing the Fund’s assets and liabilities carried at fair value:
| | | | | | | | | | | | | | | | |
| | | Level 1 | | | Level 2 | | | Level 3 | | | Total | |
| | | | |
Assets: | | | | | | | | | | | | | | | | |
Investments in Securities | | | | | | | | | | | | | | | | |
Equity Investmentsa | | | | | | | | | | | | | | | | |
Banks | | $ | 44,030 | | | $ | 26,400 | | | $ | — | | | $ | 70,430 | |
Consumer Services | | | | | | | | | | | 1,901,449 | | | | 1,901,449 | |
Diversified Financials | | | — | | | | 759,906 | | | | — | | | | 759,906 | |
Other Equity Investmentsb | | | 588,737 | | | | — | | | | — | c | | | 588,737 | |
Corporate Bonds | | | — | | | | 543,498,278 | | | | — | | | | 543,498,278 | |
Senior Floating Rate Interests | | | — | | | | 233,122,417 | | | | 835,411 | | | | 233,957,828 | |
Foreign Government and Agency Securities | | | — | | | | 331,068,361 | | | | — | | | | 331,068,361 | |
U.S. Government and Agency Securities | | | — | | | | 19,592,052 | | | | — | | | | 19,592,052 | |
Asset-Backed Securities and Commercial Mortgage-Backed Securities | | | — | | | | 82,125,010 | | | | — | | | | 82,125,010 | |
Mortgage-Backed Securities | | | — | | | | 102,020,069 | | | | — | | | | 102,020,069 | |
Municipal Bonds | | | — | | | | 85,969,060 | | | | — | | | | 85,969,060 | |
Short Term Investments | | | 36,427,159 | | | | 41,029,670 | | | | — | | | | 77,456,829 | |
| | | | |
Total Investments in Securities | | $ | 37,059,926 | | | $ | 1,439,211,223 | | | $ | 2,736,860 | | | $ | 1,479,008,009 | |
| | | | |
Forward Exchange Contracts | | | — | | | | 5,206,552 | | | | — | | | | 5,206,552 | |
Liabilities: | | | | | | | | | | | | | | | | |
Forward Exchange Contracts | | | — | | | | 4,719,909 | | | | — | | | | 4,719,909 | |
Unfunded Loan Commitments | | | — | | | | 3,519 | | | | — | | | | 3,519 | |
aIncludes common, preferred and convertible preferred stock.
bFor detailed industry descriptions, see the accompanying Statement of Investments.
c Includes securities determined to have no value at December 31, 2010.
FSI-45
Franklin Templeton Variable Insurance Products Trust
Notes to Financial Statements (continued)
Franklin Strategic Income Securities Fund
13. FAIR VALUE MEASUREMENTS (continued)
At December 31, 2010, the reconciliation of assets in which significant unobservable inputs (Level 3) were used in determining fair value, is as follows:
| | | | | | | | | | | | | | | | | | | | | | | | | | | | |
| | | Balance at
Beginning
of Year | | | Net
Realized
Gain (Loss) | | | Net Change in
Unrealized
Appreciation
(Depreciation) | | | Net
Purchases
(Sales) | | | Transfer In
(Out of)
Level 3 | | | Balance at
End of Year | | | Net Change
in Unrealized
Appreciation
(Depreciation)
on Assets Held
at Year End | |
Assets | | | | | | | | | | | | | | | | | | | | | | | | | | | | |
Equity Investments | | | | | | | | | | | | | | | | | | | | | | | | | | | | |
Consumer Services | | $ | — | | | $ | — | | | $ | (141,527 | ) | | $ | 2,042,976 | | | $ | — | | | $ | 1,901,449 | | | $ | (141,527 | ) |
Senior Floating Rate Interests | | | — | | | | — | | | | 286,871 | | | | 548,540 | | | | — | | | | 835,411 | | | | 286,871 | |
| | | | |
Total | | $ | — | | | $ | — | | | $ | 145,344 | | | $ | 2,591,516 | | | $ | — | | | $ | 2,736,860 | | | $ | 145,344 | |
| | | | |
14. SUBSEQUENT EVENTS
The Fund has evaluated subsequent events through the issuance of the financial statements and determined that no events have occurred that require disclosure other than those already disclosed in the financial statements.
| | | | |
ABBREVIATIONS | | | | |
| Counterparty | | Currency | | Selected Portfolio |
| | | | |
| BOFA - Bank of America N.A | | AUD - Australian Dollar | | CDO - Collateralized Debt Obligation |
| BZWS - Barclays Bank PLC | | BRL - Brazilian Real | | CLO - Collateralized Loan Obligation |
| CITI - Citibank N.A. | | EGP - Egyptian Pound | | DIP - Debt-In-Possession |
| DBAB - Deutsche Bank AG | | EUR - Euro | | FGIC - Financial Guaranty Insurance Co. |
| FBCO - Credit Suisse International | | GBP - British Pound | | FRN - Floating Rate Note |
| HSBC - HSBC Bank USA | | HUF - Hungarian Forint | | GO - General Obligation |
| JPHQ - JPMorgan Chase Bank, N.A. | | IDR - Indonesian Rupiah | | ID - Improvement District |
| MSCO - Morgan Stanley and Co., Inc. | | ILS - New Israeli Shekel | | IDA - Industrial Development Authority/Agency |
| UBSW - UBS AG | | KRW - South Korean Won | | L/C - Letter of Credit |
| | LKR - Sri Lankan Rupee | | NATL - National Public Financial Guarantee Corp. |
| | MXN - Mexican Peso MYR - Malaysian Ringgit NOK - Norwegian Krone NZD - - New Zealand Dollar PLN - Polish Zloty SEK - - Swedish Krona | | NATL RE - National Public Financial Guarantee Corp. Reinsured |
| | | PIK - Payment-In-Kind |
| | | SF - Single Family |
| | | USD - Unified/Union School District |
| | | |
| | | |
FSI-46
Franklin Templeton Variable Insurance Products Trust
Franklin Strategic Income Securities Fund
Report of Independent Registered Public Accounting Firm
To the Board of Trustees and Shareholders of
Franklin Strategic Income Securities Fund
In our opinion, the accompanying statement of assets and liabilities, including the statement of investments, and the related statements of operations and of changes in net assets and the financial highlights present fairly, in all material respects, the financial position of Franklin Strategic Income Securities Fund (the “Fund”) at December 31, 2010, the results of its operations for the year then ended, the changes in its net assets for each of the two years in the period then ended and the financial highlights for each of the periods presented, in conformity with accounting principles generally accepted in the United States of America. These financial statements and financial highlights (hereafter referred to as “financial statements”) are the responsibility of the Fund’s management. Our responsibility is to express an opinion on these financial statements based on our audits. We conducted our audits of these financial statements in accordance with the standards of the Public Company Accounting Oversight Board (United States). Those standards require that we plan and perform the audit to obtain reasonable assurance about whether the financial statements are free of material misstatement. An audit includes examining, on a test basis, evidence supporting the amounts and disclosures in the financial statements, assessing the accounting principles used and significant estimates made by management, and evaluating the overall financial statement presentation. We believe that our audits, which included confirmation of securities at December 31, 2010 by correspondence with the custodian and brokers, provide a reasonable basis for our opinion.
PricewaterhouseCoopers LLP
San Francisco, California
February 10, 2011
FSI-47
FRANKLIN TEMPLETON VIP FOUNDING FUNDS ALLOCATION FUND
This annual report for Franklin Templeton VIP Founding Funds Allocation Fund covers the fiscal year ended December 31, 2010.
Performance Summary as of 12/31/10
Average annual total return of Class 4 shares* represents the average annual change in value, assuming reinvestment of dividends and capital gains. Average returns smooth out variations in returns, which can be significant; they are not the same as year-by-year results.
Periods ended 12/31/10
| | | | | | | | |
| | | 1-Year | | | Inception
(7/2/07) | |
Average Annual Total Return | | | +10.24% | | | | -4.28% | |
*For the period beginning 2/29/08, Class 4 performance reflects a 12b-1 fee expense of 0.35% per year, which affects future performance. Class 4 performance prior to 2/29/08 reflects historical Class 1 performance, which does not have a 12b-1 fee expense. Since 2/29/08 (effective date), the average annual total return of Class 4 shares was -0.28%. The administrator has contractually agreed to waive or assume certain expenses so that common expenses of the Fund (excluding Rule 12b-1 fees and acquired fund fees and expenses) do not exceed 0.10% (other than certain nonroutine expenses) until 4/30/11. If the administrator had not waived fees, the Fund’s total returns would have been lower.
Total Return Index Comparison
for a Hypothetical $10,000 Investment (7/2/07–12/31/10)
The graph below shows the change in value of a hypothetical $10,000 investment in the Fund over the indicated period and includes reinvestment of any income or distributions. The Fund’s performance* is compared to the performance of the Standard & Poor’s 500 Index (S&P 500) and the Morgan Stanley Capital International (MSCI) World Index. One cannot invest directly in an index, and an index is not representative of the Fund’s portfolio. Please see Important Notes to Performance Information preceding the Fund Summaries.
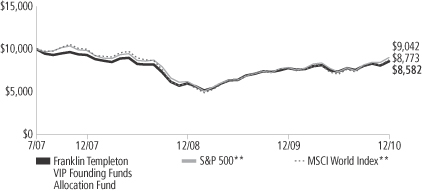
**Source: © 2011 Morningstar. Please see Index Descriptions following the Fund Summaries.
Franklin Templeton VIP Founding Funds Allocation Fund – Class 4
Performance reflects the Fund’s Class 4 operating expenses, but does not include any contract fees, expenses or sales charges. If they had been included, performance would be lower. These charges and deductions, particularly for variable life policies, can have a significant effect on contract values and insurance benefits. See the contract prospectus for a complete description of these expenses, including sales charges.
Performance data represent past performance, which does not guarantee future results. Investment return and principal value will fluctuate, and you may have a gain or loss when you sell your shares.
Current performance may differ from figures shown.
FFA-1
Fund Goals and Main Investments: Franklin Templeton VIP Founding Funds Allocation Fund seeks capital appreciation, with income as a secondary goal. The Fund normally invests equal portions in Class 1 shares of Franklin Income Securities Fund, Mutual Shares Securities Fund and Templeton Growth Securities Fund.
Performance Overview
You can find the Fund’s one-year total return in the Performance Summary. The Fund underperformed the Standard & Poor’s 500 Index’s (S&P 500’s) +15.06% total return and the MSCI World Index’s +12.34% total return for the same period.1
Economic and Market Overview
During the 12-month period ended December 31, 2010, the U.S. economy grew unevenly, supported by a combination of fundamental business improvement and government intervention. Economic activity as measured by gross domestic product expanded at an annualized 3.7% pace in 2010’s first quarter and then downshifted to 1.7% annualized in the second quarter. Consumer spending picked up, likely due to pent-up post-recession demand, and the pace of growth rose at annualized rates of 2.6% in the third quarter and an estimated 3.2% in the fourth quarter. Globally, emerging market regions primarily led growth, as they were generally unconstrained by the debt overhang burdening western economies and benefited from strong intrinsic demand and significant capital inflows. Developed economies grew at a more subdued pace, with demand recovery and asset price reflation heavily underpinned by government-sponsored, liquidity-enhancing measures.
In the U.S., challenges such as mixed economic data, elevated debt concerns surrounding the U.S. budget deficit and a lack of job prospects for the unemployed hindered consumer confidence and the economy’s advance. Although home prices rose early in the year, home sales stalled as a homebuyer tax credit program ended, foreclosures mounted and the housing sector remained weak. The unemployment situation showed little improvement. Even though the jobless rate fell from 10.0% in December 2009 to 9.4% at period-end, some of the decline was attributable to a shrinking labor force as many unemployed workers stopped looking for jobs.2
1. Source: © 2011 Morningstar. One cannot invest directly in an index, and an index is not representative of the Fund’s portfolio. Please see Index descriptions following the Fund summaries.
2. Source: Bureau of Labor Statistics.
Fund Risks: Because the Fund invests in underlying funds that may engage in a variety of investment strategies involving certain risks, this Fund may be subject to those same risks. Investments in stocks may offer the potential for long-term gains but can be subject to short-term price fluctuations. Because the underlying funds invest in bonds and other debt obligations, the Fund’s share price and yield will be affected by interest rate movements. Bond prices generally move in the opposite direction from interest rates. Thus, as prices of bonds in the Fund adjust to a rise in interest rates, the Fund’s share price may decline. High yield, lower rated (junk) bonds generally have greater price swings and higher default risks than investment-grade bonds. Foreign investing, especially in emerging markets, involves additional risks, including currency fluctuations, economic instability, market volatility, and political and social instability. Smaller and midsize company securities can increase the risk of greater price fluctuations, particularly over the short term. Underlying funds may use certain derivative instruments which may be volatile and illiquid, may give rise to leverage and may involve a small investment relative to the risk assumed. These and other risks are described more fully in the Fund’s and underlying funds’ prospectuses.
FFA-2
Amid signs of a demand-led recovery, crude oil prices rose from $79 per barrel at the end of December 2009 to $91 per barrel by the end of December 2010 largely due to accelerating global demand. The pace of inflation slowed during the year, and in December 2010 the inflation rate was an annualized 1.5%.2 Similarly, core inflation, which excludes volatile food and energy costs, slowed to a 0.8% annualized rate.2
Given few inflationary pressures and uncertainty surrounding the economic recovery, the FOMC made no major changes to its monetary policy for most of the year. The FOMC repeatedly stated it would keep the federal funds target rate within the exceptionally low 0% to 0.25% range “for an extended period” and eventually shifted its focus to its outlook and the status of its current holdings. In September, the FOMC revealed concerns about the subdued recovery and said inflation was below the pace “consistent with its mandate.” Having already lowered interest rates effectively to zero, the FOMC announced its intention to purchase government securities to stimulate the economy and promote a low level of inflation consistent with healthy economic growth.
Investor confidence shifted with each release of encouraging or discouraging economic, regulatory and political news, stoking considerable volatility among equities. Ultimately, global stock indexes posted solid gains during the 12 months under review as investor risk aversion began to subside amid generally improving economic signs and rising consumer spending. The dollar strengthened relative to the euro, which declined as a result of the region’s fiscal crisis, but weakened against the yen, which hit multi-decade highs amid persistent deflationary pressures. Meanwhile, U.S. Treasuries and corporate bonds finished the year with gains despite Treasury price declines late in the year.
Investment Strategy
The Fund invests its assets in an equally weighted combination of Class 1 shares of Franklin Income Securities Fund, Mutual Shares Securities Fund and Templeton Growth Securities Fund. These underlying funds, in turn, invest in a variety of U.S. and foreign equity securities and, to a lesser extent, fixed income and money market securities. As market conditions affect the underlying funds, we rebalance the Fund’s allocations seeking to maintain equal weightings of approximately 33 1/3% of total net assets in each underlying fund whenever the actual allocations exceed plus or minus 3% of the fixed allocation percentages.
FFA-3
Manager’s Discussion
The Fund’s performance can be attributed largely to its allocation among the underlying funds and their investments in domestic and foreign equities, fixed income securities, and short-term investments and other net assets.
During the fiscal year under review, Franklin Income Securities Fund – Class 1 and Mutual Shares Securities Fund – Class 1 underperformed the S&P 500, and Templeton Growth Securities Fund – Class 1 underperformed the MSCI World Index.
Thank you for your participation in Franklin Templeton VIP Founding Funds Allocation Fund. We look forward to serving your future investment needs.
The foregoing information reflects our analysis, opinions and portfolio holdings as of December 31, 2010, the end of the reporting period. The way we implement our main investment strategies and the resulting portfolio holdings may change depending on factors such as market and economic conditions. These opinions may not be relied upon as investment advice or an offer for a particular security. The information is not a complete analysis of every aspect of any market, country, industry, security or the Fund. Statements of fact are from sources considered reliable, but the investment manager makes no representation or warranty as to their completeness or accuracy. Although historical performance is no guarantee of future results, these insights may help you understand our investment management philosophy.
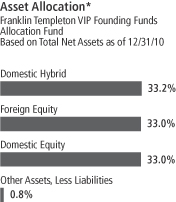
The dollar value, number of shares or principal amount, and names of all portfolio holdings are listed in the Fund’s Statement of Investments.
FFA-4
Fund Expenses
As an investor in a variable insurance contract (Contract) that indirectly provides for investment in an underlying mutual fund, you can incur transaction and/or ongoing expenses at both the Fund level and the Contract level.
| • | | Transaction expenses can include sales charges (loads) on purchases, redemption fees, surrender fees, transfer fees and premium taxes. |
| • | | Ongoing expenses can include management fees, distribution and service (12b-1) fees, contract fees, annual maintenance fees, mortality and expense risk fees and other fees and expenses. All mutual funds and Contracts have some types of ongoing expenses. |
The expenses shown in the table are meant to highlight ongoing expenses at the Fund level only and do not include ongoing expenses at the Contract level, or transaction expenses at either the Fund or Contract levels. While the Fund does not have transaction expenses, if the transaction and ongoing expenses at the Contract level were included, the expenses shown below would be higher. You should consult your Contract prospectus or disclosure document for more information.
The table shows Fund-level ongoing expenses and can help you understand these expenses and compare them with those of other mutual funds offered through the Contract. The table assumes a $1,000 investment held for the six months indicated. Please refer to the Fund prospectus for additional information on operating expenses.
Actual Fund Expenses
The first line (Actual) of the table provides actual account values and expenses. The “Ending Account Value” is derived from the Fund’s actual return, which includes the effect of ongoing Fund expenses, but does not include the effect of ongoing Contract expenses.
You can estimate the Fund-level expenses you incurred during the period by following these steps. Of course, your account value and expenses will differ from those in this illustration:
| 1. | Divide your account value by $1,000. |
If an account had an $8,600 value, then $8,600 ÷ $1,000 = 8.6.
| 2. | Multiply the result by the number under the heading “Fund-Level Expenses Incurred During Period.” |
If Fund-Level Expenses Incurred During Period were $7.50, then 8.6 x $7.50 = $64.50.
In this illustration, the estimated expenses incurred this period at the Fund level are $64.50.
Franklin Templeton VIP Founding Funds Allocation Fund – Class 4
FFA-5
Hypothetical Example for Comparison with Other Mutual Funds
Information in the second line (Hypothetical) of the table can help you compare ongoing expenses of the Fund with those of other mutual funds offered through the Contract. This information may not be used to estimate the actual ending account balance or expenses you incurred during the period. The hypothetical “Ending Account Value” is based on the Fund’s actual expense ratio and an assumed 5% annual rate of return before expenses, which does not represent the Fund’s actual return. The figure under the heading “Fund-Level Expenses Incurred During Period” shows the hypothetical expenses your account would have incurred under this scenario. You can compare this figure with the 5% hypothetical examples that appear in shareholder reports of other funds offered through a Contract.
| | | | | | | | | | | | | | | | |
| Class 4 | | Beginning
Account
Value 7/1/10 | | | Ending
Account
Value 12/31/10 | | | Expenses Paid
During Period*
7/1/10–12/31/10 | | | Expenses Paid
During Period** 7/1/10–12/31/10 | |
Actual | | $ | 1,000 | | | $ | 1,164.20 | | | $ | 2.45 | | | $ | 6.11 | |
Hypothetical (5% return before expenses) | | $ | 1,000 | | | $ | 1,022.94 | | | $ | 2.29 | | | $ | 5.70 | |
*Expenses are calculated using the most recent six-month annualized expense ratio excluding expenses of the underlying funds, net of expense waivers, for the Fund’s Class 4 shares (0.45%), which does not include any ongoing expenses of the Contract for which the Fund is an investment option, multiplied by the average account value over the period, multiplied by 184/365 to reflect the one-half year period.
**Expenses are calculated using the most recent six-month annualized expense ratio including expenses of the underlying funds, net of expense waivers, for the Fund’s Class 4 shares (1.12%), which does not include any ongoing expenses of the Contract for which the Fund is an investment option, multiplied by the average account value over the period, multiplied by 184/365 to reflect the one-half year period.
FFA-6
Franklin Templeton Variable Insurance Products Trust
Financial Highlights
Franklin Templeton VIP Founding Funds Allocation Fund
| | | | | | | | | | | | | | | | |
| | | Year Ended December 31, | |
| Class 1 | | 2010 | | | 2009 | | | 2008 | | | 2007a | |
| | | | |
Per share operating performance | | | | | | | | | | | | | | | | |
(for a share outstanding throughout the year) | | | | | | | | | | | | | | | | |
Net asset value, beginning of year | | $ | 7.15 | | | $ | 5.61 | | | $ | 9.33 | | | $ | 10.00 | |
| | | | |
Income from investment operationsb: | | | | | | | | | | | | | | | | |
Net investment income (loss)c,d | | | 0.24 | | | | 0.26 | | | | 0.28 | | | | (0.19 | ) |
Net realized and unrealized gains (losses) | | | 0.52 | | | | 1.46 | | | | (3.64 | ) | | | (0.48 | ) |
| | | | |
Total from investment operations | | | 0.76 | | | | 1.72 | | | | (3.36 | ) | | | (0.67 | ) |
| | | | |
Less distributions from: | | | | | | | | | | | | | | | | |
Net investment income | | | (0.18 | ) | | | (0.18 | ) | | | (0.19 | ) | | | — | |
Net realized gains | | | — | e | | | — | | | | (0.17 | ) | | | — | |
| | | | |
Total distributions | | | (0.18 | ) | | | (0.18 | ) | | | (0.36 | ) | | | — | |
| | | | |
Net asset value, end of year | | $ | 7.73 | | | $ | 7.15 | | | $ | 5.61 | | | $ | 9.33 | |
| | | | |
| | | | |
Total returnf | | | 10.64% | | | | 30.47% | | | | (35.75)% | | | | (6.70)% | |
Ratios to average net assetsg | | | | | | | | | | | | | | | | |
Expenses before waiver and payments by affiliatesh | | | 0.11% | | | | 0.12% | | | | 0.13% | | | | 0.41% | |
Expenses net of waiver and payments by affiliatesh | | | 0.10% | | | | 0.10% | | | | 0.13% | | | | 0.41% | |
Net investment income (loss)d | | | 3.04% | | | | 4.16% | | | | 3.81% | | | | (0.41)% | |
| | | | |
Supplemental data | | | | | | | | | | | | | | | | |
Net assets, end of year (000’s) | | $ | 437 | | | $ | 629 | | | $ | 339 | | | $ | 466 | |
Portfolio turnover rate | | | 17.81% | | | | 4.23% | | | | 22.09% | | | | 0.04% | |
aFor the period July 2, 2007 (commencement of operations) to December 31, 2007.
bThe amount shown for a share outstanding throughout the period may not correlate with the Statement of Operations for the period due to the timing of sales and repurchases of the Fund shares in relation to income earned and/or fluctuating market value of the investments of the Fund.
cBased on average daily shares outstanding.
dRecognition of net investment income by the Fund is affected by the timing of declaration of dividends by the Underlying Funds in which the Fund invests.
eAmount rounds to less than $0.01 per share
fTotal return does not include fees, charges or expenses imposed by the variable annuity and life insurance contracts for which the Franklin Templeton Variable Insurance Products Trust serves as an underlying investment vehicle. Total return is not annualized for periods less than one year.
gRatios are annualized for periods less than one year.
hDoes not include expenses of the Underlying Funds in which the Fund invests. The annualized weighted average expense ratio of the Underlying Funds was 0.67% for the year ended December 31, 2010.
The accompanying notes are an integral part of these financial statements.
FFA-7
Franklin Templeton Variable Insurance Products Trust
Financial Highlights (continued)
Franklin Templeton VIP Founding Funds Allocation Fund
| | | | | | | | | | | | | | | | |
| | | Year Ended December 31, | |
| Class 2 | | 2010 | | | 2009 | | | 2008 | | | 2007a | |
| | | | |
Per share operating performance | | | | | | | | | | | | | | | | |
(for a share outstanding throughout the year) | | | | | | | | | | | | | | | | |
Net asset value, beginning of year | | $ | 7.14 | | | $ | 5.61 | | | $ | 9.31 | | | $ | 10.00 | |
| | | | |
Income from investment operationsb: | | | | | | | | | | | | | | | | |
Net investment income (loss)c,d | | | 0.21 | | | | 0.26 | | | | 0.27 | | | | (0.03 | ) |
Net realized and unrealized gains (losses) | | | 0.52 | | | | 1.44 | | | | (3.63 | ) | | | (0.66 | ) |
| | | | |
Total from investment operations | | | 0.73 | | | | 1.70 | | | | (3.36 | ) | | | (0.69 | ) |
| | | | |
Less distributions from: | | | | | | | | | | | | | | | | |
Net investment income | | | (0.16 | ) | | | (0.17 | ) | | | (0.17 | ) | | | — | |
Net realized gains | | | — | e | | | — | | | | (0.17 | ) | | | — | |
| | | | |
Total distributions | | | (0.16 | ) | | | (0.17 | ) | | | (0.34 | ) | | | — | |
| | | | |
Net asset value, end of year | | $ | 7.71 | | | $ | 7.14 | | | $ | 5.61 | | | $ | 9.31 | |
| | | | |
| | | | |
Total returnf | | | 10.25% | | | | 30.25% | | | | (35.87)% | | | | (6.90)% | |
Ratios to average net assetsg | | | | | | | | | | | | | | | | |
Expenses before waiver and payments by affiliatesh | | | 0.36% | | | | 0.37% | | | | 0.38% | | | | 0.66% | |
Expenses net of waiver and payments by affiliatesh | | | 0.35% | | | | 0.35% | | | | 0.38% | | | | 0.66% | |
Net investment income (loss)d | | | 2.79% | | | | 3.91% | | | | 3.56% | | | | (0.66)% | |
| | | | |
Supplemental data | | | | | | | | | | | | | | | | |
Net assets, end of year (000’s) | | $ | 488,057 | | | $ | 474,176 | | | $ | 338,320 | | | $ | 131,710 | |
Portfolio turnover rate | | | 17.81% | | | | 4.23% | | | | 22.09% | | | | 0.04% | |
aFor the period July 2, 2007 (commencement of operations) to December 31, 2007.
bThe amount shown for a share outstanding throughout the period may not correlate with the Statement of Operations for the period due to the timing of sales and repurchases of the Fund shares in relation to income earned and/or fluctuating market value of the investments of the Fund.
cBased on average daily shares outstanding.
dRecognition of net investment income by the Fund is affected by the timing of declaration of dividends by the Underlying Funds in which the Fund invests.
eAmount rounds to less than $0.01 per share
fTotal return does not include fees, charges or expenses imposed by the variable annuity and life insurance contracts for which the Franklin Templeton Variable Insurance Products Trust serves as an underlying investment vehicle. Total return is not annualized for periods less than one year.
gRatios are annualized for periods less than one year.
hDoes not include expenses of the Underlying Funds in which the Fund invests. The annualized weighted average expense ratio of the Underlying Funds was 0.67% for the year ended December 31, 2010.
The accompanying notes are an integral part of these financial statements.
FFA-8
Franklin Templeton Variable Insurance Products Trust
Financial Highlights (continued)
Franklin Templeton VIP Founding Funds Allocation Fund
| | | | | | | | | | | | |
| | | Year Ended December 31, | |
| Class 4 | | 2010 | | | 2009 | | | 2008a | |
| | | | |
Per share operating performance | | | | | | | | | | | | |
(for a share outstanding throughout the year) | | | | | | | | | | | | |
Net asset value, beginning of year | | $ | 7.14 | | | $ | 5.62 | | | $ | 8.65 | |
| | | | |
Income from investment operationsb: | | | | | | | | | | | | |
Net investment incomec,d | | | 0.19 | | | | 0.23 | | | | 0.19 | |
Net realized and unrealized gains (losses) | | | 0.54 | | | | 1.46 | | | | (2.87 | ) |
| | | | |
Total from investment operations | | | 0.73 | | | | 1.69 | | | | (2.68 | ) |
| | | | |
Less distributions from: | | | | | | | | | | | | |
Net investment income | | | (0.16 | ) | | | (0.17 | ) | | | (0.18 | ) |
Net realized gains | | | — | e | | | — | | | | (0.17 | ) |
| | | | |
Total distributions | | | (0.16 | ) | | | (0.17 | ) | | | (0.35 | ) |
| | | | |
Net asset value, end of year | | $ | 7.71 | | | $ | 7.14 | | | $ | 5.62 | |
| | | | |
| | | |
Total returnf | | | 10.24% | | | | 30.06% | | | | (30.81)% | |
Ratios to average net assetsg | | | | | | | | | | | | |
Expenses before waiver and payments by affiliatesh | | | 0.46% | | | | 0.47% | | | | 0.48% | |
Expenses net of waiver and payments by affiliatesh | | | 0.45% | | | | 0.45% | | | | 0.48% | |
Net investment incomed | | | 2.69% | | | | 3.81% | | | | 3.46% | |
| | | |
Supplemental data | | | | | | | | | | | | |
Net assets, end of year (000’s) | | $ | 3,036,272 | | | $ | 1,424,479 | | | $ | 263,001 | |
Portfolio turnover rate | | | 17.81% | | | | 4.23% | | | | 22.09% | |
aFor the period February 29, 2008 (effective date) to December 31, 2008.
bThe amount shown for a share outstanding throughout the period may not correlate with the Statement of Operations for the period due to the timing of sales and repurchases of the Fund shares in relation to income earned and/or fluctuating market value of the investments of the Fund.
cBased on average daily shares outstanding.
dRecognition of net investment income by the Fund is affected by the timing of declaration of dividends by the Underlying Funds in which the Fund invests.
eAmount rounds to less than $0.01 per share
fTotal return does not include fees, charges or expenses imposed by the variable annuity and life insurance contracts for which the Franklin Templeton Variable Insurance Products Trust serves as an underlying investment vehicle. Total return is not annualized for periods less than one year.
gRatios are annualized for periods less than one year.
hDoes not include expenses of the Underlying Funds in which the Fund invests. The annualized weighted average expense ratio of the Underlying Funds was 0.67% for the year ended December 31, 2010.
The accompanying notes are an integral part of these financial statements.
FFA-9
Franklin Templeton Variable Insurance Products Trust
Statement of Investments, December 31, 2010
| | | | | | | | |
| Franklin Templeton VIP Founding Funds Allocation Fund | | Shares | | | Value | |
Investments in Underlying Fundsa | | | | | | | | |
Domestic Equity 33.0% | | | | | | | | |
Mutual Shares Securities Fund, Class 1 | | | 72,027,638 | | | $ | 1,162,526,077 | |
| | | | | | | | |
Domestic Hybrid 33.2% | | | | | | | | |
Franklin Income Securities Fund, Class 1 | | | 77,056,138 | | | | 1,168,171,047 | |
| | | | | | | | |
Foreign Equity 33.0% | | | | | | | | |
Templeton Growth Securities Fund, Class 1 | | | 104,073,430 | | | | 1,164,581,677 | |
| | | | | | | | |
Total Investments in Underlying Funds (Cost $3,063,186,944) 99.2% | | | | | | | 3,495,278,801 | |
Other Assets, less Liabilities 0.8% | | | | | | | 29,487,046 | |
| | | | | | | | |
Net Assets 100.0% | | | | | | $ | 3,524,765,847 | |
| | | | | | | | |
aSee Note 6 regarding investments in Underlying Funds.
The accompanying notes are an integral part of these financial statements.
FFA-10
Franklin Templeton Variable Insurance Products Trust
Financial Statements
Statement of Assets and Liabilities
December 31, 2010
| | | | |
| | | Franklin Templeton
VIP Founding
Funds Allocation
Fund | |
Assets: | | | | |
Investments in Underlying Funds: (Note 6) | | | | |
Cost | | $ | 3,063,186,944 | |
Value | | $ | 3,495,278,801 | |
| | | | |
Cash | | | 26,604,309 | |
Receivables: | | | | |
Investment securities sold | | | 200,998 | |
Capital shares sold | | | 5,070,548 | |
Other assets | | | 312 | |
| | | | |
Total assets | | | 3,527,154,968 | |
| | | | |
Liabilities: | | | | |
Payables: | | | | |
Capital shares redeemed | | | 200,456 | |
Affiliates | | | 2,074,207 | |
Accrued expenses and other liabilities | | | 114,458 | |
| | | | |
Total liabilities | | | 2,389,121 | |
| | | | |
Net assets, at value | | $ | 3,524,765,847 | |
| | | | |
Net assets consist of: | | | | |
Paid-in capital | | $ | 3,272,461,852 | |
Undistributed net investment income | | | 606,953 | |
Net unrealized appreciation (depreciation) | | | 432,091,857 | |
Accumulated net realized gain (loss) | | | (180,394,815 | ) |
| | | | |
Net assets, at value | | $ | 3,524,765,847 | |
| | | | |
Class 1: | | | | |
Net assets, at value | | $ | 436,856 | |
| | | | |
Shares outstanding | | | 56,498 | |
| | | | |
Net asset value and maximum offering price per share | | $ | 7.73 | |
| | | | |
Class 2: | | | | |
Net assets, at value | | $ | 488,057,026 | |
| | | | |
Shares outstanding | | | 63,262,194 | |
| | | | |
Net asset value and maximum offering price per share | | $ | 7.71 | |
| | | | |
Class 4: | | | | |
Net assets, at value | | $ | 3,036,271,965 | |
| | | | |
Shares outstanding | | | 393,798,983 | |
| | | | |
Net asset value and maximum offering price per share | | $ | 7.71 | |
| | | | |
The accompanying notes are an integral part of these financial statements.
FFA-11
Franklin Templeton Variable Insurance Products Trust
Financial Statements (continued)
Statement of Operations
for the year ended December 31, 2010
| | | | |
| | | Franklin Templeton
VIP Founding
Funds Allocation
Fund | |
Investment income: | | | | |
Dividends from Underlying Funds (Note 6) | | $ | 81,093,100 | |
| | | | |
Expenses: | | | | |
Administrative fees (Note 3a) | | | 2,580,411 | |
Distribution fees: (Note 3b) | | | | |
Class 2 | | | 1,162,541 | |
Class 4 | | | 7,415,133 | |
Unaffiliated transfer agent fees | | | 2,047 | |
Reports to shareholders | | | 208,727 | |
Professional fees | | | 49,162 | |
Trustees’ fees and expenses | | | 9,659 | |
Other | | | 48,678 | |
| | | | |
Total expenses | | | 11,476,358 | |
Expenses waived/paid by affiliates (Note 3d) | | | (318,099 | ) |
| | | | |
Net expenses | | | 11,158,259 | |
| | | | |
Net investment income | | | 69,934,841 | |
| | | | |
Realized and unrealized gains (losses): | | | | |
Net realized gain (loss) from sale of investments in Underlying Funds (Note 6) | | | (102,829,602 | ) |
Net change in unrealized appreciation (depreciation) on investments in Underlying Funds | | | 305,671,809 | |
| | | | |
Net realized and unrealized gain (loss) | | | 202,842,207 | |
| | | | |
Net increase (decrease) in net assets resulting from operations | | $ | 272,777,048 | |
| | | | |
The accompanying notes are an integral part of these financial statements.
FFA-12
Franklin Templeton Variable Insurance Products Trust
Financial Statements (continued)
Statements of Changes in Net Assets
| | | | | | | | |
| | | Franklin Templeton VIP Founding Funds
Allocation Fund | |
| | | Year Ended December 31, | |
| | | 2010 | | | 2009 | |
| | | | |
Increase (decrease) in net assets: | | | | | | | | |
Operations: | | | | | | | | |
Net investment income | | $ | 69,934,841 | | | $ | 41,768,096 | |
Net realized gain (loss) from Underlying Funds | | | (102,829,602 | ) | | | (33,084,814 | ) |
Net change in unrealized appreciation (depreciation) on investments in Underlying Funds | | | 305,671,809 | | | | 315,119,406 | |
| | | | |
Net increase (decrease) in net assets resulting from operations | | | 272,777,048 | | | | 323,802,688 | |
| | | | |
Distributions to shareholders from: | | | | | | | | |
Net investment income: | | | | | | | | |
Class 1 | | | (19,195 | ) | | | (15,661 | ) |
Class 2 | | | (9,975,426 | ) | | | (10,747,497 | ) |
Class 4 | | | (59,699,243 | ) | | | (30,912,074 | ) |
Net realized gains: | | | | | | | | |
Class 1 | | | (64 | ) | | | — | |
Class 2 | | | (37,379 | ) | | | — | |
Class 4 | | | (225,645 | ) | | | — | |
| | | | |
Total distributions to shareholders | | | (69,956,952 | ) | | | (41,675,232 | ) |
| | | | |
Capital share transactions: (Note 2) | | | | | | | | |
Class 1 | | | (249,343 | ) | | | 178,968 | |
Class 2 | | | (22,011,518 | ) | | | 33,157,540 | |
Class 4 | | | 1,444,922,739 | | | | 982,159,582 | |
| | | | |
Total capital share transactions | | | 1,422,661,878 | | | | 1,015,496,090 | |
| | | | |
Net increase (decrease) in net assets | | | 1,625,481,974 | | | | 1,297,623,546 | |
Net assets: | | | | | | | | |
Beginning of year | | | 1,899,283,873 | | | | 601,660,327 | |
| | | | |
End of year | | $ | 3,524,765,847 | | | $ | 1,899,283,873 | |
| | | | |
Undistributed net investment income included in net assets: | | | | | | | | |
End of year | | $ | 606,953 | | | $ | 391,645 | |
| | | | |
The accompanying notes are an integral part of these financial statements.
FFA-13
Franklin Templeton Variable Insurance Products Trust
Notes to Financial Statements
Franklin Templeton VIP Founding Funds Allocation Fund
1. ORGANIZATION AND SIGNIFICANT ACCOUNTING POLICIES
Franklin Templeton Variable Insurance Products Trust (Trust) is registered under the Investment Company Act of 1940, as amended, (1940 Act) as an open-end investment company, consisting of twenty separate funds. The Franklin Templeton VIP Founding Funds Allocation Fund (Fund) is included in this report. The financial statements of the remaining funds in the Trust are presented separately. The Fund invests primarily in other funds of the Trust (Underlying Funds). Shares of the Fund are generally sold only to insurance company separate accounts to fund the benefits of variable life insurance policies or variable annuity contracts. The Fund offers three classes of shares: Class 1, Class 2, and Class 4. Each class of shares differs by its distribution fees, voting rights on matters affecting a single class and its exchange privilege.
The following summarizes the Fund’s significant accounting policies.
a. Financial Instrument Valuation
Net asset value per share is calculated as of the close of trading of the NYSE. Investments in the Underlying Funds are valued at their closing net asset value each trading day.
b. Income Taxes
It is the Fund’s policy to qualify as a regulated investment company under the Internal Revenue Code. The Fund intends to distribute to shareholders substantially all of its taxable income and net realized gains to relieve it from federal income and excise taxes. As a result, no provision for U.S. federal income taxes is required. The Fund files U.S. income tax returns as well as tax returns in certain other jurisdictions. The Fund’s application of those tax rules is subject to its understanding. The Fund records a provision for taxes in its financial statements including penalties and interest, if any, for a tax position taken on a tax return (or expected to be taken) when it fails to meet the more likely than not (a greater than 50% probability) threshold and based on the technical merits, the tax position may not be sustained upon examination by the tax authorities. As of December 31, 2010, and for all open tax years, the Fund has determined that no provision for income tax is required in the Fund’s financial statements. Open tax years are those that remain subject to examination and are based on each tax jurisdiction statute of limitation. The Fund is not aware of any tax position for which it is reasonably possible that the total amounts of unrecognized tax effects will significantly change in the next twelve months.
c. Security Transactions, Investment Income, Expenses and Distributions
Security transactions are accounted for on trade date. Realized gains and losses on security transactions are determined on a specific identification basis. Estimated expenses are accrued daily. Dividend income and realized gain distributions by Underlying Funds are recorded on the ex-dividend date. Distributions to shareholders are recorded on the ex-dividend date and are determined according to income tax regulations (tax basis). Distributable earnings determined on a tax basis may differ from earnings recorded in accordance with accounting principles generally accepted in the United States of America. These differences may be permanent or temporary. Permanent differences are reclassified among capital accounts to reflect their tax character. These reclassifications have no impact on net assets or the results of operations. Temporary differences are not reclassified, as they may reverse in subsequent periods.
Common expenses incurred by the Trust are allocated among the funds based on the ratio of net assets of each fund to the combined net assets of the Trust. Fund specific expenses are charged directly to the fund that incurred the expense.
The Funds indirectly bear their proportionate share of expenses from the Underlying Funds. Since the Underlying Funds have varied expense levels and the Funds may own different proportions of the Underlying Funds at different times, the amount of expenses incurred indirectly by the Funds will vary.
FFA-14
Franklin Templeton Variable Insurance Products Trust
Notes to Financial Statements (continued)
Franklin Templeton VIP Founding Funds Allocation Fund
1. ORGANIZATION AND SIGNIFICANT ACCOUNTING POLICIES (continued)
c. Security Transactions, Investment Income, Expenses and Distributions (continued)
Realized and unrealized gains and losses and net investment income, not including class specific expenses, are allocated daily to each class of shares based upon the relative proportion of net assets of each class. Differences in per share distributions, by class, are generally due to differences in class specific expenses.
d. Accounting Estimates
The preparation of financial statements in accordance with accounting principles generally accepted in the United States of America requires management to make estimates and assumptions that affect the reported amounts of assets and liabilities at the date of the financial statements and the amounts of income and expenses during the reporting period. Actual results could differ from those estimates.
e. Guarantees and Indemnifications
Under the Trust’s organizational documents, its officers and trustees are indemnified by the Trust against certain liabilities arising out of the performance of their duties to the Trust. Additionally, in the normal course of business, the Trust, on behalf of the Fund, enters into contracts with service providers that contain general indemnification clauses. The Trust’s maximum exposure under these arrangements is unknown as this would involve future claims that may be made against the Trust that have not yet occurred. Currently, the Trust expects the risk of loss to be remote.
2. SHARES OF BENEFICIAL INTEREST
At December 31, 2010, there were an unlimited number of shares authorized (without par value). Transactions in the Fund’s shares were as follows:
| | | | | | | | | | | | | | | | |
| | | Year Ended December 31, | |
| | | 2010 | | | 2009 | |
| Class 1 Shares: | | Shares | | | Amount | | | Shares | | | Amount | |
Shares sold | | | 28,887 | | | $ | 212,938 | | | | 30,232 | | | $ | 193,836 | |
Shares issued in reinvestment of distributions | | | 2,512 | | | | 19,259 | | | | 2,209 | | | | 15,661 | |
Shares redeemed | | | (62,828 | ) | | | (481,540 | ) | | | (4,934 | ) | | | (30,529 | ) |
| | | | |
Net increase (decrease) | | | (31,429 | ) | | $ | (249,343 | ) | | | 27,507 | | | $ | 178,968 | |
| | | | |
Class 2 Shares: | | | | | | | | | | | | | | | | |
Shares sold | | | 5,965,854 | | | $ | 43,444,607 | | | | 14,864,113 | | | $ | 87,081,355 | |
Shares issued in reinvestment of distributions | | | 1,309,697 | | | | 10,012,805 | | | | 1,519,236 | | | | 10,747,497 | |
Shares redeemed | | | (10,412,128 | ) | | | (75,468,930 | ) | | | (10,330,403 | ) | | | (64,671,312 | ) |
| | | | |
Net increase (decrease) | | | (3,136,577 | ) | | $ | (22,011,518 | ) | | | 6,052,946 | | | $ | 33,157,540 | |
| | | | |
Class 4 Shares: | | | | | | | | | | | | | | | | |
Shares sold | | | 260,520,140 | | | $ | 1,895,056,899 | | | | 166,538,372 | | | $ | 1,052,248,327 | |
Shares issued on reinvestment of distributions | | | 7,836,782 | | | | 59,924,888 | | | | 4,364,502 | | | | 30,912,074 | |
Shares redeemed | | | (73,968,871 | ) | | | (510,059,048 | ) | | | (18,323,686 | ) | | | (101,000,819 | ) |
| | | | |
Net increase (decrease) | | | 194,388,051 | | | $ | 1,444,922,739 | | | | 152,579,188 | | | $ | 982,159,582 | |
| | | | |
FFA-15
Franklin Templeton Variable Insurance Products Trust
Notes to Financial Statements (continued)
Franklin Templeton VIP Founding Funds Allocation Fund
3. TRANSACTIONS WITH AFFILIATES
Franklin Resources, Inc. is the holding company for various subsidiaries that together are referred to as Franklin Templeton Investments. Certain officers and trustees of the Fund are also officers and/or directors of certain of the Underlying Funds and of the following subsidiaries:
| | |
| Subsidiary | | Affiliation |
Franklin Templeton Services, LLC (FT Services) | | Administrative manager |
Franklin Templeton Distributors, Inc. (Distributors) | | Principal underwriter |
Franklin Templeton Investor Services, LLC (Investor Services) | | Transfer agent |
a. Administrative Fees
The Fund pays an administrative fee to FT Services of 0.10% per year of the average daily net assets of the Fund for administrative services including monitoring and rebalancing the percentage of the Fund’s investment in the Underlying Funds.
b. Distribution Fees
The Trust’s Board of Trustees has adopted distribution plans for Class 2 and Class 4 shares pursuant to Rule 12b-1 under the 1940 Act. Under the Fund’s compensation distribution plans, the Fund pays Distributors for costs incurred in connection with the servicing, sale and distribution of the Fund’s shares up to 0.35% per year of its average daily net assets of each class. The Board of Trustees has agreed to limit the current rate to 0.25% per year for Class 2.
c. Transfer Agent Fees
Investor Services, under terms of an agreement, performs shareholder servicing for the Fund and is not paid by the Fund for the services.
d. Waiver and Expense Reimbursements
FT Services has contractually agreed in advance to waive or limit its fees and to assume as its own expense certain expenses otherwise payable by the Fund so that the common expenses (i.e. a combination of administrative fees and other expenses, but excluding distribution fees and acquired fund fees and expenses) for each class of the Fund do not exceed 0.10% (other than certain non-routine expenses or costs, including those relating to litigation, indemnification, reorganizations, and liquidations) until April 30, 2011.
4. INCOME TAXES
During the year ended December 31, 2010, the Fund utilized $24,705 of capital loss carryforwards.
The tax character of distributions paid during the years ended December 31, 2010 and 2009, was as follows:
| | | | | | | | |
| | | 2010 | | | 2009 | |
Distributions paid from: | | | | | | | | |
Ordinary income | | $ | 69,719,533 | | | $ | 41,675,232 | |
Long term capital gain | | | 237,419 | | | | — | |
| | | | |
| | $ | 69,956,952 | | | $ | 41,675,232 | |
| | | | |
FFA-16
Franklin Templeton Variable Insurance Products Trust
Notes to Financial Statements (continued)
Franklin Templeton VIP Founding Funds Allocation Fund
4. INCOME TAXES (continued)
At December 31, 2010, the cost of investments, net unrealized appreciation (depreciation), and undistributed ordinary income for income tax purposes were as follows:
| | | | |
Cost of investments | | $ | 3,243,581,760 | |
| | | | |
| |
Unrealized appreciation | | $ | 251,697,041 | |
Unrealized depreciation | | | — | |
| | | | |
Net unrealized appreciation (depreciation) | | $ | 251,697,041 | |
| | | | |
Distributable earnings—undistributed ordinary income | | $ | 606,953 | |
| | | | |
Net realized gains (losses) differ for financial statement and tax purposes primarily due to differing treatment of wash sales.
5. INVESTMENT TRANSACTIONS
Purchases and sales of Underlying Funds (excluding short term securities) for the year ended December 31, 2010, aggregated $1,855,093,100 and $453,631,777, respectively.
6. INVESTMENTS IN UNDERLYING FUNDS
The Fund invests primarily in the Underlying Funds which are managed by affiliates of the Fund’s administrative manager, FT Services. The Fund does not invest in the Underlying Funds for the purpose of exercising a controlling influence over the management or policies. Investments in Underlying Funds for the year ended December 31, 2010, were as follows:
| | | | | | | | | | | | | | | | | | | | | | | | | | | | | | | | |
| Underlying Funds | | Number of Shares
Held at Beginning
of Year | | | Gross
Additions | | | Gross
Reductions | | | Number of
Shares
Held at End
of Year | | | Value at
End of
Year | | | Investment
Income | | | Realized
Capital
Gain (Loss) | | | % of Underlying
Fund Shares
Outstanding Held
at End of Year | |
Franklin Income
Securities Fund,
Class 1 | | | 43,863,503 | | | | 47,880,758 | | | | 14,688,123 | | | | 77,056,138 | | | $ | 1,168,171,047 | | | $ | 16,212,085 | | | $ | (21,085,161 | ) | | | 14.03% | |
Mutual Shares
Securities Fund,
Class 1 | | | 42,654,858 | | | | 38,334,064 | | | | 8,961,284 | | | | 72,027,638 | | | | 1,162,526,077 | | | | 12,700,389 | | | | (32,019,995 | ) | | | 20.37% | |
Templeton Growth
Securities Fund,
Class 1 | | | 59,551,683 | | | | 57,141,561 | | | | 12,619,814 | | | | 104,073,430 | | | | 1,164,581,677 | | | | 52,180,626 | | | | (49,724,446 | ) | | | 38.02% | |
| | | | | | | | | | | | | | | | | | | | | | | | |
Total | | | | | | | | | | | | | | | | | | $ | 3,495,278,801 | | | $ | 81,093,100 | | | $ | (102,829,602 | ) | | | | |
| | | | | | | | | | | | | | | | | | | | | | | | |
7. CREDIT FACILITY
The Fund, together with other U.S. registered and foreign investment funds (collectively “Borrowers”), managed by Franklin Templeton Investments, are borrowers in a joint syndicated senior unsecured credit facility totaling $750 million (Global Credit Facility) which matures on January 21, 2011. This Global Credit Facility provides a source of funds to the Borrowers for temporary and emergency purposes, including the ability to meet future unanticipated or unusually large redemption requests.
Under the terms of the Global Credit Facility, the Fund shall, in addition to interest charged on any borrowings made by the Fund and other costs incurred by the Fund, pay its share of fees and expenses incurred in connection with the implementation and maintenance of the Global Credit Facility, based upon its relative share of the aggregate net assets of all of the Borrowers,
FFA-17
Franklin Templeton Variable Insurance Products Trust
Notes to Financial Statements (continued)
Franklin Templeton VIP Founding Funds Allocation Fund
7. CREDIT FACILITY (continued)
including an annual commitment fee of 0.10% based upon the unused portion of the Global Credit Facility, which is reflected in other expenses on the Statement of Operations. During the year ended December 31, 2010, the Fund did not use the Global Credit Facility.
Effective January 21, 2011, the Borrowers renewed the Global Credit Facility for a total of $750 million, maturing January 20, 2012.
8. FAIR VALUE MEASUREMENTS
The Fund follows a fair value hierarchy that distinguishes between market data obtained from independent sources (observable inputs) and the Fund’s own market assumptions (unobservable inputs). These inputs are used in determining the value of the Fund’s investments and are summarized in the following fair value hierarchy:
| | • | | Level 1 – quoted prices in active markets for identical securities |
| | • | | Level 2 – other significant observable inputs (including quoted prices for similar securities, interest rates, prepayment speed, credit risk, etc.) |
| | • | | Level 3 – significant unobservable inputs (including the Fund’s own assumptions in determining the fair value of investments) |
The inputs or methodology used for valuing securities are not an indication of the risk associated with investing in those securities.
For movements between the levels within the fair value hierarchy, the Fund has adopted a policy of recognizing the transfers as of the date of the underlying event which caused the movement.
At December 31, 2010, all of the Fund’s investments in Underlying Funds carried at fair value were in Level 1 inputs. For detailed Underlying Fund categories, see the accompanying Statement of Investments.
9. SUBSEQUENT EVENTS
The Fund has evaluated subsequent events through the issuance of the financial statements and determined that no events have occurred that require disclosure other than those already disclosed in the financial statements.
FFA-18
Franklin Templeton Variable Insurance Products Trust
Franklin Templeton VIP Founding Funds Allocation Fund
Report of Independent Registered Public Accounting Firm
To the Board of Trustees and Shareholders of
Franklin Templeton Variable Insurance Products Trust
In our opinion, the accompanying statement of assets and liabilities, including the statement of investments, and the related statements of operations and of changes in net assets and the financial highlights present fairly, in all material respects, the financial position of Franklin Templeton VIP Founding Funds Allocation Fund (the “Fund”) at December 31, 2010, the results of its operations for the year then ended, the changes in its net assets for each of the two years in the period then ended and the financial highlights for each of the periods presented, in conformity with accounting principles generally accepted in the United States of America. These financial statements and financial highlights (hereafter referred to as “financial statements”) are the responsibility of the Fund’s management. Our responsibility is to express an opinion on these financial statements based on our audits. We conducted our audits of these financial statements in accordance with the standards of the Public Company Accounting Oversight Board (United States). Those standards require that we plan and perform the audit to obtain reasonable assurance about whether the financial statements are free of material misstatement. An audit includes examining, on a test basis, evidence supporting the amounts and disclosures in the financial statements, assessing the accounting principles used and significant estimates made by management, and evaluating the overall financial statement presentation. We believe that our audits, which included confirmation of securities at December 31, 2010 by correspondence with the transfer agent of the Underlying Funds, provide a reasonable basis for our opinion.
PricewaterhouseCoopers LLP
San Francisco, California
February 10, 2011
FFA-19
Franklin Templeton Variable Insurance Products Trust
Tax Designation (unaudited)
Franklin Templeton VIP Founding Funds Allocation Fund
Under Section 852(b)(3)(C) of the Internal Revenue Code (Code), the Fund designates the maximum amount allowable but no less than $237,419 as a long term capital gain dividend for the fiscal year ended December 31, 2010.
Under Section 854(b)(2) of the Code, the Fund designates 47.13% of the ordinary income dividends as income qualifying for the dividends received deduction for the fiscal year ended December 31, 2010.
FFA-20
FRANKLIN U.S. GOVERNMENT FUND
We are pleased to bring you Franklin U.S. Government Fund’s annual report for the fiscal year ended December 31, 2010.
Performance Summary as of 12/31/10
Average annual total return of Class 4 shares* represents the average annual change in value, assuming reinvestment of dividends and capital gains. Average returns smooth out variations in returns, which can be significant; they are not the same as year-by-year results.
Periods ended 12/31/10
| | | | | | | | | | | | |
| | | 1-Year | | | 5-Year | | | 10-Year | |
Average Annual Total Return | | | +5.21% | | | | +5.37% | | | | +5.31% | |
*For the period beginning 2/29/08, Class 4 performance reflects a 12b-1 fee expense of 0.35% per year, which affects future performance. Class 4 performance prior to 2/29/08 reflects historical Class 1 performance, which does not have a 12b-1 fee expense. Since 2/29/08 (effective date), the average annual total return of Class 4 shares was +4.70%.
Total Return Index Comparison
for a Hypothetical $10,000 Investment (1/1/01–12/31/10)
The graph below shows the change in value of a hypothetical $10,000 investment in the Fund over the indicated period and includes reinvestment of any income or distributions. The Fund’s performance* is compared to the performance of the Barclays Capital (BC) U.S. Government: Intermediate Index, the Lipper VIP General U.S. Government Funds Classification Average and the Consumer Price Index (CPI). One cannot invest directly in an index, and an index is not representative of the Fund’s portfolio. Please see Important Notes to Performance Information preceding the Fund Summaries.
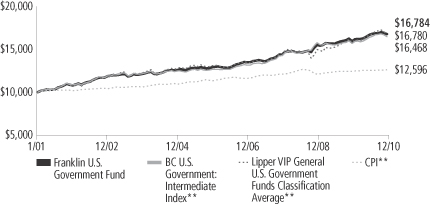
**Sources: © 2011 Morningstar; Lipper Inc. Please see Index Descriptions following the Fund Summaries.
Franklin U.S. Government Fund – Class 4
Performance reflects the Fund’s Class 4 operating expenses, but does not include any contract fees, expenses or sales charges. If they had been included, performance would be lower. These charges and deductions, particularly for variable life policies, can have a significant effect on contract values and insurance benefits. See the contract prospectus for a complete description of these expenses, including sales charges.
Performance data represent past performance, which does not guarantee future results. Investment return and principal value will fluctuate, and you may have a gain or loss when you sell your shares.
Current performance may differ from figures shown.
FUS-1
Fund Goal and Main Investments: Franklin U.S. Government Fund seeks income. The Fund normally invests at least 80% of its net assets in U.S. government securities.
Performance Overview
You can find the Fund’s one-year total return in the Performance Summary. Compared with its benchmarks for the same period, the Fund outperformed the BC U.S. Government: Intermediate Index’s +4.98% return but underperformed the Lipper VIP General U.S. Government Funds Classification Average’s +5.89% return.1
Economic and Market Overview
The U.S. economy expanded unevenly during the 12-month reporting period. The nation’s economic activity as measured by gross domestic product registered annualized growth rates of 3.7%, 1.7%, 2.6% and an estimated 3.2% in the first, second, third and fourth quarters of 2010, respectively. In the fourth quarter, rising exports, shrinking imports and greater consumer and business spending supported growth. The job market remained sluggish, however, and the unemployment rate was 9.4% in December.2 Challenges to sustained economic recovery include elevated debt concerns and a struggling housing sector.
Crude oil prices began the reporting period at $79 per barrel, but abruptly fell in May when a European debt crisis threatened the global recovery. After a brief rally, prices retreated again in August due to slumping stock prices, reduced demand and abundant inventory levels. Prices quickly recovered after receiving a boost from the falling U.S. dollar and positive economic data and reached a 12-month high of $91 in late December. The pace of inflation slowed during the year, and December’s inflation rate was an annualized 1.5%.2 Similarly, core inflation, which excludes food and energy costs, slowed to a 0.8% annualized rate.2
Early in the year, economic improvement and benign inflation trends prompted Federal Reserve Board (Fed) policymakers to maintain record-low interest rates within a 0% to 0.25% range and discontinue certain stimulus plans. In June, the Fed offered a more restrained view of the economy largely because of developments in Europe and signs the U.S. economic expansion lacked momentum. Consumer confidence tumbled due to disappointing employment numbers, a plunge in home
1. Sources: © 2011 Morningstar; Lipper, Inc. One cannot invest directly in an index, and an index is not representative of the Fund’s portfolio. Please see Index Descriptions following the Fund Summaries.
2. Source: Bureau of Labor Statistics.
Fund Risks: Interest rate movements and mortgage prepayment rates may impact the Fund’s share price and yield. Bond prices generally move in the opposite direction of interest rates. Thus, as the prices of bonds in the Fund’s portfolio adjust to a rise in interest rates, the Fund’s share price may decline. U.S. government securities owned by the Fund, but not shares of the Fund, may be guaranteed by the U.S. government, its agencies or instrumentalities as to the timely payment of principal and interest. The Fund’s yield and share price are not guaranteed and will fluctuate with market conditions. The manager applies various techniques and analyses in making investment decisions for the Fund, but there can be no guarantee that these decisions will produce the desired results. The Fund’s prospectus also includes a description of the main investment risks.
FUS-2
sales spurred by the expiration of a homebuyer tax credit, and fears of a renewed economic slowdown. On several occasions, the Fed reiterated it would maintain the federal funds target rate within a range of 0% to 0.25% for an extended period. In November, concerned about the slowing pace of recovery as well as inflation, which had dipped to a level below its mandate to foster maximum employment and price stability, the Fed said it intended to buy $600 billion of government debt in an effort to correct these conditions.
Investor concerns about weak economic data and the potential spillover effects of the European debt crisis led to market volatility. At times, wary investors favored short-term Treasuries, and Treasury yields dipped to very low levels during the year. Late in the year, encouraging corporate earnings reports, the prospect of Fed intervention and extension of Bush-era tax cuts, boosted investor confidence and fueled an equity market rally, which dampened Treasury prices. For the 12 months under review, however, Treasury prices rose and yields declined, reflecting general investor uncertainty. The two-year Treasury bill yield decreased from 1.14% to 0.61% over the 12-month period, while the 10-year Treasury note yield fell from 3.85% to 3.30%.
Investment Strategy
Using our straightforward investment approach, we seek to produce current income with a high degree of credit safety from a conservatively managed portfolio of U.S. government securities. Analyzing securities using proprietary and nonproprietary research, we seek to identify attractive investment opportunities.
Manager’s Discussion
During the year under review, continued easing of monetary policy and the combination of low inflation and tepid economic growth supported bond market performance. The economy gradually improved in the first half of the reporting period as financial systems stabilized and some measures of business activity rose. Markets fluctuated throughout the summer months, but ended the year on a positive note, led by lower unemployment levels and higher consumer spending. The Fed launched a second round of quantitative easing (QE2) measures in November. Although QE2 was widely anticipated, it faced sharp criticism and debates about its efficacy and whether it would have a meaningful impact on the real economy.
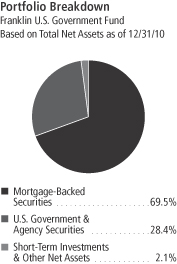
The dollar value, number of shares or principal amount, and names of all portfolio holdings are listed in the Fund’s Statement of Investments.
FUS-3
The overall mortgage-backed securities (MBS) market performed relatively well during the period. The Fed’s Agency MBS Purchase Program continued to support the mortgage sector until it ended in March 2010. The impact of the Fed’s well telegraphed exit from the MBS market was limited, as low mortgage issuance was absorbed by existing demand. Prepayment risk remained heightened, largely due to premium market prices and near historically low mortgage rates. Actual prepayment levels, however, were constrained by the associated cost of refinancing, loss of home equity, tighter underwriting standards and declining home prices.
Ginnie Mae (GNMA) MBS remained relatively attractive in the recent environment as the GNMA current coupon yielded 3.93% at period-end, an income opportunity over both 5- and 10-year Treasuries, which yielded 2.01% and 3.30%.
During the period, GNMA MBS outperformed comparable high credit-quality U.S. Treasuries and their conventional Fannie Mae (FNMA) and Freddie Mac (FHLMC) MBS counterparts. Within the sector, higher coupon GNMAs (6.0%) outperformed their mid-coupon (4.5%) counterparts. Coupon performance among GNMA I securities (comprising single-issuer pools) and GNMA II securities (comprising multiple-issuer pools), was mixed.
Franklin U.S. Government Fund takes a consistent and disciplined approach and invests significantly in GNMA mortgage pass-throughs, which remain the only MBS backed by the full faith and credit of the U.S. government.3 The Fund took a collateral intensive research approach to uncover opportunities across the GNMA and agency MBS universe. We believe our experience and continual investment in new technologies can help us identify specified pools and individual securities that offer strong cash flow fundamentals and valuations. We remained weighted toward GNMA I’s, as we believed they offered better value on a historical price-spread basis, but we slightly increased the Fund’s allocation to GNMA II securities over the period. We increased the portfolio’s allocation to some lower coupon MBS. At year-end, our heaviest allocation was in coupons in the 4.5% through 5.5% range.
3. Securities owned by the Fund, but not shares of the Fund, are guaranteed by the U.S. government, its agencies or instrumentalities as to timely payment of principal and interest. The Fund’s yield and share price are not guaranteed and will vary with market conditions.
FUS-4
Thank you for your participation in Franklin U.S. Government Fund. We look forward to serving your future investment needs.
The foregoing information reflects our analysis, opinions and portfolio holdings as of December 31, 2010, the end of the reporting period. The way we implement our main investment strategies and the resulting portfolio holdings may change depending on factors such as market and economic conditions. These opinions may not be relied upon as investment advice or an offer for a particular security. The information is not a complete analysis of every aspect of any market, country, industry, security or the Fund. Statements of fact are from sources considered reliable, but the investment manager makes no representation or warranty as to their completeness or accuracy. Although historical performance is no guarantee of future results, these insights may help you understand our investment management philosophy.
FUS-5
Fund Expenses
As an investor in a variable insurance contract (Contract) that indirectly provides for investment in an underlying mutual fund, you can incur transaction and/or ongoing expenses at both the Fund level and the Contract level.
| • | | Transaction expenses can include sales charges (loads) on purchases, redemption fees, surrender fees, transfer fees and premium taxes. |
| • | | Ongoing expenses can include management fees, distribution and service (12b-1) fees, contract fees, annual maintenance fees, mortality and expense risk fees and other fees and expenses. All mutual funds and Contracts have some types of ongoing expenses. |
The expenses shown in the table are meant to highlight ongoing expenses at the Fund level only and do not include ongoing expenses at the Contract level, or transaction expenses at either the Fund or Contract level. While the Fund does not have transaction expenses, if the transaction and ongoing expenses at the Contract level were included, the expenses shown below would be higher. You should consult your Contract prospectus or disclosure document for more information.
The table shows Fund-level ongoing expenses and can help you understand these expenses and compare them with those of other mutual funds offered through the Contract. The table assumes a $1,000 investment held for the six months indicated. Please refer to the Fund prospectus for additional information on operating expenses.
Actual Fund Expenses
The first line (Actual) of the table provides actual account values and expenses. The “Ending Account Value” is derived from the Fund’s actual return, which includes the effect of ongoing Fund expenses, but does not include the effect of ongoing Contract expenses.
You can estimate the Fund-level expenses you incurred during the period by following these steps. Of course, your account value and expenses will differ from those in this illustration:
| 1. | Divide your account value by $1,000. |
If an account had an $8,600 value, then $8,600 ÷ $1,000 = 8.6.
| 2. | Multiply the result by the number under the heading “Fund-Level Expenses Incurred During Period.” |
If Fund-Level Expenses Incurred During Period were $7.50, then 8.6 x $7.50 = $64.50.
In this illustration, the estimated expenses incurred this period at the Fund level are $64.50.
Franklin U.S. Government Fund – Class 4
FUS-6
Hypothetical Example for Comparison with Other Mutual Funds
Information in the second line (Hypothetical) of the table can help you compare ongoing expenses of the Fund with those of other mutual funds offered through the Contract. This information may not be used to estimate the actual ending account balance or expenses you incurred during the period. The hypothetical “Ending Account Value” is based on the Fund’s actual expense ratio and an assumed 5% annual rate of return before expenses, which does not represent the Fund’s actual return. The figure under the heading “Fund-Level Expenses Incurred During Period” shows the hypothetical expenses your account would have incurred under this scenario. You can compare this figure with the 5% hypothetical examples that appear in shareholder reports of other funds offered through a Contract.
| | | | | | | | | | | | |
| Class 4 | | Beginning
Account Value 7/1/10 | | | Ending
Account Value 12/31/10 | | | Fund-Level Expenses Incurred
During Period*
7/1/10–12/31/10 | |
Actual | | $ | 1,000 | | | $ | 1,006.10 | | | $ | 4.45 | |
Hypothetical (5% return before expenses) | | $ | 1,000 | | | $ | 1,020.77 | | | $ | 4.48 | |
*Expenses are calculated using the most recent six-month annualized expense ratio for the Fund’s Class 4 shares (0.88%), which does not include any ongoing expenses of the Contract for which the Fund is an investment option, multiplied by the average account value over the period, multiplied by 184/365 to reflect the one-half year period.
FUS-7
Franklin Templeton Variable Insurance Products Trust
Financial Highlights
Franklin U.S. Government Fund
| | | | | | | | | | | | | | | | | | | | |
| | | Year Ended December 31, | |
| Class 1 | | 2010 | | | 2009 | | | 2008 | | | 2007 | | | 2006 | |
| | | | |
Per share operating performance | | | | | | | | | | | | | | | | | | | | |
(for a share outstanding throughout the year) | | | | | | | | | | | | | | | | | | | | |
Net asset value, beginning of year | | $ | 13.08 | | | $ | 13.19 | | | $ | 12.89 | | | $ | 12.69 | | | $ | 12.75 | |
| | | | |
Income from investment operationsa: | | | | | | | | | | | | | | | | | | | | |
Net investment incomeb | | | 0.46 | | | | 0.51 | | | | 0.58 | | | | 0.61 | | | | 0.59 | |
Net realized and unrealized gains (losses) | | | 0.26 | | | | (0.08 | ) | | | 0.39 | | | | 0.22 | | | | (0.07 | ) |
| | | | |
Total from investment operations | | | 0.72 | | | | 0.43 | | | | 0.97 | | | | 0.83 | | | | 0.52 | |
| | | | |
Less distributions from net investment income | | | (0.46 | ) | | | (0.54 | ) | | | (0.67 | ) | | | (0.63 | ) | | | (0.58 | ) |
| | | | |
Net asset value, end of year | | $ | 13.34 | | | $ | 13.08 | | | $ | 13.19 | | | $ | 12.89 | | | $ | 12.69 | |
| | | | |
| | | | | |
Total returnc | | | 5.56% | | | | 3.34% | | | | 7.91% | | | | 6.85% | | | | 4.31% | |
Ratios to average net assets | | | | | | | | | | | | | | | | | | | | |
Expenses | | | 0.52% | | | | 0.53% | | | | 0.53% | d | | | 0.53% | d | | | 0.54% | d |
Net investment income | | | 3.47% | | | | 3.91% | | | | 4.54% | | | | 4.83% | | | | 4.67% | |
| | | | | |
Supplemental data | | | | | | | | | | | | | | | | | | | | |
Net assets, end of year (000’s) | | $ | 157,551 | | | $ | 162,524 | | | $ | 173,018 | | | $ | 167,700 | | | $ | 187,867 | |
Portfolio turnover rate | | | 51.04% | | | | 27.51% | | | | 17.06% | | | | 27.50% | | | | 23.46% | |
aThe amount shown for a share outstanding throughout the period may not correlate with the Statement of Operations for the period due to the timing of sales and repurchases of the Fund shares in relation to income earned and/or fluctuating market value of the investments of the Fund.
bBased on average daily shares outstanding.
cTotal return does not include fees, charges or expenses imposed by the variable annuity and life insurance contracts for which the Franklin Templeton Variable Insurance Products Trust serves as an underlying investment vehicle.
dBenefit of expense reduction rounds to less than 0.01%.
The accompanying notes are an integral part of these financial statements.
FUS-8
Franklin Templeton Variable Insurance Products Trust
Financial Highlights (continued)
Franklin U.S. Government Fund
| | | | | | | | | | | | | | | | | | | | |
| | | Year Ended December 31, | |
| Class 2 | | 2010 | | | 2009 | | | 2008 | | | 2007 | | | 2006 | |
| | | | |
Per share operating performance | | | | | | | | | | | | | | | | | | | | |
(for a share outstanding throughout the year) | | | | | | | | | | | | | | | | | | | | |
Net asset value, beginning of year | | $ | 12.87 | | | $ | 12.99 | | | $ | 12.71 | | | $ | 12.52 | | | $ | 12.59 | |
| | | | |
Income from investment operationsa: | | | | | | | | | | | | | | | | | | | | |
Net investment incomeb | | | 0.42 | | | | 0.47 | | | | 0.54 | | | | 0.57 | | | | 0.55 | |
Net realized and unrealized gains (losses) | | | 0.25 | | | | (0.08 | ) | | | 0.38 | | | | 0.22 | | | | (0.07 | ) |
| | | | |
Total from investment operations | | | 0.67 | | | | 0.39 | | | | 0.92 | | | | 0.79 | | | | 0.48 | |
| | | | |
Less distributions from net investment income | | | (0.43 | ) | | | (0.51 | ) | | | (0.64 | ) | | | (0.60 | ) | | | (0.55 | ) |
| | | | |
Net asset value, end of year | | $ | 13.11 | | | $ | 12.87 | | | $ | 12.99 | | | $ | 12.71 | | | $ | 12.52 | |
| | | | |
| | | | | |
Total returnc | | | 5.28% | | | | 3.09% | | | | 7.59% | | | | 6.61% | | | | 4.02% | |
Ratios to average net assets | | | | | | | | | | | | | | | | | | | | |
Expenses | | | 0.77% | | | | 0.78% | | | | 0.78%d | | | | 0.78%d | | | | 0.79%d | |
Net investment income | | | 3.22% | | | | 3.66% | | | | 4.29% | | | | 4.58% | | | | 4.42% | |
| | | | | |
Supplemental data | | | | | | | | | | | | | | | | | | | | |
Net assets, end of year (000’s) | | $ | 703,997 | | | $ | 557,809 | | | $ | 450,603 | | | $ | 379,386 | | | $ | 374,323 | |
Portfolio turnover rate | | | 51.04% | | | | 27.51% | | | | 17.06% | | | | 27.50% | | | | 23.46% | |
aThe amount shown for a share outstanding throughout the period may not correlate with the Statement of Operations for the period due to the timing of sales and repurchases of the Fund shares in relation to income earned and/or fluctuating market value of the investments of the Fund.
bBased on average daily shares outstanding.
cTotal return does not include fees, charges or expenses imposed by the variable annuity and life insurance contracts for which the Franklin Templeton Variable Insurance Products Trust serves as an underlying investment vehicle.
dBenefit of expense reduction rounds to less than 0.01%.
The accompanying notes are an integral part of these financial statements.
FUS-9
Franklin Templeton Variable Insurance Products Trust
Financial Highlights (continued)
Franklin U.S. Government Fund
| | | | | | | | | | | | |
| | | Year Ended December 31, | |
| Class 4 | | 2010 | | | 2009 | | | 2008a | |
| | | | |
Per share operating performance | | | | | | | | | | | | |
(for a share outstanding throughout the year) | | | | | | | | | | | | |
Net asset value, beginning of year | | $ | 13.03 | | | $ | 13.15 | | | $ | 13.19 | |
| | | | |
Income from investment operationsb: | | | | | | | | | | | | |
Net investment incomec | | | 0.41 | | | | 0.47 | | | | 0.45 | |
Net realized and unrealized gains (losses) | | | 0.27 | | | | (0.09 | ) | | | 0.18 | |
| | | | |
Total from investment operations | | | 0.68 | | | | 0.38 | | | | 0.63 | |
| | | | |
Less distributions from net investment income | | | (0.41 | ) | | | (0.50 | ) | | | (0.67 | ) |
| | | | |
Net asset value, end of year | | $ | 13.30 | | | $ | 13.03 | | | $ | 13.15 | |
| | | | |
| | | |
Total returnd | | | 5.21% | | | | 2.98% | | | | 5.14% | |
Ratios to average net assetse | | | | | | | | | | | | |
Expenses | | | 0.87% | | | | 0.88% | | | | 0.88% | f |
Net investment income | | | 3.12% | | | | 3.56% | | | | 4.19% | |
| | | |
Supplemental data | | | | | | | | | | | | |
Net assets, end of year (000’s) | | $ | 5 | | | $ | 5 | | | $ | 5 | |
Portfolio turnover rate | | | 51.04% | | | | 27.51% | | | | 17.06% | |
aFor the period February 29, 2008 (effective date) to December 31, 2008.
bThe amount shown for a share outstanding throughout the period may not correlate with the Statement of Operations for the period due to the timing of sales and repurchases of the Fund shares in relation to income earned and/or fluctuating market value of the investments of the Fund.
cBased on average daily shares outstanding.
dTotal return does not include fees, charges or expenses imposed by the variable annuity and life insurance contracts for which the Franklin Templeton Variable Insurance Products Trust serves as an underlying investment vehicle. Total return is not annualized for periods less than one year.
eRatios are annualized for periods less than one year.
fBenefit of expense reduction rounds to less than 0.01%.
The accompanying notes are an integral part of these financial statements.
FUS-10
Franklin Templeton Variable Insurance Products Trust
Statement of Investments, December 31, 2010
| | | | | | | | |
| Franklin U.S. Government Fund | | Principal
Amount | | | Value | |
Mortgage-Backed Securities 69.5% | | | | | | | | |
aFederal Home Loan Mortgage Corp. (FHLMC) Adjustable Rate 0.0%† | | | | | | | | |
FHLMC, 2.402%, 6/01/22 | | $ | 181,621 | | | $ | 189,316 | |
FHLMC, 2.572%, 2/01/19 | | | 124,228 | | | | 129,820 | |
| | | | | | | | |
| | | | 319,136 | |
| | | | | | | | |
Federal Home Loan Mortgage Corp. (FHLMC) Fixed Rate 8.1% | | | | | | | | |
FHLMC Gold 15 Year, 4.50%, 3/01/25 | | | 9,587,125 | | | | 10,072,056 | |
FHLMC Gold 15 Year, 4.50%, 4/01/25 | | | 9,727,747 | | | | 10,180,694 | |
FHLMC Gold 30 Year, 4.00%, 11/01/40 | | | 5,992,065 | | | | 5,956,578 | |
FHLMC Gold 30 Year, 4.50%, 5/01/40 | | | 4,414,539 | | | | 4,529,308 | |
FHLMC Gold 30 Year, 5.00%, 9/01/33 - 6/01/37 | | | 9,305,533 | | | | 9,802,466 | |
FHLMC Gold 30 Year, 5.00%, 6/01/39 | | | 9,081,888 | | | | 9,532,091 | |
FHLMC Gold 30 Year, 5.50%, 7/01/33 - 1/01/35 | | | 7,620,630 | | | | 8,178,204 | |
FHLMC Gold 30 Year, 6.00%, 1/01/24 - 8/01/35 | | | 5,501,354 | | | | 6,044,695 | |
FHLMC Gold 30 Year, 6.50%, 11/01/23 - 5/01/35 | | | 2,191,652 | | | | 2,455,345 | |
FHLMC Gold 30 Year, 7.00%, 4/01/24 - 10/01/32 | | | 858,276 | | | | 975,959 | |
FHLMC Gold 30 Year, 7.50%, 12/01/22 - 5/01/24 | | | 33,323 | | | | 37,945 | |
FHLMC Gold 30 Year, 8.00%, 7/01/21 - 5/01/22 | | | 37,560 | | | | 43,629 | |
FHLMC Gold 30 Year, 8.50%, 10/01/21 - 7/01/31 | | | 1,291,655 | | | | 1,541,191 | |
FHLMC PC 30 Year, 8.00%, 1/01/17 - 9/01/17 | | | 6,935 | | | | 7,235 | |
FHLMC PC 30 Year, 8.50%, 9/01/20 | | | 1,639 | | | | 1,909 | |
| | | | | | | | |
| | | | 69,359,305 | |
| | | | | | | | |
aFederal National Mortgage Association (FNMA) Adjustable Rate 0.2% | | | | | | | | |
FNMA, 2.381%, 1/01/18 | | | 931,125 | | | | 971,015 | |
FNMA, 2.404%, 2/01/19 | | | 133,501 | | | | 139,172 | |
FNMA, 2.607%, 9/01/18 | | | 321,822 | | | | 337,262 | |
FNMA, 4.524%, 7/01/19 | | | 116,945 | | | | 117,866 | |
FNMA, 4.829%, 3/01/20 | | | 104,127 | | | | 109,725 | |
| | | | | | | | |
| | | | 1,675,040 | |
| | | | | | | | |
Federal National Mortgage Association (FNMA) Fixed Rate 9.5% | | | | | | | | |
FNMA 15 Year, 5.50%, 6/01/16 - 11/01/17 | | | 823,334 | | | | 887,829 | |
FNMA 15 Year, 5.50%, 1/01/25 | | | 15,000,002 | | | | 16,140,565 | |
FNMA 15 Year, 6.00%, 8/01/17 - 9/01/17 | | | 927,584 | | | | 1,011,789 | |
FNMA 30 Year, 4.00%, 10/01/40 | | | 7,450,591 | | | | 7,421,600 | |
FNMA 30 Year, 5.00%, 3/01/34 - 7/01/35 | | | 5,247,538 | | | | 5,546,322 | |
FNMA 30 Year, 5.50%, 12/01/32 - 8/01/35 | | | 10,121,508 | | | | 10,899,316 | |
FNMA 30 Year, 6.00%, 1/01/24 - 8/01/38 | | | 27,067,033 | | | | 29,499,438 | |
FNMA 30 Year, 6.50%, 1/01/24 - 9/01/36 | | | 5,053,709 | | | | 5,645,381 | |
FNMA 30 Year, 7.50%, 4/01/23 - 8/01/25 | | | 115,553 | | | | 132,063 | |
FNMA 30 Year, 8.00%, 7/01/16 - 2/01/25 | | | 190,813 | | | | 220,263 | |
FNMA 30 Year, 8.50%, 10/01/19 - 8/01/21 | | | 2,852 | | | | 3,281 | |
FNMA 30 Year, 9.00%, 10/01/26 | | | 381,120 | | | | 444,577 | |
FNMA GL 30 Year, 8.00%, 8/01/19 - 6/01/20 | | | 56,049 | | | | 61,620 | |
FNMA PL 30 Year, 5.50%, 4/01/34 | | | 3,861,004 | | | | 4,160,429 | |
| | | | | | | | |
| | | | 82,074,473 | |
| | | | | | | | |
Government National Mortgage Association (GNMA) Fixed Rate 51.7% | | | | | | | | |
GNMA I SF 30 Year, 4.00%, 10/15/40 - 12/15/40 | | | 12,011,351 | | | | 12,124,139 | |
GNMA I SF 30 Year, 4.50%, 9/15/39 | | | 9,162,842 | | | | 9,528,339 | |
GNMA I SF 30 Year, 4.50%, 1/15/39 - 7/15/40 | | | 66,477,899 | | | | 69,187,800 | |
GNMA I SF 30 Year, 4.50%, 7/15/40 | | | 13,338,600 | | | | 13,870,665 | |
GNMA I SF 30 Year, 4.50%, 8/15/40 | | | 9,344,526 | | | | 9,717,271 | |
FUS-11
Franklin Templeton Variable Insurance Products Trust
Statement of Investments, December 31, 2010 (continued)
| | | | | | | | |
| Franklin U.S. Government Fund | | Principal
Amount | | | Value | |
Mortgage-Backed Securities (continued) | | | | | | | | |
Government National Mortgage Association (GNMA) Fixed Rate (continued) | | | | | | | | |
GNMA I SF 30 Year, 5.00%, 8/15/39 | | $ | 10,010,665 | | | $ | 10,651,418 | |
GNMA I SF 30 Year, 5.00%, 2/15/40 | | | 15,674,074 | | | | 16,785,084 | |
GNMA I SF 30 Year, 5.00%, 3/15/40 | | | 8,707,826 | | | | 9,325,054 | |
GNMA I SF 30 Year, 5.00%, 6/15/30 - 6/15/40 | | | 69,993,735 | | | | 74,793,446 | |
GNMA I SF 30 Year, 5.50%, 11/15/28 - 10/15/39 | | | 39,911,641 | | | | 43,381,887 | |
GNMA I SF 30 Year, 6.00%, 11/15/23 - 11/15/38 | | | 22,090,177 | | | | 24,400,367 | |
GNMA I SF 30 Year, 6.50%, 5/15/23 - 9/15/38 | | | 6,871,075 | | | | 7,796,537 | |
GNMA I SF 30 Year, 7.00%, 3/15/22 - 1/15/32 | | | 1,884,211 | | | | 2,152,604 | |
GNMA I SF 30 Year, 7.50%, 2/15/17 - 8/15/33 | | | 1,777,936 | | | | 2,076,819 | |
GNMA I SF 30 Year, 8.00%, 2/15/17 - 6/15/24 | | | 519,140 | | | | 598,758 | |
GNMA I SF 30 Year, 8.25%, 4/15/25 | | | 19,654 | | | | 19,945 | |
GNMA I SF 30 Year, 8.50%, 6/15/22 - 12/15/24 | | | 181,718 | | | | 208,088 | |
GNMA I SF 30 Year, 9.00%, 6/15/16 - 5/15/20 | | | 67,459 | | | | 76,369 | |
GNMA I SF 30 Year, 9.50%, 7/15/16 - 6/15/21 | | | 201,460 | | | | 228,415 | |
GNMA I SF 30 Year, 10.00%, 10/15/17 - 8/15/21 | | | 115,808 | | | | 130,674 | |
GNMA II SF 30 Year, 4.00%, 11/20/40 | | | 11,043,167 | | | | 11,136,594 | |
GNMA II SF 30 Year, 4.00%, 12/20/40 | | | 5,311,000 | | | | 5,355,932 | |
GNMA II SF 30 Year, 4.50%, 10/20/39 - 2/20/40 | | | 8,598,963 | | | | 8,943,351 | |
GNMA II SF 30 Year, 4.50%, 7/20/40 | | | 13,478,630 | | | | 14,016,281 | |
GNMA II SF 30 Year, 4.50%, 9/20/40 | | | 13,512,704 | | | | 14,051,714 | |
GNMA II SF 30 Year, 5.00%, 9/20/33 - 6/20/40 | | | 23,073,423 | | | | 24,633,233 | |
GNMA II SF 30 Year, 5.50%, 2/20/36 | | | 11,802,125 | | | | 12,740,831 | |
GNMA II SF 30 Year, 5.50%, 5/20/34 - 6/20/38 | | | 20,704,795 | | | | 22,380,248 | |
GNMA II SF 30 Year, 6.00%, 11/20/23 - 7/20/39 | | | 20,121,607 | | | | 22,138,387 | |
GNMA II SF 30 Year, 6.50%, 12/20/27 - 4/20/34 | | | 1,946,833 | | | | 2,202,179 | |
GNMA II SF 30 Year, 7.00%, 5/20/32 | | | 31,987 | | | | 36,545 | |
GNMA II SF 30 Year, 7.50%, 5/20/17 - 5/20/33 | | | 354,305 | | | | 403,494 | |
GNMA II SF 30 Year, 8.00%, 7/20/16 - 8/20/26 | | | 37,723 | | | | 40,832 | |
GNMA II SF 30 Year, 9.50%, 4/20/25 | | | 3,105 | | | | 3,696 | |
| | | | | | | | |
| | | | | | | 445,136,996 | |
| | | | | | | | |
Total Mortgage-Backed Securities (Cost $576,874,158) | | | | | | | 598,564,950 | |
| | | | | | | | |
U.S. Government and Agency Securities 28.4% | | | | | | | | |
FFCB, 1.50%, 11/16/15 | | | 10,000,000 | | | | 9,720,010 | |
FHLB, | | | | | | | | |
0.875%, 8/22/12 | | | 20,000,000 | | | | 20,107,640 | |
3.625%, 5/29/13 | | | 4,500,000 | | | | 4,798,616 | |
5.125%, 8/14/13 | | | 11,000,000 | | | | 12,187,472 | |
5.375%, 8/19/11 | | | 12,000,000 | | | | 12,376,788 | |
FHLMC, 5.125%, 11/17/17 | | | 10,000,000 | | | | 11,403,840 | |
FICO, 15, Strip, 3/07/16 | | | 15,000,000 | | | | 13,202,175 | |
FNMA, | | | | | | | | |
1.25%, 6/22/12 | | | 25,000,000 | | | | 25,270,625 | |
1.75%, 3/23/11 - 5/07/13 | | | 14,900,000 | | | | 15,097,734 | |
senior note, 5.375%, 6/12/17 | | | 26,000,000 | | | | 29,977,298 | |
HUD, 96-A, | | | | | | | | |
7.63%, 8/01/14 | | | 430,000 | | | | 430,828 | |
7.66%, 8/01/15 | | | 607,582 | | | | 608,869 | |
FUS-12
Franklin Templeton Variable Insurance Products Trust
Statement of Investments, December 31, 2010 (continued)
| | | | | | | | |
| Franklin U.S. Government Fund | | Principal
Amount | | | Value | |
U.S. Government and Agency Securities (continued) | | | | | | | | |
SBA, | | | | | | | | |
aFRN, 2.85%, 6/25/19 | | $ | 372,935 | | | $ | 381,918 | |
aFRN, 3.125%, 3/25/18 | | | 555,064 | | | | 567,893 | |
PC, 1995-20L, 1, 6.45%, 12/01/15 | | | 397,297 | | | | 440,931 | |
PC, 1996-20L, 1, 6.70%, 12/01/16 | | | 446,676 | | | | 487,322 | |
PC, 1997-20G, 1, 6.85%, 7/01/17 | | | 546,484 | | | | 596,616 | |
PC, 1998-20I, 1, 6.00%, 9/01/18 | | | 1,538,026 | | | | 1,676,395 | |
TVA, | | | | | | | | |
5.88%, 4/01/36 | | | 5,000,000 | | | | 5,767,045 | |
zero cpn. to 4/15/12, 8.25% thereafter, 4/15/42 | | | 6,000,000 | | | | 6,220,314 | |
U.S. Treasury Note, | | | | | | | | |
2.375%, 9/30/14 | | | 17,000,000 | | | | 17,610,946 | |
2.375%, 8/31/14 - 10/31/14 | | | 15,000,000 | | | | 15,535,397 | |
2.50%, 4/30/15 | | | 18,250,000 | | | | 18,870,226 | |
3.125%, 8/31/13 | | | 12,000,000 | | | | 12,732,192 | |
4.75%, 5/15/14 | | | 8,000,000 | | | | 8,936,880 | |
| | | | | | | | |
Total U.S. Government and Agency Securities (Cost $231,428,832) | | | | | | | 245,005,970 | |
| | | | | | | | |
Total Investments before Short Term Investments (Cost $808,302,990) | | | | | | | 843,570,920 | |
| | | | | | | | |
Short Term Investments (Cost $14,434,172) 1.7% | | | | | | | | |
Repurchase Agreements 1.7% | | | | | | | | |
bJoint Repurchase Agreement, 0.141%, 1/03/11 (Maturity Value $14,434,342) | | | 14,434,172 | | | | 14,434,172 | |
Barclays Capital Inc. (Maturity Value $2,485,161) BNP Paribas Securities Corp. (Maturity Value $2,556,033) Credit Suisse Securities (USA) LLC (Maturity Value $1,420,051) Deutsche Bank Securities Inc. (Maturity Value $2,292,751) HSBC Securities (USA) Inc. (Maturity Value $1,775,135) Merrill Lynch, Pierce, Fenner & Smith Inc. (Maturity Value $1,420,051) Morgan Stanley & Co. Inc. (Maturity Value $1,775,135) UBS Securities LLC (Maturity Value $710,025) | | | | | | | | |
Collateralized by U.S. Government Agency Securities, 0.50% - 5.75%, 1/07/11 - 10/26/15;
cU.S. Treasury Bills, 5/12/11 - 7/28/11; and U.S. Treasury Notes, 0.375% - 1.875%, 9/30/11 - 9/30/17 (valued at $14,746,286) | | | | | | | | |
| | | | | | | | |
Total Investments (Cost $822,737,162) 99.6% | | | | | | | 858,005,092 | |
Other Assets, less Liabilities 0.4% | | | | | | | 3,548,061 | |
| | | | | | | | |
Net Assets 100.0% | | | | | | $ | 861,553,153 | |
| | | | | | | | |
See Abbreviations on page FUS-22.
†Rounds to less than 0.1% of net assets.
aThe coupon rate shown represents the rate at period end.
bSee Note 1(b) regarding joint repurchase agreement.
cThe security is traded on a discount basis with no stated coupon rate.
The accompanying notes are an integral part of these financial statements.
FUS-13
Franklin Templeton Variable Insurance Products Trust
Financial Statements
Statement of Assets and Liabilities
December 31, 2010
| | | | |
| | | Franklin U.S.
Government Fund | |
Assets: | | | | |
Investments in securities: | | | | |
Cost - Unaffiliated issuers | | $ | 808,302,990 | |
Cost - Repurchase agreements | | | 14,434,172 | |
| | | | |
Total cost of investments | | $ | 822,737,162 | |
| | | | |
Value - Unaffiliated issuers | | $ | 843,570,920 | |
Value - Repurchase agreements | | | 14,434,172 | |
| | | | |
Total value of investments | | | 858,005,092 | |
Receivables: | | | | |
Investment securities sold | | | 12,224 | |
Capital shares sold | | | 704,069 | |
Interest | | | 3,650,667 | |
Other assets | | | 93 | |
| | | | |
Total assets | | | 862,372,145 | |
| | | | |
Liabilities: | | | | |
Payables: | | | | |
Affiliates | | | 643,501 | |
Reports to shareholders | | | 129,582 | |
Accrued expenses and other liabilities | | | 45,909 | |
| | | | |
Total liabilities | | | 818,992 | |
| | | | |
Net assets, at value | | $ | 861,553,153 | |
| | | | |
Net assets consist of: | | | | |
Paid-in capital | | $ | 815,220,434 | |
Undistributed net investment income | | | 28,069,944 | |
Net unrealized appreciation (depreciation) | | | 35,267,930 | |
Accumulated net realized gain (loss) | | | (17,005,155 | ) |
| | | | |
Net assets, at value | | $ | 861,553,153 | |
| | | | |
Class 1: | | | | |
Net assets, at value | | $ | 157,551,324 | |
| | | | |
Shares outstanding | | | 11,807,574 | |
| | | | |
Net asset value and maximum offering price per share | | $ | 13.34 | |
| | | | |
Class 2: | | | | |
Net assets, at value | | $ | 703,996,790 | |
| | | | |
Shares outstanding | | | 53,680,553 | |
| | | | |
Net asset value and maximum offering price per share | | $ | 13.11 | |
| | | | |
Class 4: | | | | |
Net assets, at value | | $ | 5,039 | |
| | | | |
Shares outstanding | | | 379 | |
| | | | |
Net asset value and maximum offering price per share | | $ | 13.30 | |
| | | | |
The accompanying notes are an integral part of these financial statements.
FUS-14
Franklin Templeton Variable Insurance Products Trust
Financial Statements (continued)
Statement of Operations
for the year ended December 31, 2010
| | | | |
| | | Franklin U.S.
Government Fund | |
Investment income: | | | | |
Interest | | $ | 32,361,875 | |
| | | | |
Expenses: | | | | |
Management fees (Note 3a) | | | 3,898,824 | |
Distribution fees: (Note 3c) | | | | |
Class 2 | | | 1,622,228 | |
Class 4 | | | 18 | |
Unaffiliated transfer agent fees | | | 880 | |
Custodian fees (Note 4) | | | 12,123 | |
Reports to shareholders | | | 215,797 | |
Professional fees | | | 42,232 | |
Trustees’ fees and expenses | | | 3,580 | |
Other | | | 63,137 | |
| | | | |
Total expenses | | | 5,858,819 | |
| | | | |
Net investment income | | | 26,503,056 | |
| | | | |
Realized and unrealized gains (losses): | | | | |
Net realized gain (loss) from investments | | | 545,240 | |
Net change in unrealized appreciation (depreciation) on investments | | | 13,639,024 | |
| | | | |
Net realized and unrealized gain (loss) | | | 14,184,264 | |
| | | | |
Net increase (decrease) in net assets resulting from operations | | $ | 40,687,320 | |
| | | | |
The accompanying notes are an integral part of these financial statements.
FUS-15
Franklin Templeton Variable Insurance Products Trust
Financial Statements (continued)
Statements of Changes in Net Assets
| | | | | | | | |
| | | Franklin U.S. Government Fund | |
| | | Year Ended December 31, | |
| | | 2010 | | | 2009 | |
| | | | |
Increase (decrease) in net assets: | | | | | | | | |
Operations: | | | | | | | | |
Net investment income | | $ | 26,503,056 | | | $ | 25,159,362 | |
Net realized gain (loss) from investments | | | 545,240 | | | | 1,136,390 | |
Net change in unrealized appreciation (depreciation) on investments | | | 13,639,024 | | | | (5,729,636 | ) |
| | | | |
Net increase (decrease) in net assets resulting from operations | | | 40,687,320 | | | | 20,566,116 | |
| | | | |
Distributions to shareholders from net investment income: | | | | | | | | |
Class 1 | | | (5,536,228 | ) | | | (6,764,185 | ) |
Class 2 | | | (21,255,018 | ) | | | (18,929,900 | ) |
Class 4 | | | (156 | ) | | | (189 | ) |
| | | | |
Total distributions to shareholders | | | (26,791,402 | ) | | | (25,694,274 | ) |
| | | | |
Capital share transactions: (Note 2) | | | | | | | | |
Class 1 | | | (8,339,790 | ) | | | (9,317,944 | ) |
Class 2 | | | 135,659,032 | | | | 111,158,235 | |
| | | | |
Total capital share transactions | | | 127,319,242 | | | | 101,840,291 | |
| | | | |
Net increase (decrease) in net assets | | | 141,215,160 | | | | 96,712,133 | |
Net assets: | | | | | | | | |
Beginning of year | | | 720,337,993 | | | | 623,625,860 | |
| | | | |
End of year | | $ | 861,553,153 | | | $ | 720,337,993 | |
| | | | |
Undistributed net investment income included in net assets: | | | | | | | | |
End of year | | $ | 28,069,944 | | | $ | 25,992,959 | |
| | | | |
The accompanying notes are an integral part of these financial statements.
FUS-16
Franklin Templeton Variable Insurance Products Trust
Notes to Financial Statements
Franklin U.S. Government Fund
1. ORGANIZATION AND SIGNIFICANT ACCOUNTING POLICIES
Franklin Templeton Variable Insurance Products Trust (Trust) is registered under the Investment Company Act of 1940, as amended, (1940 Act) as an open-end investment company, consisting of twenty separate funds. The Franklin U.S. Government Fund (Fund) is included in this report. The financial statements of the remaining funds in the Trust are presented separately. Shares of the Fund are generally sold only to insurance company separate accounts to fund the benefits of variable life insurance policies or variable annuity contracts. At December 31, 2010, 55.89% of the Fund’s shares were held through one insurance company. The Fund offers three classes of shares: Class 1, Class 2, and Class 4. Each class of shares differs by its distribution fees, voting rights on matters affecting a single class and its exchange privilege.
The following summarizes the Fund’s significant accounting policies.
a. Financial Instrument Valuation
The Fund values its investments in securities and other assets and liabilities carried at fair value daily. Fair value is the price that would be received to sell an asset or paid to transfer a liability in an orderly transaction between market participants on the measurement date. Under procedures approved by the Trust’s Board of Trustees, the Fund may utilize independent pricing services, quotations from securities and financial instrument dealers, and other market sources to determine fair value.
Debt securities generally trade in the over-the-counter market rather than on a securities exchange. The Fund’s pricing services use multiple valuation techniques to determine fair value. In instances where sufficient market activity exists, the pricing services may utilize a market-based approach through which quotes from market makers are used to determine fair value. In instances where sufficient market activity may not exist or is limited, the pricing services also utilize proprietary valuation models which may consider market characteristics such as benchmark yield curves, option-adjusted spreads, credit spreads, estimated default rates, coupon rates, anticipated timing of principal repayments, underlying collateral, and other unique security features in order to estimate the relevant cash flows, which are then discounted to calculate the fair value. Repurchase agreements are valued at cost, which approximates market value.
The Fund has procedures to determine the fair value of securities and other financial instruments for which market prices are not readily available or which may not be reliably priced. Under these procedures, the Fund primarily employs a market-based approach which may use related or comparable assets or liabilities, recent transactions, market multiples, book values, and other relevant information for the investment to determine the fair value of the investment. The Fund may also use an income-based valuation approach in which the anticipated future cash flows of the investment are discounted to calculate fair value. Discounts may also be applied due to the nature or duration of any restrictions on the disposition of the investments. Due to the inherent uncertainty of valuations of such investments, the fair values may differ significantly from the values that would have been used had an active market existed.
b. Joint Repurchase Agreement
The Fund may enter into a joint repurchase agreement whereby its uninvested cash balance is deposited into a joint cash account with other funds managed by the investment manager or an affiliate of the investment manager and is used to invest in one or more repurchase agreements. The value and face amount of the joint repurchase agreement are allocated to the funds based on their pro-rata interest. A repurchase agreement is accounted for as a loan by the fund to the seller, collateralized by securities which are delivered to the fund’s custodian. The market value, including accrued interest, of the initial collateralization is required to be at least 102% of the dollar amount invested by the funds, with the value of the underlying securities marked to market daily to maintain coverage of at least 100%. The joint repurchase agreement held by the Fund at year end had been entered into on December 31, 2010.
FUS-17
Franklin Templeton Variable Insurance Products Trust
Notes to Financial Statements (continued)
Franklin U.S. Government Fund
1. ORGANIZATION AND SIGNIFICANT ACCOUNTING POLICIES (continued)
c. Income Taxes
It is the Fund’s policy to qualify as a regulated investment company under the Internal Revenue Code. The Fund intends to distribute to shareholders substantially all of its taxable income and net realized gains to relieve it from federal income and excise taxes. As a result, no provision for U.S. federal income taxes is required. The Fund files U.S. income tax returns as well as tax returns in certain other jurisdictions. The Fund’s application of those tax rules is subject to its understanding. The Fund records a provision for taxes in its financial statements including penalties and interest, if any, for a tax position taken on a tax return (or expected to be taken) when it fails to meet the more likely than not (a greater than 50% probability) threshold and based on the technical merits, the tax position may not be sustained upon examination by the tax authorities. As of December 31, 2010, and for all open tax years, the Fund has determined that no provision for income tax is required in the Fund’s financial statements. Open tax years are those that remain subject to examination and are based on each tax jurisdiction statute of limitation. The Fund is not aware of any tax position for which it is reasonably possible that the total amounts of unrecognized tax effects will significantly change in the next twelve months.
d. Security Transactions, Investment Income, Expenses and Distributions
Security transactions are accounted for on trade date. Realized gains and losses on security transactions are determined on a specific identification basis. Interest income and estimated expenses are accrued daily. Amortization of premium and accretion of discount on debt securities are included in interest income. Distributions to shareholders are recorded on the ex-dividend date and are determined according to income tax regulations (tax basis). Distributable earnings determined on a tax basis may differ from earnings recorded in accordance with accounting principles generally accepted in the United States of America. These differences may be permanent or temporary. Permanent differences are reclassified among capital accounts to reflect their tax character. These reclassifications have no impact on net assets or the results of operations. Temporary differences are not reclassified, as they may reverse in subsequent periods.
Common expenses incurred by the Trust are allocated among the funds based on the ratio of net assets of each fund to the combined net assets of the Trust. Fund specific expenses are charged directly to the fund that incurred the expense.
Realized and unrealized gains and losses and net investment income, not including class specific expenses, are allocated daily to each class of shares based upon the relative proportion of net assets of each class. Differences in per share distributions, by class, are generally due to differences in class specific expenses.
e. Accounting Estimates
The preparation of financial statements in accordance with accounting principles generally accepted in the United States of America requires management to make estimates and assumptions that affect the reported amounts of assets and liabilities at the date of the financial statements and the amounts of income and expenses during the reporting period. Actual results could differ from those estimates.
f. Guarantees and Indemnifications
Under the Trust’s organizational documents, its officers and trustees are indemnified by the Trust against certain liabilities arising out of the performance of their duties to the Trust. Additionally, in the normal course of business, the Trust, on behalf of the Fund, enters into contracts with service providers that contain general indemnification clauses. The Trust’s maximum exposure under these arrangements is unknown as this would involve future claims that may be made against the Trust that have not yet occurred. Currently, the Trust expects the risk of loss to be remote.
FUS-18
Franklin Templeton Variable Insurance Products Trust
Notes to Financial Statements (continued)
Franklin U.S. Government Fund
2. SHARES OF BENEFICIAL INTEREST
At December 31, 2010, there were an unlimited number of shares authorized (without par value). Transactions in the Fund’s shares were as follows:
| | | | | | | | | | | | | | | | |
| | | Year Ended December 31, | |
| | | 2010a | | | 2009a | |
| Class 1 Shares: | | Shares | | | Amount | | | Shares | | | Amount | |
Shares sold | | | 792,069 | | | $ | 10,574,203 | | | | 763,621 | | | $ | 10,042,333 | |
Shares issued in reinvestment of distributions | | | 422,290 | | | | 5,536,228 | | | | 531,776 | | | | 6,764,185 | |
Shares redeemed | | | (1,831,372 | ) | | | (24,450,221 | ) | | | (1,989,207 | ) | | | (26,124,462 | ) |
| | | | |
Net increase (decrease) | | | (617,013 | ) | | $ | (8,339,790 | ) | | | (693,810 | ) | | $ | (9,317,944 | ) |
| | | | |
Class 2 Shares: | | | | | | | | | | | | | | | | |
Shares sold | | | 19,436,114 | | | $ | 255,318,751 | | | | 18,952,917 | | | $ | 245,236,722 | |
Shares issued in reinvestment of distributions | | | 1,647,676 | | | | 21,255,018 | | | | 1,510,766 | | | | 18,929,900 | |
Shares redeemed | | | (10,741,522 | ) | | | (140,914,737 | ) | | | (11,812,087 | ) | | | (153,008,387 | ) |
| | | | |
Net increase (decrease) | | | 10,342,268 | | | $ | 135,659,032 | | | | 8,651,596 | | | $ | 111,158,235 | |
| | | | |
| aDuring | the year Class 4 did not report any share transactions. |
3. TRANSACTIONS WITH AFFILIATES
Franklin Resources, Inc. is the holding company for various subsidiaries that together are referred to as Franklin Templeton Investments. Certain officers and trustees of the Fund are also officers and/or directors of the following subsidiaries:
| | |
| Subsidiary | | Affiliation |
Franklin Advisers, Inc. (Advisers) | | Investment manager |
Franklin Templeton Services, LLC (FT Services) | | Administrative manager |
Franklin Templeton Distributors, Inc. (Distributors) | | Principal underwriter |
Franklin Templeton Investor Services, LLC (Investor Services) | | Transfer agent |
a. Management Fees
The Fund pays an investment management fee to Advisers based on the average daily net assets of the Fund as follows:
| | |
| Annualized Fee Rate | | Net Assets |
| 0.625% | | Up to and including $100 million |
| 0.500% | | Over $100 million, up to and including $250 million |
| 0.450% | | Over $250 million, up to and including $7.5 billion |
| 0.440% | | Over $7.5 billion, up to and including $10 billion |
| 0.430% | | Over $10 billion, up to and including $12.5 billion |
| 0.420% | | Over $12.5 billion, up to and including $15 billion |
| 0.400% | | In excess of $15 billion |
FUS-19
Franklin Templeton Variable Insurance Products Trust
Notes to Financial Statements (continued)
Franklin U.S. Government Fund
3. TRANSACTIONS WITH AFFILIATES (continued)
b. Administrative Fees
Under an agreement with Advisers, FT Services provides administrative services to the Fund. The fee is paid by Advisers based on average daily net assets, and is not an additional expense of the Fund.
c. Distribution Fees
The Trust’s Board of Trustees has adopted distribution plans for Class 2 and Class 4 shares pursuant to Rule 12b-1 under the 1940 Act. Under the Fund’s compensation distribution plans, the Fund pays Distributors for costs incurred in connection with the servicing, sale and distribution of the Fund’s shares up to 0.35% per year of its average daily net assets of each class. The Board of Trustees has agreed to limit the current rate to 0.25% per year for Class 2.
d. Transfer Agent Fees
Investor Services, under terms of an agreement, performs shareholder servicing for the Fund and is not paid by the Fund for the services.
e. Other Affiliated Transactions
At December 31, 2010, Advisers owned 100% of the Fund’s Class 4 outstanding shares.
4. EXPENSE OFFSET ARRANGEMENT
The Fund has entered into an arrangement with its custodian whereby credits realized as a result of uninvested cash balances are used to reduce a portion of the Fund’s custodian expenses. During the year ended December 31, 2010, there were no credits earned.
5. INCOME TAXES
For tax purposes, capital losses may be carried over to offset future capital gains, if any. At December 31, 2010, the capital loss carryforwards were as follows:
| | | | |
Capital loss carryforwards expiring in: | | | | |
2011 | | $ | 4,558,723 | |
2012 | | | 3,331,578 | |
2013 | | | 2,102,640 | |
2014 | | | 1,618,397 | |
2015 | | | 2,329,071 | |
2016 | | | 841,479 | |
2017 | | | 401,851 | |
2018 | | | 426,637 | |
| | | | |
| | $ | 15,610,376 | |
| | | | |
For tax purposes, realized capital losses occurring subsequent to October 31 may be deferred and treated as occurring on the first day of the following fiscal year. At December 31, 2010, the Fund deferred realized capital losses of $1,394,022.
The tax character of distributions paid during the years ended December 31, 2010 and 2009, was as follows:
| | | | | | | | |
| | | 2010 | | | 2009 | |
Distributions paid from ordinary income | | $ | 26,791,402 | | | $ | 25,694,274 | |
| | | | |
FUS-20
Franklin Templeton Variable Insurance Products Trust
Notes to Financial Statements (continued)
Franklin U.S. Government Fund
5. INCOME TAXES (continued)
At December 31, 2010, the cost of investments, net unrealized appreciation (depreciation), and undistributed ordinary income for income tax purposes were as follows:
| | | | |
Cost of investments | | $ | 823,817,159 | |
| | | | |
Unrealized appreciation | | $ | 36,670,317 | |
Unrealized depreciation | | | (2,482,384 | ) |
| | | | |
Net unrealized appreciation (depreciation) | | $ | 34,187,933 | |
| | | | |
Distributable earnings – undistributed ordinary income | | $ | 29,149,177 | |
| | | | |
Net investment income differs for financial statement and tax purposes primarily due to differing treatments of paydown losses and bond discounts and premiums.
Net realized gains (losses) differ for financial statement and tax purposes primarily due to differing treatments of wash sales, paydown losses, and bond discounts and premiums.
6. INVESTMENT TRANSACTIONS
Purchases and sales of investments (excluding short term securities) for the year ended December 31, 2010, aggregated $524,867,688 and $398,668,317, respectively.
7. CREDIT FACILITY
The Fund, together with other U.S. registered and foreign investment funds (collectively “Borrowers”), managed by Franklin Templeton Investments, are borrowers in a joint syndicated senior unsecured credit facility totaling $750 million (Global Credit Facility) which matures on January 21, 2011. This Global Credit Facility provides a source of funds to the Borrowers for temporary and emergency purposes, including the ability to meet future unanticipated or unusually large redemption requests.
Under the terms of the Global Credit Facility, the Fund shall, in addition to interest charged on any borrowings made by the Fund and other costs incurred by the Fund, pay its share of fees and expenses incurred in connection with the implementation and maintenance of the Global Credit Facility, based upon its relative share of the aggregate net assets of all of the Borrowers, including an annual commitment fee of 0.10% based upon the unused portion of the Global Credit Facility, which is reflected in other expenses on the Statement of Operations. During the year ended December 31, 2010, the Fund did not use the Global Credit Facility.
Effective January 21, 2011, the Borrowers renewed the Global Credit Facility for a total of $750 million, maturing January 20, 2012.
8. FAIR VALUE MEASUREMENTS
The Fund follows a fair value hierarchy that distinguishes between market data obtained from independent sources (observable inputs) and the Fund’s own market assumptions (unobservable inputs). These inputs are used in determining the value of the Fund’s investments and are summarized in the following fair value hierarchy:
| | • | | Level 1 – quoted prices in active markets for identical securities |
| | • | | Level 2 – other significant observable inputs (including quoted prices for similar securities, interest rates, prepayment speed, credit risk, etc.) |
| | • | | Level 3 – significant unobservable inputs (including the Fund’s own assumptions in determining the fair value of investments) |
FUS-21
Franklin Templeton Variable Insurance Products Trust
Notes to Financial Statements (continued)
Franklin U.S. Government Fund
8. FAIR VALUE MEASUREMENTS (continued)
The inputs or methodology used for valuing securities are not an indication of the risk associated with investing in those securities.
For movements between the levels within the fair value hierarchy, the Fund has adopted a policy of recognizing the transfers as of the date of the underlying event which caused the movement.
At December 31, 2010, all of the Fund’s investments in securities carried at fair value were in Level 2 inputs. For detailed industry descriptions, see the accompanying Statement of Investments.
9. SUBSEQUENT EVENTS
The Fund has evaluated subsequent events through the issuance of the financial statements and determined that no events have occurred that require disclosure other than those already disclosed in the financial statements.
|
ABBREVIATIONS |
| Selected Portfolio |
|
| FFCB - Federal Farm Credit Bank |
| FHLB - Federal Home Loan Bank |
| FICO - Financing Corp. |
| FRN - Floating Rate Note |
| GL - Government Loan |
| HUD - Housing and Urban Development |
| PC - Participation Certificate |
| PL - Project Loan |
| SBA - Small Business Administration |
| SF - Single Family |
| TVA - Tennessee Valley Authority |
FUS-22
Franklin Templeton Variable Insurance Products Trust
Franklin U.S. Government Fund
Report of Independent Registered Public Accounting Firm
To the Board of Trustees and Shareholders of
Franklin Templeton Variable Insurance Products Trust
In our opinion, the accompanying statement of assets and liabilities, including the statement of investments, and the related statements of operations and of changes in net assets and the financial highlights present fairly, in all material respects, the financial position of Franklin U.S. Government Fund (the “Fund”) at December 31, 2010, the results of its operations for the year then ended, the changes in its net assets for each of the two years in the period then ended and the financial highlights for each of the periods presented, in conformity with accounting principles generally accepted in the United States of America. These financial statements and financial highlights (hereafter referred to as “financial statements”) are the responsibility of the Fund’s management. Our responsibility is to express an opinion on these financial statements based on our audits. We conducted our audits of these financial statements in accordance with the standards of the Public Company Accounting Oversight Board (United States). Those standards require that we plan and perform the audit to obtain reasonable assurance about whether the financial statements are free of material misstatement. An audit includes examining, on a test basis, evidence supporting the amounts and disclosures in the financial statements, assessing the accounting principles used and significant estimates made by management, and evaluating the overall financial statement presentation. We believe that our audits, which included confirmation of securities at December 31, 2010 by correspondence with the custodian and brokers, provide a reasonable basis for our opinion.
PricewaterhouseCoopers LLP
San Francisco, California
February 10, 2011
FUS-23
MUTUAL GLOBAL DISCOVERY SECURITIES FUND
This annual report for Mutual Global Discovery Securities Fund covers the fiscal year ended December 31, 2010.
Performance Summary as of 12/31/10
Average annual total return of Class 4 shares* represents the average annual change in value, assuming reinvestment of dividends and capital gains. Average returns smooth out variations in returns, which can be significant; they are not the same as year-by-year results.
Periods ended 12/31/10
| | | | | | | | | | | | |
| | | 1-Year | | | 5-Year | | | 10-Year | |
Average Annual Total Return | | | +11.87% | | | | +6.39% | | | | +8.28% | |
*For the period beginning 2/29/08, Class 4 performance reflects a 12b-1 fee expense of 0.35% per year, which affects future performance. Class 4 performance prior to 2/29/08 reflects historical Class 1 performance, which does not have a 12b-1 fee expense. Since 2/29/08 (effective date), the average annual total return of Class 4 shares was +1.89%.
Total Return Index Comparison for a Hypothetical $10,000 Investment (1/1/01–12/31/10)
The graph below shows the change in value of a hypothetical $10,000 investment in the Fund over the indicated period and includes reinvestment of any income or distributions. The Fund’s performance* is compared to the performance of the Standard & Poor’s 500 Index (S&P 500) and the Morgan Stanley Capital International (MSCI) World Index. One cannot invest directly in an index, and an index is not representative of the Fund’s portfolio. Please see Important Notes to Performance Information preceding the Fund Summaries.
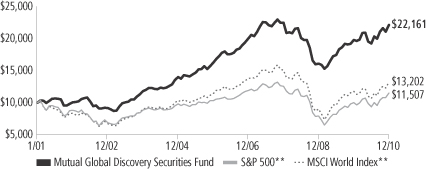
**Source: © 2011 Morningstar. Please see Index Descriptions following the Fund Summaries.
Mutual Global Discovery Securities Fund – Class 4
Performance reflects the Fund’s Class 4 operating expenses, but does not include any contract fees, expenses or sales charges. If they had been included, performance would be lower. These charges and deductions, particularly for variable life policies, can have a significant effect on contract values and insurance benefits. See the contract prospectus for a complete description of these expenses, including sales charges.
Performance data represent past performance, which does not guarantee future results. Investment return and principal value will fluctuate, and you may have a gain or loss when you sell your shares.
Current performance may differ from figures shown.
MGD-1
Fund Goal and Main Investments: Mutual Global Discovery Securities Fund seeks capital appreciation. The Fund normally invests primarily in U.S. and foreign equity securities that the manager believes are undervalued. The Fund also invests, to a lesser extent, in risk arbitrage securities and distressed companies.
Performance Overview
You can find the Fund’s one-year total return in the Performance Summary. The Fund performed comparably to the MSCI World Index, which generated a +12.34% total return, but underperformed the S&P 500, which posted a +15.06% total return for the same period.1
Economic and Market Overview
During the year under review, equities advanced against a backdrop of heightened volatility and uneven global economic recovery. Emerging market regions primarily led growth, as they were generally unconstrained by the debt overhang burdening western economies and benefited from strong intrinsic demand and significant capital inflows. Policymakers in these regions began raising interest rates toward period-end to combat inflation and speculative investment. Developed economies grew at a more subdued pace, with demand recovery and asset price reflation heavily underpinned by government-sponsored, liquidity-enhancing measures. The U.S. Federal Reserve Board (Fed), having already brought official interest rates close to zero, began directly purchasing government securities as part of an extreme policy measure known as quantitative easing. Further promoting the U.S. recovery, the traditionally pro-business Republican Party gained control of the House of Representatives in mid-term elections and President Obama extended Bush-era tax cuts. In Europe, ballooning fiscal deficits took their toll on peripheral nations and growing concerns of potential sovereign defaults significantly roiled equity markets on several occasions during the period. The European Central Bank responded by pledging 750 billion euros in the spring with the intent to forestall defaults, stabilize markets and restore confidence in the euro currency, followed by further backstops in the autumn as Ireland and the rest of the periphery came under renewed duress.
The combination of intrinsic growth drivers in emerging markets and stimulus-induced support in the developed world encouraged the
1. Source: © 2011 Morningstar. One cannot invest directly in an index, and an index is not representative of the Fund’s portfolio. Please see Index Descriptions following the Fund Summaries.
Fund Risks: The Fund’s investments in stocks may offer the potential for long-term gains but can be subject to short-term price fluctuations. Investments in companies involved in mergers, liquidations, reorganizations and distressed bankruptcy, which may include defaulted debt, involve higher credit and other risks. Foreign investing, especially in emerging markets, involves additional risks, including currency fluctuations, economic instability, market volatility, and political and social instability. Smaller and midsize company securities involve special risks, such as relatively small revenues, limited product lines and small market share. The Fund’s investment in certain hedging and derivative instruments may involve a small investment relative to the risk assumed. The manager applies various techniques and analyses in making investment decisions for the Fund, but there can be no guarantee that these decisions will produce the desired results. The Fund’s prospectus also includes a description of the main investment risks.
MGD-2
global economic recovery, and equity markets responded favorably. By the end of 2010, global equity markets recouped all losses suffered since Lehman Brothers Holdings’ 2008 bankruptcy. Commodities surged in the second half of 2010 due to near-term supply constraints and emerging market demand increases, as well as longer term fears that overly accommodative monetary policies would ultimately have negative inflationary consequences. The dollar strengthened relative to the euro, which bore the burden of the region’s fiscal crisis, but weakened against the yen, which hit multi-decade highs amid persistent deflationary pressures. Meanwhile, U.S. Treasuries and corporate bonds finished the year with gains, though Treasury prices declined considerably in the final quarter as Fed policies appeared to improve growth expectations. Although market conditions remained accommodative and corporate profitability improved, critical economic fundamentals such as employment, home prices and credit creation remained substantially depressed at period-end, leading many investors to question the true health of the global economy and the sustainability of the recovery.
Investment Strategy
At Mutual Series, we are committed to our distinctive value approach to investing. Our major investment strategy is investing in undervalued stocks. When selecting undervalued equities, we are attracted to fundamentally strong companies with healthy balance sheets, high-quality assets, substantial free cash flow and shareholder-oriented management teams and whose stocks are trading at discounts to our assessment of the companies’ intrinsic or business value. We also look for asset rich companies whose shares may be trading at depressed levels due to concerns over short-term earnings disappointments, litigation, management strategy or other perceived negatives. While the vast majority of our undervalued equity investments are made in publicly traded companies globally, we may invest occasionally in privately held companies as well.
We complement this more traditional investment strategy with two others. One is distressed investing, which is complex and can take many forms. The most common distressed investment the Fund undertakes is the purchase of financially troubled or bankrupt companies’ debt at a substantial discount to face value. After the financially distressed company is reorganized, often in bankruptcy court, the old debt is typically replaced with new securities issued by the financially stronger company.
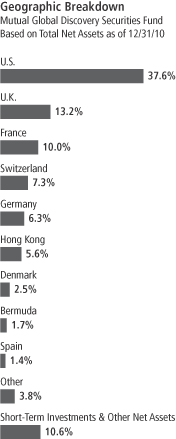
MGD-3
The other piece of our investment strategy is participating in arbitrage situations, another highly specialized field. When companies announce proposed mergers or takeovers, commonly referred to as “deals,” the target company may trade at a discount to the bid it ultimately accepts. One form of arbitrage involves purchasing the target company’s stock when it is trading below the value we believe it would receive in a deal. In keeping with our commitment to a relatively conservative investment approach, we typically focus our arbitrage efforts on announced deals, and eschew rumored deals or other situations we consider relatively risky.
In addition, it is our practice to hedge the Fund’s currency exposure when we deem it advantageous for our shareholders.
Manager’s Discussion
Against the backdrop of a global stock market advance, several Fund holdings increased in value and added to the Fund’s return. Three particularly strong Fund performers were Denmark-based brewer Carlsberg, German automaker Volkswagen and U.K.-based British American Tobacco (BAT).
Shares of Danish beer brewer Carlsberg performed well as the outlook for its largest market, Russia, improved beginning around the middle of the year. Earlier in 2010, weak consumer demand along with regulatory and taxation challenges weighed on the company’s operations in the Russian market. However, data released in 2010’s second quarter suggested business was beginning to improve, and by the third quarter it appeared to us that the negative impacts on Carlsberg would be less than we had than initially anticipated. In addition, proposals on future regulatory changes with regard to beer sales turned out to be less severe than first expected. As a result, investor confidence in Carlsberg’s ability to achieve its longer-term margin targets in western Europe rose and the share price climbed.
We bought Volkswagen’s stock in 2010 when it offered what we believed was an attractive combination of historically below-average valuation, a solid balance sheet combined with conservative accounting policies that understated the group’s industrial cash flows and earnings, and a strong global presence. The company is Europe’s largest automotive group and has market share not only in Europe but also in North America, South America and China. During the year, Volkswagen announced its intention to merge its operations with those of Porsche. We feel this is a synergistic move that, if finalized, may enhance the company’s sales and profit development.
Top 10 Sectors/Industries
Mutual Global Discovery Securities Fund Based on Equity Securities
12/31/10
| | | | |
| | | % of Total
Net Assets | |
| Tobacco | | | 9.9% | |
| Commercial Banks | | | 5.7% | |
| Food Products | | | 4.3% | |
| Food & Staples Retailing | | | 3.5% | |
| Beverages | | | 3.5% | |
| Software | | | 3.4% | |
| Media | | | 3.3% | |
| Insurance | | | 3.3% | |
| Oil, Gas & Consumable Fuels | | | 3.2% | |
| Industrial Conglomerates | | | 3.2% | |
MGD-4
BAT’s unit volume trends improved as the year unfolded. At year-end, Russia, an important market for BAT sales, appeared poised to reach a bottom, in our view. In addition, a multi-year productivity program and positive pricing contributed to the company’s ability to expand profit margins and deliver earnings growth that exceeded analyst expectations. The company believes further productivity gains and margin expansion remain to be captured in 2011 and beyond as it implements SAP business technology solutions, rationalizes duplicative functions and adopts “best practices” across its business segments. We believe BAT can benefit from an attractive geographic mix as the company has the largest exposure to emerging markets, and their associated growth opportunities, among its major industry peers. Like many other consumer staples companies, BAT typically generates significant free cash flow, and the company historically has used this cash flow to enhance shareholder value by making accretive acquisitions, paying generous dividends and buying back stock.
In contrast, several Fund investments decreased in value. Three holdings among the largest detractors from Fund performance were German utility conglomerate E.ON, one of the world’s largest investor-owned power and gas companies; Bank of America; and Intesa Sanpaolo (Intesa), an Italian financial services conglomerate.
Shares of E.ON fell in value early in 2010, as power fundamentals remained weak in many of the geographic regions the company serves. In addition, operating profit in its natural gas division was hurt by lower natural gas prices, which were soft throughout the better portion of the year, especially in relation to oil prices. Such prices are used in the pricing of the majority of the company’s long-term natural gas supply contracts. At year-end, we continued to view the stock positively because we believe it has a significant and diversified asset base and an attractive dividend policy. In addition, the recently appointed, new CEO appeared to be focused on improving E.ON’s operational efficiencies, which may benefit the company’s future stock price.
Bank of America detracted from the Fund’s performance largely due to concerns about potential mortgage losses, particularly those stemming from the Countrywide Home Loans business it acquired in 2008. In addition, new U.S. financial regulations that may pressure consumer-related fees also weighed on the stock. In our view, Bank of America has leading positions across all its businesses, its capital position is solid, credit costs continued to decline, and the mortgage loss issue appeared manageable.
Top 10 Holdings
Mutual Global Discovery
Securities Fund
12/31/10
| | | | |
Company
Sector/Industry,
Country | | % of Total
Net Assets | |
| British American Tobacco PLC | | | 2.8% | |
| Tobacco, U.K. | | | | |
| Nestle SA | | | 2.5% | |
| Food Products, Switzerland | | | | |
| Imperial Tobacco Group PLC | | | 2.2% | |
| Tobacco, U.K. | | | | |
| Vodafone Group PLC | | | 2.1% | |
| Wireless Telecommunication Services, U.K. | | | | |
| Jardine Strategic Holdings Ltd. | | | 2.0% | |
| Industrial Conglomerates, Hong Kong | | | | |
| Schindler Holding AG | | | 2.0% | |
| Machinery, Switzerland | | | | |
| Royal Dutch Shell PLC | | | 1.8% | |
| Oil, Gas & Consumable Fuels, U.K. | | | | |
| CVS Caremark Corp. | | | 1.8% | |
| Food & Staples Retailing, U.S. | | | | |
| Pernod Ricard SA | | | 1.7% | |
| Beverages, France | | | | |
| Lorillard Inc. | | | 1.7% | |
| Tobacco, U.S. | | | | |
The dollar value, number of shares or principal amount, and names of all portfolio holdings are listed in the Fund’s Statement of Investments.
MGD-5
Leading Italian bank Intesa lost value in 2010 largely due to Italy’s sovereign debt concerns. In addition, company earnings during the year were pressured by the low interest rate environment as well as market concerns that it might need to raise additional capital to comply with new Basel rules (a set of international bank supervision accords that offer recommendations on banking laws and regulations). In our view, Intesa is fundamentally a traditional retail and commercial bank with limited exposure to investment banking and virtually no exposure to peripheral sovereign debt outside Italy. It has a very strong balance sheet, in terms of leverage and liquidity, and we believe the company’s capital position is adequate given its business mix. From our perspective, the stock remains attractive on both book and earnings metrics.
Finally, investors should note that we maintained our currency hedging posture of being more hedged than not to the U.S. dollar, largely through the use of forward currency exchange contracts. Certain currencies weakened in relation to the U.S. dollar in 2010, and our hedging strategy aided Fund performance during the year.
Thank you for your participation in Mutual Global Discovery Securities Fund. We look forward to serving your future investment needs.
The foregoing information reflects our analysis, opinions and portfolio holdings as of December 31, 2010, the end of the reporting period. The way we implement our main investment strategies and the resulting portfolio holdings may change depending on factors such as market and economic conditions. These opinions may not be relied upon as investment advice or an offer for a particular security. The information is not a complete analysis of every aspect of any market, country, industry, security or the Fund. Statements of fact are from sources considered reliable, but the investment manager makes no representation or warranty as to their completeness or accuracy. Although historical performance is no guarantee of future results, these insights may help you understand our investment management philosophy.
MGD-6
Fund Expenses
As an investor in a variable insurance contract (Contract) that indirectly provides for investment in an underlying mutual fund, you can incur transaction and/or ongoing expenses at both the Fund level and the Contract level.
| • | | Transaction expenses can include sales charges (loads) on purchases, redemption fees, surrender fees, transfer fees and premium taxes. |
| • | | Ongoing expenses can include management fees, distribution and service (12b-1) fees, contract fees, annual maintenance fees, mortality and expense risk fees and other fees and expenses. All mutual funds and Contracts have some types of ongoing expenses. |
The expenses shown in the table are meant to highlight ongoing expenses at the Fund level only and do not include ongoing expenses at the Contract level, or transaction expenses at either the Fund or Contract level. While the Fund does not have transaction expenses, if the transaction and ongoing expenses at the Contract level were included, the expenses shown below would be higher. You should consult your Contract prospectus or disclosure document for more information.
The table shows Fund-level ongoing expenses and can help you understand these expenses and compare them with those of other mutual funds offered through the Contract. The table assumes a $1,000 investment held for the six months indicated. Please refer to the Fund prospectus for additional information on operating expenses.
Actual Fund Expenses
The first line (Actual) of the table provides actual account values and expenses. The “Ending Account Value” is derived from the Fund’s actual return, which includes the effect of ongoing Fund expenses, but does not include the effect of ongoing Contract expenses.
You can estimate the Fund-level expenses you incurred during the period by following these steps. Of course, your account value and expenses will differ from those in this illustration:
| 1. | Divide your account value by $1,000. |
If an account had an $8,600 value, then $8,600 ÷ $1,000 = 8.6.
| 2. | Multiply the result by the number under the heading “Fund-Level Expenses Incurred During Period.” |
If Fund-Level Expenses Incurred During Period were $7.50, then 8.6 x $7.50 = $64.50.
In this illustration, the estimated expenses incurred this period at the Fund level are $64.50.
Mutual Global Discovery Securities Fund – Class 4
MGD-7
Hypothetical Example for Comparison with Other Mutual Funds
Information in the second line (Hypothetical) of the table can help you compare ongoing expenses of the Fund with those of other mutual funds offered through the Contract. This information may not be used to estimate the actual ending account balance or expenses you incurred during the period. The hypothetical “Ending Account Value” is based on the Fund’s actual expense ratio and an assumed 5% annual rate of return before expenses, which does not represent the Fund’s actual return. The figure under the heading “Fund-Level Expenses Incurred During Period” shows the hypothetical expenses your account would have incurred under this scenario. You can compare this figure with the 5% hypothetical examples that appear in shareholder reports of other funds offered through a Contract.
| | | | | | | | | | | | |
| Class 4 | | Beginning
Account Value 7/1/10 | | | Ending
Account Value 12/31/10 | | | Fund-Level Expenses Incurred
During Period* 7/1/10–12/31/10 | |
Actual | | $ | 1,000 | | | $ | 1,151.40 | | | $ | 7.21 | |
Hypothetical (5% return before expenses) | | $ | 1,000 | | | $ | 1,018.50 | | | $ | 6.77 | |
*Expenses are calculated using the most recent six-month annualized expense ratio for the Fund’s Class 4 shares (1.33%), which does not include any ongoing expenses of the Contract for which the Fund is an investment option, multiplied by the average account value over the period, multiplied by 184/365 to reflect the one-half year period.
MGD-8
SUPPLEMENT DATED DECEMBER 31, 2010
TOTHE PROSPECTUS
DATED MAY 1, 2010
MUTUAL GLOBAL DISCOVERY SECURITIES FUND
(A series of Franklin Templeton Variable Insurance Products Trust)
The prospectus is amended as follows.
1. The portfolio management team under “Fund Summaries – Portfolio Managers” section on Page MGD-S4 is revised as follows:
Portfolio Managers
PETER A. LANGERMAN Chairman, President and Chief Executive Officer of Franklin Mutual and portfolio manager of the Fund since 2005.
PHILIPPE BRUGERE-TRELAT Executive Vice President of Franklin Mutual and portfolio manager of the Fund since 2009.
TIMOTHY RANKIN, CFA Portfolio Manager of Franklin Mutual and portfolio manager of the Fund since December 2010.
2. The portfolio management team under “Fund Details – Management” section on page MGD-D6 is revised as follows:
The Fund is managed by a team of dedicated professionals focused on investments in equity securities they consider to be undervalued. The portfolio managers of the team are as follows:
PETER LANGERMAN
Chairman, President and Chief Executive Officer of Franklin Mutual
Mr. Langerman has been a co-lead portfolio manager since 2009. He joined Franklin Templeton Investments in 1996, serving in various capacities, including President and Chief Executive Officer of Franklin Mutual and member of the management team of the Fund, before leaving in 2002 and serving as director of New Jersey’s Division of Investment, overseeing employee pension funds. Between 1986 and 1996, he was employed at Heine Securities Corporation, the predecessor of Franklin Mutual.
PHILIPPE BRUGERE-TRELAT
Executive Vice President of Franklin Mutual
Mr. Brugere-Trelat has been a co-lead portfolio manager of the Fund since 2009. He joined Franklin Templeton Investments in 2004. Previously, he was president and portfolio manager of Eurovest.
MGD-9
TIMOTHY RANKIN, CFA
Portfolio Manager of Franklin Mutual
Mr. Rankin has been a portfolio manager of the Fund since December 2010. Prior to rejoining Franklin Templeton Investments in June 2010, he was managing director of Blue Harbor Group, LLC, a private investment firm focused on small- and mid-cap North American companies. Previously, he worked at Franklin Templeton investments from 1997 through 2004.
As co-lead portfolio managers of the Fund, Mr. Langerman and Mr. Brugere-Trelat have equal authority over all aspects of the Fund’s investment portfolio, including but not limited to, purchases and sales of individual securities, portfolio risk assessment, and the management of daily cash balances in accordance with anticipated investment management requirements. The degree to which either may perform these functions, and the nature of these functions, may change from time to time. Mr. Rankin provides the Fund with research and advice on the purchases and sales of individual securities, and portfolio risk assessment.
CFA® and Chartered Financial Analyst® are trademarks owned by CFA Institute
Please retain this supplement for future reference.
MGD-10
Franklin Templeton Variable Insurance Products Trust
Financial Highlights
Mutual Global Discovery Securities Fund
| | | | | | | | | | | | | | | | | | | | |
| | | Year Ended December 31, | |
| Class 1 | | 2010 | | | 2009 | | | 2008 | | | 2007 | | | 2006 | |
| | | | |
Per share operating performance | | | | | | | | | | | | | | | | | | | | |
(for a share outstanding throughout the year) | | | | | | | | | | | | | | | | | | | | |
Net asset value, beginning of year | | $ | 19.14 | | | $ | 16.12 | | | $ | 24.08 | | | $ | 22.05 | | | $ | 18.85 | |
| | | | |
Income from investment operationsa: | | | | | | | | | | | | | | | | | | | | |
Net investment incomeb | | | 0.38 | | | | 0.19 | c | | | 0.37 | | | | 0.47 | | | | 0.52 | |
Net realized and unrealized gains (losses) | | | 1.94 | | | | 3.57 | | | | (6.95 | ) | | | 2.22 | | | | 3.69 | |
| | | | |
Total from investment operations | | | 2.32 | | | | 3.76 | | | | (6.58 | ) | | | 2.69 | | | | 4.21 | |
| | | | |
Less distributions from: | | | | | | | | | | | | | | | | | | | | |
Net investment income | | | (0.30 | ) | | | (0.26 | ) | | | (0.52 | ) | | | (0.38 | ) | | | (0.25 | ) |
Net realized gains | | | — | | | | (0.48 | ) | | | (0.86 | ) | | | (0.28 | ) | | | (0.76 | ) |
| | | | |
Total distributions | | | (0.30 | ) | | | (0.74 | ) | | | (1.38 | ) | | | (0.66 | ) | | | (1.01 | ) |
| | | | |
Net asset value, end of year | | $ | 21.16 | | | $ | 19.14 | | | $ | 16.12 | | | $ | 24.08 | | | $ | 22.05 | |
| | | | |
| | | | | |
Total returnd | | | 12.24% | | | | 23.63% | | | | (28.29)% | | | | 12.17% | | | | 23.32% | |
Ratios to average net assets | | | | | | | | | | | | | | | | | | | | |
Expensese,f | | | 1.00% | | | | 1.06% | | | | 0.98% | | | | 0.97% | | | | 1.03% | |
Expenses incurred in connection with securities sold short | | | 0.02% | | | | 0.09% | | | | 0.01% | | | | —% | g | | | 0.03% | |
Net investment income | | | 1.93% | | | | 1.07% | c | | | 1.82% | | | | 1.96% | | | | 2.44% | |
| | | | | |
Supplemental data | | | | | | | | | | | | | | | | | | | | |
Net assets, end of year (000’s) | | $ | 84,213 | | | $ | 86,755 | | | $ | 81,320 | | | $ | 142,751 | | | $ | 146,229 | |
Portfolio turnover rate | | | 49.31% | | | | 43.35% | | | | 22.76% | | | | 28.20% | | | | 19.83% | |
aThe amount shown for a share outstanding throughout the period may not correlate with the Statement of Operations for the period due to the timing of sales and repurchases of the Fund shares in relation to income earned and/or fluctuating market value of the investments of the Fund.
bBased on average daily shares outstanding.
cNet investment income per share includes approximately $(0.03) per share related to an adjustment for uncollectible interest. Excluding the effect of this
adjustment, the ratio of net investment income to average net assets would have been 1.26%.
dTotal return does not include fees, charges or expenses imposed by the variable annuity and life insurance contracts for which the Franklin Templeton Variable Insurance Products Trust serves as an underlying investment vehicle.
eBenefit of expense reduction rounds to less than 0.01%.
f Includes dividend expense on securities sold short and stock loan fees, if any. See below for the ratios of such expenses to average net assets for the periods presented. See Note 1(d).
g Rounds to less than 0.01%.
The accompanying notes are an integral part of these financial statements.
MGD-11
Franklin Templeton Variable Insurance Products Trust
Financial Highlights (continued)
Mutual Global Discovery Securities Fund
| | | | | | | | | | | | | | | | | | | | |
| | | Year Ended December 31, | |
| Class 2 | | 2010 | | | 2009 | | | 2008 | | | 2007 | | | 2006 | |
| | | | |
Per share operating performance | | | | | | | | | | | | | | | | | | | | |
(for a share outstanding throughout the year) | | | | | | | | | | | | | | | | | | | | |
Net asset value, beginning of year | | $ | 18.81 | | | $ | 15.85 | | | $ | 23.69 | | | $ | 21.73 | | | $ | 18.60 | |
| | | | |
Income from investment operationsa: | | | | | | | | | | | | | | | | | | | | |
Net investment incomeb | | | 0.33 | | | | 0.14 | c | | | 0.32 | | | | 0.40 | | | | 0.43 | |
Net realized and unrealized gains (losses) | | | 1.91 | | | | 3.50 | | | | (6.84 | ) | | | 2.18 | | | | 3.68 | |
| | | | |
Total from investment operations | | | 2.24 | | | | 3.64 | | | | (6.52 | ) | | | 2.58 | | | | 4.11 | |
| | | | |
Less distributions from: | | | | | | | | | | | | | | | | | | | | |
Net investment income | | | (0.25 | ) | | | (0.20 | ) | | | (0.46 | ) | | | (0.34 | ) | | | (0.22 | ) |
Net realized gains | | | — | | | | (0.48 | ) | | | (0.86 | ) | | | (0.28 | ) | | | (0.76 | ) |
| | | | |
Total distributions | | | (0.25 | ) | | | (0.68 | ) | | | (1.32 | ) | | | (0.62 | ) | | | (0.98 | ) |
| | | | |
Net asset value, end of year | | $ | 20.80 | | | $ | 18.81 | | | $ | 15.85 | | | $ | 23.69 | | | $ | 21.73 | |
| | | | |
| | | | | |
Total returnd | | | 11.96% | | | | 23.31% | | | | (28.45)% | | | | 11.85% | | | | 23.06% | |
Ratios to average net assets | | | | | | | | | | | | | | | | | | | | |
Expensese,f | | | 1.25% | | | | 1.31% | | | | 1.23% | | | | 1.22% | | | | 1.28% | |
Expenses incurred in connection with securities sold short | | | 0.02% | | | | 0.09% | | | | 0.01% | | | | —% | g | | | 0.03% | |
Net investment income | | | 1.68% | | | | 0.82% | c | | | 1.57% | | | | 1.71% | | | | 2.19% | |
| | | | | |
Supplemental data | | | | | | | | | | | | | | | | | | | | |
Net assets, end of year (000’s) | | $ | 1,351,223 | | | $ | 1,309,852 | | | $ | 1,113,720 | | | $ | 1,867,484 | | | $ | 1,365,575 | |
Portfolio turnover rate | | | 49.31% | | | | 43.35% | | | | 22.76% | | | | 28.20% | | | | 19.83% | |
aThe amount shown for a share outstanding throughout the period may not correlate with the Statement of Operations for the period due to the timing of sales and repurchases of the Fund shares in relation to income earned and/or fluctuating market value of the investments of the Fund.
bBased on average daily shares outstanding.
cNet investment income per share includes approximately $(0.03) per share related to an adjustment for uncollectible interest. Excluding the effect of this
adjustment, the ratio of net investment income to average net assets would have been 1.01%.
dTotal return does not include fees, charges or expenses imposed by the variable annuity and life insurance contracts for which the Franklin Templeton Variable Insurance Products Trust serves as an underlying investment vehicle.
eBenefit of expense reduction rounds to less than 0.01%.
fIncludes dividend expense on securities sold short and stock loan fees, if any. See below for the ratios of such expenses to average net assets for the periods presented. See Note 1(d).
gRounds to less than 0.01%.
The accompanying notes are an integral part of these financial statements.
MGD-12
Franklin Templeton Variable Insurance Products Trust
Financial Highlights (continued)
Mutual Global Discovery Securities Fund
| | | | | | | | | | | | |
| | | Year Ended December 31, | |
| Class 4 | | 2010 | | | 2009 | | | 2008a | |
| | | | |
Per share operating performance | | | | | | | | | | | | |
(for a share outstanding throughout the year) | | | | | | | | | | | | |
Net asset value, beginning of year | | $ | 19.02 | | | $ | 16.07 | | | $ | 22.50 | |
| | | | |
Income from investment operationsb: | | | | | | | | | | | | |
Net investment incomec | | | 0.31 | | | | 0.11 | d | | | 0.09 | |
Net realized and unrealized gains (losses) | | | 1.94 | | | | 3.56 | | | | (5.14 | ) |
| | | | |
Total from investment operations | | | 2.25 | | | | 3.67 | | | | (5.05 | ) |
| | | | |
Less distributions from: | | | | | | | | | | | | |
Net investment income | | | (0.25 | ) | | | (0.24 | ) | | | (0.52 | ) |
Net realized gains | | | — | | | | (0.48 | ) | | | (0.86 | ) |
| | | | |
Total distributions | | | (0.25 | ) | | | (0.72 | ) | | | (1.38 | ) |
| | | | |
Net asset value, end of year | | $ | 21.02 | | | $ | 19.02 | | | $ | 16.07 | |
| | | | |
| | | |
Total returne | | | 11.87% | | | | 23.19% | | | | (23.48)% | |
Ratios to average net assetsf | | | | | | | | | | | | |
Expensesg,h | | | 1.35% | | | | 1.41% | | | | 1.33% | |
Expenses incurred in connection with securities sold short | | | 0.02% | | | | 0.09% | | | | 0.01% | |
Net investment income | | | 1.58% | | | | 0.72% | d | | | 1.47% | |
| | | |
Supplemental data | | | | | | | | | | | | |
Net assets, end of year (000’s) | | $ | 70,613 | | | $ | 59,178 | | | $ | 23,981 | |
Portfolio turnover rate | | | 49.31% | | | | 43.35% | | | | 22.76% | |
aFor the period February 29, 2008 (effective date) to December 31, 2008.
bThe amount shown for a share outstanding throughout the period may not correlate with the Statement of Operations for the period due to the timing of sales and repurchases of the Fund shares in relation to income earned and/or fluctuating market value of the investments of the Fund.
cBased on average daily shares outstanding.
dNet investment income per share includes approximately $(0.03) per share related to an adjustment for uncollectible interest. Excluding the effect of this adjustment, the ratio of net investment income to average net assets would have been 0.91%.
eTotal return does not include fees, charges or expenses imposed by the variable annuity and life insurance contracts for which the Franklin Templeton Variable Insurance Products Trust serves as an underlying investment vehicle. Total return is not annualized for periods less than one year.
fRatios are annualized for periods less than one year.
gBenefit of expense reduction rounds to less than 0.01%.
hIncludes dividend expense on securities sold short and stock loan fees, if any. See below for the ratios of such expenses to average net assets for the periods presented. See Note 1(d).
The accompanying notes are an integral part of these financial statements.
MGD-13
Franklin Templeton Variable Insurance Products Trust
Statement of Investments, December 31, 2010
| | | | | | | | | | | | |
| Mutual Global Discovery Securities Fund | | Country | | | Shares | | | Value | |
Common Stocks and Other Equity Interests 84.8% | | | | | | | | | | | | |
Airlines 0.0% | | | | | | | | | | | | |
a,b,cNorthwest Airlines Corp., Contingent Distribution | | | United States | | | | 8,167,000 | | | $ | — | |
| | | | | | | | | | | | |
Auto Components 0.3% | | | | | | | | | | | | |
a,b,cCollins & Aikman Products Co., Contingent Distribution | | | United States | | | | 218,708 | | | | 2,187 | |
a,b,cDana Holding Corp., Contingent Distribution | | | United States | | | | 2,673,000 | | | | — | |
a,dIACNA Investor LLC | | | United States | | | | 47,271 | | | | 473 | |
a,d,eInternational Automotive Components Group Brazil LLC | | | Brazil | | | | 424,073 | | | | 750,244 | |
a,d,eInternational Automotive Components Group North America LLC | | | United States | | | | 3,000,220 | | | | 3,802,599 | |
| | | | | | | | | | | | |
| | | | | | | | | | | 4,555,503 | |
| | | | | | | | | | | | |
Automobiles 1.5% | | | | | | | | | | | | |
aDaimler AG (EUR Traded) | | | Germany | | | | 323,994 | | | | 22,069,899 | |
aDaimler AG (USD Traded) | | | Germany | | | | 2,800 | | | | 189,224 | |
| | | | | | | | | | | | |
| | | | | | | | | | | 22,259,123 | |
| | | | | | | | | | | | |
Beverages 3.5% | | | | | | | | | | | | |
Carlsberg AS, B | | | Denmark | | | | 148,272 | | | | 14,861,260 | |
Coca-Cola Enterprises Inc. | | | United Kingdom | | | | 189,800 | | | | 4,750,694 | |
Dr. Pepper Snapple Group Inc. | | | United States | | | | 191,410 | | | | 6,729,976 | |
Pernod Ricard SA | | | France | | | | 275,378 | | | | 25,919,704 | |
| | | | | | | | | | | | |
| | | | | | | | | | | 52,261,634 | |
| | | | | | | | | | | | |
Biotechnology 1.5% | | | | | | | | | | | | |
aAmgen Inc. | | | United States | | | | 135,290 | | | | 7,427,421 | |
aGenzyme Corp. | | | United States | | | | 207,050 | | | | 14,741,960 | |
| | | | | | | | | | | | |
| | | | | | | | | | | 22,169,381 | |
| | | | | | | | | | | | |
Capital Markets 2.7% | | | | | | | | | | | | |
Morgan Stanley | | | United States | | | | 626,650 | | | | 17,051,147 | |
aUBS AG (CHF Traded) | | | Switzerland | | | | 1,445,336 | | | | 23,753,648 | |
| | | | | | | | | | | | |
| | | | | | | | | | | 40,804,795 | |
| | | | | | | | | | | | |
Chemicals 1.5% | | | | | | | | | | | | |
Airgas Inc. | | | United States | | | | 118,431 | | | | 7,397,200 | |
a,b,cDow Corning Corp., Contingent Distribution | | | United States | | | | 300,000 | | | | — | |
Linde AG | | | Germany | | | | 97,340 | | | | 14,786,094 | |
| | | | | | | | | | | | |
| | | | | | | | | | | 22,183,294 | |
| | | | | | | | | | | | |
Commercial Banks 5.7% | | | | | | | | | | | | |
a,d,fThe Bankshares Inc. | | | United States | | | | 800,000 | | | | 2,905,224 | |
Barclays PLC | | | United Kingdom | | | | 3,900,124 | | | | 15,984,713 | |
BNP Paribas | | | France | | | | 262,466 | | | | 16,716,533 | |
a,dElephant Capital Holdings Ltd. | | | Japan | | | | 1,903 | | | | — | |
Intesa Sanpaolo SpA | | | Italy | | | | 3,779,142 | | | | 10,262,761 | |
a,dNCB Warrant Holdings Ltd., A | | | Japan | | | | 9,306 | | | | — | |
PNC Financial Services Group Inc. | | | United States | | | | 242,430 | | | | 14,720,350 | |
Wells Fargo & Co. | | | United States | | | | 802,340 | | | | 24,864,517 | |
| | | | | | | | | | | | |
| | | | | | | | | | | 85,454,098 | |
| | | | | | | | | | | | |
Commercial Services & Supplies 0.4% | | | | | | | | | | | | |
aComdisco Holding Co. Inc. | | | United States | | | | 44 | | | | 385 | |
a,b,cComdisco Holding Co. Inc., Contingent Distribution | | | United States | | | | 1,863,000 | | | | — | |
aEdenred | | | France | | | | 266,512 | | | | 6,315,866 | |
| | | | | | | | | | | | |
| | | | | | | | | | | 6,316,251 | |
| | | | | | | | | | | | |
MGD-14
Franklin Templeton Variable Insurance Products Trust
Statement of Investments, December 31, 2010 (continued)
| | | | | | | | | | | | |
| Mutual Global Discovery Securities Fund | | Country | | | Shares | | | Value | |
Common Stocks and Other Equity Interests (continued) | | | | | | | | | | | | |
Computers & Peripherals 0.8% | | | | | | | | | | | | |
a,b,cDecisionOne Corp., Contingent Distribution | | | United States | | | | 33,639 | | | $ | — | |
Hewlett-Packard Co. | | | United States | | | | 301,620 | | | | 12,698,202 | |
| | | | | | | | | | | | |
| | | | | | | | | | | 12,698,202 | |
| | | | | | | | | | | | |
Construction & Engineering 0.0%† | | | | | | | | | | | | |
Vinci SA | | | France | | | | 8,630 | | | | 469,642 | |
| | | | | | | | | | | | |
Construction Materials 0.5% | | | | | | | | | | | | |
CRH PLC | | | Ireland | | | | 337,406 | | | | 6,996,156 | |
| | | | | | | | | | | | |
Consumer Finance 0.3% | | | | | | | | | | | | |
a,dCerberus CG Investor I LLC | | | United States | | | | 2,431,677 | | | | 1,969,658 | |
a,dCerberus CG Investor II LLC | | | United States | | | | 2,431,640 | | | | 1,969,629 | |
a,dCerberus CG Investor III LLC | | | United States | | | | 1,215,984 | | | | 984,947 | |
| | | | | | | | | | | | |
| | | | | | | | | | | 4,924,234 | |
| | | | | | | | | | | | |
Containers & Packaging 0.6% | | | | | | | | | | | | |
Rexam PLC | | | United Kingdom | | | | 1,624,544 | | | | 8,455,200 | |
| | | | | | | | | | | | |
Diversified Financial Services 2.7% | | | | | | | | | | | | |
Bank of America Corp. | | | United States | | | | 1,311,930 | | | | 17,501,146 | |
Deutsche Boerse AG | | | Germany | | | | 247,739 | | | | 17,167,186 | |
a,b,cMarconi Corp., Contingent Distribution | | | United Kingdom | | | | 1,739,100 | | | | — | |
a,gNorth American Financial Holdings Inc., A, 144A | | | United States | | | | 88,507 | | | | 1,548,873 | |
a,gNorth American Financial Holdings Inc., B, 144A, non-voting | | | United States | | | | 259,909 | | | | 4,548,407 | |
| | | | | | | | | | | | |
| | | | | | | | | | | 40,765,612 | |
| | | | | | | | | | | | |
Diversified Telecommunication Services 1.9% | | | | | | | | | | | | |
AboveNet Inc. | | | United States | | | | 38,361 | | | | 2,242,584 | |
Cable & Wireless Communication PLC | | | United Kingdom | | | | 3,585,816 | | | | 2,721,681 | |
Cable & Wireless Worldwide PLC | | | United Kingdom | | | | 3,585,816 | | | | 3,672,731 | |
a,b,cGlobal Crossing Holdings Ltd., Contingent Distribution | | | United States | | | | 2,236,777 | | | | — | |
Telefonica SA | | | Spain | | | | 909,701 | | | | 20,645,600 | |
| | | | | | | | | | | | |
| | | | | | | | | | | 29,282,596 | |
| | | | | | | | | | | | |
Electric Utilities 2.7% | | | | | | | | | | | | |
a,b,cCalpine Corp., Contingent Distribution | | | United States | | | | 1,400,000 | | | | — | |
E.ON AG | | | Germany | | | | 485,720 | | | | 14,857,036 | |
Exelon Corp. | | | United States | | | | 459,650 | | | | 19,139,826 | |
dPrime AET&D Holdings No. 1 Pty. Ltd. | | | Australia | | | | 1,361,600 | | | | — | |
cPrime Infrastructure Group | | | Australia | | | | 1,361,600 | | | | 6,878,803 | |
| | | | | | | | | | | | |
| | | | | | | | | | | 40,875,665 | |
| | | | | | | | | | | | |
Electrical Equipment 0.9% | | | | | | | | | | | | |
Alstom SA | | | France | | | | 274,010 | | | | 13,126,402 | |
| | | | | | | | | | | | |
Energy Equipment & Services 1.8% | | | | | | | | | | | | |
aPetroleum Geo-Services ASA | | | Norway | | | | 11,710 | | | | 182,711 | |
aPride International Inc. | | | United States | | | | 319,600 | | | | 10,546,800 | |
Seadrill Ltd. | | | Bermuda | | | | 267,435 | | | | 9,057,497 | |
aTransocean Ltd. | | | United States | | | | 117,343 | | | | 8,156,512 | |
| | | | | | | | | | | | |
| | | | | | | | | | | 27,943,520 | |
| | | | | | | | | | | | |
MGD-15
Franklin Templeton Variable Insurance Products Trust
Statement of Investments, December 31, 2010 (continued)
| | | | | | | | | | | | |
| Mutual Global Discovery Securities Fund | | Country | | | Shares | | | Value | |
Common Stocks and Other Equity Interests (continued) | | | | | | | | | | | | |
Food & Staples Retailing 3.5% | | | | | | | | | | | | |
Carrefour SA | | | France | | | | 448,729 | | | $ | 18,518,861 | |
CVS Caremark Corp. | | | United States | | | | 766,540 | | | | 26,652,596 | |
Koninklijke Ahold NV | | | Netherlands | | | | 547,430 | | | | 7,232,437 | |
| | | | | | | | | | | | |
| | | | | | | | | | | 52,403,894 | |
| | | | | | | | | | | | |
Food Products 4.3% | | | | | | | | | | | | |
Farmer Brothers Co. | | | United States | | | | 60,060 | | | | 1,069,068 | |
Kraft Foods Inc., A | | | United States | | | | 762,346 | | | | 24,021,523 | |
Lotte Confectionery Co. Ltd. | | | South Korea | | | | 135 | | | | 181,565 | |
Nestle SA | | | Switzerland | | | | 653,031 | | | | 38,279,922 | |
Nong Shim Co. Ltd. | | | South Korea | | | | 11,291 | | | | 2,049,247 | |
| | | | | | | | | | | | |
| | | | | | | | | | | 65,601,325 | |
| | | | | | | | | | | | |
Health Care Equipment & Supplies 3.1% | | | | | | | | | | | | |
Alcon Inc. | | | Switzerland | | | | 68,860 | | | | 11,251,724 | |
Beckman Coulter Inc. | | | United States | | | | 154,480 | | | | 11,621,530 | |
aBoston Scientific Corp. | | | United States | | | | 883,480 | | | | 6,687,944 | |
Medtronic Inc. | | | United States | | | | 323,710 | | | | 12,006,404 | |
aZimmer Holdings Inc. | | | United States | | | | 87,187 | | | | 4,680,198 | |
| | | | | | | | | | | | |
| | | | | | | | | | | 46,247,800 | |
| | | | | | | | | | | | |
Health Care Providers & Services 1.7% | | | | | | | | | | | | |
Rhoen-Klinikum AG | | | Germany | | | | 608,573 | | | | 13,408,533 | |
UnitedHealth Group Inc. | | | United States | | | | 333,450 | | | | 12,040,879 | |
| | | | | | | | | | | | |
| | | | | | | | | | | 25,449,412 | |
| | | | | | | | | | | | |
Hotels, Restaurants & Leisure 1.4% | | | | | | | | | | | | |
Accor SA | | | France | | | | 278,320 | | | | 12,398,342 | |
Ladbrokes PLC | | | United Kingdom | | | | 4,875,840 | | | | 9,371,876 | |
| | | | | | | | | | | | |
| | | | | | | | | | | 21,770,218 | |
| | | | | | | | | | | | |
Household Durables 0.4% | | | | | | | | | | | | |
Stanley Black & Decker Inc. | | | United States | | | | 93,467 | | | | 6,250,138 | |
| | | | | | | | | | | | |
Independent Power Producers & Energy Traders 0.8% | | | | | | | | | | | | |
aNRG Energy Inc. | | | United States | | | | 644,630 | | | | 12,596,070 | |
| | | | | | | | | | | | |
Industrial Conglomerates 3.2% | | | | | | | | | | | | |
Jardine Matheson Holdings Ltd. | | | Hong Kong | | | | 398,522 | | | | 17,534,968 | |
Jardine Strategic Holdings Ltd. | | | Hong Kong | | | | 1,097,650 | | | | 30,382,952 | |
| | | | | | | | | | | | |
| | | | | | | | | | | 47,917,920 | |
| | | | | | | | | | | | |
Insurance 3.3% | | | | | | | | | | | | |
ACE Ltd. | | | United States | | | | 356,360 | | | | 22,183,410 | |
aAlleghany Corp. | | | United States | | | | 4,148 | | | | 1,270,823 | |
E-L Financial Corp. Ltd. | | | Canada | | | | 8,478 | | | | 4,219,021 | |
a,dImagine Group Holdings Ltd. | | | Bermuda | | | | 172,409 | | | | 2,142,354 | |
a,dOlympus Re Holdings Ltd. | | | United States | | | | 2,140 | | | | 813 | |
PartnerRe Ltd. | | | Bermuda | | | | 151,240 | | | | 12,152,134 | |
Zurich Financial Services AG | | | Switzerland | | | | 27,980 | | | | 7,255,627 | |
| | | | | | | | | | | | |
| | | | | | | | | | | 49,224,182 | |
| | | | | | | | | | | | |
IT Services 0.0%† | | | | | | | | | | | | |
dGlodyne Technoserve Ltd. | | | India | | | | 1,331 | | | | 19,161 | |
| | | | | | | | | | | | |
Machinery 2.0% | | | | | | | | | | | | |
Schindler Holding AG, PC | | | Switzerland | | | | 253,797 | | | | 30,053,478 | |
| | | | | | | | | | | | |
MGD-16
Franklin Templeton Variable Insurance Products Trust
Statement of Investments, December 31, 2010 (continued)
| | | | | | | | | | | | |
| Mutual Global Discovery Securities Fund | | Country | | | Shares | | | Value | |
Common Stocks and Other Equity Interests (continued) | | | | | | | | | | | | |
Marine 1.5% | | | | | | | | | | | | |
A.P. Moller - Maersk AS, B | | | Denmark | | | | 2,494 | | | $ | 22,607,218 | |
| | | | | | | | | | | | |
Media 3.3% | | | | | | | | | | | | |
British Sky Broadcasting Group PLC | | | United Kingdom | | | | 1,015,781 | | | | 11,671,837 | |
Comcast Corp., Special A | | | United States | | | | 244,000 | | | | 5,077,640 | |
Daekyo Co. Ltd. | | | South Korea | | | | 5,820 | | | | 31,144 | |
Eutelsat Communications | | | France | | | | 520,271 | | | | 19,063,236 | |
Time Warner Cable Inc. | | | United States | | | | 105,970 | | | | 6,997,199 | |
Time Warner Inc. | | | United States | | | | 222,200 | | | | 7,148,174 | |
| | | | | | | | | | | | |
| | | | | | | | | | | 49,989,230 | |
| | | | | | | | | | | | |
Metals & Mining 0.1% | | | | | | | | | | | | |
aThyssenKrupp AG | | | Germany | | | | 34,591 | | | | 1,438,662 | |
| | | | | | | | | | | | |
Multi-Utilities 1.8% | | | | | | | | | | | | |
GDF Suez | | | France | | | | 630,284 | | | | 22,638,912 | |
Hera SpA | | | Italy | | | | 1,864,274 | | | | 3,863,102 | |
| | | | | | | | | | | | |
| | | | | | | | | | | 26,502,014 | |
| | | | | | | | | | | | |
Office Electronics 1.1% | | | | | | | | | | | | |
Xerox Corp. | | | United States | | | | 1,514,117 | | | | 17,442,628 | |
| | | | | | | | | | | | |
Oil, Gas & Consumable Fuels 3.2% | | | | | | | | | | | | |
BP PLC | | | United Kingdom | | | | 769,413 | | | | 5,594,463 | |
Royal Dutch Shell PLC, A | | | United Kingdom | | | | 808,307 | | | | 26,740,864 | |
Total SA, B | | | France | | | | 275,896 | | | | 14,634,017 | |
Total SA, B, ADR | | | France | | | | 19,340 | | | | 1,034,303 | |
| | | | | | | | | | | | |
| | | | | | | | | | | 48,003,647 | |
| | | | | | | | | | | | |
Pharmaceuticals 2.8% | | | | | | | | | | | | |
Eli Lilly & Co. | | | United States | | | | 539,140 | | | | 18,891,466 | |
Pfizer Inc. | | | United States | | | | 1,320,541 | | | | 23,122,673 | |
| | | | | | | | | | | | |
| | | | | | | | | | | 42,014,139 | |
| | | | | | | | | | | | |
Real Estate Investment Trusts (REITs) 1.7% | | | | | | | | | | | | |
The Link REIT | | | Hong Kong | | | | 8,192,115 | | | | 25,453,789 | |
| | | | | | | | | | | | |
Real Estate Management & Development 0.9% | | | | | | | | | | | | |
cCanary Wharf Group PLC | | | United Kingdom | | | | 487,324 | | | | 2,112,892 | |
Great Eagle Holdings Ltd. | | | Hong Kong | | | | 1,613,524 | | | | 5,023,774 | |
Swire Pacific Ltd., B | | | Hong Kong | | | | 1,949,472 | | | | 5,831,486 | |
| | | | | | | | | | | | |
| | | | | | | | | | | 12,968,152 | |
| | | | | | | | | | | | |
Software 3.4% | | | | | | | | | | | | |
aMcAfee Inc. | | | United States | | | | 149,280 | | | | 6,913,157 | |
Microsoft Corp. | | | United States | | | | 806,798 | | | | 22,525,800 | |
Nintendo Co. Ltd. | | | Japan | | | | 47,500 | | | | 13,944,256 | |
aSymantec Corp. | | | United States | | | | 431,550 | | | | 7,224,147 | |
| | | | | | | | | | | | |
| | | | | | | | | | | 50,607,360 | |
| | | | | | | | | | | | |
Tobacco 9.9% | | | | | | | | | | | | |
Altria Group Inc. | | | United States | | | | 604,821 | | | | 14,890,693 | |
British American Tobacco PLC | | | United Kingdom | | | | 1,112,353 | | | | 42,769,859 | |
Imperial Tobacco Group PLC | | | United Kingdom | | | | 1,082,017 | | | | 33,306,387 | |
ITC Ltd. | | | India | | | | 240,863 | | | | 940,019 | |
Lorillard Inc. | | | United States | | | | 311,020 | | | | 25,522,301 | |
Philip Morris International Inc. | | | United States | | | | 204,981 | | | | 11,997,538 | |
Reynolds American Inc. | | | United States | | | | 629,900 | | | | 20,547,338 | |
| | | | | | | | | | | | |
| | | | | | | | | | | 149,974,135 | |
| | | | | | | | | | | | |
MGD-17
Franklin Templeton Variable Insurance Products Trust
Statement of Investments, December 31, 2010 (continued)
| | | | | | | | | | | | |
| Mutual Global Discovery Securities Fund | | Country | | | Shares | | | Value | |
Common Stocks and Other Equity Interests (continued) | | | | | | | | | | | | |
Transportation Infrastructure 0.0%† | | | | | | | | | | | | |
Groupe Eurotunnel SA | | | France | | | | 46,867 | | | $ | 412,542 | |
| | | | | | | | | | | | |
Wireless Telecommunication Services 2.1% | | | | | | | | | | | | |
Vodafone Group PLC | | | United Kingdom | | | | 12,007,170 | | | | 31,078,025 | |
| | | | | | | | | | | | |
Total Common Stocks and Other Equity Interests
(Cost $1,050,093,446) | | | | | | | | | | | 1,277,566,447 | |
| | | | | | | | | | | | |
Preferred Stocks 0.8% | | | | | | | | | | | | |
Automobiles 0.7% | | | | | | | | | | | | |
Volkswagen AG, pfd. | | | Germany | | | | 66,093 | | | | 10,769,943 | |
| | | | | | | | | | | | |
Diversified Financial Services 0.1% | | | | | | | | | | | | |
a,dHightower Holding LLC, pfd., A, Series 2 | | | United States | | | | 557,107 | | | | 1,158,855 | |
| | | | | | | | | | | | |
Total Preferred Stocks (Cost $7,085,450) | | | | | | | | | | | 11,928,798 | |
| | | | | | | | | | | | |
| | | |
| | | | | | Principal
Amount | | | | |
Corporate Bonds, Notes and Senior Floating Rate Interests 3.8% | | | | | | | | | | | | |
hAvaya Inc., Term Loan B-1, FRN, 3.034%, 10/26/14 | | | United States | | | $ | 681,521 | | | | 645,863 | |
dBroadband Ventures III LLC, secured promissory note, 5.00%, 2/01/12 | | | United States | | | | 1,443 | | | | 1,443 | |
d,iCerberus CG Investor I LLC, 12.00%, 7/31/14 | | | United States | | | | 1,897,400 | | | | 1,536,894 | |
d,iCerberus CG Investor II LLC, 12.00%, 7/31/14 | | | United States | | | | 1,897,400 | | | | 1,536,894 | |
d,iCerberus CG Investor III LLC, 12.00%, 7/31/14 | | | United States | | | | 948,700 | | | | 768,447 | |
CIT Group Inc.,
senior secured sub. bond, 7.00%, 5/01/16 | | | United States | | | | 8,060,424 | | | | 8,110,802 | |
senior secured sub. bond, 7.00%, 5/01/17 | | | United States | | | | 6,810,931 | | | | 6,844,986 | |
hTerm Loan Tranche 3, FRN, 6.25%, 8/11/15 | | | United States | | | | 1,242,135 | | | | 1,268,789 | |
hFirst Data Corp., Term Loan, FRN, 3.011%, 9/24/14 | | | | | | | | | | | | |
B-1 | | | United States | | | | 4,898,413 | | | | 4,526,824 | |
B-2 | | | United States | | | | 1,092,923 | | | | 1,010,015 | |
B-3 | | | United States | | | | 364,594 | | | | 337,376 | |
d,eInternational Automotive Components Group North America LLC, 11.00%, 11/12/14 | | | United States | | | | 407,500 | | | | 407,500 | |
hRealogy Corp., FRN, | | | | | | | | | | | | |
Delayed Draw Term Loan B, 3.286%, 10/10/13 | | | United States | | | | 6,232,983 | | | | 5,862,513 | |
Initial Term Loan B, 3.286%, 10/10/13 | | | United States | | | | 8,885,340 | | | | 8,357,222 | |
Synthetic Letter of Credit, 3.254%, 10/10/13 | | | United States | | | | 989,608 | | | | 930,788 | |
Seadrill Ltd., cvt., senior note, 3.625%, 11/08/12 | | | Bermuda | | | | 1,400,000 | | | | 1,743,000 | |
hTexas Competitive Electric Holdings Co. LLC, Delayed Draw Term Loan, FRN,
3.764%, 10/10/14 | | | United States | | | | 10,973,890 | | | | 8,434,653 | |
hTrident Exploration Corp., Exit Term Loan, FRN, 12.50%, 5/17/14 | | | United States | | | | 4,010,845 | | | | 4,251,496 | |
| | | | | | | | | | | | |
Total Corporate Bonds, Notes and Senior Floating Rate Interests
(Cost $54,073,996) | | | | | | | | | | | 56,575,505 | |
| | | | | | | | | | | | |
| | | |
| | | | | | Shares | | | | |
Companies in Liquidation 0.0%† | | | | | | | | | | | | |
aAdelphia Recovery Trust | | | United States | | | | 5,379,562 | | | | 53,796 | |
a,bAdelphia Recovery Trust, Arahova Contingent Value Vehicle, Contingent Distribution | | | United States | | | | 386,774 | | | | 38,677 | |
a,b,cCentury Communications Corp., Contingent Distribution | | | United States | | | | 1,074,000 | | | | — | |
a,dFIM Coinvestor Holdings I LLC | | | United States | | | | 2,077,368 | | | | — | |
| | | | | | | | | | | | |
Total Companies in Liquidation (Cost $497,457) | | | | | | | | | | | 92,473 | |
| | | | | | | | | | | | |
Total Investments before Short Term Investments
(Cost $1,111,750,349) | | | | | | | | | | | 1,346,163,223 | |
| | | | | | | | | | | | |
MGD-18
Franklin Templeton Variable Insurance Products Trust
Statement of Investments, December 31, 2010 (continued)
| | | | | | | | | | | | |
| Mutual Global Discovery Securities Fund | | Country | | | Principal
Amount | | | Value | |
Short Term Investments 9.0% | | | | | | | | | | | | |
U.S. Government and Agency Securities 9.0% | | | | | | | | | | | | |
jFHLB, 1/03/11 - 1/05/11 | | | United States | | | $ | 19,300,000 | | | $ | 19,299,990 | |
jU.S. Treasury Bills,
4/07/11 | | | United States | | | | 20,000,000 | | | | 19,993,360 | |
1/06/11 - 5/19/11 | | | United States | | | | 67,000,000 | | | | 66,987,774 | |
6/23/11 | | | United States | | | | 30,000,000 | | | | 29,975,490 | |
| | | | | | | | | | | | |
Total U.S. Government and Agency Securities
(Cost $136,246,438) | | | | | | | | | | | 136,256,614 | |
| | | | | | | | | | | | |
Total Investments before Money Market Funds
(Cost $1,247,996,787) | | | | | | | | | | | 1,482,419,837 | |
| | | | | | | | | | | | |
| | | |
| | | | | | Shares | | | | |
Money Market Funds (Cost $31,953) 0.0%† | | | | | | | | | | | | |
aBank of New York Institutional Cash Reserve Fund, Series B | | | United States | | | | 31,953 | | | | 25,562 | |
| | | | | | | | | | | | |
Total Investments (Cost $1,248,028,740) 98.4% | | | | | | | | | | | 1,482,445,399 | |
Other Assets, less Liabilities 1.6% | | | | | | | | | | | 23,604,049 | |
| | | | | | | | | | | | |
Net Assets 100.0% | | | | | | | | | | $ | 1,506,049,448 | |
| | | | | | | | | | | | |
†Rounds to less than 0.1% of net assets.
aNon-income producing.
bContingent distributions represent the right to receive additional distributions, if any, during the reorganization of the underlying company. Shares represent total underlying principal of debt securities.
cSecurity has been deemed illiquid because it may not be able to be sold within seven days. At December 31, 2010, the aggregate value of these securities was $8,993,882, representing 0.60% of net assets.
dSee Note 9 regarding restricted securities.
eAt December 31, 2010, pursuant to the Fund’s policies and the requirements of applicable securities law, the Fund may be restricted from trading these securities for a limited or extended period of time due to ownership limits and/or potential possession of material non-public information.
fSee Note 12 regarding holdings of 5% voting securities.
gSecurity was purchased pursuant to Rule 144A under the Securities Act of 1933 and may be sold in transactions exempt from registration only to qualified institutional buyers or in a public offering registered under the Securities Act of 1933. These securities have been deemed liquid under guidelines approved by the Trust’s Board of Trustees. At December 31, 2010, the aggregate value of these securities was $6,097,280, representing 0.40% of net assets.
hThe coupon rate shown represents the rate at period end.
iSee Note 7 regarding credit risk and defaulted securities.
jThe security is traded on a discount basis with no stated coupon rate.
The accompanying notes are an integral part of these financial statements.
MGD-19
Franklin Templeton Variable Insurance Products Trust
Statement of Investments, December 31, 2010 (continued)
|
| Mutual Global Discovery Securities Fund |
At December 31, 2010, the Fund had the following forward exchange contracts outstanding. See Note 1(c).
| | | | | | | | | | | | | | | | | | | | | | | | | | | | |
| Currency | | Counterparty | | | Type | | | Quantity | | | Contract
Amount | | | Settlement
Date | | | Unrealized
Appreciation | | | Unrealized
Depreciation | |
British Pound | | | BOFA | | | | Sell | | | | 926,936 | | | $ | 1,412,335 | | | | 1/12/11 | | | $ | — | | | $ | (33,685 | ) |
British Pound | | | DBAB | | | | Sell | | | | 900,000 | | | | 1,380,537 | | | | 1/12/11 | | | | — | | | | (23,463 | ) |
British Pound | | | BOFA | | | | Buy | | | | 660,000 | | | | 1,052,971 | | | | 1/12/11 | | | | — | | | | (23,371 | ) |
British Pound | | | DBAB | | | | Buy | | | | 240,000 | | | | 380,628 | | | | 1/12/11 | | | | — | | | | (6,228 | ) |
British Pound | | | BOFA | | | | Buy | | | | 161,189 | | | | 251,071 | | | | 1/12/11 | | | | 384 | | | | — | |
British Pound | | | DBAB | | | | Sell | | | | 3,369,169 | | | | 5,369,017 | | | | 1/12/11 | | | | 113,113 | | | | — | |
British Pound | | | SSBT | | | | Sell | | | | 30,105,949 | | | | 48,613,431 | | | | 1/12/11 | | | | 1,648,150 | | | | — | |
Euro | | | BZWS | | | | Sell | | | | 33,775,000 | | | | 42,976,825 | | | | 1/18/11 | | | | — | | | | (2,204,366 | ) |
Euro | | | SSBT | | | | Sell | | | | 8,750,000 | | | | 11,118,625 | | | | 1/18/11 | | | | — | | | | (586,347 | ) |
Euro | | | BOFA | | | | Sell | | | | 5,704,957 | | | | 7,267,374 | | | | 1/18/11 | | | | — | | | | (364,211 | ) |
Euro | | | DBAB | | | | Sell | | | | 1,860,000 | | | | 2,392,648 | | | | 1/18/11 | | | | — | | | | (95,494 | ) |
Euro | | | BOFA | | | | Buy | | | | 2,320,729 | | | | 3,184,981 | | | | 1/18/11 | | | | — | | | | (80,516 | ) |
Euro | | | DBAB | | | | Buy | | | | 1,800,825 | | | | 2,466,347 | | | | 1/18/11 | | | | — | | | | (57,363 | ) |
Euro | | | SSBT | | | | Buy | | | | 128,393 | | | | 165,490 | | | | 1/18/11 | | | | 6,263 | | | | — | |
Euro | | | BOFA | | | | Buy | | | | 1,166,398 | | | | 1,515,573 | | | | 1/18/11 | | | | 44,731 | | | | — | |
Euro | | | DBAB | | | | Buy | | | | 1,028,255 | | | | 1,337,521 | | | | 1/18/11 | | | | 37,987 | | | | — | |
Euro | | | DBAB | | | | Sell | | | | 710,000 | | | | 951,427 | | | | 1/18/11 | | | | 1,652 | | | | — | |
Danish Krone | | | HAND | | | | Sell | | | | 116,126,930 | | | | 19,956,923 | | | | 1/24/11 | | | | — | | | | (882,290 | ) |
Danish Krone | | | HAND | | | | Buy | | | | 38,838,939 | | | | 7,193,924 | | | | 1/24/11 | | | | — | | | | (224,197 | ) |
Danish Krone | | | SSBT | | | | Sell | | | | 1,975,000 | | | | 335,844 | | | | 1/24/11 | | | | — | | | | (18,573 | ) |
Danish Krone | | | SSBT | | | | Buy | | | | 2,700,000 | | | | 492,832 | | | | 1/24/11 | | | | — | | | | (8,312 | ) |
Danish Krone | | | DBAB | | | | Buy | | | | 1,895,020 | | | | 345,510 | | | | 1/24/11 | | | | — | | | | (5,445 | ) |
Danish Krone | | | HAND | | | | Buy | | | | 16,825,477 | | | | 2,917,766 | | | | 1/24/11 | | | | 101,600 | | | | — | |
Danish Krone | | | BOFA | | | | Buy | | | | 4,200,000 | | | | 733,676 | | | | 1/24/11 | | | | 20,023 | | | | — | |
South Korean Won | | | BOFA | | | | Sell | | | | 7,588,263,750 | | | | 6,335,000 | | | | 1/24/11 | | | | — | | | | (422,798 | ) |
South Korean Won | | | DBAB | | | | Sell | | | | 5,055,775,000 | | | | 4,195,000 | | | | 1/24/11 | | | | — | | | | (307,467 | ) |
South Korean Won | | | DBAB | | | | Buy | | | | 1,288,000,000 | | | | 1,152,160 | | | | 1/24/11 | | | | — | | | | (5,120 | ) |
South Korean Won | | | BOFA | | | | Buy | | | | 7,588,263,750 | | | | 6,629,041 | | | | 1/24/11 | | | | 128,757 | | | | — | |
South Korean Won | | | DBAB | | | | Buy | | | | 2,036,810,175 | | | | 1,785,633 | | | | 1/24/11 | | | | 28,267 | | | | — | |
Danish Krone | | | HAND | | | | Buy | | | | 28,589,188 | | | | 5,334,290 | | | | 1/25/11 | | | | — | | | | (203,915 | ) |
Danish Krone | | | BOFA | | | | Buy | | | | 3,290,000 | | | | 602,995 | | | | 1/25/11 | | | | — | | | | (12,599 | ) |
Danish Krone | | | HAND | | | | Buy | | | | 6,562,762 | | | | 1,163,709 | | | | 1/25/11 | | | | 13,989 | | | | — | |
Danish Krone | | | HAND | | | | Sell | | | | 66,013,087 | | | | 12,377,183 | | | | 1/25/11 | | | | 531,029 | | | | — | |
Canadian Dollar | | | DBAB | | | | Sell | | | | 3,182,146 | | | | 3,115,597 | | | | 1/31/11 | | | | — | | | | (73,572 | ) |
Swiss Franc | | | SSBT | | | | Sell | | | | 31,055,484 | | | | 30,063,392 | | | | 2/10/11 | | | | — | | | | (3,203,153 | ) |
Swiss Franc | | | DBAB | | | | Sell | | | | 1,932,296 | | | | 1,980,000 | | | | 2/10/11 | | | | — | | | | (89,870 | ) |
Swiss Franc | | | DBAB | | | | Buy | | | | 857,777 | | | | 866,949 | | | | 2/10/11 | | | | 51,899 | | | | — | |
Swiss Franc | | | BOFA | | | | Buy | | | | 273,194 | | | | 291,760 | | | | 2/10/11 | | | | 884 | | | | — | |
Swiss Franc | | | SSBT | | | | Buy | | | | 151,409 | | | | 161,608 | | | | 2/10/11 | | | | 581 | | | | — | |
British Pound | | | BZWS | | | | Buy | | | | 120,000 | | | | 191,125 | | | | 2/14/11 | | | | — | | | | (3,973 | ) |
British Pound | | | BZWS | | | | Sell | | | | 26,439,241 | | | | 42,105,285 | | | | 2/14/11 | | | | 870,644 | | | | — | |
British Pound | | | BOFA | | | | Sell | | | | 2,070,000 | | | | 3,313,387 | | | | 2/14/11 | | | | 93,409 | | | | — | |
British Pound | | | DBAB | | | | Sell | | | | 1,285,000 | | | | 2,054,393 | | | | 2/14/11 | | | | 54,504 | | | | — | |
Euro | | | BOFA | | | | Sell | | | | 41,122,198 | | | | 52,670,524 | | | | 2/28/11 | | | | — | | | | (2,330,871 | ) |
Euro | | | BZWS | | | | Sell | | | | 16,852,884 | | �� | | 21,655,956 | | | | 2/28/11 | | | | — | | | | (884,963 | ) |
Euro | | | DBAB | | | | Buy | | | | 1,907,503 | | | | 2,581,847 | | | | 2/28/11 | | | | — | | | | (30,541 | ) |
Euro | | | BOFA | | | | Buy | | | | 1,391,812 | | | | 1,888,546 | | | | 2/28/11 | | | | — | | | | (26,982 | ) |
Euro | | | DBAB | | | | Sell | | | | 440,000 | | | | 571,556 | | | | 2/28/11 | | | | — | | | | (16,949 | ) |
Euro | | | DBAB | | | | Buy | | | | 1,200,000 | | | | 1,563,156 | | | | 2/28/11 | | | | 41,857 | | | | — | |
British Pound | | | DBAB | | | | Sell | | | | 17,366,676 | | | | 27,995,081 | | | | 3/15/11 | | | | 916,247 | | | | — | |
Euro | | | DBAB | | | | Buy | | | | 2,105,430 | | | | 2,859,170 | | | | 3/15/11 | | | | — | | | | (43,304 | ) |
MGD-20
Franklin Templeton Variable Insurance Products Trust
Statement of Investments, December 31, 2010 (continued)
|
| Mutual Global Discovery Securities Fund |
| | | | | | | | | | | | | | | | | | | | | | | | | | | | |
| Currency | | Counterparty | | | Type | | | Quantity | | | Contract
Amount | | | Settlement
Date | | | Unrealized
Appreciation | | | Unrealized
Depreciation | |
Euro | | | BOFA | | | | Buy | | | | 1,731,825 | | | $ | 2,358,030 | | | | 3/15/11 | | | $ | — | | | $ | (41,835 | ) |
Euro | | | HAND | | | | Sell | | | | 1,040,000 | | | | 1,381,130 | | | | 3/15/11 | | | | — | | | | (9,797 | ) |
Euro | | | BZWS | | | | Buy | | | | 840,000 | | | | 1,130,027 | | | | 3/15/11 | | | | — | | | | (6,585 | ) |
Euro | | | BOFA | | | | Sell | | | | 18,080,492 | | | | 24,951,078 | | | | 3/15/11 | | | | 769,680 | | | | — | |
Euro | | | DBAB | | | | Sell | | | | 15,519,620 | | | | 21,417,377 | | | | 3/15/11 | | | | 660,965 | | | | — | |
Euro | | | BZWS | | | | Sell | | | | 13,297,440 | | | | 18,338,499 | | | | 3/15/11 | | | | 554,099 | | | | — | |
British Pound | | | DBAB | | | | Buy | | | | 660,000 | | | | 1,053,545 | | | | 4/15/11 | | | | — | | | | (24,760 | ) |
British Pound | | | BOFA | | | | Buy | | | | 730,000 | | | | 1,158,630 | | | | 4/15/11 | | | | — | | | | (20,731 | ) |
British Pound | | | DBAB | | | | Buy | | | | 3,500,000 | | | | 5,434,905 | | | | 4/15/11 | | | | 20,774 | | | | — | |
British Pound | | | BOFA | | | | Buy | | | | 350,000 | | | | 543,067 | | | | 4/15/11 | | | | 2,501 | | | | — | |
British Pound | | | BZWS | | | | Sell | | | | 17,243,434 | | | | 27,796,416 | | | | 4/15/11 | | | | 917,945 | | | | — | |
Euro | | | BZWS | | | | Buy | | | | 2,900,960 | | | | 3,890,187 | | | | 4/15/11 | | | | — | | | | (10,874 | ) |
Euro | | | BOFA | | | | Buy | | | | 1,020,000 | | | | 1,373,991 | | | | 4/15/11 | | | | — | | | | (9,994 | ) |
Euro | | | DBAB | | | | Buy | | | | 1,723,706 | | | | 2,312,880 | | | | 4/15/11 | | | | — | | | | (7,851 | ) |
Euro | | | DBAB | | | | Buy | | | | 1,221,986 | | | | 1,598,553 | | | | 4/15/11 | | | | 35,550 | | | | — | |
Euro | | | BOFA | | | | Sell | | | | 7,889,753 | | | | 10,777,402 | | | | 4/15/11 | | | | 226,817 | | | | — | |
Euro | | | DBAB | | | | Sell | | | | 12,688,438 | | | | 17,323,711 | | | | 4/15/11 | | | | 356,076 | | | | — | |
Euro | | | SSBT | | | | Sell | | | | 11,038,438 | | | | 15,071,884 | | | | 4/15/11 | | | | 310,714 | | | | — | |
Japanese Yen | | | DBAB | | | | Sell | | | | 2,200,000 | | | | 26,551 | | | | 4/20/11 | | | | — | | | | (586 | ) |
Japanese Yen | | | BOFA | | | | Sell | | | | 1,443,138 | | | | 17,500 | | | | 4/20/11 | | | | — | | | | (301 | ) |
Japanese Yen | | | BZWS | | | | Sell | | | | 30,299,043 | | | | 373,804 | | | | 4/20/11 | | | | 74 | | | | — | |
Japanese Yen | | | DBAB | | | | Sell | | | | 750,000 | | | | 9,286 | | | | 4/20/11 | | | | 35 | | | | — | |
Swiss Franc | | | DBAB | | | | Sell | | | | 22,492,829 | | | | 23,330,390 | | | | 5/10/11 | | | | — | | | | (794,274 | ) |
Swiss Franc | | | SSBT | | | | Sell | | | | 14,073,431 | | | | 14,592,940 | | | | 5/10/11 | | | | — | | | | (501,507 | ) |
| | | | | | | | | | | | | | | | | | | | | | | | |
Unrealized appreciation (depreciation) | | | | | | | | | | | | | | | | 8,561,200 | | | | (13,699,033 | ) |
| | | | | | | | | | | | | | | | | | | | | | | | |
Net unrealized appreciation (depreciation) | | | | | | | | | | | | | | | | | | | $ | (5,137,833 | ) |
| | | | | | | | | | | | | | | | | | | | | | | | | | | | |
See Abbreviations on page MGD-36.
MGD-21
Franklin Templeton Variable Insurance Products Trust
Financial Statements
Statement of Assets and Liabilities
December 31, 2010
| | | | |
| | | Mutual Global
Discovery
Securities Fund | |
Assets: | | | | |
Investments in securities: | | | | |
Cost - Unaffiliated issuers | | $ | 1,240,028,740 | |
Cost - Non-controlled affiliated issuers (Note 12) | | | 8,000,000 | |
| | | | |
Total cost of investments | | $ | 1,248,028,740 | |
| | | | |
Value - Unaffiliated issuers | | $ | 1,479,540,175 | |
Value - Non-controlled affiliated issuers (Note 12) | | | 2,905,224 | |
| | | | |
Total value of investments | | | 1,482,445,399 | |
Cash | | | 207,110 | |
Foreign currency, at value (cost $20,127,444) | | | 20,153,324 | |
Receivables: | | | | |
Investment securities sold | | | 9,004,480 | |
Capital shares sold | | | 310,929 | |
Dividends and interest | | | 4,040,910 | |
Unrealized appreciation on forward exchange contracts | | | 8,561,200 | |
Other assets | | | 131,622 | |
| | | | |
Total assets | | | 1,524,854,974 | |
| | | | |
Liabilities: | | | | |
Payables: | | | | |
Investment securities purchased | | | 1,551,731 | |
Capital shares redeemed | | | 513,033 | |
Affiliates | | | 1,761,222 | |
Unrealized depreciation on forward exchange contracts | | | 13,699,033 | |
Deferred tax | | | 734,375 | |
Accrued expenses and other liabilities | | | 546,132 | |
| | | | |
Total liabilities | | | 18,805,526 | |
| | | | |
Net assets, at value | | $ | 1,506,049,448 | |
| | | | |
Net assets consist of: | | | | |
Paid-in capital | | $ | 1,228,714,506 | |
Undistributed net investment income | | | 22,625,559 | |
Net unrealized appreciation (depreciation) | | | 228,652,886 | |
Accumulated net realized gain (loss) | | | 26,056,497 | |
| | | | |
Net assets, at value | | $ | 1,506,049,448 | |
| | | | |
Class 1: | | | | |
Net assets, at value | | $ | 84,213,267 | |
| | | | |
Shares outstanding | | | 3,978,931 | |
| | | | |
Net asset value and maximum offering price per share | | $ | 21.16 | |
| | | | |
Class 2: | | | | |
Net assets, at value | | $ | 1,351,223,496 | |
| | | | |
Shares outstanding | | | 64,972,088 | |
| | | | |
Net asset value and maximum offering price per share | | $ | 20.80 | |
| | | | |
Class 4: | | | | |
Net assets, at value | | $ | 70,612,685 | |
| | | | |
Shares outstanding | | | 3,359,838 | |
| | | | |
Net asset value and maximum offering price per share | | $ | 21.02 | |
| | | | |
The accompanying notes are an integral part of these financial statements.
MGD-22
Franklin Templeton Variable Insurance Products Trust
Financial Statements (continued)
Statement of Operations
for the year ended December 31, 2010
| | | | |
| | | Mutual Global
Discovery
Securities Fund | |
Investment income: | | | | |
Dividends (net of foreign taxes of $2,492,934) | | $ | 36,947,567 | |
Interest | | | 5,213,215 | |
Income from securities loaned | | | 267,386 | |
| | | | |
Total investment income | | | 42,428,168 | |
| | | | |
Expenses: | | | | |
Management fees (Note 3a) | | | 11,586,650 | |
Administrative fees (Note 3b) | | | 1,661,248 | |
Distribution fees: (Note 3c) | | | | |
Class 2 | | | 3,247,590 | |
Class 4 | | | 224,379 | |
Unaffiliated transfer agent fees | | | 1,470 | |
Custodian fees (Note 4) | | | 181,020 | |
Reports to shareholders | | | 440,787 | |
Professional fees | | | 218,900 | |
Trustees’ fees and expenses | | | 6,517 | |
Dividends on securities sold short | | | 290,000 | |
Other | | | 82,654 | |
| | | | |
Total expenses | | | 17,941,215 | |
Expense reductions (Note 4) | | | (14 | ) |
| | | | |
Net expenses | | | 17,941,201 | |
| | | | |
Net investment income | | | 24,486,967 | |
| | | | |
Realized and unrealized gains (losses): | | | | |
Net realized gain (loss) from: | | | | |
Investments (net of foreign taxes of $128,992) | | | 61,660,226 | |
Written options | | | (2,082,773 | ) |
Foreign currency transactions | | | 39,699,497 | |
Securities sold short | | | 515,293 | |
| | | | |
Net realized gain (loss) | | | 99,792,243 | |
| | | | |
Net change in unrealized appreciation (depreciation) on: | | | | |
Investments | | | 60,197,414 | |
Translation of other assets and liabilities denominated in foreign currencies | | | (21,217,095 | ) |
Change in deferred taxes on unrealized appreciation | | | (734,375 | ) |
| | | | |
Net change in unrealized appreciation (depreciation) | | | 38,245,944 | |
| | | | |
Net realized and unrealized gain (loss) | | | 138,038,187 | |
| | | | |
Net increase (decrease) in net assets resulting from operations | | $ | 162,525,154 | |
| | | | |
The accompanying notes are an integral part of these financial statements.
MGD-23
Franklin Templeton Variable Insurance Products Trust
Financial Statements (continued)
Statements of Changes in Net Assets
| | | | | | | | |
| | | Mutual Global Discovery
Securities Fund | |
| | | Year Ended December 31, | |
| | | 2010 | | | 2009 | |
| | | | |
Increase (decrease) in net assets: | | | | | | | | |
Operations: | | | | | | | | |
Net investment income | | $ | 24,486,967 | | | $ | 10,961,288 | |
Net realized gain (loss) from investments, written options, foreign currency transactions, and securities sold short | | | 99,792,243 | | | | (38,152,969 | ) |
Net change in unrealized appreciation (depreciation) on investments, translation of other assets and liabilities denominated in foreign currencies and deferred taxes | | | 38,245,944 | | | | 304,974,790 | |
| | | | |
Net increase (decrease) in net assets resulting from operations | | | 162,525,154 | | | | 277,783,109 | |
| | | | |
Distributions to shareholders from: | | | | | | | | |
Net investment income: | | | | | | | | |
Class 1 | | | (1,245,461 | ) | | | (1,156,170 | ) |
Class 2 | | | (16,267,624 | ) | | | (13,893,915 | ) |
Class 4 | | | (816,963 | ) | | | (663,709 | ) |
Net realized gains: | | | | | | | | |
Class 1 | | | — | | | | (2,188,207 | ) |
Class 2 | | | — | | | | (32,783,395 | ) |
Class 4 | | | — | | | | (1,312,205 | ) |
| | | | |
Total distributions to shareholders | | | (18,330,048 | ) | | | (51,997,601 | ) |
| | | | |
Capital share transactions: (Note 2) | | | | | | | | |
Class 1 | | | (10,957,474 | ) | | | (8,448,336 | ) |
Class 2 | | | (87,938,794 | ) | | | (8,110,790 | ) |
Class 4 | | | 4,965,152 | | | | 27,537,134 | |
| | | | |
Total capital share transactions | | | (93,931,116 | ) | | | 10,978,008 | |
| | | | |
Net increase (decrease) in net assets | | | 50,263,990 | | | | 236,763,516 | |
Net assets: | | | | | | | | |
Beginning of year | | | 1,455,785,458 | | | | 1,219,021,942 | |
| | | | |
End of year | | $ | 1,506,049,448 | | | $ | 1,455,785,458 | |
| | | | |
Undistributed net investment income included in net assets: | | | | | | | | |
End of year | | $ | 22,625,559 | | | $ | 12,778,372 | |
| | | | |
The accompanying notes are an integral part of these financial statements.
MGD-24
Franklin Templeton Variable Insurance Products Trust
Notes to Financial Statements
Mutual Global Discovery Securities Fund
1. ORGANIZATION AND SIGNIFICANT ACCOUNTING POLICIES
Franklin Templeton Variable Insurance Products Trust (Trust) is registered under the Investment Company Act of 1940, as amended, (1940 Act) as an open-end investment company, consisting of twenty separate funds. The Mutual Global Discovery Securities Fund (Fund) is included in this report. The financial statements of the remaining funds in the Trust are presented separately. Shares of the Fund are generally sold only to insurance company separate accounts to fund the benefits of variable life insurance policies or variable annuity contracts. At December 31, 2010, 54.52% of the Fund’s shares were held through one insurance company. The Fund offers three classes of shares: Class 1, Class 2, and Class 4. Each class of shares differs by its distribution fees, voting rights on matters affecting a single class and its exchange privilege.
The following summarizes the Fund’s significant accounting policies.
a. Financial Instrument Valuation
The Fund values its investments in securities and other assets and liabilities carried at fair value daily. Fair value is the price that would be received to sell an asset or paid to transfer a liability in an orderly transaction between market participants on the measurement date. Under procedures approved by the Trust’s Board of Trustees, the Fund may utilize independent pricing services, quotations from securities and financial instrument dealers, and other market sources to determine fair value.
Equity securities and derivative financial instruments (derivatives) listed on an exchange or on the NASDAQ National Market System are valued at the last quoted sale price or the official closing price of the day, respectively. Foreign equity securities are valued as of the close of trading on the foreign stock exchange on which the security is primarily traded, or the NYSE, whichever is earlier. The value is then converted into its U.S. dollar equivalent at the foreign exchange rate in effect at the close of the NYSE on the day that the value of the security is determined. Over-the-counter securities are valued within the range of the most recent quoted bid and ask prices. Securities that trade in multiple markets or on multiple exchanges are valued according to the broadest and most representative market. Certain equity securities are valued based upon fundamental characteristics or relationships to similar securities. Investments in non-registered money market funds are valued at the closing net asset value
Debt securities generally trade in the over-the-counter market rather than on a securities exchange. The Fund’s pricing services use multiple valuation techniques to determine fair value. In instances where sufficient market activity exists, the pricing services may utilize a market-based approach through which quotes from market makers are used to determine fair value. In instances where sufficient market activity may not exist or is limited, the pricing services also utilize proprietary valuation models which may consider market characteristics such as benchmark yield curves, option-adjusted spreads, credit spreads, estimated default rates, coupon rates, anticipated timing of principal repayments, underlying collateral, and other unique security features in order to estimate the relevant cash flows, which are then discounted to calculate the fair value. Securities denominated in a foreign currency are converted into their U.S. dollar equivalent at the foreign exchange rate in effect at the close of the NYSE on the date that the values of the foreign debt securities are determined.
Certain derivatives trade in the over-the-counter market. The Fund’s pricing services use various techniques including industry standard option pricing models and proprietary discounted cash flow models to determine the fair value of those instruments. The Fund’s net benefit or obligation under the derivative contract, as measured by the fair market value of the contract, is included in net assets.
The Fund has procedures to determine the fair value of securities and other financial instruments for which market prices are not readily available or which may not be reliably priced. Under these procedures, the Fund primarily employs a market-based approach which may use related or comparable assets or liabilities, recent transactions, market multiples, book values, and other relevant information for the investment to determine the fair value of the investment. The Fund may also use an income-based valuation approach in which the anticipated future cash flows of the investment are discounted to calculate fair value. Discounts may also be applied due to the nature or duration of any restrictions on the disposition of the investments. Due to the inherent uncertainty of valuations of such investments, the fair values may differ significantly from the values that would have been used had an active market existed.
MGD-25
Franklin Templeton Variable Insurance Products Trust
Notes to Financial Statements (continued)
Mutual Global Discovery Securities Fund
1. ORGANIZATION AND SIGNIFICANT ACCOUNTING POLICIES (continued)
a. Financial Instrument Valuation (continued)
Trading in securities on foreign securities stock exchanges and over-the-counter markets may be completed before the daily close of business on the NYSE. Occasionally, events occur between the time at which trading in a foreign security is completed and the close of the NYSE that might call into question the reliability of the value of a portfolio security held by the Fund. As a result, differences may arise between the value of the Fund’s portfolio securities as determined at the foreign market close and the latest indications of value at the close of the NYSE. In order to minimize the potential for these differences, the investment manager monitors price movements following the close of trading in foreign stock markets through a series of country specific market proxies (such as baskets of American Depository Receipts, futures contracts and exchange traded funds). These price movements are measured against established trigger thresholds for each specific market proxy to assist in determining if an event has occurred that may call into question the reliability of the values of the foreign securities held by the Fund. If such an event occurs, the securities may be valued using fair value procedures, which may include the use of independent pricing services.
b. Foreign Currency Translation
Portfolio securities and other assets and liabilities denominated in foreign currencies are translated into U.S. dollars based on the exchange rate of such currencies against U.S. dollars on the date of valuation. The Fund may enter into foreign currency exchange contracts to facilitate transactions denominated in a foreign currency. Purchases and sales of securities, income and expense items denominated in foreign currencies are translated into U.S. dollars at the exchange rate in effect on the transaction date. Portfolio securities and assets and liabilities denominated in foreign currencies contain risks that those currencies will decline in value relative to the U.S. dollar. Occasionally, events may impact the availability or reliability of foreign exchange rates used to convert the U.S. dollar equivalent value. If such an event occurs, the foreign exchange rate will be valued at fair value using procedures established and approved by the Trust’s Board of Trustees.
The Fund does not separately report the effect of changes in foreign exchange rates from changes in market prices on securities held. Such changes are included in net realized and unrealized gain or loss from investments on the Statement of Operations.
Realized foreign exchange gains or losses arise from sales of foreign currencies, currency gains or losses realized between the trade and settlement dates on securities transactions and the difference between the recorded amounts of dividends, interest, and foreign withholding taxes and the U.S. dollar equivalent of the amounts actually received or paid. Net unrealized foreign exchange gains and losses arise from changes in foreign exchange rates on foreign denominated assets and liabilities other than investments in securities held at the end of the reporting period.
c. Derivative Financial Instruments
The Fund invested in derivatives in order to manage risk or gain exposure to various other investments or markets. Derivatives are financial contracts based on an underlying or notional amount, require no initial investment or an initial net investment that is smaller than would normally be required to have a similar response to changes in market factors, and require or permit net settlement. Derivatives contain various risks including the potential inability of the counterparty to fulfill their obligations under the terms of the contract, the potential for an illiquid secondary market, and/or the potential for market movements which expose the Fund to gains or losses in excess of the amounts shown on the Statement of Assets and Liabilities. Realized gain and loss and unrealized appreciation and depreciation on these contracts for the period are included in the Statement of Operations.
The Fund entered into forward exchange contracts primarily to manage exposure to certain foreign currencies. A forward exchange contract is an agreement between the Fund and a counterparty to buy or sell a foreign currency for a specific exchange rate on a future date. Pursuant to the terms of the forward exchange contracts, cash or securities may be required to be deposited as collateral. Unrestricted cash may be invested according to the Fund’s investment objectives.
MGD-26
Franklin Templeton Variable Insurance Products Trust
Notes to Financial Statements (continued)
Mutual Global Discovery Securities Fund
1. ORGANIZATION AND SIGNIFICANT ACCOUNTING POLICIES (continued)
c. Derivative Financial Instruments (continued)
The Fund purchased or wrote option contracts primarily to manage and/or gain exposure to equity price risk. An option is a contract entitling the holder to purchase or sell a specific amount of shares or units of a particular security, currency or index, or notional amount of a swap (swaption), at a specified price. Options purchased are recorded as an asset while options written are recorded as a liability. Upon exercise of an option, the acquisition cost or sales proceeds of the security is adjusted by any premium paid or received. Upon expiration of an option, any premium paid or received is recorded as a realized loss or gain. Upon closing an option other than through expiration or exercise, the difference between the premium and the cost to close the position is recorded as a realized gain or loss.
See Note 11 regarding other derivative information.
d. Securities Sold Short
The Fund is engaged in selling securities short, which obligates the fund to replace a borrowed security with the same security at current market value. The fund incurs a loss if the price of the security increases between the date of the short sale and the date on which the fund replaces the borrowed security. The fund realizes a gain if the price of the security declines between those dates. Gains are limited to the price at which the fund sold the security short, while losses are potentially unlimited in size.
The fund is required to establish a margin account with the broker lending the security sold short. While the short sale is outstanding, the broker retains the proceeds of the short sale and the fund must maintain a deposit with broker consisting of cash and/or securities having a value equal to a specified percentage of the value of the securities sold short. The fund is obligated to pay stock loan fees for borrowing the securities sold short and is required to pay the counterparty any dividends or interest due on securities sold short. Such dividends or interest and any stock loan fees are recorded as an expense to the fund.
e. Securities Lending
The Fund participates in an agency based security lending program. The fund receives cash collateral against the loaned securities in an amount equal to at least 102% of the market value of the loaned securities. Collateral is maintained over the life of the loan in an amount not less than 100% of the market value of loaned securities, as determined at the close of fund business each day; any additional collateral required due to changes in security values is delivered to the fund on the next business day. The collateral is invested in a non-registered money fund managed by the fund’s custodian on the fund’s behalf. The fund receives income from the investment of cash collateral, in addition to lending fees and rebates paid by the borrower. The fund bears the market risk with respect to the collateral investment, securities loaned, and the risk that the agent may default on its obligations to the fund. The securities lending agent has agreed to indemnify the fund in the event of default by a third party borrower. At December 31, 2010, the Fund had no securities on loan.
f. Income and Deferred Taxes
It is the Fund’s policy to qualify as a regulated investment company under the Internal Revenue Code. The Fund intends to distribute to shareholders substantially all of its taxable income and net realized gains to relieve it from federal income and excise taxes. As a result, no provision for U.S. federal income taxes is required. The Fund files U.S. income tax returns as well as tax returns in certain other jurisdictions. The Fund’s application of those tax rules is subject to its understanding. The Fund records a provision for taxes in its financial statements including penalties and interest, if any, for a tax position taken on a tax return (or expected to be taken) when it fails to meet the more likely than not (a greater than 50% probability) threshold and based on the technical merits, the tax position may not be sustained upon examination by the tax authorities. As of December 31, 2010, and for all open tax years, the Fund has determined that no provision for income tax is required in the Fund’s financial statements. Open tax years are those that remain subject to examination and are based on each tax jurisdiction statute of limitation. The
MGD-27
Franklin Templeton Variable Insurance Products Trust
Notes to Financial Statements (continued)
Mutual Global Discovery Securities Fund
1. ORGANIZATION AND SIGNIFICANT ACCOUNTING POLICIES (continued)
Fund is not aware of any tax position for which it is reasonably possible that the total amounts of unrecognized tax effects will significantly change in the next twelve months.
The Fund may be subject to foreign taxation related to income received, capital gains on the sale of securities and certain foreign currency transactions in the foreign jurisdictions in which it invests. Foreign taxes, if any, are recorded based on the tax regulations and rates that exist in the foreign markets in which the Fund invests. When a capital gain tax is determined to apply the Fund records an estimated deferred tax liability for net unrealized gains on these securities in an amount that would be payable if the securities were disposed of on the valuation date.
g. Security Transactions, Investment Income, Expenses and Distributions
Security transactions are accounted for on trade date. Realized gains and losses on security transactions are determined on a specific identification basis. Interest income and estimated expenses are accrued daily. Amortization of premium and accretion of discount on debt securities are included in interest income. Facility fees are recognized as income over the expected term of the loan. Dividend income and dividends declared on securities sold short are recorded on the ex-dividend date except that certain dividends from foreign securities are recognized as soon as the Fund is notified of the ex-dividend date. Distributions to shareholders are recorded on the ex-dividend date and are determined according to income tax regulations (tax basis). Distributable earnings determined on a tax basis may differ from earnings recorded in accordance with accounting principles generally accepted in the United States of America. These differences may be permanent or temporary. Permanent differences are reclassified among capital accounts to reflect their tax character. These reclassifications have no impact on net assets or the results of operations. Temporary differences are not reclassified, as they may reverse in subsequent periods.
Common expenses incurred by the Trust are allocated among the funds based on the ratio of net assets of each fund to the combined net assets of the Trust. Fund specific expenses are charged directly to the fund that incurred the expense.
Realized and unrealized gains and losses and net investment income, not including class specific expenses, are allocated daily to each class of shares based upon the relative proportion of net assets of each class. Differences in per share distributions, by class, are generally due to differences in class specific expenses.
h. Accounting Estimates
The preparation of financial statements in accordance with accounting principles generally accepted in the United States of America requires management to make estimates and assumptions that affect the reported amounts of assets and liabilities at the date of the financial statements and the amounts of income and expenses during the reporting period. Actual results could differ from those estimates.
i. Guarantees and Indemnifications
Under the Trust’s organizational documents, its officers and trustees are indemnified by the Trust against certain liabilities arising out of the performance of their duties to the Trust. Additionally, in the normal course of business, the Trust, on behalf of the Fund, enters into contracts with service providers that contain general indemnification clauses. The Trust’s maximum exposure under these arrangements is unknown as this would involve future claims that may be made against the Trust that have not yet occurred. Currently, the Trust expects the risk of loss to be remote.
MGD-28
Franklin Templeton Variable Insurance Products Trust
Notes to Financial Statements (continued)
Mutual Global Discovery Securities Fund
2. SHARES OF BENEFICIAL INTEREST
At December 31, 2010, there were an unlimited number of shares authorized (without par value). Transactions in the Fund’s shares were as follows:
| | | | | | | | | | | | | | | | |
| | | Year Ended December 31, | |
| | | 2010 | | | 2009 | |
| Class 1 Shares: | | Shares | | | Amount | | | Shares | | | Amount | |
Shares sold | | | 105,161 | | | $ | 2,092,188 | | | | 81,769 | | | $ | 1,439,153 | |
Shares issued in reinvestment of distributions | | | 63,093 | | | | 1,245,461 | | | | 186,941 | | | | 3,344,377 | |
Shares redeemed | | | (722,443 | ) | | | (14,295,123 | ) | | | (780,395 | ) | | | (13,231,866 | ) |
| | | | |
Net increase (decrease) | | | (554,189 | ) | | $ | (10,957,474 | ) | | | (511,685 | ) | | $ | (8,448,336 | ) |
| | | | |
Class 2 Shares: | | | | | | | | | | | | | | | | |
Shares sold | | | 3,059,169 | | | $ | 60,514,460 | | | | 4,897,346 | | | $ | 81,796,690 | |
Shares issued in reinvestment of distributions | | | 837,674 | | | | 16,267,624 | | | | 2,653,628 | | | | 46,677,309 | |
Shares redeemed | | | (8,564,469 | ) | | | (164,720,878 | ) | | | (8,181,894 | ) | | | (136,584,789 | ) |
| | | | |
Net increase (decrease) | | | (4,667,626 | ) | | $ | (87,938,794 | ) | | | (630,920 | ) | | $ | (8,110,790 | ) |
| | | | |
Class 4 Shares: | | | | | | | | | | | | | | | | |
Shares sold | | | 535,481 | | | $ | 10,579,920 | | | | 1,651,459 | | | $ | 28,116,459 | |
Shares issued on reinvestment of distributions | | | 41,618 | | | | 816,963 | | | | 111,006 | | | | 1,975,914 | |
Shares redeemed | | | (327,974 | ) | | | (6,431,731 | ) | | | (143,749 | ) | | | (2,555,239 | ) |
| | | | |
Net increase (decrease) | | | 249,125 | | | $ | 4,965,152 | | | | 1,618,716 | | | $ | 27,537,134 | |
| | | | |
3. TRANSACTIONS WITH AFFILIATES
Franklin Resources, Inc. is the holding company for various subsidiaries that together are referred to as Franklin Templeton Investments. Certain officers and trustees of the Fund are also officers and/or directors of the following subsidiaries:
| | |
| Subsidiary | | Affiliation |
Franklin Mutual Advisers, LLC (Franklin Mutual) | | Investment manager |
Franklin Templeton Services, LLC (FT Services) | | Administrative manager |
Franklin Templeton Distributors, Inc. (Distributors) | | Principal underwriter |
Franklin Templeton Investor Services, LLC (Investor Services) | | Transfer agent |
a. Management Fees
The Fund pays an investment management fee to Franklin Mutual based on the average daily net assets of the Fund as follows:
| | |
| Annualized Fee Rate | | Net Assets |
| 0.800% | | Up to and including $4 billion |
| 0.770% | | Over $4 billion, up to and including $7 billion |
| 0.750% | | Over $7 billion, up to and including $10 billion |
| 0.730% | | In excess of $10 billion |
MGD-29
Franklin Templeton Variable Insurance Products Trust
Notes to Financial Statements (continued)
Mutual Global Discovery Securities Fund
3. TRANSACTIONS WITH AFFILIATES (continued)
b. Administrative Fees
The Fund pays an administrative fee to FT Services based on the Fund’s average daily net assets as follows:
| | |
| Annualized Fee Rate | | Net Assets |
| 0.150% | | Up to and including $200 million |
| 0.135% | | Over $200 million, up to and including $700 million |
| 0.100% | | Over $700 million, up to and including $1.2 billion |
| 0.075% | | In excess of $1.2 billion |
c. Distribution Fees
The Trust’s Board of Trustees has adopted distribution plans for Class 2 and Class 4 shares pursuant to Rule 12b-1 under the 1940 Act. Under the Fund’s compensation distribution plans, the Fund pays Distributors for costs incurred in connection with the servicing, sale and distribution of the Fund’s shares up to 0.35% per year of its average daily net assets of each class. The Board of Trustees has agreed to limit the current rate to 0.25% per year for Class 2.
d. Transfer Agent Fees
Investor Services, under terms of an agreement, performs shareholder servicing for the Fund and is not paid by the Fund for the services.
4. EXPENSE OFFSET ARRANGEMENT
The Fund has entered into an arrangement with its custodian whereby credits realized as a result of uninvested cash balances are used to reduce a portion of the Fund’s custodian expenses. During the year ended December 31, 2010, the custodian fees were reduced as noted in the Statement of Operations.
5. INCOME TAXES
For tax purposes, capital losses may be carried over to offset future capital gains, if any. During the year ended December 31, 2010, the Fund utilized $48,214,723 of capital loss carryforwards.
The tax character of distributions paid during the years ended December 31, 2010 and 2009, was as follows:
| | | | | | | | |
| | | 2010 | | | 2009 | |
Distributions paid from ordinary income | | $ | 18,330,048 | | | $ | 51,997,601 | |
| | | | |
MGD-30
Franklin Templeton Variable Insurance Products Trust
Notes to Financial Statements (continued)
Mutual Global Discovery Securities Fund
5. INCOME TAXES (continued)
At December 31, 2010, the cost of investments, net unrealized appreciation (depreciation), and undistributed ordinary income for income tax purposes were as follows:
| | | | |
Cost of investments | | $ | 1,253,357,957 | |
| | | | |
| |
Unrealized appreciation | | $ | 277,677,518 | |
Unrealized depreciation | | | (48,590,076 | ) |
| | | | |
Net unrealized appreciation (depreciation) | | $ | 229,087,442 | |
| | | | |
Undistributed ordinary income | | $ | 26,640,117 | |
Undistributed long term capital gains | | | 28,197,903 | |
| | | | |
Distributable earnings | | $ | 54,838,020 | |
| | | | |
Net investment income differs for financial statement and tax purposes primarily due to differing treatments of defaulted securities, foreign currency transactions, passive foreign investment company shares, pass-through entity income, bond discounts and premiums, and certain corporate actions.
Net realized gains (losses) differ for financial statement and tax purposes primarily due to differing treatments of wash sales, foreign currency transactions, passive foreign investment company shares, foreign capital gains tax, pass-through entity income, payments-in-kind, bond discounts and premiums, tax straddles, and certain corporate actions.
6. INVESTMENT TRANSACTIONS
Purchases and sales of investments (excluding short term securities and securities sold short) for the year ended December 31, 2010, aggregated $674,171,698 and $636,462,794, respectively.
Transactions in options written during the year ended December 31, 2010, were as follows:
| | | | | | | | |
| | | Number of
Contracts | | | Premiums
Received | |
Options outstanding at December 31, 2009 | | | 1,451,300 | | | $ | 4,181,131 | |
Options written | | | — | | | | — | |
Options expired | | | — | | | | — | |
Options exercised | | | — | | | | — | |
Options closed | | | (1,451,300 | ) | | | (4,181,131 | ) |
| | | | |
Options outstanding at December 31, 2010 | | | — | | | $ | — | |
| | | | |
7. CREDIT RISK AND DEFAULTED SECURITIES
The Fund may purchase the pre-default or defaulted debt of distressed companies. Distressed companies are financially troubled and are about to be or are already involved in financial restructuring or bankruptcy. Risks associated with purchasing these securities include the possibility that the bankruptcy or other restructuring process takes longer than expected, or that distributions in restructuring are less than anticipated, either or both of which may result in unfavorable consequences to the Fund. If it becomes probable that the income on debt securities, including those of distressed companies, will not be collected, the Fund discontinues accruing income and recognizes an adjustment for uncollectible interest.
MGD-31
Franklin Templeton Variable Insurance Products Trust
Notes to Financial Statements (continued)
Mutual Global Discovery Securities Fund
7. CREDIT RISK AND DEFAULTED SECURITIES (continued)
At December 31, 2010, the aggregate value of distressed company securities for which interest recognition has been discontinued was $3,842,235, representing 0.26% of the Fund’s net assets. For information as to specific securities, see the accompanying Statement of Investments.
8. CONCENTRATION OF RISK
Investing in foreign securities may include certain risks and considerations not typically associated with investing in U.S. securities, such as fluctuating currency values and changing local and regional economic, political and social conditions, which may result in greater market volatility. In addition, certain foreign securities may not be as liquid as U.S. securities.
9. RESTRICTED SECURITIES
The Fund may invest in securities that are restricted under the Securities Act of 1933 (1933 Act) or which are subject to legal, contractual, or other agreed upon restrictions on resale. Restricted securities are often purchased in private placement transactions, and cannot be sold without prior registration unless the sale is pursuant to an exemption under the 1933 Act. Disposal of these securities may require greater effort and expense, and prompt sale at an acceptable price may be difficult. The Fund may have registration rights for restricted securities. The issuer generally incurs all registration costs.
At December 31, 2010, the Fund held investments in restricted securities, excluding certain securities exempt from registration under the 1933 Act deemed to be liquid, as follows:
| | | | | | | | | | | | | | | | |
Principal
Amount/
Shares | | | Issuer | | Acquisition
Dates | | | Cost | | | Value | |
| | 800,000 | | | The Bankshares Inc. | | | 3/22/07 | | | $ | 8,000,000 | | | $ | 2,905,224 | |
| | 1,443 | | | Broadband Ventures III LLC, secured promissory note, 5.00%, 2/01/12 | | | 7/01/10 | | | | 1,444 | | | | 1,443 | |
| | 2,431,677 | | | Cerberus CG Investor I LLC | | | 7/26/07 - 4/28/10 | | | | 2,424,273 | | | | 1,969,658 | |
| | 1,897,400 | | | Cerberus CG Investor I LLC, 12.00%, 7/31/14 | | | 7/26/07 | | | | 1,897,400 | | | | 1,536,894 | |
| | 2,431,640 | | | Cerberus CG Investor II LLC | | | 7/26/07 - 4/28/10 | | | | 2,424,236 | | | | 1,969,629 | |
| | 1,897,400 | | | Cerberus CG Investor II LLC, 12.00%, 7/31/14 | | | 7/26/07 | | | | 1,897,400 | | | | 1,536,894 | |
| | 1,215,984 | | | Cerberus CG Investor III LLC | | | 7/26/07 - 4/28/10 | | | | 1,212,282 | | | | 984,947 | |
| | 948,700 | | | Cerberus CG Investor III LLC, 12.00%, 7/31/14 | | | 7/26/07 | | | | 948,700 | | | | 768,447 | |
| | 1,903 | | | Elephant Capital Holdings Ltd. | | | 8/23/04 - 3/10/08 | | | | 294,226 | | | | — | |
| | 2,077,368 | | | FIM Coinvestor Holdings I LLC | | | 11/20/06 - 6/02/09 | | | | — | | | | — | |
| | 1,331 | | | Glodyne Technoserve Ltd. | | | 6/21/10 | | | | 20,970 | | | | 19,161 | |
| | 557,107 | | | Hightower Holding LLC, pfd., A, Series 2 | | | 6/10/10 | | | | 1,392,768 | | | | 1,158,855 | |
| | 47,271 | | | IACNA Investor LLC | | | 7/24/08 | | | | 17,613 | | | | 473 | |
| | 172,409 | | | Imagine Group Holdings Ltd. | | | 8/31/04 | | | | 1,765,727 | | | | 2,142,354 | |
| | 424,073 | | | International Automotive Components Group Brazil LLC | | | 4/13/06 - 12/26/08 | | | | 281,629 | | | | 750,244 | |
| | 3,000,220 | | | International Automotive Components Group North America LLC | | | 1/12/06 - 10/10/07 | | | | 3,599,443 | | | | 3,802,599 | |
| | 407,500 | | | International Automotive Components Group North America LLC 11.00%, 11/12/14 | | | 11/11/10 | | | | 407,500 | | | | 407,500 | |
| | 9,306 | | | NCB Warrant Holdings Ltd., A | | | 12/16/05 - 3/10/08 | | | | 87,597 | | | | — | |
| | 2,140 | | | Olympus Re Holdings Ltd. | | | 12/19/01 | | | | 202,484 | | | | 813 | |
| | 1,361,600 | | | Prime AET&D Holding No.1 Pty. Ltd. | | | 10/13/10 | | | | — | | | | — | |
| | | | | | | | | | | | | | | | |
| | | | Total Restricted Securities (1.32% of Net Assets) | | | | | | | | | | $ | 19,955,135 | |
| | | | | | | | | | | | | | | | |
MGD-32
Franklin Templeton Variable Insurance Products Trust
Notes to Financial Statements (continued)
Mutual Global Discovery Securities Fund
10. UNFUNDED CAPITAL COMMITMENTS
The Fund may enter into certain capital commitments and may be obligated to perform on such agreements at a future date. The Fund monitors these commitments and assesses the probability of required performance. For any agreements whose probability of performance is determined to be greater than remote, the Fund assesses the fair value of the commitment. In instances where the probability of performance is greater than remote and the performance under the commitment would result in an unrealized loss, the Fund recognizes such losses on the Statement of Assets and Liabilities and the Statement of Operations.
At December 31, 2010, the Fund had aggregate unfunded capital commitments of $4,124,480, for which no depreciation has been recognized.
11. OTHER DERIVATIVE INFORMATION
At December 31, 2010, the Fund has invested in derivative contracts which are reflected on the Statement of Assets and Liabilities as follows:
| | | | | | | | | | | | |
| | | Asset Derivatives | | | Liability Derivatives | |
Derivative Contracts Not Accounted for
as Hedging Instruments | | Statement of Assets and
Liabilities Location | | Fair
Value
Amount | | | Statement of Assets and
Liabilities Location | | Fair
Value
Amount | |
Foreign exchange contracts | | Unrealized appreciation on forward exchange contracts | | $ | 8,561,200 | | | Unrealized depreciation on forward exchange contracts | | $ | 13,699,033 | |
For the year ended December 31, 2010, the effect of derivative contracts on the Fund’s Statement of Operations was as follows:
| | | | | | | | | | | | | | |
Derivative Contracts Not Accounted for as
Hedging Instruments | | Statement of Operations Locations | | Realized Gain
(Loss) for the
Year | | | Change in
Unrealized
Appreciation
(Depreciation)
for the Year | | | Average
Amount
Outstanding
During the
Yeara | |
Foreign exchange contracts | | Net realized gain (loss) from foreign currency transactions / Net change in unrealized appreciation (depreciation) on translation of other assets and liabilities denominated in foreign currencies | | $ | 39,455,475 | | | $ | (21,240,735 | ) | | | 670,648,488 | |
Equity contracts | | Net realized gain (loss) from written options / Net change in unrealized appreciation (depreciation) on investments | | | (2,082,773 | ) | | | 1,566,133 | | | | 30,401 | |
aRepresents the average number of option contracts or notional amount for other derivative contracts outstanding during the year. For derivative contracts denominated in foreign currencies, notional amounts are converted into U.S. dollars.
See Note 1(c) regarding derivative financial instruments.
MGD-33
Franklin Templeton Variable Insurance Products Trust
Notes to Financial Statements (continued)
Mutual Global Discovery Securities Fund
12. HOLDINGS OF 5% VOTING SECURITIES OF PORTFOLIO COMPANIES
The 1940 Act defines “affiliated companies” to include investments in portfolio companies in which a fund owns 5% or more of the outstanding voting securities. Investments in “affiliated companies” for the Fund for the year ended December 31, 2010, were as shown below.
| | | | | | | | | | | | | | | | | | | | | | | | | | | | |
| Name of Issuer | | Number of Shares
Held at Beginning
of Year | | | Gross
Additions | | | Gross
Reductions | | | Number of Shares
Held at End of
Year | | | Value at
End
of Year | | | Investment
Income | | | Realized
Capital
Gain
(Loss) | |
Non-Controlled Affiliates | | | | | | | | | | | | | | | | | | | | | | | | | | | | |
The Bankshares Inc. (0.19% of Net Assets) | | | 800,000 | | | | — | | | | — | | | | 800,000 | | | $ | 2,905,224 | | | $ | — | | | $ | — | |
| | | | | | | | | | | | | | | | |
13. CREDIT FACILITY
The Fund, together with other U.S. registered and foreign investment funds (collectively “Borrowers”), managed by Franklin Templeton Investments, are borrowers in a joint syndicated senior unsecured credit facility totaling $750 million (Global Credit Facility) which matures on January 21, 2011. This Global Credit Facility provides a source of funds to the Borrowers for temporary and emergency purposes, including the ability to meet future unanticipated or unusually large redemption requests.
Under the terms of the Global Credit Facility, the Fund shall, in addition to interest charged on any borrowings made by the Fund and other costs incurred by the Fund, pay its share of fees and expenses incurred in connection with the implementation and maintenance of the Global Credit Facility, based upon its relative share of the aggregate net assets of all of the Borrowers, including an annual commitment fee of 0.10% based upon the unused portion of the Global Credit Facility, which is reflected in other expenses on the Statement of Operations. During the year ended December 31, 2010, the Fund did not use the Global Credit Facility.
Effective January 21, 2011, the Borrowers renewed the Global Credit Facility for a total of $750 million, maturing January 20, 2012.
14. FAIR VALUE MEASUREMENTS
The Fund follows a fair value hierarchy that distinguishes between market data obtained from independent sources (observable inputs) and the Fund’s own market assumptions (unobservable inputs). These inputs are used in determining the value of the Fund’s investments and are summarized in the following fair value hierarchy:
| | • | | Level 1 – quoted prices in active markets for identical securities |
| | • | | Level 2 – other significant observable inputs (including quoted prices for similar securities, interest rates, prepayment speed, credit risk, etc.) |
| | • | | Level 3 – significant unobservable inputs (including the Fund’s own assumptions in determining the fair value of investments) |
The inputs or methodology used for valuing securities are not an indication of the risk associated with investing in those securities.
For movements between the levels within the fair value hierarchy, the Fund has adopted a policy of recognizing the transfers as of the date of the underlying event which caused the movement.
MGD-34
Franklin Templeton Variable Insurance Products Trust
Notes to Financial Statements (continued)
Mutual Global Discovery Securities Fund
14. FAIR VALUE MEASUREMENTS (continued)
The following is a summary of the inputs used as of December 31, 2010, in valuing the Fund’s assets and liabilities carried at fair value:
| | | | | | | | | | | | | | | | |
| | | Level 1 | | | Level 2 | | | Level 3 | | | Total | |
| | | | |
Assets: | | | | | | | | | | | | | | | | |
Investments in Securities | | | | | | | | | | | | | | | | |
Equity Investments:a | | | | | | | | | | | | | | | | |
Auto Components | | $ | — | | | $ | — | | | $ | 4,555,503 | b | | $ | 4,555,503 | |
Commercial Banks | | | 82,548,874 | | | | — | | | | 2,905,224 | b | | | 85,454,098 | |
Consumer Finance | | | — | | | | — | | | | 4,924,234 | | | | 4,924,234 | |
Diversified Financial Services | | | 34,668,332 | | | | 6,097,280 | | | | 1,158,855 | b | | | 41,924,467 | |
Electric Utilities | | | 33,996,862 | | | | — | | | | 6,878,803 | b | | | 40,875,665 | |
Insurance | | | 47,081,015 | | | | — | | | | 2,143,167 | | | | 49,224,182 | |
IT Services | | | — | | | | — | | | | 19,161 | | | | 19,161 | |
Real Estate Management & Development | | | 10,855,260 | | | | — | | | | 2,112,892 | | | | 12,968,152 | |
Other Equity Investmentsc | | | 1,049,549,783 | | | | — | | | | — | b | | | 1,049,549,783 | |
Corporate Bonds, Notes and Senior Floating Rate Interests | | | — | | | | 52,324,327 | | | | 4,251,178 | | | | 56,575,505 | |
Companies in Liquidation | | | — | | | | 92,473 | | | | — | b | | | 92,473 | |
Short Term Investments | | | 116,956,624 | | | | 19,325,552 | | | | — | | | | 136,282,176 | |
| | | | |
Total Investments in Securities | | $ | 1,375,656,750 | | | $ | 77,839,632 | | | $ | 28,949,017 | | | $ | 1,482,445,399 | |
| | | | |
Forward Exchange Contracts | | | — | | | | 8,561,200 | | | | — | | | | 8,561,200 | |
Liabilities: | | | | | | | | | | | | | | | | |
Forward Exchange Contracts | | | — | | | | 13,699,033 | | | | — | | | | 13,699,033 | |
aIncludes common and preferred stock as well as other equity investments.
bIncludes securities determined to have no value at December 31, 2010.
CFor detailed industry descriptions, see the accompanying Statement of Investments.
At December 31, 2010, the reconciliation of assets in which significant unobservable inputs (Level 3) were used in determining fair value, is as follows:
| | | | | | | | | | | | | | | | | | | | | | | | | | | | |
| | | Balance at
Beginning
of Year | | | Net
Realized
Gain (Loss) | | | Net Change in
Unrealized
Appreciation
(Depreciation) | | | Net
Purchases
(Sales) | | | Transfer In
(Out of)
Level 3 | | | Balance at
End
of Year | | | Net Change in
Unrealized
Appreciation
(Depreciation) on
Assets Held at
Year End | |
| | | | |
Assets | | | | | | | | | | | | | | | | | | | | | | | | | | | | |
Equity Investments:a | | | | | | | | | | | | | | | | | | | | | | | | | | | | |
Airlines | | $ | — | | | $ | — | | | $ | 17,787 | | | $ | (17,787 | ) | | $ | — | | | $ | —b | | | $ | 17,787 | |
Auto Components | | | 2,205,235 | c | | | 1,469 | | | | 2,275,617 | | | | 73,182 | | | | — | | | | 4,555,503b | | | | 1,434,320 | |
Commercial Banks | | | 2,862,639 | c | | | — | | | | 42,585 | | | | — | | | | — | | | | 2,905,224b | | | | 42,585 | |
Computers & Peripherals | | | 36,049 | c | | | 34,448 | | | | (25,409 | ) | | | (45,088 | ) | | | — | | | | —b | | | | (5,842 | ) |
Consumer Finance | | | 1,756,873 | | | | (7,781,906 | ) | | | 10,613,056 | | | | 336,211 | | | | — | | | | 4,924,234 | | | | 3,114,543 | |
Diversified Financial Services | | | 3,888,000 | c | | | — | | | | (538,777 | ) | | | 4,473,088 | | | | (6,663,456 | ) | | | 1,158,855b | | | | (233,913 | ) |
Diversified Telecommunication Services | | | — | c | | | 2,008 | | | | 205 | | | | (2,213 | ) | | | — | | | | —b | | | | 205 | |
Electric Utilities | | | — | c | | | — | | | | (343,353 | ) | | | — | | | | 7,222,156 | | | | 6,878,803b | | | | (343,353 | ) |
Insurance | | | 2,583,639 | | | | 139,069 | | | | 249,152 | | | | (828,693 | ) | | | — | | | | 2,143,167 | | | | 284,985 | |
IT Services | | | — | | | | — | | | | (1,809 | ) | | | 20,970 | | | | — | | | | 19,161 | | | | (1,809 | ) |
Machinery | | | 1,346,452 | c | | | (3,120,594 | ) | | | 1,959,280 | | | | (185,138 | ) | | | — | | | | — | | | | — | |
Real Estate Management & Development | | | 985,974 | | | | — | | | | (320,824 | ) | | | 1,447,742 | | | | — | | | | 2,112,892 | | | | (320,824 | ) |
MGD-35
Franklin Templeton Variable Insurance Products Trust
Notes to Financial Statements (continued)
Mutual Global Discovery Securities Fund
14. FAIR VALUE MEASUREMENTS (continued)
| | | | | | | | | | | | | | | | | | | | | | | | | | | | |
| | | Balance at
Beginning
of Year | | | Net
Realized
Gain (Loss) | | | Net Change in
Unrealized
Appreciation
(Depreciation) | | | Net
Purchases
(Sales) | | | Transfer In
(Out of)
Level 3 | | | Balance at
End
of Year | | | Net Change in
Unrealized
Appreciation
(Depreciation) on
Assets Held at
Year End | |
Corporate Bonds, Notes and Senior Floating Rate Interests | | $ | 1,729,206 | | | $ | (116,175 | ) | | $ | 2,936,827 | | | $ | (298,680 | ) | | $ | — | | | $ | 4,251,178 | | | $ | 2,846,100 | |
Corporate Bonds and Notes in Reorganization | | | 15 | | | | (67 | ) | | | 75 | | | | (23 | ) | | | — | | | | — | | | | — | |
| | | | |
Total | | $ | 17,394,082 | | | $ | (10,841,748 | ) | | $ | 16,864,412 | | | $ | 4,973,571 | | | $ | 558,700 | | | $ | 28,949,017 | | | $ | 6,834,784 | |
| | | | |
aIncludes common and preferred stock as well as other equity investments.
bIncludes securities determined to have no value at December 31, 2010.
cIncludes securities determined to have no value at December 31, 2009.
15. SUBSEQUENT EVENTS
The Fund has evaluated subsequent events through the issuance of the financial statements and determined that no events have occurred that require disclosure other than those already disclosed in the financial statements.
| | | | |
ABBREVIATIONS | | | | |
| Counterparty | | Currency | | Selected Portfolio |
| | | | |
| BOFA - Bank of America N.A. | | CHF - Swiss Franc | | ADR - American Depository Receipt |
| BZWS - Barclays Bank PLC | | EUR - Euro | | FHLB - Federal Home Loan Bank |
| DBAB - Deutsche Bank AG | | USD - United States Dollar | | FRN - Floating Rate Note |
| HAND - Svenska Handelsbanken | | | | PC - Participation Certificate |
| SSBT - State Street Bank and Trust Co. | | | | |
MGD-36
Franklin Templeton Variable Insurance Products Trust
Mutual Global Discovery Securities Fund
Report of Independent Registered Public Accounting Firm
To the Board of Trustees and Shareholders of Franklin Templeton Variable Insurance Products Trust
In our opinion, the accompanying statement of assets and liabilities, including the statement of investments, and the related statements of operations and of changes in net assets and the financial highlights present fairly, in all material respects, the financial position of Mutual Global Discovery Securities Fund (the “Fund”) at December 31, 2010, the results of its operations for the year then ended, the changes in its net assets for each of the two years in the period then ended and the financial highlights for each of the periods presented, in conformity with accounting principles generally accepted in the United States of America. These financial statements and financial highlights (hereafter referred to as “financial statements”) are the responsibility of the Fund’s management. Our responsibility is to express an opinion on these financial statements based on our audits. We conducted our audits of these financial statements in accordance with the standards of the Public Company Accounting Oversight Board (United States). Those standards require that we plan and perform the audit to obtain reasonable assurance about whether the financial statements are free of material misstatement. An audit includes examining, on a test basis, evidence supporting the amounts and disclosures in the financial statements, assessing the accounting principles used and significant estimates made by management, and evaluating the overall financial statement presentation. We believe that our audits, which included confirmation of securities at December 31, 2010 by correspondence with the custodian and brokers, provide a reasonable basis for our opinion.
PricewaterhouseCoopers LLP
San Francisco, California
February 10, 2011
MGD-37
Franklin Templeton Variable Insurance Products Trust
Tax Designation (unaudited)
Mutual Global Discovery Securities Fund
Under Section 854(b)(2) of the Internal Revenue Code (Code), the Fund designates 58.88% of the ordinary income dividends as income qualifying for the dividends received deduction for the fiscal year ended December 31, 2010.
At December 31, 2009, more than 50% of the Fund’s total assets were invested in securities of foreign issuers. In most instances, foreign taxes were withheld from income paid to the Fund on these investments. As shown in the table below, the Fund designates to shareholders the foreign source income and foreign taxes paid, pursuant to Section 853 of the Code. This designation will allow shareholders of record on September 02, 2010, to treat their proportionate share of foreign taxes paid by the Fund as having been paid directly by them. The shareholder shall consider these amounts as foreign taxes paid in the tax year in which they receive the Fund distribution.
The following table provides a detailed analysis of foreign tax paid and foreign source income as designated by the Fund, to Class 1, Class 2, and Class 4 shareholders of record.
| | | | | | | | |
| Class | | Foreign
Tax Paid
Per Share | | | Foreign
Source Income
Per Share | |
Class 1 | | $ | 0.0263 | | | $ | 0.2195 | |
Class 2 | | $ | 0.0263 | | | $ | 0.1874 | |
Class 4 | | $ | 0.0263 | | | $ | 0.1877 | |
Foreign Tax Paid Per Share (Column 1) is the amount per share available to you, as a tax credit (assuming you held your shares in the Fund for a minimum of 16 days during the 31-day period beginning 15 days before the ex-dividend date of the Fund’s distribution to which the foreign taxes relate), or, as a tax deduction.
Foreign Source Income Per Share (Column 2) is the amount per share of income dividends attributable to foreign securities held by the Fund, plus any foreign taxes withheld on these dividends.
MGD-38
MUTUAL INTERNATIONAL SECURITIES FUND
We are pleased to bring you Mutual International Securities Fund’s annual report for the fiscal year ended December 31, 2010.
Performance Summary as of 12/31/10
Average annual total return of Class 4 shares* represents the average annual change in value, assuming reinvestment of dividends and capital gains. Average returns smooth out variations in returns, which can be significant; they are not the same as year-by-year results.
Periods ended 12/31/10
| | | | | | | | |
| | | 1-Year | | | Since Inception
(6/15/09) | |
Average Annual Total Return | | | +15.49% | | | | +26.01% | |
*The investment manager and administrator have contractually agreed to waive or assume certain expenses so that common expenses of the Fund (excluding Rule 12b-1 fees and acquired fund fees and other expenses) do not exceed 0.95% (other than certain nonroutine expenses) until 4/30/11. If the manager and administrator had not waived fees, the Fund’s total returns would have been lower.
Total Return Index Comparison
for a Hypothetical $10,000 Investment (6/15/09–12/31/10)
The graph below shows the change in value of a hypothetical $10,000 investment in the Fund over the indicated period and includes reinvestment of any income or distributions. The Fund’s performance* is compared to the performance of the Morgan Stanley Capital International (MSCI) Europe, Australasia, Far East (EAFE) Index Net Return (Local Currency). One cannot invest directly in an index, and an index is not representative of the Fund’s portfolio. Please see Important Notes to Performance Information preceding the Fund Summaries.
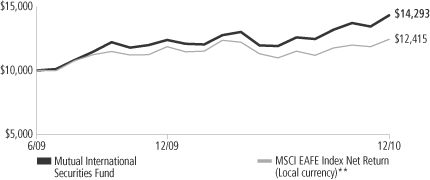
**Source: © 2011 Morningstar. Please see Index Descriptions following the Fund Summaries.
Mutual International Securities Fund – Class 4
Performance reflects the Fund’s Class 4 operating expenses, but does not include any contract fees, expenses or sales charges. If they had been included, performance would be lower. These charges and deductions, particularly for variable life policies, can have a significant effect on contract values and insurance benefits. See the contract prospectus for a complete description of these expenses, including sales charges.
Performance data represent past performance, which does not guarantee future results. Investment return and principal value will fluctuate, and you may have a gain or loss when you sell your shares.
Current performance may differ from figures shown.
MI-1
Fund Goals and Main Investments: Mutual International Securities Fund seeks capital appreciation, which may occasionally be short term, with income as a secondary goal. The Fund normally invests at least 80% of its net assets in securities of non-U.S. issuers and invests primarily in equity securities that the manager believes are undervalued. The Fund also invests, to a lesser extent, in risk arbitrage securities and distressed companies.
Performance Overview
You can find the Fund’s one-year total return in the Performance Summary. The Fund outperformed its benchmark, the MSCI EAFE Index Net Return (Local Currency), which posted a +4.82% total return for the same period.1
Economic and Market Overview
During the year under review, equities advanced against a backdrop of heightened volatility and uneven global economic recovery. Emerging market regions primarily led growth, as they were generally unconstrained by the debt overhang burdening western economies and benefited from strong intrinsic demand and significant capital inflows. Policymakers in these regions began raising interest rates toward period-end to combat inflation and speculative investment. Developed economies grew at a more subdued pace, with demand recovery and asset price reflation heavily underpinned by government-sponsored, liquidity-enhancing measures. The U.S. Federal Reserve Board (Fed), having already brought official interest rates close to zero, began directly purchasing government securities as part of an extreme policy measure known as quantitative easing. Further promoting the U.S. recovery, the traditionally pro-business Republican Party gained control of the House of Representatives in mid-term elections and President Obama extended Bush-era tax cuts. In Europe, ballooning fiscal deficits took their toll on peripheral nations and growing concerns of potential sovereign defaults significantly roiled equity markets on several occasions during the period. The European Central Bank responded by pledging 750 billion euros in the spring with the intent to forestall defaults, stabilize markets and restore confidence in the euro currency, followed by further backstops in the autumn as Ireland and the rest of the periphery came under renewed duress.
1. Source: © 2011 Morningstar. One cannot invest directly in an index, and an index is not representative of the Fund’s portfolio. Please see Index Descriptions following the Fund Summaries.
Fund Risks: The Fund’s investments in stocks may offer the potential for long-term gains but can be subject to short-term price fluctuations. Foreign investing, especially in emerging markets, involves additional risks, including currency fluctuations, economic instability, market volatility, and political and social instability. Investments in companies involved in mergers, liquidations, reorganizations and distressed bankruptcy, which may include defaulted debt, involve higher credit and other risks. Smaller and midsize company securities involve special risks, such as relatively small revenues, limited product lines and small market share. The Fund’s investment in certain hedging and derivative instruments may involve a small investment relative to the risk assumed. The manager applies various techniques and analyses in making investment decisions for the Fund, but there can be no guarantee that these decisions will produce the desired results. The Fund’s prospectus also includes a description of the main investment risks.
MI-2
The combination of intrinsic growth drivers in emerging markets and stimulus-induced support in the developed world encouraged the global economic recovery, and equity markets responded favorably. By the end of 2010, global equity markets recouped all losses suffered since Lehman Brothers Holdings’ 2008 bankruptcy. Commodities surged in the second half of 2010 due to near-term supply constraints and emerging market demand increases, as well as longer term fears that overly accommodative monetary policies would ultimately have negative inflationary consequences. The dollar strengthened relative to the euro, which bore the burden of the region’s fiscal crisis, but weakened against the yen, which hit multi-decade highs amid persistent deflationary pressures. Meanwhile, U.S. Treasuries and corporate bonds finished the year with gains, though Treasury prices declined considerably in the final quarter as Fed policies appeared to improve growth expectations. Although market conditions remained accommodative and corporate profitability improved, critical economic fundamentals such as employment, home prices and credit creation remained substantially depressed at period-end, leading many investors to question the true health of the global economy and the sustainability of the recovery.
Investment Strategy
At Mutual Series, we are committed to our distinctive value approach to investing. Our major investment strategy is investing in undervalued stocks in Asia and Europe. When selecting undervalued equities, we are attracted to fundamentally strong companies with healthy balance sheets, high-quality assets, substantial free cash flow and shareholder-oriented management teams and whose stocks are trading at discounts to our assessment of the companies’ intrinsic or business value. We also look for asset rich companies whose shares may be trading at depressed levels due to concerns over short-term earnings disappointments, litigation, management strategy or other perceived negatives. While the vast majority of our undervalued equity investments are made in publicly traded companies internationally, we may invest occasionally in privately held companies as well.
We complement this more traditional investment strategy with two others. One is distressed investing, which is complex and can take many forms. The most common distressed investment the Fund undertakes is the purchase of financially troubled or bankrupt companies’ debt at a substantial discount to face value. After the financially distressed company is reorganized, often in bankruptcy court, the old debt is typically replaced with new securities issued by the financially stronger company.
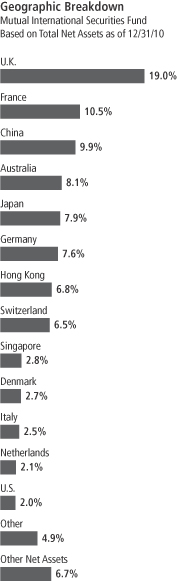
MI-3
The other piece of our investment strategy is participating in arbitrage situations, another highly specialized field. When companies announce proposed mergers or takeovers, commonly referred to as “deals,” the target company may trade at a discount to the bid it ultimately accepts. One form of arbitrage involves purchasing the target company’s stock when it is trading below the value we believe it would receive in a deal. In keeping with our commitment to a relatively conservative investment approach, we typically focus our arbitrage efforts on announced deals, and eschew rumored deals or other situations we consider relatively risky.
In addition, it is our practice to hedge the Fund’s currency exposure when we deem it advantageous for our shareholders.
Manager’s Discussion
During the year under review, Fund performance benefited from several investments. Three of the largest contributors during the period were Wheelock Properties (sold by period-end), a Hong Kong-based real estate developer; German automaker Volkswagen; and Boart Longyear Group, an Australian manufacturer of drilling equipment and parts that is also the largest provider of contract drilling services to mining companies.
Wheelock Properties is a Hong Kong-listed holding company that previously sat in a complicated structure between Wheelock & Co. and various operating companies such as Wharf Holdings, Hong Kong’s largest retail mall operator. Wheelock Properties’ corporate entity served little purpose within the overall corporate structure, and it traded at a significant discount to the net asset value of its holdings. Wheelock Properties was taken over during 2010 by its parent company at an almost 144% premium to its trading price.
We bought Volkswagen’s stock in 2010 when it offered what we believed was an attractive combination of historically below-average valuation, a solid balance sheet combined with conservative accounting policies that understated the group’s industrial cash flows and earnings, and a strong global presence. The company is Europe’s largest automotive group and has market share not only in Europe but also in North America, South America and China. During the year, Volkswagen announced its intention to merge its operations with those of Porsche. We feel this is a synergistic move that, if finalized, may enhance the company’s sales and profit development.
Top 10 Sectors/Industries
Mutual International Securities Fund
12/31/10
| | | | |
| | | % of Total
Net Assets | |
| Insurance | | | 14.1% | |
| Commercial Banks | | | 7.2% | |
| Media | | | 6.5% | |
| Food Products | | | 6.2% | |
| Food & Staples Retailing | | | 4.8% | |
| Diversified Financial Services | | | 3.9% | |
| Construction Materials | | | 3.4% | |
| Hotels, Restaurants & Leisure | | | 3.4% | |
| Wireless Telecommunication Services | | | 3.0% | |
| Capital Markets | | | 2.9% | |
MI-4
Investors sold Boart Longyear’s stock during the financial crisis largely because it had been overleveraged as it emerged from private equity ownership. Although earnings had plummeted during this phase, Boart was able to maintain a positive operating cash flow, and following a recapitalization, we saw an opportunity to buy what we believed was a global leader with depressed earnings. The stock started to rally in 2010 as customers, buoyed by better funding conditions and robust hard commodity prices, increased drilling activity during the year.
Despite the Fund’s positive performance in 2010, there were a few disappointments in the portfolio. Among the top detractors from the Fund’s returns during the year were VisionChina Media, which operates an advertising network that consists of more than 128,000 digital television displays, mainly on buses and subways, in 23 major Chinese cities; Hong Kong-based RCG Holdings, a developer of biometric and RFID (radio frequency identification) security and surveillance products for commercial and personal use; and CRH, an Irish manufacturer and distributor of building materials sold throughout western Europe and North America.
VisionChina Media lost value in 2010 mainly as a result of poorly executed acquisitions. We still liked VisionChina at year-end as the company appeared to us well positioned as a major outdoor advertiser with dominant positions in Beijing and Shanghai transit digital media. Although the stock was a detractor for the year under review, it partially recovered toward year-end.
Although RCG’s sales appear to have held up well through the financial crisis, the company was hindered by its poor cash collection processes. Working capital needs swelled as RCG distributors increasingly relied on the company’s credit. In response, the company recently installed leadership that started to more tightly manage its cash collections. With the company trading at approximately 1.5 times its 2010 consensus earnings near at year-end, we believed there could be significant upside potential if RCG were successful in improving its cash management strategy.
CRH was unable to effectively deploy into acquisitions the capital it had raised in March 2009. Management also lowered the company’s earnings guidance twice in quick succession, further undermining management’s credibility with investors. This erosion of confidence resulted in a significant stock price decline. Toward the end of 2010, CRH management hosted an analyst day where the company clearly
Top 10 Holdings
Mutual International Securities Fund 12/31/10
| | | | |
Company
Sector/Industry,
Country | | % of Total
Net Assets | |
| China Fishery Group Ltd. | | | 2.4% | |
| Food Products, China | | | | |
| Resolution Ltd. | | | 2.3% | |
| Insurance, U.K. | | | | |
| Tower Australia Group Ltd. | | | 2.1% | |
| Insurance, Australia | | | | |
| Aozora Bank Ltd. | | | 1.9% | |
| Commercial Banks, Japan | | | | |
| Vodafone Group PLC | | | 1.8% | |
| Wireless Telecommunication Services, U.K. | | | | |
| F&C Asset Management PLC | | | 1.7% | |
| Capital Markets, U.K. | | | | |
| Seven Group Holdings Ltd. | | | 1.7% | |
| Trading Companies & Distributors, Australia | | | | |
| British American Tobacco PLC | | | 1.7% | |
| Tobacco, U.K. | | | | |
| Nestle SA | | | 1.7% | |
| Food Products, Switzerland | | | | |
| REXLot Holdings Ltd. | | | 1.7% | |
| Hotels, Restaurants & Leisure, Bermuda | | | | |
The dollar value, number of shares or principal amount and names of all portfolio holdings are listed in the Fund’s Statement of Investments.
MI-5
articulated its future strategy, highlighted upcoming acquisition opportunities, showcased the breadth and depth of its management bench, and fully explained the reason for the guidance shortfall. We continued to hold CRH at period-end.
Finally, investors should note that we maintained our currency hedging posture of being more hedged than not to the U.S. dollar, largely through the use of forward currency exchange contracts. Certain currencies weakened in relation to the U.S. dollar in 2010, and our hedging strategy aided Fund performance during the year.
Thank you for your continued participation in Mutual International Securities Fund. We look forward to serving your future investment needs.
The foregoing information reflects our analysis, opinions and portfolio holdings as of December 31, 2010, the end of the reporting period. The way we implement our main investment strategies and the resulting portfolio holdings may change depending on factors such as market and economic conditions. These opinions may not be relied upon as investment advice or an offer for a particular security. The information is not a complete analysis of every aspect of any market, country, industry, security or the Fund. Statements of fact are from sources considered reliable, but the investment manager makes no representation or warranty as to their completeness or accuracy. Although historical performance is no guarantee of future results, these insights may help you understand our investment management philosophy.
MI-6
Fund Expenses
As an investor in a variable insurance contract (Contract) that indirectly provides for investment in an underlying mutual fund, you can incur transaction and/or ongoing expenses at both the Fund level and the Contract level.
| • | | Transaction expenses can include sales charges (loads) on purchases, redemption fees, surrender fees, transfer fees and premium taxes. |
| • | | Ongoing expenses can include management fees, distribution and service (12b-1) fees, contract fees, annual maintenance fees, mortality and expense risk fees and other fees and expenses. All mutual funds and Contracts have some types of ongoing expenses. |
The expenses shown in the table are meant to highlight ongoing expenses at the Fund level only and do not include ongoing expenses at the Contract level, or transaction expenses at either the Fund or Contract level. While the Fund does not have transaction expenses, if the transaction and ongoing expenses at the Contract level were included, the expenses shown below would be higher. You should consult your Contract prospectus or disclosure document for more information.
The table shows Fund-level ongoing expenses and can help you understand these expenses and compare them with those of other mutual funds offered through the Contract. The table assumes a $1,000 investment held for the six months indicated. Please refer to the Fund prospectus for additional information on operating expenses.
Actual Fund Expenses
The first line (Actual) of the table provides actual account values and expenses. The “Ending Account Value” is derived from the Fund’s actual return, which includes the effect of ongoing Fund expenses, but does not include the effect of ongoing Contract expenses.
You can estimate the Fund-level expenses you incurred during the period by following these steps. Of course, your account value and expenses will differ from those in this illustration:
| 1. | Divide your account value by $1,000. |
If an account had an $8,600 value, then $8,600 ÷ $1,000 = 8.6.
| 2. | Multiply the result by the number under the heading “Fund-Level Expenses Incurred During Period.” |
If Fund-Level Expenses Incurred During Period were $7.50, then
8.6 x $7.50 = $64.50.
In this illustration, the estimated expenses incurred this period at the Fund level are $64.50.
Mutual International Securities Fund – Class 4
MI-7
Hypothetical Example for Comparison with Other Mutual Funds
Information in the second line (Hypothetical) of the table can help you compare ongoing expenses of the Fund with those of other mutual funds offered through the Contract. This information may not be used to estimate the actual ending account balance or expenses you incurred during the period. The hypothetical “Ending Account Value” is based on the Fund’s actual expense ratio and an assumed 5% annual rate of return before expenses, which does not represent the Fund’s actual return. The figure under the heading “Fund-Level Expenses Incurred During Period” shows the hypothetical expenses your account would have incurred under this scenario. You can compare this figure with the 5% hypothetical examples that appear in shareholder reports of other funds offered through a Contract.
| | | | | | | | | | | | |
| Class 4 | | Beginning
Account Value 7/1/10 | | | Ending
Account Value 12/31/10 | | | Fund-Level Expenses Incurred
During Period* 7/1/10–12/31/10 | |
Actual | | $ | 1,000 | | | $ | 1,201.70 | | | $ | 7.21 | |
Hypothetical (5% return before expenses) | | $ | 1,000 | | | $ | 1,018.65 | | | $ | 6.61 | |
*Expenses are calculated using the most recent six-month annualized expense ratio, net of expense waivers, for the Fund’s Class 4 shares (1.30%), which does not include any ongoing expenses of the Contract for which the Fund is an investment option, multiplied by the average account value over the period, multiplied by 184/365 to reflect the one-half year period.
MI-8
Franklin Templeton Variable Insurance Products Trust
Financial Highlights
Mutual International Securities Fund
| | | | | | | | |
| | | Year Ended December 31, | |
| Class 2 | | 2010 | | | 2009a | |
| | | | |
Per share operating performance | | | | | | | | |
(for a share outstanding throughout the year) | | | | | | | | |
Net asset value, beginning of year | | $ | 11.82 | | | $ | 10.00 | |
| | | | |
Income from investment operationsb: | | | | | | | | |
Net investment incomec | | | 0.25 | | | | 0.08 | |
Net realized and unrealized gains (losses) | | | 1.51 | | | | 2.30 | |
| | | | |
Total from investment operations | | | 1.76 | | | | 2.38 | |
| | | | |
Less distributions from: | | | | | | | | |
Net investment income | | | (0.67 | ) | | | (0.13 | ) |
Net realized gains | | | (0.87 | ) | | | (0.43 | ) |
| | | | |
Total distributions | | | (1.54 | ) | | | (0.56 | ) |
| | | | |
Net asset value, end of year | | $ | 12.04 | | | $ | 11.82 | |
| | | | |
| | |
Total returnd | | | 15.49% | | | | 23.91% | |
Ratios to average net assetse | | | | | | | | |
Expenses before waiver and payments by affiliatesf | | | 4.97% | | | | 8.61% | g |
Expenses net of waiver and payments by affiliatesf | | | 1.20% | | | | 1.21% | g |
Expenses incurred in connection with securities sold short | | | — | | | | 0.01% | |
Net investment income | | | 2.07% | | | | 1.27% | |
| | |
Supplemental data | | | | | | | | |
Net assets, end of year (000’s) | | $ | 1,204 | | | $ | 1,182 | |
Portfolio turnover rate | | | 41.11% | | | | 41.84% | |
aFor the period June 15, 2009 (commencement of operations) to December 31, 2009.
bThe amount shown for a share outstanding throughout the period may not correlate with the Statement of Operations for the period due to the timing of sales and repurchases of the Fund shares in relation to income earned and/or fluctuating market value of the investments of the Fund.
cBased on average daily shares outstanding.
dTotal return does not include fees, charges or expenses imposed by the variable annuity and life insurance contracts for which the Franklin Templeton Variable Insurance Products Trust serves as an underlying investment vehicle. Total return is not annualized for periods less than one year.
eRatios are annualized for periods less than one year.
fBenefit of expense reduction rounds to less than 0.01%.
gIncludes dividend expense on securities sold short and stock loan fees, if any. See below for the ratios of such expenses to average net assets for the periods presented. See Note 1(d).
The accompanying notes are an integral part of these financial statements.
MI-9
Franklin Templeton Variable Insurance Products Trust
Financial Highlights (continued)
Mutual International Securities Fund
| | | | | | | | |
| | | Year Ended December 31, | |
| Class 4 | | 2010 | | | 2009a | |
| | | | |
Per share operating performance | | | | | | | | |
(for a share outstanding throughout the year) | | | | | | | | |
Net asset value, beginning of year | | $ | 11.81 | | | $ | 10.00 | |
| | | | |
Income from investment operationsb: | | | | | | | | |
Net investment incomec | | | 0.24 | | | | 0.07 | |
Net realized and unrealized gains (losses) | | | 1.51 | | | | 2.29 | |
| | | | |
Total from investment operations | | | 1.75 | | | | 2.36 | |
| | | | |
Less distributions from: | | | | | | | | |
Net investment income | | | (0.65 | ) | | | (0.12 | ) |
Net realized gains | | | (0.87 | ) | | | (0.43 | ) |
| | | | |
Total distributions | | | (1.52 | ) | | | (0.55 | ) |
| | | | |
Net asset value, end of year | | $ | 12.04 | | | $ | 11.81 | |
| | | | |
| | |
Total returnd | | | 15.49% | | | | 23.76% | |
Ratios to average net assetse | | | | | | | | |
Expenses before waiver and payments by affiliatesf | | | 5.07% | | | | 8.71% | g |
Expenses net of waiver and payments by affiliatesf | | | 1.30% | | | | 1.31% | g |
Expenses incurred in connection with securities sold short | | | — | | | | 0.01% | |
Net investment income | | | 1.97% | | | | 1.17% | |
| | |
Supplemental data | | | | | | | | |
Net assets, end of year (000’s) | | $ | 1,204 | | | $ | 1,181 | |
Portfolio turnover rate | | | 41.11% | | | | 41.84% | |
aFor the period June 15, 2009 (commencement of operations) to December 31, 2009.
bThe amount shown for a share outstanding throughout the period may not correlate with the Statement of Operations for the period due to the timing of sales and repurchases of the Fund shares in relation to income earned and/or fluctuating market value of the investments of the Fund.
cBased on average daily shares outstanding.
dTotal return does not include fees, charges or expenses imposed by the variable annuity and life insurance contracts for which the Franklin Templeton Variable Insurance Products Trust serves as an underlying investment vehicle. Total return is not annualized for periods less than one year.
eRatios are annualized for periods less than one year.
fBenefit of expense reduction rounds to less than 0.01%.
gIncludes dividend expense on securities sold short and stock loan fees, if any. See below for the ratios of such expenses to average net assets for the periods presented. See Note 1(d).
The accompanying notes are an integral part of these financial statements.
MI-10
Franklin Templeton Variable Insurance Products Trust
Statement of Investments, December 31, 2010
| | | | | | | | | | | | |
| Mutual International Securities Fund | | Country | | | Shares | | | Value | |
Common Stocks 91.8% | | | | | | | | | | | | |
Air Freight & Logistics 1.8% | | | | | | | | | | | | |
Sinotrans Ltd., H | | | China | | | | 105,000 | | | $ | 28,775 | |
TNT NV | | | Netherlands | | | | 530 | | | | 14,003 | |
| | | | | | | | | | | | |
| | | | | | | | | | | 42,778 | |
| | | | | | | | | | | | |
Automobiles 1.1% | | | | | | | | | | | | |
aDaimler AG (EUR Traded) | | | Germany | | | | 392 | | | | 26,702 | |
| | | | | | | | | | | | |
Beverages 1.2% | | | | | | | | | | | | |
Carlsberg AS, B | | | Denmark | | | | 22 | | | | 2,205 | |
Pernod Ricard SA | | | France | | | | 275 | | | | 25,884 | |
| | | | | | | | | | | | |
| | | | | | | | | | | 28,089 | |
| | | | | | | | | | | | |
Biotechnology 0.2% | | | | | | | | | | | | |
aCrucell NV | | | Netherlands | | | | 121 | | | | 3,820 | |
| | | | | | | | | | | | |
Capital Markets 2.9% | | | | | | | | | | | | |
F&C Asset Management PLC | | | United Kingdom | | | | 32,070 | | | | 42,154 | |
aUBS AG (CHF Traded) | | | Switzerland | | | | 1,723 | | | | 28,317 | |
| | | | | | | | | | | | |
| | | | | | | | | | | 70,471 | |
| | | | | | | | | | | | |
Chemicals 1.0% | | | | | | | | | | | | |
Linde AG | | | Germany | | | | 163 | | | | 24,760 | |
| | | | | | | | | | | | |
Commercial Banks 7.2% | | | | | | | | | | | | |
Aozora Bank Ltd. | | | Japan | | | | 22,000 | | | | 45,531 | |
Barclays PLC | | | United Kingdom | | | | 6,651 | | | | 27,259 | |
BNP Paribas | | | France | | | | 371 | | | | 23,629 | |
aDanske Bank AS | | | Denmark | | | | 395 | | | | 10,137 | |
Intesa Sanpaolo SpA | | | Italy | | | | 4,543 | | | | 12,337 | |
Intesa Sanpaolo SpA, di Risp | | | Italy | | | | 3,977 | | | | 9,486 | |
aJyske Bank AS | | | Denmark | | | | 536 | | | | 24,914 | |
Societe Generale, A | | | France | | | | 374 | | | | 20,123 | |
| | | | | | | | | | | | |
| | | | | | | | | | | 173,416 | |
| | | | | | | | | | | | |
Construction & Engineering 1.5% | | | | | | | | | | | | |
Boart Longyear Group | | | Australia | | | | 7,955 | | | | 37,064 | |
| | | | | | | | | | | | |
Construction Materials 3.4% | | | | | | | | | | | | |
China Shanshui Cement Group | | | China | | | | 40,000 | | | | 28,562 | |
CRH PLC | | | Ireland | | | | 1,268 | | | | 26,292 | |
SA des Ciments Vicat | | | France | | | | 321 | | | | 26,839 | |
| | | | | | | | | | | | |
| | | | | | | | | | | 81,693 | |
| | | | | | | | | | | | |
Containers & Packaging 0.9% | | | | | | | | | | | | |
Rexam PLC | | | United Kingdom | | | | 4,198 | | | | 21,849 | |
| | | | | | | | | | | | |
Diversified Financial Services 3.9% | | | | | | | | | | | | |
Deutsche Boerse AG | | | Germany | | | | 388 | | | | 26,887 | |
First Pacific Co. Ltd. | | | Hong Kong | | | | 43,752 | | | | 39,403 | |
Guoco Group Ltd. | | | Hong Kong | | | | 2,000 | | | | 26,555 | |
| | | | | | | | | | | | |
| | | | | | | | | | | 92,845 | |
| | | | | | | | | | | | |
Diversified Telecommunication Services 2.4% | | | | | | | | | | | | |
Cable & Wireless Communication PLC | | | United Kingdom | | | | 16,660 | | | | 12,645 | |
Cable & Wireless Worldwide PLC | | | United Kingdom | | | | 16,660 | | | | 17,064 | |
Telefonica SA | | | Spain | | | | 1,213 | | | | 27,529 | |
| | | | | | | | | | | | |
| | | | | | | | | | | 57,238 | |
| | | | | | | | | | | | |
MI-11
Franklin Templeton Variable Insurance Products Trust
Statement of Investments, December 31, 2010 (continued)
| | | | | | | | | | | | |
| Mutual International Securities Fund | | Country | | | Shares | | | Value | |
Common Stocks (continued) | | | | | | | | | | | | |
Electric Utilities 2.5% | | | | | | | | | | | | |
E.ON AG | | | Germany | | | | 821 | | | $ | 25,113 | |
bPrime AET&D Holdings No. 1 Pty. Ltd. | | | Australia | | | | 6,987 | | | | — | |
cPrime Infrastructure Group | | | Australia | | | | 6,987 | | | | 35,298 | |
| | | | | | | | | | | | |
| | | | | | | | | | | 60,411 | |
| | | | | | | | | | | | |
Electrical Equipment 0.9% | | | | | | | | | | | | |
Alstom SA | | | France | | | | 424 | | | | 20,312 | |
| | | | | | | | | | | | |
Food & Staples Retailing 4.8% | | | | | | | | | | | | |
Carrefour SA | | | France | | | | 470 | | | | 19,397 | |
FamilyMart Co. Ltd. | | | Japan | | | | 825 | | | | 31,099 | |
Koninklijke Ahold NV | | | Netherlands | | | | 2,404 | | | | 31,761 | |
Lawson Inc. | | | Japan | | | | 656 | | | | 32,446 | |
| | | | | | | | | | | | |
| | | | | | | | | | | 114,703 | |
| | | | | | | | | | | | |
Food Products 6.2% | | | | | | | | | | | | |
China Fishery Group Ltd. | | | China | | | | 32,585 | | | | 56,890 | |
Kraft Foods Inc., A | | | United States | | | | 601 | | | | 18,937 | |
Nestle SA | | | Switzerland | | | | 707 | | | | 41,444 | |
People’s Food Holdings Ltd. | | | China | | | | 53,000 | | | | 31,602 | |
| | | | | | | | | | | | |
| | | | | | | | | | | 148,873 | |
| | | | | | | | | | | | |
Hotels, Restaurants & Leisure 3.4% | | | | | | | | | | | | |
Accor SA | | | France | | | | 523 | | | | 23,298 | |
Ladbrokes PLC | | | United Kingdom | | | | 8,306 | | | | 15,965 | |
REXLot Holdings Ltd. | | | Bermuda | | | | 390,918 | | | | 41,242 | |
| | | | | | | | | | | | |
| | | | | | | | | | | 80,505 | |
| | | | | | | | | | | | |
Household Durables 0.9% | | | | | | | | | | | | |
aBerkeley Group Holdings PLC | | | United Kingdom | | | | 1,624 | | | | 22,562 | |
| | | | | | | | | | | | |
Industrial Conglomerates 2.4% | | | | | | | | | | | | |
Jardine Matheson Holdings Ltd. | | | Hong Kong | | | | 473 | | | | 20,812 | |
Jardine Strategic Holdings Ltd. | | | Hong Kong | | | | 864 | | | | 23,915 | |
Shun Tak Holdings Ltd. | | | Hong Kong | | | | 22,000 | | | | 13,728 | |
| | | | | | | | | | | | |
| | | | | | | | | | | 58,455 | |
| | | | | | | | | | | | |
Insurance 14.1% | | | | | | | | | | | | |
ACE Ltd. | | | United States | | | | 460 | | | | 28,635 | |
Ageas | | | Belgium | | | | 9,870 | | | | 22,578 | |
AXA SA | | | France | | | | 1,713 | | | | 28,530 | |
Catlin Group Ltd. | | | United Kingdom | | | | 5,581 | | | | 32,182 | |
Hiscox Ltd. | | | United Kingdom | | | | 5,130 | | | | 30,406 | |
Lancashire Holdings Ltd. | | | United Kingdom | | | | 3,415 | | | | 29,410 | |
Resolution Ltd. | | | United Kingdom | | | | 15,461 | | | | 56,589 | |
RSA Insurance Group PLC | | | United Kingdom | | | | 12,020 | | | | 23,497 | |
Tower Australia Group Ltd. | | | Australia | | | | 12,529 | | | | 49,542 | |
Zurich Financial Services AG | | | Switzerland | | | | 145 | | | | 37,601 | |
| | | | | | | | | | | | |
| | | | | | | | | | | 338,970 | |
| | | | | | | | | | | | |
Machinery 1.1% | | | | | | | | | | | | |
Schindler Holding AG, PC | | | Switzerland | | �� | | 226 | | | | 26,762 | |
| | | | | | | | | | | | |
Marine 1.1% | | | | | | | | | | | | |
A.P. Moller - Maersk AS, B | | | Denmark | | | | 3 | | | | 27,194 | |
| | | | | | | | | | | | |
MI-12
Franklin Templeton Variable Insurance Products Trust
Statement of Investments, December 31, 2010 (continued)
| | | | | | | | | | | | |
| Mutual International Securities Fund | | Country | | | Shares | | | Value | |
Common Stocks (continued) | | | | | | | | | | | | |
Media 6.5% | | | | | | | | | | | | |
aAustar United Communications Ltd. | | | Australia | | | | 31,564 | | | $ | 30,799 | |
British Sky Broadcasting Group PLC | | | United Kingdom | | | | 1,135 | | | | 13,042 | |
Eutelsat Communications | | | France | | | | 453 | | | | 16,599 | |
Sinomedia Holding Ltd. | | | China | | | | 73,017 | | | | 26,022 | |
aStroer Out-of-Home Media AG | | | Germany | | | | 565 | | | | 19,939 | |
aVisionChina Media Inc., ADR | | | China | | | | 7,000 | | | | 32,480 | |
Vivendi SA | | | France | | | | 680 | | | | 18,375 | |
| | | | | | | | | | | | |
| | | | | | | | | | | 157,256 | |
| | | | | | | | | | | | |
Metals & Mining 1.0% | | | | | | | | | | | | |
ThyssenKrupp AG | | | Germany | | | | 568 | | | | 23,623 | |
| | | | | | | | | | | | |
Multi-Utilities 2.8% | | | | | | | | | | | | |
GDF Suez | | | France | | | | 828 | | | | 29,741 | |
Hera SpA | | | Italy | | | | 3,047 | | | | 6,314 | |
Iren SpA | | | Italy | | | | 19,322 | | | | 32,387 | |
| | | | | | | | | | | | |
| | | | | | | | | | | 68,442 | |
| | | | | | | | | | | | |
Oil, Gas & Consumable Fuels 1.2% | | | | | | | | | | | | |
BP PLC | | | United Kingdom | | | | 1,260 | | | | 9,162 | |
Royal Dutch Shell PLC, A | | | United Kingdom | | | | 605 | | | | 20,015 | |
| | | | | | | | | | | | |
| | | | | | | | | | | 29,177 | |
| | | | | | | | | | | | |
Pharmaceuticals 1.0% | | | | | | | | | | | | |
Novartis AG | | | Switzerland | | | | 386 | | | | 22,710 | |
| | | | | | | | | | | | |
Real Estate Investment Trusts (REITs) 1.2% | | | | | | | | | | | | |
The Link REIT | | | Hong Kong | | | | 9,500 | | | | 29,518 | |
| | | | | | | | | | | | |
Real Estate Management & Development 2.0% | | | | | | | | | | | | |
Parkway Life REIT | | | Singapore | | | | 30,000 | | | | 38,581 | |
Renhe Commercial Holdings Co. Ltd. | | | China | | | | 52,000 | | | | 9,032 | |
| | | | | | | | | | | | |
| | | | | | | | | | | 47,613 | |
| | | | | | | | | | | | |
Software 1.6% | | | | | | | | | | | | |
Nintendo Co. Ltd. | | | Japan | | | | 100 | | | | 29,357 | |
aRCG Holdings Ltd. | | | Hong Kong | | | | 22,000 | | | | 9,397 | |
| | | | | | | | | | | | |
| | | | | | | | | | | 38,754 | |
| | | | | | | | | | | | |
Tobacco 2.8% | | | | | | | | | | | | |
British American Tobacco PLC | | | United Kingdom | | | | 1,081 | | | | 41,564 | |
Japan Tobacco Inc. | | | Japan | | | | 7 | | | | 25,913 | |
| | | | | | | | | | | | |
| | | | | | | | | | | 67,477 | |
| | | | | | | | | | | | |
Trading Companies & Distributors 2.8% | | | | | | | | | | | | |
Mitsubishi Corp. | | | Japan | | | | 500 | | | | 13,539 | |
Mitsui & Co. Ltd. | | | Japan | | | | 800 | | | | 13,216 | |
Seven Group Holdings Ltd. | | | Australia | | | | 4,637 | | | | 41,693 | |
| | | | | | | | | | | | |
| | | | | | | | | | | 68,448 | |
| | | | | | | | | | | | |
Water Utilities 1.0% | | | | | | | | | | | | |
Guangdong Investment Ltd. | | | China | | | | 48,000 | | | | 24,949 | |
| | | | | | | | | | | | |
Wireless Telecommunication Services 3.0% | | | | | | | | | | | | |
M1 Ltd. | | | Singapore | | | | 16,000 | | | | 29,306 | |
Vodafone Group PLC | | | United Kingdom | | | | 16,796 | | | | 43,473 | |
| | | | | | | | | | | | |
| | | | | | | | | | | 72,779 | |
| | | | | | | | | | | | |
Total Common Stocks (Cost $1,843,863) | | | | | | | | | | | 2,210,218 | |
| | | | | | | | | | | | |
MI-13
Franklin Templeton Variable Insurance Products Trust
Statement of Investments, December 31, 2010 (continued)
| | | | | | | | | | | | |
| Mutual International Securities Fund | | Country | | | Shares | | | Value | |
Preferred Stocks 1.5% | | | | | | | | | | | | |
Automobiles 1.5% | | | | | | | | | | | | |
Porsche Automobile Holding SE, pfd. | | | Germany | | | | 265 | | | $ | 21,121 | |
Volkswagen AG, pfd. | | | Germany | | | | 91 | | | | 14,829 | |
| | | | | | | | | | | | |
Total Preferred Stocks (Cost $23,596) | | | | | | | | | | | 35,950 | |
| | | | | | | | | | | | |
Total Investments (Cost $1,867,459) 93.3% | | | | | | | | | | | 2,246,168 | |
Other Assets, less Liabilities 6.7% | | | | | | | | | | | 161,832 | |
| | | | | | | | | | | | |
Net Assets 100.0% | | | | | | | | | | $ | 2,408,000 | |
| | | | | | | | | | | | |
aNon-income producing.
bSee Note 8 regarding restricted securities.
cSecurity has been deemed illiquid because it may not be able to be sold within seven days. At December 31, 2010, the value of this security was $35,298, representing 1.47% of net assets.
MI-14
Franklin Templeton Variable Insurance Products Trust
Statement of Investments, December 31, 2010 (continued)
|
| Mutual International Securities Fund |
At December 31, 2010, the Fund had the following forward exchange contracts outstanding. See Note 1(c).
| | | | | | | | | | | | | | | | | | | | | | | | | | | | |
| Currency | | Counterparty | | | Type | | | Quantity | | | Contract
Amount | | | Settlement
Date | | | Unrealized
Appreciation | | | Unrealized
Depreciation | |
Euro | | | DBAB | | | | Sell | | | | 401,790 | | | $ | 525,461 | | | | 1/18/11 | | | $ | — | | | $ | (12,018 | ) |
Euro | | | SSBT | | | | Buy | | | | 33,250 | | | | 45,130 | | | | 1/18/11 | | | | — | | | | (650 | ) |
Euro | | | DBAB | | | | Sell | | | | 14,000 | | | | 19,561 | | | | 1/18/11 | | | | 833 | | | | — | |
Euro | | | SSBT | | | | Sell | | | | 5,000 | | | | 7,122 | | | | 1/18/11 | | | | 433 | | | | — | |
British Pound | | | DBAB | | | | Buy | | | | 7,000 | | | | 11,174 | | | | 2/14/11 | | | | — | | | | (257 | ) |
British Pound | | | SSBT | | | | Sell | | | | 222,881 | | | | 359,788 | | | | 2/14/11 | | | | 12,183 | | | | — | |
Japanese Yen | | | DBAB | | | | Sell | | | | 1,400,000 | | | | 16,896 | | | | 4/20/11 | | | | — | | | | (374 | ) |
Japanese Yen | | | DBAB | | | | Buy | | | | 61,100 | | | | 760 | | | | 4/20/11 | | | | — | | | | (6 | ) |
Japanese Yen | | | BZWS | | | | Sell | | | | 9,260,360 | | | | 114,246 | | | | 4/20/11 | | | | 23 | | | | — | |
Japanese Yen | | | DBAB | | | | Sell | | | | 280,000 | | | | 3,467 | | | | 4/20/11 | | | | 12 | | | | — | |
Swiss Franc | | | DBAB | | | | Sell | | | | 84,115 | | | | 87,247 | | | | 5/10/11 | | | | — | | | | (2,970 | ) |
Swiss Franc | | | SSBT | | | | Sell | | | | 52,629 | | | | 54,572 | | | | 5/10/11 | | | | — | | | | (1,875 | ) |
Swiss Franc | | | DBAB | | | | Buy | | | | 10,017 | | | | 10,466 | | | | 5/10/11 | | | | 278 | | | | — | |
| | | | | | | | | | | | | | | | | | | | | | | | |
Unrealized appreciation (depreciation) | | | | | | | | | | | | | | | | 13,762 | | | | (18,150 | ) |
| | | | | | | | | | | | | | | | | | | | | | | | |
Net unrealized appreciation (depreciation) | | | | | | | | | | | | | | | | | | | $ | (4,388 | ) |
| | | | | | | | | | | | | | | | | | | | | | | | | | | | |
See Abbreviations on page MI-27.
MI-15
Franklin Templeton Variable Insurance Products Trust
Financial Statements
Statement of Assets and Liabilities
December 31, 2010
| | | | |
| | | Mutual International
Securities Fund | |
Assets: | | | | |
Investments in securities: | | | | |
Cost | | $ | 1,867,459 | |
| | | | |
Value | | $ | 2,246,168 | |
Cash | | | 134,464 | |
Foreign currency, at value (cost $15,650) | | | 15,743 | |
Receivables: | | | | |
Dividends | | | 9,213 | |
Affiliates | | | 63,810 | |
Unrealized appreciation on forward exchange contracts | | | 13,762 | |
| | | | |
Total assets | | | 2,483,160 | |
| | | | |
Liabilities: | | | | |
Payables: | | | | |
Professional fees | | | 51,039 | |
Unrealized depreciation on forward exchange contracts | | | 18,150 | |
Accrued expenses and other liabilities | | | 5,971 | |
| | | | |
Total liabilities | | | 75,160 | |
| | | | |
Net assets, at value | | $ | 2,408,000 | |
| | | | |
Net assets consist of: | | | | |
Paid-in capital | | $ | 1,997,280 | |
Distributions in excess of net investment income | | | (40,655 | ) |
Net unrealized appreciation (depreciation) | | | 374,498 | |
Accumulated net realized gain (loss) | | | 76,877 | |
| | | | |
Net assets, at value | | $ | 2,408,000 | |
| | | | |
Class 2: | | | | |
Net assets, at value | | $ | 1,204,231 | |
| | | | |
Shares outstanding | | | 100,000 | |
| | | | |
Net asset value and maximum offering price per share | | $ | 12.04 | |
| | | | |
Class 4: | | | | |
Net assets, at value | | $ | 1,203,769 | |
| | | | |
Shares outstanding | | | 100,000 | |
| | | | |
Net asset value and maximum offering price per share | | $ | 12.04 | |
| | | | |
The accompanying notes are an integral part of these financial statements.
MI-16
Franklin Templeton Variable Insurance Products Trust
Financial Statements (continued)
Statement of Operations
for the year ended December 31, 2010
| | | | |
| | | Mutual International
Securities Fund | |
Investment income: | | | | |
Dividends (net of foreign taxes of $5,037) | | $ | 74,611 | |
Interest | | | 3,848 | |
| | | | |
Total investment income | | | 78,459 | |
| | | | |
Expenses: | | | | |
Management fees (Note 3a) | | | 19,175 | |
Administrative fees (Note 3b) | | | 5,992 | |
Distribution fees: (Note 3c) | | | | |
Class 2 | | | 2,996 | |
Class 4 | | | 4,192 | |
Custodian fees (Note 4) | | | 1,836 | |
Reports to shareholders | | | 8,565 | |
Registration and filing fees | | | 1,169 | |
Professional fees | | | 56,420 | |
Amortization of offering costs | | | 1,849 | |
Pricing fees | | | 17,038 | |
Other | | | 1,059 | |
| | | | |
Total expenses | | | 120,291 | |
Expense reductions (Note 4) | | | (9 | ) |
Expenses waived/paid by affiliates (Note 3e) | | | (90,222 | ) |
| | | | |
Net expenses | | | 30,060 | |
| | | | |
Net investment income | | | 48,399 | |
| | | | |
Realized and unrealized gains (losses): | | | | |
Net realized gain (loss) from: | | | | |
Investments | | | 201,206 | |
Foreign currency transactions | | | 51,627 | |
Securities sold short | | | (1,947 | ) |
| | | | |
Net realized gain (loss) | | | 250,886 | |
| | | | |
Net change in unrealized appreciation (depreciation) on: | | | | |
Investments | | | 93,710 | |
Translation of other assets and liabilities denominated in foreign currencies | | | (41,036 | ) |
| | | | |
Net change in unrealized appreciation (depreciation) | | | 52,674 | |
| | | | |
Net realized and unrealized gain (loss) | | | 303,560 | |
| | | | |
Net increase (decrease) in net assets resulting from operations | | $ | 351,959 | |
| | | | |
The accompanying notes are an integral part of these financial statements.
MI-17
Franklin Templeton Variable Insurance Products Trust
Financial Statements (continued)
Statements of Changes in Net Assets
| | | | | | | | |
| | | Mutual International
Securities Fund | |
| | | Year Ended December 31, | |
| | | 2010 | | | 2009a | |
| | | | |
Increase (decrease) in net assets: | | | | | | | | |
Operations: | | | | | | | | |
Net investment income | | $ | 48,399 | | | $ | 15,255 | |
Net realized gain (loss) from investments, foreign currency transactions and securities sold short | | | 250,886 | | | | 137,272 | |
Net change in unrealized appreciation (depreciation) on investments and translation of other assets and liabilities denominated in foreign currencies | | | 52,674 | | | | 321,824 | |
| | | | |
Net increase (decrease) in net assets resulting from operations | | | 351,959 | | | | 474,351 | |
| | | | |
Distributions to shareholders from: | | | | | | | | |
Net investment income: | | | | | | | | |
Class 2 | | | (66,680 | ) | | | (12,710 | ) |
Class 4 | | | (65,490 | ) | | | (12,330 | ) |
Net realized gains: | | | | | | | | |
Class 2 | | | (87,300 | ) | | | (43,250 | ) |
Class 4 | | | (87,300 | ) | | | (43,250 | ) |
| | | | |
Total distributions to shareholders | | | (306,770 | ) | | | (111,540 | ) |
| | | | |
Capital share transactions: (Note 2) | | | | | | | | |
Class 2 | | | — | | | | 1,000,000 | |
Class 4 | | | — | | | | 1,000,000 | |
| | | | |
Total capital share transactions | | | — | | | | 2,000,000 | |
| | | | |
Net increase (decrease) in net assets | | | 45,189 | | | | 2,362,811 | |
Net assets: | | | | | | | | |
Beginning of year | | | 2,362,811 | | | | — | |
| | | | |
End of year | | $ | 2,408,000 | | | $ | 2,362,811 | |
| | | | |
Distributions in excess of net investment income included in net assets: | | | | | | | | |
End of year | | $ | (40,655 | ) | | $ | (11,926 | ) |
| | | | |
aFor the period June 15, 2009 (commencement of operations) to December 31, 2009.
The accompanying notes are an integral part of these financial statements.
MI-18
Franklin Templeton Variable Insurance Products Trust
Notes to Financial Statements
Mutual International Securities Fund
1. ORGANIZATION AND SIGNIFICANT ACCOUNTING POLICIES
Franklin Templeton Variable Insurance Products Trust (Trust) is registered under the Investment Company Act of 1940, as amended, (1940 Act) as an open-end investment company, consisting of twenty separate funds. The Mutual International Securities Fund (Fund) is included in this report. The financial statements of the remaining funds in the Trust are presented separately. Shares of the Fund are generally sold only to insurance company separate accounts to fund the benefits of variable life insurance policies or variable annuity contracts. The Fund offers two classes of shares: Class 2 and Class 4. Each class of shares differs by its distribution fees, voting rights on matters affecting a single class and its exchange privilege.
The following summarizes the Fund’s significant accounting policies.
a. Financial Instrument Valuation
The Fund values its investments in securities and other assets and liabilities carried at fair value daily. Fair value is the price that would be received to sell an asset or paid to transfer a liability in an orderly transaction between market participants on the measurement date. Under procedures approved by the Trust’s Board of Trustees, the Fund may utilize independent pricing services, quotations from securities and financial instrument dealers, and other market sources to determine fair value.
Equity securities listed on an exchange or on the NASDAQ National Market System are valued at the last quoted sale price or the official closing price of the day, respectively. Foreign equity securities are valued as of the close of trading on the foreign stock exchange on which the security is primarily traded, or the NYSE, whichever is earlier. The value is then converted into its U.S. dollar equivalent at the foreign exchange rate in effect at the close of the NYSE on the day that the value of the security is determined. Over-the-counter securities are valued within the range of the most recent quoted bid and ask prices. Securities that trade in multiple markets or on multiple exchanges are valued according to the broadest and most representative market. Certain equity securities are valued based upon fundamental characteristics or relationships to similar securities.
Debt securities generally trade in the over-the-counter market rather than on a securities exchange. The Fund’s pricing services use multiple valuation techniques to determine fair value. In instances where sufficient market activity exists, the pricing services may utilize a market-based approach through which quotes from market makers are used to determine fair value. In instances where sufficient market activity may not exist or is limited, the pricing services also utilize proprietary valuation models which may consider market characteristics such as benchmark yield curves, option-adjusted spreads, credit spreads, estimated default rates, coupon rates, anticipated timing of principal repayments, underlying collateral, and other unique security features in order to estimate the relevant cash flows, which are then discounted to calculate the fair value. Securities denominated in a foreign currency are converted into their U.S. dollar equivalent at the foreign exchange rate in effect at the close of the NYSE on the date that the values of the foreign debt securities are determined.
Certain derivative financial instruments (derivatives) trade in the over-the-counter market. The Fund’s pricing services use various techniques including industry standard option pricing models and proprietary discounted cash flow models to determine the fair value of those instruments. The Fund’s net benefit or obligation under the derivative contract, as measured by the fair market value of the contract, is included in net assets.
The Fund has procedures to determine the fair value of securities and other financial instruments for which market prices are not readily available or which may not be reliably priced. Under these procedures, the Fund primarily employs a market-based approach which may use related or comparable assets or liabilities, recent transactions, market multiples, book values, and other relevant information for the investment to determine the fair value of the investment. The Fund may also use an income-based valuation approach in which the anticipated future cash flows of the investment are discounted to calculate fair value. Discounts may also be applied due to the nature or duration of any restrictions on the disposition of the investments. Due to the inherent uncertainty of valuations of such investments, the fair values may differ significantly from the values that would have been used had an active market existed.
MI-19
Franklin Templeton Variable Insurance Products Trust
Notes to Financial Statements (continued)
Mutual International Securities Fund
1. ORGANIZATION AND SIGNIFICANT ACCOUNTING POLICIES (continued)
Trading in securities on foreign securities stock exchanges and over-the-counter markets may be completed before the daily close of business on the NYSE. Occasionally, events occur between the time at which trading in a foreign security is completed and the close of the NYSE that might call into question the reliability of the value of a portfolio security held by the Fund. As a result, differences may arise between the value of the Fund’s portfolio securities as determined at the foreign market close and the latest indications of value at the close of the NYSE. In order to minimize the potential for these differences, the investment manager monitors price movements following the close of trading in foreign stock markets through a series of country specific market proxies (such as baskets of American Depository Receipts, futures contracts and exchange traded funds). These price movements are measured against established trigger thresholds for each specific market proxy to assist in determining if an event has occurred that may call into question the reliability of the values of the foreign securities held by the Fund. If such an event occurs, the securities may be valued using fair value procedures, which may include the use of independent pricing services.
b. Foreign Currency Translation
Portfolio securities and other assets and liabilities denominated in foreign currencies are translated into U.S. dollars based on the exchange rate of such currencies against U.S. dollars on the date of valuation. The Fund may enter into foreign currency exchange contracts to facilitate transactions denominated in a foreign currency. Purchases and sales of securities, income and expense items denominated in foreign currencies are translated into U.S. dollars at the exchange rate in effect on the transaction date. Portfolio securities and assets and liabilities denominated in foreign currencies contain risks that those currencies will decline in value relative to the U.S. dollar. Occasionally, events may impact the availability or reliability of foreign exchange rates used to convert the U.S. dollar equivalent value. If such an event occurs, the foreign exchange rate will be valued at fair value using procedures established and approved by the Trust’s Board of Trustees.
The Fund does not separately report the effect of changes in foreign exchange rates from changes in market prices on securities held. Such changes are included in net realized and unrealized gain or loss from investments on the Statement of Operations.
Realized foreign exchange gains or losses arise from sales of foreign currencies, currency gains or losses realized between the trade and settlement dates on securities transactions and the difference between the recorded amounts of dividends, interest, and foreign withholding taxes and the U.S. dollar equivalent of the amounts actually received or paid. Net unrealized foreign exchange gains and losses arise from changes in foreign exchange rates on foreign denominated assets and liabilities other than investments in securities held at the end of the reporting period.
c. Derivative Financial Instruments
The Fund invested in derivatives in order to manage risk or gain exposure to various other investments or markets. Derivatives are financial contracts based on an underlying or notional amount, require no initial investment or an initial net investment that is smaller than would normally be required to have a similar response to changes in market factors, and require or permit net settlement. Derivatives contain various risks including the potential inability of the counterparty to fulfill their obligations under the terms of the contract, the potential for an illiquid secondary market and/or the potential for market movements which expose the Fund to gains or losses in excess of the amounts shown on the Statement of Assets and Liabilities. Realized gain and loss and unrealized appreciation and depreciation on these contracts for the period are included in the Statement of Operations.
The Fund entered into forward exchange contracts primarily to manage exposure to certain foreign currencies. A forward exchange contract is an agreement between the Fund and a counterparty to buy or sell a foreign currency for a specific exchange rate on a future date. Pursuant to the terms of the forward exchange contracts, cash or securities may be required to be deposited as collateral. Unrestricted cash may be invested according to the Fund’s investment objectives.
See Note 9 regarding other derivative information.
MI-20
Franklin Templeton Variable Insurance Products Trust
Notes to Financial Statements (continued)
Mutual International Securities Fund
1. ORGANIZATION AND SIGNIFICANT ACCOUNTING POLICIES (continued)
d. Securities Sold Short
The Fund is engaged in selling securities short, which obligates the fund to replace a borrowed security with the same security at current market value. The fund incurs a loss if the price of the security increases between the date of the short sale and the date on which the fund replaces the borrowed security. The fund realizes a gain if the price of the security declines between those dates. Gains are limited to the price at which the Fund sold the security short, while losses are potentially unlimited in size.
The fund is required to establish a margin account with the broker lending the security sold short. While the short sale is outstanding, the broker retains the proceeds of the short sale and the fund must maintain a deposit with broker consisting of cash and/or securities having a value equal to a specified percentage of the value of the securities sold short. The fund is obligated to pay stock loan fees for borrowing the securities sold short and is required to pay the counterparty any dividends or interest due on securities sold short. Such dividends or interest and any stock loan fees are recorded as an expense to the fund.
e. Income Taxes
It is the Fund’s policy to qualify as a regulated investment company under the Internal Revenue Code. The Fund intends to distribute to shareholders substantially all of its taxable income and net realized gains to relieve it from federal income and excise taxes. As a result, no provision for U.S. federal income taxes is required. The Fund files U.S. income tax returns as well as tax returns in certain other jurisdictions. The Fund’s application of those tax rules is subject to its understanding. The Fund records a provision for taxes in its financial statements including penalties and interest, if any, for a tax position taken on a tax return (or expected to be taken) when it fails to meet the more likely than not (a greater than 50% probability) threshold and based on the technical merits, the tax position may not be sustained upon examination by the tax authorities. As of December 31, 2010, and for all open tax years, the Fund has determined that no provision for income tax is required in the Fund’s financial statements. Open tax years are those that remain subject to examination and are based on each tax jurisdiction statute of limitation. The Fund is not aware of any tax position for which it is reasonably possible that the total amounts of unrecognized tax effects will significantly change in the next twelve months.
The Fund may be subject to foreign taxation related to income received, capital gains on the sale of securities and certain foreign currency transactions in the foreign jurisdictions in which it invests. Foreign taxes, if any, are recorded based on the tax regulations and rates that exist in the foreign markets in which the Fund invests. When a capital gain tax is determined to apply the Fund records an estimated deferred tax liability for net unrealized gains on these securities in an amount that would be payable if the securities were disposed of on the valuation date.
f. Security Transactions, Investment Income, Expenses and Distributions
Security transactions are accounted for on trade date. Realized gains and losses on security transactions are determined on a specific identification basis. Interest income and estimated expenses are accrued daily. Amortization of premium and accretion of discount on debt securities are included in interest income. Dividend income is recorded on the ex-dividend date except that certain dividends from foreign securities are recognized as soon as the Fund is notified of the ex-dividend date. Distributions to shareholders are recorded on the ex-dividend date and are determined according to income tax regulations (tax basis). Distributable earnings determined on a tax basis may differ from earnings recorded in accordance with accounting principles generally accepted in the United States of America. These differences may be permanent or temporary. Permanent differences are reclassified among capital accounts to reflect their tax character. These reclassifications have no impact on net assets or the results of operations. Temporary differences are not reclassified, as they may reverse in subsequent periods.
Common expenses incurred by the Trust are allocated among the funds based on the ratio of net assets of each fund to the combined net assets of the Trust. Fund specific expenses are charged directly to the fund that incurred the expense.
MI-21
Franklin Templeton Variable Insurance Products Trust
Notes to Financial Statements (continued)
Mutual International Securities Fund
1. ORGANIZATION AND SIGNIFICANT ACCOUNTING POLICIES (continued)
Realized and unrealized gains and losses and net investment income, not including class specific expenses, are allocated daily to each class of shares based upon the relative proportion of net assets of each class. Differences in per share distributions, by class, are generally due to differences in class specific expenses.
g. Offering Costs
Offering costs are amortized on a straight line basis over twelve months.
h. Accounting Estimates
The preparation of financial statements in accordance with accounting principles generally accepted in the United States of America requires management to make estimates and assumptions that affect the reported amounts of assets and liabilities at the date of the financial statements and the amounts of income and expenses during the reporting period. Actual results could differ from those estimates.
i. Guarantees and Indemnifications
Under the Trust’s organizational documents, its officers and trustees are indemnified by the Trust against certain liabilities arising out of the performance of their duties to the Trust. Additionally, in the normal course of business, the Trust, on behalf of the Fund, enters into contracts with service providers that contain general indemnification clauses. The Trust’s maximum exposure under these arrangements is unknown as this would involve future claims that may be made against the Trust that have not yet occurred. Currently, the Trust expects the risk of loss to be remote.
2. SHARES OF BENEFICIAL INTEREST
At December 31, 2010, there were an unlimited number of shares authorized (without par value). Transactions in the Fund’s shares were as follows:
| | | | | | | | | | | | | | | | |
| | | Year Ended December 31, | |
| | | 2010 | | | 2009a | |
| Class 2 Shares: | | Shares | | | Amount | | | Shares | | | Amount | |
Shares sold | | | — | | | $ | — | | | | 100,000 | | | $ | 1,000,000 | |
| | | | |
Class 4 Shares: | | | | | | | | | | | | | | | | |
Shares sold | | | — | | | $ | — | | | | 100,000 | | | $ | 1,000,000 | |
| | | | |
aFor the period June 15, 2009 (commencement of operations) to December 31, 2009.
3. TRANSACTIONS WITH AFFILIATES
Franklin Resources, Inc. is the holding company for various subsidiaries that together are referred to as Franklin Templeton Investments. Certain officers and trustees of the Trust are also officers and/or directors of the following subsidiaries:
| | |
| Subsidiary | | Affiliation |
Franklin Mutual Advisers, LLC (Franklin Mutual) | | Investment manager |
Franklin Templeton Services, LLC (FT Services) | | Administrative manager |
Franklin Templeton Distributors, Inc. (Distributors) | | Principal underwriter |
Franklin Templeton Investor Services, LLC (Investor Services) | | Transfer agent |
MI-22
Franklin Templeton Variable Insurance Products Trust
Notes to Financial Statements (continued)
Mutual International Securities Fund
3. TRANSACTIONS WITH AFFILIATES (continued)
a. Management Fees
The Fund pays an investment management fee to Franklin Mutual based on the average daily net assets of the Fund as follows:
| | |
| Annualized Fee Rate | | Net Assets |
| 0.800% | | Up to and including $4 billion |
| 0.770% | | Over $4 billion, up to and including $7 billion |
| 0.750% | | Over $7 billion, up to and including $10 billion |
| 0.730% | | In excess of $10 billion |
b. Administrative Fees
The Fund pays an administrative fee to FT Services of 0.25% per year of the average daily net assets of the Fund.
c. Distribution Fees
The Trust’s Board of Trustees has adopted distribution plans for Class 2 and Class 4 shares pursuant to Rule 12b-1 under the 1940 Act. Under the Fund’s compensation distribution plans, the Fund pays Distributors for costs incurred in connection with the servicing, sale and distribution of the Fund’s shares up to 0.35% per year of its average daily net assets of each class. The Board of Trustees has agreed to limit the current rate to 0.25% per year for Class 2.
d. Transfer Agent Fees
Investor Services, under terms of an agreement, performs shareholder servicing for the Fund and is not paid by the Fund for the services.
e. Waiver and Expense Reimbursements
FT Services and Franklin Mutual have contractually agreed in advance to waive or limit their respective fees and to assume as their own expense certain expenses otherwise payable by the fund so that the common expenses (i.e. a combination of management fees, administrative fees, and other expenses, but excluding distribution fees and acquired fund fees and expenses) for each class of the Fund do not exceed 0.95% (other than certain non-routine expenses or costs, including those relating to litigation, indemnification, reorganizations, and liquidations) until April 30, 2011.
f. Other Affiliated Transactions
At December 31, 2010, Franklin Advisers, Inc. owned 100% of the Fund’s outstanding shares.
4. EXPENSE OFFSET ARRANGEMENT
The Fund has entered into an arrangement with its custodian whereby credits realized as a result of uninvested cash balances are used to reduce a portion of the Fund’s custodian expenses. During the year ended December 31, 2010, the custodian fees were reduced as noted in the Statement of Operations.
MI-23
Franklin Templeton Variable Insurance Products Trust
Notes to Financial Statements (continued)
Mutual International Securities Fund
5. INCOME TAXES
The tax character of distributions paid during the years ended December 31, 2010 and 2009, was as follows:
| | | | | | | | |
| | | 2010 | | | 2009 | |
Distributions paid from: | | | | | | | | |
Ordinary income | | $ | 262,230 | | | $ | 111,540 | |
Long term capital gain | | | 44,540 | | | | — | |
| | | | |
| | $ | 306,770 | | | $ | 111,540 | |
| | | | |
At December 31, 2010, the cost of investments, net unrealized appreciation (depreciation), undistributed ordinary income and undistributed long term capital gains for income tax purposes were as follows:
| | | | |
Cost of investments | | $ | 1,913,052 | |
| | | | |
| |
Unrealized appreciation | | $ | 407,960 | |
Unrealized depreciation | | | (74,844 | ) |
| | | | |
Net unrealized appreciation (depreciation) | | $ | 333,116 | |
| | | | |
Undistributed ordinary income | | $ | 30,998 | |
Undistributed long term capital gains | | | 46,428 | |
| | | | |
Distributable earnings | | $ | 77,426 | |
| | | | |
Net investment income differs for financial statement and tax purposes primarily due to differing treatments of foreign currency transactions and passive foreign investment company shares.
Net realized gains (losses) differ for financial statement and tax purposes primarily due to differing treatments of foreign currency transactions and passive foreign investment company shares.
6. INVESTMENT TRANSACTIONS
Purchases and sales of investments (excluding short term securities and securities sold short) for the year ended December 31, 2010, aggregated $901,788 and $1,087,736, respectively.
7. CONCENTRATION OF RISK
Investing in foreign securities may include certain risks and considerations not typically associated with investing in U.S. securities, such as fluctuating currency values and changing local and regional economic, political and social conditions, which may result in greater market volatility. In addition, certain foreign securities may not be as liquid as U.S. securities.
8. RESTRICTED SECURITIES
The Fund may invest in securities that are restricted under the Securities Act of 1933 (1933 Act) or which are subject to legal, contractual, or other agreed upon restrictions on resale. Restricted securities are often purchased in private placement transactions, and cannot be sold without prior registration unless the sale is pursuant to an exemption under the 1933 Act. Disposal of these securities may require greater effort and expense, and prompt sale at an acceptable price may be difficult. The Fund may have registration rights for restricted securities. The issuer generally incurs all registration costs.
MI-24
Franklin Templeton Variable Insurance Products Trust
Notes to Financial Statements (continued)
Mutual International Securities Fund
8. RESTRICTED SECURITIES (continued)
At December 31, 2010, the Fund held an investment in a restricted security, excluding certain securities exempt from registration under the 1933 Act deemed to be liquid, as follows:
| | | | | | | | | | | | | | | | |
| Shares | | | Issuer | | Acquisition
Dates | | | Cost | | | Value | |
| | 6,987 | | | Prime AET&H Holdings No. 1 Pty. Ltd. | | | 10/13/10 | | | $ | — | | | $ | — | |
| | | | Total Restricted Securities (0.00% of Net Assets) | | | | | | | | | | | | |
9. OTHER DERIVATIVE INFORMATION
At December 31, 2010, the Fund has invested in derivative contracts which are reflected on the Statement of Assets and Liabilities as follows:
| | | | | | | | | | | | |
| | | Asset Derivatives | | | Liability Derivatives | |
Derivative Contracts Not Accounted
for as Hedging Instruments | | Statement of Assets and
Liabilities Location | | Fair
Value
Amount | | | Statement of Assets and
Liabilities Location | | Fair
Value
Amount | |
Foreign exchange contracts | | Unrealized appreciation on forward exchange contracts | | $ | 13,762 | | | Unrealized depreciation on forward exchange contracts | | $ | 18,150 | |
For the year ended December 31, 2010, the effect of derivative contracts on the Fund’s Statement of Operations was as follows:
| | | | | | | | | | | | | | |
Derivative Contracts Not Accounted
for as Hedging Instruments | | Statement of Operations Locations | | Realized
Gain
(Loss)
for the
Year | | | Change in
Unrealized
Appreciation
(Depreciation)
for the Year | | | Average
Amount
Outstanding
During the
Yeara | |
Foreign exchange contracts | | Net realized gain (loss) from foreign currency transactions / Net change in unrealized appreciation (depreciation) on translation of other assets and liabilities denominated in foreign currencies | | $ | 52,000 | | | $ | (41,515 | ) | | $ | 1,286,543 | |
aRepresents the average notional amount for derivative contracts outstanding during the year. For derivative contracts denominated in foreign currencies, notional amounts are converted into U.S. dollars.
See Note 1(c) regarding derivative financial instruments.
10. CREDIT FACILITY
The Fund, together with other U.S. registered and foreign investment funds (collectively “Borrowers”), managed by Franklin Templeton Investments, are borrowers in a joint syndicated senior unsecured credit facility totaling $750 million (Global Credit Facility) which matures on January 21, 2011. This Global Credit Facility provides a source of funds to the Borrowers for temporary and emergency purposes, including the ability to meet future unanticipated or unusually large redemption requests.
Under the terms of the Global Credit Facility, the Fund shall, in addition to interest charged on any borrowings made by the Fund and other costs incurred by the Fund, pay its share of fees and expenses incurred in connection with the implementation and maintenance of the Global Credit Facility, based upon its relative share of the aggregate net assets of all of the Borrowers,
MI-25
Franklin Templeton Variable Insurance Products Trust
Notes to Financial Statements (continued)
Mutual International Securities Fund
10. CREDIT FACILITY (continued)
including an annual commitment fee of 0.10% based upon the unused portion of the Global Credit Facility, which is reflected in other expenses on the Statement of Operations. During the year ended December 31, 2010, the Fund did not use the Global Credit Facility.
Effective January 21, 2011, the Borrowers renewed the Global Credit Facility for a total of $750 million, maturing January 20, 2012.
11. FAIR VALUE MEASUREMENTS
The Fund follows a fair value hierarchy that distinguishes between market data obtained from independent sources (observable inputs) and the Fund’s own market assumptions (unobservable inputs). These inputs are used in determining the value of the Fund’s investments and are summarized in the following fair value hierarchy:
| | • | | Level 1 – quoted prices in active markets for identical securities |
| | • | | Level 2 – other significant observable inputs (including quoted prices for similar securities, interest rates, prepayment speed, credit risk, etc.) |
| | • | | Level 3 – significant unobservable inputs (including the Fund’s own assumptions in determining the fair value of investments) |
The inputs or methodology used for valuing securities are not an indication of the risk associated with investing in those securities.
For movements between the levels within the fair value hierarchy, the Fund has adopted a policy of recognizing the transfers as of the date of the underlying event which caused the movement.
The following is a summary of the inputs used as of December 31, 2010, in valuing the Fund’s assets and liabilities carried at fair value:
| | | | | | | | | | | | | | | | |
| | | Level 1 | | | Level 2 | | | Level 3 | | | Total | |
| | | | | | | | | | | | | | | | |
Assets: | | | | | | | | | | | | | | | | |
Investments in Securities: | | | | | | | | | | | | | | | | |
Equity Investments:a | | | | | | | | | | | | | | | | |
Electric Utilities | | $ | 25,113 | | | $ | — | | | $ | 35,298b | | | $ | 60,411 | |
Other Equity Investmentsc | | | 2,185,757 | | | | — | | | | — | | | | 2,185,757 | |
| | | | |
Total Investments in Securities | | $ | 2,210,870 | | | $ | — | | | $ | 35,298 | | | $ | 2,246,168 | |
| | | | |
Forward Exchange Contracts | | | — | | | | 13,762 | | | | — | | | | 13,762 | |
Liabilities: | | | | | | | | | | | | | | | | |
Forward Exchange Contracts | | | — | | | | 18,150 | | | | — | | | | 18,150 | |
aIncludes common and preferred stock.
bIncludes securities determined to have no value at December 31, 2010.
cFor detailed industry descriptions, see the accompanying Statement of Investments.
MI-26
Franklin Templeton Variable Insurance Products Trust
Notes to Financial Statements (continued)
Mutual International Securities Fund
11. FAIR VALUE MEASUREMENTS (continued)
At December 31, 2010, the reconciliation of assets in which significant unobservable inputs (Level 3) were used in determining fair value, is as follows:
| | | | | | | | | | | | | | | | | | | | | | | | | | | | |
| | | Balance at
Beginning
of Year | | | Net
Realized
Gain (Loss) | | | Net Change in
Unrealized
Appreciation
(Depreciation) | | | Net
Purchases
(Sales) | | | Transfer In
(Out of)
Level 3 | | | Balance at
End of Year | | | Net Change
in Unrealized
Appreciation
(Depreciation)
on Assets Held
at Year End | |
Assets | | | | | | | | | | | | | | | | | | | | | | | | | | | | |
Equity Investments: | | | | | | | | | | | | | | | | | | | | | | | | | | | | |
Electric Utilities | | $ | — | | | $ | — | | | $ | (1,762 | ) | | $ | — | | | $ | 37,060 | | | $ | 35,298a | | | $ | (1,762 | ) |
| | | | |
aIncludes securities determined to have no value at December 31, 2010
12. SUBSEQUENT EVENTS
The Fund has evaluated subsequent events through the issuance of the financial statements and determined that no events have occurred that require disclosure other than those already disclosed in the financial statements.
| | | | |
ABBREVIATIONS | | | | |
| Counterparty | | Currency | | Selected Portfolio |
| | | | |
| BZWS - Barclays Bank PLC | | CHF - Swiss Franc | | ADR - American Depository Receipt |
| DBAB - Deutsche Bank AG | | EUR - Euro | | PC - Participation Certificate |
| SSBT - State Street Bank and Trust Co. | | | | |
MI-27
Franklin Templeton Variable Insurance Products Trust
Mutual International Securities Fund
Report of Independent Registered Public Accounting Firm
To the Board of Trustees and Shareholders of
Franklin Templeton Variable Insurance Products Trust
In our opinion, the accompanying statement of assets and liabilities, including the statement of investments, and the related statements of operations and of changes in net assets and the financial highlights present fairly, in all material respects, the financial position of Mutual International Securities Fund (the “Fund”) at December 31, 2010, the results of its operations for the year then ended, and the changes in its net assets and the financial highlights for the year then ended and the for period June 15, 2009 (commencement of operations) through December 31, 2009, in conformity with accounting principles generally accepted in the United States of America. These financial statements and financial highlights (hereafter referred to as “financial statements”) are the responsibility of the Fund’s management. Our responsibility is to express an opinion on these financial statements based on our audits. We conducted our audits of these financial statements in accordance with the standards of the Public Company Accounting Oversight Board (United States). Those standards require that we plan and perform the audit to obtain reasonable assurance about whether the financial statements are free of material misstatement. An audit includes examining, on a test basis, evidence supporting the amounts and disclosures in the financial statements, assessing the accounting principles used and significant estimates made by management, and evaluating the overall financial statement presentation. We believe that our audits, which included confirmation of securities at December 31, 2010 by correspondence with the custodian and brokers, provide a reasonable basis for our opinion.
PricewaterhouseCoopers LLP
San Francisco, California
February 10, 2011
MI-28
Franklin Templeton Variable Insurance Products Trust
Tax Designation (unaudited)
Mutual International Securities Fund
Under Section 852(b)(3)(C) of the Internal Revenue Code (Code), the Fund designates the maximum amount allowable but no less than $44,540 as a long term capital gain dividend for the fiscal year ended December 31, 2010.
Under Section 871(k)(2)(C) of the Code, the Fund designates the maximum amount allowable but no less than $130,060 as a short term capital gain dividend for purposes of the tax imposed under Section 871(a)(1)(A) of the Code for the fiscal year ended December 31, 2010.
At December 31, 2010, more than 50% of the Fund’s total assets were invested in securities of foreign issuers. In most instances, foreign taxes were withheld from income paid to the Fund on these investments. As shown in the table below, the Fund designates to shareholders the foreign source income and foreign taxes paid, pursuant to Section 853 of the Code. This designation will allow shareholders of record on December 13, 2010, to treat their proportionate share of foreign taxes paid by the Fund as having been paid directly by them. The shareholder shall consider these amounts as foreign taxes paid in the tax year in which they receive the Fund distribution.
The following table provides a detailed analysis of foreign tax paid and foreign source income as designated by the Fund, to Class 2 and Class 4 shareholders of record.
| | | | | | | | |
| Class | | Foreign
Tax Paid
Per Share | | | Foreign
Source Income
Per Share | |
Class 2 | | | 0.0245 | | | | 0.3571 | |
Class 4 | | | 0.0245 | | | | 0.3518 | |
Foreign Tax Paid Per Share (Column 1) is the amount per share available to you, as a tax credit (assuming you held your shares in the Fund for a minimum of 16 days during the 31-day period beginning 15 days before the ex-dividend date of the Fund’s distribution to which the foreign taxes relate), or, as a tax deduction.
Foreign Source Income Per Share (Column 2) is the amount per share of income dividends attributable to foreign securities held by the Fund, plus any foreign taxes withheld on these dividends.
MI-29
MUTUAL SHARES SECURITIES FUND
This annual report for Mutual Shares Securities Fund covers the fiscal year ended December 31, 2010.
Performance Summary as of 12/31/10
Average annual total return of Class 4 shares* represents the average annual change in value, assuming reinvestment of dividends and capital gains. Average returns smooth out variations in returns, which can be significant; they are not the same as year-by-year results.
Periods ended 12/31/10
| | | | | | | | | | | | |
| | | 1-Year | | | 5-Year | | | 10-Year | |
Average Annual Total Return | | | +11.06% | | | | +1.59% | | | | +4.89% | |
*For the period beginning 2/29/08, Class 4 performance reflects a 12b-1 fee expense of 0.35% per year, which affects future performance. Class 4 performance prior to 2/29/08 reflects historical Class 1 performance, which does not have a 12b-1 fee expense. Since 2/29/08 (effective date), the average annual total return of Class 4 shares was -1.81%.
Total Return Index Comparison
for a Hypothetical $10,000 Investment (1/1/01–12/31/10)
The graph below shows the change in value of a hypothetical $10,000 investment in the Fund over the indicated period and includes reinvestment of any income or distributions. The Fund’s performance* is compared to the performance of the Standard & Poor’s 500 Index (S&P 500). One cannot invest directly in an index, and an index is not representative of the Fund’s portfolio. Please see Important Notes to Performance Information preceding the Fund Summaries.
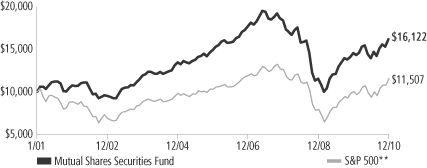
**Source: © 2011 Morningstar. Please see Index Descriptions following the Fund Summaries.
Mutual Shares Securities Fund – Class 4
Performance reflects the Fund’s Class 4 operating expenses, but does not include any contract fees, expenses or sales charges. If they had been included, performance would be lower. These charges and deductions, particularly for variable life policies, can have a significant effect on contract values and insurance benefits. See the contract prospectus for a complete description of these expenses, including sales charges.
Performance data represent past performance, which does not guarantee future results. Investment return and principal value will fluctuate, and you may have a gain or loss when you sell your shares.
Current performance may differ from figures shown.
MS-1
Fund Goals and Main Investments: Mutual Shares Securities Fund seeks capital appreciation, with income as a secondary goal. The Fund normally invests primarily in U.S. and foreign equity securities that the manager believes are undervalued. The Fund also invests, to a lesser extent, in risk arbitrage securities and distressed companies.
Performance Overview
You can find the Fund’s one-year total return in the Performance Summary. The Fund underperformed its benchmark, the S&P 500, which delivered a +15.06% total return for the period under review.1
Economic and Market Overview
During the 12-month period ended December 31, 2010, the U.S. economy grew unevenly, supported by a combination of fundamental business improvement and government intervention. Economic activity as measured by gross domestic product expanded at an annualized 3.7% pace in 2010’s first quarter and then downshifted to 1.7% annualized in the second quarter. Consumer spending picked up, likely due to pent-up post-recession demand, and the pace of growth rose at annualized rates of 2.6% in the third quarter and an estimated 3.2% in the fourth quarter. Globally, emerging market regions primarily led growth, as they were generally unconstrained by the debt overhang burdening western economies and benefited from strong intrinsic demand and significant capital inflows. Developed economies grew at a more subdued pace, with demand recovery and asset price reflation heavily underpinned by government-sponsored, liquidity-enhancing measures.
In the U.S., challenges such as mixed economic data, elevated debt concerns surrounding the U.S. budget deficit and a lack of job prospects for the unemployed hindered consumer confidence and the economy’s advance. Although home prices rose early in the year, home sales stalled as a homebuyer tax credit program ended, foreclosures mounted and the housing sector remained weak. The unemployment situation showed little improvement. Even though the jobless rate fell from 10.0% in December 2009 to 9.4% at period-end, some of the decline was attributable to a shrinking labor force as many unemployed workers stopped looking for jobs.2
1. Source: © 2011 Morningstar. One cannot invest directly in an index, and an index is not representative of the Fund’s portfolio. Please see Index Descriptions following the Fund Summaries.
2. Source: Bureau of Labor Statistics.
Fund Risks: The Fund’s investments in stocks may offer the potential for long-term gains but can be subject to short-term price fluctuations. Investments in companies involved in mergers, liquidations, reorganizations and distressed bankruptcy, which may include defaulted debt, involve higher credit and other risks. Foreign investing, especially in emerging markets, involves additional risks, including currency fluctuations, economic instability, market volatility, and political and social instability. Smaller and midsize company securities involve special risks, such as relatively small revenues, limited product lines and small market share. The Fund’s investment in certain hedging and derivative instruments may involve a small investment relative to the risk assumed. The manager applies various techniques and analyses in making investment decisions for the Fund, but there can be no guarantee that these decisions will produce the desired results. The Fund’s prospectus also includes a description of the main investment risks.
MS-2
Amid signs of a demand-led recovery, crude oil prices rose from $79 per barrel at the end of December 2009 to $91 per barrel by the end of December 2010 largely due to accelerating global demand. The pace of inflation slowed during the year, and in December 2010 the inflation rate was an annualized 1.5%.2 Similarly, core inflation, which excludes volatile food and energy costs, slowed to a 0.8% annualized rate.2
Given few inflationary pressures and uncertainty surrounding the economic recovery, the Federal Open Market Committee (FOMC) made no major changes to its monetary policy for most of the period. The FOMC repeatedly stated it would keep the federal funds target rate within the exceptionally low 0% to 0.25% range “for an extended period” and eventually shifted its focus to its outlook and the status of its current holdings. In September, the FOMC revealed concerns about the subdued recovery and said inflation was below the pace “consistent with its mandate.” Having already lowered interest rates effectively to zero, the FOMC announced its intention to purchase government securities to stimulate the economy and promote a low level of inflation consistent with healthy economic growth.
Investor confidence shifted with each release of encouraging or discouraging economic, regulatory and political news, stoking considerable volatility among equities. Ultimately, global stock indexes posted solid gains during the 12 months under review as investor risk aversion began to subside amid generally improving economic signs and rising consumer spending. The dollar strengthened relative to the euro, which declined as a result of the region’s fiscal crisis, but weakened against the yen, which hit multi-decade highs amid persistent deflationary pressures. Meanwhile, U.S. Treasuries and corporate bonds finished the year with gains despite Treasury price declines late in the year.
Investment Strategy
At Mutual Series, we are committed to our distinctive value approach to investing. Our major investment strategy is investing in undervalued stocks. When selecting undervalued equities, we are attracted to fundamentally strong companies with healthy balance sheets, high-quality assets, substantial free cash flow and shareholder-oriented management teams and whose stocks are trading at discounts to our assessment of the companies’ intrinsic or business value. We also look for asset rich companies whose shares may be trading at depressed levels due to concerns over short-term earnings disappointments, litigation, management strategy or other perceived negatives. While the vast majority of our
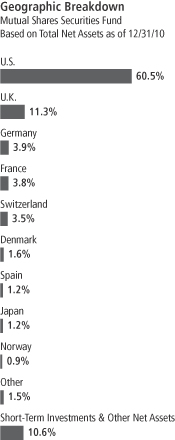
MS-3
undervalued equity investments are made in publicly traded companies globally, we may invest occasionally in privately held companies as well.
We complement this more traditional investment strategy with two others. One is distressed investing, which is complex and can take many forms. The most common distressed investment the Fund undertakes is the purchase of financially troubled or bankrupt companies’ debt at a substantial discount to face value. After the financially distressed company is reorganized, often in bankruptcy court, the old debt is typically replaced with new securities issued by the financially stronger company.
The other piece of our investment strategy is participating in arbitrage situations, another highly specialized field. When companies announce proposed mergers or takeovers, commonly referred to as “deals,” the target company may trade at a discount to the bid it ultimately accepts. One form of arbitrage involves purchasing the target company’s stock when it is trading below the value we believe it would receive in a deal. In keeping with our commitment to a relatively conservative investment approach, we typically focus our arbitrage efforts on announced deals, and eschew rumored deals or other situations we consider relatively risky.
In addition, it is our practice to hedge the Fund’s currency exposure when we deem it advantageous for our shareholders.
Manager’s Discussion
As stock markets advanced in 2010, several Fund investments increased in value. Three particularly strong Fund performers were U.K.-based British American Tobacco (BAT), U.S. tobacco company Altria Group and German automaker Volkswagen.
BAT’s unit volume trends improved as the year unfolded. At year-end, Russia, an important market for BAT sales, appeared poised to reach a bottom, in our view. In addition, a multi-year productivity program and positive pricing contributed to the company’s ability to expand margins and deliver earnings growth that exceeded analyst expectations. The company believes further productivity gains and margin expansion remain to be captured in 2011 and beyond as it implements SAP business technology solutions, rationalizes duplicative functions and adopts “best practices” across its business segments. We believe BAT can benefit from an attractive geographic mix as the company has the largest exposure to emerging markets, and their associated growth opportunities, among its major industry peers. Like many other
Top 10 Sectors/Industries
Mutual Shares Securities Fund
Based on Equity Securities
12/31/10
| | | | |
| | | % of Total
Net Assets | |
| Tobacco | | | 8.1% | |
| Food & Staples Retailing | | | 5.3% | |
| Media | | | 5.0% | |
| Food Products | | | 4.4% | |
| Oil, Gas & Consumable Fuels | | | 4.3% | |
| Beverages | | | 4.0% | |
| Commercial Banks | | | 3.8% | |
| Software | | | 3.7% | |
| Insurance | | | 3.7% | |
| Health Care Providers & Services | | | 3.5% | |
MS-4
consumer staples companies, BAT typically generates significant free cash flow, and the company historically has used this cash flow to enhance shareholder value by making accretive acquisitions, paying generous dividends and buying back stock.
Altria operates the largest U.S. tobacco company in addition to wine and financial subsidiaries. Altria’s stock performed well in 2010 due to some company-specific events and generally favorable market trends. Since spinning off its international operations in March 2008, Altria management embarked on a multi-year cost-savings program, and the company diversified its operations by entering the moist smokeless tobacco category via acquisition. During 2010, the company reported its restructuring program was ahead of schedule and the moist smokeless business generated meaningful profit growth after posting disappointing results in 2009. In addition to benefiting from these company-specific developments, the shares performed well during the year as investors generally sought higher yielding equities. Tobacco companies, like many consumer products companies, convert a very high percentage of their earnings into free cash flow. Altria’s management historically has used much of this free cash flow to reward investors with generous dividends. During the second half of 2010, Altria boosted its dividend payout policy from 75% to 80% of free cash flow, which further highlighted the company’s attractive cash flow characteristics.
We bought Volkswagen’s stock in 2010 when it offered what we believed was an attractive combination of historically below-average valuation, a solid balance sheet combined with conservative accounting policies that understated the group’s industrial cash flows and earnings, and a strong global presence. The company is Europe’s largest automotive group and has market share not only in Europe but also in North America, South America and China. During the year, Volkswagen announced its intention to merge its operations with those of Porsche, and we sold it by period-end.
Even as the global stock market advanced in 2010, several Fund investments decreased in value, hindering its return. Three holdings that were among the largest detractors from Fund performance were Swiss deepwater drilling contractor Transocean; German utility conglomerate E.ON, one of the world’s largest investor-owned power and gas companies; and Bank of America.
Top 10 Holdings
Mutual Shares Securities Fund
12/31/10
| | | | |
Company
Sector/Industry,
Country | | % of Total
Net Assets | |
| CVS Caremark Corp. | | | 2.9% | |
| Food & Staples Retailing, U.S. | | | | |
| British American Tobacco PLC, ord. & ADR | | | 2.4% | |
| Tobacco, U.K. | | | | |
| Kraft Foods Inc., A | | | 2.2% | |
| Food Products, U.S. | | | | |
| Microsoft Corp. | | | 2.1% | |
| Software, U.S. | | | | |
| UnitedHealth Group Inc. | | | 1.9% | |
| Health Care Providers & Services, U.S. | | | | |
| Altria Group Inc. | | | 1.6% | |
| Tobacco, U.S. | | | | |
| Xerox Corp. | | | 1.6% | |
| Office Electronics, U.S. | | | | |
| Pfizer Inc. | | | 1.5% | |
| Pharmaceuticals, U.S. | | | | |
| Vodafone Group PLC | | | 1.5% | |
| Wireless Telecommunication Services, U.K. | | | | |
| Imperial Tobacco Group PLC | | | 1.5% | |
| Tobacco, U.K. | | | | |
The dollar value, number of shares or principal amount, and names of all portfolio holdings are listed in the Fund’s Statement of Investments.
MS-5
Although Transocean’s stock price appreciated toward the end of 2010, our investment in the company detracted from portfolio performance for the overall year. Transocean is the world’s largest offshore drilling contractor, with a diversified fleet of deepwater, mid-water and shallow water rigs. Transocean’s stock price began several months of decline in late April after its Deepwater Horizon rig caught fire and sank in the Gulf of Mexico. In August, the stock price rose following the disclosure of a contract between the company and BP for the Deepwater Horizon, which supported management’s earlier comments of broad indemnity. We continued to like the prospects for the offshore drilling sector and believed that Transocean shares were trading at a discount to intrinsic value.
Shares of E.ON fell in value early in 2010, as power fundamentals remained weak in many of the geographic regions the company serves. In addition, operating profit in its natural gas division was hurt by lower natural gas prices, which were soft throughout the better portion of the year, especially in relation to oil prices. Such prices are used in the pricing of the majority of the company’s long-term natural gas supply contracts. At year-end, we continued to view the stock positively because we believe it has a significant and diversified asset base and an attractive dividend policy. In addition, the recently appointed, new CEO appeared to be focused on improving E.ON’s operational efficiencies, which may benefit the company’s future stock price.
Bank of America detracted from the Fund’s performance largely due to concerns about potential mortgage losses, particularly those stemming from the Countrywide Home Loans business it acquired in 2008. In addition, new U.S. financial regulations that may pressure consumer-related fees also weighed on the stock. In our view, Bank of America has leading positions across all its businesses, its capital position is solid, credit costs continued to decline, and the mortgage loss issue appeared manageable.
Finally, investors should note that we maintained our currency hedging posture of being more hedged than not to the U.S. dollar, largely through the use of forward currency exchange contracts. Certain currencies weakened in relation to the U.S. dollar in 2010, and our hedging strategy aided Fund performance during the year.
MS-6
Thank you for your participation in Mutual Shares Securities Fund. We look forward to serving your future investment needs.
The foregoing information reflects our analysis, opinions and portfolio holdings as of December 31, 2010, the end of the reporting period. The way we implement our main investment strategies and the resulting portfolio holdings may change depending on factors such as market and economic conditions. These opinions may not be relied upon as investment advice or an offer for a particular security. The information is not a complete analysis of every aspect of any market, country, industry, security or the Fund. Statements of fact are from sources considered reliable, but the investment manager makes no representation or warranty as to their completeness or accuracy. Although historical performance is no guarantee of future results, these insights may help you understand our investment management philosophy.
MS-7
Fund Expenses
As an investor in a variable insurance contract (Contract) that indirectly provides for investment in an underlying mutual fund, you can incur transaction and/or ongoing expenses at both the Fund level and the Contract level.
| • | | Transaction expenses can include sales charges (loads) on purchases, redemption fees, surrender fees, transfer fees and premium taxes. |
| • | | Ongoing expenses can include management fees, distribution and service (12b-1) fees, contract fees, annual maintenance fees, mortality and expense risk fees and other fees and expenses. All mutual funds and Contracts have some types of ongoing expenses. |
The expenses shown in the table are meant to highlight ongoing expenses at the Fund level only and do not include ongoing expenses at the Contract level, or transaction expenses at either the Fund or Contract level. While the Fund does not have transaction expenses, if the transaction and ongoing expenses at the Contract level were included, the expenses shown below would be higher. You should consult your Contract prospectus or disclosure document for more information.
The table shows Fund-level ongoing expenses and can help you understand these expenses and compare them with those of other mutual funds offered through the Contract. The table assumes a $1,000 investment held for the six months indicated. Please refer to the Fund prospectus for additional information on operating expenses.
Actual Fund Expenses
The first line (Actual) of the table provides actual account values and expenses. The “Ending Account Value” is derived from the Fund’s actual return, which includes the effect of ongoing Fund expenses, but does not include the effect of ongoing Contract expenses.
You can estimate the Fund-level expenses you incurred during the period by following these steps. Of course, your account value and expenses will differ from those in this illustration:
| 1. | Divide your account value by $1,000. |
If an account had an $8,600 value, then $8,600 ÷ $1,000 = 8.6.
| 2. | Multiply the result by the number under the heading “Fund-Level Expenses Incurred During Period.” |
If Fund-Level Expenses Incurred During Period were $7.50, then 8.6 x $7.50 = $64.50.
In this illustration, the estimated expenses incurred this period at the Fund level are $64.50.
Mutual Shares Securities Fund – Class 4
MS-8
Hypothetical Example for Comparison with Other Mutual Funds
Information in the second line (Hypothetical) of the table can help you compare ongoing expenses of the Fund with those of other mutual funds offered through the Contract. This information may not be used to estimate the actual ending account balance or expenses you incurred during the period. The hypothetical “Ending Account Value” is based on the Fund’s actual expense ratio and an assumed 5% annual rate of return before expenses, which does not represent the Fund’s actual return. The figure under the heading “Fund-Level Expenses Incurred During Period” shows the hypothetical expenses your account would have incurred under this scenario. You can compare this figure with the 5% hypothetical examples that appear in shareholder reports of other funds offered through a Contract.
| | | | | | | | | | | | |
| Class 4 | | Beginning
Account Value 7/1/10 | | | Ending
Account Value 12/31/10 | | | Fund-Level Expenses Incurred
During Period* 7/1/10–12/31/10 | |
Actual | | $ | 1,000 | | | $ | 1,159.60 | | | $ | 5.88 | |
Hypothetical (5% return before expenses) | | $ | 1,000 | | | $ | 1,019.76 | | | $ | 5.50 | |
*Expenses are calculated using the most recent six-month annualized expense ratio for the Fund’s Class 4 shares (1.08%), which does not include any ongoing expenses of the Contract for which the Fund is an investment option, multiplied by the average account value over the period, multiplied by 184/365 to reflect the one-half year period.
MS-9
Franklin Templeton Variable Insurance Products Trust
Financial Highlights
Mutual Shares Securities Fund
| | | | | | | | | | | | | | | | | | | | |
| | | Year Ended December 31, | |
| Class 1 | | 2010 | | | 2009 | | | 2008 | | | 2007 | | | 2006 | |
| | | | |
Per share operating performance | | | | | | | | | | | | | | | | | | | | |
(for a share outstanding throughout the year) | | | | | | | | | | | | | | | | | | | | |
Net asset value, beginning of year | | $ | 14.75 | | | $ | 11.92 | | | $ | 20.42 | | | $ | 20.67 | | | $ | 18.35 | |
| | | | |
Income from investment operationsa: | | | | | | | | | | | | | | | | | | | | |
Net investment incomeb | | | 0.40 | c | | | 0.23 | d | | | 0.34 | | | | 0.54 | | | | 0.40 | |
Net realized and unrealized gains (losses) | | | 1.27 | | | | 2.89 | | | | (7.54 | ) | | | 0.31 | | | | 2.86 | |
| | | | |
Total from investment operations | | | 1.67 | | | | 3.12 | | | | (7.20 | ) | | | 0.85 | | | | 3.26 | |
| | | | |
Less distributions from: | | | | | | | | | | | | | | | | | | | | |
Net investment income | | | (0.28 | ) | | | (0.29 | ) | | | (0.57 | ) | | | (0.35 | ) | | | (0.29 | ) |
Net realized gains | | | — | | | | — | | | | (0.73 | ) | | | (0.75 | ) | | | (0.65 | ) |
| | | | |
Total distributions | | | (0.28 | ) | | | (0.29 | ) | | | (1.30 | ) | | | (1.10 | ) | | | (0.94 | ) |
| | | | |
Net asset value, end of year | | $ | 16.14 | | | $ | 14.75 | | | $ | 11.92 | | | $ | 20.42 | | | $ | 20.67 | |
| | | | |
| | | | | |
Total returne | | | 11.47% | | | | 26.35% | | | | (36.93)% | | | | 3.72% | | | | 18.66% | |
Ratios to average net assets | | | | | | | | | | | | | | | | | | | | |
Expensesf,g | | | 0.74% | | | | 0.78% | | | | 0.73% | | | | 0.72% | | | | 0.81% | |
Expenses incurred in connection with securities sold short | | | 0.02% | | | | 0.06% | | | | —% | h | | | —% | h | | | 0.07% | |
Net investment income | | | 2.66% | c | | | 1.85% | d | | | 2.16% | | | | 2.58% | | | | 2.02% | |
| | | | | |
Supplemental data | | | | | | | | | | | | | | | | | | | | |
Net assets, end of year (000’s) | | $ | 1,301,520 | | | $ | 767,553 | | | $ | 319,703 | | | $ | 272,509 | | | $ | 259,943 | |
Portfolio turnover rate | | | 32.05% | | | | 49.33% | | | | 44.11% | | | | 41.73% | i | | | 19.75% | |
aThe amount shown for a share outstanding throughout the period may not correlate with the Statement of Operations for the period due to the timing of sales and repurchases of the Fund shares in relation to income earned and/or fluctuating market value of the investments of the Fund.
bBased on average daily shares outstanding.
cNet investment income per share includes approximately $0.11 per share received in the form of a special dividend paid in connection with a corporate REIT conversion. Excluding this non-recurring amount, the ratio of the net investment income to average net assets would have been 1.93%.
dNet investment income per share includes approximately $(0.03) per share related to an adjustment for uncollectible interest. Excluding the effect of this adjustment, the ratio of net investment income to average net assets would have been 2.08%.
eTotal return does not include fees, charges or expenses imposed by the variable annuity and life insurance contracts for which the Franklin Templeton Variable Insurance Products Trust serves as an underlying investment vehicle.
fIncludes dividend expense on securities sold short and stock loan fees, if any. See below for the ratios of such expenses to average net assets for the periods presented. See Note 1(d).
gBenefit of expense reduction rounds to less than 0.01%.
hRounds to less than 0.01%.
iExcludes the value of portfolio securities delivered as a result of redemption in-kind.
The accompanying notes are an integral part of these financial statements.
MS-10
Franklin Templeton Variable Insurance Products Trust
Financial Highlights (continued)
Mutual Shares Securities Fund
| | | | | | | | | | | | | | | | | | | | |
| | | Year Ended December 31, | |
| Class 2 | | 2010 | | | 2009 | | | 2008 | | | 2007 | | | 2006 | |
| | | | |
Per share operating performance | | | | | | | | | | | | | | | | | | | | |
(for a share outstanding throughout the year) | | | | | | | | | | | | | | | | | | | | |
Net asset value, beginning of year | | $ | 14.58 | | | $ | 11.78 | | | $ | 20.19 | | | $ | 20.46 | | | $ | 18.18 | |
| | | | |
Income from investment operationsa: | | | | | | | | | | | | | | | | | | | | |
Net investment incomeb | | | 0.36 | c | | | 0.20 | d | | | 0.32 | | | | 0.48 | | | | 0.34 | |
Net realized and unrealized gains (losses) | | | 1.25 | | | | 2.85 | | | | (7.49 | ) | | | 0.31 | | | | 2.84 | |
| | | | |
Total from investment operations | | | 1.61 | | | | 3.05 | | | | (7.17 | ) | | | 0.79 | | | | 3.18 | |
| | | | |
Less distributions from: | | | | | | | | | | | | | | | | | | | | |
Net investment income | | | (0.24 | ) | | | (0.25 | ) | | | (0.51 | ) | | | (0.31 | ) | | | (0.25 | ) |
Net realized gains | | | — | | | | — | | | | (0.73 | ) | | | (0.75 | ) | | | (0.65 | ) |
| | | | |
Total distributions | | | (0.24 | ) | | | (0.25 | ) | | | (1.24 | ) | | | (1.06 | ) | | | (0.90 | ) |
| | | | |
Net asset value, end of year | | $ | 15.95 | | | $ | 14.58 | | | $ | 11.78 | | | $ | 20.19 | | | $ | 20.46 | |
| | | | |
| | | | | |
Total returne | | | 11.19% | | | | 26.05% | | | | (37.11)% | | | | 3.48% | | | | 18.38% | |
Ratios to average net assets | | | | | | | | | | | | | | | | | | | | |
Expensesf,g | | | 0.99% | | | | 1.03% | | | | 0.98% | | | | 0.97% | | | | 1.06% | |
Expenses incurred in connection with securities sold short | | | 0.02% | | | | 0.06% | | | | —% | h | | | —% | h | | | 0.07% | |
Net investment income | | | 2.41% | c | | | 1.60% | d | | | 1.91% | | | | 2.33% | | | | 1.77% | |
| | | | | |
Supplemental data | | | | | | | | | | | | | | | | | | | | |
Net assets, end of year (000’s) | | $ | 4,188,821 | | | $ | 3,953,435 | | | $ | 3,303,761 | | | $ | 5,925,551 | | | $ | 5,140,878 | |
Portfolio turnover rate | | | 32.05% | | | | 49.33% | | | | 44.11% | | | | 41.73% | i | | | 19.75% | |
aThe amount shown for a share outstanding throughout the period may not correlate with the Statement of Operations for the period due to the timing of sales and repurchases of the Fund shares in relation to income earned and/or fluctuating market value of the investments of the Fund.
bBased on average daily shares outstanding.
cNet investment income per share includes approximately $0.11 per share received in the form of a special dividend paid in connection with a corporate REIT conversion. Excluding this non-recurring amount, the ratio of the net investment income to average net assets would have been 1.68%.
dNet investment income per share includes approximately $(0.03) per share related to an adjustment for uncollectible interest. Excluding the effect of this adjustment, the ratio of net investment income to average net assets would have been 1.83%.
eTotal return does not include fees, charges or expenses imposed by the variable annuity and life insurance contracts for which the Franklin Templeton Variable Insurance Products Trust serves as an underlying investment vehicle.
fIncludes dividend expense on securities sold short and stock loan fees, if any. See below for the ratios of such expenses to average net assets for the periods presented. See Note 1(d).
gBenefit of expense reduction rounds to less than 0.01%.
hRounds to less than 0.01%.
iExcludes the value of portfolio securities delivered as a result of redemption in-kind.
The accompanying notes are an integral part of these financial statements.
MS-11
Franklin Templeton Variable Insurance Products Trust
Financial Highlights (continued)
Mutual Shares Securities Fund
| | | | | | | | | | | | |
| | | Year Ended December 31, | |
| Class 4 | | 2010 | | | 2009 | | | 2008a | |
| | | | |
Per share operating performance | | | | | | | | | | | | |
(for a share outstanding throughout the year) | | | | | | | | | | | | |
Net asset value, beginning of year | | $ | 14.66 | | | $ | 11.88 | | | $ | 18.91 | |
| | | | |
Income from investment operationsb: | | | | | | | | | | | | |
Net investment incomec | | | 0.35 | d | | | 0.19 | e | | | 0.17 | |
Net realized and unrealized gains (losses) | | | 1.26 | | | | 2.87 | | | | (5.90 | ) |
| | | | |
Total from investment operations | | | 1.61 | | | | 3.06 | | | | (5.73 | ) |
| | | | |
Less distributions from: | | | | | | | | | | | | |
Net investment income | | | (0.24 | ) | | | (0.28 | ) | | | (0.57 | ) |
Net realized gains | | | — | | | | — | | | | (0.73 | ) |
| | | | |
Total distributions | | | (0.24 | ) | | | (0.28 | ) | | | (1.30 | ) |
| | | | |
Net asset value, end of year | | $ | 16.03 | | | $ | 14.66 | | | $ | 11.88 | |
| | | | |
| | | |
Total returnf | | | 11.06% | | | | 25.94% | | | | (32.12)% | |
Ratios to average net assetsg | | | | | | | | | | | | |
Expensesh,i | | | 1.09% | | | | 1.13% | | | | 1.08% | |
Expenses incurred in connection with securities sold short | | | 0.02% | | | | 0.06% | | | | —% | j |
Net investment income | | | 2.31% | d | | | 1.50% | e | | | 1.81% | |
| | | |
Supplemental data | | | | | | | | | | | | |
Net assets, end of year (000’s) | | $ | 167,274 | | | $ | 141,446 | | | $ | 57,266 | |
Portfolio turnover rate | | | 32.05% | | | | 49.33% | | | | 44.11% | |
aFor the period February 29, 2008 (effective date) to December 31, 2008.
bThe amount shown for a share outstanding throughout the period may not correlate with the Statement of Operations for the period due to the timing of sales and repurchases of the Fund shares in relation to income earned and/or fluctuating market value of the investments of the Fund.
cBased on average daily shares outstanding.
dNet investment income per share includes approximately $0.11 per share received in the form of a special dividend paid in connection with a corporate REIT conversion. Excluding this non-recurring amount, the ratio of the net investment income to average net assets would have been 1.58%.
eNet investment income per share includes approximately ($0.03) per share related to an adjustment for uncollectible interest. Excluding the effect of this adjustment, the ratio of net investment income to average net assets would have been 1.73%.
fTotal return does not include fees, charges or expenses imposed by the variable annuity and life insurance contracts for which the Franklin Templeton Variable Insurance Products Trust serves as an underlying investment vehicle. Total return is not annualized for periods less than one year.
gRatios are annualized for periods less than one year.
hIncludes dividend expense on securities sold short and stock loan fees, if any. See below for the ratios of such expenses to average net assets for the periods presented. See Note 1(d).
iBenefit of expense reduction rounds to less than 0.01%.
jRounds to less than 0.01%
The accompanying notes are an integral part of these financial statements.
MS-12
Franklin Templeton Variable Insurance Products Trust
Statement of Investments, December 31, 2010
| | | | | | | | | | | | |
| Mutual Shares Securities Fund | | Country | | | Shares | | | Value | |
Common Stocks and Other Equity Interests 85.5% | | | | | | | | | | | | |
Aerospace & Defense 0.1% | | | | | | | | | | | | |
aGenCorp Inc. | | | United States | | | | 494,180 | | | $ | 2,554,912 | |
| | | | | | | | | | | | |
Air Freight & Logistics 0.4% | | | | | | | | | | | | |
TNT NV | | | Netherlands | | | | 868,685 | | | | 22,951,147 | |
| | | | | | | | | | | | |
Airlines 0.0% | | | | | | | | | | | | |
a,b,cNorthwest Airlines Corp., Contingent Distribution | | | United States | | | | 27,670,000 | | | | — | |
| | | | | | | | | | | | |
Auto Components 0.3% | | | | | | | | | | | | |
a,b,cCollins & Aikman Products Co., Contingent Distribution | | | United States | | | | 929,505 | | | | 9,295 | |
a,b,cDana Holding Corp., Contingent Distribution | | | United States | | | | 10,339,000 | | | | — | |
a,dIACNA Investor LLC | | | United States | | | | 168,957 | | | | 1,690 | |
a,d,eInternational Automotive Components Group Brazil LLC | | | Brazil | | | | 1,730,515 | | | | 3,061,523 | |
a,d,eInternational Automotive Components Group North America LLC | | | United States | | | | 11,387,027 | | | | 14,432,373 | |
| | | | | | | | | | | | |
| | | | | | | | | | | 17,504,881 | |
| | | | | | | | | | | | |
Automobiles 0.8% | | | | | | | | | | | | |
aDaimler AG (EUR Traded) | | | Germany | | | | 663,837 | | | | 45,219,403 | |
| | | | | | | | | | | | |
Beverages 4.0% | | | | | | | | | | | | |
Brown-Forman Corp., A | | | United States | | | | 7,455 | | | | 518,197 | |
Brown-Forman Corp., B | | | United States | | | | 59,819 | | | | 4,164,599 | |
Carlsberg AS, B | | | Denmark | | | | 198,803 | | | | 19,925,967 | |
Coca-Cola Enterprises Inc. | | | United Kingdom | | | | 1,382,660 | | | | 34,607,980 | |
Dr. Pepper Snapple Group Inc. | | | United States | | | | 1,302,464 | | | | 45,794,634 | |
PepsiCo Inc. | | | United States | | | | 677,058 | | | | 44,232,199 | |
Pernod Ricard SA | | | France | | | | 792,451 | | | | 74,588,732 | |
| | | | | | | | | | | | |
| | | | | | | | | | | 223,832,308 | |
| | | | | | | | | | | | |
Biotechnology 1.6% | | | | | | | | | | | | |
aAmgen Inc. | | | United States | | | | 563,160 | | | | 30,917,484 | |
aGenzyme Corp. | | | United States | | | | 849,460 | | | | 60,481,552 | |
| | | | | | | | | | | | |
| | | | | | | | | | | 91,399,036 | |
| | | | | | | | | | | | |
Building Products 0.7% | | | | | | | | | | | | |
aOwens Corning Inc. | | | United States | | | | 1,293,251 | | | | 40,284,769 | |
| | | | | | | | | | | | |
Capital Markets 1.8% | | | | | | | | | | | | |
Morgan Stanley | | | United States | | | | 2,232,590 | | | | 60,748,774 | |
aUBS AG (CHF Traded) | | | Switzerland | | | | 2,545,758 | | | | 41,838,742 | |
| | | | | | | | | | | | |
| | | | | | | | | | | 102,587,516 | |
| | | | | | | | | | | | |
Chemicals 1.2% | | | | | | | | | | | | |
a,b,cDow Corning Corp., Contingent Distribution | | | United States | | | | 650,000 | | | | 25,000 | |
Linde AG | | | Germany | | | | 455,240 | | | | 69,151,647 | |
| | | | | | | | | | | | |
| | | | | | | | | | | 69,176,647 | |
| | | | | | | | | | | | |
Commercial Banks 3.8% | | | | | | | | | | | | |
Barclays PLC | | | United Kingdom | | | | 11,141,292 | | | | 45,662,742 | |
a,dElephant Capital Holdings Ltd. | | | Japan | | | | 11,728 | | | | — | |
a,dFirst Southern Bancorp Inc. | | | United States | | | | 140,952 | | | | 1,805,370 | |
aGuaranty Bancorp | | | United States | | | | 1,288,316 | | | | 1,816,526 | |
Intesa Sanpaolo SpA | | | Italy | | | | 5,663,270 | | | | 15,379,361 | |
a,dNCB Warrant Holdings Ltd., A | | | Japan | | | | 57,295 | | | | — | |
PNC Financial Services Group Inc. | | | United States | | | | 1,091,270 | | | | 66,261,914 | |
a,dState Bank Financial Corp. | | | United States | | | | 433,000 | | | | 6,495,000 | |
Wells Fargo & Co. | | | United States | | | | 2,539,150 | | | | 78,688,258 | |
| | | | | | | | | | | | |
| | | | | | | | | | | 216,109,171 | |
| | | | | | | | | | | | |
MS-13
Franklin Templeton Variable Insurance Products Trust
Statement of Investments, December 31, 2010 (continued)
| | | | | | | | | | | | |
| Mutual Shares Securities Fund | | Country | | | Shares | | | Value | |
Common Stocks and Other Equity Interests (continued) | | | | | | | | | | | | |
Commercial Services & Supplies 0.0%† | | | | | | | | | | | | |
aComdisco Holding Co. Inc. | | | United States | | | | 180 | | | $ | 1,575 | |
a,b,cComdisco Holding Co. Inc., Contingent Distribution | | | United States | | | | 7,473,000 | | | | — | |
| | | | | | | | | | | | |
| | | | | | | | | | | 1,575 | |
| | | | | | | | | | | | |
Communications Equipment 0.8% | | | | | | | | | | | | |
aMotorola Inc. | | | United States | | | | 5,130,743 | | | | 46,535,839 | |
| | | | | | | | | | | | |
Computers & Peripherals 1.1% | | | | | | | | | | | | |
a,b,cDecisionOne Corp., Contingent Distribution | | | United States | | | | 167,652 | | | | — | |
Hewlett-Packard Co. | | | United States | | | | 1,523,703 | | | | 64,147,896 | |
| | | | | | | | | | | | |
| | | | | | | | | | | 64,147,896 | |
| | | | | | | | | | | | |
Consumer Finance 0.5% | | | | | | | | | | | | |
a,dAlly Financial Inc. | | | United States | | | | 1,376 | | | | 9,772,866 | |
a,dCerberus CG Investor I LLC | | | United States | | | | 9,192,800 | | | | 7,446,168 | |
a,dCerberus CG Investor II LLC | | | United States | | | | 9,192,662 | | | | 7,446,056 | |
a,dCerberus CG Investor III LLC | | | United States | | | | 4,596,951 | | | | 3,723,531 | |
| | | | | | | | | | | | |
| | | | | | | | | | | 28,388,621 | |
| | | | | | | | | | | | |
Diversified Financial Services 1.9% | | | | | | | | | | | | |
Bank of America Corp. | | | United States | | | | 4,328,920 | | | | 57,747,793 | |
a,fBond Street Holdings LLC, A, 144A | | | United States | | | | 477,632 | | | | 9,695,929 | |
Deutsche Boerse AG | | | Germany | | | | 552,620 | | | | 38,294,053 | |
a,b,cMarconi Corp., Contingent Distribution | | | United Kingdom | | | | 9,945,700 | | | | — | |
| | | | | | | | | | | | |
| | | | | | | | | | | 105,737,775 | |
| | | | | | | | | | | | |
Diversified Telecommunication Services 2.0% | | | | | | | | | | | | |
AboveNet Inc. | | | United States | | | | 131,103 | | | | 7,664,282 | |
Cable & Wireless Communication PLC | | | United Kingdom | | | | 20,212,409 | | | | 15,341,481 | |
Cable & Wireless Worldwide PLC | | | United Kingdom | | | | 20,212,409 | | | | 20,702,327 | |
a,b,cGlobal Crossing Holdings Ltd., Contingent Distribution | | | United States | | | | 9,005,048 | | | | — | |
Telefonica SA | | | Spain | | | | 3,079,721 | | | | 69,894,051 | |
| | | | | | | | | | | | |
| | | | | | | | | | | 113,602,141 | |
| | | | | | | | | | | | |
Electric Utilities 2.9% | | | | | | | | | | | | |
a,b,cCalpine Corp., Contingent Distribution | | | United States | | | | 4,555,000 | | | | — | |
E.ON AG | | | Germany | | | | 2,156,953 | | | | 65,976,134 | |
Entergy Corp. | | | United States | | | | 319,190 | | | | 22,608,227 | |
Exelon Corp. | | | United States | | | | 1,196,059 | | | | 49,803,897 | |
dPrime AET&D Holdings No. 1 Pty. Ltd. | | | Australia | | | | 4,709,226 | | | | — | |
cPrime Infrastructure Group | | | Australia | | | | 4,709,226 | | | | 23,791,010 | |
| | | | | | | | | | | | |
| | | | | | | | | | | 162,179,268 | |
| | | | | | | | | | | | |
Electrical Equipment 0.6% | | | | | | | | | | | | |
Alstom SA | | | France | | | | 654,500 | | | | 31,353,711 | |
| | | | | | | | | | | | |
Electronic Equipment, Instruments & Components 0.8% | | | | | | | | | | | | |
Tyco Electronics Ltd. | | | United States | | | | 1,199,372 | | | | 42,457,769 | |
| | | | | | | | | | | | |
Energy Equipment & Services 2.5% | | | | | | | | | | | | |
Baker Hughes Inc. | | | United States | | | | 610,929 | | | | 34,926,811 | |
aExterran Holding Inc. | | | United States | | | | 613,890 | | | | 14,702,665 | |
aPride International Inc. | | | United States | | | | 700,754 | | | | 23,124,882 | |
aTransocean Ltd. | | | United States | | | | 996,727 | | | | 69,282,494 | |
| | | | | | | | | | | | |
| | | | | | | | | | | 142,036,852 | |
| | | | | | | | | | | | |
MS-14
Franklin Templeton Variable Insurance Products Trust
Statement of Investments, December 31, 2010 (continued)
| | | | | | | | | | | | |
| Mutual Shares Securities Fund | | Country | | | Shares | | | Value | |
Common Stocks and Other Equity Interests (continued) | | | | | | | | | | | | |
Food & Staples Retailing 5.3% | | | | | | | | | | | | |
Carrefour SA | | | France | | | | 662,185 | | | $ | 27,328,103 | |
CVS Caremark Corp. | | | United States | | | | 4,766,105 | | | | 165,717,471 | |
Kroger Co. | | | United States | | | | 2,950,978 | | �� | | 65,983,868 | |
Wal-Mart Stores Inc. | | | United States | | | | 781,682 | | | | 42,156,110 | |
| | | | | | | | | | | | |
| | | | | | | | | | | 301,185,552 | |
| | | | | | | | | | | | |
Food Products 4.4% | | | | | | | | | | | | |
General Mills Inc. | | | United States | | | | 1,253,560 | | | | 44,614,200 | |
Kraft Foods Inc., A | | | United States | | | | 3,863,999 | | | | 121,754,609 | |
Nestle SA | | | Switzerland | | | | 1,436,003 | | | | 84,176,835 | |
| | | | | | | | | | | | |
| | | | | | | | | | | 250,545,644 | |
| | | | | | | | | | | | |
Health Care Equipment & Supplies 2.6% | | | | | | | | | | | | |
Alcon Inc. | | | Switzerland | | | | 235,373 | | | | 38,459,948 | |
aBoston Scientific Corp. | | | United States | | | | 4,521,950 | | | | 34,231,162 | |
Medtronic Inc. | | | United States | | | | 1,473,130 | | | | 54,638,392 | |
aZimmer Holdings Inc. | | | United States | | | | 319,411 | | | | 17,145,982 | |
| | | | | | | | | | | | |
| | | | | | | | | | | 144,475,484 | |
| | | | | | | | | | | | |
Health Care Providers & Services 3.5% | | | | | | | | | | | | |
aCommunity Health Systems Inc. | | | United States | | | | 1,277,022 | | | | 47,722,312 | |
aCoventry Health Care Inc. | | | United States | | | | 62,400 | | | | 1,647,360 | |
aTenet Healthcare Corp. | | | United States | | | | 6,379,987 | | | | 42,682,113 | |
UnitedHealth Group Inc. | | | United States | | | | 2,930,220 | | | | 105,810,244 | |
| | | | | | | | | | | | |
| | | | | | | | | | | 197,862,029 | |
| | | | | | | | | | | | |
Hotels, Restaurants & Leisure 0.1% | | | | | | | | | | | | |
a,d,gGLCP Harrah’s Investment LP | | | United States | | | | 5,565,600 | | | | 2,369,832 | |
Thomas Cook Group PLC | | | United Kingdom | | | | 1,474,171 | | | | 4,351,464 | |
| | | | | | | | | | | | |
| | | | | | | | | | | 6,721,296 | |
| | | | | | | | | | | | |
Household Durables 0.5% | | | | | | | | | | | | |
Stanley Black & Decker Inc. | | | United States | | | | 436,490 | | | | 29,188,086 | |
| | | | | | | | | | | | |
Independent Power Producers & Energy Traders 0.7% | | | | | | | | | | | | |
aNRG Energy Inc. | | | United States | | | | 1,951,380 | | | | 38,129,965 | |
| | | | | | | | | | | | |
Industrial Conglomerates 0.9% | | | | | | | | | | | | |
Orkla ASA | | | Norway | | | | 5,148,369 | | | | 50,134,394 | |
| | | | | | | | | | | | |
Insurance 3.7% | | | | | | | | | | | | |
ACE Ltd. | | | United States | | | | 939,785 | | | | 58,501,616 | |
aAlleghany Corp. | | | United States | | | | 24,294 | | | | 7,442,953 | |
aBerkshire Hathaway Inc., A | | | United States | | | | 121 | | | | 14,574,450 | |
aBerkshire Hathaway Inc., B | | | United States | | | | 71,859 | | | | 5,756,625 | |
aCNO Financial Group Inc. | | | United States | | | | 964,957 | | | | 6,542,408 | |
Old Republic International Corp. | | | United States | | | | 2,329,142 | | | | 31,746,206 | |
a,dOlympus Re Holdings Ltd. | | | United States | | | | 16,280 | | | | 6,186 | |
White Mountains Insurance Group Ltd. | | | United States | | | | 140,935 | | | | 47,297,786 | |
Zurich Financial Services AG | | | Switzerland | | | | 137,066 | | | | 35,543,239 | |
| | | | | | | | | | | | |
| | | | | | | | | | | 207,411,469 | |
| | | | | | | | | | | | |
IT Services 0.0%† | | | | | | | | | | | | |
dGlodyne Technoserve Ltd. | | | India | | | | 6,635 | | | | 95,515 | |
| | | | | | | | | | | | |
Leisure Equipment & Products 0.7% | | | | | | | | | | | | |
Mattel Inc. | | | United States | | | | 1,509,886 | | | | 38,396,401 | |
| | | | | | | | | | | | |
MS-15
Franklin Templeton Variable Insurance Products Trust
Statement of Investments, December 31, 2010 (continued)
| | | | | | | | | | | | |
| Mutual Shares Securities Fund | | Country | | | Shares | | | Value | |
Common Stocks and Other Equity Interests (continued) | | | | | | | | | | | | |
Machinery 0.1% | | | | | | | | | | | | |
Federal Signal Corp. | | | United States | | | | 930,921 | | | $ | 6,386,118 | |
| | | | | | | | | | | | |
Marine 1.2% | | | | | | | | | | | | |
A.P. Moller - Maersk AS, B | | | Denmark | | | | 7,669 | | | | 69,516,742 | |
| | | | | | | | | | | | |
Media 5.0% | | | | | | | | | | | | |
British Sky Broadcasting Group PLC | | | United Kingdom | | | | 4,160,735 | | | | 47,808,946 | |
Comcast Corp., A, Special | | | United States | | | | 889,600 | | | | 18,512,576 | |
News Corp., A | | | United States | | | | 3,158,079 | | | | 45,981,630 | |
Time Warner Cable Inc. | | | United States | | | | 964,069 | | | | 63,657,476 | |
Time Warner Inc. | | | United States | | | | 1,929,216 | | | | 62,062,879 | |
Virgin Media Inc. | | | United Kingdom | | | | 1,675,019 | | | | 45,627,518 | |
| | | | | | | | | | | | |
| | | | | | | | | | | 283,651,025 | |
| | | | | | | | | | | | |
Metals & Mining 0.0%† | | | | | | | | | | | | |
aThyssenKrupp AG | | | Germany | | | | 28,695 | | | | 1,193,444 | |
| | | | | | | | | | | | |
Multi-Utilities 0.8% | | | | | | | | | | | | |
GDF Suez | | | France | | | | 1,236,342 | | | | 44,407,660 | |
| | | | | | | | | | | | |
Office Electronics 1.6% | | | | | | | | | | | | |
Xerox Corp. | | | United States | | | | 7,798,704 | | | | 89,841,070 | |
| | | | | | | | | | | | |
Oil, Gas & Consumable Fuels 4.3% | | | | | | | | | | | | |
BP PLC | | | United Kingdom | | | | 4,211,280 | | | | 30,620,550 | |
Marathon Oil Corp. | | | United States | | | | 2,325,884 | | | | 86,127,485 | |
Noble Energy Inc. | | | United States | | | | 255,029 | | | | 21,952,896 | |
Royal Dutch Shell PLC, A | | | United Kingdom | | | | 2,258,779 | | | | 74,726,189 | |
Total SA, B | | | France | | | | 548,419 | | | | 29,089,125 | |
| | | | | | | | | | | | |
| | | | | | | | | | | 242,516,245 | |
| | | | | | | | | | | | |
Paper & Forest Products 2.2% | | | | | | | | | | | | |
Domtar Corp. | | | United States | | | | 219,608 | | | | 16,672,639 | |
International Paper Co. | | | United States | | | | 2,579,184 | | | | 70,256,972 | |
MeadWestvaco Corp. | | | United States | | | | 1,464,799 | | | | 38,319,142 | |
| | | | | | | | | | | | |
| | | | | | | | | | | 125,248,753 | |
| | | | | | | | | | | | |
Pharmaceuticals 3.0% | | | | | | | | | | | | |
Eli Lilly & Co. | | | United States | | | | 2,363,280 | | | | 82,809,331 | |
Pfizer Inc. | | | United States | | | | 4,997,649 | | | | 87,508,834 | |
| | | | | | | | | | | | |
| | | | | | | | | | | 170,318,165 | |
| | | | | | | | | | | | |
Real Estate Investment Trusts (REITs) 1.7% | | | | | | | | | | | | |
Alexander’s Inc. | | | United States | | | | 49,326 | | | | 20,336,123 | |
The Link REIT | | | Hong Kong | | | | 5,777,287 | | | | 17,950,657 | |
Weyerhaeuser Co. | | | United States | | | | 3,122,690 | | | | 59,112,522 | |
| | | | | | | | | | | | |
| | | | | | | | | | | 97,399,302 | |
| | | | | | | | | | | | |
Real Estate Management & Development 0.4% | | | | | | | | | | | | |
cCanary Wharf Group PLC | | | United Kingdom | | | | 1,535,898 | | | | 6,659,198 | |
aForestar Group Inc. | | | United States | | | | 330,463 | | | | 6,377,936 | |
a,hThe St. Joe Co. | | | United States | | | | 442,962 | | | | 9,678,720 | |
| | | | | | | | | | | | |
| | | | | | | | | | | 22,715,854 | |
| | | | | | | | | | | | |
Semiconductors & Semiconductor Equipment 1.6% | | | | | | | | | | | | |
aLSI Corp. | | | United States | | | | 7,780,673 | | | | 46,606,231 | |
Maxim Integrated Products Inc. | | | United States | | | | 1,935,403 | | | | 45,714,219 | |
| | | | | | | | | | | | |
| | | | | | | | | | | 92,320,450 | |
| | | | | | | | | | | | |
MS-16
Franklin Templeton Variable Insurance Products Trust
Statement of Investments, December 31, 2010 (continued)
| | | | | | | | | | | | |
| Mutual Shares Securities Fund | | Country | | | Shares | | | Value | |
Common Stocks and Other Equity Interests (continued) | | | | | | | | | | | | |
Software 3.7% | | | | | | | | | | | | |
aMcAfee Inc. | | | United States | | | | 591,830 | | | $ | 27,407,647 | |
Microsoft Corp. | | | United States | | | | 4,218,003 | | | | 117,766,644 | |
Nintendo Co. Ltd. | | | Japan | | | | 123,923 | | | | 36,379,244 | |
aSymantec Corp. | | | United States | | | | 1,739,900 | | | | 29,125,926 | |
| | | | | | | | | | | | |
| | | | | | | | | | | 210,679,461 | |
| | | | | | | | | | | | |
Tobacco 8.1% | | | | | | | | | | | | |
Altria Group Inc. | | | United States | | | | 3,672,424 | | | | 90,415,079 | |
British American Tobacco PLC | | | United Kingdom | | | | 3,534,227 | | | | 135,890,665 | |
British American Tobacco PLC, ADR | | | United Kingdom | | | | 4,218 | | | | 327,739 | |
Imperial Tobacco Group PLC | | | United Kingdom | | | | 2,811,499 | | | | 86,542,887 | |
Japan Tobacco Inc. | | | Japan | | | | 8,960 | | | | 33,168,833 | |
Lorillard Inc. | | | United States | | | | 405,204 | | | | 33,251,040 | |
Philip Morris International Inc. | | | United States | | | | 599,920 | | | | 35,113,318 | |
Reynolds American Inc. | | | United States | | | | 1,379,742 | | | | 45,007,184 | |
| | | | | | | | | | | | |
| | | | | | | | | | | 459,716,745 | |
| | | | | | | | | | | | |
Transportation Infrastructure 0.1% | | | | | | | | | | | | |
Groupe Eurotunnel SA | | | France | | | | 324,528 | | | | 2,856,624 | |
| | | | | | | | | | | | |
Wireless Telecommunication Services 1.5% | | | | | | | | | | | | |
Vodafone Group PLC | | | United Kingdom | | | | 33,562,610 | | | | 86,869,731 | |
| | | | | | | | | | | | |
Total Common Stocks and Other Equity Interests
(Cost $4,416,031,293) | | | | | | | | | | | 4,837,844,461 | |
| | | | | | | | | | | | |
Preferred Stocks (Cost $241,000) 0.0%† | | | | | | | | | | | | |
Commercial Banks 0.0%† | | | | | | | | | | | | |
a,dFirst Southern Bancorp Inc., cvt. pfd., C | | | United States | | | | 241 | | | | 883,260 | |
| | | | | | | | | | | | |
| | | |
| | | | | | Principal
Amount* | | | | |
Corporate Bonds, Notes and Senior Floating Rate Interests 4.2% | | | | | | | | | | | | |
i Avaya Inc., Term Loan B-1, FRN, 3.034%, 10/26/14 | | | United States | | | | 1,710,188 | | | | 1,620,710 | |
iBoston Generating LLC, FRN, | | | | | | | | | | | | |
Revolver, 6.50%, 12/21/13 | | | United States | | | | 117,273 | | | | 112,729 | |
Synthetic Letter of Credit, 4.928%, 12/21/13 | | | United States | | | | 1,236,360 | | | | 1,188,451 | |
Term Loan B, 6.50%, 12/21/13 | | | United States | | | | 7,307,112 | | | | 7,023,961 | |
dBroadband Ventures III LLC, secured promissory note, 5.00%, 2/01/12 | | | United States | | | | 4,255 | | | | 4,255 | |
d,jCerberus CG Investor I LLC, 12.00%, 7/31/14 | | | United States | | | | 7,173,000 | | | | 5,810,130 | |
d,jCerberus CG Investor II LLC, 12.00%, 7/31/14 | | | United States | | | | 7,173,000 | | | | 5,810,130 | |
d,jCerberus CG Investor III LLC, 12.00%, 7/31/14 | | | United States | | | | 3,586,500 | | | | 2,905,065 | |
CIT Group Inc.,
senior secured sub. bond, 7.00%, 5/01/16 | | | United States | | | | 24,538,436 | | | | 24,691,801 | |
senior secured sub. bond, 7.00%, 5/01/17 | | | United States | | | | 21,729,811 | | | | 21,838,460 | |
iTerm Loan Tranche 3, FRN, 6.25%, 8/11/15 | | | United States | | | | 11,079,747 | | | | 11,317,496 | |
iFirst Data Corp., Term Loan, FRN, 3.011%, 9/24/14, | | | | | | | | | | | | |
B-1 | | | United States | | | | 18,959,875 | | | | 17,521,598 | |
B-2 | | | United States | | | | 14,272,801 | | | | 13,190,081 | |
B-3 | | | United States | | | | 1,908,500 | | | | 1,766,025 | |
d,eInternational Automotive Components Group North America LLC, 11.00%, 11/12/14 | | | United States | | | | 1,456,500 | | | | 1,456,500 | |
MS-17
Franklin Templeton Variable Insurance Products Trust
Statement of Investments, December 31, 2010 (continued)
| | | | | | | | | | | | |
| Mutual Shares Securities Fund | | Country | | | Principal
Amount* | | | Value | |
Corporate Bonds, Notes and Senior Floating Rate Interests (continued) | | | | | | | | | |
Realogy Corp.,
iDelayed Draw Term Loan B, FRN, 3.286%, 10/10/13 | | | United States | | | | 21,163,235 | | | $ | 19,905,356 | |
iInitial Term Loan B, FRN, 3.286%, 10/10/13 | | | United States | | | | 29,581,452 | | | | 27,823,220 | |
Second Lien Term Loan, 13.50%, 10/15/17 | | | United States | | | | 1,642,000 | | | | 1,799,016 | |
iSynthetic Letter of Credit, FRN, 3.254%, 10/10/13 | | | United States | | | | 4,029,540 | | | | 3,790,036 | |
iSmurfit-Stone Container Enterprises, Exit Term Loan, FRN, 6.75%, 2/22/16 | | | United States | | | | 9,031,615 | | | | 9,196,442 | |
iTexas Competitive Electric Holdings Co. LLC, FRN, 3.764%, 10/10/14, | | | | | | | | | | | | |
Delayed Draw Term Loan | | | United States | | | | 35,769,312 | | | | 27,492,687 | |
Initial Tranche B-1 Term Loan | | | United States | | | | 18,485,114 | | | | 14,324,909 | |
Tranche B-2 Term Loan | | | United States | | | | 2,914,814 | | | | 2,257,821 | |
Tranche B-3 Term Loan | | | United States | | | | 19,847,804 | | | | 15,351,601 | |
| | | | | | | | | | | | |
Total Corporate Bonds, Notes and Senior Floating Rate Interests (Cost $226,571,613) | | | | | | | | | | | 238,198,480 | |
| | | | | | | | | | | | |
| | | |
| | | | | | Shares | | | | |
Companies in Liquidation 0.0%† | | | | | | | | | | | | |
aAdelphia Recovery Trust | | | United States | | | | 29,283,354 | | | | 292,834 | |
a,bAdelphia Recovery Trust, Arahova Contingent Value Vehicle, Contingent Distribution | | | United States | | | | 1,955,453 | | | | 195,545 | |
a,d,e,gCB FIM Coinvestors LLC | | | United States | | | | 6,400,507 | | | | — | |
a,b,cCentury Communications Corp., Contingent Distribution | | | United States | | | | 5,487,000 | | | | — | |
a,dFIM Coinvestor Holdings I LLC | | | United States | | | | 8,006,950 | | | | — | |
a,b,cTropicana Entertainment LLC, Liquidating Trust | | | United States | | | | 18,305,000 | | | | 20,776 | |
| | | |
| | | | | | Principal
Amount* | | | | |
c,jPeregrine Investments Holdings Ltd., 6.70%, 1/15/98 | | | Hong Kong | | | | 5,000,000 | JPY | | | — | |
c,jPIV Investment Finance (Cayman) Ltd., 4.50%, 12/01/00 | | | Hong Kong | | | | 12,200,000 | | | | — | |
| | | | | | | | | | | | |
Total Companies in Liquidation (Cost $2,791,061) | | | | | | | | | | | 509,155 | |
| | | | | | | | | | | | |
Total Investments before Short Term Investments
(Cost $4,645,634,967) | | | | | | | | | | | 5,077,435,356 | |
| | | | | | | | | | | | |
Short Term Investments 10.2% | | | | | | | | | | | | |
U.S. Government and Agency Securities 10.0% | | | | | | | | | | | | |
kFHLB, 1/03/11 - 1/05/11 | | | United States | | | | 40,000,000 | | | | 39,999,985 | |
kU.S. Treasury Bills, 1/06/11 - 6/23/11 | | | United States | | | | 525,000,000 | | | | 524,844,845 | |
| | | | | | | | | | | | |
Total U.S. Government and Agency Securities
(Cost $564,791,527) | | | | | | | | | | | 564,844,830 | |
| | | | | | | | | | | | |
Total Investments before Money Market Funds
(Cost $5,210,426,494) | | | | | | | | | | | 5,642,280,186 | |
| | | | | | | | | | | | |
MS-18
Franklin Templeton Variable Insurance Products Trust
Statement of Investments, December 31, 2010 (continued)
| | | | | | | | | | | | |
| Mutual Shares Securities Fund | | Country | | | Shares | | | Value | |
lInvestments from Cash Collateral Received for Loaned Securities (Cost $9,102,000) 0.2% | | | | | | | | | | | | |
Money Market Funds 0.2% | | | | | | | | | | | | |
mBNY Mellon Overnight Government Fund, 0.19% | | | United States | | | | 9,102,000 | | | $ | 9,102,000 | |
| | | | | | | | | | | | |
Total Investments (Cost $5,219,528,494) 99.9% | | | | | | | | | | | 5,651,382,186 | |
Securities Sold Short (0.3)% | | | | | | | | | | | (16,796,724 | ) |
Other Assets, less Liabilities 0.4% | | | | | | | | | | | 23,029,753 | |
| | | | | | | | | | | | |
Net Assets 100.0% | | | | | | | | | | $ | 5,657,615,215 | |
| | | | | | | | | | | | |
Securities Sold Short (Proceeds $15,460,707) (0.3)% | | | | | | | | | | | | |
Communications Equipment (0.3)% | | | | | | | | | | | | |
nMotorola Mobility Holdings Inc., when-issued | | | United States | | | | 577,207 | | | $ | (16,796,724 | ) |
| | | | | | | | | | | | |
†Rounds to less than 0.1% of net assets.
*The principal amount is stated in U.S. dollars unless otherwise indicated.
aNon-income producing.
bContingent distributions represent the right to receive additional distributions, if any, during the reorganization of the underlying company. Shares represent total underlying principal of debt securities.
cSecurity has been deemed illiquid because it may not be able to be sold within seven days. At December 31, 2010, the aggregate value of these securities was $30,505,279, representing 0.54% of net assets.
dSee Note 9 regarding restricted securities.
eAt December 31, 2010, pursuant to the Fund’s policies and the requirements of applicable securities law, the Fund may be restricted from trading these securities for a limited or extended period of time due to ownership limits and/or potential possession of material non-public information.
fSecurity was purchased pursuant to Rule 144A under the Securities Act of 1933 and may be sold in transactions exempt from registration only to qualified institutional buyers or in a public offering registered under the Securities Act of 1933. This security has been deemed liquid under guidelines approved by the Trust’s Board of Trustees. At December 31, 2010, the value of this security was $9,695,929, representing 0.17% of net assets.
gSee Note 13 regarding holdings of 5% voting securities.
hA portion or all of the security is on loan at December 31, 2010. See Note 1(e).
iThe coupon rate shown represents the rate at period end.
jSee Note 7 regarding credit risk and defaulted securities.
kThe security is traded on a discount basis with no stated coupon rate.
lSee Note 1(e) regarding securities on loan.
mThe rate shown is the annualized seven-day yield at period end.
nShort position is the result of the sale of a when-issued security from a pending spin-off from Motorola Inc.
MS-19
Franklin Templeton Variable Insurance Products Trust
Statement of Investments, December 31, 2010 (continued)
|
| Mutual Shares Securities Fund |
At December 31, 2010, the Fund had the following forward exchange contracts outstanding. See Note 1(c).
| | | | | | | | | | | | | | | | | | | | | | | | | | | | |
| Currency | | Counterparty | | | Type | | | Quantity | | | Contract
Amount | | | Settlement
Date | | | Unrealized
Appreciation | | | Unrealized
Depreciation | |
British Pound | | | SSBT | | | | Sell | | | | 19,700,000 | | | $ | 29,786,400 | | | | 1/12/11 | | | $ | — | | | $ | (945,600 | ) |
British Pound | | | BOFA | | | | Buy | | | | 4,960,000 | | | | 7,917,398 | | | | 1/12/11 | | | | — | | | | (179,798 | ) |
British Pound | | | DBAB | | | | Buy | | | | 2,800,000 | | | | 4,440,660 | | | | 1/12/11 | | | | — | | | | (72,660 | ) |
British Pound | | | BOFA | | | | Sell | | | | 1,867,643 | | | | 2,841,814 | | | | 1/12/11 | | | | — | | | | (71,709 | ) |
British Pound | | | DBAB | | | | Sell | | | | 1,600,000 | | | | 2,454,288 | | | | 1/12/11 | | | | — | | | | (41,712 | ) |
British Pound | | | BOFA | | | | Buy | | | | 665,015 | | | | 1,035,841 | | | | 1/12/11 | | | | 1,583 | | | | — | |
British Pound | | | DBAB | | | | Sell | | | | 28,666,985 | | | | 45,195,492 | | | | 1/12/11 | | | | 474,996 | | | | — | |
Euro | | | BZWS | | | | Sell | | | | 41,250,000 | | | | 52,428,750 | | | | 1/18/11 | | | | — | | | | (2,751,832 | ) |
Euro | | | SSBT | | | | Sell | | | | 42,239,117 | | | | 53,831,897 | | | | 1/18/11 | | | | — | | | | (2,671,838 | ) |
Euro | | | BOFA | | | | Sell | | | | 27,190,140 | | | | 34,636,704 | | | | 1/18/11 | | | | — | | | | (1,735,848 | ) |
Euro | | | DBAB | | | | Buy | | | | 29,846,578 | | | | 41,482,835 | | | | 1/18/11 | | | | — | | | | (1,556,737 | ) |
Euro | | | DBAB | | | | Sell | | | | 6,780,000 | | | | 8,721,589 | | | | 1/18/11 | | | | — | | | | (348,092 | ) |
Euro | | | BOFA | | | | Buy | | | | 4,046,398 | | | | 5,553,321 | | | | 1/18/11 | | | | — | | | | (140,409 | ) |
Euro | | | SSBT | | | | Buy | | | | 136,078 | | | | 189,416 | | | | 1/18/11 | | | | — | | | | (7,382 | ) |
Euro | | | DBAB | | | | Buy | | | | 2,840,000 | | | | 3,699,158 | | | | 1/18/11 | | | | 99,941 | | | | — | |
Euro | | | BOFA | | | | Buy | | | | 3,003,000 | | | | 3,903,810 | | | | 1/18/11 | | | | 113,336 | | | | — | |
Euro | | | BOFA | | | | Sell | | | | 5,408,883 | | | | 7,473,015 | | | | 1/18/11 | | | | 237,493 | | | | — | |
Euro | | | DBAB | | | | Sell | | | | 940,000 | | | | 1,260,023 | | | | 1/18/11 | | | | 2,575 | | | | — | |
Danish Krone | | | HAND | | | | Sell | | | | 71,225,093 | | | | 12,246,428 | | | | 1/24/11 | | | | — | | | | (535,059 | ) |
Danish Krone | | | HAND | | | | Buy | | | | 12,255,129 | | | | 2,270,202 | | | | 1/24/11 | | | | — | | | | (70,995 | ) |
Danish Krone | | | SSBT | | | | Sell | | | | 2,025,000 | | | | 344,347 | | | | 1/24/11 | | | | — | | | | (19,044 | ) |
Danish Krone | | | DBAB | | | | Buy | | | | 2,394,426 | | | | 436,565 | | | | 1/24/11 | | | | — | | | | (6,880 | ) |
Danish Krone | | | HAND | | | | Buy | | | | 1,428,008 | | | | 256,003 | | | | 1/24/11 | | | | 256 | | | | — | |
Danish Krone | | | BOFA | | | | Buy | | | | 4,372,068 | | | | 763,733 | | | | 1/24/11 | | | | 20,843 | | | | — | |
Danish Krone | | | HAND | | | | Buy | | | | 7,461,171 | | | | 1,387,278 | | | | 1/25/11 | | | | — | | | | (48,359 | ) |
Danish Krone | | | BOFA | | | | Buy | | | | 3,770,000 | | | | 690,970 | | | | 1/25/11 | | | | — | | | | (14,437 | ) |
Danish Krone | | | HAND | | | | Sell | | | | 58,349,968 | | | | 10,940,380 | | | | 1/25/11 | | | | 469,385 | | | | — | |
Swiss Franc | | | SSBT | | | | Sell | | | | 100,743,441 | | | | 97,522,681 | | | | 2/10/11 | | | | — | | | | (10,393,405 | ) |
Swiss Franc | | | DBAB | | | | Sell | | | | 1,537,594 | | | | 1,540,000 | | | | 2/10/11 | | | | — | | | | (107,067 | ) |
Swiss Franc | | | DBAB | | | | Buy | | | | 12,787,123 | | | | 13,099,202 | | | | 2/10/11 | | | | 598,328 | | | | — | |
Swiss Franc | | | BOFA | | | | Buy | | | | 3,270,781 | | | | 3,436,584 | | | | 2/10/11 | | | | 67,068 | | | | — | |
British Pound | | | BZWS | | | | Buy | | | | 1,400,000 | | | | 2,229,794 | | | | 2/14/11 | | | | — | | | | (46,354 | ) |
British Pound | | | BZWS | | | | Sell | | | | 50,954,182 | | | | 81,146,063 | | | | 2/14/11 | | | | 1,677,921 | | | | — | |
British Pound | | | BOFA | | | | Sell | | | | 2,250,000 | | | | 3,656,768 | | | | 2/14/11 | | | | 147,668 | | | | — | |
British Pound | | | DBAB | | | | Sell | | | | 1,420,000 | | | | 2,291,383 | | | | 2/14/11 | | | | 76,751 | | | | — | |
Norwegian Krone | | | DBAB | | | | Sell | | | | 117,809,053 | | | | 18,874,060 | | | | 2/16/11 | | | | — | | | | (1,311,823 | ) |
Norwegian Krone | | | HAND | | | | Sell | | | | 14,669,930 | | | | 2,475,000 | | | | 2/16/11 | | | | — | | | | (38,606 | ) |
Norwegian Krone | | | BOFA | | | | Sell | | | | 2,244,050 | | | | 385,000 | | | | 2/16/11 | | | | 495 | | | | — | |
Euro | | | BOFA | | | | Sell | | | | 71,410,278 | | | | 91,757,649 | | | | 2/28/11 | | | | — | | | | (3,754,391 | ) |
Euro | | | BZWS | | | | Sell | | | | 39,013,340 | | | | 50,132,141 | | | | 2/28/11 | | | | — | | | | (2,048,633 | ) |
Euro | | | BZWS | | | | Buy | | | | 4,183,113 | | | | 5,712,669 | | | | 2/28/11 | | | | — | | | | (117,708 | ) |
Euro | | | DBAB | | | | Buy | | | | 6,536,890 | | | | 8,846,622 | | | | 2/28/11 | | | | — | | | | (103,460 | ) |
Euro | | | BOFA | | | | Buy | | | | 4,990,614 | | | | 6,773,006 | | | | 2/28/11 | | | | — | | | | (98,005 | ) |
Euro | | | DBAB | | | | Sell | | | | 940,000 | | | | 1,221,051 | | | | 2/28/11 | | | | — | | | | (36,210 | ) |
Euro | | | SSBT | | | | Buy | | | | 197,213 | | | | 272,054 | | | | 2/28/11 | | | | — | | | | (8,279 | ) |
Euro | | | DBAB | | | | Buy | | | | 1,800,000 | | | | 2,344,734 | | | | 2/28/11 | | | | 62,786 | | | | — | |
British Pound | | | DBAB | | | | Sell | | | | 40,502,114 | | | | 65,289,408 | | | | 3/15/11 | | | | 2,136,848 | | | | — | |
Euro | | | DBAB | | | | Buy | | | | 10,876,573 | | | | 14,879,344 | | | | 3/15/11 | | | | — | | | | (332,685 | ) |
Euro | | | BOFA | | | | Buy | | | | 9,030,397 | | | | 12,291,799 | | | | 3/15/11 | | | | — | | | | (214,272 | ) |
Euro | | | BZWS | | | | Buy | | | | 2,640,000 | | | | 3,551,513 | | | | 3/15/11 | | | | — | | | | (20,697 | ) |
Euro | | | HAND | | | | Sell | | | | 1,320,000 | | | | 1,752,973 | | | | 3/15/11 | | | | — | | | | (12,435 | ) |
MS-20
Franklin Templeton Variable Insurance Products Trust
Statement of Investments, December 31, 2010 (continued)
| | | | | | | | | | | | | | | | | | | | | | | | | | | | |
| Currency | | Counterparty | | | Type | | | Quantity | | | Contract
Amount | | | Settlement
Date | | | Unrealized
Appreciation | | | Unrealized
Depreciation | |
Euro | | | BOFA | | | | Sell | | | | 44,680,126 | | | $ | 61,658,574 | | | | 3/15/11 | | | $ | 1,902,016 | | | $ | — | |
Euro | | | DBAB | | | | Sell | | | | 39,787,895 | | | | 54,943,339 | | | | 3/15/11 | | | | 1,729,800 | | | | — | |
Euro | | | BZWS | | | | Sell | | | | 32,860,351 | | | | 45,317,710 | | | | 3/15/11 | | | | 1,369,278 | | | | — | |
British Pound | | | DBAB | | | | Buy | | | | 3,720,000 | | | | 5,938,162 | | | | 4/15/11 | | | | — | | | | (139,554 | ) |
British Pound | | | BOFA | | | | Buy | | | | 2,820,000 | | | | 4,476,031 | | | | 4/15/11 | | | | — | | | | (80,312 | ) |
British Pound | | | BOFA | | | | Buy | | | | 1,020,000 | | | | 1,582,652 | | | | 4/15/11 | | | | 7,288 | | | | — | |
British Pound | | | BZWS | | | | Sell | | | | 40,214,693 | | | | 64,826,085 | | | | 4/15/11 | | | | 2,140,808 | | | | — | |
Euro | | | BOFA | | | | Buy | | | | 2,550,000 | | | | 3,434,978 | | | | 4/15/11 | | | | — | | | | (24,986 | ) |
Euro | | | DBAB | | | | Buy | | | | 2,550,000 | | | | 3,429,113 | | | | 4/15/11 | | | | — | | | | (19,121 | ) |
Euro | | | BZWS | | | | Buy | | | | 573,897 | | | | 769,596 | | | | 4/15/11 | | | | — | | | | (2,151 | ) |
Euro | | | DBAB | | | | Buy | | | | 232,965 | | | | 304,755 | | | | 4/15/11 | | | | 6,777 | | | | — | |
Euro | | | SSBT | | | | Sell | | | | 25,664,644 | | | | 35,042,505 | | | | 4/15/11 | | | | 722,417 | | | | — | |
Euro | | | DBAB | | | | Sell | | | | 29,864,644 | | | | 40,777,837 | | | | 4/15/11 | | | | 841,292 | | | | — | |
Euro | | | BOFA | | | | Sell | | | | 18,343,872 | | | | 25,057,729 | | | | 4/15/11 | | | | 527,356 | | | | — | |
Japanese Yen | | | DBAB | | | | Sell | | | | 245,989,185 | | | | 2,975,000 | | | | 4/20/11 | | | | — | | | | (59,208 | ) |
Japanese Yen | | | BOFA | | | | Sell | | | | 35,047,625 | | | | 425,000 | | | | 4/20/11 | | | | — | | | | (7,302 | ) |
Japanese Yen | | | BZWS | | | | Sell | | | | 2,054,919,975 | | | | 25,351,855 | | | | 4/20/11 | | | | 4,993 | | | | — | |
Japanese Yen | | | DBAB | | | | Sell | | | | 23,327,177 | | | | 288,810 | | | | 4/20/11 | | | | 1,076 | | | | — | |
Swiss Franc | | | DBAB | | | | Sell | | | | 3,039,949 | | | | 3,153,147 | | | | 5/10/11 | | | | — | | | | (107,346 | ) |
Swiss Franc | | | SSBT | | | | Sell | | | | 1,902,051 | | | | 1,972,264 | | | | 5/10/11 | | | | — | | | | (67,780 | ) |
Swiss Franc | | | BOFA | | | | Buy | | | | 1,895,903 | | | | 1,973,358 | | | | 5/10/11 | | | | 60,092 | | | | — | |
British Pound | | | BZWS | | | | Sell | | | | 38,490,013 | | | | 62,095,938 | | | | 5/12/11 | | | | 2,117,409 | | | | — | |
British Pound | | | DBAB | | | | Sell | | | | 34,222,049 | | | | 55,159,099 | | | | 5/12/11 | | | | 1,831,287 | | | | — | |
Norwegian Krone | | | HAND | | | | Sell | | | | 130,195,297 | | | | 21,392,238 | | | | 5/18/11 | | | | — | | | | (809,553 | ) |
Norwegian Krone | | | HAND | | | | Buy | | | | 6,151,040 | | | | 982,500 | | | | 5/18/11 | | | | 66,417 | | | | — | |
| | | | | | | | | | | | | | | | | | | | | | | | |
Unrealized appreciation (depreciation) | | | | | | | | | | | | | | | | 19,516,579 | | | | (31,179,734 | ) |
| | | | | | | | | | | | | | | | | | | | | | | | |
Net unrealized appreciation (depreciation) | | | | | | | | | | | | | | | | | | | $ | (11,663,155 | ) |
| | | | | | | | | | | | | | | | | | | | | | | | | | | | |
See Abbreviations on page MS-37.
MS-21
Franklin Templeton Variable Insurance Products Trust
Financial Statements
Statement of Assets and Liabilities
December 31, 2010
| | | | |
| | | Mutual Shares
Securities Fund | |
Assets: | | | | |
Investments in securities: | | | | |
Cost - Unaffiliated issuers | | $ | 5,213,960,561 | |
Cost - Non-controlled affiliated issuers (Note 13) | | | 5,567,933 | |
| | | | |
Total cost of investments | | $ | 5,219,528,494 | |
| | | | |
Value - Unaffiliated issuers | | $ | 5,649,012,354 | |
Value - Non-controlled affiliated issuers (Note 13) | | | 2,369,832 | |
| | | | |
Total value of investments (includes securities loaned in the amount of $8,827,007) | | | 5,651,382,186 | |
Cash | | | 705,178 | |
Foreign currency, at value (cost $16,007,873) | | | 16,048,538 | |
Receivables: | | | | |
Investment securities sold | | | 37,548,554 | |
Capital shares sold | | | 1,035,064 | |
Dividends and interest | | | 14,651,122 | |
Unrealized appreciation on forward exchange contracts | | | 19,516,579 | |
Unrealized appreciation on unfunded loan commitments (Note 10) | | | 1,386,319 | |
Other assets | | | 328,722 | |
| | | | |
Total assets | | | 5,742,602,262 | |
| | | | |
Liabilities: | | | | |
Payables: | | | | |
Investment securities purchased | | | 17,212,625 | |
Capital shares redeemed | | | 2,125,422 | |
Affiliates | | | 5,054,182 | |
Securities sold short, at value (proceeds $15,460,707) | | | 16,796,724 | |
Payable upon return of securities loaned | | | 9,102,000 | |
Unrealized depreciation on forward exchange contracts | | | 31,179,734 | |
Accrued expenses and other liabilities | | | 3,516,360 | |
| | | | |
Total liabilities | | | 84,987,047 | |
| | | | |
Net assets, at value | | $ | 5,657,615,215 | |
| | | | |
Net assets consist of: | | | | |
Paid-in capital | | $ | 5,643,181,439 | |
Undistributed net investment income | | | 115,196,471 | |
Net unrealized appreciation (depreciation) | | | 420,724,533 | |
Accumulated net realized gain (loss) | | | (521,487,228 | ) |
| | | | |
Net assets, at value | | $ | 5,657,615,215 | |
| | | | |
The accompanying notes are an integral part of these financial statements.
MS-22
Franklin Templeton Variable Insurance Products Trust
Financial Statements (continued)
Statement of Assets and Liabilities (continued)
December 31, 2010
| | | | |
| | | Mutual Shares
Securities Fund | |
Class 1: | | | | |
Net assets, at value | | $ | 1,301,520,046 | |
| | | | |
Shares outstanding | | | 80,616,463 | |
| | | | |
Net asset value and maximum offering price per share | | $ | 16.14 | |
| | | | |
Class 2: | | | | |
Net assets, at value | | $ | 4,188,821,259 | |
| | | | |
Shares outstanding | | | 262,584,100 | |
| | | | |
Net asset value and maximum offering price per share | | $ | 15.95 | |
| | | | |
Class 4: | | | | |
Net assets, at value | | $ | 167,273,910 | |
| | | | |
Shares outstanding | | | 10,436,457 | |
| | | | |
Net asset value and maximum offering price per share | | $ | 16.03 | |
| | | | |
The accompanying notes are an integral part of these financial statements.
MS-23
Franklin Templeton Variable Insurance Products Trust
Financial Statements (continued)
Statement of Operations
for the year ended December 31, 2010
| | | | |
| | | Mutual Shares
Securities Fund | |
Investment income: | | | | |
Dividends (net of foreign taxes of $5,343,463) | | $ | 150,182,091 | |
Interest | | | 23,007,973 | |
Income from securities loaned | | | 604,583 | |
| | | | |
Total investment income | | | 173,794,647 | |
| | | | |
Expenses: | | | | |
Management fees (Note 3a) | | | 30,569,697 | |
Administrative fees (Note 3b) | | | 4,402,182 | |
Distribution fees: (Note 3c) | | | | |
Class 2 | | | 9,892,652 | |
Class 4 | | | 533,918 | |
Unaffiliated transfer agent fees | | | 2,846 | |
Custodian fees (Note 4) | | | 346,486 | |
Reports to shareholders | | | 963,086 | |
Professional fees | | | 599,842 | |
Trustees’ fees and expenses | | | 22,183 | |
Dividends on securities sold short | | | 737,617 | |
Other | | | 198,539 | |
| | | | |
Total expenses | | | 48,269,048 | |
Expense reductions (Note 4) | | | (71 | ) |
| | | | |
Net expenses | | | 48,268,977 | |
| | | | |
Net investment income | | | 125,525,670 | |
| | | | |
Realized and unrealized gains (losses): | | | | |
Net realized gain (loss) from: | | | | |
Investments: | | | | |
Unaffiliated issuers | | | 69,191,106 | |
Non-controlled affiliated issuers (Note 13) | | | (18,098,638 | ) |
Foreign currency transactions | | | 73,360,881 | |
Securities sold short | | | 1,815,533 | |
| | | | |
Net realized gain (loss) | | | 126,268,882 | |
| | | | |
Net change in unrealized appreciation (depreciation) on: | | | | |
Investments | | | 345,350,702 | |
Translation of other assets and liabilities denominated in foreign currencies | | | (44,502,047 | ) |
| | | | |
Net change in unrealized appreciation (depreciation) | | | 300,848,655 | |
| | | | |
Net realized and unrealized gain (loss) | | | 427,117,537 | |
| | | | |
Net increase (decrease) in net assets resulting from operations | | $ | 552,643,207 | |
| | | | |
The accompanying notes are an integral part of these financial statements.
MS-24
Franklin Templeton Variable Insurance Products Trust
Financial Statements (continued)
Statements of Changes in Net Assets
| | | | | | | | |
| | | Mutual Shares
Securities Fund | |
| | | Year Ended December 31, | |
| | | 2010 | | | 2009 | |
| | | | |
Increase (decrease) in net assets: | | | | | | | | |
Operations: | | | | | | | | |
Net investment income | | $ | 125,525,670 | | | $ | 65,304,934 | |
Net realized gain (loss) from investments, foreign currency transactions and securities sold short | | | 126,268,882 | | | | (405,802,552 | ) |
Net change in unrealized appreciation (depreciation) on investments and translation of other assets and liabilities denominated in foreign currencies | | | 300,848,655 | | | | 1,314,656,242 | |
| | | | |
Net increase (decrease) in net assets resulting from operations | | | 552,643,207 | | | | 974,158,624 | |
| | | | |
Distributions to shareholders from: | | | | | | | | |
Net investment income: | | | | | | | | |
Class 1 | | | (18,628,775 | ) | | | (11,770,982 | ) |
Class 2 | | | (62,378,105 | ) | | | (67,085,076 | ) |
Class 4 | | | (2,455,400 | ) | | | (2,339,365 | ) |
| | | | |
Total distributions to shareholders | | | (83,462,280 | ) | | | (81,195,423 | ) |
| | | | |
Capital share transactions: (Note 2) | | | | | | | | |
Class 1 | | | 440,450,926 | | | | 334,577,934 | |
Class 2 | | | (125,986,124 | ) | | | (105,733,549 | ) |
Class 4 | | | 11,534,796 | | | | 59,897,038 | |
| | | | |
Total capital share transactions | | | 325,999,598 | | | | 288,741,423 | |
| | | | |
Net increase (decrease) in net assets | | | 795,180,525 | | | | 1,181,704,624 | |
Net assets: | | | | | | | | |
Beginning of year | | | 4,862,434,690 | | | | 3,680,730,066 | |
| | | | |
End of year | | $ | 5,657,615,215 | | | $ | 4,862,434,690 | |
| | | | |
Undistributed net investment income included in net assets: | | | | | | | | |
End of year | | $ | 115,196,471 | | | $ | 67,796,719 | |
| | | | |
The accompanying notes are an integral part of these financial statements.
MS-25
Franklin Templeton Variable Insurance Products Trust
Notes to Financial Statements
Mutual Shares Securities Fund
1. ORGANIZATION AND SIGNIFICANT ACCOUNTING POLICIES
Franklin Templeton Variable Insurance Products Trust (Trust) is registered under the Investment Company Act of 1940, as amended, (1940 Act) as an open-end investment company, consisting of twenty separate funds. The Mutual Shares Securities (Fund) is included in this report. The financial statements of the remaining funds in the Trust are presented separately. Shares of the Fund are generally sold only to insurance company separate accounts to fund the benefits of variable life insurance policies or variable annuity contracts. The Fund offers three classes of shares: Class 1, Class 2, and Class 4. Each class of shares differs by its distribution fees, voting rights on matters affecting a single class and its exchange privilege.
The following summarizes the Fund’s significant accounting policies.
a. Financial Instrument Valuation
The Fund values its investments in securities and other assets and liabilities carried at fair value daily. Fair value is the price that would be received to sell an asset or paid to transfer a liability in an orderly transaction between market participants on the measurement date. Under procedures approved by Trust’s Board of Trustees, the Fund may utilize independent pricing services, quotations from securities and financial instrument dealers, and other market sources to determine fair value.
Equity securities listed on an exchange or on the NASDAQ National Market System are valued at the last quoted sale price or the official closing price of the day, respectively. Foreign equity securities are valued as of the close of trading on the foreign stock exchange on which the security is primarily traded, or the NYSE, whichever is earlier. The value is then converted into its U.S. dollar equivalent at the foreign exchange rate in effect at the close of the NYSE on the day that the value of the security is determined. Over-the-counter securities are valued within the range of the most recent quoted bid and ask prices. Securities that trade in multiple markets or on multiple exchanges are valued according to the broadest and most representative market. Certain equity securities are valued based upon fundamental characteristics or relationships to similar securities. Investments in non-registered money market funds are valued at the closing net asset value.
Debt securities generally trade in the over-the-counter market rather than on a securities exchange. The Fund’s pricing services use multiple valuation techniques to determine fair value. In instances where sufficient market activity exists, the pricing services may utilize a market-based approach through which quotes from market makers are used to determine fair value. In instances where sufficient market activity may not exist or is limited, the pricing services also utilize proprietary valuation models which may consider market characteristics such as benchmark yield curves, option-adjusted spreads, credit spreads, estimated default rates, coupon rates, anticipated timing of principal repayments, underlying collateral, and other unique security features in order to estimate the relevant cash flows, which are then discounted to calculate the fair value. Securities denominated in a foreign currency are converted into their U.S. dollar equivalent at the foreign exchange rate in effect at the close of the NYSE on the date that the values of the foreign debt securities are determined.
Certain derivative financial instruments (derivatives) trade in the over-the-counter market. The Fund’s pricing services use various techniques including industry standard option pricing models and proprietary discounted cash flow models to determine the fair value of those instruments. The Fund’s net benefit or obligation under the derivative contract, as measured by the fair market value of the contract, is included in net assets.
The Fund has procedures to determine the fair value of securities and other financial instruments for which market prices are not readily available or which may not be reliably priced. Under these procedures, the Fund primarily employs a market-based approach which may use related or comparable assets or liabilities, recent transactions, market multiples, book values, and other relevant information for the investment to determine the fair value of the investment. The Fund may also use an income-based valuation approach in which the anticipated future cash flows of the investment are discounted to calculate fair value. Discounts may also be applied due to the nature or duration of any restrictions on the disposition of the investments. Due to the inherent uncertainty of valuations of such investments, the fair values may differ significantly from the values that would have been used had an active market existed.
MS-26
Franklin Templeton Variable Insurance Products Trust
Notes to Financial Statements (continued)
Mutual Shares Securities Fund
1. ORGANIZATION AND SIGNIFICANT ACCOUNTING POLICIES (continued)
a. Financial Instrument Valuation (continued)
Trading in securities on foreign securities stock exchanges and over-the-counter markets may be completed before the daily close of business on the NYSE. Occasionally, events occur between the time at which trading in a foreign security is completed and the close of the NYSE that might call into question the reliability of the value of a portfolio security held by the Fund. As a result, differences may arise between the value of the Fund’s portfolio securities as determined at the foreign market close and the latest indications of value at the close of the NYSE. In order to minimize the potential for these differences, the investment manager monitors price movements following the close of trading in foreign stock markets through a series of country specific market proxies (such as baskets of American Depository Receipts, futures contracts and exchange traded funds). These price movements are measured against established trigger thresholds for each specific market proxy to assist in determining if an event has occurred that may call into question the reliability of the values of the foreign securities held by the Fund. If such an event occurs, the securities may be valued using fair value procedures, which may include the use of independent pricing services.
b. Foreign Currency Translation
Portfolio securities and other assets and liabilities denominated in foreign currencies are translated into U.S. dollars based on the exchange rate of such currencies against U.S. dollars on the date of valuation. The Fund may enter into foreign currency exchange contracts to facilitate transactions denominated in a foreign currency. Purchases and sales of securities, income and expense items denominated in foreign currencies are translated into U.S. dollars at the exchange rate in effect on the transaction date. Portfolio securities and assets and liabilities denominated in foreign currencies contain risks that those currencies will decline in value relative to the U.S. dollar. Occasionally, events may impact the availability or reliability of foreign exchange rates used to convert the U.S. dollar equivalent value. If such an event occurs, the foreign exchange rate will be valued at fair value using procedures established and approved by the Trust’s Board of Trustees.
The Fund does not separately report the effect of changes in foreign exchange rates from changes in market prices on securities held. Such changes are included in net realized and unrealized gain or loss from investments on the Statement of Operations.
Realized foreign exchange gains or losses arise from sales of foreign currencies, currency gains or losses realized between the trade and settlement dates on securities transactions and the difference between the recorded amounts of dividends, interest, and foreign withholding taxes and the U.S. dollar equivalent of the amounts actually received or paid. Net unrealized foreign exchange gains and losses arise from changes in foreign exchange rates on foreign denominated assets and liabilities other than investments in securities held at the end of the reporting period.
c. Derivative Financial Instruments
The Fund invested in derivatives in order to manage risk or gain exposure to various other investments or markets. Derivatives are financial contracts based on an underlying or notional amount, require no initial investment or an initial net investment that is smaller than would normally be required to have a similar response to changes in market factors, and require or permit net settlement. Derivatives contain various risks including the potential inability of the counterparty to fulfill their obligations under the terms of the contract, the potential for an illiquid secondary market, and/or the potential for market movements which expose the Fund to gains or losses in excess of the amounts shown on the Statement of Assets and Liabilities. Realized gain and loss and unrealized appreciation and depreciation on these contracts for the period are included in the Statement of Operations.
The Fund entered into forward exchange contracts primarily to manage exposure to certain foreign currencies. A forward exchange contract is an agreement between the Fund and a counterparty to buy or sell a foreign currency for a specific exchange rate on a future date. Pursuant to the terms of the forward exchange contracts, cash or securities may be required to be deposited as collateral. Unrestricted cash may be invested according to the Fund’s investment objectives.
See Note 12 regarding other derivative information.
MS-27
Franklin Templeton Variable Insurance Products Trust
Notes to Financial Statements (continued)
Mutual Shares Securities Fund
1. ORGANIZATION AND SIGNIFICANT ACCOUNTING POLICIES (continued)
d. Securities Sold Short
The Fund is engaged in selling securities short, which obligates the fund to replace a borrowed security with the same security at current market value. The fund incurs a loss if the price of the security increases between the date of the short sale and the date on which the fund replaces the borrowed security. The fund realizes a gain if the price of the security declines between those dates. Gains are limited to the price at which the fund sold the security short, while losses are potentially unlimited in size.
The fund is required to establish a margin account with the broker lending the security sold short. While the short sale is outstanding, the broker retains the proceeds of the short sale and the fund must maintain a deposit with broker consisting of cash and/or securities having a value equal to a specified percentage of the value of the securities sold short. The fund is obligated to pay stock loan fees for borrowing the securities sold short and is required to pay the counterparty any dividends or interest due on securities sold short. Such dividends or interest and any stock loan fees are recorded as an expense to the fund.
e. Securities Lending
The Fund participates in an agency based security lending program. The fund receives cash collateral against the loaned securities in an amount equal to at least 102% of the market value of the loaned securities. Collateral is maintained over the life of the loan in an amount not less than 100% of the market value of loaned securities, as determined at the close of fund business each day; any additional collateral required due to changes in security values is delivered to the fund on the next business day. The collateral is invested in a non-registered money fund managed by the fund’s custodian on the fund’s behalf. The fund receives income from the investment of cash collateral, in addition to lending fees and rebates paid by the borrower. The fund bears the market risk with respect to the collateral investment, securities loaned, and the risk that the agent may default on its obligations to the fund. The securities lending agent has agreed to indemnify the fund in the event of default by a third party borrower.
f. Income Taxes
It is the Fund’s policy to qualify as a regulated investment company under the Internal Revenue Code. The Fund intends to distribute to shareholders substantially all of its taxable income and net realized gains to relieve it from federal income and excise taxes. As a result, no provision for U.S. federal income taxes is required. The Fund files U.S. income tax returns as well as tax returns in certain other jurisdictions. The Fund’s application of those tax rules is subject to its understanding. The Fund records a provision for taxes in its financial statements including penalties and interest, if any, for a tax position taken on a tax return (or expected to be taken) when it fails to meet the more likely than not (a greater than 50% probability) threshold and based on the technical merits, the tax position may not be sustained upon examination by the tax authorities. As of December 31, 2010, and for all open tax years, the Fund has determined that no provision for income tax is required in the Fund’s financial statements. Open tax years are those that remain subject to examination and are based on each tax jurisdiction statute of limitation. The Fund is not aware of any tax position for which it is reasonably possible that the total amounts of unrecognized tax effects will significantly change in the next twelve months.
The Fund may be subject to foreign taxation related to income received, capital gains on the sale of securities and certain foreign currency transactions in the foreign jurisdictions in which it invests. Foreign taxes, if any, are recorded based on the tax regulations and rates that exist in the foreign markets in which the Fund invests. When a capital gain tax is determined to apply the Fund records an estimated deferred tax liability for net unrealized gains on these securities in an amount that would be payable if the securities were disposed of on the valuation date.
MS-28
Franklin Templeton Variable Insurance Products Trust
Notes to Financial Statements (continued)
Mutual Shares Securities Fund
1. ORGANIZATION AND SIGNIFICANT ACCOUNTING POLICIES (continued)
g. Security Transactions, Investment Income, Expenses and Distributions
Security transactions are accounted for on trade date. Realized gains and losses on security transactions are determined on a specific identification basis. Interest income and estimated expenses are accrued daily. Amortization of premium and accretion of discount on debt securities are included in interest income. Facility fees are recognized as income over the expected term of the loan. Dividend income and dividends declared on securities sold short are recorded on the ex-dividend date except that certain dividends from foreign securities are recognized as soon as the Fund is notified of the ex-dividend date. Distributions to shareholders are recorded on the ex-dividend date and are determined according to income tax regulations (tax basis). Distributable earnings determined on a tax basis may differ from earnings recorded in accordance with accounting principles generally accepted in the United States of America. These differences may be permanent or temporary. Permanent differences are reclassified among capital accounts to reflect their tax character. These reclassifications have no impact on net assets or the results of operations. Temporary differences are not reclassified, as they may reverse in subsequent periods.
Common expenses incurred by the Trust are allocated among the funds based on the ratio of net assets of each fund to the combined net assets of the Trust. Fund specific expenses are charged directly to the fund that incurred the expense.
Realized and unrealized gains and losses and net investment income, not including class specific expenses, are allocated daily to each class of shares based upon the relative proportion of net assets of each class. Differences in per share distributions, by class, are generally due to differences in class specific expenses.
h. Accounting Estimates
The preparation of financial statements in accordance with accounting principles generally accepted in the United States of America requires management to make estimates and assumptions that affect the reported amounts of assets and liabilities at the date of the financial statements and the amounts of income and expenses during the reporting period. Actual results could differ from those estimates.
i. Guarantees and Indemnifications
Under the Trust’s organizational documents, its officers and trustees are indemnified by the Trust against certain liabilities arising out of the performance of their duties to the Trust. Additionally, in the normal course of business, the Trust, on behalf of the Fund, enters into contracts with service providers that contain general indemnification clauses. The Trust’s maximum exposure under these arrangements is unknown as this would involve future claims that may be made against the Trust that have not yet occurred. Currently, the Trust expects the risk of loss to be remote.
MS-29
Franklin Templeton Variable Insurance Products Trust
Notes to Financial Statements (continued)
Mutual Shares Securities Fund
2. SHARES OF BENEFICIAL INTEREST
At December 31, 2010, there were an unlimited number of shares authorized (without par value). Transactions in the Fund’s shares were as follows:
| | | | | | | | | | | | | | | | |
| | | Year Ended December 31, | |
| | | 2010 | | | 2009 | |
| Class 1 Shares: | | Shares | | | Amount | | | Shares | | | Amount | |
Shares sold | | | 37,999,296 | | | $ | 576,826,047 | | | | 27,788,529 | | | $ | 362,470,917 | |
Shares issued in reinvestment of distributions | | | 1,260,404 | | | | 18,628,775 | | | | 864,242 | | | | 11,770,982 | |
Shares redeemed | | | (10,669,332 | ) | | | (155,003,896 | ) | | | (3,455,041 | ) | | | (39,663,965 | ) |
| | | | |
Net increase (decrease) | | | 28,590,368 | | | $ | 440,450,926 | | | | 25,197,730 | | | $ | 334,577,934 | |
| | | | |
Class 2 Shares: | | | | | | | | | | | | | | | | |
Shares sold | | | 24,723,011 | | | $ | 370,497,941 | | | | 26,685,456 | | | $ | 332,016,404 | |
Shares issued in reinvestment of distributions | | | 4,269,549 | | | | 62,378,105 | | | | 4,980,332 | | | | 67,085,076 | |
Shares redeemed | | | (37,538,246 | ) | | | (558,862,170 | ) | | | (41,070,597 | ) | | | (504,835,029 | ) |
| | | | |
Net increase (decrease) | | | (8,545,686 | ) | | $ | (125,986,124 | ) | | | (9,404,809 | ) | | $ | (105,733,549 | ) |
| | | | |
Class 4 Shares: | | | | | | | | | | | | | | | | |
Shares sold | | | 1,277,647 | | | $ | 19,039,058 | | | | 4,731,346 | | | $ | 58,567,480 | |
Shares issued on reinvestment of distributions | | | 167,148 | | | | 2,455,400 | | | | 172,647 | | | | 2,339,365 | |
Shares redeemed | | | (654,528 | ) | | | (9,959,662 | ) | | | (78,048 | ) | | | (1,009,807 | ) |
| | | | |
Net increase (decrease) | | | 790,267 | | | $ | 11,534,796 | | | | 4,825,945 | | | $ | 59,897,038 | |
| | | | |
3. TRANSACTIONS WITH AFFILIATES
Franklin Resources, Inc. is the holding company for various subsidiaries that together are referred to as Franklin Templeton Investments. Certain officers and trustees of the Fund are also officers and/or directors of the following subsidiaries:
| | |
| Subsidiary | | Affiliation |
Franklin Mutual Advisers, LLC (Franklin Mutual) | | Investment manager |
Franklin Templeton Services, LLC (FT Services) | | Administrative manager |
Franklin Templeton Distributors, Inc. (Distributors) | | Principal underwriter |
Franklin Templeton Investor Services, LLC (Investor Services) | | Transfer agent |
a. Management Fees
The Fund pays an investment management fee to Franklin Mutual based on the average daily net assets of the Fund as follows:
| | |
| Annualized Fee Rate | | Net Assets |
| 0.600% | | Up to and including $5 billion |
| 0.570% | | Over $5 billion, up to and including $10 billion |
| 0.550% | | Over $10 billion, up to and including $15 billion |
| 0.530% | | Over $15 billion, up to and including $20 billion |
| 0.510% | | In excess of $20 billion |
MS-30
Franklin Templeton Variable Insurance Products Trust
Notes to Financial Statements (continued)
Mutual Shares Securities Fund
3. TRANSACTIONS WITH AFFILIATES (continued)
b. Administrative Fees
The Fund pays an administrative fee to FT Services based on the Fund’s average daily net assets as follows:
| | |
| Annualized Fee Rate | | Net Assets |
| 0.150% | | Up to and including $200 million |
| 0.135% | | Over $200 million, up to and including $700 million |
| 0.100% | | Over $700 million, up to and including $1.2 billion |
| 0.075% | | In excess of $1.2 billion |
c. Distribution Fees
The Trust’s Board of Trustees has adopted distribution plans for Class 2 and Class 4 shares pursuant to Rule 12b-1 under the 1940 Act. Under the Fund’s compensation distribution plans, the Fund pays Distributors for costs incurred in connection with the servicing, sale and distribution of the Fund’s shares up to 0.35% per year of its average daily net assets of each class. The Board of Trustees has agreed to limit the current rate to 0.25% per year for Class 2.
d. Transfer Agent Fees
Investor Services, under terms of an agreement, performs shareholder servicing for the Fund and is not paid by the Fund for the services.
e. Other Affiliated Transactions
At December 31, 2010, Franklin Templeton Variable Insurance Products Trust — Franklin Templeton VIP Founding Funds Allocation Fund owned 20.37% of the Fund’s outstanding shares.
4. EXPENSE OFFSET ARRANGEMENT
The Fund has entered into an arrangement with its custodian whereby credits realized as a result of uninvested cash balances are used to reduce a portion of the Fund’s custodian expenses. During the year ended December 31, 2010, the custodian fees were reduced as noted in the Statement of Operations.
5. INCOME TAXES
For tax purposes, capital losses may be carried over to offset future capital gains, if any. At December 31, 2010, the Fund had tax basis capital losses of $510,953,703 expiring in 2017. During the year ended December 31, 2010, the Fund utilized $93,154,538 of capital loss carryforwards.
The tax character of distributions paid during the years ended December 31, 2010 and 2009, was as follows:
| | | | | | | | |
| | | 2010 | | | 2009 | |
Distributions paid from ordinary income | | $ | 83,462,280 | | | $ | 81,195,423 | |
| | | | |
MS-31
Franklin Templeton Variable Insurance Products Trust
Notes to Financial Statements (continued)
Mutual Shares Securities Fund
5. INCOME TAXES (continued)
At December 31, 2010, the cost of investments, net unrealized appreciation (depreciation), and undistributed ordinary income for income tax purposes were as follows:
| | | | |
Cost of investments | | $ | 5,259,096,324 | |
| | | | |
| |
Unrealized appreciation | | $ | 738,730,891 | |
Unrealized depreciation | | | (346,445,029 | ) |
| | | | |
Net unrealized appreciation (depreciation) | | $ | 392,285,862 | |
| | | | |
Distributable earnings - undistributed ordinary income | | $ | 132,771,905 | |
| | | | |
Net investment income differs for financial statement and tax purposes primarily due to differing treatments of foreign currency transactions, passive foreign investment company shares, pass-through entity income, bond discounts and premiums, and corporate actions.
Net realized gains (losses) differ for financial statement and tax purposes primarily due to differing treatments of wash sales, foreign currency transactions, pass-through entity income, bond discounts and premiums, and corporate actions.
6. INVESTMENT TRANSACTIONS
Purchases and sales of investments (excluding short term securities and securities sold short) for the year ended December 31, 2010, aggregated $1,903,946,940 and $1,456,538,133, respectively.
7. CREDIT RISK AND DEFAULTED SECURITIES
The Fund may purchase the pre-default or defaulted debt of distressed companies. Distressed companies are financially troubled and are about to be or are already involved in financial restructuring or bankruptcy. Risks associated with purchasing these securities include the possibility that the bankruptcy or other restructuring process takes longer than expected, or that distributions in restructuring are less than anticipated, either or both of which may result in unfavorable consequences to the Fund. If it becomes probable that the income on debt securities, including those of distressed companies, will not be collected, the Fund discontinues accruing income and recognizes an adjustment for uncollectible interest.
At December 31, 2010, the aggregate value of distressed company securities for which interest recognition has been discontinued was $14,525,325, representing 0.26% of the Fund’s net assets. For information as to specific securities, see the accompanying Statement of Investments.
8. CONCENTRATION OF RISK
Investing in foreign securities may include certain risks and considerations not typically associated with investing in U.S. securities, such as fluctuating currency values and changing local and regional economic, political and social conditions, which may result in greater market volatility. In addition, certain foreign securities may not be as liquid as U.S. securities.
9. RESTRICTED SECURITIES
The Fund may invest in securities that are restricted under the Securities Act of 1933 (1933 Act) or which are subject to legal, contractual, or other agreed upon restrictions on resale. Restricted securities are often purchased in private placement transactions, and cannot be sold without prior registration unless the sale is pursuant to an exemption under the 1933 Act. Disposal of these securities may require greater effort and expense, and prompt sale at an acceptable price may be difficult. The Fund may have registration rights for restricted securities. The issuer generally incurs all registration costs.
MS-32
Franklin Templeton Variable Insurance Products Trust
Notes to Financial Statements (continued)
Mutual Shares Securities Fund
9. RESTRICTED SECURITIES (continued)
At December 31, 2010, the Fund held investments in restricted securities, excluding certain securities exempt from registration under the 1933 Act deemed to be liquid, as follows:
| | | | | | | | | | | | | | | | |
Principal
Amount/
Shares | | | Issuer | | Acquisition
Dates | | | Cost | | | Value | |
| | 1,376 | | | Ally Financial Inc. | | | 11/20/06 - 6/02/09 | | | $ | 6,501,522 | | | $ | 9,772,866 | |
| | 4,255 | | | Broadband Ventures III LLC, secured promissory note, 5.00%, 2/01/12 | | | 7/01/10 | | | | 4,255 | | | | 4,255 | |
| | 6,400,507 | | | CB FIM Coinvestors LLC | | | 1/15/09 - 6/02/09 | | | | — | | | | — | |
| | 9,192,800 | | | Cerberus CG Investor I LLC | | | 7/26/07 - 4/28/10 | | | | 9,164,810 | | | | 7,446,168 | |
| | 7,173,000 | | | Cerberus CG Investor I LLC, 12.00%, 7/31/14 | | | 7/26/07 | | | | 7,173,000 | | | | 5,810,130 | |
| | 9,192,662 | | | Cerberus CG Investor II LLC | | | 7/26/07 - 4/28/10 | | | | 9,164,672 | | | | 7,446,056 | |
| | 7,173,000 | | | Cerberus CG Investor II LLC, 12.00%, 7/31/14 | | | 7/26/07 | | | | 7,173,000 | | | | 5,810,130 | |
| | 4,596,951 | | | Cerberus CG Investor III LLC | | | 7/26/07 - 4/28/10 | | | | 4,582,956 | | | | 3,723,531 | |
| | 3,586,500 | | | Cerberus CG Investor III LLC, 12.00%, 7/31/14 | | | 7/26/07 | | | | 3,586,500 | | | | 2,905,065 | |
| | 11,728 | | | Elephant Capital Holdings Ltd. | | | 8/29/03 - 3/10/08 | | | | 1,813,542 | | | | — | |
| | 8,006,950 | | | FIM Coinvestor Holdings I LLC | | | 11/20/06 - 6/02/09 | | | | — | | | | — | |
| | 140,952 | | | First Southern Bancorp Inc. | | | 1/27/10 - 7/07/10 | | | | 2,974,087 | | | | 1,805,370 | |
| | 241 | | | First Southern Bancorp Inc., cvt. pfd., C | | | 1/27/10 - 7/07/10 | | | | 241,000 | | | | 883,260 | |
| | 5,565,600 | | | GLCP Harrah's Investment LP | | | 1/15/08 | | | | 5,567,933 | | | | 2,369,832 | |
| | 6,635 | | | Glodyne Technoserve Ltd. | | | 6/21/10 | | | | 104,511 | | | | 95,515 | |
| | 168,957 | | | IACNA Investor LLC | | | 7/24/08 | | | | 62,949 | | | | 1,690 | |
| | 1,730,515 | | | International Automotive Components Group Brazil LLC | | | 4/13/06 - 12/26/08 | | | | 1,149,241 | | | | 3,061,523 | |
| | 11,387,027 | | | International Automotive Components Group North America LLC | | | 1/12/06 - 10/10/07 | | | | 13,926,539 | | | | 14,432,373 | |
| | 1,456,500 | | | International Automotive Components Group North America LLC, 11.00%, 11/12/14 | | | 11/11/10 | | | | 1,456,500 | | | | 1,456,500 | |
| | 57,295 | | | NCB Warrant Holdings Ltd., A | | | 12/16/05 - 3/10/08 | | | | 539,528 | | | | — | |
| | 16,280 | | | Olympus Re Holdings Ltd. | | | 12/19/01 | | | | 1,540,390 | | | | 6,186 | |
| | 4,709,226 | | | Prime AET&D Holdings No. 1 Pty. Ltd. | | | 10/13/10 | | | | — | | | | — | |
| | 433,000 | | | State Bank Financial Corp. | | | 7/24/09 | | | | 4,330,000 | | | | 6,495,000 | |
| | | | | | | | | | | | | | | | |
| | | | Total Restricted Securities (1.30% of Net Assets) | | | | | | | | | | $ | 73,525,450 | |
| | | | | | | | | | | | | | | | |
10. UNFUNDED LOAN COMMITMENTS
The Fund may enter into certain credit agreements, all or a portion of which may be unfunded. The Fund is obligated to fund these loan commitments at the borrowers’ discretion. Funded portions of credit agreements are presented on the Statement of Investments.
At December 31, 2010, unfunded commitments were as follows:
| | | | |
| Borrower | | Unfunded
Commitment | |
Realogy Corp., Revolver, FRN, 4/10/13 | | $ | 11,080,500 | |
| | | | |
Unfunded loan commitments and funded portions of credit agreements are marked to market daily and any unrealized appreciation or depreciation is included in the Statement of Assets and Liabilities and Statement of Operations.
11. UNFUNDED CAPITAL COMMITMENTS
The Fund may enter into certain capital commitments and may be obligated to perform on such agreements at a future date. The Fund monitors these commitments and assesses the probability of required performance. For any agreements whose probability
MS-33
Franklin Templeton Variable Insurance Products Trust
Notes to Financial Statements (continued)
Mutual Shares Securities Fund
11. UNFUNDED CAPITAL COMMITMENTS (continued)
of performance is determined to be greater than remote, the Fund assesses the fair value of the commitment. In instances where the probability of performance is greater than remote and the performance under the commitment would result in an unrealized loss, the Fund recognizes such losses on the Statement of Assets and Liabilities and the Statement of Operations.
At December 31, 2010, the Fund had aggregate unfunded capital commitments of $329,837, for which no depreciation has been recognized.
12. OTHER DERIVATIVE INFORMATION
At December 31, 2010, the Fund has invested in derivative contracts which are reflected on the Statement of Assets and Liabilities as follows:
| | | | | | | | | | | | |
| | | Asset Derivatives | | | Liability Derivatives | |
Derivative Contracts Not Accounted for as
Hedging Instruments | | Statement of Assets and
Liabilities Location | | Fair
Value
Amount | | | Statement of Assets and
Liabilities Location | | Fair
Value
Amount | |
Foreign exchange contracts | | Unrealized appreciation on forward exchange contracts | | $ | 19,516,579 | | | Unrealized depreciation on forward
exchange contracts | | $ | 31,179,734 | |
For the year ended December 31, 2010, the effect of derivative contracts on the Fund’s Statement of Operations was as follows:
| | | | | | | | | | | | | | |
Derivative Contracts Not
Accounted for as Hedging
Instruments | | Statement of Operations Locations | | Realized Gain
(Loss) for
the Year | | | Change in
Unrealized
Appreciation
(Depreciation)
for the Year | | | Average
Amount
Outstanding
During the
Yeara | |
Foreign exchange contracts | | Net realized gain (loss) from foreign currency transactions/Net change in unrealized appreciation (depreciation) on translation of other assets and liabilities denominated in foreign currencies | | $ | 74,178,702 | | | $ | (44,927,806 | ) | | | 1,294,286,350 | |
aRepresents the average notional amount for derivative contracts outstanding during the year. For derivative contracts denominated in foreign currencies, notional amounts are converted into U.S. dollars.
See Note 1(c) regarding derivative financial instruments.
13. HOLDINGS OF 5% VOTING SECURITIES OF PORTFOLIO COMPANIES
The 1940 Act defines “affiliated companies” to include investments in portfolio companies in which a fund owns 5% or more of the outstanding voting securities. Investments in “affiliated companies” for the Fund for the year ended December 31, 2010, were as shown below.
| | | | | | | | | | | | | | | | | | | | | | | | | | | | |
| Name of Issuer | | Number of Shares
Held at Beginning
of Year | | | Gross
Additions | | | Gross
Reductions | | | Number of Shares
Held at End
of Year | | | Value at
End
of Year | | | Investment
Income | | | Realized Capital
Gain (Loss) | |
Non-Controlled Affiliates | | | | | | | | | | | | | | | | | | | | | | | | | | | | |
CB FIM Coinvestors LLC | | | 6,400,507 | | | | — | | | | — | | | | 6,400,507 | | | $ | — | | | $ | — | | | $ | — | |
GLCP Harrah's Investment LP | | | 5,565,600 | | | | — | | | | — | | | | 5,565,600 | | | | 2,369,832 | | | | — | | | | — | |
MCII Holdings Inc. | | | 2,219 | | | | — | | | | 2,219 | | | | — | | | | — | | | | — | | | | (2,552,537 | ) |
MCII Holdings Inc., PIK, pfd., A | | | 16,805 | | | | 1,559 | | | | 18,364 | | | | — | | | | — | | | | — | | | | (15,546,101 | ) |
| | | | | | | | | | | | | | | | | | | | |
Total Affiliated Securities (0.04% of Net Assets) | | | | | | | | | | | $ | 2,369,832 | | | $ | — | | | $ | (18,098,638 | ) |
| | | | | | | | | | | | | | | | | | | | |
MS-34
Franklin Templeton Variable Insurance Products Trust
Notes to Financial Statements (continued)
Mutual Shares Securities Fund
14. CREDIT FACILITY
The Fund, together with other U.S. registered and foreign investment funds (collectively “Borrowers”), managed by Franklin Templeton Investments, are borrowers in a joint syndicated senior unsecured credit facility totaling $750 million (Global Credit Facility) which matures on January 21, 2011. This Global Credit Facility provides a source of funds to the Borrowers for temporary and emergency purposes, including the ability to meet future unanticipated or unusually large redemption requests.
Under the terms of the Global Credit Facility, the Fund shall, in addition to interest charged on any borrowings made by the Fund and other costs incurred by the Fund, pay its share of fees and expenses incurred in connection with the implementation and maintenance of the Global Credit Facility, based upon its relative share of the aggregate net assets of all of the Borrowers, including an annual commitment fee of 0.10% based upon the unused portion of the Global Credit Facility, which is reflected in other expenses on the Statement of Operations. During the year ended December 31, 2010, the Fund did not use the Global Credit Facility.
Effective January 21, 2011, the Borrowers renewed the Global Credit Facility for a total of $750 million, maturing January 20, 2012.
15. FAIR VALUE MEASUREMENTS
The Fund follows a fair value hierarchy that distinguishes between market data obtained from independent sources (observable inputs) and the Fund’s own market assumptions (unobservable inputs). These inputs are used in determining the value of the Fund’s investments and are summarized in the following fair value hierarchy:
| | • | | Level 1 – quoted prices in active markets for identical securities |
| | • | | Level 2 – other significant observable inputs (including quoted prices for similar securities, interest rates, prepayment speed, credit risk, etc.) |
| | • | | Level 3 – significant unobservable inputs (including the Fund’s own assumptions in determining the fair value of investments) |
The inputs or methodology used for valuing securities are not an indication of the risk associated with investing in those securities.
For movements between the levels within the fair value hierarchy, the Fund has adopted a policy of recognizing the transfers as of the date of the underlying event which caused the movement.
MS-35
Franklin Templeton Variable Insurance Products Trust
Notes to Financial Statements (continued)
Mutual Shares Securities Fund
15. FAIR VALUE MEASUREMENTS (continued)
The following is a summary of the inputs used as of December 31, 2010, in valuing the Fund’s assets and liabilities carried at fair value:
| | | | | | | | | | | | | | | | |
| | | Level 1 | | | Level 2 | | | Level 3 | | | Total | |
| | | | |
Assets: | | | | | | | | | | | | | | | | |
Investments in Securities: | | | | | | | | | | | | | | | | |
Equity Investments:a | | | | | | | | | | | | | | | | |
Auto Components | | $ | — | | | $ | — | | | $ | 17,504,881 | b | | $ | 17,504,881 | |
Chemicals | | | 69,151,647 | | | | — | | | | 25,000 | | | | 69,176,647 | |
Commercial Banks | | | 214,303,801 | | | | — | | | | 2,688,630 | b | | | 216,992,431 | |
Consumer Finance | | | — | | | | — | | | | 28,388,621 | | | | 28,388,621 | |
Diversified Financial Services | | | 96,041,846 | | | | 9,695,929 | | | | — | b | | | 105,737,775 | |
Electric Utilities | | | 138,388,258 | | | | — | | | | 23,791,010 | b | | | 162,179,268 | |
Hotels, Restaurants & Leisure | | | 4,351,464 | | | | — | | | | 2,369,832 | | | | 6,721,296 | |
Insurance | | | 207,405,283 | | | | — | | | | 6,186 | | | | 207,411,469 | |
IT Services | | | — | | | | — | | | | 95,515 | | | | 95,515 | |
Real Estate Management & Development | | | 16,056,656 | | | | — | | | | 6,659,198 | | | | 22,715,854 | |
Other Equity Investmentsc | | | 4,001,803,964 | | | | — | | | | — | b | | | 4,001,803,964 | |
Corporate Bonds, Notes and Senior Floating Rate Interests | | | — | | | | 222,212,400 | | | | 15,986,080 | | | | 238,198,480 | |
Companies in Liquidation | | | — | | | | 509,155 | | | | — | b | | | 509,155 | |
Short Term Investments | | | 524,844,845 | | | | 49,101,985 | | | | — | | | | 573,946,830 | |
| | | | |
Total Investments in Securities | | $ | 5,272,347,764 | | | $ | 281,519,469 | | | $ | 97,514,953 | | | $ | 5,651,382,186 | |
| | | | |
Forward Exchange Contracts | | | — | | | | 19,516,579 | | | | — | | | | 19,516,579 | |
Unfunded Loan Commitments | | | — | | | | 1,386,319 | | | | — | | | | 1,386,319 | |
Liabilities: | | | | | | | | | | | | | | | | |
Securities Sold Short | | | 16,796,724 | | | | — | | | | — | | | | 16,796,724 | |
Forward Exchange Contracts | | | — | | | | 31,179,734 | | | | — | | | | 31,179,734 | |
aIncludes common and preferred stocks as well as other equity investments.
bIncludes securities determined to have no value at December 31, 2010.
cFor detailed industry descriptions, see the accompanying Statements of Investments.
MS-36
Franklin Templeton Variable Insurance Products Trust
Notes to Financial Statements (continued)
Mutual Shares Securities Fund
15. FAIR VALUE MEASUREMENTS (continued)
At December 31, 2010, the reconciliation of assets in which significant unobservable inputs (Level 3) were used in determining fair value, is as follows:
| | | | | | | | | | | | | | | | | | | | | | | | | | | | |
| | | Balance at
Beginning
of Year | | | Net
Realized
Gain (Loss) | | | Net Change in
Unrealized
Appreciation
(Depreciation) | | | Net
Purchases
(Sales) | | | Transfer In
(Out of)
Level 3 | | | Balance at
End
of Year | | | Net Change in
Unrealized
Appreciation
(Depreciation) on
Assets Held at
Year End | |
| | | | |
Investments in Securities: | | | | | | | | | | | | | | | | | | | | | | | | | | | | |
Equity Investments:a | | | | | | | | | | | | | | | | | | | | | | | | | | | | |
Airlines | | $ | — | | | $ | — | | | | 60,246 | | | $ | (60,246 | ) | | $ | — | | | $ | — | b | | $ | 60,246 | |
Auto Components | | | 8,663,585 | c | | | 6,241 | | | | 8,574,768 | | | | 260,287 | | | | — | | | | 17,504,881 | b | | | 5,302,068 | |
Chemicals | | | 25,000 | | | | — | | | | — | | | | — | | | | — | | | | 25,000 | | | | — | |
Commercial Banks | | | — | c | | | — | | | | (526,457 | ) | | | 3,215,087 | | | | — | | | | 2,688,630 | b | | | (526,457 | ) |
Computers & Peripherals | | | 179,657 | c | | | 87,238 | | | | (132,155 | ) | | | (134,740 | ) | | | — | | | | — | b | | | (29,117 | ) |
Consumer Finance | | | 21,844,439 | | | | (29,902,016 | ) | | | 35,191,540 | | | | 1,254,658 | | | | — | | | | 28,388,621 | | | | 6,374,577 | |
Diversified Financial Services | | | 6,316,000 | c | | | — | | | | 78,950 | | | | — | | | | (6,394,950 | ) | | | — | b | | | — | |
Diversified Telecommunication Services | | | — | c | | | 8,360 | | | | 919 | | | | (9,279 | ) | | | — | | | | — | b | | | 919 | |
Electric Utilities | | | — | | | | — | | | | (1,187,522 | ) | | | — | | | | 24,978,532 | | | | 23,791,010 | b | | | (1,187,522 | ) |
Hotels, Restaurants & Leisure | | | — | c | | | — | | | | 2,371,117 | | | | (1,285 | ) | | | | | | | 2,369,832 | | | | 2,371,117 | |
Insurance | | | 34,774 | | | | — | | | | 5,325 | | | | (33,913 | ) | | | — | | | | 6,186 | | | | 5,325 | |
IT Services | | | — | | | | — | | | | (8,996 | ) | | | 104,511 | | | | — | | | | 95,515 | | | | (8,996 | ) |
Machinery | | | 7,810,403 | c | | | (18,098,639 | ) | | | 11,362,166 | | | | (1,073,930 | ) | | | — | | | | — | | | | — | |
Real Estate Management & Development | | | 8,146,075 | | | | — | | | | (1,486,877 | ) | | | — | | | | — | | | | 6,659,198 | | | | (1,486,877 | ) |
Corporate Bonds, Notes and Senior Floating Rate interests | | | 6,419,422 | | | | (381,356 | ) | | | 11,068,285 | | | | (1,120,271 | ) | | | — | | | | 15,986,080 | | | | 10,759,500 | |
Corporate Bonds and Notes in Reorganization | | | 25 | | | | (112 | ) | | | 125 | | | | (38 | ) | | | — | | | | — | | | | — | |
| | | | |
Total | | $ | 59,439,380 | | | $ | (48,280,284 | ) | | $ | 65,371,434 | | | $ | 2,400,841 | | | $ | 18,583,582 | | | $ | 97,514,953 | | | $ | 21,634,783 | |
| | | | |
aIncludes common and preferred stocks as well as other equity investments.
bIncludes securities determined to have no value at December 31, 2010.
cIncludes securities determined to have no value at December 31, 2009.
16. SUBSEQUENT EVENTS
The Fund has evaluated subsequent events through the issuance of the financial statements and determined that no events have occurred that require disclosure other than those already disclosed in the financial statements.
| | | | |
ABBREVIATIONS | | | | |
| Counterparty | | Currency | | Selected Portfolio |
| | | | |
| BOFA - Bank of America N.A. | | JPY - Japanese Yen | | ADR - American Depository Receipt |
| BZWS - Barclays Bank PLC | | | | FHLB - Federal Home Loan Bank |
| DBAB - Deutsche Bank AG | | | | FRN - Floating Rate Note |
| HAND - Svenska Handelsbanken | | | | |
| SSBT - State Street Bank and Trust Co., N.A. | | | | |
MS-37
Franklin Templeton Variable Insurance Products Trust
Mutual Shares Securities Fund
Report of Independent Registered Public Accounting Firm
To the Board of Trustees and Shareholders of
Franklin Templeton Variable Insurance Products Trust
In our opinion, the accompanying statement of assets and liabilities, including the statement of investments, and the related statements of operations and of changes in net assets and the financial highlights present fairly, in all material respects, the financial position of Mutual Shares Securities Fund (the “Fund”) at December 31, 2010, the results of its operations for the year then ended, the changes in its net assets for each of the two years in the period then ended and the financial highlights for each of the periods presented, in conformity with accounting principles generally accepted in the United States of America. These financial statements and financial highlights (hereafter referred to as “financial statements”) are the responsibility of the Fund’s management. Our responsibility is to express an opinion on these financial statements based on our audits. We conducted our audits of these financial statements in accordance with the standards of the Public Company Accounting Oversight Board (United States). Those standards require that we plan and perform the audit to obtain reasonable assurance about whether the financial statements are free of material misstatement. An audit includes examining, on a test basis, evidence supporting the amounts and disclosures in the financial statements, assessing the accounting principles used and significant estimates made by management, and evaluating the overall financial statement presentation. We believe that our audits, which included confirmation of securities at December 31, 2010 by correspondence with the custodian and brokers, provide a reasonable basis for our opinion.
PricewaterhouseCoopers LLP
San Francisco, California
February 10, 2011
MS-38
Franklin Templeton Variable Insurance Products Trust
Tax Designation (unaudited)
Mutual Shares Securities Fund
Under Section 854(b)(2) of the Internal Revenue Code (Code), the Fund designates 100.00% of the ordinary income dividends as income qualifying for the dividends received deduction for the fiscal year ended December 31, 2010.
MS-39
TEMPLETON DEVELOPING MARKETS SECURITIES FUND
This annual report for Templeton Developing Markets Securities Fund covers the fiscal year ended December 31, 2010.
Performance Summary as of 12/31/10
Average annual total return of Class 4 shares* represents the average annual change in value, assuming reinvestment of dividends and capital gains. Average returns smooth out variations in returns, which can be significant; they are not the same as year-by-year results.
Periods ended 12/31/10
| | | | | | | | | | | | |
| | | 1-Year | | | 5-Year | | | 10-Year | |
Average Annual Total Return | | | +17.41% | | | | +9.66% | | | | +13.59% | |
*For the period beginning 2/29/08, Class 4 performance reflects a 12b-1 fee expense of 0.35% per year, which affects future performance. Class 4 performance prior to 2/29/08 reflects historical Class 1 performance, which does not have a 12b-1 fee expense. Since 2/29/08 (effective date), the average annual total return of Class 4 shares was +1.37%.
Total Return Index Comparison for a Hypothetical $10,000 Investment (1/1/01–12/31/10)
The graph below shows the change in value of a hypothetical $10,000 investment in the Fund over the indicated period and includes reinvestment of any income or distributions. The Fund’s performance* is compared to the performance of the Morgan Stanley Capital International (MSCI) Emerging Markets (EM) Index and the Standard & Poor’s/International Finance Corporation Investable (S&P/IFCI) Composite Index. One cannot invest directly in an index, and an index is not representative of the Fund’s portfolio. Please see Important Notes to Performance Information preceding the Fund Summaries.
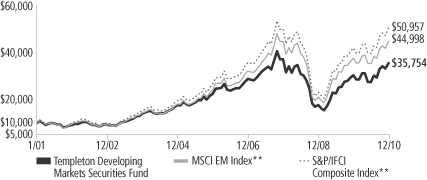
**Source: © 2011 Morningstar. Please see Index Descriptions following the Fund Summaries.
Templeton Developing Markets Securities Fund Class 4
Performance reflects the Fund’s Class 4 operating expenses, but does not include any contract fees, expenses or sales charges. If they had been included, performance would be lower. These charges and deductions, particularly for variable life policies, can have a significant effect on contract values and insurance benefits. See the contract prospectus for a complete description of these expenses, including sales charges.
Performance data represent past performance, which does not guarantee future results. Investment return and principal value will fluctuate, and you may have a gain or loss when you sell your shares. Current performance may differ from figures shown.
TD-1
Fund Goal and Main Investments: Templeton Developing Markets Securities Fund seeks long-term capital appreciation. The Fund normally invests at least 80% of its net assets in emerging market investments.
Performance Overview
You can find the Fund’s one-year total return in the Performance Summary. The Fund underperformed the MSCI EM Index’s +19.20% total return, and the S&P/IFCI Composite Index’s +20.64% total return for the same period.1 Please note index performance numbers are for reference and we do not attempt to track an index but rather undertake investments on the basis of fundamental research.
Economic and Market Overview
In 2010, economic recovery was a major theme. Many emerging markets reported strong gross domestic product growth as they continued to recover from the impact of the 2008 global financial crisis. In several cases, robust domestic consumption, government expenditure and intra-regional trade offset weak external demand from developed markets. This led many countries in Asia and Latin America to return to pre-crisis growth levels faster than expected.
Following unprecedented fiscal and monetary expansion implemented by governments and central banks globally in 2009, the focus for many major emerging economies shifted from stimulating growth to managing inflation in 2010. Concerns about economic overheating and accelerating inflation in major economies such as China, India and Brazil led officials to steer toward the normalization of fiscal and monetary policies.
In an environment of low interest rates and ample liquidity, particularly in developed markets, the search for higher returns pushed fund flows into emerging markets toward record levels. Emerging market portfolios attracted US$88 billion in the first 11 months of 2010, already exceeding the 2009 total of US$83 billion.2
After rising 79.02% in 2009, emerging stock markets, as represented by the MSCI EM Index, were up 19.20% in U.S. dollar terms in 2010.1 However, equity prices experienced significant volatility throughout the year, as did exchange rates and commodity prices. Argentina’s market,
1. Source: © 2011 Morningstar. One cannot invest directly in an index, and an index is not representative of the Fund’s portfolio. Please see Index Descriptions following the Fund Summaries.
2. Source: EPFR Global.
Fund Risks: The Fund’s investments in stocks may offer the potential for long-term gains but can be subject to short-term price fluctuations. Investing in emerging or developing markets is subject to all the risks of foreign investing generally as well as additional, heightened risks, including currency fluctuations, economic instability, market volatility, political and social instability, the relatively smaller size and lesser liquidity of these markets, and less government supervision and regulation of business and industry practices. The Fund may have significant investments in one or more countries or in particular sectors or industries from time to time and may carry greater risk of adverse developments in a country, sector or industry than a fund that invests more broadly. Smaller and midsize company securities can increase the risk of greater price fluctuations, particularly over the short term. The manager applies various techniques and analyses in making investment decisions for the Fund, but there can be no guarantee that these decisions will produce the desired results. The Fund’s prospectus also includes a description of the main investment risks.
TD-2
although small and restricted, was one of the top performers with a total return of +77.37% in U.S. dollars.1 Investors anticipated long overdue market reforms after the death of former President Nestor Kirchner. Another strong performer was Thailand, with a +56.27% total return in U.S. dollar terms, as investors focused on the country’s strong fundamentals and put aside concerns regarding political turmoil earlier in the year.1 Other strong performers included South Africa; Chile, Colombia and Peru in Latin America; and Indonesia, Malaysia and the Philippines in Asia.
Investment Strategy
Our investment philosophy is bottom up, value oriented and long term. In choosing investments, we may make on-site visits to companies to assess critical factors such as management strength and local conditions. In addition, we focus on the market price of a company’s securities relative to our evaluation of the company’s potential long-term (typically five years) earnings, asset value and cash flow potential. Among factors we consider are a company’s historical value measures, including price/earnings ratio, profit margins and liquidation value. We perform in-depth research to construct an action list from which we make our investment decisions.
Manager’s Discussion
During the 12 months under review, key contributors to the Fund’s absolute performance included India’s Tata Consultancy Services, a major IT consulting company; Brazil’s AmBev (Companhia de Bebidas das Americas), one of the world’s largest beer and soft drink producers; and Russia’s Norilsk Nickel (Mining and Metallurgical Co. Norilsk Nickel), the world’s largest nickel and palladium producer. The outsourcing trend to Indian consulting companies continued to benefit Tata Consultancy Services, while greater beverage demand supported AmBev’s strong volume growth and high profitability. We increased the Fund’s positions in these two companies due to their attractive prospects in our view. In addition, higher nickel prices boosted Norilsk Nickel’s share price, as the company benefited from a strong market position and low production costs.
Some of the Fund’s largest detractors for the reporting period included Brazil’s Petrobras (Petroleo Brasileiro), a top global oil and gas
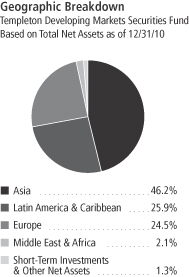
TD-3
company; Hungary’s OTP Bank, the country’s largest commercial bank; and India’s Sesa Goa, a leading iron ore exporter. Petrobras sold US$70 billion worth of shares to raise funds for its purchase of five billion barrels of undeveloped offshore oil reserves from the Brazilian government and for the company’s five-year investment plan. This share dilution pushed down Petrobras’ stock price and, as a result, we significantly reduced the Fund’s exposure to the company by period-end. Uncertainty surrounding the Hungarian economy and government plans for a temporary crisis tax on banks weighed on OTP Bank’s share price. We divested the Fund’s position and thus, our exposure to Hungary, by year-end. Sesa Goa’s stock declined in value because of India’s export ban on iron ore and the cancellation of mine leases.
It is also important to recognize the effect of currency movements on the Fund’s performance. In general, if the value of the U.S. dollar goes up compared with a foreign currency, an investment traded in that foreign currency will go down in value because it will be worth fewer U.S. dollars. This can have a negative effect on Fund performance. Conversely, when the U.S. dollar weakens in relation to a foreign currency, an investment traded in that foreign currency will increase in value, which can contribute to Fund performance. For the 12 months ended December 31, 2010, the U.S. dollar declined in value relative to most non-U.S. currencies. As a result, the Fund’s performance was positively affected by the portfolio’s predominant investment in securities with non-U.S. currency exposure. However, one cannot expect the same results in future periods.
During the review period, we increased the Fund’s holdings in Indonesia, Thailand and China via Hong Kong-listed Red Chip, Shanghai B and Shenzhen B shares, as we searched for attractive investment opportunities.3 Major purchases included Itau Unibanco Holding, one of Brazil’s largest financial conglomerates; CNOOC, China’s largest offshore oil and natural gas exploration and production company; and Kasikornbank Public, a major Thai bank. We made select purchases in companies engaged in automobile manufacturing; IT consulting and other services; and apparel, accessories and luxury goods. Key purchases included Astra International, Indonesia’s leading
3. “Red Chip” denotes shares of Hong Kong Stock Exchange-listed companies with significant exposure to China. “Shanghai B” denotes shares of China-incorporated, Shanghai Stock Exchange-listed companies that are traded in U.S. dollars and are eligible for foreign investment. “Shenzhen B” denotes shares of China-incorporated, Shenzhen Stock Exchange-listed companies that are traded in Hong Kong dollars.
Top 10 Holdings
Templeton Developing Markets Securities Fund 12/31/10
| | | | |
Company
Sector/Industry,
Country | | % of Total
Net Assets | |
| Vale SA, ADR, pfd., A | | | 6.5% | |
| Metals & Mining, Brazil | |
| Tata Consultancy Services Ltd. | | | 5.7% | |
| IT Services, India | |
| Itau Unibanco Holding SA, ADR | | | 4.6% | |
| Commercial Banks, Brazil | |
| AmBev (Companhia de Bebidas das Americas) | | | 4.2% | |
| Beverages, Brazil | |
Norilsk Nickel (Mining and Metallurgical Co. Norilsk Nickel), ADR | | | 3.6% | |
| Metals & Mining, Russia | |
| Gazprom, ADR | | | 3.3% | |
| Oil, Gas & Consumable Fuels, Russia | | | | |
| Natura Cosmeticos SA | | | 2.8% | |
| Personal Products, Brazil | |
| Anglo American PLC | | | 2.7% | |
| Metals & Mining, U.K. | |
| PT Astra International Tbk | | | 2.7% | |
| Automobiles, Indonesia | |
| LUKOIL Holdings, ADR | | | 2.6% | |
| Oil, Gas & Consumable Fuels, Russia | | | | |
The dollar value, number of shares or principal amount, and names of all portfolio holdings are listed in the Fund’s Statement of Investments.
TD-4
car and motorcycle manufacturer; Infosys Technologies, a major Indian IT consulting services provider; and Anta Sports Products, a leading Chinese sportswear producer and retailer.
Based on our analysis, consumer-related industries remained attractive due to large populations in emerging markets, where a growing middle class and greater domestic demand for goods and services could have an increasingly positive effect on these companies. We also had a favorable assessment of the IT consulting industry, which could continue to gain from the services outsourcing trend to emerging markets.
Conversely, we reduced or eliminated the Fund’s exposure to South Korea, Austria, Hungary and South Africa, which allowed us to focus on stocks we deemed to be relatively more attractively valued within our investment universe and raise funds for redemptions. We made large sales of holdings in oil and gas, banking, semiconductors, and wireless telecommunication services companies. Some Fund holdings reached their target sale prices, and we sold them by period-end. In addition to sales mentioned earlier, we eliminated the Fund’s position in South Korean electronics manufacturer Samsung Electronics by period-end.
Thank you for your participation in Templeton Developing Markets Securities Fund. We look forward to serving your future investment needs.
The foregoing information reflects our analysis, opinions and portfolio holdings as of December 31, 2010, the end of the reporting period. The way we implement our main investment strategies and the resulting portfolio holdings may change depending on factors such as market and economic conditions. These opinions may not be relied upon as investment advice or an offer for a particular security. The information is not a complete analysis of every aspect of any market, country, industry, security or the Fund. Statements of fact are from sources considered reliable, but the investment manager makes no representation or warranty as to their completeness or accuracy. Although historical performance is no guarantee of future results, these insights may help you understand our investment management philosophy.
Top 10 Countries
Templeton Developing Markets Securities Fund
12/31/10
| | | | |
| | | % of Total Net Assets | |
| Brazil | | | 22.4% | |
| India | | | 16.5% | |
| Russia | | | 15.0% | |
| China | | | 13.2% | |
| U.K. | | | 4.8% | |
| Indonesia | | | 4.8% | |
| Thailand | | | 3.9% | |
| Turkey | | | 3.8% | |
| Mexico | | | 2.6% | |
| Hong Kong | | | 2.2% | |
TD-5
Fund Expenses
As an investor in a variable insurance contract (Contract) that indirectly provides for investment in an underlying mutual fund, you can incur transaction and/or ongoing expenses at both the Fund level and the Contract level.
| • | | Transaction expenses can include sales charges (loads) on purchases, redemption fees, surrender fees, transfer fees and premium taxes. |
| • | | Ongoing expenses can include management fees, distribution and service (12b-1) fees, contract fees, annual maintenance fees, mortality and expense risk fees and other fees and expenses. All mutual funds and Contracts have some types of ongoing expenses. |
The expenses shown in the table are meant to highlight ongoing expenses at the Fund level only and do not include ongoing expenses at the Contract level, or transaction expenses at either the Fund or Contract level. While the Fund does not have transaction expenses, if the transaction and ongoing expenses at the Contract level were included, the expenses shown below would be higher. You should consult your Contract prospectus or disclosure document for more information.
The table shows Fund-level ongoing expenses and can help you understand these expenses and compare them with those of other mutual funds offered through the Contract. The table assumes a $1,000 investment held for the six months indicated. Please refer to the Fund prospectus for additional information on operating expenses.
Actual Fund Expenses
The first line (Actual) of the table provides actual account values and expenses. The “Ending Account Value” is derived from the Fund’s actual return, which includes the effect of ongoing Fund expenses, but does not include the effect of ongoing Contract expenses.
You can estimate the Fund-level expenses you incurred during the period by following these steps. Of course, your account value and expenses will differ from those in this illustration:
| 1. | Divide your account value by $1,000. |
If an account had an $8,600 value, then $8,600 ÷ $1,000 = 8.6.
| 2. | Multiply the result by the number under the heading “Fund-Level Expenses Incurred During Period.” |
If Fund-Level Expenses Incurred During Period were $7.50, then
8.6 x $7.50 = $64.50.
In this illustration, the estimated expenses incurred this period at the Fund level are $64.50.
Templeton Developing Markets Securities Fund Class 4
TD-6
Hypothetical Example for Comparison with Other Mutual Funds
Information in the second line (Hypothetical) of the table can help you compare ongoing expenses of the Fund with those of other mutual funds offered through the Contract. This information may not be used to estimate the actual ending account balance or expenses you incurred during the period. The hypothetical “Ending Account Value” is based on the Fund’s actual expense ratio and an assumed 5% annual rate of return before expenses, which does not represent the Fund’s actual return. The figure under the heading “Fund-Level Expenses Incurred During Period” shows the hypothetical expenses your account would have incurred under this scenario. You can compare this figure with the 5% hypothetical examples that appear in shareholder reports of other funds offered through a Contract.
| | | | | | | | | | | | |
| Class 4 | | Beginning
Account Value 7/1/10 | | | Ending
Account Value 12/31/10 | | | Fund-Level Expenses Incurred
During Period* 7/1/10–12/31/10 | |
Actual | | $ | 1,000 | | | $ | 1,297.40 | | | $ | 10.71 | |
Hypothetical (5% return before expenses) | | $ | 1,000 | | | $ | 1,015.88 | | | $ | 9.40 | |
*Expenses are calculated using the most recent six-month annualized expense ratio for the Fund’s Class 4 shares (1.85%), which does not include any ongoing expenses of the Contract for which the Fund is an investment option, multiplied by the average account value over the period, multiplied by 184/365 to reflect the one-half year period.
TD-7
Franklin Templeton Variable Insurance Products Trust
Financial Highlights
Templeton Developing Markets Securities Fund
| | | | | | | | | | | | | | | | | | | | |
| | | Year Ended December 31, | |
| Class 1 | | 2010 | | | 2009 | | | 2008 | | | 2007 | | | 2006 | |
| | | | |
Per share operating performance | | | | | | | | | | | | | | | | | | | | |
(for a share outstanding throughout the year) | | | | | | | | | | | | | | | | | | | | |
Net asset value, beginning of year | | $ | 9.86 | | | $ | 6.11 | | | $ | 16.16 | | | $ | 13.92 | | | $ | 10.99 | |
| | | | |
Income from investment operationsa: | | | | | | | | | | | | | | | | | | | | |
Net investment incomeb | | | 0.09 | | | | 0.12 | | | | 0.16 | | | | 0.32 | | | | 0.24 | |
Net realized and unrealized gains (losses) | | | 1.63 | | | | 4.02 | | | | (7.40 | ) | | | 3.51 | | | | 2.84 | |
| | | | |
Total from investment operations | | | 1.72 | | | | 4.14 | | | | (7.24 | ) | | | 3.83 | | | | 3.08 | |
| | | | |
Less distributions from: | | | | | | | | | | | | | | | | | | | | |
Net investment income | | | (0.18 | ) | | | (0.36 | ) | | | (0.37 | ) | | | (0.38 | ) | | | (0.15 | ) |
Net realized gains | | | — | | | | (0.03 | ) | | | (2.44 | ) | | | (1.21 | ) | | | — | |
| | | | |
Total distributions | | | (0.18 | ) | | | (0.39 | ) | | | (2.81 | ) | | | (1.59 | ) | | | (0.15 | ) |
| | | | |
Redemption feesc | | | — | | | | — | | | | — | | | | — | | | | — | |
| | | | |
Net asset value, end of year | | $ | 11.40 | | | $ | 9.86 | | | $ | 6.11 | | | $ | 16.16 | | | $ | 13.92 | |
| | | | |
| | | | | |
Total returnd | | | 17.83% | | | | 73.32% | | | | (52.62)% | | | | 29.09% | | | | 28.43% | |
Ratios to average net assets | | | | | | | | | | | | | | | | | | | | |
Expensese | | | 1.49% | | | | 1.45% | | | | 1.52% | | | | 1.48% | | | | 1.47% | |
Net investment income | | | 0.87% | | | | 1.64% | | | | 1.52% | | | | 2.07% | | | | 1.93% | |
| | | | | |
Supplemental data | | | | | | | | | | | | | | | | | | | | |
Net assets, end of year (000’s) | | $ | 347,242 | | | $ | 325,927 | | | $ | 234,213 | | | $ | 753,843 | | | $ | 749,120 | |
Portfolio turnover rate | | | 24.41% | | | | 56.58% | f | | | 75.11% | f | | | 98.32% | | | | 53.65% | |
aThe amount shown for a share outstanding throughout the period may not correlate with the Statement of Operations for the period due to the timing of sales and repurchases of the Fund shares in relation to income earned and/or fluctuating market value of the investments of the Fund.
bBased on average daily shares outstanding.
cAmount rounds to less than $0.01 per share.
dTotal return does not include fees, charges or expenses imposed by the variable annuity and life insurance contracts for which the Franklin Templeton Variable Insurance Products Trust serves as an underlying investment vehicle.
eBenefit of expense reduction rounds to less than 0.01%.
fExcludes the value of portfolio securities delivered as a result of redemptions in-kind. See Note 10.
The accompanying notes are an integral part of these financial statements.
TD-8
Franklin Templeton Variable Insurance Products Trust
Financial Highlights (continued)
Templeton Developing Markets Securities Fund
| | | | | | | | | | | | | | | | | | | | |
| | | Year Ended December 31, | |
| Class 2 | | 2010 | | | 2009 | | | 2008 | | | 2007 | | | 2006 | |
| | | | |
Per share operating performance | | | | | | | | | | | | | | | | | | | | |
(for a share outstanding throughout the year) | | | | | | | | | | | | | | | | | | | | |
Net asset value, beginning of year | | $ | 9.78 | | | $ | 6.04 | | | $ | 15.99 | | | $ | 13.79 | | | $ | 10.90 | |
| | | | |
Income from investment operationsa: | | | | | | | | | | | | | | | | | | | | |
Net investment incomeb | | | 0.06 | | | | 0.11 | | | | 0.15 | | | | 0.27 | | | | 0.20 | |
Net realized and unrealized gains (losses) | | | 1.62 | | | | 3.98 | | | | (7.33 | ) | | | 3.49 | | | | 2.82 | |
| | | | |
Total from investment operations | | | 1.68 | | | | 4.09 | | | | (7.18 | ) | | | 3.76 | | | | 3.02 | |
| | | | |
Less distributions from: | | | | | | | | | | | | | | | | | | | | |
Net investment income | | | (0.16 | ) | | | (0.32 | ) | | | (0.33 | ) | | | (0.35 | ) | | | (0.13 | ) |
Net realized gains | | | — | | | | (0.03 | ) | | | (2.44 | ) | | | (1.21 | ) | | | — | |
| | | | |
Total distributions | | | (0.16 | ) | | | (0.35 | ) | | | (2.77 | ) | | | (1.56 | ) | | | (0.13 | ) |
| | | | |
Redemption feesc | | | — | | | | — | | | | — | | | | — | | | | — | |
| | | | |
Net asset value, end of year | | $ | 11.30 | | | $ | 9.78 | | | $ | 6.04 | | | $ | 15.99 | | | $ | 13.79 | |
| | | | |
| | | | | |
Total returnd | | | 17.58% | | | | 72.59% | | | | (52.70)% | | | | 28.78% | | | | 28.09% | |
Ratios to average net assets | | | | | | | | | | | | | | | | | | | | |
Expensese | | | 1.74% | | | | 1.70% | | | | 1.77% | | | | 1.73% | | | | 1.72% | |
Net investment income | | | 0.62% | | | | 1.39% | | | | 1.27% | | | | 1.82% | | | | 1.68% | |
| | | | | |
Supplemental data | | | | | | | | | | | | | | | | | | | | |
Net assets, end of year (000’s) | | $ | 392,546 | | | $ | 435,947 | | | $ | 264,186 | | | $ | 1,090,549 | | | $ | 857,514 | |
Portfolio turnover rate | | | 24.41% | | | | 56.58% | f | | | 75.11% | f | | | 98.32% | | | | 53.65% | |
aThe amount shown for a share outstanding throughout the period may not correlate with the Statement of Operations for the period due to the timing of sales and repurchases of the Fund shares in relation to income earned and/or fluctuating market value of the investments of the Fund.
bBased on average daily shares outstanding.
cAmount rounds to less than $0.01 per share.
dTotal return does not include fees, charges or expenses imposed by the variable annuity and life insurance contracts for which the Franklin Templeton Variable Insurance Products Trust serves as an underlying investment vehicle.
eBenefit of expense reduction rounds to less than 0.01%.
fExcludes the value of portfolio securities delivered as a result of redemptions in-kind. See Note 10.
The accompanying notes are an integral part of these financial statements.
TD-9
Franklin Templeton Variable Insurance Products Trust
Financial Highlights (continued)
Templeton Developing Markets Securities Fund
| | | | | | | | | | | | | | | | | | | | |
| | | Year Ended December 31, | |
| Class 3 | | 2010 | | | 2009 | | | 2008 | | | 2007 | | | 2006 | |
| | | | |
Per share operating performance | | | | | | | | | | | | | | | | | | | | |
(for a share outstanding throughout the year) | | | | | | | | | | | | | | | | | | | | |
Net asset value, beginning of year | | $ | 9.73 | | | $ | 6.02 | | | $ | 15.96 | | | $ | 13.78 | | | $ | 10.90 | |
| | | | |
Income from investment operationsa: | | | | | | | | | | | | | | | | | | | | |
Net investment incomeb | | | 0.06 | | | | 0.10 | | | | 0.11 | | | | 0.24 | | | | 0.20 | |
Net realized and unrealized gains (losses) | | | 1.60 | | | | 3.97 | | | | (7.27 | ) | | | 3.52 | | | | 2.83 | |
| | | | |
Total from investment operations | | | 1.66 | | | | 4.07 | | | | (7.16 | ) | | | 3.76 | | | | 3.03 | |
| | | | |
Less distributions from: | | | | | | | | | | | | | | | | | | | | |
Net investment income | | | (0.16 | ) | | | (0.33 | ) | | | (0.34 | ) | | | (0.37 | ) | | | (0.15 | ) |
Net realized gains | | | — | | | | (0.03 | ) | | | (2.44 | ) | | | (1.21 | ) | | | — | |
| | | | |
Total distributions | | | (0.16 | ) | | | (0.36 | ) | | | (2.78 | ) | | | (1.58 | ) | | | (0.15 | ) |
| | | | |
Redemption feesc | | | — | | | | — | | | | — | | | | — | | | | — | |
| | | | |
Net asset value, end of year | | $ | 11.23 | | | $ | 9.73 | | | $ | 6.02 | | | $ | 15.96 | | | $ | 13.78 | |
| | | | |
| | | | | |
Total returnd | | | 17.51% | | | | 72.63% | | | | (52.67)% | | | | 28.70% | | | | 28.17% | |
Ratios to average net assets | | | | | | | | | | | | | | | | | | | | |
Expensese | | | 1.74% | | | | 1.70% | | | | 1.77% | | | | 1.73% | | | | 1.72% | |
Net investment income | | | 0.62% | | | | 1.39% | | | | 1.27% | | | | 1.82% | | | | 1.68% | |
| | | | | |
Supplemental data | | | | | | | | | | | | | | | | | | | | |
Net assets, end of year (000’s) | | $ | 66,484 | | | $ | 66,718 | | | $ | 32,953 | | | $ | 100,961 | | | $ | 43,372 | |
Portfolio turnover rate | | | 24.41% | | | | 56.58% | f | | | 75.11% | f | | | 98.32% | | | | 53.65% | |
aThe amount shown for a share outstanding throughout the period may not correlate with the Statement of Operations for the period due to the timing of sales and repurchases of the Fund shares in relation to income earned and/or fluctuating market value of the investments of the Fund.
bBased on average daily shares outstanding.
cAmount rounds to less than $0.01 per share.
dTotal return does not include fees, charges or expenses imposed by the variable annuity and life insurance contracts for which the Franklin Templeton Variable Insurance Products Trust serves as an underlying investment vehicle.
eBenefit of expense reduction rounds to less than 0.01%.
fExcludes the value of portfolio securities delivered as a result of redemptions in-kind. See Note 10.
The accompanying notes are an integral part of these financial statements.
TD-10
Franklin Templeton Variable Insurance Products Trust
Financial Highlights (continued)
Templeton Developing Markets Securities Fund
| | | | | | | | | | | | |
| | | Year Ended December 31, | |
| Class 4 | | 2010 | | | 2009 | | | 2008a | |
| | | | |
Per share operating performance | | | | | | | | | | | | |
(for a share outstanding throughout the year) | | | | | | | | | | | | |
Net asset value, beginning of year | | $ | 9.80 | | | $ | 6.09 | | | $ | 14.88 | |
| | | | |
Income from investment operationsb: | | | | | | | | | | | | |
Net investment income (loss)c | | | 0.05 | | | | 0.09 | | | | (0.33 | ) |
Net realized and unrealized gains (losses) | | | 1.61 | | | | 4.00 | | | | (5.65 | ) |
| | | | |
Total from investment operations | | | 1.66 | | | | 4.09 | | | | (5.98 | ) |
| | | | |
Less distributions from: | | | | | | | | | | | | |
Net investment income | | | (0.16 | ) | | | (0.35 | ) | | | (0.37 | ) |
Net realized gains | | | — | | | | (0.03 | ) | | | (2.44 | ) |
| | | | |
Total distributions | | | (0.16 | ) | | | (0.38 | ) | | | (2.81 | ) |
| | | | |
Redemption feesd | | | — | | | | — | | | | — | |
| | | | |
Net asset value, end of year | | $ | 11.30 | | | $ | 9.80 | | | $ | 6.09 | |
| | | | |
| | | |
Total returne | | | 17.41% | | | | 72.45% | | | | (48.66)% | |
Ratios to average net assetsf | | | | | | | | | | | | |
Expensesg | | | 1.84% | | | | 1.80% | | | | 1.87% | |
Net investment income | | | 0.52% | | | | 1.29% | | | | 1.17% | |
| | | |
Supplemental data | | | | | | | | | | | | |
Net assets, end of year (000’s) | | $ | 37,198 | | | $ | 26,362 | | | $ | 7,208 | |
Portfolio turnover rate | | | 24.41% | | | | 56.58% | h | | | 75.11% | h |
aFor the period February 29, 2008 (effective date) to December 31, 2008.
bThe amount shown for a share outstanding throughout the period may not correlate with the Statement of Operations for the period due to the timing of sales and repurchases of the Fund shares in relation to income earned and/or fluctuating market value of the investments of the Fund.
cBased on average daily shares outstanding.
dAmount rounds to less than $0.01 per share.
eTotal return does not include fees, charges or expenses imposed by the variable annuity and life insurance contracts for which the Franklin Templeton Variable Insurance Products Trust serves as an underlying investment vehicle. Total return is not annualized for periods less than one year.
fRatios are annualized for periods less than one year.
gBenefit of expense reduction rounds to less than 0.01%.
hExcludes the value of portfolio securities delivered as a result of redemptions in-kind. See Note 10.
The accompanying notes are an integral part of these financial statements.
TD-11
Franklin Templeton Variable Insurance Products Trust
Statement of Investments, December 31, 2010
| | | | | | | | | | | | |
| Templeton Developing Markets Securities Fund | | Industry | | | Shares | | | Value | |
Common Stocks 88.3% | | | | | | | | | | | | |
Brazil 12.9% | | | | | | | | | | | | |
Companhia de Bebidas das Americas (AmBev) | | | Beverages | | | | 1,356,585 | | | $ | 35,476,960 | |
Itau Unibanco Holding SA, ADR | | | Commercial Banks | | | | 1,623,674 | | | | 38,984,413 | |
Natura Cosmeticos SA | | | Personal Products | | | | 823,138 | | | | 23,654,274 | |
Souza Cruz SA | | | Tobacco | | | | 199,070 | | | | 10,842,661 | |
| | | | | | | | | | | | |
| | | | | | | | | | | 108,958,308 | |
| | | | | | | | | | | | |
China 13.2% | | | | | | | | | | | | |
Ajisen China Holdings Ltd. | | | Hotels, Restaurants & Leisure | | | | 501,754 | | | | 845,671 | |
aAluminum Corp. of China Ltd., H | | | Metals & Mining | | | | 13,316,000 | | | | 12,146,727 | |
Anta Sports Products Ltd. | | | Textiles, Apparel & Luxury Goods | | | | 2,131,000 | | | | 3,416,180 | |
a,bChangsha Zoomlion Heavy Industry Science and Technology Development Co. Ltd., H, 144A | | | Machinery | | | | 450,600 | | | | 1,018,017 | |
China Coal Energy Co., H | | | Oil, Gas & Consumable Fuels | | | | 6,513,000 | | | | 10,172,765 | |
China Dongxiang Group Co. | | | Textiles, Apparel & Luxury Goods | | | | 5,428,000 | | | | 2,374,423 | |
China Shipping Development Co. Ltd., H | | | Marine | | | | 6,816,000 | | | | 9,085,077 | |
CNOOC Ltd. | | | Oil, Gas & Consumable Fuels | | | | 7,181,000 | | | | 17,129,075 | |
Golden Eagle Retail Group Ltd. | | | Multiline Retail | | | | 1,204,000 | | | | 2,958,688 | |
Great Wall Motor Co. Ltd., H | | | Automobiles | | | | 903,000 | | | | 2,823,146 | |
Guangzhou Automobile Group Co. Ltd., H | | | Automobiles | | | | 13,424,396 | | | | 18,584,304 | |
Inner Mongolia Yitai Coal Co. Ltd., B | | | Oil, Gas & Consumable Fuels | | | | 1,014,967 | | | | 7,241,790 | |
PetroChina Co. Ltd., H | | | Oil, Gas & Consumable Fuels | | | | 13,880,000 | | | | 18,072,126 | |
Yantai Changyu Pioneer Wine Co. Ltd., B | | | Beverages | | | | 472,400 | | | | 5,027,588 | |
| | | | | | | | | | | | |
| | | | | | | | | | | 110,895,577 | |
| | | | | | | | | | | | |
Hong Kong 2.2% | | | | | | | | | | | | |
Dairy Farm International Holdings Ltd. | | | Food & Staples Retailing | | | | 1,014,733 | | | | 9,426,870 | |
Daphne International Holdings Ltd. | | | Textiles, Apparel & Luxury Goods | | | | 874,000 | | | | 818,619 | |
VTech Holdings Ltd. | | | Communications Equipment | | | | 724,000 | | | | 8,541,756 | |
| | | | | | | | | | | | |
| | | | | | | | | | | 18,787,245 | |
| | | | | | | | | | | | |
India 16.5% | | | | | | | | | | | | |
aCoal India Ltd. | | | Oil, Gas & Consumable Fuels | | | | 581,875 | | | | 4,092,808 | |
a,bCoal India Ltd., 144A | | | Oil, Gas & Consumable Fuels | | | | 32,353 | | | | 227,565 | |
Grasim Industries Ltd. | | | Chemicals | | | | 40,253 | | | | 2,107,335 | |
Hindalco Industries Ltd. | | | Metals & Mining | | | | 2,542,079 | | | | 13,986,054 | |
Infosys Technologies Ltd. | | | IT Services | | | | 238,290 | | | | 18,359,721 | |
National Aluminium Co. Ltd. | | | Metals & Mining | | | | 561,104 | | | | 4,917,386 | |
Oil & Natural Gas Corp. Ltd. | | | Oil, Gas & Consumable Fuels | | | | 456,656 | | | | 13,209,704 | |
Sesa Goa Ltd. | | | Metals & Mining | | | | 2,421,060 | | | | 17,781,965 | |
Steel Authority of India Ltd. | | | Metals & Mining | | | | 1,451,892 | | | | 5,926,090 | |
Tata Chemicals Ltd. | | | Chemicals | | | | 1,172,718 | | | | 10,329,885 | |
Tata Consultancy Services Ltd. | | | IT Services | | | | 1,857,283 | | | | 48,394,242 | |
| | | | | | | | | | | | |
| | | | | | | | | | | 139,332,755 | |
| | | | | | | | | | | | |
Indonesia 4.8% | | | | | | | | | | | | |
PT Astra International Tbk | | | Automobiles | | | | 3,806,000 | | | | 23,042,986 | |
PT Bank Central Asia Tbk | | | Commercial Banks | | | | 15,933,532 | | | | 11,317,936 | |
PT Bank Rakyat Indonesia (Persero) Tbk | | | Commercial Banks | | | | 4,902,500 | | | | 5,713,235 | |
| | | | | | | | | | | | |
| | | | | | | | | | | 40,074,157 | |
| | | | | | | | | | | | |
Mexico 2.6% | | | | | | | | | | | | |
America Movil SAB de CV, L, ADR | | | Wireless Telecommunication Services | | | | 307,367 | | | | 17,624,424 | |
Kimberly Clark de Mexico SAB de CV, A | | | Household Products | | | | 730,258 | | | | 4,459,071 | |
| | | | | | | | | | | | |
| | | | | | | | | | | 22,083,495 | |
| | | | | | | | | | | | |
TD-12
Franklin Templeton Variable Insurance Products Trust
Statement of Investments, December 31, 2010 (continued)
| | | | | | | | | | | | |
| Templeton Developing Markets Securities Fund | | Industry | | | Shares | | | Value | |
Common Stocks (continued) | | | | | | | | | | | | |
Nigeria 0.1% | | | | | | | | | | | | |
Nigerian Breweries PLC | | | Beverages | | | | 1,586,265 | | | $ | 798,350 | |
| | | | | | | | | | | | |
Pakistan 1.7% | | | | | | | | | | | | |
MCB Bank Ltd. | | | Commercial Banks | | | | 2,302,989 | | | | 6,132,346 | |
Oil & Gas Development Co. Ltd. | | | Oil, Gas & Consumable Fuels | | | | 4,217,200 | | | | 8,377,810 | |
| | | | | | | | | | | | |
| | | | | | | | | | | 14,510,156 | |
| | | | | | | | | | | | |
Russia 15.0% | | | | | | | | | | | | |
Gazprom, ADR | | | Oil, Gas & Consumable Fuels | | | | 851,800 | | | | 21,669,792 | |
Gazprom, ADR (London Stock Exchange) | | | Oil, Gas & Consumable Fuels | | | | 235,100 | | | | 5,931,573 | |
cLUKOIL Holdings, ADR | | | Oil, Gas & Consumable Fuels | | | | 75,208 | | | | 4,303,402 | |
cLUKOIL Holdings, ADR (London Stock Exchange) | | | Oil, Gas & Consumable Fuels | | | | 317,168 | | | | 17,951,709 | |
Mining and Metallurgical Co. Norilsk Nickel, ADR | | | Metals & Mining | | | | 1,251,800 | | | | 30,093,272 | |
Mobile TeleSystems | |
| Wireless Telecommunication
Services |
| | | 302,083 | | | | 2,567,463 | |
Mobile TeleSystems, ADR | |
| Wireless Telecommunication
Services |
| | | 206,000 | | | | 4,299,220 | |
Sberbank RF | | | Commercial Banks | | | | 6,061,420 | | | | 20,651,258 | |
TNK-BP | | | Oil, Gas & Consumable Fuels | | | | 5,340,274 | | | | 14,316,063 | |
dUralkali, GDR, Reg S | | | Chemicals | | | | 122,196 | | | | 4,489,481 | |
| | | | | | | | | | | | |
| | | | | | | | | | | 126,273,233 | |
| | | | | | | | | | | | |
Singapore 0.6% | | | | | | | | | | | | |
Keppel Corp. Ltd. | | | Industrial Conglomerates | | | | 559,143 | | | | 4,933,358 | |
| | | | | | | | | | | | |
South Africa 1.0% | | | | | | | | | | | | |
Remgro Ltd. | | | Diversified Financial Services | | | | 504,061 | | | | 8,600,905 | |
| | | | | | | | | | | | |
South Korea 1.0% | | | | | | | | | | | | |
aSilicon Works Co. Ltd. | |
| Semiconductors &
Semiconductor Equipment |
| | | 1,632 | | | | 48,760 | |
SK Energy Co. Ltd. | | | Oil, Gas & Consumable Fuels | | | | 48,967 | | | | 8,472,328 | |
| | | | | | | | | | | | |
| | | | | | | | | | | 8,521,088 | |
| | | | | | | | | | | | |
Sweden 0.9% | | | | | | | | | | | | |
Oriflame Cosmetics SA, SDR | | | Personal Products | | | | 149,765 | | | | 7,897,398 | |
| | | | | | | | | | | | |
Taiwan 2.2% | | | | | | | | | | | | |
President Chain Store Corp. | | | Food & Staples Retailing | | | | 3,628,075 | | | | 16,728,697 | |
eUni-President China Holdings Ltd. | | | Food Products | | | | 2,679,000 | | | | 1,433,855 | |
| | | | | | | | | | | | |
| | | | | | | | | | | 18,162,552 | |
| | | | | | | | | | | | |
Thailand 3.9% | | | | | | | | | | | | |
Kasikornbank Public Co. Ltd., fgn. | | | Commercial Banks | | | | 2,739,100 | | | | 11,889,325 | |
PTT Exploration and Production Public Co. Ltd., fgn. | | | Oil, Gas & Consumable Fuels | | | | 1,961,100 | | | | 10,958,417 | |
PTT Public Co. Ltd., fgn. | | | Oil, Gas & Consumable Fuels | | | | 938,100 | | | | 9,984,766 | |
| | | | | | | | | | | | |
| | | | | | | | | | | 32,832,508 | |
| | | | | | | | | | | | |
Turkey 3.8% | | | | | | | | | | | | |
Akbank TAS | | | Commercial Banks | | | | 2,712,311 | | | | 15,092,826 | |
Koza Altin Isletmeleri AS | | | Metals & Mining | | | | 36,069 | | | | 481,887 | |
Tupras-Turkiye Petrol Rafinerileri AS | | | Oil, Gas & Consumable Fuels | | | | 667,504 | | | | 16,710,328 | |
| | | | | | | | | | | | |
| | | | | | | | | | | 32,285,041 | |
| | | | | | | | | | | | |
United Arab Emirates 1.0% | | | | | | | | | | | | |
aEmaar Properties PJSC | |
| Real Estate Management &
Development |
| | | 8,942,377 | | | | 8,642,918 | |
| | | | | | | | | | | | |
TD-13
Franklin Templeton Variable Insurance Products Trust
Statement of Investments, December 31, 2010 (continued)
| | | | | | | | | | | | |
| Templeton Developing Markets Securities Fund | | Industry | | | Shares | | | Value | |
Common Stocks (continued) | | | | | | | | | | | | |
United Kingdom 4.8% | | | | | | | | | | | | |
Anglo American PLC | | | Metals & Mining | | | | 444,762 | | | $ | 23,046,056 | |
Antofagasta PLC | | | Metals & Mining | | | | 704,479 | | | | 17,750,351 | |
| | | | | | | | | | | | |
| | | | | | | | | | | 40,796,407 | |
| | | | | | | | | | | | |
Vietnam 0.1% | | | | | | | | | | | | |
Petrovietnam Fertilizer and Chemical JSC | | | Chemicals | | | | 217,810 | | | | 424,505 | |
| | | | | | | | | | | | |
Total Common Stocks (Cost $438,404,828) | | | | | | | | | | | 744,809,956 | |
| | | | | | | | | | | | |
Preferred Stocks 10.4% | | | | | | | | | | | | |
Brazil 9.5% | | | | | | | | | | | | |
Banco Bradesco SA, ADR, pfd. | | | Commercial Banks | | | | 607,631 | | | | 12,328,833 | |
Itausa - Investimentos Itau SA, pfd. | | | Commercial Banks | | | | 1,018,810 | | | | 8,103,577 | |
Petroleo Brasileiro SA, ADR, pfd. | | | Oil, Gas & Consumable Fuels | | | | 130,588 | | | | 4,462,192 | |
Vale SA, ADR, pfd., A | | | Metals & Mining | | | | 1,817,625 | | | | 54,928,628 | |
| | | | | | | | | | | | |
| | | | | | | | | | | 79,823,230 | |
| | | | | | | | | | | | |
Chile 0.9% | | | | | | | | | | | | |
Embotelladora Andina SA, pfd., A | | | Beverages | | | | 1,918,947 | | | | 7,872,603 | |
| | | | | | | | | | | | |
Total Preferred Stocks (Cost $37,817,290) | | | | | | | | | | | 87,695,833 | |
| | | | | | | | | | | | |
Total Investments before Short Term Investments
(Cost $476,222,118) | | | | | | | | | | | 832,505,789 | |
| | | | | | | | | | | | |
Short Term Investments (Cost $12,023,709) 1.4% | | | | | | | | | | | | |
Money Market Funds 1.4% | | | | | | | | | | | | |
a,fInstitutional Fiduciary Trust Money Market Portfolio | | | | | | | 12,023,709 | | | | 12,023,709 | |
| | | | | | | | | | | | |
Total Investments (Cost $488,245,827) 100.1% | | | | | | | | | | | 844,529,498 | |
Other Assets, less Liabilities (0.1)% | | | | | | | | | | | (1,059,551 | ) |
| | | | | | | | | | | | |
Net Assets 100.0% | | | | | | | | | | $ | 843,469,947 | |
| | | | | | | | | | | | |
See Abbreviations on page TD-26.
aNon-income producing.
bSecurity was purchased pursuant to Rule 144A under the Securities Act of 1933 and may be sold in transactions exempt from registration only to qualified institutional buyers or in a public offering registered under the Securities Act of 1933. These securities have been deemed liquid under guidelines approved by the Trust’s Board of Trustees. At December 31, 2010, the aggregate value of these securities was $1,245,582, representing 0.15% of net assets.
cAt December 31, 2010, pursuant to the Fund’s policies and the requirements of applicable securities law, the Fund may be restricted from trading these securities for a limited or extended period of time due to ownership limits and/or potential possession of material non-public information.
dSecurity was purchased pursuant to Regulation S under the Securities Act of 1933, which exempts from registration securities offered and sold outside of the United States. Such a security cannot be sold in the United States without either an effective registration statement filed pursuant to the Securities Act of 1933, or pursuant to an exemption from registration. This security has been deemed liquid under guidelines approved by the Trust’s Board of Trustees. At December 31, 2010, the value of this security was $4,489,481, representing 0.53% of net assets.
eA portion of all of the security purchased on a delayed delivery basis. See note 1(c).
fSee Note 7 regarding investments in the Institutional Fiduciary Trust Money Market Portfolio.
The accompanying notes are an integral part of these financial statements.
TD-14
Franklin Templeton Variable Insurance Products Trust
Financial Statements
Statements of Assets and Liabilities
December 31, 2010
| | | | |
| | | Templeton
Developing Markets
Securities Fund | |
Assets: | | | | |
Investments in securities: | | | | |
Cost - Unaffiliated issuers | | $ | 476,222,118 | |
Cost - Sweep Money Fund (Note 7) | | | 12,023,709 | |
| | | | |
Total cost of investments | | $ | 488,245,827 | |
| | | | |
Value - Unaffiliated issuers | | $ | 832,505,789 | |
Value - Sweep Money Fund (Note 7) | | | 12,023,709 | |
| | | | |
Total value of investments | | | 844,529,498 | |
Foreign currency, at value (cost $255,156) | | | 254,727 | |
Receivables: | | | | |
Investment securities sold | | | 274,331 | |
Capital shares sold | | | 596,965 | |
Dividends | | | 571,719 | |
Foreign tax | | | 244,317 | |
Other assets | | | 122 | |
| | | | |
Total assets | | | 846,471,679 | |
| | | | |
Liabilities: | | | | |
Payables: | | | | |
Investment securities purchased | | | 802,548 | |
Capital shares redeemed | | | 601,838 | |
Affiliates | | | 1,167,902 | |
Reports to shareholders | | | 190,633 | |
Deferred tax | | | 53,321 | |
Accrued expenses and other liabilities | | | 185,490 | |
| | | | |
Total liabilities | | | 3,001,732 | |
| | | | |
Net assets, at value | | $ | 843,469,947 | |
| | | | |
Net assets consist of: | | | | |
Paid-in capital | | $ | 660,200,245 | |
Undistributed net investment income | | | 163,727 | |
Net unrealized appreciation (depreciation) | | | 356,211,712 | |
Accumulated net realized gain (loss) | | | (173,105,737 | ) |
| | | | |
Net assets, at value | | $ | 843,469,947 | |
| | | | |
The accompanying notes are an integral part of these financial statements.
TD-15
Franklin Templeton Variable Insurance Products Trust
Financial Statements (continued)
Statements of Assets and Liabilities (continued)
December 31, 2010
| | | | |
| | | Templeton
Developing Markets
Securities Fund | |
Class 1: | | | | |
Net assets, at value | | $ | 347,242,173 | |
| | | | |
Shares outstanding | | | 30,462,720 | |
| | | | |
Net asset value and maximum offering price per share | | $ | 11.40 | |
| | | | |
Class 2: | | | | |
Net assets, at value | | $ | 392,546,175 | |
| | | | |
Shares outstanding | | | 34,731,746 | |
| | | | |
Net asset value and maximum offering price per share | | $ | 11.30 | |
| | | | |
Class 3: | | | | |
Net assets, at value | | $ | 66,483,746 | |
| | | | |
Shares outstanding | | | 5,917,820 | |
| | | | |
Net asset value and maximum offering price per sharea | | $ | 11.23 | |
| | | | |
Class 4: | | | | |
Net assets, at value | | $ | 37,197,853 | |
| | | | |
Shares outstanding | | | 3,290,674 | |
| | | | |
Net asset value and maximum offering price per share | | $ | 11.30 | |
| | | | |
aRedemption price is equal to net asset value less redemption fees retained by the Fund.
The accompanying notes are an integral part of these financial statements.
TD-16
Franklin Templeton Variable Insurance Products Trust
Financial Statements (continued)
Statements of Operations
for the year ended December 31, 2010
| | | | |
| | | Templeton
Developing Markets
Securities Fund | |
Investment income: | | | | |
Dividends (net of foreign taxes of $2,096,520) | | $ | 18,390,972 | |
Interest | | | 567 | |
| | | | |
Total investment income | | | 18,391,539 | |
| | | | |
Expenses: | | | | |
Management fees (Note 3a) | | | 9,615,170 | |
Administrative fees (Note 3b) | | | 1,053,483 | |
Distribution fees (Note 3c) | | | | |
Class 2 | | | 950,322 | |
Class 3 | | | 151,963 | |
Class 4 | | | 104,197 | |
Unaffiliated transfer agent fees | | | 2,538 | |
Custodian fees (Note 4) | | | 564,413 | |
Reports to shareholders | | | 250,793 | |
Professional fees | | | 75,232 | |
Trustees’ fees and expenses | | | 3,523 | |
Other | | | 27,832 | |
| | | | |
Total expenses | | | 12,799,466 | |
Expense reductions (Note 4) | | | (3 | ) |
| | | | |
Net expenses | | | 12,799,463 | |
| | | | |
Net investment income | | | 5,592,076 | |
| | | | |
Realized and unrealized gains (losses): | | | | |
Net realized gain (loss) from: | | | | |
Investments | | | 49,859,979 | |
Foreign currency transactions | | | (98,901 | ) |
| | | | |
Net realized gain (loss) | | | 49,761,078 | |
| | | | |
Net change in unrealized appreciation (depreciation) on: | | | | |
Investments | | | 65,639,558 | |
Translation of other assets and liabilities denominated in foreign currencies | | | 2,185 | |
Change in deferred taxes on unrealized appreciation | | | 2,815,324 | |
| | | | |
Net change in unrealized appreciation (depreciation) | | | 68,457,067 | |
| | | | |
Net realized and unrealized gain (loss) | | | 118,218,145 | |
| | | | |
Net increase (decrease) in net assets resulting from operations | | $ | 123,810,221 | |
| | | | |
The accompanying notes are an integral part of these financial statements.
TD-17
Franklin Templeton Variable Insurance Products Trust
Financial Statements (continued)
Statements of Changes in Net Assets
| | | | | | | | |
| | | Templeton Developing Markets
Securities Fund | |
| | | Year Ended December 31, | |
| | | 2010 | | | 2009 | |
| | | | |
Increase (decrease) in net assets: | | | | | | | | |
Operations: | | | | | | | | |
Net investment income | | $ | 5,592,076 | | | $ | 9,443,956 | |
Net realized gain (loss) from investments and foreign currency transactions | | | 49,761,078 | | | | (56,490,240 | ) |
Net change in unrealized appreciation (depreciation) on investments, translation of other assets and liabilities denominated in foreign currencies and deferred taxes | | | 68,457,067 | | | | 387,238,551 | |
| | | | |
Net increase (decrease) in net assets resulting from operations | | | 123,810,221 | | | | 340,192,267 | |
| | | | |
Distributions to shareholders from: | | | | | | | | |
Net investment income: | | | | | | | | |
Class 1 | | | (5,483,924 | ) | | | (13,652,950 | ) |
Class 2 | | | (5,656,521 | ) | | | (13,921,115 | ) |
Class 3 | | | (947,886 | ) | | | (1,779,543 | ) |
Class 4 | | | (471,295 | ) | | | (467,339 | ) |
Net realized gains: | | | | | | | | |
Class 1 | | | — | | | | (1,172,623 | ) |
Class 2 | | | — | | | | (1,344,137 | ) |
Class 3 | | | — | | | | (166,799 | ) |
Class 4 | | | — | | | | (41,022 | ) |
| | | | |
Total distributions to shareholders | | | (12,559,626 | ) | | | (32,545,528 | ) |
| | | | |
Capital share transactions: (Note 2) | | | | | | | | |
Class 1 | | | (22,233,537 | ) | | | (15,950,150 | ) |
Class 2 | | | (97,764,544 | ) | | | 3,177,398 | |
Class 3 | | | (9,001,736 | ) | | | 10,244,457 | |
Class 4 | | | 6,238,252 | | | | 11,266,396 | |
| | | | |
Total capital share transactions | | | (122,761,565 | ) | | | 8,738,101 | |
| | | | |
Redemption fees | | | 26,367 | | | | 10,133 | |
| | | | |
Net increase (decrease) in net assets | | | (11,484,603 | ) | | | 316,394,973 | |
Net assets: | | | | | | | | |
Beginning of year | | | 854,954,550 | | | | 538,559,577 | |
| | | | |
End of year | | $ | 843,469,947 | | | $ | 854,954,550 | |
| | | | |
Undistributed net investment income included in net assets: | | | | | | | | |
End of year | | $ | 163,727 | | | $ | 6,700,234 | |
| | | | |
The accompanying notes are an integral part of these financial statements.
TD-18
Franklin Templeton Variable Insurance Products Trust
Notes to Financial Statements
Templeton Developing Markets Securities Fund
1. ORGANIZATION AND SIGNIFICANT ACCOUNTING POLICIES
Franklin Templeton Variable Insurance Products Trust (Trust) is registered under the Investment Company Act of 1940, as amended, (1940 Act) as an open-end investment company, consisting of twenty separate funds. The Templeton Developing Markets Securities Fund (Fund) is included in this report. The financial statements of the remaining funds in the Trust are presented separately. Shares of the Fund are generally sold only to insurance company separate accounts to fund the benefits of variable life insurance policies or variable annuity contracts. The Fund offers four classes of shares: Class 1, Class 2, Class 3, and Class 4. Each class of shares differs by its distribution fees, voting rights on matters affecting a single class and its exchange privilege.
The following summarizes the Fund’s significant accounting policies.
a. Financial Instrument Valuation
The Fund values its investments in securities and other assets and liabilities carried at fair value daily. Fair value is the price that would be received to sell an asset or paid to transfer a liability in an orderly transaction between market participants on the measurement date. Under procedures approved by the Trust’s Board of Trustees, the Fund may utilize independent pricing services, quotations from securities and financial instrument dealers, and other market sources to determine fair value.
Equity securities listed on an exchange or on the NASDAQ National Market System are valued at the last quoted sale price or the official closing price of the day, respectively. Foreign equity securities are valued as of the close of trading on the foreign stock exchange on which the security is primarily traded, or the NYSE, whichever is earlier. The value is then converted into its U.S. dollar equivalent at the foreign exchange rate in effect at the close of the NYSE on the day that the value of the security is determined. Over-the-counter securities are valued within the range of the most recent quoted bid and ask prices. Securities that trade in multiple markets or on multiple exchanges are valued according to the broadest and most representative market. Certain equity securities are valued based upon fundamental characteristics or relationships to similar securities. Investments in open-end mutual funds are valued at the closing net asset value.
The Fund has procedures to determine the fair value of securities and other financial instruments for which market prices are not readily available or which may not be reliably priced. Under these procedures, the Fund primarily employs a market-based approach which may use related or comparable assets or liabilities, recent transactions, market multiples, book values, and other relevant information for the investment to determine the fair value of the investment. The Fund may also use an income-based valuation approach in which the anticipated future cash flows of the investment are discounted to calculate fair value. Discounts may also be applied due to the nature or duration of any restrictions on the disposition of the investments. Due to the inherent uncertainty of valuations of such investments, the fair values may differ significantly from the values that would have been used had an active market existed.
Trading in securities on foreign securities stock exchanges and over-the-counter markets may be completed before the daily close of business on the NYSE. Occasionally, events occur between the time at which trading in a foreign security is completed and the close of the NYSE that might call into question the reliability of the value of a portfolio security held by the Fund. As a result, differences may arise between the value of the Fund’s portfolio securities as determined at the foreign market close and the latest indications of value at the close of the NYSE. In order to minimize the potential for these differences, the investment manager monitors price movements following the close of trading in foreign stock markets through a series of country specific market proxies (such as baskets of American Depository Receipts, futures contracts and exchange traded funds). These price movements are measured against established trigger thresholds for each specific market proxy to assist in determining if an event has occurred that may call into question the reliability of the values of the foreign securities held by the Fund. If such an event occurs, the securities may be valued using fair value procedures, which may include the use of independent pricing services.
b. Foreign Currency Translation
Portfolio securities and other assets and liabilities denominated in foreign currencies are translated into U.S. dollars based on the exchange rate of such currencies against U.S. dollars on the date of valuation. The Fund may enter into foreign currency
TD-19
Franklin Templeton Variable Insurance Products Trust
Notes to Financial Statements (continued)
Templeton Developing Markets Securities Fund
1. ORGANIZATION AND SIGNIFICANT ACCOUNTING POLICIES (continued)
b. Foreign Currency Translation (continued)
exchange contracts to facilitate transactions denominated in a foreign currency. Purchases and sales of securities, income and expense items denominated in foreign currencies are translated into U.S. dollars at the exchange rate in effect on the transaction date. Portfolio securities and assets and liabilities denominated in foreign currencies contain risks that those currencies will decline in value relative to the U.S. dollar. Occasionally, events may impact the availability or reliability of foreign exchange rates used to convert the U.S. dollar equivalent value. If such an event occurs, the foreign exchange rate will be valued at fair value using procedures established and approved by the Trust’s Board of Trustees.
The Fund does not separately report the effect of changes in foreign exchange rates from changes in market prices on securities held. Such changes are included in net realized and unrealized gain or loss from investments on the Statement of Operations.
Realized foreign exchange gains or losses arise from sales of foreign currencies, currency gains or losses realized between the trade and settlement dates on securities transactions and the difference between the recorded amounts of dividends, interest, and foreign withholding taxes and the U.S. dollar equivalent of the amounts actually received or paid. Net unrealized foreign exchange gains and losses arise from changes in foreign exchange rates on foreign denominated assets and liabilities other than investments in securities held at the end of the reporting period.
c. Securities Purchased on a Delayed Delivery Basis
The Fund may purchase securities on a delayed delivery basis, with payment and delivery scheduled for a future date. These transactions are subject to market fluctuations and are subject to the risk that the value at delivery may be more or less than the trade date purchase price. Although the Fund will generally purchase these securities with the intention of holding the securities, it may sell the securities before the settlement date. Sufficient assets have been segregated for these securities.
d. Income and Deferred Taxes
It is the Fund’s policy to qualify as a regulated investment company under the Internal Revenue Code. The Fund intends to distribute to shareholders substantially all of its taxable income and net realized gains to relieve it from federal income and excise taxes. As a result, no provision for U.S. federal income taxes is required. The Fund files U.S. income tax returns as well as tax returns in certain other jurisdictions. The Fund’s application of those tax rules is subject to its understanding. The Fund records a provision for taxes in its financial statements including penalties and interest, if any, for a tax position taken on a tax return (or expected to be taken) when it fails to meet the more likely than not (a greater than 50% probability) threshold and based on the technical merits, the tax position may not be sustained upon examination by the tax authorities. As of December 31, 2010, and for all open tax years, the Fund has determined that no provision for income tax is required in the Fund’s financial statements. Open tax years are those that remain subject to examination and are based on each tax jurisdiction statute of limitation. The Fund is not aware of any tax position for which it is reasonably possible that the total amounts of unrecognized tax effects will significantly change in the next twelve months.
The Fund may be subject to foreign taxation related to income received, capital gains on the sale of securities and certain foreign currency transactions in the foreign jurisdictions in which it invests. Foreign taxes, if any, are recorded based on the tax regulations and rates that exist in the foreign markets in which the Fund invests. When a capital gain tax is determined to apply the Fund records an estimated deferred tax liability for net unrealized gains on these securities in an amount that would be payable if the securities were disposed of on the valuation date.
e. Security Transactions, Investment Income, Expenses and Distributions
Security transactions are accounted for on trade date. Realized gains and losses on security transactions are determined on a specific identification basis. Dividend income is recorded on the ex-dividend date except that certain dividends from foreign securities are recognized as soon as the Fund is notified of the ex-dividend date. Distributions to shareholders are recorded on the ex-dividend date and are determined according to income tax regulations (tax basis). Distributable earnings determined on a
TD-20
Franklin Templeton Variable Insurance Products Trust
Notes to Financial Statements (continued)
Templeton Developing Markets Securities Fund
1. ORGANIZATION AND SIGNIFICANT ACCOUNTING POLICIES (continued)
e. Security Transactions, Investment Income, Expenses and Distributions (continued)
tax basis may differ from earnings recorded in accordance with accounting principles generally accepted in the United States of America. These differences may be permanent or temporary. Permanent differences are reclassified among capital accounts to reflect their tax character. These reclassifications have no impact on net assets or the results of operations. Temporary differences are not reclassified, as they may reverse in subsequent periods.
Common expenses incurred by the Trust are allocated among the funds based on the ratio of net assets of each fund to the combined net assets of the Trust. Fund specific expenses are charged directly to the fund that incurred the expense.
Realized and unrealized gains and losses and net investment income, not including class specific expenses, are allocated daily to each class of shares based upon the relative proportion of net assets of each class. Differences in per share distributions, by class, are generally due to differences in class specific expenses.
f. Accounting Estimates
The preparation of financial statements in accordance with accounting principles generally accepted in the United States of America requires management to make estimates and assumptions that affect the reported amounts of assets and liabilities at the date of the financial statements and the amounts of income and expenses during the reporting period. Actual results could differ from those estimates.
g. Redemption Fees
Redemptions and exchanges of interests in an insurance company subaccount that invests in Class 3 shares of the Fund will be subject to a 1.0% short term trading fee if the interest in the subaccount has been held for less than 60 days. Such fees are retained by the Fund and accounted for as an addition to paid-in capital, allocated to each class of shares based upon the relative proportion of net assets of each class.
h. Guarantees and Indemnifications
Under the Trust’s organizational documents, its officers and trustees are indemnified by the Trust against certain liabilities arising out of the performance of their duties to the Trust. Additionally, in the normal course of business, the Trust, on behalf of the Fund, enters into contracts with service providers that contain general indemnification clauses. The Trust’s maximum exposure under these arrangements is unknown as this would involve future claims that may be made against the Trust that have not yet occurred. Currently, the Trust expects the risk of loss to be remote.
2. SHARES OF BENEFICIAL INTEREST
At December 31, 2010, there were an unlimited number of shares authorized (without par value). Transactions in the Fund’s shares were as follows:
| | | | | | | | | | | | | | | | |
| | | Year Ended December 31, | |
| | | 2010 | | | 2009 | |
| | | Shares | | | Amount | | | Shares | | | Amount | |
Class 1 Shares: | | | | | | | | | | | | | | | | |
Shares sold | | | 4,235,745 | | | $ | 44,045,245 | | | | 8,168,810 | | | $ | 63,707,152 | |
Shares issued in reinvestment of distributions | | | 603,956 | | | | 5,483,924 | | | | 2,750,570 | | | | 14,825,573 | |
Shares redeemed in-kind (Note 10) | | | — | | | | — | | | | (7,688,598 | ) | | | (41,966,671 | ) |
Shares redeemed | | | (7,418,014 | ) | | | (71,762,706 | ) | | | (8,503,331 | ) | | | (52,516,204 | ) |
| | | | |
Net increase (decrease) | | | (2,578,313 | ) | | $ | (22,233,537 | ) | | | (5,272,549 | ) | | $ | (15,950,150 | ) |
| | | | |
TD-21
Franklin Templeton Variable Insurance Products Trust
Notes to Financial Statements (continued)
Templeton Developing Markets Securities Fund
2. SHARES OF BENEFICIAL INTEREST (continued)
| | | | | | | | | | | | | | | | |
| | | Year Ended December 31, | |
| | | 2010 | | | 2009 | |
| | | Shares | | | Amount | | | Shares | | | Amount | |
Class 2 Shares: | | | | | | | | | | | | | | | | |
Shares sold | | | 9,770,557 | | | $ | 97,538,996 | | | | 10,529,364 | | | $ | 81,012,897 | |
Shares issued in reinvestment of distributions | | | 627,805 | | | | 5,656,521 | | | | 2,847,995 | | | | 15,265,252 | |
Shares redeemed | | | (20,231,375 | ) | | | (200,960,061 | ) | | | (12,555,978 | ) | | | (93,100,751 | ) |
| | | | |
Net increase (decrease) | | | (9,833,013 | ) | | $ | (97,764,544 | ) | | | 821,381 | | | $ | 3,177,398 | |
| | | | |
Class 3 Shares: | | | | | | | | | | | | | | | | |
Shares sold | | | 1,343,547 | | | $ | 13,467,640 | | | | 2,627,098 | | | $ | 19,856,055 | |
Shares issued in reinvestment of distributions | | | 105,791 | | | | 947,886 | | | | 365,167 | | | | 1,946,341 | |
Shares redeemed | | | (2,390,224 | ) | | | (23,417,262 | ) | | | (1,609,465 | ) | | | (11,557,938 | ) |
| | | | |
Net increase (decrease) | | | (940,886 | ) | | $ | (9,001,736 | ) | | | 1,382,800 | | | $ | 10,244,457 | |
| | | | |
Class 4 Shares: | | | | | | | | | | | | | | | | |
Shares sold | | | 1,189,893 | | | $ | 11,893,157 | | | | 1,613,355 | | | $ | 12,381,956 | |
Shares issued on reinvestment of distributions | | | 52,250 | | | | 471,295 | | | | 94,491 | | | | 508,362 | |
Shares redeemed | | | (641,932 | ) | | | (6,126,200 | ) | | | (201,223 | ) | | | (1,623,922 | ) |
| | | | |
Net increase (decrease) | | | 600,211 | | | $ | 6,238,252 | | | | 1,506,623 | | | $ | 11,266,396 | |
| | | | |
3. TRANSACTIONS WITH AFFILIATES
Franklin Resources, Inc. is the holding company for various subsidiaries that together are referred to as Franklin Templeton Investments. Certain officers and trustees of the Fund are also officers and/or directors of the following subsidiaries:
| | |
| Subsidiary | | Affiliation |
Templeton Asset Management Ltd. (TAML) | | Investment manager |
Franklin Templeton Services, LLC (FT Services) | | Administrative manager |
Franklin Templeton Distributors, Inc. (Distributors) | | Principal underwriter |
Franklin Templeton Investor Services, LLC (Investor Services) | | Transfer agent |
a. Management Fees
The Fund pays an investment management fee to TAML based on the average daily net assets of the Fund as follows:
| | |
| Annualized Fee Rate | | Net Assets |
| 1.250% | | Up to and including $500 million |
| 1.200% | | Over $500 million, up to and including $3 billion |
| 1.150% | | Over $3 billion, up to and including $4 billion |
| 1.100% | | Over $4 billion, up to and including $15 billion |
| 1.050% | | Over $15 billion, up to and including $20 billion |
| 1.000% | | In excess of $20 billion |
Prior to May 1, 2010, the Fund paid an annualized fee rate of 1.25% on net assets up to and including $1 billion.
TD-22
Franklin Templeton Variable Insurance Products Trust
Notes to Financial Statements (continued)
Templeton Developing Markets Securities Fund
3. TRANSACTIONS WITH AFFILIATES (continued)
b. Administrative Fees
The Fund pays an administrative fee to FT Services based on the Fund’s average daily net assets as follows:
| | |
| Fee Rate | | Net Assets |
| 0.150% | | Up to and including $200 million |
| 0.135% | | Over $200 million, up to and including $700 million |
| 0.100% | | Over $700 million, up to and including $1.2 billion |
| 0.075% | | In excess of $1.2 billion |
c. Distribution Fees
The Trust’s Board of Trustees has adopted distribution plans for Class 2, Class 3, and Class 4 shares pursuant to Rule 12b-1 under the 1940 Act. Under the Fund’s compensation distribution plans, the Fund pays Distributors for costs incurred in connection with the servicing, sale and distribution of the Fund’s shares up to 0.25%, 0.35%, and 0.35% per year of its average daily net assets of Class 2, Class 3, and Class 4, respectively. The Board of Trustees has agreed to limit the current rate to 0.25% per year for Class 3.
d. Transfer Agent Fees
Investor Services, under terms of an agreement, performs shareholder servicing for the Fund and is not paid by the Fund for the services.
4. EXPENSE OFFSET ARRANGEMENT
The Fund has entered into an arrangement with its custodian whereby credits realized as a result of uninvested cash balances are used to reduce a portion of the Fund’s custodian expenses. During the year ended December 31, 2010, the custodian fees were reduced as noted in the Statement of Operations.
5. INCOME TAXES
For tax purposes, capital losses may be carried over to offset future capital gains, if any. At December 31, 2010, the Fund had tax basis capital losses of $166,405,957 expiring in 2017. During the year ended December 31, 2010, the Fund utilized $46,167,495 of capital loss carryforwards.
The tax character of distributions paid during the years ended December 31, 2010 and 2009, was as follows:
| | | | | | | | |
| | | 2010 | | | 2009 | |
Distributions paid from: | | | | | | | | |
Ordinary income | | $ | 12,559,626 | | | $ | 29,826,261 | |
Long term capital gain | | | — | | | | 2,719,267 | |
| | | | |
| | $ | 12,559,626 | | | $ | 32,545,528 | |
| | | | |
TD-23
Franklin Templeton Variable Insurance Products Trust
Notes to Financial Statements (continued)
Templeton Developing Markets Securities Fund
5. INCOME TAXES (continued)
At December 31, 2010, the cost of investments, net unrealized appreciation (depreciation) and undistributed ordinary income for income tax purposes were as follows:
| | | | |
Cost of investments | | $ | 502,554,307 | |
| | | | |
| |
Unrealized appreciation | | $ | 352,930,909 | |
Unrealized depreciation | | | (10,955.718 | ) |
| | | | |
Net unrealized appreciation (depreciation) | | $ | 341,975,191 | |
| | | | |
Distributable earnings – undistributed ordinary income | | $ | 7,772,423 | |
| | | | |
Net investment income differs for financial statement and tax purposes primarily due to differing treatments of foreign currency transactions, passive foreign investment company shares, and corporate actions.
Net realized gains (losses) differ for financial statement and tax purposes primarily due to differing treatments of wash sales, foreign currency transactions, passive foreign investment company shares, and corporate actions.
6. INVESTMENT TRANSACTIONS
Purchases and sales of investments (excluding short term securities) for the year ended December 31, 2010, aggregated $182,627,907 and $288,362,839, respectively.
7. INVESTMENTS IN INSTITUTIONAL FIDUCIARY TRUST MONEY MARKET PORTFOLIO
The Fund may invest in the Institutional Fiduciary Trust Money Market Portfolio (Sweep Money Fund), an open-end investment company managed by Franklin Advisers, Inc. (an affiliate of the investment manager). Management fees paid by the Fund are reduced on assets invested in the Sweep Money Fund, in an amount not to exceed the management and administrative fees paid by the Sweep Money Fund.
8. CONCENTRATION OF RISK
Investing in foreign securities may include certain risks and considerations not typically associated with investing in U.S. securities, such as fluctuating currency values and changing local and regional economic, political and social conditions, which may result in greater market volatility. In addition, certain foreign securities may not be as liquid as U.S. securities.
9. CREDIT FACILITY
The Fund, together with other U.S. registered and foreign investment funds (collectively “Borrowers”), managed by Franklin Templeton Investments, are borrowers in a joint syndicated senior unsecured credit facility totaling $750 million (Global Credit Facility) which matures on January 21, 2011. This Global Credit Facility provides a source of funds to the Borrowers for temporary and emergency purposes, including the ability to meet future unanticipated or unusually large redemption requests.
Under the terms of the Global Credit Facility, the Fund shall, in addition to interest charged on any borrowings made by the Fund and other costs incurred by the Fund, pay its share of fees and expenses incurred in connection with the implementation and maintenance of the Global Credit Facility, based upon its relative share of the aggregate net assets of all of the Borrowers, including an annual commitment fee of 0.10% based upon the unused portion of the Global Credit Facility, which is reflected in other expenses on the Statement of Operations. During the year ended December 31, 2010, the Fund did not use the Global Credit Facility.
TD-24
Franklin Templeton Variable Insurance Products Trust
Notes to Financial Statements (continued)
Templeton Developing Markets Securities Fund
9. CREDIT FACILITY (continued)
Effective January 21, 2011, the Borrowers renewed the Global Credit Facility for a total of $750 million, maturing January 20, 2012.
10. REDEMPTION IN-KIND
During the year ended December 31, 2009, the Fund realized $6,207,989 of net losses resulting from a redemption in-kind in which a shareholder redeemed fund shares for securities held by the Fund rather than for cash. Because such losses are not taxable to the Fund, and are not netted with capital gains that are distributed to remaining shareholders, they have been reclassified from accumulated net realized losses to paid in capital.
11. FAIR VALUE MEASUREMENTS
The Fund follows a fair value hierarchy that distinguishes between market data obtained from independent sources (observable inputs) and the Fund’s own market assumptions (unobservable inputs). These inputs are used in determining the value of the Fund’s investments and are summarized in the following fair value hierarchy:
| | • | | Level 1 – quoted prices in active markets for identical securities |
| | • | | Level 2 – other significant observable inputs (including quoted prices for similar securities, interest rates, prepayment speed, credit risk, etc.) |
| | • | | Level 3 – significant unobservable inputs (including the Fund’s own assumptions in determining the fair value of investments) |
The inputs or methodology used for valuing securities are not an indication of the risk associated with investing in those securities.
For movements between the levels within the fair value hierarchy, the Fund has adopted a policy of recognizing the transfers as of the date of the underlying event which caused the movement.
At December 31, 2010, all of the Fund’s investments in securities carried at fair value were in Level 1 inputs. For detailed industry/country descriptions, see the accompanying Statement of Investments.
TD-25
Franklin Templeton Variable Insurance Products Trust
Notes to Financial Statements (continued)
Templeton Developing Markets Securities Fund
12. SUBSEQUENT EVENTS
The Fund has evaluated subsequent events through the issuance of the financial statements and determined that no events have occurred that require disclosure other than those already disclosed in the financial statements.
| | | | |
ABBREVIATIONS | | | | |
| Selected Portfolio | | | | |
| | | | |
| ADR - American Depository Receipt | | | | |
| GDR - Global Depository Receipt | | | | |
| SDR - Swedish Depository Receipt | | | | |
TD-26
Franklin Templeton Variable Insurance Products Trust
Templeton Developing Markets Securities Fund
Report of Independent Registered Public Accounting Firm
To the Board of Trustees and Shareholders of Franklin Templeton Variable Insurance Products Trust
In our opinion, the accompanying statement of assets and liabilities, including the statement of investments, and the related statements of operations and of changes in net assets and the financial highlights present fairly, in all material respects, the financial position of Templeton Developing Markets Securities Fund (the “Fund”) at December 31, 2010, the results of its operations for the year then ended, the changes in its net assets for each of the two years in the period then ended and the financial highlights for each of the periods presented, in conformity with accounting principles generally accepted in the United States of America. These financial statements and financial highlights (hereafter referred to as “financial statements”) are the responsibility of the Fund’s management. Our responsibility is to express an opinion on these financial statements based on our audits. We conducted our audits of these financial statements in accordance with the standards of the Public Company Accounting Oversight Board (United States). Those standards require that we plan and perform the audit to obtain reasonable assurance about whether the financial statements are free of material misstatement. An audit includes examining, on a test basis, evidence supporting the amounts and disclosures in the financial statements, assessing the accounting principles used and significant estimates made by management, and evaluating the overall financial statement presentation. We believe that our audits, which included confirmation of securities at December 31, 2010 by correspondence with the custodian and brokers, provide a reasonable basis for our opinion.
PricewaterhouseCoopers LLP
San Francisco, California
February 10, 2011
TD-27
Franklin Templeton Variable Insurance Products Trust
Tax Designation (unaudited)
Templeton Developing Markets Securities Fund
At December 31, 2010, more than 50% of the Fund’s total assets were invested in securities of foreign issuers. In most instances, foreign taxes were withheld from income paid to the Fund on these investments. The Fund elects to treat foreign taxes paid as allowed under Section 853 of the Internal Revenue Code. This election will allow shareholders of record as of the 2011 distribution date, to treat their proportionate share of foreign taxes paid by the Funds as having been paid directly by them. The shareholder shall consider these amounts as foreign taxes paid in the tax year in which they receive the Fund distribution.
TD-28
TEMPLETON FOREIGN SECURITIES FUND
This annual report for Templeton Foreign Securities Fund covers the fiscal year ended December 31, 2010.
Performance Summary as of 12/31/10
Average annual total return of Class 4 shares* represents the average annual change in value, assuming reinvestment of dividends and capital gains. Average returns smooth out variations in returns, which can be significant; they are not the same as year-by-year results.
Periods ended 12/31/10
| | | | | | | | | | | | | | | | |
| | | | | | 1-Year | | | 5-Year | | | 10-Year | |
Average Annual Total Return | | | | | | | +8.38% | | | | +4.47% | | | | +4.06% | |
*For the period beginning 2/29/08, Class 4 performance reflects a 12b-1 fee expense of 0.35% per year, which affects future performance. Class 4 performance prior to 2/29/08 reflects historical Class 1 performance, which does not have a 12b-1 fee expense. Since 2/29/08 (effective date), the average annual total return of Class 4 shares was -1.36%.
Total Return Index Comparison
for a Hypothetical $10,000 Investment (1/1/01–12/31/10)
The graph below shows the change in value of a hypothetical $10,000 investment in the Fund over the indicated period and includes reinvestment of any income or distributions. The Fund’s performance* is compared to the performance of the Morgan Stanley Capital International (MSCI) Europe, Australasia, Far East (EAFE) Index. One cannot invest directly in an index, and an index is not representative of the Fund’s portfolio. Please see Important Notes to Performance Information preceding the Fund Summaries.
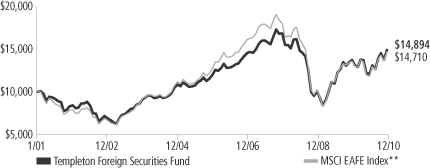
**Source: © 2011 Morningstar. Please see Index Descriptions following the Fund Summaries.
Templeton Foreign Securities Fund – Class 4
Performance reflects the Fund’s Class 4 operating expenses, but does not include any contract fees, expenses or sales charges. If they had been included, performance would be lower. These charges and deductions, particularly for variable life policies, can have a significant effect on contract values and insurance benefits. See the contract prospectus for a complete description of these expenses, including sales charges.
Performance data represent past performance, which does not guarantee future results. Investment return and principal value will fluctuate, and you may have a gain or loss when you sell your shares.
Current performance may differ from figures shown.
TF-1
Fund Goal and Main Investments: Templeton Foreign Securities Fund seeks long-term capital growth. The Fund normally invests at least 80% of its net assets in investments of issuers located outside the U.S., including those in emerging markets.
Performance Overview
You can find the Fund’s one-year total return in the Performance Summary. The Fund performed comparably to its benchmark, the MSCI EAFE Index, which delivered a total return of +8.21% for the same period.1 Please note, index performance information is provided for reference and we do not attempt to track the index but rather undertake investments on the basis of fundamental research.
Economic and Market Overview
During the year under review, equities advanced against a backdrop of heightened volatility and uneven global economic recovery. Emerging market regions primarily led growth, as they were generally unconstrained by the debt overhang burdening western economies and benefited from strong intrinsic demand and significant capital inflows. Policymakers in these regions began raising interest rates toward period-end to combat inflation and speculative investment. Developed economies grew at a more subdued pace, with demand recovery and asset price reflation heavily underpinned by government-sponsored, liquidity-enhancing measures. The U.S. Federal Reserve Board (Fed), having already brought official interest rates close to zero, began directly purchasing government securities as part of an extreme policy measure known as quantitative easing. Further promoting the U.S. recovery, the traditionally pro-business Republican Party gained control of the House of Representatives in mid-term elections and President Obama extended Bush-era tax cuts. In Europe, ballooning fiscal deficits took their toll on peripheral nations and growing concerns of potential sovereign defaults significantly roiled equity markets on several occasions during the period. The European Central Bank responded by pledging 750 billion euros in the spring with the intent to forestall defaults, stabilize markets and restore confidence in the euro currency, followed by further backstops in the autumn as Ireland and the rest of the periphery came under renewed duress.
1. Source: © 2011 Morningstar. One cannot invest directly in an index, and an index is not representative of the Fund’s portfolio. Please see Index Descriptions following the Fund Summaries.
Fund Risks: The Fund’s investments in stocks may offer the potential for long-term gains but can be subject to short-term price fluctuations. Foreign investing, especially in emerging markets, involves additional risks, including currency fluctuations, economic instability, market volatility, and political and social instability. The Fund may have significant investments in one or more countries or in particular sectors, such as technology and financial services from time to time, and may carry greater risk of adverse developments in a country or sector than a fund that invests more broadly. Smaller and midsize company securities can increase the risk of greater price fluctuations, particularly over the short term. The manager applies various techniques and analyses in making investment decisions for the Fund, but there can be no guarantee that these decisions will produce the desired results. The Fund’s prospectus also includes a description of the main investment risks.
TF-2
The combination of intrinsic growth drivers in emerging markets and stimulus-induced support in the developed world encouraged the global economic recovery, and equity markets responded favorably. By the end of 2010, global equity markets recouped all losses suffered since Lehman Brothers Holdings’ 2008 bankruptcy. Commodities surged in the second half of 2010 due to near-term supply constraints and emerging market demand increases, as well as longer term fears that overly accommodative monetary policies would ultimately have negative inflationary consequences. The dollar strengthened relative to the euro, which bore the burden of the region’s fiscal crisis, but weakened against the yen, which hit multi-decade highs amid persistent deflationary pressures. Meanwhile, U.S. Treasuries and corporate bonds finished the year with gains, though Treasury prices declined considerably in the final quarter as Fed policies appeared to improve growth expectations. Although market conditions remained accommodative and corporate profitability improved, critical economic fundamentals such as employment, home prices and credit creation remained substantially depressed at period-end, leading many investors to question the true health of the global economy and the sustainability of the recovery.
Investment Strategy
Our investment philosophy is bottom up, value oriented and long term. In choosing investments, we generally focus on the market price of a company’s securities relative to our evaluation of the company’s potential long-term earnings, asset value and cash flow. Among factors we consider are a company’s historical value measures, including price/earnings ratio, profit margins and liquidation value. We do in-depth research to construct a bargain list from which we buy.
Manager’s Discussion
During the year under review, our stock selection and underweighted allocation to the generally poor-performing financials sector benefited the Fund’s results relative to the benchmark MSCI EAFE Index.2 Within the sector, real estate conglomerate Cheung Kong Holdings (Hong Kong), insurer ACE3 (U.S.) and global private equity firm KKR & Co.3 (U.S.) produced strong returns. Our overweighting and stock selection in the information technology sector also aided performance, and key contributors included security software developer Check Point Software
2. The financials sector comprises capital markets, commercial banks, diversified financial services, insurance, and real estate management and development in the SOI.
3. Not an index component.
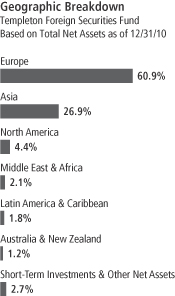
TF-3
Technologies3 (Israel) and semiconductor manufacturers Taiwan Semiconductor Manufacturing3 (Taiwan) and Infineon Technologies (Germany).4 Other positions that helped relative results included telecommunications provider Vodafone Group (U.K.) in the wireless telecommunication services industry, and electronic and electrical engineering company Siemens (Germany) and holding company Hutchison Whampoa (Hong Kong) in the industrial conglomerates industry.
In contrast, stock selection in the health care sector detracted from relative performance, as pharmaceutical developers Sanofi-Aventis (France) and Merck (Germany) underperformed.5 The Fund’s underweighted allocation and stock selection in the consumer staples sector hindered results, largely due to our position in personal products producer Unilever (U.K.).6 Other key detractors were insurer AXA (France) and telecommunication services providers Telefonica (Spain) and France Telecom.
From a geographic perspective, our overweighted allocation to North America boosted relative performance, as our investments in Canada3 and the U.S.3 outperformed. Our stock selection and overweighting in the Middle East were also beneficial, particularly stocks in Israel. In contrast, the Fund’s slight weighting in Australia hurt performance as that country’s stocks performed well.
Thank you for your participation in Templeton Foreign Securities Fund. We look forward to serving your future investment needs.
4. The information technology sector comprises communications equipment; computers and peripherals; electronic equipment, instruments and components; semiconductors and semiconductor equipment; and software in the SOI.
5. The health care sector comprises health care providers and services, life sciences tools and services, and pharmaceuticals in the SOI.
6. The consumer staples sector comprises food and staples retailing, and food products in the SOI.
The foregoing information reflects our analysis, opinions and portfolio holdings as of December 31, 2010, the end of the reporting period. The way we implement our main investment strategies and the resulting portfolio holdings may change depending on factors such as market and economic conditions. These opinions may not be relied upon as investment advice or an offer for a particular security. The information is not a complete analysis of every aspect of any market, country, industry, security or the Fund. Statements of fact are from sources considered reliable, but the investment manager makes no representation or warranty as to their completeness or accuracy. Although historical performance is no guarantee of future results, these insights may help you understand our investment management philosophy.
Top 10 Holdings
Templeton Foreign Securities Fund
12/31/10
| | | | |
Company
Sector/Industry,
Country | | % of Total
Net Assets | |
| Vodafone Group PLC, ADR | | | 3.5% | |
| Wireless Telecommunication Services, U.K. | | | | |
| Samsung Electronics Co. Ltd. | | | 2.7% | |
| Semiconductors & Semiconductor Equipment, South Korea | | | | |
| Sanofi-Aventis | | | 2.6% | |
| Pharmaceuticals, France | | | | |
| Taiwan Semiconductor Manufacturing Co. | | | 2.4% | |
| Semiconductors & Semiconductor Equipment, Taiwan | | | | |
| KB Financial Group Inc. | | | 2.3% | |
| Commercial Banks, South Korea | | | | |
| Siemens AG | | | 2.2% | |
| Industrial Conglomerates, Germany | | | | |
| Statoil ASA | | | 2.1% | |
| Oil, Gas & Consumable Fuels, Norway | | | | |
| ING Groep NV | | | 2.0% | |
| Diversified Financial Services, Netherlands | | | | |
| Singapore Telecommunications Ltd. | | | 2.0% | |
| Diversified Telecommunication Services, Singapore | | | | |
| Kingfisher PLC | | | 2.0% | |
| Specialty Retail, U.K. | | | | |
The dollar value, number of shares or principal amount, and names of all portfolio holdings are listed in the Fund’s Statement of Investments (SOI).
TF-4
Fund Expenses
As an investor in a variable insurance contract (Contract) that indirectly provides for investment in an underlying mutual fund, you can incur transaction and/or ongoing expenses at both the Fund level and the Contract level.
| • | | Transaction expenses can include sales charges (loads) on purchases, redemption fees, surrender fees, transfer fees and premium taxes. |
| • | | Ongoing expenses can include management fees, distribution and service (12b-1) fees, contract fees, annual maintenance fees, mortality and expense risk fees and other fees and expenses. All mutual funds and Contracts have some types of ongoing expenses. |
The expenses shown in the table are meant to highlight ongoing expenses at the Fund level only and do not include ongoing expenses at the Contract level, or transaction expenses at either the Fund or Contract level. While the Fund does not have transaction expenses, if the transaction and ongoing expenses at the Contract level were included, the expenses shown below would be higher. You should consult your Contract prospectus or disclosure document for more information.
The table shows Fund-level ongoing expenses and can help you understand these expenses and compare them with those of other mutual funds offered through the Contract. The table assumes a $1,000 investment held for the six months indicated. Please refer to the Fund prospectus for additional information on operating expenses.
Actual Fund Expenses
The first line (Actual) of the table provides actual account values and expenses. The “Ending Account Value” is derived from the Fund’s actual return, which includes the effect of ongoing Fund expenses, but does not include the effect of ongoing Contract expenses.
You can estimate the Fund-level expenses you incurred during the period by following these steps. Of course, your account value and expenses will differ from those in this illustration:
| 1. | Divide your account value by $1,000. |
If an account had an $8,600 value, then $8,600 ÷ $1,000 = 8.6.
| 2. | Multiply the result by the number under the heading “Fund-Level Expenses Incurred During Period.” |
If Fund-Level Expenses Incurred During Period were $7.50, then 8.6 x $7.50 = $64.50.
In this illustration, the estimated expenses incurred this period at the Fund level are $64.50.
Templeton Foreign Securities Fund – Class 4
TF-5
Hypothetical Example for Comparison with Other Mutual Funds
Information in the second line (Hypothetical) of the table can help you compare ongoing expenses of the Fund with those of other mutual funds offered through the Contract. This information may not be used to estimate the actual ending account balance or expenses you incurred during the period. The hypothetical “Ending Account Value” is based on the Fund’s actual expense ratio and an assumed 5% annual rate of return before expenses, which does not represent the Fund’s actual return. The figure under the heading “Fund-Level Expenses Incurred During Period” shows the hypothetical expenses your account would have incurred under this scenario. You can compare this figure with the 5% hypothetical examples that appear in shareholder reports of other funds offered through a Contract.
| | | | | | | | | | | | |
| Class 4 | | Beginning
Account Value 7/1/10 | | | Ending
Account Value 12/31/10 | | | Fund-Level Expenses Incurred
During Period* 7/1/10–12/31/10 | |
Actual | | $ | 1,000 | | | $ | 1,233.30 | | | $ | 6.36 | |
Hypothetical (5% return before expenses) | | $ | 1,000 | | | $ | 1,019.51 | | | $ | 5.75 | |
*Expenses are calculated using the most recent six-month annualized expense ratio for the Fund’s Class 4 shares (1.13%), which does not include any ongoing expenses of the Contract for which the Fund is an investment option, multiplied by the average account value over the period, multiplied by 184/365 to reflect the one-half year period.
TF-6
Franklin Templeton Variable Insurance Products Trust
Financial Highlights
Templeton Foreign Securities Fund
| | | | | | | | | | | | | | | | | | | | |
| | | Year Ended December 31, | |
| Class 1 | | 2010 | | | 2009 | | | 2008 | | | 2007 | | | 2006 | |
| | | | |
Per share operating performance | | | | | | | | | | | | | | | | | | | | |
(for a share outstanding throughout the year) | | | | | | | | | | | | | | | | | | | | |
Net asset value, beginning of year | | $ | 13.68 | | | $ | 10.95 | | | $ | 20.57 | | | $ | 19.00 | | | $ | 15.84 | |
| | | | |
Income from investment operationsa: | | | | | | | | | | | | | | | | | | | | |
Net investment incomeb | | | 0.28 | | | | 0.25 | | | | 0.45 | | | | 0.45 | | | | 0.46 | |
Net realized and unrealized gains (losses) | | | 0.86 | | | | 3.39 | | | | (8.01 | ) | | | 2.46 | | | | 2.94 | |
| | | | |
Total from investment operations | | | 1.14 | | | | 3.64 | | | | (7.56 | ) | | | 2.91 | | | | 3.40 | |
| | | | |
Less distributions from: | | | | | | | | | | | | | | | | | | | | |
Net investment income | | | (0.28 | ) | | | (0.43 | ) | | | (0.45 | ) | | | (0.44 | ) | | | (0.24 | ) |
Net realized gains | | | — | | | | (0.48 | ) | | | (1.61 | ) | | | (0.90 | ) | | | — | |
| | | | |
Total distributions | | | (0.28 | ) | | | (0.91 | ) | | | (2.06 | ) | | | (1.34 | ) | | | (0.24 | ) |
| | | | |
Redemption feesc | | | — | | | | — | | | | — | | | | — | | | | — | |
| | | | |
Net asset value, end of year | | $ | 14.54 | | | $ | 13.68 | | | $ | 10.95 | | | $ | 20.57 | | | $ | 19.00 | |
| | | | |
| | | | | |
Total returnd | | | 8.67% | | | | 37.34% | | | | (40.23)% | | | | 15.79% | | | | 21.70% | |
Ratios to average net assets | | | | | | | | | | | | | | | | | | | | |
Expensese | | | 0.78% | | | | 0.78% | | | | 0.77% | | | | 0.75% | | | | 0.75% | |
Net investment income | | | 2.10% | | | | 2.28% | | | | 2.82% | | | | 2.22% | | | | 2.63% | |
| | | | | |
Supplemental data | | | | | | | | | | | | | | | | | | | | |
Net assets, end of year (000’s) | | $ | 321,282 | | | $ | 318,173 | | | $ | 262,725 | | | $ | 531,377 | | | $ | 594,991 | |
Portfolio turnover rate | | | 19.16% | | | | 22.50% | | | | 18.27% | | | | 26.74% | | | | 18.97% | f |
aThe amount shown for a share outstanding throughout the period may not correlate with the Statement of Operations for the period due to the timing of sales and repurchases of the Fund shares in relation to income earned and/or fluctuating market value of the investments of the Fund.
bBased on average daily shares outstanding.
cAmount rounds to less than $0.01 per share.
dTotal return does not include fees, charges or expenses imposed by the variable annuity and life insurance contracts for which the Franklin Templeton Variable Insurance Products Trust serves as an underlying investment vehicle.
eBenefit of expense reduction rounds to less than 0.01%.
fExcludes the value of portfolio securities delivered as a result of redemption in-kind.
The accompanying notes are an integral part of these financial statements.
TF-7
Franklin Templeton Variable Insurance Products Trust
Financial Highlights (continued)
Templeton Foreign Securities Fund
| | | | | | | | | | | | | | | | | | | | |
| | | Year Ended December 31, | |
| Class 2 | | 2010 | | | 2009 | | | 2008 | | | 2007 | | | 2006 | |
| | | | |
Per share operating performance | | | | | | | | | | | | | | | | | | | | |
(for a share outstanding throughout the year) | | | | | | | | | | | | | | | | | | | | |
Net asset value, beginning of year | | $ | 13.45 | | | $ | 10.76 | | | $ | 20.25 | | | $ | 18.73 | | | $ | 15.63 | |
| | | | |
Income from investment operationsa: | | | | | | | | | | | | | | | | | | | | |
Net investment incomeb | | | 0.25 | | | | 0.22 | | | | 0.40 | | | | 0.38 | | | | 0.40 | |
Net realized and unrealized gains (losses) | | | 0.84 | | | | 3.34 | | | | (7.89 | ) | | | 2.44 | | | | 2.91 | |
| | | | |
Total from investment operations | | | 1.09 | | | | 3.56 | | | | (7.49 | ) | | | 2.82 | | | | 3.31 | |
| | | | |
Less distributions from: | | | | | | | | | | | | | | | | | | | | |
Net investment income | | | (0.25 | ) | | | (0.39 | ) | | | (0.39 | ) | | | (0.40 | ) | | | (0.21 | ) |
Net realized gains | | | — | | | | (0.48 | ) | | | (1.61 | ) | | | (0.90 | ) | | | — | |
| | | | |
Total distributions | | | (0.25 | ) | | | (0.87 | ) | | | (2.00 | ) | | | (1.30 | ) | | | (0.21 | ) |
| | | | |
Redemption feesc | | | — | | | | — | | | | — | | | | — | | | | — | |
| | | | |
Net asset value, end of year | | $ | 14.29 | | | $ | 13.45 | | | $ | 10.76 | | | $ | 20.25 | | | $ | 18.73 | |
| | | | |
| | | | | |
Total returnd | | | 8.41% | | | | 37.04% | | | | (40.38)% | | | | 15.46% | | | | 21.44% | |
Ratios to average net assets | | | | | | | | | | | | | | | | | | | | |
Expensese | | | 1.03% | | | | 1.03% | | | | 1.02% | | | | 1.00% | | | | 1.00% | |
Net investment income | | | 1.85% | | | | 2.03% | | | | 2.57% | | | | 1.97% | | | | 2.38% | |
| | | | | |
Supplemental data | | | | | | | | | | | | | | | | | | | | |
Net assets, end of year (000’s) | | $ | 2,090,757 | | | $ | 2,010,268 | | | $ | 1,702,038 | | | $ | 3,255,154 | | | $ | 2,941,374 | |
Portfolio turnover rate | | | 19.16% | | | | 22.50% | | | | 18.27% | | | | 26.74% | | | | 18.97% | f |
aThe amount shown for a share outstanding throughout the period may not correlate with the Statement of Operations for the period due to the timing of sales and repurchases of the Fund shares in relation to income earned and/or fluctuating market value of the investments of the Fund.
bBased on average daily shares outstanding.
cAmount rounds to less than $0.01 per share.
dTotal return does not include fees, charges or expenses imposed by the variable annuity and life insurance contracts for which the Franklin Templeton Variable Insurance Products Trust serves as an underlying investment vehicle.
eBenefit of expense reduction rounds to less than 0.01%.
fExcludes the value of portfolio securities delivered as a result of redemption in-kind.
The accompanying notes are an integral part of these financial statements.
TF-8
Franklin Templeton Variable Insurance Products Trust
Financial Highlights (continued)
Templeton Foreign Securities Fund
| | | | | | | | | | | | | | | | | | | | |
| | | Year Ended December 31, | |
| Class 3 | | 2010 | | | 2009 | | | 2008 | | | 2007 | | | 2006 | |
| | | | |
Per share operating performance | | | | | | | | | | | | | | | | | | | | |
(for a share outstanding throughout the year) | | | | | | | | | | | | | | | | | | | | |
Net asset value, beginning of year | | $ | 13.37 | | | $ | 10.70 | | | $ | 20.18 | | | $ | 18.68 | | | $ | 15.60 | |
| | | | |
Income from investment operationsa: | | | | | | | | | | | | | | | | | | | | |
Net investment incomeb | | | 0.25 | | | | 0.25 | | | | 0.39 | | | | 0.37 | | | | 0.37 | |
Net realized and unrealized gains (losses) | | | 0.84 | | | | 3.30 | | | | (7.84 | ) | | | 2.45 | | | | 2.94 | |
| | | | |
Total from investment operations | | | 1.09 | | | | 3.55 | | | | (7.45 | ) | | | 2.82 | | | | 3.31 | |
| | | | |
Less distributions from: | | | | | | | | | | | | | | | | | | | | |
Net investment income | | | (0.22 | ) | | | (0.40 | ) | | | (0.42 | ) | | | (0.42 | ) | | | (0.23 | ) |
Net realized gains | | | — | | | | (0.48 | ) | | | (1.61 | ) | | | (0.90 | ) | | | — | |
| | | | |
Total distributions | | | (0.22 | ) | | | (0.88 | ) | | | (2.03 | ) | | | (1.32 | ) | | | (0.23 | ) |
| | | | |
Redemption feesc | | | — | | | | — | | | | — | | | | — | | | | — | |
| | | | |
Net asset value, end of year | | $ | 14.24 | | | $ | 13.37 | | | $ | 10.70 | | | $ | 20.18 | | | $ | 18.68 | |
| | | | |
| | | | | |
Total returnd | | | 8.41% | | | | 37.20% | | | | (40.39)% | | | | 15.45% | | | | 21.46% | |
Ratios to average net assets | | | | | | | | | | | | | | | | | | | | |
Expensese | | | 1.03% | | | | 1.03% | | | | 1.02% | | | | 1.00% | | | | 1.00% | |
Net investment income | | | 1.85% | | | | 2.03% | | | | 2.57% | | | | 1.97% | | | | 2.38% | |
| | | | | |
Supplemental data | | | | | | | | | | | | | | | | | | | | |
Net assets, end of year (000’s) | | $ | 108,766 | | | $ | 115,364 | | | $ | 271,061 | | | $ | 313,505 | | | $ | 150,417 | |
Portfolio turnover rate | | | 19.16% | | | | 22.50% | | | | 18.27% | | | | 26.74% | | | | 18.97% | f |
aThe amount shown for a share outstanding throughout the period may not correlate with the Statement of Operations for the period due to the timing of sales and repurchases of the Fund shares in relation to income earned and/or fluctuating market value of the investments of the Fund.
bBased on average daily shares outstanding.
cAmount rounds to less than $0.01 per share.
dTotal return does not include fees, charges or expenses imposed by the variable annuity and life insurance contracts for which the Franklin Templeton Variable Insurance Products Trust serves as an underlying investment vehicle.
eBenefit of expense reduction rounds to less than 0.01%.
fExcludes the value of portfolio securities delivered as a result of redemption in-kind.
The accompanying notes are an integral part of these financial statements.
TF-9
Franklin Templeton Variable Insurance Products Trust
Financial Highlights (continued)
Templeton Foreign Securities Fund
| | | | | | | | | | | | |
| | | Year Ended December 31, | |
| Class 4 | | 2010 | | | 2009 | | | 2008a | |
| | | | |
Per share operating performance | | | | | | | | | | | | |
(for a share outstanding throughout the year) | | | | | | | | | | | | |
Net asset value, beginning of year | | $ | 13.59 | | | $ | 10.91 | | | $ | 18.90 | |
| | | | |
Income from investment operationsb: | | | | | | | | | | | | |
Net investment incomec | | | 0.17 | | | | 0.21 | | | | 0.15 | |
Net realized and unrealized gains (losses) | | | 0.92 | | | | 3.37 | | | | (6.08 | ) |
| | | | |
Total from investment operations | | | 1.09 | | | | 3.58 | | | | (5.93 | ) |
| | | | |
Less distributions from: | | | | | | | | | | | | |
Net investment income | | | (0.25 | ) | | | (0.42 | ) | | | (0.45 | ) |
Net realized gains | | | — | | | | (0.48 | ) | | | (1.61 | ) |
| | | | |
Total distributions | | | (0.25 | ) | | | (0.90 | ) | | | (2.06 | ) |
| | | | |
Redemption feesd | | | — | | | | — | | | | — | |
| | | | |
Net asset value, end of year | | $ | 14.43 | | | $ | 13.59 | | | $ | 10.91 | |
| | | | |
| | | |
Total returne | | | 8.38% | | | | 36.84% | | | | (35.15)% | |
Ratios to average net assetsf | | | | | | | | | | | | |
Expensesg | | | 1.13% | | | | 1.13% | | | | 1.12% | |
Net investment income | | | 1.75% | | | | 1.93% | | | | 2.47% | |
| | | |
Supplemental data | | | | | | | | | | | | |
Net assets, end of year (000’s) | | $ | 305,505 | | | $ | 48,501 | | | $ | 14,287 | |
Portfolio turnover rate | | | 19.16% | | | | 22.50% | | | | 18.27% | |
aFor the period February 29, 2008 (effective date) to December 31, 2008.
bThe amount shown for a share outstanding throughout the period may not correlate with the Statement of Operations for the period due to the timing of sales and repurchases of the Fund shares in relation to income earned and/or fluctuating market value of the investments of the Fund.
cBased on average daily shares outstanding.
dAmount rounds to less than $0.01 per share.
eTotal return does not include fees, charges or expenses imposed by the variable annuity and life insurance contracts for which the Franklin Templeton Variable Insurance Products Trust serves as an underlying investment vehicle. Total return is not annualized for periods less than one year.
fRatios are annualized for periods less than one year.
gBenefit of expense reduction rounds to less than 0.01%.
The accompanying notes are an integral part of these financial statements.
TF-10
Franklin Templeton Variable Insurance Products Trust
Statement of Investments, December 31, 2010
| | | | | | | | | | | | |
| Templeton Foreign Securities Fund | | Country | | | Shares/
Units | | | Value | |
Common Stocks and Other Equity Interests 96.0% | | | | | | | | | | | | |
Aerospace & Defense 1.2% | | | | | | | | | | | | |
BAE Systems PLC | | | United Kingdom | | | | 3,909,200 | | | $ | 20,144,794 | |
Embraer SA, ADR | | | Brazil | | | | 484,240 | | | | 14,236,656 | |
| | | | | | | | | | | | |
| | | | | | | | | | | 34,381,450 | |
| | | | | | | | | | | | |
Air Freight & Logistics 0.5% | | | | | | | | | | | | |
Deutsche Post AG | | | Germany | | | | 773,232 | | | | 13,074,704 | |
| | | | | | | | | | | | |
Automobiles 1.2% | | | | | | | | | | | | |
Toyota Motor Corp., ADR | | | Japan | | | | 440,460 | | | | 34,633,370 | |
| | | | | | | | | | | | |
Capital Markets 0.6% | | | | | | | | | | | | |
KKR & Co., LP | | | United States | | | | 1,155,000 | | | | 16,401,000 | |
| | | | | | | | | | | | |
Commercial Banks 5.4% | | | | | | | | | | | | |
DBS Group Holdings Ltd. | | | Singapore | | | | 2,993,520 | | | | 33,411,696 | |
HSBC Holdings PLC | | | United Kingdom | | | | 1,865,200 | | | | 19,125,949 | |
KB Financial Group Inc., ADR | | | South Korea | | | | 1,220,681 | | | | 64,561,818 | |
UniCredit SpA | | | Italy | | | | 10,439,019 | | | | 21,617,508 | |
United Overseas Bank Ltd. | | | Singapore | | | | 985,000 | | | | 13,972,720 | |
| | | | | | | | | | | | |
| | | | | | | | | | | 152,689,691 | |
| | | | | | | | | | | | |
Commercial Services & Supplies 1.2% | | | | | | | | | | | | |
Brambles Ltd. | | | Australia | | | | 2,750,737 | | | | 20,011,227 | |
Downer EDI Ltd. | | | Australia | | | | 3,200,569 | | | | 15,010,132 | |
| | | | | | | | | | | | |
| | | | | | | | | | | 35,021,359 | |
| | | | | | | | | | | | |
Communications Equipment 1.1% | | | | | | | | | | | | |
Telefonaktiebolaget LM Ericsson, B, ADR | | | Sweden | | | | 2,637,070 | | | | 30,405,417 | |
| | | | | | | | | | | | |
Computers & Peripherals 1.8% | | | | | | | | | | | | |
Compal Electronics Inc. | | | Taiwan | | | | 15,329,431 | | | | 20,311,365 | |
Lite-On Technology Corp. | | | Taiwan | | | | 23,045,407 | | | | 31,680,521 | |
| | | | | | | | | | | | |
| | | | | | | | | | | 51,991,886 | |
| | | | | | | | | | | | |
Construction Materials 0.5% | | | | | | | | | | | | |
CRH PLC | | | Ireland | | | | 659,820 | | | | 13,681,451 | |
| | | | | | | | | | | | |
Containers & Packaging 0.6% | | | | | | | | | | | | |
Rexam PLC | | | United Kingdom | | | | 3,021,290 | | | | 15,724,789 | |
| | | | | | | | | | | | |
Diversified Financial Services 2.0% | | | | | | | | | | | | |
aING Groep NV | | | Netherlands | | | | 5,880,644 | | | | 57,270,536 | |
| | | | | | | | | | | | |
Diversified Telecommunication Services 9.8% | | | | | | | | | | | | |
China Telecom Corp. Ltd., H | | | China | | | | 84,868,357 | | | | 44,112,983 | |
France Telecom SA | | | France | | | | 2,164,143 | | | | 45,148,810 | |
Singapore Telecommunications Ltd. | | | Singapore | | | | 23,481,000 | | | | 55,819,992 | |
Telefonica SA, ADR | | | Spain | | | | 801,544 | | | | 54,841,640 | |
Telekom Austria AG | | | Austria | | | | 1,711,400 | | | | 24,084,756 | |
Telenor ASA | | | Norway | | | | 3,226,804 | | | | 52,536,843 | |
| | | | | | | | | | | | |
| | | | | | | | | | | 276,545,024 | |
| | | | | | | | | | | | |
Electric Utilities 2.0% | | | | | | | | | | | | |
E.ON AG | | | Germany | | | | 917,590 | | | | 28,066,926 | |
Iberdrola SA | | | Spain | | | | 3,537,921 | | | | 27,299,102 | |
| | | | | | | | | | | | |
| | | | | | | | | | | 55,366,028 | |
| | | | | | | | | | | | |
TF-11
Franklin Templeton Variable Insurance Products Trust
Statement of Investments, December 31, 2010 (continued)
| | | | | | | | | | | | |
| Templeton Foreign Securities Fund | | Country | | | Shares/
Units | | | Value | |
Common Stocks and Other Equity Interests (continued) | | | | | | | | | | | | |
Electronic Equipment, Instruments & Components 1.4% | | | | | | | | | | | | |
aFlextronics International Ltd. | | | Singapore | | | | 4,961,670 | | | $ | 38,949,109 | |
| | | | | | | | | | | | |
Energy Equipment & Services 1.0% | | | | | | | | | | | | |
Aker Solutions ASA | | | Norway | | | | 1,617,940 | | | | 27,578,838 | |
| | | | | | | | | | | | |
Food & Staples Retailing 0.5% | | | | | | | | | | | | |
Tesco PLC | | | United Kingdom | | | | 2,056,090 | | | | 13,655,642 | |
| | | | | | | | | | | | |
Food Products 2.1% | | | | | | | | | | | | |
Nestle SA | | | Switzerland | | | | 518,760 | | | | 30,409,111 | |
Unilever PLC | | | United Kingdom | | | | 930,743 | | | | 28,562,782 | |
| | | | | | | | | | | | |
| | | | | | | | | | | 58,971,893 | |
| | | | | | | | | | | | |
Health Care Providers & Services 0.4% | | | | | | | | | | | | |
Celesio AG | | | Germany | | | | 509,850 | | | | 12,597,498 | |
| | | | | | | | | | | | |
Hotels, Restaurants & Leisure 0.8% | | | | | | | | | | | | |
aAutogrill SpA | | | Italy | | | | 1,655,033 | | | | 23,402,196 | |
| | | | | | | | | | | | |
Industrial Conglomerates 3.6% | | | | | | | | | | | | |
Hutchison Whampoa Ltd. | | | Hong Kong | | | | 3,794,709 | | | | 39,155,440 | |
Siemens AG | | | Germany | | | | 493,434 | | | | 61,500,712 | |
| | | | | | | | | | | | |
| | | | | | | | | | | 100,656,152 | |
| | | | | | | | | | | | |
Insurance 9.5% | | | | | | | | | | | | |
ACE Ltd. | | | United States | | | | 377,449 | | | | 23,496,200 | |
aAIA Group Ltd. | | | Hong Kong | | | | 7,983,000 | | | | 22,441,756 | |
a,bAIA Group Ltd., 144A | | | Hong Kong | | | | 3,128,000 | | | | 8,793,413 | |
Aviva PLC | | | United Kingdom | | | | 7,678,820 | | | | 47,225,598 | |
AXA SA | | | France | | | | 2,027,508 | | | | 33,768,122 | |
Muenchener Rueckversicherungs-Gesellschaft AG | | | Germany | | | | 249,150 | | | | 37,792,935 | |
aNKSJ Holdings Inc. | | | Japan | | | | 4,218,000 | | | | 31,073,163 | |
PartnerRe Ltd. | | | Bermuda | | | | 196,480 | | | | 15,787,168 | |
Swiss Reinsurance Co. | | | Switzerland | | | | 917,340 | | | | 49,402,786 | |
| | | | | | | | | | | | |
| | | | | | | | | | | 269,781,141 | |
| | | | | | | | | | | | |
Life Sciences Tools & Services 0.5% | | | | | | | | | | | | |
Lonza Group AG | | | Switzerland | | | | 175,440 | | | | 14,078,403 | |
| | | | | | | | | | | | |
Media 2.5% | | | | | | | | | | | | |
Pearson PLC | | | United Kingdom | | | | 875,466 | | | | 13,822,486 | |
Reed Elsevier NV | | | Netherlands | | | | 2,017,693 | | | | 24,986,206 | |
Vivendi SA | | | France | | | | 1,178,959 | | | | 31,858,480 | |
| | | | | | | | | | | | |
| | | | | | | | | | | 70,667,172 | |
| | | | | | | | | | | | |
Metals & Mining 1.3% | | | | | | | | | | | | |
Barrick Gold Corp. | | | Canada | | | | 663,561 | | | | 35,347,333 | |
| | | | | | | | | | | | |
Multi-Utilities 0.9% | | | | | | | | | | | | |
GDF Suez | | | France | | | | 697,431 | | | | 25,050,737 | |
| | | | | | | | | | | | |
Multiline Retail 0.5% | | | | | | | | | | | | |
Marks & Spencer Group PLC | | | United Kingdom | | | | 2,350,320 | | | | 13,538,017 | |
| | | | | | | | | | | | |
Oil, Gas & Consumable Fuels 11.0% | | | | | | | | | | | | |
BP PLC | | | United Kingdom | | | | 4,406,715 | | | | 32,041,574 | |
Gazprom, ADR | | | Russia | | | | 1,311,500 | | | | 33,364,560 | |
Reliance Industries Ltd. | | | India | | | | 998,145 | | | | 23,623,974 | |
Royal Dutch Shell PLC, B | | | United Kingdom | | | | 1,292,973 | | | | 42,815,746 | |
TF-12
Franklin Templeton Variable Insurance Products Trust
Statement of Investments, December 31, 2010 (continued)
| | | | | | | | | | | | |
| Templeton Foreign Securities Fund | | Country | | | Shares/
Units | | | Value | |
Common Stocks and Other Equity Interests (continued) | | | | | | | | | | | | |
Oil, Gas & Consumable Fuels (continued) | | | | | | | | | | | | |
Sasol, ADR | | | South Africa | | | | 701,210 | | | $ | 36,497,980 | |
Statoil ASA | | | Norway | | | | 2,455,740 | | | | 58,455,941 | |
Talisman Energy Inc. | | | Canada | | | | 1,506,600 | | | | 33,419,567 | |
Total SA, B | | | France | | | | 979,926 | | | | 51,977,029 | |
| | | | | | | | | | | | |
| | | | | | | | | | | 312,196,371 | |
| | | | | | | | | | | | |
Pharmaceuticals 8.0% | | | | | | | | | | | | |
GlaxoSmithKline PLC | | | United Kingdom | | | | 2,772,585 | | | | 53,659,670 | |
Merck KGaA | | | Germany | | | | 320,220 | | | | 25,813,837 | |
Novartis AG | | | Switzerland | | | | 360,330 | | | | 21,199,286 | |
Roche Holding AG | | | Switzerland | | | | 368,200 | | | | 54,007,923 | |
Sanofi-Aventis | | | France | | | | 1,127,925 | | | | 72,199,991 | |
| | | | | | | | | | | | |
| | | | | | | | | | | 226,880,707 | |
| | | | | | | | | | | | |
Professional Services 2.9% | | | | | | | | | | | | |
Adecco SA | | | Switzerland | | | | 481,280 | | | | 31,561,456 | |
Hays PLC | | | United Kingdom | | | | 11,353,070 | | | | 22,937,678 | |
aRandstad Holding NV | | | Netherlands | | | | 535,950 | | | | 28,320,202 | |
| | | | | | | | | | | | |
| | | | | | | | | | | 82,819,336 | |
| | | | | | | | | | | | |
Real Estate Management & Development 1.1% | | | | | | | | | | | | |
Cheung Kong (Holdings) Ltd. | | | Hong Kong | | | | 1,973,922 | | | | 30,424,684 | |
| | | | | | | | | | | | |
Semiconductors & Semiconductor Equipment 5.7% | | | | | | | | | | | | |
aInfineon Technologies AG | | | Germany | | | | 1,103,225 | | | | 10,342,682 | |
Samsung Electronics Co. Ltd. | | | South Korea | | | | 89,088 | | | | 75,402,017 | |
Siliconware Precision Industries Co. | | | Taiwan | | | | 6,412,000 | | | | 7,693,521 | |
Taiwan Semiconductor Manufacturing Co. Ltd. | | | Taiwan | | | | 27,781,526 | | | | 67,620,444 | |
| | | | | | | | | | | | |
| | | | | | | | | | | 161,058,664 | |
| | | | | | | | | | | | |
Software 5.5% | | | | | | | | | | | | |
aCheck Point Software Technologies Ltd. | | | Israel | | | | 494,361 | | | | 22,869,140 | |
Nintendo Co. Ltd. | | | Japan | | | | 166,400 | | | | 48,848,931 | |
The Sage Group PLC | | | United Kingdom | | | | 4,609,500 | | | | 19,704,742 | |
SAP AG, ADR | | | Germany | | | | 983,280 | | | | 49,763,801 | |
Trend Micro Inc. | | | Japan | | | | 464,100 | | | | 15,328,021 | |
| | | | | | | | | | | | |
| | | | | | | | | | | 156,514,635 | |
| | | | | | | | | | | | |
Specialty Retail 3.2% | | | | | | | | | | | | |
Kingfisher PLC | | | United Kingdom | | | | 13,521,086 | | | | 55,711,690 | |
USS Co. Ltd. | | | Japan | | | | 431,520 | | | | 35,297,725 | |
| | | | | | | | | | | | |
| | | | | | | | | | | 91,009,415 | |
| | | | | | | | | | | | |
Textiles, Apparel & Luxury Goods 0.6% | | | | | | | | | | | | |
Yue Yuen Industrial Holdings Ltd. | | | Hong Kong | | | | 4,486,500 | | | | 16,104,645 | |
| | | | | | | | | | | | |
Wireless Telecommunication Services 5.1% | | | | | | | | | | | | |
Mobile TeleSystems, ADR | | | Russia | | | | 914,865 | | | | 19,093,233 | |
Turkcell Iletisim Hizmetleri AS, ADR | | | Turkey | | | | 1,482,500 | | | | 25,395,225 | |
Vodafone Group PLC, ADR | | | United Kingdom | | | | 3,781,940 | | | | 99,956,674 | |
| | | | | | | | | | | | |
| | | | | | | | | | | 144,445,132 | |
| | | | | | | | | | | | |
Total Common Stocks and Other Equity Interests
(Cost $2,401,603,306) | | | | | | | | | | | 2,712,914,425 | |
| | | | | | | | | | | | |
TF-13
Franklin Templeton Variable Insurance Products Trust
Statement of Investments, December 31, 2010 (continued)
| | | | | | | | | | | | |
| Templeton Foreign Securities Fund | | Country | | | Shares/
Units | | | Value | |
Preferred Stocks (Cost $2,178,441) 1.3% | | | | | | | | | | | | |
Metals & Mining 1.3% | | | | | | | | | | | | |
Vale SA, ADR, pfd., A | | | Brazil | | | | 1,210,222 | | | $ | 36,572,909 | |
| | | | | | | | | | | | |
Total Investments before Short Term Investments (Cost $2,403,781,747) | | | | | | | | | | | 2,749,487,334 | |
| | | | | | | | | | | | |
Short Term Investments (Cost $74,399,334) 2.6% | | | | | | | | | | | | |
Money Market Funds 2.6% | | | | | | | | | | | | |
a,cInstitutional Fiduciary Trust Money Market Portfolio | | | United States | | | | 74,399,334 | | | | 74,399,334 | |
| | | | | | | | | | | | |
Total Investments (Cost $2,478,181,081) 99.9% | | | | | | | | | | | 2,823,886,668 | |
Other Assets, less Liabilities 0.1% | | | | | | | | | | | 2,423,491 | |
| | | | | | | | | | | | |
Net Assets 100.0% | | | | | | | | | | $ | 2,826,310,159 | |
| | | | | | | | | | | | |
See Abbreviations on page TF-25.
aNon-income producing.
bSecurity was purchased pursuant to Rule 144A under the Securities Act of 1933 and may be sold in transactions exempt from registration only to qualified institutional buyers or in a public offering registered under the Securities Act of 1933. This security has been deemed liquid under guidelines approved by the Trust’s Board of Trustees. At December 31, 2010, the value of this security was $8,793,413, representing 0.31% of net assets.
cSee Note 7 regarding investments in the Institutional Fiduciary Trust Money Market Portfolio.
TF-14
Franklin Templeton Variable Insurance Products Trust
Financial Statements
Statement of Assets and Liabilities
December 31, 2010
| | | | |
| | | Templeton
Foreign
Securities Fund | |
Assets: | | | | |
Investments in securities: | | | | |
Cost - Unaffiliated issuers | | $ | 2,403,781,747 | |
Cost - Sweep Money Fund (Note 7) | | | 74,399,334 | |
| | | | |
Total cost of investments | | $ | 2,478,181,081 | |
| | | | |
Value - Unaffiliated issuers | | $ | 2,749,487,334 | |
Value - Sweep Money Fund (Note 7) | | | 74,399,334 | |
| | | | |
Total value of investments | | | 2,823,886,668 | |
Cash | | | 160,166 | |
Receivables: | | | | |
Capital shares sold | | | 955,829 | |
Dividends | | | 6,524,598 | |
Other assets | | | 462 | |
| | | | |
Total assets | | | 2,831,527,723 | |
| | | | |
Liabilities: | | | | |
Payables: | | | | |
Capital shares redeemed | | | 1,791,426 | |
Affiliates | | | 2,806,757 | |
Reports to shareholders | | | 427,459 | |
Accrued expenses and other liabilities | | | 191,922 | |
| | | | |
Total liabilities | | | 5,217,564 | |
| | | | |
Net assets, at value | | $ | 2,826,310,159 | |
| | | | |
Net assets consist of: | | | | |
Paid-in capital | | $ | 2,700,376,228 | |
Undistributed net investment income | | | 46,209,487 | |
Net unrealized appreciation (depreciation) | | | 345,894,768 | |
Accumulated net realized gain (loss) | | | (266,170,324 | ) |
| | | | |
Net assets, at value | | $ | 2,826,310,159 | |
| | | | |
The accompanying notes are an integral part of these financial statements.
TF-15
Franklin Templeton Variable Insurance Products Trust
Financial Statements (continued)
Statement of Assets and Liabilities (continued)
December 31, 2010
| | | | |
| | | Templeton
Foreign
Securities Fund | |
Class 1: | | | | |
Net assets, at value | | $ | 321,281,861 | |
| | | | |
Shares outstanding | | | 22,089,453 | |
| | | | |
Net asset value and maximum offering price per share | | $ | 14.54 | |
| | | | |
Class 2: | | | | |
Net assets, at value | | $ | 2,090,756,821 | |
| | | | |
Shares outstanding | | | 146,276,558 | |
| | | | |
Net asset value and maximum offering price per share | | $ | 14.29 | |
| | | | |
Class 3: | | | | |
Net assets, at value | | $ | 108,766,254 | |
| | | | |
Shares outstanding | | | 7,637,341 | |
| | | | |
Net asset value and maximum offering price per sharea | | $ | 14.24 | |
| | | | |
Class 4: | | | | |
Net assets, at value | | $ | 305,505,223 | |
| | | | |
Shares outstanding | | | 21,171,205 | |
| | | | |
Net asset value and maximum offering price per share | | $ | 14.43 | |
| | | | |
aRedemption price is equal to net asset value less any redemption fees retained by the fund.
The accompanying notes are an integral part of these financial statements.
TF-16
Franklin Templeton Variable Insurance Products Trust
Financial Statements (continued)
Statement of Operations
for the year ended December 31, 2010
| | | | |
| | | Templeton
Foreign
Securities Fund | |
Investment income: | | | | |
Dividends (net of foreign taxes of $7,562,786) | | $ | 72,304,643 | |
Income from securities loaned | | | 360,920 | |
| | | | |
Total investment income | | | 72,665,563 | |
| | | | |
Expenses: | | | | |
Management fees (Note 3a) | | | 16,084,169 | |
Administrative fees (Note 3b) | | | 2,466,397 | |
Distribution fees: (Note 3c) | | | | |
Class 2 | | | 4,871,112 | |
Class 3 | | | 264,046 | |
Class 4 | | | 568,874 | |
Unaffiliated transfer agent fees | | | 4,430 | |
Custodian fees (Note 4) | | | 484,376 | |
Reports to shareholders | | | 529,930 | |
Registration and filing fees | | | 1,392 | |
Professional fees | | | 85,848 | |
Trustees’ fees and expenses | | | 11,617 | |
Other | | | 80,504 | |
| | | | |
Total expenses | | | 25,452,695 | |
Expense reductions (Note 4) | | | (19 | ) |
| | | | |
Net expenses | | | 25,452,676 | |
| | | | |
Net investment income | | | 47,212,887 | |
| | | | |
Realized and unrealized gains (losses): | | | | |
Net realized gain (loss) from: | | | | |
Investments | | | 37,030,875 | |
Foreign currency transactions | | | (1,115,391 | ) |
| | | | |
Net realized gain (loss) | | | 35,915,484 | |
| | | | |
Net change in unrealized appreciation (depreciation) on: | | | | |
Investments | | | 169,586,867 | |
Translation of other assets and liabilities denominated in foreign currencies | | | 125,872 | |
Change in deferred taxes on unrealized appreciation | | | 1,550,561 | |
| | | | |
Net change in unrealized appreciation (depreciation) | | | 171,263,300 | |
| | | | |
Net realized and unrealized gain (loss) | | | 207,178,784 | |
| | | | |
Net increase (decrease) in net assets resulting from operations | | $ | 254,391,671 | |
| | | | |
The accompanying notes are an integral part of these financial statements.
TF-17
Franklin Templeton Variable Insurance Products Trust
Financial Statements (continued)
Statements of Changes in Net Assets
| | | | | | | | |
| | | Templeton Foreign
Securities Fund | |
| | | Year Ended December 31, | |
| | | 2010 | | | 2009 | |
| | | | |
Increase (decrease) in net assets: | | | | | | | | |
Operations: | | | | | | | | |
Net investment income | | $ | 47,212,887 | | | $ | 46,778,715 | |
Net realized gain (loss) from investments and foreign currency transactions | | | 35,915,484 | | | | (272,580,971 | ) |
Net change in unrealized appreciation (depreciation) on investments, translation of other assets and liabilities denominated in foreign currencies and deferred taxes | | | 171,263,300 | | | | 930,461,583 | |
| | | | |
Net increase (decrease) in net assets resulting from operations | | | 254,391,671 | | | | 704,659,327 | |
| | | | |
Distributions to shareholders from: | | | | | | | | |
Net investment income: | | | | | | | | |
Class 1 | | | (6,186,591 | ) | | | (10,082,097 | ) |
Class 2 | | | (35,909,578 | ) | | | (60,860,305 | ) |
Class 3 | | | (1,738,264 | ) | | | (10,601,203 | ) |
Class 4 | | | (1,159,055 | ) | | | (654,024 | ) |
Net realized gains: | | | | | | | | |
Class 1 | | | — | | | | (11,279,713 | ) |
Class 2 | | | — | | | | (75,080,881 | ) |
Class 3 | | | — | | | | (12,814,465 | ) |
Class 4 | | | — | | | | (749,197 | ) |
| | | | |
Total distributions to shareholders | | | (44,993,488 | ) | | | (182,121,885 | ) |
| | | | |
Capital share transactions: (Note 2) | | | | | | | | |
Class 1 | | | (16,391,025 | ) | | | (11,544,985 | ) |
Class 2 | | | (56,686,127 | ) | | | (118,629,302 | ) |
Class 3 | | | (13,133,254 | ) | | | (174,980,330 | ) |
Class 4 | | | 210,807,534 | | | | 24,793,775 | |
| | | | |
Total capital share transactions | | | 124,597,128 | | | | (280,360,842 | ) |
| | | | |
Redemption fees | | | 9,228 | | | | 18,230 | |
| | | | |
Net increase (decrease) in net assets | | | 334,004,539 | | | | 242,194,830 | |
Net assets: | | | | | | | | |
Beginning of year | | | 2,492,305,620 | | | | 2,250,110,790 | |
| | | | |
End of year | | $ | 2,826,310,159 | | | $ | 2,492,305,620 | |
| | | | |
Undistributed net investment income included in net assets: | | | | | | | | |
End of year | | $ | 46,209,487 | | | $ | 45,063,070 | |
| | | | |
The accompanying notes are an integral part of these financial statements.
TF-18
Franklin Templeton Variable Insurance Products Trust
Notes to Financial Statements
Templeton Foreign Securities Fund
1. ORGANIZATION AND SIGNIFICANT ACCOUNTING POLICIES
Franklin Templeton Variable Insurance Products Trust (Trust) is registered under the Investment Company Act of 1940, as amended, (1940 Act) as an open-end investment company, consisting of twenty separate funds. The Templeton Foreign Securities Fund (Fund) is included in this report. The financial statements of the remaining funds in the Trust are presented separately. Shares of the Fund are generally sold only to insurance company separate accounts to fund the benefits of variable life insurance policies or variable annuity contracts. The Fund offers four classes of shares: Class 1, Class 2, Class 3, and Class 4. Each class of shares differs by its distribution fees, voting rights on matters affecting a single class and its exchange privilege.
The following summarizes the Fund’s significant accounting policies.
a. Financial Instrument Valuation
The Fund values its investments in securities and other assets and liabilities carried at fair value daily. Fair value is the price that would be received to sell an asset or paid to transfer a liability in an orderly transaction between market participants on the measurement date. Under procedures approved by the Trust’s Board of Trustees, the Fund may utilize independent pricing services, quotations from securities and financial instrument dealers, and other market sources to determine fair value.
Equity securities listed on an exchange or on the NASDAQ National Market System are valued at the last quoted sale price or the official closing price of the day, respectively. Foreign equity securities are valued as of the close of trading on the foreign stock exchange on which the security is primarily traded, or the NYSE, whichever is earlier. The value is then converted into its U.S. dollar equivalent at the foreign exchange rate in effect at the close of the NYSE on the day that the value of the security is determined. Over-the-counter securities are valued within the range of the most recent quoted bid and ask prices. Securities that trade in multiple markets or on multiple exchanges are valued according to the broadest and most representative market. Certain equity securities are valued based upon fundamental characteristics or relationships to similar securities. Investments in open-end mutual funds are valued at the closing net asset value.
The Fund has procedures to determine the fair value of securities and other financial instruments for which market prices are not readily available or which may not be reliably priced. Under these procedures, the Fund primarily employs a market-based approach which may use related or comparable assets or liabilities, recent transactions, market multiples, book values, and other relevant information for the investment to determine the fair value of the investment. The Fund may also use an income-based valuation approach in which the anticipated future cash flows of the investment are discounted to calculate fair value. Discounts may also be applied due to the nature or duration of any restrictions on the disposition of the investments. Due to the inherent uncertainty of valuations of such investments, the fair values may differ significantly from the values that would have been used had an active market existed.
Trading in securities on foreign securities stock exchanges and over-the-counter markets may be completed before the daily close of business on the NYSE. Occasionally, events occur between the time at which trading in a foreign security is completed and the close of the NYSE that might call into question the reliability of the value of a portfolio security held by the Fund. As a result, differences may arise between the value of the Fund’s portfolio securities as determined at the foreign market close and the latest indications of value at the close of the NYSE. In order to minimize the potential for these differences, the investment manager monitors price movements following the close of trading in foreign stock markets through a series of country specific market proxies (such as baskets of American Depository Receipts, futures contracts and exchange traded funds). These price movements are measured against established trigger thresholds for each specific market proxy to assist in determining if an event has occurred that may call into question the reliability of the values of the foreign securities held by the Fund. If such an event occurs, the securities may be valued using fair value procedures, which may include the use of independent pricing services.
TF-19
Franklin Templeton Variable Insurance Products Trust
Notes to Financial Statements (continued)
Templeton Foreign Securities Fund
1. ORGANIZATION AND SIGNIFICANT ACCOUNTING POLICIES (continued)
b. Foreign Currency Translation
Portfolio securities and other assets and liabilities denominated in foreign currencies are translated into U.S. dollars based on the exchange rate of such currencies against U.S. dollars on the date of valuation. The Fund may enter into foreign currency exchange contracts to facilitate transactions denominated in a foreign currency. Purchases and sales of securities, income and expense items denominated in foreign currencies are translated into U.S. dollars at the exchange rate in effect on the transaction date. Portfolio securities and assets and liabilities denominated in foreign currencies contain risks that those currencies will decline in value relative to the U.S. dollar. Occasionally, events may impact the availability or reliability of foreign exchange rates used to convert the U.S. dollar equivalent value. If such an event occurs, the foreign exchange rate will be valued at fair value using procedures established and approved by the Trust’s Board of Trustees.
The Funds does not separately report the effect of changes in foreign exchange rates from changes in market prices on securities held. Such changes are included in net realized and unrealized gain or loss from investments on the Statement of Operations.
Realized foreign exchange gains or losses arise from sales of foreign currencies, currency gains or losses realized between the trade and settlement dates on securities transactions and the difference between the recorded amounts of dividends, interest, and foreign withholding taxes and the U.S. dollar equivalent of the amounts actually received or paid. Net unrealized foreign exchange gains and losses arise from changes in foreign exchange rates on foreign denominated assets and liabilities other than investments in securities held at the end of the reporting period.
c. Securities Lending
The Fund participates in an agency based security lending program. The Fund receives cash collateral against the loaned securities in an amount equal to at least 102% of the market value of the loaned securities. Collateral is maintained over the life of the loan in an amount not less than 100% of the market value of loaned securities, as determined at the close of Fund business each day; any additional collateral required due to changes in security values is delivered to the Fund on the next business day. The collateral is invested in repurchase agreements and/or in a money market fund managed by the Fund’s custodian on the Fund’s behalf. The Fund receives income from the investment of cash collateral, in addition to lending fees and rebates paid by the borrower. The Fund bears the market risk with respect to the collateral investment, securities loaned, and the risk that the agent may default on its obligations to the fund. At December 31, 2010, the Fund had no securities on loan.
d. Income and Deferred Taxes
It is the Fund’s policy to qualify as a regulated investment company under the Internal Revenue Code. The Fund intends to distribute to shareholders substantially all of its taxable income and net realized gains to relieve it from federal income and excise taxes. As a result, no provision for U.S. federal income taxes is required. The Fund files U.S. income tax returns as well as tax returns in certain other jurisdictions. The Fund’s application of those tax rules is subject to its understanding. The Fund records a provision for taxes in its financial statements including penalties and interest, if any, for a tax position taken on a tax return (or expected to be taken) when it fails to meet the more likely than not (a greater than 50% probability) threshold and based on the technical merits, the tax position may not be sustained upon examination by the tax authorities. As of December 31, 2010, and for all open tax years, the Fund has determined that no provision for income tax is required in the Fund’s financial statements. Open tax years are those that remain subject to examination and are based on each tax jurisdiction statute of limitation. The Fund is not aware of any tax position for which it is reasonably possible that the total amounts of unrecognized tax effects will significantly change in the next twelve months.
The Fund may be subject to foreign taxation related to income received, capital gains on the sale of securities and certain foreign currency transactions in the foreign jurisdictions in which it invests. Foreign taxes, if any, are recorded based on the tax regulations and rates that exist in the foreign markets in which the Fund invests. When a capital gain tax is determined to apply
TF-20
Franklin Templeton Variable Insurance Products Trust
Notes to Financial Statements (continued)
Templeton Foreign Securities Fund
1. ORGANIZATION AND SIGNIFICANT ACCOUNTING POLICIES (continued)
d. Income and Deferred Taxes (continued)
the Fund records an estimated deferred tax liability for net unrealized gains on these securities in an amount that would be payable if the securities were disposed of on the valuation date.
e. Security Transactions, Investment Income, Expenses and Distributions
Security transactions are accounted for on trade date. Realized gains and losses on security transactions are determined on a specific identification basis. Estimated expenses are accrued daily. Dividend income is recorded on the ex-dividend date except that certain dividends from foreign securities are recognized as soon as the Fund is notified of the ex-dividend date. Distributions to shareholders are recorded on the ex-dividend date and are determined according to income tax regulations (tax basis). Distributable earnings determined on a tax basis may differ from earnings recorded in accordance with accounting principles generally accepted in the United States of America. These differences may be permanent or temporary. Permanent differences are reclassified among capital accounts to reflect their tax character. These reclassifications have no impact on net assets or the results of operations. Temporary differences are not reclassified, as they may reverse in subsequent periods.
Common expenses incurred by the Trust are allocated among the funds based on the ratio of net assets of each fund to the combined net assets of the Trust. Fund specific expenses are charged directly to the fund that incurred the expense.
Realized and unrealized gains and losses and net investment income, not including class specific expenses, are allocated daily to each class of shares based upon the relative proportion of net assets of each class. Differences in per share distributions, by class, are generally due to differences in class specific expenses.
f. Accounting Estimates
The preparation of financial statements in accordance with accounting principles generally accepted in the United States of America requires management to make estimates and assumptions that affect the reported amounts of assets and liabilities at the date of the financial statements and the amounts of income and expenses during the reporting period. Actual results could differ from those estimates.
g. Redemption Fees
Redemptions and exchanges of interests in an insurance company subaccount that invests in Class 3 shares of the Fund will be subject to a 1.0% short term trading fee if the interest in the subaccount has been held for less than 60 days. Such fees are retained by the Fund and accounted for as an addition to paid-in capital, allocated to each class of shares based upon the relative proportion of net assets of each class.
h. Guarantees and Indemnifications
Under the Trust’s organizational documents, its officers and trustees are indemnified by the Trust against certain liabilities arising out of the performance of their duties to the Trust. Additionally, in the normal course of business, the Trust, on behalf of the Fund, enters into contracts with service providers that contain general indemnification clauses. The Trust’s maximum exposure under these arrangements is unknown as this would involve future claims that may be made against the Trust that have not yet occurred. Currently, the Trust expects the risk of loss to be remote.
TF-21
Franklin Templeton Variable Insurance Products Trust
Notes to Financial Statements (continued)
Templeton Foreign Securities Fund
2. SHARES OF BENEFICIAL INTEREST
At December 31, 2010, there were an unlimited number of shares authorized (without par value). Transactions in the Fund’s shares were as follows:
| | | | | | | | | | | | | | | | |
| | | Year Ended December 31, | |
| | | 2010 | | | 2009 | |
| Class 1 Shares: | | Shares | | | Amount | | | Shares | | | Amount | |
Shares sold | | | 1,834,739 | | | $ | 24,009,210 | | | | 984,005 | | | $ | 11,607,893 | |
Shares issued in reinvestment of distributions | | | 500,533 | | | | 6,186,591 | | | | 2,337,178 | | | | 21,361,810 | |
Shares redeemed | | | (3,507,687 | ) | | | (46,586,826 | ) | | | (4,055,131 | ) | | | (44,514,688 | ) |
| | | | |
Net increase (decrease) | | | (1,172,415 | ) | | $ | (16,391,025 | ) | | | (733,948 | ) | | $ | (11,544,985 | ) |
| | | | |
Class 2 Shares: | | | | | | | | | | | | | | | | |
Shares sold | | | 24,359,823 | | | $ | 304,453,001 | | | | 17,636,013 | | | $ | 191,261,657 | |
Shares issued in reinvestment of distributions | | | 2,950,664 | | | | 35,909,578 | | | | 15,030,410 | | | | 135,423,993 | |
Shares redeemed | | | (30,526,296 | ) | | | (397,048,706 | ) | | | (41,328,787 | ) | | | (445,314,952 | ) |
| | | | |
Net increase (decrease) | | | (3,215,809 | ) | | $ | (56,686,127 | ) | | | (8,662,364 | ) | | $ | (118,629,302 | ) |
| | | | |
Class 3 Shares: | | | | | | | | | | | | | | | | |
Shares sold | | | 488,049 | | | $ | 6,145,010 | | | | 2,721,038 | | | $ | 28,784,908 | |
Shares issued in reinvestment of distributions | | | 143,421 | | | | 1,738,264 | | | | 2,619,202 | | | | 23,415,667 | |
Shares redeemed | | | (1,625,745 | ) | | | (21,016,528 | ) | | | (22,034,601 | ) | | | (227,180,905 | ) |
| | | | |
Net increase (decrease) | | | (994,275 | ) | | $ | (13,133,254 | ) | | | (16,694,361 | ) | | $ | (174,980,330 | ) |
| | | | |
Class 4 Shares: | | | | | | | | | | | | | | | | |
Shares sold | | | 19,836,996 | | | $ | 240,414,850 | | | | 2,965,551 | | | $ | 33,480,588 | |
Shares issued on reinvestment of distributions | | | 94,309 | | | | 1,159,055 | | | | 154,031 | | | | 1,403,220 | |
Shares redeemed | | | (2,328,115 | ) | | | (30,766,371 | ) | | | (860,936 | ) | | | (10,090,033 | ) |
| | | | |
Net increase (decrease) | | | 17,603,190 | | | $ | 210,807,534 | | | | 2,258,646 | | | $ | 24,793,775 | |
| | | | |
3. TRANSACTIONS WITH AFFILIATES
Franklin Resources, Inc. is the holding company for various subsidiaries that together are referred to as Franklin Templeton Investments. Certain officers and trustees of the Fund are also officers and/or directors of the following subsidiaries:
| | |
| Subsidiary | | Affiliation |
Templeton Investment Counsel, LLC (TIC) | | Investment manager |
Franklin Templeton Services, LLC (FT Services) | | Administrative manager |
Franklin Templeton Distributors, Inc. (Distributors) | | Principal underwriter |
Franklin Templeton Investor Services, LLC (Investor Services) | | Transfer agent |
TF-22
Franklin Templeton Variable Insurance Products Trust
Notes to Financial Statements (continued)
Templeton Foreign Securities Fund
3. TRANSACTIONS WITH AFFILIATES (continued)
a. Management Fees
The Fund pays an investment management fee to TIC based on the average daily net assets of the Fund as follows:
| | |
| Annualized Fee Rate | | Net Assets |
| 0.750% | | Up to and including $200 million |
| 0.675% | | Over $200 million, up to and including $1.3 billion |
| 0.600% | | Over $1.3 billion, up to and including $10 billion |
| 0.580% | | Over $10 billion, up to and including $15 billion |
| 0.560% | | Over $15 billion, up to and including $20 billion |
| 0.540% | | In excess of $20 billion |
b. Administrative Fees
The Fund pays an administrative fee to FT Services based on the Fund’s average daily net assets as follows:
| | |
| Annualized Fee Rate | | Net Assets |
| 0.150% | | Up to and including $200 million |
| 0.135% | | Over $200 million, up to and including $700 million |
| 0.100% | | Over $700 million, up to and including $1.2 billion |
| 0.075% | | In excess of $1.2 billion |
c. Distribution Fees
The Trust’s Board of Trustees has adopted distribution plans for Class 2, Class 3, and Class 4 shares pursuant to Rule 12b-1 under the 1940 Act. Under the Fund’s compensation distribution plans, the Fund pays Distributors for costs incurred in connection with the servicing, sale and distribution of the Fund’s shares up to 0.25%, 0.35%, and 0.35% per year of its average daily net assets of Class 2, Class 3, and Class 4, respectively. The Board of Trustees has agreed to limit the current rate to 0.25% per year for Class 3.
d. Transfer Agent Fees
Investor Services, under terms of an agreement, performs shareholder servicing for the Fund and is not paid by the Fund for the services.
4. EXPENSE OFFSET ARRANGEMENT
The Fund has entered into an arrangement with its custodian whereby credits realized as a result of uninvested cash balances are used to reduce a portion of the Fund’s custodian expenses. During the year ended December 31, 2010, the custodian fees were reduced as noted in the Statement of Operations.
5. INCOME TAXES
For tax purposes, capital losses may be carried over to offset future capital gains, if any. At December 31, 2010, the Fund had tax basis capital losses of $265,728,291 expiring in 2017. During the year ended December 31, 2010, the Fund utilized $34,730,679 of capital loss carryforwards.
TF-23
Franklin Templeton Variable Insurance Products Trust
Notes to Financial Statements (continued)
Templeton Foreign Securities Fund
5. INCOME TAXES (continued)
The tax character of distributions paid during the years ended December 31, 2010 and 2009, was as follows:
| | | | | | | | |
| | | 2010 | | | 2009 | |
Distributions paid from: | | | | | | | | |
Ordinary income | | $ | 44,993,488 | | | $ | 82,201,258 | |
Long term capital gain | | | — | | | | 99,920,627 | |
| | | | |
| | $ | 44,993,488 | | | $ | 182,121,885 | |
| | | | |
At December 31, 2010, the cost of investments, net unrealized appreciation (depreciation) and undistributed ordinary income for income tax purposes were as follows:
| | | | |
Cost of investments | | $ | 2,478,623,118 | |
| | | | |
| |
Unrealized appreciation | | $ | 556,653,681 | |
Unrealized depreciation | | | (211,390,131 | ) |
| | | | |
Net unrealized appreciation (depreciation) | | $ | 345,263,550 | |
| | | | |
Distributable earnings – undistributed ordinary income | | $ | 46,209,487 | |
| | | | |
Net investment income differs for financial statement and tax purposes primarily due to differing treatments of foreign currency transactions and pass-through entity income.
Net realized gains (losses) differ for financial statement and tax purposes primarily due to differing treatments of wash sales, foreign currency transactions and pass-through entity income.
6. INVESTMENT TRANSACTIONS
Purchases and sales of investments (excluding short term securities) for the year ended December 31, 2010, aggregated $565,830,247 and $461,804,103, respectively.
7. INVESTMENTS IN INSTITUTIONAL FIDUCIARY TRUST MONEY MARKET PORTFOLIO
The Fund may invest in the Institutional Fiduciary Trust Money Market Portfolio (Sweep Money Fund), an open-end investment company managed by Franklin Advisers, Inc. (an affiliate of the investment manager). Management fees paid by the Fund are reduced on assets invested in the Sweep Money Fund, in an amount not to exceed the management and administrative fees paid by the Sweep Money Fund.
8. CONCENTRATION OF RISK
Investing in foreign securities may include certain risks and considerations not typically associated with investing in U.S. securities, such as fluctuating currency values and changing local and regional economic, political and social conditions, which may result in greater market volatility. In addition, certain foreign securities may not be as liquid as U.S. securities.
9. CREDIT FACILITY
The Fund, together with other U.S. registered and foreign investment funds (collectively “Borrowers”), managed by Franklin Templeton Investments, are borrowers in a joint syndicated senior unsecured credit facility totaling $750 million (Global Credit
TF-24
Franklin Templeton Variable Insurance Products Trust
Notes to Financial Statements (continued)
Templeton Foreign Securities Fund
9. CREDIT FACILITY (continued)
Facility) which matures on January 21, 2011. This Global Credit Facility provides a source of funds to the Borrowers for temporary and emergency purposes, including the ability to meet future unanticipated or unusually large redemption requests.
Under the terms of the Global Credit Facility, the Fund shall, in addition to interest charged on any borrowings made by the Fund and other costs incurred by the Fund, pay its share of fees and expenses incurred in connection with the implementation and maintenance of the Global Credit Facility, based upon its relative share of the aggregate net assets of all of the Borrowers, including an annual commitment fee of 0.10% based upon the unused portion of the Global Credit Facility, which is reflected in other expenses on the Statement of Operations. During the year ended December 31, 2010, the Fund did not use the Global Credit Facility.
Effective January 21, 2011, the Borrowers renewed the Global Credit Facility for a total of $750 million, maturing January 20, 2012.
10. FAIR VALUE MEASUREMENTS
The Fund follows a fair value hierarchy that distinguishes between market data obtained from independent sources (observable inputs) and the Fund’s own market assumptions (unobservable inputs). These inputs are used in determining the value of the Fund’s investments and are summarized in the following fair value hierarchy:
| | • | | Level 1 – quoted prices in active markets for identical securities |
| | • | | Level 2 – other significant observable inputs (including quoted prices for similar securities, interest rates, prepayment speed, credit risk, etc.) |
| | • | | Level 3 – significant unobservable inputs (including the Fund’s own assumptions in determining the fair value of investments) |
The inputs or methodology used for valuing securities are not an indication of the risk associated with investing in those securities.
For movements between the levels within the fair value hierarchy, the Fund has adopted a policy of recognizing the transfers as of the date of the underlying event which caused the movement.
At December 31, 2010, all of the Fund’s investments in securities carried at fair value were in Level 1 inputs. For detailed industry descriptions, see the accompanying Statement of Investments.
11. SUBSEQUENT EVENTS
The Fund has evaluated subsequent events through the issuance of the financial statements and determined that no events have occurred that require disclosure other than those already disclosed in the financial statements.
|
ABBREVIATIONS |
| Selected Portfolio |
|
| ADR - American Depository Receipt |
TF-25
Franklin Templeton Variable Insurance Products Trust
Templeton Foreign Securities Fund
Report of Independent Registered Public Accounting Firm
To the Board of Trustees and Shareholders of Franklin Templeton Variable Insurance Products Trust
In our opinion, the accompanying statement of assets and liabilities, including the statement of investments, and the related statements of operations and of changes in net assets and the financial highlights present fairly, in all material respects, the financial position of Templeton Foreign Securities Fund (the “Fund”) at December 31, 2010, the results of its operations for the year then ended, the changes in its net assets for each of the two years in the period then ended and the financial highlights for each of the periods presented, in conformity with accounting principles generally accepted in the United States of America. These financial statements and financial highlights (hereafter referred to as “financial statements”) are the responsibility of the Fund’s management. Our responsibility is to express an opinion on these financial statements based on our audits. We conducted our audits of these financial statements in accordance with the standards of the Public Company Accounting Oversight Board (United States). Those standards require that we plan and perform the audit to obtain reasonable assurance about whether the financial statements are free of material misstatement. An audit includes examining, on a test basis, evidence supporting the amounts and disclosures in the financial statements, assessing the accounting principles used and significant estimates made by management, and evaluating the overall financial statement presentation. We believe that our audits, which included confirmation of securities at December 31, 2010 by correspondence with the custodian and brokers, provide a reasonable basis for our opinion.
PricewaterhouseCoopers LLP
San Francisco, California
February 10, 2011
TF-26
Franklin Templeton Variable Insurance Products Trust
Tax Designation (unaudited)
Templeton Foreign Securities Fund
At December 31, 2010, more than 50% of the Fund’s total assets were invested in securities of foreign issuers. In most instances, foreign taxes were withheld from income paid to the Fund on these investments. The Fund elects to treat foreign taxes paid as allowed under Section 853 of the Internal Revenue Code. This election will allow shareholders of record as of the 2011 distribution date, to treat their proportionate share of foreign taxes paid by the Fund as having been paid directly by them. The shareholder shall consider these amounts as foreign taxes paid in the tax year in which they receive the Fund distribution.
TF-27
TEMPLETON GLOBAL BOND SECURITIES FUND
We are pleased to bring you Templeton Global Bond Securities Fund’s annual report for the fiscal year ended December 31, 2010.
Performance Summary as of 12/31/10
Average annual total return of Class 4 shares* represents the average annual change in value, assuming reinvestment of dividends and capital gains. Average returns smooth out variations in returns, which can be significant; they are not the same as year-by-year results.
Periods ended 12/31/10
| | | | | | | | | | | | |
| | | 1-Year | | | 5-Year | | | 10-Year | |
Average Annual Total Return | | | +14.28% | | | | +12.62% | | | | +11.95% | |
*For the period beginning 2/29/08, Class 4 performance reflects a 12b-1 fee expense of 0.35% per year, which affects future performance. Class 4 performance prior to 2/29/08 reflects historical Class 1 performance, which does not have a 12b-1 fee expense. Since 2/29/08 (effective date), the average annual total return of Class 4 shares was +11.41%.
Total Return Index Comparison for a Hypothetical $10,000 Investment (1/1/01–12/31/10)
The graph below shows the change in value of a hypothetical $10,000 investment in the Fund over the indicated period and includes reinvestment of any income or distributions. The Fund’s performance* is compared to the performance of the J.P. Morgan (JPM) Global Government Bond Index (GGBI), the Citigroup World Government Bond Index (WGBI) and the Consumer Price Index (CPI). One cannot invest directly in an index, and an index is not representative of the Fund’s portfolio. Please see Important Notes to Performance Information preceding the Fund Summaries.
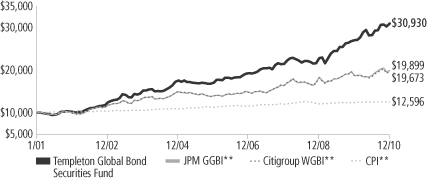
**Source: © 2011 Morningstar. Please see Index Descriptions following the Fund Summaries.
Templeton Global Bond Securities Fund – Class 4
Performance reflects the Fund’s Class 4 operating expenses, but does not include any contract fees, expenses or sales charges. If they had been included, performance would be lower. These charges and deductions, particularly for variable life policies, can have a significant effect on contract values and insurance benefits. See the contract prospectus for a complete description of these expenses, including sales charges.
Performance data represent past performance, which does not guarantee future results. Investment return and principal value will fluctuate, and you may have a gain or loss when you sell your shares.
Current performance may differ from figures shown.
TGB-1
Fund Goal and Main Investments: Templeton Global Bond Securities Fund seeks high current income, consistent with preservation of capital, with capital appreciation as a secondary consideration. The Fund normally invests at least 80% of its net assets in bonds, which include debt securities of any maturity, such as bonds, notes, bills and debentures.
Performance Overview
You can find the Fund’s one-year total return in the Performance Summary. The Fund outperformed its benchmarks, the JPM GGBI, which posted a +6.42% total return in U.S. dollar terms, and the Citigroup WGBI, which produced a +5.17% total return for the same period.1
Economic and Market Overview
Financial markets strengthened during the year under review as the global economy recovered, albeit at an uneven pace. Emerging economies generally enjoyed robust growth as they were less exposed than developed ones to many of the causes of the financial crisis, particularly overreliance on leverage. Many developing economies returned to trend growth levels, particularly in Asia, prompting some officials there to tighten fiscal and monetary policies. In contrast, the G-3 (U.S., eurozone and Japan) continued to struggle with recoveries that were not as robust as in previous episodes. Labor markets remained weak, and concerns regarding public sector balances led to periods of volatility during the year.
The first quarter of the year was broadly positive for most risk assets and currencies. Bond markets were generally supported by developed market policymakers’ reiterated commitment to keep interest rates low for an extended period. This commitment helped risk appetite broadly, and as the disparate nature of the recovery became more clear, emerging market sovereign credit spreads declined and currencies generally appreciated against the U.S. dollar. However, concerns regarding the Greek government’s ability to meet its financing needs, combined with heightened geopolitical tensions on the Korean peninsula and fears of a hard landing in China, led to a less favorable second quarter. In Greece, the public sector’s already substantial debt burden rose quickly as the government’s past manipulations of its fiscal balances came to light. Given Greece’s uncompetitive labor force, rising political tensions, and very weak growth, many observers questioned its ability to continue to
1. Source: © 2011 Morningstar. One cannot invest directly in an index, and an index is not representative of the Fund’s portfolio. Please see Index Descriptions following the Fund Summaries.
Fund Risks: Because the Fund invests in bonds and other debt obligations, its share price and yield will be affected by interest rate movements. Bond prices generally move in the opposite direction of interest rates. Thus, as prices of bonds in the Fund adjust to a rise in interest rates, the Fund’s share price may decline. High yield, lower rated (junk) bonds generally have greater price swings and higher default risks than investment-grade bonds. Foreign investing, especially in emerging markets, involves additional risks, including currency fluctuations, economic instability, market volatility, and political and social instability. The Fund’s investment in certain hedging and derivative instruments may involve a small investment relative to the risk assumed. As a nondiversified fund, the Fund may be more sensitive to economic, business, political or other changes affecting similar issuers or securities, which may result in greater fluctuation in the value of the Fund’s shares. The manager applies various techniques and analyses in making investment decisions for the Fund, but there can be no guarantee that these decisions will produce the desired results. The Fund’s prospectus also includes a description of the main investment risks.
TGB-2
meet its debt obligations, many of which were owned by Greek and other European banks. Chinese policymakers’ steps to remove the stimulus that had helped their economy counteract the global financial crisis in 2009 further dampened market sentiment. Although these steps proved to be gradual and in our view appropriate, the market appeared preoccupied by the prospect of a hard landing.
Financial markets recovered in 2010’s third quarter after the European Union and International Monetary Fund provided strong support to the Greek government. Loans made available to the government were sufficient to meet its financing needs for more than two years, which temporarily reduced fears that other highly indebted, non-eurozone European governments would have trouble meeting their financing needs. The euro and other European currencies strengthened against the U.S. dollar in this environment. Policymakers’ commitments in many developed economies to support their fragile recoveries kept bond yields low, even as additional countries that recovered quickly from the financial crisis were tightening policy. However, volatility returned in the fourth quarter largely due to renewed concerns in the eurozone, this time centered on Ireland. In addition, after reaching the lowest levels of the year early in the quarter in anticipation of the U.S. Federal Reserve Board’s announcing its second quantitative easing program, U.S. Treasury yields rose meaningfully near period-end, which created problems for many traditional fixed income investors. Overall, financial markets aside from bonds generally ended 2010 on a positive note, with equity markets at their highest levels since Lehman Brothers Holdings’ collapse in 2008. Currencies tended to reflect their economies’ underlying strength, with many emerging and select developed economies, such as Australia and Sweden, ending the year stronger against the U.S. dollar.
Investment Strategy
We allocate the Fund’s assets among issuers, geographic regions and currencies based upon our assessment of relative interest rates among currencies, our outlook for changes in interest rates and currencies, and credit risks. In considering these factors, we may evaluate a country’s changing market, economic and political conditions, such as inflation rate, growth prospects, global trade patterns and government policies. We seek to manage the Fund’s exposure to various currencies and may utilize forward currency exchange contracts.
What is a forward currency exchange contract?
A forward currency exchange contract is an agreement between the Fund and a counterparty to buy or sell a foreign currency for a specific exchange rate on a future date.
TGB-3
Manager’s Discussion
The Fund’s total return was influenced by various factors including interest rate developments, currency movements and exposure to sovereign debt markets. During the fiscal year under review, each of these sources of return benefited absolute and relative results.
Interest Rate Strategy
The Fund’s duration exposure was a major contributor to relative performance during the year. Government bond yields in many developed economies fell toward their historical lows reached at the height of the financial crisis. Monetary policymakers attempted to support their fragile economic recoveries by reiterating their commitment to keep rates low for an extended period and enacting further asset purchase programs. The Fund sought to capitalize on this low interest rate environment by maintaining long duration exposure only in economies with relatively high interest rates where we felt the full extent of any likely interest rate hikes had been priced in. In addition, we looked for areas where we believed long-term government bond yields were likely to benefit over time as risk premiums fell due to improved fiscal and inflation-fighting policies. This strategy contributed to relative performance during 2010’s first three quarters because of some select, overweighted exposures. In particular, long duration, local government bonds from Indonesia and Mexico were significant contributors. Each country’s central bank left rates unchanged throughout the year as inflation pressures were less than expected. Yields on Indonesia’s 10-year government bonds fell 244 basis points (bps; 100 bps equal one percentage point) during 2010’s first nine months, while Mexico’s declined 187 bps.
Toward period-end, yields began to rise in many developed economies, particularly in the U.S. Pushing yields higher were better-than-expected economic data and mounting concerns about many countries’ historically high fiscal deficits, which could be politically difficult to address and therefore may persist for some time. In this environment, the Fund’s underweighted exposures in euro- and U.S. dollar-denominated bonds and no exposure to yen-denominated bonds helped relative performance.
What is duration?
Duration is a measure of a bond’s price sensitivity to interest rate changes. In general, a portfolio of securities with a lower duration can be expected to be less sensitive to interest rate changes than a portfolio with a higher duration.
TGB-4
Currency Strategy
The Fund’s diverse, actively managed currency exposure provided strong returns during the year. Global currency markets increasingly reflected the underlying strengths of their respective economies. Although the U.S. dollar fell 1.06% against its major trading partners overall, this decline was the result of pronounced weakness against Asian currencies and select other emerging economies as the U.S. dollar strengthened against most European currencies.2 In the Americas, we concentrated the Fund’s currency exposure in a few emerging Latin American economies, which benefited performance. The Chilean peso, Mexican peso, and Brazilian real each appreciated more than 5% against the U.S. dollar as their domestically led recoveries outpaced that of the U.S.2 In addition, these economies benefited from high prices for the commodities they exported.
The Fund’s European currency exposure was a significant contributor to relative performance. Heightened tensions surrounding some non-eurozone European countries weighed on the euro periodically through the year. Combined with the market’s recognition of the relative strength of other European countries, this environment favored the Fund’s positioning in these currencies against the euro. For example, the Swedish krona appreciated 13.58% against the euro during the year as growth in Sweden outperformed, it did not suffer from the same concerns about unsustainable fiscal balances, and in the second half of the year the country’s central bank hiked its policy rate 100 bps.2 Norway and Poland similarly outperformed. In the Middle East, the Fund’s Egyptian pound position detracted from performance.
The Fund’s exposure to Asian currencies also contributed to results during the year, with one large exception, its negative exposure to the Japanese yen. The currencies of both emerging Asian economies and those of more developed economies, such as South Korea and Australia, appreciated as the region again had the world’s strongest growth. Although China’s economy led, with robust domestic demand despite steps by policymakers to tighten policy, the country’s demand and investment had a positive impact throughout the region. For example, Australia was one of the first developed economies to recover from the global financial crisis not only because it had not gone through a housing bubble and had much better government finances, but also because
2. Source: IDC/Exshare.
Currency Breakdown
Templeton Global Bond Securities Fund
12/31/10
| | | | |
| | | % of Total
Net Assets | |
| |
Americas | | | 61.8% | |
U.S. Dollar | | | 40.3% | |
Brazilian Real | | | 4.7% | |
Mexican Peso | | | 9.0% | |
Chilean Peso | | | 6.9% | |
Peruvian Nuevo Sol | | | 0.9% | |
| |
Asia Pacific | | | 32.2% | |
South Korean Won | | | 15.6% | |
Australian Dollar | | | 9.6% | |
Malaysian Ringgit | | | 9.4% | |
Indonesian Rupiah | | | 6.8% | |
Philippine Peso | | | 5.3% | |
Indian Rupee | | | 5.0% | |
Sri Lankan Rupee | | | 1.7% | |
Chinese Yuan | | | 0.7% | |
New Zealand Dollar* | | | -0.7% | |
Japanese Yen* | | | -21.2% | |
| |
Middle East & Africa | | | 9.1% | |
New Israeli Shekel | | | 4.6% | |
Egyptian Pound | | | 4.5% | |
| |
Europe* | | | -3.1% | |
Norwegian Krone | | | 8.3% | |
Swedish Krona | | | 7.9% | |
Polish Zloty | | | 6.8% | |
Euro* | | | -26.1% | |
*Holding is a negative percentage because of the Fund’s holdings of forward currency exchange contracts.
The dollar value, number of shares or principal amount, and names of all portfolio holdings are listed in the Fund’s Statement of Investments.
TGB-5
it has close links with China, which is Australia’s largest trading partner. Chinese demand supported prices for Australia’s commodity exports, and the Australian dollar appreciated 13.98% against the U.S. dollar.2 The Fund experienced similar benefits from regional emerging currencies from countries closely integrated with China, such as Malaysia, Indonesia and the Philippines. In contrast, the Fund’s underweighted position in the Japanese yen detracted significantly from performance. We held a long position in the U.S. dollar against the Japanese yen, through the use of forward contracts, in part to hedge the duration exposure of our U.S. dollar-denominated holdings. This position worked against us through most of the year as U.S. yields fell; however, even late in the year when interest rates rose, the yen remained strong. Historically the exchange rate and interest rate differentials between the U.S. and Japan have had a strong correlation. Although this relationship persists over longer periods, over the short term specific developments can cause it to break down. In particular, despite higher U.S. interest rates, the yen was stronger this year amid surprisingly good Japanese economic data, largely due to temporary stimulus measures and the rebuilding of inventories, and the market’s preoccupation with the second round of quantitative easing in the U.S.
Global Sovereign Debt Strategy
Sovereign credit exposure benefited performance as the broadly supportive risk environment led to spread tightening in most credits. Despite sovereign credits’ significant tightening since the financial crisis, we found opportunities we feel are attractive as we believe relative fundamentals continued to favor emerging markets. The enhanced resilience of such economies and the significant challenges facing highly indebted non-eurozone European countries drove reevaluation of traditional perceptions of sovereign risk. This situation, in conjunction with developed economies’ low interest rates, brought new investors to the asset class and pushed credit spreads lower for some of the largest, traditional emerging markets. We were selective in our sovereign credit exposure as the period progressed, but we managed to benefit somewhat from the rally. Specifically, exposures in Argentina and Venezuela were two of the Fund’s best performing sovereign credit positions, while outside Latin America, positions in Iraq, Lithuania and Indonesia contributed to performance.
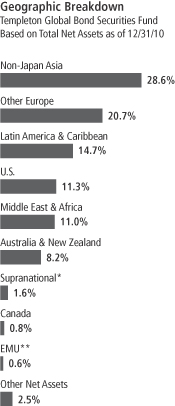
*The Fund’s supranational investments were denominated in the Mexican peso, Norwegian krone and U.S. dollar.
**The Fund’s EMU investment was in Germany.
TGB-6
Thank you for your participation in Templeton Global Bond Securities Fund. We look forward to serving your future investment needs.
The foregoing information reflects our analysis, opinions and portfolio holdings as of December 31, 2010, the end of the reporting period. The way we implement our main investment strategies and the resulting portfolio holdings may change depending on factors such as market and economic conditions. These opinions may not be relied upon as investment advice or an offer for a particular security. The information is not a complete analysis of every aspect of any market, country, industry, security or the Fund. Statements of fact are from sources considered reliable, but the investment manager makes no representation or warranty as to their completeness or accuracy. Although historical performance is no guarantee of future results, these insights may help you understand our investment management philosophy.
TGB-7
Fund Expenses
As an investor in a variable insurance contract (Contract) that indirectly provides for investment in an underlying mutual fund, you can incur transaction and/or ongoing expenses at both the Fund level and the Contract level.
| • | | Transaction expenses can include sales charges (loads) on purchases, redemption fees, surrender fees, transfer fees and premium taxes. |
| • | | Ongoing expenses can include management fees, distribution and service (12b-1) fees, contract fees, annual maintenance fees, mortality and expense risk fees and other fees and expenses. All mutual funds and Contracts have some types of ongoing expenses. |
The expenses shown in the table are meant to highlight ongoing expenses at the Fund level only and do not include ongoing expenses at the Contract level, or transaction expenses at either the Fund or Contract level. While the Fund does not have transaction expenses, if the transaction and ongoing expenses at the Contract level were included, the expenses shown below would be higher. You should consult your Contract prospectus or disclosure document for more information.
The table shows Fund-level ongoing expenses and can help you understand these expenses and compare them with those of other mutual funds offered through the Contract. The table assumes a $1,000 investment held for the six months indicated. Please refer to the Fund prospectus for additional information on operating expenses.
Actual Fund Expenses
The first line (Actual) of the table provides actual account values and expenses. The “Ending Account Value” is derived from the Fund’s actual return, which includes the effect of ongoing Fund expenses, but does not include the effect of ongoing Contract expenses.
You can estimate the Fund-level expenses you incurred during the period by following these steps. Of course, your account value and expenses will differ from those in this illustration:
| 1. | Divide your account value by $1,000. |
If an account had an $8,600 value, then $8,600 ÷ $1,000 = 8.6.
| 2. | Multiply the result by the number under the heading “Fund-Level Expenses Incurred During Period.” |
If Fund-Level Expenses Incurred During Period were $7.50, then 8.6 x $7.50 = $64.50.
In this illustration, the estimated expenses incurred this period at the Fund level are $64.50.
Templeton Global Bond Securities Fund – Class 4
TGB-8
Hypothetical Example for Comparison with Other Mutual Funds
Information in the second line (Hypothetical) of the table can help you compare ongoing expenses of the Fund with those of other mutual funds offered through the Contract. This information may not be used to estimate the actual ending account balance or expenses you incurred during the period. The hypothetical “Ending Account Value” is based on the Fund’s actual expense ratio for each class and an assumed 5% annual rate of return before expenses, which does not represent the Fund’s actual return. The figure under the heading “Fund-Level Expenses Incurred During Period” shows the hypothetical expenses your account would have incurred under this scenario. You can compare this figure with the 5% hypothetical examples that appear in shareholder reports of other funds offered through a Contract.
| | | | | | | | | | | | |
| Class 4 | | Beginning
Account
Value 7/1/10 | | | Ending
Account Value 12/31/10 | | | Fund-Level Expenses Incurred During Period* 7/1/10–12/31/10 | |
Actual | | $ | 1,000 | | | $ | 1,095.80 | | | $ | 4.81 | |
Hypothetical (5% return before expenses) | | $ | 1,000 | | | $ | 1,020.62 | | | $ | 4.63 | |
*Expenses are calculated using the most recent six-month annualized expense ratio for the Fund’s Class 4 shares (0.91%), which does not include any ongoing expenses of the Contract for which the Fund is an investment option, multiplied by the average account value over the period, multiplied by 184/365 to reflect the one-half year period.
TGB-9
Franklin Templeton Variable Insurance Products Trust
Financial Highlights
Templeton Global Bond Securities Fund
| | | | | | | | | | | | | | | | | | | | |
| | | Year Ended December 31, | |
| Class 1 | | 2010 | | | 2009 | | | 2008 | | | 2007 | | | 2006 | |
| | | | |
Per share operating performance | | | | | | | | | | | | | | | | | | | | |
(for a share outstanding throughout the year) | | | | | | | | | | | | | | | | | | | | |
Net asset value, beginning of year | | $ | 17.72 | | | $ | 17.42 | | | $ | 17.00 | | | $ | 15.73 | | | $ | 14.36 | |
| | | | |
Income from investment operationsa: | | | | | | | | | | | | | | | | | | | | |
Net investment incomeb | | | 1.00 | | | | 0.99 | | | | 0.80 | | | | 0.77 | | | | 0.61 | |
Net realized and unrealized gains (losses) | | | 1.58 | | | | 2.01 | | | | 0.27 | | | | 0.97 | | | | 1.24 | |
| | | | |
Total from investment operations | | | 2.58 | | | | 3.00 | | | | 1.07 | | | | 1.74 | | | | 1.85 | |
| | | | |
Less distributions from: | | | | | | | | | | | | | | | | | | | | |
Net investment income and net foreign currency gains | | | (0.31 | ) | | | (2.70 | ) | | | (0.65 | ) | | | (0.47 | ) | | | (0.48 | ) |
Net realized gains | | | (0.05 | ) | | | — | | | | — | | | | — | | | | — | |
| | | | |
Total distributions | | | (0.36 | ) | | | (2.70 | ) | | | (0.65 | ) | | | (0.47 | ) | | | (0.48 | ) |
| | | | |
Redemption feesc | | | — | | | | — | | | | — | | | | — | | | | — | |
| | | | |
Net asset value, end of year | | $ | 19.94 | | | $ | 17.72 | | | $ | 17.42 | | | $ | 17.00 | | | $ | 15.73 | |
| | | | |
| | | | | |
Total returnd | | | 14.71% | | | | 18.98% | | | | 6.46% | | | | 11.27% | | | | 13.14% | |
Ratios to average net assets | | | | | | | | | | | | | | | | | | | | |
Expenses before expense reduction | | | 0.55% | | | | 0.54% | | | | 0.58% | | | | 0.64% | | | | 0.80% | |
Expenses net of expense reduction | | | 0.55% | e | | | 0.54% | e | | | 0.58% | e | | | 0.64% | e | | | 0.72% | |
Net investment income | | | 5.27% | | | | 5.73% | | | | 4.66% | | | | 4.70% | | | | 4.09% | |
| | | | | |
Supplemental data | | | | | | | | | | | | | | | | | | | | |
Net assets, end of year (000’s) | | $ | 272,232 | | | $ | 195,662 | | | $ | 220,588 | | | $ | 137,700 | | | $ | 75,843 | |
Portfolio turnover rate | | | 8.77% | | | | 20.84% | | | | 28.46% | | | | 47.33% | | | | 30.65% | |
aThe amount shown for a share outstanding throughout the period may not correlate with the Statement of Operations for the period due to the timing of sales and repurchases of the Fund shares in relation to income earned and/or fluctuating market value of the investments of the Fund.
bBased on average daily shares outstanding.
cAmount rounds to less than $0.01 per share.
dTotal return does not include fees, charges or expenses imposed by the variable annuity and life insurance contracts for which the Franklin Templeton Variable Insurance Products Trust serves as an underlying investment vehicle.
eBenefit of expense reduction rounds to less than 0.01%.
The accompanying notes are an integral part of these financial statements.
TGB-10
Franklin Templeton Variable Insurance Products Trust
Financial Highlights (continued)
Templeton Global Bond Securities Fund
| | | | | | | | | | | | | | | | | | | | |
| | | Year Ended December 31, | |
| Class 2 | | 2010 | | | 2009 | | | 2008 | | | 2007 | | | 2006 | |
| | | | |
Per share operating performance | | | | | | | | | | | | | | | | | | | | |
(for a share outstanding throughout the year) | | | | | | | | | | | | | | | | | | | | |
Net asset value, beginning of year | | $ | 17.34 | | | $ | 17.10 | | | $ | 16.72 | | | $ | 15.50 | | | $ | 14.19 | |
| | | | |
Income from investment operationsa: | | | | | | | | | | | | | | | | | | | | |
Net investment incomeb | | | 0.93 | | | | 0.93 | | | | 0.74 | | | | 0.72 | | | | 0.57 | |
Net realized and unrealized gains (losses) | | | 1.54 | | | | 1.98 | | | | 0.27 | | | | 0.96 | | | | 1.21 | |
| | | | |
Total from investment operations | | | 2.47 | | | | 2.91 | | | | 1.01 | | | | 1.68 | | | | 1.78 | |
| | | | |
Less distributions from: | | | | | | | | | | | | | | | | | | | | |
Net investment income and net foreign currency gains | | | (0.27 | ) | | | (2.67 | ) | | | (0.63 | ) | | | (0.46 | ) | | | (0.47 | ) |
Net realized gains | | | (0.05 | ) | | | — | | | | — | | | | — | | | | — | |
| | | | |
Total distributions | | | (0.32 | ) | | | (2.67 | ) | | | (0.63 | ) | | | (0.46 | ) | | | (0.47 | ) |
| | | | |
Redemption feesc | | | — | | | | — | | | | — | | | | — | | | | — | |
| | | | |
Net asset value, end of year | | $ | 19.49 | | | $ | 17.34 | | | $ | 17.10 | | | $ | 16.72 | | | $ | 15.50 | |
| | | | |
| | | | | |
Total returnd | | | 14.45% | | | | 18.68% | | | | 6.21% | | | | 11.00% | | | | 12.77% | |
Ratios to average net assets | | | | | | | | | | | | | | | | | | | | |
Expenses before expense reduction | | | 0.80% | | | | 0.79% | | | | 0.83% | | | | 0.89% | | | | 1.05% | |
Expenses net of expense reduction | | | 0.80% | e | | | 0.79% | e | | | 0.83% | e | | | 0.89% | e | | | 0.97% | |
Net investment income | | | 5.02% | | | | 5.48% | | | | 4.41% | | | | 4.45% | | | | 3.84% | |
| | | | | |
Supplemental data | | | | | | | | | | | | | | | | | | | | |
Net assets, end of year (000’s) | | $ | 1,490,794 | | | $ | 1,262,783 | | | $ | 793,881 | | | $ | 480,649 | | | $ | 205,768 | |
Portfolio turnover rate | | | 8.77% | | | | 20.84% | | | | 28.46% | | | | 47.33% | | | | 30.65% | |
aThe amount shown for a share outstanding throughout the period may not correlate with the Statement of Operations for the period due to the timing of sales and repurchases of the Fund shares in relation to income earned and/or fluctuating market value of the investments of the Fund.
bBased on average daily shares outstanding.
cAmount rounds to less than $0.01 per share.
dTotal return does not include fees, charges or expenses imposed by the variable annuity and life insurance contracts for which the Franklin Templeton Variable Insurance Products Trust serves as an underlying investment vehicle.
eBenefit of expense reduction rounds to less than 0.01%.
The accompanying notes are an integral part of these financial statements.
TGB-11
Franklin Templeton Variable Insurance Products Trust
Financial Highlights (continued)
Templeton Global Bond Securities Fund
| | | | | | | | | | | | | | | | | | | | |
| | | Year Ended December 31, | |
| Class 3 | | 2010 | | | 2009 | | | 2008 | | | 2007 | | | 2006 | |
| | | | |
Per share operating performance | | | | | | | | | | | | | | | | | | | | |
(for a share outstanding throughout the year) | | | | | | | | | | | | | | | | | | | | |
Net asset value, beginning of year | | $ | 17.33 | | | $ | 17.08 | | | $ | 16.70 | | | $ | 15.49 | | | $ | 14.18 | |
| | | | |
Income from investment operationsa: | | | | | | | | | | | | | | | | | | | | |
Net investment incomeb | | | 0.93 | | | | 0.93 | | | | 0.74 | | | | 0.72 | | | | 0.58 | |
Net realized and unrealized gains (losses) | | | 1.54 | | | | 1.98 | | | | 0.27 | | | | 0.95 | | | | 1.21 | |
| | | | |
Total from investment operations | | | 2.47 | | | | 2.91 | | | | 1.01 | | | | 1.67 | | | | 1.79 | |
| | | | |
Less distributions from: | | | | | | | | | | | | | | | | | | | | |
Net investment income and net foreign currency gains | | | (0.27 | ) | | | (2.66 | ) | | | (0.63 | ) | | | (0.46 | ) | | | (0.48 | ) |
Net realized gains | | | (0.05 | ) | | | — | | | | — | | | | — | | | | — | |
| | | | |
Total distributions | | | (0.32 | ) | | | (2.66 | ) | | | (0.63 | ) | | | (0.46 | ) | | | (0.48 | ) |
| | | | |
Redemption feesc | | | — | | | | — | | | | — | | | | — | | | | — | |
| | | | |
Net asset value, end of year | | $ | 19.48 | | | $ | 17.33 | | | $ | 17.08 | | | $ | 16.70 | | | $ | 15.49 | |
| | | | |
| | | | | |
Total returnd | | | 14.38% | | | | 18.69% | | | | 6.21% | | | | 11.03% | | | | 12.84% | |
Ratios to average net assets | | | | | | | | | | | | | | | | | | | | |
Expenses before expense reduction | | | 0.80% | | | | 0.79% | | | | 0.83% | | | | 0.89% | | | | 1.05% | |
Expenses net of expense reduction | | | 0.80% | e | | | 0.79% | e | | | 0.83% | e | | | 0.89% | e | | | 0.97% | |
Net investment income | | | 5.02% | | | | 5.48% | | | | 4.41% | | | | 4.45% | | | | 3.84% | |
| | | | | |
Supplemental data | | | | | | | | | | | | | | | | | | | | |
Net assets, end of year (000’s) | | $ | 183,380 | | | $ | 143,264 | | | $ | 128,155 | | | $ | 91,162 | | | $ | 35,572 | |
Portfolio turnover rate | | | 8.77% | | | | 20.84% | | | | 28.46% | | | | 47.33% | | | | 30.65% | |
aThe amount shown for a share outstanding throughout the period may not correlate with the Statement of Operations for the period due to the timing of sales and repurchases of the Fund shares in relation to income earned and/or fluctuating market value of the investments of the Fund.
bBased on average daily shares outstanding.
cAmount rounds to less than $0.01 per share.
dTotal return does not include fees, charges or expenses imposed by the variable annuity and life insurance contracts for which the Franklin Templeton Variable Insurance Products Trust serves as an underlying investment vehicle.
eBenefit of expense reduction rounds to less than 0.01%.
The accompanying notes are an integral part of these financial statements.
TGB-12
Franklin Templeton Variable Insurance Products Trust
Financial Highlights (continued)
Templeton Global Bond Securities Fund
| | | | | | | | | | | | |
| | | Year Ended December 31, | |
| Class 4 | | 2010 | | | 2009 | | | 2008a | |
| | | | |
Per share operating performance | | | | | | | | | | | | |
(for a share outstanding throughout the year) | | | | | | | | | | | | |
Net asset value, beginning of year | | $ | 17.61 | | | $ | 17.37 | | | $ | 18.00 | |
| | | | |
Income from investment operationsb: | | | | | | | | | | | | |
Net investment incomec | | | 0.93 | | | | 0.93 | | | | 0.66 | |
Net realized and unrealized gains (losses) | | | 1.56 | | | | 2.00 | | | | (0.64 | ) |
| | | | |
Total from investment operations | | | 2.49 | | | | 2.93 | | | | 0.02 | |
| | | | |
Less distributions from: | | | | | | | | | | | | |
Net investment income and net foreign currency gains | | | (0.27 | ) | | | (2.69 | ) | | | (0.65 | ) |
Net realized gains | | | (0.05 | ) | | | — | | | | — | |
| | | | |
Total distributions | | | (0.32 | ) | | | (2.69 | ) | | | (0.65 | ) |
| | | | |
Redemption feesd | | | — | | | | — | | | | — | |
| | | | |
Net asset value, end of year | | $ | 19.78 | | | $ | 17.61 | | | $ | 17.37 | |
| | | | |
| | | |
Total returne | | | 14.28% | | | | 18.58% | | | | 0.26% | |
Ratios to average net assetsf | | | | | | | | | | | | |
Expensesg | | | 0.90% | | | | 0.89% | | | | 0.93% | |
Net investment income | | | 4.92% | | | | 5.38% | | | | 4.31% | |
| | | |
Supplemental data | | | | | | | | | | | | |
Net assets, end of year (000’s) | | | $150,891 | | | | $108,910 | | | | $43,069 | |
Portfolio turnover rate | | | 8.77% | | | | 20.84% | | | | 28.46% | |
aFor the period February 29, 2008 (effective date) to December 31, 2008.
bThe amount shown for a share outstanding throughout the period may not correlate with the Statement of Operations for the period due to the timing of sales and repurchases of the Fund shares in relation to income earned and/or fluctuating market value of the investments of the Fund.
cBased on average daily shares outstanding.
dAmount rounds to less than $0.01 per share.
eTotal return does not include fees, charges or expenses imposed by the variable annuity and life insurance contracts for which the Franklin Templeton Variable Insurance Products Trust serves as an underlying investment vehicle. Total return is not annualized for periods less than one year.
fRatios are annualized for periods less than one year.
gBenefit of expense reduction rounds to less than 0.01%.
The accompanying notes are an integral part of these financial statements.
TGB-13
Franklin Templeton Variable Insurance Products Trust
Statement of Investments, December 31, 2010
| | | | | | | | |
| Templeton Global Bond Securities Fund | | Principal
Amount* | | | Value | |
Foreign Government and Agency Securities 79.1% | | | | | | | | |
Argentina 1.2% | | | | | | | | |
a,bGovernment of Argentina, senior bond, FRN, 0.677%, 8/03/12 | | | 107,485,000 | | | $ | 25,748,032 | |
| | | | | | | | |
Australia 8.2% | | | | | | | | |
Government of Australia, TB123, 5.75%, 4/15/12 | | | 43,700,000 | AUD | | | 45,093,095 | |
New South Wales Treasury Corp., | | | | | | | | |
6.00%, 5/01/12 | | | 9,350,000 | AUD | | | 9,649,316 | |
6.00%, 5/01/12 (London Exchange) | | | 13,180,000 | AUD | | | 13,599,985 | |
senior note, 5.50%, 3/01/17 | | | 32,225,000 | AUD | | | 32,417,913 | |
Queensland Treasury Corp., | | | | | | | | |
6.00%, 6/14/11 | | | 22,050,000 | AUD | | | 22,635,972 | |
6.00%, 8/14/13 | | | 24,450,000 | AUD | | | 25,378,548 | |
6.00%, 9/14/17 | | | 13,160,000 | AUD | | | 13,577,613 | |
c144A, 7.125%, 9/18/17 | | | 4,380,000 | NZD | | | 3,648,265 | |
Western Australia Treasury Corp., 5.50%, 7/17/12 | | | 6,400,000 | AUD | | | 6,561,996 | |
| | | | | | | | |
| | | | | | | 172,562,703 | |
| | | | | | | | |
Brazil 4.2% | | | | | | | | |
Nota Do Tesouro Nacional, | | | | | | | | |
10.00%, 1/01/12 | | | 38,245 | d BRL | | | 22,634,425 | |
10.00%, 1/01/14 | | | 7,100 | d BRL | | | 4,050,044 | |
10.00%, 1/01/17 | | | 22,490 | d BRL | | | 12,432,821 | |
eIndex Linked, 6.00%, 5/15/11 | | | 2,055 | d BRL | | | 2,461,112 | |
eIndex Linked, 6.00%, 5/15/15 | | | 27,735 | d BRL | | | 32,870,412 | |
eIndex Linked, 6.00%, 5/15/45 | | | 10,825 | d BRL | | | 13,847,349 | |
| | | | | | | | |
| | | | | | | 88,296,163 | |
| | | | | | | | |
Canada 0.8% | | | | | | | | |
Province of Manitoba, 6.375%, 9/01/15 | | | 19,985,000 | NZD | | | 16,318,664 | |
| | | | | | | | |
Germany 0.6% | | | | | | | | |
Landwirtschaftliche Rentenbank, senior note, 8.50%, 2/22/16 | | | 137,707,000 | MXN | | | 12,001,377 | |
| | | | | | | | |
Hungary 1.6% | | | | | | | | |
Government of Hungary, senior note, | | | | | | | | |
3.50%, 7/18/16 | | | 1,055,000 | EUR | | | 1,217,067 | |
4.375%, 7/04/17 | | | 5,380,000 | EUR | | | 6,351,059 | |
5.75%, 6/11/18 | | | 13,795,000 | EUR | | | 17,226,294 | |
6.25%, 1/29/20 | | | 6,420,000 | | | | 6,259,500 | |
3.875%, 2/24/20 | | | 3,120,000 | EUR | | | 3,351,886 | |
| | | | | | | | |
| | | | | | | 34,405,806 | |
| | | | | | | | |
Indonesia 8.5% | | | | | | | | |
Government of Indonesia, | | | | | | | | |
FR20, 14.275%, 12/15/13 | | | 14,267,000,000 | IDR | | | 1,919,225 | |
FR31, 11.00%, 11/15/20 | | | 167,351,000,000 | IDR | | | 22,934,919 | |
FR34, 12.80%, 6/15/21 | | | 207,810,000,000 | IDR | | | 31,480,160 | |
FR35, 12.90%, 6/15/22 | | | 66,582,000,000 | IDR | | | 10,022,076 | |
FR36, 11.50%, 9/15/19 | | | 30,075,000,000 | IDR | | | 4,178,151 | |
FR37, 12.00%, 9/15/26 | | | 8,230,000,000 | IDR | | | 1,148,449 | |
FR39, 11.75%, 8/15/23 | | | 5,491,000,000 | IDR | | | 761,931 | |
FR40, 11.00%, 9/15/25 | | | 61,856,000,000 | IDR | | | 8,111,047 | |
FR42, 10.25%, 7/15/27 | | | 88,574,000,000 | IDR | | | 10,821,139 | |
FR43, 10.25%, 7/15/22 | | | 68,340,000,000 | IDR | | | 8,711,320 | |
FR44, 10.00%, 9/15/24 | | | 4,454,000,000 | IDR | | | 544,615 | |
FR46, 9.50%, 7/15/23 | | | 226,780,000,000 | IDR | | | 27,186,636 | |
TGB-14
Franklin Templeton Variable Insurance Products Trust
Statement of Investments, December 31, 2010 (continued)
| | | | | | | | |
| Templeton Global Bond Securities Fund | | Principal
Amount* | | | Value | |
Foreign Government and Agency Securities (continued) | | | | | | | | |
Indonesia (continued) | | | | | | | | |
FR47, 10.00%, 2/15/28 | | | 61,737,000,000 | IDR | | $ | 7,353,068 | |
FR48, 9.00%, 9/15/18 | | | 16,920,000,000 | IDR | | | 2,044,667 | |
FR49, 9.00%, 9/15/13 | | | 35,030,000,000 | IDR | | | 4,146,284 | |
csenior bond, 144A, 8.50%, 10/12/35 | | | 9,119,000 | | | | 12,103,573 | |
csenior bond, 144A, 6.625%, 2/17/37 | | | 2,240,000 | | | | 2,458,867 | |
csenior bond, 144A, 7.75%, 1/17/38 | | | 10,980,000 | | | | 13,439,063 | |
csenior note, 144A, 11.625%, 3/04/19 | | | 6,410,000 | | | | 9,525,527 | |
| | | | | | | | |
| | | | | | | 178,890,717 | |
| | | | | | | | |
Iraq 0.4% | | | | | | | | |
Government of Iraq, | | | | | | | | |
c144A, 5.80%, 1/15/28 | | | 5,055,000 | | | | 4,643,018 | |
fReg S, 5.80%, 1/15/28 | | | 3,440,000 | | | | 3,159,640 | |
| | | | | | | | |
| | | | | | | 7,802,658 | |
| | | | | | | | |
Israel 1.4% | | | | | | | | |
Government of Israel, 2680, 7.00%, 4/29/11 | | | 99,205,000 | ILS | | | 28,560,181 | |
| | | | | | | | |
Lithuania 1.7% | | | | | | | | |
cGovernment of Lithuania, 144A, | | | | | | | | |
6.75%, 1/15/15 | | | 19,480,000 | | | | 21,160,150 | |
7.375%, 2/11/20 | | | 12,690,000 | | | | 14,070,037 | |
| | | | | | | | |
| | | | | | | 35,230,187 | |
| | | | | | | | |
Malaysia 2.9% | | | | | | | | |
Government of Malaysia, senior bond, | | | | | | | | |
3.756%, 4/28/11 | | | 106,980,000 | MYR | | | 34,841,618 | |
3.833%, 9/28/11 | | | 3,860,000 | MYR | | | 1,262,416 | |
3.461%, 7/31/13 | | | 12,600,000 | MYR | | | 4,119,757 | |
3.814%, 2/15/17 | | | 18,885,000 | MYR | | | 6,201,587 | |
4.24%, 2/07/18 | | | 44,360,000 | MYR | | | 14,810,672 | |
0309, 2.711%, 2/14/12 | | | 20,000 | MYR | | | 6,477 | |
| | | | | | | | |
| | | | | | | 61,242,527 | |
| | | | | | | | |
Mexico 7.7% | | | | | | | | |
Government of Mexico, | | | | | | | | |
M, 9.00%, 6/20/13 | | | 385,600 | g MXN | | | 3,388,218 | |
M10, 8.00%, 12/17/15 | | | 726,000 | g MXN | | | 6,291,031 | |
M10, 7.25%, 12/15/16 | | | 250,000 | g MXN | | | 2,106,316 | |
M10, 7.75%, 12/14/17 | | | 4,473,000 | g MXN | | | 38,575,253 | |
M20, 10.00%, 12/05/24 | | | 8,569,800 | g MXN | | | 86,752,235 | |
M30, 10.00%, 11/20/36 | | | 1,440,600 | g MXN | | | 14,501,316 | |
MI10, 9.00%, 12/20/12 | | | 265,000 | g MXN | | | 2,302,017 | |
MI10, 8.00%, 12/19/13 | | | 794,500 | g MXN | | | 6,845,781 | |
| | | | | | | | |
| | | | | | | 160,762,167 | |
| | | | | | | | |
Norway 2.9% | | | | | | | | |
Government of Norway, | | | | | | | | |
6.00%, 5/16/11 | | | 300,110,000 | NOK | | | 52,243,241 | |
6.50%, 5/15/13 | | | 49,400,000 | NOK | | | 9,268,969 | |
| | | | | | | | |
| | | | | | | 61,512,210 | |
| | | | | | | | |
Peru 0.2% | | | | | | | | |
Government of Peru, 7.84%, 8/12/20 | | | 11,090,000 | PEN | | | 4,509,900 | |
| | | | | | | | |
TGB-15
Franklin Templeton Variable Insurance Products Trust
Statement of Investments, December 31, 2010 (continued)
| | | | | | | | |
| Templeton Global Bond Securities Fund | | Principal
Amount* | | | Value | |
Foreign Government and Agency Securities (continued) | | | | | | | | |
Philippines 0.2% | | | | | | | | |
Government of Philippine, senior bond, | | | | | | | | |
5.75%, 2/21/12 | | | 105,070,000 | PHP | | $ | 2,474,930 | |
8.75%, 3/03/13 | | | 64,160,000 | PHP | | | 1,598,896 | |
| | | | | | | | |
| | | | | | | 4,073,826 | |
| | | | | | | | |
Poland 5.9% | | | | | | | | |
Government of Poland, | | | | | | | | |
4.75%, 4/25/12 | | | 44,940,000 | PLN | | | 15,232,099 | |
5.75%, 4/25/14 | | | 92,590,000 | PLN | | | 31,868,572 | |
6.25%, 10/24/15 | | | 44,730,000 | PLN | | | 15,640,761 | |
5.75%, 9/23/22 | | | 48,750,000 | PLN | | | 15,998,694 | |
senior note, 6.375%, 7/15/19 | | | 27,200,000 | | | | 30,546,797 | |
Strip, 10/25/12 | | | 24,085,000 | PLN | | | 7,474,622 | |
Strip, 1/25/13 | | | 22,655,000 | PLN | | | 6,945,305 | |
| | | | | | | | |
| | | | | | | 123,706,850 | |
| | | | | | | | |
Qatar 0.7% | | | | | | | | |
cGovernment of Qatar, senior note, 144A, 6.55%, 4/09/19 | | | 12,060,000 | | | | 13,943,772 | |
| | | | | | | | |
Russia 3.5% | | | | | | | | |
cGovernment of Russia, 144A, 7.50%, 3/31/30 | | | 63,399,115 | | | | 73,229,148 | |
| | | | | | | | |
South Africa 1.8% | | | | | | | | |
Government of South Africa, | | | | | | | | |
5.25%, 5/16/13 | | | 3,590,000 | EUR | | | 5,072,058 | |
4.50%, 4/05/16 | | | 1,874,000 | EUR | | | 2,600,202 | |
6.875%, 5/27/19 | | | 21,215,000 | | | | 24,810,942 | |
senior note, 6.50%, 6/02/14 | | | 805,000 | | | | 910,391 | |
senior note, 5.875%, 5/30/22 | | | 3,485,000 | | | | 3,753,689 | |
| | | | | | | | |
| | | | | | | 37,147,282 | |
| | | | | | | | |
South Korea 13.6% | | | | | | | | |
The Export-Import Bank of Korea, 4.625%, 2/20/17 | | | 230,000 | EUR | | | 312,267 | |
Korea Deposit Insurance Corp., | | | | | | | | |
07-1, 5.57%, 9/14/12 | | | 6,600,000,000 | KRW | | | 6,087,908 | |
08-1, 5.28%, 2/15/13 | | | 880,000,000 | KRW | | | 811,581 | |
Korea Treasury Bond, | | | | | | | | |
4.75%, 12/10/11 | | | 77,103,490,000 | KRW | | | 70,004,186 | |
5.25%, 9/10/12 | | | 28,539,000,000 | KRW | | | 26,278,988 | |
4.25%, 12/10/12 | | | 2,473,000,000 | KRW | | | 2,242,513 | |
5.25%, 3/10/13 | | | 6,483,790,000 | KRW | | | 5,992,218 | |
5.00%, 9/10/16 | | | 2,806,000,000 | KRW | | | 2,599,992 | |
senior bond, 5.50%, 6/10/11 | | | 19,791,570,000 | KRW | | | 17,867,651 | |
senior bond, 4.00%, 6/10/12 | | | 126,527,650,000 | KRW | | | 114,099,181 | |
senior bond, 3.75%, 6/10/13 | | | 42,675,000,000 | KRW | | | 38,358,735 | |
| | | | | | | | |
| | | | | | | 284,655,220 | |
| | | | | | | | |
Sri Lanka 1.7% | | | | | | | | |
Government of Sri Lanka, | | | | | | | | |
A, 12.00%, 7/15/11 | | | 115,200,000 | LKR | | | 1,063,720 | |
A, 6.90%, 8/01/12 | | | 14,600,000 | LKR | | | 130,098 | |
A, 8.50%, 1/15/13 | | | 694,400,000 | LKR | | | 6,332,184 | |
A, 13.50%, 2/01/13 | | | 674,300,000 | LKR | | | 6,706,609 | |
A, 7.00%, 3/01/14 | | | 43,380,000 | LKR | | | 371,970 | |
A, 11.25%, 7/15/14 | | | 773,000,000 | LKR | | | 7,428,931 | |
A, 6.50%, 7/15/15 | | | 18,610,000 | LKR | | | 150,926 | |
TGB-16
Franklin Templeton Variable Insurance Products Trust
Statement of Investments, December 31, 2010 (continued)
| | | | | | | | |
| Templeton Global Bond Securities Fund | | Principal
Amount* | | | Value | |
Foreign Government and Agency Securities (continued) | | | | | | | | |
Sri Lanka (continued) | | | | | | | | |
A, 11.00%, 8/01/15 | | | 1,349,700,000 | LKR | | $ | 12,924,231 | |
B, 6.60%, 6/01/14 | | | 56,800,000 | LKR | | | 478,868 | |
| | | | | | | | |
| | | | | | | 35,587,537 | |
| | | | | | | | |
hSupranational 1.6% | | | | | | | | |
Corporacion Andina De Fomento, 8.125%, 6/04/19 | | | 9,880,000 | | | | 11,835,549 | |
European Investment Bank, senior note, 4.50%, 5/15/13 | | | 33,700,000 | NOK | | | 5,995,783 | |
Inter-American Development Bank, senior note, 7.50%, 12/05/24 | | | 200,000,000 | MXN | | | 16,232,651 | |
| | | | | | | | |
| | | | | | | 34,063,983 | |
| | | | | | | | |
Sweden 5.1% | | | | | | | | |
Government of Sweden, 5.25%, 3/15/11 | | | 712,870,000 | SEK | | | 107,028,194 | |
| | | | | | | | |
United Arab Emirates 0.7% | | | | | | | | |
cEmirate of Abu Dhabi, 144A, 6.75%, 4/08/19 | | | 11,840,000 | | | | 13,781,144 | |
| | | | | | | | |
Venezuela 1.4% | | | | | | | | |
Government of Venezuela, | | | | | | | | |
10.75%, 9/19/13 | | | 13,570,000 | | | | 13,038,734 | |
a,fReg S, FRN, 1.288%, 4/20/11 | | | 4,695,000 | | | | 4,636,313 | |
Petroleos de Venezuela SA, senior bond, zero cpn., 7/10/11 | | | 12,205,000 | | | | 11,644,498 | |
| | | | | | | | |
| | | | | | | 29,319,545 | |
| | | | | | | | |
Vietnam 0.6% | | | | | | | | |
cGovernment of Vietnam, 144A, 6.75%, 1/29/20 | | | 13,110,000 | | | | 13,355,812 | |
| | | | | | | | |
Total Foreign Government and Agency Securities (Cost $1,465,208,774) | | | | | | | 1,657,735,605 | |
| | | | | | | | |
Municipal Bonds 1.6% | | | | | | | | |
United States 1.6% | | | | | | | | |
Alabama State University Revenue, General Tuition and Fee, Assured Guaranty, 5.00%, 9/01/29 | | | 175,000 | | | | 177,074 | |
Bay Area Toll Authority Toll Bridge Revenue, Build America Bonds, Series S1, 6.793%, 4/01/30 | | | 3,460,000 | | | | 3,473,286 | |
Bexar County Revenue, Venue Project, Refunding, Series A, BHAC Insured, 5.25%, 8/15/47 | | | 1,450,000 | | | | 1,489,252 | |
California State GO, | | | | | | | | |
7.625%, 3/01/40 | | | 1,320,000 | | | | 1,378,621 | |
Refunding, 5.125%, 4/01/33 | | | 4,725,000 | | | | 4,352,717 | |
Refunding, 5.00%, 4/01/38 | | | 1,985,000 | | | | 1,783,701 | |
Various Purpose, 6.00%, 4/01/38 | | | 11,650,000 | | | | 11,883,699 | |
Illinois Municipal Electricity Agency Power Supply Revenue, Series A, BHAC Insured, 5.00%, 2/01/35 | | | 2,155,000 | | | | 2,087,484 | |
Los Angeles Community College District GO, 2008 Election, Series D, 6.68%, 8/01/36 | | | 1,700,000 | | | | 1,651,278 | |
Los Angeles USD, GO, Series KRY, 5.25%, 7/01/26 | | | 765,000 | | | | 784,538 | |
North Carolina Eastern Municipal Power Agency Power System Revenue, Refunding, Series A, Assured Guaranty,
5.25%, 1/01/19 | | | 2,400,000 | | | | 2,658,384 | |
Philadelphia GO, Refunding, Series A, Assured Guaranty,
5.00%, 8/01/24 | | | 500,000 | | | | 506,940 | |
Tarrant County Cultural Education Facilities Finance Corp. Revenue, Christus Health, Refunding, Series A, Assured Guaranty, 6.25%, 7/01/28 | | | 1,500,000 | | | | 1,600,875 | |
| | | | | | | | |
Total Municipal Bonds (Cost $33,800,373) | | | | | | | 33,827,849 | |
| | | | | | | | |
Total Investments before Short Term Investments (Cost $1,499,009,147) | | | | | | | 1,691,563,454 | |
| | | | | | | | |
Short Term Investments 16.8% | | | | | | | | |
Foreign Government and Agency Securities 7.1% | | | | | | | | |
Egypt 4.4% | | | | | | | | |
iEgypt Treasury Bills, 2/08/11 - 12/06/11 | | | 572,225,000 | EGP | | | 94,844,908 | |
| | | | | | | | |
Israel 1.5% | | | | | | | | |
iIsrael Treasury Bills, 6/01/11 - 10/05/11 | | | 116,818,900 | ILS | | | 32,682,811 | |
| | | | | | | | |
TGB-17
Franklin Templeton Variable Insurance Products Trust
Statement of Investments, December 31, 2010 (continued)
| | | | | | | | |
| Templeton Global Bond Securities Fund | | Principal
Amount* | | | Value | |
Short Term Investments (continued) | | | | | | | | |
Foreign Government and Agency Securities (continued) | | | | | | | | |
Malaysia 1.1% | | | | | | | | |
iBank of Negara Monetary Note, 1/06/11 - 10/13/11 | | | 8,270,000 | MYR | | $ | 2,630,757 | |
iMalaysia Treasury Bills, 4/05/11 - 12/15/11 | | | 62,895,000 | MYR | | | 19,903,901 | |
| | | | | | | | |
| | | | | | | 22,534,658 | |
| | | | | | | | |
Philippines 0.1% | | | | | | | | |
iPhilippine Treasury Bills, 11/16/11 - 11/29/11 | | | 55,180,000 | PHP | | | 1,241,894 | |
| | | | | | | | |
Sri Lanka 0.0%† | | | | | | | | |
iSri Lanka Treasury Bills, 7/08/11 - 9/16/11 | | | 53,690,000 | LKR | | | 464,901 | |
| | | | | | | | |
Total Foreign Government and Agency Securities (Cost $152,410,548) | | | | | | | 151,769,172 | |
| | | | | | | | |
Total Investments before Repurchase Agreements (Cost $1,651,419,695) | | | | | | | 1,843,332,626 | |
| | | | | | | | |
Repurchase Agreements (Cost $202,257,044) 9.7% | | | | | | | | |
jJoint Repurchase Agreement, 0.141%, 1/03/11 (Maturity Value $202,259,426) | | | 202,257,044 | | | | 202,257,044 | |
Barclays Capital Inc. (Maturity Value $34,823,006) | | | | | | | | |
BNP Paribas Securities Corp. (Maturity Value $35,816,100) | | | | | | | | |
Credit Suisse Securities (USA) LLC (Maturity Value $19,898,282) | | | | | | | | |
Deutsche Bank Securities Inc. (Maturity Value $32,126,887) | | | | | | | | |
HSBC Securities (USA) Inc. (Maturity Value $24,873,864) | | | | | | | | |
Merrill Lynch, Pierce, Fenner & Smith Inc. (Maturity Value $19,898,282) | | | | | | | | |
Morgan Stanley & Co. Inc. (Maturity Value $24,873,864) | | | | | | | | |
UBS Securities LLC (Maturity Value $9,949,141) | | | | | | | | |
Collateralized by U.S. Government Agency Securities, 0.50% - 5.75%, 1/07/11 - 10/26/15; iU.S. Treasury Bills, 5/12/11 - 7/28/11; and U.S. Treasury Notes, 0.375% - 1.875%, 9/30/11 - 9/30/17 (valued at $206,630,501) | | | | | | | | |
| | | | | | | | |
Total Investments (Cost $1,853,676,739) 97.5% | | | | | | | 2,045,589,670 | |
Other Assets, less Liabilities 2.5% | | | | | | | 51,707,831 | |
| | | | | | | | |
Net Assets 100.0% | | | | | | $ | 2,097,297,501 | |
| | | | | | | | |
*The principal amount is stated in U.S. dollars unless otherwise indicated.
†Rounds to less than 0.1% of net assets.
aThe coupon rate shown represents the rate at period end.
bThe principal amount is stated in original face, and scheduled paydowns are reflected in the market price on ex-date.
cSecurity was purchased pursuant to Rule 144A under the Securities Act of 1933 and may be sold in transactions exempt from registration only to qualified institutional buyers or in a public offering registered under the Securities Act of 1933. These securities have been deemed liquid under guidelines approved by the Trust’s Board of Trustees. At December 31, 2010, the aggregate value of these securities was $195,358,376, representing 9.31% of net assets.
dPrincipal amount is stated in 1,000 Brazilian Real Units.
eRedemption price at maturity is adjusted for inflation. See Note 1(f).
fSecurity was purchased pursuant to Regulation S under the Securities Act of 1933, which exempts from registration securities offered and sold outside of the United States. Such a security cannot be sold in the United States without either an effective registration statement filed pursuant to the Securities Act of 1933, or pursuant to an exemption from registration. These securities have been deemed liquid under guidelines approved by the Trust’s Board of Trustees. At December 31, 2010, the aggregate value of these securities was $7,795,953, representing 0.37% of net assets.
gPrincipal amount is stated in 100 Mexican Peso Units.
hA supranational organization is an entity formed by two or more central governments through international treaties.
iThe security is traded on a discount basis with no stated coupon rate.
jSee Note 1(c) regarding joint repurchase agreement.
TGB-18
Franklin Templeton Variable Insurance Products Trust
Statement of Investments, December 31, 2010 (continued)
| | | | | | |
| Templeton Global Bond Securities Fund | | | | | | |
At December 31, 2010, the Fund had the following financial futures contracts outstanding. See Note 1(d).
| | | | | | | | | | | | | | | | | | | | | | | | |
| Description | | Type | | | Number of
Contracts | | | Notional
Value | | | Expiration
Date | | | Unrealized
Appreciation | | | Unrealized
Depreciation | |
U.S. Treasury 10 Yr. Note | | | Short | | | | 1 | | | $ | 120,438 | | | | 3/22/11 | | | $ | 3,052 | | | $ | — | |
At December 31, 2010, the Fund had the following forward exchange contracts outstanding. See Note 1(d).
| | | | | | | | | | | | | | | | | | | | | | | | | | | | | | | | |
| Currency | | Counterparty | | | Type | | | Quantity | | | Contract
Amount* | | | | | | Settlement
Date | | | Unrealized
Appreciation | | | Unrealized
Depreciation | |
Malaysian Ringgit | | | JPHQ | | | | Buy | | | | 56,089,316 | | | | 16,324,490 | | | | | | | | 1/04/11 | | | $ | 1,860,230 | | | $ | — | |
Swedish Krona | | | DBAB | | | | Buy | | | | 136,332,733 | | | | 13,223,991 | | | | EUR | | | | 1/04/11 | | | | 2,615,117 | | | | — | |
Japanese Yen | | | BZWS | | | | Sell | | | | 277,330,000 | | | | 3,043,819 | | | | | | | | 1/07/11 | | | | — | | | | (372,903 | ) |
Japanese Yen | | | CITI | | | | Sell | | | | 138,680,000 | | | | 1,521,916 | | | | | | | | 1/07/11 | | | | — | | | | (186,631 | ) |
Japanese Yen | | | UBSW | | | | Sell | | | | 138,650,000 | | | | 1,521,870 | | | | | | | | 1/07/11 | | | | — | | | | (186,306 | ) |
Malaysian Ringgit | | | DBAB | | | | Buy | | | | 11,434,805 | | | | 3,372,104 | | | | | | | | 1/07/11 | | | | 334,346 | | | | — | |
New Israeli Shekel | | | DBAB | | | | Buy | | | | 117,806,600 | | | | 31,561,539 | | | | | | | | 1/07/11 | | | | 1,859,279 | | | | — | |
Euro | | | CITI | | | | Sell | | | | 2,240,000 | | | | 3,221,568 | | | | | | | | 1/10/11 | | | | 225,056 | | | | — | |
Euro | | | BZWS | | | | Sell | | | | 1,726,000 | | | | 2,481,298 | | | | | | | | 1/10/11 | | | | 172,378 | | | | — | |
Euro | | | BOFA | | | | Sell | | | | 2,800,000 | | | | 4,001,200 | | | | | | | | 1/11/11 | | | | 255,567 | | | | — | |
Euro | | | DBAB | | | | Sell | | | | 9,460,000 | | | | 13,521,273 | | | | | | | | 1/11/11 | | | | 866,382 | | | | — | |
Euro | | | UBSW | | | | Sell | | | | 13,846,000 | | | | 19,797,703 | | | | | | | | 1/11/11 | | | | 1,275,546 | | | | — | |
Japanese Yen | | | HSBC | | | | Sell | | | | 139,250,000 | | | | 1,521,858 | | | | | | | | 1/11/11 | | | | — | | | | (193,790 | ) |
Japanese Yen | | | DBAB | | | | Sell | | | | 139,110,000 | | | | 1,521,941 | | | | | | | | 1/11/11 | | | | — | | | | (191,982 | ) |
Euro | | | JPHQ | | | | Sell | | | | 937,000 | | | | 1,356,331 | | | | | | | | 1/13/11 | | | | 102,886 | | | | — | |
Japanese Yen | | | HSBC | | | | Sell | | | | 397,130,000 | | | | 4,329,997 | | | | | | | | 1/13/11 | | | | — | | | | (563,009 | ) |
Philippine Peso | | | JPHQ | | | | Buy | | | | 374,905,000 | | | | 8,061,299 | | | | | | | | 1/13/11 | | | | 529,854 | | | | — | |
Japanese Yen | | | BZWS | | | | Sell | | | | 394,150,000 | | | | 4,330,058 | | | | | | | | 1/14/11 | | | | — | | | | (526,289 | ) |
Japanese Yen | | | UBSW | | | | Sell | | | | 313,510,000 | | | | 3,463,992 | | | | | | | | 1/14/11 | | | | — | | | | (398,784 | ) |
Philippine Peso | | | HSBC | | | | Buy | | | | 60,160,000 | | | | 1,286,295 | | | | | | | | 1/14/11 | | | | 92,320 | | | | — | |
Euro | | | DBAB | | | | Sell | | | | 4,856,000 | | | | 7,024,544 | | | | | | | | 1/18/11 | | | | 528,619 | | | | — | |
Philippine Peso | | | DBAB | | | | Buy | | | | 66,125,000 | | | | 1,420,516 | | | | | | | | 1/18/11 | | | | 94,862 | | | | — | |
Philippine Peso | | | HSBC | | | | Buy | | | | 115,942,000 | | | | 2,483,709 | | | | | | | | 1/18/11 | | | | 173,318 | | | | — | |
Philippine Peso | | | JPHQ | | | | Buy | | | | 165,119,000 | | | | 3,542,946 | | | | | | | | 1/19/11 | | | | 241,106 | | | | — | |
Philippine Peso | | | DBAB | | | | Buy | | | | 41,372,000 | | | | 885,341 | | | | | | | | 1/19/11 | | | | 62,786 | | | | — | |
Brazilian Real | | | DBAB | | | | Buy | | | | 12,752,000 | | | | 580,709,502 | | | | JPY | | | | 1/26/11 | | | | 482,187 | | | | — | |
Japanese Yen | | | BZWS | | | | Sell | | | | 1,079,470,000 | | | | 12,019,178 | | | | | | | | 1/26/11 | | | | — | | | | (1,282,887) | |
Japanese Yen | | | UBSW | | | | Sell | | | | 944,420,000 | | | | 10,516,692 | | | | | | | | 1/26/11 | | | | — | | | | (1,121,182 | ) |
Japanese Yen | | | DBAB | | | | Sell | | | | 269,140,000 | | | | 3,004,801 | | | | | | | | 1/26/11 | | | | — | | | | (311,751 | ) |
Philippine Peso | | | HSBC | | | | Buy | | | | 154,149,000 | | | | 3,536,988 | | | | | | | | 1/26/11 | | | | — | | | | (4,053 | ) |
Brazilian Real | | | HSBC | | | | Buy | | | | 4,760,000 | | | | 217,473,737 | | | | JPY | | | | 1/27/11 | | | | 170,560 | | | | — | |
Chilean Peso | | | DBAB | | | | Buy | | | | 2,227,910,000 | | | | 4,431,888 | | | | | | | | 1/27/11 | | | | 318,099 | | | | — | |
Euro | | | CITI | | | | Sell | | | | 4,998,400 | | | | 7,056,491 | | | | | | | | 1/27/11 | | | | 370,174 | | | | — | |
Japanese Yen | | | HSBC | | | | Sell | | | | 928,300,000 | | | | 10,335,920 | | | | | | | | 1/27/11 | | | | — | | | | (1,103,443 | ) |
Chilean Peso | | | DBAB | | | | Buy | | | | 5,127,860,000 | | | | 10,123,107 | | | | | | | | 1/28/11 | | | | 808,787 | | | | — | |
Chilean Peso | | | JPHQ | | | | Buy | | | | 675,370,000 | | | | 1,327,509 | | | | | | | | 1/28/11 | | | | 112,288 | | | | — | |
New Zealand Dollar | | | BZWS | | | | Sell | | | | 12,970,535 | | | | 8,910,757 | | | | | | | | 1/28/11 | | | | — | | | | (1,165,485 | ) |
New Zealand Dollar | | | DBAB | | | | Sell | | | | 9,712,629 | | | | 6,684,717 | | | | | | | | 1/28/11 | | | | — | | | | (860,601 | ) |
New Zealand Dollar | | | UBSW | | | | Sell | | | | 7,565,376 | | | | 5,173,734 | | | | | | | | 1/28/11 | | | | — | | | | (703,477 | ) |
Chilean Peso | | | DBAB | | | | Buy | | | | 3,093,470,000 | | | | 5,966,966 | | | | | | | | 1/31/11 | | | | 626,271 | | | | — | |
Euro | | | UBSW | | | | Sell | | | | 5,540,000 | | | | 7,757,662 | | | | | | | | 1/31/11 | | | | 346,920 | | | | — | |
Euro | | | DBAB | | | | Sell | | | | 31,205,000 | | | | 43,732,247 | | | | | | | | 1/31/11 | | | | 1,989,971 | | | | — | |
Chinese Yuan | | | DBAB | | | | Buy | | | | 102,053,000 | | | | 15,368,270 | | | | | | | | 2/01/11 | | | | 70,983 | | | | — | |
Philippine Peso | | | HSBC | | | | Buy | | | | 55,600,000 | | | | 1,161,722 | | | | | | | | 2/03/11 | | | | 112,572 | | | | — | |
Philippine Peso | | | DBAB | | | | Buy | | | | 155,800,000 | | | | 3,253,968 | | | | | | | | 2/03/11 | | | | 316,805 | | | | — | |
TGB-19
Franklin Templeton Variable Insurance Products Trust
Statement of Investments, December 31, 2010 (continued)
| | | | | | |
| Templeton Global Bond Securities Fund | | | | | | |
| | | | | | | | | | | | | | | | | | | | | | | | | | | | | | | | |
| Currency | | Counterparty | | | Type | | | Quantity | | | Contract
Amount* | | | | | | Settlement
Date | | | Unrealized
Appreciation | | | Unrealized
Depreciation | |
Indian Rupee | | | JPHQ | | | | Buy | | | | 21,500,000 | | | | 455,412 | | | | | | | | 2/04/11 | | | $ | 22,366 | | | $ | — | |
New Zealand Dollar | | | DBAB | | | | Sell | | | | 12,744,985 | | | | 8,740,511 | | | | | | | | 2/04/11 | | | | — | | | | (1,155,071 | ) |
Philippine Peso | | | HSBC | | | | Buy | | | | 43,900,000 | | | | 923,278 | | | | | | | | 2/04/11 | | | | 82,853 | | | | — | |
Philippine Peso | | | BOFA | | | | Buy | | | | 43,900,000 | | | | 924,211 | | | | | | | | 2/04/11 | | | | 81,920 | | | | — | |
Philippine Peso | | | BOFA | | | | Buy | | | | 55,000,000 | | | | 1,161,563 | | | | | | | | 2/07/11 | | | | 98,922 | | | | — | |
Philippine Peso | | | JPHQ | | | | Buy | | | | 60,500,000 | | | | 1,279,070 | | | | | | | | 2/07/11 | | | | 107,464 | | | | — | |
Australian Dollar | | | MSCO | | | | Buy | | | | 10,560,886 | | | | 8,795,000 | | | | | | | | 2/08/11 | | | | 1,940,193 | | | | — | |
Australian Dollar | | | UBSW | | | | Buy | | | | 10,557,970 | | | | 8,795,000 | | | | | | | | 2/08/11 | | | | 1,937,229 | | | | — | |
Euro | | | UBSW | | | | Sell | | | | 4,929,000 | | | | 6,766,778 | | | | | | | | 2/08/11 | | | | 173,594 | | | | — | |
Euro | | | CITI | | | | Sell | | | | 6,572,000 | | | | 9,019,051 | | | | | | | | 2/08/11 | | | | 228,140 | | | | — | |
Euro | | | HSBC | | | | Sell | | | | 1,200,000 | | | | 1,641,060 | | | | | | | | 2/08/11 | | | | 35,903 | | | | — | |
Euro | | | JPHQ | | | | Sell | | | | 300,000 | | | | 410,190 | | | | | | | | 2/08/11 | | | | 8,901 | | | | — | |
Norwegian Krone | | | UBSW | | | | Buy | | | | 72,121,400 | | | | 8,654,603 | | | | EUR | | | | 2/08/11 | | | | 785,654 | | | | — | |
Australian Dollar | | | BZWS | | | | Buy | | | | 3,351,000 | | | | 247,404,330 | | | | JPY | | | | 2/09/11 | | | | 356,762 | | | | — | |
Australian Dollar | | | CITI | | | | Buy | | | | 3,351,000 | | | | 248,017,563 | | | | JPY | | | | 2/09/11 | | | | 349,204 | | | | — | |
Australian Dollar | | | DBAB | | | | Buy | | | | 3,351,000 | | | | 248,523,564 | | | | JPY | | | | 2/09/11 | | | | 342,968 | | | | — | |
Euro | | | HSBC | | | | Sell | | | | 600,000 | | | | 820,560 | | | | | | | | 2/09/11 | | | | 17,985 | | | | — | |
Euro | | | BZWS | | | | Sell | | | | 800,000 | | | | 1,091,740 | | | | | | | | 2/09/11 | | | | 21,640 | | | | — | |
Norwegian Krone | | | UBSW | | | | Buy | | | | 100,802,700 | | | | 12,116,437 | | | | EUR | | | | 2/09/11 | | | | 1,070,497 | | | | — | |
Norwegian Krone | | | DBAB | | | | Buy | | | | 144,025,000 | | | | 17,309,241 | | | | EUR | | | | 2/09/11 | | | | 1,532,846 | | | | — | |
Poland Zloty | | | DBAB | | | | Buy | | | | 17,528,000 | | | | 4,206,888 | | | | EUR | | | | 2/09/11 | | | | 269,243 | | | | — | |
South Korean Won | | | HSBC | | | | Buy | | | | 21,363,430,000 | | | | 18,100,000 | | | | | | | | 2/09/11 | | | | 910,275 | | | | — | |
Chilean Peso | | | MLCO | | | | Buy | | | | 1,145,000,000 | | | | 2,131,224 | | | | | | | | 2/10/11 | | | | 307,169 | | | | — | |
Chilean Peso | | | DBAB | | | | Buy | | | | 1,145,000,000 | | | | 2,131,224 | | | | | | | | 2/10/11 | | | | 307,169 | | | | — | |
Euro | | | BZWS | | | | Sell | | | | 612,000 | | | | 836,298 | | | | | | | | 2/10/11 | | | | 17,675 | | | | — | |
Euro | | | DBAB | | | | Sell | | | | 180,000 | | | | 246,114 | | | | | | | | 2/10/11 | | | | 5,343 | | | | — | |
Japanese Yen | | | MSCO | | | | Sell | | | | 394,373,000 | | | | 4,433,015 | | | | | | | | 2/10/11 | | | | — | | | | (427,498 | ) |
Poland Zloty | | | BZWS | | | | Buy | | | | 17,528,000 | | | | 4,183,493 | | | | EUR | | | | 2/10/11 | | | | 300,205 | | | | — | |
South Korean Won | | | HSBC | | | | Buy | | | | 5,578,000,000 | | | | 419,650,917 | | | | JPY | | | | 2/10/11 | | | | — | | | | (208,678 | ) |
Chilean Peso | | | DBAB | | | | Buy | | | | 1,058,220,000 | | | | 1,975,766 | | | | | | | | 2/11/11 | | | | 277,636 | | | | — | |
Chilean Peso | | | BZWS | | | | Buy | | | | 1,142,900,000 | | | | 2,131,183 | | | | | | | | 2/11/11 | | | | 302,539 | | | | — | |
Euro | | | UBSW | | | | Sell | | | | 657,000 | | | | 903,454 | | | | | | | | 2/11/11 | | | | 24,642 | | | | — | |
Chilean Peso | | | DBAB | | | | Buy | | | | 1,130,600,000 | | | | 2,131,197 | | | | | | | | 2/14/11 | | | | 275,743 | | | | — | |
Malaysian Ringgit | | | DBAB | | | | Buy | | | | 97,443,480 | | | | 28,224,035 | | | | | | | | 2/14/11 | | | | 3,281,504 | | | | — | |
New Zealand Dollar | | | HSBC | | | | Sell | | | | 2,945,715 | | | | 1,982,172 | | | | | | | | 2/14/11 | | | | — | | | | (303,229 | ) |
Poland Zloty | | | DBAB | | | | Buy | | | | 17,528,000 | | | | 4,220,462 | | | | EUR | | | | 2/14/11 | | | | 249,431 | | | | — | |
South Korean Won | | | JPHQ | | | | Buy | | | | 1,913,000,000 | | | | 144,924,242 | | | | JPY | | | | 2/14/11 | | | | — | | | | (84,292 | ) |
South Korean Won | | | DBAB | | | | Buy | | | | 1,658,000,000 | | | | 125,968,697 | | | | JPY | | | | 2/14/11 | | | | — | | | | (77,525 | ) |
South Korean Won | | | HSBC | | | | Buy | | | | 16,244,000,000 | | | | 13,918,259 | | | | | | | | 2/14/11 | | | | 533,377 | | | | — | |
Chilean Peso | | | MSCO | | | | Buy | | | | 2,254,600,000 | | | | 4,262,407 | | | | | | | | 2/16/11 | | | | 536,640 | | | | — | |
Euro | | | JPHQ | | | | Sell | | | | 1,971,000 | | | | 2,681,743 | | | | | | | | 2/16/11 | | | | 45,366 | | | | — | |
Euro | | | UBSW | | | | Sell | | | | 1,971,000 | | | | 2,680,363 | | | | | | | | 2/16/11 | | | | 43,987 | | | | — | |
South Korean Won | | | JPHQ | | | | Buy | | | | 1,116,000,000 | | | | 85,432,136 | | | | JPY | | | | 2/16/11 | | | | — | | | | (60,208 | ) |
Malaysian Ringgit | | | HSBC | | | | Buy | | | | 4,899,000 | | | | 1,424,045 | | | | | | | | 2/17/11 | | | | 159,649 | | | | — | |
Chilean Peso | | | DBAB | | | | Buy | | | | 526,900,000 | | | | 1,007,457 | | | | | | | | 2/18/11 | | | | 113,897 | | | | — | |
Chilean Peso | | | JPHQ | | | | Buy | | | | 1,055,800,000 | | | | 2,014,886 | | | | | | | | 2/18/11 | | | | 232,079 | | | | — | |
Euro | | | UBSW | | | | Sell | | | | 2,038,000 | | | | 2,799,825 | | | | | | | | 2/18/11 | | | | 73,855 | | | | — | |
Euro | | | DBAB | | | | Sell | | | | 2,038,000 | | | | 2,800,090 | | | | | | | | 2/18/11 | | | | 74,120 | | | | — | |
Chilean Peso | | | MSCO | | | | Buy | | | | 5,517,900,000 | | | | 10,517,860 | | | | | | | | 2/22/11 | | | | 1,221,562 | | | | — | |
Chilean Peso | | | DBAB | | | | Buy | | | | 2,364,060,000 | | | | 4,512,520 | | | | | | | | 2/22/11 | | | | 517,056 | | | | — | |
Chilean Peso | | | JPHQ | | | | Buy | | | | 1,792,000,000 | | | | 3,425,404 | | | | | | | | 2/22/11 | | | | 387,105 | | | | — | |
Japanese Yen | | | JPHQ | | | | Sell | | | | 385,700,000 | | | | 4,286,508 | | | | | | | | 2/22/11 | | | | — | | | | (467,666 | ) |
Japanese Yen | | | HSBC | | | | Sell | | | | 385,460,000 | | | | 4,287,033 | | | | | | | | 2/22/11 | | | | — | | | | (464,183 | ) |
TGB-20
Franklin Templeton Variable Insurance Products Trust
Statement of Investments, December 31, 2010 (continued)
| | | | | | |
| Templeton Global Bond Securities Fund | | | | | | |
| | | | | | | | | | | | | | | | | | | | | | | | | | | | | | | | |
| Currency | | Counterparty | | | Type | | | Quantity | | | Contract
Amount* | | | | | | Settlement
Date | | | Unrealized
Appreciation | | | Unrealized
Depreciation | |
Chilean Peso | | | MLCO | | | | Buy | | | | 1,062,800,000 | | | | 2,014,978 | | | | | | | | 2/23/11 | | | $ | 245,962 | | | $ | — | |
Chilean Peso | | | MSCO | | | | Buy | | | | 1,055,200,000 | | | | 2,014,894 | | | | | | | | 2/24/11 | | | | 229,695 | | | | — | |
Chilean Peso | | | MSCO | | | | Buy | | | | 2,254,540,000 | | | | 4,311,938 | | | | | | | | 2/25/11 | | | | 483,459 | | | | — | |
Chilean Peso | | | CITI | | | | Buy | | | | 2,285,090,000 | | | | 4,356,702 | | | | | | | | 2/25/11 | | | | 503,675 | | | | — | |
Chilean Peso | | | DBAB | | | | Buy | | | | 1,580,100,000 | | | | 3,022,380 | | | | | | | | 2/25/11 | | | | 338,487 | | | | — | |
Chilean Peso | | | JPHQ | | | | Buy | | | | 593,800,000 | | | | 1,128,897 | | | | | | | | 2/28/11 | | | | 133,804 | | | | — | |
Chilean Peso | | | DBAB | | | | Buy | | | | 1,304,870,000 | | | | 2,495,448 | | | | | | | | 2/28/11 | | | | 279,326 | | | | — | |
Chilean Peso | | | MSCO | | | | Buy | | | | 1,559,200,000 | | | | 2,972,736 | | | | | | | | 3/01/11 | | | | 342,595 | | | | — | |
Chilean Peso | | | MLCO | | | | Buy | | | | 576,500,000 | | | | 1,099,561 | | | | | | | | 3/01/11 | | | | 126,252 | | | | — | |
Chilean Peso | | | DBAB | | | | Buy | | | | 2,119,640,000 | | | | 4,052,849 | | | | | | | | 3/01/11 | | | | 454,147 | | | | — | |
Japanese Yen | | | UBSW | | | | Sell | | | | 447,200,000 | | | | 5,027,091 | | | | | | | | 3/01/11 | | | | — | | | | (485,512 | ) |
Japanese Yen | | | JPHQ | | | | Sell | | | | 401,100,000 | | | | 4,489,188 | | | | | | | | 3/01/11 | | | | — | | | | (455,143 | ) |
Japanese Yen | | | HSBC | | | | Sell | | | | 400,800,000 | | | | 4,488,393 | | | | | | | | 3/01/11 | | | | — | | | | (452,241 | ) |
Chilean Peso | | | DBAB | | | | Buy | | | | 388,300,000 | | | | 743,158 | | | | | | | | 3/02/11 | | | | 82,417 | | | | — | |
Chilean Peso | | | DBAB | | | | Buy | | | | 1,328,230,000 | | | | 2,539,637 | | | | | | | | 3/04/11 | | | | 283,876 | | | | — | |
Euro | �� | | BOFA | | | | Sell | | | | 5,225,000 | | | | 7,149,159 | | | | | | | | 3/07/11 | | | | 160,862 | | | | — | |
Euro | | | UBSW | | | | Sell | | | | 6,915,000 | | | | 9,471,890 | | | | | | | | 3/07/11 | | | | 223,264 | | | | — | |
Euro | | | HSBC | | | | Sell | | | | 1,844,000 | | | | 2,523,311 | | | | | | | | 3/08/11 | | | | 57,021 | | | | — | |
Chilean Peso | | | DBAB | | | | Buy | | | | 2,604,680,000 | | | | 5,160,337 | | | | | | | | 3/10/11 | | | | 373,852 | | | | — | |
Chilean Peso | | | MSCO | | | | Buy | | | | 662,100,000 | | | | 1,278,803 | | | | | | | | 3/15/11 | | | | 127,383 | | | | — | |
Chilean Peso | | | DBAB | | | | Buy | | | | 2,600,220,000 | | | | 5,038,698 | | | | | | | | 3/15/11 | | | | 483,717 | | | | — | |
Japanese Yen | | | CITI | | | | Sell | | | | 407,702,000 | | | | 4,526,593 | | | | | | | | 3/18/11 | | | | — | | | | (500,108 | ) |
Japanese Yen | | | UBSW | | | | Sell | | | | 330,530,000 | | | | 3,675,373 | | | | | | | | 3/18/11 | | | | — | | | | (399,847 | ) |
Japanese Yen | | | MSCO | | | | Sell | | | | 244,700,000 | | | | 2,715,811 | | | | | | | | 3/18/11 | | | | — | | | | (301,181 | ) |
Chilean Peso | | | JPHQ | | | | Buy | | | | 1,065,000,000 | | | | 2,063,554 | | | | | | | | 3/21/11 | | | | 197,193 | | | | — | |
Japanese Yen | | | BOFA | | | | Sell | | | | 242,774,840 | | | | 2,697,948 | | | | | | | | 3/22/11 | | | | — | | | | (295,446 | ) |
New Israeli Shekel | | | MSCO | | | | Buy | | | | 5,783,303 | | | | 1,540,202 | | | | | | | | 3/29/11 | | | | 98,776 | | | | — | |
Chilean Peso | | | DBAB | | | | Buy | | | | 1,252,750,000 | | | | 2,382,560 | | | | | | | | 3/31/11 | | | | 274,527 | | | | — | |
New Israeli Shekel | | | MSCO | | | | Buy | | | | 3,512,807 | | | | 936,948 | | | | | | | | 3/31/11 | | | | 58,548 | | | | — | |
Chilean Peso | | | DBAB | | | | Buy | | | | 1,330,940,000 | | | | 2,535,124 | | | | | | | | 4/04/11 | | | | 286,760 | | | | — | |
Euro | | | DBAB | | | | Sell | | | | 7,243,000 | | | | 9,787,683 | | | | | | | | 4/07/11 | | | | 101,609 | | | | — | |
Euro | | | HSBC | | | | Sell | | | | 8,692,000 | | | | 11,746,630 | | | | | | | | 4/07/11 | | | | 122,805 | | | | — | |
Euro | | | UBSW | | | | Sell | | | | 4,346,000 | | | | 5,871,011 | | | | | | | | 4/07/11 | | | | 59,099 | | | | — | |
Indian Rupee | | | DBAB | | | | Buy | | | | 159,915,000 | | | | 3,523,521 | | | | | | | | 4/11/11 | | | | — | | | �� | (14,390 | ) |
Indian Rupee | | | DBAB | | | | Buy | | | | 342,913,000 | | | | 7,554,814 | | | | | | | | 4/12/11 | | | | — | | | | (31,355 | ) |
Euro | | | UBSW | | | | Sell | | | | 3,907,000 | | | | 5,263,120 | | | | | | | | 4/13/11 | | | | 38,429 | | | | — | |
Indian Rupee | | | JPHQ | | | | Buy | | | | 230,330,000 | | | | 5,089,041 | | | | | | | | 4/13/11 | | | | — | | | | (36,529 | ) |
Euro | | | HSBC | | | | Sell | | | | 6,919,000 | | | | 9,445,404 | | | | | | | | 4/14/11 | | | | 192,916 | | | | — | |
Indian Rupee | | | JPHQ | | | | Buy | | | | 226,092,000 | | | | 4,995,404 | | | | | | | | 4/15/11 | | | | — | | | | (37,609 | ) |
Indian Rupee | | | JPHQ | | | | Buy | | | | 112,941,000 | | | | 2,484,951 | | | | | | | | 4/19/11 | | | | — | | | | (10,104 | ) |
Indian Rupee | | | DBAB | | | | Buy | | | | 79,271,000 | | | | 1,746,057 | | | | | | | | 4/19/11 | | | | — | | | | (9,013 | ) |
Malaysian Ringgit | | | JPHQ | | | | Buy | | | | 4,069,213 | | | | 1,247,077 | | | | | | | | 4/19/11 | | | | 63,429 | | | | — | |
Japanese Yen | | | UBSW | | | | Sell | | | | 261,900,000 | | | | 2,855,990 | | | | | | | | 4/20/11 | | | | — | | | | (374,473 | ) |
Japanese Yen | | | CITI | | | | Sell | | | | 261,800,000 | | | | 2,856,410 | | | | | | | | 4/20/11 | | | | — | | | | (372,819 | ) |
Malaysian Ringgit | | | JPHQ | | | | Buy | | | | 11,659,000 | | | | 3,590,146 | | | | | | | | 4/22/11 | | | | 163,989 | | | | — | |
Chilean Peso | | | MSCO | | | | Buy | | | | 5,015,940,000 | | | | 9,549,442 | | | | | | | | 4/25/11 | | | | 1,064,837 | | | | — | |
Indian Rupee | | | DBAB | | | | Buy | | | | 160,601,000 | | | | 3,546,059 | | | | | | | | 4/26/11 | | | | — | | | | (31,194 | ) |
Chilean Peso | | | JPHQ | | | | Buy | | | | 1,501,938,000 | | | | 2,859,473 | | | | | | | | 4/27/11 | | | | 318,207 | | | | — | |
Indian Rupee | | | JPHQ | | | | Buy | | | | 22,911,000 | | | | 505,538 | | | | | | | | 4/27/11 | | | | — | | | | (4,204 | ) |
Chilean Peso | | | CITI | | | | Buy | | | | 2,420,966,000 | | | | 4,637,866 | | | | | | | | 4/28/11 | | | | 483,746 | | | | — | |
Indian Rupee | | | JPHQ | | | | Buy | | | | 113,671,000 | | | | 2,508,186 | | | | | | | | 4/28/11 | | | | — | | | | (21,294 | ) |
Indian Rupee | | | DBAB | | | | Buy | | | | 71,377,981 | | | | 1,575,325 | | | | | | | | 4/28/11 | | | | — | | | | (13,719 | ) |
Indian Rupee | | | JPHQ | | | | Buy | | | | 113,782,000 | | | | 2,511,744 | | | | | | | | 4/29/11 | �� | | | — | | | | (22,862 | ) |
TGB-21
Franklin Templeton Variable Insurance Products Trust
Statement of Investments, December 31, 2010 (continued)
| | | | | | |
| Templeton Global Bond Securities Fund | | | | | | |
| | | | | | | | | | | | | | | | | | | | | | | | | | | | | | | | |
| Currency | | Counterparty | | | Type | | | Quantity | | | Contract
Amount* | | | | | | Settlement
Date | | | Unrealized
Appreciation | | | Unrealized
Depreciation | |
Peruvian Nuevo Sol | | | DBAB | | | | Buy | | | | 32,777,510 | | | | 11,430,692 | | | | | | | | 4/29/11 | | | $ | 190,592 | | | $ | — | |
Swedish Krona | | | BZWS | | | | Buy | | | | 122,773,200 | | | | 12,757,645 | | | | EUR | | | | 4/29/11 | | | | 1,144,988 | | | | — | |
Peruvian Nuevo Sol | | | DBAB | | | | Buy | | | | 7,298,991 | | | | 2,544,089 | | | | | | | | 5/06/11 | | | | 43,059 | | | | — | |
Chilean Peso | | | DBAB | | | | Buy | | | | 1,150,200,000 | | | | 2,166,102 | | | | | | | | 5/10/11 | | | | 264,483 | | | | — | |
Japanese Yen | | | CITI | | | | Sell | | | | 733,721,000 | | | | 8,237,235 | | | | | | | | 5/10/11 | | | | — | | | | (815,591 | ) |
Japanese Yen | | | UBSW | | | | Sell | | | | 733,361,000 | | | | 8,237,235 | | | | | | | | 5/10/11 | | | | — | | | | (811,150 | ) |
Japanese Yen | | | DBAB | | | | Sell | | | | 490,555,000 | | | | 5,491,492 | | | | | | | | 5/10/11 | | | | — | | | | (561,093 | ) |
Chilean Peso | | | DBAB | | | | Buy | | | | 420,740,000 | | | | 778,788 | | | | | | | | 5/19/11 | | | | 109,577 | | | | — | |
Indian Rupee | | | DBAB | | | | Buy | | | | 217,594,000 | | | | 4,578,998 | | | | | | | | 6/01/11 | | | | 153,163 | | | | — | |
Indian Rupee | | | HSBC | | | | Buy | | | | 251,448,000 | | | | 5,224,023 | | | | | | | | 6/03/11 | | | | 242,469 | | | | — | |
Indian Rupee | | | DBAB | | | | Buy | | | | 160,277,000 | | | | 3,315,619 | | | | | | | | 6/07/11 | | | | 166,372 | | | | — | |
Poland Zloty | | | CITI | | | | Buy | | | | 5,990,000 | | | | 1,436,451 | | | | EUR | | | | 6/07/11 | | | | 78,396 | | | | — | |
Poland Zloty | | | DBAB | | | | Buy | | | | 30,704,000 | | | | 7,358,658 | | | | EUR | | | | 6/07/11 | | | | 407,748 | | | | — | |
Indian Rupee | | | HSBC | | | | Buy | | | | 42,784,000 | | | | 898,257 | | | | | | | | 6/08/11 | | | | 31,055 | | | | — | |
Indian Rupee | | | DBAB | | | | Buy | | | | 43,392,000 | | | | 902,684 | | | | | | | | 6/10/11 | | | | 39,506 | | | | — | |
Indian Rupee | | | HSBC | | | | Buy | | | | 108,000,000 | | | | 2,247,098 | | | | | | | | 6/13/11 | | | | 96,723 | | | | — | |
Indian Rupee | | | DBAB | | | | Buy | | | | 108,614,000 | | | | 2,278,456 | | | | | | | | 6/16/11 | | | | 77,454 | | | | — | |
Indian Rupee | | | DBAB | | | | Buy | | | | 98,937,000 | | | | 2,078,072 | | | | | | | | 6/20/11 | | | | 66,439 | | | | — | |
Indian Rupee | | | JPHQ | | | | Buy | | | | 79,054,000 | | | | 1,658,012 | | | | | | | | 6/22/11 | | | | 54,926 | | | | — | |
Indian Rupee | | | DBAB | | | | Buy | | | | 119,627,000 | | | | 2,535,007 | | | | | | | | 6/24/11 | | | | 56,160 | | | | — | |
Indian Rupee | | | HSBC | | | | Buy | | | | 80,337,000 | | | | 1,690,949 | | | | | | | | 6/27/11 | | | | 48,271 | | | | — | |
Malaysian Ringgit | | | JPHQ | | | | Buy | | | | 14,772,000 | | | | 4,510,397 | | | | | | | | 6/29/11 | | | | 226,344 | | | | — | |
Swedish Krona | | | UBSW | | | | Buy | | | | 103,791,000 | | | | 10,806,797 | | | | EUR | | | | 6/29/11 | | | | 902,791 | | | | — | |
Indian Rupee | | | DBAB | | | | Buy | | | | 79,423,000 | | | | 1,637,588 | | | | | | | | 7/11/11 | | | | 78,436 | | | | — | |
Indian Rupee | | | JPHQ | | | | Buy | | | | 127,745,000 | | | | 2,632,289 | | | | | | | | 7/12/11 | | | | 127,409 | | | | — | |
Indian Rupee | | | DBAB | | | | Buy | | | | 40,128,000 | | | | 829,948 | | | | | | | | 7/12/11 | | | | 36,944 | | | | — | |
Malaysian Ringgit | | | DBAB | | | | Buy | | | | 18,006,622 | | | | 5,559,659 | | | | | | | | 7/12/11 | | | | 210,170 | | | | — | |
Malaysian Ringgit | | | DBAB | | | | Buy | | | | 13,610,000 | | | | 4,207,760 | | | | | | | | 7/13/11 | | | | 153,028 | | | | — | |
Indian Rupee | | | CITI | | | | Buy | | | | 19,711,000 | | | | 408,349 | | | | | | | | 7/18/11 | | | | 17,124 | | | | — | |
Malaysian Ringgit | | | DBAB | | | | Buy | | | | 11,455,000 | | | | 2,778,014 | | | | EUR | | | | 7/18/11 | | | | — | | | | (43,949 | ) |
Malaysian Ringgit | | | DBAB | | | | Buy | | | | 2,637,000 | | | | 813,763 | | | | | | | | 7/18/11 | | | | 30,928 | | | | — | |
Indian Rupee | | | JPHQ | | | | Buy | | | | 19,711,000 | | | | 407,673 | | | | | | | | 7/20/11 | | | | 17,684 | | | | — | |
Malaysian Ringgit | | | DBAB | | | | Buy | | | | 12,933,000 | | | | 3,082,647 | | | | EUR | | | | 7/20/11 | | | | 21,886 | | | | — | |
Malaysian Ringgit | | | DBAB | | | | Buy | | | | 4,160,000 | | | | 1,279,252 | | | | | | | | 7/20/11 | | | | 53,145 | | | | — | |
Malaysian Ringgit | | | DBAB | | | | Buy | | | | 16,628,000 | | | | 3,962,661 | | | | EUR | | | | 7/25/11 | | | | 27,762 | | | | — | |
Malaysian Ringgit | | | DBAB | | | | Buy | | | | 5,058,000 | | | | 1,555,111 | | | | | | | | 7/25/11 | | | | 64,460 | | | | — | |
Malaysian Ringgit | | | JPHQ | | | | Buy | | | | 16,628,000 | | | | 3,979,799 | | | | EUR | | | | 7/27/11 | | | | 4,326 | | | | — | |
Malaysian Ringgit | | | JPHQ | | | | Buy | | | | 5,318,000 | | | | 1,638,526 | | | | | | | | 7/27/11 | | | | 64,111 | | | | — | |
Malaysian Ringgit | | | HSBC | | | | Buy | | | | 3,005,000 | | | | 926,268 | | | | | | | | 7/29/11 | | | | 35,722 | | | | — | |
Malaysian Ringgit | | | HSBC | | | | Buy | | | | 6,100,000 | | | | 1,897,297 | | | | | | | | 8/08/11 | | | | 54,425 | | | | — | |
Malaysian Ringgit | | | JPHQ | | | | Buy | | | | 1,100,000 | | | | 341,827 | | | | | | | | 8/09/11 | | | | 10,103 | | | | — | |
Poland Zloty | | | DBAB | | | | Buy | | | | 59,155,000 | | | | 14,545,119 | | | | EUR | | | | 8/12/11 | | | | 207,003 | | | | — | |
Japanese Yen | | | UBSW | | | | Sell | | | | 758,781,000 | | | | 8,929,251 | | | | | | | | 8/18/11 | | | | — | | | | (448,314 | ) |
Japanese Yen | | | DBAB | | | | Sell | | | | 461,885,000 | | | | 5,435,540 | | | | | | | | 8/18/11 | | | | — | | | | (272,770 | ) |
Japanese Yen | | | JPHQ | | | | Sell | | | | 377,047,000 | | | | 4,414,037 | | | | | | | | 8/18/11 | | | | — | | | | (245,783 | ) |
Japanese Yen | | | HSBC | | | | Sell | | | | 375,298,000 | | | | 4,415,946 | | | | | | | | 8/19/11 | | | | — | | | | (222,346 | ) |
Euro | | | UBSW | | | | Sell | | | | 6,270,000 | | | | 8,074,004 | | | | | | | | 8/22/11 | | | | — | | | | (305,324 | ) |
Japanese Yen | | | BZWS | | | | Sell | | | | 376,247,000 | | | | 4,429,249 | | | | | | | | 8/22/11 | | | | — | | | | (221,036 | ) |
Japanese Yen | | | DBAB | | | | Sell | | | | 376,727,000 | | | | 4,440,441 | | | | | | | | 8/22/11 | | | | — | | | | (215,776 | ) |
Japanese Yen | | | MSCO | | | | Sell | | | | 300,000,000 | | | | 3,531,739 | | | | | | | | 8/22/11 | | | | — | | | | (176,159 | ) |
Euro | | | UBSW | | | | Sell | | | | 6,274,000 | | | | 8,065,980 | | | | | | | | 8/23/11 | | | | — | | | | (318,651 | ) |
Japanese Yen | | | FBCO | | | | Sell | | | | 746,218,000 | | | | 8,779,035 | | | | | | | | 8/23/11 | | | | — | | | | (444,139 | ) |
Japanese Yen | | | CITI | | | | Sell | | | | 751,731,000 | | | | 8,864,439 | | | | | | | | 8/23/11 | | | | — | | | | (426,876 | ) |
TGB-22
Franklin Templeton Variable Insurance Products Trust
Statement of Investments, December 31, 2010 (continued)
| | | | | | |
| Templeton Global Bond Securities Fund | | | | | | |
| | | | | | | | | | | | | | | | | | | | | | | | | | | | | | | | |
| Currency | | Counterparty | | | Type | | | Quantity | | | Contract
Amount* | | | | | | Settlement
Date | | | Unrealized
Appreciation | | | Unrealized
Depreciation | |
Japanese Yen | | | DBAB | | | | Sell | | | | 371,821,000 | | | | 4,391,829 | | | | | | | | 8/23/11 | | | $ | — | | | $ | (203,839 | ) |
Indian Rupee | | | HSBC | | | | Buy | | | | 143,891,000 | | | | 2,979,171 | | | | | | | | 8/24/11 | | | | 111,230 | | | | — | |
Indian Rupee | | | DBAB | | | | Buy | | | | 124,700,000 | | | | 2,577,511 | | | | | | | | 8/24/11 | | | | 100,718 | | | | — | |
Japanese Yen | | | JPHQ | | | | Sell | | | | 750,133,000 | | | | 8,840,695 | | | | | | | | 8/24/11 | | | | — | | | | (431,044 | ) |
Japanese Yen | | | BZWS | | | | Sell | | | | 747,636,000 | | | | 8,833,546 | | | | | | | | 8/24/11 | | | | — | | | | (407,330 | ) |
Euro | | | BZWS | | | | Sell | | | | 7,656,600 | | | | 9,689,427 | | | | | | | | 8/25/11 | | | | — | | | | (542,819 | ) |
Japanese Yen | | | DBAB | | | | Sell | | | | 685,950,000 | | | | 8,081,836 | | | | | | | | 8/25/11 | | | | — | | | | (396,753 | ) |
Japanese Yen | | | BZWS | | | | Sell | | | | 337,439,000 | | | | 3,976,420 | | | | | | | | 8/25/11 | | | | — | | | | (194,448 | ) |
United States Dollar | | | CITI | | | | Buy | | | | 7,760,297 | | | | 6,137,727 | | | | EUR | | | | 8/25/11 | | | | — | | | | (442,135 | ) |
Euro | | | UBSW | | | | Sell | | | | 9,307,428 | | | | 11,777,806 | | | | | | | | 8/26/11 | | | | — | | | | (660,536 | ) |
Euro | | | HSBC | | | | Sell | | | | 8,279,000 | | | | 10,443,296 | | | | | | | | 8/26/11 | | | | — | | | | (620,666 | ) |
Japanese Yen | | | HSBC | | | | Sell | | | | 2,493,199,000 | | | | 29,825,345 | | | | | | | | 8/26/11 | | | | — | | | | (992,076 | ) |
Japanese Yen | | | UBSW | | | | Sell | | | | 937,086,000 | | | | 11,163,361 | | | | | | | | 8/26/11 | | | | — | | | | (419,579 | ) |
Japanese Yen | | | JPHQ | | | | Sell | | | | 751,903,000 | | | | 8,880,234 | | | | | | | | 8/26/11 | | | | — | | | | (413,734 | ) |
Swedish Krona | | | UBSW | | | | Buy | | | | 30,000,000 | | | | 3,154,541 | | | | EUR | | | | 8/26/11 | | | | 208,027 | | | | — | |
United States Dollar | | | UBSW | | | | Buy | | | | 16,993,151 | | | | 13,425,892 | | | | EUR | | | | 8/26/11 | | | | — | | | | (949,059 | ) |
United States Dollar | | | HSBC | | | | Buy | | | | 14,772,566 | | | | 11,710,875 | | | | EUR | | | | 8/26/11 | | | | — | | | | (877,715 | ) |
United States Dollar | | | JPHQ | | | | Buy | | | | 11,099,031 | | | | 8,794,794 | | | | EUR | | | | 8/26/11 | | | | — | | | | (654,233 | ) |
Euro | | | JPHQ | | | | Sell | | | | 4,095,317 | | | | 5,170,338 | | | | | | | | 8/29/11 | | | | — | | | | (302,514 | ) |
Euro | | | JPHQ | | | | Sell | | | | 2,095,000 | | | | 2,647,452 | | | | | | | | 8/29/11 | | | | — | | | | (152,240 | ) |
Malaysian Ringgit | | | JPHQ | | | | Buy | | | | 8,340,000 | | | | 2,611,555 | | | | | | | | 8/29/11 | | | | 53,801 | | | | — | |
Japanese Yen | | | BZWS | | | | Sell | | | | 890,300,000 | | | | 10,574,388 | | | | | | | | 8/30/11 | | | | — | | | | (431,082 | ) |
Indian Rupee | | | DBAB | | | | Buy | | | | 88,183,000 | | | | 1,811,855 | | | | | | | | 9/01/11 | | | | 80,035 | | | | — | |
Japanese Yen | | | JPHQ | | | | Sell | | | | 372,662,000 | | | | 4,392,527 | | | | | | | | 9/01/11 | | | | — | | | | (214,319 | ) |
Indian Rupee | | | DBAB | | | | Buy | | | | 25,000,000 | | | | 511,876 | | | | | | | | 9/27/11 | | | | 22,598 | | | | — | |
Japanese Yen | | | JPHQ | | | | Sell | | | | 172,207,000 | | | | 2,055,712 | | | | | | | | 9/30/11 | | | | — | | | | (74,314 | ) |
Philippine Peso | | | HSBC | | | | Buy | | | | 49,600,000 | | | | 1,097,709 | | | | | | | | 9/30/11 | | | | 32,998 | | | | — | |
Philippine Peso | | | HSBC | | | | Buy | | | | 39,700,000 | | | | 878,562 | | | | | | | | 10/03/11 | | | | 26,433 | | | | — | |
Philippine Peso | | | HSBC | | | | Buy | | | | 156,866,000 | | | | 3,480,806 | | | | | | | | 10/04/11 | | | | 95,049 | | | | — | |
Philippine Peso | | | DBAB | | | | Buy | | | | 195,560,000 | | | | 4,346,164 | | | | | | | | 10/04/11 | | | | 111,744 | | | | — | |
Euro | | | UBSW | | | | Sell | | | | 6,370,000 | | | | 8,714,670 | | | | | | | | 10/05/11 | | | | 203,665 | | | | — | |
Philippine Peso | | | HSBC | | | | Buy | | | | 233,867,000 | | | | 5,225,144 | | | | | | | | 10/05/11 | | | | 105,941 | | | | — | |
Philippine Peso | | | DBAB | | | | Buy | | | | 233,811,000 | | | | 5,220,977 | | | | | | | | 10/05/11 | | | | 108,832 | | | | — | |
Philippine Peso | | | JPHQ | | | | Buy | | | | 61,767,000 | | | | 1,379,836 | | | | | | | | 10/06/11 | | | | 28,151 | | | | — | |
Philippine Peso | | | DBAB | | | | Buy | | | | 191,936,000 | | | | 4,314,526 | | | | | | | | 10/07/11 | | | | 60,638 | | | | — | |
Philippine Peso | | | CITI | | | | Buy | | | | 76,826,000 | | | | 1,737,044 | | | | | | | | 10/11/11 | | | | 14,126 | | | | — | |
Philippine Peso | | | JPHQ | | | | Buy | | | | 76,627,000 | | | | 1,729,768 | | | | | | | | 10/11/11 | | | | 16,867 | | | | — | |
Philippine Peso | | | DBAB | | | | Buy | | | | 153,588,000 | | | | 3,468,642 | | | | | | | | 10/11/11 | | | | 32,241 | | | | — | |
Philippine Peso | | | HSBC | | | | Buy | | | | 153,878,000 | | | | 3,469,706 | | | | | | | | 10/11/11 | | | | 37,787 | | | | — | |
Malaysian Ringgit | | | DBAB | | | | Buy | | | | 11,434,805 | | | | 3,645,721 | | | | | | | | 10/12/11 | | | | 872 | | | | — | |
Philippine Peso | | | DBAB | | | | Buy | | | | 45,732,000 | | | | 1,037,807 | | | | | | | | 10/12/11 | | | | 4,597 | | | | — | |
Malaysian Ringgit | | | DBAB | | | | Buy | | | | 4,934,783 | | | | 1,573,040 | | | | | | | | 10/13/11 | | | | 619 | | | | — | |
Philippine Peso | | | HSBC | | | | Buy | | | | 76,252,000 | | | | 1,717,581 | | | | | | | | 10/13/11 | | | | 20,471 | | | | — | |
Philippine Peso | | | JPHQ | | | | Buy | | | | 194,374,000 | | | | 4,386,190 | | | | | | | | 10/13/11 | | | | 44,279 | | | | — | |
Euro | | | HSBC | | | | Sell | | | | 3,762,000 | | | | 5,229,932 | | | | | | | | 10/17/11 | | | | 203,850 | | | | — | |
Philippine Peso | | | JPHQ | | | | Buy | | | | 108,152,000 | | | | 2,463,767 | | | | | | | | 10/17/11 | | | | 1,298 | | | | — | |
Euro | | | HSBC | | | | Sell | | | | 3,753,000 | | | | 5,264,333 | | | | | | | | 10/18/11 | | | | 250,304 | | | | — | |
Norwegian Krone | | | BZWS | | | | Buy | | | | 30,824,000 | | | | 3,765,775 | | | | EUR | | | | 10/18/11 | | | | 183,025 | | | | — | |
Euro | | | HSBC | | | | Sell | | | | 5,054,000 | | | | 7,058,416 | | | | | | | | 10/19/11 | | | | 306,284 | | | | — | |
Norwegian Krone | | | BZWS | | | | Buy | | | | 30,949,000 | | | | 3,765,727 | | | | EUR | | | | 10/19/11 | | | | 203,969 | | | | — | |
Philippine Peso | | | DBAB | | | | Buy | | | | 41,880,000 | | | | 950,954 | | | | | | | | 10/19/11 | | | | 3,581 | | | | — | |
Philippine Peso | | | HSBC | | | | Buy | | | | 154,149,000 | | | | 3,493,699 | | | | | | | | 10/19/11 | | | | 19,686 | | | | — | |
Philippine Peso | | | DBAB | | | | Buy | | | | 167,411,000 | | | | 3,771,877 | | | | | | | | 10/21/11 | | | | 43,700 | | | | — | |
TGB-23
Franklin Templeton Variable Insurance Products Trust
Statement of Investments, December 31, 2010 (continued)
| | | | | | |
| Templeton Global Bond Securities Fund | | | | | | |
| | | | | | | | | | | | | | | | | | | | | | | | | | | | | | | | |
| Currency | | Counterparty | | | Type | | | Quantity | | | Contract
Amount* | | | | | | Settlement
Date | | | Unrealized
Appreciation | | | Unrealized
Depreciation | |
Philippine Peso | | | JPHQ | | | | Buy | | | | 84,061,000 | | | | 1,894,460 | | | | | | | | 10/21/11 | | | $ | 21,431 | | | $ | — | |
Chilean Peso | | | CITI | | | | Buy | | | | 921,291,798 | | | | 1,849,984 | | | | | | | | 10/25/11 | | | | 66,491 | | | | — | |
Indian Rupee | | | HSBC | | | | Buy | | | | 213,392,000 | | | | 4,601,941 | | | | | | | | 10/26/11 | | | | — | | | | (56,130 | ) |
Indian Rupee | | | DBAB | | | | Buy | | | | 208,500,000 | | | | 4,488,698 | | | | | | | | 10/26/11 | | | | — | | | | (47,099 | ) |
Philippine Peso | | | JPHQ | | | | Buy | | | | 82,631,000 | | | | 1,873,634 | | | | | | | | 10/26/11 | | | | 9,570 | | | | — | |
Philippine Peso | | | HSBC | | | | Buy | | | | 154,149,000 | | | | 3,489,745 | | | | | | | | 10/26/11 | | | | 23,392 | | | | — | |
Philippine Peso | | | DBAB | | | | Buy | | | | 165,158,000 | | | | 3,744,145 | | | | | | | | 10/26/11 | | | | 19,892 | | | | — | |
Indian Rupee | | | HSBC | | | | Buy | | | | 317,880,000 | | | | 6,876,055 | | | | | | | | 10/27/11 | | | | — | | | | (105,207 | ) |
Indian Rupee | | | DBAB | | | | Buy | | | | 440,314,000 | | | | 9,473,193 | | | | | | | | 10/27/11 | | | | — | | | | (94,500 | ) |
Norwegian Krone | | | BZWS | | | | Buy | | | | 61,766,000 | | | | 7,531,521 | | | | EUR | | | | 10/27/11 | | | | 381,291 | | | | — | |
Philippine Peso | | | HSBC | | | | Buy | | | | 40,030,000 | | | | 911,637 | | | | | | | | 10/27/11 | | | | 658 | | | | — | |
Chilean Peso | | | BZWS | | | | Buy | | | | 199,342,000 | | | | 393,568 | | | | | | | | 10/28/11 | | | | 20,982 | | | | — | |
Chilean Peso | | | DBAB | | | | Buy | | | | 398,486,000 | | | | 787,133 | | | | | | | | 10/28/11 | | | | 41,555 | | | | — | |
Philippine Peso | | | DBAB | | | | Buy | | | | 146,355,000 | | | | 3,332,312 | | | | | | | | 10/28/11 | | | | 3,128 | | | | — | |
Philippine Peso | | | HSBC | | | | Buy | | | | 26,680,000 | | | | 607,745 | | | | | | | | 10/28/11 | | | | 294 | | | | — | |
Philippine Peso | | | HSBC | | | | Buy | | | | 52,110,000 | | | | 1,185,126 | | | | | | | | 10/31/11 | | | | 2,428 | | | | — | |
Philippine Peso | | | DBAB | | | | Buy | | | | 26,150,000 | | | | 607,843 | | | | | | | | 11/04/11 | | | | — | | | | (11,925 | ) |
Norwegian Krone | | | UBSW | | | | Buy | | | | 47,173,200 | | | | 5,682,902 | | | | EUR | | | | 11/07/11 | | | | 379,245 | | | | — | |
Japanese Yen | | | CITI | | | | Sell | | | | 341,992,119 | | | | 4,230,534 | | | | | | | | 11/08/11 | | | | — | | | | (3,597 | ) |
Japanese Yen | | | BZWS | | | | Sell | | | | 335,950,000 | | | | 4,156,254 | | | | | | | | 11/10/11 | | | | — | | | | (3,274 | ) |
Japanese Yen | | | BZWS | | | | Sell | | | | 429,663,000 | | | | 5,357,394 | | | | | | | | 11/14/11 | | | | 37,048 | | | | — | |
Japanese Yen | | | UBSW | | | | Sell | | | | 340,600,700 | | | | 4,246,521 | | | | | | | | 11/14/11 | | | | 28,998 | | | | — | |
Philippine Peso | | | DBAB | | | | Buy | | | | 48,500,000 | | | | 1,126,545 | | | | | | | | 11/14/11 | | | | — | | | | (21,417 | ) |
Japanese Yen | | | DBAB | | | | Sell | | | | 796,770,000 | | | | 9,733,480 | | | | | | | | 11/16/11 | | | | — | | | | (133,088 | ) |
Japanese Yen | | | JPHQ | | | | Sell | | | | 397,873,000 | | | | 4,862,190 | | | | | | | | 11/16/11 | | | | — | | | | (64,754 | ) |
Euro | | | UBSW | | | | Sell | | | | 4,794,427 | | | | 6,494,531 | | | | | | | | 11/17/11 | | | | 90,277 | | | | — | |
Japanese Yen | | | BZWS | | | | Sell | | | | 986,239,000 | | | | 11,990,310 | | | | | | | | 11/17/11 | | | | — | | | | (222,791 | ) |
Japanese Yen | | | UBSW | | | | Sell | | | | 317,836,000 | | | | 3,860,044 | | | | | | | | 11/17/11 | | | | — | | | | (75,882 | ) |
Japanese Yen | | | HSBC | | | | Sell | | | | 207,909,000 | | | | 2,515,231 | | | | | | | | 11/17/11 | | | | — | | | | (59,412 | ) |
Euro | | | DBAB | | | | Sell | | | | 933,877 | | | | 1,259,295 | | | | | | | | 11/18/11 | | | | 11,857 | | | | — | |
Japanese Yen | | | BZWS | | | | Sell | | | | 1,107,834,000 | | | | 13,360,275 | | | | | | | | 11/21/11 | | | | — | | | | (359,942 | ) |
Norwegian Krone | | | MSCO | | | | Buy | | | | 15,002,870 | | | | 1,807,891 | | | | EUR | | | | 11/25/11 | | | | 117,622 | | | | — | |
Euro | | | DBAB | | | | Sell | | | | 1,300,570 | | | | 1,737,236 | | | | | | | | 11/28/11 | | | | 85 | | | | — | |
Japanese Yen | | | BOFA | | | | Sell | | | | 859,147,000 | | | | 10,376,172 | | | | | | | | 11/28/11 | | | | — | | | | (265,946 | ) |
Norwegian Krone | | | MSCO | | | | Buy | | | | 23,130,000 | | | | 2,781,921 | | | | EUR | | | | 11/28/11 | | | | 187,842 | | | | — | |
Norwegian Krone | | | UBSW | | | | Buy | | | | 75,812,000 | | | | 9,179,975 | | | | EUR | | | | 11/28/11 | | | | 533,116 | | | | — | |
Japanese Yen | | | BZWS | | | | Sell | | | | 1,251,786,000 | | | | 15,116,363 | | | | | | | | 11/29/11 | | | | — | | | | (389,693 | ) |
Japanese Yen | | | CITI | | | | Sell | | | | 310,702,000 | | | | 3,754,253 | | | | | | | | 11/29/11 | | | | — | | | | (94,458 | ) |
Japanese Yen | | | DBAB | | | | Sell | | | | 770,370,000 | | | | 9,205,042 | | | | | | | | 12/01/11 | | | | — | | | | (338,111 | ) |
Norwegian Krone | | | UBSW | | | | Buy | | | | 23,030,000 | | | | 2,791,515 | | | | EUR | | | | 12/01/11 | | | | 157,562 | | | | — | |
Euro | | | DBAB | | | | Sell | | | | 5,440,000 | | | | 7,078,800 | | | | | | | | 12/02/11 | | | | — | | | | (187,152 | ) |
Euro | | | HSBC | | | | Sell | | | | 2,155,292 | | | | 2,824,079 | | | | | | | | 12/06/11 | | | | — | | | | (54,576 | ) |
Euro | | | UBSW | | | | Sell | | | | 1,343,551 | | | | 1,789,315 | | | | | | | | 12/07/11 | | | | — | | | | (5,151 | ) |
Euro | | | BZWS | | | | Sell | | | | 5,095,000 | | | | 6,732,533 | | | | | | | | 12/12/11 | | | | — | | | | (72,220 | ) |
Malaysian Ringgit | | | JPHQ | | | | Buy | | | | 13,361,013 | | | | 4,220,289 | | | | | | | | 12/16/11 | | | | 30,296 | | | | — | |
Japanese Yen | | | CITI | | | | Sell | | | | 286,112,008 | | | | 3,445,887 | | | | | | | | 12/28/11 | | | | — | | | | (100,741 | ) |
Japanese Yen | | | BZWS | | | | Sell | | | | 285,057,504 | | | | 3,434,883 | | | | | | | | 12/28/11 | | | | — | | | | (98,674 | ) |
Japanese Yen | | | JPHQ | | | | Sell | | | | 285,510,329 | | | | 3,463,124 | | | | | | | | 12/28/11 | | | | — | | | | (76,046 | ) |
| | | | | | | | | | | | | | | | | | | | | | | | | | | | |
Unrealized appreciation (depreciation) | | | | | | | | | | | | | | | | 55,649,899 | | | | (34,141,144 | ) |
| | | | | | | | | | | | | | | | | | | | | | | | | | | | |
Net unrealized appreciation (depreciation) | | | | | | | | | | | | | | | $ | 21,508,755 | | | | | |
| | | | | | | | | | | | | | | | | | | | | | | | | | | | | | | | |
*In U.S. dollars unless otherwise indicated.
See Abbreviations on page TGB-37.
The accompanying notes are an integral part of these financial statements.
TGB-24
Franklin Templeton Variable Insurance Products Trust
Financial Statements
Statement of Assets and Liabilities
December 31, 2010
| | | | |
| | | Templeton
Global Bond
Securities Fund | |
Assets: | | | | |
Investments in securities: | | | | |
Cost - Unaffiliated issuers | | $ | 1,651,419,695 | |
Cost - Repurchase agreements | | | 202,257,044 | |
| | | | |
Total cost of investments | | $ | 1,853,676,739 | |
| | | | |
Value - Unaffiliated issuers | | $ | 1,843,332,626 | |
Value - Repurchase agreements | | | 202,257,044 | |
| | | | |
Total value of investments | | | 2,045,589,670 | |
Foreign currency, at value (cost $285,816) | | | 286,145 | |
Receivables: | | | | |
Capital shares sold | | | 1,407,061 | |
Interest | | | 30,760,236 | |
Due from brokers | | | 760,000 | |
Variation margin | | | 1,147 | |
Unrealized appreciation on forward exchange contracts | | | 55,649,899 | |
Other assets | | | 236 | |
| | | | |
Total assets | | | 2,134,454,394 | |
| | | | |
Liabilities: | | | | |
Payables: | | | | |
Capital shares redeemed | | | 704,820 | |
Affiliates | | | 1,573,906 | |
Unrealized depreciation on forward exchange contracts | | | 34,141,144 | |
Accrued expenses and other liabilities | | | 737,023 | |
| | | | |
Total liabilities | | | 37,156,893 | |
| | | | |
Net assets, at value | | $ | 2,097,297,501 | |
| | | | |
Net assets consist of: | | | | |
Paid-in capital | | $ | 1,766,423,338 | |
Undistributed net investment income | | | 102,069,075 | |
Net unrealized appreciation (depreciation) | | | 214,138,569 | |
Accumulated net realized gain (loss) | | | 14,666,519 | |
| | | | |
Net assets, at value | | $ | 2,097,297,501 | |
| | | | |
The accompanying notes are an integral part of these financial statements.
TGB-25
Franklin Templeton Variable Insurance Products Trust
Financial Statements (continued)
Statement of Assets and Liabilities (continued)
December 31, 2010
| | | | |
| | | Templeton
Global Bond
Securities Fund | |
Class 1: | | | | |
Net assets, at value | | $ | 272,232,359 | |
| | | | |
Shares outstanding | | | 13,653,460 | |
| | | | |
Net asset value and maximum offering price per share | | $ | 19.94 | |
| | | | |
Class 2: | | | | |
Net assets, at value | | $ | 1,490,793,794 | |
| | | | |
Shares outstanding | | | 76,503,327 | |
| | | | |
Net asset value and maximum offering price per share | | $ | 19.49 | |
| | | | |
Class 3: | | | | |
Net assets, at value | | $ | 183,379,958 | |
| | | | |
Shares outstanding | | | 9,413,166 | |
| | | | |
Net asset value and maximum offering price per sharea | | $ | 19.48 | |
| | | | |
Class 4: | | | | |
Net assets, at value | | $ | 150,891,390 | |
| | | | |
Shares outstanding | | | 7,628,434 | |
| | | | |
Net asset value and maximum offering price per share | | $ | 19.78 | |
| | | | |
aRedemption price is equal to net asset value less redemption fees retained by the Fund.
The accompanying notes are an integral part of these financial statements.
TGB-26
Franklin Templeton Variable Insurance Products Trust
Financial Statements (continued)
Statement of Operations
for the year ended December 31, 2010
| | | | |
| | | Templeton
Global Bond
Securities Fund | |
Investment income: | | | | |
Interest (net of foreign taxes $1,720,413) | | $ | 107,781,185 | |
| | | | |
Expenses: | | | | |
Management fees (Note 3a) | | | 8,580,430 | |
Distribution fees: (Note 3c) | | | | |
Class 2 | | | 3,297,025 | |
Class 3 | | | 398,370 | |
Class 4 | | | 465,578 | |
Unaffiliated transfer agent fees | | | 2,199 | |
Custodian fees (Note 4) | | | 1,089,734 | |
Reports to shareholders | | | 413,669 | |
Professional fees | | | 69,959 | |
Trustees’ fees and expenses | | | 7,999 | |
Other | | | 45,625 | |
| | | | |
Total expenses | | | 14,370,588 | |
Expense reductions (Note 4) | | | (5,004 | ) |
| | | | |
Net expenses | | | 14,365,584 | |
| | | | |
Net investment income | | | 93,415,601 | |
| | | | |
Realized and unrealized gains (losses): | | | | |
Net realized gain (loss) from: | | | | |
Investments | | | 15,041,336 | |
Foreign currency transactions | | | 10,659,124 | |
Futures contracts | | | (9,179 | ) |
Swap contracts | | | 1,034,692 | |
| | | | |
Net realized gain (loss) | | | 26,725,973 | |
| | | | |
Net change in unrealized appreciation (depreciation) on: | | | | |
Investments | | | 96,323,232 | |
Translation of other assets and liabilities denominated in foreign currencies | | | 26,700,490 | |
| | | | |
Net change in unrealized appreciation (depreciation) | | | 123,023,722 | |
| | | | |
Net realized and unrealized gain (loss) | | | 149,749,695 | |
| | | | |
Net increase (decrease) in net assets resulting from operations | | $ | 243,165,296 | |
| | | | |
The accompanying notes are an integral part of these financial statements.
TGB-27
Franklin Templeton Variable Insurance Products Trust
Financial Statements (continued)
Statements of Changes in Net Assets
| | | | | | | | |
| | | Templeton Global Bond
Securities Fund | |
| | | Year Ended December 31, | |
| | | 2010 | | | 2009 | |
| | | | |
Increase (decrease) in net assets: | | | | | | | | |
Operations: | | | | | | | | |
Net investment income | | $ | 93,415,601 | | | $ | 76,847,189 | |
Net realized gain (loss) from investments, foreign currency transactions, futures contracts and swap contracts | | | 26,725,973 | | | | 63,328,021 | |
Net change in unrealized appreciation (depreciation) on investments and translation of other assets and liabilities denominated in foreign currencies | | | 123,023,722 | | | | 99,438,346 | |
| | | | |
Net increase (decrease) in net assets resulting from operations | | | 243,165,296 | | | | 239,613,556 | |
| | | | |
Distributions to shareholders from: | | | | | | | | |
Net investment income and net foreign currency gains: | | | | | | | | |
Class 1 | | | (3,860,853 | ) | | | (23,763,176 | ) |
Class 2 | | | (17,334,382 | ) | | | (139,472,843 | ) |
Class 3 | | | (2,167,994 | ) | | | (18,449,432 | ) |
Class 4 | | | (1,885,595 | ) | | | (10,152,433 | ) |
Net realized gains: | | | | | | | | |
Class 1 | | | (610,541 | ) | | | — | |
Class 2 | | | (3,135,836 | ) | | | — | |
Class 3 | | | (394,847 | ) | | | — | |
Class 4 | | | (338,834 | ) | | | — | |
| | | | |
Total distributions to shareholders | | | (29,728,882 | ) | | | (191,837,884 | ) |
| | | | |
Capital share transactions: (Note 2) | | | | | | | | |
Class 1 | | | 48,911,860 | | | | (33,006,590 | ) |
Class 2 | | | 75,615,219 | | | | 435,496,396 | |
Class 3 | | | 21,722,929 | | | | 11,495,009 | |
Class 4 | | | 26,968,281 | | | | 63,139,007 | |
| | | | |
Total capital share transactions | | | 173,218,289 | | | | 477,123,822 | |
| | | | |
Redemption fees | | | 23,708 | | | | 26,899 | |
| | | | |
Net increase (decrease) in net assets | | | 386,678,411 | | | | 524,926,393 | |
Net assets: | | | | | | | | |
Beginning of year | | | 1,710,619,090 | | | | 1,185,692,697 | |
| | | | |
End of year | | $ | 2,097,297,501 | | | $ | 1,710,619,090 | |
| | | | |
Undistributed net investment income included in net assets: | | | | | | | | |
End of year | | $ | 102,069,075 | | | $ | 24,514,511 | |
| | | | |
The accompanying notes are an integral part of these financial statements.
TGB-28
Franklin Templeton Variable Insurance Products Trust
Notes to Financial Statements
Templeton Global Bond Securities Fund
1. ORGANIZATION AND SIGNIFICANT ACCOUNTING POLICIES
Franklin Templeton Variable Insurance Products Trust (Trust) is registered under the Investment Company Act of 1940, as amended, (1940 Act) as an open-end investment company, consisting of twenty separate funds. The Templeton Global Bond Securities Fund (Fund) is included in this report. The financial statements of the remaining funds in the Trust are presented separately. Shares of the Fund are generally sold only to insurance company separate accounts to fund the benefits of variable life insurance policies or variable annuity contracts The Fund offers four classes of shares: Class 1, Class 2, Class 3, and Class 4. Each class of shares differs by its distribution fees, voting rights on matters affecting a single class and its exchange privilege.
The following summarizes the Fund’s significant accounting policies.
a. Financial Instrument Valuation
The Fund values its investments in securities and other assets and liabilities carried at fair value daily. Fair value is the price that would be received to sell an asset or paid to transfer a liability in an orderly transaction between market participants on the measurement date. Under procedures approved by the Trust’s Board of Trustees, the Fund may utilize independent pricing services, quotations from securities and financial instrument dealers, and other market sources to determine fair value.
Debt securities generally trade in the over-the-counter market rather than on a securities exchange. The Fund’s pricing services use multiple valuation techniques to determine fair value. In instances where sufficient market activity exists, the pricing services may utilize a market-based approach through which quotes from market makers are used to determine fair value. In instances where sufficient market activity may not exist or is limited, the pricing services also utilize proprietary valuation models which may consider market characteristics such as benchmark yield curves, option-adjusted spreads, credit spreads, estimated default rates, coupon rates, anticipated timing of principal repayments, underlying collateral, and other unique security features in order to estimate the relevant cash flows, which are then discounted to calculate the fair value. Securities denominated in a foreign currency are converted into their U.S. dollar equivalent at the foreign exchange rate in effect at the close of the NYSE on the date that the values of the foreign debt securities are determined. Repurchase agreements are valued at cost, which approximates market value.
Certain derivative financial instruments trade in the over-the-counter market. The Fund’s pricing services use various techniques including industry standard option pricing models and proprietary discounted cash flow models to determine the fair value of those instruments. The Fund’s net benefit or obligation under the derivative contract, as measured by the fair market value of the contract, is included in net assets.
The Fund has procedures to determine the fair value of securities and other financial instruments for which market prices are not readily available or which may not be reliably priced. Under these procedures, the Fund primarily employs a market-based approach which may use related or comparable assets or liabilities, recent transactions, market multiples, book values, and other relevant information for the investment to determine the fair value of the investment. The Fund may also use an income-based valuation approach in which the anticipated future cash flows of the investment are discounted to calculate fair value. Discounts may also be applied due to the nature or duration of any restrictions on the disposition of the investments. Due to the inherent uncertainty of valuations of such investments, the fair values may differ significantly from the values that would have been used had an active market existed.
Trading in securities on foreign exchanges and over-the-counter markets may be completed before the daily close of business on the NYSE. Occasionally, events occur between the time at which trading in a foreign security is completed and the close of the NYSE that might call into question the reliability of the value of a portfolio security held by the Fund. As a result, differences may arise between the value of the Fund’s portfolio securities as determined at the foreign market close and the latest indications of value at the close of the NYSE. In order to minimize the potential for these differences, the investment manager monitors price movements following the close of trading in foreign stock markets through a series of country specific market proxies (such as baskets of American Depository Receipts, futures contracts and exchange traded funds). These price movements are measured against established trigger thresholds for each specific market proxy to assist in determining if an event has occurred that may call into question the reliability of the values of the foreign securities held by the Fund. If such an event occurs, the securities may be valued using fair value procedures, which may include the use of independent pricing services.
TGB-29
Franklin Templeton Variable Insurance Products Trust
Notes to Financial Statements (continued)
Templeton Global Bond Securities Fund
1. ORGANIZATION AND SIGNIFICANT ACCOUNTING POLICIES (continued)
b. Foreign Currency Translation
Portfolio securities and other assets and liabilities denominated in foreign currencies are translated into U.S. dollars based on the exchange rate of such currencies against U.S. dollars on the date of valuation. The Fund may enter into foreign currency exchange contracts to facilitate transactions denominated in a foreign currency. Purchases and sales of securities, income and expense items denominated in foreign currencies are translated into U.S. dollars at the exchange rate in effect on the transaction date. Portfolio securities and assets and liabilities denominated in foreign currencies contain risks that those currencies will decline in value relative to the U.S. dollar. Occasionally, events may impact the availability or reliability of foreign exchange rates used to convert the U.S. dollar equivalent value. If such an event occurs, the foreign exchange rate will be valued at fair value using procedures established and approved by the Trust’s Board of Trustees.
The Fund does not separately report the effect of changes in foreign exchange rates from changes in market prices on securities held. Such changes are included in net realized and unrealized gain or loss from investments on the Statement of Operations.
Realized foreign exchange gains or losses arise from sales of foreign currencies, currency gains or losses realized between the trade and settlement dates on securities transactions and the difference between the recorded amounts of dividends, interest, and foreign withholding taxes and the U.S. dollar equivalent of the amounts actually received or paid. Net unrealized foreign exchange gains and losses arise from changes in foreign exchange rates on foreign denominated assets and liabilities other than investments in securities held at the end of the reporting period.
c. Joint Repurchase Agreement
The Fund may enter into a joint repurchase agreement whereby its uninvested cash balance is deposited into a joint cash account with other funds managed by the investment manager or an affiliate of the investment manager and is used to invest in one or more repurchase agreements. The value and face amount of the joint repurchase agreement are allocated to the funds based on their pro-rata interest. A repurchase agreement is accounted for as a loan by the fund to the seller, collateralized by securities which are delivered to the fund’s custodian. The market value, including accrued interest, of the initial collateralization is required to be at least 102% of the dollar amount invested by the funds, with the value of the underlying securities marked to market daily to maintain coverage of at least 100%. The joint repurchase agreement held by the Fund at year end had been entered into on December 31, 2010.
d. Derivative Financial Instruments
The Fund invested in derivative financial instruments (derivatives) in order to manage risk or gain exposure to various other investments or markets. Derivatives are financial contracts based on an underlying or notional amount, require no initial investment or an initial net investment that is smaller than would normally be required to have a similar response to changes in market factors, and require or permit net settlement. Derivatives contain various risks including the potential inability of the counterparty to fulfill their obligations under the terms of the contract, the potential for an illiquid secondary market, and/or the potential for market movements which expose the Fund to gains or losses in excess of the amounts shown on the Statement of Assets and Liabilities. Realized gain and loss and unrealized appreciation and depreciation on these contracts for the period are included in the Statement of Operations.
The Fund entered into futures contracts primarily to manage interest rate and/or foreign exchange rate risk. A futures contract is an agreement between the Fund and a counterparty to buy or sell a security for a specific price on a future date. Required initial margin deposits of cash or securities are pledged by the Fund. Subsequent payments, known as variation margin, are made or received by the Fund, depending on fluctuations in the value of the underlying security. Such variation margin is accounted for as unrealized appreciation or depreciation until the contract is closed, at which time the gains or losses are realized.
TGB-30
Franklin Templeton Variable Insurance Products Trust
Notes to Financial Statements (continued)
Templeton Global Bond Securities Fund
1. ORGANIZATION AND SIGNIFICANT ACCOUNTING POLICIES (continued)
d. Derivative Financial Instruments (continued)
The Fund entered into forward exchange contracts primarily to manage and/or gain exposure to certain foreign currencies. A forward exchange contract is an agreement between the Fund and a counterparty to buy or sell a foreign currency for a specific exchange rate on a future date. Pursuant to the terms of the forward exchange contracts, cash or securities may be required to be deposited as collateral. Unrestricted cash may be invested according to the Fund’s investment objectives.
The Fund entered into interest rate swap contracts primarily to manage interest rate risk. An interest rate swap is an agreement between the Fund and a counterparty to exchange cash flows based on the difference between two interest rates, applied to a notional principal amount. Over the term of the contract, contractually required payments to be paid and to be received are accrued daily and recorded as unrealized depreciation and appreciation until the payments are made, at which time they are realized. Pursuant to the terms of the interest rate swap contract, cash or securities may be required to be deposited as collateral. Unrestricted cash may be invested according to the Fund’s investment objectives.
See Note 9 regarding other derivative information.
e. Income Taxes
It is the Fund’s policy to qualify as a regulated investment company under the Internal Revenue Code. The Fund intends to distribute to shareholders substantially all of its taxable income and net realized gains to relieve it from federal income and excise taxes. As a result, no provision for U.S. federal income taxes is required. The Fund files U.S. income tax returns as well as tax returns in certain other jurisdictions. The Fund’s application of those tax rules is subject to its understanding. The Fund records a provision for taxes in its financial statements including penalties and interest, if any, for a tax position taken on a tax return (or expected to be taken) when it fails to meet the more likely than not (a greater than 50% probability) threshold and based on the technical merits, the tax position may not be sustained upon examination by the tax authorities. As of December 31, 2010, and for all open tax years, the Fund has determined that no provision for income tax is required in the Fund’s financial statements. Open tax years are those that remain subject to examination and are based on each tax jurisdiction statute of limitation. The Fund is not aware of any tax position for which it is reasonably possible that the total amounts of unrecognized tax effects will significantly change in the next twelve months.
The Fund may be subject to foreign taxation related to income received, capital gains on the sale of securities and certain foreign currency transactions in the foreign jurisdictions in which it invests. Foreign taxes, if any, are recorded based on the tax regulations and rates that exist in the foreign markets in which the Fund invests. When a capital gain tax is determined to apply the Fund records an estimated deferred tax liability for unrealized gains on these securities in an amount that would be payable if the securities were disposed of on the valuation date.
f. Security Transactions, Investment Income, Expenses and Distributions
Security transactions are accounted for on trade date. Realized gains and losses on security transactions are determined on a specific identification basis. Interest income and estimated expenses are accrued daily. Amortization of premium and accretion of discount on debt securities are included in interest income. Distributions to shareholders are recorded on the ex-dividend date and are determined according to income tax regulations (tax basis). Distributable earnings determined on a tax basis may differ from earnings recorded in accordance with accounting principles generally accepted in the United States of America. These differences may be permanent or temporary. Permanent differences are reclassified among capital accounts to reflect their tax character. These reclassifications have no impact on net assets or the results of operations. Temporary differences are not reclassified, as they may reverse in subsequent periods.
TGB-31
Franklin Templeton Variable Insurance Products Trust
Notes to Financial Statements (continued)
Templeton Global Bond Securities Fund
1. ORGANIZATION AND SIGNIFICANT ACCOUNTING POLICIES (continued)
f. Security Transactions, Investment Income, Expenses and Distributions (continued)
Common expenses incurred by the Trust are allocated among the funds based on the ratio of net assets of each fund to the combined net assets of the Trust. Fund specific expenses are charged directly to the fund that incurred the expense.
Realized and unrealized gains and losses and net investment income, not including class specific expenses, are allocated daily to each class of shares based upon the relative proportion of net assets of each class. Differences in per share distributions, by class, are generally due to differences in class specific expenses.
Inflation-indexed bonds are adjusted for inflation through periodic increases or decreases in the security’s interest accruals, face amount, or principal redemption value, by amounts corresponding to the rate of inflation as measured by an index. Any increase or decrease in the face amount or principal redemption value will be included as interest income on the Statement of Operations.
g. Accounting Estimates
The preparation of financial statements in accordance with accounting principles generally accepted in the United States of America requires management to make estimates and assumptions that affect the reported amounts of assets and liabilities at the date of the financial statements and the amounts of income and expenses during the reporting period. Actual results could differ from those estimates.
h. Redemption Fees
Redemptions and exchanges of interests in an insurance company subaccount that invests in Class 3 shares of the Fund will be subject to a 1.0% short term trading fee if the interest in the subaccount has been held for less than 60 days. Such fees are retained by the Fund and accounted for as an addition to paid-in capital, allocated to each class of shares based upon the relative proportion of net assets of each class.
i. Guarantees and Indemnifications
Under the Trust’s organizational documents, its officers and trustees are indemnified by the Trust against certain liabilities arising out of the performance of their duties to the Trust. Additionally, in the normal course of business, the Trust, on behalf of the Fund, enters into contracts with service providers that contain general indemnification clauses. The Trust’s maximum exposure under these arrangements is unknown as this would involve future claims that may be made against the Trust that have not yet occurred. Currently, the Trust expects the risk of loss to be remote.
2. SHARES OF BENEFICIAL INTEREST
At December 31, 2010, there were an unlimited number of shares authorized (without par value). Transactions in the Fund’s shares were as follows:
| | | | | | | | | | | | | | | | |
| | | Year Ended December 31, | |
| | | 2010 | | | 2009 | |
| Class 1 Shares: | | Shares | | | Amount | | | Shares | | | Amount | |
Shares sold | | | 4,522,323 | | | $ | 85,300,049 | | | | 2,951,874 | | | $ | 50,898,302 | |
Shares issued in reinvestment of distributions | | | 243,806 | | | | 4,471,394 | | | | 1,490,789 | | | | 23,763,176 | |
Shares redeemed | | | (2,152,653 | ) | | | (40,859,583 | ) | | | (6,068,722 | ) | | | (107,668,068 | ) |
| | | | |
Net increase (decrease) | | | 2,613,476 | | | $ | 48,911,860 | | | | (1,626,059 | ) | | $ | (33,006,590 | ) |
| | | | |
TGB-32
Franklin Templeton Variable Insurance Products Trust
Notes to Financial Statements (continued)
Templeton Global Bond Securities Fund
2. SHARES OF BENEFICIAL INTEREST (continued)
| | | | | | | | | | | | | | | | |
| | | Year Ended December 31, | |
| | | 2010 | | | 2009 | |
| Class 2 Shares: | | Shares | | | Amount | | | Shares | | | Amount | |
Shares sold | | | 23,116,184 | | | $ | 432,400,311 | | | | 24,341,548 | | | $ | 411,300,147 | |
Shares issued in reinvestment of distributions | | | 1,140,402 | | | | 20,470,218 | | | | 8,934,839 | | | | 139,472,843 | |
Shares redeemed | | | (20,598,509 | ) | | | (377,255,310 | ) | | | (6,858,618 | ) | | | (115,276,594 | ) |
| | | | |
Net increase (decrease) | | | 3,658,077 | | | $ | 75,615,219 | | | | 26,417,769 | | | $ | 435,496,396 | |
| | | | |
Class 3 Shares: | | | | | | | | | | | | | | | | |
Shares sold | | | 2,390,123 | | | $ | 44,722,862 | | | | 1,901,513 | | | $ | 32,238,548 | |
Shares issued in reinvestment of distributions | | | 142,856 | | | | 2,562,841 | | | | 1,182,656 | | | | 18,449,432 | |
Shares redeemed | | | (1,387,144 | ) | | | (25,562,774 | ) | | | (2,318,382 | ) | | | (39,192,971 | ) |
| | | | |
Net increase (decrease) | | | 1,145,835 | | | $ | 21,722,929 | | | | 765,787 | | | $ | 11,495,009 | |
| | | | |
Class 4 Shares: | | | | | | | | | | | | | | | | |
Shares sold | | | 1,871,353 | | | $ | 34,938,015 | | | | 3,243,291 | | | $ | 56,014,173 | |
Shares issued on reinvestment of distributions | | | 122,020 | | | | 2,224,429 | | | | 639,725 | | | | 10,152,433 | |
Shares redeemed | | | (549,061 | ) | | | (10,194,163 | ) | | | (178,649 | ) | | | (3,027,599 | ) |
| | | | |
Net increase (decrease) | | | 1,444,312 | | | $ | 26,968,281 | | | | 3,704,367 | | | $ | 63,139,007 | |
| | | | |
3. TRANSACTIONS WITH AFFILIATES
Franklin Resources, Inc. is the holding company for various subsidiaries that together are referred to as Franklin Templeton Investments. Certain officers and trustees of the Fund are also officers and/or directors of the following subsidiaries:
| | |
| Subsidiary | | Affiliation |
Franklin Advisers, Inc. (Advisers) | | Investment manager |
Franklin Templeton Services, LLC (FT Services) | | Administrative manager |
Franklin Templeton Distributors, Inc. (Distributors) | | Principal underwriter |
Franklin Templeton Investor Services, LLC (Investor Services) | | Transfer agent |
a. Management Fees
The Fund pays an investment management fee to Advisers based on the average daily net assets of the Fund as follows:
| | |
| Annualized Fee Rate | | Net Assets |
| 0.625% | | Up to and including $100 million |
| 0.500% | | Over $100 million, up to and including $250 million |
| 0.450% | | Over $250 million, up to and including $7.5 billion |
| 0.440% | | Over $7.5 billion, up to and including $10 billion |
| 0.430% | | Over $10 billion, up to and including $12.5 billion |
| 0.420% | | Over $12.5 billion, up to and including $15 billion |
| 0.400% | | In excess of $15 billion |
b. Administrative Fees
Under an agreement with Advisers, FT Services provides administrative services to the Fund. The fee is paid by Advisers based on average daily net assets, and is not an additional expense of the Fund.
TGB-33
Franklin Templeton Variable Insurance Products Trust
Notes to Financial Statements (continued)
Templeton Global Bond Securities Fund
3. TRANSACTIONS WITH AFFILIATES (contiued)
c. Distribution Fees
The Trust’s Board of Trustees has adopted distribution plans for Class 2, Class 3, and Class 4 shares pursuant to Rule 12b-1 under the 1940 Act. Under the Fund’s compensation distribution plans, the Fund pays Distributors for costs incurred in connection with the servicing, sale and distribution of the Fund’s shares up to 0.25%, 0.35%, and 0.35% per year of its average daily net assets of Class 2, Class 3, and Class 4, respectively. The Board of Trustees has agreed to limit the current rate to 0.25% per year for Class 3.
d. Transfer Agent Fees
Investor Services, under terms of an agreement, performs shareholder servicing for the Fund and is not paid by the Fund for the services.
4. EXPENSE OFFSET ARRANGEMENT
The Fund has entered into an arrangement with its custodian whereby credits realized as a result of uninvested cash balances are used to reduce a portion of the Fund’s custodian expenses. During the year ended December 31, 2010, the custodian fees were reduced as noted in the Statement of Operations.
5. INCOME TAXES
For tax purposes, realized capital losses occurring subsequent to October 31 may be deferred and treated as occurring on the first day of the following fiscal year. At December 31, 2010, the Fund deferred realized capital losses of $1,905,817.
The tax character of distributions paid during the years ended December 31, 2010 and 2009, was as follows:
| | | | | | | | |
| | | 2010 | | | 2009 | |
Distributions paid from: | | | | | | | | |
Ordinary income | | $ | 25,248,824 | | | $ | 191,837,884 | |
Long term capital gain | | | 4,480,058 | | | | — | |
| | | | | | | |
| | $ | 29,728,882 | | | $ | 191,837,884 | |
| | | | | | | |
At December 31, 2010, the cost of investments, net unrealized appreciation (depreciation), undistributed ordinary income and undistributed long term capital gains for income tax purposes were as follows:
| | | | |
Cost of investments | | $ | 1,872,391,708 | |
| | | | |
| |
Unrealized appreciation | | $ | 197,383,981 | |
Unrealized depreciation | | | (24,186,019 | ) |
| | | | |
Net unrealized appreciation (depreciation) | | $ | 173,197,962 | |
| | | | |
Undistributed ordinary income | | $ | 130,755,962 | |
Undistributed long term capital gains | | | 13,176,639 | |
| | | | |
Distributable earnings | | $ | 143,932,601 | |
| | | | |
TGB-34
Franklin Templeton Variable Insurance Products Trust
Notes to Financial Statements (continued)
Templeton Global Bond Securities Fund
5. INCOME TAXES (continued)
Net investment income differs for financial statement and tax purposes primarily due to differing treatments of foreign currency transactions, bond discounts and premiums, interest rate swaps, tax straddles, and inflation related adjustments on foreign securities.
Net realized gains (losses) differ for financial statement and tax purposes primarily due to differing treatments of foreign currency transactions, financial futures transactions, bond discounts and premiums, interest rate swaps, tax straddles, and inflation related adjustments on foreign securities.
6. INVESTMENT TRANSACTIONS
Purchases and sales of investments (excluding short term securities) for the year ended December 31, 2010, aggregated $143,386,820 and $208,264,205, respectively.
7. CREDIT RISK
At December 31, 2010, the Fund had 14.49% of its portfolio invested in high yield or other securities rated below investment grade. These securities may be more sensitive to economic conditions causing greater price volatility and are potentially subject to a greater risk of loss due to default than higher rated securities.
8. CONCENTRATION OF RISK
Investing in foreign securities may include certain risks and considerations not typically associated with investing in U.S. securities, such as fluctuating currency values and changing local and regional economic, political and social conditions, which may result in greater market volatility. In addition, certain foreign securities may not be as liquid as U.S. securities.
9. OTHER DERIVATIVE INFORMATION
At December 31, 2010, the Fund has invested in derivative contracts which are reflected on the Statement of Assets and Liabilities as follows:
| | | | | | | | | | | | |
| | | Asset Derivatives | | | Liability Derivatives | |
Derivative Contracts Not Accounted
for as Hedging Instruments | | Statement of Assets and
Liabilities Location | | Fair
Value
Amount | | | Statement of Assets and
Liabilities Location | | Fair
Value
Amount | |
Interest rate contracts | | Variation margin / Net assets consist of - net unrealized appreciation (depreciation) | | $ | 3,052a | | | Variation margin / Net assets consist of - net unrealized appreciation (depreciation) | | $ | —a | |
Foreign exchange contracts | | Unrealized appreciation on forward exchange contracts | | | 55,649,899 | | | Unrealized depreciation on forward exchange contracts | | | 34,141,144 | |
a Includes cumulative appreciation (depreciation) of futures contracts as reported in the Statement of Investments. Only current day’s variation margin is reported within the Statement of Assets and Liabilities.
TGB-35
Franklin Templeton Variable Insurance Products Trust
Notes to Financial Statements (continued)
Templeton Global Bond Securities Fund
9. OTHER DERIVATIVE INFORMATION (continued)
For the period ended December 31, 2010, the effect of derivative contracts on the Fund’s Statement of Operations was as follows:
| | | | | | | | | | | | | | |
Derivative Contracts Not Accounted
for as Hedging Instruments | | Statement of Operations Locations | | Realized Gain
(Loss) for the
Year | | | Change in
Unrealized
Appreciation
(Depreciation)
for the Year | | | Average
Amount
Outstanding
During the
Yeara | |
Interest rate contracts | | Net realized gain (loss) from futures and swap contracts / Net change in unrealized appreciation (depreciation) on investments | | $ | 1,025,513 | | | $ | (931,474 | ) | | | 580,921 | |
Foreign exchange contracts | | Net realized gain (loss) from foreign currency transactions / Net change in unrealized appreciation (depreciation) on translation of other assets and liabilities denominated in foreign currencies | | | 11,035,722 | | | | 26,207,815 | | | | 1,702,469,755 | |
aRepresents the average notional amount for other derivative contracts outstanding during the period. For derivative contracts denominated in foreign currencies, notional amounts are converted into U.S. dollars.
See Note 1(d) regarding derivative financial instruments.
10. CREDIT FACILITY
The Fund, together with other U.S. registered and foreign investment funds (collectively “Borrowers”), managed by Franklin Templeton Investments, are borrowers in a joint syndicated senior unsecured credit facility totaling $750 million (Global Credit Facility) which matures on January 21, 2011. This Global Credit Facility provides a source of funds to the Borrowers for temporary and emergency purposes, including the ability to meet future unanticipated or unusually large redemption requests.
Under the terms of the Global Credit Facility, the Fund shall, in addition to interest charged on any borrowings made by the Fund and other costs incurred by the Fund, pay its share of fees and expenses incurred in connection with the implementation and maintenance of the Global Credit Facility, based upon its relative share of the aggregate net assets of all of the Borrowers, including an annual commitment fee of 0.10% based upon the unused portion of the Global Credit Facility, which is reflected in other expenses on the Statement of Operations. During the year ended December 31, 2010, the Fund did not use the Global Credit Facility.
Effective January 21, 2011, the Borrowers renewed the Global Credit Facility for a total of $750 million, maturing January 20, 2012.
11. FAIR VALUE MEASUREMENTS
The Fund follows a fair value hierarchy that distinguishes between market data obtained from independent sources (observable inputs) and the Fund’s own market assumptions (unobservable inputs). These inputs are used in determining the value of the Fund’s investments and are summarized in the following fair value hierarchy:
| | • | | Level 1 – quoted prices in active markets for identical securities |
| | • | | Level 2 – other significant observable inputs (including quoted prices for similar securities, interest rates, prepayment speed, credit risk, etc.) |
| | • | | Level 3 – significant unobservable inputs (including the Fund’s own assumptions in determining the fair value of investments) |
TGB-36
Franklin Templeton Variable Insurance Products Trust
Notes to Financial Statements (continued)
Templeton Global Bond Securities Fund
11. FAIR VALUE MEASUREMENTS (continued)
The inputs or methodology used for valuing securities are not an indication of the risk associated with investing in those securities.
For movements between the levels within the fair value hierarchy, the Fund has adopted a policy of recognizing the transfers as of the date of the underlying event which caused the movement.
The following is a summary of the inputs used as of December 31, 2010, in valuing the Fund’s assets and liabilities carried at fair value:
| | | | | | | | | | | | | | | | |
| | | Level 1 | | | Level 2 | | | Level 3 | | | Total | |
| | | | |
Assets: | | | | | | | | | | | | | | | | |
Investments in Securities: | | | | | | | | | | | | | | | | |
Foreign Government and Agency Securities | | $ | — | | | $ | 1,657,735,605 | | | $ | — | | | $ | 1,657,735,605 | |
Municipal Bonds | | | — | | | | 33,827,849 | | | | — | | | | 33,827,849 | |
Short Term Investments | | | — | | | | 354,026,216 | | | | — | | | | 354,026,216 | |
| | | | |
Total Investments in Securities | | $ | — | | | $ | 2,045,589,670 | | | $ | — | | | $ | 2,045,589,670 | |
| | | | |
Forward Exchange Contracts | | | — | | | | 55,649,899 | | | | — | | | | 55,649,899 | |
Futures Contracts | | | 3,052 | | | | — | | | | — | | | | 3,052 | |
Liabilities: | | | | | | | | | | | | | | | | |
Forward Exchange Contracts | | | — | | | | 34,141,144 | | | | — | | | | 34,141,144 | |
12. SUBSEQUENT EVENTS
The Fund has evaluated subsequent events through the issuance of the financial statements and determined that no events have occurred that require disclosure other than those already disclosed in the financial statements.
| | | | |
ABBREVIATIONS | | | | |
| Counterparty | | Currency | | Selected Portfolio |
| | | | |
| BOFA - Bank of America Corp | | AUD - Australian Dollar | | BHAC - Berkshire Hathaway Assurance Corp. |
| BZWS - Barclays Bank PLC | | BRL - Brazilian Real | | FRN - Floating Rate Note |
| CITI - Citigroup, Inc. | | EGP - Egyptian Pound | | GO - General Obligation |
| DBAB - Deutsche Bank AG | | EUR - Euro | | USD - Unified/Union School District |
| FBCO - Credit Suisse Group AG | | IDR - Indonesian Rupiah | | |
| HSBC - HSBC Bank USA, N.A. | | ILS - New Israeli Shekel | | |
| JPHQ - JP Morgan Chase & Co. | | KRW - South Korean Won | | |
| MLCO - Merrill Lynch & Co., Inc. | | LKR - Sri Lankan Rupee | | |
| MSCO - Morgan Stanley | | MXN - Mexican Peso | | |
| UBSW - UBS AG | | MYR - Malaysian Ringgit | | |
| | NOK - Norwegian Krone | | |
| | NZD - New Zealand Dollar | | |
| | PEN - Peruvian Nuevo Sol | | |
| | PHP - Philippine Peso | | |
| | PLN - Polish Zloty | | |
| | SEK - Swedish Krona | | |
TGB-37
Franklin Templeton Variable Insurance Products Trust
Templeton Global Bond Securities Fund
Report of Independent Registered Public Accounting Firm
To the Board of Trustees and Shareholders of Franklin Templeton Variable Insurance Products Trust
In our opinion, the accompanying statement of assets and liabilities, including the statement of investments, and the related statements of operations and of changes in net assets and the financial highlights present fairly, in all material respects, the financial position of Templeton Global Bond Securities Fund (the “Fund”) at December 31, 2010, the results of its operations for the year then ended, the changes in its net assets for each of the two years in the period then ended and the financial highlights for each of the periods presented, in conformity with accounting principles generally accepted in the United States of America. These financial statements and financial highlights (hereafter referred to as “financial statements”) are the responsibility of the Fund’s management. Our responsibility is to express an opinion on these financial statements based on our audits. We conducted our audits of these financial statements in accordance with the standards of the Public Company Accounting Oversight Board (United States). Those standards require that we plan and perform the audit to obtain reasonable assurance about whether the financial statements are free of material misstatement. An audit includes examining, on a test basis, evidence supporting the amounts and disclosures in the financial statements, assessing the accounting principles used and significant estimates made by management, and evaluating the overall financial statement presentation. We believe that our audits, which included confirmation of securities at December 31, 2010 by correspondence with the custodian and brokers, provide a reasonable basis for our opinion.
PricewaterhouseCoopers LLP
San Francisco, California
February 10, 2011
TGB-38
Franklin Templeton Variable Insurance Products Trust
Tax Designation (unaudited)
Templeton Global Bond Securities Fund
Under Section 852(b)(3)(C) of the Internal Revenue Code (Code), the Fund designates the maximum amount allowable but no less than $4,480,058 as a long term capital gain dividend for the fiscal year ended December 31, 2010.
At December 31, 2010, more than 50% of the Fund’s total assets were invested in securities of foreign issuers. In most instances, foreign taxes were withheld from income paid to the Fund on these investments. The Fund elects to treat foreign taxes paid as allowed under Section 853 of the Code. This election will allow shareholders of record as of the 2011 distribution date, to treat their proportionate share of foreign taxes paid by the Fund as having been paid directly by them. The shareholder shall consider these amounts as foreign taxes paid in the tax year in which they receive the Fund distribution.
TGB-39
TEMPLETON GROWTH SECURITIES FUND
This annual report for Templeton Growth Securities Fund covers the fiscal year ended December 31, 2010.
Performance Summary as of 12/31/10
Average annual total return of Class 4 shares* represents the average annual change in value, assuming reinvestment of dividends and capital gains. Average returns smooth out variations in returns, which can be significant; they are not the same as year-by-year results.
Periods ended 12/31/10
| | | | | | | | | | | | |
| | | 1-Year | | | 5-Year | | | 10-Year | |
Average Annual Total Return | | | +7.31% | | | | +0.31% | | | | +3.28% | |
*For the period beginning 2/29/08, Class 4 performance reflects a 12b-1 fee expense of 0.35% per year, which affects future performance. Class 4 performance prior to 2/29/08 reflects historical Class 1 performance, which does not have a 12b-1 fee expense. Since 2/29/08 (effective date), the average annual total return of Class 4 shares was -3.55%.
Total Return Index Comparison for a Hypothetical $10,000 Investment (1/1/01–12/31/10)
The graph below shows the change in value of a hypothetical $10,000 investment in the Fund over the indicated period and includes reinvestment of any income or distributions. The Fund’s performance* is compared to the performance of the Morgan Stanley Capital International (MSCI) World Index. One cannot invest directly in an index, and an index is not representative of the Fund’s portfolio. Please see Important Notes to Performance Information preceding the Fund Summaries.
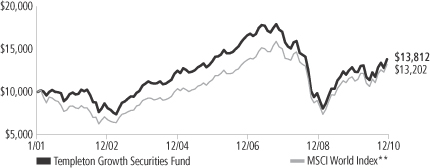
**Source: © 2011 Morningstar. Please see Index Descriptions following the Fund Summaries.
Templeton Growth Securities Fund – Class 4
Performance reflects the Fund’s Class 4 operating expenses, but does not include any contract fees, expenses or sales charges. If they had been included, performance would be lower. These charges and deductions, particularly for variable life policies, can have a significant effect on contract values and insurance benefits. See the contract prospectus for a complete description of these expenses, including sales charges.
Performance data represent past performance, which does not guarantee future results. Investment return and principal value will fluctuate, and you may have a gain or loss when you sell your shares.
Current performance may differ from figures shown.
TG-1
Fund Goal and Main Investments: Templeton Growth Securities Fund seeks long-term capital growth. The Fund normally invests primarily in equity securities of companies located anywhere in the world, including those in the U.S. and in emerging markets.
Performance Overview
You can find the Fund’s one-year total return in the Performance Summary. The Fund underperformed the +12.34% total return of the MSCI World Index for the period under review.1
Economic and Market Overview
During the year under review, equities advanced against a backdrop of heightened volatility and uneven global economic recovery. Emerging market regions primarily led growth, as they were generally unconstrained by the debt overhang burdening western economies and benefited from strong intrinsic demand and significant capital inflows. Policymakers in these regions began raising interest rates toward period-end to combat inflation and speculative investment. Developed economies grew at a more subdued pace, with demand recovery and asset price reflation heavily underpinned by government-sponsored, liquidity-enhancing measures. The U.S. Federal Reserve Board (Fed), having already brought official interest rates close to zero, began directly purchasing government securities as part of an extreme policy measure known as quantitative easing. Further promoting the U.S. recovery, the traditionally pro-business Republican Party gained control of the House of Representatives in mid-term elections and President Obama extended Bush-era tax cuts. In Europe, ballooning fiscal deficits took their toll on peripheral nations and growing concerns of potential sovereign defaults significantly roiled equity markets on several occasions during the period. The European Central Bank responded by pledging 750 billion euros in the spring with the intent to forestall defaults, stabilize markets and restore confidence in the euro currency, followed by further backstops in the autumn as Ireland and the rest of the periphery came under renewed duress.
The combination of intrinsic growth drivers in emerging markets and stimulus-induced support in the developed world encouraged the global economic recovery, and equity markets responded favorably. By the end of 2010, global equity markets recouped all losses suffered
1. Source: © 2011 Morningstar. One cannot invest directly in an index, and an index is not representative of the Fund’s portfolio. Please see Index Descriptions following the Fund Summaries.
Fund Risks: The Fund’s investments in stocks may offer the potential for long-term gains but can be subject to short-term price fluctuations. Foreign investing, especially in emerging markets, involves additional risks, including currency fluctuations, economic instability, market volatility, and political and social instability. The Fund may have significant investments in one or more countries or in particular sectors from time to time and may be at greater risk of adverse developments in a country or sector than a fund that invests more broadly. Because the Fund may invest in bonds and other debt obligations, its share price and yield may be affected by interest rate movements. The manager applies various techniques and analyses in making investment decisions for the Fund, but there can be no guarantee that these decisions will produce the desired results. The Fund’s prospectus also includes a description of the main investment risks.
TG-2
since Lehman Brothers Holdings’ 2008 bankruptcy. Commodities surged in the second half of 2010 due to near-term supply constraints and emerging market demand increases, as well as longer term fears that overly accommodative monetary policies would ultimately have negative inflationary consequences. The dollar strengthened relative to the euro, which bore the burden of the region’s fiscal crisis, but weakened against the yen, which hit multi-decade highs amid persistent deflationary pressures. Meanwhile U.S. Treasuries and corporate bonds finished the year with gains, though Treasury prices declined considerably in the final quarter as Fed policies appeared to improve growth expectations. Although market conditions remained accommodative and corporate profitability improved, critical economic fundamentals such as employment, home prices and credit creation remained substantially depressed at period-end, leading many investors to question the true health of the global economy and the sustainability of the recovery.
Investment Strategy
Our investment philosophy is bottom up, value oriented and long term. In choosing investments, we will focus on the market price of a company’s securities relative to our evaluation of the company’s potential long-term earnings, asset value and cash flow. Among factors we may consider are a company’s historical value measures, including price/earnings ratio, profit margins and liquidation value. We do in-depth research to construct a bargain list from which we buy.
Manager’s Discussion
During the reporting period, the Fund’s major contributors to performance relative to the MSCI World Index included German car maker BMW and South Korean car maker Hyundai Motor,2 which rallied due to increasing international car demand. U.S. telecommunications, cable television and Internet services provider Comcast boosted Fund performance as well. In contrast, key detractors from performance included U.K. integrated oil and gas company BP, U.S. computer software maker Microsoft and French pharmaceuticals manufacturer Sanofi-Aventis.
From a sector perspective, our overweighting in consumer discretionary stocks helped relative results.3 Notable contributors from this sector included U.S.-based telecommunications, cable television and Internet services provider Time Warner Cable and media conglomerate Viacom,
2. This holding is not an index component.
3. The consumer discretionary sector comprises auto components; automobiles; hotels, restaurants and leisure; Internet and catalog retail; media; multiline retail and specialty retail in the SOI.
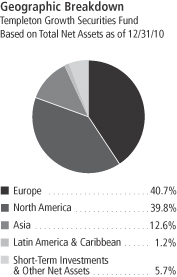
TG-3
which benefited from improving advertising markets and growing broadband penetration. The Fund’s underweighted position in financials also added to relative Fund returns.
Conversely, an overweighted position and stock selection in the health care sector hindered performance during a period when European governments undertaking fiscal austerity measures considered reducing pharmaceutical industry reimbursements and U.S. politicians debated sweeping health care reforms.4 For example, Sanofi-Aventis lagged despite strong earnings as investors focused on impending patent expirations and the company’s hostile bid for biotechnology firm Genzyme. Our stock selection in energy hampered results, mainly among oil, gas and consumable fuels companies such as BP.5 The Fund’s underweighting and stock selection in the materials sector restrained relative performance as supply constraints, emerging market demand increases, and inflation concerns supported commodity prices during the year.6
From a geographic perspective, our stock selection in Asia benefited performance relative to the MSCI World Index, notably in off-index countries Taiwan and South Korea. Underweighting and stock selection in North America, particularly the U.S., and no exposure to Canada, hindered relative results. Overweighting and stock selection in Europe hurt relative returns as these stocks were pressured by European sovereign debt risk, capital adequacy concerns and regulatory tightening. The Fund’s holdings in France, Italy and the U.K weighed on performance as well.
Thank you for your participation in Templeton Growth Securities Fund. We look forward to serving your future investment needs.
4. The health care sector comprises biotechnology, health care equipment and supplies, health care providers and services, life science tools and services, and pharmaceuticals in the SOI.
5. The energy sector comprises energy equipment and services; and oil, gas and consumable fuels in the SOI.
6. The materials sector comprises construction materials, metals and mining, and paper and forest products in the SOI.
The foregoing information reflects our analysis, opinions and portfolio holdings as of December 31, 2010, the end of the reporting period. The way we implement our main investment strategies and the resulting portfolio holdings may change depending on factors such as market and economic conditions. These opinions may not be relied upon as investment advice or an offer for a particular security. The information is not a complete analysis of every aspect of any market, country, industry, security or the Fund. Statements of fact are from sources considered reliable, but the investment manager makes no representation or warranty as to their completeness or accuracy. Although historical performance is no guarantee of future results, these insights may help you understand our investment management philosophy.
Top 10 Holdings
Templeton Growth Securities Fund
12/31/10
| | | | |
Company Sector/Industry, Country | | % of Total
Net Assets | |
| Oracle Corp. | | | 2.6% | |
| Software, U.S. | | | | |
| Accenture PLC, A | | | 2.5% | |
| IT Services, U.S. | | | | |
| Microsoft Corp. | | | 2.4% | |
| Software, U.S. | | | | |
| Pfizer Inc. | | | 2.0% | |
| Pharmaceuticals, U.S. | | | | |
| Vodafone Group PLC | | | 2.0% | |
| Wireless Telecommunication Services, U.K. | | | | |
| Comcast Corp., A, Special | | | 1.9% | |
| Media, U.S. | | | | |
| Amgen Inc. | | | 1.9% | |
| Biotechnology, U.S. | | | | |
| Sanofi-Aventis | | | 1.9% | |
| Pharmaceuticals, France | | | | |
| Siemens AG | | | 1.7% | |
| Industrial Conglomerates, Germany | | | | |
| Novartis AG | | | 1.7% | |
| Pharmaceuticals, Switzerland | | | | |
The dollar value, number of shares or principal amount, and names of all portfolio holdings are listed in the Fund’s Statement of Investments (SOI).
TG-4
Fund Expenses
As an investor in a variable insurance contract (Contract) that indirectly provides for investment in an underlying mutual fund, you can incur transaction and/or ongoing expenses at both the Fund level and the Contract level.
| • | | Transaction expenses can include sales charges (loads) on purchases, redemption fees, surrender fees, transfer fees and premium taxes. |
| • | | Ongoing expenses can include management fees, distribution and service (12b-1) fees, contract fees, annual maintenance fees, mortality and expense risk fees and other fees and expenses. All mutual funds and Contracts have some types of ongoing expenses. |
The expenses shown in the table are meant to highlight ongoing expenses at the Fund level only and do not include ongoing expenses at the Contract level, or transaction expenses at either the Fund or Contract level. While the Fund does not have transaction expenses, if the transaction and ongoing expenses at the Contract level were included, the expenses shown below would be higher. You should consult your Contract prospectus or disclosure document for more information.
The table shows Fund-level ongoing expenses and can help you understand these expenses and compare them with those of other mutual funds offered through the Contract. The table assumes a $1,000 investment held for the six months indicated. Please refer to the Fund prospectus for additional information on operating expenses.
Actual Fund Expenses
The first line (Actual) of the table provides actual account values and expenses. The “Ending Account Value” is derived from the Fund’s actual return, which includes the effect of ongoing Fund expenses, but does not include the effect of ongoing Contract expenses.
You can estimate the Fund-level expenses you incurred during the period by following these steps. Of course, your account value and expenses will differ from those in this illustration:
| 1. | Divide your account value by $1,000. |
If an account had an $8,600 value, then $8,600 ÷ $1,000 = 8.6.
| 2. | Multiply the result by the number under the heading “Fund-Level Expenses Incurred During Period.” |
If Fund-Level Expenses Incurred During Period were $7.50, then 8.6 x $7.50 = $64.50.
In this illustration, the estimated expenses incurred this period at the Fund level are $64.50.
Templeton Growth Securities Fund – Class 4
TG-5
Hypothetical Example for Comparison with Other Mutual Funds
Information in the second line (Hypothetical) of the table can help you compare ongoing expenses of the Fund with those of other mutual funds offered through the Contract. This information may not be used to estimate the actual ending account balance or expenses you incurred during the period. The hypothetical “Ending Account Value” is based on the Fund’s actual expense ratio and an assumed 5% annual rate of return before expenses, which does not represent the Fund’s actual return. The figure under the heading “Fund-Level Expenses Incurred During Period” shows the hypothetical expenses your account would have incurred under this scenario. You can compare this figure with the 5% hypothetical examples that appear in shareholder reports of other funds offered through a Contract.
| | | | | | | | | | | | |
| Class 4 | | Beginning
Account Value 7/1/10 | | | Ending
Account Value 12/31/10 | | | Fund-Level Expenses Incurred
During Period* 7/1/10–12/31/10 | |
Actual | | $ | 1,000 | | | $ | 1,215.50 | | | $ | 6.25 | |
Hypothetical (5% return before expenses) | | $ | 1,000 | | | $ | 1,019.56 | | | $ | 5.70 | |
*Expenses are calculated using the most recent six-month annualized expense ratio for the Fund’s Class 4 shares (1.12%), which does not include any ongoing expenses of the Contract for which the Fund is an investment option, multiplied by the average account value over the period, multiplied by 184/365 to reflect the one-half year period.
TG-6
SUPPLEMENT DATED SEPTEMBER 7, 2010
TO THE PROSPECTUS
DATED MAY 1, 2010
OF
TEMPLETON GROWTH SECURITIES FUND
(A series of Franklin Templeton Variable Insurance Products Trust)
The prospectus is amended as follows:
1. On page TG-S4 of the Fund summary, the sections under the headings “Investment Manager,” “Sub-Advisor,” and “Portfolio Managers” are replaced with the following:
Investment Manager
Templeton Global Advisors Limited (Global Advisors)
Portfolio Managers
CINDY L. SWEETING, CFA
President, Chairman and Director of Global Advisors and portfolio manager of the Fund since 2007.
LISA F. MEYERS, J.D., CFA
Executive Vice President of Global Advisors and portfolio manager of the Fund since August 2010.
MATTHEW NAGLE, CFA
Portfolio Manager of Global Advisors and portfolio manager of the Fund since August 2010.
JAMES HARPER, CFA
Portfolio Manager of Global Advisors and portfolio manager of the Fund since August 2010.
2. On page TG-D4 of the Fund details, the section under the heading “Management” is replaced with the following:
Management
Templeton Global Advisors Limited (Global Advisors), Lyford Cay, Nassau, Bahamas, is the Fund’s investment manager.
The Fund is managed by a team of dedicated professionals focused on investments in equity securities of companies anywhere in the world. The portfolio managers of the team are as follows:
CINDY L. SWEETING, CFA
President, Chairman and Director of Global Advisors
Ms. Sweeting has been a portfolio manager of the Fund since 2007 and assumed the duties of lead portfolio manager of the Fund in August 2010. She has primary
TG-7
responsibility for the investments of the Fund. Ms. Sweeting has final authority over all aspects of the Fund’s investment portfolio, including but not limited to, purchases and sales of individual securities, portfolio risk assessment, and the management of daily cash balances in accordance with anticipated investment management requirements. The degree to which she may perform these functions, and the nature of these functions, may change from time to time. She joined Franklin Templeton Investments in 1997.
LISA F. MEYERS, J.D., CFA
Executive Vice President of Global Advisors
Ms. Meyers has been a portfolio manager of the Fund since August 2010, providing research and advice on the purchases and sales of individual securities, and portfolio risk assessment. She joined Franklin Templeton Investments in 1996.
MATTHEW NAGLE, CFA
Portfolio Manager of Global Advisors
Mr. Nagle has been a portfolio manager of the Fund since August 2010, providing research and advice on the purchases and sales of individual securities, and portfolio risk assessment. He joined Franklin Templeton Investments in 2003.
JAMES HARPER, CFA
Portfolio Manager of Global Advisors
Mr. Harper has been a portfolio manager of the Fund since August 2010, providing research and advice on the purchases and sales of individual securities, and portfolio risk assessment. He joined Franklin Templeton Investments in 2007. Prior to joining Franklin Templeton Investments in 2007, he was a partner at sell-side research brokerage, Redburn Partners LLP, where he covered the European telecoms sector. He was also a research analyst at Citigroup and Credit Suisse First Boston.
CFA® and Charted Financial Analyst® are trademarks owned by CFA Institute.
The Fund’s SAI provides additional information about portfolio manager compensation, other accounts that they manage and their ownership of Fund shares.
The Fund pays Global Advisors a fee for managing its assets and providing certain administrative facilities and services to the Fund. For the fiscal year ended December 31, 2009 the Fund paid 0.75% of its average daily net assets to Global Advisors for its services.
A discussion regarding the basis for the board of trustees approving the investment management contract of the Fund is available in the Fund’s semiannual report to shareholders for the six-month period ended June 30.
Please retain this supplement for future reference.
TG-8
SUPPLEMENT DATED DECEMBER 7, 2010
TOTHE PROSPECTUS
DATED MAY 1, 2010
OF
TEMPLETON GROWTH SECURITIES FUND
(A series of Franklin Templeton Variable Insurance Products Trust)
Effective March 1, 2011, the prospectus will be amended as follows:
| 1. | In the Fund Summary, the section titled “Portfolio Managers” on page TG-S4 is replaced with the following: |
Portfolio Managers
NORM BOERSMA, CFA
President of Global Advisors and portfolio manager of the Fund effective March 1, 2011.
LISA F. MEYERS, J.D., CFA
Executive Vice President of Global Advisors and portfolio manager of the Fund since August 2010.
MATTHEW NAGLE, CFA
Portfolio Manager of Global Advisors and portfolio manager of the Fund since August 2010.
JAMES HARPER, CFA
Portfolio Manager of Global Advisors and portfolio manager of the Fund since August 2010.
| 2. | In the Fund Details, in the section titled “Management” on page TG-D4, the listing of portfolio managers is replaced with the following: |
The Fund is managed by a team of dedicated professionals focused on investments in equity securities of companies anywhere in the world. The portfolio managers of the team are as follows:
NORM BOERSMA, CFA
President of Global Advisors and portfolio manager of the Fund since March 2011.
Mr. Boersma assumes the duties of lead portfolio manager of the Fund effective March 2011. He will have primary responsibility for the investments of the Fund. Mr. Boersma will have final authority over all aspects of the Fund’s investment portfolio, including but not limited to, purchases and sales of individual securities, portfolio risk assessment, and the management of daily cash balances in accordance with anticipated investment
TG-9
management requirements. The degree to which he may perform these functions, and the nature of these functions, may change from time to time. He joined Franklin Templeton Investments in 1991.
LISA F. MEYERS, J.D., CFA
Executive Vice President of Global Advisors
Ms. Meyers has been a portfolio manager of the Fund since August 2010, providing research and advice on the purchases and sales of individual securities, and portfolio risk assessment. She joined Franklin Templeton Investments in 1996.
MATTHEW NAGLE, CFA
Portfolio Manager of Global Advisors
Mr. Nagle has been a portfolio manager of the Fund since August 2010, providing research and advice on the purchases and sales of individual securities, and portfolio risk assessment. He joined Franklin Templeton Investments in 2003.
JAMES HARPER, CFA
Portfolio Manager of Global Advisors
Mr. Harper has been a portfolio manager of the Fund since August 2010, providing research and advice on the purchases and sales of individual securities, and portfolio risk assessment. He joined Franklin Templeton Investments in 2007. Prior to joining Franklin Templeton Investments in 2007, he was a partner at sell-side research brokerage, Redburn Partners LLP, where he covered the European telecoms sector. He was also a research analyst at Citigroup and Credit Suisse First Boston.
CFA® and Charted Financial Analyst® are trademarks owned by CFA Institute.
Please retain this supplement for future reference.
TG-10
Franklin Templeton Variable Insurance Products Trust
Financial Highlights
Templeton Growth Securities Fund
| | | | | | | | | | | | | | | | | | | | |
| | | Year Ended December 31, | |
| Class 1 | | 2010 | | | 2009 | | | 2008 | | | 2007 | | | 2006 | |
| | | | |
Per share operating performance | | | | | | | | | | | | | | | | | | | | |
(for a share outstanding throughout the year) | | | | | | | | | | | | | | | | | | | | |
Net asset value, beginning of year | | $ | 10.56 | | | $ | 8.34 | | | $ | 15.68 | | | $ | 16.16 | | | $ | 13.98 | |
| | | | |
Income from investment operationsa: | | | | | | | | | | | | | | | | | | | | |
Net investment incomeb | | | 0.17 | | | | 0.17 | | | | 0.29 | | | | 0.27 | | | | 0.29 | |
Net realized and unrealized gains (losses) | | | 0.62 | | | | 2.36 | | | | (6.50 | ) | | | 0.19 | | | | 2.67 | |
| | | | |
Total from investment operations | | | 0.79 | | | | 2.53 | | | | (6.21 | ) | | | 0.46 | | | | 2.96 | |
| | | | |
Less distributions from: | | | | | | | | | | | | | | | | | | | | |
Net investment income | | | (0.16 | ) | | | (0.31 | ) | | | (0.26 | ) | | | (0.25 | ) | | | (0.23 | ) |
Net realized gains | | | — | | | | — | | | | (0.87 | ) | | | (0.69 | ) | | | (0.55 | ) |
| | | | |
Total distributions | | | (0.16 | ) | | | (0.31 | ) | | | (1.13 | ) | | | (0.94 | ) | | | (0.78 | ) |
| | | | |
Net asset value, end of year | | $ | 11.19 | | | $ | 10.56 | | | $ | 8.34 | | | $ | 15.68 | | | $ | 16.16 | |
| | | | |
| | | | | |
Total returnc | | | 7.74% | | | | 31.33% | | | | (42.13)% | | | | 2.55% | | | | 22.20% | |
Ratios to average net assets | | | | | | | | | | | | | | | | | | | | |
Expenses before expense reduction | | | 0.77% | | | | 0.79% | | | | 0.78% | | | | 0.77% | | | | 0.78% | |
Expenses net of expense reduction | | | 0.77% | d | | | 0.79% | d | | | 0.78% | d | | | 0.76% | | | | 0.78% | d |
Net investment income | | | 1.71% | | | | 2.00% | | | | 2.64% | | | | 1.64% | | | | 1.93% | |
| | | | | |
Supplemental data | | | | | | | | | | | | | | | | | | | | |
Net assets, end of year (000’s) | | $ | 1,348,622 | | | $ | 824,575 | | | $ | 371,700 | | | $ | 406,538 | | | $ | 413,871 | |
Portfolio turnover rate | | | 9.61% | | | | 14.95% | | | | 18.37% | | | | 20.45% | | | | 20.29% | e |
aThe amount shown for a share outstanding throughout the period may not correlate with the Statement of Operations for the period due to the timing of sales and repurchases of the Fund shares in relation to income earned and/or fluctuating market value of the investments of the Fund.
bBased on average daily shares outstanding.
cTotal return does not include fees, charges or expenses imposed by the variable annuity and life insurance contracts for which the Franklin Templeton Variable Insurance Products Trust serves as an underlying investment vehicle.
dBenefit of expense reduction rounds to less than 0.01%.
eExcludes the value of portfolio securities delivered as a result of a redemption in kind.
The accompanying notes are an integral part of these financial statements.
TG-11
Franklin Templeton Variable Insurance Products Trust
Financial Highlights (continued)
Templeton Growth Securities Fund
| | | | | | | | | | | | | | | | | | | | |
| | | Year Ended December 31, | |
| Class 2 | | 2010 | | | 2009 | | | 2008 | | | 2007 | | | 2006 | |
| | | | |
Per share operating performance | | | | | | | | | | | | | | | | | | | | |
(for a share outstanding throughout the year) | | | | | | | | | | | | | | | | | | | | |
Net asset value, beginning of year | | $ | 10.40 | | | $ | 8.20 | | | $ | 15.44 | | | $ | 15.93 | | | $ | 13.81 | |
| | | | |
Income from investment operationsa: | | | | | | | | | | | | | | | | | | | | |
Net investment incomeb | | | 0.15 | | | | 0.16 | | | | 0.29 | | | | 0.22 | | | | 0.24 | |
Net realized and unrealized gains (losses) | | | 0.60 | | | | 2.32 | | | | (6.44 | ) | | | 0.20 | | | | 2.63 | |
| | | | |
Total from investment operations | | | 0.75 | | | | 2.48 | | | | (6.15 | ) | | | 0.42 | | | | 2.87 | |
| | | | |
Less distributions from: | | | | | | | | | | | | | | | | | | | | |
Net investment income | | | (0.14 | ) | | | (0.28 | ) | | | (0.22 | ) | | | (0.22 | ) | | | (0.20 | ) |
Net realized gains | | | — | | | | — | | | | (0.87 | ) | | | (0.69 | ) | | | (0.55 | ) |
| | | | |
Total distributions | | | (0.14 | ) | | | (0.28 | ) | | | (1.09 | ) | | | (0.91 | ) | | | (0.75 | ) |
| | | | |
Net asset value, end of year | | $ | 11.01 | | | $ | 10.40 | | | $ | 8.20 | | | $ | 15.44 | | | $ | 15.93 | |
| | | | |
| | | | | |
Total returnc | | | 7.39% | | | | 31.10% | | | | (42.32)% | | | | 2.35% | | | | 21.81% | |
Ratios to average net assets | | | | | | | | | | | | | | | | | | | | |
Expenses before expense reduction | | | 1.02% | | | | 1.04% | | | | 1.03% | | | | 1.02% | | | | 1.03% | |
Expenses net of expense reduction | | | 1.02% | d | | | 1.04% | d | | | 1.03% | d | | | 1.01% | | | | 1.03% | d |
Net investment income | | | 1.46% | | | | 1.75% | | | | 2.39% | | | | 1.39% | | | | 1.68% | |
| | | | | |
Supplemental data | | | | | | | | | | | | | | | | | | | | |
Net assets, end of year (000’s) | | $ | 1,626,885 | | | $ | 1,718,894 | | | $ | 1,513,557 | | | $ | 3,182,203 | | | $ | 2,821,818 | |
Portfolio turnover rate | | | 9.61% | | | | 14.95% | | | | 18.37% | | | | 20.45% | | | | 20.29% | e |
aThe amount shown for a share outstanding throughout the period may not correlate with the Statement of Operations for the period due to the timing of sales and repurchases of the Fund shares in relation to income earned and/or fluctuating market value of the investments of the Fund.
bBased on average daily shares outstanding.
cTotal return does not include fees, charges or expenses imposed by the variable annuity and life insurance contracts for which the Franklin Templeton Variable Insurance Products Trust serves as an underlying investment vehicle.
dBenefit of expense reduction rounds to less than 0.01%.
eExcludes the value of portfolio securities delivered as a result of a redemption in kind.
The accompanying notes are an integral part of these financial statements.
TG-12
Franklin Templeton Variable Insurance Products Trust
Financial Highlights (continued)
Templeton Growth Securities Fund
| | | | | | | | | | | | |
| | | Year Ended December 31, | |
| Class 4 | | 2010 | | | 2009 | | | 2008a | |
| | | | |
Per share operating performance | | | | | | | | | | | | |
(for a share outstanding throughout the year) | | | | | | | | | | | | |
Net asset value, beginning of year | | $ | 10.50 | | | $ | 8.31 | | | $ | 14.08 | |
| | | | |
Income from investment operationsb: | | | | | | | | | | | | |
Net investment incomec | | | 0.14 | | | | 0.14 | | | | 0.09 | |
Net realized and unrealized gains (losses) | | | 0.61 | | | | 2.36 | | | | (4.73 | ) |
| | | | |
Total from investment operations | | | 0.75 | | | | 2.50 | | | | (4.64 | ) |
| | | | |
Less distributions from: | | | | | | | | | | | | |
Net investment income | | | (0.14 | ) | | | (0.31 | ) | | | (0.26 | ) |
Net realized gains | | | — | | | | — | | | | (0.87 | ) |
| | | | |
Total distributions | | | (0.14 | ) | | | (0.31 | ) | | | (1.13 | ) |
| | | | |
Net asset value, end of year | | $ | 11.11 | | | $ | 10.50 | | | $ | 8.31 | |
| | | | |
| | | |
Total returnd | | | 7.31% | | | | 30.98% | | | | (35.79)% | |
Ratios to average net assetse | | | | | | | | | | | | |
Expensesf | | | 1.12% | | | | 1.14% | | | | 1.13% | |
Net investment income | | | 1.36% | | | | 1.65% | | | | 2.29% | |
| | | |
Supplemental data | | | | | | | | | | | | |
Net assets, end of year (000’s) | | $ | 60,569 | | | $ | 56,218 | | | $ | 24,877 | |
Portfolio turnover rate | | | 9.61% | | | | 14.95% | | | | 18.37% | |
aFor the period February 29, 2008 (effective date) to December 31, 2008.
bThe amount shown for a share outstanding throughout the period may not correlate with the Statement of Operations for the period due to the timing of sales and repurchases of the Fund shares in relation to income earned and/or fluctuating market value of the investments of the Fund.
cBased on average daily shares outstanding.
dTotal return does not include fees, charges or expenses imposed by the variable annuity and life insurance contracts for which the Franklin Templeton Variable Insurance Products Trust serves as an underlying investment vehicle. Total return is not annualized for periods less than one year.
eRatios are annualized for periods less than one year.
fBenefit of expense reduction rounds to less than 0.01%.
The accompanying notes are an integral part of these financial statements.
TG-13
Franklin Templeton Variable Insurance Products Trust
Statement of Investments, December 31, 2010
| | | | | | | | | | | | |
| Templeton Growth Securities Fund | | Country | | | Shares | | | Value | |
Common Stocks 93.2% | | | | | | | | | | | | |
Aerospace & Defense 0.4% | | | | | | | | | | | | |
BAE Systems PLC | | | United Kingdom | | | | 2,263,542 | | | $ | 11,664,429 | |
aBAE Systems PLC, 144A | | | United Kingdom | | | | 387 | | | | 1,995 | |
| | | | | | | | | | | | |
| | | | | | | | | | | 11,666,424 | |
| | | | | | | | | | | | |
Air Freight & Logistics 2.2% | | | | | | | | | | | | |
Deutsche Post AG | | | Germany | | | | 773,732 | | | | 13,083,159 | |
FedEx Corp. | | | United States | | | | 162,010 | | | | 15,068,550 | |
United Parcel Service Inc., B | | | United States | | | | 525,890 | | | | 38,169,096 | |
| | | | | | | | | | | | |
| | | | | | | | | | | 66,320,805 | |
| | | | | | | | | | | | |
Airlines 0.6% | | | | | | | | | | | | |
bBritish Airways PLC | | | United Kingdom | | | | 1,690,910 | | | | 7,201,940 | |
bDeutsche Lufthansa AG | | | Germany | | | | 425,860 | | | | 9,371,470 | |
| | | | | | | | | | | | |
| | | | | | | | | | | 16,573,410 | |
| | | | | | | | | | | | |
Auto Components 0.6% | | | | | | | | | | | | |
Compagnie Generale des Etablissements Michelin, B | | | France | | | | 265,066 | | | | 19,041,593 | |
| | | | | | | | | | | | |
Automobiles 3.0% | | | | | | | | | | | | |
Bayerische Motoren Werke AG | | | Germany | | | | 350,807 | | | | 27,552,138 | |
Hyundai Motor Co. Ltd. | | | South Korea | | | | 247,430 | | | | 38,286,827 | |
Toyota Motor Corp. | | | Japan | | | | 603,200 | | | | 23,927,367 | |
| | | | | | | | | | | | |
| | | | | | | | | | | 89,766,332 | |
| | | | | | | | | | | | |
Biotechnology 2.5% | | | | | | | | | | | | |
bAmgen Inc. | | | United States | | | | 1,032,850 | | | | 56,703,465 | |
bBiogen Idec Inc. | | | United States | | | | 302,080 | | | | 20,254,464 | |
| | | | | | | | | | | | |
| | | | | | | | | | | 76,957,929 | |
| | | | | | | | | | | | |
Commercial Banks 3.6% | | | | | | | | | | | | |
DBS Group Holdings Ltd. | | | Singapore | | | | 1,244,000 | | | | 13,884,708 | |
HSBC Holdings PLC | | | United Kingdom | | | | 2,504,324 | | | | 25,679,591 | |
ICICI Bank Ltd., ADR | | | India | | | | 174,110 | | | | 8,816,930 | |
Intesa Sanpaolo SpA | | | Italy | | | | 5,720,440 | | | | 15,534,613 | |
KB Financial Group Inc. | | | South Korea | | | | 564,934 | | | | 30,230,582 | |
UniCredit SpA | | | Italy | | | | 8,040,061 | | | | 16,649,657 | |
| | | | | | | | | | | | |
| | | | | | | | | | | 110,796,081 | |
| | | | | | | | | | | | |
Communications Equipment 2.2% | | | | | | | | | | | | |
bBrocade Communications Systems Inc. | | | United States | | | | 2,339,190 | | | | 12,374,315 | |
bCisco Systems Inc. | | | United States | | | | 1,255,680 | | | | 25,402,406 | |
Telefonaktiebolaget LM Ericsson, B | | | Sweden | | | | 2,488,244 | | | | 28,966,256 | |
| | | | | | | | | | | | |
| | | | | | | | | | | 66,742,977 | |
| | | | | | | | | | | | |
Computers & Peripherals 0.8% | | | | | | | | | | | | |
bDell Inc. | | | United States | | | | 724,720 | | | | 9,819,956 | |
bSeagate Technology | | | United States | | | | 1,017,688 | | | | 15,295,851 | |
| | | | | | | | | | | | |
| | | | | | | | | | | 25,115,807 | |
| | | | | | | | | | | | |
Construction Materials 0.8% | | | | | | | | | | | | |
CRH PLC | | | Ireland | | | | 1,158,413 | | | | 24,019,839 | |
| | | | | | | | | | | | |
Consumer Finance 0.7% | | | | | | | | | | | | |
American Express Co. | | | United States | | | | 481,900 | | | | 20,683,148 | |
| | | | | | | | | | | | |
Diversified Financial Services 1.8% | | | | | | | | | | | | |
Bank of America Corp. | | | United States | | | | 989,060 | | | | 13,194,061 | |
TG-14
Franklin Templeton Variable Insurance Products Trust
Statement of Investments, December 31, 2010 (continued)
| | | | | | | | | | | | |
| Templeton Growth Securities Fund | | Country | | | Shares | | | Value | |
Common Stocks (continued) | | | | | | | | | | | | |
Diversified Financial Services (continued) | | | | | | | | | | | | |
bING Groep NV | | | Netherlands | | | | 2,860,660 | | | $ | 27,859,454 | |
JPMorgan Chase & Co. | | | United States | | | | 341,310 | | | | 14,478,370 | |
| | | | | | | | | | | | |
| | | | | | | | | | | 55,531,885 | |
| | | | | | | | | | | | |
Diversified Telecommunication Services 4.5% | | | | | | | | | | | | |
AT&T Inc. | | | United States | | | | 259,080 | | | | 7,611,770 | |
France Telecom SA | | | France | | | | 1,675,680 | | | | 34,958,391 | |
KT Corp., ADR | | | South Korea | | | | 862,201 | | | | 17,933,781 | |
Singapore Telecommunications Ltd. | | | Singapore | | | | 15,434,000 | | | | 36,690,335 | |
Telefonica SA | | | Spain | | | | 1,233,540 | | | | 27,995,104 | |
Telekom Austria AG | | | Austria | | | | 526,010 | | | | 7,402,607 | |
Telenor ASA | | | Norway | | | | 210,567 | | | | 3,428,323 | |
| | | | | | | | | | | | |
| | | | | | | | | | | 136,020,311 | |
| | | | | | | | | | | | |
Electronic Equipment, Instruments & Components 1.7% | | | | | | | | | | | | |
bFlextronics International Ltd. | | | Singapore | | | | 1,843,660 | | | | 14,472,731 | |
FUJIFILM Holdings Corp. | | | Japan | | | | 303,610 | | | | 10,981,201 | |
Tyco Electronics Ltd. | | | United States | | | | 756,978 | | | | 26,797,021 | |
| | | | | | | | | | | | |
| | | | | | | | | | | 52,250,953 | |
| | | | | | | | | | | | |
Energy Equipment & Services 2.6% | | | | | | | | | | | | |
Baker Hughes Inc. | | | United States | | | | 403,460 | | | | 23,065,808 | |
Halliburton Co. | | | United States | | | | 871,820 | | | | 35,596,411 | |
Noble Corp. | | | United States | | | | 219,600 | | | | 7,855,092 | |
SBM Offshore NV | | | Netherlands | | | | 567,850 | | | | 12,735,387 | |
| | | | | | | | | | | | |
| | | | | | | | | | | 79,252,698 | |
| | | | | | | | | | | | |
Food & Staples Retailing 1.8% | | | | | | | | | | | | |
CVS Caremark Corp. | | | United States | | | | 834,560 | | | | 29,017,651 | |
Tesco PLC | | | United Kingdom | | | | 3,703,240 | | | | 24,595,286 | |
| | | | | | | | | | | | |
| | | | | | | | | | | 53,612,937 | |
| | | | | | | | | | | | |
Food Products 1.3% | | | | | | | | | | | | |
Nestle SA | | | Switzerland | | | | 480,840 | | | | 28,186,285 | |
Unilever NV | | | Netherlands | | | | 382,832 | | | | 11,932,711 | |
| | | | | | | | | | | | |
| | | | | | | | | | | 40,118,996 | |
| | | | | | | | | | | | |
Health Care Equipment & Supplies 1.6% | | | | | | | | | | | | |
Covidien PLC | | | United States | | | | 594,418 | | | | 27,141,126 | |
Medtronic Inc. | | | United States | | | | 603,950 | | | | 22,400,506 | |
Olympus Corp. | | | Japan | | | | 800 | | | | 24,224 | |
| | | | | | | | | | | | |
| | | | | | | | | | | 49,565,856 | |
| | | | | | | | | | | | |
Health Care Providers & Services 0.5% | | | | | | | | | | | | |
Quest Diagnostics Inc. | | | United States | | | | 265,060 | | | | 14,305,288 | |
| | | | | | | | | | | | |
Hotels, Restaurants & Leisure 0.7% | | | | | | | | | | | | |
Compass Group PLC | | | United Kingdom | | | | 2,457,422 | | | | 22,313,572 | |
| | | | | | | | | | | | |
Industrial Conglomerates 4.5% | | | | | | | | | | | | |
General Electric Co. | | | United States | | | | 1,692,410 | | | | 30,954,179 | |
Koninklijke Philips Electronics NV | | | Netherlands | | | | 678,444 | | | | 20,801,928 | |
Siemens AG | | | Germany | | | | 413,374 | | | | 51,522,180 | |
Tyco International Ltd. | | | United States | | | | 775,748 | | | | 32,146,997 | |
| | | | | | | | | | | | |
| | | | | | | | | | | 135,425,284 | |
| | | | | | | | | | | | |
TG-15
Franklin Templeton Variable Insurance Products Trust
Statement of Investments, December 31, 2010 (continued)
| | | | | | | | | | | | |
| Templeton Growth Securities Fund | | Country | | | Shares | | | Value | |
Common Stocks (continued) | | | | | | | | | | | | |
Insurance 5.1% | | | | | | | | | | | | |
ACE Ltd. | | | United States | | | | 260,030 | | | $ | 16,186,867 | |
a,bAIA Group Ltd., 144A | | | Hong Kong | | | | 3,254,200 | | | | 9,148,185 | |
Aviva PLC | | | United Kingdom | | | | 5,006,141 | | | | 30,788,325 | |
AXA SA | | | France | | | | 888,516 | | | | 14,798,223 | |
Muenchener Rueckversicherungs-Gesellschaft AG | | | Germany | | | | 132,810 | | | | 20,145,614 | |
Progressive Corp. | | | United States | | | | 1,285,020 | | | | 25,533,347 | |
RenaissanceRe Holdings Ltd. | | | United States | | | | 232,530 | | | | 14,809,836 | |
Swiss Reinsurance Co. | | | Switzerland | | | | 300,730 | | | | 16,195,631 | |
Torchmark Corp. | | | United States | | | | 130,097 | | | | 7,771,995 | |
| | | | | | | | | | | | |
| | | | | | | | | | | 155,378,023 | |
| | | | | | | | | | | | |
Internet & Catalog Retail 0.4% | | | | | | | | | | | | |
Expedia Inc. | | | United States | | | | 519,760 | | | | 13,040,778 | |
| | | | | | | | | | | | |
IT Services 2.9% | | | | | | | | | | | | |
Accenture PLC, A | | | United States | | | | 1,567,167 | | | | 75,991,928 | |
bSAIC Inc. | | | United States | | | | 730,690 | | | | 11,588,743 | |
| | | | | | | | | | | | |
| | | | | | | | | | | 87,580,671 | |
| | | | | | | | | | | | |
Life Sciences Tools & Services 0.5% | | | | | | | | | | | | |
Lonza Group AG | | | Switzerland | | | | 179,380 | | | | 14,394,573 | |
| | | | | | | | | | | | |
Machinery 0.3% | | | | | | | | | | | | |
bNavistar International Corp. | | | United States | | | | 141,780 | | | | 8,210,480 | |
| | | | | | | | | | | | |
Media 8.9% | | | | | | | | | | | | |
Comcast Corp., Special, A | | | United States | | | | 2,842,322 | | | | 59,148,721 | |
News Corp., A | | | United States | | | | 2,978,832 | | | | 43,371,794 | |
Pearson PLC | | | United Kingdom | | | | 1,647,248 | | | | 26,007,934 | |
Reed Elsevier NV | | | Netherlands | | | | 15,140 | | | | 187,487 | |
Time Warner Cable Inc. | | | United States | | | | 330,550 | | | | 21,826,216 | |
Time Warner Inc. | | | United States | | | | 606,340 | | | | 19,505,958 | |
Viacom Inc., B | | | United States | | | | 930,928 | | | | 36,874,058 | |
Vivendi SA | | | France | | | | 1,595,455 | | | | 43,113,264 | |
The Walt Disney Co. | | | United States | | | | 517,160 | | | | 19,398,672 | |
| | | | | | | | | | | | |
| | | | | | | | | | | 269,434,104 | |
| | | | | | | | | | | | |
Metals & Mining 0.5% | | | | | | | | | | | | |
Alcoa Inc. | | | United States | | | | 926,480 | | | | 14,258,527 | |
| | | | | | | | | | | | |
Multiline Retail 0.5% | | | | | | | | | | | | |
Target Corp. | | | United States | | | | 250,420 | | | | 15,057,755 | |
| | | | | | | | | | | | |
Office Electronics 0.6% | | | | | | | | | | | | |
Konica Minolta Holdings Ltd. | | | Japan | | | | 1,733,800 | | | | 18,026,821 | |
| | | | | | | | | | | | |
Oil, Gas & Consumable Fuels 6.5% | | | | | | | | | | | | |
BG Group PLC | | | United Kingdom | | | | 615,140 | | | | 12,452,246 | |
BP PLC | | | United Kingdom | | | | 5,524,775 | | | | 40,171,077 | |
Chevron Corp. | | | United States | | | | 194,230 | | | | 17,723,487 | |
Eni SpA | | | Italy | | | | 1,041,807 | | | | 22,772,688 | |
Gazprom, ADR | | | Russia | | | | 475,980 | | | | 12,108,931 | |
Royal Dutch Shell PLC, B | | | United Kingdom | | | | 1,284,833 | | | | 42,546,197 | |
Statoil ASA | | | Norway | | | | 511,060 | | | | 12,165,170 | |
Total SA, B | | | France | | | | 703,120 | | | | 37,294,743 | |
| | | | | | | | | | | | |
| | | | | | | | | | | 197,234,539 | |
| | | | | | | | | | | | |
TG-16
Franklin Templeton Variable Insurance Products Trust
Statement of Investments, December 31, 2010 (continued)
| | | | | | | | | | | | |
| Templeton Growth Securities Fund | | Country | | | Shares | | | Value | |
Common Stocks (continued) | | | | | | | | | | | | |
Paper & Forest Products 0.5% | | | | | | | | | | | | |
Svenska Cellulosa AB, B | | | Sweden | | | | 929,383 | | | $ | 14,702,448 | |
| | | | | | | | | | | | |
Pharmaceuticals 10.2% | | | | | | | | | | | | |
Bristol-Myers Squibb Co. | | | United States | | | | 282,710 | | | | 7,486,161 | |
GlaxoSmithKline PLC | | | United Kingdom | | | | 2,562,730 | | | | 49,598,208 | |
Merck & Co. Inc. | | | United States | | | | 944,391 | | | | 34,035,852 | |
Merck KGaA | | | Germany | | | | 234,690 | | | | 18,919,022 | |
Novartis AG | | | Switzerland | | | | 857,664 | | | | 50,458,926 | |
Pfizer Inc. | | | United States | | | | 3,508,463 | | | | 61,433,187 | |
Roche Holding AG | | | Switzerland | | | | 207,520 | | | | 30,439,229 | |
Sanofi-Aventis | | | France | | | | 877,657 | | | | 56,180,000 | |
| | | | | | | | | | | | |
| | | | | | | | | | | 308,550,585 | |
| | | | | | | | | | | | |
Professional Services 1.4% | | | | | | | | | | | | |
Adecco SA | | | Switzerland | | | | 261,060 | | | | 17,119,834 | |
Hays PLC | | | United Kingdom | | | | 4,042,646 | | | | 8,167,739 | |
bRandstad Holding NV | | | Netherlands | | | | 309,590 | | | | 16,359,084 | |
| | | | | | | | | | | | |
| | | | | | | | | | | 41,646,657 | |
| | | | | | | | | | | | |
Real Estate Management & Development 1.1% | | | | | | | | | | | | |
Cheung Kong (Holdings) Ltd. | | | Hong Kong | | | | 1,623,833 | | | | 25,028,652 | |
Swire Pacific Ltd., A | | | Hong Kong | | | | 580,046 | | | | 9,537,456 | |
| | | | | | | | | | | | |
| | | | | | | | | | | 34,566,108 | |
| | | | | | | | | | | | |
Semiconductors & Semiconductor Equipment 2.7% | | | | | | | | | | | | |
Samsung Electronics Co. Ltd. | | | South Korea | | | | 56,930 | | | | 48,184,232 | |
Taiwan Semiconductor Manufacturing Co. Ltd. | | | Taiwan | | | | 13,672,625 | | | | 33,279,272 | |
| | | | | | | | | | | | |
| | | | | | | | | | | 81,463,504 | |
| | | | | | | | | | | | |
Software 6.6% | | | | | | | | | | | | |
Microsoft Corp. | | | United States | | | | 2,572,279 | | | | 71,818,030 | |
Nintendo Co. Ltd. | | | Japan | | | | 65,600 | | | | 19,257,752 | |
Oracle Corp. | | | United States | | | | 2,513,920 | | | | 78,685,696 | |
SAP AG | | | Germany | | | | 611,910 | | | | 31,044,746 | |
| | | | | | | | | | | | |
| | | | | | | | | | | 200,806,224 | |
| | | | | | | | | | | | |
Specialty Retail 1.7% | | | | | | | | | | | | |
The Home Depot Inc. | | | United States | | | | 387,190 | | | | 13,574,881 | |
Inditex SA | | | Spain | | | | 147,560 | | | | 11,060,232 | |
Kingfisher PLC | | | United Kingdom | | | | 6,391,215 | | | | 26,334,083 | |
| | | | | | | | | | | | |
| | | | | | | | | | | 50,969,196 | |
| | | | | | | | | | | | |
Trading Companies & Distributors 1.3% | | | | | | | | | | | | |
Itochu Corp. | | | Japan | | | | 2,385,740 | | | | 24,158,648 | |
bWolseley PLC | | | United Kingdom | | | | 503,954 | | | | 16,102,274 | |
| | | | | | | | | | | | |
| | | | | | | | | | | 40,260,922 | |
| | | | | | | | | | | | |
Wireless Telecommunication Services 3.0% | | | | | | | | | | | | |
bSprint Nextel Corp. | | | United States | | | | 4,179,020 | | | | 17,677,255 | |
Turkcell Iletisim Hizmetleri AS | | | Turkey | | | | 465,865 | | | | 3,187,545 | |
Turkcell Iletisim Hizmetleri AS, ADR | | | Turkey | | | | 777,820 | | | | 13,324,057 | |
Vodafone Group PLC | | | United Kingdom | | | | 23,393,524 | | | | 60,549,198 | |
| | | | | | | | | | | | |
| | | | | | | | | | | 94,738,055 | |
| | | | | | | | | | | | |
Total Common Stocks (Cost $2,679,439,663) | | | | | | | | | | | 2,826,402,095 | |
| | | | | | | | | | | | |
TG-17
Franklin Templeton Variable Insurance Products Trust
Statement of Investments, December 31, 2010 (continued)
| | | | | | | | | | | | |
| Templeton Growth Securities Fund | | Country | | | Shares | | | Value | |
Non-Registered Mutual Funds (Cost $11,910,000) 0.5% | | | | | | | | | | | | |
Diversified Financial Services 0.5% | | | | | | | | | | | | |
b,c,d,eTempleton China Opportunities Fund Ltd., Reg D | | | Cayman Islands | | | | 1,192,192 | | | $ | 14,592,433 | |
| | | | | | | | | | | | |
Preferred Stocks 0.7% | | | | | | | | | | | | |
Metals & Mining 0.5% | | | | | | | | | | | | |
Vale SA, ADR, pfd., A | | | Brazil | | | | 529,780 | | | | 16,009,952 | |
| | | | | | | | | | | | |
Oil, Gas & Consumable Fuels 0.2% | | | | | | | | | | | | |
Petroleo Brasileiro SA, ADR, pfd. | | | Brazil | | | | 218,150 | | | | 7,454,185 | |
| | | | | | | | | | | | |
Total Preferred Stocks (Cost $16,986,886) | | | | | | | | | | | 23,464,137 | |
| | | | | | | | | | | | |
Total Investments before Short Term Investments (Cost $2,708,336,549) | | | | | | | | | | | 2,864,458,665 | |
| | | | | | | | | | | | |
| | | |
| | | | | | Principal
Amount | | | | |
Short Term Investments 5.6% | | | | | | | | | | | | |
Time Deposits (Cost $35,198,535) 1.2% | | | | | | | | | | | | |
BNP Paribas Corp., 0.10%, 1/03/11 | | | United States | | | $ | 35,200,000 | | | | 35,200,000 | |
| | | | | | | | | | | | |
U.S. Government and Agency Securities 4.4% | | | | | | | | | | | | |
fFHLMC, 2/28/11—3/28/11 | | | United States | | | | 35,000,000 | | | | 34,993,660 | |
fFNMA, 1/05/11 | | | United States | | | | 20,000,000 | | | | 19,999,960 | |
fU.S. Treasury Bills, 1/20/11—3/10/11 | | | United States | | | | 80,000,000 | | | | 79,991,303 | |
| | | | | | | | | | | | |
Total U.S. Government and Agency Securities (Cost $134,975,341) | | | | | | | | | | | 134,984,923 | |
| | | | | | | | | | | | |
Total Short Term Investments (Cost $170,173,876) 100.0% | | | | | | | | | | | 170,184,923 | |
| | | | | | | | | | | | |
Total Investments (Cost $2,878,510,425) 100.0% | | | | | | | | | | | 3,034,643,588 | |
Other Assets, less Liabilities 0.0%† | | | | | | | | | | | 1,433,139 | |
| | | | | | | | | | | | |
Net Assets 100.0% | | | | | | | | | | $ | 3,036,076,727 | |
| | | | | | | | | | | | |
See Abbreviations on page TG-30.
†Rounds to less than 0.1% of net assets.
aSecurity was purchased pursuant to Rule 144A under the Securities Act of 1933 and may be sold in transactions exempt from registration only to qualified institutional buyers or in a public offering registered under the Securities Act of 1933. These securities have been deemed liquid under guidelines approved by the Trust's Board of Trustees. At December 31, 2010, the aggregate value of these securities was $9,150,180, representing 0.30% of net assets.
bNon-income producing.
cSee Note 1(d) regarding investment in Templeton China Opportunities Fund, Ltd.
dSee Note 8 regarding restricted securities.
eSee Note 9 regarding holdings of 5% voting securities.
fThe security is traded on a discount basis with no stated coupon rate.
The accompanying notes are an integral part of these financial statements.
TG-18
Franklin Templeton Variable Insurance Products Trust
Financial Statements
Statement of Assets and Liabilities
December 31, 2010
| | | | |
| | | Templeton
Growth
Securities Fund | |
Assets: | | | | |
Investments in securities: | | | | |
Cost - Unaffiliated issuers | | $ | 2,866,600,425 | |
Cost - Non-controlled affiliated issuers (Note 9) | | | 11,910,000 | |
| | | | |
Total cost of investments | | $ | 2,878,510,425 | |
| | | | |
Value - Unaffiliated issuers | | $ | 3,020,051,155 | |
Value - Non-controlled affiliated issuers (Note 9) | | | 14,592,433 | |
| | | | |
Total value of investments | | | 3,034,643,588 | |
Cash | | | 79,080 | |
Receivables: | | | | |
Capital shares sold | | | 58,239 | |
Dividends | | | 5,645,732 | |
Other assets | | | 481 | |
| | | | |
Total assets | | | 3,040,427,120 | |
| | | | |
Liabilities: | | | | |
Payables: | | | | |
Capital shares redeemed | | | 1,355,367 | |
Affiliates | | | 2,578,214 | |
Reports to shareholders | | | 301,801 | |
Accrued expenses and other liabilities | | | 115,011 | |
| | | | |
Total liabilities | | | 4,350,393 | |
| | | | |
Net assets, at value | | $ | 3,036,076,727 | |
| | | | |
Net assets consist of: | | | | |
Paid-in capital | | $ | 3,300,036,857 | |
Undistributed net investment income | | | 41,408,000 | |
Net unrealized appreciation (depreciation) | | | 156,400,145 | |
Accumulated net realized gain (loss) | | | (461,768,275 | ) |
| | | | |
Net assets, at value | | $ | 3,036,076,727 | |
| | | | |
The accompanying notes are an integral part of these financial statements.
TG-19
Franklin Templeton Variable Insurance Products Trust
Financial Statements (continued)
Statement of Assets and Liabilities (continued)
December 31, 2010
| | | | |
| | | Templeton
Growth
Securities Fund | |
Class 1: | | | | |
Net assets, at value | | $ | 1,348,622,431 | |
| | | | |
Shares outstanding | | | 120,546,203 | |
| | | | |
Net asset value and maximum offering price per share | | $ | 11.19 | |
| | | | |
Class 2: | | | | |
Net assets, at value | | $ | 1,626,885,320 | |
| | | | |
Shares outstanding | | | 147,702,725 | |
| | | | |
Net asset value and maximum offering price per share | | $ | 11.01 | |
| | | | |
Class 4: | | | | |
Net assets, at value | | $ | 60,568,976 | |
| | | | |
Shares outstanding | | | 5,451,250 | |
| | | | |
Net asset value and maximum offering price per share | | $ | 11.11 | |
| | | | |
The accompanying notes are an integral part of these financial statements.
TG-20
Franklin Templeton Variable Insurance Products Trust
Financial Statements (continued)
Statement of Operations
for the year ended December 31, 2010
| | | | |
| | | Templeton
Growth
Securities Fund | |
Investment income: | | | | |
Dividends (net of foreign taxes of $4,671,346) | | $ | 66,184,109 | |
Interest | | | 152,331 | |
Income from securities loaned | | | 393,928 | |
| | | | |
Total investment income | | | 66,730,368 | |
| | | | |
Expenses: | | | | |
Management fees (Note 3a) | | | 19,882,694 | |
Distribution fees: (Note 3c) | | | | |
Class 2 | | | 3,971,686 | |
Class 4 | | | 198,927 | |
Unaffiliated transfer agent fees | | | 1,513 | |
Custodian fees (Note 4) | | | 310,740 | |
Reports to shareholders | | | 364,670 | |
Registration and filing fees | | | 2,075 | |
Professional fees | | | 60,335 | |
Trustees' fees and expenses | | | 11,560 | |
Other | | | 74,645 | |
| | | | |
Total expenses | | | 24,878,845 | |
Expense reductions (Note 4) | | | (19 | ) |
| | | | |
Net expenses | | | 24,878,826 | |
| | | | |
Net investment income | | | 41,851,542 | |
| | | | |
Realized and unrealized gains (losses): | | | | |
Net realized gain (loss) from: | | | | |
Investments | | | (42,293,741 | ) |
Foreign currency transactions | | | (440,460 | ) |
| | | | |
Net realized gain (loss) | | | (42,734,201 | ) |
| | | | |
Net change in unrealized appreciation (depreciation) on: | | | | |
Investments | | | 206,077,465 | |
Translation of other assets and liabilities denominated in foreign currencies | | | 231,661 | |
| | | | |
Net change in unrealized appreciation (depreciation) | | | 206,309,126 | |
| | | | |
Net realized and unrealized gain (loss) | | | 163,574,925 | |
| | | | |
Net increase (decrease) in net assets resulting from operations | | $ | 205,426,467 | |
| | | | |
The accompanying notes are an integral part of these financial statements.
TG-21
Franklin Templeton Variable Insurance Products Trust
Financial Statements (continued)
Statements of Changes in Net Assets
| | | | | | | | |
| | | Templeton Growth
Securities Fund | |
| | | Year Ended December 31, | |
| | | 2010 | | | 2009 | |
| | | | |
Increase (decrease) in net assets: | | | | | | | | |
Operations: | | | | | | | | |
Net investment income | | $ | 41,851,542 | | | $ | 37,769,219 | |
Net realized gain (loss) from investments and foreign currency transactions | | | (42,734,201 | ) | | | (252,848,898 | ) |
Net change in unrealized appreciation (depreciation) on investments and translation of other assets and liabilities denominated in foreign currencies | | | 206,309,126 | | | | 807,780,555 | |
| | | | |
Net increase (decrease) in net assets resulting from operations | | | 205,426,467 | | | | 592,700,876 | |
| | | | |
Distributions to shareholders from: | | | | | | | | |
Net investment income: | | | | | | | | |
Class 1 | | | (15,588,191 | ) | | | (17,057,443 | ) |
Class 2 | | | (21,721,910 | ) | | | (48,545,883 | ) |
Class 4 | | | (762,562 | ) | | | (1,318,174 | ) |
| | | | |
Total distributions to shareholders | | | (38,072,663 | ) | | | (66,921,500 | ) |
| | | | |
Capital share transactions: (Note 2) | | | | | | | | |
Class 1 | | | 446,712,026 | | | | 307,891,288 | |
Class 2 | | | (178,452,057 | ) | | | (164,033,071 | ) |
Class 4 | | | 774,782 | | | | 19,916,353 | |
| | | | |
Total capital share transactions | | | 269,034,751 | | | | 163,774,570 | |
| | | | |
Net increase (decrease) in net assets | | | 436,388,555 | | | | 689,553,946 | |
Net assets: | | | | | | | | |
Beginning of year | | | 2,599,688,172 | | | | 1,910,134,226 | |
| | | | |
End of year | | $ | 3,036,076,727 | | | $ | 2,599,688,172 | |
| | | | |
Undistributed net investment income included in net assets: | | | | | | | | |
End of year | | $ | 41,408,000 | | | $ | 37,872,811 | |
| | | | |
The accompanying notes are an integral part of these financial statements.
TG-22
Franklin Templeton Variable Insurance Products Trust
Notes to Financial Statements
Templeton Growth Securities Fund
1. ORGANIZATION AND SIGNIFICANT ACCOUNTING POLICIES
Franklin Templeton Variable Insurance Products Trust (Trust) is registered under the Investment Company Act of 1940, as amended, (1940 Act) as an open-end investment company, consisting of twenty separate funds. The Templeton Growth Securities Fund (Fund) is included in this report. The financial statements of the remaining funds in the Trust are presented separately. Shares of the Fund are generally sold only to insurance company separate accounts to fund the benefits of variable life insurance policies or variable annuity contracts. The Fund offers three classes of shares: Class 1, Class 2, and Class 4. Each class of shares differs by its distribution fees, voting rights on matters affecting a single class and its exchange privilege.
The following summarizes the Fund's significant accounting policies.
a. Financial Instrument Valuation
The Fund values its investments in securities and other assets and liabilities carried at fair value daily. Fair value is the price that would be received to sell an asset or paid to transfer a liability in an orderly transaction between market participants on the measurement date. Under procedures approved by the Trust’s Board of Trustees, the Fund may utilize independent pricing services, quotations from securities and financial instrument dealers, and other market sources to determine fair value.
Equity securities listed on an exchange or on the NASDAQ National Market System are valued at the last quoted sale price or the official closing price of the day, respectively. Foreign equity securities are valued as of the close of trading on the foreign stock exchange on which the security is primarily traded, or the NYSE, whichever is earlier. The value is then converted into its U.S. dollar equivalent at the foreign exchange rate in effect at the close of the NYSE on the day that the value of the security is determined. Over-the-counter securities are valued within the range of the most recent quoted bid and ask prices. Securities that trade in multiple markets or on multiple exchanges are valued according to the broadest and most representative market. Certain equity securities are valued based upon fundamental characteristics or relationships to similar securities.
Debt securities generally trade in the over-the-counter market rather than on a securities exchange. The Fund's pricing services use multiple valuation techniques to determine fair value. In instances where sufficient market activity exists, the pricing services may utilize a market-based approach through which quotes from market makers are used to determine fair value. In instances where sufficient market activity may not exist or is limited, the pricing services also utilize proprietary valuation models which may consider market characteristics such as benchmark yield curves, option-adjusted spreads, credit spreads, estimated default rates, coupon rates, anticipated timing of principal repayments, underlying collateral, and other unique security features in order to estimate the relevant cash flows, which are then discounted to calculate the fair value. Time deposits are valued at cost, which approximates market value.
The Fund has procedures to determine the fair value of securities and other financial instruments for which market prices are not readily available or which may not be reliably priced. Under these procedures, the Fund primarily employs a market-based approach which may use related or comparable assets or liabilities, recent transactions, market multiples, book values, and other relevant information for the investment to determine the fair value of the investment. The Fund may also use an income-based valuation approach in which the anticipated future cash flows of the investment are discounted to calculate fair value. Discounts may also be applied due to the nature or duration of any restrictions on the disposition of the investments. Due to the inherent uncertainty of valuations of such investments, the fair values may differ significantly from the values that would have been used had an active market existed.
Trading in securities on foreign securities stock exchanges and over-the-counter markets may be completed before the daily close of business on the NYSE. Occasionally, events occur between the time at which trading in a foreign security is completed and the close of the NYSE that might call into question the reliability of the value of a portfolio security held by the Fund. As a result, differences may arise between the value of the Fund’s portfolio securities as determined at the foreign market close and the latest indications of value at the close of the NYSE. In order to minimize the potential for these differences, the investment manager monitors price movements following the close of trading in foreign stock markets through a series of country specific market
TG-23
Franklin Templeton Variable Insurance Products Trust
Notes to Financial Statements (continued)
Templeton Growth Securities Fund
1. ORGANIZATION AND SIGNIFICANT ACCOUNTING POLICIES (continued)
a. Financial Instrument Valuation (continued)
proxies (such as baskets of American Depository Receipts, futures contracts and exchange traded funds). These price movements are measured against established trigger thresholds for each specific market proxy to assist in determining if an event has occurred that may call into question the reliability of the values of the foreign securities held by the Fund. If such an event occurs, the securities may be valued using fair value procedures, which may include the use of independent pricing services.
b. Foreign Currency Translation
Portfolio securities and other assets and liabilities denominated in foreign currencies are translated into U.S. dollars based on the exchange rate of such currencies against U.S. dollars on the date of valuation. The Fund may enter into foreign currency exchange contracts to facilitate transactions denominated in a foreign currency. Purchases and sales of securities, income and expense items denominated in foreign currencies are translated into U.S. dollars at the exchange rate in effect on the transaction date. Portfolio securities and assets and liabilities denominated in foreign currencies contain risks that those currencies will decline in value relative to the U.S. dollar. Occasionally, events may impact the availability or reliability of foreign exchange rates used to convert the U.S. dollar equivalent value. If such an event occurs, the foreign exchange rate will be valued at fair value using procedures established and approved by the Trust’s Board of Trustees.
The Fund does not separately report the effect of changes in foreign exchange rates from changes in market prices on securities held. Such changes are included in net realized and unrealized gain or loss from investments on the Statement of Operations.
Realized foreign exchange gains or losses arise from sales of foreign currencies, currency gains or losses realized between the trade and settlement dates on securities transactions and the difference between the recorded amounts of dividends, interest, and foreign withholding taxes and the U.S. dollar equivalent of the amounts actually received or paid. Net unrealized foreign exchange gains and losses arise from changes in foreign exchange rates on foreign denominated assets and liabilities other than investments in securities held at the end of the reporting period.
c. Securities Lending
The Fund participates in an agency based security lending program. The Fund receives cash collateral against the loaned securities in an amount equal to at least 102% of the market value of the loaned securities. Collateral is maintained over the life of the loan in an amount not less than 100% of the market value of loaned securities, as determined at the close of Fund business each day; any additional collateral required due to changes in security values is delivered to the Fund on the next business day. The collateral is invested in repurchase agreements and/or in a money market fund managed by the Fund’s custodian on the Fund’s behalf. The Fund receives income from the investment of cash collateral, in addition to lending fees and rebates paid by the borrower. The Fund bears the market risk with respect to the collateral investment, securities loaned, and the risk that the agent may default on its obligations to the fund. At December 31, 2010, the Fund had no securities on loan.
d. Investment in Templeton China Opportunities Fund, Ltd.
The Fund invests in Templeton China Opportunities Fund, Ltd. (China Fund), a private offering of unregistered shares in a Cayman Islands Exempt Company. The China Fund investment objective is to seek capital growth primarily through investments in A-shares of Chinese companies listed on the Shanghai and Shenzhen stock exchanges. Chinese A-shares are traded in Chinese Renminbi and are only available as an investment to domestic (Chinese) investors and holders of a Qualified Foreign Institutional Investors license. The China Fund is managed by Templeton Investment Counsel, LLC (an affiliate of the investment manager). No additional management or administrative fees are incurred on assets invested in the China Fund.
TG-24
Franklin Templeton Variable Insurance Products Trust
Notes to Financial Statements (continued)
Templeton Growth Securities Fund
1. ORGANIZATION AND SIGNIFICANT ACCOUNTING POLICIES (continued)
d. Investment in Templeton China Opportunities Fund, Ltd. (continued)
Currently, shares of the China Fund are subject to a restriction on redemption set to expire on approximately April 7, 2011. Additionally, the Fund may incur delays in redeeming its investment in the China Fund. The China Fund may be subject to certain restrictions and administrative processes relating to its ability to repatriate cash balances, investment proceeds and earnings associated with its investment, as such activities are subject to approval by agencies of the Chinese government. The Fund's investment in the China Fund is valued based upon fair value of China Fund’s portfolio securities and other assets and liabilities.
e. Income Taxes
It is the Fund's policy to qualify as a regulated investment company under the Internal Revenue Code. The Fund intends to distribute to shareholders substantially all of its taxable income and net realized gains to relieve it from federal income and excise taxes. As a result, no provision for U.S. federal income taxes is required. The Fund files U.S. income tax returns as well as tax returns in certain other jurisdictions. The Fund's application of those tax rules is subject to its understanding. The Fund records a provision for taxes in its financial statements including penalties and interest, if any, for a tax position taken on a tax return (or expected to be taken) when it fails to meet the more likely than not (a greater than 50% probability) threshold and based on the technical merits, the tax position may not be sustained upon examination by the tax authorities. As of December 31, 2010, and for all open tax years, the Fund has determined that no provision for income tax is required in the Fund's financial statements. Open tax years are those that remain subject to examination and are based on each tax jurisdiction statute of limitation. The Fund is not aware of any tax position for which it is reasonably possible that the total amounts of unrecognized tax effects will significantly change in the next twelve months.
The Fund may be subject to foreign taxation related to income received, capital gains on the sale of securities and certain foreign currency transactions in the foreign jurisdictions in which it invests. Foreign taxes, if any, are recorded based on the tax regulations and rates that exist in the foreign markets in which the Fund invests. When a capital gain tax is determined to apply the Fund records an estimated deferred tax liability for net unrealized gains on these securities in an amount that would be payable if the securities were disposed of on the valuation date.
f. Security Transactions, Investment Income, Expenses and Distributions
Security transactions are accounted for on trade date. Realized gains and losses on security transactions are determined on a specific identification basis. Interest income and estimated expenses are accrued daily. Amortization of premium and accretion of discount on debt securities are included in interest income. Dividend income is recorded on the ex-dividend date except that certain dividends from foreign securities are recognized as soon as the Fund is notified of the ex-dividend date. Distributions to shareholders are recorded on the ex-dividend date and are determined according to income tax regulations (tax basis). Distributable earnings determined on a tax basis may differ from earnings recorded in accordance with accounting principles generally accepted in the United States of America. These differences may be permanent or temporary. Permanent differences are reclassified among capital accounts to reflect their tax character. These reclassifications have no impact on net assets or the results of operations. Temporary differences are not reclassified, as they may reverse in subsequent periods.
Common expenses incurred by the Trust are allocated among the funds based on the ratio of net assets of each fund to the combined net assets of the Trust. Fund specific expenses are charged directly to the fund that incurred the expense.
Realized and unrealized gains and losses and net investment income, not including class specific expenses, are allocated daily to each class of shares based upon the relative proportion of net assets of each class. Differences in per share distributions, by class, are generally due to differences in class specific expenses.
TG-25
Franklin Templeton Variable Insurance Products Trust
Notes to Financial Statements (continued)
Templeton Growth Securities Fund
1. ORGANIZATION AND SIGNIFICANT ACCOUNTING POLICIES (continued)
g. Accounting Estimates
The preparation of financial statements in accordance with accounting principles generally accepted in the United States of America requires management to make estimates and assumptions that affect the reported amounts of assets and liabilities at the date of the financial statements and the amounts of income and expenses during the reporting period. Actual results could differ from those estimates.
h. Guarantees and Indemnifications
Under the Trust's organizational documents, its officers and trustees are indemnified by the Trust against certain liabilities arising out of the performance of their duties to the Trust. Additionally, in the normal course of business, the Trust, on behalf of the Fund, enters into contracts with service providers that contain general indemnification clauses. The Trust's maximum exposure under these arrangements is unknown as this would involve future claims that may be made against the Trust that have not yet occurred. Currently, the Trust expects the risk of loss to be remote.
2. SHARES OF BENEFICIAL INTEREST
At December 31, 2010, there were an unlimited number of shares authorized (without par value). Transactions in the Fund's shares were as follows:
| | | | | | | | | | | | | | | | |
| | | Year Ended December 31, | |
| | | 2010 | | | 2009 | |
| Class 1 Shares: | | Shares | | | Amount | | | Shares | | | Amount | |
Shares sold | | | 56,324,674 | | | $ | 579,159,138 | | | | 35,481,950 | | | $ | 324,792,496 | |
Shares issued in reinvestment of distributions | | | 1,592,257 | | | | 15,588,191 | | | | 2,018,632 | | | | 17,057,443 | |
Shares redeemed | | | (15,424,906 | ) | | | (148,035,303 | ) | | | (4,036,022 | ) | | | (33,958,651 | ) |
| | | | |
Net increase (decrease) | | | 42,492,025 | | | $ | 446,712,026 | | | | 33,464,560 | | | $ | 307,891,288 | |
| | | | |
Class 2 Shares: | | | | | | | | | | | | | | | | |
Shares sold | | | 7,805,671 | | | $ | 79,205,936 | | | | 7,712,666 | | | $ | 66,170,428 | |
Shares issued in reinvestment of distributions | | | 2,250,975 | | | | 21,721,910 | | | | 5,813,228 | | | | 48,424,190 | |
Shares redeemed | | | (27,579,182 | ) | | | (279,379,903 | ) | | | (32,845,464 | ) | | | (278,627,689 | ) |
| | | | |
Net increase (decrease) | | | (17,522,536 | ) | | $ | (178,452,057 | ) | | | (19,319,570 | ) | | $ | (164,033,071 | ) |
| | | | |
Class 4 Shares: | | | | | | | | | | | | | | | | |
Shares sold | | | 792,359 | | | $ | 8,038,832 | | | | 2,450,209 | | | $ | 20,937,774 | |
Shares issued on reinvestment of distributions | | | 78,292 | | | | 762,562 | | | | 156,739 | | | | 1,318,174 | |
Shares redeemed | | | (772,020 | ) | | | (8,026,612 | ) | | | (247,445 | ) | | | (2,339,595 | ) |
| | | | |
Net increase (decrease) | | | 98,631 | | | $ | 774,782 | | | | 2,359,503 | | | $ | 19,916,353 | |
| | | | |
3. TRANSACTIONS WITH AFFILIATES
Franklin Resources, Inc. is the holding company for various subsidiaries that together are referred to as Franklin Templeton Investments. Certain officers and trustees of the Trust are also officers and/or directors of the following subsidiaries:
| | |
| Subsidiary | | Affiliation |
Templeton Global Advisors Limited (TGAL) | | Investment manager |
Franklin Templeton Services, LLC (FT Services) | | Administrative manager |
Franklin Templeton Distributors, Inc. (Distributors) | | Principal underwriter |
Franklin Templeton Investor Services, LLC (Investor Services) | | Transfer agent |
TG-26
Franklin Templeton Variable Insurance Products Trust
Notes to Financial Statements (continued)
Templeton Growth Securities Fund
3. TRANSACTIONS WITH AFFILIATES (continued)
a. Management Fees
The Fund pays an investment management fee to TGAL based on the average daily net assets of the Fund as follows:
| | |
| Annualized Fee Rate | | Net Assets |
| 1.000% | | Up to and including $100 million |
| 0.900% | | over $100 million, up to and including $250 million |
| 0.800% | | over $250 million, up to and including $500 million |
| 0.750% | | over $500 million, up to and including $1 billion |
| 0.700% | | over $1 billion, up to and including $5 billion |
| 0.675% | | over $5 billion, up to and including $10 billion |
| 0.655% | | over $10 billion, up to and including $15 billion |
| 0.635% | | over $15 billion, up to and including $20 billion |
| 0.615% | | In excess of $20 billion |
b. Administrative Fees
Under an agreement with TGAL, FT Services provides administrative services to the Fund. The fee is paid by TGAL based on average daily net assets, and is not an additional expense of the Fund.
c. Distribution Fees
The Trust’s Board of Trustees has adopted distribution plans for Class 2 and Class 4 shares pursuant to Rule 12b-1 under the 1940 Act. Under the Fund's compensation distribution plans, the Fund pays Distributors for costs incurred in connection with the servicing, sale and distribution of the Fund's shares up to 0.35% per year of its average daily net assets of each class. The Board of Trustees has agreed to limit the current rate to 0.25% per year for Class 2.
d. Transfer Agent Fees
Investor Services, under terms of an agreement, performs shareholder servicing for the Fund and is not paid by the Fund for the services.
e. Other Affiliated Transactions
At December 31, 2010, Franklin Templeton Variable Insurance Products Trust — Franklin Templeton VIP Founding Funds Allocation Fund owned 38.02% of the Fund’s outstanding shares.
4. EXPENSE OFFSET ARRANGEMENT
The Fund has entered into an arrangement with its custodian whereby credits realized as a result of uninvested cash balances are used to reduce a portion of the Fund’s custodian expenses. During the year ended December 31, 2010, the custodian fees were reduced as noted in the Statement of Operations.
5. INCOME TAXES
For tax purposes, capital losses may be carried over to offset future capital gains, if any. At December 31, 2010, the capital loss carryforwards were as follows:
| | | | |
Capital loss carryforwards expiring in: | | | | |
2016 | | $ | 103,613,248 | |
2017 | | | 294,580,233 | |
2018 | | | 55,299,629 | |
| | | | |
| | $ | 453,493,110 | |
| | | | |
TG-27
Franklin Templeton Variable Insurance Products Trust
Notes to Financial Statements (continued)
Templeton Growth Securities Fund
5. INCOME TAXES (continued)
The tax character of distributions paid during the years ended December 31, 2010 and 2009, was as follows:
| | | | | | | | |
| | | 2010 | | | 2009 | |
Distributions paid from ordinary income | | $ | 38,072,663 | | | $ | 66,921,500 | |
| | | | |
At December 31, 2010, the cost of investments, net unrealized appreciation (depreciation) and undistributed ordinary income for income tax purposes were as follows:
| | | | |
Cost of investments | | $ | 2,889,468,023 | |
| | | | |
| |
Unrealized appreciation | | $ | 489,882,739 | |
Unrealized depreciation | | | (344,707,174 | ) |
| | | | |
Net unrealized appreciation (depreciation) | | $ | 145,175,565 | |
| | | | |
Distributable earnings - undistributed ordinary income | | $ | 44,090,433 | |
| | | | |
Net investment income differs for financial statement and tax purposes primarily due to differing treatment of passive foreign investment company shares and foreign currency transactions.
Net realized gains (losses) differ for financial statement and tax purposes primarily due to differing treatments of wash sales and foreign currency transactions.
6. INVESTMENT TRANSACTIONS
Purchases and sales of investments (excluding short term securities) for the year ended December 31, 2010, aggregated $438,269,397 and $244,933,875, respectively.
7. CONCENTRATION OF RISK
Investing in foreign securities may include certain risks and considerations not typically associated with investing in U.S. securities, such as fluctuating currency values and changing local and regional economic, political and social conditions, which may result in greater market volatility. In addition, certain foreign securities may not be as liquid as U.S. securities.
8. RESTRICTED SECURITIES
The Fund may invest in securities that are restricted under the Securities Act of 1933 (1933 Act) or which are subject to legal, contractual, or other agreed upon restrictions on resale. Restricted securities are often purchased in private placement transactions, and cannot be sold without prior registration unless the sale is pursuant to an exemption under the 1933 Act. Disposal of these securities may require greater effort and expense, and prompt sale at an acceptable price may be difficult. The Fund may have registration rights for restricted securities. The issuer generally incurs all registration costs.
At December 31, 2010, the Fund held investments in restricted securities, excluding certain securities exempt from registration under the 1933 Act deemed to be liquid, as follows:
| | | | | | | | | | | | | | |
| Shares | | Issuer | | Acquisition
Date | | | Cost | | | Value | |
| 1,192,192 | | Templeton China Opportunities Fund Ltd., Reg D (0.48% of Net Assets) | | | 3/17/10 | | | $ | 11,910,000 | | | $ | 14,592,433 | |
| | | | | | | | | | |
TG-28
Franklin Templeton Variable Insurance Products Trust
Notes to Financial Statements (continued)
Templeton Growth Securities Fund
9. HOLDINGS OF 5% VOTING SECURITIES OF PORTFOLIO COMPANIES
The 1940 Act defines "affiliated companies" to include investments in portfolio companies in which a fund owns 5% or more of the outstanding voting securities. Investments in "affiliated companies" for the Fund for the year ended December 31, 2010, were as shown below.
| | | | | | | | | | | | | | | | | | | | | | | | | | | | |
| Name of Issuer | | Number of
Shares Held at
Beginning of Year | | | Gross
Additions | | | Gross
Reductions | | | Number of
Shares Held at
End of Year | | | Value at
End of Year | | | Investment
Income | | | Realized
Capital
Gain (Loss) | |
Non-Controlled Affiliates | | | | | | | | | | | | | | | | | | | | | | | | | | | | |
Templeton China Opportunities Fund Ltd., Reg D | | | — | | | | 1,192,192 | | | | — | | | | 1,192,192 | | | $ | 14,592,433 | | | $ | — | | | $ | — | |
| | | | | | | | | | | | | | | | | | | | | | | | | | | | |
Total Affiliated Securities (0.48% of Net Assets) | | | | | | | | | | | | | | | | | | | | | |
10. CREDIT FACILITY
The Fund, together with other U.S. registered and foreign investment funds (collectively “Borrowers”), managed by Franklin Templeton Investments, are borrowers in a joint syndicated senior unsecured credit facility totaling $750 million (Global Credit Facility) which matures on January 21, 2011. This Global Credit Facility provides a source of funds to the Borrowers for temporary and emergency purposes, including the ability to meet future unanticipated or unusually large redemption requests.
Under the terms of the Global Credit Facility, the Fund shall, in addition to interest charged on any borrowings made by the Fund and other costs incurred by the Fund, pay its share of fees and expenses incurred in connection with the implementation and maintenance of the Global Credit Facility, based upon its relative share of the aggregate net assets of all of the Borrowers, including an annual commitment fee of 0.10% based upon the unused portion of the Global Credit Facility, which is reflected in other expenses on the Statement of Operations. During the year ended December 31, 2010, the Fund did not use the Global Credit Facility.
Effective January 21, 2011, the Borrowers renewed the Global Credit Facility for a total of $750 million, maturing January 20, 2012.
11. FAIR VALUE MEASUREMENTS
The Fund follows a fair value hierarchy that distinguishes between market data obtained from independent sources (observable inputs) and the Fund's own market assumptions (unobservable inputs). These inputs are used in determining the value of the Fund’s investments and are summarized in the following fair value hierarchy:
| | • | | Level 1 – quoted prices in active markets for identical securities |
| | • | | Level 2 – other significant observable inputs (including quoted prices for similar securities, interest rates, prepayment speed, credit risk, etc.) |
| | • | | Level 3 – significant unobservable inputs (including the Fund’s own assumptions in determining the fair value of investments) |
The inputs or methodology used for valuing securities are not an indication of the risk associated with investing in those securities.
For movements between the levels within the fair value hierarchy, the Fund has adopted a policy of recognizing the transfers as of the date of the underlying event which caused the movement.
TG-29
Franklin Templeton Variable Insurance Products Trust
Notes to Financial Statements (continued)
Templeton Growth Securities Fund
11. FAIR VALUE MEASUREMENTS (continued)
The following is a summary of the inputs used as of December 31, 2010, in valuing the Fund’s assets carried at fair value:
| | | | | | | | | | | | | | | | |
| | | Level 1 | | | Level 2 | | | Level 3 | | | Total | |
| | | | |
Assets: | | | | | | | | | | | | | | | | |
Investments in Securities | | | | | | | | | | | | | | | | |
Equity Investments: | | | | | | | | | | | | | | | | |
Diversified Financial Services | | $ | — | | | $ | — | | | $ | 14,592,433 | | | $ | 14,592,433 | |
Other Equity Investments a,b | | | 2,849,866,232 | | | | — | | | | — | | | | 2,849,866,232 | |
Short Term Investments | | | 79,991,303 | | | | 90,193,620 | | | | — | | | | 170,184,923 | |
| | | | |
Total Investments in Securities | | $ | 2,929,857,535 | | | $ | 90,193,620 | | | $ | 14,592,433 | | | $ | 3,034,643,588 | |
| | | | |
aIncludes common preferred stocks as well as other equity investments
bFor detailed industry descriptions, see the accompanying Statement of Investments.
At December 31, 2010, the reconciliation of assets in which significant unobservable inputs (Level 3) were used in determining fair value, is as follows:
| | | | | | | | | | | | | | | | | | | | | | | | | | | | |
| | | Balance at
Beginning of
Year | | | Net
Realized
Gain (Loss) | | | Net Change in
Unrealized
Appreciation
(Depreciation) | | | Net Purchases
(Sales) | | | Transfer In
(Out of)
Level 3 | | | Balance at End
of Year | | | Net Change in
Unrealized
Appreciation
(Depreciation)
on Assets
Held at Year
End | |
Assets | | | | | | | | | | | | | | | | | | | | | | | | | | | | |
Equity Investments - Diversified Financial Services | | $ | — | | | $ | — | | | $ | 2,682,433 | | | $ | 11,910,000 | | | $ | — | | | $ | 14,592,433 | | | $ | 2,682,433 | |
12. SUBSEQUENT EVENTS
The Fund has evaluated subsequent events through the issuance of the financial statements and determined that no events have occurred that require disclosure other than those already disclosed in the financial statements.
| | | | |
ABBREVIATIONS | | | | |
| Selected Portfolio | | | | |
| | | | |
| ADR - American Depository Receipt | | | | |
| FHLMC - Federal Home Loan Mortgage Corp. | | | | |
| FNMA - Federal National Mortgage Association | | | | |
TG-30
Franklin Templeton Variable Insurance Products Trust
Templeton Growth Securities Fund
Report of Independent Registered Public Accounting Firm
To the Board of Trustees and Shareholders of Franklin Templeton Variable Insurance Products Trust
In our opinion, the accompanying statement of assets and liabilities, including the statement of investments, and the related statements of operations and of changes in net assets and the financial highlights present fairly, in all material respects, the financial position of Templeton Growth Securities Fund (the "Fund") at December 31, 2010, the results of its operations for the year then ended, the changes in its net assets for each of the two years in the period then ended and the financial highlights for each of the periods presented, in conformity with accounting principles generally accepted in the United States of America. These financial statements and financial highlights (hereafter referred to as "financial statements") are the responsibility of the Fund's management. Our responsibility is to express an opinion on these financial statements based on our audits. We conducted our audits of these financial statements in accordance with the standards of the Public Company Accounting Oversight Board (United States). Those standards require that we plan and perform the audit to obtain reasonable assurance about whether the financial statements are free of material misstatement. An audit includes examining, on a test basis, evidence supporting the amounts and disclosures in the financial statements, assessing the accounting principles used and significant estimates made by management, and evaluating the overall financial statement presentation. We believe that our audits, which included confirmation of securities at December 31, 2010 by correspondence with the custodian and brokers, provide a reasonable basis for our opinion.
PricewaterhouseCoopers LLP
San Francisco, California
February 10, 2011
TG-31
Franklin Templeton Variable Insurance Products Trust
Tax Designation (unaudited)
Templeton Growth Securities Fund
Under Section 854(b)(2) of the Internal Revenue Code (Code), the Fund designates 44.34% of the ordinary income dividends as income qualifying for the dividends received deduction for the fiscal year ended December 31, 2010.
At December 31, 2010, more than 50% of the Fund's total assets were invested in securities of foreign issuers. In most instances, foreign taxes were withheld from income paid to the Fund on these investments. The Fund elects to treat foreign taxes paid as allowed under Section 853 of the Code. This election will allow shareholders of record as of the 2011 distribution date, to treat their proportionate share of foreign taxes paid by the Fund as having been paid directly by them. The shareholder shall consider these amounts as foreign taxes paid in the tax year in which they receive the Fund distribution.
TG-32
INDEX DESCRIPTIONS
The indexes are unmanaged and include reinvested distributions.
Barclays Capital (BC) U.S. Aggregate Index is a market capitalization-weighted index representing the U.S. investment-grade, fixed-rate, taxable bond market with index components for government and corporate, mortgage pass-through and asset-backed securities. All issues included are SEC registered, taxable, dollar denominated and nonconvertible, must have at least one year to final maturity and must be rated investment grade (Baa3/BBB-/BBB- or higher) using the middle rating of Moody’s, Standard & Poor’s and Fitch, respectively. STANDARD & POOR’S®, S&P® and S&P 500® are registered trademarks of Standard & Poor’s Financial Services LLC. Standard & Poor’s does not sponsor, endorse, sell or promote any S&P index-based product.
Barclays Capital (BC) U.S. Government Index: Intermediate Component is the intermediate component of the BC U.S. Government Index, which includes public obligations of the U.S. Treasury with at least one year to final maturity and publicly issued debt of U.S. government agencies, quasi-federal corporations, and corporate or foreign debt guaranteed by the U.S. government.
Citigroup World Government Bond Index is a market capitalization-weighted index consisting of investment-grade world government bond markets.
Consumer Price Index (CPI), calculated by the U.S. Bureau of Labor Statistics, is a commonly used measure of the inflation rate.
Credit Suisse (CS) High Yield Index is designed to mirror the investable universe of the U.S. dollar-denominated high yield debt market.
Dow Jones Industrial Average is price weighted based on the average market price of 30 blue chip stocks of companies that are generally industry leaders.
FTSE/EPRA NAREIT Developed Index is a free float-adjusted index designed to measure the performance of publicly traded real estate securities in the North American, European and Asian real estate markets.
J.P. Morgan (JPM) Global Government Bond Index (GGBI) tracks total returns for liquid, fixed-rate, domestic government bonds with maturities greater than one year issued by developed countries globally.
Lipper Multi-Sector Income Funds Classification Average is calculated by averaging the total returns of all funds within the Lipper Multi-Sector Income Funds classification in the Lipper Open-End underlying funds universe. Lipper Multi-Sector Income Funds are defined as funds that seek current income by allocating assets among different fixed income securities sectors (not primarily in one sector except for defensive purposes), including U.S. and foreign governments, with a significant portion rated below investment grade. For the one-year period ended 12/31/10, there were 164 funds in this category. Lipper calculations do not include contract fees, expenses or sales charges, and may have been different if such charges had been considered.
Lipper VIP Equity Income Funds Classification Average is an equally weighted average calculation of performance figures for all funds within the Lipper Equity Income Funds classification in the Lipper VIP underlying funds universe. Lipper Equity Income Funds seek relatively high current income and growth of income through investing 60% or more of their portfolios in equities. For the one-year period ended 12/31/10, there were 61 funds in this category. Lipper calculations do not include contract fees, expenses or sales charges, and may have been different if such charges had been considered.
Lipper VIP General U.S. Government Funds Classification Average is an equally weighted average calculation of performance figures for all funds within the Lipper General U.S. Government Funds classification in the Lipper VIP underlying funds universe. Lipper U.S. Government Funds invest primarily in U.S. government and agency issues. For the one-year period ended 12/31/10, there were 64 funds in this category. Lipper calculations do not include contract fees, expenses or sales charges, and may have been different if such charges had been considered.
Lipper VIP High Current Yield Funds Classification Average is an equally weighted average calculation of performance figures for all funds within the Lipper High Current Yield Funds Classification in the Lipper VIP underlying funds universe. Lipper High Current Yield Funds aim at high (relative) current yield from fixed income securities, have no quality or maturity restrictions, and tend to invest in lower grade debt issues. For the one-year period ended 12/31/10, there were 107 funds in this category. Lipper calculations do not include contract fees, expenses or sales charges, and may have been different if such charges had been considered.
Morgan Stanley Capital International (MSCI) All Country (AC) World Index is a free float-adjusted, market capitalization-weighted index designed to measure equity market performance in global developed and emerging markets.
I-1
Morgan Stanley Capital International (MSCI) Emerging Markets (EM) Index is a free float-adjusted, market capitalization-weighted index designed to measure equity market performance in global emerging markets.
Morgan Stanley Capital International (MSCI) Europe, Australasia, Far East (EAFE) Index is a free float-adjusted, market capitalization-weighted index designed to measure equity market performance in global developed markets excluding the U.S. and Canada.
Morgan Stanley Capital International (MSCI) Europe, Australasia, Far East (EAFE) Index Net Return (Local Currency) is a free float-adjusted, market capitalization-weighted index designed to measure equity market performance of global developed markets excluding the U.S. and Canada. The index is calculated in local currency and includes reinvested daily net dividends.
Morgan Stanley Capital International (MSCI) World Index is a free float-adjusted, market capitalization-weighted index designed to measure equity market performance in global developed markets.
NASDAQ Composite Index is a broad-based, market capitalization-weighted index designed to measure all NASDAQ domestic and international based common type stocks listed on The NASDAQ Stock Market.
Russell 1000® Growth Index is market capitalization weighted and measures performance of those Russell 1000 Index companies with higher price-to-book ratios and higher forecasted growth values.
Russell 1000 Index is market capitalization weighted and measures performance of the largest companies in the Russell 3000 Index, which represent the majority of the U.S. market’s total capitalization.
Russell 1000 Value Index is market capitalization weighted and measures performance of those Russell 1000 Index companies with lower price-to-book ratios and lower forecasted growth values.
Russell 2500™ Index is market capitalization weighted and measures performance of the smallest companies in the Russell 3000 Index, which represent a modest amount of the Russell 3000 Index’s total market capitalization.
Russell 2500 Value Index is market capitalization weighted and measures performance of those Russell 2500 Index companies with lower price-to-book ratios and lower forecasted growth values.
Russell 3000® Growth Index is market capitalization weighted and measures performance of those Russell 3000 Index companies with higher price-to-book ratios and higher forecasted growth values.
Russell 3000 Index is market capitalization weighted and measures performance of the largest U.S. companies based on total market capitalization and represents the majority of the investable U.S. equity market.
Russell Midcap® Growth Index is market capitalization weighted and measures performance of those Russell Midcap Index companies with higher price-to-book ratios and higher forecasted growth values.
Russell Midcap Index is market capitalization weighted and measures performance of the smallest companies in the Russell 1000 Index, which represent a modest amount of the Russell 1000 Index’s total market capitalization.
Standard & Poor’s 500 Index (S&P 500) is a market capitalization-weighted index of 500 stocks designed to measure total U.S. equity market performance.
Standard & Poor’s Global REIT Index is designed to measure performance of the investable universe of publicly traded real estate investment trusts. Index constituents generally derive the majority of their revenue from real estate development, management, rental, and/or direct investment in physical property and with local REIT or property trust tax status.
Standard & Poor’s/International Finance Corporation Investable (S&P/IFCI) Composite Index is a free float-adjusted, market capitalization-weighted index designed to measure equity performance in global emerging markets.
I-2
Board Members and Officers
The name, year of birth and address of the officers and board members, as well as their affiliations, positions held with the Trust, principal occupation during the past five years and number of portfolios overseen in the Franklin Templeton Investments fund complex are shown below. Generally, each board member serves until that person’s successor is elected and qualified.
Independent Board Members
| | | | | | | | |
| Name, Year of Birth and Address | | Position | | Length of
Time Served | | Number of
Portfolios in Fund
Complex Overseen
by Board Member* | | Other Directorships Held |
Harris J. Ashton (1932) One Franklin Parkway San Mateo, CA 94403-1906 | | Trustee | | Since 1988 | | 130 | | Bar-S Foods (meat packing company) (1981-2010). |
|
Principal Occupation During Past 5 Years: Director of various companies; and formerly, Director, RBC Holdings, Inc. (bank holding company) (until 2002); and President, Chief Executive Officer and Chairman of the Board, General Host Corporation (nursery and craft centers) (until 1998). |
Sam Ginn (1937) One Franklin Parkway San Mateo, CA 94403-1906 | | Trustee | | Since 2007 | | 106 | | ICO Global Communications (Holdings) Limited (satellite company). |
|
Principal Occupation During Past 5 Years: Private investor; and formerly, Chairman of the Board, Vodafone AirTouch, PLC (wireless company); Chairman of the Board and Chief Executive Officer, AirTouch Communications (cellular communications) (1993-1998) and Pacific Telesis Group (telephone holding company) (1988-1994). |
Edith E. Holiday (1952) One Franklin Parkway San Mateo, CA 94403-1906 | | Trustee | | Since 2005 | | 130 | | Hess Corporation (exploration and refining of oil and gas), H.J. Heinz Company (processed foods and allied products), RTI International Metals, Inc. (manufacture and distribution of titanium), Canadian National Railway (railroad) and White Mountains Insurance Group, Ltd. (holding company). |
|
Principal Occupation During Past 5 Years: Director or Trustee of various companies and trusts; and formerly, Assistant to the President of the United States and Secretary of the Cabinet (1990-1993); General Counsel to the United States Treasury Department (1989-1990); and Counselor to the Secretary and Assistant Secretary for Public Affairs and Public Liaison-United States Treasury Department (1988-1989). |
J. Michael Luttig (1954) One Franklin Parkway San Mateo, CA 94403-1906 | | Trustee | | Since 2009 | | 130 | | Boeing Capital Corporation (aircraft financing). |
|
Principal Occupation During Past 5 Years: Executive Vice President, General Counsel and member of Executive Council, The Boeing Company; and formerly, Federal Appeals Court Judge, U.S. Court of Appeals for the Fourth Circuit (1991-2006). |
Frank A. Olson (1932) One Franklin Parkway
San Mateo, CA 94403-1906 | | Trustee | | Since 2005 | | 130 | | Hess Corporation (exploration and refining of oil and gas). |
|
Principal Occupation During Past 5 Years: Chairman Emeritus, The Hertz Corporation (car rental) (since 2000) (Chairman of the Board (1980-2000) and Chief Executive Officer (1977-1999)); and formerly, Chairman of the Board, President and Chief Executive Officer, UAL Corporation (airlines). |
BOD-1
| | | | | | | | |
| Name, Year of Birth and Address | | Position | | Length of
Time Served | | Number of
Portfolios in Fund
Complex Overseen
by Board Member* | | Other Directorships Held |
Larry D. Thompson (1945) One Franklin Parkway San Mateo, CA 94403-1906 | | Trustee | | Since 2007 | | 138 | | Cbeyond, Inc. (business communications provider) and The Southern Company (energy company). |
|
Principal Occupation During Past 5 Years: Senior Vice President—Government Affairs, General Counsel and Secretary, PepsiCo, Inc. (consumer products); and formerly, Director, Delta Airlines (aviation) (2003-2005) and Providian Financial Corp. (credit card provider) (1997-2001); Senior Fellow of The Brookings Institution (2003-2004); Visiting Professor, University of Georgia School of Law (2004); and Deputy Attorney General, U.S. Department of Justice (2001-2003). |
John B. Wilson (1959) One Franklin Parkway San Mateo, CA 94403-1906 | | Lead Independent Trustee | | Trustee since 2007 and Lead Independent Trustee since 2008 | | 106 | | None |
|
Principal Occupation During Past 5 Years: President and Founder, Hyannis Port Capital, Inc. (real estate and private equity investing); serves on private and non-profit boards; and formerly, Chief Operating Officer and Executive Vice President, Gap, Inc. (retail) (1996-2000); Chief Financial Officer and Executive Vice President—Finance and Strategy, Staples, Inc. (office supplies) (1992-1996); Senior Vice President—Corporate Planning, Northwest Airlines, Inc. (airlines) (1990-1992); and Vice President and Partner, Bain & Company (consulting firm) (1986-1990). |
Interested Board Members and Officers
| | | | | | | | |
| Name, Year of Birth and Address | | Position | | Length of
Time Served | | Number of
Portfolios in Fund
Complex Overseen
by Board Member* | | Other Directorships Held |
**Charles B. Johnson (1933) One Franklin Parkway San Mateo, CA 94403-1906 | | Trustee and Chairman of the Board | | Trustee since 1988 and Chairman of the Board since 1993 | | 130 | | None |
|
Principal Occupation During Past 5 Years: Chairman of the Board, Member—Office of the Chairman and Director, Franklin Resources, Inc.; and officer and/or director or trustee, as the case may be, of some of the other subsidiaries of Franklin Resources, Inc. and of 41 of the investment companies in Franklin Templeton Investments. |
**Rupert H. Johnson, Jr. (1940) One Franklin Parkway San Mateo, CA 94403-1906 | | Trustee | | Since 1988 | | 50 | | None |
|
Principal Occupation During Past 5 Years: Vice Chairman, Member—Office of the Chairman and Director, Franklin Resources, Inc.; Director, Franklin Advisers, Inc.; Senior Vice President, Franklin Advisory Services, LLC; and officer and/or director or trustee, as the case may be, of some of the other subsidiaries of Franklin Resources, Inc. and of 25 of the investment companies in Franklin Templeton Investments. |
BOD-2
| | | | | | | | |
| Name, Year of Birth and Address | | Position | | Length of
Time Served | | Number of
Portfolios in Fund
Complex Overseen
by Board Member* | | Other Directorships Held |
James M. Davis (1952) One Franklin Parkway San Mateo, CA 94403-1906 | | Chief Compliance Officer and Vice President—AML Compliance | | Chief Compliance Officer since 2004 and Vice President—AML Compliance since 2006 | | Not
Applicable | | Not Applicable |
|
Principal Occupation During Past 5 Years: Director, Global Compliance, Franklin Resources, Inc.; officer of some of the other subsidiaries of Franklin Resources, Inc. and of 45 of the investment companies in Franklin Templeton Investments; and formerly, Director of Compliance, Franklin Resources, Inc. (1994-2001). |
Laura F. Fergerson (1962) One Franklin Parkway San Mateo, CA 94403-1906 | | Chief Executive Officer—Finance and Administration | | Since 2009 | | Not
Applicable | | Not Applicable |
|
Principal Occupation During Past 5 Years: Senior Vice President, Franklin Templeton Services, LLC; officer of 45 of the investment companies in Franklin Templeton Investments; and formerly, Director and member of Audit and Valuation Committees, Runkel Funds, Inc. (2003-2004); Assistant Treasurer of most of the investment companies in Franklin Templeton Investments (1997-2003); and Vice President, Franklin Templeton Services, LLC (1997-2003). |
Gaston Gardey (1967) One Franklin Parkway San Mateo, CA 94403-1906 | | Treasurer, Chief Financial Officer and Chief Accounting Officer | | Since 2009 | | Not
Applicable | | Not Applicable |
|
Principal Occupation During Past 5 Years: Director, Fund Accounting, Franklin Templeton Investments; and officer of 27 of the investment companies in Franklin Templeton Investments. |
Aliya S. Gordon (1973) One Franklin Parkway San Mateo, CA 94403-1906 | | Vice President | | Since 2009 | | Not
Applicable | | Not Applicable |
|
Principal Occupation During Past 5 Years: Senior Associate General Counsel, Franklin Templeton Investments; officer of 45 of the investment companies in Franklin Templeton Investments; and formerly, Litigation Associate, Steefel, Levitt & Weiss, LLP (2000-2004). |
David P. Goss (1947) One Franklin Parkway San Mateo, CA 94403-1906 | | Vice President | | Since 2000 | | Not
Applicable | | Not Applicable |
|
Principal Occupation During Past 5 Years:
Senior Associate General Counsel, Franklin Templeton Investments; and officer and/or director, as the case maybe, of some of the other subsidiaries of Franklin Resources, Inc. and of 46 of the investment companies in Franklin Templeton Investments. |
Steven J. Gray (1955) One Franklin Parkway San Mateo, CA 94403-1906 | | Vice President | | Since 2009 | | Not
Applicable | | Not Applicable |
|
Principal Occupation During Past 5 Years: Senior Associate General Counsel, Franklin Templeton Investments; Vice President, Franklin Templeton Distributors, Inc.; and officer of 45 of the investment companies in Franklin Templeton Investments. |
Edward B. Jamieson (1948) One Franklin Parkway San Mateo, CA 94403-1906 | | President and Chief Executive Officer—Investment Management | | Since
April 2010 | | Not
Applicable | | Not Applicable |
|
Principal Occupation During Past 5 Years: President, Chief Investment Officer and Director, Franklin Advisers, Inc.; Executive Vice President, Franklin Templeton Institutional, LLC; and officer and/or trustee, as the case may be, of some of the other subsidiaries of Franklin Resources, Inc. and of 10 of the investment companies in Franklin Templeton Investments. |
BOD-3
| | | | | | | | |
| Name, Year of Birth and Address | | Position | | Length of
Time Served | | Number of
Portfolios in Fund
Complex Overseen
by Board Member* | | Other Directorships Held |
Robert C. Rosselot (1960) 500 East Broward Blvd. Suite 2100 Fort Lauderdale, FL 33394-3091 | | Vice President | | Since 2009 | | Not
Applicable | | Not Applicable |
|
Principal Occupation During Past 5 Years: Senior Associate General Counsel, Franklin Templeton Investments; Assistant Secretary, Franklin Resources, Inc.; Vice President and Secretary, Templeton Investment Counsel, LLC; Vice President, Secretary and Trust Officer, Fiduciary Trust International of the South; and officer of 45 of the investment companies in Franklin Templeton Investments. |
Karen L. Skidmore (1952) One Franklin Parkway San Mateo, CA 94403-1906 | | Vice President and Secretary | | Since 2006 | | Not
Applicable | | Not Applicable |
|
Principal Occupation During Past 5 Years: Senior Associate General Counsel, Franklin Templeton Investments; and officer of 45 of the investment companies in Franklin Templeton Investments. |
Craig S. Tyle (1960) One Franklin Parkway San Mateo, CA 94403-1906 | | Vice President | | Since 2005 | | Not
Applicable | | Not Applicable |
|
Principal Occupation During Past 5 Years: General Counsel and Executive Vice President, Franklin Resources, Inc.; officer of some of the other subsidiaries of Franklin Resources, Inc. and of 45 of the investment companies in Franklin Templeton Investments; and formerly, Partner, Shearman & Sterling, LLP (2004-2005); and General Counsel, Investment Company Institute (ICI) (1997-2004). |
| *We | base the number of portfolios on each separate series of the U.S. registered investment companies within the Franklin Templeton Investments fund complex. These portfolios have a common investment manager or affiliated investment managers. |
| **Charles | B. Johnson and Rupert H. Johnson, Jr. are considered to be interested persons of the Trust under the federal securities laws due to their positions as officers and directors and major shareholders of Franklin Resources, Inc., which is the parent company of the Trust’s investment manager and distributor. |
Note 1: Charles B. Johnson and Rupert H. Johnson, Jr. are brothers.
Note 2: Officer information is current as of the date of this report. It is possible that after this date, information about officers may change.
Note 3: Prior to December 31, 2010, Frank W.T. LaHaye ceased to be a trustee of the Trust.
| *We | base the number of portfolios on each separate series of the U.S. registered investment companies within the Franklin Templeton Investments fund complex. These portfolios have a common investment manager or affiliated investment managers. |
| **Charles | B. Johnson and Rupert H. Johnson, Jr. are considered to be interested persons of the Trust under the federal securities laws due to their positions as officers and directors and major shareholders of Franklin Resources, Inc., which is the parent company of the Trust’s investment manager and distributor. |
Note 1: Charles B. Johnson and Rupert H. Johnson, Jr. are brothers and the father and uncle, respectively, of Jennifer J. Bolt.
Note 2: Officer information is current as of the date of this report. It is possible that after this date, information about officers may change.
The Sarbanes-Oxley Act of 2002 and Rules adopted by the Securities and Exchange Commission require the Fund to disclose whether the Fund’s Audit Committee includes at least one member who is an audit committee financial expert within the meaning of such Act and Rules. The Fund’s Board has determined that there is at least one such financial expert on the Audit Committee and has designated John B. Wilson as its audit committee financial expert. The Board believes that Mr. Wilson qualifies as such an expert in view of his extensive business background and experience, including service as chief financial officer of Staples, Inc. from 1992 to 1996. Mr. Wilson has been a Member and Chairman of the Fund’s Audit Committee since 2007. As a result of such background and experience, the Board believes that Mr. Wilson has acquired an understanding of generally accepted accounting principles and financial statements, the general application of such principles in connection with the accounting estimates, accruals and reserves, and analyzing and evaluating financial statements that present a breadth and level of complexity of accounting issues generally comparable to those of the Fund, as well as an understanding of internal controls and procedures for financial reporting and an understanding of audit committee functions. Mr. Wilson is an independent Board member as that term is defined under the relevant Securities and Exchange Commission Rules and Releases.
The Statement of Additional Information (SAI) includes additional information about the board members and is available, without charge, upon request. Shareholders may call (800) 321-8563 or their insurance companies to request the SAI.
BOD-4
Franklin Templeton Variable Insurance Products Trust
Shareholder Information
Proxy Voting Policies and Procedures
The Trust’s investment manager has established Proxy Voting Policies and Procedures (Policies) that the Trust uses to determine how to vote proxies relating to portfolio securities. Shareholders may view the Trust’s complete Policies online at franklintempleton.com. Alternatively, shareholders may request copies of the Policies free of charge by calling the Proxy Group collect at (954) 527-7678 or by sending a written request to: Franklin Templeton Companies, LLC, 500 East Broward Boulevard, Suite 1500, Fort Lauderdale, FL 33394, Attention: Proxy Group. Copies of the Trust’s proxy voting records are also made available online at franklintempleton.com and posted on the U.S. Securities and Exchange Commission’s website at sec.gov and reflect the most recent 12-month period ended June 30.
Quarterly Statement of Investments
The Trust files a complete statement of investments with the U.S. Securities and Exchange Commission for the first and third quarters for each fiscal year on Form N-Q. Shareholders may view the filed Form N-Q by visiting the Commission’s website at sec.gov. The filed form may also be viewed and copied at the Commission’s Public Reference Room in Washington, DC. Information regarding the operations of the Public Reference Room may be obtained by calling (800) SEC-0330.
SI-1
| | | | | | | | | | | | | | | | |
| VALUE | | BLEND | | GROWTH | | SECTOR | | GLOBAL | | INTERNATIONAL | | HYBRID | | ASSET ALLOCATION | | FIXED INCOME |
| | |
 | | < GAIN FROM OUR PERSPECTIVE® > |
Annual Report
FRANKLIN TEMPLETON
VARIABLE INSURANCE PRODUCTS TRUST
Investment Managers
Franklin Advisers, Inc.
Franklin Advisory Services, LLC
Franklin Mutual Advisers, LLC
Franklin Templeton Institutional, LLC
Templeton Asset Management, Ltd.
Templeton Global Advisors Limited
Templeton Investment Counsel, LLC
Fund Administrator
Franklin Templeton Services, LLC
Distributor
Franklin Templeton Distributors, Inc.
Franklin Templeton Variable Insurance Products Trust (FTVIP) shares are generally sold to insurance company separate accounts (Separate Account) to serve as the investment vehicles for both variable annuity and variable life insurance contracts and to certain funds of funds.
Authorized for distribution to investors in Separate Accounts only when accompanied or preceded by the current prospectus for the applicable contract, which includes the Separate Account and the FTVIP prospectuses. Investors should carefully consider a fund’s investment goals, risks, charges and expenses before investing. The prospectus contains this and other information; please read it carefully before investing.
To ensure the highest quality of service, telephone calls to or from our service departments may be monitored, recorded and accessed. These calls can be identified by the presence of a regular beeping tone.
| | |
| © 2011 Franklin Templeton Investments. All rights reserved. | | FTVIP A 02/11 |
| (a) | The Registrant has adopted a code of ethics that applies to its principal executive officers and principal financial and accounting officer. |
| (f) | Pursuant to Item 12 (a) (1), the Registrant is attaching as an exhibit a copy of its code of ethics that applies to its principal executive officers and principal financial and accounting officer. |
| Item 3. | Audit Committee Financial Expert. |
| | | | |
| (a) | | (1) | | The Registrant has an audit committee financial expert serving on its audit committee. |
| | |
| | (2) | | The audit committee financial expert is John B. Wilson and he is “independent” as defined under the relevant Securities and Exchange Commission Rules and Releases. |
| Item 4. | Principal Accountant Fees and Services. |
(a) Audit Fees
The aggregate fees paid to the principal accountant for professional services rendered by the principal accountant for the audit of the registrant’s annual financial statements or for services that are normally provided by the principal accountant in connection with statutory and regulatory filings or engagements were $849,457 for the fiscal year ended December 31, 2010 and $906,023 for the fiscal year ended December 31, 2009.
(b) Audit-Related Fees
There were no fees paid to the principal accountant for assurance and related services rendered by the principal accountant to the registrant that are reasonably related to the performance of the audit of the registrant’s financial statements and are not reported under paragraph (a) of Item 4.
There were no fees paid to the principal accountant for assurance and related services rendered by the principal accountant to the registrant’s investment adviser and any entity controlling, controlled by or under common control with the investment adviser that provides ongoing services to the registrant that are reasonably related to the performance of the audit of their financial statements.
(c) Tax Fees
The aggregate fees paid to the principal accountant for professional services rendered by the principal accountant to the registrant for tax compliance, tax advice and tax planning were $1,290 for the fiscal year ended December 31, 2010 and $1,250 for the fiscal year ended December 31, 2009. The services for which these fees were paid included preparation of tax returns for foreign governments.
The aggregate fees paid to the principal accountant for professional services rendered by the principal accountant to the registrant’s investment adviser and any entity controlling, controlled by or under common control with the investment adviser that provides ongoing services to the registrant for tax compliance, tax advice and tax planning were $35,000 for the fiscal year ended December 31, 2010 and $2,000 for the fiscal year ended December 31, 2009. The services for which these fees were paid included technical tax consultation for capital gain tax reporting to foreign governments and derivative instruments.
(d) All Other Fees
The aggregate fees paid to the principal accountant for products and services rendered by the principal accountant to the registrant not reported in paragraphs (a)-(c) of Item 4 were $12,501 for the fiscal year ended December 31, 2010 and $0 for the fiscal year ended December 31, 2009. The services for which these fees were paid include review of materials provided to the fund Board in connection with the investment management contract renewal process.
The aggregate fees paid to the principal accountant for products and services rendered by the principal accountant to the registrant’s investment adviser and any entity controlling, controlled by or under common control with the investment adviser that provides ongoing
services to the registrant other than services reported in paragraphs (a)-(c) of Item 4 were $132,299 for the fiscal year ended December 31, 2010 and $0 for the fiscal year ended December 31, 2009. The services for which these fees were paid include review of materials provided to the fund Board in connection with the investment management contract renewal process.
(e) (1) The registrant’s audit committee is directly responsible for approving the services to be provided by the auditors, including:
(i) pre-approval of all audit and audit related services;
(ii) pre-approval of all non-audit related services to be provided to the Fund by the auditors;
(iii) pre-approval of all non-audit related services to be provided to the registrant by the auditors to the registrant’s investment adviser or to any entity that controls, is controlled by or is under common control with the registrant’s investment adviser and that provides ongoing services to the registrant where the non-audit services relate directly to the operations or financial reporting of the registrant; and
(iv) establishment by the audit committee, if deemed necessary or appropriate, as an alternative to committee pre-approval of services to be provided by the auditors, as required by paragraphs (ii) and (iii) above, of policies and procedures to permit such services to be pre-approved by other means, such as through establishment of guidelines or by action of a designated member or members of the committee; provided the policies and procedures are detailed as to the particular service and the committee is informed of each service and such policies and procedures do not include delegation of audit committee responsibilities, as contemplated under the Securities Exchange Act of 1934, to management; subject, in the case of (ii) through (iv), to any waivers, exceptions or exemptions that may be available under applicable law or rules.
(e) (2) None of the services provided to the registrant described in paragraphs (b)-(d) of Item 4 were approved by the audit committee pursuant to paragraph (c)(7)(i)(C) of Rule 2-01 of regulation S-X.
(f) No disclosures are required by this Item 4(f).
(g) The aggregate non-audit fees paid to the principal accountant for services rendered by the principal accountant to the registrant and the registrant’s investment adviser and any entity controlling, controlled by or under common control with the investment adviser that provides ongoing services to the registrant were $181,090 for the fiscal year ended December 31, 2010 and $3,250 for the fiscal year ended December 31, 2009.
(h) The registrant’s audit committee of the board has considered whether the provision of non-audit services that were rendered to the registrant’s investment adviser (not including any sub-adviser whose role is primarily portfolio management and is subcontracted with or overseen by another investment adviser), and any entity controlling, controlled by, or under common control with the investment adviser that
provides ongoing services to the registrant that were not pre-approved pursuant to paragraph (c)(7)(ii) of Rule 2-01 of Regulation S-X is compatible with maintaining the principal accountant’s independence.
| Item 5. | Audit Committee of Listed Registrants. N/A |
| Item 6. | Schedule of Investments. N/A |
| Item 7. | Disclosure of Proxy Voting Policies and Procedures for Closed-End Management Investment Companies. N/A |
| Item 8. | Portfolio Managers of Closed-End Management Investment Companies. N/A |
| Item 9. | Purchases of Equity Securities by Closed-End Management Investment Companies and Affiliated Purchasers N/A |
| Item 10. | Submission of Matters to a vote of Security Holders. |
There have been no changes to the procedures by which shareholders may recommend nominees to the Registrant’s Board of Trustees that would require disclosure herein.
| Item 11. | Controls and Procedures. |
(a) Evaluation of Disclosure Controls and Procedures. The Registrant maintains disclosure controls and procedures that are designed to ensure that information required to be disclosed in the Registrant’s filings under the Securities Exchange Act of 1934 and the Investment Company Act of 1940 is recorded, processed, summarized and reported within the periods specified in the rules and forms of the Securities and Exchange Commission. Such information is accumulated and communicated to the Registrant’s management, including its principal executive officer and principal financial officer, as appropriate, to allow timely decisions regarding required disclosure. The Registrant’s management, including the principal executive officer and the principal financial officer, recognizes that any set of controls and procedures, no matter how well designed and operated, can provide only reasonable assurance of achieving the desired control objectives.
Within 90 days prior to the filing date of this Shareholder Report on Form N-CSR, the Registrant had carried out an evaluation, under the supervision and with the participation of the Registrant’s management, including the Registrant’s principal executive officer and the Registrant’s principal financial officer, of the effectiveness of the design and operation of the Registrant’s disclosure controls and procedures. Based on such evaluation, the Registrant’s principal executive officer and principal financial officer concluded that the Registrant’s disclosure controls and procedures are effective.
(b) Changes in Internal Controls. There have been no significant changes in the Registrant’s internal controls or in other factors that could significantly affect the internal controls subsequent to the date of their evaluation in connection with the preparation of this Shareholder Report on Form N-CSR.
(a) (1) Code of Ethics
(a) (2) Certifications pursuant to Section 302 of the Sarbanes-Oxley Act of 2002 of Laura F. Fergerson, Chief Executive Officer - Finance and Administration, and Gaston Gardey, Chief Financial Officer and Chief Accounting Officer
(b) Certifications pursuant to Section 906 of the Sarbanes-Oxley Act of 2002 of Laura F. Fergerson, Chief Executive Officer - Finance and Administration, and Gaston Gardey, Chief Financial Officer and Chief Accounting Officer
SIGNATURES
Pursuant to the requirements of the Securities Exchange Act of 1934 and the Investment Company Act of 1940, the registrant has duly caused this report to be signed on its behalf by the undersigned, thereunto duly authorized.
FRANKLIN TEMPLETON VARIABLE INSURANCE PRODUCTS TRUST
| | |
| By: | | /s/ Laura F. Fergerson |
| | Laura F. Fergerson |
| | Chief Executive Officer – Finance and Administration |
| Date | | February 25, 2011 |
Pursuant to the requirements of the Securities Exchange Act of 1934 and the Investment Company Act of 1940, this report has been signed below by the following persons on behalf of the registrant and in the capacities and on the dates indicated.
| | |
| By: | | /s/ Laura F. Fergerson |
| | Laura F. Fergerson |
| | Chief Executive Officer – Finance and Administration |
| Date | | February 25, 2011 |
| |
| By: | | /s/ Gaston Gardey |
| | Gaston Gardey |
| | |
| | Chief Financial Officer and |
| | Chief Accounting Officer |
| Date | | February 25, 2011 |