UNITED STATES
SECURITIES AND EXCHANGE COMMISSION
Washington, D.C. 20549
FORM N-CSR
CERTIFIED SHAREHOLDER REPORT OF REGISTERED MANAGEMENT INVESTMENT COMPANIES
Investment Company Act file number 811-05583
Franklin Templeton Variable Insurance Products Trust
(Exact name of registrant as specified in charter)
One Franklin Parkway, San Mateo, CA 94403-1906
(Address of principal executive offices) (Zip code)
Craig S. Tyle, One Franklin Parkway, San Mateo, CA 94403-1906
(Name and address of agent for service)
Registrant’s telephone number, including area code: (650) 312-2000
Date of fiscal year end: 12/31
Date of reporting period: 12/31/09
| Item 1. | Reports to Stockholders. |

DECEMBER 31, 2009
FRANKLIN TEMPLETON
VARIABLE INSURANCE PRODUCTS TRUST
ANNUAL REPORT

FRANKLIN TEMPLETON VARIABLE INSURANCE PRODUCTS TRUST ANNUAL REPORT
TABLEOF CONTENTS
*Not part of the annual report
NOT FDIC INSURED | MAY LOSE VALUE | NO BANK GUARANTEE
MASTER CLASS – 4
IMPORTANT NOTESTOPERFORMANCE INFORMATION
Performance data is historical and cannot predict or guarantee future results. Principal value and investment return will fluctuate with market conditions, and you may have a gain or loss when you withdraw your money. Inception dates of the funds may have preceded the effective dates of the subaccounts, contracts, or their availability in all states.
When reviewing the index comparisons, please keep in mind that indexes have a number of inherent performance differentials over the funds. First, unlike the funds, which must hold a minimum amount of cash to maintain liquidity, indexes do not have a cash component. Second, the funds are actively managed and, thus, are subject to management fees to cover salaries of securities analysts or portfolio managers in addition to other expenses. Indexes are unmanaged and do not include any commissions or other expenses typically associated with investing in securities. Third, indexes often contain a different mix of securities than the fund to which they are compared. Additionally, please remember that indexes are simply a measure of performance and cannot be invested in directly.
i
FRANKLIN FLEX CAP GROWTH SECURITIES FUND
This annual report for Franklin Flex Cap Growth Securities Fund covers the fiscal year ended December 31, 2009.
Performance Summary as of 12/31/09
Average annual total return of Class 4 shares* represents the average annual change in value, assuming reinvestment of dividends and capital gains. Average returns smooth out variations in returns, which can be significant; they are not the same as year-by-year results.
Periods ended 12/31/09
| | | | | | |
| | | 1-Year | | 3-Year | | Since Inception
(3/1/05) |
Average Annual Total Return | | +32.69% | | -0.63% | | +1.88% |
*For the period beginning 2/29/08, Class 4 performance reflects a 12b-1 fee expense of 0.35% per year, which affects future performance. Class 4 performance prior to 2/29/08 reflects historical Class 2 performance which includes a 12b-1 fee expense of 0.25% per year. Since 2/29/08 (effective date), the average annual total return of Class 4 shares was -1.48%. The investment manager and administrator have contractually agreed to waive or limit their respective fees and to assume as their own expense certain expenses otherwise payable by the Fund so that common annual Fund operating expenses (i.e., a combination of investment management fees, fund administration fees, and other expenses, but excluding Rule 12b-1 fees and acquired fund fees and expenses) do not exceed 0.68% (other than certain nonroutine expenses or costs, including those relating to litigation, indemnification, reorganizations and liquidations) until 4/30/10. If the manager and administrator had not waived fees, the Fund’s total returns would have been lower.
Total Return Index Comparison for a Hypothetical $10,000 Investment (3/1/05–12/31/09)
The graph below shows the change in value of a hypothetical $10,000 investment in the Fund over the indicated period and includes reinvestment of any income or distributions. The Fund’s performance* is compared to the performance of the Russell 3000® Growth Index. One cannot invest directly in an index, and an index is not representative of the Fund’s portfolio. Please see Important Notes to Performance Information preceding the Fund Summaries.
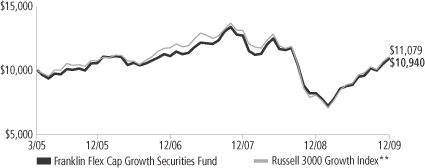
**Source: © 2009 Morningstar. Please see Index Descriptions following the Fund Summaries.
Franklin Flex Cap Growth Securities Fund – Class 4
Performance reflects the Fund’s Class 4 operating expenses, but does not include any contract fees, expenses or sales charges. If they had been included, performance would be lower. These charges and deductions, particularly for variable life policies, can have a significant effect on contract values and insurance benefits. See the contract prospectus for a complete description of these expenses, including sales charges.
Performance data represent past performance, which does not guarantee future results. Investment return and principal value will fluctuate, and you may have a gain or loss when you sell your shares.
Current performance may differ from figures shown.
FFC-1
Fund Goal and Main Investments: Franklin Flex Cap Growth Securities Fund seeks capital appreciation. The Fund normally invests predominantly in equity securities of companies across the entire market capitalization spectrum that the manager believes have the potential for capital appreciation.
Performance Overview
You can find the Fund’s one-year total return in the Performance Summary. The Fund underperformed its benchmark, the Russell 3000 Growth Index, which had a +37.01% total return for the same period.1
Economic and Market Overview
The U.S. economy ended 2009 in much better shape than it began. Economic challenges remain, such as stalled consumer confidence and job prospects for the unemployed as stimulus measures wind down. However, several reports pointed to improving economic conditions. In the year’s second half, corporate profit growth was higher than earlier estimates, which may allow businesses to build inventory following a long period of inventory drawdowns.
Throughout the year, the Federal Open Market Committee kept monetary policy unchanged, announcing it intends to hold the federal funds target rate in the 0% to 0.25% range “for an extended period” as it lays the groundwork for an eventual tightening of monetary policy. Late in the period, the labor market improved somewhat as the economy lost fewer jobs than expected and the unemployment rate fell slightly, dropping from a period high of 10.2% in October to 10.0% at period-end.2
U.S. gross domestic product grew at a 2.2% annualized rate in 2009’s third quarter after shrinking by 0.7% in the prior three months. This was the first expansion since 2008’s second quarter. As economic conditions improved, oil prices increased from $44 per barrel in December 2008 to $79 at year-end, still well below 2008 highs. December’s inflation rate was an annualized 2.7%.2 Core inflation, which excludes food and energy costs, rose at a 1.8% annualized rate, which was within the Federal Reserve Board’s informal target range of 1.5% to 2.0%.2
1. Source: © 2009 Morningstar. One cannot invest directly in an index, and an index is not representative of the Fund’s portfolio. Please see Index Descriptions following the Fund Summaries.
2. Source: Bureau of Labor Statistics.
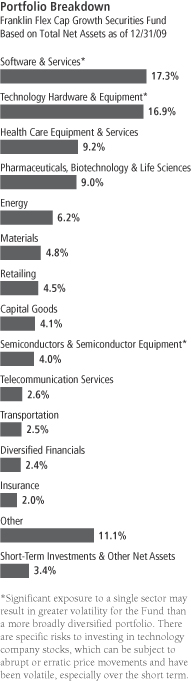
Fund Risks: The Fund’s investments in stocks may offer the potential for long-term gains but can be subject to short-term price fluctuations. Smaller and midsize company securities can increase the risk of greater price fluctuations, particularly over the short term. Smaller, newer or unseasoned companies can also be particularly sensitive to changing economic conditions, and their prospects for growth are less certain than those of larger, more established companies. The Fund may have significant investments in particular sectors such as technology, which can be highly volatile. The Fund’s prospectus also includes a description of the main investment risks.
FFC-2
Most stocks suffered significant losses through early March 2009 as investors worried about an uncertain future. Stocks then recovered from 12-year lows as economic data improved and investors perceived many bargains among the bear market fallout. For the 12 months under review, the blue chip stocks of the Dow Jones Industrial Average delivered a total return of +22.68%, while the broader Standard & Poor’s 500 Index posted a +26.46% total return and the technology-heavy NASDAQ Composite Index returned +45.32%.1 All sectors posted gains for the period, with the strongest returns from the information technology, materials and consumer discretionary sectors.
Investment Strategy
We use fundamental, bottom-up research to seek companies meeting our criteria of growth potential, quality and valuation. In seeking sustainable growth characteristics, we look for companies we believe can produce sustainable earnings and cash flow growth, evaluating the long-term market opportunity and competitive structure of an industry to target leaders and emerging leaders. We define quality companies as those with strong and improving competitive positions in attractive markets. We also believe important attributes of quality are experienced and talented management teams as well as financial strength reflected in the capital structure, gross and operating margins, free cash flow generation and returns on capital employed. Our valuation analysis includes a range of potential outcomes based on an assessment of multiple scenarios. In assessing value, we consider whether security prices fully reflect the balance of the sustainable growth opportunities relative to business and financial risks.
Manager’s Discussion
From a sector perspective, the Fund’s consumer staples, health care and telecommunication services sectors helped performance relative to the Russell 3000 Growth Index.3 An underweighting in the consumer staples sector, specifically in the food and staples retailing industry, benefited relative results. In the health care sector, stock selection gave
3. The consumer staples sector comprises food and staples retailing; food, beverage and tobacco; and household and personal products in the SOI. The health care sector comprises health care equipment and services; and pharmaceuticals, biotechnology and life sciences in the SOI.
FFC-3
relative Fund performance a boost, and biotechnology company Genentech and robotic surgical systems maker Intuitive Surgical were key contributors. Genentech was acquired by Roche Holdings during the period. Our investments in the wireless telecommunication services industry also helped the Fund.4 Additional major contributors to relative results included credit card company MasterCard, castings manufacturer Precision Castparts, and subsea oil and gas equipment maker FMC Technologies.
In contrast, our investments in information technology, financials and industrials weighed on the Fund’s relative performance.5 Significant negative impact came from stock selection in the information technology sector, notably from holdings FLIR Systems, a specialized imaging systems manufacturer, and Microsemi, a semiconductor company. We exited the Fund’s position in Microsemi by period-end. In the financials sector, our investment in commercial bank Wells Fargo and an overweighted allocation to insurance companies, also hurt relative results. In addition, stock selection in the industrials sector constrained relative Fund performance, and medical and pharmaceutical waste management company Stericycle and freight and logistics company Expeditors International of Washington were major detractors. Outside of these sectors, biotechnology company Gilead Sciences and medical devices manufacturer C.R. Bard hindered relative results.
Thank you for your participation in Franklin Flex Cap Growth Securities Fund. We look forward to serving your future investment needs.
4. Wireless telecommunication services holdings are in the telecommunication services sector in the SOI.
5. The information technology sector comprises semiconductors and semiconductor equipment, software and services, and technology hardware and equipment in the SOI. The financials sector comprises banks, diversified financials and insurance in the SOI. The industrials sector comprises capital goods, commercial and professional services, and transportation in the SOI.
The foregoing information reflects our analysis, opinions and portfolio holdings as of December 31, 2009, the end of the reporting period. The way we implement our main investment strategies and the resulting portfolio holdings may change depending on factors such as market and economic conditions. These opinions may not be relied upon as investment advice or an offer for a particular security. The information is not a complete analysis of every aspect of any market, country, industry, security or the Fund. Statements of fact are from sources considered reliable, but the investment manager makes no representation or warranty as to their completeness or accuracy. Although historical performance is no guarantee of future results, these insights may help you understand our investment management philosophy.
Top 10 Holdings
Franklin Flex Cap Growth Securities Fund 12/31/09
| | |
Company
Sector/Industry | | % of Total
Net Assets |
| Apple Inc. | | 3.2% |
| Technology Hardware & Equipment | | |
| Google Inc., A | | 2.9% |
| Software & Services | | |
| QUALCOMM Inc. | | 2.8% |
| Technology Hardware & Equipment | | |
| Cisco Systems Inc. | | 2.7% |
| Technology Hardware & Equipment | | |
| Hewlett-Packard Co. | | 2.5% |
| Technology Hardware & Equipment | | |
| MasterCard Inc., A | | 2.5% |
| Software & Services | | |
| Praxair Inc. | | 2.1% |
| Materials | | |
| American Tower Corp., A | | 2.0% |
| Telecommunication Services | | |
| Visa Inc., A | | 1.9% |
| Software & Services | | |
| NetApp Inc. | | 1.9% |
| Technology Hardware & Equipment | | |
The dollar value, number of shares or principal amount, and names of all portfolio holdings are listed in the Fund’s Statement of Investments (SOI).
FFC-4
Fund Expenses
As an investor in a variable insurance contract (Contract) that indirectly provides for investment in an underlying mutual fund, you can incur transaction and/or ongoing expenses at both the Fund level and the Contract level.
| • | | Transaction expenses can include sales charges (loads) on purchases, redemption fees, surrender fees, transfer fees and premium taxes. |
| • | | Ongoing expenses can include management fees, distribution and service (12b-1) fees, contract fees, annual maintenance fees, mortality and expense risk fees and other fees and expenses. All mutual funds and Contracts have some types of ongoing expenses. |
The expenses shown in the table are meant to highlight ongoing expenses at the Fund level only and do not include ongoing expenses at the Contract level, or transaction expenses at either the Fund or Contract level. While the Fund does not have transaction expenses, if the transaction and ongoing expenses at the Contract level were included, the expenses shown below would be higher. You should consult your Contract prospectus or disclosure document for more information.
The table shows Fund-level ongoing expenses and can help you understand these expenses and compare them with those of other mutual funds offered through the Contract. The table assumes a $1,000 investment held for the six months indicated. Please refer to the Fund prospectus for additional information on operating expenses.
Actual Fund Expenses
The first line (Actual) of the table provides actual account values and expenses. The “Ending Account Value” is derived from the Fund’s actual return, which includes the effect of ongoing Fund expenses, but does not include the effect of ongoing Contract expenses.
You can estimate the Fund-level expenses you incurred during the period by following these steps. Of course, your account value and expenses will differ from those in this illustration:
| 1. | Divide your account value by $1,000. |
If an account had an $8,600 value, then $8,600 ÷ $1,000 = 8.6.
| 2. | Multiply the result by the number under the heading “Fund-Level Expenses Incurred During Period.” |
If Fund-Level Expenses Incurred During Period were $7.50, then 8.6 x $7.50 = $64.50.
In this illustration, the estimated expenses incurred this period at the Fund level are $64.50.
Franklin Flex Cap Growth Securities Fund – Class 4
FFC-5
Hypothetical Example for Comparison with Other Mutual Funds
Information in the second line (Hypothetical) of the table can help you compare ongoing expenses of the Fund with those of other mutual funds offered through the Contract. This information may not be used to estimate the actual ending account balance or expenses you incurred during the period. The hypothetical “Ending Account Value” is based on the Fund’s actual expense ratio and an assumed 5% annual rate of return before expenses, which does not represent the Fund’s actual return. The figure under the heading “Fund-Level Expenses Incurred During Period” shows the hypothetical expenses your account would have incurred under this scenario. You can compare this figure with the 5% hypothetical examples that appear in shareholder reports of other funds offered through a Contract.
| | | | | | | | | |
| Class 4 | | Beginning
Account Value 7/1/09 | | Ending
Account Value 12/31/09 | | Fund-Level Expenses Incurred
During Period* 7/1/09–12/31/09 |
Actual | | $ | 1,000 | | $ | 1,229.40 | | $ | 5.79 |
Hypothetical (5% return before expenses) | | $ | 1,000 | | $ | 1,020.01 | | $ | 5.24 |
*Expenses are calculated using the most recent six-month annualized expense ratio, net of expense waivers, for the Fund’s Class 4 shares (1.03%), which does not include any ongoing expenses of the Contract for which the Fund is an investment option, multiplied by the average account value over the period, multiplied by 184/365 to reflect the one-half year period.
FFC-6
SUPPLEMENT DATED DECEMBER 18, 2009
TOTHE PROSPECTUS
DATED MAY 1, 2009
AS PREVIOUSLY AMENDED
FRANKLIN FLEX CAP GROWTH SECURITIES FUND
(ASERIESOF FRANKLIN TEMPLETON VARIABLE INSURANCE PRODUCTS TRUST)
The prospectus is amended as follows.
The Portfolio management team under the “Management” section on page FFC-7 is revised as follows:
The Fund is managed by a team of dedicated professionals focused on investments in sectors that are believed to have growth potential. The portfolio managers of the team are as follows:
CONRAD B. HERRMANN CFA
Senior Vice President of Franklin Advisers, Inc. (Advisers)
Mr. Herrmann has been the lead portfolio manager of the Fund since its inception. He has primary responsibility for the investments of the Fund. Mr. Herrmann has final authority over all aspects of the Fund’s investment portfolio, including but not limited to, purchases and sales of individual securities, portfolio risk assessment, and the management of daily cash balances in accordance with anticipated investment management requirements. The degree to which Mr. Herrmann may perform these functions, and the nature of these functions, may change from time to time. He joined Franklin Templeton Investments in 1989.
MATT MOBERG, CPA
Vice President of Advisers
Mr. Moberg has been a portfolio manager of the Fund since its inception, providing research and advice on the purchases and sales of individual securities, and portfolio risk assessment. He joined Franklin Templeton Investments in 1998.
CFA® and Charted Financial Analyst® are trademarks owned by CFA Institute.
Please retain this supplement for future reference.
FFC-7
Franklin Templeton Variable Insurance Products Trust
Financial Highlights
Franklin Flex Cap Growth Securities Fund
| | | | | | | | | | | | | | | | | | | | |
| | | Year Ended December 31, | |
| Class 2 | | 2009 | | | 2008 | | | 2007 | | | 2006 | | | 2005a | |
| | | | |
Per share operating performance | | | | | | | | | | | | | | | | | | | | |
(for a share outstanding throughout the year) | | | | | | | | | | | | | | | | | | | | |
Net asset value, beginning of year | | $ | 8.22 | | | $ | 12.72 | | | $ | 11.14 | | | $ | 10.59 | | | $ | 10.00 | |
| | | | |
Income from investment operationsb: | | | | | | | | | | | | | | | | | | | | |
Net investment income(loss)c | | | (— | )d | | | — | d | | | 0.04 | | | | 0.02 | | | | 0.03 | |
Net realized and unrealized gains (losses) | | | 2.71 | | | | (4.49 | ) | | | 1.55 | | | | 0.53 | | | | 0.57 | |
| | | | |
Total from investment operations | | | 2.71 | | | | (4.49 | ) | | | 1.59 | | | | 0.55 | | | | 0.60 | |
| | | | |
Less distributions from net investment income | | | — | | | | (0.01 | ) | | | (0.01 | ) | | | — | d | | | (0.01 | ) |
| | | | |
Net asset value, end of year | | $ | 10.93 | | | $ | 8.22 | | | $ | 12.72 | | | $ | 11.14 | | | $ | 10.59 | |
| | | | |
| | | | | |
Total returne | | | 32.97% | | | | (35.31)% | | | | 14.32% | | | | 5.20% | | | | 5.99% | |
Ratios to average net assetsf | | | | | | | | | | | | | | | | | | | | |
Expenses before waiver and payments by affiliates | | | 1.19% | | | | 1.21% | | | | 1.25% | | | | 1.32% | | | | 1.45% | |
Expenses net of waiver and payments by affiliates | | | 0.93%g | | | | 0.93% | | | | 0.93% | g | | | 0.93% | g | | | 0.93% | g |
Net investment income (loss) | | | (0.01)% | | | | 0.04% | | | | 0.31% | | | | 0.19% | | | | 0.30% | |
| | | | | |
Supplemental data | | | | | | | | | | | | | | | | | | | | |
Net assets, end of year (000’s) | | $ | 244,768 | | | $ | 195,425 | | | $ | 206,218 | | | $ | 60,520 | | | $ | 26,935 | |
Portfolio turnover rate | | | 33.64% | | | | 32.76% | | | | 30.15% | | | | 67.01% | | | | 36.58% | |
aFor the period March 1, 2005 (commencement of operations) to December 31, 2005.
bThe amount shown for a share outstanding throughout the period may not correlate with the Statement of Operations for the period due to the timing of sales and repurchases of the Fund shares in relation to income earned and/or fluctuating market value of the investments of the Fund.
cBased on average daily shares outstanding.
dAmount rounds to less than $0.01 per share.
eTotal return does not include any fees, charges or expenses imposed by the variable annuity and life insurance contracts for which the Franklin Templeton
Variable Insurance Products Trust serves as an underlying investment vehicle. Total return is not annualized for periods less than one year.
fRatios are annualized for periods less than one year.
gBenefit of expense reduction rounds to less than 0.01%.
The accompanying notes are an integral part of these financial statements.
FFC-8
Franklin Templeton Variable Insurance Products Trust
Financial Highlights (continued)
Franklin Flex Cap Growth Securities Fund
| | | | | | | | |
| | | Year Ended
December 31, | |
| Class 4 | | 2009 | | | 2008a | |
| | | | |
Per share operating performance | | | | | | | | |
(for a share outstanding throughout the year) | | | | | | | | |
Net asset value, beginning of year | | $ | 8.21 | | | $ | 11.22 | |
| | | | |
Income from investment operationsb: | | | | | | | | |
Net investment income (loss)c | | | (0.01 | ) | | | — | d |
Net realized and unrealized gains (losses) | | | 2.69 | | | | (2.98 | ) |
| | | | |
Total from investment operations | | | 2.68 | | | | (2.98 | ) |
| | | | |
Less distributions from net investment income | | | (0.01 | ) | | | (0.03 | ) |
| | | | |
Net asset value, end of year | | $ | 10.88 | | | $ | 8.21 | |
| | | | |
| | |
Total returne | | | 32.69% | | | | (26.68)% | |
Ratios to average net assetsf | | | | | | | | |
Expenses before waiver and payments by affiliates | | | 1.29% | | | | 1.31% | |
Expenses net of waiver and payments by affiliates | | | 1.03% | g | | | 1.03% | |
Net investment income (loss) | | | (0.11)% | | | | (0.06)% | |
| | |
Supplemental data | | | | | | | | |
Net assets, end of year (000’s) | | $ | 218,798 | | | $ | 50,268 | |
Portfolio turnover rate | | | 33.64% | | | | 32.76% | |
aFor the period February 29, 2008 (effective date) to December 31, 2008.
bThe amount shown for a share outstanding throughout the period may not correlate with the Statement of Operations for the period due to the timing of sales and repurchases of the Fund shares in relation to income earned and/or fluctuating market value of the investments of the Fund.
cBased on average daily shares outstanding.
dAmount rounds to less than $0.01 per share.
eTotal return does not include any fees, charges or expenses imposed by the variable annuity and life insurance contracts for which the Franklin Templeton Variable Insurance Products Trust serves as an underlying investment vehicle. Total return is not annualized for periods less than one year.
fRatios are annualized for periods less than one year.
gBenefit of expense reduction rounds to less than 0.01%.
The accompanying notes are an integral part of these financial statements.
FFC-9
Franklin Templeton Variable Insurance Products Trust
Statement of Investments, December 31, 2009
| | | | | |
| Franklin Flex Cap Growth Securities Fund | | Shares | | Value |
Common Stocks 96.6% | | | | | |
Automobiles & Components 1.5% | | | | | |
Johnson Controls Inc. | | 250,000 | | $ | 6,810,000 |
| | | | | |
Banks 0.7% | | | | | |
Wells Fargo & Co. | | 115,000 | | | 3,103,850 |
| | | | | |
Capital Goods 4.1% | | | | | |
Danaher Corp. | | 63,000 | | | 4,737,600 |
Flowserve Corp. | | 45,000 | | | 4,253,850 |
aJacobs Engineering Group Inc. | | 70,000 | | | 2,632,700 |
Precision Castparts Corp. | | 42,000 | | | 4,634,700 |
United Technologies Corp. | | 40,000 | | | 2,776,400 |
| | | | | |
| | | | | 19,035,250 |
| | | | | |
Commercial & Professional Services 1.2% | | | | | |
aStericycle Inc. | | 100,000 | | | 5,517,000 |
| | | | | |
Consumer Durables & Apparel 1.5% | | | | | |
NIKE Inc., B | | 70,000 | | | 4,624,900 |
Polo Ralph Lauren Corp. | | 30,000 | | | 2,429,400 |
| | | | | |
| | | | | 7,054,300 |
| | | | | |
Consumer Services 0.6% | | | | | |
aApollo Group Inc., A | | 45,000 | | | 2,726,100 |
| | | | | |
Diversified Financials 2.4% | | | | | |
BlackRock Inc. | | 22,000 | | | 5,108,400 |
JPMorgan Chase & Co. | | 50,000 | | | 2,083,500 |
T. Rowe Price Group Inc. | | 70,000 | | | 3,727,500 |
| | | | | |
| | | | | 10,919,400 |
| | | | | |
Energy 6.2% | | | | | |
aConcho Resources Inc. | | 105,000 | | | 4,714,500 |
aFMC Technologies Inc. | | 85,000 | | | 4,916,400 |
Occidental Petroleum Corp. | | 65,000 | | | 5,287,750 |
aPetrohawk Energy Corp. | | 225,000 | | | 5,397,750 |
Smith International Inc. | | 137,900 | | | 3,746,743 |
XTO Energy Inc. | | 100,000 | | | 4,653,000 |
| | | | | |
| | | | | 28,716,143 |
| | | | | |
Food & Staples Retailing 1.7% | | | | | |
CVS Caremark Corp. | | 250,000 | | | 8,052,500 |
| | | | | �� |
Food, Beverage & Tobacco 1.8% | | | | | |
aHansen Natural Corp | | 95,000 | | | 3,648,000 |
PepsiCo Inc. | | 80,000 | | | 4,864,000 |
| | | | | |
| | | | | 8,512,000 |
| | | | | |
Health Care Equipment & Services 9.2% | | | | | |
Aetna Inc. | | 160,000 | | | 5,072,000 |
Baxter International Inc. | | 70,000 | | | 4,107,600 |
C. R. Bard Inc. | | 55,000 | | | 4,284,500 |
aDaVita Inc. | | 70,000 | | | 4,111,800 |
aExpress Scripts Inc. | | 75,000 | | | 6,483,750 |
aIntuitive Surgical Inc. | | 22,000 | | | 6,673,040 |
Stryker Corp. | | 65,000 | | | 3,274,050 |
aVarian Medical Systems Inc. | | 75,000 | | | 3,513,750 |
aVCA Antech Inc. | | 215,000 | | | 5,357,800 |
| | | | | |
| | | | | 42,878,290 |
| | | | | |
FFC-10
Franklin Templeton Variable Insurance Products Trust
Statement of Investments, December 31, 2009 (continued)
| | | | | |
| Franklin Flex Cap Growth Securities Fund | | Shares | | Value |
Common Stocks (continued) | | | | | |
Household & Personal Products 1.0% | | | | | |
The Procter & Gamble Co. | | 75,000 | | $ | 4,547,250 |
| | | | | |
Insurance 2.0% | | | | | |
Aflac Inc. | | 150,000 | | | 6,937,500 |
Assurant Inc. | | 75,000 | | | 2,211,000 |
| | | | | |
| | | | | 9,148,500 |
| | | | | |
Materials 4.8% | | | | | |
Celanese Corp., A | | 160,000 | | | 5,136,000 |
Ecolab Inc. | | 170,000 | | | 7,578,600 |
Praxair Inc. | | 120,000 | | | 9,637,200 |
| | | | | |
| | | | | 22,351,800 |
| | | | | |
Media 1.1% | | | | | |
aDIRECTV, A | | 75,000 | | | 2,501,250 |
The Walt Disney Co. | | 75,000 | | | 2,418,750 |
| | | | | |
| | | | | 4,920,000 |
| | | | | |
Pharmaceuticals, Biotechnology & Life Sciences 9.0% | | | | | |
Abbott Laboratories | | 85,000 | | | 4,589,150 |
aCelgene Corp. | | 125,000 | | | 6,960,000 |
aGilead Sciences Inc. | | 120,000 | | | 5,193,600 |
Johnson & Johnson | | 55,000 | | | 3,542,550 |
aLife Technologies Corp. | | 70,000 | | | 3,656,100 |
Merck & Co. Inc. | | 228,688 | | | 8,356,260 |
aOnyx Pharmaceuticals Inc. | | 90,000 | | | 2,640,600 |
aTalecris Biotherapeutics Holdings Corp. | | 102,860 | | | 2,290,692 |
aWaters Corp. | | 75,000 | | | 4,647,000 |
| | | | | |
| | | | | 41,875,952 |
| | | | | |
Retailing 4.5% | | | | | |
aAmazon.com Inc. | | 47,000 | | | 6,322,440 |
aDollar General Corp. | | 150,000 | | | 3,364,500 |
aKohl’s Corp. | | 65,000 | | | 3,505,450 |
aPriceline.com Inc. | | 23,000 | | | 5,025,500 |
aUrban Outfitters Inc. | | 70,000 | | | 2,449,300 |
| | | | | |
| | | | | 20,667,190 |
| | | | | |
Semiconductors & Semiconductor Equipment 4.0% | | | | | |
Altera Corp. | | 150,000 | | | 3,394,500 |
Analog Devices Inc. | | 120,000 | | | 3,789,600 |
Intel Corp. | | 160,000 | | | 3,264,000 |
aLam Research Corp. | | 75,000 | | | 2,940,750 |
Microchip Technology Inc. | | 180,000 | | | 5,230,800 |
| | | | | |
| | | | | 18,619,650 |
| | | | | |
Software & Services 17.3% | | | | | |
aAdobe Systems Inc. | | 145,000 | | | 5,333,100 |
aAlliance Data Systems Corp. | | 75,000 | | | 4,844,250 |
aConcur Technologies Inc. | | 90,000 | | | 3,847,500 |
FactSet Research Systems Inc. | | 50,000 | | | 3,293,500 |
aGoogle Inc., A | | 22,000 | | | 13,639,560 |
MasterCard Inc., A | | 45,000 | | | 11,519,100 |
aMcAfee Inc. | | 115,000 | | | 4,665,550 |
aNuance Communications Inc. | | 300,000 | | | 4,662,000 |
FFC-11
Franklin Templeton Variable Insurance Products Trust
Statement of Investments, December 31, 2009 (continued)
| | | | | | |
| Franklin Flex Cap Growth Securities Fund | | Shares | | Value | |
Common Stocks (continued) | | | | | | |
Software & Services (continued) | | | | | | |
Oracle Corp. | | 250,000 | | $ | 6,135,000 | |
Paychex Inc. | | 115,000 | | | 3,523,600 | |
aSAIC Inc. | | 110,000 | | | 2,083,400 | |
aSalesforce.com Inc. | | 40,000 | | | 2,950,800 | |
aSybase Inc. | | 110,000 | | | 4,774,000 | |
Visa Inc., A | | 100,000 | | | 8,746,000 | |
| | | | | | |
| | | | | 80,017,360 | |
| | | | | | |
Technology Hardware & Equipment 16.9% | | | | | | |
aApple Inc. | | 70,000 | | | 14,760,200 | |
aCisco Systems Inc. | | 525,000 | | | 12,568,500 | |
aFLIR Systems Inc. | | 225,000 | | | 7,362,000 | |
Hewlett-Packard Co. | | 225,000 | | | 11,589,750 | |
aJuniper Networks Inc. | | 125,000 | | | 3,333,750 | |
National Instruments Corp. | | 115,000 | | | 3,386,750 | |
aNetApp Inc. | | 250,000 | | | 8,597,500 | |
QUALCOMM Inc. | | 285,000 | | | 13,184,100 | |
aTrimble Navigation Ltd. | | 145,000 | | | 3,654,000 | |
| | | | | | |
| | | | | 78,436,550 | |
| | | | | | |
Telecommunication Services 2.6% | | | | | | |
aAmerican Tower Corp., A | | 210,000 | | | 9,074,100 | |
aNII Holdings Inc. | | 90,000 | | | 3,022,200 | |
| | | | | | |
| | | | | 12,096,300 | |
| | | | | | |
Transportation 2.5% | | | | | | |
C.H. Robinson Worldwide Inc. | | 75,000 | | | 4,404,750 | |
Expeditors International of Washington Inc. | | 150,000 | | | 5,209,500 | |
FedEx Corp. | | 26,000 | | | 2,169,700 | |
| | | | | | |
| | | | | 11,783,950 | |
| | | | | | |
Total Common Stocks (Cost $382,248,910) | | | | | 447,789,335 | |
| | | | | | |
Short Term Investments (Cost $24,214,523) 5.2% | | | | | | |
Money Market Funds 5.2% | | | | | | |
bInstitutional Fiduciary Trust Money Market Portfolio, 0.00% | | 24,214,523 | | | 24,214,523 | |
| | | | | | |
Total Investments (Cost $406,463,433) 101.8% | | | | | 472,003,858 | |
Other Assets, less Liabilities (1.8)% | | | | | (8,437,779 | ) |
| | | | | | |
Net Assets 100.0% | | | | $ | 463,566,079 | |
| | | | | | |
aNon-income producing.
bSee Note 7 regarding investments in the Institutional Fiduciary Trust Money Market Portfolio. The rate shown is the annualized seven-day yield at period end.
The accompanying notes are an integral part of these financial statements.
FFC-12
Franklin Templeton Variable Insurance Products Trust
Financial Statements
Statement of Assets and Liabilities
December 31, 2009
| | | | |
| | | Franklin Flex
Cap Growth
Securities Fund | |
Assets: | | | | |
Investments in securities: | | | | |
Cost - Unaffiliated issuers | | $ | 382,248,910 | |
Cost - Sweep Money Fund (Note 7) | | | 24,214,523 | |
| | | | |
Total cost of investments | | $ | 406,463,433 | �� |
| | | | |
Value - Unaffiliated issuers | | $ | 447,789,335 | |
Value - Sweep Money Fund (Note 7) | | | 24,214,523 | |
| | | | |
Total value of investments | | | 472,003,858 | |
Receivables: | | | | |
Capital shares sold | | | 617,173 | |
Dividends | | | 358,917 | |
| | | | |
Total assets | | | 472,979,948 | |
| | | | |
Liabilities: | | | | |
Payables: | | | | |
Capital shares redeemed | | | 8,869,023 | |
Affiliates | | | 475,568 | |
Accrued expenses and other liabilities | | | 69,278 | |
| | | | |
Total liabilities | | | 9,413,869 | |
| | | | |
Net assets, at value | | $ | 463,566,079 | |
| | | | |
Net assets consist of: | | | | |
Paid-in capital | | $ | 449,691,865 | |
Net unrealized appreciation (depreciation) | | | 65,540,425 | |
Accumulated net realized gain (loss) | | | (51,666,211 | ) |
| | | | |
Net assets, at value | | $ | 463,566,079 | |
| | | | |
Class 2: | | | | |
Net assets, at value | | $ | 244,768,349 | |
| | | | |
Shares outstanding | | | 22,403,863 | |
| | | | |
Net asset value and maximum offering price per share | | $ | 10.93 | |
| | | | |
Class 4: | | | | |
Net assets, at value | | $ | 218,797,730 | |
| | | | |
Shares outstanding | | | 20,105,573 | |
| | | | |
Net asset value and maximum offering price per share | | $ | 10.88 | |
| | | | |
The accompanying notes are an integral part of these financial statements.
FFC-13
Franklin Templeton Variable Insurance Products Trust
Financial Statements (continued)
Statement of Operations
for the year ended December 31, 2009
| | | | |
| | | Franklin Flex
Cap Growth
Securities Fund | |
Investment income: | | | | |
Dividends: | | | | |
Unaffiliated issuers | | $ | 3,097,514 | |
Sweep Money Fund (Note 7) | | | 13,347 | |
| | | | |
Total investment income | | | 3,110,861 | |
| | | | |
Expenses: | | | | |
Management fees (Note 3a) | | | 2,204,101 | |
Administrative fees (Note 3b) | | | 849,573 | |
Distribution fees: (Note 3c) | | | | |
Class 2 | | | 526,819 | |
Class 4 | | | 453,364 | |
Unaffiliated transfer agent fees | | | 694 | |
Custodian fees (Note 4) | | | 4,107 | |
Reports to shareholders | | | 84,404 | |
Professional fees | | | 31,213 | |
Trustees’ fees and expenses | | | 1,992 | |
Other | | | 17,118 | |
| | | | |
Total expenses | | | 4,173,385 | |
Expense reductions (Note 4) | | | (27 | ) |
Expenses waived/paid by affiliates (Note 3e) | | | (882,392 | ) |
| | | | |
Net expenses | | | 3,290,966 | |
| | | | |
Net investment income (loss) | | | (180,105 | ) |
| | | | |
Realized and unrealized gains (losses): | | | | |
Net realized gain (loss) from investments | | | (29,161,047 | ) |
Net change in unrealized appreciation (depreciation) on investments | | | 135,604,614 | |
| | | | |
Net realized and unrealized gain (loss) | | | 106,443,567 | |
| | | | |
Net increase (decrease) in net assets resulting from operations | | $ | 106,263,462 | |
| | | | |
The accompanying notes are an integral part of these financial statements.
FFC-14
Franklin Templeton Variable Insurance Products Trust
Financial Statements (continued)
Statements of Changes in Net Assets
| | | | | | | | |
| | | Franklin Flex Cap Growth
Securities Fund | |
| | | Year Ended December 31, | |
| | | 2009 | | | 2008 | |
| | | | |
Increase (decrease) in net assets: | | | | | | | | |
Operations: | | | | | | | | |
Net investment income (loss) | | $ | (180,105 | ) | | $ | 92,908 | |
Net realized gain (loss) from investments and foreign currency transactions | | | (29,161,047 | ) | | | (18,500,786 | ) |
Net change in unrealized appreciation (depreciation) on investments | | | 135,604,614 | | | | (88,696,995 | ) |
| | | | |
Net increase (decrease) in net assets resulting from operations | | | 106,263,462 | | | | (107,104,873 | ) |
| | | | |
Distributions to shareholders from: | | | | | | | | |
Net investment income: | | | | | | | | |
Class 2 | | | — | | | | (267,065 | ) |
Class 4 | | | (158,474 | ) | | | (12,871 | ) |
| | | | |
Total distributions to shareholders | | | (158,474 | ) | | | (279,936 | ) |
| | | | |
Capital share transactions: (Note 2) | | | | | | | | |
Class 2 | | | (12,333,249 | ) | | | 86,938,359 | |
Class 4 | | | 124,101,792 | | | | 59,920,873 | |
| | | | |
Total capital share transactions | | | 111,768,543 | | | | 146,859,232 | |
| | | | |
Net increase (decrease) in net assets | | | 217,873,531 | | | | 39,474,423 | |
Net assets: | | | | | | | | |
Beginning of year | | | 245,692,548 | | | | 206,218,125 | |
| | | | |
End of year | | $ | 463,566,079 | | | $ | 245,692,548 | |
| | | | |
Undistributed net investment income included in net assets: | | | | | | | | |
End of year | | $ | — | | | $ | 157,304 | |
| | | | |
The accompanying notes are an integral part of these financial statements.
FFC-15
Franklin Templeton Variable Insurance Products Trust
Notes to Financial Statements
Franklin Flex Cap Growth Securities Fund
1. ORGANIZATION AND SIGNIFICANT ACCOUNTING POLICIES
Franklin Templeton Variable Insurance Products Trust (Trust) is registered under the Investment Company Act of 1940, as amended, (1940 Act) as an open-end investment company, consisting of twenty-two separate funds. The Franklin Flex Cap Growth Securities Fund (Fund) is included in this report. The financial statements of the remaining funds in the Trust are presented separately. Shares of the Fund are generally sold only to insurance company separate accounts to fund the benefits of variable life insurance policies or variable annuity contracts. At December 31, 2009, 79.14% of the Fund’s shares were held through one insurance company. The Fund offers two classes of shares: Class 2 and Class 4. Each class of shares differs by its distribution fees, voting rights on matters affecting a single class and its exchange privilege.
The following summarizes the Fund’s significant accounting policies.
a. Security Valuation
Equity and other securities listed on a securities exchange or on the NASDAQ National Market System are valued at the last quoted sale price or the official closing price of the day, respectively. Over-the-counter securities and listed securities for which there is no reported sale are valued within the range of the most recent quoted bid and ask prices. Securities that trade in multiple markets or on multiple exchanges are valued according to the broadest and most representative market. Certain equity securities are valued based upon fundamental characteristics or relationships to similar securities. Investments in open-end mutual funds are valued at the closing net asset value.
The Fund has procedures to determine the fair value of individual securities and other assets for which market prices are not readily available or which may not be reliably priced. Methods for valuing these securities may include: fundamental analysis based upon the underlying investment book value, anticipated future cash flows, market changes in comparable or similar securities, matrix pricing, discounts from market prices of similar securities, or discounts applied due to the nature and duration of restrictions on the disposition of the securities. Due to the inherent uncertainty of valuations of such securities, the fair values may differ significantly from the values that would have been used had a ready market for such investments existed. Occasionally, events occur between the time at which trading in a security is completed and the close of the NYSE that might call into question the availability (including the reliability) of the value of a portfolio security held by the Fund. If such an event occurs, the securities may be valued using fair value procedures, which may include the use of independent pricing services. All security valuation procedures are approved by the Fund’s Board of Trustees.
b. Foreign Currency Translation
Portfolio securities and other assets and liabilities denominated in foreign currencies are translated into U.S. dollars based on the exchange rate of such currencies against U.S. dollars on the date of valuation. The Fund may enter into foreign currency exchange contracts to facilitate transactions denominated in a foreign currency. Purchases and sales of securities, income and expense items denominated in foreign currencies are translated into U.S. dollars at the exchange rate in effect on the transaction date. Occasionally, events may impact the availability or reliability of foreign exchange rates used to convert the U.S. dollar equivalent value. If such an event occurs, the foreign exchange rate will be valued at fair value using procedures established and approved by the Fund’s Board of Trustees.
The Fund does not separately report the effect of changes in foreign exchange rates from changes in market prices on securities held. Such changes are included in net realized and unrealized gain or loss from investments on the Statement of Operations.
Realized foreign exchange gains or losses arise from sales of foreign currencies, currency gains or losses realized between the trade and settlement dates on securities transactions and the difference between the recorded amounts of dividends, interest, and foreign withholding taxes and the U.S. dollar equivalent of the amounts actually received or paid. Net unrealized foreign exchange gains and losses arise from changes in foreign exchange rates on foreign denominated assets and liabilities other than investments in securities held at the end of the reporting period.
FFC-16
Franklin Templeton Variable Insurance Products Trust
Notes to Financial Statements (continued)
Franklin Flex Cap Growth Securities Fund
1. ORGANIZATION AND SIGNIFICANT ACCOUNTING POLICIES (continued)
c. Income Taxes
No provision has been made for U.S. income taxes because it is the Fund’s policy to qualify as a regulated investment company under the Internal Revenue Code and to distribute to shareholders substantially all of its taxable income and net realized gains.
The Fund has reviewed the tax positions, taken on federal income tax returns, for three open tax years and as of December 31, 2009, and has determined that no provision for income tax is required in the Fund’s financial statements.
d. Security Transactions, Investment Income, Expenses and Distributions
Security transactions are accounted for on trade date. Realized gains and losses on security transactions are determined on a specific identification basis. Estimated expenses are accrued daily. Dividend income is recorded on the ex-dividend date. Distributions to shareholders are recorded on the ex-dividend date and are determined according to income tax regulations (tax basis). Distributable earnings determined on a tax basis may differ from earnings recorded in accordance with accounting principles generally accepted in the United States of America. These differences may be permanent or temporary. Permanent differences are reclassified among capital accounts to reflect their tax character. These reclassifications have no impact on net assets or the results of operations. Temporary differences are not reclassified, as they may reverse in subsequent periods.
Common expenses incurred by the Trust are allocated among the funds based on the ratio of net assets of each fund to the combined net assets of the Trust. Fund specific expenses are charged directly to the fund that incurred the expense.
Realized and unrealized gains and losses and net investment income, not including class specific expenses, are allocated daily to each class of shares based upon the relative proportion of net assets of each class. Differences in per share distributions, by class, are generally due to differences in class specific expenses.
e. Accounting Estimates
The preparation of financial statements in accordance with accounting principles generally accepted in the United States of America requires management to make estimates and assumptions that affect the reported amounts of assets and liabilities at the date of the financial statements and the amounts of income and expenses during the reporting period. Actual results could differ from those estimates.
f. Guarantees and Indemnifications
Under the Trust’s organizational documents, its officers and trustees are indemnified by the Trust against certain liabilities arising out of the performance of their duties to the Trust. Additionally, in the normal course of business, the Trust, on behalf of the Fund, enters into contracts with service providers that contain general indemnification clauses. The Trust’s maximum exposure under these arrangements is unknown as this would involve future claims that may be made against the Trust that have not yet occurred. Currently, the Trust expects the risk of loss to be remote.
FFC-17
Franklin Templeton Variable Insurance Products Trust
Notes to Financial Statements (continued)
Franklin Flex Cap Growth Securities Fund
2. SHARES OF BENEFICIAL INTEREST
At December 31, 2009, there were an unlimited number of shares authorized (without par value). Transactions in the Fund’s shares were as follows:
| | | | | | | | | | | | | | |
| | | Year Ended December 31, | |
| | | 2009 | | | 2008a | |
| Class 2 Shares: | | Shares | | | Amount | | | Shares | | | Amount | |
Shares sold | | 4,431,644 | | | $ | 39,989,400 | | | 10,156,274 | | | $ | 112,355,182 | |
Shares issued in reinvestment of distributions | | — | | | | — | | | 21,855 | | | | 267,065 | |
Shares redeemed | | (5,802,635 | ) | | | (52,322,649 | ) | | (2,615,387 | ) | | | (25,683,888 | ) |
| | | | |
Net increase (decrease) | | (1,370,991 | ) | | $ | (12,333,249 | ) | | 7,562,742 | | | $ | 86,938,359 | |
| | | | |
Class 4 Shares: | | | | | | | | | | | | | | |
Shares sold | | 18,820,498 | | | $ | 169,410,832 | | | 6,161,771 | | | $ | 60,220,795 | |
Shares issued on reinvestment of distributions | | 17,968 | | | | 158,474 | | | 1,054 | | | | 12,860 | |
Shares redeemed | | (4,859,046 | ) | | | (45,467,514 | ) | | (36,672 | ) | | | (312,782 | ) |
| | | | |
Net increase (decrease) | | 13,979,420 | | | $ | 124,101,792 | | | 6,126,153 | | | $ | 59,920,873 | |
| | | | |
| aFor | the period February 29, 2008 (effective date) to December 31, 2008 for Class 4. |
3. TRANSACTIONS WITH AFFILIATES
Franklin Resources, Inc. is the holding company for various subsidiaries that together are referred to as Franklin Templeton Investments. Certain officers and trustees of the Trust are also officers and/or directors of the following subsidiaries:
| | |
| Subsidiary | | Affiliation |
Franklin Advisers, Inc. (Advisers) | | Investment manager |
Franklin Templeton Services, LLC (FT Services) | | Administrative manager |
Franklin Templeton Distributors, Inc. (Distributors) | | Principal underwriter |
Franklin Templeton Investor Services, LLC (Investor Services) | | Transfer agent |
a. Management Fees
The Fund pays an investment management fee to Advisers based on the average daily net assets of the Fund as follows:
| | |
| Annualized Fee Rate | | Net Assets |
| 0.750% | | Up to and including $100 million |
| 0.650% | | Over $100 million, up to and including $250 million |
| 0.600% | | Over $250 million, up to and including $10 billion |
| 0.550% | | Over $10 billion, up to and including $12.5 billion |
| 0.525% | | Over $12.5 billion, up to and including $15 billion |
| 0.500% | | In excess of $15 billion |
b. Administrative Fees
The Fund pays an administrative fee to FT Services of 0.25% per year of the average daily net assets of the Fund.
FFC-18
Franklin Templeton Variable Insurance Products Trust
Notes to Financial Statements (continued)
Franklin Flex Cap Growth Securities Fund
3. TRANSACTIONS WITH AFFILIATES (continued)
c. Distribution Fees
The Fund’s Board of Trustees has adopted distribution plans for Class 2 and Class 4 shares pursuant to Rule 12b-1 under the 1940 Act. Under the Fund’s compensation distribution plans, the Fund pays Distributors for costs incurred in connection with the servicing, sale and distribution of the Fund’s shares up to 0.35% per year of its average daily net assets of each class. The Board of Trustees has agreed to limit the current rate to 0.25% per year for Class 2.
d. Transfer Agent Fees
Investor Services, under terms of an agreement, performs shareholder servicing for the Fund and is not paid by the Fund for the services.
e. Waiver and Expense Reimbursements
FT Services and Advisers have contractually agreed in advance to waive or limit their respective fees and to assume as their own expense certain expenses otherwise payable by the fund so that the common expenses (i.e. a combination of management fees, administrative fees, and other expenses, but excluding distribution fees, and acquired fund fees and expenses) for each class of the Fund do not exceed 0.68% (other than certain non-routine expenses or costs, including those relating to litigation, indemnification, reorganizations, and liquidations) until April 30, 2010.
4. EXPENSE OFFSET ARRANGEMENT
The Fund has entered into an arrangement with its custodian whereby credits realized as a result of uninvested cash balances are used to reduce a portion of the Fund’s custodian expenses. During the year ended December 31, 2009, the custodian fees were reduced as noted in the Statement of Operations.
5. INCOME TAXES
For tax purposes, capital losses may be carried over to offset future capital gains, if any. At December 31, 2009, the capital loss carryforwards were as follows:
| | | |
Capital loss carryforwards expiring in: | | | |
2013 | | $ | 233,183 |
2014 | | | 2,517,251 |
2015 | | | 777,263 |
2016 | | | 15,495,131 |
2017 | | | 30,645,725 |
| | | |
| | $ | 49,668,553 |
| | | |
For tax purposes, realized capital losses occurring subsequent to October 31, may be deferred and treated as occurring on the first day of the following fiscal year. At December 31, 2009, the Fund deferred realized capital losses of $797,053.
The tax character of distributions paid during the years ended December 31, 2009 and 2008, was as follows:
| | | | | | |
| | | 2009 | | 2008 |
| | | |
Distributions paid from income | | $ | 158,474 | | $ | 279,936 |
| | | |
FFC-19
Franklin Templeton Variable Insurance Products Trust
Notes to Financial Statements (continued)
Franklin Flex Cap Growth Securities Fund
5. INCOME TAXES (continued)
At December 31, 2009, the cost of investments and net unrealized appreciation (depreciation) for income tax purposes were as follows:
| | | | |
| |
Cost of investments | | $ | 407,664,037 | |
| | | | |
| |
Unrealized appreciation | | $ | 70,422,200 | |
Unrealized depreciation | | | (6,082,379 | ) |
| | | | |
Net unrealized appreciation (depreciation) | | $ | 64,339,821 | |
| | | | |
Net realized gains (losses) differ for financial statement and tax purposes primarily due to differing treatment of wash sales.
6. INVESTMENT TRANSACTIONS
Purchases and sales of investments (excluding short term securities) for the year ended December 31, 2009, aggregated $222,307,339 and $107,065,497, respectively.
7. INVESTMENTS IN INSTITUTIONAL FIDUCIARY TRUST MONEY MARKET PORTFOLIO
The Fund may invest in the Institutional Fiduciary Trust Money Market Portfolio (Sweep Money Fund), an open-end investment company managed by Advisers. Management fees paid by the Fund are reduced on assets invested in the Sweep Money Fund, in an amount not to exceed the management and administrative fees paid by the Sweep Money Fund.
8. CREDIT FACILITY
The Fund, together with other U.S. registered and foreign investment funds (collectively “Borrowers”), managed by Franklin Templeton Investments, are borrowers in a joint syndicated senior unsecured credit facility totaling $725 million (Global Credit Facility) to provide a source of funds to the Borrowers for temporary and emergency purposes, including the ability to meet future unanticipated or unusually large redemption requests. Effective January 22, 2010, the Fund renewed the Global Credit Facility, for a total of $750 million, maturing January 21, 2011.
Under the terms of the Global Credit Facility, the Fund shall, in addition to interest charged on any borrowings made by the Fund and other costs incurred by the Fund, pay its share of fees and expenses incurred in connection with the implementation and maintenance of the Global Credit Facility, based upon its relative share of the aggregate net assets of all of the Borrowers, including an annual commitment fee of 0.10% based upon the unused portion of the Global Credit Facility, which is reflected in other expenses on the Statement of Operations. During the year ended December 31, 2009, the Fund did not utilize the Global Credit Facility.
9. FAIR VALUE MEASUREMENTS
The Fund follows a fair value hierarchy that distinguishes between market data obtained from independent sources (observable inputs) and the Fund’s own market assumptions (unobservable inputs). These inputs are used in determining the value of the Fund’s investments and are summarized in the following fair value hierarchy:
| | • | | Level 1 – quoted prices in active markets for identical securities |
| | • | | Level 2 – other significant observable inputs (including quoted prices for similar securities, interest rates, prepayment speed, credit risk, etc.) |
| | • | | Level 3 – significant unobservable inputs (including the Fund’s own assumptions in determining the fair value of investments) |
FFC-20
Franklin Templeton Variable Insurance Products Trust
Notes to Financial Statements (continued)
Franklin Flex Cap Growth Securities Fund
9. FAIR VALUE MEASUREMENTS (continued)
The inputs or methodology used for valuing securities are not an indication of the risk associated with investing in those securities.
At December 31, 2009, all of the Fund’s investments in securities carried at fair value were in Level 1 inputs. For detailed industry descriptions, see the accompanying Statement of Investments.
10. NEW ACCOUNTING PRONOUNCEMENTS
In January 2010, the Financial Accounting Standards Board issued Accounting Standards Update (ASU) No. 2010-6, Fair Value Measurements and Disclosures (Topic 820): Improving Disclosures about Fair Value Measurements. ASU No. 2010-6 enhances and clarifies existing fair value measurement disclosure requirements and is effective for interim and annual periods beginning after December 15, 2009. The Fund is currently evaluating the impact, if any, of applying the provisions of ASU No. 2010-6.
11. SUBSEQUENT EVENTS
The Fund has evaluated subsequent events through February 10, 2010, the issuance date of the financial statements and determined that no events have occurred that require disclosure.
FFC-21
Franklin Templeton Variable Insurance Products Trust
Franklin Flex Cap Growth Securities Fund
Report of Independent Registered Public Accounting Firm
To the Board of Trustees and Shareholders of Franklin Templeton Variable Insurance Products Trust
In our opinion, the accompanying statement of assets and liabilities, including the statement of investments, and the related statements of operations and of changes in net assets and the financial highlights present fairly, in all material respects, the financial position of Franklin Flex Cap Growth Securities Fund (one of the funds constituting the Franklin Templeton Variable Insurance Products Trust, hereafter referred to as the “Fund”) at December 31, 2009, the results of its operations for the year then ended, the changes in its net assets and the financial highlights for the periods presented, in conformity with accounting principles generally accepted in the United States of America. These financial statements and financial highlights (hereafter referred to as “financial statements”) are the responsibility of the Fund’s management. Our responsibility is to express an opinion on these financial statements based on our audits. We conducted our audits of these financial statements in accordance with the standards of the Public Company Accounting Oversight Board (United States). Those standards require that we plan and perform the audit to obtain reasonable assurance about whether the financial statements are free of material misstatement. An audit includes examining, on a test basis, evidence supporting the amounts and disclosures in the financial statements, assessing the accounting principles used and significant estimates made by management, and evaluating the overall financial statement presentation. We believe that our audits, which included confirmation of securities at December 31, 2009 by correspondence with the custodian and brokers, provide a reasonable basis for our opinion.
PricewaterhouseCoopers LLP
San Francisco, California
February 10, 2010
FFC-22
Franklin Templeton Variable Insurance Products Trust
Tax Designation (unaudited)
Franklin Flex Cap Growth Securities Fund
Under Section 854(b)(2) of the Internal Revenue Code, the Fund designates 100% of the ordinary income dividends as income qualifying for the dividends received deduction for the fiscal year ended December 31, 2009
FFC-23
FRANKLIN GLOBAL REAL ESTATE SECURITIES FUND
This annual report for Franklin Global Real Estate Securities Fund covers the fiscal year ended December 31, 2009.
Performance Summary as of 12/31/09
Average annual total return of Class 4 shares* represents the average annual change in value, assuming reinvestment of dividends and capital gains. Average returns smooth out variations in returns, which can be significant; they are not the same as year-by-year results.
Periods ended 12/31/09
| | | | | | |
| | | 1-Year | | 5-Year | | 10-Year |
Average Annual Total Return | | +19.01% | | -5.65% | | +6.98% |
*For the period beginning 2/29/08, Class 4 performance reflects a 12b-1 fee expense of 0.35% per year, which affects future performance. Class 4 performance prior to 2/29/08 reflects historical Class 1 performance, which does not include a 12b-1 fee expense. Since 2/29/08 (effective date), the average annual total return of Class 4 shares was -14.71%. The investment manager and administrator have contractually agreed to waive or limit their respective fees so that the increase in investment management and fund administration fees paid by the Fund is phased in over a five-year period, starting on 5/1/07, with there being no increase in the rate of such fees for the first year ended 4/30/08. For each of four years thereafter through 4/30/12, the investment manager and administrator will receive one-fifth of the increase in the rate of fees. Beginning 5/1/12, the full new investment management and administration fees will then be in effect. If the manager and administrator had not waived fees, the Fund’s total returns would have been lower.
Total Return Index Comparison
for a Hypothetical $10,000 Investment (1/1/00–12/31/09)
The graph below shows the change in value of a hypothetical $10,000 investment in the Fund over the indicated period and includes reinvestment of any income or distributions. The Fund’s performance* is compared to the performance of the Standard & Poor’s (S&P) Global REIT Index (hedged into U.S. dollars). One cannot invest directly in an index, and an index is not representative of the Fund’s portfolio. Please see Important Notes to Performance Information preceding the Fund Summaries.
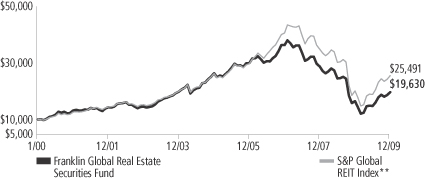
**Source: © 2009 Morningstar. Please see Index Descriptions following the Fund Summaries.
Franklin Global Real Estate Securities Fund Class 4
Performance reflects the Fund’s Class 4 operating expenses, but does not include any contract fees, expenses or sales charges. If they had been included, performance would be lower. These charges and deductions, particularly for variable life policies, can have a significant effect on contract values and insurance benefits. See the contract prospectus for a complete description of these expenses, including sales charges.
Performance data represent past performance, which does not guarantee future results. Investment return and principal value will fluctuate, and you may have a gain or loss when you sell your shares. Current performance may differ from figures shown.
FGR-1
Fund Goal and Main Investments: Franklin Global Real Estate Securities Fund seeks high total return. The Fund normally invests at least 80% of its net assets in investments of companies located anywhere in the world that operate in the real estate sector and normally invests predominantly in equity securities.
Performance Overview
You can find the Fund’s one-year total return in the Performance Summary. The Fund underperformed its benchmark, the S&P Global REIT Index (hedged into U.S. dollars), which posted a +26.99% total return.1
Economic and Market Overview
Equity markets entered 2009 largely pricing in a possible economic depression and systemic solvency crisis, scenarios that were ultimately averted by one of the most aggressive global policy responses in financial history. As government monetary and fiscal intervention began to gain traction toward the end of the first quarter, equities bottomed and largely reversed their decline, economic growth stabilized and rebounded, and confidence was rekindled as investors began to believe the global financial system was finally on the mend. Global equities rallied 73% from their March lows, led by the riskier, lower quality stocks that had been most vulnerable to a systemic meltdown or funding collapse.2 Emerging market economies fueled the recovery as governments aggressively incentivized lending and consumption, resulting in a dramatic statistical recovery that laid the groundwork for the developing world’s best annual equity rally on record. Growing demand from emerging markets supported commodity prices, which also posted record gains during the year. For most of the year, the fading U.S. dollar also helped underpin the rally in hard assets, while continued euro and yen strength created headwinds for regional recoveries.
Nonetheless, developed economies technically recovered by year-end, with Germany and France leading the eurozone out of a recession and both Japan and the U.S. exiting their longest recessions since World War II. Credit spreads narrowed as access to capital expanded and the private sector significantly reduced debt, though largely by transferring its liabilities to the public balance sheet. The growing indebtedness of sovereign governments exposed structural weaknesses in places like Dubai, Greece and Ireland, temporarily roiling markets toward the end
1. Source: © 2009 Morningstar. One cannot invest directly in an index, and an index is not representative of the Fund’s portfolio. Please see Index Descriptions following the Fund Summaries.
2. As measured by the Morgan Stanley Capital International All Country World Index. Source: © 2009 Morningstar. Please see Index Descriptions following the Fund Summaries.
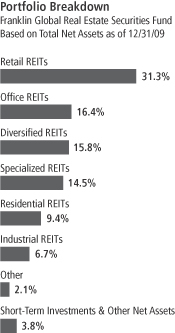
Fund Risks: The Fund’s investments in stocks may offer the potential for long-term gains but can be subject to short-term price fluctuations. As a nondiversified Fund that invests at least 80% of its assets in companies located anywhere in the world that operate in the real estate sector, the Fund carries much greater risk of adverse developments affecting that sector than a fund that invests more broadly. Foreign investing, especially in emerging markets, involves additional risks, including currency fluctuations, economic instability, market volatility, and political and social instability. REITS may be affected by any change in the value of the properties owned and by their location, rental income, financing and management. The Fund’s prospectus also includes a description of the main investment risks.
FGR-2
of the year. Policymakers remained firmly committed to stimulus throughout the period, indicating that deflation worries persisted despite signs of economic stabilization. The U.S. Federal Reserve Board announced its intention to keep the benchmark lending rate “exceptionally low” for an extended period; the new Japanese administration trumpeted its fight against deflation; and even China restated its commitment to “moderately loose” policy. Still, policymakers began discussing exit strategies by period-end as interest rates remained at record lows and economic indicators rebounded.
Global Real Estate Market Overview
The global real estate markets showed improvement in 2009 with generally stronger results in developing countries. According to the S&P Global REIT Index (hedged into U.S. dollars), Turkey (+172.93%) and Singapore (+86.96%) led emerging country real estate markets.1 Canada (+83.42%) also posted significantly positive results. 1 All of the markets represented by the index were up; however, the weakest markets were Japan with a +3.29% return and Belgium with a +17.94% return.1
Investment Strategy
We are research-driven, fundamental investors. Our active investment strategy is centered on the belief that unsynchronized regional economic activity within the global economy provides consistent, attractive return opportunities in global real estate markets. When selecting investments for the Fund’s portfolio, we use a bottom-up, value-oriented stock selection process that incorporates macro-level views in the evaluation process.
Manager’s Discussion
During the 12 months under review, significant contributors to Fund performance relative to the S&P Global REIT Index (hedged into U.S. dollars) included overweighted positions in Developers Diversified Realty, Ventas and RioCan REIT.
Developers Diversified Realty, one of the largest shopping center owners in the U.S., reported solid results for the third quarter and, in November, successfully issued $400 million in securities. This company is a component of the retail REIT sector, which was the Fund’s largest sector allocation during the period and a top contributor to absolute returns. Investors appeared attracted to the retail sector because they felt the positive economic reports, including labor and retail data, since March signaled a possible recovery.
FGR-3
Share prices of Ventas, a U.S.-based health care REIT that primarily owns skilled-nursing and assisted living facilities, rose in recent months, along with other health care REITs, largely due to the perceived sentiment that many of these companies had strong balance sheets and the potential to acquire assets. Ventas reported third-quarter funds from operations, a commonly accepted and reported measure of REIT operating performance, that were about 13% below those from the same period one year ago. These results surpassed analysts’ expectations and were largely due to rent increases and the strength of Ventas’ portfolio of medical office buildings.
RioCan is a Canadian mall REIT that owns and manages a portfolio of more than 240 shopping centers. Its shares rose sharply in value during the period, especially after the company’s third-quarter financial results demonstrated improvement in occupancy levels and rental rates at its malls. RioCan raised Can$330 million through the equity and unsecured debt markets in the first half of 2009, which enabled the company to pay down debt, maintain a significant amount of cash on its balance sheet and position the company to make strategic acquisitions such as its investment in a joint venture with U.S. REIT Cedar Shopping.
Significant detractors from relative Fund performance during the period included Land Securities Group, Nippon Building Fund and Hospitality Properties Trust. Over the past 12 months, U.K.-based REIT Land Securities Group suffered due to declining U.K. property values and an overleveraged balance sheet. Japanese office REIT Nippon Building Fund, a large-capitalization, higher quality REIT, weighed on absolute and relative returns. Accordingly, we trimmed our position in Nippon during the year. Our investment in hotel REIT Hospitality Properties Trust declined in value during the period and detracted from relative returns. As with many other REITs, Hospitality Properties raised capital over the past 12 months but was forced to suspend its dividend in April due to capital constraints. The hotel REIT sector faced severe challenges during the review period as the economic downturn led to cutbacks in travel that in turn forced many lodging companies to cut costs. Declines in occupancy and room rates left some lodging companies without sufficient cash to cover expenses. Hospitality Properties’ third-quarter earnings rose 34%, assisted by an $11.2 million gain on debt buyback, but core results without one-time items fell short of analysts’ expectations as occupancy and revenue fell.
Top 10 Holdings
Franklin Global Real Estate Securities Fund
12/31/09
| | |
Company
Sector/Industry,
Country | | % of Total
Net Assets |
| Westfield Group, ord. & 144A | | 6.9% |
| Retail REITs, Australia | | |
| Simon Property Group Inc. | | 4.4% |
| Retail REITs, U.S. | | |
| Unibail-Rodamco SE | | 3.8% |
| Retail REITs, France | | |
| Boston Properties Inc. | | 3.4% |
| Office REITs, U.S. | | |
| Host Hotels & Resorts Inc. | | 3.0% |
| Specialized REITs, U.S. | | |
| Equity Residential | | 2.8% |
| Residential REITs, U.S. | | |
| Ventas Inc. | | 2.8% |
| Specialized REITs, U.S. | | |
| Vornado Realty Trust | | 2.7% |
| Diversified REITs, U.S. | | |
| Public Storage | | 2.5% |
| Specialized REITs, U.S. | | |
| Stockland, ord. & 144A | | 2.2% |
| Diversified REITs, Australia | | |
The dollar value, number of shares or principal amount, and names of all portfolio holdings are listed in the Fund’s Statement of Investments.
FGR-4
Thank you for your participation in Franklin Global Real Estate Securities Fund. We look forward to serving your future investment needs.
The foregoing information reflects our analysis, opinions and portfolio holdings as of December 31, 2009, the end of the reporting period. The way we implement our main investment strategies and the resulting portfolio holdings may change depending on factors such as market and economic conditions. These opinions may not be relied upon as investment advice or an offer for a particular security. The information is not a complete analysis of every aspect of any market, country, industry, security or the Fund. Statements of fact are from sources considered reliable, but the investment manager makes no representation or warranty as to their completeness or accuracy. Although historical performance is no guarantee of future results, these insights may help you understand our investment management philosophy.
FGR-5
Fund Expenses
As an investor in a variable insurance contract (Contract) that indirectly provides for investment in an underlying mutual fund, you can incur transaction and/or ongoing expenses at both the Fund level and the Contract level.
| • | | Transaction expenses can include sales charges (loads) on purchases, redemption fees, surrender fees, transfer fees and premium taxes. |
| • | | Ongoing expenses can include management fees, distribution and service (12b-1) fees, contract fees, annual maintenance fees, mortality and expense risk fees and other fees and expenses. All mutual funds and Contracts have some types of ongoing expenses. |
The expenses shown in the table are meant to highlight ongoing expenses at the Fund level only and do not include ongoing expenses at the Contract level, or transaction expenses at either the Fund or Contract level. While the Fund does not have transaction expenses, if the transaction and ongoing expenses at the Contract level were included, the expenses shown would be higher. You should consult your Contract prospectus or disclosure document for more information.
The table shows Fund-level ongoing expenses and can help you understand these expenses and compare them with those of other mutual funds offered through the Contract. The table assumes a $1,000 investment held for the six months indicated. Please refer to the Fund prospectus for additional information on operating expenses.
Actual Fund Expenses
The first line (Actual) of the table provides actual account values and expenses. The “Ending Account Value” is derived from the Fund’s actual return, which includes the effect of ongoing Fund expenses, but does not include the effect of ongoing Contract expenses.
You can estimate the Fund-level expenses you incurred during the period by following these steps. Of course, your account value and expenses will differ from those in this illustration:
| 1. | Divide your account value by $1,000. |
If an account had an $8,600 value, then $8,600 ÷ $1,000 = 8.6.
| 2. | Multiply the result by the number under the heading “Fund-Level Expenses Incurred During Period.” |
If Fund-Level Expenses Incurred During Period were $7.50, then 8.6 x $7.50 = $64.50.
In this illustration, the estimated expenses incurred this period at the Fund level are $64.50.
Franklin Global Real Estate Securities Fund Class 4
FGR-6
Hypothetical Example for Comparison with Other Mutual Funds
Information in the second line (Hypothetical) of the table can help you compare ongoing expenses of the Fund with those of other mutual funds offered through the Contract. This information may not be used to estimate the actual ending account balance or expenses you incurred during the period. The hypothetical “Ending Account Value” is based on the Fund’s actual expense ratio and an assumed 5% annual rate of return before expenses, which does not represent the Fund’s actual return. The figure under the heading “Fund-Level Expenses Incurred During Period” shows the hypothetical expenses your account would have incurred under this scenario. You can compare this figure with the 5% hypothetical examples that appear in shareholder reports of other funds offered through a Contract.
| | | | | | | | | |
| Class 4 | | Beginning
Account Value 7/1/09 | | Ending
Account Value 12/31/09 | | Fund-Level Expenses Incurred
During Period* 7/1/09–12/31/09 |
Actual | | $ | 1,000 | | $ | 1,327.80 | | $ | 6.40 |
Hypothetical (5% return before expenses) | | $ | 1,000 | | $ | 1,019.71 | | $ | 5.55 |
*Expenses are calculated using the most recent six-month annualized expense ratio, net of expense waivers, for the Fund’s Class 4 shares (1.09%), which does not include any ongoing expenses of the Contract for which the Fund is an investment option, multiplied by the average account value over the period, multiplied by 184/365 to reflect the one-half year period.
FGR-7
Franklin Templeton Variable Insurance Products Trust
Financial Highlights
Franklin Global Real Estate Securities Fund
| | | | | | | | | | | | | | | | | | | | |
| | | Year Ended December 31, | |
| Class 1 | | 2009 | | | 2008 | | | 2007 | | | 2006 | | | 2005 | |
| | | | |
Per share operating performance | | | | | | | | | | | | | | | | | | | | |
(for a share outstanding throughout the year) | | | | | | | | | | | | | | | | | | | | |
Net asset value, beginning of year | | $ | 10.84 | | | $ | 25.42 | | | $ | 35.25 | | | $ | 32.55 | | | $ | 30.87 | |
| | | | |
Income from investment operationsa: | | | | | | | | | | | | | | | | | | | | |
Net investment incomeb | | | 0.30 | | | | 0.62 | | | | 0.80 | | | | 0.67 | | | | 0.70 | |
Net realized and unrealized gains (losses) | | | 1.36 | | | | (9.10 | ) | | | (7.56 | ) | | | 5.40 | | | | 3.38 | |
| | | | |
Total from investment operations | | | 1.66 | | | | (8.48 | ) | | | (6.76 | ) | | | 6.07 | | | | 4.08 | |
| | | | |
Less distributions from: | | | | | | | | | | | | | | | | | | | | |
Net investment income and net realized foreign currency gains | | | (1.34 | ) | | | (0.32 | ) | | | (0.81 | ) | | | (0.75 | ) | | | (0.49 | ) |
Net realized gains | | | — | | | | (5.78 | ) | | | (2.26 | ) | | | (2.62 | ) | | | (1.91 | ) |
| | | | |
Total distributions | | | (1.34 | ) | | | (6.10 | ) | | | (3.07 | ) | | | (3.37 | ) | | | (2.40 | ) |
| | | | |
Net asset value, end of year | | $ | 11.16 | | | $ | 10.84 | | | $ | 25.42 | | | $ | 35.25 | | | $ | 32.55 | |
| | | | |
| | | | | |
Total returnc | | | 19.41% | | | | (42.22)% | | | | (20.65)% | | | | 20.87% | | | | 13.74% | |
Ratios to average net assets | | | | | | | | | | | | | | | | | | | | |
Expenses before waiver and payments by affiliates | | | 1.11% | | | | 1.08% | | | | 0.84% | | | | 0.50% | | | | 0.49% | |
Expenses net of waiver and payments by affiliatesd | | | 0.76% | | | | 0.60% | | | | 0.52% | | | | 0.50% | | | | 0.49% | |
Net investment income | | | 3.13% | | | | 3.41% | | | | 2.57% | | | | 2.04% | | | | 2.32% | |
| | | | | |
Supplemental data | | | | | | | | | | | | | | | | | | | | |
Net assets, end of year (000’s) | | $ | 38,486 | | | $ | 39,018 | | | $ | 83,250 | | | $ | 140,487 | | | $ | 145,425 | |
Portfolio turnover rate | | | 87.34% | | | | 77.28% | | | | 121.84% | | | | 31.39% | | | | 36.10% | |
aThe amount shown for a share outstanding throughout the period may not correlate with the Statement of Operations for the period due to the timing of sales and repurchases of the Fund shares in relation to income earned and/or fluctuating market value of the investments of the Fund.
bBased on average daily shares outstanding.
cTotal return does not include any fees, charges or expenses imposed by the variable annuity and life insurance contracts for which the Franklin Templeton Variable Insurance Products Trust serves as an underlying investment vehicle.
dBenefit of expense reduction rounds to less than 0.01%.
The accompanying notes are an integral part of these financial statements.
FGR-8
Franklin Templeton Variable Insurance Products Trust
Financial Highlights (continued)
Franklin Global Real Estate Securities Fund
| | | | | | | | | | | | | | | | | | | | |
| | | Year Ended December 31, | |
| Class 2 | | 2009 | | | 2008 | | | 2007 | | | 2006 | | | 2005 | |
| | | | |
Per share operating performance | | | | | | | | | | | | | | | | | | | | |
(for a share outstanding throughout the year) | | | | | | | | | | | | | | | | | | | | |
Net asset value, beginning of year | | $ | 10.61 | | | $ | 24.97 | | | $ | 34.67 | | | $ | 32.08 | | | $ | 30.49 | |
| | | | |
Income from investment operationsa: | | | | | | | | | | | | | | | | | | | | |
Net investment incomeb | | | 0.27 | | | | 0.56 | | | | 0.72 | | | | 0.58 | | | | 0.64 | |
Net realized and unrealized gains (losses) | | | 1.33 | | | | (8.93 | ) | | | (7.43 | ) | | | 5.31 | | | | 3.30 | |
| | | | |
Total from investment operations | | | 1.60 | | | | (8.37 | ) | | | (6.71 | ) | | | 5.89 | | | | 3.94 | |
| | | | |
Less distributions from: | | | | | | | | | | | | | | | | | | | | |
Net investment income and net realized foreign currency gains | | | (1.29 | ) | | | (0.21 | ) | | | (0.73 | ) | | | (0.68 | ) | | | (0.44 | ) |
Net realized gains | | | — | | | | (5.78 | ) | | | (2.26 | ) | | | (2.62 | ) | | | (1.91 | ) |
| | | | |
Total distributions | | | (1.29 | ) | | | (5.99 | ) | | | (2.99 | ) | | | (3.30 | ) | | | (2.35 | ) |
| | | | |
Net asset value, end of year | | $ | 10.92 | | | $ | 10.61 | | | $ | 24.97 | | | $ | 34.67 | | | $ | 32.08 | |
| | | | |
| | | | | |
Total returnc | | | 19.08% | | | | (42.39)% | | | | (20.86)% | | | | 20.58% | | | | 13.47% | |
Ratios to average net assets | | | | | | | | | | | | | | | | | | | | |
Expenses before waiver and payments by affiliates | | | 1.36% | | | | 1.33% | | | | 1.09% | | | | 0.75% | | | | 0.74% | |
Expenses net of waiver and payments by affiliatesd | | | 1.01% | | | | 0.85% | | | | 0.77% | | | | 0.75% | | | | 0.74% | |
Net investment income | | | 2.88% | | | | 3.16% | | | | 2.32% | | | | 1.79% | | | | 2.07% | |
| | | | | |
Supplemental data | | | | | | | | | | | | | | | | | | | | |
Net assets, end of year (000’s) | | $ | 345,445 | | | $ | 343,701 | | | $ | 893,837 | | | $ | 1,491,571 | | | $ | 1,343,868 | |
Portfolio turnover rate | | | 87.34% | | | | 77.28% | | | | 121.84% | | | | 31.39% | | | | 36.10% | |
aThe amount shown for a share outstanding throughout the period may not correlate with the Statement of Operations for the period due to the timing of sales and repurchases of the Fund shares in relation to income earned and/or fluctuating market value of the investments of the Fund.
bBased on average daily shares outstanding.
cTotal return does not include any fees, charges or expenses imposed by the variable annuity and life insurance contracts for which the Franklin Templeton Variable Insurance Products Trust serves as an underlying investment vehicle.
dBenefit of expense reduction rounds to less than 0.01%.
The accompanying notes are an integral part of these financial statements.
FGR-9
Franklin Templeton Variable Insurance Products Trust
Financial Highlights (continued)
Franklin Global Real Estate Securities Fund
| | | | | | | | |
| | | Year Ended
December 31, | |
| Class 4 | | 2009 | | | 2008a | |
| | | | |
Per share operating performance | | | | | | | | |
(for a share outstanding throughout the year) | | | | | | | | |
Net asset value, beginning of year | | $ | 10.80 | | | $ | 23.34 | |
| | | | |
Income from investment operationsb: | | | | | | | | |
Net investment incomec | | | 0.27 | | | | 0.45 | |
Net realized and unrealized gains (losses) | | | 1.36 | | | | (6.89 | ) |
| | | | |
Total from investment operations | | | 1.63 | | | | (6.44 | ) |
| | | | |
Less distributions from: | | | | | | | | |
Net investment income and net realized foreign currency gains | | | (1.29 | ) | | | (0.32 | ) |
Net realized gains | | | — | | | | (5.78 | ) |
| | | | |
Total distributions | | | (1.29 | ) | | | (6.10 | ) |
| | | | |
Net asset value, end of year | | $ | 11.14 | | | $ | 10.80 | |
| | | | |
| | |
Total returnd | | | 19.01% | | | | (37.28)% | |
Ratios to average net assetse | | | | | | | | |
Expenses before waiver and payments by affiliates | | | 1.46% | | | | 1.43% | |
Expenses net of waiver and payments by affiliatesf | | | 1.11% | | | | 0.95% | |
Net investment income | | | 2.78% | | | | 3.06% | |
| | |
Supplemental data | | | | | | | | |
Net assets, end of year (000’s) | | $ | 2 | | | $ | 2 | |
Portfolio turnover rate | | | 87.34% | | | | 77.28% | |
aFor the period February 29, 2008 (effective date) to December 31, 2008.
bThe amount shown for a share outstanding throughout the period may not correlate with the Statement of Operations for the period due to the timing of sales and repurchases of the Fund shares in relation to income earned and/or fluctuating market value of the investments of the Fund.
cBased on average daily shares outstanding.
dTotal return does not include any fees, charges or expenses imposed by the variable annuity and life insurance contracts for which the Franklin Templeton Variable Insurance Products Trust serves as an underlying investment vehicle. Total return is not annualized for periods less than one year.
eRatios are annualized for periods less than one year.
fBenefit of expense reduction rounds to less than 0.01%.
The accompanying notes are an integral part of these financial statements.
FGR-10
Franklin Templeton Variable Insurance Products Trust
Statement of Investments, December 31, 2009
| | | | | | | |
| Franklin Global Real Estate Securities Fund | | Country | | Shares | | Value |
Common Stocks 96.2% | | | | | | | |
Diversified REITs 15.8% | | | | | | | |
British Land Co. PLC | | United Kingdom | | 513,800 | | $ | 3,987,744 |
Canadian REIT | | Canada | | 58,200 | | | 1,501,578 |
Dexus Property Group | | Australia | | 5,192,926 | | | 3,960,891 |
Goodman Property Trust | | New Zealand | | 2,016,044 | | | 1,564,917 |
GPT Group | | Australia | | 8,964,765 | | | 4,866,942 |
H&R Real Estate Investment Trust | | Canada | | 217,500 | | | 3,196,856 |
ICADE | | France | | 16,280 | | | 1,555,542 |
Kenedix Realty Investment Corp. | | Japan | | 512 | | | 1,398,666 |
Land Securities Group PLC | | United Kingdom | | 396,762 | | | 4,370,732 |
Liberty Property Trust | | United States | | 185,800 | | | 5,947,458 |
Mirvac Group | | Australia | | 2,982,544 | | | 4,201,926 |
Shaftesbury PLC | | United Kingdom | | 203,000 | | | 1,291,253 |
Stockland | | Australia | | 1,677,931 | | | 5,947,481 |
aStockland, 144A | | Australia | | 652,010 | | | 2,311,071 |
United Urban Investment Corp. | | Japan | | 245 | | | 1,291,138 |
Vornado Realty Trust | | United States | | 150,527 | | | 10,527,858 |
Wereldhave NV | | Netherlands | | 28,140 | | | 2,686,743 |
| | | | | | | |
| | | | | | | 60,608,796 |
| | | | | | | |
Industrial REITs 6.7% | | | | | | | |
AMB Property Corp. | | United States | | 177,700 | | | 4,540,235 |
Ascendas REIT | | Singapore | | 1,771,000 | | | 2,797,310 |
DuPont Fabros Technology Inc. | | United States | | 105,100 | | | 1,890,749 |
Goodman Group | | Australia | | 8,056,681 | | | 4,590,836 |
Japan Logistics Fund Inc. | | Japan | | 204 | | | 1,496,322 |
ProLogis | | United States | | 379,700 | | | 5,198,093 |
Segro PLC | | United Kingdom | | 961,770 | | | 5,379,767 |
| | | | | | | |
| | | | | | | 25,893,312 |
| | | | | | | |
Mortgage REITs 0.4% | | | | | | | |
Starwood Property Trust Inc. | | United States | | 82,900 | | | 1,565,981 |
| | | | | | | |
Office REITs 16.4% | | | | | | | |
Alexandria Real Estate Equities Inc. | | United States | | 85,200 | | | 5,477,508 |
AMP NZ Office Trust | | New Zealand | | 2,119,780 | | | 1,168,724 |
Befimmo SCA | | Belgium | | 20,600 | | | 1,822,350 |
Boston Properties Inc. | | United States | | 194,900 | | | 13,071,943 |
CapitaCommercial Trust | | Singapore | | 1,804,000 | | | 1,501,729 |
Champion REIT | | Hong Kong | | 4,102,196 | | | 1,745,908 |
Commonwealth Property Office Fund | | Australia | | 1,080,957 | | | 940,897 |
Corporate Office Properties Trust | | United States | | 83,700 | | | 3,065,931 |
Derwent London PLC | | United Kingdom | | 79,630 | | | 1,696,529 |
Digital Realty Trust Inc. | | United States | | 89,800 | | | 4,515,144 |
Great Portland Estates PLC | | United Kingdom | | 495,636 | | | 2,323,272 |
Highwoods Properties Inc. | | United States | | 105,700 | | | 3,525,095 |
ING Office Fund | | Australia | | 4,953,779 | | | 2,844,975 |
Japan Real Estate Investment Co. | | Japan | | 563 | | | 4,141,665 |
Kilroy Realty Corp. | | United States | | 59,000 | | | 1,809,530 |
Mack-Cali Realty Corp. | | United States | | 82,400 | | | 2,848,568 |
Nippon Building Fund Inc. | | Japan | | 430 | | | 3,265,003 |
ORIX JREIT Inc. | | Japan | | 408 | | | 2,027,274 |
Silic | | France | | 19,940 | | | 2,426,165 |
SL Green Realty Corp. | | United States | | 51,300 | | | 2,577,312 |
| | | | | | | |
| | | | | | | 62,795,522 |
| | | | | | | |
FGR-11
Franklin Templeton Variable Insurance Products Trust
Statement of Investments, December 31, 2009 (continued)
| | | | | | | |
| Franklin Global Real Estate Securities Fund | | Country | | Shares | | Value |
Common Stocks (continued) | | | | | | | |
Real Estate Development 0.5% | | | | | | | |
Helical Bar PLC | | United Kingdom | | 375,449 | | $ | 2,067,368 |
| | | | | | | |
Real Estate Operating Companies 1.2% | | | | | | | |
bForest City Enterprises Inc., A | | United States | | 130,600 | | | 1,538,468 |
Hongkong Land Holdings Ltd. | | Hong Kong | | 635,000 | | | 3,143,250 |
| | | | | | | |
| | | | | | | 4,681,718 |
| | | | | | | |
Residential REITs 9.4% | | | | | | | |
AvalonBay Communities Inc. | | United States | | 81,090 | | | 6,658,300 |
Boardwalk REIT | | Canada | | 36,600 | | | 1,290,044 |
Camden Property Trust | | United States | | 73,100 | | | 3,097,247 |
Equity Lifestyle Properties Inc. | | United States | | 75,100 | | | 3,790,297 |
Equity Residential | | United States | | 319,000 | | | 10,775,820 |
Essex Property Trust Inc. | | United States | | 26,200 | | | 2,191,630 |
Nippon Accommodations Fund Inc. | | Japan | | 322 | | | 1,683,072 |
Nippon Residential Investment Corp. | | Japan | | 407 | | | 992,768 |
UDR Inc. | | United States | | 345,070 | | | 5,672,951 |
| | | | | | | |
| | | | | | | 36,152,129 |
| | | | | | | |
Retail REITs 31.3% | | | | | | | |
a,bCapitamalls Asia Ltd., 144A | | Singapore | | 1,061,000 | | | 1,917,424 |
CFS Retail Property Trust | | Australia | | 817,232 | | | 1,393,352 |
Corio NV | | Netherlands | | 92,870 | | | 6,339,850 |
Developers Diversified Realty Corp. | | United States | | 126,576 | | | 1,172,094 |
Eurocommercial Properties NV | | Netherlands | | 56,550 | | | 2,331,317 |
Federal Realty Investment Trust | | United States | | 71,900 | | | 4,869,068 |
Frontier Real Estate Investment Corp. | | Japan | | 207 | | | 1,469,348 |
General Growth Properties Inc. | | United States | | 179,800 | | | 2,078,488 |
Hammerson PLC | | United Kingdom | | 829,360 | | | 5,680,005 |
Japan Retail Fund Investment Corp. | | Japan | | 197 | | | 883,513 |
Kimco Realty Corp. | | United States | | 223,000 | | | 3,017,190 |
Klepierre | | France | | 37,250 | | | 1,513,798 |
The Link REIT | | Hong Kong | | 2,496,600 | | | 6,381,806 |
The Macerich Co. | | United States | | 78,305 | | | 2,815,065 |
National Retail Properties Inc. | | United States | | 162,900 | | | 3,456,738 |
Realty Income Corp. | | United States | | 204,400 | | | 5,296,004 |
Regency Centers Corp. | | United States | | 51,100 | | | 1,791,566 |
RioCan REIT | | Canada | | 151,600 | | | 2,862,826 |
Simon Property Group Inc. | | United States | | 212,966 | | | 16,994,687 |
Suntec REIT | | Singapore | | 2,683,000 | | | 2,577,054 |
Tanger Factory Outlet Centers Inc. | | United States | | 79,100 | | | 3,084,109 |
Taubman Centers Inc. | | United States | | 29,400 | | | 1,055,754 |
Unibail-Rodamco SE | | France | | 65,653 | | | 14,444,571 |
Westfield Group | | Australia | | 2,000,365 | | | 22,509,645 |
aWestfield Group, 144A | | Australia | | 368,200 | | | 4,143,269 |
| | | | | | | |
| | | | | | | 120,078,541 |
| | | | | | | |
Specialized REITs 14.5% | | | | | | | |
CDL Hospitality Trusts | | Singapore | | 1,639,000 | | | 2,040,733 |
HCP Inc. | | United States | | 260,900 | | | 7,967,886 |
Health Care REIT Inc. | | United States | | 104,600 | | | 4,635,872 |
Host Hotels & Resorts Inc. | | United States | | 973,639 | | | 11,362,367 |
LaSalle Hotel Properties | | United States | | 56,800 | | | 1,205,864 |
Nationwide Health Properties Inc. | | United States | | 158,100 | | | 5,561,958 |
bPebblebrook Hotel Trust | | United States | | 117,320 | | | 2,582,213 |
FGR-12
Franklin Templeton Variable Insurance Products Trust
Statement of Investments, December 31, 2009 (continued)
| | | | | | | | |
| Franklin Global Real Estate Securities Fund | | Country | | Shares | | Value |
Common Stocks (continued) | | | | | | | | |
Specialized REITs (continued) | | | | | | | | |
Public Storage | | United States | | | 119,400 | | $ | 9,725,130 |
Ventas Inc. | | United States | | | 245,900 | | | 10,755,666 |
| | | | | | | | |
| | | | | | | | 55,837,689 |
| | | | | | | | |
Total Common Stocks (Cost $296,276,998) | | | | | | | | 369,681,056 |
| | | | | | | | |
| | | |
| | | | | Principal
Amount | | |
Short Term Investments (Cost $10,980,401) 2.9% | | | | | | | | |
Repurchase Agreements 2.9% | | | | | | | | |
cJoint Repurchase Agreement, 0.003%, 1/04/10 (Maturity Value $10,980,405) | | United States | | $ | 10,980,401 | | | 10,980,401 |
Banc of America Securities LLC (Maturity Value $1,290,088) | | | | | | | | |
BNP Paribas Securities Corp. (Maturity Value $2,580,065) | | | | | | | | |
Credit Suisse Securities (USA) LLC (Maturity Value $2,150,183) | | | | | | | | |
Deutsche Bank Securities Inc. (Maturity Value $659,813) | | | | | | | | |
HSBC Securities (USA) Inc. (Maturity Value $2,150,183) | | | | | | | | |
Morgan Stanley & Co. Inc. (Maturity Value $1,720,080) | | | | | | | | |
UBS Securities LLC (Maturity Value $429,993) | | | | | | | | |
Collateralized by U.S. Government Agency Securities, 0.50% - 7.625%, 3/30/10 - 2/09/28; dU.S. Government Agency Discount Notes, 9/21/10; dU.S. Treasury Bills, 8/26/10 - 12/16/10; and U.S. Treasury Notes, 0.875% - 4.25%, 5/31/11 - 11/15/14 | | | | | | | | |
| | | | | | | | |
Total Investments (Cost $307,257,399) 99.1% | | | | | | | | 380,661,457 |
Other Assets, less Liabilities 0.9% | | | | | | | | 3,272,030 |
| | | | | | | | |
Net Assets 100.0% | | | | | | | $ | 383,933,487 |
| | | | | | | | |
aSecurity was purchased pursuant to Rule 144A under the Securities Act of 1933 and may be sold in transactions exempt from registration only to qualified institutional buyers or in a public offering registered under the Securities Act of 1933. These securities have been deemed liquid under guidelines approved by the Trust’s Board of Trustees. At December 31, 2009, the aggregate value of these securities was $8,371,764, representing 2.18% of net assets.
bNon-income producing.
cSee Note 1(c) regarding joint repurchase agreement.
dThe security is traded on a discount basis with no stated coupon rate.
FGR-13
Franklin Templeton Variable Insurance Products Trust
Statement of Investments, December 31, 2009 (continued)
|
| Franklin Global Real Estate Securities Fund |
At December 31, 2009, the Fund had the following forward exchange contracts outstanding. See Note 1(d).
Forward Exchange Contracts
| | | | | | | | | | | | | | | | | |
| Currency | | Counterparty | | Type | | Quantity | | Contract
Amount | | Settlement
Date | | Unrealized
Appreciation | | Unrealized
Depreciation | |
Australian Dollar | | DBAB | | Sell | | 2,701,164 | | $ | 2,419,000 | | 1/15/10 | | $ | — | | $ (1,089 | ) |
Australian Dollar | | DBAB | | Sell | | 4,187,481 | | | 3,759,102 | | 1/15/10 | | | 7,357 | | — | |
Japanese Yen | | DBAB | | Buy | | 188,355,405 | | | 2,121,000 | | 1/19/10 | | | — | | (95,040 | ) |
Japanese Yen | | DBAB | | Sell | | 220,778,378 | | | 2,474,539 | | 1/19/10 | | | 99,836 | | — | |
Euro | | JPHQ | | Sell | | 4,803,953 | | | 7,145,304 | | 1/20/10 | | | 268,904 | | — | |
Australian Dollar | | UBSW | | Buy | | 8,007,497 | | | 7,357,000 | | 1/21/10 | | | — | | (187,235 | ) |
Australian Dollar | | HSBC | | Buy | | 3,029,059 | | | 2,731,000 | | 1/21/10 | | | — | | (18,836 | ) |
Australian Dollar | | JPHQ | | Sell | | 3,394,834 | | | 3,099,483 | | 1/21/10 | | | 59,812 | | — | |
Australian Dollar | | HSBC | | Sell | | 8,031,708 | | | 7,329,335 | | 1/21/10 | | | 137,893 | | — | |
Australian Dollar | | UBSW | | Sell | | 14,719,041 | | | 13,450,292 | | 1/21/10 | | | 271,136 | | — | |
British Pound | | UBSW | | Buy | | 2,973,225 | | | 4,914,000 | | 1/21/10 | | | — | | (112,073 | ) |
British Pound | | BZWS | | Sell | | 2,379,507 | | | 3,879,357 | | 1/21/10 | | | 36,320 | | — | |
British Pound | | UBSW | | Sell | | 7,215,219 | | | 11,816,512 | | 1/21/10 | | | 163,525 | | — | |
Canadian Dollar | | UBSW | | Sell | | 4,238,993 | | | 4,076,806 | | 1/21/10 | | | 44,067 | | — | |
Euro | | UBSW | | Buy | | 3,976,644 | | | 5,912,000 | | 1/21/10 | | | — | | (219,823 | ) |
Euro | | UBSW | | Sell | | 10,153,550 | | | 15,144,222 | | 1/21/10 | | | 610,409 | | — | |
Japanese Yen | | CITI | | Sell | | 343,273,797 | | | 3,785,343 | | 1/21/10 | | | 93,035 | | — | |
Singapore Dollar | | BZWS | | Sell | | 349,896 | | | 251,038 | | 1/21/10 | | | 2,152 | | — | |
Singapore Dollar | | CITI | | Sell | | 2,871,982 | | | 2,070,017 | | 1/21/10 | | | 27,137 | | — | |
Canadian Dollar | | DBAB | | Sell | | 2,482,598 | | | 2,336,497 | | 1/28/10 | | | — | | (25,311 | ) |
Australian Dollar | | BOFA | | Sell | | 5,544,358 | | | 5,097,909 | | 2/22/10 | | | 149,327 | | — | |
Australian Dollar | | JPHQ | | Sell | | 7,784,563 | | | 7,170,673 | | 2/22/10 | | | 222,608 | | — | |
British Pound | | BOFA | | Sell | | 2,266,408 | | | 3,806,772 | | 2/22/10 | | | 147,091 | | — | |
Euro | | BZWS | | Sell | | 2,771,063 | | | 4,132,875 | | 2/22/10 | | | 166,602 | | — | |
Japanese Yen | | BZWS | | Sell | | 328,128,712 | | | 3,676,595 | | 2/22/10 | | | 146,596 | | — | |
Japanese Yen | | JPHQ | | Sell | | 100,796,081 | | | 1,129,494 | | 2/22/10 | | | 45,133 | | — | |
Singapore Dollar | | BOFA | | Sell | | 4,133,949 | | | 2,984,370 | | 2/22/10 | | | 45,072 | | — | |
Canadian Dollar | | DBAB | | Sell | | 892,834 | | | 841,328 | | 3/01/10 | | | — | | (8,050 | ) |
Euro | | DBAB | | Sell | | 3,965,527 | | | 5,674,868 | | 3/23/10 | | | — | | (683 | ) |
Australian Dollar | | CITI | | Sell | | 6,092,505 | | | 5,336,057 | | 3/24/10 | | | — | | (83,562 | ) |
Australian Dollar | | DBAB | | Sell | | 9,434,985 | | | 8,311,089 | | 3/24/10 | | | — | | (81,850 | ) |
Australian Dollar | | HSBC | | Sell | | 5,878,471 | | | 5,172,466 | | 3/24/10 | | | — | | (56,758 | ) |
Australian Dollar | | BZWS | | Sell | | 3,574,502 | | | 3,145,204 | | 3/24/10 | | | — | | (34,512 | ) |
Australian Dollar | | BOFA | | Sell | | 2,572,273 | | | 2,259,948 | | 3/24/10 | | | — | | (28,231 | ) |
British Pound | | BZWS | | Sell | | 1,616,274 | | | 2,613,920 | | 3/24/10 | | | 4,544 | | — | |
British Pound | | DBAB | | Sell | | 3,318,795 | | | 5,367,455 | | 3/24/10 | | | 9,462 | | — | |
British Pound | | CITI | | Sell | | 2,460,287 | | | 3,978,181 | | 3/24/10 | | | 6,198 | | — | |
Canadian Dollar | | DBAB | | Sell | | 1,909,256 | | | 1,792,662 | | 3/24/10 | | | — | | (23,593 | ) |
Euro | | DBAB | | Sell | | 1,431,201 | | | 2,054,317 | | 3/24/10 | | | 5,955 | | — | |
Hong Kong Dollar | | HSBC | | Sell | | 59,729,827 | | | 7,704,490 | | 3/24/10 | | | — | | (3,269 | ) |
Japanese Yen | | HSBC | | Sell | | 526,797,231 | | | 5,828,048 | | 3/24/10 | | | 159,676 | | — | |
Japanese Yen | | DBAB | | Sell | | 48,536,734 | | | 537,202 | | 3/24/10 | | | 14,944 | | — | |
Japanese Yen | | CITI | | Sell | | 40,334,385 | | | 446,361 | | 3/24/10 | | | 12,360 | | — | |
New Zealand Dollar | | DBAB | | Sell | | 5,033,473 | | | 3,549,001 | | 3/24/10 | | | — | | (80,444 | ) |
New Zealand Dollar | | UBSW | | Sell | | 553,646 | | | 389,813 | | 3/24/10 | | | — | | (9,400 | ) |
Singapore Dollar | | DBAB | | Sell | | 8,314,094 | | | 5,925,095 | | 3/24/10 | | | 14,782 | | — | |
Australian Dollar | | BOFA | | Sell | | 1,959,408 | | | 1,715,559 | | 3/31/10 | | | — | | (26,026 | ) |
Euro | | BOFA | | Sell | | 3,621,888 | | | 5,217,221 | | 3/31/10 | | | 33,594 | | — | |
Japanese Yen | | BOFA | | Sell | | 273,118,545 | | | 2,987,024 | | 3/31/10 | | | 48,110 | | — | |
| | | | | | | | | | | | | | | |
Unrealized appreciation (depreciation) | | | | | | | | | | | | 3,053,637 | | (1,095,785 | ) |
| | | | | | | | | | | | | | | |
Net unrealized appreciation (depreciation) | | | | | | | | | $ | 1,957,852 | | | |
| | | | | | | | | | | | | | | | | |
See Abbreviations on page FGR-26.
The accompanying notes are an integral part of these financial statements.
FGR-14
Franklin Templeton Variable Insurance Products Trust
Financial Statements
Statement of Assets and Liabilities
December 31, 2009
| | | | |
| | | Franklin Global
Real Estate
Securities Fund | |
Assets: | | | | |
Investments in securities: | | | | |
Cost - Unaffiliated issuers | | $ | 296,276,998 | |
Cost - Repurchase agreements | | | 10,980,401 | |
| | | | |
Total cost of investments | | $ | 307,257,399 | |
| | | | |
Value - Unaffiliated issuers | | $ | 369,681,056 | |
Value - Repurchase agreements | | | 10,980,401 | |
Total value of investments | | | 380,661,457 | |
Receivables: | | | | |
Investment securities sold | | | 305,163 | |
Capital shares sold | | | 11,722 | |
Dividends | | | 2,088,060 | |
Unrealized appreciation on forward exchange contracts | | | 3,053,637 | |
Other assets | | | 58 | |
| | | | |
Total assets | | | 386,120,097 | |
| | | | |
Liabilities: | | | | |
Payables: | | | | |
Capital shares redeemed | | | 373,679 | |
Affiliates | | | 373,150 | |
Reports to shareholders | | | 116,400 | |
Foreign currency advanced by custodian | | | 173,726 | |
Unrealized depreciation on forward exchange contracts | | | 1,095,785 | |
Accrued expenses and other liabilities | | | 53,870 | |
| | | | |
Total liabilities | | | 2,186,610 | |
| | | | |
Net assets, at value | | $ | 383,933,487 | |
| | | | |
Net assets consist of: | | | | |
Paid-in capital | | $ | 714,245,245 | |
Distributions in excess of net investment income | | | (2,713,247 | ) |
Net unrealized appreciation (depreciation) | | | 75,342,350 | |
Accumulated net realized gain (loss) | | | (402,940,861 | ) |
| | | | |
Net assets, at value | | $ | 383,933,487 | |
| | | | |
The accompanying notes are an integral part of these financial statements.
FGR-15
Franklin Templeton Variable Insurance Products Trust
Financial Statements (continued)
Statement of Assets and Liabilities (continued)
December 31, 2009
| | | |
| | | Franklin Global
Real Estate
Securities Fund |
Class 1: | | | |
Net assets, at value | | $ | 38,486,423 |
| | | |
Shares outstanding | | | 3,449,549 |
| | | |
Net asset value and maximum offering price per share | | $ | 11.16 |
| | | |
Class 2: | | | |
Net assets, at value | | $ | 345,444,677 |
| | | |
Shares outstanding | | | 31,624,473 |
| | | |
Net asset value and maximum offering price per share | | $ | 10.92 |
| | | |
Class 4: | | | |
Net assets, at value | | $ | 2,387 |
| | | |
Shares outstanding | | | 214 |
| | | |
Net asset value and maximum offering price per share | | $ | 11.14 |
| | | |
The accompanying notes are an integral part of these financial statements.
FGR-16
Franklin Templeton Variable Insurance Products Trust
Financial Statements (continued)
Statement of Operations
for the year ended December 31, 2009
| | | | |
| | | Franklin Global
Real Estate
Securities Fund | |
Investment income: | | | | |
Dividends (net of foreign taxes of $835,706) | | $ | 13,075,433 | |
Interest | | | 11,752 | |
| | | | |
Total investment income | | | 13,087,185 | |
| | | | |
Expenses: | | | | |
Management fees (Note 3a) | | | 2,692,412 | |
Administrative fees (Note 3b) | | | 841,379 | |
Distribution fees: (Note 3c) | | | | |
Class 2 | | | 757,317 | |
Class 4 | | | 7 | |
Unaffiliated transfer agent fees | | | 1,334 | |
Custodian fees (Note 4) | | | 32,083 | |
Reports to shareholders | | | 87,098 | |
Professional fees | | | 36,799 | |
Trustees’ fees and expenses | | | 2,432 | |
Other | | | 30,377 | |
| | | | |
Total expenses | | | 4,481,238 | |
Expense reductions (Note 4) | | | (394 | ) |
Expenses waived/paid by affiliates (Note 3e) | | | (1,166,121 | ) |
| | | | |
Net expenses | | | 3,314,723 | |
| | | | |
Net investment income | | | 9,772,462 | |
| | | | |
Realized and unrealized gains (losses): | | | | |
Net realized gain (loss) from: | | | | |
Investments | | | (148,887,231 | ) |
Foreign currency transactions | | | (17,443,906 | ) |
| | | | |
Net realized gain (loss) | | | (166,331,137 | ) |
| | | | |
Net change in unrealized appreciation (depreciation) on: | | | | |
Investments | | | 212,044,603 | |
Translation of other assets and liabilities denominated in foreign currencies | | | 3,600,913 | |
| | | | |
Net change in unrealized appreciation (depreciation) | | | 215,645,516 | |
| | | | |
Net realized and unrealized gain (loss) | | | 49,314,379 | |
| | | | |
Net increase (decrease) in net assets resulting from operations | | $ | 59,086,841 | |
| | | | |
The accompanying notes are an integral part of these financial statements.
FGR-17
Franklin Templeton Variable Insurance Products Trust
Financial Statements (continued)
Statements of Changes in Net Assets
| | | | | | | | |
| | | Franklin Global Real Estate
Securities Fund | |
| | | Year Ended December 31, | |
| | | 2009 | | | 2008 | |
| | | | |
Increase (decrease) in net assets: | | | | | | | | |
Operations: | | | | | | | | |
Net investment income | | $ | 9,772,462 | | | $ | 21,545,683 | |
Net realized gain (loss) from investments and foreign currency transactions | | | (166,331,137 | ) | | | (188,456,332 | ) |
Net change in unrealized appreciation (depreciation) on investments and translation of other assets and liabilities denominated in foreign currencies | | | 215,645,516 | | | | (163,343,453 | ) |
| | | | |
Net increase (decrease) in net assets resulting from operations | | | 59,086,841 | | | | (330,254,102 | ) |
| | | | |
Distributions to shareholders from: | | | | | | | | |
Net investment income and net foreign currency gains: | | | | | | | | |
Class 1 | | | (4,292,176 | ) | | | (938,439 | ) |
Class 2 | | | (39,137,801 | ) | | | (6,327,844 | ) |
Class 4 | | | (277 | ) | | | (68 | ) |
Net realized gains: | | | | | | | | |
Class 1 | | | — | | | | (17,121,915 | ) |
Class 2 | | | — | | | | (172,823,447 | ) |
Class 4 | | | — | | | | (1,237 | ) |
| | | | |
Total distributions to shareholders | | | (43,430,254 | ) | | | (197,212,950 | ) |
| | | | |
Capital share transactions: (Note 2) | | | | | | | | |
Class 1 | | | (1,895,657 | ) | | | 5,111,100 | |
Class 2 | | | (12,548,461 | ) | | | (72,014,922 | ) |
Class 4 | | | — | | | | 5,000 | |
| | | | |
Total capital share transactions | | | (14,444,118 | ) | | | (66,898,822 | ) |
| | | | |
Net increase (decrease) in net assets | | | 1,212,469 | | | | (594,365,874 | ) |
Net assets: | | | | | | | | |
Beginning of year | | | 382,721,018 | | | | 977,086,892 | |
| | | | |
End of year | | $ | 383,933,487 | | | $ | 382,721,018 | |
| | | | |
Undistributed net investment income (distributions in excess of net investment income) included in net assets: | | | | | | | | |
End of year | | $ | (2,713,247 | ) | | $ | 48,180,845 | |
| | | | |
The accompanying notes are an integral part of these financial statements.
FGR-18
Franklin Templeton Variable Insurance Products Trust
Notes to Financial Statements
Franklin Global Real Estate Securities Fund
1. ORGANIZATION AND SIGNIFICANT ACCOUNTING POLICIES
Franklin Templeton Variable Insurance Products Trust (Trust) is registered under the Investment Company Act of 1940, as amended, (1940 Act) as an open-end investment company, consisting of twenty-two separate funds. The Franklin Global Real Estate Securities Fund (Fund) is included in this report. The financial statements of the remaining funds in the Trust are presented separately. Shares of the Fund are generally sold only to insurance company separate accounts to fund the benefits of variable life insurance policies or variable annuity contracts. At December 31, 2009, 60.92% of the Fund’s shares were held through one insurance company. The Fund offers three classes of shares: Class 1, Class 2, and Class 4. Each class of shares differs by its distribution fees, voting rights on matters affecting a single class and its exchange privilege.
The following summarizes the Fund’s significant accounting policies.
a. Security Valuation
Equity and other securities listed on a securities exchange or on the NASDAQ National Market System are valued at the last quoted sale price or the official closing price of the day, respectively. Over-the-counter securities and listed securities for which there is no reported sale are valued within the range of the most recent quoted bid and ask prices. Securities that trade in multiple markets or on multiple exchanges are valued according to the broadest and most representative market. Certain equity securities are valued based upon fundamental characteristics or relationships to similar securities.
Foreign equity securities are valued as of the close of trading on the foreign stock exchange on which the security is primarily traded, or the NYSE, whichever is earlier. If no sale is reported at that time, the foreign equity security will be valued within the range of the most recent quoted bid and ask prices. The value is then converted into its U.S. dollar equivalent at the foreign exchange rate in effect at the close of the NYSE on the day that the value of the security is determined.
The Fund has procedures to determine the fair value of individual securities and other assets for which market prices are not readily available or which may not be reliably priced. Methods for valuing these securities may include: fundamental analysis based upon the underlying investment book value, anticipated future cash flows, market changes in comparable or similar securities, matrix pricing, discounts from market prices of similar securities, or discounts applied due to the nature and duration of restrictions on the disposition of the securities. Due to the inherent uncertainty of valuations of such securities, the fair values may differ significantly from the values that would have been used had a ready market for such investments existed. Occasionally, events occur between the time at which trading in a security is completed and the close of the NYSE that might call into question the availability (including the reliability) of the value of a portfolio security held by the Fund. The investment manager monitors price movements following the close of trading in foreign stock markets through a series of country specific market proxies (such as baskets of American Depository Receipts, futures contracts and exchange traded funds). These price movements are measured against established trigger thresholds for each specific market proxy to assist in determining if an event has occurred. If such an event occurs, the securities may be valued using fair value procedures, which may include the use of independent pricing services. All security valuation procedures are approved by the Fund’s Board of Trustees.
b. Foreign Currency Translation
Portfolio securities and other assets and liabilities denominated in foreign currencies are translated into U.S. dollars based on the exchange rate of such currencies against U.S. dollars on the date of valuation. The Fund may enter into foreign currency exchange contracts to facilitate transactions denominated in a foreign currency. Purchases and sales of securities, income and expense items denominated in foreign currencies are translated into U.S. dollars at the exchange rate in effect on the transaction date. Occasionally, events may impact the availability or reliability of foreign exchange rates used to convert the U.S. dollar equivalent value. If such an event occurs, the foreign exchange rate will be valued at fair value using procedures established and approved by the Fund’s Board of Trustees.
The Fund does not separately report the effect of changes in foreign exchange rates from changes in market prices on securities held. Such changes are included in net realized and unrealized gain or loss from investments on the Statement of Operations.
FGR-19
Franklin Templeton Variable Insurance Products Trust
Notes to Financial Statements (continued)
Franklin Global Real Estate Securities Fund
1. ORGANIZATION AND SIGNIFICANT ACCOUNTING POLICIES (continued)
b. Foreign Currency Translation (continued)
Realized foreign exchange gains or losses arise from sales of foreign currencies, currency gains or losses realized between the trade and settlement dates on securities transactions and the difference between the recorded amounts of dividends, interest, and foreign withholding taxes and the U.S. dollar equivalent of the amounts actually received or paid. Net unrealized foreign exchange gains and losses arise from changes in foreign exchange rates on foreign denominated assets and liabilities other than investments in securities held at the end of the reporting period.
c. Joint Repurchase Agreement
The Fund may enter into a joint repurchase agreement whereby its uninvested cash balance is deposited into a joint cash account with other funds managed by the investment manager or an affiliate of the investment manager and is used to invest in one or more repurchase agreements. The value and face amount of the joint repurchase agreement are allocated to the funds based on their pro-rata interest. A repurchase agreement is accounted for as a loan by the fund to the seller, collateralized by securities which are delivered to the fund’s custodian. The market value, including accrued interest, of the initial collateralization is required to be at least 102% of the dollar amount invested by the funds, with the value of the underlying securities marked to market daily to maintain coverage of at least 100%. The joint repurchase agreement held by the Fund at year end had been entered into on December 31, 2009. The joint repurchase agreement is valued at cost which approximates market value.
d. Derivative Financial Instruments
The Fund may invest in derivative financial instruments (derivatives) in order to manage risk or gain exposure to various other investments or markets. Derivatives are financial contracts based on an underlying or notional amount, require no initial investment or an initial net investment that is smaller than would normally be required to have a similar response to changes in market factors, and require or permit net settlement. Derivatives may contain various risks including the potential inability of the counterparty to fulfill their obligations under the terms of the contract, the potential for an illiquid secondary market, and the potential for market movements which may expose the Fund to gains or losses in excess of the amounts shown on the Statement of Assets and Liabilities.
Derivatives are marked to market daily based upon quotations from market makers or the Fund’s independent pricing services and the Fund’s net benefit or obligation under the contract, as measured by the fair market value of the contract, is included in net assets. Realized gain and loss and unrealized appreciation and depreciation on these contracts for the period are included in the Statement of Operations.
The Fund generally enters into forward exchange contracts in order to hedge against fluctuations in foreign exchange rates or to gain exposure to certain foreign currencies. A forward exchange contract is an agreement between the Fund and a counterparty to buy or sell a foreign currency for a specific exchange rate on a future date. Pursuant to the terms of the forward exchange contracts, cash or securities may be required to be deposited as collateral.
See Note 7 regarding other derivative information.
e. Income Taxes
No provision has been made for U.S. income taxes because it is the Fund’s policy to qualify as a regulated investment company under the Internal Revenue Code and to distribute to shareholders substantially all of its taxable income and net realized gains.
The Fund has reviewed the tax positions, taken on federal income tax returns, for each of the three open tax years and as of December 31, 2009, and has determined that no provision for income tax is required in the Fund’s financial statements.
Foreign securities held by the Fund may be subject to foreign taxation on dividend income received. Foreign taxes, if any, are recorded based on the tax regulations and rates that exist in the foreign markets in which the Fund invests.
FGR-20
Franklin Templeton Variable Insurance Products Trust
Notes to Financial Statements (continued)
Franklin Global Real Estate Securities Fund
1. ORGANIZATION AND SIGNIFICANT ACCOUNTING POLICIES (continued)
f. Security Transactions, Investment Income, Expenses and Distributions
Security transactions are accounted for on trade date. Realized gains and losses on security transactions are determined on a specific identification basis. Interest income and estimated expenses are accrued daily. Dividend income is recorded on the ex-dividend date except that certain dividends from foreign securities are recognized as soon as the Fund is notified of the ex-dividend date. Distributions to shareholders are recorded on the ex-dividend date and are determined according to income tax regulations (tax basis). Distributable earnings determined on a tax basis may differ from earnings recorded in accordance with accounting principles generally accepted in the United States of America. These differences may be permanent or temporary. Permanent differences are reclassified among capital accounts to reflect their tax character. These reclassifications have no impact on net assets or the results of operations. Temporary differences are not reclassified, as they may reverse in subsequent periods.
Common expenses incurred by the Trust are allocated among the funds based on the ratio of net assets of each fund to the combined net assets of the Trust. Fund specific expenses are charged directly to the fund that incurred the expense.
Realized and unrealized gains and losses and net investment income, not including class specific expenses, are allocated daily to each class of shares based upon the relative proportion of net assets of each class. Differences in per share distributions, by class, are generally due to differences in class specific expenses.
Distributions received by the Fund from certain securities may be a return of capital (ROC). Such distributions reduce the cost basis of the securities, and any distributions in excess of the cost basis are recognized as capital gains.
g. Accounting Estimates
The preparation of financial statements in accordance with accounting principles generally accepted in the United States of America requires management to make estimates and assumptions that affect the reported amounts of assets and liabilities at the date of the financial statements and the amounts of income and expenses during the reporting period. Actual results could differ from those estimates.
h. Guarantees and Indemnifications
Under the Trust’s organizational documents, its officers and trustees are indemnified by the Trust against certain liabilities arising out of the performance of their duties to the Trust. Additionally, in the normal course of business, the Trust, on behalf of the Fund, enters into contracts with service providers that contain general indemnification clauses. The Trust’s maximum exposure under these arrangements is unknown as this would involve future claims that may be made against the Trust that have not yet occurred. Currently, the Trust expects the risk of loss to be remote.
2. SHARES OF BENEFICIAL INTEREST
At December 31, 2009, there were an unlimited number of shares authorized (without par value). Transactions in the Fund’s shares were as follows:
| | | | | | | | | | | | | | |
| | | Year Ended December 31, | |
| | | 2009 | | | 2008 | |
| Class 1 Shares: | | Shares | | | Amount | | | Shares | | | Amount | |
Shares sold | | 44,534 | | | $ | 426,475 | | | 8,666 | | | $ | 137,517 | |
Shares issued in reinvestment of distributions | | 510,366 | | | | 4,292,176 | | | 1,051,855 | | | | 18,060,354 | |
Shares redeemed | | (705,877 | ) | | | (6,614,308 | ) | | (734,804 | ) | | | (13,086,771 | ) |
| | | | |
Net increase (decrease) | | (150,977 | ) | | $ | (1,895,657 | ) | | 325,717 | | | $ | 5,111,100 | |
| | | | |
FGR-21
Franklin Templeton Variable Insurance Products Trust
Notes to Financial Statements (continued)
Franklin Global Real Estate Securities Fund
2. SHARES OF BENEFICIAL INTEREST (continued)
| | | | | | | | | | | | | | |
| | | Year Ended December 31, | |
| | | 2009 | | | 2008a | |
Class 2 Shares: | | | | | | | | | | | | | | |
Shares sold | | 1,108,202 | | | $ | 9,575,869 | | | 1,073,979 | | | $ | 16,369,385 | |
Shares issued in reinvestment of distributions | | 4,749,733 | | | | 39,137,801 | | | 10,644,759 | | | | 179,151,291 | |
Shares redeemed | | (6,626,769 | ) | | | (61,262,131 | ) | | (15,122,736 | ) | | | (267,535,598 | ) |
| | | | |
Net increase (decrease) | | (768,834 | ) | | $ | (12,548,461 | ) | | (3,403,998 | ) | | $ | (72,014,922 | ) |
| | | | |
Class 4 Shares: | | | | | | | | | | | | | | |
Shares sold | | — | | | $ | — | | | 214 | | | $ | 5,000 | |
| | | | |
| a | For the period February 29, 2008 (effective date) to December 31, 2008 for Class 4. |
3. TRANSACTIONS WITH AFFILIATES
Franklin Resources, Inc. is the holding company for various subsidiaries that together are referred to as Franklin Templeton Investments. Certain officers and trustees of the Trust are also officers and/or directors of the following subsidiaries:
| | |
| Subsidiary | | Affiliation |
Franklin Templeton Institutional, LLC (FT Institutional) | | Investment manager |
Franklin Templeton Services, LLC (FT Services) | | Administrative manager |
Franklin Templeton Distributors, Inc. (Distributors) | | Principal underwriter |
Franklin Templeton Investor Services, LLC (Investor Services) | | Transfer agent |
a. Management Fees
The Fund pays an investment management fee to FT Institutional based on the average daily net assets of the Fund as follows:
| | |
| Annualized Fee Rate | | Net Assets |
| 0.800% | | Up to and including $500 million |
| 0.700% | | Over $500 million, up to and including $1 billion |
| 0.650% | | Over $1 billion, up to and including $1.5 billion |
| 0.600% | | Over $1.5 billion, up to and including $6.5 billion |
| 0.580% | | Over $6.5 billion, up to and including $11.5 billion |
| 0.560% | | Over $11.5 billion, up to and including $16.5 billion |
| 0.540% | | Over $16.5 billion, up to and including $19 billion |
| 0.530% | | Over $19 billion, up to and including $21.5 billion |
| 0.520% | | In excess of $21.5 billion |
b. Administrative Fees
The Fund pays an administrative fee to FT Services of 0.25% per year of the average daily net assets of the Fund.
c. Distribution Fees
The Fund’s Board of Trustees has adopted distribution plans for Class 2 and Class 4 shares pursuant to Rule 12b-1 under the 1940 Act. Under the Fund’s compensation distribution plans, the Fund pays Distributors for costs incurred in connection with the servicing, sale and distribution of the Fund’s shares up to 0.35% per year of its average daily net assets of each class. The Board of Trustees has agreed to limit the current rate to 0.25% per year for Class 2.
FGR-22
Franklin Templeton Variable Insurance Products Trust
Notes to Financial Statements (continued)
Franklin Global Real Estate Securities Fund
3. TRANSACTIONS WITH AFFILIATES (continued)
d. Transfer Agent Fees
Investor Services, under terms of an agreement, performs shareholder servicing for the Fund and is not paid by the Fund for the services.
e. Waiver and Expense Reimbursements
FT Services and FT Institutional have contractually agreed in advance to waive or limit their respective fees so that the increase in the Fund’s investment management and fund administration fees that became effective May 1, 2007 is phased in over a five year period, with there being no increase in the rate of such fees for the first year ending April 30, 2008. For each of the four years thereafter through April 30, 2012, the manager and administrator will receive one-fifth of the increase in the rate of fees. Beginning May 1, 2012, the full new investment management and administration fees will then be in effect.
4. EXPENSE OFFSET ARRANGEMENT
The Fund has entered into an arrangement with its custodian whereby credits realized as a result of uninvested cash balances are used to reduce a portion of the Fund’s custodian expenses. During the year ended December 31, 2009, the custodian fees were reduced as noted in the Statement of Operations.
5. INCOME TAXES
For tax purposes, capital losses may be carried over to offset future capital gains, if any. At December 31, 2009, the capital loss carryforwards were as follows:
| | | |
Capital loss carryforwards expiring in: | | | |
2016 | | $ | 151,234,938 |
2017 | | | 208,967,392 |
| | | |
| | $ | 360,202,330 |
| | | |
For tax purposes, realized capital losses occurring subsequent to October 31, may be deferred and treated as occurring on the first day of the following fiscal year. At December 31, 2009, the Fund deferred realized capital losses of $3,679,891.
The tax character of distributions paid during the years ended December 31, 2009 and 2008, was as follows:
| | | | | | |
| | | 2009 | �� | 2008 |
Distributions paid from: | | | | | | |
Ordinary income | | $ | 43,430,254 | | $ | 7,267,384 |
Long term capital gain | | | — | | | 189,945,566 |
| | | |
| | $ | 43,430,254 | | $ | 197,212,950 |
| | | |
At December 31, 2009, the cost of investments and net unrealized appreciation (depreciation) for income tax purposes were as follows:
| | | | |
Cost of investments | | $ | 359,987,804 | |
| | | | |
| |
Unrealized appreciation | | $ | 57,250,510 | |
Unrealized depreciation | | | (36,576,857 | ) |
| | | | |
Net unrealized appreciation (depreciation) | | $ | 20,673,653 | |
| | | | |
Distributable earnings - undistributed ordinary income | | $ | 12,830,500 | |
| | | | |
FGR-23
Franklin Templeton Variable Insurance Products Trust
Notes to Financial Statements (continued)
Franklin Global Real Estate Securities Fund
5. INCOME TAXES (continued)
Net investment income (loss) differs for financial statement and tax purposes primarily due to differing treatments of foreign currency transactions and passive foreign investment company shares.
Net realized gains (losses) differ for financial statement and tax purposes primarily due to differing treatments of wash sales, foreign currency transactions, and passive foreign investment company shares.
6. INVESTMENT TRANSACTIONS
Purchases and sales of investments (excluding short term securities) for the year ended December 31, 2009, aggregated $289,031,373 and $347,506,029, respectively.
7. OTHER DERIVATIVE INFORMATION
At December 31, 2009, the Fund has invested in derivative contracts which are reflected on the Statement of Assets and Liabilities as follows:
| | | | | | | | | | |
| | | Asset Derivatives | | Liability Derivatives |
Derivative Contracts Not Accounted
for as Hedging Instruments | | Statement of Assets and
Liabilities Location | | Fair
Value
Amount | | Statement of Assets and
Liabilities Location | | Fair
Value
Amount |
Foreign exchange contracts | | Unrealized appreciation on forward exchange contracts | | $ | 3,053,637 | | Unrealized depreciation on forward exchange contracts | | $ | 1,095,785 |
For the period ended December 31, 2009, the effect of derivative contracts on the Fund’s Statement of Operations was as follows:
| | | | | | | | | | | |
Derivative Contracts Not Accounted
for as Hedging Instruments | | Statement of Operations Locations | | Realized Gain
(Loss) for the
Year Ended
December 31, 2009 | | | Change in
Unrealized
Appreciation
(Depreciation)
for the Year Ended
December 31, 2009 | | Average
Notional
Amount
Outstanding
During the
Yeara |
Foreign exchange contracts | | Net realized gain (loss) from foreign currency transactions / Net change in unrealized appreciation (depreciation) on translation of other assets and liabilities denominated in foreign currencies | | $ | (16,999,360 | ) | | $ | 3,595,022 | | 232,541,055 |
a Notional amount represents the U.S. dollar equivalent based on the foreign exchange rate at the time of contract entry.
See Note 1(d) regarding derivative financial instruments.
8. CREDIT FACILITY
The Fund, together with other U.S. registered and foreign investment funds (collectively “Borrowers”), managed by Franklin Templeton Investments, are borrowers in a joint syndicated senior unsecured credit facility totaling $725 million (Global Credit Facility) to provide a source of funds to the Borrowers for temporary and emergency purposes, including the ability to meet future unanticipated or unusually large redemption requests. Effective January 22, 2010, the Fund renewed the Global Credit Facility, for a total of $750 million, maturing January 21, 2011.
FGR-24
Franklin Templeton Variable Insurance Products Trust
Notes to Financial Statements (continued)
Franklin Global Real Estate Securities Fund
8. CREDIT FACILITY (continued)
Under the terms of the Global Credit Facility, the Fund shall, in addition to interest charged on any borrowings made by the Fund and other costs incurred by the Fund, pay its share of fees and expenses incurred in connection with the implementation and maintenance of the Global Credit Facility, based upon its relative share of the aggregate net assets of all of the Borrowers, including an annual commitment fee of 0.10% based upon the unused portion of the Global Credit Facility, which is reflected in other expenses on the Statement of Operations. During the year ended December 31, 2009, the Fund did not utilize the Global Credit Facility.
9. FAIR VALUE MEASUREMENTS
The Fund follows a fair value hierarchy that distinguishes between market data obtained from independent sources (observable inputs) and the Fund’s own market assumptions (unobservable inputs). These inputs are used in determining the value of the Fund’s investments and are summarized in the following fair value hierarchy:
| | • | | Level 1 – quoted prices in active markets for identical securities |
| | • | | Level 2 – other significant observable inputs (including quoted prices for similar securities, interest rates, prepayment speed, credit risk, etc.) |
| | • | | Level 3 – significant unobservable inputs (including the Fund’s own assumptions in determining the fair value of investments) |
The inputs or methodology used for valuing securities are not an indication of the risk associated with investing in those securities.
The following is a summary of the inputs used as of December 31, 2009, in valuing the Fund’s assets and liabilities carried at fair value:
| | | | | | | | | | | | |
| | | Level 1 | | Level 2 | | Level 3 | | Total |
| | | |
Assets: | | | | | | | | | | | | |
Investments in Securities | | | | | | | | | | | | |
Equity Investmentsa | | $ | 369,681,056 | | $ | — | | $ | — | | $ | 369,681,056 |
Short Term Investments | | | — | | | 10,980,401 | | | — | | | 10,980,401 |
| | | |
Total Investments in Securities | | $ | 369,681,056 | | $ | 10,980,401 | | $ | — | | $ | 380,661,457 |
| | | |
Forward Exchange Contracts | | | — | | | 3,053,637 | | | — | | | 3,053,637 |
Liabilities: | | | | | | | | | | | | |
Forward Exchange Contracts | | | — | | | 1,095,785 | | | — | | | 1,095,785 |
aFor detailed industry descriptions, see the accompanying Statement of Investments.
10. NEW ACCOUNTING PRONOUNCEMENTS
In January 2010, the Financial Accounting Standards Board issued Accounting Standards Update (ASU) No. 2010-6, Fair Value Measurements and Disclosures (Topic 820): Improving Disclosures about Fair Value Measurements. ASU No. 2010-6 enhances and clarifies existing fair value measurement disclosure requirements and is effective for interim and annual periods beginning after December 15, 2009. The Fund is currently evaluating the impact, if any, of applying the provisions of ASU No. 2010-6.
11. SUBSEQUENT EVENTS
The Fund has evaluated subsequent events through February 10, 2010, the issuance date of the financial statements and determined that no events have occurred that require disclosure.
FGR-25
Franklin Templeton Variable Insurance Products Trust
Notes to Financial Statements (continued)
Franklin Global Real Estate Securities Fund
| | | | |
| ABBREVIATIONS | | | | |
| Counterparty | | Selected Portfolio | | |
| DBAB - Deutsche Bank AG | | REIT - Real Estate Investment Trust | | |
| BZWS - Barclays Bank PLC | | | | |
| BOFA - Bank of America N.A | | | | |
| CITI - Citibank N.A. | | | | |
| JPHQ - JPMorgan Chase Bank, N.A. | | | | |
| HSBC - HSBC Bank USA | | | | |
| UBSW - UBS AG | | | | |
FGR-26
Franklin Templeton Variable Insurance Products Trust
Franklin Global Real Estate Securities Fund
Report of Independent Registered Public Accounting Firm
To the Board of Trustees and Shareholders of
Franklin Templeton Variable Insurance Products Trust
In our opinion, the accompanying statement of assets and liabilities, including the statement of investments, and the related statements of operations and of changes in net assets and the financial highlights present fairly, in all material respects, the financial position of Franklin Global Real Estate Securities Fund (one of the funds constituting the Franklin Templeton Variable Insurance Products Trust, hereafter referred to as the “Fund”) at December 31, 2009, the results of its operations for the year then ended, the changes in its net assets and the financial highlights for the periods presented, in conformity with accounting principles generally accepted in the United States of America. These financial statements and financial highlights (hereafter referred to as “financial statements”) are the responsibility of the Fund’s management. Our responsibility is to express an opinion on these financial statements based on our audits. We conducted our audits of these financial statements in accordance with the standards of the Public Company Accounting Oversight Board (United States). Those standards require that we plan and perform the audit to obtain reasonable assurance about whether the financial statements are free of material misstatement. An audit includes examining, on a test basis, evidence supporting the amounts and disclosures in the financial statements, assessing the accounting principles used and significant estimates made by management, and evaluating the overall financial statement presentation. We believe that our audits, which included confirmation of securities at December 31, 2009 by correspondence with the custodian and brokers, provide a reasonable basis for our opinion.
PricewaterhouseCoopers LLP
San Francisco, California
February 10, 2010
FGR-27
FRANKLIN GROWTHAND INCOME SECURITIES FUND
We are pleased to bring you Franklin Growth and Income Securities Fund’s annual report for the fiscal year ended December 31, 2009.
Performance Summary as of 12/31/09
Average annual total return of Class 4 shares* represents the average annual change in value, assuming reinvestment of dividends and capital gains. Average returns smooth out variations in returns, which can be significant; they are not the same as year-by-year results.
Periods ended 12/31/09
| | | | | | |
| | | 1-Year | | 5-Year | | 10-Year |
Average Annual Total Return | | +26.54% | | -0.78% | | +2.76% |
*For the period beginning 2/29/08, Class 4 performance reflects a 12b-1 fee expense of 0.35% per year, which affects future performance. Class 4 performance prior to 2/29/08 reflects historical Class 1 performance, which does not include a 12b-1 fee expense. Since 2/29/08 (effective date), the average annual total return of Class 4 shares was -7.12%.
Total Return Index Comparison for a Hypothetical $10,000 Investment (1/1/00–12/31/09)
The graph below shows the change in value of a hypothetical $10,000 investment in the Fund over the indicated period and includes reinvestment of any income or distributions. The Fund’s performance* is compared to the performance of the Standard & Poor’s 500 Index (S&P 500), the Lipper VIP Equity Income Funds Classification Average and the Consumer Price Index (CPI). One cannot invest directly in an index, and an index is not representative of the Fund’s portfolio. Please see Important Notes to Performance Information preceding the Fund Summaries.
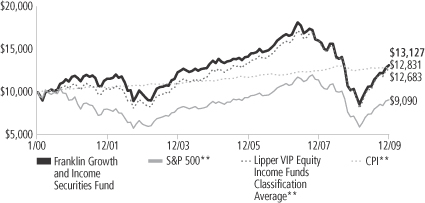
**Sources: © 2009 Morningstar; Lipper Inc. Please see Index Descriptions following the Fund Summaries.
Franklin Growth and Income Securities Fund Class 4
Performance reflects the Fund’s Class 4 operating expenses, but does not include any contract fees, expenses or sales charges. If they had been included, performance would be lower. These charges and deductions, particularly for variable life policies, can have a significant effect on contract values and insurance benefits. See the contract prospectus for a complete description of these expenses, including sales charges.
Performance data represent past performance, which does not guarantee future results. Investment return and principal value will fluctuate, and you may have a gain or loss when you sell your shares.
Current performance may differ from figures shown.
FGI-1
Fund Goals and Main Investments: Franklin Growth and Income Securities Fund seeks capital appreciation with current income as a secondary goal. The Fund normally invests predominantly in equity securities, including securities convertible into common stock.
Performance Overview
You can find the Fund’s one-year total return in the Performance Summary. The Fund performed comparably to its benchmark, the S&P 500, which had a +26.46% total return.1 The Fund outperformed its peers as measured by the Lipper VIP Equity Income Funds Classification Average, which had a +23.06% return for the same period.2 Please note that the Fund invests primarily in stocks with above average dividend yields. As a result, its holdings and returns may differ from those of the S&P 500, which include nondividend-paying stocks and do not focus on dividend yield.
Economic and Market Overview
The U.S. economy ended 2009 in much better shape than it began. Economic challenges remain, such as stalled consumer confidence and job prospects for the unemployed as stimulus measures wind down. However, several reports pointed to improving economic conditions. In the year’s second half, corporate profit growth was higher than earlier estimates, which may allow businesses to build inventory following a long period of inventory drawdowns.
Throughout the year, the Federal Open Market Committee kept monetary policy unchanged, announcing it intends to hold the federal funds target rate in the 0% to 0.25% range “for an extended period” as it lays the groundwork for an eventual tightening of monetary policy. Late in the period, the labor market improved somewhat as the economy lost fewer jobs than expected and the unemployment rate fell slightly, dropping from a period high of 10.2% in October to 10.0% at period-end.3
U.S. gross domestic product grew at a 2.2% annualized rate in 2009’s third quarter after shrinking by 0.7% in the prior three months. This was the first expansion since 2008’s second quarter. As economic conditions improved, oil prices increased from $45 per barrel in December 2008 to $79 at year-end, still well below 2008 highs. December’s
1. Source: © 2009 Morningstar.
2. Source: Lipper Inc.
One cannot invest directly in an index, and an index is not representative of the Fund’s portfolio. Please see Index Descriptions following the Fund Summaries.
3. Source: Bureau of Labor Statistics.
Fund Risks: The Fund’s investments in stocks may offer the potential for long-term gains but can be subject to short-term price fluctuations. The value of convertible securities may rise and fall with the market value of the underlying stock or, like a debt security, vary with changes in interest rates and the credit quality of the issuer. By having significant investments in particular sectors from time to time, such as financial services, energy, health care/pharmaceuticals, technology and telecommunications, the Fund may be at greater risk of adverse developments in a sector than a fund that invests more broadly. Foreign investing, especially in emerging markets, involves additional risks, including currency fluctuations, economic instability, market volatility, and political and social instability. The Fund’s prospectus also includes a description of the main investment risks.
FGI-2
inflation rate was an annualized 2.7%.3 Core inflation, which excludes food and energy costs, rose at a 1.8% annualized rate, which was within the Federal Reserve Board’s informal target range of 1.5% to 2.0%.3
Most stocks suffered significant losses through early March 2009 as investors worried about an uncertain future. Stocks then recovered from 12-year lows as economic data improved and investors perceived many bargains among the bear market fallout. For the 12 months under review, the blue chip stocks of the Dow Jones Industrial Average delivered a total return of +22.68%, while the broader S&P 500 posted a +26.46% total return and the technology-heavy NASDAQ Composite Index returned +45.32%.1 All sectors posted gains for the period, with the strongest returns from the information technology, materials and consumer discretionary sectors.
Investment Strategy
We invest in a broadly diversified portfolio of equity securities that we consider to be financially strong. To help identify such companies, we use a current relative yield analysis that focuses on a company’s dividend yield (calculated by dividing a stock’s annual per share dividends by its per share market price). This results in a relative yield range for each company that can assist us in determining whether we believe a stock is attractively priced for purchase or sale. A higher relative dividend yield is frequently accompanied by a lower stock price. Therefore, we seek to buy a stock when its relative dividend yield is high and to sell a stock when its relative dividend yield is low, which may be caused by an increase in the price of the stock.
Manager’s Discussion
During the fiscal year under review, several information technology sector holdings helped the Fund’s absolute performance, including software company Microsoft, information technology software and services provider International Business Machines, and semiconductor manufacturers Intel and Microchip Technology. In the health care sector, positions in drug maker Mylan convertible bonds and pharmaceuticals company Schering-Plough convertible preferred stock boosted returns, as did Bank of America convertible preferred stock. During the period, Schering-Plough was purchased by Merck.
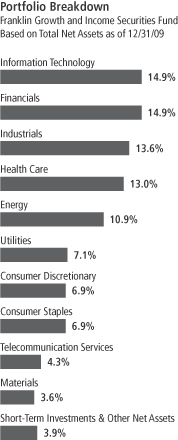
FGI-3
Detractors from performance included several common stock positions such as financials sector holdings Bank of America4 and Citigroup4 and energy sector holdings Exxon Mobil and ConocoPhillips. In the industrials sector, Waste Management4 and General Electric hindered performance, as did Dow Chemical4 in the materials sector. In the utilities sector, Dominion Resources4 also hurt results during the fiscal year.
Thank you for your participation in Franklin Growth and Income Securities Fund. We look forward to serving your future investment needs.
4. Sold by period-end.
The foregoing information reflects our analysis, opinions and portfolio holdings as of December 31, 2009, the end of the reporting period. The way we implement our main investment strategies and the resulting portfolio holdings may change depending on factors such as market and economic conditions. These opinions may not be relied upon as investment advice or an offer for a particular security. The information is not a complete analysis of every aspect of any market, country, industry, security or the Fund. Statements of fact are from sources considered reliable, but the investment manager makes no representation or warranty as to their completeness or accuracy. Although historical performance is no guarantee of future results, these insights may help you understand our investment management philosophy.
Top 10 Holdings
Franklin Growth and Income Securities Fund
12/31/09
| | |
Company Sector/Industry | | % of Total
Net Assets |
| JPMorgan Chase & Co. | | 3.8% |
| Financials | | |
| Wells Fargo & Co. | | 3.6% |
| Financials | | |
| Merck & Co. | | 3.5% |
| Health Care | | |
| Microsoft Corp. | | 3.1% |
| Information Technology | | |
| Microchip Technology Inc. | | 2.7% |
| Information Technology | | |
| Johnson & Johnson | | 2.7% |
| Health Care | | |
| Chevron Corp. | | 2.6% |
| Energy | | |
| The Coca-Cola Co. | | 2.6% |
| Consumer Staples | | |
| International Business Machines Corp. | | 2.5% |
| Information Technology | | |
| 3M Co. | | 2.4% |
| Industrials | | |
The dollar value, number of shares or principal amount, and names of all portfolio holdings are listed in the Fund’s Statement of Investments.
FGI-4
Fund Expenses
As an investor in a variable insurance contract (Contract) that indirectly provides for investment in an underlying mutual fund, you can incur transaction and/or ongoing expenses at both the Fund level and the Contract level.
| • | | Transaction expenses can include sales charges (loads) on purchases, redemption fees, surrender fees, transfer fees and premium taxes. |
| • | | Ongoing expenses can include management fees, distribution and service (12b-1) fees, contract fees, annual maintenance fees, mortality and expense risk fees and other fees and expenses. All mutual funds and Contracts have some types of ongoing expenses. |
The expenses shown in the table are meant to highlight ongoing expenses at the Fund level only and do not include ongoing expenses at the Contract level, or transaction expenses at either the Fund or Contract level. While the Fund does not have transaction expenses, if the transaction and ongoing expenses at the Contract level were included, the expenses shown would be higher. You should consult your Contract prospectus or disclosure document for more information.
The table shows Fund-level ongoing expenses and can help you understand these expenses and compare them with those of other mutual funds offered through the Contract. The table assumes a $1,000 investment held for the six months indicated. Please refer to the Fund prospectus for additional information on operating expenses.
Actual Fund Expenses
The first line (Actual) of the table provides actual account values and expenses. The “Ending Account Value” is derived from the Fund’s actual return, which includes the effect of ongoing Fund expenses, but does not include the effect of ongoing Contract expenses.
You can estimate the Fund-level expenses you incurred during the period by following these steps. Of course, your account value and expenses will differ from those in this illustration:
| 1. | Divide your account value by $1,000. |
If an account had an $8,600 value, then $8,600 ÷ $1,000 = 8.6.
| 2. | Multiply the result by the number under the heading “Fund-Level Expenses Incurred During Period.” |
If Fund-Level Expenses Incurred During Period were $7.50, then 8.6 x $7.50 = $64.50.
In this illustration, the estimated expenses incurred this period at the Fund level are $64.50.
Franklin Growth and Income Securities Fund Class 4
FGI-5
Hypothetical Example for Comparison with Other Mutual Funds
Information in the second line (Hypothetical) of the table can help you compare ongoing expenses of the Fund with those of other mutual funds offered through the Contract. This information may not be used to estimate the actual ending account balance or expenses you incurred during the period. The hypothetical “Ending Account Value” is based on the Fund’s actual expense ratio and an assumed 5% annual rate of return before expenses, which does not represent the Fund’s actual return. The figure under the heading “Fund-Level Expenses Incurred During Period” shows the hypothetical expenses your account would have incurred under this scenario. You can compare this figure with the 5% hypothetical examples that appear in shareholder reports of other funds offered through a Contract.
| | | | | | | | | |
| Class 4 | | Beginning
Account Value 7/1/09 | | Ending
Account
Value 12/31/09 | | Fund-Level Expenses Incurred
During Period* 7/1/09–12/31/09 |
Actual | | $ | 1,000 | | $ | 1,230.90 | | $ | 5.23 |
Hypothetical (5% return before expenses) | | $ | 1,000 | | $ | 1,020.52 | | $ | 4.74 |
*Expenses are calculated using the most recent six-month annualized expense ratio for the Fund’s Class 4 shares (0.93%), which does not include any ongoing expenses of the Contract for which the Fund is an investment option, multiplied by the average account value over the period, multiplied by 184/365 to reflect the one-half year period.
FGI-6
Franklin Templeton Variable Insurance Products Trust
Financial Highlights
Franklin Growth and Income Securities Fund
| | | | | | | | | | | | | | | | | | | | |
| | | Year Ended December 31, | |
| Class 1 | | 2009 | | | 2008 | | | 2007 | | | 2006 | | | 2005 | |
| | | | |
Per share operating performance | | | | | | | | | | | | | | | | | | | | |
(for a share outstanding throughout the year) | | | | | | | | | | | | | | | | | | | | |
Net asset value, beginning of year | | $ | 8.72 | | | $ | 15.07 | | | $ | 16.83 | | | $ | 15.60 | | | $ | 15.60 | |
| | | | |
Income from investment operationsa: | | | | | | | | | | | | | | | | | | | | |
Net investment incomeb | | | 0.31 | | | | 0.39 | | | | 0.41 | | | | 0.42 | | | | 0.42 | |
Net realized and unrealized gains (losses) | | | 1.92 | | | | (5.17 | ) | | | (0.82 | ) | | | 2.05 | | | | 0.15 | |
| | | | |
Total from investment operations | | | 2.23 | | | | (4.78 | ) | | | (0.41 | ) | | | 2.47 | | | | 0.57 | |
| | | | |
Less distributions from: | | | | | | | | | | | | | | | | | | | | |
Net investment income | | | (0.48 | ) | | | (0.45 | ) | | | (0.42 | ) | | | (0.43 | ) | | | (0.43 | ) |
Net realized gains | | | — | | | | (1.12 | ) | | | (0.93 | ) | | | (0.81 | ) | | | (0.14 | ) |
| | | | |
Total distributions | | | (0.48 | ) | | | (1.57 | ) | | | (1.35 | ) | | | (1.24 | ) | | | (0.57 | ) |
| | | | |
Net asset value, end of year | | $ | 10.47 | | | $ | 8.72 | | | $ | 15.07 | | | $ | 16.83 | | | $ | 15.60 | |
| | | | |
| | | | | |
Total returnc | | | 26.82% | | | | (34.95)% | | | | (3.46)% | | | | 17.05% | | | | 3.71% | |
Ratios to average net assets | | | | | | | | | | | | | | | | | | | | |
Expensesd | | | 0.60% | | | | 0.55% | | | | 0.52% | | | | 0.54% | | | | 0.51% | |
Net investment income | | | 3.46% | | | | 3.17% | | | | 2.47% | | | | 2.63% | | | | 2.74% | |
| | | | | |
Supplemental data | | | | | | | | | | | | | | | | | | | | |
Net assets, end of year (000’s) | | $ | 174,403 | | | $ | 162,936 | | | $ | 306,691 | | | $ | 388,751 | | | $ | 405,245 | |
Portfolio turnover rate | | | 51.05% | | | | 30.66% | | | | 36.66% | | | | 23.05% | | | | 43.89% | |
aThe amount shown for a share outstanding throughout the period may not correlate with the Statement of Operations for the period due to the timing of sales and repurchases of the Fund shares in relation to income earned and/or fluctuating market value of the investments of the Fund.
bBased on average daily shares outstanding.
cTotal return does not include any fees, charges or expenses imposed by the variable annuity and life insurance contracts for which the Franklin Templeton Variable Insurance Products Trust serves as an underlying investment vehicle.
dBenefit of expense reduction rounds to less than 0.01%.
The accompanying notes are an integral part of these financial statements.
FGI-7
Franklin Templeton Variable Insurance Products Trust
Financial Highlights (continued)
Franklin Growth and Income Securities Fund
| | | | | | | | | | | | | | | | | | | | |
| | | Year Ended December 31, | |
| Class 2 | | 2009 | | | 2008 | | | 2007 | | | 2006 | | | 2005 | |
| | | | |
Per share operating performance | | | | | | | | | | | | | | | | | | | | |
(for a share outstanding throughout the year) | | | | | | | | | | | | | | | | | | | | |
Net asset value, beginning of year | | $ | 8.59 | | | $ | 14.86 | | | $ | 16.62 | | | $ | 15.42 | | | $ | 15.43 | |
| | | | |
Income from investment operationsa: | | | | | | | | | | | | | | | | | | | | |
Net investment incomeb | | | 0.28 | | | | 0.35 | | | | 0.37 | | | | 0.37 | | | | 0.38 | |
Net realized and unrealized gains (losses) | | | 1.90 | | | | (5.10 | ) | | | (0.82 | ) | | | 2.03 | | | | 0.15 | |
| | | | |
Total from investment operations | | | 2.18 | | | | (4.75 | ) | | | (0.45 | ) | | | 2.40 | | | | 0.53 | |
| | | | |
Less distributions from: | | | | | | | | | | | | | | | | | | | | |
Net investment income | | | (0.44 | ) | | | (0.40 | ) | | | (0.38 | ) | | | (0.39 | ) | | | (0.40 | ) |
Net realized gains | | | — | | | | (1.12 | ) | | | (0.93 | ) | | | (0.81 | ) | | | (0.14 | ) |
| | | | |
Total distributions | | | (0.44 | ) | | | (1.52 | ) | | | (1.31 | ) | | | (1.20 | ) | | | (0.54 | ) |
| | | | |
Net asset value, end of year | | $ | 10.33 | | | $ | 8.59 | | | $ | 14.86 | | | $ | 16.62 | | | $ | 15.42 | |
| | | | |
| | | | | |
Total returnc | | | 26.55% | | | | (35.14)% | | | | (3.71)% | | | | 16.76% | | | | 3.51% | |
Ratios to average net assets | | | | | | | | | | | | | | | | | | | | |
Expensesd | | | 0.85% | | | | 0.80% | | | | 0.77% | | | | 0.79% | | | | 0.76% | |
Net investment income | | | 3.21% | | | | 2.92% | | | | 2.22% | | | | 2.38% | | | | 2.49% | |
| | | | | |
Supplemental data | | | | | | | | | | | | | | | | | | | | |
Net assets, end of year (000’s) | | $ | 152,077 | | | $ | 141,359 | | | $ | 312,692 | | | $ | 348,724 | | | $ | 313,286 | |
Portfolio turnover rate | | | 51.05% | | | | 30.66% | | | | 36.66% | | | | 23.05% | | | | 43.89% | |
aThe amount shown for a share outstanding throughout the period may not correlate with the Statement of Operations for the period due to the timing of sales and repurchases of the Fund shares in relation to income earned and/or fluctuating market value of the investments of the Fund.
bBased on average daily shares outstanding.
cTotal return does not include any fees, charges or expenses imposed by the variable annuity and life insurance contracts for which the Franklin Templeton Variable Insurance Products Trust serves as an underlying investment vehicle.
dBenefit of expense reduction rounds to less than 0.01%.
The accompanying notes are an integral part of these financial statements.
FGI-8
Franklin Templeton Variable Insurance Products Trust
Financial Highlights (continued)
Franklin Growth and Income Securities Fund
| | | | | | | | |
| | | Year Ended
December 31, | |
| Class 4 | | 2009 | | | 2008a | |
| | | | |
Per share operating performance | | | | | | | | |
(for a share outstanding throughout the year) | | | | | | | | |
Net asset value, beginning of year | | $ | 8.70 | | | $ | 14.16 | |
| | | | |
Income from investment operationsb: | | | | | | | | |
Net investment incomec | | | 0.28 | | | | 0.29 | |
Net realized and unrealized gains (losses) | | | 1.92 | | | | (4.18 | ) |
| | | | |
Total from investment operations | | | 2.20 | | | | (3.89 | ) |
| | | | |
Less distributions from: | | | | | | | | |
Net investment income | | | (0.45 | ) | | | (0.45 | ) |
Net realized gains | | | — | | | | (1.12 | ) |
| | | | |
Total distributions | | | (0.45 | ) | | | (1.57 | ) |
| | | | |
Net asset value, end of year | | $ | 10.45 | | | $ | 8.70 | |
| | | | |
| | |
Total returnd | | | 26.54% | | | | (31.00)% | |
Ratios to average net assetse | | | | | | | | |
Expensesf | | | 0.95% | | | | 0.90% | |
Net investment income | | | 3.11% | | | | 2.82% | |
| | |
Supplemental data | | | | | | | | |
Net assets, end of year (000’s) | | $ | 4 | | | $ | 3 | |
Portfolio turnover rate | | | 51.05% | | | | 30.66% | |
aFor the period February 29, 2008 (effective date) to December 31, 2008.
bThe amount shown for a share outstanding throughout the period may not correlate with the Statement of Operations for the period due to the timing of sales and repurchases of the Fund shares in relation to income earned and/or fluctuating market value of the investments of the Fund.
cBased on average daily shares outstanding.
dTotal return does not include any fees, charges or expenses imposed by the variable annuity and life insurance contracts for which the Franklin Templeton Variable Insurance Products Trust serves as an underlying investment vehicle. Total return is not annualized for periods less than one year.
eRatios are annualized for periods less than one year.
fBenefit of expense reduction rounds to less than 0.01%.
The accompanying notes are an integral part of these financial statements.
FGI-9
Franklin Templeton Variable Insurance Products Trust
Statement of Investments, December 31, 2009
| | | | | | | |
| Franklin Growth and Income Securities Fund | | Country | | Shares | | Value |
Common Stocks 75.1% | | | | | | | |
Consumer Discretionary 3.2% | | | | | | | |
Best Buy Co. Inc. | | United States | | 132,700 | | $ | 5,236,342 |
The Home Depot Inc. | | United States | | 184,000 | | | 5,323,120 |
| | | | | | | |
| | | | | | | 10,559,462 |
| | | | | | | |
Consumer Staples 6.9% | | | | | | | |
The Coca-Cola Co. | | United States | | 146,700 | | | 8,361,900 |
Diageo PLC, ADR | | United Kingdom | | 101,600 | | | 7,052,056 |
Unilever NV, N.Y. shs. | | Netherlands | | 221,200 | | | 7,151,396 |
| | | | | | | |
| | | | | | | 22,565,352 |
| | | | | | | |
Energy 9.7% | | | | | | | |
Chevron Corp. | | United States | | 109,200 | | | 8,407,308 |
ConocoPhillips | | United States | | 125,100 | | | 6,388,857 |
Exxon Mobil Corp. | | United States | | 63,144 | | | 4,305,789 |
Halliburton Co. | | United States | | 202,400 | | | 6,090,216 |
Spectra Energy Corp. | | United States | | 316,500 | | | 6,491,415 |
| | | | | | | |
| | | | | | | 31,683,585 |
| | | | | | | |
Financials 7.5% | | | | | | | |
Aflac Inc. | | United States | | 137,100 | | | 6,340,875 |
JPMorgan Chase & Co. | | United States | | 156,470 | | | 6,520,105 |
Marsh & McLennan Cos. Inc. | | United States | | 226,000 | | | 4,990,080 |
Wells Fargo & Co. | | United States | | 239,800 | | | 6,472,202 |
| | | | | | | |
| | | | | | | 24,323,262 |
| | | | | | | |
Health Care 10.0% | | | | | | | |
Abbott Laboratories | | United States | | 124,300 | | | 6,710,957 |
Johnson & Johnson | | United States | | 137,100 | | | 8,830,611 |
Merck & Co. Inc. | | United States | | 313,261 | | | 11,446,557 |
Pfizer Inc. | | United States | | 304,500 | | | 5,538,855 |
| | | | | | | |
| | | | | | | 32,526,980 |
| | | | | | | |
Industrials 13.6% | | | | | | | |
3M Co. | | United States | | 95,300 | | | 7,878,451 |
Caterpillar Inc. | | United States | | 118,300 | | | 6,741,917 |
General Dynamics Corp. | | United States | | 96,700 | | | 6,592,039 |
General Electric Co. | | United States | | 267,300 | | | 4,044,249 |
J.B. Hunt Transport Services Inc. | | United States | | 125,700 | | | 4,056,339 |
Pitney Bowes Inc. | | United States | | 149,900 | | | 3,411,724 |
Republic Services Inc. | | United States | | 233,400 | | | 6,607,554 |
United Parcel Service Inc., B | | United States | | 90,100 | | | 5,169,037 |
| | | | | | | |
| | | | | | | 44,501,310 |
| | | | | | | |
Information Technology 14.9% | | | | | | | |
Intel Corp. | | United States | | 376,300 | | | 7,676,520 |
International Business Machines Corp. | | United States | | 62,000 | | | 8,115,800 |
Microchip Technology Inc. | | United States | | 304,200 | | | 8,840,052 |
Microsoft Corp. | | United States | | 331,600 | | | 10,110,484 |
Nokia Corp., ADR | | Finland | | 237,800 | | | 3,055,730 |
Paychex Inc. | | United States | | 198,700 | | | 6,088,168 |
Xerox Corp. | | United States | | 579,900 | | | 4,905,954 |
| | | | | | | |
| | | | | | | 48,792,708 |
| | | | | | | |
FGI-10
Franklin Templeton Variable Insurance Products Trust
Statement of Investments, December 31, 2009 (continued)
| | | | | | | | |
| Franklin Growth and Income Securities Fund | | Country | | Shares | | Value |
Common Stocks (continued) | | | | | | | | |
Telecommunication Services 4.3% | | | | | | | | |
AT&T Inc. | | United States | | | 274,397 | | $ | 7,691,348 |
Verizon Communications Inc. | | United States | | | 193,500 | | | 6,410,655 |
| | | | | | | | |
| | | | | | | | 14,102,003 |
| | | | | | | | |
Utilities 5.0% | | | | | | | | |
PG&E Corp. | | United States | | | 116,300 | | | 5,192,795 |
Sempra Energy | | United States | | | 89,242 | | | 4,995,767 |
The Southern Co. | | United States | | | 180,100 | | | 6,000,932 |
| | | | | | | | |
| | | | | | | | 16,189,494 |
| | | | | | | | |
Total Common Stocks (Cost $219,325,268) | | | | | | | | 245,244,156 |
| | | | | | | | |
Preferred Stocks (Cost $8,133,100) 0.1% | | | | | | | | |
Financials 0.1% | | | | | | | | |
aFannie Mae, 8.25%, pfd. | | United States | | | 325,000 | | | 357,500 |
| | | | | | | | |
Convertible Preferred Stocks 11.8% | | | | | | | | |
Consumer Discretionary 1.2% | | | | | | | | |
Autoliv Inc., 8.00%, cvt. pfd. | | Sweden | | | 66,000 | | | 3,957,096 |
| | | | | | | | |
Financials 5.4% | | | | | | | | |
Bank of America Corp., 7.25%, cvt. pfd., L | | United States | | | 8,100 | | | 7,119,900 |
Citigroup Inc., 7.50%, cvt. pfd. | | United States | | | 50,000 | | | 5,217,000 |
Wells Fargo & Co., 7.50%, cvt. pfd., A | | United States | | | 5,700 | | | 5,232,600 |
| | | | | | | | |
| | | | | | | | 17,569,500 |
| | | | | | | | |
Health Care 0.9% | | | | | | | | |
Tenet Healthcare Corp., 7.00%, cvt. pfd. | | United States | | | 3,200 | | | 3,086,250 |
| | | | | | | | |
Materials 2.2% | | | | | | | | |
Freeport-McMoRan Copper & Gold Inc., 6.75%, cvt. pfd. | | United States | | | 63,200 | | | 7,280,640 |
| | | | | | | | |
Utilities 2.1% | | | | | | | | |
Great Plains Energy Inc., 12.00%, cvt. pfd. | | United States | | | 100,000 | | | 6,690,000 |
| | | | | | | | |
Total Convertible Preferred Stocks (Cost $31,403,302) | | | | | | | | 38,583,486 |
| | | | | | | | |
bEquity-Linked Securities 2.7% | | | | | | | | |
Consumer Discretionary 1.5% | | | | | | | | |
cMorgan Stanley into Comcast Corp., 10.00%, 144A | | United States | | | 300,000 | | | 5,039,370 |
| | | | | | | | |
Energy 1.2% | | | | | | | | |
Credit Suisse into Weatherford International Ltd., 11.00% | | United States | | | 200,000 | | | 3,833,760 |
| | | | | | | | |
Total Equity-Linked Securities (Cost $8,494,850) | | | | | | | | 8,873,130 |
| | | | | | | | |
| | | |
| | | | | Principal
Amountd | | |
Corporate Bonds (Cost $5,179,789) 1.9% | | | | | | | | |
Financials 1.9% | | | | | | | | |
eJPMorgan Chase & Co., junior sub. note, 1, 7.90%, Perpetual | | United States | | $ | 5,800,000 | | | 6,002,037 |
| | | | | | | | |
Convertible Bonds 4.5% | | | | | | | | |
Consumer Discretionary 1.0% | | | | | | | | |
Carnival Corp., cvt., senior deb., 2.00%, 4/15/21 | | United States | | | 3,156,000 | | | 3,270,405 |
| | | | | | | | |
Health Care 2.1% | | | | | | | | |
cMylan Inc., cvt., 144A, 3.75%, 9/15/15 | | United States | | | 4,500,000 | | | 6,946,875 |
| | | | | | | | |
FGI-11
Franklin Templeton Variable Insurance Products Trust
Statement of Investments, December 31, 2009 (continued)
| | | | | | | | |
| Franklin Growth and Income Securities Fund | | Country | | Principal
Amountd | | Value |
Convertible Bonds (continued) | | | | | | | | |
Materials 1.4% | | | | | | | | |
ArcelorMittal, cvt., senior note, 5.00%, 5/15/14 | | Luxembourg | | $ | 2,750,000 | | $ | 4,568,438 |
| | | | | | | | |
Total Convertible Bonds (Cost $10,039,208) | | | | | | | | 14,785,718 |
| | | | | | | | |
Total Investments before Short Term Investments (Cost $282,575,517) | | | | | | | | 313,846,027 |
| | | | | | | | |
| | | | | | | |
Short Term Investments (Cost $12,309,860) 3.8% | | | | | | | |
Repurchase Agreements 3.8% | | | | | | | |
fJoint Repurchase Agreement, 0.003%, 1/04/10 (Maturity Value $12,309,864) | | United States | | 12,309,860 | | | 12,309,860 |
Banc of America Securities LLC (Maturity Value $1,446,286) | | | | | | | |
BNP Paribas Securities Corp. (Maturity Value $2,892,449) | | | | | | | |
Credit Suisse Securities (USA) LLC (Maturity Value $2,410,517) | | | | | | | |
Deutsche Bank Securities Inc. (Maturity Value $739,700) | | | | | | | |
HSBC Securities (USA) Inc. (Maturity Value $2,410,518) | | | | | | | |
Morgan Stanley & Co. Inc. (Maturity Value $1,928,340) | | | | | | | |
UBS Securities LLC (Maturity Value $482,054) | | | | | | | |
Collateralized by U.S. Government Agency Securities, 0.50% - 7.625%, 3/30/10 - 2/09/28; gU.S. Government Agency Discount Notes, 9/21/10; gU.S. Treasury Bills, 8/26/10 - 12/16/10; and U.S. Treasury Notes, 0.875% - 4.25%, 5/31/11 - 11/15/14 | | | | | | | |
| | | | | | | |
Total Investments (Cost $294,885,377) 99.9% | | | | | | | 326,155,887 |
Other Assets, less Liabilities 0.1% | | | | | | | 328,217 |
| | | | | | | |
Net Assets 100.0% | | | | | | $ | 326,484,104 |
| | | | | | | |
See Abbreviations on page FGI-22.
aNon-income producing.
bSee Note 1(d) regarding equity-linked securities.
cSecurity was purchased pursuant to Rule 144A under the Securities Act of 1933 and may be sold in transactions exempt from registration only to qualified institutional buyers or in a public offering registered under the Securities Act of 1933. These securities have been deemed liquid under guidelines approved by the Trust’s Board of Trustees. At December 31, 2009, the aggregate value of these securities was $11,986,245, representing 3.67% of net assets.
dThe principal amount is stated in U.S. dollars unless otherwise indicated.
ePerpetual security with no stated maturity date.
fSee Note 1(c) regarding joint repurchase agreement.
gThe security is traded on a discount basis with no stated coupon rate.
The accompanying notes are an integral part of these financial statements.
FGI-12
Franklin Templeton Variable Insurance Products Trust
Financial Statements
Statement of Assets and Liabilities
December 31, 2009
| | | | |
| | | Franklin Growth
and Income
Securities Fund | |
Assets: | | | | |
Investments in securities: | | | | |
Cost - Unaffiliated issuers | | $ | 282,575,517 | |
Cost - Repurchase agreements | | | 12,309,860 | |
| | | | |
Total cost of investments | | $ | 294,885,377 | |
| | | | |
Value - Unaffiliated issuers | | $ | 313,846,027 | |
Value - Repurchase agreements | | | 12,309,860 | |
| | | | |
Total value of investments | | | 326,155,887 | |
Receivables: | | | | |
Capital shares sold | | | 19,021 | |
Dividends and interest | | | 768,243 | |
Other assets | | | 47,296 | |
| | | | |
Total assets | | | 326,990,447 | |
| | | | |
Liabilities: | | | | |
Payables: | | | | |
Capital shares redeemed | | | 163,956 | |
Affiliates | | | 209,648 | |
Reports to shareholders | | | 101,110 | |
Professional fees | | | 27,636 | |
Accrued expenses and other liabilities | | | 3,993 | |
| | | | |
Total liabilities | | | 506,343 | |
| | | | |
Net assets, at value | | $ | 326,484,104 | |
| | | | |
Net assets consist of: | | | | |
Paid-in capital | | $ | 378,019,800 | |
Undistributed net investment income | | | 11,425,179 | |
Net unrealized appreciation (depreciation) | | | 31,277,934 | |
Accumulated net realized gain (loss) | | | (94,238,809 | ) |
| | | | |
Net assets, at value | | $ | 326,484,104 | |
| | | | |
Class 1: | | | | |
Net assets, at value | | $ | 174,403,040 | |
| | | | |
Shares outstanding | | | 16,651,925 | |
| | | | |
Net asset value and maximum offering price per share | | $ | 10.47 | |
| | | | |
Class 2: | | | | |
Net assets, at value | | $ | 152,077,376 | |
| | | | |
Shares outstanding | | | 14,716,531 | |
| | | | |
Net asset value and maximum offering price per share | | $ | 10.33 | |
| | | | |
Class 4: | | | | |
Net assets, at value | | $ | 3,688 | |
| | | | |
Shares outstanding | | | 353 | |
| | | | |
Net asset value and maximum offering price per share | | $ | 10.45 | |
| | | | |
The accompanying notes are an integral part of these financial statements.
FGI-13
Franklin Templeton Variable Insurance Products Trust
Financial Statements (continued)
Statement of Operations
for the year ended December 31, 2009
| | | | |
| | | Franklin Growth
and Income
Securities Fund | |
Investment income: | | | | |
Dividends | | $ | 9,605,419 | |
Interest | | | 2,238,750 | |
| | | | |
Total investment income | | | 11,844,169 | |
| | | | |
Expenses: | | | | |
Management fees (Note 3a) | | | 1,564,218 | |
Distribution fees: (Note 3c) | | | | |
Class 2 | | | 339,414 | |
Class 4 | | | 11 | |
Unaffiliated transfer agent fees | | | 654 | |
Custodian fees (Note 4) | | | 5,700 | |
Reports to shareholders | | | 114,838 | |
Professional fees | | | 32,928 | |
Trustees’ fees and expenses | | | 2,052 | |
Other | | | 25,057 | |
| | | | |
Total expenses | | | 2,084,872 | |
Expense reductions (Note 4) | | | (14 | ) |
| | | | |
Net expenses | | | 2,084,858 | |
| | | | |
Net investment income | | | 9,759,311 | |
| | | | |
Realized and unrealized gains (losses): | | | | |
Net realized gain (loss) from: | | | | |
Investments | | | (57,628,446 | ) |
Foreign currency transactions | | | (41,368 | ) |
| | | | |
Net realized gain (loss) | | | (57,669,814 | ) |
| | | | |
Net change in unrealized appreciation (depreciation) on: | | | | |
Investments | | | 117,568,451 | |
Translation of other assets and liabilities denominated in foreign currencies | | | 10,466 | |
| | | | |
Net change in unrealized appreciation (depreciation) | | | 117,578,917 | |
| | | | |
Net realized and unrealized gain (loss) | | | 59,909,103 | |
| | | | |
Net increase (decrease) in net assets resulting from operations | | $ | 69,668,414 | |
| | | | |
The accompanying notes are an integral part of these financial statements.
FGI-14
Franklin Templeton Variable Insurance Products Trust
Financial Statements (continued)
Statements of Changes in Net Assets
| | | | | | | | |
| | | Franklin Growth and Income
Securities Fund | |
| | | Year Ended December 31, | |
| | | 2009 | | | 2008 | |
| | | | |
Increase (decrease) in net assets: | | | | | | | | |
Operations: | | | | | | | | |
Net investment income | | $ | 9,759,311 | | | $ | 14,275,978 | |
Net realized gain (loss) from investments and foreign currency transactions | | | (57,669,814 | ) | | | (30,384,934 | ) |
Net change in unrealized appreciation (depreciation) on investments and translation of other assets and liabilities denominated in foreign currencies | | | 117,578,917 | | | | (174,276,787 | ) |
| | | | |
Net increase (decrease) in net assets resulting from operations | | | 69,668,414 | | | | (190,385,743 | ) |
| | | | |
Distributions to shareholders from: | | | | | | | | |
Net investment income: | | | | | | | | |
Class 1 | | | (8,187,942 | ) | | | (8,476,479 | ) |
Class 2 | | | (6,640,173 | ) | | | (7,499,080 | ) |
Class 4 | | | (158 | ) | | | (160 | ) |
Net realized gains: | | | | | | | | |
Class 1 | | | — | | | | (20,947,837 | ) |
Class 2 | | | — | | | | (20,755,554 | ) |
Class 4 | | | — | | | | (395 | ) |
| | | | |
Total distributions to shareholders | | | (14,828,273 | ) | | | (57,679,505 | ) |
| | | | |
Capital share transactions: (Note 2) | | | | | | | | |
Class 1 | | | (17,856,351 | ) | | | (18,020,538 | ) |
Class 2 | | | (14,797,923 | ) | | | (49,003,980 | ) |
Class 4 | | | — | | | | 5,000 | |
| | | | |
Total capital share transactions | | | (32,654,274 | ) | | | (67,019,518 | ) |
| | | | |
Net increase (decrease) in net assets | | | 22,185,867 | | | | (315,084,766 | ) |
Net assets: | | | | | | | | |
Beginning of year | | | 304,298,237 | | | | 619,383,003 | |
| | | | |
End of year | | $ | 326,484,104 | | | $ | 304,298,237 | |
| | | | |
Undistributed net investment income included in net assets: | | | | | | | | |
End of year | | $ | 11,425,179 | | | $ | 15,149,162 | |
| | | | |
The accompanying notes are an integral part of these financial statements.
FGI-15
Franklin Templeton Variable Insurance Products Trust
Notes to Financial Statements
Franklin Growth and Income Securities Fund
1. ORGANIZATION AND SIGNIFICANT ACCOUNTING POLICIES
Franklin Templeton Variable Insurance Products Trust (Trust) is registered under the Investment Company Act of 1940, as amended, (1940 Act) as an open-end investment company, consisting of twenty-two separate funds. The Franklin Growth and Income Securities Fund (Fund) is included in this report. The financial statements of the remaining funds in the Trust are presented separately. Shares of the Fund are generally sold only to insurance company separate accounts to fund the benefits of variable life insurance policies or variable annuity contracts. At December 31, 2009, 74.75% of the Fund’s shares were held through one insurance company. The Fund offers three classes of shares: Class 1, Class 2, and Class 4. Each class of shares differs by its distribution fees, voting rights on matters affecting a single class and its exchange privilege.
The following summarizes the Fund’s significant accounting policies.
a. Security Valuation
Equity and other securities listed on a securities exchange or on the NASDAQ National Market System are valued at the last quoted sale price or the official closing price of the day, respectively. Over-the-counter securities and listed securities for which there is no reported sale are valued within the range of the most recent quoted bid and ask prices. Securities that trade in multiple markets or on multiple exchanges are valued according to the broadest and most representative market. Certain equity securities are valued based upon fundamental characteristics or relationships to similar securities.
Corporate debt securities generally trade in the over-the-counter market rather than on a securities exchange. The Fund may utilize independent pricing services, quotations from bond dealers, and information with respect to bond and note transactions, to assist in determining a current market value for each security. The Fund’s pricing services may use valuation models or matrix pricing which considers information with respect to comparable bond and note transactions, quotations from bond dealers, or by reference to other securities that are considered comparable in such characteristics as rating, interest rate and maturity date, option adjusted spread models, prepayment projections, interest rate spreads and yield curves, to determine current value.
Foreign equity securities are valued as of the close of trading on the foreign stock exchange on which the security is primarily traded, or the NYSE, whichever is earlier. If no sale is reported at that time, the foreign equity security will be valued within the range of the most recent quoted bid and ask prices. The value is then converted into its U.S. dollar equivalent at the foreign exchange rate in effect at the close of the NYSE on the day that the value of the security is determined.
The Fund has procedures to determine the fair value of individual securities and other assets for which market prices are not readily available or which may not be reliably priced. Methods for valuing these securities may include: fundamental analysis based upon the underlying investment book value, anticipated future cash flows, market changes in comparable or similar securities, matrix pricing, discounts from market prices of similar securities, or discounts applied due to the nature and duration of restrictions on the disposition of the securities. Due to the inherent uncertainty of valuations of such securities, the fair values may differ significantly from the values that would have been used had a ready market for such investments existed. Occasionally, events occur between the time at which trading in a security is completed and the close of the NYSE that might call into question the availability (including the reliability) of the value of a portfolio security held by the Fund. The investment manager monitors price movements following the close of trading in foreign stock markets through a series of country specific market proxies (such as baskets of American Depository Receipts, futures contracts and exchange traded funds). These price movements are measured against established trigger thresholds for each specific market proxy to assist in determining if an event has occurred. If such an event occurs, the securities may be valued using fair value procedures, which may include the use of independent pricing services. All security valuation procedures are approved by the Fund’s Board of Trustees.
b. Foreign Currency Translation
Portfolio securities and other assets and liabilities denominated in foreign currencies are translated into U.S. dollars based on the exchange rate of such currencies against U.S. dollars on the date of valuation. The Fund may enter into foreign currency
FGI-16
Franklin Templeton Variable Insurance Products Trust
Notes to Financial Statements (continued)
Franklin Growth and Income Securities Fund
1. ORGANIZATION AND SIGNIFICANT ACCOUNTING POLICIES (continued)
b. Foreign Currency Translation (continued)
exchange contracts to facilitate transactions denominated in a foreign currency. Purchases and sales of securities, income and expense items denominated in foreign currencies are translated into U.S. dollars at the exchange rate in effect on the transaction date. Occasionally, events may impact the availability or reliability of foreign exchange rates used to convert the U.S. dollar equivalent value. If such an event occurs, the foreign exchange rate will be valued at fair value using procedures established and approved by the Fund’s Board of Trustees.
The Fund does not separately report the effect of changes in foreign exchange rates from changes in market prices on securities held. Such changes are included in net realized and unrealized gain or loss from investments on the Statement of Operations.
Realized foreign exchange gains or losses arise from sales of foreign currencies, currency gains or losses realized between the trade and settlement dates on securities transactions and the difference between the recorded amounts of dividends, interest, and foreign withholding taxes and the U.S. dollar equivalent of the amounts actually received or paid. Net unrealized foreign exchange gains and losses arise from changes in foreign exchange rates on foreign denominated assets and liabilities other than investments in securities held at the end of the reporting period.
c. Joint Repurchase Agreement
The Fund may enter into a joint repurchase agreement whereby its uninvested cash balance is deposited into a joint cash account with other funds managed by the investment manager or an affiliate of the investment manager and is used to invest in one or more repurchase agreements. The value and face amount of the joint repurchase agreement are allocated to the funds based on their pro-rata interest. A repurchase agreement is accounted for as a loan by the fund to the seller, collateralized by securities which are delivered to the fund’s custodian. The market value, including accrued interest, of the initial collateralization is required to be at least 102% of the dollar amount invested by the funds, with the value of the underlying securities marked to market daily to maintain coverage of at least 100%. The joint repurchase agreement held by the Fund at year end had been entered into on December 31, 2009. The joint repurchase agreement is valued at cost which approximates market value.
d. Equity-Linked Securities
The Fund may invest in equity-linked securities. Equity-linked securities are hybrid financial instruments that generally combine both debt and equity characteristics into a single note form. Income received from equity linked securities is recorded as realized gains in the Statement of Operations and may be based on the performance of an underlying equity security, an equity index, or an option position. The risks of investing in equity-linked securities include unfavorable price movements in the underlying security and the credit risk of the issuing financial institution. There may be no guarantee of a return of principal with equity linked securities and the appreciation potential may be limited. Equity-linked securities may be more volatile and less liquid than other investments held by the Fund.
e. Income Taxes
No provision has been made for U.S. income taxes because it is the Fund’s policy to qualify as a regulated investment company under the Internal Revenue Code and to distribute to shareholders substantially all of its taxable income and net realized gains.
The Fund has reviewed the tax positions, taken on federal income tax returns, for each of the three open tax years and as of December 31, 2009, and has determined that no provision for income tax is required in the Fund’s financial statements.
f. Security Transactions, Investment Income, Expenses and Distributions
Security transactions are accounted for on trade date. Realized gains and losses on security transactions are determined on a specific identification basis. Interest income and estimated expenses are accrued daily. Amortization of premium and accretion of
FGI-17
Franklin Templeton Variable Insurance Products Trust
Notes to Financial Statements (continued)
Franklin Growth and Income Securities Fund
1. ORGANIZATION AND SIGNIFICANT ACCOUNTING POLICIES (continued)
f. Security Transactions, Investment Income, Expenses and Distributions (continued)
discount on debt securities are included in interest income. Dividend income is recorded on the ex-dividend date except that certain dividends from foreign securities are recognized as soon as the Fund is notified of the ex-dividend date. Distributions to shareholders are recorded on the ex-dividend date and are determined according to income tax regulations (tax basis). Distributable earnings determined on a tax basis may differ from earnings recorded in accordance with accounting principles generally accepted in the United States of America. These differences may be permanent or temporary. Permanent differences are reclassified among capital accounts to reflect their tax character. These reclassifications have no impact on net assets or the results of operations. Temporary differences are not reclassified, as they may reverse in subsequent periods.
Common expenses incurred by the Trust are allocated among the funds based on the ratio of net assets of each fund to the combined net assets of the Trust. Fund specific expenses are charged directly to the fund that incurred the expense.
Realized and unrealized gains and losses and net investment income, not including class specific expenses, are allocated daily to each class of shares based upon the relative proportion of net assets of each class. Differences in per share distributions, by class, are generally due to differences in class specific expenses.
g. Accounting Estimates
The preparation of financial statements in accordance with accounting principles generally accepted in the United States of America requires management to make estimates and assumptions that affect the reported amounts of assets and liabilities at the date of the financial statements and the amounts of income and expenses during the reporting period. Actual results could differ from those estimates.
h. Guarantees and Indemnifications
Under the Trust’s organizational documents, its officers and trustees are indemnified by the Trust against certain liabilities arising out of the performance of their duties to the Trust. Additionally, in the normal course of business, the Trust, on behalf of the Fund, enters into contracts with service providers that contain general indemnification clauses. The Trust’s maximum exposure under these arrangements is unknown as this would involve future claims that may be made against the Trust that have not yet occurred. Currently, the Trust expects the risk of loss to be remote.
2. SHARES OF BENEFICIAL INTEREST
At December 31, 2009, there were an unlimited number of shares authorized (without par value). Transactions in the Fund’s shares were as follows:
| | | | | | | | | | | | | | |
| | | Year Ended December 31, | |
| | | 2009 | | | 2008 | |
| Class 1 Shares: | | Shares | | | Amount | | | Shares | | | Amount | |
Shares sold | | 19,644 | | | $ | 180,736 | | | 16,555 | | | $ | 196,921 | |
Shares issued in reinvestment of distributions | | 956,535 | | | | 8,187,942 | | | 2,324,196 | | | | 29,424,315 | |
Shares redeemed | | (3,016,988 | ) | | | (26,225,029 | ) | | (4,003,019 | ) | | | (47,641,774 | ) |
| | | | |
Net increase (decrease) | | (2,040,809 | ) | | $ | (17,856,351 | ) | | (1,662,268 | ) | | $ | (18,020,538 | ) |
| | | | |
FGI-18
Franklin Templeton Variable Insurance Products Trust
Notes to Financial Statements (continued)
Franklin Growth and Income Securities Fund
2. SHARES OF BENEFICIAL INTEREST (continued)
| | | | | | | | | | | | | | |
| | | Year Ended December 31, | |
| | | 2009 | | | 2008a | |
| | | Shares | | | Amount | | | Shares | | | Amount | |
Class 2 Shares: | | | | | | | | | | | | | | |
Shares sold | | 951,710 | | | $ | 8,248,590 | | | 705,175 | | | $ | 8,223,845 | |
Shares issued in reinvestment of distributions | | 784,890 | | | | 6,640,173 | | | 2,262,180 | | | | 28,254,634 | |
Shares redeemed | | (3,475,755 | ) | | | (29,686,686 | ) | | (7,557,698 | ) | | | (85,482,459 | ) |
| | | | |
Net increase (decrease) | | (1,739,155 | ) | | $ | (14,797,923 | ) | | (4,590,343 | ) | | $ | (49,003,980 | ) |
| | | | |
Class 4 Shares: | | | | | | | | | | | | | | |
Shares sold | | — | | | | — | | | 353 | | | $ | 5,000 | |
| | | | |
| aFor | the period February 29, 2008 (effective date) to December 31, 2008 for Class 4. |
3. TRANSACTIONS WITH AFFILIATES
Franklin Resources, Inc. is the holding company for various subsidiaries that together are referred to as Franklin Templeton Investments. Certain officers and trustees of the Trust are also officers and/or directors of the following subsidiaries:
| | |
| Subsidiary | | Affiliation |
Franklin Advisers, Inc. (Advisers) | | Investment manager |
Franklin Templeton Services, LLC (FT Services) | | Administrative manager |
Franklin Templeton Distributors, Inc. (Distributors) | | Principal underwriter |
Franklin Templeton Investor Services, LLC (Investor Services) | | Transfer agent |
a. Management Fees
The Fund pays an investment management fee to Advisers based on the average daily net assets of the Fund as follows:
| | |
| Annualized Fee Rate | | Net Assets |
| 0.625% | | Up to and including $100 million |
| 0.500% | | Over $100 million, up to and including $250 million |
| 0.450% | | Over $250 million, up to and including $7.5 billion |
| 0.440% | | Over $7.5 billion, up to and including $10 billion |
| 0.430% | | Over $10 billion, up to and including $12.5 billion |
| 0.420% | | Over $12.5 billion, up to and including $15 billion |
| 0.400% | | In excess of $15 billion |
b. Administrative Fees
Under an agreement with Advisers, FT Services provides administrative services to the Fund. The fee is paid by Advisers based on average daily net assets, and is not an additional expense of the Fund.
c. Distribution Fees
The Fund’s Board of Trustees has adopted distribution plans for Class 2 and Class 4 shares pursuant to Rule 12b-1 under the 1940 Act. Under the Fund’s compensation distribution plans, the Fund pays Distributors for costs incurred in connection with
FGI-19
Franklin Templeton Variable Insurance Products Trust
Notes to Financial Statements (continued)
Franklin Growth and Income Securities Fund
3. TRANSACTIONS WITH AFFILIATES (continued)
c. Distribution Fees (continued)
the servicing, sale and distribution of the Fund’s shares up to 0.35% per year of its average daily net assets of each class. The Board of Trustees has agreed to limit the current rate to 0.25% per year for Class 2.
d. Transfer Agent Fees
Investor Services, under terms of an agreement, performs shareholder servicing for the Fund and is not paid by the Fund for the services.
4. EXPENSE OFFSET ARRANGEMENT
The Fund has entered into an arrangement with its custodian whereby credits realized as a result of uninvested cash balances are used to reduce a portion of the Fund’s custodian expenses. During the year ended December 31, 2009, the custodian fees were reduced as noted in the Statement of Operations.
5. INCOME TAXES
For tax purposes, capital losses may be carried over to offset future capital gains, if any. At December 31, 2009, the capital loss carryforwards were as follows:
| | | |
Capital loss carryforwards expiring in: | | | |
2016 | | $ | 20,500,338 |
2017 | | | 73,449,517 |
| | | |
| | $ | 93,949,855 |
| | | |
The tax character of distributions paid during the years ended December 31, 2009 and 2008, was as follows:
| | | | | | |
| | | 2009 | | 2008 |
Distributions paid from: | | | | | | |
Ordinary income | | $ | 14,828,273 | | $ | 18,802,624 |
Long term capital gain | | | — | | | 38,876,881 |
| | | |
| | $ | 14,828,273 | | $ | 57,679,505 |
| | | |
At December 31, 2009, the cost of investments, net unrealized appreciation (depreciation), and undistributed ordinary income for income tax purposes were as follows:
| | | | |
Cost of investments | | $ | 295,365,380 | |
| | | | |
| |
Unrealized appreciation | | $ | 52,267,665 | |
Unrealized depreciation | | | (21,477,158 | ) |
| | | | |
Net unrealized appreciation (depreciation) | | $ | 30,790,507 | |
| | | | |
Distributable earnings – undistributed ordinary income | | $ | 11,652,754 | |
| | | | |
Net investment income differs for financial statement and tax purposes primarily due to differing treatments of foreign currency transactions and bond discounts and premiums.
FGI-20
Franklin Templeton Variable Insurance Products Trust
Notes to Financial Statements (continued)
Franklin Growth and Income Securities Fund
5. INCOME TAXES (continued)
Net realized gains (losses) differ for financial statement and tax purposes primarily due to differing treatments of wash sales, foreign currency transactions, and bond discounts and premiums.
6. INVESTMENT TRANSACTIONS
Purchases and sales of investments (excluding short term securities) for the year ended December 31, 2009, aggregated $143,789,887 and $162,317,498, respectively.
7. CREDIT RISK AND DEFAULTED SECURITIES
At December 31, 2009, the Fund had 12.46% of its portfolio invested in high yield or other securities rated below investment grade. These securities may be more sensitive to economic conditions causing greater price volatility and are potentially subject to a greater risk of loss due to default than higher rated securities.
8. CREDIT FACILITY
The Fund, together with other U.S. registered and foreign investment funds (collectively “Borrowers”), managed by Franklin Templeton Investments, are borrowers in a joint syndicated senior unsecured credit facility totaling $725 million (Global Credit Facility) to provide a source of funds to the Borrowers for temporary and emergency purposes, including the ability to meet future unanticipated or unusually large redemption requests. Effective January 22, 2010, the Fund renewed the Global Credit Facility, for a total of $750 million, maturing January 21, 2011.
Under the terms of the Global Credit Facility, the Fund shall, in addition to interest charged on any borrowings made by the Fund and other costs incurred by the Fund, pay its share of fees and expenses incurred in connection with the implementation and maintenance of the Global Credit Facility, based upon its relative share of the aggregate net assets of all of the Borrowers, including an annual commitment fee of 0.10% based upon the unused portion of the Global Credit Facility, which is reflected in other expenses on the Statement of Operations. During the year ended December 31, 2009, the Fund did not utilize the Global Credit Facility.
9. FAIR VALUE MEASUREMENTS
The Fund follows a fair value hierarchy that distinguishes between market data obtained from independent sources (observable inputs) and the Fund’s own market assumptions (unobservable inputs). These inputs are used in determining the value of the Fund’s investments and are summarized in the following fair value hierarchy:
| | • | | Level 1 – quoted prices in active markets for identical securities |
| | • | | Level 2 – other significant observable inputs (including quoted prices for similar securities, interest rates, prepayment speed, credit risk, etc.) |
| | • | | Level 3 – significant unobservable inputs (including the Fund’s own assumptions in determining the fair value of investments) |
The inputs or methodology used for valuing securities are not an indication of the risk associated with investing in those securities.
FGI-21
Franklin Templeton Variable Insurance Products Trust
Notes to Financial Statements (continued)
Franklin Growth and Income Securities Fund
9. FAIR VALUE MEASUREMENTS (continued)
The following is a summary of the inputs used as of December 31, 2009, in valuing the Fund’s assets carried at fair value:
| | | | | | | | | | | | |
| | | Level 1 | | Level 2 | | Level 3 | | Total |
| | | |
Assets: | | | | | | | | | | | | |
Investments in Securities: | | | | | | | | | | | | |
Equity Investments:a | | | | | | | | | | | | |
Consumer Discretionary | | $ | 10,559,462 | | $ | 8,996,466 | | $ | — | | $ | 19,555,928 |
Energy | | | 31,683,585 | | | 3,833,760 | | | — | | | 35,517,345 |
Health Care | | | 32,526,980 | | | 3,086,250 | | | — | | | 35,613,230 |
Utilities | | | 16,189,494 | | | 6,690,000 | | | — | | | 22,879,494 |
All Other Equity Investmentsb | | | 179,492,275 | | | — | | | — | | | 179,492,275 |
Corporate Bonds | | | — | | | 6,002,037 | | | — | | | 6,002,037 |
Convertible Bonds | | | — | | | 14,785,718 | | | — | | | 14,785,718 |
Short Term Investments | | | — | | | 12,309,860 | | | — | | | 12,309,860 |
| | | |
Total Investments in Securities | | $ | 270,451,796 | | $ | 55,704,091 | | $ | — | | $ | 326,155,887 |
| | | |
aIncludes common and preferred stock as well as other equity investments.
bFor detailed industry descriptions, see the accompanying Statement of Investments.
10. NEW ACCOUNTING PRONOUNCEMENTS
In January 2010, the Financial Accounting Standards Board issued Accounting Standards Update (ASU) No. 2010-6, Fair Value Measurements and Disclosures (Topic 820): Improving Disclosures about Fair Value Measurements. ASU No. 2010-6 enhances and clarifies existing fair value measurement disclosure requirements and is effective for interim and annual periods beginning after December 15, 2009. The Fund is currently evaluating the impact, if any, of applying the provisions of ASU No. 2010-6.
11. SUBSEQUENT EVENTS
The Fund has evaluated subsequent events through February 10, 2010, the issuance date of the financial statements and determined that no events have occurred that require disclosure.
ABBREVIATIONS
Selected Portfolio
ADR - American Depository Receipt
FGI-22
Franklin Templeton Variable Insurance Products Trust
Franklin Growth and Income Securities Fund
Report of Independent Registered Public Accounting Firm
To the Board of Trustees and Shareholders of Franklin Templeton Variable Insurance Products Trust
In our opinion, the accompanying statement of assets and liabilities, including the statement of investments, and the related statements of operations and of changes in net assets and the financial highlights present fairly, in all material respects, the financial position of Franklin Growth and Income Securities Fund (one of the funds constituting the Franklin Templeton Variable Insurance Products Trust, hereafter referred to as the “Fund”) at December 31, 2009, the results of its operations for the year then ended, the changes in its net assets and the financial highlights for the periods presented, in conformity with accounting principles generally accepted in the United States of America. These financial statements and financial highlights (hereafter referred to as “financial statements”) are the responsibility of the Fund’s management. Our responsibility is to express an opinion on these financial statements based on our audits. We conducted our audits of these financial statements in accordance with the standards of the Public Company Accounting Oversight Board (United States). Those standards require that we plan and perform the audit to obtain reasonable assurance about whether the financial statements are free of material misstatement. An audit includes examining, on a test basis, evidence supporting the amounts and disclosures in the financial statements, assessing the accounting principles used and significant estimates made by management, and evaluating the overall financial statement presentation. We believe that our audits, which included confirmation of securities at December 31, 2009 by correspondence with the custodian and brokers, provide a reasonable basis for our opinion.
PricewaterhouseCoopers LLP
San Francisco, California
February 10, 2010
FGI-23
Franklin Templeton Variable Insurance Products Trust
Tax Designation (unaudited)
Franklin Growth and Income Securities Fund
Under Section 854(b)(2) of the Internal Revenue Code, the Fund designates 58.64% of the ordinary income dividends as income qualifying for the dividends received deduction for the fiscal year ended December 31, 2009.
FGI-24
FRANKLIN HIGH INCOME SECURITIES FUND
This annual report for Franklin High Income Securities Fund covers the fiscal year ended December 31, 2009.
Performance Summary as of 12/31/09
Average annual total return of Class 4 shares* represents the average annual change in value, assuming reinvestment of dividends and capital gains. Average returns smooth out variations in returns, which can be significant; they are not the same as year-by-year results.
Periods ended 12/31/09
| | | | | | |
| | | 1-Year | | 5-Year | | 10-Year |
Average Annual Total Return | | +42.36% | | +5.01% | | +4.25% |
*For the period beginning 2/29/08, Class 4 performance reflects a 12b-1 fee expense of 0.35% per year, which affects future performance. Class 4 performance prior to 2/29/08 reflects historical Class 1 performance, which does not include a 12b-1 fee expense. Since 2/29/08 (effective date), the average annual total return of Class 4 shares was +6.35%.
Total Return Index Comparison for a Hypothetical $10,000 Investment (1/1/00–12/31/09)
The graph below shows the change in value of a hypothetical $10,000 investment in the Fund over the indicated period and includes reinvestment of any income or distributions. The Fund’s performance* is compared to the performance of the Credit Suisse (CS) High Yield Index and the Lipper VIP High Current Yield Funds Classification Average. One cannot invest directly in an index, and an index is not representative of the Fund’s portfolio. Please see Important Notes to Performance Information preceding the Fund Summaries.
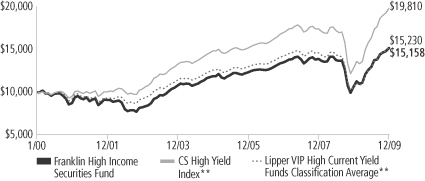
**Sources: © 2009 Morningstar; Lipper Inc. Please see Index Descriptions following the Fund Summaries.
Franklin High Income Securities Fund – Class 4
Performance reflects the Fund’s Class 4 operating expenses, but does not include any contract fees, expenses or sales charges. If they had been included, performance would be lower. These charges and deductions, particularly for variable life policies, can have a significant effect on contract values and insurance benefits. See the contract prospectus for a complete description of these expenses, including sales charges.
Performance data represent past performance, which does not guarantee future results. Investment return and principal value will fluctuate, and you may have a gain or loss when you sell your shares.
Current performance may differ from figures shown.
FH-1
Fund Goals and Main Investments: Franklin High Income Securities Fund seeks a high level of current income with capital appreciation as a secondary goal. The Fund normally invests primarily to predominantly in debt securities offering high yield and expected total return.
Performance Overview
You can find the Fund’s one-year total return in the Performance Summary. The Fund underperformed its benchmark, the CS High Yield Index, which had a +54.22% total return for the period under review.1 The Fund performed comparably to its peers, as measured by the +43.48% return of the Lipper VIP High Current Yield Funds Classification Average.2
Economic and Market Overview
The U.S. economy ended 2009 in much better shape than it began. Early in the period, the U.S. financial system was in crisis and consumer confidence fell to an all-time low. The financial system, however, avoided collapse, and financial markets stabilized in response to federal stimulus packages and the Federal Reserve Board’s (Fed’s) interventions.
Economic headwinds and benign inflation prompted policymakers to enact stimulus plans. During the period, the Fed kept the federal funds target rate in a range of 0% to 0.25%. The government implemented the American Recovery and Reinvestment Act, which included tax breaks, money for ailing state governments, aid to the poor and unemployed, and spending on infrastructure, renewable energy, health care and education. The Fed and U.S. Treasury Department also launched programs designed to shore up beleaguered banks’ capital, enable freer lending to businesses and consumers, help struggling home owners avoid foreclosure, and boost auto sales. Near period-end, the Fed assessed which of its support programs could be phased out.
In March, many investors reentered the stock market and started a rally that brought the major indexes off this cycle’s lows. Economic activity as measured by gross domestic product (GDP) turned from contraction to expansion. GDP registered annualized quarterly rates of -6.4%, -0.7%, 2.2% and an estimated 5.7% in 2009. These positive signs, however, were constrained by a rising unemployment rate, which stood
1. Source: © 2009 Morningstar.
2. Source: Lipper Inc.
One cannot invest directly in an index, and an index is not representative of the Fund’s portfolio. Please see Index Descriptions following the Fund Summaries.
Fund Risks: Because the Fund invests in bonds and other debt obligations, its share price and yield will be affected by interest rate movements. Bond prices generally move in the opposite direction of interest rates. Thus, as prices of bonds in the Fund adjust to a rise in interest rates, the Fund’s share price may decline. The Fund invests primarily to predominantly in high yield, lower rated (junk) bonds, which generally have greater price swings and higher risk of default and loss of principal than investment-grade bonds. Foreign investing, especially in emerging markets, involves additional risks including currency fluctuations, economic instability, market volatility, and political and social instability. The Fund’s prospectus also includes a description of the main investment risks.
FH-2
at 10.0% by period-end.3 Economic challenges remain, such as stalled consumer confidence and job prospects for the unemployed as stimulus measures begin to wind down, but several reports pointed to a resumption of growth.
Many commodity prices generally rose as economic conditions improved. Oil prices moved up from $45 per barrel at the beginning of the period to $79 at year-end, still well below 2008 highs. Inflation remained muted, and December 2009’s inflation rate was an annualized - -2.7%.3 Core inflation, which excludes food and energy costs, rose at a 1.8% annualized rate, which was within the Fed’s informal target range of 1.5% to 2.0%.3 The core personal consumption expenditures price index reported a 12-month increase of 1.5%.4
The spread between two-year and 10-year Treasury yields increased to 271 basis points (100 basis points equal one percentage point) at the end of December from 149 basis points at the beginning of the reporting period. The two-year Treasury bill yield rose from 0.76% to 1.14% over the 12-month period, while the 10-year Treasury note yield rose from 2.25% to 3.85%.
Investment Strategy
We are research-driven, fundamental investors who rely on a team of analysts to provide in-depth industry expertise and use qualitative and quantitative analyses to evaluate companies. As bottom-up investors, we focus primarily on individual securities. We also consider sectors when choosing investments. In selecting securities for the Fund’s investment portfolio, we do not rely principally on ratings assigned by rating agencies, but perform our own independent analysis to evaluate an issuer’s creditworthiness. We consider a variety of factors, including an issuer’s experience and managerial strength, its sensitivity to economic conditions and its current financial condition.
Manager’s Discussion
The high yield bond market rebounded impressively in 2009 and generated a record return for the year ended December 31, 2009. Although the Fund did not keep pace with its benchmark, the CS High Yield Index, the Fund provided a strong absolute return, performing comparably to its peers as measured by the Lipper VIP High Current Yield Funds Classification Average. Despite a still very uncertain economic environment at the start of 2009, near-record-wide yield spread
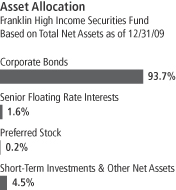
3. Source: Bureau of Labor Statistics.
4. Source: Bureau of Economic Analysis.
FH-3
premiums above U.S. Treasury securities began to attract investors to the high yield market and provide some stability to secondary market pricing. By the end of the first quarter, risk appetites had increased sufficiently to also buoy the U.S. equity market and begin a rally that lasted the remainder of the year, providing further support to the high yield market. With capital markets reopening, companies that had seemed to be on their way to defaulting due to near-term debt maturities got a reprieve. Many management teams seized the opportunity to refinance or repair balance sheets, thereby buying time for the overall economy to recover and improving the fundamental corporate picture. By year-end 2009, spread premiums had narrowed significantly, falling from 17.1 percentage points at the beginning of the period to 6.3 percentage points at the end.1
We mainly use a bottom-up security selection process to manage the Fund; however, we also draw on our research process to take economic conditions into account. For instance, although we maintained a fairly conservative risk positioning (beta) versus the benchmark index through late 2008, as we entered 2009, we sought to take advantage of depressed valuations by selectively adding some higher beta positions to the portfolio. However, our overall positioning relative to the index remained slightly defensive and therefore hindered relative results given the extreme market rally, but the repositioning helped us keep pace with our peer group. Furthering our top-down efforts, as is typical, we also drew on our fundamental research to drive the Fund’s industry positioning. Within that framework, we over- and underweighted certain industries relative to our benchmark index.
For example, we overweighted the broadcasting industry throughout the fiscal year despite concerns about advertising revenues.5 With severely depressed valuations for most industry participants, we saw better long-term value than market prices indicated. Fortunately, the industry was the best performing in the CS High Yield Index in 2009. Similarly, we overweighted our allocation to the chemicals industry, a typically deep cyclical area.6 We increased our holdings in this industry as the economic outlook improved during the year. Many chemicals companies were able to maintain healthy liquidity and cut costs during the economic downturn, which may boost profits when demand picks up. The chemicals industry outperformed the index during the year; therefore, our positioning benefited relative performance.
5. Broadcasting holdings are in media in the SOI.
6. Chemicals holdings are in materials in the SOI.
Top 10 Sectors/Industries
Franklin High Income Securities Fund 12/31/09
| | |
| | | % of Total
Net Assets |
| Energy | | 13.9% |
| Media | | 11.2% |
| Materials | | 11.0% |
| Telecommunication Services | | 8.3% |
| Utilities | | 8.0% |
| Health Care Equipment & Services | | 7.8% |
| Consumer Services | | 6.5% |
| Capital Goods | | 3.7% |
| Diversified Financials | | 3.5% |
| Food, Beverage & Tobacco | | 2.9% |
The dollar value, number of shares or principal amount, and names of all portfolio holdings are listed in the Fund’s Statement of Investments (SOI).
FH-4
Conversely, we maintained an underweighted allocation to the metals/minerals industry given our outlook for pressures on certain commodity prices.7 This positioning also benefited relative results as the industry underperformed the index.
While some of the Fund’s positioning enhanced relative performance versus the benchmark index, certain weightings had a negative effect. For example, we took a cautious view of future consumer spending given historically high unemployment during the year. This stance, coupled with our view of a general lack of downside protection offered by companies in the consumer and retail industries versus valuations in the market, led us to underweight these areas.8 Although actual earnings results did not necessarily exceed market expectations, these industries participated in the market rally. In addition, investors’ bias toward higher beta names helped propel these industries to outperform the overall index. Given our underweighted allocations to these sectors, relative performance suffered. Toward the other end of the risk spectrum, we remained overweighted in the utilities sector, although we reduced our exposure during the Fund’s fiscal year. Mainly due to its typically lower beta, the sector underperformed the benchmark, and our positioning was a drag on relative results.
Thank you for your participation in Franklin High Income Securities Fund. We look forward to serving your future investment needs.
7. Metals and minerals holdings are in materials in the SOI.
8. Consumer holdings are in consumer durables and apparel, and consumer services in the SOI. Retail holdings are in retailing in the SOI.
The foregoing information reflects our analysis, opinions and portfolio holdings as of
December 31, 2009, the end of the reporting period. The way we implement our main investment strategies and the resulting portfolio holdings may change depending on factors such as market and economic conditions. These opinions may not be relied upon as investment advice or an offer for a particular security. The information is not a complete analysis of every aspect of any market, country, industry, security or the Fund. Statements of fact are from sources considered reliable, but the investment manager makes no representation or warranty as to their completeness or accuracy. Although historical performance is no guarantee of future results, these insights may help you understand our investment management philosophy.
FH-5
Fund Expenses
As an investor in a variable insurance contract (Contract) that indirectly provides for investment in an underlying mutual fund, you can incur transaction and/or ongoing expenses at both the Fund level and the Contract level.
| • | | Transaction expenses can include sales charges (loads) on purchases, redemption fees, surrender fees, transfer fees and premium taxes. |
| • | | Ongoing expenses can include management fees, distribution and service (12b-1) fees, contract fees, annual maintenance fees, mortality and expense risk fees and other fees and expenses. All mutual funds and Contracts have some types of ongoing expenses. |
The expenses shown in the table are meant to highlight ongoing expenses at the Fund level only and do not include ongoing expenses at the Contract level, or transaction expenses at either the Fund or Contract level. While the Fund does not have transaction expenses, if the transaction and ongoing expenses at the Contract level were included, the expenses shown would be higher. You should consult your Contract prospectus or disclosure document for more information.
The table shows Fund-level ongoing expenses and can help you understand these expenses and compare them with those of other mutual funds offered through the Contract. The table assumes a $1,000 investment held for the six months indicated. Please refer to the Fund prospectus for additional information on operating expenses.
Actual Fund Expenses
The first line (Actual) of the table provides actual account values and expenses. The “Ending Account Value” is derived from the Fund’s actual return, which includes the effect of ongoing Fund expenses, but does not include the effect of ongoing Contract expenses.
You can estimate the Fund-level expenses you incurred during the period by following these steps. Of course, your account value and expenses will differ from those in this illustration:
| 1. | Divide your account value by $1,000. |
If an account had an $8,600 value, then $8,600 ÷ $1,000 = 8.6.
| 2. | Multiply the result by the number under the heading “Fund-Level Expenses Incurred During Period.” |
If Fund-Level Expenses Incurred During Period were $7.50, then 8.6 x $7.50 = $64.50.
In this illustration, the estimated expenses incurred this period at the Fund level are $64.50.
Franklin High Income Securities Fund – Class 4
FH-6
Hypothetical Example for Comparison with Other Mutual Funds
Information in the second line (Hypothetical) of the table can help you compare ongoing expenses of the Fund with those of other mutual funds offered through the Contract. This information may not be used to estimate the actual ending account balance or expenses you incurred during the period. The hypothetical “Ending Account Value” is based on the Fund’s actual expense ratio and an assumed 5% annual rate of return before expenses, which does not represent the Fund’s actual return. The figure under the heading “Fund-Level Expenses Incurred During Period” shows the hypothetical expenses your account would have incurred under this scenario. You can compare this figure with the 5% hypothetical examples that appear in shareholder reports of other funds offered through a Contract.
| | | | | | | | | |
| Class 4 | | Beginning
Account Value 7/1/09 | | Ending
Account
Value 12/31/09 | | Fund-Level Expenses Incurred
During Period* 7/1/09–12/31/09 |
Actual | | $ | 1,000 | | $ | 1,171.40 | | $ | 5.31 |
Hypothetical (5% return before expenses) | | $ | 1,000 | | $ | 1,020.32 | | $ | 4.94 |
*Expenses are calculated using the most recent six-month annualized expense ratio for the Fund’s Class 4 shares (0.97%), which does not include any ongoing expenses of the Contract for which the Fund is an investment option, multiplied by the average account value over the period, multiplied by 184/365 to reflect the one-half year period.
FH-7
Franklin Templeton Variable Insurance Products Trust
Financial Highlights
Franklin High Income Securities Fund
| | | | | | | | | | | | | | | | | | | | |
| | | Year Ended December 31, | |
| Class 1 | | 2009 | | | 2008 | | | 2007 | | | 2006 | | | 2005 | |
| | | | |
Per share operating performance | | | | | | | | | | | | | | | | | | | | |
(for a share outstanding throughout the year) | | | | | | | | | | | | | | | | | | | | |
Net asset value, beginning of year | | $ | 4.68 | | | $ | 6.72 | | | $ | 6.96 | | | $ | 6.82 | | | $ | 6.99 | |
| | | | |
Income from investment operationsa: | | | | | | | | | | | | | | | | | | | | |
Net investment incomeb | | | 0.46 | | | | 0.50 | | | | 0.51 | | | | 0.49 | | | | 0.48 | |
Net realized and unrealized gains (losses) | | | 1.50 | | | | (1.92 | ) | | | (0.30 | ) | | | 0.12 | | | | (0.23 | ) |
| | | | |
Total from investment operations | | | 1.96 | | | | (1.42 | ) | | | 0.21 | | | | 0.61 | | | | 0.25 | |
| | | | |
Less distributions from net investment income | | | (0.38 | ) | | | (0.62 | ) | | | (0.45 | ) | | | (0.47 | ) | | | (0.42 | ) |
| | | | |
Net asset value, end of year | | $ | 6.26 | | | $ | 4.68 | | | $ | 6.72 | | | $ | 6.96 | | | $ | 6.82 | |
| | | | |
| | | | | |
Total returnc | | | 42.99% | | | | (23.16)% | | | | 3.02% | | | | 9.48% | | | | 3.72% | |
Ratios to average net assets | | | | | | | | | | | | | | | | | | | | |
Expenses before expense reduction | | | 0.63% | | | | 0.66% | | | | 0.61% | | | | 0.64% | | | | 0.60% | |
Expenses net of expense reduction | | | 0.63% | d | | | 0.66% | d | | | 0.61% | d | | | 0.63% | | | | 0.60% | d |
Net investment income | | | 8.33% | | | | 8.30% | | | | 7.38% | | | | 7.14% | | | | 6.96% | |
| | | | | |
Supplemental data | | | | | | | | | | | | | | | | | | | | |
Net assets, end of year (000’s) | | $ | 48,855 | | | $ | 38,225 | | | $ | 61,286 | | | $ | 77,641 | | | $ | 87,814 | |
Portfolio turnover rate | | | 26.41% | | | | 21.75% | | | | 40.65% | | | | 37.99% | | | | 47.60% | |
aThe amount shown for a share outstanding throughout the period may not correlate with the Statement of Operations for the period due to the timing of sales and repurchases of the Fund shares in relation to income earned and/or fluctuating market value of the investments of the Fund.
bBased on average daily shares outstanding.
cTotal return does not include any fees, charges or expenses imposed by the variable annuity and life insurance contracts for which the Franklin Templeton Variable Insurance Products Trust serves as an underlying investment vehicle.
dBenefit of expense reduction rounds to less than 0.01%.
The accompanying notes are an integral part of these financial statements.
FH-8
Franklin Templeton Variable Insurance Products Trust
Financial Highlights (continued)
Franklin High Income Securities Fund
| | | | | | | | | | | | | | | | | | | | |
| | | Year Ended December 31, | |
| Class 2 | | 2009 | | | 2008 | | | 2007 | | | 2006 | | | 2005 | |
| | | | |
Per share operating performance | | | | | | | | | | | | | | | | | | | | |
(for a share outstanding throughout the year) | | | | | | | | | | | | | | | | | | | | |
Net asset value, beginning of year | | $ | 4.59 | | | $ | 6.60 | | | $ | 6.85 | | | $ | 6.71 | | | $ | 6.90 | |
| | | | |
Income from investment operationsa: | | | | | | | | | | | | | | | | | | | | |
Net investment incomeb | | | 0.44 | | | | 0.47 | | | | 0.48 | | | | 0.46 | | | | 0.45 | |
Net realized and unrealized gains (losses) | | | 1.47 | | | | (1.88 | ) | | | (0.29 | ) | | | 0.13 | | | | (0.23 | ) |
| | | | |
Total from investment operations | | | 1.91 | | | | (1.41 | ) | | | 0.19 | | | | 0.59 | | | | 0.22 | |
| | | | |
Less distributions from net investment income | | | (0.37 | ) | | | (0.60 | ) | | | (0.44 | ) | | | (0.45 | ) | | | (0.41 | ) |
| | | | |
Net asset value, end of year | | $ | 6.13 | | | $ | 4.59 | | | $ | 6.60 | | | $ | 6.85 | | | $ | 6.71 | |
| | | | |
| | | | | |
Total returnc | | | 42.70% | | | | (23.38)% | | | | 2.72% | | | | 9.36% | | | | 3.31% | |
Ratios to average net assets | | | | | | | | | | | | | | | | | | | | |
Expenses before expense reduction | | | 0.88% | | | | 0.91% | | | | 0.86% | | | | 0.89% | | | | 0.85% | |
Expenses net of expense reduction | | | 0.88% | d | | | 0.91% | d | | | 0.86% | d | | | 0.88% | | | | 0.85% | d |
Net investment income | | | 8.08% | | | | 8.05% | | | | 7.13% | | | | 6.89% | | | | 6.71% | |
| | | | | |
Supplemental data | | | | | | | | | | | | | | | | | | | | |
Net assets, end of year (000’s) | | $ | 198,567 | | | $ | 84,396 | | | $ | 155,777 | | | $ | 166,318 | | | $ | 139,413 | |
Portfolio turnover rate | | | 26.41% | | | | 21.75% | | | | 40.65% | | | | 37.99% | | | | 47.60% | |
aThe amount shown for a share outstanding throughout the period may not correlate with the Statement of Operations for the period due to the timing of sales and repurchases of the Fund shares in relation to income earned and/or fluctuating market value of the investments of the Fund.
bBased on average daily shares outstanding.
cTotal return does not include any fees, charges or expenses imposed by the variable annuity and life insurance contracts for which the Franklin Templeton Variable Insurance Products Trust serves as an underlying investment vehicle.
dBenefit of expense reduction rounds to less than 0.01%.
The accompanying notes are an integral part of these financial statements.
FH-9
Franklin Templeton Variable Insurance Products Trust
Financial Highlights (continued)
Franklin High Income Securities Fund
| | | | | | | | |
| | | Year Ended
December 31, | |
| Class 4 | | 2009 | | | 2008a | |
| | | | |
Per share operating performance | | | | | | | | |
(for a share outstanding throughout the year) | | | | | | | | |
Net asset value, beginning of year | | $ | 4.67 | | | $ | 6.55 | |
| | | | |
Income from investment operationsb: | | | | | | | | |
Net investment incomec | | | 0.45 | | | | 0.39 | |
Net realized and unrealized gains (losses) | | | 1.48 | | | | (1.65 | ) |
| | | | |
Total from investment operations | | | 1.93 | | | | (1.26 | ) |
| | | | |
Less distributions from net investment income | | | (0.38 | ) | | | (0.62 | ) |
| | | | |
Net asset value, end of year | | $ | 6.22 | | | $ | 4.67 | |
| | | | |
| | |
Total returnd | | | 42.36% | | | | (21.34)% | |
Ratios to average net assetse | | | | | | | | |
Expensesf | | | 0.98% | | | | 1.01% | |
Net investment income | | | 7.98% | | | | 7.95% | |
| | |
Supplemental data | | | | | | | | |
Net assets, end of year (000’s) | | $ | 15,105 | | | $ | 2,244 | |
Portfolio turnover rate | | | 26.41% | | | | 21.75% | |
aFor the period February 29, 2008 (effective date) to December 31, 2008.
bThe amount shown for a share outstanding throughout the period may not correlate with the Statement of Operations for the period due to the timing of sales and repurchase of the Fund shares in relation to income earned and/or fluctuating market value of the investments of the Fund.
cBased on average daily shares outstanding.
dTotal return does not include any fees, charges or expenses imposed by the variable annuity and life insurance contracts for which the Franklin Templeton Variable Insurance Products Trust serves as an underlying investment vehicle. Total return is not annualized for periods less than one year.
eRatios are annualized for periods less than one year.
fBenefit of expense reduction rounds to less than 0.01%.
The accompanying notes are an integral part of these financial statements.
FH-10
Franklin Templeton Variable Insurance Products Trust
Statement of Investments, December 31, 2009
| | | | | | | |
| Franklin High Income Securities Fund | | Country | | Principal
Amounta | | Value |
b,cSenior Floating Rate Interests 1.6% | | | | | | | |
Consumer Services 0.2% | | | | | | | |
OSI Restaurant Partners LLC (Outback), | | | | | | | |
Pre-Funded Revolving Credit, 0.074% - 2.563%, 6/14/13 | | United States | | 54,086 | | $ | 44,312 |
Term Loan B, 2.563% - 4.50%, 6/14/14 | | United States | | 635,607 | | | 520,744 |
| | | | | | | |
| | | | | | | 565,056 |
| | | | | | | |
Materials 0.6% | | | | | | | |
Novelis Corp., U.S. Term Loan, 2.24% - 2.26%, 7/07/14 | | United States | | 1,583,818 | | | 1,452,022 |
| | | | | | | |
Media 0.3% | | | | | | | |
Univision Communications Inc., Initial Term Loan, 2.501%, 9/29/14 | | United States | | 1,000,000 | | | 872,500 |
| | | | | | | |
Utilities 0.5% | | | | | | | |
Dynegy Holdings Inc., | | | | | | | |
Term L/C Facility, 3.99%, 4/02/13 | | United States | | 1,386,133 | | | 1,331,843 |
Term Loan B, 3.99%, 4/02/13 | | United States | | 111,584 | | | 107,213 |
| | | | | | | |
| | | | | | | 1,439,056 |
| | | | | | | |
Total Senior Floating Rate Interests (Cost $4,370,441) | | | | | | | 4,328,634 |
| | | | | | | |
Corporate Bonds 93.7% | | | | | | | |
Automobiles & Components 2.7% | | | | | | | |
dAmerican Axle & Manufacturing Holdings Inc., senior secured note, 144A, 1/15/17 | | United States | | 500,000 | | | 510,000 |
Ford Motor Credit Co. LLC, | | | | | | | |
7.80%, 6/01/12 | | United States | | 1,500,000 | | | 1,516,948 |
senior note, 9.875%, 8/10/11 | | United States | | 3,200,000 | | | 3,360,000 |
dTRW Automotive Inc., senior note, 144A, 7.25%, 3/15/17 | | United States | | 1,700,000 | | | 1,657,500 |
| | | | | | | |
| | | | | | | 7,044,448 |
| | | | | | | |
Banks 0.8% | | | | | | | |
eWells Fargo Capital XV, pfd., 9.75%, Perpetual | | United States | | 2,000,000 | | | 2,150,000 |
| | | | | | | |
Capital Goods 3.7% | | | | | | | |
dAllison Transmission Inc., senior note, 144A, 11.00%, 11/01/15 | | United States | | 2,200,000 | | | 2,321,000 |
Case New Holland Inc., senior note, | | | | | | | |
7.125%, 3/01/14 | | United States | | 2,000,000 | | | 2,040,000 |
d144A, 7.75%, 9/01/13 | | United States | | 300,000 | | | 308,250 |
Greenbrier Cos. Inc., senior note, 8.375%, 5/15/15 | | United States | | 600,000 | | | 498,750 |
RBS Global & Rexnord Corp., senior note, 9.50%, 8/01/14 | | United States | | 2,000,000 | | | 2,015,000 |
dRSC Equipment Rental/RSC Holdings, senior note, 144A, 10.25%, 11/15/19 | | United States | | 2,500,000 | | | 2,521,875 |
| | | | | | | |
| | | | | | | 9,704,875 |
| | | | | | | |
Commercial & Professional Services 2.0% | | | | | | | |
ARAMARK Corp., senior note, 8.50%, 2/01/15 | | United States | | 2,000,000 | | | 2,070,000 |
dCasella Waste Systems Inc., senior secured note, 144A, 11.00%, 7/15/14 | | United States | | 900,000 | | | 978,750 |
Clean Harbors Inc., senior secured note, 7.625%, 8/15/16 | | United States | | 500,000 | | | 509,375 |
f,gGoss Graphic Systems Inc., senior sub. note, 12.25%, 11/19/05 | | United States | | 1,912,374 | | | 191 |
d,hJohnsonDiversey Holdings Inc., senior note, 144A, PIK, 10.50%, 5/15/20 | | United States | | 1,600,000 | | | 1,616,000 |
| | | | | | | |
| | | | | | | 5,174,316 |
| | | | | | | |
Consumer Durables & Apparel 2.7% | | | | | | | |
Hanesbrands Inc., senior note, 8.00%, 12/15/16 | | United States | | 400,000 | | | 409,500 |
Jarden Corp., senior sub. note, 7.50%, 5/01/17 | | United States | | 2,200,000 | | | 2,205,500 |
Jostens IH Corp., senior sub. note, 7.625%, 10/01/12 | | United States | | 2,100,000 | | | 2,121,000 |
KB Home, senior note, 6.25%, 6/15/15 | | United States | | 1,600,000 | | | 1,500,000 |
dNorcraft Cos. LP, senior secured note, 144A, 10.50%, 12/15/15 | | United States | | 900,000 | | | 927,000 |
| | | | | | | |
| | | | | | | 7,163,000 |
| | | | | | | |
FH-11
Franklin Templeton Variable Insurance Products Trust
Statement of Investments, December 31, 2009 (continued)
| | | | | | | | |
| Franklin High Income Securities Fund | | Country | | Principal
Amounta | | | Value |
Corporate Bonds (continued) | | | | | | | | |
Consumer Services 6.3% | | | | | | | | |
d,fFontainebleau Las Vegas, 144A, 10.25%, 6/15/15 | | United States | | 1,700,000 | | | $ | 25,500 |
dHarrah’s Operating Co. Inc., senior secured note, 144A, 11.25%, 6/01/17 | | United States | | 500,000 | | | | 525,625 |
dHarrah’s Operating Escrow, senior secured note, 144A, 11.25%, 6/01/17 | | United States | | 2,500,000 | | | | 2,628,125 |
MGM MIRAGE, senior note, | | | | | | | | |
6.625%, 7/15/15 | | United States | | 2,500,000 | | | | 1,956,250 |
6.875%, 4/01/16 | | United States | | 600,000 | | | | 460,500 |
dNorwegian Cruise Line Ltd., senior secured note, 144A, 11.75%, 11/15/16 | | United States | | 2,000,000 | | | | 1,970,000 |
dPinnacle Entertainment Inc., senior note, 144A, 8.625%, 8/01/17 | | United States | | 2,200,000 | | | | 2,255,000 |
Royal Caribbean Cruises Ltd., senior deb., 7.25%, 3/15/18 | | United States | | 1,500,000 | | | | 1,402,500 |
Speedway Motorsports Inc., senior note, 8.75%, 6/01/16 | | United States | | 1,900,000 | | | | 2,014,000 |
Starwood Hotels & Resorts Worldwide Inc., senior note, 6.75%, 5/15/18 | | United States | | 1,500,000 | | | | 1,511,250 |
fStation Casinos Inc.,
senior note, 6.00%, 4/01/12 | | United States | | 300,000 | | | | 46,875 |
senior note, 7.75%, 8/15/16 | | United States | | 1,000,000 | | | | 161,250 |
senior sub. note, 6.50%, 2/01/14 | | United States | | 100,000 | | | | 1,000 |
senior sub. note, 6.875%, 3/01/16 | | United States | | 1,000,000 | | | | 10,000 |
dUniversal City Development,
senior note, 144A, 8.875%, 11/15/15 | | United States | | 1,300,000 | | | | 1,278,875 |
senior sub. note, 144A, 10.875%, 11/15/16 | | United States | | 200,000 | | | | 201,500 |
| | | | | | | | |
| | | | | | | | 16,448,250 |
| | | | | | | | |
Diversified Financials 3.3% | | | | | | | | |
Citigroup Inc., senior note, 6.375%, 8/12/14 | | United States | | 2,000,000 | | | | 2,095,894 |
dGMAC LLC, senior note, 144A, 6.875%, 8/28/12 | | United States | | 4,049,000 | | | | 4,008,510 |
eJPMorgan Chase & Co., junior sub. note, 1, 7.90%, Perpetual | | United States | | 1,500,000 | | | | 1,552,251 |
fLehman Brothers Holdings Inc., senior note, 6.20%, 9/26/14 | | United States | | 2,300,000 | | | | 460,000 |
d,hWind Acquisition Holding, senior note, 144A, PIK, 12.25%, 7/15/17 | | Italy | | 400,000 | EUR | | | 547,291 |
| | | | | | | | |
| | | | | | | | 8,663,946 |
| | | | | | | | |
Energy 13.9% | | | | | | | | |
dAntero Resources Finance, senior note, 144A, 9.375%, 12/01/17 | | United States | | 1,100,000 | | | | 1,127,500 |
dArch Coal Inc., senior note, 144A, 8.75%, 8/01/16 | | United States | | 400,000 | | | | 425,000 |
Berry Petroleum Co., senior note, 10.25%, 6/01/14 | | United States | | 1,400,000 | | | | 1,529,500 |
Chesapeake Energy Corp., senior note, 6.25%, 1/15/18 | | United States | | 3,700,000 | | | | 3,570,500 |
Compagnie Generale de Geophysique-Veritas, senior note, | | | | | | | | |
7.50%, 5/15/15 | | France | | 800,000 | | | | 798,000 |
7.75%, 5/15/17 | | France | | 1,200,000 | | | | 1,197,000 |
Concho Resources Inc., senior note, 8.625%, 10/01/17 | | United States | | 800,000 | | | | 844,000 |
El Paso Corp., senior note, | | | | | | | | |
12.00%, 12/12/13 | | United States | | 400,000 | | | | 471,000 |
6.875%, 6/15/14 | | United States | | 2,000,000 | | | | 2,008,522 |
bEnterprise Products Operating LLC, junior sub. note, FRN, 7.034%, 1/15/68 | | United States | | 1,900,000 | | | | 1,745,843 |
dExpro Finance Luxembourg, senior secured note, 144A, 8.50%, 12/15/16 | | United Kingdom | | 1,500,000 | | | | 1,476,300 |
dGeneral Maritime Corp., senior note, 144A, 12.00%, 11/15/17 | | United States | | 1,100,000 | | | | 1,150,875 |
dHolly Corp., senior note, 144A, 9.875%, 6/15/17 | | United States | | 700,000 | | | | 740,250 |
Mariner Energy Inc., senior note, 7.50%, 4/15/13 | | United States | | 2,100,000 | | | | 2,100,000 |
MarkWest Energy Partners LP, senior note, 6.875%, 11/01/14 | | United States | | 2,200,000 | | | | 2,112,000 |
dOPTI Canada Inc., senior secured note, 144A, 9.00%, 12/15/12 | | Canada | | 700,000 | | | | 719,250 |
Peabody Energy Corp., senior note, B, 6.875%, 3/15/13 | | United States | | 2,000,000 | | | | 2,032,500 |
Petrohawk Energy Corp., senior note, 7.875%, 6/01/15 | | United States | | 1,800,000 | | | | 1,827,000 |
dPetroplus Finance Ltd., senior note, 144A, 6.75%, 5/01/14 | | Switzerland | | 2,100,000 | | | | 1,969,129 |
Plains Exploration & Production Co., senior note, 7.625%, 6/01/18 | | United States | | 2,200,000 | | | | 2,260,500 |
FH-12
Franklin Templeton Variable Insurance Products Trust
Statement of Investments, December 31, 2009 (continued)
| | | | | | | |
| Franklin High Income Securities Fund | | Country | | Principal
Amounta | | Value |
Corporate Bonds (continued) | | | | | | | |
Energy (continued) | | | | | | | |
Quicksilver Resources Inc., senior note, | | | | | | | |
8.25%, 8/01/15 | | United States | | 2,000,000 | | $ | 2,060,000 |
9.125%, 8/15/19 | | United States | | 300,000 | | | 313,500 |
dSandRidge Energy Inc., senior note, 144A,
8.00%, 6/01/18 | | United States | | 2,000,000 | | | 1,975,000 |
8.75%, 1/15/20 | | United States | | 300,000 | | | 301,500 |
Tesoro Corp., senior note, 6.50%, 6/01/17 | | United States | | 2,000,000 | | | 1,870,000 |
| | | | | | | |
| | | | | | | 36,624,669 |
| | | | | | | |
Food & Staples Retailing 1.2% | | | | | | | |
Rite Aid Corp., senior secured note, 9.75%, 6/12/16 | | United States | | 1,500,000 | | | 1,635,000 |
SUPERVALU Inc., senior note, 8.00%, 5/01/16 | | United States | | 1,500,000 | | | 1,530,000 |
| | | | | | | |
| | | | | | | 3,165,000 |
| | | | | | | |
Food, Beverage & Tobacco 2.9% | | | | | | | |
dAlliance One International Inc., senior note, 144A, 10.00%, 7/15/16 | | United States | | 400,000 | | | 422,000 |
dCEDC Finance Corp. International Inc., senior secured note, 144A, 9.125%, 12/01/16 | | United States | | 1,200,000 | | | 1,242,000 |
dCott Beverages Inc., senior note, 144A, 8.375%, 11/15/17 | | United States | | 900,000 | | | 931,500 |
dDole Food Co. Inc., senior note, 144A, 13.875%, 3/15/14 | | United States | | 1,118,000 | | | 1,349,985 |
dJBS USA LLC, senior note, 144A, 11.625%, 5/01/14 | | United States | | 2,100,000 | | | 2,409,750 |
dPinnacle Foods Finance LLC, senior note, 144A, 9.25%, 4/01/15 | | United States | | 1,300,000 | | | 1,326,000 |
| | | | | | | |
| | | | | | | 7,681,235 |
| | | | | | | |
Health Care Equipment & Services 7.8% | | | | | | | |
DaVita Inc., senior sub. note, 7.25%, 3/15/15 | | United States | | 2,000,000 | | | 2,015,000 |
FMC Finance III SA, senior note, 6.875%, 7/15/17 | | Germany | | 2,200,000 | | | 2,194,500 |
dFresenius US Finance II, senior note, 144A, 9.00%, 7/15/15 | | Germany | | 1,000,000 | | | 1,105,000 |
HCA Inc., senior secured note,
9.125%, 11/15/14 | | United States | | 4,000,000 | | | 4,230,000 |
d144A, 7.875%, 2/15/20 | | United States | | 1,500,000 | | | 1,565,625 |
Tenet Healthcare Corp., senior note, 7.375%, 2/01/13 | | United States | | 2,400,000 | | | 2,418,000 |
hUnited Surgical Partners International Inc., senior sub. note, PIK, 9.25%, 5/01/17 | | United States | | 2,300,000 | | | 2,357,500 |
b,hUS Oncology Holdings Inc., senior note, PIK, FRN, 6.428%, 3/15/12 | | United States | | 2,688,000 | | | 2,526,720 |
Vanguard Health Holding Co. II LLC, senior sub. note, 9.00%, 10/01/14 | | United States | | 2,000,000 | | | 2,082,500 |
| | | | | | | |
| | | | | | | 20,494,845 |
| | | | | | | |
Materials 10.4% | | | | | | | |
Ball Corp., senior note,
7.125%, 9/01/16 | | United States | | 2,200,000 | | | 2,266,000 |
7.375%, 9/01/19 | | United States | | 300,000 | | | 309,750 |
dClearwater Paper Corp., senior note, 144A, 10.625%, 6/15/16 | | United States | | 1,900,000 | | | 2,130,375 |
Crown Americas Inc., senior note, 7.75%, 11/15/15 | | United States | | 1,900,000 | | | 1,976,000 |
Freeport-McMoRan Copper & Gold Inc., senior note, 8.375%, 4/01/17 | | United States | | 1,700,000 | | | 1,864,052 |
Huntsman International LLC, senior sub. note, 7.875%, 11/15/14 | | United States | | 2,000,000 | | | 1,965,000 |
dIneos Group Holdings PLC, senior secured note, 144A, 8.50%, 2/15/16 | | United Kingdom | | 1,800,000 | | | 1,219,500 |
dMacDermid Inc., senior sub. note, 144A, 9.50%, 4/15/17 | | United States | | 2,200,000 | | | 2,211,000 |
Nalco Co.,
dsenior note, 144A, 8.25%, 5/15/17 | | United States | | 100,000 | | | 106,750 |
senior sub. note, 8.875%, 11/15/13 | | United States | | 1,700,000 | | | 1,759,500 |
NewPage Corp., senior secured note,
10.00%, 5/01/12 | | United States | | 500,000 | �� | | 360,000 |
d144A, 11.375%, 12/31/14 | | United States | | 1,700,000 | | | 1,725,500 |
dNovelis Inc., senior note, 144A, 11.50%, 2/15/15 | | Canada | | 700,000 | | | 753,375 |
FH-13
Franklin Templeton Variable Insurance Products Trust
Statement of Investments, December 31, 2009 (continued)
| | | | | | | |
| Franklin High Income Securities Fund | | Country | | Principal
Amounta | | Value |
Corporate Bonds (continued) | | | | | | | |
Materials (continued) | | | | | | | |
Owens-Illinois Inc., senior note, 7.80%, 5/15/18 | | United States | | 2,000,000 | | $ | 2,025,000 |
Solo Cup Co.,
dsenior secured note, 144A, 10.50%, 11/01/13 | | United States | | 400,000 | | | 425,000 |
senior sub. note, 8.50%, 2/15/14 | | United States | | 2,000,000 | | | 1,965,000 |
Solutia Inc., senior note, 8.75%, 11/01/17 | | United States | | 600,000 | | | 628,500 |
Teck Resources Ltd., senior secured note, 10.75%, 5/15/19 | | Canada | | 1,700,000 | | | 2,040,000 |
Weyerhaeuser Co., senior note, 7.375%, 10/01/19 | | United States | | 1,400,000 | | | 1,465,563 |
| | | | | | | |
| | | | | | | 27,195,865 |
| | | | | | | |
Media 10.9% | | | | | | | |
Cablevision Systems Corp., senior note,
d144A, 8.625%, 9/15/17 | | United States | | 1,000,000 | | | 1,046,250 |
B, 8.00%, 4/15/12 | | United States | | 700,000 | | | 743,750 |
dCCH II LLC/CCH II Capital Corp., senior note, 144A, 13.50%, 11/30/16 | | United States | | 2,566,823 | | | 3,009,600 |
dClear Channel Worldwide Holdings Inc., senior note,
A, 144A, 9.25%, 12/15/17 | | United States | | 300,000 | | | 307,500 |
B, 144A, 9.25%, 12/15/17 | | United States | | 1,100,000 | | | 1,138,500 |
dCSC Holdings Inc., senior note, 144A, 8.50%, 4/15/14 | | United States | | 500,000 | | | 535,000 |
f,iDex Media Inc.,
senior disc. note, 9.00%, 11/15/13 | | United States | | 700,000 | | | 180,250 |
senior note, B, 8.00%, 11/15/13 | | United States | | 2,300,000 | | | 592,250 |
DIRECTV Holdings LLC, senior note, 7.625%, 5/15/16 | | United States | | 1,800,000 | | | 1,969,011 |
EchoStar DBS Corp., senior note, 7.125%, 2/01/16 | | United States | | 2,500,000 | | | 2,565,625 |
Lamar Media Corp., senior sub. note, 7.25%, 1/01/13 | | United States | | 2,000,000 | | | 2,005,000 |
Liberty Media Corp., senior note, 5.70%, 5/15/13 | | United States | | 2,000,000 | | | 1,915,000 |
LIN Television Corp., senior sub. note, 6.50%, 5/15/13 | | United States | | 2,000,000 | | | 1,940,000 |
Quebecor Media Inc., senior note, 7.75%, 3/15/16 | | Canada | | 2,000,000 | | | 2,005,000 |
iRadio One Inc., senior sub. note, 6.375%, 2/15/13 | | United States | | 2,000,000 | | | 1,477,500 |
dSinclair Television Group Inc., senior secured note, 144A, 9.25%, 11/01/17 | | United States | | 2,000,000 | | | 2,090,000 |
d,hUnivision Communications Inc., senior note, 144A, PIK, 10.50%, 3/15/15 | | United States | | 315,750 | | | 278,255 |
dUPC Germany GmbH, senior secured bond, 144A, 8.125%, 12/01/17 | | Germany | | 1,500,000 | | | 1,522,500 |
dUPC Holding BV, senior note, 144A, 9.875%, 4/15/18 | | Netherlands | | 1,500,000 | | | 1,535,475 |
dWMG Acquisition Corp., senior secured note, 144A, 9.50%, 6/15/16 | | United States | | 1,600,000 | | | 1,722,000 |
| | | | | | | |
| | | | | | | 28,578,466 |
| | | | | | | |
Pharmaceuticals, Biotechnology & Life Sciences 0.6% | | | | | | | |
dTalecris Biotherapeutics Holdings Corp., senior note, 144A, 7.75%, 11/15/16 | | United States | | 1,500,000 | | | 1,530,000 |
| | | | | | | |
Real Estate 1.7% | | | | | | | |
dFelCor Lodging Trust Inc., senior secured note, 144A, 10.00%, 10/01/14 | | United States | | 2,300,000 | | | 2,331,625 |
Forest City Enterprises Inc., senior note,
7.625%, 6/01/15 | | United States | | 2,000,000 | | | 1,800,000 |
6.50%, 2/01/17 | | United States | | 300,000 | | | 229,500 |
| | | | | | | |
| | | | | | | 4,361,125 |
| | | | | | | |
Retailing 1.5% | | | | | | | |
Dollar General Corp., senior note, 10.625%, 7/15/15 | | United States | | 1,622,000 | | | 1,804,475 |
Michaels Stores Inc., senior note, 10.00%, 11/01/14 | | United States | | 2,200,000 | | | 2,288,000 |
| | | | | | | |
| | | | | | | 4,092,475 |
| | | | | | | |
Semiconductors & Semiconductor Equipment 1.1% | | | | | | | |
dAdvanced Micro Devices Inc., senior note, 144A, 8.125%, 12/15/17 | | United States | | 500,000 | | | 500,625 |
Freescale Semiconductor Inc., senior note, 8.875%, 12/15/14 | | United States | | 2,500,000 | | | 2,306,250 |
| | | | | | | |
| | | | | | | 2,806,875 |
| | | | | | | |
FH-14
Franklin Templeton Variable Insurance Products Trust
Statement of Investments, December 31, 2009 (continued)
| | | | | | | |
| Franklin High Income Securities Fund | | Country | | Principal
Amounta | | Value |
Corporate Bonds (continued) | | | | | | | |
Software & Services 1.4% | | | | | | | |
First Data Corp., senior note, 9.875%, 9/24/15 | | United States | | 1,100,000 | | $ | 1,031,250 |
SunGard Data Systems Inc., senior sub. note, 10.25%, 8/15/15 | | United States | | 2,600,000 | | | 2,782,000 |
| | | | | | | |
| | | | | | | 3,813,250 |
| | | | | | | |
Technology Hardware & Equipment 1.5% | | | | | | | |
Jabil Circuit Inc., senior note, 7.75%, 7/15/16 | | United States | | 1,200,000 | | | 1,266,000 |
Sanmina-SCI Corp.,
b,dsenior note, 144A, FRN, 3.004%, 6/15/14 | | United States | | 1,000,000 | | | 922,500 |
senior sub. note, 6.75%, 3/01/13 | | United States | | 1,200,000 | | | 1,189,500 |
dViaSat Inc., senior note, 144A, 8.875%, 9/15/16 | | United States | | 500,000 | | | 525,000 |
| | | | | | | |
| | | | | | | 3,903,000 |
| | | | | | | |
Telecommunication Services 8.3% | | | | | | | |
dCC Holdings GS V LLC, senior secured note, 144A, 7.75%, 5/01/17 | | United States | | 200,000 | | | 214,000 |
Crown Castle International Corp.,
senior bond, 7.125%, 11/01/19 | | United States | | 100,000 | | | 99,500 |
senior note, 9.00%, 1/15/15 | | United States | | 2,000,000 | | | 2,140,000 |
dDigicel Group Ltd., senior note, 144A, 8.875%, 1/15/15 | | Jamaica | | 2,000,000 | | | 1,967,500 |
Intelsat Subsidiary Holding Co. Ltd., senior note,
8.50%, 1/15/13 | | Bermuda | | 2,000,000 | | | 2,050,000 |
d144A, 8.875%, 1/15/15 | | Bermuda | | 1,000,000 | | | 1,035,000 |
MetroPCS Wireless Inc., senior note, 9.25%, 11/01/14 | | United States | | 2,500,000 | | | 2,543,750 |
Millicom International Cellular SA, senior note, 10.00%, 12/01/13 | | Luxembourg | | 2,200,000 | | | 2,288,000 |
Qwest Communications International Inc., senior note, B, 7.50%, 2/15/14 | | United States | | 2,200,000 | | | 2,219,250 |
Qwest Corp., senior note, 8.375%, 5/01/16 | | United States | | 1,800,000 | | | 1,939,500 |
dSBA Telecommunications Inc., senior note, 144A, 8.25%, 8/15/19 | | United States | | 800,000 | | | 852,000 |
Sprint Nextel Corp., senior note, 8.375%, 8/15/17 | | United States | | 1,500,000 | | | 1,537,500 |
dWind Acquisition Finance SA, senior note, 144A, 10.75%, 12/01/15 | | Italy | | 2,025,000 | | | 2,176,875 |
dWindstream Corp., senior note, 144A, 7.875%, 11/01/17 | | United States | | 700,000 | | | 694,750 |
| | | | | | | |
| | | | | | | 21,757,625 |
| | | | | | | |
Transportation 1.5% | | | | | | | |
dCeva Group PLC, senior secured note, 144A,
10.00%, 9/01/14 | | United Kingdom | | 2,000,000 | | | 1,880,979 |
11.625%, 10/01/16 | | United Kingdom | | 200,000 | | | 206,250 |
dDelta Air Lines Inc., senior secured note, 144A, 9.50%, 9/15/14 | | United States | | 1,700,000 | | | 1,776,500 |
| | | | | | | |
| | | | | | | 3,863,729 |
| | | | | | | |
Utilities 7.5% | | | | | | | |
The AES Corp., senior note, 8.00%, 10/15/17 | | United States | | 2,000,000 | | | 2,062,500 |
Ameren Corp., senior note, 8.875%, 5/15/14 | | United States | | 1,900,000 | | | 2,136,073 |
CMS Energy Corp., senior note, 8.75%, 6/15/19 | | United States | | 2,000,000 | | | 2,199,084 |
Dynegy Holdings Inc., senior note, 8.375%, 5/01/16 | | United States | | 1,000,000 | | | 955,000 |
Edison Mission Energy, senior note, 7.00%, 5/15/17 | | United States | | 2,300,000 | | | 1,828,500 |
dIntergen NV, senior secured note, 144A, 9.00%, 6/30/17 | | Netherlands | | 2,000,000 | | | 2,095,000 |
Mirant North America LLC, senior note, 7.375%, 12/31/13 | | United States | | 1,900,000 | | | 1,888,125 |
NRG Energy Inc., senior note,
7.25%, 2/01/14 | | United States | | 700,000 | | | 710,500 |
7.375%, 2/01/16 | | United States | | 2,600,000 | | | 2,609,750 |
Texas Competitive Electric Holdings Co. LLC, senior note, A, 10.25%, 11/01/15 | | United States | | 4,000,000 | | | 3,260,000 |
| | | | | | | |
| | | | | | | 19,744,532 |
| | | | | | | |
Total Corporate Bonds (Cost $240,230,309) | | | | | | | 245,961,526 |
| | | | | | | |
FH-15
Franklin Templeton Variable Insurance Products Trust
Statement of Investments, December 31, 2009 (continued)
| | | | | | | |
| Franklin High Income Securities Fund | | Country | | Shares | | Value |
Preferred Stocks (Cost $214,420) 0.2% | | | | | | | |
Diversified Financials 0.2% | | | | | | | |
dGMAC Inc., 7.00%, pfd., 144A | | United States | | 604 | | $ | 398,150 |
| | | | | | | |
Total Investments before Short Term Investments
(Cost $244,815,170) | | | | | | | 250,688,310 |
| | | | | | | |
| | | |
| | | | | Principal
Amounta | | |
Short Term Investments (Cost $7,453,841) 2.8% | | | | | | | |
Repurchase Agreements 2.8% | | | | | | | |
jJoint Repurchase Agreement, 0.003%, 1/04/10 (Maturity Value $7,453,844) | | United States | | 7,453,841 | | | 7,453,841 |
Banc of America Securities LLC (Maturity Value $875,752) BNP Paribas Securities Corp. (Maturity Value $1,751,429) Credit Suisse Securities (USA) LLC (Maturity Value $1,459,612) Deutsche Bank Securities Inc. (Maturity Value $447,901) HSBC Securities (USA) Inc. (Maturity Value $1,459,612) Morgan Stanley & Co. Inc. (Maturity Value $1,167,645) UBS Securities LLC (Maturity Value $291,893) | | | | | | | |
Collateralized by U.S. Government Agency Securities, 0.50% - 7.625%, 3/30/10 - 2/09/28; kU.S. Government Agency Discount Notes, 9/21/10; kU.S. Treasury Bills, 8/26/10 - 12/16/10; and U.S. Treasury Notes, 0.875% - 4.25%, 5/31/11 - 11/15/14 | | | | | | | |
| | | | | | | |
Total Investments (Cost $252,269,011) 98.3% | | | | | | | 258,142,151 |
Other Assets, less Liabilities 1.7% | | | | | | | 4,384,758 |
| | | | | | | |
Net Assets 100.0% | | | | | | $ | 262,526,909 |
| | | | | | | |
aThe principal amount is stated in U.S. dollars unless otherwise indicated.
bThe coupon rate shown represents the rate at period end.
cSee Note 1(e) regarding senior floating rate interests.
dSecurity was purchased pursuant to Rule 144A under the Securities Act of 1933 and may be sold in transactions exempt from registration only to qualified institutional buyers or in a public offering registered under the Securities Act of 1933. These securities have been deemed liquid under guidelines approved by the Trust’s Board of Trustees. At December 31, 2009, the aggregate value of these securities was $85,380,799, representing 32.52% of net assets.
ePerpetual security with no stated maturity date.
fSee Note 7 regarding defaulted securities.
gSecurity has been deemed illiquid because it may not be able to be sold within seven days. At December 31, 2009, the value of this security was $191, representing less than 0.01% of net assets.
hIncome may be received in additional securities and/or cash.
iSee Note 9 regarding other considerations.
jSee Note 1(c) regarding joint repurchase agreement.
kThe security is traded on a discount basis with no stated coupon rate.
The accompanying notes are an integral part of these financial statements.
FH-16
Franklin Templeton Variable Insurance Products Trust
Statement of Investments, December 31, 2009 (continued)
| | | | | | |
| Franklin High Income Securities Fund | | | | | | |
At December 31, 2009, the Fund had the following forward exchange contracts outstanding. See Note 1(d).
| | | | | | | | | | | | | | | | | |
| Currency | | Counterparty | | Type | | Quantity | | Contract
Amount* | | Settlement
Date | | Unrealized
Appreciation | | Unrealized
Depreciation |
Euro | | DBAB | | Sell | | 389,500 | | $ | 567,852 | | 12/15/10 | | $ | 11,214 | | $ | — |
*In U.S. dollars unless otherwise indicated.
See Abbreviations on page FH-30.
FH-17
Franklin Templeton Variable Insurance Products Trust
Financial Statements
Statement of Assets and Liabilities
December 31, 2009
| | | | |
| | | Franklin High
Income
Securities Fund | |
Assets: | | | | |
Investments in securities: | | | | |
Cost - Unaffiliated issuers | | $ | 244,815,170 | |
Cost - Repurchase agreements | | | 7,453,841 | |
| | | | |
Total cost of investments | | $ | 252,269,011 | |
| | | | |
Value - Unaffiliated issuers | | $ | 250,688,310 | |
Value - Repurchase agreements | | | 7,453,841 | |
| | | | |
Total value of investments | | | 258,142,151 | |
Cash | | | 10,622 | |
Receivables: | | | | |
Investment securities sold | | | 4,331 | |
Capital shares sold | | | 241,458 | |
Interest | | | 4,468,305 | |
Unrealized appreciation on forward exchange contracts | | | 11,214 | |
Other assets | | | 19 | |
| | | | |
Total assets | | | 262,878,100 | |
| | | | |
Liabilities: | | | | |
Payables: | | | | |
Capital shares redeemed | | | 40,531 | |
Affiliates | | | 208,031 | |
Reports to shareholders | | | 65,850 | |
Professional fees | | | 30,806 | |
Accrued expenses and other liabilities | | | 5,973 | |
| | | | |
Total liabilities | | | 351,191 | |
| | | | |
Net assets, at value | | $ | 262,526,909 | |
| | | | |
Net assets consist of: | | | | |
Paid-in capital | | $ | 350,491,444 | |
Undistributed net investment income | | | 15,889,751 | |
Net unrealized appreciation (depreciation) | | | 5,884,351 | |
Accumulated net realized gain (loss) | | | (109,738,637 | ) |
| | | | |
Net assets, at value | | $ | 262,526,909 | |
| | | | |
The accompanying notes are an integral part of these financial statements.
FH-18
Franklin Templeton Variable Insurance Products Trust
Financial Statements (continued)
Statement of Assets and Liabilities (continued)
December 31, 2009
| | | |
| | | Franklin High
Income
Securities Fund |
Class 1: | | | |
Net assets, at value | | $ | 48,855,037 |
| | | |
Shares outstanding | | | 7,802,944 |
| | | |
Net asset value and maximum offering price per share | | $ | 6.26 |
| | | |
Class 2: | | | |
Net assets, at value | | $ | 198,567,304 |
| | | |
Shares outstanding | | | 32,405,636 |
| | | |
Net asset value and maximum offering price per share | | $ | 6.13 |
| | | |
Class 4: | | | |
Net assets, at value | | $ | 15,104,568 |
| | | |
Shares outstanding | | | 2,426,704 |
| | | |
Net asset value and maximum offering price per share | | $ | 6.22 |
| | | |
The accompanying notes are an integral part of these financial statements.
FH-19
Franklin Templeton Variable Insurance Products Trust
Financial Statements (continued)
Statement of Operations
for the year ended December 31, 2009
| | | | |
| | | Franklin High
Income
Securities Fund | |
Investment income: | | | | |
Dividends | | $ | 37,653 | |
Interest | | | 18,080,767 | |
| | | | |
Total investment income | | | 18,118,420 | |
| | | | |
Expenses: | | | | |
Management fees (Note 3a) | | | 1,133,912 | |
Distribution fees: (Note 3c) | | | | |
Class 2 | | | 376,283 | |
Class 4 | | | 27,409 | |
Unaffiliated transfer agent fees | | | 632 | |
Custodian fees (Note 4) | | | 2,734 | |
Reports to shareholders | | | 72,450 | |
Professional fees | | | 40,484 | |
Trustees’ fees and expenses | | | 1,160 | |
Other | | | 19,650 | |
| | | | |
Total expenses | | | 1,674,714 | |
Expense reductions (Note 4) | | | (20 | ) |
| | | | |
Net expenses | | | 1,674,694 | |
| | | | |
Net investment income | | | 16,443,726 | |
| | | | |
Realized and unrealized gains (losses): | | | | |
Net realized gain (loss) from: | | | | |
Investments | | | (6,279,892 | ) |
Foreign currency transactions | | | 5,511 | |
| | | | |
Net realized gain (loss) | | | (6,274,381 | ) |
| | | | |
Net change in unrealized appreciation (depreciation) on: | | | | |
Investments | | | 60,030,935 | |
Translation of other assets and liabilities denominated in foreign currencies | | | 11,211 | |
| | | | |
Net change in unrealized appreciation (depreciation) | | | 60,042,146 | |
| | | | |
Net realized and unrealized gain (loss) | | | 53,767,765 | |
| | | | |
Net increase (decrease) in net assets resulting from operations | | $ | 70,211,491 | |
| | | | |
The accompanying notes are an integral part of these financial statements.
FH-20
Franklin Templeton Variable Insurance Products Trust
Financial Statements (continued)
Statements of Changes in Net Assets
| | | | | | | | |
| | | Franklin High Income
Securities Fund | |
| | | Year Ended December 31, | |
| | | 2009 | | | 2008 | |
| | | | |
Increase (decrease) in net assets: | | | | | | | | |
Operations: | | | | | | | | |
Net investment income | | $ | 16,443,726 | | | $ | 14,147,619 | |
Net realized gain (loss) from investments and foreign currency transactions | | | (6,274,381 | ) | | | (12,094,569 | ) |
Net change in unrealized appreciation (depreciation) on investments and translation of other assets and liabilities denominated in foreign currencies | | | 60,042,146 | | | | (44,020,341 | ) |
| | | | |
Net increase (decrease) in net assets resulting from operations | | | 70,211,491 | | | | (41,967,291 | ) |
| | | | |
Distributions to shareholders from net investment income: | | | | | | | | |
Class 1 | | | (2,944,930 | ) | | | (5,331,940 | ) |
Class 2 | | | (10,742,997 | ) | | | (12,613,674 | ) |
Class 4 | | | (471,677 | ) | | | (40,112 | ) |
| | | | |
Total distributions to shareholders | | | (14,159,604 | ) | | | (17,985,726 | ) |
| | | | |
Capital share transactions: (Note 2) | | | | | | | | |
Class 1 | | | (2,028,103 | ) | | | (5,364,101 | ) |
Class 2 | | | 72,968,916 | | | | (29,589,130 | ) |
Class 4 | | | 10,669,989 | | | | 2,707,846 | |
| | | | |
Total capital share transactions | | | 81,610,802 | | | | (32,245,385 | ) |
| | | | |
Net increase (decrease) in net assets | | | 137,662,689 | | | | (92,198,402 | ) |
Net assets: | | | | | | | | |
Beginning of year | | | 124,864,220 | | | | 217,062,622 | |
| | | | |
End of year | | $ | 262,526,909 | | | $ | 124,864,220 | |
| | | | |
Undistributed net investment income included in net assets: | | | | | | | | |
End of year | | $ | 15,889,751 | | | $ | 13,449,168 | |
| | | | |
The accompanying notes are an integral part of these financial statements.
FH-21
Franklin Templeton Variable Insurance Products Trust
Notes to Financial Statements
Franklin High Income Securities Fund
1. ORGANIZATION AND SIGNIFICANT ACCOUNTING POLICIES
Franklin Templeton Variable Insurance Products Trust (Trust) is registered under the Investment Company Act of 1940, as amended, (1940 Act) as an open-end investment company, consisting of twenty-two separate funds. The Franklin High Income Securities Fund (Fund) is included in this report. The financial statements of the remaining funds in the Trust are presented separately. Shares of the Fund are generally sold only to insurance company separate accounts to fund the benefits of variable life insurance policies or variable annuity contracts. At December 31, 2009, 85.48% of the Fund’s shares were held through one insurance company. The Fund offers three classes of shares: Class 1, Class 2, and Class 4. Each class of shares differs by its distribution fees, voting rights on matters affecting a single class and its exchange privilege.
The following summarizes the Fund’s significant accounting policies.
a. Security Valuation
Equity and other securities listed on a securities exchange or on the NASDAQ National Market System are valued at the last quoted sale price or the official closing price of the day, respectively. Over-the-counter securities and listed securities for which there is no reported sale are valued within the range of the most recent quoted bid and ask prices. Securities that trade in multiple markets or on multiple exchanges are valued according to the broadest and most representative market. Certain equity securities are valued based upon fundamental characteristics or relationships to similar securities.
Corporate debt securities generally trade in the over-the-counter market rather than on a securities exchange. The Fund may utilize independent pricing services, quotations from bond dealers, and information with respect to bond and note transactions, to assist in determining a current market value for each security. The Fund’s pricing services may use valuation models or matrix pricing which considers information with respect to comparable bond and note transactions, quotations from bond dealers, or by reference to other securities that are considered comparable in such characteristics as rating, interest rate and maturity date, option adjusted spread models, prepayment projections, interest rate spreads and yield curves, to determine current value. Debt securities denominated in a foreign currency are converted into their U.S. dollar equivalent at the foreign exchange rate in effect at the close of the NYSE on the date that the values of the foreign debt securities are determined.
Senior secured corporate loans with floating or variable interest rates generally trade in the over-the-counter market rather than on a securities exchange. The Fund may utilize independent pricing services, quotations from loan dealers and other financial institutions, and information with respect to bond and note transactions, to assist in determining a current market value for each security. The Fund’s pricing services use independent market quotations from loan dealers or financial institutions and may incorporate valuation methodologies that consider multiple bond characteristics such as dealer quotes, issuer type, coupon, maturity, weighted average maturity, interest rate spreads and yield curves, cash flow and credit risk/quality analysis, to determine current value.
The Fund has procedures to determine the fair value of individual securities and other assets for which market prices are not readily available or which may not be reliably priced. Methods for valuing these securities may include: fundamental analysis based upon the underlying investment book value, anticipated future cash flows, market changes in comparable or similar securities, matrix pricing, discounts from market prices of similar securities, or discounts applied due to the nature and duration of restrictions on the disposition of the securities. Due to the inherent uncertainty of valuations of such securities, the fair values may differ significantly from the values that would have been used had a ready market for such investments existed. Occasionally, events occur between the time at which trading in a security is completed and the close of the NYSE that might call into question the availability (including the reliability) of the value of a portfolio security held by the Fund. If such an event occurs, the securities may be valued using fair value procedures, which may include the use of independent pricing services. All security valuation procedures are approved by the Fund’s Board of Trustees.
FH-22
Franklin Templeton Variable Insurance Products Trust
Notes to Financial Statements (continued)
Franklin High Income Securities Fund
1. ORGANIZATION AND SIGNIFICANT ACCOUNTING POLICIES (continued)
b. Foreign Currency Translation
Portfolio securities and other assets and liabilities denominated in foreign currencies are translated into U.S. dollars based on the exchange rate of such currencies against U.S. dollars on the date of valuation. The Fund may enter into foreign currency exchange contracts to facilitate transactions denominated in a foreign currency. Purchases and sales of securities, income and expense items denominated in foreign currencies are translated into U.S. dollars at the exchange rate in effect on the transaction date. Occasionally, events may impact the availability or reliability of foreign exchange rates used to convert the U.S. dollar equivalent value. If such an event occurs, the foreign exchange rate will be valued at fair value using procedures established and approved by the Fund’s Board of Trustees.
The Fund does not separately report the effect of changes in foreign exchange rates from changes in market prices on securities held. Such changes are included in net realized and unrealized gain or loss from investments on the Statement of Operations.
Realized foreign exchange gains or losses arise from sales of foreign currencies, currency gains or losses realized between the trade and settlement dates on securities transactions and the difference between the recorded amounts of dividends, interest, and foreign withholding taxes and the U.S. dollar equivalent of the amounts actually received or paid. Net unrealized foreign exchange gains and losses arise from changes in foreign exchange rates on foreign denominated assets and liabilities other than investments in securities held at the end of the reporting period.
c. Joint Repurchase Agreement
The Fund may enter into a joint repurchase agreement whereby its uninvested cash balance is deposited into a joint cash account with other funds managed by the investment manager or an affiliate of the investment manager and is used to invest in one or more repurchase agreements. The value and face amount of the joint repurchase agreement are allocated to the funds based on their pro-rata interest. A repurchase agreement is accounted for as a loan by the Fund to the seller, collateralized by securities which are delivered to the Fund’s custodian. The market value, including accrued interest, of the initial collateralization is required to be at least 102% of the dollar amount invested by the funds, with the value of the underlying securities marked to market daily to maintain coverage of at least 100%. The joint repurchase agreement held by the Fund at year end had been entered into on December 31, 2009. The joint repurchase agreement is valued at cost which approximates market value.
d. Derivative Financial Instruments
The Fund may invest in derivative financial instruments (derivatives) in order to manage risk or gain exposure to various other investments or markets. Derivatives are financial contracts based on an underlying or notional amount, require no initial investment or an initial net investment that is smaller than would normally be required to have a similar response to changes in market factors, and require or permit net settlement. Derivatives may contain various risks including the potential inability of the counterparty to fulfill their obligations under the terms of the contract, the potential for an illiquid secondary market, and the potential for market movements which may expose the Fund to gains or losses in excess of the amounts shown on the Statement of Assets and Liabilities.
Derivatives are marked to market daily based upon quotations from market makers or the Fund’s independent pricing services and the Fund’s net benefit or obligation under the contract, as measured by the fair market value of the contract, is included in net assets. Realized gain and loss and unrealized appreciation and depreciation on these contracts for the period are included in the Statement of Operations.
The Fund generally enters into forward exchange contracts in order to hedge against fluctuations in foreign exchange rates or to gain exposure to certain foreign currencies. A forward exchange contract is an agreement between the Fund and a counterparty to buy or sell a foreign currency for a specific exchange rate on a future date. Pursuant to the terms of the forward exchange contracts, cash or securities may be required to be deposited as collateral.
See Note 8 regarding other derivative information.
FH-23
Franklin Templeton Variable Insurance Products Trust
Notes to Financial Statements (continued)
Franklin High Income Securities Fund
1. ORGANIZATION AND SIGNIFICANT ACCOUNTING POLICIES (continued)
e. Senior Floating Rate Interests
Senior secured corporate loans pay interest at rates which are periodically reset by reference to a base lending rate plus a spread. These base lending rates are generally the prime rate offered by a designated U.S. bank or the London InterBank Offered Rate (LIBOR). Senior secured corporate loans often require prepayment of principal from excess cash flows or at the discretion of the borrower. As a result, actual maturity may be substantially less than the stated maturity.
Senior secured corporate loans in which the Fund invests are generally readily marketable, but may be subject to some restrictions on resale.
f. Income Taxes
No provision has been made for U.S. income taxes because it is the Fund’s policy to qualify as a regulated investment company under the Internal Revenue Code and to distribute to shareholders substantially all of its taxable income and net realized gains.
The Fund has reviewed the tax positions, taken on federal income tax returns, for each of the three open tax years and as of December 31, 2009, and has determined that no provision for income tax is required in the Fund’s financial statements.
g. Security Transactions, Investment Income, Expenses and Distributions
Security transactions are accounted for on trade date. Realized gains and losses on security transactions are determined on a specific identification basis. Interest income and estimated expenses are accrued daily. Amortization of premium and accretion of discount on debt securities are included in interest income. Facility fees are recognized as income over the expected term of the loan. Dividend income is recorded on the ex-dividend date. Distributions to shareholders are recorded on the ex-dividend date and are determined according to income tax regulations (tax basis). Distributable earnings determined on a tax basis may differ from earnings recorded in accordance with accounting principles generally accepted in the United States of America. These differences may be permanent or temporary. Permanent differences are reclassified among capital accounts to reflect their tax character. These reclassifications have no impact on net assets or the results of operations. Temporary differences are not reclassified, as they may reverse in subsequent periods.
Common expenses incurred by the Trust are allocated among the funds based on the ratio of net assets of each fund to the combined net assets of the Trust. Fund specific expenses are charged directly to the fund that incurred the expense.
Realized and unrealized gains and losses and net investment income, not including class specific expenses, are allocated daily to each class of shares based upon the relative proportion of net assets of each class. Differences in per share distributions, by class, are generally due to differences in class specific expenses.
h. Accounting Estimates
The preparation of financial statements in accordance with accounting principles generally accepted in the United States of America requires management to make estimates and assumptions that affect the reported amounts of assets and liabilities at the date of the financial statements and the amounts of income and expenses during the reporting period. Actual results could differ from those estimates.
i. Guarantees and Indemnifications
Under the Trust’s organizational documents, its officers and trustees are indemnified by the Trust against certain liabilities arising out of the performance of their duties to the Trust. Additionally, in the normal course of business, the Trust, on behalf of the Fund, enters into contracts with service providers that contain general indemnification clauses. The Trust’s maximum exposure under these arrangements is unknown as this would involve future claims that may be made against the Trust that have not yet occurred. Currently, the Trust expects the risk of loss to be remote.
FH-24
Franklin Templeton Variable Insurance Products Trust
Notes to Financial Statements (continued)
Franklin High Income Securities Fund
2. SHARES OF BENEFICIAL INTEREST
At December 31, 2009, there were an unlimited number of shares authorized (without par value). Transactions in the Fund’s shares were as follows:
| | | | | | | | | | | | | | |
| | | Year Ended December 31, | |
| | | 2009 | | | 2008a | |
| Class 1 Shares: | | Shares | | | Amount | | | Shares | | | Amount | |
Shares sold | | 682,625 | | | $ | 3,526,494 | | | 714,258 | | | $ | 4,273,846 | |
Shares issued in reinvestment of distributions | | 549,427 | | | | 2,944,930 | | | 864,172 | | | | 5,331,940 | |
Shares redeemed | | (1,598,576 | ) | | | (8,499,527 | ) | | (2,530,790 | ) | | | (14,969,887 | ) |
| | | | |
Net increase (decrease) | | (366,524 | ) | | $ | (2,028,103 | ) | | (952,360 | ) | | $ | (5,364,101 | ) |
| | | | |
Class 2 Shares: | | | | | | | | | | | | | | |
Shares sold | | 22,446,477 | | | $ | 116,193,323 | | | 4,825,096 | | | $ | 27,974,845 | |
Shares issued in reinvestment of distributions | | 2,046,285 | | | | 10,742,997 | | | 2,081,464 | | | | 12,613,674 | |
Shares redeemed | | (10,479,398 | ) | | | (53,967,404 | ) | | (12,129,167 | ) | | | (70,177,649 | ) |
| | | | |
Net increase (decrease) | | 14,013,364 | | | $ | 72,968,916 | | | (5,222,607 | ) | | $ | (29,589,130 | ) |
| | | | |
Class 4 Shares: | | | | | | | | | | | | | | |
Shares sold | | 1,889,708 | | | $ | 10,380,779 | | | 481,696 | | | $ | 2,702,636 | |
Shares issued on reinvestment of distributions | | 88,329 | | | | 471,677 | | | 6,424 | | | | 39,636 | |
Shares redeemed | | (32,164 | ) | | | (182,467 | ) | | (7,289 | ) | | | (34,426 | ) |
| | | | |
Net increase (decrease) | | 1,945,873 | | | $ | 10,669,989 | | | 480,831 | | | $ | 2,707,846 | |
| | | | |
| aFor | the period February 29, 2008 (effective date) to December 31, 2008 for Class 4. |
3. TRANSACTIONS WITH AFFILIATES
Franklin Resources, Inc. is the holding company for various subsidiaries that together are referred to as Franklin Templeton Investments. Certain officers and trustees of the Trust are also officers and/or directors of the following subsidiaries:
| | |
| Subsidiary | | Affiliation |
Franklin Advisers, Inc. (Advisers) | | Investment manager |
Franklin Templeton Services, LLC (FT Services) | | Administrative manager |
Franklin Templeton Distributors, Inc. (Distributors) | | Principal underwriter |
Franklin Templeton Investor Services, LLC (Investor Services) | | Transfer agent |
a. Management Fees
The Fund pays an investment management fee to Advisers based on the average daily net assets of the Fund as follows:
| | |
| Annualized Fee Rate | | Net Assets |
| 0.625% | | Up to and including $100 million |
| 0.500% | | over $100 million, up to and including $250 million |
| 0.450% | | over $250 million, up to and including $7.5 billion |
| 0.440% | | over $7.5 billion, up to and including $10 billion |
| 0.430% | | over $10 billion, up to and including $12.5 billion |
| 0.420% | | over $12.5 billion, up to and including $15 billion |
| 0.400% | | In excess of $15 billion |
FH-25
Franklin Templeton Variable Insurance Products Trust
Notes to Financial Statements (continued)
Franklin High Income Securities Fund
3. TRANSACTIONS WITH AFFILIATES (continued)
b. Administrative Fees
Under an agreement with Advisers, FT Services provides administrative services to the Fund. The fee is paid by Advisers based on average daily net assets, and is not an additional expense of the Fund.
c. Distribution Fees
The Fund’s Board of Trustees has adopted distribution plans for Class 2 and Class 4 shares pursuant to Rule 12b-1 under the 1940 Act. Under the Fund’s compensation distribution plans, the Fund pays Distributors for costs incurred in connection with the servicing, sale and distribution of the Fund’s shares up to 0.35% per year of its average daily net assets of each class. The Board of Trustees has agreed to limit the current rate to 0.25% per year for Class 2.
d. Transfer Agent Fees
Investor Services, under terms of an agreement, performs shareholder servicing for the Fund and is not paid by the Fund for the services.
4. EXPENSE OFFSET ARRANGEMENT
The Fund has entered into an arrangement with its custodian whereby credits realized as a result of uninvested cash balances are used to reduce a portion of the Fund’s custodian expenses. During the year ended December 31, 2009, the custodian fees were reduced as noted in the Statement of Operations.
5. INCOME TAXES
For tax purposes, capital losses may be carried over to offset future capital gains, if any. At December 31, 2009, the capital loss carryforwards were as follows:
| | | |
Capital loss carryforwards expiring in: | | | |
2010 | | $ | 46,366,314 |
2011 | | | 24,711,916 |
2012 | | | 9,009,590 |
2013 | | | 6,321,190 |
2014 | | | 40,420 |
2015 | | | 4,493,289 |
2016 | | | 8,150,741 |
2017 | | | 10,612,332 |
| | | |
| | $ | 109,705,792 |
| | | |
On December 31, 2009, the Fund had expired capital loss carryforwards of $14,152,532, which were reclassified to paid-in capital.
The tax character of distributions paid during the years ended December 31, 2009 and 2008 was as follows:
| | | | | | |
| | | 2009 | | 2008 |
| | | |
Distributions paid from ordinary income | | $ | 14,159,604 | | $ | 17,985,726 |
| | | |
FH-26
Franklin Templeton Variable Insurance Products Trust
Notes to Financial Statements (continued)
Franklin High Income Securities Fund
5. INCOME TAXES (continued)
At December 31, 2009, the cost of investments, net unrealized appreciation (depreciation), and undistributed ordinary income for income tax purposes were as follows:
| | | | |
Cost of investments | | $ | 252,975,447 | |
| | | | |
| |
Unrealized appreciation | | $ | 14,818,571 | |
Unrealized depreciation | | | (9,651,867 | ) |
| | | | |
Net unrealized appreciation (depreciation) | | $ | 5,166,704 | |
| | | | |
Distributable earnings – undistributed ordinary income | | $ | 16,914,159 | |
| | | | |
Net investment income (loss) differs for financial statement and tax purposes primarily due to differing treatments of defaulted securities, foreign currency transactions, payments-in-kind, and bond discounts and premiums.
Net realized gains (losses) differ for financial statement and tax purposes primarily due to differing treatments of wash sales, foreign currency transactions, payments-in-kind, and bond discounts and premiums.
6. INVESTMENT TRANSACTIONS
Purchases and sales of investments (excluding short term securities) for the year ended December 31, 2009, aggregated $134,724,489 and $49,397,783, respectively.
7. CREDIT RISK AND DEFAULTED SECURITIES
At December 31, 2009, the Fund had 90.45% of its portfolio invested in high yield, senior secured floating rate notes, or other securities rated below investment grade. These securities may be more sensitive to economic conditions causing greater price volatility and are potentially subject to a greater risk of loss due to default than higher rated securities.
The Fund held defaulted securities and/or other securities for which the income has been deemed uncollectible. At December 31, 2009, the aggregate value of these securities was $1,477,316 representing 0.56% of the Fund’s net assets. The Fund discontinues accruing income on securities for which income has been deemed uncollectible and provides an estimate for losses on interest receivable. The securities have been identified on the accompanying Statement of Investments.
8. OTHER DERIVATIVE INFORMATION
At December 31, 2009, the Fund has invested in derivative contracts which are reflected on the Statement of Assets and Liabilities as follows:
| | | | | | | | | | |
| | | Asset Derivatives | | Liability Derivatives |
Derivative Contracts Not Accounted
for as Hedging Instruments | | Statement of Assets and
Liabilities Location | | Fair
Value
Amount | | Statement of Assets and
Liabilities Location | | Fair
Value
Amount |
Foreign exchange contracts | | Unrealized appreciation on forward exchange contracts | | $ | 11,214 | | Unrealized depreciation on forward exchange contracts | | $ | — |
FH-27
Franklin Templeton Variable Insurance Products Trust
Notes to Financial Statements (continued)
Franklin High Income Securities Fund
8. OTHER DERIVATIVE INFORMATION (continued)
For the year ended December 31, 2009, the effect of derivative contracts on the Fund’s Statement of Operations was as follows:
| | | | | | | | | | |
Derivative Contracts Not Accounted
for as Hedging Instruments | | Statement of Operations Locations | | Realized Gain
(Loss) for the
Year Ended
December 31, 2009 | | Change in
Unrealized
Appreciation
(Depreciation)
for the
Year Ended
December 31, 2009 | | Average
Notional
Amount
Outstanding
During the
Yeara |
Foreign exchange contracts | | Net realized gain (loss) from foreign currency transactions/Net change in unrealized appreciation (depreciation) on translation of other assets and liabilities denominated in foreign currencies | | $ | — | | $ | 11,214 | | 32,229 |
a Notional amount represents the U.S. dollar equivalent based on the foreign exchange rate at the time of contract entry.
See Note 1(d) regarding derivative financial instruments.
9. OTHER CONSIDERATIONS
From time to time, officers, directors or employees of the Fund’s Investment Manager may have discussions or enter into agreements with issuers, underwriters or creditors’ committees which, pursuant to the Fund’s policies and requirements of applicable securities laws, could prevent the Fund from trading in the securities of such company for limited or extended periods of time.
10. CREDIT FACILITY
The Fund, together with other U.S. registered and foreign investment funds (collectively “Borrowers”), managed by Franklin Templeton Investments, are borrowers in a joint syndicated senior unsecured credit facility totaling $725 million (Global Credit Facility) to provide a source of funds to the Borrowers for temporary and emergency purposes, including the ability to meet future unanticipated or unusually large redemption requests. Effective January 22, 2010, the Fund renewed the Global Credit Facility, for a total of $750 million, maturing January 21, 2011.
Under the terms of the Global Credit Facility, the Fund shall, in addition to interest charged on any borrowings made by the Fund and other costs incurred by the Fund, pay its share of fees and expenses incurred in connection with the implementation and maintenance of the Global Credit Facility, based upon its relative share of the aggregate net assets of all of the Borrowers, including an annual commitment fee of 0.10% based upon the unused portion of the Global Credit Facility, which is reflected in other expenses on the Statement of Operations. During the year ended December 31, 2009, the Fund did not utilize the Global Credit Facility.
11. FAIR VALUE MEASUREMENTS
The Fund follow a fair value hierarchy that distinguishes between market data obtained from independent sources (observable inputs) and the Fund’s own market assumptions (unobservable inputs). These inputs are used in determining the value of the Fund’s investments and are summarized in the following fair value hierarchy:
| | • | | Level 1 – quoted prices in active markets for identical securities |
| | • | | Level 2 – other significant observable inputs (including quoted prices for similar securities, interest rates, prepayment speed, credit risk, etc.) |
FH-28
Franklin Templeton Variable Insurance Products Trust
Notes to Financial Statements (continued)
Franklin High Income Securities Fund
11. FAIR VALUE MEASUREMENTS (continued)
| | • | | Level 3 – significant unobservable inputs (including the Fund’s own assumptions in determining the fair value of investments) |
The inputs or methodology used for valuing securities are not an indication of the risk associated with investing in those securities.
The following is a summary of the inputs used as of December 31, 2009, in valuing the Fund’s assets and liabilities carried at fair value:
| | | | | | | | | | | | |
| | | Level 1 | | Level 2 | | Level 3 | | Total |
| | | |
Assets: | | | | | | | | | | | | |
Investments in Securities | | | | | | | | | | | | |
Equity Investmentsa | | $ | — | | $ | 398,150 | | $ | — | | $ | 398,150 |
Senior Floating Rate Interests | | | — | | | 4,328,634 | | | — | | | 4,328,634 |
Corporate Bonds & Notes | | | — | | | 245,961,335 | | | 191 | | | 245,961,526 |
Short Term Investments | | | — | | | 7,453,841 | | | — | | | 7,453,841 |
| | | |
Total Investments in Securities | | $ | — | | $ | 258,141,960 | | $ | 191 | | $ | 258,142,151 |
| | | |
Forward Exchange Contracts | | | — | | | 11,214 | | | — | | | 11,214 |
aIncludes preferred stock
At December 31, 2009, the reconciliation of assets in which significant unobservable inputs (Level 3) were used in determining fair value, was as follows:
| | | | | | | | | | | | | | | | | | | | | | | | |
| | | Balance at
Beginning of
Year | | Net Realized
Gain (Loss) | | | Net Change in
Unrealized
Appreciation
(Depreciation) | | Net
Purchases
(Sales) | | | Transfer In (Out)
of Level 3 | | | Balance at End
of Year | | Net Change in
Unrealized
Appreciation
(Depreciation)
on Assets Held
at Year End |
Assets | | | | | | | | | | | | | | | | | | | | | | | | |
Equity Investments
Diversified Financials | | $ | 214,420 | | $ | — | | | $ | — | | $ | — | | | $ | (214,420 | ) | | $ | — | | $ | — |
Corporate Bonds | | | 466 | | | (2,561,864 | ) | | | 2,618,308 | | | (56,719 | ) | | | — | | | | 191 | | | — |
| | | |
Total | | $ | 214,886 | | $ | (2,561,864 | ) | | $ | 2,618,308 | | $ | (56,719 | ) | | $ | (214,420 | ) | | $ | 191 | | $ | — |
| | | |
12. NEW ACCOUNTING PRONOUNCEMENTS
In January 2010, the Financial Accounting Standards Board issued Accounting Standards Update (ASU) No. 2010-6, Fair Value Measurements and Disclosures (Topic 820): Improving Disclosures about Fair Value Measurements. ASU No. 2010-6 enhances and clarifies existing fair value measurement disclosure requirements and is effective for interim and annual periods beginning after December 15, 2009. The Fund is currently evaluating the impact, if any, of applying the provisions of ASU No. 2010-6.
FH-29
Franklin Templeton Variable Insurance Products Trust
Notes to Financial Statements (continued)
Franklin High Income Securities Fund
13. SUBSEQUENT EVENTS
The Fund has evaluated subsequent events through February 10, 2010, the issuance date of the financial statements and determined that no events have occurred that require disclosure.
ABBREVIATIONS
| | | | |
| Counterparty | | Currency | | Selected Portfolio |
| DBAB - Deutsche Bank AG | | EUR - Euro | | FRN - Floating Rate Note |
| | | | L/C - Letter of Credit |
| | | | PIK - Payment-In-Kind |
FH-30
Franklin Templeton Variable Insurance Products Trust
Franklin High Income Securities Fund
Report of Independent Registered Public Accounting Firm
To the Board of Trustees and Shareholders of Franklin Templeton Variable Insurance Products Trust
In our opinion, the accompanying statement of assets and liabilities, including the statement of investments, and the related statements of operations and of changes in net assets and the financial highlights present fairly, in all material respects, the financial position of Franklin High Income Securities Fund (one of the funds constituting the Franklin Templeton Variable Insurance Products Trust, hereafter referred to as the “Fund”) at December 31, 2009, the results of its operations for the year then ended, the changes in its net assets and the financial highlights for the period presented, in conformity with accounting principles generally accepted in the United States of America. These financial statements and financial highlights (hereafter referred to as “financial statements”) are the responsibility of the Fund’s management. Our responsibility is to express an opinion on these financial statements based on our audits. We conducted our audits of these financial statements in accordance with the standards of the Public Company Accounting Oversight Board (United States). Those standards require that we plan and perform the audit to obtain reasonable assurance about whether the financial statements are free of material misstatement. An audit includes examining, on a test basis, evidence supporting the amounts and disclosures in the financial statements, assessing the accounting principles used and significant estimates made by management, and evaluating the overall financial statement presentation. We believe that our audits, which included confirmation of securities at December 31, 2009 by correspondence with the custodian and brokers, provide a reasonable basis for our opinion.
PricewaterhouseCoopers LLP
San Francisco, California
February 10, 2010
FH-31
FRANKLIN INCOME SECURITIES FUND
We are pleased to bring you Franklin Income Securities Fund’s annual report for the fiscal year ended December 31, 2009.
Performance Summary as of 12/31/09
Average annual total return of Class 4 shares* represents the average annual change in value, assuming reinvestment of dividends and capital gains. Average returns smooth out variations in returns, which can be significant; they are not the same as year-by-year results.
Periods ended 12/31/09
| | | | | | |
| | | 1-Year | | 5-Year | | 10-Year |
Average Annual Total Return | | +35.37% | | +3.63% | | +8.06% |
*For the period beginning 2/29/08, Class 4 performance reflects a 12b-1 fee expense of 0.35% per year, which affects future performance. Class 4 performance prior to 2/29/08 reflects historical Class 1 performance, which does not include a 12b-1 fee expense. Since 2/29/08 (effective date), the average annual total return of Class 4 shares was -0.35%.
Total Return Index Comparison for a Hypothetical $10,000 Investment (1/1/00–12/31/09)
The graph below shows the change in value of a hypothetical $10,000 investment in the Fund over the indicated period and includes reinvestment of any income or distributions. The Fund’s performance* is compared to the performance of the Standard & Poor’s 500 Index (S&P 500) and the Barclays Capital (BC) U.S. Aggregate Index. One cannot invest directly in an index, and an index is not representative of the Fund’s portfolio. Please see Important Notes to Performance Information preceding the Fund Summaries.
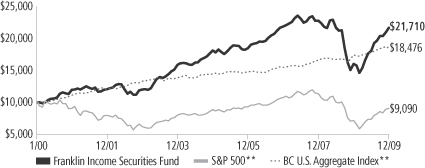
**Source: © 2009 Morningstar. Please see Index Descriptions following the Fund Summaries.
Franklin Income Securities Fund – Class 4
Performance reflects the Fund’s Class 4 operating expenses, but does not include any contract fees, expenses or sales charges. If they had been included, performance would be lower. These charges and deductions, particularly for variable life policies, can have a significant effect on contract values and insurance benefits. See the contract prospectus for a complete description of these expenses, including sales charges.
Performance data represent past performance, which does not guarantee future results. Investment return and principal value will fluctuate, and you may have a gain or loss when you sell your shares.
Current performance may differ from figures shown.
FI-1
Fund Goal and Main Investments: Franklin Income Securities Fund seeks to maximize income while maintaining prospects for capital appreciation. The Fund may invest in equity and debt securities and may invest all of its assets in below investment-grade debt securities.
Performance Overview
You can find the Fund’s one-year total return in the Performance Summary. The Fund outperformed its equity benchmark, the S&P 500, which had a +26.46% total return, and also outperformed its fixed income benchmark, the BC U.S. Aggregate Index, which had a +5.93% total return for the same period.1
Economic and Market Overview
The U.S. economy ended 2009 in much better shape than it began. Economic challenges remain, such as stalled consumer confidence and job prospects for the unemployed as stimulus measures wind down. However, several reports pointed to improving economic conditions. In the year’s second half, corporate profit growth was higher than earlier estimates, which may allow businesses to build inventory following a long period of inventory drawdowns.
Throughout the year, the Federal Open Market Committee kept monetary policy unchanged, announcing it intends to hold the federal funds target rate in the 0% to 0.25% range “for an extended period” as it lays the groundwork for an eventual tightening of monetary policy. Late in the period, the labor market improved somewhat as the economy lost fewer jobs than expected and the unemployment rate fell slightly, dropping from a period high of 10.2% in October to 10.0% at period-end.2
U.S. gross domestic product grew at a 2.2% annualized rate in 2009’s third quarter after shrinking by 0.7% in the prior three months. This was the first expansion since 2008’s second quarter. As economic conditions improved, oil prices increased from $45 per barrel in December 2008 to $79 at year-end, still well below 2008 highs. December’s inflation rate was an annualized 2.7%.2 Core inflation, which excludes food and energy costs, rose at a 1.8% annualized rate, which was within the Federal Reserve Board’s (Fed’s) informal target range of 1.5% to 2.0%.2
Most stocks suffered significant losses through early March 2009 as investors worried about an uncertain future. Stocks then recovered from
1. Source: © 2009 Morningstar. One cannot invest directly in an index, and an index is not representative of the Fund’s portfolio. Please see Index Descriptions following the Fund Summaries.
2. Source: Bureau of Labor Statistics.
Fund Risks: The Fund’s investments in stocks may offer the potential for long-term gains but can be subject to short-term price fluctuations. Changes in the financial strength of a debt issuer or in the rating of its securities may affect the securities’ value and, as a result, impact Fund performance. Because the Fund invests in bonds and other debt obligations, its share price and yield will be affected by interest rate movements. Bond prices generally move in the opposite direction of interest rates. Thus, as prices of bonds in the Fund adjust to a rise in interest rates, the Fund’s share price may decline. The Fund may invest all of its assets in high yield, lower rated (junk) bonds, which generally have greater price swings and higher risk of default and loss of principal than investment-grade bonds. Foreign investing involves additional risks, including currency fluctuations, economic instability, market volatility, and political and social instability. The Fund’s prospectus also includes a description of the main investment risks.
FI-2
12-year lows as economic data improved and investors perceived many bargains among the bear market fallout. For the 12 months under review, the blue chip stocks of the Dow Jones Industrial Average delivered a total return of +22.68%, while the broader S&P 500 posted a +26.46% total return and the technology-heavy NASDAQ Composite Index returned +45.32%.1 All sectors posted gains for the period, with the strongest returns from the information technology, materials and consumer discretionary sectors.
During the period, long-term interest rates rose as the economy began to recover and the financial system moved away from the turmoil that engulfed markets beginning in the second half of 2008. Ten-year U.S. Treasury yields increased from 2.25% on December 31, 2008, to 3.85% on December 31, 2009. Short-term rates remained very low throughout the year influenced in large part by the Fed’s maintaining a range of 0% to 0.25% for the federal funds target rate.
Despite the modest increase in long-term interest rates during the period, corporate bonds rallied as credit spreads contracted from the extremely elevated levels on December 31, 2008. Investment-grade corporate bond spreads fell from 555 basis points (bps; 100 basis points equal one percentage point) to 172 bps while high yield corporate bond credit spreads declined from 1,706 bps to 634 bps on December 31, 2009.3
Investment Strategy
We search for undervalued or out-of-favor securities we believe offer opportunities for income today and growth tomorrow. We generally perform independent analysis of the debt securities being considered for the Fund’s portfolio, rather than relying principally on ratings assigned by rating agencies. In analyzing debt and equity securities, we consider a variety of factors, including: a security’s relative value based on such factors as anticipated cash flow, interest or dividend coverage, asset coverage, and earnings prospects; the experience and strength of a company’s management; a company’s sensitivity to changes in interest rates and business conditions; a company’s debt maturity schedules and borrowing requirements; and a company’s changing financial condition and market recognition of the change.
Manager’s Discussion
The Fund experienced strong gains across its equity and fixed income holdings with high yield and investment-grade corporate bonds contributing significantly to returns.
3. Sources: Barclays Capital; Credit Suisse.
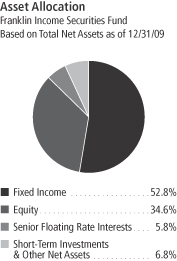
FI-3
Within fixed income, corporate bonds — particularly high yield bonds — surged during the year as companies that survived the credit crisis began to access the capital markets. Two of the Fund’s largest holdings at the start of the year, Ford Motor Credit Company (FMCC) and General Motors Acceptance Corp. (GMAC), advanced as these automotive finance companies maintained access to funding. Additionally, the overall automotive sector improved partly due to government involvement either directly in the case of the General Motors restructuring or through the “cash for clunkers” program, which helped stimulate auto industry sales. Bonds and hybrid securities from J.P. Morgan Chase, Bank of America and Morgan Stanley appreciated as the financial system stabilized and banks began to rebuild their capital positions.
Energy sector holdings also recovered sharply with strong gains realized by companies involved in the oil and gas production and pipeline business including Chesapeake Energy, PetroHawk Energy, Plains Exploration & Production and El Paso. As the economy emerged from recession, commodity prices improved and helped drive positive results and a more favorable outlook for companies in the sector.
Positions in electric utility and power generation companies Dynegy Holdings, Energy Futures Holdings (formerly, TXU) and Reliant Energy gained as business stabilized and credit spreads tightened. For many of these holdings, significant price increases provided us with an opportunity for profit-taking, and we sold Sempra Energy, Dominion Resources and Illinois Power bonds.
Stable financial performance and optimism regarding potential health care reform and the easing of bad debt expense related to uninsured patients helped drive gains for hospital operators Tenet Healthcare, HCA and Community Health Systems.
Within equities and convertible securities, several sectors and individual companies contributed to the Fund’s income and total return, while many dividend-paying stocks lagged the broader market’s rapid gains.
With a strong recovery in credit and equity markets, convertible securities delivered substantial gains, and the Fund’s holdings in convertible bonds and convertible preferred stocks were strong contributors to overall performance. Real estate-related holdings Vornado Realty Trust (sold by period-end) and Duke Realty advanced as property and real estate financing markets began to recover. Financial sector holdings including Bank of America and Wells Fargo convertible preferred stocks appreciated as bank credit spreads tightened and the risk of bank failures subsided.
Top Five Equity Holdings*
Franklin Income Securities Fund 12/31/09
| | |
Company
Sector/Industry | | % of Total
Net Assets |
| Exxon Mobil Corp. | | 1.7% |
| Energy | | |
| Merck & Co. Inc. | | 1.7% |
| Health Care | | |
| Bank of America Corp. | | 1.4% |
| Financials | | |
| PG&E Corp. | | 1.2% |
| Utilities | | |
| Duke Energy Corp. | | 1.2% |
| Utilities | | |
*Does not include convertible preferred stocks.
Top Five Fixed Income and Senior Floating Rate Interests Holdings**
Franklin Income Securities Fund
12/31/09
| | |
Issuer
Sector/Industry | | % of Total
Net Assets |
| Ford Motor Credit Co. LLC | | 4.0% |
| Consumer Discretionary | | |
| Texas Competitive Electric Holdings Co. LLC | | 3.0% |
| Utilities | | |
| Tenet Healthcare Corp. | | 2.4% |
| Health Care | | |
| HCA Inc. | | 2.4% |
| Health Care | | |
| Chesapeake Energy Corp. | | 1.8% |
| Energy | | |
**Does not include convertible bonds.
The dollar value, number of shares or principal amount, and names of all portfolio holdings are listed in the Fund’s Statement of Investments.
FI-4
Although some common stock holdings, such as Southern Co., Pfizer (sold by period-end) and Ameren, detracted from performance, other positions including Merck, Canadian Oil Sands Trust and J.P. Morgan Chase delivered strong gains.
The Fund began the year with a 49.8% weighting, based on total net assets, in fixed income securities (largely corporate bonds) and rapidly increased that weighting as we sought to take advantage of what we considered attractive valuations and a favorable risk-adjusted return profile offered by the sector relative to other asset classes. By mid-year, the Fund’s fixed income weighting had increased to 59.6%, which helped generate income while also providing capital appreciation as markets continued to improve from lows earlier in the year. As we ended the year, the Fund took advantage of several profit-taking opportunities in corporate bonds, and thus shifted toward a more balanced portfolio of equity and fixed income securities.
Although the Fund shifted significantly toward fixed income markets during part of the year, common stocks and convertible securities continued to play an important role. The year began with the S&P 500 declining 24.63% to its low point on March 9, 2009, before rallying 67.80% to finish the year with an overall advance of +26.46%.1 As equity markets rallied and the economy emerged from recession, many dividend-paying stocks underperformed on a relative basis as investors sought companies leveraged to the economic recovery. For example, electric utility stocks, which generally offer attractive dividends, lagged as represented by the S&P 500 Utilities Index, which returned +11.91% during 2009.1
At year-end, we continue to seek investment opportunities across a wide range of asset classes that could help the Fund achieve its investment objective of high current income while maintaining prospects for capital appreciation. We remain optimistic about opportunities across the capital structure from bank debt and corporate bonds to convertible securities and common stocks.
FI-5
Thank you for your participation in Franklin Income Securities Fund. We look forward to serving your future investment needs.
The foregoing information reflects our analysis, opinions and portfolio holdings as of December 31, 2009, the end of the reporting period. The way we implement our main investment strategies and the resulting portfolio holdings may change depending on factors such as market and economic conditions. These opinions may not be relied upon as investment advice or an offer for a particular security. The information is not a complete analysis of every aspect of any market, country, industry, security or the Fund. Statements of fact are from sources considered reliable, but the investment manager makes no representation or warranty as to their completeness or accuracy. Although historical performance is no guarantee of future results, these insights may help you understand our investment management philosophy.
FI-6
Fund Expenses
As an investor in a variable insurance contract (Contract) that indirectly provides for investment in an underlying mutual fund, you can incur transaction and/or ongoing expenses at both the Fund level and the Contract level.
| • | | Transaction expenses can include sales charges (loads) on purchases, redemption fees, surrender fees, transfer fees and premium taxes. |
| • | | Ongoing expenses can include management fees, distribution and service (12b-1) fees, contract fees, annual maintenance fees, mortality and expense risk fees and other fees and expenses. All mutual funds and Contracts have some types of ongoing expenses. |
The expenses shown in the table are meant to highlight ongoing expenses at the Fund level only and do not include ongoing expenses at the Contract level, or transaction expenses at either the Fund or Contract level. While the Fund does not have transaction expenses, if the transaction and ongoing expenses at the Contract level were included, the expenses shown would be higher. You should consult your Contract prospectus or disclosure document for more information.
The table shows Fund-level ongoing expenses and can help you understand these expenses and compare them with those of other mutual funds offered through the Contract. The table assumes a $1,000 investment held for the six months indicated. Please refer to the Fund prospectus for additional information on operating expenses.
Actual Fund Expenses
The first line (Actual) of the table provides actual account values and expenses. The “Ending Account Value” is derived from the Fund’s actual return, which includes the effect of ongoing Fund expenses, but does not include the effect of ongoing Contract expenses.
You can estimate the Fund-level expenses you incurred during the period by following these steps. Of course, your account value and expenses will differ from those in this illustration:
| 1. | Divide your account value by $1,000. |
If an account had an $8,600 value, then $8,600 ÷ $1,000 = 8.6.
| 2. | Multiply the result by the number under the heading “Fund-Level Expenses Incurred During Period.” |
If Fund-Level Expenses Incurred During Period were $7.50, then 8.6 x $7.50 = $64.50.
In this illustration, the estimated expenses incurred this period at the Fund level are $64.50.
Franklin Income Securities Fund – Class 4
FI-7
Hypothetical Example for Comparison with Other Mutual Funds
Information in the second line (Hypothetical) of the table can help you compare ongoing expenses of the Fund with those of other mutual funds offered through the Contract. This information may not be used to estimate the actual ending account balance or expenses you incurred during the period. The hypothetical “Ending Account Value” is based on the Fund’s actual expense ratio and an assumed 5% annual rate of return before expenses, which does not represent the Fund’s actual return. The figure under the heading “Fund-Level Expenses Incurred During Period” shows the hypothetical expenses your account would have incurred under this scenario. You can compare this figure with the 5% hypothetical examples that appear in shareholder reports of other funds offered through a Contract.
| | | | | | | | | |
| Class 4 | | Beginning
Account Value 7/1/09 | | Ending
Account
Value 12/31/09 | | Fund-Level
Expenses Incurred
During Period*
7/1/09–12/31/09 |
Actual | | $ | 1,000 | | $ | 1,200.20 | | $ | 4.55 |
Hypothetical (5% return before expenses) | | $ | 1,000 | | $ | 1,021.07 | | $ | 4.18 |
*Expenses are calculated using the most recent six-month annualized expense ratio for the Fund’s Class 4 shares (0.82%), which does not include any ongoing expenses of the Contract for which the Fund is an investment option, multiplied by the average account value over the period, multiplied by 184/365 to reflect the one-half year period.
FI-8
Franklin Templeton Variable Insurance Products Trust
Financial Highlights
Franklin Income Securities Fund
| | | | | | | | | | | | | | | | | | | | |
| | | Year Ended December 31, | |
| Class 1 | | 2009 | | | 2008 | | | 2007 | | | 2006 | | | 2005 | |
| | | | |
Per share operating performance | | | | | | | | | | | | | | | | | | | | |
(for a share outstanding throughout the year) | | | | | | | | | | | | | | | | | | | | |
Net asset value, beginning of year | | $ | 11.53 | | | $ | 17.63 | | | $ | 17.65 | | | $ | 15.56 | | | $ | 15.89 | |
| | | | |
Income from investment operationsa: | | | | | | | | | | | | | | | | | | | | |
Net investment incomeb | | | 0.91 | | | | 1.10 | | | | 1.03 | | | | 0.94 | | | | 0.85 | |
Net realized and unrealized gains (losses) | | | 3.08 | | | | (5.99 | ) | | | (0.31 | ) | | | 1.85 | | | | (0.56 | ) |
| | | | |
Total from investment operations | | | 3.99 | | | | (4.89 | ) | | | 0.72 | | | | 2.79 | | | | 0.29 | |
| | | | |
Less distributions from: | | | | | | | | | | | | | | | | | | | | |
Net investment income | | | (1.09 | ) | | | (0.86 | ) | | | (0.63 | ) | | | (0.62 | ) | | | (0.57 | ) |
Net realized gains | | | — | | | | (0.35 | ) | | | (0.11 | ) | | | (0.08 | ) | | | (0.05 | ) |
| | | | |
Total distributions | | | (1.09 | ) | | | (1.21 | ) | | | (0.74 | ) | | | (0.70 | ) | | | (0.62 | ) |
| | | | |
Net asset value, end of year | | $ | 14.43 | | | $ | 11.53 | | | $ | 17.63 | | | $ | 17.65 | | | $ | 15.56 | |
| | | | |
| | | | | |
Total returnc | | | 35.88% | | | | (29.41)% | | | | 4.01% | | | | 18.47% | | | | 1.83% | |
Ratios to average net assets | | | | | | | | | | | | | | | | | | | | |
Expensesd | | | 0.47% | | | | 0.47% | | | | 0.47% | | | | 0.47% | | | | 0.48% | |
Net investment income | | | 7.23% | | | | 7.28% | | | | 5.77% | | | | 5.70% | | | | 5.44% | |
| | | | | |
Supplemental data | | | | | | | | | | | | | | | | | | | | |
Net assets, end of year (000’s) | | $ | 910,504 | | | $ | 433,370 | | | $ | 455,932 | | | $ | 458,613 | | | $ | 457,625 | |
Portfolio turnover rate | | | 42.30% | | | | 43.89% | | | | 32.11% | | | | 25.05% | | | | 34.76% | |
aThe amount shown for a share outstanding throughout the period may not correlate with the Statement of Operations for the period due to the timing of sales and repurchases of the Fund shares in relation to income earned and/or fluctuating market value of the investments of the Fund.
bBased on average daily shares outstanding.
cTotal return does not include any fees, charges or expenses imposed by the variable annuity and life insurance contracts for which the Franklin Templeton Variable Insurance Products Trust serves as an underlying investment vehicle.
dBenefit of expense reduction rounds to less than 0.01%.
The accompanying notes are an integral part of these financial statements.
FI-9
Franklin Templeton Variable Insurance Products Trust
Financial Highlights (continued)
Franklin Income Securities Fund
| | | | | | | | | | | | | | | | | | | | |
| | | Year Ended December 31, | |
| Class 2 | | 2009 | | | 2008 | | | 2007 | | | 2006 | | | 2005 | |
| | | | |
Per share operating performance | | | | | | | | | | | | | | | | | | | | |
(for a share outstanding throughout the year) | | | | | | | | | | | | | | | | | | | | |
Net asset value, beginning of year | | $ | 11.30 | | | $ | 17.31 | | | $ | 17.36 | | | $ | 15.32 | | | $ | 15.67 | |
| | | | |
Income from investment operationsa: | | | | | | | | | | | | | | | | | | | | |
Net investment incomeb | | | 0.86 | | | | 1.04 | | | | 0.97 | | | | 0.89 | | | | 0.80 | |
Net realized and unrealized gains (losses) | | | 3.01 | | | | (5.87 | ) | | | (0.30 | ) | | | 1.82 | | | | (0.55 | ) |
| | | | |
Total from investment operations | | | 3.87 | | | | (4.83 | ) | | | 0.67 | | | | 2.71 | | | | 0.25 | |
| | | | |
Less distributions from: | | | | | | | | | | | | | | | | | | | | |
Net investment income | | | (1.05 | ) | | | (0.83 | ) | | | (0.61 | ) | | | (0.59 | ) | | | (0.55 | ) |
Net realized gains | | | — | | | | (0.35 | ) | | | (0.11 | ) | | | (0.08 | ) | | | (0.05 | ) |
| | | | |
Total distributions | | | (1.05 | ) | | | (1.18 | ) | | | (0.72 | ) | | | (0.67 | ) | | | (0.60 | ) |
| | | | |
Net asset value, end of year | | $ | 14.12 | | | $ | 11.30 | | | $ | 17.31 | | | $ | 17.36 | | | $ | 15.32 | |
| | | | |
| | | | | |
Total returnc | | | 35.59% | | | | (29.66)% | | | | 3.76% | | | | 18.24% | | | | 1.60% | |
Ratios to average net assets | | | | | | | | | | | | | | | | | | | | |
Expensesd | | | 0.72% | | | | 0.72% | | | | 0.72% | | | | 0.72% | | | | 0.73% | |
Net investment income | | | 6.98% | | | | 7.03% | | | | 5.52% | | | | 5.45% | | | | 5.19% | |
| | | | | |
Supplemental data | | | | | | | | | | | | | | | | | | | | |
Net assets, end of year (000’s) | | $ | 6,114,898 | | | $ | 4,944,457 | | | $ | 7,429,064 | | | $ | 5,109,373 | | | $ | 2,865,361 | |
Portfolio turnover rate | | | 42.30% | | | | 43.89% | | | | 32.11% | | | | 25.05% | | | | 34.76% | |
aThe amount shown for a share outstanding throughout the period may not correlate with the Statement of Operations for the period due to the timing of sales and repurchases of the Fund shares in relation to income earned and/or fluctuating market value of the investments of the Fund.
bBased on average daily shares outstanding.
cTotal return does not include any fees, charges or expenses imposed by the variable annuity and life insurance contracts for which the Franklin Templeton Variable Insurance Products Trust serves as an underlying investment vehicle.
dBenefit of expense reduction rounds to less than 0.01%.
The accompanying notes are an integral part of these financial statements.
FI-10
Franklin Templeton Variable Insurance Products Trust
Financial Highlights (continued)
Franklin Income Securities Fund
| | | | | | | | |
| | | Year Ended
December 31, | |
| Class 4 | | 2009 | | | 2008a | |
| | | | |
Per share operating performance | | | | | | | | |
(for a share outstanding throughout the year) | | | | | | | | |
Net asset value, beginning of year | | $ | 11.49 | | | $ | 16.90 | |
| | | | |
Income from investment operationsb: | | | | | | | | |
Net investment incomec | | | 0.86 | | | | 0.87 | |
Net realized and unrealized gains (losses) | | | 3.06 | | | | (5.07 | ) |
| | | | |
Total from investment operations | | | 3.92 | | | | (4.20 | ) |
| | | | |
Less distributions from: | | | | | | | | |
Net investment income | | | (1.08 | ) | | | (0.86 | ) |
Net realized gains | | | — | | | | (0.35 | ) |
| | | | |
Total distributions | | | (1.08 | ) | | | (1.21 | ) |
| | | | |
Net asset value, end of year | | $ | 14.33 | | | $ | 11.49 | |
| | | | |
| | |
Total returnd | | | 35.37% | | | | (26.61)% | |
Ratios to average net assetse | | | | | | | | |
Expensesf | | | 0.82% | | | | 0.82% | |
Net investment income | | | 6.88% | | | | 6.93% | |
| | |
Supplemental data | | | | | | | | |
Net assets, end of year (000’s) | | $ | 347,733 | | | $ | 135,360 | |
Portfolio turnover rate | | | 42.30% | | | | 43.89% | |
aFor the period February 29, 2008 (effective date) to December 31, 2008.
bThe amount shown for a share outstanding throughout the period may not correlate with the Statement of Operations for the period due to the timing of sales and repurchases of the Fund shares in relation to income earned and/or fluctuating market value of the investments of the Fund.
cBased on average daily shares outstanding.
dTotal return does not include any fees, charges or expenses imposed by the variable annuity and life insurance contracts for which the Franklin Templeton Variable Insurance Products Trust serves as an underlying investment vehicle. Total return is not annualized for periods less than one year.
eRatios are annualized for periods less than one year.
fBenefit of expense reduction rounds to less than 0.01%.
The accompanying notes are an integral part of these financial statements.
FI-11
Franklin Templeton Variable Insurance Products Trust
Statement of Investments, December 31, 2009
| | | | | | | |
| Franklin Income Securities Fund | | Country | | Shares/
Warrants | | Value |
Common Stocks and Other Equity Interests 30.1% | | | | | | | |
Consumer Discretionary 1.6% | | | | | | | |
aCharter Communications Inc. | | United States | | 1,747,500 | | $ | 62,036,250 |
aCharter Communications Inc., A | | United States | | 601,809 | | | 21,364,220 |
aCharter Communications Inc., wts., 11/30/14 | | United States | | 311,018 | | | 1,850,557 |
Comcast Corp., A | | United States | | 1,035,000 | | | 17,450,100 |
Target Corp. | | United States | | 300,000 | | | 14,511,000 |
| | | | | | | |
| | | | | | | 117,212,127 |
| | | | | | | |
Consumer Staples 0.3% | | | | | | | |
Diageo PLC | | United Kingdom | | 1,150,000 | | | 20,135,707 |
| | | | | | | |
Energy 4.3% | | | | | | | |
aCallon Petroleum Co. | | United States | | 430,424 | | | 645,636 |
Canadian Oil Sands Trust | | Canada | | 2,500,050 | | | 71,137,797 |
ConocoPhillips | | United States | | 1,500,000 | | | 76,605,000 |
Exxon Mobil Corp. | | United States | | 1,800,000 | | | 122,742,000 |
Spectra Energy Corp. | | United States | | 2,243,200 | | | 46,008,032 |
| | | | | | | |
| | | | | | | 317,138,465 |
| | | | | | | |
Financials 5.0% | | | | | | | |
Bank of America Corp. | | United States | | 6,800,000 | | | 102,408,000 |
Barclays PLC | | United Kingdom | | 2,000,000 | | | 8,908,104 |
Capital One Financial Corp. | | United States | | 1,463,702 | | | 56,118,335 |
Citigroup Inc. | | United States | | 9,270,000 | | | 30,683,700 |
Duke Realty Corp. | | United States | | 750,000 | | | 9,127,500 |
HSBC Holdings PLC | | United Kingdom | | 3,500,000 | | | 40,099,389 |
aiStar Financial Inc. | | United States | | 968,800 | | | 2,480,128 |
JPMorgan Chase & Co. | | United States | | 1,250,000 | | | 52,087,500 |
Wells Fargo & Co. | | United States | | 2,500,000 | | | 67,475,000 |
| | | | | | | |
| | | | | | | 369,387,656 |
| | | | | | | |
Health Care 2.4% | | | | | | | |
Abbott Laboratories | | United States | | 248,000 | | | 13,389,520 |
Johnson & Johnson | | United States | | 600,000 | | | 38,646,000 |
Merck & Co. Inc. | | United States | | 3,350,000 | | | 122,409,000 |
| | | | | | | |
| | | | | | | 174,444,520 |
| | | | | | | |
Industrials 0.0%b | | | | | | | |
aNortek Inc. | | United States | | 4,800 | | | 170,400 |
| | | | | | | |
Information Technology 1.7% | | | | | | | |
Intel Corp. | | United States | | 3,000,000 | | | 61,200,000 |
Maxim Integrated Products Inc. | | United States | | 2,500,000 | | | 50,750,000 |
Xerox Corp. | | United States | | 2,000,000 | | | 16,920,000 |
| | | | | | | |
| | | | | | | 128,870,000 |
| | | | | | | |
Materials 0.8% | | | | | | | |
Barrick Gold Corp. | | Canada | | 100,000 | | | 3,938,000 |
Newmont Mining Corp. | | United States | | 1,100,000 | | | 52,041,000 |
| | | | | | | |
| | | | | | | 55,979,000 |
| | | | | | | |
Telecommunication Services 1.9% | | | | | | | |
AT&T Inc. | | United States | | 2,500,000 | | | 70,075,000 |
Verizon Communications Inc. | | United States | | 1,200,000 | | | 39,756,000 |
Vodafone Group PLC | | United Kingdom | | 12,500,000 | | | 28,983,643 |
| | | | | | | |
| | | | | | | 138,814,643 |
| | | | | | | |
FI-12
Franklin Templeton Variable Insurance Products Trust
Statement of Investments, December 31, 2009 (continued)
| | | | | | | |
| Franklin Income Securities Fund | | Country | | Shares/
Warrants | | Value |
Common Stocks and Other Equity Interests (continued) | | | | | | | |
Utilities 12.1% | | | | | | | |
AGL Resources Inc. | | United States | | 550,000 | | $ | 20,058,500 |
Ameren Corp. | | United States | | 1,800,000 | | | 50,310,000 |
American Electric Power Co. Inc. | | United States | | 1,523,800 | | | 53,013,002 |
American Water Works Co. Inc. | | United States | | 208,500 | | | 4,672,485 |
CenterPoint Energy Inc. | | United States | | 350,000 | | | 5,078,500 |
Consolidated Edison Inc. | | United States | | 1,000,000 | | | 45,430,000 |
Dominion Resources Inc. | | United States | | 1,600,000 | | | 62,272,000 |
DTE Energy Co. | | United States | | 260,500 | | | 11,355,195 |
Duke Energy Corp. | | United States | | 5,000,000 | | | 86,050,000 |
FirstEnergy Corp. | | United States | | 600,000 | | | 27,870,000 |
FPL Group Inc. | | United States | | 800,000 | | | 42,256,000 |
NiSource Inc. | | United States | | 600,000 | | | 9,228,000 |
PG&E Corp. | | United States | | 2,000,000 | | | 89,300,000 |
Pinnacle West Capital Corp. | | United States | | 300,000 | | | 10,974,000 |
Portland General Electric Co. | | United States | | 765,400 | | | 15,621,814 |
Progress Energy Inc. | | United States | | 1,400,000 | | | 57,414,000 |
Public Service Enterprise Group Inc. | | United States | | 2,500,000 | | | 83,125,000 |
Sempra Energy | | United States | | 875,900 | | | 49,032,882 |
The Southern Co. | | United States | | 2,250,000 | | | 74,970,000 |
TECO Energy Inc. | | United States | | 2,500,000 | | | 40,550,000 |
Xcel Energy Inc. | | United States | | 2,670,464 | | | 56,667,246 |
| | | | | | | |
| | | | | | | 895,248,624 |
| | | | | | | |
Total Common Stocks and Other Equity Interests
(Cost $2,149,004,105) | | | | | | | 2,217,401,142 |
| | | | | | | |
Convertible Preferred Stocks 2.2% | | | | | | | |
Consumer Discretionary 0.1% | | | | | | | |
aGeneral Motors Corp., 6.25%, cvt. pfd., C | | United States | | 1,400,000 | | | 7,770,000 |
| | | | | | | |
Energy 0.2% | | | | | | | |
aCallon Petroleum Co., cvt. pfd. | | United States | | 35,217 | | | 519,451 |
McMoRan Exploration Co., 8.00%, cvt. pfd. | | United States | | 4,400 | | | 6,201,800 |
a,cSandRidge Energy Inc., 8.50%, cvt. pfd., 144A | | United States | | 50,000 | | | 7,156,750 |
| | | | | | | |
| | | | | | | 13,878,001 |
| | | | | | | |
Financials 1.6% | | | | | | | |
Bank of America Corp., 7.25%, cvt. pfd., L | | United States | | 85,000 | | | 74,715,000 |
aFannie Mae, 5.375%, cvt. pfd. | | United States | | 600 | | | 1,740,000 |
aFannie Mae, 8.75%, cvt. pfd. | | United States | | 1,060,400 | | | 1,823,888 |
aFelcor Lodging Trust Inc., 7.80%, cvt. pfd., A | | United States | | 400,000 | | | 4,348,000 |
Wells Fargo & Co., 7.50%, cvt. pfd., A | | United States | | 40,000 | | | 36,720,000 |
| | | | | | | |
| | | | | | | 119,346,888 |
| | | | | | | |
Health Care 0.2% | | | | | | | |
Tenet Healthcare Corp., 7.00%, cvt. pfd. | | United States | | 13,500 | | | 13,020,115 |
| | | | | | | |
Materials 0.1% | | | | | | | |
Freeport-McMoRan Copper & Gold Inc., 6.75%, cvt. pfd. | | United States | | 86,500 | | | 9,964,800 |
| | | | | | | |
Total Convertible Preferred Stocks (Cost $276,443,788) | | | | | | | 163,979,804 |
| | | | | | | |
dEquity-Linked Securities 1.9% | | | | | | | |
Energy 1.3% | | | | | | | |
Credit Suisse into Halliburtun Co., 12.00% | | United States | | 300,000 | | | 7,140,900 |
FI-13
Franklin Templeton Variable Insurance Products Trust
Statement of Investments, December 31, 2009 (continued)
| | | | | | | |
| Franklin Income Securities Fund | | Country | | Shares/
Warrants | | Value |
dEquity-Linked Securities (continued) | | | | | | | |
Energy (continued) | | | | | | | |
Credit Suisse into Weatherford International Ltd., 11.00% | | United States | | 1,000,000 | | $ | 19,168,800 |
cDeutsche Bank AG into Chesapeake Energy Corp., 12.00%, 144A | | United States | | 900,000 | | | 24,334,200 |
cThe Goldman Sachs Group Inc. into Devon Energy Corp., 10.55%, 144A | | United States | | 200,000 | | | 12,175,200 |
cThe Goldman Sachs Group Inc. into XTO Energy Inc., 9.00%, 144A | | United States | | 750,000 | | | 33,468,375 |
| | | | | | | |
| | | | | | | 96,287,475 |
| | | | | | | |
Information Technology 0.1% | | | | | | | |
cThe Goldman Sachs Group Inc. into Intel Corp., 10.00%, 144A | | United States | | 350,000 | | | 6,555,150 |
| | | | | | | |
Materials 0.5% | | | | | | | |
cThe Goldman Sachs Group Inc. into Barrick Gold Corp., 12.5%, 144A | | United States | | 1,000,000 | | | 40,427,200 |
| | | | | | | |
Total Equity-Linked Securities (Cost $134,462,710) | | | | | | | 143,269,825 |
| | | | | | | |
Preferred Stocks 0.4% | | | | | | | |
Financials 0.4% | | | | | | | |
aFannie Mae, 6.75%, pfd. | | United States | | 500,000 | | | 487,500 |
aFannie Mae, 7.625%, pfd., R | | United States | | 800,000 | | | 744,000 |
aFannie Mae, 8.25%, pfd. | | United States | | 851,500 | | | 936,650 |
aFreddie Mac, 8.375%, pfd., Z | | United States | | 1,549,200 | | | 1,626,660 |
cGMAC Inc., 7.00%, pfd., 144A | | United States | | 36,265 | | | 23,905,435 |
| | | | | | | |
Total Preferred Stocks (Cost $105,391,575) | | | | | | | 27,700,245 |
| | | | | | | |
| | | |
| | | | | Principal
Amounte | | |
f,gSenior Floating Rate Interests 5.8% | | | | | | | |
Consumer Discretionary 1.3% | | | | | | | |
Clear Channel Communications Inc., Term Loan B, 3.881%, 11/13/15 | | United States | | 74,951,317 | | | 61,722,409 |
Dex Media West LLC, Term Loan B, 7.00%, 10/24/14 | | United States | | 7,533,170 | | | 6,980,740 |
hIdearc Inc., Term Loan A, 5.75%, 11/17/13 | | United States | | 7,766,201 | | | 4,063,665 |
Jarden Corp., Term Loan B-3, 2.751%, 1/24/12 | | United States | | 18,886,642 | | | 18,444,826 |
| | | | | | | |
| | | | | | | 91,211,640 |
| | | | | | | |
Consumer Staples 0.1% | | | | | | | |
JohnsonDiversey Inc., Tranch B Dollar Term Loan, 3.50%, 11/24/15 | | United States | | 10,000,000 | | | 10,093,750 |
| | | | | | | |
Health Care 0.4% | | | | | | | |
Bausch and Lomb Inc., | | | | | | | |
Delayed Draw Term Loan, 3.50%, 4/28/15 | | United States | | 1,666,867 | | | 1,591,338 |
Parent Term Loan, 3.50%, 4/28/15 | | United States | | 6,864,000 | | | 6,552,978 |
HCA Inc., | | | | | | | |
Term Loan A-1, 1.501%, 11/19/12 | | United States | | 15,215,577 | | | 14,564,685 |
Term Loan B-1, 2.501%, 11/18/13 | | United States | | 3,767,696 | | | 3,606,156 |
| | | | | | | |
| | | | | | | 26,315,157 |
| | | | | | | |
Industrials 0.8% | | | | | | | |
Allison Transmission Inc., Term Loan B, 2.99% - 3.04%, 8/07/14 | | United States | | 28,935,745 | | | 26,642,587 |
Altegrity Inc., Term Loan B, 3.253%, 2/21/15 | | United States | | 19,548,872 | | | 17,618,421 |
Ceva Group PLC, Dollar Pre-Refunded L/C Commitment, 3.251%, 8/01/12 | | United States | | 2,105,263 | | | 1,775,438 |
EGL Term Loans, 3.244%, 8/01/12 | | United States | | 17,492,105 | | | 14,707,940 |
| | | | | | | |
| | | | | | | 60,744,386 |
| | | | | | | |
FI-14
Franklin Templeton Variable Insurance Products Trust
Statement of Investments, December 31, 2009 (continued)
| | | | | | | |
| Franklin Income Securities Fund | | Country | | Principal
Amounte | | Value |
f,gSenior Floating Rate Interests (continued) | | | | | | | |
Information Technology 1.8% | | | | | | | |
First Data Corp., | | | | | | | |
Term Loan B-2, 2.999% - 3.001%, 9/24/14 | | United States | | 53,762,500 | | $ | 47,969,591 |
Term Loan B-3, 2.999% - 3.001%, 9/24/14 | | United States | | 22,514,348 | | | 20,009,627 |
Freescale Semiconductor Inc., | | | | | | | |
Incremental Term Loan, 12.50%, 12/15/14 | | United States | | 60,483,630 | | | 62,449,348 |
Term Loan, 1.985%, 12/01/13 | | United States | | 3,266,444 | | | 2,872,429 |
| | | | | | | |
| | | | | | | 133,300,995 |
| | | | | | | |
Materials 0.3% | | | | | | | |
Novelis Corp., U.S. Term Loan, 2.24% - 2.26%, 7/07/14 | | United States | | 26,449,760 | | | 24,248,769 |
| | | | | | | |
Utilities 1.1% | | | | | | | |
Texas Competitive Electric Holdings Co. LLC, | | | | | | | |
iTerm Loan 3.25%, 10/10/14 | | United States | | 20,000,000 | | | 16,110,000 |
Term Loan B-2, 3.735% - 3.751%, 10/10/14 | | United States | | 52,030,035 | | | 42,502,035 |
Term Loan B-3, 3.735% - 3.751%, 10/10/14 | | United States | | 24,437,500 | | | 19,782,156 |
| | | | | | | |
| | | | | | | 78,394,191 |
| | | | | | | |
Total Senior Floating Rate Interests (Cost $493,269,715) | | | | | | | 424,308,888 |
| | | | | | | |
Corporate Bonds 51.4% | | | | | | | |
Consumer Discretionary 14.2% | | | | | | | |
Cablevision Systems Corp., senior note, | | | | | | | |
c144A, 8.625%, 9/15/17 | | United States | | 5,000,000 | | | 5,231,250 |
B, 8.00%, 4/15/12 | | United States | | 45,000,000 | | | 47,812,500 |
CBS Corp., senior note, 8.875%, 5/15/19 | | United States | | 10,000,000 | | | 11,983,050 |
cCCH II LLC/CCH II Capital Corp., senior note, 144A, 13.50%, 11/30/16 | | United States | | 42,829,272 | | | 50,217,321 |
CCO Holdings LLC, senior note, 8.75%, 11/15/13 | | United States | | 30,000,000 | | | 30,937,500 |
cCequel Communications Holdings I LLC, senior note, 144A, 8.625%, 11/15/17 | | United States | | 10,000,000 | | | 10,150,000 |
cCinemark USA Inc., senior note, 144A, 8.625%, 6/15/19 | | United States | | 4,100,000 | | | 4,284,500 |
cClear Channel Worldwide Holdings Inc., senior note,
A, 144A, 9.25%, 12/15/17 | | United States | | 4,200,000 | | | 4,305,000 |
B, 144A, 9.25%, 12/15/17 | | United States | | 17,000,000 | | | 17,595,000 |
h,jDex Media Inc.,
senior disc. note, 9.00%, 11/15/13 | | United States | | 35,000,000 | | | 9,012,500 |
senior note, B, 8.00%, 11/15/13 | | United States | | 25,800,000 | | | 6,643,500 |
h,jDex Media West Finance,
senior note, B, 8.50%, 8/15/10 | | United States | | 42,675,000 | | | 46,302,375 |
senior sub. note, 9.875%, 8/15/13 | | United States | | 51,296,000 | | | 16,286,480 |
DISH DBS Corp., senior note, 7.875%, 9/01/19 | | United States | | 42,000,000 | | | 44,257,500 |
Dollar General Corp.,
senior note, 10.625%, 7/15/15 | | United States | | 54,246,000 | | | 60,348,674 |
ksenior sub. note, PIK, 11.875%, 7/15/17 | | United States | | 18,084,000 | | | 20,977,440 |
EchoStar DBS Corp., senior note,
7.75%, 5/31/15 | | United States | | 25,000,000 | | | 26,312,500 |
7.125%, 2/01/16 | | United States | | 27,500,000 | | | 28,221,875 |
Ford Motor Credit Co. LLC,
7.375%, 2/01/11 | | United States | | 40,000,000 | | | 40,900,000 |
8.00%, 6/01/14 | | United States | | 25,000,000 | | | 25,693,275 |
senior note, 9.75%, 9/15/10 | | United States | | 19,500,000 | | | 20,124,429 |
senior note, 9.875%, 8/10/11 | | United States | | 22,000,000 | | | 23,100,000 |
senior note, 7.25%, 10/25/11 | | United States | | 12,000,000 | | | 12,123,768 |
senior note, 7.50%, 8/01/12 | | United States | | 84,500,000 | | | 85,263,795 |
FI-15
Franklin Templeton Variable Insurance Products Trust
Statement of Investments, December 31, 2009 (continued)
| | | | | | | | |
| Franklin Income Securities Fund | | Country | | Principal
Amounte | | | Value |
Corporate Bonds (continued) | | | | | | | | |
Consumer Discretionary (continued) | | | | | | | | |
Ford Motor Credit Co. LLC (continued) | | | | | | | | |
senior note, 7.00%, 10/01/13 | | United States | | 50,000,000 | | | $ | 49,965,150 |
senior note, 12.00%, 5/15/15 | | United States | | 15,000,000 | | | | 17,437,500 |
fsenior note, FRN, 3.034%, 1/13/12 | | United States | | 20,000,000 | | | | 18,590,793 |
hGeneral Motors Corp., senior deb., 8.25%, 7/15/23 | | United States | | 25,000,000 | | | | 6,750,000 |
cHarrah’s Operating Escrow, senior secured note, 144A, 11.25%, 6/01/17 | | United States | | 10,000,000 | | | | 10,512,500 |
Host Hotels & Resorts LP, senior note,
c144A, 9.00%, 5/15/17 | | United States | | 12,900,000 | | | | 14,012,625 |
M, 7.00%, 8/15/12 | | United States | | 3,000,000 | | | | 3,063,750 |
O, 6.375%, 3/15/15 | | United States | | 15,000,000 | | | | 14,775,000 |
Q, 6.75%, 6/01/16 | | United States | | 30,000,000 | | | | 30,000,000 |
S, 6.875%, 11/01/14 | | United States | | 16,635,000 | | | | 16,822,144 |
Jarden Corp., senior note, 8.00%, 5/01/16 | | United States | | 3,600,000 | | | | 3,735,000 |
KB Home, senior note,
6.375%, 8/15/11 | | United States | | 1,044,000 | | | | 1,049,220 |
5.75%, 2/01/14 | | United States | | 6,500,000 | | | | 6,142,500 |
6.25%, 6/15/15 | | United States | | 9,500,000 | | | | 8,906,250 |
7.25%, 6/15/18 | | United States | | 10,600,000 | | | | 10,123,000 |
Lamar Media Corp., senior note, 9.75%, 4/01/14 | | United States | | 8,700,000 | | | | 9,646,125 |
cLimited Brands Inc., senior note, 144A, 8.50%, 6/15/19 | | United States | | 5,000,000 | | | | 5,462,500 |
MGM MIRAGE,
senior note, 8.50%, 9/15/10 | | United States | | 3,223,000 | | | | 3,223,000 |
senior note, 6.75%, 4/01/13 | | United States | | 10,000,000 | | | | 8,700,000 |
senior secured note, 13.00%, 11/15/13 | | United States | | 14,000,000 | | | | 16,170,000 |
Michaels Stores Inc., senior note, 10.00%, 11/01/14 | | United States | | 9,600,000 | | | | 9,984,000 |
hR.H. Donnelley Corp., | | | | | | | | |
senior disc. note, A-1, 6.875%, 1/15/13 | | United States | | 30,000,000 | | | | 2,962,500 |
senior disc. note, A-2, 6.875%, 1/15/13 | | United States | | 70,125,000 | | | | 6,924,844 |
senior note, 6.875%, 1/15/13 | | United States | | 11,089,000 | | | | 1,095,039 |
senior note, 8.875%, 10/15/17 | | United States | | 83,000,000 | | | | 8,196,250 |
senior note, A-3, 8.875%, 1/15/16 | | United States | | 125,000,000 | | | | 12,343,750 |
Regal Cinemas Corp., senior note, 8.625%, 7/15/19 | | United States | | 3,600,000 | | | | 3,762,000 |
cUnivision Communications Inc., | | | | | | | | |
ksenior note, 144A, PIK, 10.50%, 3/15/15 | | United States | | 42,100,000 | | | | 37,100,625 |
senior secured note, 144A, 12.00%, 7/01/14 | | United States | | 2,600,000 | | | | 2,879,500 |
cUPC Germany GmbH,
senior note, 144A, 9.625%, 12/01/19 | | Germany | | 3,000,000 | EUR | | | 4,358,765 |
senior secured bond, 144A, 8.125%, 12/01/17 | | Germany | | 6,300,000 | | | | 6,394,500 |
senior secured note, 144A, 8.125%, 12/01/17 | | Germany | | 5,500,000 | EUR | | | 8,020,594 |
Visant Holding Corp., senior note, 8.75%, 12/01/13 | | United States | | 17,000,000 | | | | 17,552,500 |
Wendy’s/Arby’s Restaurant LLC, senior note, 10.00%, 7/15/16 | | United States | | 6,000,000 | | | | 6,570,000 |
Wyndham Worldwide Corp., senior note, 9.875%, 5/01/14 | | United States | | 15,000,000 | | | | 16,689,930 |
| | | | | | | | |
| | | | | | | | 1,048,006,086 |
| | | | | | | | |
Consumer Staples 0.5% | | | | | | | | |
cAlliance One International Inc., senior note, 144A, 10.00%, 7/15/16 | | United States | | 4,500,000 | | | | 4,747,500 |
cJBS USA LLC, senior note, 144A, 11.625%, 5/01/14 | | United States | | 11,000,000 | | | | 12,622,500 |
cJohnsonDiversey Inc., senior note, 144A, 8.25%, 11/15/19 | | United States | | 10,000,000 | | | | 10,125,000 |
SUPERVALU Inc., senior note, 8.00%, 5/01/16 | | United States | | 11,200,000 | | | | 11,424,000 |
| | | | | | | | |
| | | | | | | | 38,919,000 |
| | | | | | | | |
Energy 8.6% | | | | | | | | |
cAntero Resources Finance, senior note, 144A, 9.375%, 12/01/17 | | United States | | 13,200,000 | | | | 13,530,000 |
cArch Coal Inc., senior note, 144A, 8.75%, 8/01/16 | | United States | | 5,025,000 | | | | 5,339,063 |
FI-16
Franklin Templeton Variable Insurance Products Trust
Statement of Investments, December 31, 2009 (continued)
| | | | | | | |
| Franklin Income Securities Fund | | Country | | Principal
Amounte | | Value |
Corporate Bonds (continued) | | | | | | | |
Energy (continued) | | | | | | | |
Bill Barrett Corp., senior note, 9.875%, 7/17/16 | | United States | | 2,200,000 | | $ | 2,354,000 |
Callon Petroleum Co., senior secured note, 13.00%, 9/15/16 | | United States | | 15,651,750 | | | 11,738,812 |
Chesapeake Energy Corp., senior note, | | | | | | | |
7.625%, 7/15/13 | | United States | | 15,000,000 | | | 15,787,500 |
9.50%, 2/15/15 | | United States | | 30,000,000 | | | 33,075,000 |
6.50%, 8/15/17 | | United States | | 34,000,000 | | | 33,490,000 |
6.25%, 1/15/18 | | United States | | 20,000,000 | | | 19,300,000 |
7.25%, 12/15/18 | | United States | | 33,000,000 | | | 33,412,500 |
El Paso Corp., senior note, | | | | | | | |
12.00%, 12/12/13 | | United States | | 2,000,000 | | | 2,355,000 |
8.25%, 2/15/16 | | United States | | 14,000,000 | | | 15,015,000 |
7.25%, 4/01/18 | | United States | | 10,200,000 | | | 10,128,580 |
MTN, 7.75%, 1/15/32 | | United States | | 22,000,000 | | | 20,913,486 |
cExpro Finance Luxembourg, senior secured note, 144A, 8.50%, 12/15/16 | | United Kingdom | | 11,400,000 | | | 11,219,880 |
cForest Oil Corp., senior note, 144A, 8.50%, 2/15/14 | | United States | | 20,000,000 | | | 21,000,000 |
cHolly Corp., senior note, 144A, 9.875%, 6/15/17 | | United States | | 10,000,000 | | | 10,575,000 |
Mariner Energy Inc., senior note, | | | | | | | |
7.50%, 4/15/13 | | United States | | 10,000,000 | | | 10,000,000 |
11.75%, 6/30/16 | | United States | | 7,000,000 | | | 7,840,000 |
Newfield Exploration Co., senior sub. note, 6.625%, 4/15/16 | | United States | | 18,200,000 | | | 18,336,500 |
OPTI Canada Inc., senior note, 7.875%, 12/15/14 | | Canada | | 7,500,000 | | | 6,187,500 |
Petrohawk Energy Corp., senior note, | | | | | | | |
10.50%, 8/01/14 | | United States | | 20,200,000 | | | 22,169,500 |
7.875%, 6/01/15 | | United States | | 26,000,000 | | | 26,390,000 |
cPetroplus Finance Ltd., senior note, 144A, | | | | | | | |
6.75%, 5/01/14 | | Switzerland | | 3,500,000 | | | 3,281,881 |
7.00%, 5/01/17 | | Switzerland | | 20,000,000 | | | 17,950,614 |
Pioneer Natural Resources Co., | | | | | | | |
6.65%, 3/15/17 | | United States | | 5,000,000 | | | 4,956,335 |
senior bond, 6.875%, 5/01/18 | | United States | | 18,165,000 | | | 18,063,639 |
Plains Exploration & Production Co., senior note, | | | | | | | |
7.75%, 6/15/15 | | United States | | 15,000,000 | | | 15,337,500 |
10.00%, 3/01/16 | | United States | | 10,000,000 | | | 11,000,000 |
Pride International Inc., senior note, 8.50%, 6/15/19 | | United States | | 4,700,000 | | | 5,452,000 |
Quicksilver Resources Inc., senior note, | | | | | | | |
11.75%, 1/01/16 | | United States | | 7,800,000 | | | 8,892,000 |
9.125%, 8/15/19 | | United States | | 20,000,000 | | | 20,900,000 |
Range Resources Corp., senior sub. note, 8.00%, 5/15/19 | | United States | | 10,000,000 | | | 10,750,000 |
Sabine Pass LNG LP, senior secured note, | | | | | | | |
7.25%, 11/30/13 | | United States | | 10,000,000 | | | 9,125,000 |
7.50%, 11/30/16 | | United States | | 40,000,000 | | | 33,500,000 |
cSandRidge Energy Inc., senior note, 144A, | | | | | | | |
9.875%, 5/15/16 | | United States | | 20,000,000 | | | 21,150,000 |
8.00%, 6/01/18 | | United States | | 17,000,000 | | | 16,787,500 |
8.75%, 1/15/20 | | United States | | 6,600,000 | | | 6,633,000 |
SEACOR Holdings Inc., senior note, 7.375%, 10/01/19 | | United States | | 4,000,000 | | | 4,056,352 |
SESI LLC, senior note, 6.875%, 6/01/14 | | United States | | 18,500,000 | | | 18,315,000 |
Tesoro Corp., senior note, 9.75%, 6/01/19 | | United States | | 10,400,000 | | | 10,816,000 |
cW&T Offshore Inc., senior note, 144A, 8.25%, 6/15/14 | | United States | | 40,000,000 | | | 38,200,000 |
cWestern Refining Inc.,
fsenior note, 144A, FRN, 7.753% 6/15/14 | | United States | | 5,000,000 | | | 4,500,000 |
senior secured note, 144A, 11.25%, 6/15/17 | | United States | | 5,000,000 | | | 4,550,000 |
| | | | | | | |
| | | | | | | 634,374,142 |
| | | | | | | |
FI-17
Franklin Templeton Variable Insurance Products Trust
Statement of Investments, December 31, 2009 (continued)
| | | | | | | |
| Franklin Income Securities Fund | | Country | | Principal
Amounte | | Value |
Corporate Bonds (continued) | | | | | | | |
Financials 5.5% | | | | | | | |
Aflac Inc., senior note, 8.50%, 5/15/19 | | United States | | 5,200,000 | | $ | 6,000,296 |
.lBank of America Corp., pfd., sub. bond, M, 8.125%, Perpetual | | United States | | 5,000,000 | | | 4,819,950 |
CB Richard Ellis Services Inc., senior sub. note, 11.625%, 6/15/17 | | United States | | 5,000,000 | | | 5,575,000 |
Duke Realty LP, senior note,
5.625%, 8/15/11 | | United States | | 4,000,000 | | | 4,096,696 |
7.375%, 2/15/15 | | United States | | 15,200,000 | | | 16,046,670 |
5.95%, 2/15/17 | | United States | | 1,950,000 | | | 1,822,270 |
cFelCor Lodging Trust Inc., senior secured note, 144A, 10.00%, 10/01/14 | | United States | | 12,900,000 | | | 13,077,375 |
cGMAC LLC, senior note, 144A,
7.75%, 1/19/10 | | United States | | 23,000,000 | | | 23,014,375 |
7.25%, 3/02/11 | | United States | | 7,650,000 | | | 7,650,000 |
6.875%, 9/15/11 | | United States | | 70,000,000 | | | 69,650,000 |
6.875%, 8/28/12 | | United States | | 10,094,000 | | | 9,993,060 |
6.75%, 12/01/14 | | United States | | 15,479,000 | | | 14,859,840 |
HCP Inc., senior note, 6.70%, 1/30/18 | | United States | | 10,000,000 | | | 9,766,134 |
ciStar Financial Inc., senior secured note, 144A, 10.00%, 6/15/14 | | United States | | 8,000,000 | | | 7,040,000 |
lJPMorgan Chase & Co., junior sub. note, 1, 7.90%, Perpetual | | United States | | 110,000,000 | | | 113,831,740 |
c,fLiberty Mutual Group, junior sub. note, 144A, FRN, 10.75%, 6/15/88 | | United States | | 25,000,000 | | | 26,750,000 |
cReynolds Group Escrow, senior secured note, 144A, 7.75%, 10/15/16 | | United Kingdom | | 5,000,000 | | | 5,137,500 |
lWells Fargo Capital XIII, pfd., 7.70%, Perpetual | | United States | | 5,600,000 | | | 5,460,000 |
lWells Fargo Capital XV, pfd., 9.75%, Perpetual | | United States | | 55,000,000 | | | 59,125,000 |
| | | | | | | |
| | | | | | | 403,715,906 |
| | | | | | | |
Health Care 7.0% | | | | | | | |
Community Health Systems Inc., senior sub. note, 8.875%, 7/15/15 | | United States | | 55,000,000 | | | 57,062,500 |
DaVita Inc.,
senior note, 6.625%, 3/15/13 | | United States | | 15,500,000 | | | 15,616,250 |
senior sub. note, 7.25%, 3/15/15 | | United States | | 19,500,000 | | | 19,646,250 |
HCA Inc.,
6.75%, 7/15/13 | | United States | | 2,000,000 | | | 1,980,000 |
6.375%, 1/15/15 | | United States | | 5,000,000 | | | 4,743,750 |
senior note, 6.30%, 10/01/12 | | United States | | 14,910,000 | | | 14,984,550 |
senior note, 6.50%, 2/15/16 | | United States | | 20,000,000 | | | 19,100,000 |
senior secured note, 9.25%, 11/15/16 | | United States | | 20,000,000 | | | 21,525,000 |
csenior secured note, 144A, 8.50%, 4/15/19 | | United States | | 27,500,000 | | | 29,768,750 |
csenior secured note, 144A, 7.875%, 2/15/20 | | United States | | 50,000,000 | | | 52,187,500 |
ksenior secured note, PIK, 9.625%, 11/15/16 | | United States | | 12,622,000 | | | 13,694,870 |
c,kQuintiles Transnational Corp., senior note, 144A, PIK, 9.50%, 12/30/14 | | United States | | 35,000,000 | | | 35,262,500 |
cTalecris Biotherapeutics Holdings Corp., senior note, 144A, 7.75%, 11/15/16 | | United States | | 6,400,000 | | | 6,528,000 |
Tenet Healthcare Corp., senior note, | | | | | | | |
7.375%, 2/01/13 | | United States | | 65,000,000 | | | 65,487,500 |
c144A, 9.00%, 5/01/15 | | United States | | 50,000,000 | | | 54,250,000 |
c144A, 10.00%, 5/01/18 | | United States | | 41,250,000 | | | 46,406,250 |
fFRN, 9.25%, 2/01/15 | | United States | | 13,500,000 | | | 14,445,000 |
f,kUS Oncology Holdings Inc., senior note, PIK, FRN, 6.428%, 3/15/12 | | United States | | 23,245,000 | | | 21,850,300 |
US Oncology Inc., | | | | | | | |
senior note, 10.75%, 8/15/14 | | United States | | 9,220,000 | | | 9,727,100 |
senior secured note, 9.125%, 8/15/17 | | United States | | 6,000,000 | | | 6,330,000 |
Vanguard Health Holding Co. I LLC, senior sub. note, 11.25%, 10/01/15 | | United States | | 7,200,000 | | | 7,614,000 |
| | | | | | | |
| | | | | | | 518,210,070 |
| | | | | | | |
FI-18
Franklin Templeton Variable Insurance Products Trust
Statement of Investments, December 31, 2009 (continued)
| | | | | | | | |
| Franklin Income Securities Fund | | Country | | Principal
Amounte | | | Value |
Corporate Bonds (continued) | | | | | | | | |
Industrials 4.2% | | | | | | | | |
cAmerican Airlines Inc., senior secured note, 144A, 10.50%, 10/15/12 | | United States | | 7,500,000 | | | $ | 7,893,750 |
cCase New Holland Inc., senior note, 144A, 7.75%, 9/01/13 | | United States | | 30,000,000 | | | | 30,825,000 |
cCeva Group PLC, senior secured note, 144A, 10.00%, 9/01/14 | | United Kingdom | | 18,000,000 | | | | 16,928,811 |
cDelta Air Lines Inc., senior secured note, 144A, | | | | | | | | |
9.50%, 9/15/14 | | United States | | 12,100,000 | | | | 12,644,500 |
11.75%, 3/15/15 | | United States | | 20,000,000 | | | | 20,100,000 |
Hertz Corp., | | | | | | | | |
senior note, 8.875%, 1/01/14 | | United States | | 65,835,000 | | | | 67,645,462 |
senior sub. note, 10.50%, 1/01/16 | | United States | | 17,000,000 | | | | 18,232,500 |
c,kJohnsonDiversey Holdings Inc., senior note, 144A, PIK, 10.50%, 5/15/20 | | United States | | 16,400,000 | | | | 16,564,000 |
Navistar International Corp., senior note, 8.25%, 11/01/21 | | United States | | 11,700,000 | | | | 12,051,000 |
Nortek Inc., senior secured note, 11.00%, 12/15/13 | | United States | | 4,821,333 | | | | 5,062,400 |
RBS Global & Rexnord Corp.,
c144A, 9.50%, 8/01/14 | | United States | | 22,560,000 | | | | 22,729,200 |
senior note, 9.50%, 8/01/14 | | United States | | 13,000,000 | | | | 13,097,500 |
senior sub. note, 11.75%, 8/01/16 | | United States | | 13,500,000 | | | | 13,432,500 |
Terex Corp., senior sub. note, 8.00%, 11/15/17 | | United States | | 45,000,000 | | | | 43,537,500 |
United Rentals North America Inc., senior sub. note, 7.75%, 11/15/13 | | United States | | 7,500,000 | | | | 7,050,000 |
| | | | | | | | |
| | | | | | | | 307,794,123 |
| | | | | | | | |
Information Technology 2.4% | | | | | | | | |
cAdvanced Micro Devices Inc., senior note, 144A, 8.125%, 12/15/17 | | United States | | 10,100,000 | | | | 10,112,625 |
Ceridian Corp., senior note, 11.50%, 11/15/15 | | United States | | 20,000,000 | | | | 19,175,000 |
First Data Corp., senior note, 9.875%, 9/24/15 | | United States | | 43,000,000 | | | | 40,312,500 |
Flextronics International Ltd., senior sub. note, 6.25%, 11/15/14 | | Singapore | | 10,000,000 | | | | 9,900,000 |
Freescale Semiconductor Inc., senior note,
8.875%, 12/15/14 | | United States | | 10,000,000 | | | | 9,225,000 |
10.125%, 12/15/16 | | United States | | 18,000,000 | | | | 14,580,000 |
Lucent Technologies Inc., 6.45%, 3/15/29 | | United States | | 4,100,000 | | | | 2,957,125 |
Sanmina-SCI Corp., senior sub. note,
8.125%, 3/01/16 | | United States | | 18,100,000 | | | | 18,145,250 |
6.75%, 3/01/13 | | United States | | 22,000,000 | | | | 21,807,500 |
SunGard Data Systems Inc., | | | | | | | | |
senior note, 9.125%, 8/15/13 | | United States | | 8,100,000 | | | | 8,343,000 |
senior note, 10.625%, 5/15/15 | | United States | | 7,500,000 | | | | 8,296,875 |
senior sub. note, 10.25%, 8/15/15 | | United States | | 14,500,000 | | | | 15,515,000 |
| | | | | | | | |
| | | | | | | | 178,369,875 |
| | | | | | | | |
Materials 1.8% | | | | | | | | |
Ball Corp., senior note,
7.125%, 9/01/16 | | United States | | 3,800,000 | | | | 3,914,000 |
7.375%, 9/01/19 | | United States | | 3,700,000 | | | | 3,820,250 |
Freeport-McMoRan Copper & Gold Inc., senior note,
8.25%, 4/01/15 | | United States | | 5,000,000 | | | | 5,455,825 |
8.375%, 4/01/17 | | United States | | 10,000,000 | | | | 10,965,010 |
cIneos Group Holdings PLC, senior sub. note, 144A, 7.875%, 2/15/16 | | United Kingdom | | 25,000,000 | EUR | | | 22,916,458 |
.cNalco Co., senior note, 144A, 8.25%, 5/15/17 | | United States | | 5,500,000 | | | | 5,871,250 |
Nalco Finance Holdings, senior note, 9.00%, 2/01/14 | | United States | | 36,829,000 | | | | 37,749,725 |
NewPage Corp., senior secured note,
10.00%, 5/01/12 | | United States | | 11,600,000 | | | | 8,352,000 |
c144A, 11.375%, 12/31/14 | | United States | | 3,900,000 | | | | 3,958,500 |
FI-19
Franklin Templeton Variable Insurance Products Trust
Statement of Investments, December 31, 2009 (continued)
| | | | | | | |
| Franklin Income Securities Fund | | Country | | Principal
Amounte | | Value |
Corporate Bonds (continued) | | | | | | | |
Materials (continued) | | | | | | | |
Teck Resources Ltd., | | | | | | | |
senior note, 9.75%, 5/15/14 | | Canada | | 11,700,000 | | $ | 13,557,375 |
senior secured note, 10.75%, 5/15/19 | | Canada | | 10,900,000 | | | 13,080,000 |
| | | | | | | |
| | | | | | | 129,640,393 |
| | | | | | | |
Telecommunication Services 1.5% | | | | | | | |
cCC Holdings GS V LLC, senior secured note, 144A, 7.75%, 5/01/17 | | United States | | 10,800,000 | | | 11,556,000 |
cClearwire Communications LLC/Finance, senior sec. note, 144A, 12.00%, 12/01/15 | | United States | | 5,000,000 | | | 5,125,000 |
cClearwire Corp., senior secured note, 144A, 12.00%, 12/01/15 | | United States | | 27,500,000 | | | 28,050,000 |
Cricket Communications Inc., | | | | | | | |
senior note, 9.375%, 11/01/14 | | United States | | 7,500,000 | | | 7,575,000 |
senior secured note, 7.75%, 5/15/16 | | United States | | 5,000,000 | | | 5,012,500 |
Crown Castle International Corp., senior note, 9.00%, 1/15/15 | | United States | | 15,000,000 | | | 16,050,000 |
cDigicel Group Ltd., senior note, 144A, 8.875%, 1/15/15 | | Jamaica | | 12,000,000 | | | 11,805,000 |
Qwest Corp., senior note, 8.375%, 5/01/16 | | United States | | 9,300,000 | | | 10,020,750 |
Sprint Nextel Corp., senior note, 8.375%, 8/15/17 | | United States | | 7,700,000 | | | 7,892,500 |
cWind Acquisition Finance SA, senior note, 144A, 11.75%, 7/15/17 | | Italy | | 9,200,000 | | | 10,051,000 |
| | | | | | | |
| | | | | | | 113,137,750 |
| | | | | | | |
Utilities 5.7% | | | | | | | |
cCalpine Construction Finance, senior secured note, 144A, 8.00%, 6/01/16 | | United States | | 17,500,000 | | | 18,112,500 |
a,mCalpine Corp., Escrow Account, 8.50%, 7/15/10 | | United States | | 13,000,000 | | | — |
CMS Energy Corp., senior note, 8.75%, 6/15/19 | | United States | | 14,400,000 | | | 15,833,405 |
Dynegy Holdings Inc., senior note, | | | | | | | |
7.50%, 6/01/15 | | United States | | 10,000,000 | | | 9,400,000 |
8.375%, 5/01/16 | | United States | | 58,000,000 | | | 55,390,000 |
7.75%, 6/01/19 | | United States | | 3,000,000 | | | 2,617,500 |
c144A, 7.50%, 6/01/15 | | United States | | 10,000,000 | | | 9,250,000 |
Energy Future Holdings Corp., senior note, | | | | | | | |
10.875%, 11/01/17 | | United States | | 37,500,000 | | | 30,843,750 |
P, 5.55%, 11/15/14 | | United States | | 27,000,000 | | | 19,283,346 |
kPIK, 12.00%, 11/01/17 | | United States | | 71,550,000 | | | 50,979,375 |
cIntergen NV, senior secured note, 144A, 9.00%, 6/30/17 | | Netherlands | | 7,500,000 | | | 7,856,250 |
Public Service Co. of New Mexico, senior note, 7.95%, 5/15/18 | | United States | | 12,500,000 | | | 13,104,962 |
Reliant Energy Inc., senior note, | | | | | | | |
7.625%, 6/15/14 | | United States | | 19,500,000 | | | 19,402,500 |
7.875%, 6/15/17 | | United States | | 25,000,000 | | | 24,687,500 |
Texas Competitive Electric Holdings Co. LLC, senior note, | | | | | | | |
A, 10.25%, 11/01/15 | | United States | | 107,000,000 | | | 87,205,000 |
B, 10.25%, 11/01/15 | | United States | | 18,000,000 | | | 14,670,000 |
kPIK, 10.50%, 11/01/16 | | United States | | 56,000,000 | | | 39,760,000 |
| | | | | | | |
| | | | | | | 418,396,088 |
| | | | | | | |
Total Corporate Bonds (Cost $3,697,811,753) | | | | | | | 3,790,563,433 |
| | | | | | | |
Convertible Bonds 1.4% | | | | | | | |
Consumer Discretionary 0.3% | | | | | | | |
cLiberty Global Inc., cvt., senior sub. note, 144A, 4.50%, 11/15/16 | | United States | | 20,000,000 | | | 21,800,000 |
| | | | | | | |
Financials 0.7% | | | | | | | |
cForest City Enterprises Inc., cvt., senior note, 144A, 5.00%, 10/15/16 | | United States | | 12,500,000 | | | 13,656,250 |
fiStar Financial Inc., cvt., senior note, FRN, 0.79%, 10/01/12 | | United States | | 70,000,000 | | | 38,591,000 |
| | | | | | | |
| | | | | | | 52,247,250 |
| | | | | | | |
The accompanying notes are an integral part of these financial statements.
FI-20
Franklin Templeton Variable Insurance Products Trust
Statement of Investments, December 31, 2009 (continued)
| | | | | | | |
| Franklin Income Securities Fund | | Country | | Principal
Amounte | | Value |
Convertible Bonds (continued) | | | | | | | |
Information Technology 0.2% | | | | | | | |
cAdvanced Micro Devices Inc., cvt., senior note, 144A, 5.75%, 8/15/12 | | United States | | 13,008,000 | | $ | 12,894,180 |
| | | | | | | |
Utilities 0.2% | | | | | | | |
CMS Energy Corp., cvt., senior note, 5.50%, 6/15/29 | | United States | | 10,000,000 | | | 12,275,000 |
| | | | | | | |
Total Convertible Bonds (Cost $110,942,388) | | | | | | | 99,216,430 |
| | | | | | | |
Total Investments before Short Term Investments
(Cost $6,967,326,034) | | | | | | | 6,866,439,767 |
| | | | | | | |
Short Term Investments (Cost $496,135,857) 6.7% | | | | | | | |
Repurchase Agreements 6.7% | | | | | | | |
nJoint Repurchase Agreement, 0.003%, 1/04/10 (Maturity Value $496,136,030) | | United States | | 496,135,857 | | | 496,135,857 |
Banc of America Securities LLC (Maturity Value $58,291,022) | | | | | | | |
BNP Paribas Securities Corp. (Maturity Value $116,577,084) | | | | | | | |
Credit Suisse Securities (USA) LLC (Maturity Value $97,153,357) | | | | | | | |
Deutsche Bank Securities Inc. (Maturity Value $29,812,814) | | | | | | | |
HSBC Securities (USA) Inc. (Maturity Value $97,153,357) | | | | | | | |
Morgan Stanley & Co. Inc. (Maturity Value $77,719,709) | | | | | | | |
UBS Securities LLC (Maturity Value $19,428,687) | | | | | | | |
Collateralized by U.S. Government Agency Securities, 0.50% - 7.625%, 3/30/10 - 2/09/28; oU.S. Government Agency Discount Notes, 9/21/10; oU.S. Treasury Bills, 8/26/10 - 12/16/10; and U.S. Treasury Notes, 0.875% - 4.25%, 5/31/11 - 11/15/14 | | | | | | | |
| | | | | | | |
Total Investments (Cost $7,463,461,891) 99.9% | | | | | | | 7,362,575,624 |
Other Assets, less Liabilities 0.1% | | | | | | | 10,559,769 |
| | | | | | | |
Net Assets 100.0% | | | | | | $ | 7,373,135,393 |
| | | | | | | |
See Abbreviations on page FI-34.
aNon-income producing.
bRounds to less than 0.1% of net assets.
cSecurity was purchased pursuant to Rule 144A under the Securities Act of 1933 and may be sold in transactions exempt from registration only to qualified institutional buyers or in a public offering registered under the Securities Act of 1933. These securities have been deemed liquid under guidelines approved by the Trust’s Board of Trustees. At December 31, 2009, the aggregate value of these securities was $1,253,034,352, representing 16.99% of net assets.
dSee Note 1(e) regarding equity-linked securities.
eThe principal amount is stated in U.S. dollars unless otherwise indicated.
fThe coupon rate shown represents the rate at period end.
gSee Note 1(f) regarding senior floating rate interests.
hSee Note 7 regarding defaulted securities.
iSecurity purchased on a delayed delivery basis. See Note 1(d).
jSee Note 8 regarding other considerations.
kIncome may be received in additional securities and/or cash.
lPerpetual security with no stated maturity date.
mSecurity has been deemed illiquid because it may not be able to be sold within seven days.
nSee Note 1(c) regarding joint repurchase agreement.
oThe security is traded on a discount basis with no stated coupon rate.
FI-21
Franklin Templeton Variable Insurance Products Trust
Financial Statements
Statement of Assets and Liabilities
December 31, 2009
| | | | |
| | | Franklin
Income
Securities Fund | |
Assets: | | | | |
Investments in securities: | | | | |
Cost - Unaffiliated issuers | | $ | 6,967,326,034 | |
Cost - Repurchase agreements | | | 496,135,857 | |
| | | | |
Total cost of investments | | $ | 7,463,461,891 | |
| | | | |
Value - Unaffiliated issuers | | $ | 6,866,439,767 | |
Value - Repurchase agreements | | | 496,135,857 | |
| | | | |
Total value of investments | | | 7,362,575,624 | |
Cash | | | 14,996,790 | |
Receivables: | | | | |
Investment securities sold | | | 3,717,076 | |
Capital shares sold | | | 901,819 | |
Dividends and interest | | | 80,839,919 | |
Other assets | | | 169,158 | |
| | | | |
Total assets | | | 7,463,200,386 | |
| | | | |
Liabilities: | | | | |
Payables: | | | | |
Investment securities purchased | | | 80,588,722 | |
Capital shares redeemed | | | 3,238,718 | |
Affiliates | | | 5,496,473 | |
Accrued expenses and other liabilities | | | 741,080 | |
| | | | |
Total liabilities | | | 90,064,993 | |
| | | | |
Net assets, at value | | $ | 7,373,135,393 | |
| | | | |
Net assets consist of: | | | | |
Paid-in capital | | $ | 8,181,005,372 | |
Undistributed net investment income | | | 448,201,048 | |
Net unrealized appreciation (depreciation) | | | (100,945,492 | ) |
Accumulated net realized gain (loss) | | | (1,155,125,535 | ) |
| | | | |
Net assets, at value | | $ | 7,373,135,393 | |
| | | | |
The accompanying notes are an integral part of these financial statements.
FI-22
Franklin Templeton Variable Insurance Products Trust
Financial Statements (continued)
Statement of Assets and Liabilities (continued)
December 31, 2009
| | | |
| | | Franklin
Income
Securities Fund |
Class 1: | | | |
Net assets, at value | | $ | 910,503,680 |
| | | |
Shares outstanding | | | 63,109,559 |
| | | |
Net asset value and maximum offering price per share | | $ | 14.43 |
| | | |
Class 2: | | | |
Net assets, at value | | $ | 6,114,898,295 |
| | | |
Shares outstanding | | | 433,043,316 |
| | | |
Net asset value and maximum offering price per share | | $ | 14.12 |
| | | |
Class 4: | | | |
Net assets, at value | | $ | 347,733,418 |
| | | |
Shares outstanding | | | 24,258,227 |
| | | |
Net asset value and maximum offering price per share | | $ | 14.33 |
| | | |
The accompanying notes are an integral part of these financial statements.
FI-23
Franklin Templeton Variable Insurance Products Trust
Financial Statements (continued)
Statement of Operations
for the year ended December 31, 2009
| | | | |
| | | Franklin
Income
Securities Fund | |
Investment income: | | | | |
Dividends | | $ | 86,285,747 | |
Interest | | | 388,474,536 | |
| | | | |
Total investment income | | | 474,760,283 | |
| | | | |
Expenses: | | | | |
Management fees (Note 3a) | | | 27,966,993 | |
Distribution fees: (Note 3c) | | | | |
Class 2 | | | 13,299,931 | |
Class 4 | | | 832,330 | |
Unaffiliated transfer agent fees | | | 1,992 | |
Custodian fees (Note 4) | | | 86,392 | |
Reports to shareholders | | | 593,581 | |
Professional fees | | | 196,622 | |
Trustees’ fees and expenses | | | 40,269 | |
Other | | | 212,554 | |
| | | | |
Total expenses | | | 43,230,664 | |
Expense reductions (Note 4) | | | (1,590 | ) |
| | | | |
Net expenses | | | 43,229,074 | |
| | | | |
Net investment income | | | 431,531,209 | |
| | | | |
Realized and unrealized gains (losses): | | | | |
Net realized gain (loss) from: | | | | |
Investments | | | (456,902,624 | ) |
Foreign currency transactions | | | (39,752 | ) |
| | | | |
Net realized gain (loss) | | | (456,942,376 | ) |
Net change in unrealized appreciation (depreciation) on: | | | | |
Investments | | | 1,964,766,715 | |
Translation of other assets and liabilities denominated in foreign currencies | | | (75,331 | ) |
| | | | |
Net change in unrealized appreciation (depreciation) | | | 1,964,691,384 | |
| | | | |
Net realized and unrealized gain (loss) | | | 1,507,749,008 | |
| | | | |
Net increase (decrease) in net assets resulting from operations | | $ | 1,939,280,217 | |
| | | | |
The accompanying notes are an integral part of these financial statements.
FI-24
Franklin Templeton Variable Insurance Products Trust
Financial Statements (continued)
Statements of Changes in Net Assets
| | | | | | | | |
| | | Franklin Income
Securities Fund | |
| | | Year Ended December 31, | |
| | | 2009 | | | 2008 | |
| | | | |
Increase (decrease) in net assets: | | | | | | | | |
Operations: | | | | | | | | |
Net investment income | | $ | 431,531,209 | | | $ | 497,775,375 | |
Net realized gain (loss) from investments and foreign currency transactions | | | (456,942,376 | ) | | | (630,979,497 | ) |
Net change in unrealized appreciation (depreciation) on investments and translation of other assets and liabilities denominated in foreign currencies | | | 1,964,691,384 | | | | (2,290,757,956 | ) |
| | | | |
Net increase (decrease) in net assets resulting from operations | | | 1,939,280,217 | | | | (2,423,962,078 | ) |
| | | | |
Distributions to shareholders from: | | | | | | | | |
Net investment income: | | | | | | | | |
Class 1 | | | (46,648,798 | ) | | | (24,795,329 | ) |
Class 2 | | | (437,720,445 | ) | | | (360,749,953 | ) |
Class 4 | | | (19,056,945 | ) | | | (836,031 | ) |
Net realized gains: | | | | | | | | |
Class 1 | | | — | | | | (9,933,051 | ) |
Class 2 | | | — | | | | (151,054,226 | ) |
Class 4 | | | — | | | | (334,915 | ) |
| | | | |
Total distributions to shareholders | | | (503,426,188 | ) | | | (547,703,505 | ) |
| | | | |
Capital share transactions: (Note 2) | | | | | | | | |
Class 1 | | | 328,438,277 | | | | 177,883,831 | |
Class 2 | | | (55,863,777 | ) | | | 262,081,415 | |
Class 4 | | | 151,520,403 | | | | 159,890,193 | |
| | | | |
Total capital share transactions | | | 424,094,903 | | | | 599,855,439 | |
| | | | |
Net increase (decrease) in net assets | | | 1,859,948,932 | | | | (2,371,810,144 | ) |
Net assets: | | | | | | | | |
Beginning of year | | | 5,513,186,461 | | | | 7,884,996,605 | |
| | | | |
End of year | | $ | 7,373,135,393 | | | $ | 5,513,186,461 | |
| | | | |
Undistributed net investment income included in net assets: | | | | | | | | |
End of year | | $ | 448,201,048 | | | $ | 497,923,282 | |
| | | | |
The accompanying notes are an integral part of these financial statements.
FI-25
Franklin Templeton Variable Insurance Products Trust
Notes to Financial Statements
Franklin Income Securities Fund
1. ORGANIZATION AND SIGNIFICANT ACCOUNTING POLICIES
Franklin Templeton Variable Insurance Products Trust (Trust) is registered under the Investment Company Act of 1940, as amended, (1940 Act) as an open-end investment company, consisting of twenty-two separate funds. The Franklin Income Securities Fund (Fund) is included in this report. The financial statements of the remaining funds in the Trust are presented separately. Shares of the Fund are generally sold only to insurance company separate accounts to fund the benefits of variable life insurance policies or variable annuity contracts. The Fund offers three classes of shares: Class 1, Class 2, and Class 4. Each class of shares differs by its distribution fees, voting rights on matters affecting a single class and its exchange privilege.
The following summarizes the Fund’s significant accounting policies.
a. Security Valuation
Equity and other securities listed on a securities exchange or on the NASDAQ National Market System are valued at the last quoted sale price or the official closing price of the day, respectively. Over-the-counter securities and listed securities for which there is no reported sale are valued within the range of the most recent quoted bid and ask prices. Securities that trade in multiple markets or on multiple exchanges are valued according to the broadest and most representative market. Certain equity securities are valued based upon fundamental characteristics or relationships to similar securities.
Corporate debt securities generally trade in the over-the-counter market rather than on a securities exchange. The Fund may utilize independent pricing services, quotations from bond dealers, and information with respect to bond and note transactions, to assist in determining a current market value for each security. The Fund’s pricing services may use valuation models or matrix pricing which considers information with respect to comparable bond and note transactions, quotations from bond dealers, or by reference to other securities that are considered comparable in such characteristics as rating, interest rate and maturity date, option adjusted spread models, prepayment projections, interest rate spreads and yield curves, to determine current value. Debt securities denominated in a foreign currency are converted into their U.S. dollar equivalent at the foreign exchange rate in effect at the close of the NYSE on the date that the values of the foreign debt securities are determined.
Senior secured corporate loans with floating or variable interest rates generally trade in the over-the-counter market rather than on a securities exchange. The Fund may utilize independent pricing services, quotations from loan dealers and other financial institutions, and information with respect to bond and note transactions, to assist in determining a current market value for each security. The Fund’s pricing services use independent market quotations from loan dealers or financial institutions and may incorporate valuation methodologies that consider multiple bond characteristics such as dealer quotes, issuer type, coupon, maturity, weighted average maturity, interest rate spreads and yield curves, cash flow and credit risk/quality analysis, to determine current value.
Foreign equity securities are valued as of the close of trading on the foreign stock exchange on which the security is primarily traded, or the NYSE, whichever is earlier. If no sale is reported at that time, the foreign equity security will be valued within the range of the most recent quoted bid and ask prices. The value is then converted into its U.S. dollar equivalent at the foreign exchange rate in effect at the close of the NYSE on the day that the value of the security is determined.
The Fund has procedures to determine the fair value of individual securities and other assets for which market prices are not readily available or which may not be reliably priced. Methods for valuing these securities may include: fundamental analysis based upon the underlying investment book value, anticipated future cash flows, market changes in comparable or similar securities, matrix pricing, discounts from market prices of similar securities, or discounts applied due to the nature and duration of restrictions on the disposition of the securities. Due to the inherent uncertainty of valuations of such securities, the fair values may differ significantly from the values that would have been used had a ready market for such investments existed. Occasionally, events occur between the time at which trading in a security is completed and the close of the NYSE that might call into question the availability (including the reliability) of the value of a portfolio security held by the Fund. The investment manager monitors price movements following the close of trading in foreign stock markets through a series of country specific
FI-26
Franklin Templeton Variable Insurance Products Trust
Notes to Financial Statements (continued)
Franklin Income Securities Fund
1. ORGANIZATION AND SIGNIFICANT ACCOUNTING POLICIES (continued)
a. Security Valuation (continued)
market proxies (such as baskets of American Depository Receipts, futures contracts and exchange traded funds). These price movements are measured against established trigger thresholds for each specific market proxy to assist in determining if an event has occurred. If such an event occurs, the securities may be valued using fair value procedures, which may include the use of independent pricing services. All security valuation procedures are approved by the Fund’s Board of Trustees.
b. Foreign Currency Translation
Portfolio securities and other assets and liabilities denominated in foreign currencies are translated into U.S. dollars based on the exchange rate of such currencies against U.S. dollars on the date of valuation. The Fund may enter into foreign currency exchange contracts to facilitate transactions denominated in a foreign currency. Purchases and sales of securities, income and expense items denominated in foreign currencies are translated into U.S. dollars at the exchange rate in effect on the transaction date. Occasionally, events may impact the availability or reliability of foreign exchange rates used to convert the U.S. dollar equivalent value. If such an event occurs, the foreign exchange rate will be valued at fair value using procedures established and approved by the Fund’s Board of Trustees.
The Fund does not separately report the effect of changes in foreign exchange rates from changes in market prices on securities held. Such changes are included in net realized and unrealized gain or loss from investments on the Statement of Operations.
Realized foreign exchange gains or losses arise from sales of foreign currencies, currency gains or losses realized between the trade and settlement dates on securities transactions and the difference between the recorded amounts of dividends, interest, and foreign withholding taxes and the U.S. dollar equivalent of the amounts actually received or paid. Net unrealized foreign exchange gains and losses arise from changes in foreign exchange rates on foreign denominated assets and liabilities other than investments in securities held at the end of the reporting period.
c. Joint Repurchase Agreement
The Fund may enter into a joint repurchase agreement whereby its uninvested cash balance is deposited into a joint cash account with other funds managed by the investment manager or an affiliate of the investment manager and is used to invest in one or more repurchase agreements. The value and face amount of the joint repurchase agreement are allocated to the funds based on their pro-rata interest. A repurchase agreement is accounted for as a loan by the Fund to the seller, collateralized by securities which are delivered to the Fund’s custodian. The market value, including accrued interest, of the initial collateralization is required to be at least 102% of the dollar amount invested by the funds, with the value of the underlying securities marked to market daily to maintain coverage of at least 100%. The joint repurchase agreement held by the Fund at year end had been entered into on December 31, 2009. The joint repurchase agreement is valued at cost which approximates market value.
d. Securities Purchased on a Delayed Delivery Basis
The Fund may purchase securities on a delayed delivery basis, with payment and delivery scheduled for a future date. These transactions are subject to market fluctuations and are subject to the risk that the value at delivery may be more or less than the trade date purchase price. Although the Fund will generally purchase these securities with the intention of holding the securities, it may sell the securities before the settlement date. Sufficient assets have been segregated for these securities.
e. Equity-Linked Securities
The Fund may invest in equity-linked securities. Equity-linked securities are hybrid financial instruments that generally combine both debt and equity characteristics into a single note form. Income received from equity linked securities is recorded as realized
FI-27
Franklin Templeton Variable Insurance Products Trust
Notes to Financial Statements (continued)
Franklin Income Securities Fund
1. ORGANIZATION AND SIGNIFICANT ACCOUNTING POLICIES (continued)
e. Equity-Linked Securities (continued)
gains in the Statement of Operations and may be based on the performance of an underlying equity security, an equity index, or an option position. The risks of investing in equity-linked securities include unfavorable price movements in the underlying security and the credit risk of the issuing financial institution. There may be no guarantee of a return of principal with equity linked securities and the appreciation potential may be limited. Equity-linked securities may be more volatile and less liquid than other investments held by the Fund.
f. Senior Floating Rate Interests
Senior secured corporate loans pay interest at rates which are periodically reset by reference to a base lending rate plus a spread. These base lending rates are generally the prime rate offered by a designated U.S. bank or the London InterBank Offered Rate (LIBOR). Senior secured corporate loans often require prepayment of principal from excess cash flows or at the discretion of the borrower. As a result, actual maturity may be substantially less than the stated maturity.
Senior secured corporate loans in which the Fund invests are generally readily marketable, but may be subject to some restrictions on resale.
g. Income Taxes
No provision has been made for U.S. income taxes because it is the Fund’s policy to qualify as a regulated investment company under the Internal Revenue Code and to distribute to shareholders substantially all of its taxable income and net realized gains.
The Fund has reviewed the tax positions, taken on federal income tax returns, for each of the three open tax years and as of December 31, 2009, and has determined that no provision for income tax is required in the Fund’s financial statements.
h. Security Transactions, Investment Income, Expenses and Distributions
Security transactions are accounted for on trade date. Realized gains and losses on security transactions are determined on a specific identification basis. Interest income and estimated expenses are accrued daily. Amortization of premium and accretion of discount on debt securities are included in interest income. Facility fees are recognized as income over the expected term of the loan. Dividend income is recorded on the ex-dividend date. Distributions to shareholders are recorded on the ex-dividend date and are determined according to income tax regulations (tax basis). Distributable earnings determined on a tax basis may differ from earnings recorded in accordance with accounting principles generally accepted in the United States of America. These differences may be permanent or temporary. Permanent differences are reclassified among capital accounts to reflect their tax character. These reclassifications have no impact on net assets or the results of operations. Temporary differences are not reclassified, as they may reverse in subsequent periods.
Common expenses incurred by the Trust are allocated among the funds based on the ratio of net assets of each fund to the combined net assets of the Trust. Fund specific expenses are charged directly to the fund that incurred the expense.
Realized and unrealized gains and losses and net investment income, not including class specific expenses, are allocated daily to each class of shares based upon the relative proportion of net assets of each class. Differences in per share distributions, by class, are generally due to differences in class specific expenses.
i. Accounting Estimates
The preparation of financial statements in accordance with accounting principles generally accepted in the United States of America requires management to make estimates and assumptions that affect the reported amounts of assets and liabilities at the
FI-28
Franklin Templeton Variable Insurance Products Trust
Notes to Financial Statements (continued)
Franklin Income Securities Fund
1. ORGANIZATION AND SIGNIFICANT ACCOUNTING POLICIES (continued)
i. Accounting Estimates (continued)
date of the financial statements and the amounts of income and expenses during the reporting period. Actual results could differ from those estimates.
j. Guarantees and Indemnifications
Under the Trust’s organizational documents, its officers and trustees are indemnified by the Trust against certain liabilities arising out of the performance of their duties to the Trust. Additionally, in the normal course of business, the Trust, on behalf of the Fund, enters into contracts with service providers that contain general indemnification clauses. The Trust’s maximum exposure under these arrangements is unknown as this would involve future claims that may be made against the Trust that have not yet occurred. Currently, the Trust expects the risk of loss to be remote.
2. SHARES OF BENEFICIAL INTEREST
At December 31, 2009, there were an unlimited number of shares authorized (without par value). Transactions in the Fund’s shares were as follows:
| | | | | | | | | | | | | | |
| | | Year Ended December 31, | |
| | | 2009 | | | 2008a | |
| Class 1 Shares: | | Shares | | | Amount | | | Shares | | | Amount | |
Shares sold | | 27,450,254 | | | $ | 349,770,752 | | | 17,900,721 | | | $ | 257,601,912 | |
Shares issued in reinvestment of distributions | | 3,884,163 | | | | 46,648,798 | | | 2,143,727 | | | | 34,728,380 | |
Shares redeemed | | (5,820,524 | ) | | | (67,981,273 | ) | | (8,303,783 | ) | | | (114,446,461 | ) |
| | | | |
Net increase (decrease) | | 25,513,893 | | | $ | 328,438,277 | | | 11,740,665 | | | $ | 177,883,831 | |
| | | | |
Class 2 Shares: | | | | | | | | | | | | | | |
Shares sold | | 28,676,075 | | | $ | 352,470,139 | | | 51,438,684 | | | $ | 783,774,483 | |
Shares issued in reinvestment of distributions | | 37,189,503 | | | | 437,720,445 | | | 32,188,942 | | | | 511,804,179 | |
Shares redeemed | | (70,577,619 | ) | | | (846,054,361 | ) | | (75,101,550 | ) | | | (1,033,497,247 | ) |
| | | | |
Net increase (decrease) | | (4,712,041 | ) | | $ | (55,863,777 | ) | | 8,526,076 | | | $ | 262,081,415 | |
| | | | |
Class 4 Shares: | | | | | | | | | | | | | | |
Shares sold | | 12,441,769 | | | $ | 152,226,979 | | | 11,763,342 | | | $ | 159,393,310 | |
Shares issued on reinvestment of distributions | | 1,593,390 | | | | 19,056,945 | | | 72,348 | | | | 1,170,589 | |
Shares redeemed | | (1,557,805 | ) | | | (19,763,521 | ) | | (54,817 | ) | | | (673,706 | ) |
| | | | |
Net increase (decrease) | | 12,477,354 | | | $ | 151,520,403 | | | 11,780,873 | | | $ | 159,890,193 | |
| | | | |
| aFor | the period February 29, 2008 (effective date) to December 31, 2008 for Class 4. |
FI-29
Franklin Templeton Variable Insurance Products Trust
Notes to Financial Statements (continued)
Franklin Income Securities Fund
3. TRANSACTIONS WITH AFFILIATES
Franklin Resources, Inc. is the holding company for various subsidiaries that together are referred to as Franklin Templeton Investments. Certain officers and trustees of the Trust are also officers and/or directors of the following subsidiaries:
| | |
| Subsidiary | | Affiliation |
Franklin Advisers, Inc. (Advisers) | | Investment manager |
Franklin Templeton Services, LLC (FT Services) | | Administrative manager |
Franklin Templeton Distributors, Inc. (Distributors) | | Principal underwriter |
Franklin Templeton Investor Services, LLC (Investor Services) | | Transfer agent |
a. Management Fees
The Fund pays an investment management fee to Advisers based on the average daily net assets of the Fund as follows:
| | |
| Annualized Fee Rate | | Net Assets |
| 0.625% | | Up to and including $100 million |
| 0.500% | | Over $100 million, up to and including $250 million |
| 0.450% | | Over $250 million, up to and including $7.5 billion |
| 0.440% | | Over $7.5 billion, up to and including $10 billion |
| 0.430% | | Over $10 billion, up to and including $12.5 billion |
| 0.420% | | Over $12.5 billion, up to and including $15 billion |
| 0.400% | | In excess of $15 billion |
b. Administrative Fees
Under an agreement with Advisers, FT Services provides administrative services to the Fund. The fee is paid by Advisers based on average daily net assets, and is not an additional expense of the Fund.
c. Distribution Fees
The Fund’s Board of Trustees has adopted distribution plans for Class 2 and Class 4 shares pursuant to Rule 12b-1 under the 1940 Act. Under the Fund’s compensation distribution plans, the Fund pays Distributors for costs incurred in connection with the servicing, sale and distribution of the Fund’s shares up to 0.35% per year of its average daily net assets of each class. The Board of Trustees has agreed to limit the current rate to 0.25% per year for Class 2.
d. Transfer Agent Fees
Investor Services, under terms of an agreement, performs shareholder servicing for the Fund and is not paid by the Fund for the services.
4. EXPENSE OFFSET ARRANGEMENT
The Fund has entered into an arrangement with its custodian whereby credits realized as a result of uninvested cash balances are used to reduce a portion of the Fund’s custodian expenses. During the year ended December 31, 2009, the custodian fees were reduced as noted in the Statement of Operations.
FI-30
Franklin Templeton Variable Insurance Products Trust
Notes to Financial Statements (continued)
Franklin Income Securities Fund
5. INCOME TAXES
For tax purposes, capital losses may be carried over to offset future capital gains, if any. At December 31, 2009, the capital loss carryforwards were as follows:
| | | |
Capital loss carryforwards expiring in: | | | |
2016 | | $ | 524,982,657 |
2017 | | | 514,368,170 |
| | | |
| | $ | 1,039,350,827 |
| | | |
For tax purposes, realized capital losses occurring subsequent to October 31, may be deferred and treated as occurring on the first day of the following fiscal year. At December 31, 2009, the Fund deferred realized capital losses of $114,122,943.
The tax character of distributions paid during the years ended December 31, 2009 and 2008, was as follows:
| | | | | | |
| | | 2009 | | 2008 |
Distributions paid from: | | | | | | |
Ordinary income | | $ | 503,426,188 | | $ | 440,431,430 |
Long term capital gain | | | — | | | 107,272,075 |
| | | |
| | $ | 503,426,188 | | $ | 547,703,505 |
| | | |
At December 31, 2009, the cost of investments, net unrealized appreciation (depreciation), and undistributed ordinary income for income tax purposes were as follows:
| | | | |
Cost of investments | | $ | 7,488,765,481 | |
| | | | |
| |
Unrealized appreciation | | $ | 639,954,656 | |
Unrealized depreciation | | | (766,144,513 | ) |
| | | | |
Net unrealized appreciation (depreciation) | | $ | (126,189,857 | ) |
| | | | |
Distributable earnings - undistributed ordinary income | | $ | 490,721,692 | |
| | | | |
Net investment income differs for financial statement and tax purposes primarily due to differing treatments of defaulted securities, foreign currency transactions, payments-in-kind, and bond discounts and premiums.
Net realized gains (losses) differ for financial statement and tax purposes primarily due to differing treatments of wash sales, defaulted securities, foreign currency transactions, payments-in-kind, and bond discounts and premiums.
6. INVESTMENT TRANSACTIONS
Purchases and sales of investments (excluding short term securities) for the year ended December 31, 2009, aggregated $2,901,551,830 and $2,453,794,997, respectively.
7. CREDIT RISK AND DEFAULTED SECURITIES
At December 31, 2009, the Fund had 52.56% of its portfolio invested in high yield, senior secured floating rate notes, or other securities rated below investment grade. These securities may be more sensitive to economic conditions causing greater price volatility and are potentially subject to a greater risk of loss due to default than higher rated securities.
FI-31
Franklin Templeton Variable Insurance Products Trust
Notes to Financial Statements (continued)
Franklin Income Securities Fund
7. CREDIT RISK AND DEFAULTED SECURITIES (continued)
The Fund held defaulted securities and/or other securities for which the income has been deemed uncollectible. At December 31, 2009, the aggregate value of these securities was $120,580,903, representing 1.64% of the Fund’s net assets. The Fund discontinues accruing income on securities for which income has been deemed uncollectible and provides an estimate for losses on interest receivable. The securities have been identified on the accompanying Statement of Investments.
8. OTHER CONSIDERATIONS
From time to time, officers, directors or employees of the Fund’s Investment Manager may have discussions or enter into agreements with issuers, underwriters or creditors’ committees which, pursuant to the Fund’s policies and requirements of applicable securities laws, could prevent the Fund from trading in the securities of such company for limited or extended periods of time.
9. CREDIT FACILITY
The Fund, together with other U.S. registered and foreign investment funds (collectively “Borrowers”), managed by Franklin Templeton Investments, are borrowers in a joint syndicated senior unsecured credit facility totaling $725 million (Global Credit Facility) to provide a source of funds to the Borrowers for temporary and emergency purposes, including the ability to meet future unanticipated or unusually large redemption requests. Effective January 22, 2010, the Fund renewed the Global Credit Facility, for a total of $750 million, maturing January 21, 2011.
Under the terms of the Global Credit Facility, the Fund shall, in addition to interest charged on any borrowings made by the Fund and other costs incurred by the Fund, pay its share of fees and expenses incurred in connection with the implementation and maintenance of the Global Credit Facility, based upon its relative share of the aggregate net assets of all of the Borrowers, including an annual commitment fee of 0.10% based upon the unused portion of the Global Credit Facility. During the year ended December 31, 2009, the Fund did not utilize the Global Credit Facility.
10. FAIR VALUE MEASUREMENTS
The Fund follow a fair value hierarchy that distinguishes between market data obtained from independent sources (observable inputs) and the Fund’s own market assumptions (unobservable inputs). These inputs are used in determining the value of the Fund’s investments and are summarized in the following fair value hierarchy:
| | • | | Level 1 – quoted prices in active markets for identical securities |
| | • | | Level 2 – other significant observable inputs (including quoted prices for similar securities, interest rates, prepayment speed, credit risk, etc.) |
| | • | | Level 3 – significant unobservable inputs (including the Fund’s own assumptions in determining the fair value of investments) |
The inputs or methodology used for valuing securities are not an indication of the risk associated with investing in those securities.
FI-32
Franklin Templeton Variable Insurance Products Trust
Notes to Financial Statements (continued)
Franklin Income Securities Fund
10. FAIR VALUE MEASUREMENTS (continued)
The following is a summary of the inputs used as of December 31, 2009, in valuing the Fund’s assets carried at fair value:
| | | | | | | | | | | | | |
| | | Level 1 | | Level 2 | | Level 3 | | | Total |
| | | |
Assets: | | | | | | | | | | | | | |
Investments in Securities: | | | | | | | | | | | | | |
Equity Investmentsa | | | | | | | | | | | | | |
Energy | | $ | 317,138,465 | | $ | 110,165,476 | | $ | — | | | $ | 427,303,941 |
Financials | | | 488,965,466 | | | 27,469,323 | | | — | | | | 516,434,789 |
Health Care | | | 174,444,520 | | | 13,020,115 | | | — | | | | 187,464,635 |
Industrials | | | — | | | 170,400 | | | — | | | | 170,400 |
Information Technology | | | 128,870,000 | | | 6,555,150 | | | — | | | | 135,425,150 |
Materials | | | 65,943,800 | | | 40,427,200 | | | — | | | | 106,371,000 |
All Other Equity Investmentsb | | | 1,179,181,101 | | | — | | | — | | | | 1,179,181,101 |
Senior Floating Rate Interests | | | — | | | 424,308,888 | | | — | | | | 424,308,888 |
Corporate Bonds | | | — | | | 3,790,563,433 | | | — | c | | | 3,790,563,433 |
Convertible Bonds | | | — | | | 99,216,430 | | | — | | | | 99,216,430 |
Short Term Investments | | | — | | | 496,135,857 | | | — | | | | 496,135,857 |
| | | |
Total Investments in Securities | | $ | 2,354,543,352 | | $ | 5,008,032,272 | | $ | — | | | $ | 7,362,575,624 |
| | | |
aIncludes common, preferred, and convertible preferred stock as well as other equity investments.
bFor detailed industry descriptions, see the accompanying statement of investments.
cIncludes securities determined to have no value at December 31, 2009.
At December 31, 2009, the reconciliation of assets in which significant unobservable inputs (Level 3) were used in determining fair value, was as follows:
| | | | | | | | | | | | | | | | | | | |
| | | Balance at
Beginning of
Year | | Net Realized
Gain (Loss) | | Net Change in
Unrealized
Appreciation
(Depreciation) | | Net Purchases
(Sales) | | Transfer In (Out) of
Level 3 | | | Balance at
End of Year |
| | | |
Assets | | | | | | | | | | | | | | | | | | | |
Equity Investments: | | | | | | | | | | | | | | | | | | | |
Financials | | $ | 12,874,075 | | $ | — | | $ | — | | $ | — | | $ | (12,874,075 | ) | | $ | — |
11. NEW ACCOUNTING PRONOUNCEMENTS
In January 2010, the Financial Accounting Standards Board issued Accounting Standards Update (ASU) No. 2010-6, Fair Value Measurements and Disclosures (Topic 820): Improving Disclosures about Fair Value Measurements. ASU No. 2010-6 enhances and clarifies existing fair value measurement disclosure requirements and is effective for interim and annual periods beginning after December 15, 2009. The Fund is currently evaluating the impact, if any, of applying the provisions of ASU No. 2010-6.
FI-33
Franklin Templeton Variable Insurance Products Trust
Notes to Financial Statements (continued)
Franklin Income Securities Fund
12. SUBSEQUENT EVENTS
The Fund has evaluated subsequent events through February 10, 2010, the issuance date of the financial statements and determined that no events have occurred that require disclosure.
ABBREVIATIONS
| | |
| Currency | | Selected Portfolio |
| EUR - Euro | | FRN - Floating Rate Note |
| | L/C - Letter of Credit |
| | MTN - Medium Term Note |
| | PIK - Payment-In-Kind |
FI-34
Franklin Templeton Variable Insurance Products Trust
Franklin Income Securities Fund
Report of Independent Registered Public Accounting Firm
To the Board of Trustees and Shareholders of
Franklin Templeton Variable Insurance Products Trust
In our opinion, the accompanying statement of assets and liabilities, including the statement of investments, and the related statements of operations and of changes in net assets and the financial highlights present fairly, in all material respects, the financial position of Franklin Income Securities Fund (one of the funds constituting the Franklin Templeton Variable Insurance Products Trust, hereafter referred to as the “Fund”) at December 31, 2009, the results of its operations for the year then ended, the changes in its net assets and the financial highlights for the periods presented, in conformity with accounting principles generally accepted in the United States of America. These financial statements and financial highlights (hereafter referred to as “financial statements”) are the responsibility of the Fund’s management. Our responsibility is to express an opinion on these financial statements based on our audits. We conducted our audits of these financial statements in accordance with the standards of the Public Company Accounting Oversight Board (United States). Those standards require that we plan and perform the audit to obtain reasonable assurance about whether the financial statements are free of material misstatement. An audit includes examining, on a test basis, evidence supporting the amounts and disclosures in the financial statements, assessing the accounting principles used and significant estimates made by management, and evaluating the overall financial statement presentation. We believe that our audits, which included confirmation of securities at December 31, 2009 by correspondence with the custodian and brokers, provide a reasonable basis for our opinion.
PricewaterhouseCoopers LLP
San Francisco, California
February 10, 2010
FI-35
Franklin Templeton Variable Insurance Products Trust
Tax Designation (unaudited)
Franklin Income Securities Fund
Under Section 854(b)(2) of the Internal Revenue Code, the Fund designates 15.68% of the ordinary income dividends as income qualifying for the dividends received deduction for the fiscal year ended December 31, 2009.
FI-36
FRANKLIN LARGE CAP GROWTH SECURITIES FUND
We are pleased to bring you Franklin Large Cap Growth Securities Fund’s annual report for the fiscal year ended December 31, 2009.
Performance Summary as of 12/31/09
Average annual total return of Class 4 shares* represents the average annual change in value, assuming reinvestment of dividends and capital gains. Average returns smooth out variations in returns, which can be significant; they are not the same as year-by-year results.
Periods ended 12/31/09
| | | | | | |
| | | 1-Year | | 5-Year | | 10-Year |
Average Annual Total Return | | +29.58% | | +0.32% | | +0.11% |
*For the period beginning 2/29/08, Class 4 performance reflects a 12b-1 fee expense of 0.35% per year, which affects future performance. Class 4 performance prior to 2/29/08 reflects historical Class 1 performance, which does not include a 12b-1 fee expense. Since 2/29/08 (effective date), the average annual total return of Class 4 shares was -4.20%.
Total Return Index Comparison
for a Hypothetical $10,000 Investment (1/1/00–12/31/09)
The graph below shows the change in value of a hypothetical $10,000 investment in the Fund over the indicated period and includes reinvestment of any income or distributions. The Fund’s performance* is compared to the performance of the Standard & Poor’s 500 Index (S&P 500) and the Russell 1000® Growth Index. One cannot invest directly in an index, and an index is not representative of the Fund’s portfolio. Please see Important Notes to Performance Information preceding the Fund Summaries.
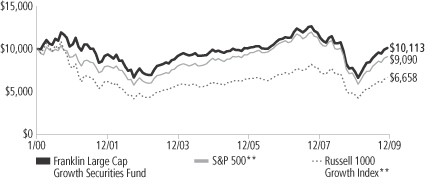
**Source: © 2009 Morningstar. Please see Index Descriptions following the Fund Summaries.
Franklin Large Cap Growth Securities Fund Class 4
Performance reflects the Fund’s Class 4 operating expenses, but does not include any contract fees, expenses or sales charges. If they had been included, performance would be lower. These charges and deductions, particularly for variable life policies, can have a significant effect on contract values and insurance benefits. See the contract prospectus for a complete description of these expenses, including sales charges.
Performance data represent past performance, which does not guarantee future results. Investment return and principal value will fluctuate, and you may have a gain or loss when you sell your shares.
Current performance may differ from figures shown.
FLG-1
Fund Goal and Main Investments: Franklin Large Cap Growth Securities Fund seeks capital appreciation. The Fund normally invests at least 80% of its net assets in investments of large capitalization companies and normally invests predominantly in equity securities. For this Fund, large capitalization companies are those with market capitalization values within those of the top 50% of companies in the Russell 1000 Index at the time of purchase.1
Performance Overview
You can find the Fund’s one-year total return in the Performance Summary. The Fund outperformed its primary benchmark, the S&P 500, which had a +26.46% total return.2 The Fund underperformed its secondary benchmark, the Russell 1000 Growth Index, which had a +37.21% total return for the same period.2
Economic and Market Overview
The U.S. economy ended 2009 in much better shape than it began. Economic challenges remain, such as stalled consumer confidence and job prospects for the unemployed as stimulus measures wind down. However, several reports pointed to improving economic conditions. In the year’s second half, corporate profit growth was higher than earlier estimates, which may allow businesses to build inventory following a long period of inventory drawdowns.
Throughout the year, the Federal Open Market Committee kept monetary policy unchanged, announcing it intends to hold the federal funds target rate in the 0% to 0.25% range “for an extended period” as it lays the groundwork for an eventual tightening of monetary policy. Late in the period, the labor market improved somewhat as the economy lost fewer jobs than expected and the unemployment rate fell slightly, dropping from a period high of 10.2% in October to 10.0% at period-end.3
U.S. gross domestic product grew at a 2.2% annualized rate in 2009’s third quarter after shrinking by 0.7% in the prior three months. This was the first expansion since 2008’s second quarter. As economic conditions improved, oil prices increased from $45 per barrel in December 2008 to $79 at year-end, still well below 2008 highs. December’s inflation rate was an annualized 2.7%.3 Core inflation, which excludes
1. Please see Index Descriptions following the Fund Summaries.
2. Source: © 2009 Morningstar. One cannot invest directly in an index, and an index is not representative of the Fund’s portfolio. Please see Index Descriptions following the Fund Summaries.
3. Source: Bureau of Labor Statistics.
Fund Risks: The Fund’s investments in stocks may offer the potential for long-term gains but can be subject to short-term price fluctuations. By having substantial investments in particular sectors from time to time, such as the technology sector (including health care technology, electronic technology and technology services), which has been among the market’s most volatile sectors, as well as the communications and financial services sectors, the Fund may be at greater risk from adverse developments in a sector than a fund that invests more broadly. Foreign investing involves additional risks, including currency fluctuations, economic instability, market volatility, and political and social instability. The Fund’s prospectus also includes a description of the main investment risks.
FLG-2
food and energy costs, rose at a 1.8% annualized rate, which was within the Federal Reserve Board’s informal target range of 1.5% to 2.0%.3
Most stocks suffered significant losses through early March 2009 as investors worried about an uncertain future. Stocks then recovered from 12-year lows as economic data improved and investors perceived many bargains among the bear market fallout. For the 12 months under review, the blue chip stocks of the Dow Jones Industrial Average delivered a total return of +22.68%, while the broader S&P 500 posted a +26.46% total return and the technology-heavy NASDAQ Composite Index returned +45.32%.2 All sectors posted gains for the period, with the strongest returns from the information technology, materials and consumer discretionary sectors.
Investment Strategy
We are research-driven, fundamental investors pursuing a bottom-up strategy. As such, we focus primarily on individual securities that present, in our opinion, the best trade-off between potential return and risk. We seek out companies trading at the greatest discount to our estimates of their fair worth, with worth most often being a function of future growth potential. In making these judgments, we also take into account risks and uncertainties that are inherent to our growth and worth estimates. We rely on a team of analysts to help provide in-depth industry expertise and use both qualitative and quantitative analysis to evaluate companies for distinct, sustainable and competitive advantages likely to lead to growth in earnings and/or cash flow. Competitive advantages such as a particular product niche, proven technology, sound financial profits and records, or strong management are all factors we believe may contribute to future cash flow and earnings growth potential.
Manager’s Discussion
Looking back on the key factors impacting the Fund’s returns during the year under review, we would like to remind shareholders that our investment strategy is primarily bottom up and driven by individual stock selection. However, we recognize that a sector-based discussion can be a helpful way to organize a portfolio review of key performance drivers.
From a sector perspective, the Fund’s performance relative to the S&P 500 was helped by our stock selection in the health care sector. In particular, our holdings in biotechnology company Genentech4 and
4. This holding is not an index component.
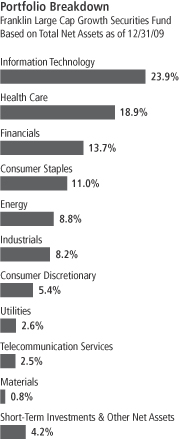
FLG-3
pharmaceutical manufacturer Schering-Plough, which benefited from its merger with Merck, contributed to relative returns. The Fund’s overweighted allocation and stock selection in the information technology sector also aided relative results partly due to our holdings in computer storage and data management company NetApp; information technology software and services provider International Business Machines; and laboratory analysis equipment manufacturer Agilent Technologies. Our underweighting and stock selection in the industrials sector also boosted the Fund’s relative performance, largely due to holdings including diversified technology, media and financial services company General Electric, and metal fabrication company Precision Castparts.
Other key contributors to relative Fund returns included beverage manufacturer Hansen Natural,4 independent investment management company Invesco and diversified consumer products manufacturer Procter & Gamble.
The Fund’s underweighted position in the consumer discretionary sector relative to the benchmark hampered performance as that sector was one of the index’s strongest for the year. Our underweighted allocation and stock selection in the materials sector, another index leader, also hurt relative Fund performance. Our stock selection in the financials sector also hampered relative performance largely due to our investment in common shares of financial services company Bank of America.4
Other key detractors from relative Fund returns included electricity and natural gas providers Allegheny Energy and Exelon and biotechnology company Genzyme. In addition, food and staples retailers Safeway and Wal-Mart Stores lost value and weighed on relative performance.
Thank you for your participation in Franklin Large Cap Growth Securities Fund. We look forward to serving your future investment needs.
The foregoing information reflects our analysis, opinions and portfolio holdings as of December 31, 2009, the end of the reporting period. The way we implement our main investment strategies and the resulting portfolio holdings may change depending on factors such as market and economic conditions. These opinions may not be relied upon as investment advice or an offer for a particular security. The information is not a complete analysis of every aspect of any market, country, industry, security or the Fund. Statements of fact are from sources considered reliable, but the investment manager makes no representation or warranty as to their completeness or accuracy. Although historical performance is no guarantee of future results, these insights may help you understand our investment management philosophy.
Top 10 Holdings
Franklin Large Cap Growth Securities Fund
12/31/09
| | |
Company
Sector/Industry | | % of Total
Net Assets |
| Exxon Mobil Corp. | | 3.4% |
| Energy | | |
| Microsoft Corp. | | 2.9% |
| Information Technology | | |
| Hewlett-Packard Co. | | 2.7% |
| Information Technology | | |
| International Business Machines Corp. | | 2.5% |
| Information Technology | | |
| Abbott Laboratories | | 2.3% |
| Health Care | | |
| Northern Trust Corp. | | 2.3% |
| Financials | | |
| Wells Fargo & Co. | | 2.3% |
| Financials | | |
| JPMorgan Chase & Co. | | 2.3% |
| Financials | | |
| NetApp Inc. | | 2.3% |
Information Technology | | |
| Merck & Co. Inc. | | 2.2% |
| Health Care | | |
The dollar value, number of shares or principal amount, and names of all portfolio holdings are listed in the Fund’s Statement of Investments.
FLG-4
Fund Expenses
As an investor in a variable insurance contract (Contract) that indirectly provides for investment in an underlying mutual fund, you can incur transaction and/or ongoing expenses at both the Fund level and the Contract level.
| • | | Transaction expenses can include sales charges (loads) on purchases, redemption fees, surrender fees, transfer fees and premium taxes. |
| • | | Ongoing expenses can include management fees, distribution and service (12b-1) fees, contract fees, annual maintenance fees, mortality and expense risk fees and other fees and expenses. All mutual funds and Contracts have some types of ongoing expenses. |
The expenses shown in the table are meant to highlight ongoing expenses at the Fund level only and do not include ongoing expenses at the Contract level, or transaction expenses at either the Fund or Contract level. While the Fund does not have transaction expenses, if the transaction and ongoing expenses at the Contract level were included, the expenses shown would be higher. You should consult your Contract prospectus or disclosure document for more information.
The table shows Fund-level ongoing expenses and can help you understand these expenses and compare them with those of other mutual funds offered through the Contract. The table assumes a $1,000 investment held for the six months indicated. Please refer to the Fund prospectus for additional information on operating expenses.
Actual Fund Expenses
The first line (Actual) of the table provides actual account values and expenses. The “Ending Account Value” is derived from the Fund’s actual return, which includes the effect of ongoing Fund expenses, but does not include the effect of ongoing Contract expenses.
You can estimate the Fund-level expenses you incurred during the period by following these steps. Of course, your account value and expenses will differ from those in this illustration:
| 1. | Divide your account value by $1,000. |
If an account had an $8,600 value, then $8,600 ÷ $1,000 = 8.6.
| 2. | Multiply the result by the number under the heading “Fund-Level Expenses Incurred During Period.” |
If Fund-Level Expenses Incurred During Period were $7.50, then 8.6 x $7.50 = $64.50.
In this illustration, the estimated expenses incurred this period at the Fund level are $64.50.
Franklin Large Cap Growth Securities Fund Class 4
FLG-5
Hypothetical Example for Comparison with Other Mutual Funds
Information in the second line (Hypothetical) of the table can help you compare ongoing expenses of the Fund with those of other mutual funds offered through the Contract. This information may not be used to estimate the actual ending account balance or expenses you incurred during the period. The hypothetical “Ending Account Value” is based on the Fund’s actual expense ratio and an assumed 5% annual rate of return before expenses, which does not represent the Fund’s actual return. The figure under the heading “Fund-Level Expenses Incurred During Period” shows the hypothetical expenses your account would have incurred under this scenario. You can compare this figure with the 5% hypothetical examples that appear in shareholder reports of other funds offered through a Contract.
| | | | | | | | | |
| Class 4 | | Beginning
Account Value 7/1/09 | | Ending
Account
Value 12/31/09 | | Fund-Level
Expenses Incurred
During Period*
7/1/09–12/31/09 |
Actual | | $ | 1,000 | | $ | 1,194.50 | | $ | 6.47 |
Hypothetical (5% return before expenses) | | $ | 1,000 | | $ | 1,019.31 | | $ | 5.96 |
*Expenses are calculated using the most recent six-month annualized expense ratio for the Fund’s Class 4 shares (1.17%), which does not include any ongoing expenses of the Contract for which the Fund is an investment option, multiplied by the average account value over the period, multiplied by 184/365 to reflect the one-half year period.
FLG-6
Franklin Templeton Variable Insurance Products Trust
Financial Highlights
Franklin Large Cap Growth Securities Fund
| | | | | | | | | | | | | | | | | | | | |
| | | Year Ended December 31, | |
| Class 1 | | 2009 | | | 2008 | | | 2007 | | | 2006 | | | 2005 | |
| | | | |
Per share operating performance | | | | | | | | | | | | | | | | | | | | |
(for a share outstanding throughout the year) | | | | | | | | | | | | | | | | | | | | |
Net asset value, beginning of year | | $ | 10.66 | | | $ | 17.51 | | | $ | 16.70 | | | $ | 15.17 | | | $ | 15.08 | |
| | | | |
Income from investment operationsa: | | | | | | | | | | | | | | | | | | | | |
Net investment incomeb | | | 0.12 | | | | 0.17 | | | | 0.21 | | | | 0.17 | | | | 0.17 | |
Net realized and unrealized gains (losses) | | | 3.04 | | | | (5.82 | ) | | | 0.89 | | | | 1.51 | | | | 0.02 | |
| | | | |
Total from investment operations | | | 3.16 | | | | (5.65 | ) | | | 1.10 | | | | 1.68 | | | | 0.19 | |
| | | | |
Less distributions from: | | | | | | | | | | | | | | | | | | | | |
Net investment income | | | (0.20 | ) | | | (0.24 | ) | | | (0.16 | ) | | | (0.15 | ) | | | (0.10 | ) |
Net realized gains | | | — | | | | (0.96 | ) | | | (0.13 | ) | | | — | | | | — | |
| | | | |
Total distributions | | | (0.20 | ) | | | (1.20 | ) | | | (0.29 | ) | | | (0.15 | ) | | | (0.10 | ) |
| | | | |
Net asset value, end of year | | $ | 13.62 | | | $ | 10.66 | | | $ | 17.51 | | | $ | 16.70 | | | $ | 15.17 | |
| | | | |
| | | | | |
Total returnc | | | 30.04% | | | | (34.39)% | | | | 6.53% | | | | 11.17% | | | | 1.31% | |
Ratios to average net assets | | | | | | | | | | | | | | | | | | | | |
Expensesd | | | 0.81% | | | | 0.77% | | | | 0.74% | | | | 0.76% | | | | 0.76% | |
Net investment income | | | 1.03% | | | | 1.19% | | | | 1.21% | | | | 1.11% | | | | 1.14% | |
| | | | | |
Supplemental data | | | | | | | | | | | | | | | | | | | | |
Net assets, end of year (000’s) | | $ | 58,287 | | | $ | 51,651 | | | $ | 96,920 | | | $ | 114,929 | | | $ | 136,464 | |
Portfolio turnover rate | | | 71.95% | | | | 66.04% | | | | 50.67% | | | | 50.97% | | | | 39.44% | |
aThe amount shown for a share outstanding throughout the period may not correlate with the Statement of Operations for the period due to the timing of sales and repurchases of the Fund shares in relation to income earned and/or fluctuating market value of the investments of the Fund.
bBased on average daily shares outstanding.
cTotal return does not include any fees, charges or expenses imposed by the variable annuity and life insurance contracts for which the Franklin Templeton Variable Insurance Products Trust serves as an underlying investment vehicle.
dBenefit of expense reduction rounds to less than 0.01%.
The accompanying notes are an integral part of these financial statements.
FLG-7
Franklin Templeton Variable Insurance Products Trust
Financial Highlights (continued)
Franklin Large Cap Growth Securities Fund
| | | | | | | | | | | | | | | | | | | | |
| | | Year Ended December 31, | |
| Class 2 | | 2009 | | | 2008 | | | 2007 | | | 2006 | | | 2005 | |
| | | | |
Per share operating performance | | | | | | | | | | | | | | | | | | | | |
(for a share outstanding throughout the year) | | | | | | | | | | | | | | | | | | | | |
Net asset value, beginning of year | | $ | 10.50 | | | $ | 17.25 | | | $ | 16.47 | | | $ | 14.97 | | | $ | 14.90 | |
| | | | |
Income from investment operationsa: | | | | | | | | | | | | | | | | | | | | |
Net investment incomeb | | | 0.09 | | | | 0.13 | | | | 0.17 | | | | 0.13 | | | | 0.13 | |
Net realized and unrealized gains (losses) | | | 3.00 | | | | (5.73 | ) | | | 0.87 | | | | 1.49 | | | | 0.03 | |
| | | | |
Total from investment operations | | | 3.09 | | | | (5.60 | ) | | | 1.04 | | | | 1.62 | | | | 0.16 | |
| | | | |
Less distributions from: | | | | | | | | | | | | | | | | | | | | |
Net investment income | | | (0.16 | ) | | | (0.19 | ) | | | (0.13 | ) | | | (0.12 | ) | | | (0.09 | ) |
Net realized gains | | | — | | | | (0.96 | ) | | | (0.13 | ) | | | — | | | | — | |
| | | | |
Total distributions | | | (0.16 | ) | | | (1.15 | ) | | | (0.26 | ) | | | (0.12 | ) | | | (0.09 | ) |
| | | | |
Net asset value, end of year | | $ | 13.43 | | | $ | 10.50 | | | $ | 17.25 | | | $ | 16.47 | | | $ | 14.97 | |
| | | | |
| | | | | |
Total returnc | | | 29.73% | | | | (34.53)% | | | | 6.23% | | | | 10.90% | | | | 1.06% | |
Ratios to average net assets | | | | | | | | | | | | | | | | | | | | |
Expensesd | | | 1.06% | | | | 1.02% | | | | 0.99% | | | | 1.01% | | | | 1.01% | |
Net investment income | | | 0.78% | | | | 0.94% | | | | 0.96% | | | | 0.86% | | | | 0.89% | |
| | | | | |
Supplemental data | | | | | | | | | | | | | | | | | | | | |
Net assets, end of year (000’s) | | $ | 373,821 | | | $ | 328,597 | | | $ | 642,351 | | | $ | 636,592 | | | $ | 510,395 | |
Portfolio turnover rate | | | 71.95% | | | | 66.04% | | | | 50.67% | | | | 50.97% | | | | 39.44% | |
aThe amount shown for a share outstanding throughout the period may not correlate with the Statement of Operations for the period due to the timing of sales and repurchases of the Fund shares in relation to income earned and/or fluctuating market value of the investments of the Fund.
bBased on average daily shares outstanding.
cTotal return does not include any fees, charges or expenses imposed by the variable annuity and life insurance contracts for which the Franklin Templeton Variable Insurance Products Trust serves as an underlying investment vehicle.
dBenefit of expense reduction rounds to less than 0.01%.
The accompanying notes are an integral part of these financial statements.
FLG-8
Franklin Templeton Variable Insurance Products Trust
Financial Highlights (continued)
Franklin Large Cap Growth Securities Fund
| | | | | | | | |
| | | Year Ended
December 31, | |
| Class 4 | | 2009 | | | 2008a | |
| | | | |
Per share operating performance | | | | | | | | |
(for a share outstanding throughout the year) | | | | | | | | |
Net asset value, beginning of year | | $ | 10.62 | | | $ | 16.05 | |
| | | | |
Income from investment operationsb: | | | | | | | | |
Net investment incomec | | | 0.09 | | | | 0.11 | |
Net realized and unrealized gains (losses) | | | 3.02 | | | | (4.34 | ) |
| | | | |
Total from investment operations | | | 3.11 | | | | (4.23 | ) |
| | | | |
Less distributions from: | | | | | | | | |
Net investment income | | | (0.16 | ) | | | (0.24 | ) |
Net realized gains | | | — | | | | (0.96 | ) |
| | | | |
Total distributions | | | (0.16 | ) | | | (1.20 | ) |
| | | | |
Net asset value, end of year | | $ | 13.57 | | | $ | 10.62 | |
| | | | |
| | |
Total returnd | | | 29.58% | | | | (28.68)% | |
Ratios to average net assetse | | | | | | | | |
Expensesf | | | 1.16% | | | | 1.12% | |
Net investment income | | | 0.68% | | | | 0.84% | |
| | |
Supplemental data | | | | | | | | |
Net assets, end of year (000’s) | | $ | 4 | | | $ | 3 | |
Portfolio turnover rate | | | 71.95% | | | | 66.04% | |
aFor the period February 29, 2008 (effective date) to December 31, 2008.
bThe amount shown for a share outstanding throughout the period may not correlate with the Statement of Operations for the period due to the timing of sales and repurchases of the Fund shares in relation to income earned and/or fluctuating market value of the investments of the Fund.
cBased on average daily shares outstanding.
dTotal return does not include any fees, charges or expenses imposed by the variable annuity and life insurance contracts for which the Franklin Templeton Variable Insurance Products Trust serves as an underlying investment vehicle. Total return is not annualized for periods less than one year.
eRatios are annualized for periods less than one year.
fBenefit of expense reduction rounds to less than 0.01%.
The accompanying notes are an integral part of these financial statements.
FLG-9
Franklin Templeton Variable Insurance Products Trust
Statement of Investments, December 31, 2009
| | | | | | | |
| Franklin Large Cap Growth Securities Fund | | Country | | Shares | | Value |
Common Stocks 95.8% | | | | | | | |
Consumer Discretionary 5.4% | | | | | | | |
Burger King Holdings Inc. | | United States | | 289,400 | | $ | 5,446,508 |
CBS Corp., B | | United States | | 325,900 | | | 4,578,895 |
aDollar General Corp. | | United States | | 64,700 | | | 1,451,221 |
aIconix Brand Group Inc. | | United States | | 211,100 | | | 2,670,415 |
aKohl’s Corp. | | United States | | 43,500 | | | 2,345,955 |
NIKE Inc., B | | United States | | 35,800 | | | 2,365,306 |
Target Corp. | | United States | | 54,200 | | | 2,621,654 |
The Walt Disney Co. | | United States | | 61,200 | | | 1,973,700 |
| | | | | | | |
| | | | | | | 23,453,654 |
| | | | | | | |
Consumer Staples 11.0% | | | | | | | |
CVS Caremark Corp. | | United States | | 285,100 | | | 9,183,071 |
aHansen Natural Corp. | | United States | | 74,100 | | | 2,845,440 |
PepsiCo Inc. | | United States | | 78,000 | | | 4,742,400 |
Philip Morris International Inc. | | United States | | 141,600 | | | 6,823,704 |
The Procter & Gamble Co. | | United States | | 94,200 | | | 5,711,346 |
Safeway Inc. | | United States | | 221,700 | | | 4,719,993 |
Wal-Mart Stores Inc. | | United States | | 96,700 | | | 5,168,615 |
Walgreen Co. | | United States | | 223,354 | | | 8,201,559 |
| | | | | | | |
| | | | | | | 47,396,128 |
| | | | | | | |
Energy 8.8% | | | | | | | |
ConocoPhillips | | United States | | 154,200 | | | 7,874,994 |
Devon Energy Corp. | | United States | | 50,000 | | | 3,675,000 |
Exxon Mobil Corp. | | United States | | 216,400 | | | 14,756,316 |
Marathon Oil Corp. | | United States | | 224,200 | | | 6,999,524 |
Schlumberger Ltd. | | United States | | 73,900 | | | 4,810,151 |
| | | | | | | |
| | | | | | | 38,115,985 |
| | | | | | | |
Financials 13.7% | | | | | | | |
The Allstate Corp. | | United States | | 178,109 | | | 5,350,394 |
Bank of America Corp. | | United States | | 227,700 | | | 3,429,162 |
aBerkshire Hathaway Inc., B | | United States | | 1,700 | | | 5,586,200 |
Invesco Ltd. | | United States | | 186,100 | | | 4,371,489 |
JPMorgan Chase & Co. | | United States | | 235,240 | | | 9,802,451 |
Northern Trust Corp. | | United States | | 189,100 | | | 9,908,840 |
T. Rowe Price Group Inc. | | United States | | 64,600 | | | 3,439,950 |
U.S. Bancorp | | United States | | 328,927 | | | 7,404,147 |
Wells Fargo & Co. | | United States | | 364,200 | | | 9,829,758 |
| | | | | | | |
| | | | | | | 59,122,391 |
| | | | | | | |
Health Care 18.9% | | | | | | | |
Abbott Laboratories | | United States | | 187,490 | | | 10,122,585 |
Aetna Inc. | | United States | | 166,600 | | | 5,281,220 |
aAmgen Inc. | | United States | | 58,000 | | | 3,281,060 |
aCelgene Corp. | | United States | | 69,100 | | | 3,847,488 |
aExpress Scripts Inc. | | United States | | 59,400 | | | 5,135,130 |
aGenzyme Corp. | | United States | | 96,800 | | | 4,744,168 |
aGilead Sciences Inc. | | United States | | 84,200 | | | 3,644,176 |
Johnson & Johnson | | United States | | 100,400 | | | 6,466,764 |
Medtronic Inc. | | United States | | 150,600 | | | 6,623,388 |
Merck & Co. Inc. | | United States | | 258,375 | | | 9,441,022 |
aMyriad Genetics Inc. | | United States | | 137,100 | | | 3,578,310 |
aOnyx Pharmaceuticals Inc. | | United States | | 62,434 | | | 1,831,814 |
FLG-10
Franklin Templeton Variable Insurance Products Trust
Statement of Investments, December 31, 2009 (continued)
| | | | | | | |
| Franklin Large Cap Growth Securities Fund | | Country | | Shares | | Value |
Common Stocks (continued) | | | | | | | |
Health Care (continued) | | | | | | | |
Roche Holding AG, ADR | | Switzerland | | 201,600 | | $ | 8,507,520 |
Teva Pharmaceutical Industries Ltd., ADR | | Israel | | 166,500 | | | 9,353,970 |
| | | | | | | |
| | | | | | | 81,858,615 |
| | | | | | | |
Industrials 8.2% | | | | | | | |
Expeditors International of Washington Inc. | | United States | | 69,400 | | | 2,410,262 |
FedEx Corp. | | United States | | 53,900 | | | 4,497,955 |
Flowserve Corp. | | United States | | 47,960 | | | 4,533,659 |
Fluor Corp. | | United States | | 82,200 | | | 3,702,288 |
General Dynamics Corp. | | United States | | 46,400 | | | 3,163,088 |
General Electric Co. | | United States | | 312,500 | | | 4,728,125 |
aJacobs Engineering Group Inc. | | United States | | 11,200 | | | 421,232 |
Pitney Bowes Inc. | | United States | | 180,000 | | | 4,096,800 |
Precision Castparts Corp. | | United States | | 21,100 | | | 2,328,385 |
United Technologies Corp. | | United States | | 76,900 | | | 5,337,629 |
| | | | | | | |
| | | | | | | 35,219,423 |
| | | | | | | |
Information Technology 23.9% | | | | | | | |
aAgilent Technologies Inc. | | United States | | 182,300 | | | 5,664,061 |
aApple Inc. | | United States | | 30,200 | | | 6,367,972 |
aCisco Systems Inc. | | United States | | 208,200 | | | 4,984,308 |
aEMC Corp. | | United States | | 310,000 | | | 5,415,700 |
aFLIR Systems Inc. | | United States | | 141,200 | | | 4,620,064 |
aGoogle Inc., A | | United States | | 11,900 | | | 7,377,762 |
Hewlett-Packard Co. | | United States | | 224,400 | | | 11,558,844 |
Intel Corp. | | United States | | 364,900 | | | 7,443,960 |
International Business Machines Corp. | | United States | | 81,900 | | | 10,720,710 |
Microsoft Corp. | | United States | | 416,600 | | | 12,702,134 |
aNetApp Inc. | | United States | | 284,400 | | | 9,780,516 |
Oracle Corp. | | United States | | 104,700 | | | 2,569,338 |
aPolycom Inc. | | United States | | 157,200 | | | 3,925,284 |
QUALCOMM Inc. | | United States | | 182,500 | | | 8,442,450 |
Visa Inc., A | | United States | | 21,500 | | | 1,880,390 |
| | | | | | | |
| | | | | | | 103,453,493 |
| | | | | | | |
Materials 0.8% | | | | | | | |
Randgold Resources Ltd., ADR | | United Kingdom | | 43,900 | | | 3,473,368 |
| | | | | | | |
Telecommunication Services 2.5% | | | | | | | |
AT&T Inc. | | United States | | 157,300 | | | 4,409,119 |
aNII Holdings Inc. | | United States | | 101,750 | | | 3,416,765 |
Vodafone Group PLC, ADR | | United Kingdom | | 131,300 | | | 3,031,717 |
| | | | | | | |
| | | | | | | 10,857,601 |
| | | | | | | |
Utilities 2.6% | | | | | | | |
Constellation Energy Group | | United States | | 76,450 | | | 2,688,746 |
Exelon Corp. | | United States | | 172,280 | | | 8,419,324 |
| | | | | | | |
| | | | | | | 11,108,070 |
| | | | | | | |
Total Common Stocks (Cost $319,122,821) | | | | | | | 414,058,728 |
| | | | | | | |
FLG-11
Franklin Templeton Variable Insurance Products Trust
Statement of Investments, December 31, 2009 (continued)
| | | | | | | | | |
| Franklin Large Cap Growth Securities Fund | | Country | | Principal
Amount | | Value | |
Short Term Investments (Cost $20,103,794) 4.7% | | | | | | | | | |
Repurchase Agreements 4.7% | | | | | | | | | |
bJoint Repurchase Agreement, 0.003%, 1/04/10 (Maturity Value $20,103,801) | | United States | | $ | 20,103,794 | | $ | 20,103,794 | |
Banc of America Securities LLC (Maturity Value $2,361,996) | | | | | | | | | |
BNP Paribas Securities Corp. (Maturity Value $4,723,791) | | | | | | | | | |
Credit Suisse Securities (USA) LLC (Maturity Value $3,936,726) | | | | | | | | | |
Deutsche Bank Securities Inc. (Maturity Value $1,208,037) | | | | | | | | | |
HSBC Securities (USA) Inc. (Maturity Value $3,936,726) | | | | | | | | | |
Morgan Stanley & Co. Inc. (Maturity Value $3,149,260) | | | | | | | | | |
UBS Securities LLC (Maturity Value $787,265) | | | | | | | | | |
Collateralized by U.S. Government Agency Securities, 0.50% - 7.625%, 3/30/10 - 2/09/28; cU.S. Government Agency Discount Notes, 9/21/10; cU.S. Treasury Bills, 8/26/10 -12/16/10; and U.S. Treasury Notes, 0.875% - 4.25%, 5/31/11 - 11/15/14 | | | | | | | | | |
| | | | | | | | | |
Total Investments (Cost $339,226,615) 100.5% | | | | | | | | 434,162,522 | |
Other Assets, less Liabilities (0.5)% | | | | | | | | (2,050,120 | ) |
| | | | | | | | | |
Net Assets 100.0% | | | | | | | $ | 432,112,402 | |
| | | | | | | | | |
See Abbreviations on page FLG-21.
aNon-income producing.
bSee Note 1(c) regarding joint repurchase agreement.
cThe security is traded on a discount basis with no stated coupon rate.
The accompanying notes are an integral part of these financial statements.
FLG-12
Franklin Templeton Variable Insurance Products Trust
Financial Statements
Statement of Assets and Liabilities
December 31, 2009
| | | | |
| | | Franklin Large
Cap Growth
Securities Fund | |
Assets: | | | | |
Investments in securities: | | | | |
Cost - Unaffiliated issuers | | $ | 319,122,821 | |
Cost - Repurchase agreements | | | 20,103,794 | |
| | | | |
Total cost of investments | | $ | 339,226,615 | |
| | | | |
Value - Unaffiliated issuers | | $ | 414,058,728 | |
Value - Repurchase agreements | | | 20,103,794 | |
| | | | |
Total value of investments | | | 434,162,522 | |
Receivables: | | | | |
Investment securities sold | | | 17,082 | |
Capital shares sold | | | 2,975 | |
Dividends | | | 627,791 | |
Other assets | | | 171,393 | |
| | | | |
Total assets | | | 434,981,763 | |
| | | | |
Liabilities: | | | | |
Payables: | | | | |
Investment securities purchased | | | 2,026,474 | |
Capital shares redeemed | | | 209,597 | |
Affiliates | | | 430,691 | |
Reports to shareholders | | | 174,065 | |
Accrued expenses and other liabilities | | | 28,534 | |
| | | | |
Total liabilities | | | 2,869,361 | |
| | | | |
Net assets, at value | | $ | 432,112,402 | |
| | | | |
Net assets consist of: | | | | |
Paid-in capital | | $ | 471,760,065 | |
Undistributed net investment income | | | 3,407,918 | |
Net unrealized appreciation (depreciation) | | | 94,935,907 | |
Accumulated net realized gain (loss) | | | (137,991,488 | ) |
| | | | |
Net assets, at value | | $ | 432,112,402 | |
| | | | |
Class 1: | | | | |
Net assets, at value | | $ | 58,286,746 | |
| | | | |
Shares outstanding | | | 4,279,949 | |
| | | | |
Net asset value and maximum offering price per share | | $ | 13.62 | |
| | | | |
Class 2: | | | | |
Net assets, at value | | $ | 373,821,422 | |
| | | | |
Shares outstanding | | | 27,840,028 | |
| | | | |
Net asset value and maximum offering price per share | | $ | 13.43 | |
| | | | |
Class 4: | | | | |
Net assets, at value | | $ | 4,234 | |
| | | | |
Shares outstanding | | | 312 | |
| | | | |
Net asset value and maximum offering price per share | | $ | 13.57 | |
| | | | |
The accompanying notes are an integral part of these financial statements.
FLG-13
Franklin Templeton Variable Insurance Products Trust
Financial Statements (continued)
Statement of Operations
for the year ended December 31, 2009
| | | | |
| | | Franklin Large
Cap Growth
Securities Fund | |
Investment income: | | | | |
Dividends | | $ | 7,123,135 | |
Interest | | | 26,846 | |
| | | | |
Total investment income | | | 7,149,981 | |
| | | | |
Expenses: | | | | |
Management fees (Note 3a) | | | 2,921,403 | |
Distribution fees: (Note 3c) | | | | |
Class 2 | | | 843,408 | |
Class 4 | | | 13 | |
Unaffiliated transfer agent fees | | | 712 | |
Custodian fees (Note 4) | | | 4,041 | |
Reports to shareholders | | | 166,192 | |
Professional fees | | | 29,850 | |
Trustees’ fees and expenses | | | 2,672 | |
Other | | | 22,324 | |
| | | | |
Total expenses | | | 3,990,615 | |
Expense reductions (Note 4) | | | (115 | ) |
| | | | |
Net expenses | | | 3,990,500 | |
| | | | |
Net investment income | | | 3,159,481 | |
| | | | |
Realized and unrealized gains (losses): | | | | |
Net realized gain (loss) from: | | | | |
Investments | | | (51,445,329 | ) |
Foreign currency transactions | | | 1,485 | |
| | | | |
Net realized gain (loss) | | | (51,443,844 | ) |
| | | | |
Net change in unrealized appreciation (depreciation) on investments | | | 150,444,919 | |
| | | | |
Net realized and unrealized gain (loss) | | | 99,001,075 | |
| | | | |
Net increase (decrease) in net assets resulting from operations | | $ | 102,160,556 | |
| | | | |
The accompanying notes are an integral part of these financial statements.
FLG-14
Franklin Templeton Variable Insurance Products Trust
Financial Statements (continued)
Statements of Changes in Net Assets
| | | | | | | | |
| | | Franklin Large Cap Growth
Securities Fund | |
| | | Year Ended December 31, | |
| | | 2009 | | | 2008 | |
| | | | |
Increase (decrease) in net assets: | | | | | | | | |
Operations: | | | | | | | | |
Net investment income | | $ | 3,159,481 | | | $ | 5,551,250 | |
Net realized gain (loss) from investments and foreign currency transactions | | | (51,443,844 | ) | | | (83,485,431 | ) |
Net change in unrealized appreciation (depreciation) on investments | | | 150,444,919 | | | | (151,830,475 | ) |
| | | | |
Net increase (decrease) in net assets resulting from operations | | | 102,160,556 | | | | (229,764,656 | ) |
| | | | |
Distributions to shareholders from: | | | | | | | | |
Net investment income: | | | | | | | | |
Class 1 | | | (896,286 | ) | | | (1,183,538 | ) |
Class 2 | | | (4,724,247 | ) | | | (6,484,690 | ) |
Class 4 | | | (49 | ) | | | (73 | ) |
Net realized gains: | | | | | | | | |
Class 1 | | | — | | | | (4,817,075 | ) |
Class 2 | | | — | | | | (33,345,360 | ) |
Class 4 | | | — | | | | (298 | ) |
| | | | |
Total distributions to shareholders | | | (5,620,582 | ) | | | (45,831,034 | ) |
| | | | |
Capital share transactions: (Note 2) | | | | | | | | |
Class 1 | | | (6,256,675 | ) | | | (9,557,762 | ) |
Class 2 | | | (38,422,446 | ) | | | (73,871,480 | ) |
Class 4 | | | — | | | | 5,000 | |
| | | | |
Total capital share transactions | | | (44,679,121 | ) | | | (83,424,242 | ) |
| | | | |
Net increase (decrease) in net assets | | | 51,860,853 | | | | (359,019,932 | ) |
Net assets: | | | | | | | | |
Beginning of year | | | 380,251,549 | | | | 739,271,481 | |
| | | | |
End of year | | $ | 432,112,402 | | | $ | 380,251,549 | |
| | | | |
Undistributed net investment income included in net assets: | | | | | | | | |
End of year | | $ | 3,407,918 | | | $ | 5,867,639 | |
| | | | |
The accompanying notes are an integral part of these financial statements.
FLG-15
Franklin Templeton Variable Insurance Products Trust
Notes to Financial Statements
Franklin Large Cap Growth Securities Fund
1. ORGANIZATION AND SIGNIFICANT ACCOUNTING POLICIES
Franklin Templeton Variable Insurance Products Trust (Trust) is registered under the Investment Company Act of 1940, as amended, (1940 Act) as an open-end investment company, consisting of twenty-two separate funds. The Franklin Large Cap Growth Fund (Fund) is included in this report. The financial statements of the remaining funds in the Trust are presented separately. Shares of the Fund are generally sold only to insurance company separate accounts to fund the benefits of variable life insurance policies or variable annuity contracts. The Fund offers three classes of shares: Class 1, Class 2, and Class 4. Each class of shares differs by its distribution fees, voting rights on matters affecting a single class and its exchange privilege.
The following summarizes the Fund’s significant accounting policies.
a. Security Valuation
Equity and other securities listed on a securities exchange or on the NASDAQ National Market System are valued at the last quoted sale price or the official closing price of the day, respectively. Over-the-counter securities and listed securities for which there is no reported sale are valued within the range of the most recent quoted bid and ask prices. Securities that trade in multiple markets or on multiple exchanges are valued according to the broadest and most representative market. Certain equity securities are valued based upon fundamental characteristics or relationships to similar securities.
The Fund has procedures to determine the fair value of individual securities and other assets for which market prices are not readily available or which may not be reliably priced. Methods for valuing these securities may include: fundamental analysis based upon the underlying investment book value, anticipated future cash flows, market changes in comparable or similar securities, matrix pricing, discounts from market prices of similar securities, or discounts applied due to the nature and duration of restrictions on the disposition of the securities. Due to the inherent uncertainty of valuations of such securities, the fair values may differ significantly from the values that would have been used had a ready market for such investments existed. Occasionally, events occur between the time at which trading in a security is completed and the close of the NYSE that might call into question the availability (including the reliability) of the value of a portfolio security held by the Fund. If such an event occurs, the securities may be valued using fair value procedures, which may include the use of independent pricing services. All security valuation procedures are approved by the Fund’s Board of Trustees.
b. Foreign Currency Translation
Portfolio securities and other assets and liabilities denominated in foreign currencies are translated into U.S. dollars based on the exchange rate of such currencies against U.S. dollars on the date of valuation. The Fund may enter into foreign currency exchange contracts to facilitate transactions denominated in a foreign currency. Purchases and sales of securities, income and expense items denominated in foreign currencies are translated into U.S. dollars at the exchange rate in effect on the transaction date. Occasionally, events may impact the availability or reliability of foreign exchange rates used to convert the U.S. dollar equivalent value. If such an event occurs, the foreign exchange rate will be valued at fair value using procedures established and approved by the Fund’s Board of Trustees.
The Fund does not separately report the effect of changes in foreign exchange rates from changes in market prices on securities held. Such changes are included in net realized and unrealized gain or loss from investments on the Statement of Operations.
Realized foreign exchange gains or losses arise from sales of foreign currencies, currency gains or losses realized between the trade and settlement dates on securities transactions and the difference between the recorded amounts of dividends, interest, and foreign withholding taxes and the U.S. dollar equivalent of the amounts actually received or paid. Net unrealized foreign exchange gains and losses arise from changes in foreign exchange rates on foreign denominated assets and liabilities other than investments in securities held at the end of the reporting period.
FLG-16
Franklin Templeton Variable Insurance Products Trust
Notes to Financial Statements (continued)
Franklin Large Cap Growth Securities Fund
1. ORGANIZATION AND SIGNIFICANT ACCOUNTING POLICIES (continued)
c. Joint Repurchase Agreement
The Fund may enter into a joint repurchase agreement whereby its uninvested cash balance is deposited into a joint cash account with other funds managed by the investment manager or an affiliate of the investment manager and is used to invest in one or more repurchase agreements. The value and face amount of the joint repurchase agreement are allocated to the funds based on their pro-rata interest. A repurchase agreement is accounted for as a loan by the fund to the seller, collateralized by securities which are delivered to the fund’s custodian. The market value, including accrued interest, of the initial collateralization is required to be at least 102% of the dollar amount invested by the funds, with the value of the underlying securities marked to market daily to maintain coverage of at least 100%. The joint repurchase agreement held by the Fund at year end had been entered into on December 31, 2009. The joint repurchase agreement is valued at cost which approximates market value.
d. Income Taxes
No provision has been made for U.S. income taxes because it is the Fund’s policy to qualify as a regulated investment company under the Internal Revenue Code and to distribute to shareholders substantially all of its taxable income and net realized gains.
The Fund has reviewed the tax positions, taken on federal income tax returns, for each of the three open tax years and as of December 31, 2009, and has determined that no provision for income tax is required in the Fund’s financial statements.
e. Security Transactions, Investment Income, Expenses and Distributions
Security transactions are accounted for on trade date. Realized gains and losses on security transactions are determined on a specific identification basis. Interest income and estimated expenses are accrued daily. Dividend income is recorded on the ex-dividend date. Distributions to shareholders are recorded on the ex-dividend date and are determined according to income tax regulations (tax basis). Distributable earnings determined on a tax basis may differ from earnings recorded in accordance with accounting principles generally accepted in the United States of America. These differences may be permanent or temporary. Permanent differences are reclassified among capital accounts to reflect their tax character. These reclassifications have no impact on net assets or the results of operations. Temporary differences are not reclassified, as they may reverse in subsequent periods.
Common expenses incurred by the Trust are allocated among the funds based on the ratio of net assets of each fund to the combined net assets of the Trust. Fund specific expenses are charged directly to the fund that incurred the expense.
Realized and unrealized gains and losses and net investment income, not including class specific expenses, are allocated daily to each class of shares based upon the relative proportion of net assets of each class. Differences in per share distributions, by class, are generally due to differences in class specific expenses.
f. Accounting Estimates
The preparation of financial statements in accordance with accounting principles generally accepted in the United States of America requires management to make estimates and assumptions that affect the reported amounts of assets and liabilities at the date of the financial statements and the amounts of income and expenses during the reporting period. Actual results could differ from those estimates.
g. Guarantees and Indemnifications
Under the Trust’s organizational documents, its officers and trustees are indemnified by the Trust against certain liabilities arising out of the performance of their duties to the Trust. Additionally, in the normal course of business, the Trust, on behalf of the Fund, enters into contracts with service providers that contain general indemnification clauses. The Trust’s maximum exposure under these arrangements is unknown as this would involve future claims that may be made against the Trust that have not yet occurred. Currently, the Trust expects the risk of loss to be remote.
FLG-17
Franklin Templeton Variable Insurance Products Trust
Notes to Financial Statements (continued)
Franklin Large Cap Growth Securities Fund
2. SHARES OF BENEFICIAL INTEREST
At December 31, 2009, there were an unlimited number of shares authorized (without par value). Transactions in the Fund’s shares were as follows:
| | | | | | | | | | | | | | |
| | | Year Ended December 31, | |
| | | 2009 | | | 2008a | |
| Class 1 Shares: | | Shares | | | Amount | | | Shares | | | Amount | |
Shares sold | | 92,858 | | | $ | 1,084,582 | | | 42,013 | | | $ | 581,393 | |
Shares issued in reinvestment of distributions | | 79,458 | | | | 896,286 | | | 390,665 | | | | 6,000,613 | |
Shares redeemed | | (739,154 | ) | | | (8,237,543 | ) | | (1,122,371 | ) | | | (16,139,768 | ) |
| | | | |
Net increase (decrease) | | (566,838 | ) | | $ | (6,256,675 | ) | | (689,693 | ) | | $ | (9,557,762 | ) |
| | | | |
Class 2 Shares: | | | | | | | | | | | | | | |
Shares sold | | 1,484,116 | | | $ | 16,174,927 | | | 2,042,228 | | | $ | 30,356,073 | |
Shares issued in reinvestment of distributions | | 424,080 | | | | 4,724,247 | | | 2,630,783 | | | | 39,830,049 | |
Shares redeemed | | (5,372,705 | ) | | | (59,321,620 | ) | | (10,607,967 | ) | | | (144,057,602 | ) |
| | | | |
Net increase (decrease) | | (3,464,509 | ) | | $ | (38,422,446 | ) | | (5,934,956 | ) | | $ | (73,871,480 | ) |
| | | | |
Class 4 Shares: | | | | | | | | | | | | | | |
Shares sold | | — | | | $ | — | | | 312 | | | $ | 5,000 | |
| | | | |
| aFor | the period February 29, 2008 (effective date) to December 31, 2008 for Class 4. |
3. TRANSACTIONS WITH AFFILIATES
Franklin Resources, Inc. is the holding company for various subsidiaries that together are referred to as Franklin Templeton Investments. Certain officers and trustees of the Trust are also officers and/or directors of the following subsidiaries:
| | |
| Subsidiary | | Affiliation |
Franklin Advisers, Inc. (Advisers) | | Investment manager |
Franklin Templeton Services, LLC (FT Services) | | Administrative manager |
Franklin Templeton Distributors, Inc. (Distributors) | | Principal underwriter |
Franklin Templeton Investor Services, LLC (Investor Services) | | Transfer agent |
a. Management Fees
The Fund pays an investment management fee to Advisers based on the average daily net assets of the Fund as follows:
| | |
| Annualized Fee Rate | | Net Assets |
| 0.750% | | Up to and including $500 million |
| 0.625% | | Over $500 million, up to and including $1 billion |
| 0.500% | | In excess of $1 billion |
b. Administrative Fees
Under an agreement with Advisers, FT Services provides administrative services to the Fund. The fee is paid by Advisers based on average daily net assets, and is not an additional expense of the Fund.
FLG-18
Franklin Templeton Variable Insurance Products Trust
Notes to Financial Statements (continued)
Franklin Large Cap Growth Securities Fund
3. TRANSACTIONS WITH AFFILIATES (continued)
c. Distribution Fees
The Fund’s Board of Trustees has adopted distribution plans for Class 2 and Class 4 shares pursuant to Rule 12b-1 under the 1940 Act. Under the Fund’s compensation distribution plans, the Fund pays Distributors for costs incurred in connection with the servicing, sale and distribution of the Fund’s shares up to 0.35% per year of its average daily net assets of each class. The Board of Trustees has agreed to limit the current rate to 0.25% per year for Class 2.
d. Transfer Agent Fees
Investor Services, under terms of an agreement, performs shareholder servicing for the Fund and is not paid by the Fund for the services.
4. EXPENSE OFFSET ARRANGEMENT
The Fund has entered into an arrangement with its custodian whereby credits realized as a result of uninvested cash balances are used to reduce a portion of the Fund’s custodian expenses. During the year ended December 31, 2009, the custodian fees were reduced as noted in the Statement of Operations.
5. INCOME TAXES
For tax purposes, capital losses may be carried over to offset future capital gains, if any. At December 31, 2009, the capital loss carryforwards were as follows:
| | | |
Capital loss carryforwards expiring in: | | | |
2016 | | $ | 67,544,988 |
2017 | | | 62,435,606 |
| | | |
| | $ | 129,980,594 |
| | | |
The tax character of distributions paid during the years ended December 31, 2009 and 2008, was as follows:
| | | | | | |
| | | 2009 | | 2008 |
Distributions paid from: | | | | | | |
Ordinary Income | | $ | 5,620,582 | | $ | 21,652,204 |
Long term capital gain | | | — | | | 24,178,830 |
| | | |
| | $ | 5,620,582 | | $ | 45,831,034 |
| | | |
At December 31, 2009, the cost of investments, net unrealized appreciation (depreciation) and undistributed ordinary income for income tax purposes were as follows:
| | | | |
Cost of investments | | $ | 347,237,508 | |
| | | | |
| |
Unrealized appreciation | | $ | 96,664,665 | |
Unrealized depreciation | | | (9,739,651 | ) |
| | | | |
Net unrealized appreciation (depreciation) | | $ | 86,925,014 | |
| | | | |
Distributable earnings – undistributed ordinary income | | $ | 3,407,918 | |
| | | | |
FLG-19
Franklin Templeton Variable Insurance Products Trust
Notes to Financial Statements (continued)
Franklin Large Cap Growth Securities Fund
5. INCOME TAXES (continued)
Net investment income differs for financial statement and tax purposes primarily due to differing treatment of foreign currency transactions.
Net realized gains (losses) differ for financial statement and tax purposes primarily due to differing treatments of wash sales and foreign currency transactions.
6. INVESTMENT TRANSACTIONS
Purchases and sales of investments (excluding short term securities) for the year ended December 31, 2009, aggregated $265,544,243 and $305,001,241, respectively.
7. CREDIT FACILITY
The Fund, together with other U.S. registered and foreign investment funds (collectively “Borrowers”), managed by Franklin Templeton Investments, are borrowers in a joint syndicated senior unsecured credit facility totaling $725 million (Global Credit Facility) to provide a source of funds to the Borrowers for temporary and emergency purposes, including the ability to meet future unanticipated or unusually large redemption requests. Effective January 22, 2010, the Fund renewed the Global Credit Facility, for a total of $750 million, maturing January 21, 2011.
Under the terms of the Global Credit Facility, the Fund shall, in addition to interest charged on any borrowings made by the Fund and other costs incurred by the Fund, pay its share of fees and expenses incurred in connection with the implementation and maintenance of the Global Credit Facility, based upon its relative share of the aggregate net assets of all of the Borrowers, including an annual commitment fee of 0.10% based upon the unused portion of the Global Credit Facility, which is reflected in other expenses on the Statement of Operations. During the year ended December 31, 2009, the Fund did not utilize the Global Credit Facility.
8. FAIR VALUE MEASUREMENTS
The Fund follows a fair value hierarchy that distinguishes between market data obtained from independent sources (observable inputs) and the Fund’s own market assumptions (unobservable inputs). These inputs are used in determining the value of the Fund’s investments and are summarized in the following fair value hierarchy:
| | • | | Level 1 – quoted prices in active markets for identical securities |
| | • | | Level 2 – other significant observable inputs (including quoted prices for similar securities, interest rates, prepayment speed, credit risk, etc.) |
| | • | | Level 3 – significant unobservable inputs (including the Fund’s own assumptions in determining the fair value of investments) |
The inputs or methodology used for valuing securities are not an indication of the risk associated with investing in those securities.
The following is a summary of the inputs used as of December 31, 2009, in valuing the Fund’s assets carried at fair value:
| | | | | | | | | | | | |
| | | Level 1 | | Level 2 | | Level 3 | | Total |
| | | |
Assets: | | | | | | | | | | | | |
Investments in Securities: | | | | | | | | | | | | |
Equity Investmentsa | | $ | 414,058,728 | | $ | — | | $ | — | | $ | 414,058,728 |
Short Term Investments | | | — | | | 20,103,794 | | | — | | | 20,103,794 |
| | | |
Total Investments in Securities | | $ | 414,058,728 | | $ | 20,103,794 | | $ | — | | $ | 434,162,522 |
| | | |
aFor detailed industry descriptions, see the accompanying Statement of Investments.
FLG-20
Franklin Templeton Variable Insurance Products Trust
Notes to Financial Statements (continued)
Franklin Large Cap Growth Securities Fund
9. NEW ACCOUNTING PRONOUNCEMENTS
In January 2010, the Financial Accounting Standards Board issued Accounting Standards Update (ASU) No. 2010-6, Fair Value Measurements and Disclosures (Topic 820): Improving Disclosures about Fair Value Measurements. ASU No. 2010-6 enhances and clarifies existing fair value measurement disclosure requirements and is effective for interim and annual periods beginning after December 15, 2009. The Fund is currently evaluating the impact, if any, of applying the provisions of ASU No. 2010-6.
10. SUBSEQUENT EVENTS
The Fund has evaluated subsequent events through February 10, 2010, the issuance date of the financial statements and determined that no events have occurred that require disclosure.
ABBREVIATIONS
Selected Portfolio
ADR - American Depository Receipt
FLG-21
Franklin Templeton Variable Insurance Products Trust
Franklin Large Cap Growth Securities Fund
Report of Independent Registered Public Accounting Firm
To the Board of Trustees and Shareholders of Franklin Templeton Variable Insurance Products Trust
In our opinion, the accompanying statement of assets and liabilities, including the statement of investments, and the related statements of operations and of changes in net assets and the financial highlights present fairly, in all material respects, the financial position of Franklin Large Cap Growth Securities Fund (one of the funds constituting the Franklin Templeton Variable Insurance Products Trust, hereafter referred to as the “Fund”) at December 31, 2009, the results of its operations for the year then ended, the changes in its net assets and the financial highlights for the periods presented, in conformity with accounting principles generally accepted in the United States of America. These financial statements and financial highlights (hereafter referred to as “financial statements”) are the responsibility of the Fund’s management. Our responsibility is to express an opinion on these financial statements based on our audits. We conducted our audits of these financial statements in accordance with the standards of the Public Company Accounting Oversight Board (United States). Those standards require that we plan and perform the audit to obtain reasonable assurance about whether the financial statements are free of material misstatement. An audit includes examining, on a test basis, evidence supporting the amounts and disclosures in the financial statements, assessing the accounting principles used and significant estimates made by management, and evaluating the overall financial statement presentation. We believe that our audits, which included confirmation of securities at December 31, 2009 by correspondence with the custodian and brokers, provide a reasonable basis for our opinion.
PricewaterhouseCoopers LLP
San Francisco, California
February 10, 2010
FLG-22
Franklin Templeton Variable Insurance Products Trust
Tax Designation (unaudited)
Franklin Large Cap Growth Securities Fund
Under Section 854(b)(2) of the Internal Revenue Code, the Fund designates 100% of the ordinary income dividends as income qualifying for the dividends received deduction for the fiscal year ended December 31, 2009.
FLG-23
FRANKLIN LARGE CAP VALUE SECURITIES FUND
We are pleased to bring you Franklin Large Cap Value Securities Fund’s annual report for the fiscal year ended December 31, 2009.
Performance Summary as of 12/31/09
Average annual total return of Class 4 shares* represents the average annual change in value, assuming reinvestment of dividends and capital gains. Average returns smooth out variations in returns, which can be significant; they are not the same as year-by-year results.
Periods ended 12/31/09
| | | | | | |
| | | 1-Year | | 3-Year | | Since Inception (3/1/05) |
Average Annual Total Return | | +26.54% | | -6.51% | | -0.20% |
*For the period beginning 2/29/08, Class 4 performance reflects a 12b-1 fee expense of 0.35% per year, which affects future performance. Class 4 performance prior to 2/29/08 reflects historical Class 2 performance, which includes a 12b-1 fee expense of 0.25% per year. Since 2/29/08 (effective date), the average annual total return of Class 4 shares was -7.83%. The investment manager and administrator have contractually agreed to waive or limit their respective fees and to assume as their own expense certain expenses otherwise payable by the Fund so that common annual Fund operating expenses (i.e., a combination of investment management fees, fund administration fees, and other expenses, but excluding Rule 12b-1 fees and acquired fund fees and expenses) do not exceed 0.65% (other than certain nonroutine expenses or costs, including those relating to litigation, indemnification, reorganizations and liquidations) until 4/30/10. If the manager and administrator had not waived fees, the Fund’s total returns would have been lower.
Total Return Index Comparison
for a Hypothetical $10,000 Investment (3/1/05–12/31/09)
The graph below shows the change in value of a hypothetical $10,000 investment in the Fund over the indicated period and includes reinvestment of any income or distributions. The Fund’s performance* is compared to the performance of the Russell 1000® Value Index. One cannot invest directly in an index, and an index is not representative of the Fund’s portfolio. Please see Important Notes to Performance Information preceding the Fund Summaries.
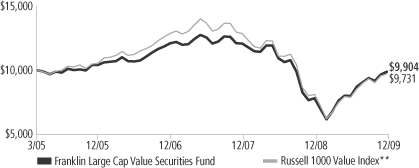
**Source: © 2009 Morningstar. Please see Index Descriptions following the Fund Summaries.
Franklin Large Cap Value Securities Fund – Class 4
Performance reflects the Fund’s Class 4 operating expenses, but does not include any contract fees, expenses or sales charges. If they had been included, performance would be lower. These charges and deductions, particularly for variable life policies, can have a significant effect on contract values and insurance benefits. See the contract prospectus for a complete description of these expenses, including sales charges.
Performance data represent past performance, which does not guarantee future results. Investment return and principal value will fluctuate, and you may have a gain or loss when you sell your shares.
Current performance may differ from figures shown.
FLV-1
Fund Goal and Main Investments: Franklin Large Cap Value Securities Fund seeks long-term capital appreciation. The Fund normally invests at least 80% of its net assets in investments of large capitalization companies and normally invests predominantly in equity securities, focusing on those the manager believes to be undervalued. For this Fund, large capitalization companies are those that are similar in size to those in the Russell 1000 Index at the time of purchase.1
Performance Overview
You can find the Fund’s one-year total return in the Performance Summary. The Fund outperformed its benchmark, the Russell 1000 Value Index, which rose 19.69% for the same period.2 Please note that the Fund employs a bottom-up stock selection process, and the managers invest in securities without regard to benchmark comparisons.
Economic and Market Overview
The U.S. economy ended 2009 in much better shape than it began. Economic challenges remain, such as stalled consumer confidence and job prospects for the unemployed as stimulus measures wind down. However, several reports pointed to improving economic conditions. In the year’s second half, corporate profit growth was higher than earlier estimates, which may allow businesses to build inventory following a long period of inventory drawdowns.
Throughout the year, the Federal Open Market Committee kept monetary policy unchanged, announcing it intends to hold the federal funds target rate in the 0% to 0.25% range “for an extended period” as it lays the groundwork for an eventual tightening of monetary policy. Late in the period, the labor market improved somewhat as the economy lost fewer jobs than expected and the unemployment rate fell slightly, dropping from a period high of 10.2% in October to 10.0% at period-end.3
U.S. gross domestic product grew at a 2.2% annualized rate in 2009’s third quarter after shrinking by 0.7% in the prior three months. This was the first expansion since 2008’s second quarter. As economic conditions improved, oil prices increased from $45 per barrel in December 2008 to $79 at year-end, still well below 2008 highs. December’s inflation rate was an annualized 2.7%.3 Core inflation, which excludes food and energy costs, rose at a 1.8% annualized rate, which was within the Federal Reserve Boards’ informal target range of 1.5% to 2.0%.3
1. Please see Index Descriptions following the Fund Summaries.
2. Source: © 2009 Morningstar. One cannot invest directly in an index, and an index is not representative of the Fund’s portfolio. Please see Index Descriptions following the Fund Summaries.
3. Source: Bureau of Labor Statistics.
Fund Risks: The Fund’s investments in stocks may offer the potential for long-term gains but can be subject to short-term price fluctuations. Foreign investing involves additional risks, including currency fluctuations, economic instability, market volatility, and political and social instability. The Fund’s prospectus also includes a description of the main investment risks.
FLV-2
Most stocks suffered significant losses through early March 2009 as investors worried about an uncertain future. Stocks then recovered from 12-year lows as economic data improved and investors perceived many bargains among the bear market fallout. For the 12 months under review, the Dow Jones Industrial Average, the Standard & Poor’s 500 Index and the NASDAQ Composite Index returned 22.68%, 26.46% and 45.32%, respectively.2 All sectors posted gains for the period, with the strongest returns from the information technology, materials and consumer discretionary sectors.
Investment Strategy
Although this report covers a 12-month period, our investment horizon aims for longer-term results. We seek to invest in securities of large-capitalization companies that we determine are selling below their underlying worth and hold them until they reach what we believe is their fair market value. Our aim is to construct a diversified portfolio of fundamentally sound companies purchased at attractive prices, often when they are out of favor with other investors for reasons we believe are temporary. Portfolio securities are selected without regard to benchmark comparisons and are chosen based on fundamental bottom-up research focusing on several criteria, such as low price relative to earnings, cash flow or book value. We also consider stocks with recent sharp price declines that we feel still have significant growth potential or that possess valuable intangibles not reflected in the stock price.
Manager’s Discussion
During the fiscal year under review, the consumer discretionary sector was a top contributor to performance, as were the information technology and materials sectors.4 Consumer discretionary holdings that performed well included homebuilder D.R. Horton, retailer Nordstrom, home improvement retailer Home Depot and department store operator J.C. Penney. In the information technology sector, information technology software and services provider International Business Machines and software giant Microsoft helped results. Industrial gases company Praxair, in the materials sector, benefited results, as did aluminum company Alcoa and chemicals company Dow Chemical. Other significant contributors to performance were supplemental health insurer Aflac and institutional financial services firm State Street.
4. The consumer discretionary sector comprises consumer durables and apparel, consumer services, and retailing in the SOI. The information technology sector comprises software and services, and technology hardware and equipment in the SOI.
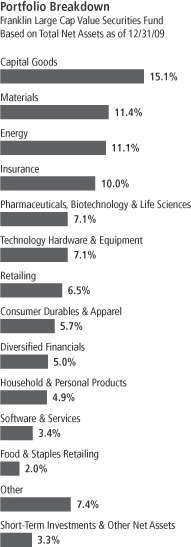
FLV-3
All sectors helped the Fund’s results; however, there were some individual detractors from performance. Oil and gas exploration and production company Exxon Mobil, in the energy sector, hindered results. Several holdings in the financials sector also hurt performance, including SunTrust Banks, U.S. Bancorp, Citigroup, Allstate and Chubb.5 In the consumer staples sector, personal products manufacturer Procter & Gamble detracted from performance, as did industrial conglomerate General Electric and electric utility company Entergy.6
During the fiscal year, we initiated a position in specialty gases and services company Air Products & Chemicals. We also added to several positions including supplemental health insurer Aflac, insurer MetLife and drug maker Pfizer. The Fund liquidated its positions in Ambac Financial Group, Schering-Plough and SunTrust Banks. We also reduced holdings in D.R. Horton, International Business Machines and Nucor, among others.
Thank you for your participation in Franklin Large Cap Value Securities Fund. We look forward to serving your future investment needs.
5. The financials sector comprises banks, diversified financials and insurance in the SOI.
6. The consumer staples sector comprises food and staples retailing, and household and personal products in the SOI.
The foregoing information reflects our analysis, opinions and portfolio holdings as of December 31, 2009, the end of the reporting period. The way we implement our main investment strategies and the resulting portfolio holdings may change depending on factors such as market and economic conditions. These opinions may not be relied upon as investment advice or an offer for a particular security. The information is not a complete analysis of every aspect of any market, country, industry, security or the Fund. Statements of fact are from sources considered reliable, but the investment manager makes no representation or warranty as to their completeness or accuracy. Although historical performance is no guarantee of future results, these insights may help you understand our investment management philosophy.
Top 10 Holdings
Franklin Large Cap Value Securities Fund
12/31/09
| | |
Company
Sector/Industry | | % of Total
Net Assets |
| International Business Machines Corp. | | 4.3% |
| Technology Hardware & Equipment | | |
| Merck & Co. Inc. | | 3.8% |
| Pharmaceuticals, Biotechnology & Life Sciences | | |
| Nucor Corp. | | 3.8% |
| Materials | | |
| Microsoft Corp. | | 3.4% |
| Software & Services | | |
| Aflac Inc. | | 3.2% |
| Insurance | | |
| Hewlett-Packard Co. | | 2.8% |
| Technology Hardware & Equipment | | |
| Praxair Inc. | | 2.8% |
| Materials | | |
| State Street Corp. | | 2.7% |
| Diversified Financials | | |
| General Electric Co. | | 2.7% |
| Capital Goods | | |
| Kimberly-Clark Corp. | | 2.6% |
| Household & Personal Products | | |
The dollar value, number of shares or principal amount, and names of all portfolio holdings are listed in the Fund’s Statement of Investments (SOI).
FLV-4
Fund Expenses
As an investor in a variable insurance contract (Contract) that indirectly provides for investment in an underlying mutual fund, you can incur transaction and/or ongoing expenses at both the Fund level and the Contract level.
| • | | Transaction expenses can include sales charges (loads) on purchases, redemption fees, surrender fees, transfer fees and premium taxes. |
| • | | Ongoing expenses can include management fees, distribution and service (12b-1) fees, contract fees, annual maintenance fees, mortality and expense risk fees and other fees and expenses. All mutual funds and Contracts have some types of ongoing expenses. |
The expenses shown in the table are meant to highlight ongoing expenses at the Fund level only and do not include ongoing expenses at the Contract level, or transaction expenses at either the Fund or Contract level. While the Fund does not have transaction expenses, if the transaction and ongoing expenses at the Contract level were included, the expenses shown would be higher. You should consult your Contract prospectus or disclosure document for more information.
The table shows Fund-level ongoing expenses and can help you understand these expenses and compare them with those of other mutual funds offered through the Contract. The table assumes a $1,000 investment held for the six months indicated. Please refer to the Fund prospectus for additional information on operating expenses.
Actual Fund Expenses
The first line (Actual) of the table provides actual account values and expenses. The “Ending Account Value” is derived from the Fund’s actual return, which includes the effect of ongoing Fund expenses, but does not include the effect of ongoing Contract expenses.
You can estimate the Fund-level expenses you incurred during the period by following these steps. Of course, your account value and expenses will differ from those in this illustration:
| 1. | Divide your account value by $1,000. |
If an account had an $8,600 value, then $8,600 ÷ $1,000 = 8.6.
| 2. | Multiply the result by the number under the heading “Fund-Level Expenses Incurred During Period.” |
If Fund-Level Expenses Incurred During Period were $7.50, then 8.6 x $7.50 = $64.50.
In this illustration, the estimated expenses incurred this period at the Fund level are $64.50.
Franklin Large Cap Value Securities Fund – Class 4
FLV-5
Hypothetical Example for Comparison with Other Mutual Funds
Information in the second line (Hypothetical) of the table can help you compare ongoing expenses of the Fund with those of other mutual funds offered through the Contract. This information may not be used to estimate the actual ending account balance or expenses you incurred during the period. The hypothetical “Ending Account Value” is based on the Fund’s actual expense ratio and an assumed 5% annual rate of return before expenses, which does not represent the Fund’s actual return. The figure under the heading “Fund-Level Expenses Incurred During Period” shows the hypothetical expenses your account would have incurred under this scenario. You can compare this figure with the 5% hypothetical examples that appear in shareholder reports of other funds offered through a Contract.
| | | | | | | | | |
| Class 4 | | Beginning
Account Value 7/1/09 | | Ending
Account
Value 12/31/09 | | Fund-Level
Expenses Incurred
During Period*
7/1/09–12/31/09 |
Actual | | $ | 1,000 | | $ | 1,237.10 | | $ | 5.64 |
Hypothetical (5% return before expenses) | | $ | 1,000 | | $ | 1,020.16 | | $ | 5.09 |
*Expenses are calculated using the most recent six-month annualized expense ratio, net of expense waivers, for the Fund’s Class 4 shares (1.00%), which does not include any ongoing expenses of the Contract for which the Fund is an investment option, multiplied by the average account value over the period, multiplied by 184/365 to reflect the one-half year period.
FLV-6
Franklin Templeton Variable Insurance Products Trust
Financial Highlights
Franklin Large Cap Value Securities Fund
| | | | | | | | | | | | | | | | | | | | |
| | | Year Ended December 31, | |
| Class 2 | | 2009 | | | 2008 | | | 2007 | | | 2006 | | | 2005a | |
| | | | |
Per share operating performance | | | | | | | | | | | | | | | | | | | | |
(for a share outstanding throughout the year) | | | | | | | | | | | | | | | | | | | | |
Net asset value, beginning of year | | $ | 7.54 | | | $ | 11.63 | | | $ | 11.86 | | | $ | 10.37 | | | $ | 10.00 | |
| | | | |
Income from investment operationsb: | | | | | | | | | | | | | | | | | | | | |
Net investment incomec | | | 0.17 | | | | 0.19 | | | | 0.22 | | | | 0.21 | | | | 0.14 | |
Net realized and unrealized gains (losses) | | | 1.81 | | | | (4.28 | ) | | | (0.25 | ) | | | 1.46 | | | | 0.29 | |
| | | | |
Total from investment operations | | | 1.98 | | | | (4.09 | ) | | | (0.03 | ) | | | 1.67 | | | | 0.43 | |
| | | | |
Less distributions from: | | | | | | | | | | | | | | | | | | | | |
Net investment income | | | (0.16 | ) | | | — | | | | (0.19 | ) | | | (0.15 | ) | | | (0.06 | ) |
Net realized gains | | | — | | | | — | | | | (0.01 | ) | | | (0.03 | ) | | | — | |
| | | | |
Total distributions | | | (0.16 | ) | | | — | | | | (0.20 | ) | | | (0.18 | ) | | | (0.06 | ) |
| | | | |
Net asset value, end of year | | $ | 9.36 | | | $ | 7.54 | | | $ | 11.63 | | | $ | 11.86 | | | $ | 10.37 | |
| | | | |
| | | | | |
Total returnd | | | 26.76% | | | | (35.17)% | | | | (0.26)% | | | | 16.19% | | | | 4.32% | |
Ratios to average net assetse | | | | | | | | | | | | | | | | | | | | |
Expenses before waiver and payments by affiliates | | | 1.38% | | | | 1.34% | | | | 1.36% | | | | 1.41% | | | | 1.82% | |
Expenses net of waiver and payments by affiliates | | | 0.90% | | | | 0.90% | | | | 0.90% | f | | | 0.90% | f | | | 0.90% | f |
Net investment income | | | 2.15% | | | | 1.93% | | | | 1.82% | | | | 1.93% | | | | 1.70% | |
| | | | | |
Supplemental data | | | | | | | | | | | | | | | | | | | | |
Net assets, end of year (000’s) | | $ | 35,892 | | | $ | 26,776 | | | $ | 37,797 | | | $ | 26,069 | | | $ | 7,979 | |
Portfolio turnover rate | | | 15.64% | | | | 12.92% | | | | 15.80% | | | | 24.71% | | | | 18.79% | |
aFor the period March 1, 2005 (commencement of operations) to December 31, 2005.
bThe amount shown for a share outstanding throughout the period may not correlate with the Statement of Operations for the period due to the timing of sales and repurchases of the Fund shares in relation to income earned and/or fluctuating market value of the investments of the Fund.
cBased on average daily shares outstanding.
dTotal return does not include any fees, charges or expenses imposed by the variable annuity and life insurance contracts for which the Franklin Templeton Variable Insurance Products Trust serves as an underlying investment vehicle. Total return is not annualized for periods less than one year.
eRatios are annualized for periods less than one year.
fBenefit of expense reduction rounds to less than 0.01%.
The accompanying notes are an integral part of these financial statements.
FLV-7
Franklin Templeton Variable Insurance Products Trust
Financial Highlights (continued)
Franklin Large Cap Value Securities Fund
| | | | | | | | |
| | | Year Ended
December 31, | |
| Class 4 | | 2009 | | | 2008a | |
| | | | |
Per share operating performance | | | | | | | | |
(for a share outstanding throughout the year) | | | | | | | | |
Net asset value, beginning of year | | $ | 7.53 | | | $ | 11.07 | |
| | | | |
Income from investment operationsb: | | | | | | | | |
Net investment incomec | | | 0.16 | | | | 0.15 | |
Net realized and unrealized gains (losses) | | | 1.80 | | | | (3.69 | ) |
| | | | |
Total from investment operations | | | 1.96 | | | | (3.54 | ) |
| | | | |
Less distributions from net investment income | | | (0.15 | ) | | | — | |
| | | | |
Net asset value, end of year | | $ | 9.34 | | | $ | 7.53 | |
| | | | |
| | |
Total returnd | | | 26.54% | | | | (31.98)% | |
Ratios to average net assetse | | | | | | | | |
Expenses before waiver and payments by affiliates | | | 1.48% | | | | 1.44% | |
Expenses net of waiver and payments by affiliates | | | 1.00% | | | | 1.00% | |
Net investment income | | | 2.05% | | | | 1.83% | |
| | |
Supplemental data | | | | | | | | |
Net assets, end of year (000’s) | | $ | 4 | | | $ | 3 | |
Portfolio turnover rate | | | 15.64% | | | | 12.92% | |
aFor the period February 29, 2008 (effective date) to December 31, 2008.
bThe amount shown for a share outstanding throughout the period may not correlate with the Statement of Operations for the period due to the timing of sales and repurchases of the Fund shares in relation to income earned and/or fluctuating market value of the investments of the Fund.
cBased on average daily shares outstanding.
dTotal return does not include any fees, charges or expenses imposed by the variable annuity and life insurance contracts for which the Franklin Templeton Variable Insurance Products Trust serves as an underlying investment vehicle. Total return is not annualized for periods less than one year.
eRatios are annualized for periods less than one year.
The accompanying notes are an integral part of these financial statements.
FLV-8
Franklin Templeton Variable Insurance Products Trust
Statement of Investments, December 31, 2009
| | | | | | |
| Franklin Large Cap Value Securities Fund | | Shares | | | Value |
Common Stocks 96.7% | | | | | | |
Banks 1.1% | | | | | | |
U.S. Bancorp | | 17,400 | | | $ | 391,674 |
| | | | | | |
Capital Goods 15.1% | | | | | | |
3M Co. | | 8,800 | | | | 727,496 |
Dover Corp. | | 16,700 | | | | 694,887 |
Eaton Corp. | | 11,400 | | | | 725,268 |
General Electric Co. | | 63,300 | | | | 957,729 |
Illinois Tool Works Inc. | | 15,000 | | | | 719,850 |
Masco Corp. | | 29,100 | | | | 401,871 |
Parker Hannifin Corp. | | 7,000 | | | | 377,160 |
United Technologies Corp. | | 11,700 | | | | 812,097 |
| | | | | | |
| | | | | | 5,416,358 |
| | | | | | |
Consumer Durables & Apparel 5.7% | | | | | | |
D.R. Horton Inc. | | 59,500 | | | | 646,765 |
Fortune Brands Inc. | | 17,600 | | | | 760,320 |
NIKE Inc., B | | 9,400 | | | | 621,058 |
| | | | | | |
| | | | | | 2,028,143 |
| | | | | | |
Consumer Services 1.5% | | | | | | |
McDonald’s Corp. | | 8,800 | | | | 549,472 |
| | | | | | |
Diversified Financials 5.0% | | | | | | |
Bank of America Corp. | | 12,400 | | | | 186,744 |
The Bank of New York Mellon Corp. | | 14,600 | | | | 408,362 |
Citigroup Inc. | | 13,500 | | | | 44,685 |
Morgan Stanley | | 5,500 | | | | 162,800 |
State Street Corp. | | 22,500 | | | | 979,650 |
| | | | | | |
| | | | | | 1,782,241 |
| | | | | | |
Energy 11.1% | | | | | | |
Apache Corp. | | 5,900 | | | | 608,703 |
Chesapeake Energy Corp. | | 9,300 | | | | 240,684 |
ConocoPhillips | | 7,000 | | | | 357,490 |
Devon Energy Corp. | | 7,600 | | | | 558,600 |
Exxon Mobil Corp. | | 12,000 | | | | 818,280 |
Occidental Petroleum Corp. | | 8,900 | | | | 724,015 |
Peabody Energy Corp. | | 14,600 | | | | 660,066 |
| | | | | | |
| | | | | | 3,967,838 |
| | | | | | |
Food & Staples Retailing 2.0% | | | | | | |
Wal-Mart Stores Inc. | | 13,700 | | | | 732,265 |
| | | | | | |
Health Care Equipment & Services 1.5% | | | | | | |
Becton, Dickinson and Co. | | 6,700 | | | | 528,362 |
| | | | | | |
Household & Personal Products 4.9% | | | | | | |
Kimberly-Clark Corp. | | 14,700 | | | | 936,537 |
The Procter & Gamble Co. | | 13,500 | | | | 818,505 |
| | | | | | |
| | | | | | 1,755,042 |
| | | | | | |
Insurance 10.0% | | | | | | |
Aflac Inc. | | 25,100 | | | | 1,160,875 |
The Allstate Corp. | | 25,000 | | | | 751,000 |
aBerkshire Hathaway Inc., A | | 3 | | | | 297,600 |
Chubb Corp. | | 12,200 | | | | 599,996 |
MetLife Inc. | | 22,200 | | | | 784,770 |
| | | | | | |
| | | | | | 3,594,241 |
| | | | | | |
FLV-9
Franklin Templeton Variable Insurance Products Trust
Statement of Investments, December 31, 2009 (continued)
| | | | | |
| Franklin Large Cap Value Securities Fund | | Shares | | Value |
Common Stocks (continued) | | | | | |
Materials 11.4% | | | | | |
Air Products and Chemicals Inc. | | 1,800 | | $ | 145,908 |
Alcoa Inc. | | 54,600 | | | 880,152 |
The Dow Chemical Co. | | 25,700 | | | 710,091 |
Nucor Corp. | | 29,000 | | | 1,352,850 |
Praxair Inc. | | 12,300 | | | 987,813 |
| | | | | |
| | | | | 4,076,814 |
| | | | | |
Pharmaceuticals, Biotechnology & Life Sciences 7.1% | | | | | |
Abbott Laboratories | | 7,600 | | | 410,324 |
Merck & Co. Inc. | | 37,165 | | | 1,358,009 |
Pfizer Inc. | | 43,700 | | | 794,903 |
| | | | | |
| | | | | 2,563,236 |
| | | | | |
Retailing 6.5% | | | | | |
The Home Depot Inc. | | 28,000 | | | 810,040 |
J.C. Penney Co. Inc. | | 17,800 | | | 473,658 |
Nordstrom Inc. | | 17,100 | | | 642,618 |
aOffice Depot Inc. | | 61,800 | | | 398,610 |
| | | | | |
| | | | | 2,324,926 |
| | | | | |
Software & Services 3.4% | | | | | |
Microsoft Corp. | | 40,300 | | | 1,228,747 |
| | | | | |
Technology Hardware & Equipment 7.1% | | | | | |
Hewlett-Packard Co. | | 19,500 | | | 1,004,445 |
International Business Machines Corp. | | 11,700 | | | 1,531,530 |
| | | | | |
| | | | | 2,535,975 |
| | | | | |
Transportation 1.4% | | | | | |
Norfolk Southern Corp. | | 9,600 | | | 503,232 |
| | | | | |
Utilities 1.9% | | | | | |
Entergy Corp. | | 5,200 | | | 425,568 |
Sempra Energy | | 4,900 | | | 274,302 |
| | | | | |
| | | | | 699,870 |
| | | | | |
Total Common Stocks (Cost $33,561,552) | | | | | 34,678,436 |
| | | | | |
Short Term Investments (Cost $1,200,866) 3.3% | | | | | |
Money Market Funds 3.3% | | | | | |
bInstitutional Fiduciary Trust Money Market Portfolio, 0.00% | | 1,200,866 | | | 1,200,866 |
| | | | | |
Total Investments (Cost $34,762,418) 100.0% | | | | | 35,879,302 |
Other Assets, less Liabilities 0.0%c | | | | | 17,021 |
| | | | | |
Net Assets 100.0% | | | | $ | 35,896,323 |
| | | | | |
aNon-income producing.
bSee Note 7 regarding investments in the Institutional Fiduciary Trust Money Market Portfolio. The rate shown is the annualized seven-day yield at period end.
cRounds to less than 0.1% of net assets.
The accompanying notes are an integral part of these financial statements.
FLV-10
Franklin Templeton Variable Insurance Products Trust
Financial Statements
Statement of Assets and Liabilities
December 31, 2009
| | | | |
| | | Franklin
Large Cap Value
Securities Fund | |
Assets: | | | | |
Investments in securities: | | | | |
Cost - Unaffiliated issuers | | $ | 33,561,552 | |
Cost - Sweep Money Fund (Note 7) | | | 1,200,866 | |
| | | | |
Total cost of investments | | $ | 34,762,418 | |
| | | | |
Value - Unaffiliated issuers | | $ | 34,678,436 | |
Value - Sweep Money Fund (Note 7) | | | 1,200,866 | |
| | | | |
Total value of investments | | | 35,879,302 | |
Receivables: | | | | |
Capital shares sold | | | 39,111 | |
Dividends | | | 72,673 | |
| | | | |
Total assets | | | 35,991,086 | |
| | | | |
Liabilities: | | | | |
Payables: | | | | |
Capital shares redeemed | | | 37,893 | |
Affiliates | | | 28,938 | |
Reports to shareholders | | | 5,903 | |
Professional fees | | | 21,149 | |
Accrued expenses and other liabilities | | | 880 | |
| | | | |
Total liabilities | | | 94,763 | |
| | | | |
Net assets, at value | | $ | 35,896,323 | |
| | | | |
Net assets consist of: | | | | |
Paid-in capital | | $ | 41,926,017 | |
Undistributed net investment income | | | 686,266 | |
Net unrealized appreciation (depreciation) | | | 1,116,884 | |
Accumulated net realized gain (loss) | | | (7,832,844 | ) |
| | | | |
Net assets, at value | | $ | 35,896,323 | |
| | | | |
Class 2: | | | | |
Net assets, at value | | $ | 35,892,102 | |
| | | | |
Shares outstanding | | | 3,836,398 | |
| | | | |
Net asset value and maximum offering price per share | | $ | 9.36 | |
| | | | |
Class 4: | | | | |
Net assets, at value | | $ | 4,221 | |
| | | | |
Shares outstanding | | | 452 | |
| | | | |
Net asset value and maximum offering price per share | | $ | 9.34 | |
| | | | |
The accompanying notes are an integral part of these financial statements.
FLV-11
Franklin Templeton Variable Insurance Products Trust
Financial Statements (continued)
Statement of Operations
for the year ended December 31, 2009
| | | | |
| | | Franklin
Large Cap Value
Securities Fund | |
Investment income: | | | | |
Dividends: | | | | |
Unaffiliated issuers | | $ | 956,990 | |
Sweep Money Fund (Note 7) | | | 1,605 | |
Income from securities loaned | | | 15,295 | |
| | | | |
Total investment income | | | 973,890 | |
| | | | |
Expenses: | | | | |
Management fees (Note 3a) | | | 235,184 | |
Administrative fees (Note 3b) | | | 79,874 | |
Distribution fees: (Note 3c) | | | | |
Class 2 | | | 79,900 | |
Class 4 | | | 13 | |
Unaffiliated transfer agent fees | | | 58 | |
Custodian fees (Note 4) | | | 377 | |
Reports to shareholders | | | 12,170 | |
Professional fees | | | 24,294 | |
Trustees’ fees and expenses | | | 119 | |
Other | | | 10,637 | |
| | | | |
Total expenses | | | 442,626 | |
Expenses waived/paid by affiliates (Note 3e) | | | (155,044 | ) |
| | | | |
Net expenses | | | 287,582 | |
| | | | |
Net investment income | | | 686,308 | |
| | | | |
Realized and unrealized gains (losses): | | | | |
Net realized gain (loss) from investments | | | (3,133,157 | ) |
Net change in unrealized appreciation (depreciation) on investments | | | 10,565,216 | |
| | | | |
Net realized and unrealized gain (loss) | | | 7,432,059 | |
| | | | |
Net increase (decrease) in net assets resulting from operations | | $ | 8,118,367 | |
| | | | |
The accompanying notes are an integral part of these financial statements.
FLV-12
Franklin Templeton Variable Insurance Products Trust
Financial Statements (continued)
Statements of Changes in Net Assets
| | | | | | | | |
| | | Franklin Large Cap Value
Securities Fund | |
| | | Year Ended December 31, | |
| | | 2009 | | | 2008 | |
| | | | |
Increase (decrease) in net assets: | | | | | | | | |
Operations: | | | | | | | | |
Net investment income | | $ | 686,308 | | | $ | 701,594 | |
Net realized gain (loss) from investments | | | (3,133,157 | ) | | | (4,663,548 | ) |
Net change in unrealized appreciation (depreciation) on investments | | | 10,565,216 | | | | (11,168,192 | ) |
| | | | |
Net increase (decrease) in net assets resulting from operations | | | 8,118,367 | | | | (15,130,146 | ) |
| | | | |
Distributions to shareholders from: | | | | | | | | |
Net investment income: | | | | | | | | |
Class 2 | | | (701,566 | ) | | | — | |
Class 4 | | | (70 | ) | | | — | |
| | | | |
Total distributions to shareholders | | | (701,636 | ) | | | — | |
| | | | |
Capital share transactions: (Note 2) | | | | | | | | |
Class 2 | | | 1,699,737 | | | | 4,108,232 | |
Class 4 | | | — | | | | 5,000 | |
| | | | |
Total capital share transactions | | | 1,699,737 | | | | 4,113,232 | |
| | | | |
Net increase (decrease) in net assets | | | 9,116,468 | | | | (11,016,914 | ) |
Net assets: | | | | | | | | |
Beginning of year | | | 26,779,855 | | | | 37,796,769 | |
| | | | |
End of year | | $ | 35,896,323 | | | $ | 26,779,855 | |
| | | | |
Undistributed net investment income included in net assets: | | | | | | | | |
End of year | | $ | 686,266 | | | $ | 701,594 | |
| | | | |
The accompanying notes are an integral part of these financial statements.
FLV-13
Franklin Templeton Variable Insurance Products Trust
Notes to Financial Statements
Franklin Large Cap Value Securities Fund
1. ORGANIZATION AND SIGNIFICANT ACCOUNTING POLICIES
Franklin Templeton Variable Insurance Products Trust (Trust) is registered under the Investment Company Act of 1940, as amended, (1940 Act) as an open-end investment company, consisting of twenty-two separate funds. The Franklin Large Cap Value Securities Fund (Fund) is included in this report. The financial statements of the remaining funds in the Trust are presented separately. Shares of the Fund are generally sold only to insurance company separate accounts to fund the benefits of variable life insurance policies or variable annuity contracts. At December 31, 2009, 99.74% of the Fund’s shares were held through one insurance company. The Fund offers two classes of shares: Class 2 and Class 4. Each class of shares differs by its distribution fees, voting rights on matters affecting a single class and its exchange privilege.
The following summarizes the Fund’s significant accounting policies.
a. Security Valuation
Equity and other securities listed on a securities exchange or on the NASDAQ National Market System are valued at the last quoted sale price or the official closing price of the day, respectively. Over-the-counter securities and listed securities for which there is no reported sale are valued within the range of the most recent quoted bid and ask prices. Securities that trade in multiple markets or on multiple exchanges are valued according to the broadest and most representative market. Certain equity securities are valued based upon fundamental characteristics or relationships to similar securities. Investments in open-end mutual funds are valued at the closing net asset value.
The Fund has procedures to determine the fair value of individual securities and other assets for which market prices are not readily available or which may not be reliably priced. Methods for valuing these securities may include: fundamental analysis based upon the underlying investment book value, anticipated future cash flows, market changes in comparable or similar securities, matrix pricing, discounts from market prices of similar securities, or discounts applied due to the nature and duration of restrictions on the disposition of the securities. Due to the inherent uncertainty of valuations of such securities, the fair values may differ significantly from the values that would have been used had a ready market for such investments existed. Occasionally, events occur between the time at which trading in a security is completed and the close of the NYSE that might call into question the availability (including the reliability) of the value of a portfolio security held by the Fund. If such an event occurs, the securities may be valued using fair value procedures, which may include the use of independent pricing services. All security valuation procedures are approved by the Fund’s Board of Trustees.
b. Securities Lending
The Fund participates in a principal based security lending program. The Fund receives cash collateral against the loaned securities in an amount equal to at least 102% of the market value of the loaned securities. Collateral is maintained over the life of the loan in an amount not less than 100% of the market value of loaned securities, as determined at the close of Fund business each day; any additional collateral required due to changes in security values is delivered to the Fund on the next business day. The collateral is invested in repurchase agreements managed by the Fund’s custodian on the Fund’s behalf. The Fund receives income from the investment of cash collateral, in addition to lending fees and rebates paid by the borrower. The Fund bears the market risk with respect to the collateral investment, securities loaned, and the risk that the principal may default on its obligations to the Fund. At December 31, 2009, the Fund had no securities on loan.
c. Income Taxes
No provision has been made for U.S. income taxes because it is the Fund’s policy to qualify as a regulated investment company under the Internal Revenue Code and to distribute to shareholders substantially all of its taxable income and net realized gains.
The Fund has reviewed the tax positions, taken on federal income tax returns, for each of the three open tax years and as of December 31, 2009, and has determined that no provision for income tax is required in the Fund’s financial statements.
FLV-14
Franklin Templeton Variable Insurance Products Trust
Notes to Financial Statements (continued)
Franklin Large Cap Value Securities Fund
1. ORGANIZATION AND SIGNIFICANT ACCOUNTING POLICIES (continued)
d. Security Transactions, Investment Income, Expenses and Distributions
Security transactions are accounted for on trade date. Realized gains and losses on security transactions are determined on a specific identification basis. Estimated expenses are accrued daily. Dividend income is recorded on the ex-dividend date. Distributions to shareholders are recorded on the ex-dividend date and are determined according to income tax regulations (tax basis). Distributable earnings determined on a tax basis may differ from earnings recorded in accordance with accounting principles generally accepted in the United States of America. These differences may be permanent or temporary. Permanent differences are reclassified among capital accounts to reflect their tax character. These reclassifications have no impact on net assets or the results of operations. Temporary differences are not reclassified, as they may reverse in subsequent periods.
Common expenses incurred by the Trust are allocated among the funds based on the ratio of net assets of each fund to the combined net assets of the Trust. Fund specific expenses are charged directly to the fund that incurred the expense.
Realized and unrealized gains and losses and net investment income, not including class specific expenses, are allocated daily to each class of shares based upon the relative proportion of net assets of each class. Differences in per share distributions, by class, are generally due to differences in class specific expenses.
e. Accounting Estimates
The preparation of financial statements in accordance with accounting principles generally accepted in the United States of America requires management to make estimates and assumptions that affect the reported amounts of assets and liabilities at the date of the financial statements and the amounts of income and expenses during the reporting period. Actual results could differ from those estimates.
f. Guarantees and Indemnifications
Under the Trust’s organizational documents, its officers and trustees are indemnified by the Trust against certain liabilities arising out of the performance of their duties to the Trust. Additionally, in the normal course of business, the Trust, on behalf of the Fund, enters into contracts with service providers that contain general indemnification clauses. The Trust’s maximum exposure under these arrangements is unknown as this would involve future claims that may be made against the Trust that have not yet occurred. Currently, the Trust expects the risk of loss to be remote.
2. SHARES OF BENEFICIAL INTEREST
At December 31, 2009, there were an unlimited number of shares authorized (without par value). Transactions in the Fund’s shares were as follows:
| | | | | | | | | | | | | | |
| | | Year Ended December 31, | |
| | | 2009 | | | 2008a | |
| Class 2 Shares: | | Shares | | | Amount | | | Shares | | | Amount | |
Shares sold | | 1,384,166 | | | $ | 10,151,286 | | | 1,644,855 | | | $ | 16,145,485 | |
Shares issued in reinvestment of distributions | | 91,707 | | | | 701,566 | | | — | | | | — | |
Shares redeemed | | (1,192,993 | ) | | | (9,153,115 | ) | | (1,342,128 | ) | | | (12,037,253 | ) |
| | | | |
Net increase (decrease) | | 282,880 | | | $ | 1,699,737 | | | 302,727 | | | $ | 4,108,232 | |
| | | | |
| Class 4 Shares: | | | | | | | | | | | | |
Shares sold | | — | | | $ | — | | | 452 | | | $ | 5,000 | |
| | | | |
| aFor | the period February 29, 2008 (effective date) to December 31, 2008 for Class 4. |
FLV-15
Franklin Templeton Variable Insurance Products Trust
Notes to Financial Statements (continued)
Franklin Large Cap Value Securities Fund
3. TRANSACTIONS WITH AFFILIATES
Franklin Resources, Inc. is the holding company for various subsidiaries that together are referred to as Franklin Templeton Investments. Certain officers and trustees of the Trust are also officers and/or directors of the following subsidiaries:
| | |
| Subsidiary | | Affiliation |
Franklin Advisory Services, LLC (Advisory Services) | | Investment manager |
Franklin Templeton Services, LLC (FT Services) | | Administrative manager |
Franklin Templeton Distributors, Inc. (Distributors) | | Principal underwriter |
Franklin Templeton Investor Services, LLC (Investor Services) | | Transfer agent |
a. Management Fees
The Fund pays an investment management fee to Advisory Services based on the average daily net assets of the Fund as follows:
| | |
| Annualized Fee Rate | | Net Assets |
| 0.750% | | Up to and including $500 million |
| 0.650% | | over $500 million, up to and including $1 billion |
| 0.600% | | over $1 billion, up to and including $1.5 billion |
| 0.550% | | over $1.5 billion, up to and including $6.5 billion |
| 0.525% | | over $6.5 billion, up to and including $11.5 billion |
| 0.500% | | over $11.5 billion, up to and including $16.5 billion |
| 0.490% | | over $16.5 billion, up to and including $19 billion |
| 0.480% | | over $19 billion, up to and including $21.5 billion |
| 0.470% | | In excess of $21.5 billion |
b. Administrative Fees
The Fund pays an administrative fee to FT Services of 0.25% per year of the average daily net assets of the Fund.
c. Distribution Fees
The Fund’s Board of Trustees has adopted distribution plans for Class 2 and Class 4 shares pursuant to Rule 12b-1 under the 1940 Act. Under the Fund’s compensation distribution plans, the Fund pays Distributors for costs incurred in connection with the servicing, sale and distribution of the Fund’s shares up to 0.35% per year of its average daily net assets of each class. The Board of Trustees has agreed to limit the current rate to 0.25% per year for Class 2.
d. Transfer Agent Fees
Investor Services, under terms of an agreement, performs shareholder servicing for the Fund and is not paid by the Fund for the services.
e. Waiver and Expense Reimbursements
FT Services and Advisory Services have contractually agreed in advance to waive or limit their respective fees and to assume as their own expense certain expenses otherwise payable by the Fund so that the common expenses (i.e. a combination of management fees, administrative fees, and other expenses, but excluding distribution fees, and acquired fund fees and expenses) for each class of the Fund do not exceed 0.65% (other than certain non-routine expenses or costs, including those relating to litigation, indemnification, reorganizations, and liquidations) until April 30, 2010.
FLV-16
Franklin Templeton Variable Insurance Products Trust
Notes to Financial Statements (continued)
Franklin Large Cap Value Securities Fund
4. EXPENSE OFFSET ARRANGEMENT
The Fund has entered into an arrangement with its custodian whereby credits realized as a result of uninvested cash balances are used to reduce a portion of the Fund’s custodian expenses. During the year ended December 31, 2009, there were no credits earned.
5. INCOME TAXES
For tax purposes, capital losses may be carried over to offset future capital gains, if any. At December 31, 2009, the capital loss carryforwards were as follows:
| | | |
Capital loss carryforwards expiring in: | | | |
2016 | | $ | 4,455,608 |
2017 | | | 2,320,965 |
| | | |
| | $ | 6,776,573 |
| | | |
For tax purposes, realized capital losses occurring subsequent to October 31, may be deferred and treated as occurring on the first day of the following fiscal year. At December 31, 2009, the Fund deferred realized capital losses of $725,309.
The tax character of distributions paid during the years ended December 31, 2009 and 2008, was as follows:
| | | | | | |
| | | 2009 | | 2008 |
Distributions paid from ordinary income | | $ | 701,636 | | $ | — |
| | | |
At December 31, 2009, the cost of investments, net unrealized appreciation (depreciation) and undistributed ordinary income for income tax purposes were as follows:
| | | | |
Cost of investments | | $ | 35,093,379 | |
| | | | |
| |
Unrealized appreciation | | $ | 5,364,465 | |
Unrealized depreciation | | | (4,578,542 | ) |
| | | | |
Net unrealized appreciation (depreciation) | | $ | 785,923 | |
| | | | |
Distributable earnings – undistributed ordinary income | | $ | 686,266 | |
| | | | |
Net realized gains (losses) differ for financial statement and tax purposes primarily due to differing treatment of wash sales.
6. INVESTMENT TRANSACTIONS
Purchases and sales of investments (excluding short term securities) for the year ended December 31, 2009, aggregated $6,175,045 and $4,698,459, respectively.
7. INVESTMENTS IN INSTITUTIONAL FIDUCIARY TRUST MONEY MARKET PORTFOLIO
The Fund may invest in the Institutional Fiduciary Trust Money Market Portfolio (Sweep Money Fund), an open-end investment company managed by Franklin Advisers, Inc. (an affiliate of the investment manager). Management fees paid by the Fund are reduced on assets invested in the Sweep Money Fund, in an amount not to exceed the management and administrative fees paid by the Sweep Money Fund.
FLV-17
Franklin Templeton Variable Insurance Products Trust
Notes to Financial Statements (continued)
Franklin Large Cap Value Securities Fund
8. CREDIT FACILITY
The Fund, together with other U.S. registered and foreign investment funds (collectively “Borrowers”), managed by Franklin Templeton Investments, are borrowers in a joint syndicated senior unsecured credit facility totaling $725 million (Global Credit Facility) to provide a source of funds to the Borrowers for temporary and emergency purposes, including the ability to meet future unanticipated or unusually large redemption requests. Effective January 22, 2010, the Fund renewed the Global Credit Facility, for a total of $750 million, maturing January 21, 2011.
Under the terms of the Global Credit Facility, the Fund shall, in addition to interest charged on any borrowings made by the Fund and other costs incurred by the Fund, pay its share of fees and expenses incurred in connection with the implementation and maintenance of the Global Credit Facility, based upon its relative share of the aggregate net assets of all of the Borrowers, including an annual commitment fee of 0.10% based upon the unused portion of the Global Credit Facility, which is reflected in other expenses on the Statement of Operations. During the year ended December 31, 2009, the Fund did not utilize the Global Credit Facility.
9. FAIR VALUE MEASUREMENTS
The Fund follows a fair value hierarchy that distinguishes between market data obtained from independent sources (observable inputs) and the Fund’s own market assumptions (unobservable inputs). These inputs are used in determining the value of the Fund’s investments and are summarized in the following fair value hierarchy:
| | • | | Level 1 – quoted prices in active markets for identical securities |
| | • | | Level 2 – other significant observable inputs (including quoted prices for similar securities, interest rates, prepayment speed, credit risk, etc.) |
| | • | | Level 3 – significant unobservable inputs (including the Fund’s own assumptions in determining the fair value of investments) |
The inputs or methodology used for valuing securities are not an indication of the risk associated with investing in those securities.
At December 31, 2009, all of the Fund’s investments in securities carried at fair value were in Level 1 inputs. For detailed industry descriptions, see the accompanying Statement of Investments.
10. NEW ACCOUNTING PRONOUNCEMENTS
In January 2010, the Financial Accounting Standards Board issued Accounting Standards Update (ASU) No. 2010-6, Fair Value Measurements and Disclosures (Topic 820): Improving Disclosures about Fair Value Measurements. ASU No. 2010-6 enhances and clarifies existing fair value measurement disclosure requirements and is effective for interim and annual periods beginning after December 15, 2009. The Fund is currently evaluating the impact, if any, of applying the provisions of ASU No. 2010-6.
11. SUBSEQUENT EVENTS
The Fund has evaluated subsequent events through February 10, 2010, the issuance date of the financial statements and determined that no events have occurred that require disclosure.
FLV-18
Franklin Templeton Variable Insurance Products Trust
Franklin Large Cap Value Securities Fund
Report of Independent Registered Public Accounting Firm
To the Board of Trustees and Shareholders of Franklin Templeton Variable Insurance Products Trust
In our opinion, the accompanying statement of assets and liabilities, including the statement of investments, and the related statements of operations and of changes in net assets and the financial highlights present fairly, in all material respects, the financial position of Franklin Large Cap Value Securities Fund (one of the funds constituting the Franklin Templeton Variable Insurance Products Trust, hereafter referred to as the “Fund”) at December 31, 2009, the results of its operations for the year then ended, the changes in its net assets and the financial highlights for the periods presented, in conformity with accounting principles generally accepted in the United States of America. These financial statements and financial highlights (hereafter referred to as “financial statements”) are the responsibility of the Fund’s management. Our responsibility is to express an opinion on these financial statements based on our audits. We conducted our audits of these financial statements in accordance with the standards of the Public Company Accounting Oversight Board (United States). Those standards require that we plan and perform the audit to obtain reasonable assurance about whether the financial statements are free of material misstatement. An audit includes examining, on a test basis, evidence supporting the amounts and disclosures in the financial statements, assessing the accounting principles used and significant estimates made by management, and evaluating the overall financial statement presentation. We believe that our audits, which included confirmation of securities at December 31, 2009 by correspondence with the custodian and brokers, provide a reasonable basis for our opinion.
PricewaterhouseCoopers LLP
San Francisco, California
February 10, 2010
FLV-19
Franklin Templeton Variable Insurance Products Trust
Tax Designation (unaudited)
Franklin Large Cap Value Securities Fund
Under Section 854(b)(2) of the Internal Revenue Code, the Fund designates 100% of the ordinary income dividends as income qualifying for the dividends received deduction for the fiscal year ended December 31, 2009.
FLV-20
FRANKLIN RISING DIVIDENDS SECURITIES FUND
This annual report for Franklin Rising Dividends Securities Fund covers the fiscal year ended December 31, 2009.
Performance Summary as of 12/31/09
Average annual total return of Class 4 shares* represents the average annual change in value, assuming reinvestment of dividends and capital gains. Average returns smooth out variations in returns, which can be significant; they are not the same as year-by-year results.
Periods ended 12/31/09
| | | | | | |
| | | 1-Year | | 5-Year | | 10-Year |
Average Annual Total Return | | +17.22% | | +0.29% | | +6.73% |
*For the period beginning 2/29/08, Class 4 performance reflects a 12b-1 fee expense of 0.35% per year, which affects future performance. Class 4 performance prior to 2/29/08 reflects historical Class 1 performance, which does not include a 12b-1 fee expense. Since 2/29/08 (effective date), the average annual total return of Class 4 shares was -5.30%.
Total Return Index Comparison for a Hypothetical $10,000 Investment (1/1/00–12/31/09)
The graph below shows the change in value of a hypothetical $10,000 investment in the Fund over the indicated period and includes reinvestment of any income or distributions. The Fund’s performance* is compared to the performance of the Standard & Poor’s 500 Index (S&P 500). One cannot invest directly in an index, and an index is not representative of the Fund’s portfolio. Please see Important Notes to Performance Information preceding the Fund Summaries.
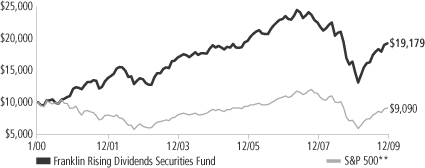
**Source: © 2009 Morningstar. Please see Index Descriptions following the Fund Summaries.
Franklin Rising Dividends Securities Fund – Class 4
Performance reflects the Fund’s Class 4 operating expenses, but does not include any contract fees, expenses or sales charges. If they had been included, performance would be lower. These charges and deductions, particularly for variable life policies, can have a significant effect on contract values and insurance benefits. See the contract prospectus for a complete description of these expenses, including sales charges.
Performance data represent past performance, which does not guarantee future results. Investment return and principal value will fluctuate, and you may have a gain or loss when you sell your shares.
Current performance may differ from figures shown.
FRD-1
Fund Goal and Main Investments: Franklin Rising Dividends Securities Fund seeks long-term capital appreciation, with preservation of capital as an important consideration. The Fund normally invests at least 80% of its net assets in investments of companies that have paid rising dividends, and normally invests predominantly in equity securities.
Performance Overview
You can find the Fund’s one-year total return in the Performance Summary. The Fund underperformed its benchmark, the S&P 500, which rose 26.46% for the same period.1 Please note the Fund employs a bottom-up stock selection process, and the managers invest in securities without regard to benchmark comparisons.
Economic and Market Overview
The U.S. economy ended 2009 in much better shape than it began. Economic challenges remain, such as stalled consumer confidence and job prospects for the unemployed as stimulus measures wind down. However, several reports pointed to improving economic conditions. In the year’s second half, corporate profit growth was higher than earlier estimates, which may allow businesses to build inventory following a long period of inventory drawdowns.
Throughout the year, the Federal Open Market Committee kept monetary policy unchanged, announcing it intends to hold the federal funds target rate in the 0% to 0.25% range “for an extended period” as it lays the groundwork for an eventual tightening of monetary policy. Late in the period, the labor market improved somewhat as the economy lost fewer jobs than expected and the unemployment rate fell slightly, dropping from a period high of 10.2% in October to 10.0% at period-end.2
U.S. gross domestic product grew at a 2.2% annualized rate in 2009’s third quarter after shrinking by 0.7% in the prior three months. This was the first expansion since 2008’s second quarter. As economic conditions improved, oil prices increased from $45 per barrel in December 2008 to $79 at year-end, still well below 2008 highs. December’s inflation rate was an annualized 2.7%.2 Core inflation, which excludes food and energy costs, rose at a 1.8% annualized rate, which was within the Federal Reserve Board’s informal target range of 1.5% to 2.0%.2
1. Source: © 2009 Morningstar. One cannot invest directly in an index, and an index is not representative of the Fund’s portfolio. Please see Index Descriptions following the Fund Summaries.
2. Source: Bureau of Labor Statistics.
Fund Risks: The Fund’s investments in stocks may offer the potential for long-term gains but can be subject to short-term price fluctuations. Smaller and midsize company securities can increase the risk of greater price fluctuations, particularly over the short term. By having significant investments in particular sectors from time to time, such as financial services, the Fund may be at greater risk of adverse developments in a sector than a fund that invests more broadly. The Fund’s prospectus also includes a description of the main investment risks.
FRD-2
Most stocks suffered significant losses through early March 2009 as investors worried about an uncertain future. Stocks then recovered from 12-year lows as economic data improved and investors perceived many bargains among the bear market fallout. For the 12 months under review, the Dow Jones Industrial Average, the S&P 500 and the NASDAQ Composite Index returned 22.68%, 26.46% and 45.32%, respectively.1 All sectors posted gains for the period, with the strongest returns from the information technology, materials and consumer discretionary sectors.
Investment Strategy
We are a research-driven, fundamental investment adviser, pursuing a disciplined value-oriented strategy. As bottom-up investors concentrating primarily on individual securities, we seek fundamentally sound companies that we believe meet our screening criteria, which include consistent, substantial dividend increases; reinvested earnings; and strong balance sheets. We attempt to acquire such stocks at attractive prices, often when they are out of favor with other investors. In following these criteria, we do not necessarily focus on companies whose securities pay a high dividend but rather on companies that consistently raise their dividends.
Manager’s Discussion
During the year under review, significant contributors to performance included Praxair, an industrial gases company, United Technologies, a manufacturer of products for the aerospace and building industries, and Carlisle Companies, a diversified manufacturer. Praxair may benefit from a number of new projects in coming months. Praxair has 16 consecutive years of dividend increases. United Technologies has significant exposure to the infrastructure needs of what we believe are attractive international markets. United Technologies also has 16 years of dividend increases. Despite a very weak sales environment, Carlisle’s profitability recovered considerably by mid-2009. Carlisle has increased its dividend each of the past 33 years.
Detractors from Fund performance included General Electric (GE), a diversified manufacturer and financial services company, Old Republic International, an insurer primarily focused on mortgage guaranty and various liability risks, and RLI, a specialty property and casualty underwriter. Shares of GE fell largely due to investors’ concerns about the underlying value of certain financial assets held by the company.
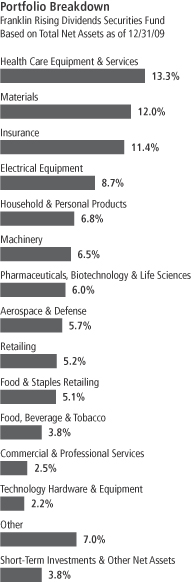
FRD-3
These concerns led to fears the company was not adequately capitalized. Old Republic International continued to build reserves for expected mortgage losses with home prices still well below the previous economic cycle’s peak. RLI’s stock price declined during 2009’s recovery after having appreciated in 2008’s very difficult environment.
We initiated positions in Abbott Laboratories, Air Products & Chemicals, Beckman Coulter, Hudson City Bancorp, International Business Machines (IBM) and Stryker during the fiscal year. Health care products manufacturer Abbott Laboratories has 37 consecutive years of dividend increases. Air Products & Chemicals, which offers specialty gases and related products and services, has 27 years of dividend increases. Medical instruments manufacturer Beckman Coulter has increased its dividend for 16 years. Regional bank holding company Hudson City Bancorp has 10 years of dividend increases. Information technology software and services provider IBM has raised its dividend for 14 years. Stryker, a medical technology company specializing in orthopedic implants and surgical equipment, has increased its dividend for 17 years. We made additions to 10 positions, and we liquidated two positions: GE and PNC Financial Services Group. We significantly reduced positions in Aflac, Carlisle and State Street and made smaller reductions to 27 other positions.
Our 10 largest positions on December 31, 2009, represented 48.1% of the Fund’s total net assets. It is interesting to note how these 10 companies would, in aggregate, respond to the Fund’s screening criteria based on a simple average of statistical measures. On average, these 10 companies have raised their dividends 31 years in a row and by 242% in the past 10 years. Their most recent year-over-year dividend increases averaged 8.2% with a yield of 2.1% on December 31, 2009, and a dividend payout ratio of 36.5%, based on estimates of calendar year 2009 operating earnings. The average price/earnings ratio was 17.2 times calendar year 2009 estimates versus 18.2 for that of the unmanaged S&P 500.
Thank you for your participation in Franklin Rising Dividends Securities Fund. We look forward to serving your future investment needs.
The foregoing information reflects our analysis, opinions and portfolio holdings as of December 31, 2009, the end of the reporting period. The way we implement our main investment strategies and the resulting portfolio holdings may change depending on factors such as market and economic conditions. These opinions may not be relied upon as investment advice or an offer for a particular security. The information is not a complete analysis of every aspect of any market, country, industry, security or the Fund. Statements of fact are from sources considered reliable, but the investment manager makes no representation or warranty as to their completeness or accuracy. Although historical performance is no guarantee of future results, these insights may help you understand our investment management philosophy.
Top 10 Holdings
Franklin Rising Dividends Securities Fund 12/31/09
| | |
Company
Sector/Industry | | % of Total
Net Assets |
| United Technologies Corp. | | 5.7% |
| Aerospace & Defense | | |
| Becton, Dickinson and Co. | | 5.6% |
| Health Care Equipment & Services | | |
| The Procter & Gamble Co. | | 5.2% |
| Household & Personal Products | | |
| Wal-Mart Stores Inc. | | 5.1% |
| Food & Staples Retailing | | |
| Family Dollar Stores Inc. | | 5.0% |
| Retailing | | |
| Roper Industries Inc. | | 5.0% |
| Electrical Equipment | | |
| Praxair Inc. | | 4.9% |
| Materials | | |
| Dover Corp. | | 4.0% |
| Machinery | | |
| McCormick & Co. Inc. | | 3.8% |
| Food, Beverage & Tobacco | | |
| Brady Corp., A | | 3.8% |
| Electrical Equipment | | |
The dollar value, number of shares or principal amount, and names of all portfolio holdings are listed in the Fund’s Statement of Investments.
FRD-4
Fund Expenses
As an investor in a variable insurance contract (Contract) that indirectly provides for investment in an underlying mutual fund, you can incur transaction and/or ongoing expenses at both the Fund level and the Contract level.
| • | | Transaction expenses can include sales charges (loads) on purchases, redemption fees, surrender fees, transfer fees and premium taxes. |
| • | | Ongoing expenses can include management fees, distribution and service (12b-1) fees, contract fees, annual maintenance fees, mortality and expense risk fees and other fees and expenses. All mutual funds and Contracts have some types of ongoing expenses. |
The expenses shown in the table are meant to highlight ongoing expenses at the Fund level only and do not include ongoing expenses at the Contract level, or transaction expenses at either the Fund or Contract level. While the Fund does not have transaction expenses, if the transaction and ongoing expenses at the Contract level were included, the expenses shown would be higher. You should consult your Contract prospectus or disclosure document for more information.
The table shows Fund-level ongoing expenses and can help you understand these expenses and compare them with those of other mutual funds offered through the Contract. The table assumes a $1,000 investment held for the six months indicated. Please refer to the Fund prospectus for additional information on operating expenses.
Actual Fund Expenses
The first line (Actual) of the table provides actual account values and expenses. The “Ending Account Value” is derived from the Fund’s actual return, which includes the effect of ongoing Fund expenses, but does not include the effect of ongoing Contract expenses.
You can estimate the Fund-level expenses you incurred during the period by following these steps. Of course, your account value and expenses will differ from those in this illustration:
| 1. | Divide your account value by $1,000. |
If an account had an $8,600 value, then $8,600 ÷ $1,000 = 8.6.
| 2. | Multiply the result by the number under the heading “Fund-Level Expenses Incurred During Period.” |
If Fund-Level Expenses Incurred During Period were $7.50, then 8.6 x $7.50 = $64.50.
In this illustration, the estimated expenses incurred this period at the Fund level are $64.50.
Franklin Rising Dividends Securities Fund – Class 4
FRD-5
Hypothetical Example for Comparison with Other Mutual Funds
Information in the second line (Hypothetical) of the table can help you compare ongoing expenses of the Fund with those of other mutual funds offered through the Contract. This information may not be used to estimate the actual ending account balance or expenses you incurred during the period. The hypothetical “Ending Account Value” is based on the Fund’s actual expense ratio and an assumed 5% annual rate of return before expenses, which does not represent the Fund’s actual return. The figure under the heading “Fund-Level Expenses Incurred During Period” shows the hypothetical expenses your account would have incurred under this scenario. You can compare this figure with the 5% hypothetical examples that appear in shareholder reports of other funds offered through a Contract.
| | | | | | | | | |
| Class 4 | | Beginning
Account Value 7/1/09 | | Ending
Account
Value 12/31/09 | | Fund-Level Expenses Incurred
During Period* 7/1/09–12/31/09 |
Actual | | $ | 1,000 | | $ | 1,181.50 | | $ | 5.50 |
Hypothetical (5% return before expenses) | | $ | 1,000 | | $ | 1,020.16 | | $ | 5.09 |
*Expenses are calculated using the most recent six-month annualized expense ratio for the Fund’s Class 4 shares (1.00%), which does not include any ongoing expenses of the Contract for which the Fund is an investment option, multiplied by the average account value over the period, multiplied by 184/365 to reflect the one-half year period.
FRD-6
Franklin Templeton Variable Insurance Products Trust
Financial Highlights
Franklin Rising Dividends Securities Fund
| | | | | | | | | | | | | | | | | | | | |
| | | Year Ended December 31, | |
| Class 1 | | 2009 | | | 2008 | | | 2007 | | | 2006 | | | 2005 | |
| | | | |
Per share operating performance | | | | | | | | | | | | | | | | | | | | |
(for a share outstanding throughout the year) | | | | | | | | | | | | | | | | | | | | |
Net asset value, beginning of year | | $ | 13.96 | | | $ | 19.61 | | | $ | 20.88 | | | $ | 18.11 | | | $ | 17.75 | |
| | | | |
Income from investment operationsa: | | | | | | | | | | | | | | | | | | | | |
Net investment incomeb | | | 0.14 | c | | | 0.35 | | | | 0.36 | | | | 0.58 | d | | | 0.28 | |
Net realized and unrealized gains (losses) | | | 2.28 | | | | (5.51 | ) | | | (0.80 | ) | | | 2.53 | | | | 0.36 | |
| | | | |
Total from investment operations | | | 2.42 | | | | (5.16 | ) | | | (0.44 | ) | | | 3.11 | | | | 0.64 | |
| | | | |
Less distributions from: | | | | | | | | | | | | | | | | | | | | |
Net investment income | | | (0.25 | ) | | | (0.36 | ) | | | (0.53 | ) | | | (0.24 | ) | | | (0.18 | ) |
Net realized gains | | | — | | | | (0.13 | ) | | | (0.30 | ) | | | (0.10 | ) | | | (0.10 | ) |
| | | | |
Total distributions | | | (0.25 | ) | | | (0.49 | ) | | | (0.83 | ) | | | (0.34 | ) | | | (0.28 | ) |
| | | | |
Net asset value, end of year | | $ | 16.13 | | | $ | 13.96 | | | $ | 19.61 | | | $ | 20.88 | | | $ | 18.11 | |
| | | | |
| | | | | |
Total returne | | | 17.67% | | | | (26.94)% | | | | (2.41)% | | | | 17.43% | | | | 3.68% | |
Ratios to average net assets | | | | | | | | | | | | | | | | | | | | |
Expensesf | | | 0.65% | | | | 0.61% | | | | 0.59% | | | | 0.61% | | | | 0.62% | |
Net investment income | | | 0.99% | c | | | 2.05% | | | | 1.72% | | | | 3.15% | d | | | 1.65% | |
| | | | | |
Supplemental data | | | | | | | | | | | | | | | | | | | | |
Net assets, end of year (000’s) | | $ | 139,816 | | | $ | 142,862 | | | $ | 235,946 | | | $ | 288,303 | | | $ | 292,223 | |
Portfolio turnover rate | | | 16.99% | | | | 5.39% | | | | 3.29% | | | | 6.19% | | | | 2.26% | |
aThe amount shown for a share outstanding throughout the period may not correlate with the Statement of Operations for the period due to the timing of sales and repurchases of the Fund shares in relation to income earned and/or fluctuating market value of the investments of the Fund.
bBased on average daily shares outstanding.
cNet investment income per share includes approximately $(0.15) per share as a return of capital adjustment to a previously recorded special dividend received by the Fund. Excluding this non-recurring amount, the ratio of net investment income to average net assets would have been 2.07%.
dNet investment income per share includes approximately $0.30 per share received in the form of a special dividend paid in connection with a corporate spin-off. Excluding this non-recurring amount, the ratio of net investment income to average net assets would have been 1.57%.
eTotal return does not include any fees, charges or expenses imposed by the variable annuity and life insurance contracts for which the Franklin Templeton Variable Insurance Products Trust serves as an underlying investment vehicle.
fBenefit of expense reduction rounds to less than 0.01%.
The accompanying notes are an integral part of these financial statements.
FRD-7
Franklin Templeton Variable Insurance Products Trust
Financial Highlights (continued)
Franklin Rising Dividends Securities Fund
| | | | | | | | | | | | | | | | | | | | |
| | | Year Ended December 31, | |
| Class 2 | | 2009 | | | 2008 | | | 2007 | | | 2006 | | | 2005 | |
| | | | |
Per share operating performance | | | | | | | | | | | | | | | | | | | | |
(for a share outstanding throughout the year) | | | | | | | | | | | | | | | | | | | | |
Net asset value, beginning of year | | $ | 13.72 | | | $ | 19.27 | | | $ | 20.55 | | | $ | 17.84 | | | $ | 17.51 | |
| | | | |
Income from investment operationsa: | | | | | | | | | | | | | | | | | | | | |
Net investment incomeb | | | 0.10 | c | | | 0.31 | | | | 0.30 | | | | 0.56 | d | | | 0.24 | |
Net realized and unrealized gains (losses) | | | 2.24 | | | | (5.42 | ) | | | (0.79 | ) | | | 2.46 | | | | 0.34 | |
| | | | |
Total from investment operations | | | 2.34 | | | | (5.11 | ) | | | (0.49 | ) | | | 3.02 | | | | 0.58 | |
| | | | |
Less distributions from: | | | | | | | | | | | | | | | | | | | | |
Net investment income | | | (0.20 | ) | | | (0.31 | ) | | | (0.49 | ) | | | (0.21 | ) | | | (0.15 | ) |
Net realized gains | | | — | | | | (0.13 | ) | | | (0.30 | ) | | | (0.10 | ) | | | (0.10 | ) |
| | | | |
Total distributions | | | (0.20 | ) | | | (0.44 | ) | | | (0.79 | ) | | | (0.31 | ) | | | (0.25 | ) |
| | | | |
Net asset value, end of year | | $ | 15.86 | | | $ | 13.72 | | | $ | 19.27 | | | $ | 20.55 | | | $ | 17.84 | |
| | | | |
| | | | | |
Total returne | | | 17.34% | | | | (27.10)% | | | | (2.69)% | | | | 17.12% | | | | 3.43% | |
Ratios to average net assets | | | | | | | | | | | | | | | | | | | | |
Expensesf | | | 0.90% | | | | 0.86% | | | | 0.84% | | | | 0.86% | | | | 0.87% | |
Net investment income | | | 0.74% | c | | | 1.80% | | | | 1.47% | | | | 2.90% | d | | | 1.40% | |
| | | | | |
Supplemental data | | | | | | | | | | | | | | | | | | | | |
Net assets, end of year (000’s) | | $ | 1,371,351 | | | $ | 1,286,878 | | | $ | 2,079,366 | | | $ | 1,981,240 | | | $ | 1,423,827 | |
Portfolio turnover rate | | | 16.99% | | | | 5.39% | | | | 3.29% | | | | 6.19% | | | | 2.26% | |
aThe amount shown for a share outstanding throughout the period may not correlate with the Statement of Operations for the period due to the timing of sales and repurchases of the Fund shares in relation to income earned and/or fluctuating market value of the investments of the Fund.
bBased on average daily shares outstanding.
cNet investment income per share includes approximately $(0.15) per share as a return of capital adjustment to a previously recorded special dividend received by the Fund. Excluding this non-recurring amount, the ratio of net investment income to average net assets would have been 1.82%.
dNet investment income per share includes approximately $0.30 per share received in the form of a special dividend paid in connection with a corporate spin-off. Excluding this non-recurring amount, the ratio of net investment income to average net assets would have been 1.32%.
eTotal return does not include any fees, charges or expenses imposed by the variable annuity and life insurance contracts for which the Franklin Templeton Variable Insurance Products Trust serves as an underlying investment vehicle.
fBenefit of expense reduction rounds to less than 0.01%.
The accompanying notes are an integral part of these financial statements.
FRD-8
Franklin Templeton Variable Insurance Products Trust
Financial Highlights (continued)
Franklin Rising Dividends Securities Fund
| | | | | | | | |
| | | Year Ended
December 31, | |
| Class 4 | | 2009 | | | 2008a | |
| | | | |
Per share operating performance | | | | | | | | |
(for a share outstanding throughout the year) | | | | | | | | |
Net asset value, beginning of year | | $ | 13.92 | | | $ | 18.51 | |
| | | | |
Income from investment operationsb: | | | | | | | | |
Net investment incomec | | | 0.13 | d | | | 0.26 | |
Net realized and unrealized gains (losses) | | | 2.24 | | | | (4.36 | ) |
| | | | |
Total from investment operations | | | 2.37 | | | | (4.10 | ) |
| | | | |
Less distributions from: | | | | | | | | |
Net investment income | | | (0.20 | ) | | | (0.36 | ) |
Net realized gains | | | — | | | | (0.13 | ) |
| | | | |
Total distributions | | | (0.20 | ) | | | (0.49 | ) |
| | | | |
Net asset value, end of year | | $ | 16.09 | | | $ | 13.92 | |
| | | | |
| | |
Total returne | | | 17.22% | | | | (22.82)% | |
Ratios to average net assetsf | | | | | | | | |
Expensesg | | | 1.00% | | | | 0.96% | |
Net investment income | | | 0.64% | d | | | 1.70% | |
| | |
Supplemental data | | | | | | | | |
Net assets, end of year (000’s) | | $ | 15 | | | $ | 4 | |
Portfolio turnover rate | | | 16.99% | | | | 5.39% | |
aFor the period February 29, 2008 (effective date) to December 31, 2008.
bThe amount shown for a share outstanding throughout the period may not correlate with the Statement of Operations for the period due to the timing of sales and repurchases of the Fund shares in relation to income earned and/or fluctuating market value of the investments of the Fund.
cBased on average daily shares outstanding.
dNet investment income per share includes approximately $(0.15) per share as a return of capital adjustment to a previously recorded special dividend received by the Fund. Excluding this non-recurring amount, the ratio of net investment income to average net assets would have been 1.72%.
eTotal return does not include any fees, charges or expenses imposed by the variable annuity and life insurance contracts for which the Franklin Templeton Variable Insurance Products Trust serves as an underlying investment vehicle. Total return is not annualized for periods less than one year.
fRatios are annualized for periods less than one year.
gBenefit of expense reduction rounds to less than 0.01%.
The accompanying notes are an integral part of these financial statements.
FRD-9
Franklin Templeton Variable Insurance Products Trust
Statement of Investments, December 31, 2009
| | | | | |
| Franklin Rising Dividends Securities Fund | | Shares | | Value |
Common Stocks 96.2% | | | | | |
Aerospace & Defense 5.7% | | | | | |
United Technologies Corp. | | 1,239,776 | | $ | 86,052,852 |
| | | | | |
Banks 1.8% | | | | | |
Hudson City Bancorp Inc. | | 1,378,600 | | | 18,928,178 |
Peoples Bancorp Inc. | | 159,977 | | | 1,548,577 |
TrustCo Bank Corp. NY | | 328,588 | | | 2,070,105 |
U.S. Bancorp | | 166,449 | | | 3,746,767 |
| | | | | |
| | | | | 26,293,627 |
| | | | | |
Commercial & Professional Services 2.5% | | | | | |
ABM Industries Inc. | | 951,288 | | | 19,653,610 |
Cintas Corp. | | 583,200 | | | 15,192,360 |
Superior Uniform Group Inc. | | 237,100 | | | 2,311,725 |
| | | | | |
| | | | | 37,157,695 |
| | | | | |
Consumer Durables & Apparel 1.3% | | | | | |
aKid Brands Inc. | | 306,081 | | | 1,340,635 |
Leggett & Platt Inc. | | 852,300 | | | 17,386,920 |
| | | | | |
| | | | | 18,727,555 |
| | | | | |
Consumer Services 1.5% | | | | | |
Hillenbrand Inc. | | 1,191,300 | | | 22,444,092 |
| | | | | |
Diversified Financials 0.9% | | | | | |
State Street Corp. | | 324,500 | | | 14,128,730 |
| | | | | |
Electrical Equipment 8.7% | | | | | |
Brady Corp., A | | 1,896,079 | | | 56,901,331 |
Roper Industries Inc. | | 1,433,050 | | | 75,048,828 |
| | | | | |
| | | | | 131,950,159 |
| | | | | |
Food & Staples Retailing 5.1% | | | | | |
Wal-Mart Stores Inc. | | 1,450,600 | | | 77,534,570 |
| | | | | |
Food, Beverage & Tobacco 3.8% | | | | | |
McCormick & Co. Inc. | | 1,592,095 | | | 57,522,392 |
| | | | | |
Health Care Equipment & Services 13.3% | | | | | |
Beckman Coulter Inc. | | 15,400 | | | 1,007,776 |
Becton, Dickinson and Co. | | 1,074,143 | | | 84,706,917 |
Hill-Rom Holdings Inc. | | 896,603 | | | 21,509,506 |
Stryker Corp. | | 414,500 | | | 20,878,365 |
Teleflex Inc. | | 513,753 | | | 27,686,149 |
West Pharmaceutical Services Inc. | | 1,165,600 | | | 45,691,520 |
| | | | | |
| | | | | 201,480,233 |
| | | | | |
Household & Personal Products 6.8% | | | | | |
Alberto-Culver Co. | | 848,350 | | | 24,848,172 |
The Procter & Gamble Co. | | 1,293,600 | | | 78,430,968 |
| | | | | |
| | | | | 103,279,140 |
| | | | | |
Industrial Conglomerates 1.4% | | | | | |
Carlisle Cos. Inc. | | 596,861 | | | 20,448,458 |
| | | | | |
Insurance 11.4% | | | | | |
Aflac Inc. | | 874,900 | | | 40,464,125 |
Arthur J. Gallagher & Co. | | 753,000 | | | 16,950,030 |
Erie Indemnity Co., A | | 1,418,294 | | | 55,341,832 |
FRD-10
Franklin Templeton Variable Insurance Products Trust
Statement of Investments, December 31, 2009 (continued)
| | | | | |
| Franklin Rising Dividends Securities Fund | | Shares | | Value |
Common Stocks (continued) | | | | | |
Insurance (continued) | | | | | |
Mercury General Corp. | | 154,200 | | $ | 6,053,892 |
Old Republic International Corp. | | 3,587,208 | | | 36,015,568 |
RLI Corp. | | 335,848 | | | 17,883,906 |
| | | | | |
| | | | | 172,709,353 |
| | | | | |
Machinery 6.5% | | | | | |
Donaldson Co. Inc. | | 392,000 | | | 16,675,680 |
Dover Corp. | | 1,453,700 | | | 60,488,457 |
Graco Inc. | | 270,112 | | | 7,717,100 |
Nordson Corp. | | 226,591 | | | 13,862,837 |
| | | | | |
| | | | | 98,744,074 |
| | | | | |
Materials 12.0% | | | | | |
Air Products and Chemicals Inc. | | 429,500 | | | 34,815,270 |
Bemis Co. Inc. | | 1,231,300 | | | 36,508,045 |
Nucor Corp. | | 763,802 | | | 35,631,363 |
Praxair Inc. | | 926,100 | | | 74,375,091 |
| | | | | |
| | | | | 181,329,769 |
| | | | | |
Pharmaceuticals, Biotechnology & Life Sciences 6.0% | | | | | |
Abbott Laboratories | | 897,300 | | | 48,445,227 |
Pfizer Inc. | | 2,284,100 | | | 41,547,779 |
| | | | | |
| | | | | 89,993,006 |
| | | | | |
Retailing 5.2% | | | | | |
Family Dollar Stores Inc. | | 2,738,630 | | | 76,216,073 |
aSally Beauty Holdings Inc. | | 349,150 | | | 2,670,998 |
| | | | | |
| | | | | 78,887,071 |
| | | | | |
Semiconductors & Semiconductor Equipment 0.1% | | | | | |
Cohu Inc. | | 50,300 | | | 701,685 |
| | | | | |
Technology Hardware & Equipment 2.2% | | | | | |
International Business Machines Corp. | | 253,100 | | | 33,130,790 |
| | | | | |
Total Common Stocks (Cost $1,149,988,902) | | | | | 1,452,515,251 |
| | | | | |
Short Term Investments 3.6% | | | | | |
Money Market Funds 3.6% | | | | | |
aBank of New York Institutional Cash Reserve Fund, Series B | | 632,226 | | | 505,781 |
bInstitutional Fiduciary Trust Money Market Portfolio, 0.00% | | 54,581,614 | | | 54,581,614 |
| | | | | |
Total Money Market Funds (Cost $55,213,840) | | 55,087,395 |
| | | | | |
Total Investments (Cost $1,205,202,742) 99.8% | | | | | 1,507,602,646 |
Other Assets, less Liabilities 0.2% | | | | | 3,579,694 |
| | | | | |
Net Assets 100.0% | | | | $ | 1,511,182,340 |
| | | | | |
aNon-income producing.
bSee Note 7 regarding investments in the Institutional Fiduciary Trust Money Market Portfolio. The rate shown is the annualized seven-day yield at period end.
The accompanying notes are an integral part of these financial statements.
FRD-11
Franklin Templeton Variable Insurance Products Trust
Financial Statements
Statement of Assets and Liabilities
December 31, 2009
| | | | |
| | | Franklin Rising
Dividends
Securities Fund | |
Assets: | | | | |
Investments in securities: | | | | |
Cost - Unaffiliated issuers | | $ | 1,150,621,128 | |
Cost - Sweep Money Fund (Note 7) | | | 54,581,614 | |
| | | | |
Total cost of investments | | $ | 1,205,202,742 | |
| | | | |
Value - Unaffiliated issuers | | $ | 1,453,021,032 | |
Value - Sweep Money Fund (Note 7) | | | 54,581,614 | |
| | | | |
Total value of investments | | | 1,507,602,646 | |
Receivables: | | | | |
Investment securities sold | | | 3,240,304 | |
Capital shares sold | | | 169,140 | |
Dividends | | | 3,445,915 | |
Other assets | | | 224 | |
| | | | |
Total assets | | | 1,514,458,229 | |
| | | | |
Liabilities: | | | | |
Payables: | | | | |
Capital shares redeemed | | | 1,025,559 | |
Affiliates | | | 1,367,670 | |
Reports to shareholders | | | 187,788 | |
Funds advanced by custodian | | | 632,226 | |
Accrued expenses and other liabilities | | | 62,646 | |
| | | | |
Total liabilities | | | 3,275,889 | |
| | | | |
Net assets, at value | | $ | 1,511,182,340 | |
| | | | |
Net assets consist of: | | | | |
Paid-in capital | | $ | 1,497,715,982 | |
Undistributed net investment income | | | 25,224,971 | |
Net unrealized appreciation (depreciation) | | | 302,399,904 | |
Accumulated net realized gain (loss) | | | (314,158,517 | ) |
| | | | |
Net assets, at value | | $ | 1,511,182,340 | |
| | | | |
Class 1: | | | | |
Net assets, at value | | $ | 139,815,671 | |
| | | | |
Shares outstanding | | | 8,670,013 | |
| | | | |
Net asset value and maximum offering price per share | | $ | 16.13 | |
| | | | |
Class 2: | | | | |
Net assets, at value | | $ | 1,371,351,204 | |
| | | | |
Shares outstanding | | | 86,476,726 | |
| | | | |
Net asset value and maximum offering price per share | | $ | 15.86 | |
| | | | |
Class 4: | | | | |
Net assets, at value | | $ | 15,465 | |
| | | | |
Shares outstanding | | | 961 | |
| | | | |
Net asset value and maximum offering price per share | | $ | 16.09 | |
| | | | |
The accompanying notes are an integral part of these financial statements.
FRD-12
Franklin Templeton Variable Insurance Products Trust
Financial Statements (continued)
Statement of Operations
for the year ended December 31, 2009
| | | | |
| | | Franklin Rising
Dividends
Securities Fund | |
Investment income: | | | | |
Dividends: | | | | |
Unaffiliated issuers | | $ | 22,493,407 | a |
Sweep Money Fund (Note 7) | | | 55,452 | |
| | | | |
Total investment income | | | 22,548,859 | |
| | | | |
Expenses: | | | | |
Management fees (Note 3a) | | | 8,549,431 | |
Distribution fees: (Note 3c) | | | | |
Class 2 | | | 3,097,752 | |
Class 4 | | | 16 | |
Unaffiliated transfer agent fees | | | 1,364 | |
Custodian fees (Note 4) | | | 14,973 | |
Reports to shareholders | | | 229,369 | |
Professional fees | | | 50,499 | |
Trustees’ fees and expenses | | | 11,391 | |
Other | | | 66,720 | |
| | | | |
Total expenses | | | 12,021,515 | |
Expense reductions (Note 4) | | | (3 | ) |
| | | | |
Net expenses | | | 12,021,512 | |
| | | | |
Net investment income | | | 10,527,347 | |
| | | | |
Realized and unrealized gains (losses): | | | | |
Net realized gain (loss) from investments | | | (78,434,293 | ) |
Net change in unrealized appreciation (depreciation) on investments | | | 289,247,239 | |
| | | | |
Net realized and unrealized gain (loss) | | | 210,812,946 | |
| | | | |
Net increase (decrease) in net assets resulting from operations | | $ | 221,340,293 | |
| | | | |
aDividend income includes $(14,706,456) as a return of capital adjustment to a previously recorded special dividend received by the Fund. Excluding this non-recurring amount, the dividend income would have been $37,199,863.
The accompanying notes are an integral part of these financial statements.
FRD-13
Franklin Templeton Variable Insurance Products Trust
Financial Statements (continued)
Statements of Changes in Net Assets
| | | | | | | | |
| | | Franklin Rising Dividends
Securities Fund | |
| | | Year Ended December 31, | |
| | | 2009 | | | 2008 | |
| | | | |
Increase (decrease) in net assets: | | | | | | | | |
Operations: | | | | | | | | |
Net investment income | | $ | 10,527,347 | | | $ | 35,174,364 | |
Net realized gain (loss) from investments | | | (78,434,293 | ) | | | (234,658,586 | ) |
Net change in unrealized appreciation (depreciation) on investments | | | 289,247,239 | | | | (387,942,691 | ) |
| | | | |
Net increase (decrease) in net assets resulting from operations | | | 221,340,293 | | | | (587,426,913 | ) |
| | | | |
Distributions to shareholders from: | | | | | | | | |
Net investment income: | | | | | | | | |
Class 1 | | | (2,324,786 | ) | | | (3,976,477 | ) |
Class 2 | | | (18,134,021 | ) | | | (31,994,362 | ) |
Class 4 | | | (54 | ) | | | (98 | ) |
Net realized gains: | | | | | | | | |
Class 1 | | | — | | | | (1,471,627 | ) |
Class 2 | | | — | | | | (13,810,813 | ) |
Class 4 | | | — | | | | (36 | ) |
| | | | |
Total distributions to shareholders | | | (20,458,861 | ) | | | (51,253,413 | ) |
| | | | |
Capital share transactions: (Note 2) | | | | | | | | |
Class 1 | | | (21,307,918 | ) | | | (30,501,392 | ) |
Class 2 | | | (98,146,365 | ) | | | (216,391,575 | ) |
Class 4 | | | 11,072 | | | | 5,000 | |
| | | | |
Total capital share transactions | | | (119,443,211 | ) | | | (246,887,967 | ) |
| | | | |
Net increase (decrease) in net assets | | | 81,438,221 | | | | (885,568,293 | ) |
Net assets: | | | | | | | | |
Beginning of year | | | 1,429,744,119 | | | | 2,315,312,412 | |
| | | | |
End of year | | $ | 1,511,182,340 | | | $ | 1,429,744,119 | |
| | | | |
Undistributed net investment income included in net assets: | | | | | | | | |
End of year | | $ | 25,224,971 | | | $ | 35,156,485 | |
| | | | |
The accompanying notes are an integral part of these financial statements.
FRD-14
Franklin Templeton Variable Insurance Products Trust
Notes to Financial Statements
Franklin Rising Dividends Securities Fund
1. ORGANIZATION AND SIGNIFICANT ACCOUNTING POLICIES
Franklin Templeton Variable Insurance Products Trust (Trust) is registered under the Investment Company Act of 1940, as amended, (1940 Act) as an open-end investment company, consisting of twenty-two separate funds. The Franklin Rising Dividends Securities Fund (Fund) is included in this report. The financial statements of the remaining funds in the Trust are presented separately. Shares of the Fund are generally sold only to insurance company separate accounts to fund the benefits of variable life insurance policies or variable annuity contracts. At December 31, 2009, 64.23% of the Fund’s shares were held through one insurance company. The Fund offers three classes of shares: Class 1, Class 2, and Class 4. Each class of shares differs by its distribution fees, voting rights on matters affecting a single class and its exchange privilege.
The following summarizes the Fund’s significant accounting policies.
a. Security Valuation
Equity and other securities listed on a securities exchange or on the NASDAQ National Market System are valued at the last quoted sale price or the official closing price of the day, respectively. Over-the-counter securities and listed securities for which there is no reported sale are valued within the range of the most recent quoted bid and ask prices. Securities that trade in multiple markets or on multiple exchanges are valued according to the broadest and most representative market. Certain equity securities are valued based upon fundamental characteristics or relationships to similar securities. Investments in open-end mutual funds are valued at the closing net asset value.
The Fund has procedures to determine the fair value of individual securities and other assets for which market prices are not readily available or which may not be reliably priced. Methods for valuing these securities may include: fundamental analysis based upon the underlying investment book value, anticipated future cash flows, market changes in comparable or similar securities, matrix pricing, discounts from market prices of similar securities, or discounts applied due to the nature and duration of restrictions on the disposition of the securities. Due to the inherent uncertainty of valuations of such securities, the fair values may differ significantly from the values that would have been used had a ready market for such investments existed. Occasionally, events occur between the time at which trading in a security is completed and the close of the NYSE that might call into question the availability (including the reliability) of the value of a portfolio security held by the Fund. If such an event occurs, the securities may be valued using fair value procedures, which may include the use of independent pricing services. All security valuation procedures are approved by the Fund’s Board of Trustees.
b. Securities Lending
The Fund participates in a principal based security lending program. The Fund receives cash collateral against the loaned securities in an amount equal to at least 102% of the market value of the loaned securities. Collateral is maintained over the life of the loan in an amount not less than 100% of the market value of loaned securities, as determined at the close of Fund business each day; any additional collateral required due to changes in security values is delivered to the Fund on the next business day. The collateral is invested in repurchase agreements or in a non-registered money fund (Bank of New York Institutional Cash Reserve Fund or ICRF) managed by the Fund’s custodian on the Fund’s behalf. The Fund receives income from the investment of cash collateral, in addition to lending fees and rebates paid by the borrower. The Fund bears the market risk with respect to the collateral investment, securities loaned, and the risk that the principal may default on its obligations to the Fund. At December 31, 2009, the Fund had no securities on loan.
In September of 2008, the Bank of New York Mellon advised the Fund that the ICRF had exposure to certain defaulted debt obligations of Lehman Brothers Holdings, Inc. and that they had created a separate sleeve (Series B) of the ICRF to hold these securities apart from the main investments. Each investor in the ICRF was allocated its pro-rata portion of Series B. The Fund’s position in Series B is disclosed on the Statement of Investments at fair value and any unrealized loss attributable to the position is included in net assets.
FRD-15
Franklin Templeton Variable Insurance Products Trust
Notes to Financial Statements (continued)
Franklin Rising Dividends Securities Fund
1. ORGANIZATION AND SIGNIFICANT ACCOUNTING POLICIES (continued)
c. Income Taxes
No provision has been made for U.S. income taxes because it is the Fund’s policy to qualify as a regulated investment company under the Internal Revenue Code and to distribute to shareholders substantially all of its taxable income and net realized gains.
The Fund has reviewed the tax positions, taken on federal income tax returns, for each of the three open tax years and as of December 31, 2009, and has determined that no provision for income tax is required in the Fund’s financial statements.
d. Security Transactions, Investment Income, Expenses and Distributions
Security transactions are accounted for on trade date. Realized gains and losses on security transactions are determined on a specific identification basis. Estimated expenses are accrued daily. Dividend income is recorded on the ex-dividend date. Distributions to shareholders are recorded on the ex-dividend date and are determined according to income tax regulations (tax basis). Distributable earnings determined on a tax basis may differ from earnings recorded in accordance with accounting principles generally accepted in the United States of America. These differences may be permanent or temporary. Permanent differences are reclassified among capital accounts to reflect their tax character. These reclassifications have no impact on net assets or the results of operations. Temporary differences are not reclassified, as they may reverse in subsequent periods.
Common expenses incurred by the Trust are allocated among the funds based on the ratio of net assets of each fund to the combined net assets of the Trust. Fund specific expenses are charged directly to the fund that incurred the expense.
Realized and unrealized gains and losses and net investment income, not including class specific expenses, are allocated daily to each class of shares based upon the relative proportion of net assets of each class. Differences in per share distributions, by class, are generally due to differences in class specific expenses.
Distributions received by the Fund from certain securities may be a return of capital (ROC). Such distributions reduce the cost basis of the securities, and any distributions in excess of the cost basis are recognized as capital gains.
e. Accounting Estimates
The preparation of financial statements in accordance with accounting principles generally accepted in the United States of America requires management to make estimates and assumptions that affect the reported amounts of assets and liabilities at the date of the financial statements and the amounts of income and expenses during the reporting period. Actual results could differ from those estimates.
f. Guarantees and Indemnifications
Under the Trust’s organizational documents, its officers and trustees are indemnified by the Trust against certain liabilities arising out of the performance of their duties to the Trust. Additionally, in the normal course of business, the Trust, on behalf of the Fund, enters into contracts with service providers that contain general indemnification clauses. The Trust’s maximum exposure under these arrangements is unknown as this would involve future claims that may be made against the Trust that have not yet occurred. Currently, the Trust expects the risk of loss to be remote.
FRD-16
Franklin Templeton Variable Insurance Products Trust
Notes to Financial Statements (continued)
Franklin Rising Dividends Securities Fund
2. SHARES OF BENEFICIAL INTEREST
At December 31, 2009, there were an unlimited number of shares authorized (without par value). Transactions in the Fund’s shares were as follows:
| | | | | | | | | | | | | | |
| | | Year Ended December 31, | |
| | | 2009 | | | 2008a | |
| Class 1 Shares: | | Shares | | | Amount | | | Shares | | | Amount | |
Shares sold | | 342,788 | | | $ | 4,710,091 | | | 277,877 | | | $ | 4,587,250 | |
Shares issued in reinvestment of distributions | | 170,689 | | | | 2,324,786 | | | 289,331 | | | | 5,448,104 | |
Shares redeemed | | (2,076,650 | ) | | | (28,342,795 | ) | | (2,366,622 | ) | | | (40,536,746 | ) |
| | | | |
Net increase (decrease) | | (1,563,173 | ) | | $ | (21,307,918 | ) | | (1,799,414 | ) | | $ | (30,501,392 | ) |
| | | | |
Class 2 Shares: | | | | | | | | | | | | | | |
Shares sold | | 3,853,342 | | | $ | 52,313,933 | | | 4,881,454 | | | $ | 84,391,025 | |
Shares issued in reinvestment of distributions | | 1,352,276 | | | | 18,134,021 | | | 2,471,947 | | | | 45,805,175 | |
Shares redeemed | | (12,538,092 | ) | | | (168,594,319 | ) | | (21,427,912 | ) | | | (346,587,775 | ) |
| | | | |
Net increase (decrease) | | (7,332,474 | ) | | $ | (98,146,365 | ) | | (14,074,511 | ) | | $ | (216,391,575 | ) |
| | | | |
Class 4 Shares: | | | | | | | | | | | | | | |
Shares sold | | 691 | | | $ | 11,072 | | | 270 | | | $ | 5,000 | |
| | | | |
aFor the period February 29, 2008 (effective date) to December 31, 2008 for Class 4.
3. TRANSACTIONS WITH AFFILIATES
Franklin Resources, Inc. is the holding company for various subsidiaries that together are referred to as Franklin Templeton Investments. Certain officers and trustees of the Trust are also officers and/or directors of the following subsidiaries:
| | |
| Subsidiary | | Affiliation |
Franklin Advisory Services, LLC (Advisory Services) | | Investment manager |
Franklin Templeton Services, LLC (FT Services) | | Administrative manager |
Franklin Templeton Distributors, Inc. (Distributors) | | Principal underwriter |
Franklin Templeton Investor Services, LLC (Investor Services) | | Transfer agent |
a. Management Fees
The Fund pays an investment management fee to Advisory Services based on the average daily net assets of the Fund as follows:
| | |
| Annualized Fee Rate | | Net Assets |
| 0.750% | | Up to and including $500 million |
| 0.625% | | Over $500 million, up to and including $1 billion |
| 0.500% | | In excess of $1 billion |
b. Administrative Fees
Under an agreement with Advisory Services, FT Services provides administrative services to the Fund. The fee is paid by Advisory Services based on average daily net assets, and is not an additional expense of the Fund.
FRD-17
Franklin Templeton Variable Insurance Products Trust
Notes to Financial Statements (continued)
Franklin Rising Dividends Securities Fund
3. TRANSACTIONS WITH AFFILIATES (continued)
c. Distribution Fees
The Fund’s Board of Trustees has adopted distribution plans for Class 2 and Class 4 shares pursuant to Rule 12b-1 under the 1940 Act. Under the Fund’s compensation distribution plans, the Fund pays Distributors for costs incurred in connection with the servicing, sale and distribution of the Fund’s shares up to 0.35% per year of its average daily net assets of each class. The Board of Trustees has agreed to limit the current rate to 0.25% per year for Class 2.
d. Transfer Agent Fees
Investor Services, under terms of an agreement, performs shareholder servicing for the Fund and is not paid by the Fund for the services.
4. EXPENSE OFFSET ARRANGEMENT
The Fund has entered into an arrangement with its custodian whereby credits realized as a result of uninvested cash balances are used to reduce a portion of the Fund’s custodian expenses. During the year ended December 31, 2009, the custodian fees were reduced as noted in the Statement of Operations.
5. INCOME TAXES
For tax purposes, capital losses may be carried over to offset future capital gains, if any. At December 31, 2009, the capital loss carryforwards were as follows:
| | | |
Capital loss carryforwards expiring in: | | | |
2016 | | $ | 204,040,738 |
2017 | | | 107,931,803 |
| | | |
| | $ | 311,972,541 |
| | | |
The tax character of distributions paid during the years ended December 31, 2009 and 2008, was as follows:
| | | | | | |
| | | 2009 | | 2008 |
Distributions paid from: | | | | | | |
Ordinary income | | $ | 20,458,861 | | $ | 37,511,317 |
Long term capital gain | | | — | | | 13,742,096 |
| | | |
| | $ | 20,458,861 | | $ | 51,253,413 |
| | | |
At December 31, 2009, the cost of investments, net unrealized appreciation (depreciation) and undistributed ordinary income for income tax purposes were as follows:
| | | | |
Cost of investments | | $ | 1,207,388,715 | |
| | | | |
| |
Unrealized appreciation | | $ | 393,457,948 | |
Unrealized depreciation | | | (93,244,017 | ) |
| | | | |
Net unrealized appreciation (depreciation) | | $ | 300,213,931 | |
| | | | |
Distributable earnings – undistributed ordinary income | | $ | 25,224,971 | |
| | | | |
Net realized gains (losses) differ for financial statement and tax purposes primarily due to differing treatment of wash sales.
FRD-18
Franklin Templeton Variable Insurance Products Trust
Notes to Financial Statements (continued)
Franklin Rising Dividends Securities Fund
6. INVESTMENT TRANSACTIONS
Purchases and sales of investments (excluding short term securities) for the year ended December 31, 2009, aggregated $221,851,049 and $310,803,886, respectively.
7. INVESTMENTS IN INSTITUTIONAL FIDUCIARY TRUST MONEY MARKET PORTFOLIO
The Fund may invest in the Institutional Fiduciary Trust Money Market Portfolio (Sweep Money Fund), an open-end investment company managed by Franklin Advisers, Inc. (an affiliate of the investment manager). Management fees paid by the Fund are reduced on assets invested in the Sweep Money Fund, in an amount not to exceed the management and administrative fees paid by the Sweep Money Fund.
8. CREDIT FACILITY
The Fund, together with other U.S. registered and foreign investment funds (collectively “Borrowers”), managed by Franklin Templeton Investments, are borrowers in a joint syndicated senior unsecured credit facility totaling $725 million (Global Credit Facility) to provide a source of funds to the Borrowers for temporary and emergency purposes, including the ability to meet future unanticipated or unusually large redemption requests. Effective January 22, 2010, the Fund renewed the Global Credit Facility, for a total of $750 million, maturing January 21, 2011.
Under the terms of the Global Credit Facility, the Fund shall, in addition to interest charged on any borrowings made by the Fund and other costs incurred by the Fund, pay its share of fees and expenses incurred in connection with the implementation and maintenance of the Global Credit Facility, based upon its relative share of the aggregate net assets of all of the Borrowers, including an annual commitment fee of 0.10% based upon the unused portion of the Global Credit Facility, which is reflected in other expenses on the Statement of Operations. During the year ended December 31, 2009, the Fund did not utilize the Global Credit Facility.
9. FAIR VALUE MEASUREMENTS
The Fund follows a fair value hierarchy that distinguishes between market data obtained from independent sources (observable inputs) and the Fund’s own market assumptions (unobservable inputs). These inputs are used in determining the value of the Fund’s investments and are summarized in the following fair value hierarchy:
| | • | | Level 1 – quoted prices in active markets for identical securities |
| | • | | Level 2 – other significant observable inputs (including quoted prices for similar securities, interest rates, prepayment speed, credit risk, etc.) |
| | • | | Level 3 – significant unobservable inputs (including the Fund’s own assumptions in determining the fair value of investments) |
The inputs or methodology used for valuing securities are not an indication of the risk associated with investing in those securities.
The following is a summary of the inputs used as of December 31, 2009, in valuing the Fund’s assets carried at fair value:
| | | | | | | | | | | | |
| | | Level 1 | | Level 2 | | Level 3 | | Total |
| | | |
Assets: | | | | | | | | | | | | |
Investments in Securities | | | | | | | | | | | | |
Equity Investmentsa | | $ | 1,452,515,251 | | $ | — | | $ | — | | $ | 1,452,515,251 |
Short Term Investments | | | 54,581,614 | | | 505,781 | | | — | | | 55,087,395 |
| | | |
Total Investments in Securities | | $ | 1,507,096,865 | | $ | 505,781 | | $ | — | | $ | 1,507,602,646 |
| | | |
aFor detailed industry descriptions, see the accompanying Statement of Investments.
FRD-19
Franklin Templeton Variable Insurance Products Trust
Notes to Financial Statements (continued)
Franklin Rising Dividends Securities Fund
10. NEW ACCOUNTING PRONOUNCEMENTS
In January 2010, the Financial Accounting Standards Board issued Accounting Standards Update (ASU) No. 2010-6, Fair Value Measurements and Disclosures (Topic 820): Improving Disclosures about Fair Value Measurements. ASU No. 2010-6 enhances and clarifies existing fair value measurement disclosure requirements and is effective for interim and annual periods beginning after December 15, 2009. The Fund is currently evaluating the impact, if any, of applying the provisions of ASU No. 2010-6.
11. SUBSEQUENT EVENTS
The Fund has evaluated subsequent events through February 10, 2010, the issuance date of the financial statements and determined that no events have occurred that require disclosure.
FRD-20
Franklin Templeton Variable Insurance Products Trust
Franklin Rising Dividends Securities Fund
Report of Independent Registered Public Accounting Firm
To the Board of Trustees and Shareholders of
Franklin Templeton Variable Insurance Products Trust
In our opinion, the accompanying statement of assets and liabilities, including the statement of investments, and the related statements of operations and of changes in net assets and the financial highlights present fairly, in all material respects, the financial position of Franklin Rising Dividends Securities Fund (one of the funds constituting the Franklin Templeton Variable Insurance Products Trust, hereafter referred to as the “Fund”) at December 31, 2009, the results of its operations for the year then ended, the changes in its net assets and the financial highlights for the periods presented, in conformity with accounting principles generally accepted in the United States of America. These financial statements and financial highlights (hereafter referred to as “financial statements”) are the responsibility of the Fund’s management. Our responsibility is to express an opinion on these financial statements based on our audits. We conducted our audits of these financial statements in accordance with the standards of the Public Company Accounting Oversight Board (United States). Those standards require that we plan and perform the audit to obtain reasonable assurance about whether the financial statements are free of material misstatement. An audit includes examining, on a test basis, evidence supporting the amounts and disclosures in the financial statements, assessing the accounting principles used and significant estimates made by management, and evaluating the overall financial statement presentation. We believe that our audits, which included confirmation of securities at December 31, 2009 by correspondence with the custodian and brokers, provide a reasonable basis for our opinion.
PricewaterhouseCoopers LLP
San Francisco, California
February 10, 2010
FRD-21
Franklin Templeton Variable Insurance Products Trust
Tax Designation (unaudited)
Franklin Rising Dividends Securities Fund
Under Section 854(b)(2) of the Internal Revenue Code, the Fund designates 100% of the ordinary income dividends as income qualifying for the dividends received deduction for the fiscal year ended December 31, 2009.
FRD-22
FRANKLIN SMALL CAP VALUE SECURITIES FUND
We are pleased to bring you Franklin Small Cap Value Securities Fund’s annual report for the fiscal year ended December 31, 2009.
Performance Summary as of 12/31/09
Average annual total return of Class 4 shares* represents the average annual change in value, assuming reinvestment of dividends and capital gains. Average returns smooth out variations in returns, which can be significant; they are not the same as year-by-year results.
Periods ended 12/31/09
| | | | | | |
| | | 1-Year | | 5-Year | | 10-Year |
Average Annual Total Return | | +29.04% | | +1.57% | | +8.74% |
*For the period beginning 2/29/08, Class 4 performance reflects a 12b-1 fee expense of 0.35% per year, which affects future performance. Class 4 performance prior to 2/29/08 reflects historical Class 1 performance, which does not include a 12b-1 fee expense. Since 2/29/08 (effective date), the average annual total return of Class 4 shares was -4.75%.
Total Return Index Comparison for a Hypothetical $10,000 Investment (1/1/00–12/31/09)
The graph below shows the change in value of a hypothetical $10,000 investment in the Fund over the indicated period and includes reinvestment of any income or distributions. The Fund’s performance* is compared to the performance of the Russell 2500™ Value Index. One cannot invest directly in an index, and an index is not representative of the Fund’s portfolio. Please see Important Notes to Performance Information preceding the Fund Summaries.
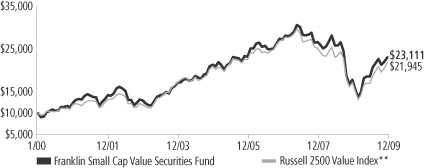
*Source: © 2009 Morningstar. Please see Index Descriptions following the
Fund Summaries.
Franklin Small Cap Value Securities Fund – Class 4
Performance reflects the Fund’s Class 4 operating expenses, but does not include any contract fees, expenses or sales charges. If they had been included, performance would be lower. These charges and deductions, particularly for variable life policies, can have a significant effect on contract values and insurance benefits. See the contract prospectus for a complete description of these expenses, including sales charges.
Performance data represent past performance, which does not guarantee future results. Investment return and principal value will fluctuate, and you may have a gain or loss when you sell your shares.
Current performance may differ from figures shown.
FSV-1
Fund Goal and Main Investments: Franklin Small Cap Value Securities Fund seeks long-term total return. The Fund normally invests at least 80% of its net assets in investments of small capitalization companies and normally invests predominantly in equity securities. For this Fund, small-capitalization companies are those with market capitalization values not exceeding $3.5 billion at the time of purchase. The Fund invests generally in equity securities of companies that the manager believes are currently undervalued and have the potential for capital appreciation.
Performance Overview
You can find the Fund’s one-year total return in the Performance Summary. The Fund outperformed its benchmark, the Russell 2500 Value Index, which rose 27.68% for the same period.1 Please note that the Fund employs a bottom-up stock selection process, and the managers invest in securities without regard to benchmark comparisons.
Economic and Market Overview
The U.S. economy ended 2009 in much better shape than it began. Economic challenges remain, such as stalled consumer confidence and job prospects for the unemployed as stimulus measures wind down. However, several reports pointed to improving economic conditions. In the year’s second half, corporate profit growth was higher than earlier estimates, which may allow businesses to build inventory following a long period of inventory drawdowns.
Throughout the year, the Federal Open Market Committee kept monetary policy unchanged, announcing it intends to hold the federal funds target rate in the 0% to 0.25% range “for an extended period” as it lays the groundwork for an eventual tightening of monetary policy. Late in the period, the labor market improved somewhat as the economy lost fewer jobs than expected and the unemployment rate fell slightly, dropping from a period high of 10.2% in October to 10.0% at period-end.2
U.S. gross domestic product grew at a 2.2% annualized rate in 2009’s third quarter after shrinking by 0.7% in the prior three months. This was the first expansion since 2008’s second quarter. As economic conditions improved, oil prices increased from $45 per barrel in December 2008 to $79 at year-end, still well below 2008 highs. December’s inflation rate was an annualized 2.7%.2 Core inflation, which excludes food and energy costs, rose at a 1.8% annualized rate, which was within the Federal Reserve Board’s informal target range of 1.5% to 2.0%.2
1. Source: © 2009 Morningstar. One cannot invest directly in an index, and an index is not representative of the Fund’s portfolio. Please see Index Descriptions following the Fund Summaries.
2. Source: Bureau of Labor Statistics.
Fund Risks: The Fund’s investments in stocks may offer the potential for long-term gains but can be subject to short-term price fluctuations. Smaller company securities can increase the risk of greater price volatility, particularly over the short term. Smaller or relatively new or unseasoned companies can also be particularly sensitive to changing economic conditions, and their prospects for growth are less certain than those of larger, more established companies. Foreign investing, especially in emerging markets, involves additional risks, including currency fluctuations, economic instability, market volatility, and political and social instability. The Fund’s prospectus also includes a description of the main investment risks.
FSV-2
Most stocks suffered significant losses through early March 2009 as investors worried about an uncertain future. Stocks then recovered from 12-year lows as economic data improved and investors perceived many bargains among the bear market fallout. For the 12 months under review, the Dow Jones Industrial Average, the Standard & Poor’s 500 Index and the NASDAQ Composite Index returned 22.68%, 26.46% and 45.32%, respectively.1 All sectors posted gains for the period, with the strongest returns from the information technology, materials and consumer discretionary sectors.
Investment Strategy
We are a research-driven, fundamental investment adviser, pursuing a disciplined, value-oriented strategy for the Fund. As a bottom-up adviser concentrating primarily on individual securities, we focus on the market price of a company’s securities relative to our evaluation of the company’s potential long-term earnings, asset value or cash flow. We seek bargains among the “unloved,” out-of-favor companies that offer, in our opinion, attractive long-term potential. These might include current growth companies that are being ignored by the market, former growth companies that have stumbled recently, dropping sharply in price but that still have significant growth potential, in our opinion, or companies that may be potential turnaround candidates or takeover targets.
Manager’s Discussion
During the fiscal year under review, the consumer discretionary sector was a top contributor to performance, due in part to recreational vehicle manufacturer Thor Industries, auto dealership operator Group 1 Automotive and specialty retailer Men’s Wearhouse.3 Other sector holdings that performed well included sportswear company Warnaco Group, furniture manufacturer La-Z-Boy, and automobile components manufacturers Autoliv and Gentex. In the materials sector, Reliance Steel & Aluminum and Westlake Chemical aided results. Industrials holding Universal Forest Products was also a significant contributor to performance.4
3. The consumer discretionary sector comprises automobiles and components, consumer durables and apparel, consumer services, and retailing in the SOI.
4. The industrials sector comprises capital goods, commercial and professional services, and transportation in the SOI.
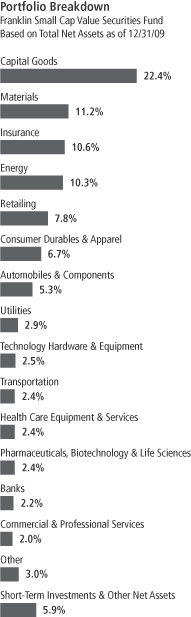
FSV-3
The financials sector detracted from Fund performance due in part to regional bank TrustCo Bank Corp. NY, commercial bank Chemical Financial, and insurance company IPC Holdings.5 In the industrials sector, transportation equipment manufacturer Wabash National and airline SkyWest hindered results. Other key detractors from performance included information technology products manufacturer Avocent and crude oil transportation services company General Maritime.
The Fund initiated five positions during the fiscal year in what we considered attractively valued securities: ceramics manufacturer Ceradyne, building and recreational vehicles products manufacturer Drew Industries, industrial goods provider Gardner Denver, department store operator J.C. Penney and contract research firm Pharmaceutical Product Development. We also added significantly to several existing positions including Fred’s, Protective Life, Rowan Companies and Trinity Industries. We liquidated seven positions during the fiscal year. The positions sold were Avocent, Corus Bankshares, General Maritime, Kid Brands (formerly, Russ Berrie & Co.), Mercer International, Monaco Coach and Syncora Holdings. In September, IPC Holdings was purchased by Validus Holdings for cash and stock. We also reduced several holdings including Mueller Industries, Omnivision Technologies and Universal Forest Products.
Thank you for your participation in Franklin Small Cap Value Securities Fund. We look forward to serving your future investment needs.
5. The financials sector comprises banks and insurance in the SOI.
The foregoing information reflects our analysis, opinions and portfolio holdings as of December 31, 2009, the end of the reporting period. The way we implement our main investment strategies and the resulting portfolio holdings may change depending on factors such as market and economic conditions. These opinions may not be relied upon as investment advice or an offer for a particular security. The information is not a complete analysis of every aspect of any market, country, industry, security or the Fund. Statements of fact are from sources considered reliable, but the investment manager makes no representation or warranty as to their completeness or accuracy. Although historical performance is no guarantee of future results, these insights may help you understand our investment management philosophy.
Top 10 Holdings
Franklin Small Cap Value Securities Fund
12/31/09
| | |
Company Sector/Industry | | % of Total
Net Assets |
| Thor Industries Inc. | | 2.0% |
| Automobiles & Components |
| Westlake Chemical Corp. | | 1.8% |
| Materials | | |
| Benchmark Electronics Inc. | | 1.7% |
Technology Hardware &
Equipment |
| Protective Life Corp. | | 1.6% |
| Insurance | | |
| Reliance Steel & Aluminum Co. | | 1.6% |
| Materials | | |
| Steel Dynamics Inc. | | 1.6% |
| Materials | | |
| Universal Forest Products Inc. | | 1.5% |
| Capital Goods | | |
| Rowan Cos. Inc. | | 1.5% |
| Energy | | |
| RPM International Inc. | | 1.5% |
| Materials | | |
| Old Republic International Corp. | | 1.5% |
| Insurance | | |
The dollar value, number of shares or principal amount, and names of all portfolio holdings are listed in the Fund’s Statement of Investments (SOI).
FSV-4
Fund Expenses
As an investor in a variable insurance contract (Contract) that indirectly provides for investment in an underlying mutual fund, you can incur transaction and/or ongoing expenses at both the Fund level and the Contract level.
| • | | Transaction expenses can include sales charges (loads) on purchases, redemption fees, surrender fees, transfer fees and premium taxes. |
| • | | Ongoing expenses can include management fees, distribution and service (12b-1) fees, contract fees, annual maintenance fees, mortality and expense risk fees and other fees and expenses. All mutual funds and Contracts have some types of ongoing expenses. |
The expenses shown in the table are meant to highlight ongoing expenses at the Fund level only and do not include ongoing expenses at the Contract level, or transaction expenses at either the Fund or Contract level. While the Fund does not have transaction expenses, if the transaction and ongoing expenses at the Contract level were included, the expenses shown below would be higher. You should consult your Contract prospectus or disclosure document for more information.
The table shows Fund-level ongoing expenses and can help you understand these expenses and compare them with those of other mutual funds offered through the Contract. The table assumes a $1,000 investment held for the six months indicated. Please refer to the Fund prospectus for additional information on operating expenses.
Actual Fund Expenses
The first line (Actual) of the table provides actual account values and expenses. The “Ending Account Value” is derived from the Fund’s actual return, which includes the effect of ongoing Fund expenses, but does not include the effect of ongoing Contract expenses.
You can estimate the Fund-level expenses you incurred during the period by following these steps. Of course, your account value and expenses will differ from those in this illustration:
| 1. | Divide your account value by $1,000. |
If an account had an $8,600 value, then $8,600 ÷ $1,000 = 8.6.
| 2. | Multiply the result by the number under the heading “Fund-Level Expenses Incurred During Period.” |
If Fund-Level Expenses Incurred During Period were $7.50, then
8.6 x $7.50 = $64.50.
In this illustration, the estimated expenses incurred this period at the Fund level are $64.50.
Franklin Small Cap Value Securities Fund – Class 4
FSV-5
Hypothetical Example for Comparison with Other Mutual Funds
Information in the second line (Hypothetical) of the table can help you compare ongoing expenses of the Fund with those of other mutual funds offered through the Contract. This information may not be used to estimate the actual ending account balance or expenses you incurred during the period. The hypothetical “Ending Account Value” is based on the Fund’s actual expense ratio and an assumed 5% annual rate of return before expenses, which does not represent the Fund’s actual return. The figure under the heading “Fund-Level Expenses Incurred During Period” shows the hypothetical expenses your account would have incurred under this scenario. You can compare this figure with the 5% hypothetical examples that appear in shareholder reports of other funds offered through a Contract.
| | | | | | | | | |
| Class 4 | | Beginning
Account Value 7/1/09 | | Ending
Account
Value 12/31/09 | | Fund-Level Expenses Incurred
During Period* 7/1/09–12/31/09 |
Actual | | $ | 1,000 | | $ | 1,238.70 | | $ | 5.70 |
Hypothetical (5% return before expenses) | | $ | 1,000 | | $ | 1,020.11 | | $ | 5.14 |
*Expenses are calculated using the most recent six-month annualized expense ratio for the Fund’s Class 4 shares (1.01%), which does not include any ongoing expenses of the Contract for which the Fund is an investment option, multiplied by the average account value over the period, multiplied by 184/365 to reflect the one-half year period.
FSV-6
Franklin Templeton Variable Insurance Products Trust
Financial Highlights
Franklin Small Cap Value Securities Fund
| | | | | | | | | | | | | | | | | | | | |
| | | Year Ended December 31, | |
| Class 1 | | 2009 | | | 2008 | | | 2007 | | | 2006 | | | 2005 | |
| | | | |
Per share operating performance | | | | | | | | | | | | | | | | | | | | |
(for a share outstanding throughout the year) | | | | | | | | | | | | | | | | | | | | |
Net asset value, beginning of year | | $ | 10.73 | | | $ | 17.38 | | | $ | 19.07 | | | $ | 17.02 | | | $ | 15.85 | |
| | | | |
Income from investment operationsa: | | | | | | | | | | | | | | | | | | | | |
Net investment incomeb | | | 0.15 | | | | 0.24 | | | | 0.22 | | | | 0.18 | | | | 0.17 | |
Net realized and unrealized gains (losses) | | | 2.86 | | | | (5.44 | ) | | | (0.44 | ) | | | 2.69 | | | | 1.24 | |
| | | | |
Total from investment operations | | | 3.01 | | | | (5.20 | ) | | | (0.22 | ) | | | 2.87 | | | | 1.41 | |
| | | | |
Less distributions from: | | | | | | | | | | | | | | | | | | | | |
Net investment income | | | (0.22 | ) | | | (0.23 | ) | | | (0.17 | ) | | | (0.16 | ) | | | (0.14 | ) |
Net realized gains | | | (0.52 | ) | | | (1.22 | ) | | | (1.30 | ) | | | (0.66 | ) | | | (0.10 | ) |
| | | | |
Total distributions | | | (0.74 | ) | | | (1.45 | ) | | | (1.47 | ) | | | (0.82 | ) | | | (0.24 | ) |
| | | | |
Net asset value, end of year | | $ | 13.00 | | | $ | 10.73 | | | $ | 17.38 | | | $ | 19.07 | | | $ | 17.02 | |
| | | | |
| | | | | |
Total returnc | | | 29.54% | | | | (32.87)% | | | | (2.14)% | | | | 17.30% | | | | 8.99% | |
Ratios to average net assets | | | | | | | | | | | | | | | | | | | | |
Expensesd | | | 0.68% | | | | 0.67% | | | | 0.64% | | | | 0.65% | | | | 0.64% | |
Net investment income | | | 1.29% | | | | 1.62% | | | | 1.13% | | | | 0.97% | | | | 1.05% | |
| | | | | |
Supplemental data | | | | | | | | | | | | | | | | | | | | |
Net assets, end of year (000’s) | | $ | 42,428 | | | $ | 34,901 | | | $ | 57,045 | | | $ | 73,154 | | | $ | 52,632 | |
Portfolio turnover rate | | | 6.68% | | | | 16.98% | | | | 16.27% | | | | 16.43% | e | | | 11.03% | |
aThe amount shown for a share outstanding throughout the period may not correlate with the Statement of Operations for the period due to the timing of sales and repurchases of the Fund shares in relation to income earned and/or fluctuating market value of the investments of the Fund.
bBased on average daily shares outstanding.
cTotal return does not include any fees, charges or expenses imposed by the variable annuity and life insurance contracts for which the Franklin Templeton Variable Insurance Products Trust serves as an underlying investment vehicle.
dBenefit of expense reduction rounds to less than 0.01%.
eExcludes the value of portfolio securities delivered as a result of a redemption in-kind.
The accompanying notes are an integral part of these financial statements.
FSV-7
Franklin Templeton Variable Insurance Products Trust
Financial Highlights (continued)
Franklin Small Cap Value Securities Fund
| | | | | | | | | | | | | | | | | | | | |
| | | Year Ended December 31, | |
| Class 2 | | 2009 | | | 2008 | | | 2007 | | | 2006 | | | 2005 | |
| | | | |
Per share operating performance | | | | | | | | | | | | | | | | | | | | |
(for a share outstanding throughout the year) | | | | | | | | | | | | | | | | | | | | |
Net asset value, beginning of year | | $ | 10.55 | | | $ | 17.10 | | | $ | 18.79 | | | $ | 16.79 | | | $ | 15.65 | |
| | | | |
Income from investment operationsa: | | | | | | | | | | | | | | | | | | | | |
Net investment incomeb | | | 0.12 | | | | 0.20 | | | | 0.17 | | | | 0.13 | | | | 0.13 | |
Net realized and unrealized gains (losses) | | | 2.81 | | | | (5.35 | ) | | | (0.43 | ) | | | 2.65 | | | | 1.23 | |
| | | | |
Total from investment operations | | | 2.93 | | | | (5.15 | ) | | | (0.26 | ) | | | 2.78 | | | | 1.36 | |
| | | | |
Less distributions from: | | | | | | | | | | | | | | | | | | | | |
Net investment income | | | (0.19 | ) | | | (0.18 | ) | | | (0.13 | ) | | | (0.12 | ) | | | (0.12 | ) |
Net realized gains | | | (0.52 | ) | | | (1.22 | ) | | | (1.30 | ) | | | (0.66 | ) | | | (0.10 | ) |
| | | | |
Total distributions | | | (0.71 | ) | | | (1.40 | ) | | | (1.43 | ) | | | (0.78 | ) | | | (0.22 | ) |
| | | | |
Net asset value, end of year | | $ | 12.77 | | | $ | 10.55 | | | $ | 17.10 | | | $ | 18.79 | | | $ | 16.79 | |
| | | | |
| | | | | |
Total returnc | | | 29.16% | | | | (33.02)% | | | | (2.38)% | | | | 16.98% | | | | 8.77% | |
Ratios to average net assets | | | | | | | | | | | | | | | | | | | | |
Expensesd | | | 0.93% | | | | 0.92% | | | | 0.89% | | | | 0.90% | | | | 0.89% | |
Net investment income | | | 1.04% | | | | 1.37% | | | | 0.88% | | | | 0.72% | | | | 0.80% | |
| | | | | |
Supplemental data | | | | | | | | | | | | | | | | | | | | |
Net assets, end of year (000’s) | | $ | 1,109,855 | | | $ | 784,773 | | | $ | 1,177,367 | | | $ | 1,240,892 | | | $ | 1,094,120 | |
Portfolio turnover rate | | | 6.68% | | | | 16.98% | | | | 16.27% | | | | 16.43% | e | | | 11.03% | |
aThe amount shown for a share outstanding throughout the period may not correlate with the Statement of Operations for the period due to the timing of sales and repurchases of the Fund shares in relation to income earned and/or fluctuating market value of the investments of the Fund.
bBased on average daily shares outstanding.
cTotal return does not include any fees, charges or expenses imposed by the variable annuity and life insurance contracts for which the Franklin Templeton Variable Insurance Products Trust serves as an underlying investment vehicle.
dBenefit of expense reduction rounds to less than 0.01%.
eExcludes the value of portfolio securities delivered as a result of a redemption in-kind.
The accompanying notes are an integral part of these financial statements.
FSV-8
Franklin Templeton Variable Insurance Products Trust
Financial Highlights (continued)
Franklin Small Cap Value Securities Fund
| | | | | | | | |
| | | Year Ended
December 31, | |
| Class 4 | | 2009 | | | 2008a | |
| | | | |
Per share operating performance | | | | | | | | |
(for a share outstanding throughout the year) | | | | | | | | |
Net asset value, beginning of year | | $ | 10.70 | | | $ | 16.42 | |
| | | | |
Income from investment operationsb: | | | | | | | | |
Net investment incomec | | | 0.11 | | | | 0.15 | |
Net realized and unrealized gains (losses) | | | 2.84 | | | | (4.42 | ) |
| | | | |
Total from investment operations | | | 2.95 | | | | (4.27 | ) |
| | | | |
Less distributions from: | | | | | | | | |
Net investment income | | | (0.21 | ) | | | (0.23 | ) |
Net realized gains | | | (0.52 | ) | | | (1.22 | ) |
| | | | |
Total distributions | | | (0.73 | ) | | | (1.45 | ) |
| | | | |
Net asset value, end of year | | $ | 12.92 | | | $ | 10.70 | |
| | | | |
| | |
Total returnd | | | 29.04% | | | | (29.14)% | |
Ratios to average net assetse | | | | | | | | |
Expensesf | | | 1.03% | | | | 1.02% | |
Net investment income | | | 0.94% | | | | 1.27% | |
| | |
Supplemental data | | | | | | | | |
Net assets, end of year (000’s) | | $ | 28,599 | | | $ | 14,850 | |
Portfolio turnover rate | | | 6.68% | | | | 16.98% | |
aFor the period February 29, 2008 (effective date) to December 31, 2008.
bThe amount shown for a share outstanding throughout the period may not correlate with the Statement of Operations for the period due to the timing of sales and repurchases of the Fund shares in relation to income earned and/or fluctuating market value of the investments of the Fund.
cBased on average daily shares outstanding.
dTotal return does not include any fees, charges or expenses imposed by the variable annuity and life insurance contracts for which the Franklin Templeton Variable Insurance Products Trust serves as an underlying investment vehicle. Total return is not annualized for periods less than one year.
eRatios are annualized for periods less than one year.
fBenefit of expense reduction rounds to less than 0.01%.
The accompanying notes are an integral part of these financial statements.
FSV-9
Franklin Templeton Variable Insurance Products Trust
Statement of Investments, December 31, 2009
| | | | | | | |
| Franklin Small Cap Value Securities Fund | | | | Shares | | Value |
Common Stocks 94.0% | | | | | | | |
Automobiles & Components 5.3% | | | | | | | |
Autoliv Inc. (Sweden) | | | | 384,900 | | $ | 16,689,265 |
aDrew Industries Inc. | | | | 90,700 | | | 1,872,955 |
Gentex Corp. | | | | 714,000 | | | 12,744,900 |
Thor Industries Inc. | | | | 754,900 | | | 23,703,860 |
aWinnebago Industries Inc. | | | | 600,000 | | | 7,320,000 |
| | | | | | | |
| | | | | | | 62,330,980 |
| | | | | | | |
Banks 2.2% | | | | | | | |
Chemical Financial Corp. | | | | 485,854 | | | 11,456,437 |
Peoples Bancorp Inc. | | | | 199,400 | | | 1,930,192 |
TrustCo Bank Corp. NY | | | | 1,939,000 | | | 12,215,700 |
| | | | | | | |
| | | | | | | 25,602,329 |
| | | | | | | |
Capital Goods 22.4% | | | | | | | |
A.O. Smith Corp. | | | | 112,500 | | | 4,881,375 |
American Woodmark Corp. | | | | 359,310 | | | 7,071,221 |
Apogee Enterprises Inc. | | | | 864,000 | | | 12,096,000 |
Applied Industrial Technologies Inc. | | | | 227,100 | | | 5,012,097 |
aAstec Industries Inc. | | | | 151,800 | | | 4,089,492 |
Brady Corp., A | | | | 474,100 | | | 14,227,741 |
Briggs & Stratton Corp. | | | | 472,600 | | | 8,842,346 |
Carlisle Cos. Inc. | | | | 433,000 | | | 14,834,580 |
aCeradyne Inc. | | | | 204,200 | | | 3,922,682 |
CIRCOR International Inc. | | | | 141,000 | | | 3,550,380 |
aCNH Global NV (Netherlands) | | | | 84,000 | | | 2,098,320 |
aEMCOR Group Inc. | | | | 264,000 | | | 7,101,600 |
Franklin Electric Co. Inc. | | | | 246,732 | | | 7,174,966 |
Gardner Denver Inc. | | | | 323,800 | | | 13,777,690 |
aGibraltar Industries Inc. | | | | 1,079,800 | | | 16,985,254 |
Graco Inc. | | | | 458,200 | | | 13,090,774 |
Kennametal Inc. | | | | 542,300 | | | 14,056,416 |
Lincoln Electric Holdings Inc. | | | | 216,000 | | | 11,547,360 |
Mueller Industries Inc. | | | | 539,500 | | | 13,401,180 |
Nordson Corp. | | | | 252,000 | | | 15,417,360 |
aPowell Industries Inc. | | | | 62,600 | | | 1,973,778 |
Roper Industries Inc. | | | | 202,000 | | | 10,578,740 |
Simpson Manufacturing Co. Inc. | | | | 412,284 | | | 11,086,317 |
Timken Co. | | | | 120,000 | | | 2,845,200 |
Trinity Industries Inc. | | | | 781,000 | | | 13,620,640 |
Universal Forest Products Inc. | | | | 488,800 | | | 17,992,728 |
aWabash National Corp. | | | | 1,259,200 | | | 2,379,888 |
Watts Water Technologies Inc., A | | | | 341,300 | | | 10,552,996 |
| | | | | | | |
| | | | | | | 264,209,121 |
| | | | | | | |
Commercial & Professional Services 2.0% | | | | | | | |
ABM Industries Inc. | | | | 649,000 | | | 13,408,340 |
Mine Safety Appliances Co. | | | | 402,100 | | | 10,667,713 |
| | | | | | | |
| | | | | | | 24,076,053 |
| | | | | | | |
Consumer Durables & Apparel 6.7% | | | | | | | |
aBassett Furniture Industries Inc. | | | | 230,900 | | | 812,768 |
Brunswick Corp. | | | | 906,000 | | | 11,515,260 |
D.R. Horton Inc. | | | | 874,000 | | | 9,500,380 |
bEthan Allen Interiors Inc. | | | | 470,000 | | | 6,307,400 |
FSV-10
Franklin Templeton Variable Insurance Products Trust
Statement of Investments, December 31, 2009 (continued)
| | | | | | | |
| Franklin Small Cap Value Securities Fund | | | | Shares | | Value |
Common Stocks (continued) | | | | | | | |
Consumer Durables & Apparel (continued) | | | | | | | |
cHooker Furniture Corp. | | | | 555,100 | | $ | 6,866,587 |
aLa-Z-Boy Inc. | | | | 1,095,700 | | | 10,442,021 |
aM/I Homes Inc. | | | | 593,700 | | | 6,168,543 |
M.D.C. Holdings Inc. | | | | 287,700 | | | 8,930,208 |
aTimberland Co., A | | | | 250,700 | | | 4,495,051 |
aThe Warnaco Group Inc. | | | | 341,000 | | | 14,386,790 |
| | | | | | | |
| | | | | | | 79,425,008 |
| | | | | | | |
Consumer Services 0.6% | | | | | | | |
Regis Corp. | | | | 476,400 | | | 7,417,548 |
| | | | | | | |
Energy 10.3% | | | | | | | |
Arch Coal Inc. | | | | 111,500 | | | 2,480,875 |
aAtwood Oceanics Inc. | | | | 249,800 | | | 8,955,330 |
aBristow Group Inc. | | | | 379,413 | | | 14,588,430 |
bCARBO Ceramics Inc. | | | | 23,000 | | | 1,567,910 |
CONSOL Energy Inc. | | | | 87,000 | | | 4,332,600 |
aGlobal Industries Ltd. | | | | 1,356,000 | | | 9,668,280 |
aHelix Energy Solutions Group Inc. | | | | 780,300 | | | 9,168,525 |
aOil States International Inc. | | | | 346,500 | | | 13,613,985 |
Overseas Shipholding Group Inc. | | | | 197,000 | | | 8,658,150 |
Peabody Energy Corp. | | | | 114,000 | | | 5,153,940 |
aRowan Cos. Inc. | | | | 793,300 | | | 17,960,312 |
Teekay Corp. (Bahamas) | | | | 286,431 | | | 6,648,064 |
Tidewater Inc. | | | | 141,853 | | | 6,801,851 |
aUnit Corp. | | | | 295,000 | | | 12,537,500 |
| | | | | | | |
| | | | | | | 122,135,752 |
| | | | | | | |
Food & Staples Retailing 1.2% | | | | | | | |
Casey’s General Stores Inc. | | | | 453,567 | | | 14,477,859 |
| | | | | | | |
Health Care Equipment & Services 2.4% | | | | | | | |
STERIS Corp. | | | | 324,100 | | | 9,065,077 |
Teleflex Inc. | | | | 195,600 | | | 10,540,884 |
West Pharmaceutical Services Inc. | | | | 215,800 | | | 8,459,360 |
| | | | | | | |
| | | | | | | 28,065,321 |
| | | | | | | |
Insurance 10.6% | | | | | | | |
American National Insurance Co. | | | | 86,000 | | | 10,271,840 |
Arthur J. Gallagher & Co. | | | | 294,900 | | | 6,638,199 |
Aspen Insurance Holdings Ltd. | | | | 594,800 | | | 15,137,660 |
Erie Indemnity Co., A | | | | 194,000 | | | 7,569,880 |
Montpelier Re Holdings Ltd. (Bermuda) | | | | 776,200 | | | 13,443,784 |
Old Republic International Corp. | | | | 1,747,000 | | | 17,539,880 |
Protective Life Corp. | | | | 1,176,500 | | | 19,471,075 |
RLI Corp. | | | | 155,764 | | | 8,294,433 |
StanCorp Financial Group Inc. | | | | 232,000 | | | 9,284,640 |
Validus Holdings Ltd. (Bermuda) | | | | 488,295 | | | 13,154,667 |
Zenith National Insurance Corp. | | | | 148,100 | | | 4,407,456 |
| | | | | | | |
| | | | | | | 125,213,514 |
| | | | | | | |
Materials 11.2% | | | | | | | |
Airgas Inc. | | | | 297,700 | | | 14,170,520 |
AptarGroup Inc. | | | | 250,700 | | | 8,960,018 |
Cabot Corp. | | | | 384,000 | | | 10,072,320 |
FSV-11
Franklin Templeton Variable Insurance Products Trust
Statement of Investments, December 31, 2009 (continued)
| | | | | | | |
| Franklin Small Cap Value Securities Fund | | | | Shares | | Value |
Common Stocks (continued) | | | | | | | |
Materials (continued) | | | | | | | |
Gerdau Ameristeel Corp. (Canada) | | | | 1,316,000 | | $ | 10,857,000 |
Glatfelter | | | | 688,900 | | | 8,370,135 |
Reliance Steel & Aluminum Co. | | | | 449,600 | | | 19,431,712 |
RPM International Inc. | | | | 865,000 | | | 17,585,450 |
Steel Dynamics Inc. | | | | 1,071,400 | | | 18,985,208 |
United States Steel Corp. | | | | 49,000 | | | 2,700,880 |
Westlake Chemical Corp. | | | | 840,221 | | | 20,946,710 |
| | | | | | | |
| | | | | | | 132,079,953 |
| | | | | | | |
Pharmaceuticals, Biotechnology & Life Sciences 2.4% | | | | | | | |
aMettler-Toledo International Inc. | | | | 150,000 | | | 15,748,500 |
Pharmaceutical Product Development Inc. | | | | 521,800 | | | 12,230,992 |
| | | | | | | |
| | | | | | | 27,979,492 |
| | | | | | | |
Retailing 7.8% | | | | | | | |
Brown Shoe Co. Inc. | | | | 967,843 | | | 9,552,610 |
Christopher & Banks Corp. | | | | 1,420,000 | | | 10,820,400 |
Fred’s Inc. | | | | 967,000 | | | 9,863,400 |
aGroup 1 Automotive Inc. | | | | 447,600 | | | 12,689,460 |
aGymboree Corp. | | | | 146,200 | | | 6,358,238 |
J.C. Penney Co. Inc. | | | | 273,000 | | | 7,264,530 |
The Men’s Wearhouse Inc. | | | | 671,100 | | | 14,133,366 |
aPier 1 Imports Inc. | | | | 770,000 | | | 3,919,300 |
aSaks Inc. | | | | 777,548 | | | 5,100,715 |
aTuesday Morning Corp. | | | | 1,227,000 | | | 3,165,660 |
aWest Marine Inc. | | | | 845,600 | | | 6,815,536 |
a,bZale Corp. | | | | 853,000 | | | 2,320,160 |
| | | | | | | |
| | | | | | | 92,003,375 |
| | | | | | | |
Semiconductors & Semiconductor Equipment 1.1% | | | | | | | |
Cohu Inc. | | | | 818,100 | | | 11,412,495 |
aOmniVision Technologies Inc. | | | | 124,000 | | | 1,801,720 |
| | | | | | | |
| | | | | | | 13,214,215 |
| | | | | | | |
Technology Hardware & Equipment 2.5% | | | | | | | |
aBenchmark Electronics Inc. | | | | 1,068,000 | | | 20,195,880 |
Diebold Inc. | | | | 46,400 | | | 1,320,080 |
aRofin-Sinar Technologies Inc. | | | | 334,089 | | | 7,887,841 |
| | | | | | | |
| | | | | | | 29,403,801 |
| | | | | | | |
Transportation 2.4% | | | | | | | |
aGenesee & Wyoming Inc. | | | | 372,700 | | | 12,164,928 |
aKansas City Southern | | | | 139,400 | | | 4,640,626 |
SkyWest Inc. | | | | 719,195 | | | 12,168,780 |
| | | | | | | |
| | | | | | | 28,974,334 |
| | | | | | | |
Utilities 2.9% | | | | | | | |
Atmos Energy Corp. | | | | 170,100 | | | 5,000,940 |
Energen Corp. | | | | 257,000 | | | 12,027,600 |
NV Energy Inc. | | | | 1,375,000 | | | 17,022,500 |
| | | | | | | |
| | | | | | | 34,051,040 |
| | | | | | | |
Total Common Stocks (Cost $1,073,388,817) | | | | | | | 1,110,659,695 |
| | | | | | | |
FSV-12
Franklin Templeton Variable Insurance Products Trust
Statement of Investments, December 31, 2009 (continued)
| | | | | | | | | |
| Franklin Small Cap Value Securities Fund | | | | Principal
Amount | | Value | |
Corporate Bonds (Cost $1,481,445) 0.1% | | | | | | | | | |
Capital Goods 0.1% | | | | | | | | | |
Mueller Industries Inc., 6.00%, 11/01/14 | | | | $ | 1,494,000 | | $ | 1,428,637 | |
| | | | | | | | | |
Total Investments before Short Term Investments (Cost $1,074,870,262) | | | | | | | | 1,112,088,332 | |
| | | | | | | | | |
| | | |
| | | | | Shares | | | |
Short Term Investments 6.3% | | | | | | | | | |
Money Market Funds (Cost $71,563,932) 6.1% | | | | | | | | | |
dInstitutional Fiduciary Trust Money Market Portfolio, 0.00% | | | | | 71,563,932 | | | 71,563,932 | |
| | | | | | | | | |
eInvestments from Cash Collateral Received for Loaned Securities 0.2% | | | | | | | | | |
Money Market Funds (Cost $2,536,889) 0.2% | | | | | | | | | |
aBank of New York Institutional Cash Reserve Fund, Series B | | | | | 2,536,889 | | | 2,029,511 | |
| | | | | | | | | |
| | | |
| | | | | Principal
Amount | | | |
fRepurchase Agreements (Cost $474,000) 0.0%g | | | | | | | | | |
Banc of America Securities LLC, 0.01%, 1/4/10 (Maturity Value $474,001) | | | | | | | | | |
Collateralized by U.S. Government Agency Securities, 3.00% - 17.00%, 2/15/10 - 7/15/51 | | | | $ | 474,000 | | | 474,000 | |
| | | | | | | | | |
Total Investments from Cash Collateral Received for Loaned Securities
(Cost $3,010,889) | | | | | | | | 2,503,511 | |
| | | | | | | | | |
Total Investments (Cost $1,149,445,083) 100.4% | | | | | | | | 1,186,155,775 | |
Other Assets, less Liabilities (0.4)% | | | | | | | | (5,273,623 | ) |
| | | | | | | | | |
Net Assets 100.0% | | | | | | | $ | 1,180,882,152 | |
| | | | | | | | | |
aNon-income producing.
bA portion or all of the security is on loan at December 31, 2009. See Note 1(c).
cSee Note 8 regarding holdings of 5% voting securities.
dSee Note 7 regarding investments in the Institutional Fiduciary Trust Money Market Portfolio. The rate shown is the annualized seven-day yield at period end.
eSee Note 1(c) regarding securities on loan.
fSee Note 1(b) regarding repurchase agreements.
gRounds to less than 0.1% of net assets.
The accompanying notes are an integral part of these financial statements.
FSV-13
Franklin Templeton Variable Insurance Products Trust
Financial Statements
Statement of Assets and Liabilities
December 31, 2009
| | | | |
| | | Franklin Small Cap
Value Securities
Fund | |
Assets: | | | | |
Investments in securities: | | | | |
Cost - Unaffiliated issuers | | $ | 1,068,686,410 | |
Cost - Non-controlled affiliated issuers (Note 8) | | | 8,720,741 | |
Cost - Sweep Money Fund (Note 7) | | | 71,563,932 | |
Cost - Repurchase agreements | | | 474,000 | |
| | | | |
Total cost of investments | | $ | 1,149,445,083 | |
| | | | |
Value - Unaffiliated issuers | | $ | 1,107,251,256 | |
Value - Non-controlled affiliated issuers (Note 8) | | | 6,866,587 | |
Value - Sweep Money Fund (Note 7) | | | 71,563,932 | |
Value - Repurchase agreements | | | 474,000 | |
| | | | |
Total value of investments (includes securities loaned in the amount of $2,860,863) | | | 1,186,155,775 | |
Receivables: | | | | |
Investment securities sold | | | 39,981 | |
Capital shares sold | | | 711,494 | |
Dividends and interest | | | 941,560 | |
Other assets | | | 129 | |
| | | | |
Total assets | | | 1,187,848,939 | |
| | | | |
Liabilities: | | | | |
Payables: | | | | |
Capital shares redeemed | | | 2,602,773 | |
Affiliates | | | 1,097,568 | |
Payable upon return of securities loaned | | | 3,010,889 | |
Accrued expenses and other liabilities | | | 255,557 | |
| | | | |
Total liabilities | | | 6,966,787 | |
| | | | |
Net assets, at value | | $ | 1,180,882,152 | |
| | | | |
Net assets consist of: | | | | |
Paid-in capital | | $ | 1,223,630,113 | |
Undistributed net investment income | | | 9,972,591 | |
Net unrealized appreciation (depreciation) | | | 36,710,692 | |
Accumulated net realized gain (loss) | | | (89,431,244 | ) |
| | | | |
Net assets, at value | | $ | 1,180,882,152 | |
| | | | |
The accompanying notes are an integral part of these financial statements.
FSV-14
Franklin Templeton Variable Insurance Products Trust
Financial Statements (continued)
Statement of Assets and Liabilities (continued)
December 31, 2009
| | | |
| | | Franklin Small Cap
Value Securities
Fund |
Class 1: | | | |
Net assets, at value | | $ | 42,428,018 |
| | | |
Shares outstanding | | | 3,264,612 |
| | | |
Net asset value and maximum offering price per share | | $ | 13.00 |
| | | |
Class 2: | | | |
Net assets, at value | | $ | 1,109,854,647 |
| | | |
Shares outstanding | | | 86,930,281 |
| | | |
Net asset value and maximum offering price per share | | $ | 12.77 |
| | | |
Class 4: | | | |
Net assets, at value | | $ | 28,599,487 |
| | | |
Shares outstanding | | | 2,212,954 |
| | | |
Net asset value and maximum offering price per share | | $ | 12.92 |
| | | |
The accompanying notes are an integral part of these financial statements.
FSV-15
Franklin Templeton Variable Insurance Products Trust
Financial Statements (continued)
Statement of Operations
for the year ended December 31, 2009
| | | | |
| | | Franklin Small Cap
Value Securities
Fund | |
Investment income: | | | | |
Dividends: | | | | |
Unaffiliated issuers | | $ | 18,363,114 | |
Non-controlled affiliated issuers (Note 8) | | | 222,040 | |
Sweep Money Fund (Note 7) | | | 25,254 | |
Interest | | | 91,793 | |
Income from securities loaned | | | 28,137 | |
| | | | |
Total investment income | | | 18,730,338 | |
| | | | |
Expenses: | | | | |
Management fees (Note 3a) | | | 4,797,917 | |
Administrative fees (Note 3b) | | | 1,221,882 | |
Distribution fees: (Note 3c) | | | | |
Class 2 | | | 2,233,916 | |
Class 4 | | | 73,085 | |
Unaffiliated transfer agent fees | | | 3,786 | |
Custodian fees (Note 4) | | | 9,931 | |
Reports to shareholders | | | 312,213 | |
Professional fees | | | 37,681 | |
Trustees’ fees and expenses | | | 6,832 | |
Other | | | 46,577 | |
| | | | |
Total expenses | | | 8,743,820 | |
Expense reductions (Note 4) | | | (113 | ) |
| | | | |
Net expenses | | | 8,743,707 | |
| | | | |
Net investment income | | | 9,986,631 | |
| | | | |
Realized and unrealized gains (losses): | | | | |
Net realized gain (loss) from investments | | | (86,881,008 | ) |
Net change in unrealized appreciation (depreciation) on investments | | | 345,475,195 | |
| | | | |
Net realized and unrealized gain (loss) | | | 258,594,187 | |
| | | | |
Net increase (decrease) in net assets resulting from operations | | $ | 268,580,818 | |
| | | | |
The accompanying notes are an integral part of these financial statements.
FSV-16
Franklin Templeton Variable Insurance Products Trust
Financial Statements (continued)
Statements of Changes in Net Assets
| | | | | | | | |
| | | Franklin Small Cap Value
Securities Fund | |
| | | Year Ended December 31, | |
| | | 2009 | | | 2008 | |
| | | | |
Increase (decrease) in net assets: | | | | | | | | |
Operations: | | | | | | | | |
Net investment income | | $ | 9,986,631 | | | $ | 14,806,129 | |
Net realized gain (loss) from investments | | | (86,881,008 | ) | | | 37,661,051 | |
Net change in unrealized appreciation (depreciation) on investments | | | 345,475,195 | | | | (460,075,401 | ) |
| | | | |
Net increase (decrease) in net assets resulting from operations | | | 268,580,818 | | | | (407,608,221 | ) |
| | | | |
Distributions to shareholders from: | | | | | | | | |
Net investment income: | | | | | | | | |
Class 1 | | | (665,043 | ) | | | (691,359 | ) |
Class 2 | | | (13,687,826 | ) | | | (11,639,809 | ) |
Class 4 | | | (385,972 | ) | | | (17,091 | ) |
Net realized gains: | | | | | | | | |
Class 1 | | | (1,544,298 | ) | | | (3,739,945 | ) |
Class 2 | | | (37,694,393 | ) | | | (80,615,234 | ) |
Class 4 | | | (931,849 | ) | | | (92,454 | ) |
| | | | |
Total distributions to shareholders | | | (54,909,381 | ) | | | (96,795,892 | ) |
| | | | |
Capital share transactions: (Note 2) | | | | | | | | |
Class 1 | | | 209,708 | | | | (56,463 | ) |
Class 2 | | | 123,378,715 | | | | 85,951,774 | |
Class 4 | | | 9,098,546 | | | | 18,620,427 | |
| | | | |
Total capital share transactions | | | 132,686,969 | | | | 104,515,738 | |
| | | | |
Net increase (decrease) in net assets | | | 346,358,406 | | | | (399,888,375 | ) |
Net assets: | | | | | | | | |
Beginning of year | | | 834,523,746 | | | | 1,234,412,121 | |
| | | | |
End of year | | $ | 1,180,882,152 | | | $ | 834,523,746 | |
| | | | |
Undistributed net investment income included in net assets: | | | | | | | | |
End of year | | $ | 9,972,591 | | | $ | 14,725,880 | |
| | | | |
The accompanying notes are an integral part of these financial statements.
FSV-17
Franklin Templeton Variable Insurance Products Trust
Notes to Financial Statements
Franklin Small Cap Value Securities Fund
1. ORGANIZATION AND SIGNIFICANT ACCOUNTING POLICIES
Franklin Templeton Variable Insurance Products Trust (Trust) is registered under the Investment Company Act of 1940, as amended, (1940 Act) as an open-end investment company, consisting of twenty-two separate funds. The Franklin Small Cap Value Securities Fund (Fund) is included in this report. The financial statements of the remaining funds in the Trust are presented separately. Shares of the Fund are generally sold only to insurance company separate accounts to fund the benefits of variable life insurance policies or variable annuity contracts. The Fund offers three classes of shares: Class 1, Class 2, and Class 4. Each class of shares differs by its distribution fees, voting rights on matters affecting a single class and its exchange privilege.
The following summarizes the Fund’s significant accounting policies.
a. Security Valuation
Equity and other securities listed on a securities exchange or on the NASDAQ National Market System are valued at the last quoted sale price or the official closing price of the day, respectively. Over-the-counter securities and listed securities for which there is no reported sale are valued within the range of the most recent quoted bid and ask prices. Securities that trade in multiple markets or on multiple exchanges are valued according to the broadest and most representative market. Certain equity securities are valued based upon fundamental characteristics or relationships to similar securities. Investments in open-end mutual funds are valued at the closing net asset value.
The Fund has procedures to determine the fair value of individual securities and other assets for which market prices are not readily available or which may not be reliably priced. Methods for valuing these securities may include: fundamental analysis based upon the underlying investment book value, anticipated future cash flows, market changes in comparable or similar securities, matrix pricing, discounts from market prices of similar securities, or discounts applied due to the nature and duration of restrictions on the disposition of the securities. Due to the inherent uncertainty of valuations of such securities, the fair values may differ significantly from the values that would have been used had a ready market for such investments existed. Occasionally, events occur between the time at which trading in a security is completed and the close of the NYSE that might call into question the availability (including the reliability) of the value of a portfolio security held by the Fund. If such an event occurs, the securities may be valued using fair value procedures, which may include the use of independent pricing services. All security valuation procedures are approved by the Fund’s Board of Trustees.
b. Repurchase Agreements
The Fund may enter into repurchase agreements, which are accounted for as a loan by the Fund to the seller, collateralized by securities which are delivered to the Fund’s custodian. The market value, including accrued interest, of the initial collateralization is required to be at least 102% of the dollar amount invested by the Fund, with the value of the underlying securities marked to market daily to maintain coverage of at least 100%. All repurchase agreements held by the Fund at year end had been entered into on December 31, 2009. Repurchase agreements are valued at cost which approximates market value.
c. Securities Lending
The Fund participates in a principal based security lending program. The Fund receives cash collateral against the loaned securities in an amount equal to at least 102% of the market value of the loaned securities. Collateral is maintained over the life of the loan in an amount not less than 100% of the market value of loaned securities, as determined at the close of Fund business each day; any additional collateral required due to changes in security values is delivered to the Fund on the next business day. The collateral is invested in repurchase agreements or in a non-registered money fund (Bank of New York Institutional Cash Reserve Fund or ICRF) managed by the Fund’s custodian on the Fund’s behalf. The Fund receives income from the investment of cash collateral, in addition to lending fees and rebates paid by the borrower. The Fund bears the market risk with respect to the collateral investment, securities loaned, and the risk that the principal may default on its obligations to the Fund.
FSV-18
Franklin Templeton Variable Insurance Products Trust
Notes to Financial Statements (continued)
Franklin Small Cap Value Securities Fund
1. ORGANIZATION AND SIGNIFICANT ACCOUNTING POLICIES (continued)
c. Securities Lending (continued)
In September of 2008, the Bank of New York Mellon advised the Fund that the ICRF had exposure to certain defaulted debt obligations of Lehman Brothers Holdings, Inc. and that they had created a separate sleeve (Series B) of the ICRF to hold these securities apart from the main investments. Each investor in the ICRF was allocated its pro-rata portion of Series B. The Fund’s position in Series B is disclosed on the Statement of Investments at fair value and any unrealized loss attributable to the position is included in net assets.
d. Income Taxes
No provision has been made for U.S. income taxes because it is the Fund’s policy to qualify as a regulated investment company under the Internal Revenue Code and to distribute to shareholders substantially all of its taxable income and net realized gains.
The Fund has reviewed the tax positions, taken on federal income tax returns, for each of the three open tax years and as of December 31, 2009, and has determined that no provision for income tax is required in the Fund’s financial statements.
e. Security Transactions, Investment Income, Expenses and Distributions
Security transactions are accounted for on trade date. Realized gains and losses on security transactions are determined on a specific identification basis. Interest income and estimated expenses are accrued daily. Dividend income is recorded on the ex-dividend date. Distributions to shareholders are recorded on the ex-dividend date and are determined according to income tax regulations (tax basis). Distributable earnings determined on a tax basis may differ from earnings recorded in accordance with accounting principles generally accepted in the United States of America. These differences may be permanent or temporary. Permanent differences are reclassified among capital accounts to reflect their tax character. These reclassifications have no impact on net assets or the results of operations. Temporary differences are not reclassified, as they may reverse in subsequent periods.
Common expenses incurred by the Trust are allocated among the funds based on the ratio of net assets of each fund to the combined net assets of the Trust. Fund specific expenses are charged directly to the fund that incurred the expense.
Realized and unrealized gains and losses and net investment income, not including class specific expenses, are allocated daily to each class of shares based upon the relative proportion of net assets of each class. Differences in per share distributions, by class, are generally due to differences in class specific expenses.
f. Accounting Estimates
The preparation of financial statements in accordance with accounting principles generally accepted in the United States of America requires management to make estimates and assumptions that affect the reported amounts of assets and liabilities at the date of the financial statements and the amounts of income and expenses during the reporting period. Actual results could differ from those estimates.
g. Guarantees and Indemnifications
Under the Trust’s organizational documents, its officers and trustees are indemnified by the Trust against certain liabilities arising out of the performance of their duties to the Trust. Additionally, in the normal course of business, the Trust, on behalf of the Fund, enters into contracts with service providers that contain general indemnification clauses. The Trust’s maximum exposure under these arrangements is unknown as this would involve future claims that may be made against the Trust that have not yet occurred. Currently, the Trust expects the risk of loss to be remote.
FSV-19
Franklin Templeton Variable Insurance Products Trust
Notes to Financial Statements (continued)
Franklin Small Cap Value Securities Fund
2. SHARES OF BENEFICIAL INTEREST
At December 31, 2009, there were an unlimited number of shares authorized (without par value). Transactions in the Fund’s shares were as follows:
| | | | | | | | | | | | | | |
| | | Year Ended December 31, | |
| | | 2009 | | | 2008a | |
| Class 1 Shares: | | Shares | | | Amount | | | Shares | | | Amount | |
Shares sold | | 756,038 | | | $ | 8,112,443 | | | 497,732 | | | $ | 7,402,544 | |
Shares issued in reinvestment of distributions | | 206,867 | | | | 2,209,341 | | | 267,107 | | | | 4,431,305 | |
Shares redeemed | | (950,287 | ) | | | (10,112,076 | ) | | (794,982 | ) | | | (11,890,312 | ) |
| | | | |
Net increase (decrease) | | 12,618 | | | $ | 209,708 | | | (30,143 | ) | | $ | (56,463 | ) |
| | | | |
Class 2 Shares: | | | | | | | | | | | | | | |
Shares sold | | 25,275,286 | | | $ | 260,568,778 | | | 18,734,933 | | | $ | 264,994,545 | |
Shares issued in reinvestment of distributions | | 4,888,889 | | | | 51,382,219 | | | 5,649,421 | | | | 92,255,043 | |
Shares redeemed | | (17,632,475 | ) | | | (188,572,282 | ) | | (18,829,303 | ) | | | (271,297,814 | ) |
| | | | |
Net increase (decrease) | | 12,531,700 | | | $ | 123,378,715 | | | 5,555,051 | | | $ | 85,951,774 | |
| | | | |
Class 4 Shares: | | | | | | | | | | | | | | |
Shares sold | | 1,211,897 | | | $ | 12,938,698 | | | 1,391,688 | | | $ | 18,668,696 | |
Shares issued on reinvestment of distributions | | 123,855 | | | | 1,317,821 | | | 6,580 | | | | 109,104 | |
Shares redeemed | | (510,091 | ) | | | (5,157,973 | ) | | (10,975 | ) | | | (157,373 | ) |
| | | | |
Net increase (decrease) | | 825,661 | | | $ | 9,098,546 | | | 1,387,293 | | | $ | 18,620,427 | |
| | | | |
| aFor | the period February 29, 2008 (effective date) to December 31, 2008 for Class 4. |
3. TRANSACTIONS WITH AFFILIATES
Franklin Resources, Inc. is the holding company for various subsidiaries that together are referred to as Franklin Templeton Investments. Certain officers and trustees of the Trust are also officers and/or directors of the following subsidiaries:
| | |
| Subsidiary | | Affiliation |
Franklin Advisory Services, LLC (Advisory Services) | | Investment manager |
Franklin Templeton Services, LLC (FT Services) | | Administrative manager |
Franklin Templeton Distributors, Inc. (Distributors) | | Principal underwriter |
Franklin Templeton Investor Services, LLC (Investor Services) | | Transfer agent |
a. Management Fees
The Fund pays an investment management fee to Advisory Services based on the average daily net assets of the Fund as follows:
| | |
| Annualized Fee Rate | | Net Assets |
| 0.600% | | Up to and including $200 million |
| 0.500% | | over $200 million, up to and including $1.3 billion |
| 0.400% | | In excess of $1.3 billion |
FSV-20
Franklin Templeton Variable Insurance Products Trust
Notes to Financial Statements (continued)
Franklin Small Cap Value Securities Fund
3. TRANSACTIONS WITH AFFILIATES (continued)
b. Administrative Fees
The Fund pays an administrative fee to FT Services based on the Fund’s average daily net assets as follows:
| | |
| Annualized Fee Rate | | Net Assets |
| 0.150% | | Up to and including $200 million |
| 0.135% | | over $200 million, up to and including $700 million |
| 0.100% | | over $700 million, up to and including $1.2 billion |
| 0.075% | | In excess of $1.2 billion |
c. Distribution Fees
The Fund’s Board of Trustees has adopted distribution plans for Class 2 and Class 4 shares pursuant to Rule 12b-1 under the 1940 Act. Under the Fund’s compensation distribution plans, the Fund pays Distributors for costs incurred in connection with the servicing, sale and distribution of the Fund’s shares up to 0.35% per year of its average daily net assets of each class. The Board of Trustees has agreed to limit the current rate to 0.25% per year for Class 2.
d. Transfer Agent Fees
Investor Services, under terms of an agreement, performs shareholder servicing for the Fund and is not paid by the Fund for the services.
4. EXPENSE OFFSET ARRANGEMENT
The Fund has entered into an arrangement with its custodian whereby credits realized as a result of uninvested cash balances are used to reduce a portion of the Fund’s custodian expenses. During the year ended December 31, 2009, the custodian fees were reduced as noted in the Statement of Operations.
5. INCOME TAXES
For tax purposes, capital losses may be carried over to offset future capital gains, if any. At December 31, 2009, the Fund had tax basis capital losses of $76,440,230 expiring in 2017.
For tax purposes, realized capital losses occurring subsequent to October 31, may be deferred and treated as occurring on the first day of the following fiscal year. At December 31, 2009, the Fund deferred realized capital losses of $12,909,409.
The tax character of distributions paid during the years ended December 31, 2009 and 2008, was as follows:
| | | | | | |
| | | 2009 | | 2008 |
Distributions paid from: | | | | | | |
Ordinary income | | $ | 14,739,921 | | $ | 15,883,308 |
Long term capital gain | | | 40,169,460 | | | 80,912,584 |
| | | |
| | $ | 54,909,381 | | $ | 96,795,892 |
| | | |
FSV-21
Franklin Templeton Variable Insurance Products Trust
Notes to Financial Statements (continued)
Franklin Small Cap Value Securities Fund
5. INCOME TAXES (continued)
At December 31, 2009, the cost of investments, net unrealized appreciation (depreciation) and undistributed ordinary income for income tax purposes were as follows:
| | | | |
Cost of investments | | $ | 1,149,516,832 | |
| | | | |
| |
Unrealized appreciation | | $ | 224,821,643 | |
Unrealized depreciation | | | (188,182,700 | ) |
| | | | |
Net unrealized appreciation (depreciation) | | $ | 36,638,943 | |
| | | | |
Distributable earnings – undistributed ordinary income | | $ | 9,962,735 | |
| | | | |
Net investment income differs for financial statement and tax purposes primarily due to differing treatments of bond discounts and premiums.
Net realized gains (losses) differ for financial statement and tax purposes primarily due to differing treatment of wash sales.
6. INVESTMENT TRANSACTIONS
Purchases and sales of investments (excluding short term securities) for the year ended December 31, 2009, aggregated $124,012,626 and $58,863,203, respectively.
7. INVESTMENTS IN INSTITUTIONAL FIDUCIARY TRUST MONEY MARKET PORTFOLIO
The Fund may invest in the Institutional Fiduciary Trust Money Market Portfolio (Sweep Money Fund), an open-end investment company managed by Franklin Advisers, Inc. (an affiliate of the investment manager). Management fees paid by the Fund are reduced on assets invested in the Sweep Money Fund, in an amount not to exceed the management and administrative fees paid by the Sweep Money Fund.
8. HOLDINGS OF 5% VOTING SECURITIES OF PORTFOLIO COMPANIES
The 1940 Act defines “affiliated companies” to include investments in portfolio companies in which a fund owns 5% or more of the outstanding voting securities. Investments in “affiliated companies” for the Fund for the year ended December 31, 2009, were as shown below.
| | | | | | | | | | | | | | | | | |
| Name of Issuer | | Number of Shares
Held at Beginning
of Year | | Gross
Additions | | Gross
Reductions | | Number of Shares
Held at End
of Year | | Value at
End of
Year | | Investment
Income | | Realized Capital
Gain (Loss) |
Non-Controlled Affiliates | | | | | | | | | | | | | | | |
Hooker Furniture Corp. | | 555,100 | | — | | — | | 555,100 | | $ | 6,866,587 | | $ | 222,040 | | $ | — |
| | | | | | | | | | | |
Total Affiliated Securities (0.58% of Net Assets) | | | | | | | | | | | | | |
9. CREDIT FACILITY
The Fund, together with other U.S. registered and foreign investment funds (collectively “Borrowers”), managed by Franklin Templeton Investments, are borrowers in a joint syndicated senior unsecured credit facility totaling $725 million (Global Credit Facility) to provide a source of funds to the Borrowers for temporary and emergency purposes, including the ability to meet future unanticipated or unusually large redemption requests. Effective January 22, 2010, the Fund renewed the Global Credit Facility, for a total of $750 million, maturing January 21, 2011.
FSV-22
Franklin Templeton Variable Insurance Products Trust
Notes to Financial Statements (continued)
Franklin Small Cap Value Securities Fund
9. CREDIT FACILITY (continued)
Under the terms of the Global Credit Facility, the Fund shall, in addition to interest charged on any borrowings made by the Fund and other costs incurred by the Fund, pay its share of fees and expenses incurred in connection with the implementation and maintenance of the Global Credit Facility, based upon its relative share of the aggregate net assets of all of the Borrowers, including an annual commitment fee of 0.10% based upon the unused portion of the Global Credit Facility, which is reflected in other expenses on the Statement of Operations. During the year ended December 31, 2009, the Fund did not utilize the Global Credit Facility.
10. FAIR VALUE MEASUREMENTS
The Fund follows a fair value hierarchy that distinguishes between market data obtained from independent sources (observable inputs) and the Fund’s own market assumptions (unobservable inputs). These inputs are used in determining the value of the Fund’s investments and are summarized in the following fair value hierarchy:
| | • | | Level 1 – quoted prices in active markets for identical securities |
| | • | | Level 2 – other significant observable inputs (including quoted prices for similar securities, interest rates, prepayment speed, credit risk, etc.) |
| | • | | Level 3 – significant unobservable inputs (including the Fund’s own assumptions in determining the fair value of investments) |
The inputs or methodology used for valuing securities are not an indication of the risk associated with investing in those securities.
The following is a summary of the inputs used as of December 31, 2009, in valuing the Fund’s assets carried at fair value:
| | | | | | | | | | | | |
| | | Level 1 | | Level 2 | | Level 3 | | Total |
| | | |
Assets: | | | | | | | | | | | | |
Investments in Securities | | | | | | | | | | | | |
Equity Investmentsa | | $ | 1,110,659,695 | | $ | — | | $ | — | | $ | 1,110,659,695 |
Corporate Bonds | | | — | | | 1,428,637 | | | — | | | 1,428,637 |
Short Term Investments | | | 71,563,932 | | | 2,503,511 | | | — | | | 74,067,443 |
| | | |
Total Investments in Securities | | $ | 1,182,223,627 | | $ | 3,932,148 | | $ | — | | $ | 1,186,155,775 |
| | | |
aFor detailed industry descriptions, see the accompanying Statement of Investments.
11. NEW ACCOUNTING PRONOUNCEMENTS
In January 2010, the Financial Accounting Standards Board issued Accounting Standards Update (ASU) No. 2010-6, Fair Value Measurements and Disclosures (Topic 820): Improving Disclosures about Fair Value Measurements. ASU No. 2010-6 enhances and clarifies existing fair value measurement disclosure requirements and is effective for interim and annual periods beginning after December 15, 2009. The Fund is currently evaluating the impact, if any, of applying the provisions of ASU No. 2010-6.
12. SUBSEQUENT EVENTS
The Fund has evaluated subsequent events through February 10, 2010, the issuance date of the financial statements and determined that no events have occurred that require disclosure.
FSV-23
Franklin Templeton Variable Insurance Products Trust
Franklin Small Cap Value Securities Fund
Report of Independent Registered Public Accounting Firm
To the Board of Trustees and Shareholders of
Franklin Templeton Variable Insurance Products Trust
In our opinion, the accompanying statement of assets and liabilities, including the statement of investments, and the related statements of operations and of changes in net assets and the financial highlights present fairly, in all material respects, the financial position of Franklin Small Cap Value Securities Fund (one of the funds constituting the Franklin Templeton Variable Insurance Products Trust, hereafter referred to as the “Fund”) at December 31, 2009, the results of its operations for the year then ended, the changes in its net assets and the financial highlights for each of the periods presented, in conformity with accounting principles generally accepted in the United States of America. These financial statements and financial highlights (hereafter referred to as “financial statements”) are the responsibility of the Fund’s management. Our responsibility is to express an opinion on these financial statements based on our audits. We conducted our audits of these financial statements in accordance with the standards of the Public Company Accounting Oversight Board (United States). Those standards require that we plan and perform the audit to obtain reasonable assurance about whether the financial statements are free of material misstatement. An audit includes examining, on a test basis, evidence supporting the amounts and disclosures in the financial statements, assessing the accounting principles used and significant estimates made by management, and evaluating the overall financial statement presentation. We believe that our audits, which included confirmation of securities at December 31, 2009 by correspondence with the custodian and brokers, provide a reasonable basis for our opinion.
PricewaterhouseCoopers LLP
San Francisco, California
February 10, 2010
FSV-24
Franklin Templeton Variable Insurance Products Trust
Tax Designation (unaudited)
Franklin Small Cap Value Securities Fund
Under Section 852(b)(3)(C) of the Internal Revenue Code (Code), the Fund designates the maximum amount allowable but no less than $40,169,460 as a long term capital gain dividend for the fiscal year ended December 31, 2009.
Under Section 854(b)(2) of the Code, the Fund designates 100% of the ordinary income dividends as income qualifying for the dividends received deduction for the fiscal year ended December 31, 2009.
FSV-25
FRANKLIN SMALL-MID CAP GROWTH SECURITIES FUND
This annual report for Franklin Small-Mid Cap Growth Securities Fund covers the fiscal year ended December 31, 2009.
Performance Summary as of 12/31/09
Average annual total return of Class 4 shares* represents the average annual change in value, assuming reinvestment of dividends and capital gains. Average returns smooth out variations in returns, which can be significant; they are not the same as year-by-year results.
Periods ended 12/31/09
| | | | | | |
| | | 1-Year | | 5-Year | | 10-Year |
Average Annual Total Return | | +43.43% | | +1.03% | | -1.74% |
*For the period beginning 2/29/08, Class 4 performance reflects a 12b-1 fee expense of 0.35% per year, which affects future performance. Class 4 performance prior to 2/29/08 reflects historical Class 1 performance, which does not include a 12b-1 fee expense. Since 2/29/08 (effective date), the average annual total return of Class 4 shares was -3.53%.
Total Return Index Comparison
for a Hypothetical $10,000 Investment (1/1/00–12/31/09)
The graph below shows the change in value of a hypothetical $10,000 investment in the Fund over the indicated period and includes reinvestment of any income or distributions. The Fund’s performance* is compared to the performance of the Standard & Poor’s 500 Index (S&P 500) and the Russell Midcap® Growth Index. One cannot invest directly in an index, and an index is not representative of the Fund’s portfolio. Please see Important Notes to Performance Information preceding the Fund Summaries.
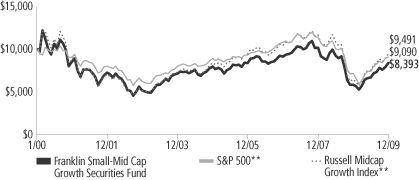
**Source: © 2009 Morningstar. Please see Index Descriptions following the Fund Summaries.
Franklin Small-Mid Cap Growth Securities Fund Class 4
Performance reflects the Fund’s Class 4 operating expenses, but does not include any contract fees, expenses or sales charges. If they had been included, performance would be lower. These charges and deductions, particularly for variable life policies, can have a significant effect on contract values and insurance benefits. See the contract prospectus for a complete description of these expenses, including sales charges.
Performance data represent past performance, which does not guarantee future results. Investment return and principal value will fluctuate, and you may have a gain or loss when you sell your shares.
Current performance may differ from figures shown.
FSC-1
Fund Goal and Main Investments: Franklin Small-Mid Cap Growth Securities Fund seeks long-term capital growth. The Fund normally invests at least 80% of its net assets in investments of small capitalization (small cap) and mid capitalization (mid cap) companies and normally invests predominantly in equity securities. For this Fund, small cap companies are those within the market capitalization range of companies in the Russell 2500™ Index at the time of purchase, and mid cap companies are companies within the market capitalization range of companies in the Russell Midcap Index at the time of purchase.1
Performance Overview
You can find the Fund’s one-year total return in the Performance Summary. The Fund underperformed its narrow benchmark, the Russell Midcap Growth Index, which had a +46.29% total return, and outperformed its broad benchmark, the S&P 500, which had a +26.46% total return, for the same period.2
Economic and Market Overview
The U.S. economy ended 2009 in much better shape than it began. Economic challenges remain, such as stalled consumer confidence and job prospects for the unemployed as stimulus measures wind down. However, several reports pointed to improving economic conditions. In the year’s second half, corporate profit growth was higher than earlier estimates, which may allow businesses to build inventory following a long period of inventory drawdowns.
Throughout the year, the Federal Open Market Committee kept monetary policy unchanged, announcing it intends to hold the federal funds target rate in the 0% to 0.25% range “for an extended period” as it lays the groundwork for an eventual tightening of monetary policy. Late in the period, the labor market improved somewhat as the economy lost fewer jobs than expected and the unemployment rate fell slightly, dropping from a period high of 10.2% in October to 10.0% at period-end.3
U.S. gross domestic product grew at a 2.2% annualized rate in 2009’s third quarter after shrinking by 0.7% in the prior three months. This was the first expansion since 2008’s second quarter. As economic
1. Please see Index Descriptions following the Fund Summaries.
2. Source: © 2009 Morningstar. One cannot invest directly in an index, and an index is not representative of the Fund’s portfolio. Please see Index Descriptions following the Fund Summaries.
3. Source: Bureau of Labor Statistics.
Fund Risks: The Fund’s investments in stocks may offer the potential for long-term gains but can be subject to short-term price fluctuations. Smaller and midsize company securities can increase the risk of greater price fluctuations, particularly over the short term. Smaller or relatively new or unseasoned companies can also be particularly sensitive to changing economic conditions, and their prospects for growth are less certain than those of larger, more established companies. The Fund may have significant investments in the technology sector, which has been among the market’s most volatile sectors and involves special risks. The Fund’s prospectus also includes a description of the main investment risks.
FSC-2
conditions improved, oil prices increased from $44 per barrel in December 2008 to $79 at year-end, still well below 2008 highs. December’s inflation rate was an annualized 2.7%.3 Core inflation, which excludes food and energy costs, rose at a 1.8% annualized rate, which was within the Federal Reserve Board’s informal target range of 1.5% to 2.0%.3
Most stocks suffered significant losses through early March 2009 as investors worried about an uncertain future. Stocks then recovered from 12-year lows as economic data improved and investors perceived many bargains among the bear market fallout. For the 12 months under review, the blue chip stocks of the Dow Jones Industrial Average delivered a total return of +22.68%, while the broader S&P 500 posted a +26.46% total return and the technology-heavy NASDAQ Composite Index returned +45.32%.2 All sectors posted gains for the period, with the strongest returns from the information technology, materials and consumer discretionary sectors.
Investment Strategy
We use fundamental, bottom-up research to seek companies meeting our criteria of growth potential, quality and valuation. In seeking sustainable growth characteristics, we look for companies we believe can produce sustainable earnings and cash flow growth, evaluating the long-term market opportunity and competitive structure of an industry to target leaders and emerging leaders. We define quality companies as those with strong and improving competitive positions in attractive markets. We also believe important attributes of quality are experienced and talented management teams as well as financial strength reflected in the capital structure, gross and operating margins, free cash flow generation and returns on capital employed. Our valuation analysis includes a range of potential outcomes based on an assessment of multiple scenarios. In assessing value, we consider whether security prices fully reflect the balance of the sustainable growth opportunities relative to business and financial risks.
Manager’s Discussion
From a sector perspective, stock selection in consumer discretionary, financials and energy boosted the Fund’s performance relative to the Russell Midcap Growth Index during the reporting period. Apparel retailer Guess? in the consumer discretionary sector appreciated significantly in value during the reporting period and helped the Fund’s relative performance. An underweighting in the financials sector also
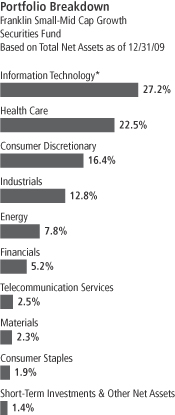
*Significant exposure to a single sector may result in greater volatility for the Fund than a more broadly diversified portfolio. There are specific risks to investing in technology company stocks, which can be subject to abrupt or erratic price movements and have been volatile, especially over the short term.
FSC-3
supported relative results, and money manager BlackRock4 (sold by period-end) was a contributor. An overweighting in energy holdings helped as well, particularly FMC Technologies, a subsea oil and gas equipment maker. Additional key contributors included Norwegian videoconferencing equipment maker Tandberg,4 semiconductor company Silicon Laboratories and hospital operator Community Health Systems.
In contrast, our stock selection in information technology was a major detractor from relative Fund performance. Significant positions included FLIR Systems, a specialized imaging systems manufacturer, and SAIC, a government services contractor that provides technical support and project management services to federal and state agencies. Stock selection and an underweighting in the materials sector, particularly in the chemicals industry, also had a negative impact. In addition, an overweighted position in the underperforming health care sector constrained relative Fund performance, and major detractors included Pharmaceutical Product Development, a contract research organization, and Sequenom,4 which makes a sequencing system to analyze DNA variations. Another large detractor outside of these sectors was communications satellites manufacturer Orbital Sciences4 in the industrials sector, and we exited our position by period-end.
Thank you for your participation in Franklin Small-Mid Cap Growth Securities Fund. We look forward to serving your future investment needs.
4. This holding is not an index component.
The foregoing information reflects our analysis, opinions and portfolio holdings as of December 31, 2009, the end of the reporting period. The way we implement our main investment strategies and the resulting portfolio holdings may change depending on factors such as market and economic conditions. These opinions may not be relied upon as investment advice or an offer for a particular security. The information is not a complete analysis of every aspect of any market, country, industry, security or the Fund. Statements of fact are from sources considered reliable, but the investment manager makes no representation or warranty as to their completeness or accuracy. Although historical performance is no guarantee of future results, these insights may help you understand our investment management philosophy.
Top 10 Holdings
Franklin Small-Mid Cap Growth
Securities Fund 12/31/09
| | |
Company
Sector/Industry | | % of Total
Net Assets |
| MasterCard Inc., A | | 2.2% |
| Information Technology | | |
| Express Scripts Inc. | | 2.0% |
| Health Care | | |
| Silicon Laboratories Inc. | | 1.9% |
| Information Technology | | |
| Concho Resources Inc. | | 1.7% |
| Energy | | |
| Nuance Communications Inc. | | 1.7% |
| Information Technology | | |
| Mettler-Toledo International Inc. | | 1.7% |
| Health Care | | |
| FLIR Systems Inc. | | 1.7% |
| Information Technology | | |
| Waters Corp. | | 1.7% |
| Health Care | | |
| Community Health Systems Inc. | | 1.6% |
| Health Care | | |
| Alliance Data Systems Corp. | | 1.6% |
| Information Technology | | |
The dollar value, number of shares or principal amount, and names of all portfolio holdings are listed in the Fund’s Statement of Investments.
FSC-4
Fund Expenses
As an investor in a variable insurance contract (Contract) that indirectly provides for investment in an underlying mutual fund, you can incur transaction and/or ongoing expenses at both the Fund level and the Contract level.
| • | | Transaction expenses can include sales charges (loads) on purchases, redemption fees, surrender fees, transfer fees and premium taxes. |
| • | | Ongoing expenses can include management fees, distribution and service (12b-1) fees, contract fees, annual maintenance fees, mortality and expense risk fees and other fees and expenses. All mutual funds and Contracts have some types of ongoing expenses. |
The expenses shown in the table are meant to highlight ongoing expenses at the Fund level only and do not include ongoing expenses at the Contract level, or transaction expenses at either the Fund or Contract level. While the Fund does not have transaction expenses, if the transaction and ongoing expenses at the Contract level were included, the expenses shown below would be higher. You should consult your Contract prospectus or disclosure document for more information.
The table shows Fund-level ongoing expenses and can help you understand these expenses and compare them with those of other mutual funds offered through the Contract. The table assumes a $1,000 investment held for the six months indicated. Please refer to the Fund prospectus for additional information on operating expenses.
Actual Fund Expenses
The first line (Actual) of the table provides actual account values and expenses. The “Ending Account Value” is derived from the Fund’s actual return, which includes the effect of ongoing Fund expenses, but does not include the effect of ongoing Contract expenses.
You can estimate the Fund-level expenses you incurred during the period by following these steps. Of course, your account value and expenses will differ from those in this illustration:
| 1. | Divide your account value by $1,000. |
If an account had an $8,600 value, then $8,600 ÷ $1,000 = 8.6.
| 2. | Multiply the result by the number under the heading “Fund-Level Expenses Incurred During Period.” |
If Fund-Level Expenses Incurred During Period were $7.50, then 8.6 x $7.50 = $64.50.
In this illustration, the estimated expenses incurred this period at the Fund level are $64.50.
Franklin Small-Mid Cap Growth Securities Fund Class 4
FSC-5
Hypothetical Example for Comparison with Other Mutual Funds
Information in the second line (Hypothetical) of the table can help you compare ongoing expenses of the Fund with those of other mutual funds offered through the Contract. This information may not be used to estimate the actual ending account balance or expenses you incurred during the period. The hypothetical “Ending Account Value” is based on the Fund’s actual expense ratio and an assumed 5% annual rate of return before expenses, which does not represent the Fund’s actual return. The figure under the heading “Fund-Level Expenses Incurred During Period” shows the hypothetical expenses your account would have incurred under this scenario. You can compare this figure with the 5% hypothetical examples that appear in shareholder reports of other funds offered through a Contract.
| | | | | | | | | |
| Class 4 | | Beginning
Account Value 7/1/09 | | Ending
Account Value 12/31/09 | | Fund-Level Expenses Incurred
During Period* 7/1/09–12/31/09 |
Actual | | $ | 1,000 | | $ | 1,253.80 | | $ | 6.48 |
Hypothetical (5% return before expenses) | | $ | 1,000 | | $ | 1,019.46 | | $ | 5.80 |
*Expenses are calculated using the most recent six-month annualized expense ratio for the Fund’s Class 4 shares (1.14%), which does not include any ongoing expenses of the Contract for which the Fund is an investment option, multiplied by the average account value over the period, multiplied by 184/365 to reflect the one-half year period.
FSC-6
Franklin Templeton Variable Insurance Products Trust
Financial Highlights
Franklin Small-Mid Cap Growth Securities Fund
| | | | | | | | | | | | | | | | | | | | |
| | | Year Ended December 31, | |
| Class 1 | | 2009 | | | 2008 | | | 2007 | | | 2006 | | | 2005 | |
| | | | |
Per share operating performance | | | | | | | | | | | | | | | | | | | | |
(for a share outstanding throughout the year) | | | | | | | | | | | | | | | | | | | | |
Net asset value, beginning of year | | $ | 12.06 | | | $ | 23.39 | | | $ | 22.51 | | | $ | 20.66 | | | $ | 19.66 | |
| | | | |
Income from investment operationsa: | | | | | | | | | | | | | | | | | | | | |
Net investment income (loss)b | | | (0.10 | )c | | | 0.01 | | | | (0.02 | ) | | | — | d | | | (0.02 | ) |
Net realized and unrealized gains (losses) | | | 5.40 | | | | (8.98 | ) | | | 2.65 | | | | 1.85 | | | | 1.02 | |
| | | | |
Total from investment operations | | | 5.30 | | | | (8.97 | ) | | | 2.63 | | | | 1.85 | | | | 1.00 | |
| | | | |
Less distributions from net realized gains | | | — | | | | (2.36 | ) | | | (1.75 | ) | | | — | | | | — | |
| | | | |
Net asset value, end of year | | $ | 17.36 | | | $ | 12.06 | | | $ | 23.39 | | | $ | 22.51 | | | $ | 20.66 | |
| | | | |
| | | | | |
Total returne | | | 43.95% | | | | (42.34)% | | | | 11.51% | | | | 8.95% | | | | 5.09% | |
Ratios to average net assets | | | | | | | | | | | | | | | | | | | | |
Expensesf | | | 0.80% | | | | 0.76% | | | | 0.74% | | | | 0.76% | | | | 0.74% | |
Net investment income (loss) | | | (0.72)% | c | | | 0.06% | | | | (0.10)% | | | | (0.02)% | | | | (0.09)% | |
| | | | | |
Supplemental data | | | | | | | | | | | | | | | | | | | | |
Net assets, end of year (000’s) | | $ | 79,670 | | | $ | 63,531 | | | $ | 127,602 | | | $ | 135,402 | | | $ | 157,085 | |
Portfolio turnover rate | | | 63.93% | | | | 60.12% | | | | 66.94% | | | | 50.08% | | | | 74.39% | |
aThe amount shown for a share outstanding throughout the period may not correlate with the Statement of Operations for the period due to the timing of sales and repurchases of the Fund shares in relation to income earned and/or fluctuating market value of the investments of the Fund.
bBased on average daily shares outstanding.
cNet investment income per share includes approximately $(0.06) per share as a return of capital and capital gain adjustment to previously recorded dividends received by the Fund. Excluding this non-recurring amount, the ratio of net investment income to average net assets would have been (0.22)%.
dAmount rounds to less than $0.01 per share.
eTotal return does not include any fees, charges or expenses imposed by the variable annuity and life insurance contracts for which the Franklin Templeton Variable Insurance Products Trust serves as an underlying investment vehicle.
fBenefit of expense reduction rounds to less than 0.01%.
The accompanying notes are an integral part of these financial statements.
FSC-7
Franklin Templeton Variable Insurance Products Trust
Financial Highlights (continued)
Franklin Small-Mid Cap Growth Securities Fund
| | | | | | | | | | | | | | | | | | | | |
| | | Year Ended December 31, | |
| Class 2 | | 2009 | | | 2008 | | | 2007 | | | 2006 | | | 2005 | |
| | | | |
Per share operating performance | | | | | | | | | | | | | | | | | | | | |
(for a share outstanding throughout the year) | | | | | | | | | | | | | | | | | | | | |
Net asset value, beginning of year | | $ | 11.75 | | | $ | 22.91 | | | $ | 22.13 | | | $ | 20.36 | | | $ | 19.43 | |
| | | | |
Income from investment operationsa: | | | | | | | | | | | | | | | | | | | | |
Net investment income (loss)b | | | (0.13 | )c | | | (0.03 | ) | | | (0.08 | ) | | | (0.06 | ) | | | (0.07 | ) |
Net realized and unrealized gains (losses) | | | 5.25 | | | | (8.77 | ) | | | 2.61 | | | | 1.83 | | | | 1.00 | |
| | | | |
Total from investment operations | | | 5.12 | | | | (8.80 | ) | | | 2.53 | | | | 1.77 | | | | 0.93 | |
| | | | |
Less distributions from net realized gains | | | — | | | | (2.36 | ) | | | (1.75 | ) | | | — | | | | — | |
| | | | |
Net asset value, end of year | | $ | 16.87 | | | $ | 11.75 | | | $ | 22.91 | | | $ | 22.13 | | | $ | 20.36 | |
| | | | |
| | | | | |
Total returnd | | | 43.57% | | | | (42.49)% | | | | 11.24% | | | | 8.69% | | | | 4.79% | |
Ratios to average net assets | | | | | | | | | | | | | | | | | | | | |
Expensese | | | 1.05% | | | | 1.01% | | | | 0.99% | | | | 1.01% | | | | 0.99% | |
Net investment income (loss) | | | (0.97)% | c | | | (0.19)% | | | | (0.35)% | | | | (0.27)% | | | | (0.34)% | |
| | | | | |
Supplemental data | | | | | | | | | | | | | | | | | | | | |
Net assets, end of year (000’s) | | $ | 813,480 | | | $ | 614,053 | | | $ | 1,217,177 | | | $ | 1,184,521 | | | $ | 1,166,806 | |
Portfolio turnover rate | | | 63.93% | | | | 60.12% | | | | 66.94% | | | | 50.08% | | | | 74.39% | |
aThe amount shown for a share outstanding throughout the period may not correlate with the Statement of Operations for the period due to the timing of sales and repurchases of the Fund shares in relation to income earned and/or fluctuating market value of the investments of the Fund.
bBased on average daily shares outstanding.
cNet investment income per share includes approximately $(0.06) per share as a return of capital and capital gain adjustment to previously recorded dividends received by the Fund. Excluding this non-recurring amount, the ratio of net investment income to average net assets would have been (0.47)%.
dTotal return does not include any fees, charges or expenses imposed by the variable annuity and life insurance contracts for which the Franklin Templeton Variable Insurance Products Trust serves as an underlying investment vehicle.
eBenefit of expense reduction rounds to less than 0.01%.
The accompanying notes are an integral part of these financial statements.
FSC-8
Franklin Templeton Variable Insurance Products Trust
Financial Highlights (continued)
Franklin Small-Mid Cap Growth Securities Fund
| | | | | | | | |
| | | Year Ended
December 31, | |
| Class 4 | | 2009 | | | 2008a | |
| | | | |
Per share operating performance | | | | | | | | |
(for a share outstanding throughout the year) | | | | | | | | |
Net asset value, beginning of year | | $ | 12.02 | | | $ | 20.60 | |
| | | | |
Income from investment operationsb: | | | | | | | | |
Net investment income (loss)c | | | (0.15 | )d | | | 0.02 | |
Net realized and unrealized gains (losses) | | | 5.37 | | | | (6.24 | ) |
| | | | |
Total from investment operations | | | 5.22 | | | | (6.22 | ) |
| | | | |
Less distributions from net realized gains | | | — | | | | (2.36 | ) |
| | | | |
Net asset value, end of year | | $ | 17.24 | | | $ | 12.02 | |
| | | | |
| | |
Total returne | | | 43.43% | | | | (34.74)% | |
Ratios to average net assetsf | | | | | | | | |
Expensesg | | | 1.15% | | | | 1.11% | |
Net investment income (loss) | | | (1.07)% | d | | | (0.29)% | |
| | |
Supplemental data | | | | | | | | |
Net assets, end of year (000’s) | | $ | 11,029 | | | $ | 3,538 | |
Portfolio turnover rate | | | 63.93% | | | | 60.12% | |
aFor the period February 29, 2008 (effective date) to December 31, 2008.
bThe amount shown for a share outstanding throughout the period may not correlate with the Statement of Operations for the period due to the timing of sales and repurchases of the Fund shares in relation to income earned and/or fluctuating market value of the investments of the Fund.
cBased on average daily shares outstanding.
dNet investment income per share includes approximately $(0.06) per share as a return of capital and capital gain adjustment to previously recorded dividends received by the Fund. Excluding this non-recurring amount, the ratio of net investment income to average net assets would have been (0.57)%.
eTotal return does not include any fees, charges or expenses imposed by the variable annuity and life insurance contracts for which the Franklin Templeton Variable Insurance Products Trust serves as an underlying investment vehicle. Total return is not annualized for periods less than one year.
fRatios are annualized for periods less than one year.
gBenefit of expense reduction rounds to less than 0.01%.
The accompanying notes are an integral part of these financial statements.
FSC-9
Franklin Templeton Variable Insurance Products Trust
Statement of Investments, December 31, 2009
| | | | | |
| Franklin Small-Mid Cap Growth Securities Fund | | Shares | | Value |
Common Stocks 98.4% | | | | | |
Consumer Discretionary 16.4% | | | | | |
Advance Auto Parts Inc. | | 167,000 | | $ | 6,760,159 |
aApollo Group Inc., A | | 107,600 | | | 6,518,408 |
BorgWarner Inc. | | 278,400 | | | 9,248,448 |
aBuffalo Wild Wings Inc. | | 155,000 | | | 6,241,850 |
aCapella Education Co. | | 59,800 | | | 4,502,940 |
aChipotle Mexican Grill Inc. | | 94,200 | | | 8,304,672 |
aDick’s Sporting Goods Inc. | | 322,500 | | | 8,020,575 |
aDollar General Corp. | | 188,800 | | | 4,234,784 |
Guess? Inc. | | 315,000 | | | 13,324,500 |
aJ Crew Group Inc. | | 125,000 | | | 5,592,500 |
Jarden Corp. | | 188,900 | | | 5,838,899 |
Johnson Controls Inc. | | 450,000 | | | 12,258,000 |
aKohl’s Corp. | | 160,000 | | | 8,628,800 |
Polo Ralph Lauren Corp. | | 55,000 | | | 4,453,900 |
aPriceline.com Inc. | | 37,000 | | | 8,084,500 |
Starwood Hotels & Resorts Worldwide Inc. | | 115,000 | | | 4,205,550 |
aUnder Armour Inc., A | | 226,330 | | | 6,172,019 |
aUrban Outfitters Inc. | | 285,400 | | | 9,986,146 |
aWMS Industries Inc. | | 170,000 | | | 6,800,000 |
Wolverine World Wide Inc. | | 336,200 | | | 9,151,364 |
| | | | | |
| | | | | 148,328,014 |
| | | | | |
Consumer Staples 1.9% | | | | | |
aHansen Natural Corp. | | 198,700 | | | 7,630,080 |
Mead Johnson Nutrition Co., A | | 216,200 | | | 9,447,940 |
| | | | | |
| | | | | 17,078,020 |
| | | | | |
Energy 7.8% | | | | | |
aCameron International Corp. | | 233,400 | | | 9,756,120 |
aConcho Resources Inc. | | 348,579 | | | 15,651,197 |
aFMC Technologies Inc. | | 216,900 | | | 12,545,496 |
Noble Corp. | | 100,000 | | | 4,070,000 |
Peabody Energy Corp. | | 165,000 | | | 7,459,650 |
aPetrohawk Energy Corp. | | 381,500 | | | 9,152,185 |
Smith International Inc. | | 160,000 | | | 4,347,200 |
aWeatherford International Ltd. | | 410,000 | | | 7,343,100 |
| | | | | |
| | | | | 70,324,948 |
| | | | | |
Financials 5.2% | | | | | |
aAffiliated Managers Group Inc. | | 157,700 | | | 10,621,095 |
The Charles Schwab Corp. | | 350,700 | | | 6,600,174 |
aFelCor Lodging Trust Inc. | | 291,860 | | | 1,050,696 |
aiStar Financial Inc. | | 824,991 | | | 2,111,977 |
Lazard Ltd., LP | | 150,000 | | | 5,695,500 |
Northern Trust Corp. | | 100,000 | | | 5,240,000 |
T. Rowe Price Group Inc. | | 197,865 | | | 10,536,311 |
W. R. Berkley Corp. | | 225,000 | | | 5,544,000 |
| | | | | |
| | | | | 47,399,753 |
| | | | | |
Health Care 22.5% | | | | | |
Aetna Inc. | | 375,000 | | | 11,887,500 |
aAllscripts-Misys Healthcare Solutions Inc. | | 264,600 | | | 5,352,858 |
aBioMarin Pharmaceutical Inc. | | 271,000 | | | 5,097,510 |
C. R. Bard Inc. | | 124,000 | | | 9,659,600 |
FSC-10
Franklin Templeton Variable Insurance Products Trust
Statement of Investments, December 31, 2009 (continued)
| | | | | |
| Franklin Small-Mid Cap Growth Securities Fund | | Shares | | Value |
Common Stocks (continued) | | | | | |
Health Care (continued) | | | | | |
aCerner Corp. | | 116,000 | | $ | 9,563,040 |
aCommunity Health Systems Inc. | | 410,400 | | | 14,610,240 |
aDaVita Inc. | | 117,500 | | | 6,901,950 |
aDendreon Corp. | | 80,000 | | | 2,102,400 |
aEdwards Lifesciences Corp. | | 95,000 | | | 8,250,750 |
aExpress Scripts Inc. | | 212,400 | | | 18,361,980 |
aIntuitive Surgical Inc. | | 42,100 | | | 12,769,772 |
aLife Technologies Corp. | | 132,600 | | | 6,925,698 |
aMasimo Corp. | | 207,500 | | | 6,312,150 |
aMettler-Toledo International Inc. | | 146,400 | | | 15,370,536 |
aMyriad Genetics Inc. | | 202,100 | | | 5,274,810 |
aOnyx Pharmaceuticals Inc. | | 78,800 | | | 2,311,992 |
aOSI Pharmaceuticals Inc. | | 39,900 | | | 1,238,097 |
Perrigo Co. | | 202,606 | | | 8,071,823 |
Pharmaceutical Product Development Inc. | | 260,000 | | | 6,094,400 |
aQIAGEN NV (Netherlands) | | 350,700 | | | 7,827,624 |
aSavient Pharmaceuticals Inc. | | 160,000 | | | 2,177,600 |
aSequenom Inc. | | 267,400 | | | 1,107,036 |
aTalecris Biotherapeutics Holdings Corp. | | 416,500 | | | 9,275,455 |
aVarian Medical Systems Inc. | | 244,040 | | | 11,433,274 |
aWaters Corp. | | 241,500 | | | 14,963,340 |
| | | | | |
| | | | | 202,941,435 |
| | | | | |
Industrials 12.8% | | | | | |
aAllegiant Travel Co. | | 121,000 | | | 5,707,570 |
AMETEK Inc. | | 199,600 | | | 7,632,704 |
C.H. Robinson Worldwide Inc. | | 102,500 | | | 6,019,825 |
aCopart Inc. | | 145,000 | | | 5,311,350 |
Danaher Corp. | | 94,400 | | | 7,098,880 |
Expeditors International of Washington Inc. | | 125,000 | | | 4,341,250 |
Flowserve Corp. | | 130,000 | | | 12,288,900 |
Fluor Corp. | | 145,000 | | | 6,530,800 |
Heico Corp. | | 21,193 | | | 939,486 |
J.B. Hunt Transport Services Inc. | | 140,000 | | | 4,517,800 |
aJacobs Engineering Group Inc. | | 100,000 | | | 3,761,000 |
Joy Global Inc. | | 105,000 | | | 5,416,950 |
Knight Transportation Inc. | | 100,000 | | | 1,929,000 |
Precision Castparts Corp. | | 127,700 | | | 14,091,695 |
Robert Half International Inc. | | 240,000 | | | 6,415,200 |
Rockwell Collins Inc. | | 195,000 | | | 10,795,200 |
aRyanair Holdings PLC, ADR (Ireland) | | 316,100 | | | 8,477,802 |
aTetra Tech Inc. | | 174,100 | | | 4,730,297 |
| | | | | |
| | | | | 116,005,709 |
| | | | | |
Information Technology 27.0% | | | | | |
aActivision Blizzard Inc. | | 527,200 | | | 5,857,192 |
aAlliance Data Systems Corp. | | 225,400 | | | 14,558,586 |
Analog Devices Inc. | | 245,000 | | | 7,737,100 |
aANSYS Inc. | | 255,700 | | | 11,112,722 |
aAvago Technologies Ltd. (Singapore) | | 354,000 | | | 6,474,660 |
aCitrix Systems Inc. | | 215,000 | | | 8,946,150 |
aConcur Technologies Inc. | | 126,200 | | | 5,395,050 |
FactSet Research Systems Inc. | | 187,100 | | | 12,324,277 |
aFLIR Systems Inc. | | 466,100 | | | 15,250,792 |
FSC-11
Franklin Templeton Variable Insurance Products Trust
Statement of Investments, December 31, 2009 (continued)
| | | | | | |
| Franklin Small-Mid Cap Growth Securities Fund | | Shares | | Value | |
Common Stocks (continued) | | | | | | |
Information Technology (continued) | | | | | | |
aHittite Microwave Corp. | | 169,200 | | $ | 6,894,900 | |
aJuniper Networks Inc. | | 235,000 | | | 6,267,450 | |
aLam Research Corp. | | 249,400 | | | 9,778,974 | |
MasterCard Inc., A | | 77,000 | | | 19,710,460 | |
aMcAfee Inc. | | 180,000 | | | 7,302,600 | |
aNetApp Inc. | | 372,800 | | | 12,820,592 | |
aNuance Communications Inc. | | 1,000,000 | | | 15,540,000 | |
aPolycom Inc. | | 200,000 | | | 4,994,000 | |
aSAIC Inc. | | 541,300 | | | 10,252,222 | |
aSilicon Laboratories Inc. | | 351,400 | | | 16,986,676 | |
aSybase Inc. | | 215,000 | | | 9,331,000 | |
Tandberg ASA (Norway) | | 224,000 | | | 6,376,372 | |
aTrimble Navigation Ltd. | | 358,300 | | | 9,029,160 | |
aVarian Semiconductor Equipment Associates Inc. | | 265,000 | | | 9,508,200 | |
aViaSat Inc. | | 161,101 | | | 5,119,790 | |
Xilinx Inc. | | 275,000 | | | 6,891,500 | |
| | | | | | |
| | | | | 244,460,425 | |
| | | | | | |
Materials 2.3% | | | | | | |
Celanese Corp., A | | 380,000 | | | 12,198,000 | |
Ecolab Inc. | | 186,900 | | | 8,332,002 | |
| | | | | | |
| | | | | 20,530,002 | |
| | | | | | |
Telecommunication Services 2.5% | | | | | | |
aAmerican Tower Corp., A | | 190,600 | | | 8,235,826 | |
aSBA Communications Corp. | | 424,900 | | | 14,514,584 | |
| | | | | | |
| | | | | 22,750,410 | |
| | | | | | |
Total Common Stocks (Cost $699,855,802) | | | | | 889,818,716 | |
| | | | | | |
| | | Principal
Amount | | | |
Convertible Bonds (Cost $790,524) 0.2% | | | | | | |
Information Technology 0.2% | | | | | | |
bAlliance Data Systems Corp., cvt., senior note, 144A, 4.75%, 5/15/14 | | $781,000 | | | 1,198,835 | |
| | | | | | |
Total Investments before Short Term Investments (Cost $700,646,326) | | | | | 891,017,551 | |
| | | | | | |
| | | Shares | | | |
Short Term Investments (Cost $13,641,054) 1.5% | | | | | | |
Money Market Funds 1.5% | | | | | | |
cInstitutional Fiduciary Trust Money Market Portfolio, 0.00% | | 13,641,054 | | | 13,641,054 | |
| | | | | | |
Total Investments (Cost $714,287,380) 100.1% | | | | | 904,658,605 | |
Other Assets, less Liabilities (0.1)% | | | | | (479,655 | ) |
| | | | | | |
Net Assets 100.0% | | | | $ | 904,178,950 | |
| | | | | | |
See Abbreviations on page FSC-21.
aNon-income producing.
bSecurity was purchased pursuant to Rule 144A under the Securities Act of 1933 and may be sold in transactions exempt from registration only to qualified institutional buyers or in a public offering registered under the Securities Act of 1933. This security has been deemed liquid under guidelines approved by the Trust’s Board of Trustees. At December 31, 2009, the value of this security was $1,198,835, representing 0.13% of net assets.
cSee Note 7 regarding investments in the Institutional Fiduciary Trust Money Market Portfolio. The rate shown is the annualized seven-day yield at period end.
The accompanying notes are an integral part of these financial statements.
FSC-12
Franklin Templeton Variable Insurance Products Trust
Financial Statements
Statement of Assets and Liabilities
December 31, 2009
| | | | |
| | | Franklin Small-Mid
Cap Growth
Securities Fund | |
Assets: | | | | |
Investments in securities: | | | | |
Cost - Unaffiliated issuers | | $ | 700,646,326 | |
Cost - Sweep Money Fund (Note 7) | | | 13,641,054 | |
| | | | |
Total cost of investments | | $ | 714,287,380 | |
| | | | |
Value - Unaffiliated issuers | | $ | 891,017,551 | |
Value - Sweep Money Fund (Note 7) | | | 13,641,054 | |
| | | | |
Total value of investments | | | 904,658,605 | |
Receivables: | | | | |
Capital shares sold | | | 1,629,568 | |
Dividends and interest | | | 368,342 | |
Other assets | | | 1,981 | |
| | | | |
Total assets | | | 906,658,496 | |
| | | | |
Liabilities: | | | | |
Payables: | | | | |
Investment securities purchased | | | 451,059 | |
Capital shares redeemed | | | 842,305 | |
Affiliates | | | 896,635 | |
Reports to shareholders | | | 247,386 | |
Accrued expenses and other liabilities | | | 42,161 | |
| | | | |
Total liabilities | | | 2,479,546 | |
| | | | |
Net assets, at value | | $ | 904,178,950 | |
| | | | |
Net assets consist of: | | | | |
Paid-in capital | | $ | 863,622,388 | |
Net unrealized appreciation (depreciation) | | | 190,371,225 | |
Accumulated net realized gain (loss) | | | (149,814,663 | ) |
| | | | |
Net assets, at value | | $ | 904,178,950 | |
| | | | |
Class 1: | | | | |
Net assets, at value | | $ | 79,670,012 | |
| | | | |
Shares outstanding | | | 4,589,007 | |
| | | | |
Net asset value and maximum offering price per share | | $ | 17.36 | |
| | | | |
Class 2: | | | | |
Net assets, at value | | $ | 813,480,326 | |
| | | | |
Shares outstanding | | | 48,214,901 | |
| | | | |
Net asset value and maximum offering price per share | | $ | 16.87 | |
| | | | |
Class 4: | | | | |
Net assets, at value | | $ | 11,028,612 | |
| | | | |
Shares outstanding | | | 639,596 | |
| | | | |
Net asset value and maximum offering price per share | | $ | 17.24 | |
| | | | |
The accompanying notes are an integral part of these financial statements.
FSC-13
Franklin Templeton Variable Insurance Products Trust
Financial Statements (continued)
Statement of Operations
for the year ended December 31, 2009
| | | | |
| | | Franklin Small-Mid
Cap Growth
Securities Fund | |
Investment income: | | | | |
Dividends: | | | | |
Unaffiliated issuers | | $ | 508,336 | a |
Sweep Money Fund (Note 7) | | | 28,265 | |
Interest | | | 53,636 | |
| | | | |
Total investment income | | | 590,237 | |
| | | | |
Expenses: | | | | |
Management fees (Note 3a) | | | 3,857,733 | |
Administrative fees (Note 3b) | | | 1,910,368 | |
Distribution fees: (Note 3c) | | | | |
Class 2 | | | 1,720,680 | |
Class 4 | | | 25,789 | |
Unaffiliated transfer agent fees | | | 2,609 | |
Custodian fees (Note 4) | | | 14,326 | |
Reports to shareholders | | | 227,284 | |
Professional fees | | | 37,119 | |
Trustees’ fees and expenses | | | 5,039 | |
Other | | | 37,369 | |
| | | | |
Total expenses | | | 7,838,316 | |
Expense reductions (Note 4) | | | (24 | ) |
| | | | |
Net expenses | | | 7,838,292 | |
| | | | |
Net investment income (loss) | | | (7,248,055 | ) |
| | | | |
Realized and unrealized gains (losses): | | | | |
Net realized gain (loss) from: | | | | |
Investments | | | (16,648,981 | ) |
Realized gain distributions from REITs | | | 1,318,637 | |
Foreign currency transactions | | | 59,846 | |
| | | | |
Net realized gain (loss) | | | (15,270,498 | ) |
| | | | |
Net change in unrealized appreciation (depreciation) on investments | | | 304,247,899 | |
| | | | |
Net realized and unrealized gain (loss) | | | 288,977,401 | |
| | | | |
Net increase (decrease) in net assets resulting from operations | | $ | 281,729,346 | |
| | | | |
aDividend income includes $(3,437,236) as a return of capital and capital gain adjustment to previously recorded dividends received by the Fund. Excluding this non-recurring amount, the dividend income would have been $3,945,572.
The accompanying notes are an integral part of these financial statements.
FSC-14
Franklin Templeton Variable Insurance Products Trust
Financial Statements (continued)
Statements of Changes in Net Assets
| | | | | | | | |
| | | Franklin Small-Mid
Cap Growth
Securities Fund | |
| | | Year Ended December 31, | |
| | | 2009 | | | 2008 | |
| | | | |
Increase (decrease) in net assets: | | | | | | | | |
Operations: | | | | | | | | |
Net investment income (loss) | | $ | (7,248,055 | ) | | $ | (1,751,350 | ) |
Net realized gain (loss) from investments and foreign currency transactions | | | (15,270,498 | ) | | | (129,490,774 | ) |
Net change in unrealized appreciation (depreciation) on investments | | | 304,247,899 | | | | (402,574,863 | ) |
| | | | |
Net increase (decrease) in net assets resulting from operations | | | 281,729,346 | | | | (533,816,987 | ) |
| | | | |
Distributions to shareholders from net realized gains: | | | | | | | | |
Class 1 | | | — | | | | (12,125,691 | ) |
Class 2 | | | — | | | | (120,375,409 | ) |
Class 4 | | | — | | | | (60,013 | ) |
| | | | |
Total distributions to shareholders | | | — | | | | (132,561,113 | ) |
| | | | |
Capital share transactions: (Note 2) | | | | | | | | |
Class 1 | | | (9,085,824 | ) | | | (2,123,859 | ) |
Class 2 | | | (54,143,599 | ) | | | 111,515 | |
Class 4 | | | 4,556,653 | | | | 4,733,324 | |
| | | | |
Total capital share transactions | | | (58,672,770 | ) | | | 2,720,980 | |
| | | | |
Net increase (decrease) in net assets | | | 223,056,576 | | | | (663,657,120 | ) |
Net assets: | | | | | | | | |
Beginning of year | | | 681,122,374 | | | | 1,344,779,494 | |
| | | | |
End of year | | $ | 904,178,950 | | | $ | 681,122,374 | |
| | | | |
Undistributed net investment income (loss) included in net assets: | | | | | | | | |
End of year | | $ | — | | | $ | (20,106 | ) |
| | | | |
The accompanying notes are an integral part of these financial statements.
FSC-15
Franklin Templeton Variable Insurance Products Trust
Notes to Financial Statements
Franklin Small-Mid Cap Growth Securities Fund
1. ORGANIZATION AND SIGNIFICANT ACCOUNTING POLICIES
Franklin Templeton Variable Insurance Products Trust (Trust) is registered under the Investment Company Act of 1940, as amended, (1940 Act) as an open-end investment company, consisting of twenty-two separate funds. The Franklin Small-Mid Cap Growth Securities Fund (Fund) is included in this report. The financial statements of the remaining funds in the Trust are presented separately. Shares of the Fund are generally sold only to insurance company separate accounts to fund the benefits of variable life insurance policies or variable annuity contracts. The Fund offers three classes of shares: Class 1, Class 2, and Class 4. Each class of shares differs by its distribution fees, voting rights on matters affecting a single class and its exchange privilege.
The following summarizes the Fund’s significant accounting policies.
a. Security Valuation
Equity and other securities listed on a securities exchange or on the NASDAQ National Market System are valued at the last quoted sale price or the official closing price of the day, respectively. Over-the-counter securities and listed securities for which there is no reported sale are valued within the range of the most recent quoted bid and ask prices. Securities that trade in multiple markets or on multiple exchanges are valued according to the broadest and most representative market. Certain equity securities are valued based upon fundamental characteristics or relationships to similar securities. Investments in open-end mutual funds are valued at the closing net asset value.
Corporate debt securities generally trade in the over-the-counter market rather than on a securities exchange. The Fund may utilize independent pricing services, quotations from bond dealers, and information with respect to bond and note transactions, to assist in determining a current market value for each security. The Fund’s pricing services may use valuation models or matrix pricing which considers information with respect to comparable bond and note transactions, quotations from bond dealers, or by reference to other securities that are considered comparable in such characteristics as rating, interest rate and maturity date, option adjusted spread models, prepayment projections, interest rate spreads and yield curves, to determine current value.
Foreign equity securities are valued as of the close of trading on the foreign stock exchange on which the security is primarily traded, or the NYSE, whichever is earlier. If no sale is reported at that time, the foreign equity security will be valued within the range of the most recent quoted bid and ask prices. The value is then converted into its U.S. dollar equivalent at the foreign exchange rate in effect at the close of the NYSE on the day that the value of the security is determined.
The Fund has procedures to determine the fair value of individual securities and other assets for which market prices are not readily available or which may not be reliably priced. Methods for valuing these securities may include: fundamental analysis based upon the underlying investment book value, anticipated future cash flows, market changes in comparable or similar securities, matrix pricing, discounts from market prices of similar securities, or discounts applied due to the nature and duration of restrictions on the disposition of the securities. Due to the inherent uncertainty of valuations of such securities, the fair values may differ significantly from the values that would have been used had a ready market for such investments existed. Occasionally, events occur between the time at which trading in a security is completed and the close of the NYSE that might call into question the availability (including the reliability) of the value of a portfolio security held by the Fund. The investment manager monitors price movements following the close of trading in foreign stock markets through a series of country specific market proxies (such as baskets of American Depository Receipts, futures contracts and exchange traded funds). These price movements are measured against established trigger thresholds for each specific market proxy to assist in determining if an event has occurred. If such an event occurs, the securities may be valued using fair value procedures, which may include the use of independent pricing services. All security valuation procedures are approved by the Fund’s Board of Trustees.
b. Foreign Currency Translation
Portfolio securities and other assets and liabilities denominated in foreign currencies are translated into U.S. dollars based on the exchange rate of such currencies against U.S. dollars on the date of valuation. The Fund may enter into foreign currency
FSC-16
Franklin Templeton Variable Insurance Products Trust
Notes to Financial Statements (continued)
Franklin Small-Mid Cap Growth Securities Fund
1. ORGANIZATION AND SIGNIFICANT ACCOUNTING POLICIES (continued)
b. Foreign Currency Translation (continued)
exchange contracts to facilitate transactions denominated in a foreign currency. Purchases and sales of securities, income and expense items denominated in foreign currencies are translated into U.S. dollars at the exchange rate in effect on the transaction date. Occasionally, events may impact the availability or reliability of foreign exchange rates used to convert the U.S. dollar equivalent value. If such an event occurs, the foreign exchange rate will be valued at fair value using procedures established and approved by the Fund’s Board of Trustees.
The Fund does not separately report the effect of changes in foreign exchange rates from changes in market prices on securities held. Such changes are included in net realized and unrealized gain or loss from investments on the Statement of Operations.
Realized foreign exchange gains or losses arise from sales of foreign currencies, currency gains or losses realized between the trade and settlement dates on securities transactions and the difference between the recorded amounts of dividends, interest, and foreign withholding taxes and the U.S. dollar equivalent of the amounts actually received or paid. Net unrealized foreign exchange gains and losses arise from changes in foreign exchange rates on foreign denominated assets and liabilities other than investments in securities held at the end of the reporting period.
c. Income Taxes
No provision has been made for U.S. income taxes because it is the Fund’s policy to qualify as a regulated investment company under the Internal Revenue Code and to distribute to shareholders substantially all of its taxable income and net realized gains.
The Fund has reviewed the tax positions, taken on federal income tax returns, for each of the three open tax years and as of December 31, 2009, and has determined that no provision for income tax is required in the Fund’s financial statements.
d. Security Transactions, Investment Income, Expenses and Distributions
Security transactions are accounted for on trade date. Realized gains and losses on security transactions are determined on a specific identification basis. Interest income and estimated expenses are accrued daily. Dividend income is recorded on the ex-dividend date. Distributions to shareholders are recorded on the ex-dividend date and are determined according to income tax regulations (tax basis). Distributable earnings determined on a tax basis may differ from earnings recorded in accordance with accounting principles generally accepted in the United States of America. These differences may be permanent or temporary. Permanent differences are reclassified among capital accounts to reflect their tax character. These reclassifications have no impact on net assets or the results of operations. Temporary differences are not reclassified, as they may reverse in subsequent periods.
Common expenses incurred by the Trust are allocated among the funds based on the ratio of net assets of each fund to the combined net assets of the Trust. Fund specific expenses are charged directly to the fund that incurred the expense.
Realized and unrealized gains and losses and net investment income, not including class specific expenses, are allocated daily to each class of shares based upon the relative proportion of net assets of each class. Differences in per share distributions, by class, are generally due to differences in class specific expenses.
Distributions received by the Fund from certain securities may be a return of capital (ROC). Such distributions reduce the cost basis of the securities, and any distributions in excess of the cost basis are recognized as capital gains.
e. Accounting Estimates
The preparation of financial statements in accordance with accounting principles generally accepted in the United States of America requires management to make estimates and assumptions that affect the reported amounts of assets and liabilities at the date of the financial statements and the amounts of income and expenses during the reporting period. Actual results could differ from those estimates.
FSC-17
Franklin Templeton Variable Insurance Products Trust
Notes to Financial Statements (continued)
Franklin Small-Mid Cap Growth Securities Fund
1. ORGANIZATION AND SIGNIFICANT ACCOUNTING POLICIES (continued)
f. Guarantees and Indemnifications
Under the Trust’s organizational documents, its officers and trustees are indemnified by the Trust against certain liabilities arising out of the performance of their duties to the Trust. Additionally, in the normal course of business, the Trust, on behalf of the Fund, enters into contracts with service providers that contain general indemnification clauses. The Trust’s maximum exposure under these arrangements is unknown as this would involve future claims that may be made against the Trust that have not yet occurred. Currently, the Trust expects the risk of loss to be remote.
2. SHARES OF BENEFICIAL INTEREST
At December 31, 2009, there were an unlimited number of shares authorized (without par value). Transactions in the Fund’s shares were as follows:
| | | | | | | | | | | | | | |
| | | Year Ended December 31, | |
| | | 2009 | | | 2008a | |
| Class 1 Shares: | | Shares | | | Amount | | | Shares | | | Amount | |
Shares sold | | 360,719 | | | $ | 4,738,225 | | | 227,516 | | | $ | 3,688,465 | |
Shares issued in reinvestment of distributions | | — | | | | — | | | 606,588 | | | | 12,125,691 | |
Shares redeemed | | (1,039,202 | ) | | | (13,824,049 | ) | | (1,022,106 | ) | | | (17,938,015 | ) |
| | | | |
Net increase (decrease) | | (678,483 | ) | | $ | (9,085,824 | ) | | (188,002 | ) | | $ | (2,123,859 | ) |
| | | | |
Class 2 Shares: | | | | | | | | | | | | | | |
Shares sold | | 5,849,260 | | | $ | 79,159,779 | | | 5,946,940 | | | $ | 107,425,372 | |
Shares issued in reinvestment of distributions | | — | | | | — | | | 6,173,098 | | | | 120,375,409 | |
Shares redeemed | | (9,890,944 | ) | | | (133,303,378 | ) | | (13,001,795 | ) | | | (227,689,266 | ) |
| | | | |
Net increase (decrease) | | (4,041,684 | ) | | $ | (54,143,599 | ) | | (881,757 | ) | | $ | 111,515 | |
| | | | |
Class 4 Shares: | | | | | | | | | | | | | | |
Shares sold | | 430,752 | | | $ | 5,835,810 | | | 307,835 | | | $ | 4,910,005 | |
Shares issued on reinvestment of distributions | | — | | | | — | | | 2,978 | | | | 59,439 | |
Shares redeemed | | (85,450 | ) | | | (1,279,157 | ) | | (16,519 | ) | | | (236,120 | ) |
| | | | |
Net increase (decrease) | | 345,302 | | | $ | 4,556,653 | | | 294,294 | | | $ | 4,733,324 | |
| | | | |
| aFor | the period February 29, 2008 (effective date) to December 31, 2008 for Class 4. |
3. TRANSACTIONS WITH AFFILIATES
Franklin Resources, Inc. is the holding company for various subsidiaries that together are referred to as Franklin Templeton Investments. Certain officers and trustees of the Trust are also officers and/or directors of the following subsidiaries:
| | |
| Subsidiary | | Affiliation |
Franklin Advisers, Inc. (Advisers) | | Investment manager |
Franklin Templeton Services, LLC (FT Services) | | Administrative manager |
Franklin Templeton Distributors, Inc. (Distributors) | | Principal underwriter |
Franklin Templeton Investor Services, LLC (Investor Services) | | Transfer agent |
FSC-18
Franklin Templeton Variable Insurance Products Trust
Notes to Financial Statements (continued)
Franklin Small-Mid Cap Growth Securities Fund
3. TRANSACTIONS WITH AFFILIATES (continued)
a. Management Fees
The Fund pays an investment management fee to Advisers based on the average daily net assets of the Fund as follows:
| | |
| Annualized Fee Rate | | Net Assets |
| 0.550% | | Up to and including $500 million |
| 0.450% | | Over $500 million, up to and including $1 billion |
| 0.400% | | Over $1 billion, up to and including $1.5 billion |
| 0.350% | | Over $1.5 billion, up to and including $6.5 billion |
| 0.325% | | Over $6.5 billion, up to and including $11.5 billion |
| 0.300% | | Over $11.5 billion, up to and including $16.5 billion |
| 0.290% | | Over $16.5 billion, up to and including $19 billion |
| 0.280% | | Over $19 billion, up to and including $21.5 billion |
| 0.270% | | In excess of $21.5 billion |
b. Administrative Fees
The Fund pays an administrative fee to FT Services of 0.25% per year of the average daily net assets of the Funds.
c. Distribution Fees
The Fund’s Board of Trustees has adopted distribution plans for Class 2 and Class 4 shares pursuant to Rule 12b-1 under the 1940 Act. Under the Fund’s compensation distribution plans, the Fund pays Distributors for costs incurred in connection with the servicing, sale and distribution of the Fund’s shares up to 0.35% per year of its average daily net assets of each class. The Board of Trustees has agreed to limit the current rate to 0.25% per year for Class 2.
d. Transfer Agent Fees
Investor Services, under terms of an agreement, performs shareholder servicing for the Fund and is not paid by the Fund for the services.
4. EXPENSE OFFSET ARRANGEMENT
The Fund has entered into an arrangement with its custodian whereby credits realized as a result of uninvested cash balances are used to reduce a portion of the Fund’s custodian expenses. During the year ended December 31, 2009, the custodian fees were reduced as noted in the Statement of Operations.
5. INCOME TAXES
For tax purposes, capital losses may be carried over to offset future capital gains, if any. At December 31, 2009, the capital loss carryforwards were as follows:
| | | |
Capital loss carryforwards expiring in: | | | |
2016 | | $ | 75,079,787 |
2017 | | | 74,710,692 |
| | | |
| | $ | 149,790,479 |
| | | |
FSC-19
Franklin Templeton Variable Insurance Products Trust
Notes to Financial Statements (continued)
Franklin Small-Mid Cap Growth Securities Fund
5. INCOME TAXES (continued)
The tax character of distributions paid during the years ended December 31, 2009 and 2008, was as follows:
| | | | | | |
| | | 2009 | | 2008 |
Distributions paid from long term capital gain | | $ | — | | $ | 132,561,113 |
| | | |
At December 31, 2009, the cost of investments and net unrealized appreciation (depreciation) for income tax purposes were as follows:
| | | | |
Cost of investments | | $ | 714,311,564 | |
| | | | |
Unrealized appreciation | | $ | 235,602,959 | |
Unrealized depreciation | | | (45,255,918 | ) |
| | | | |
Net unrealized appreciation (depreciation) | | $ | 190,347,041 | |
| | | | |
Net investment income (loss) differs for financial statement and tax purposes primarily due to differing treatments of foreign currency transactions and corporate actions.
Net realized gains (losses) differ for financial statement and tax purposes primarily due to differing treatments of wash sales, foreign currency transactions and corporate actions.
6. INVESTMENT TRANSACTIONS
Purchases and sales of investments (excluding short term securities) for the year ended December 31, 2009, aggregated $469,665,708 and $506,719,899, respectively.
7. INVESTMENTS IN INSTITUTIONAL FIDUCIARY TRUST MONEY MARKET PORTFOLIO
The Fund may invest in the Institutional Fiduciary Trust Money Market Portfolio (Sweep Money Fund), an open-end investment company managed by Advisers. Management fees paid by the Fund are reduced on assets invested in the Sweep Money Fund, in an amount not to exceed the management and administrative fees paid by the Sweep Money Fund.
8. CREDIT FACILITY
The Fund, together with other U.S. registered and foreign investment funds (collectively “Borrowers”), managed by Franklin Templeton Investments, are borrowers in a joint syndicated senior unsecured credit facility totaling $725 million (Global Credit Facility) to provide a source of funds to the Borrowers for temporary and emergency purposes, including the ability to meet future unanticipated or unusually large redemption requests. Effective January 22, 2010, the Fund renewed the Global Credit Facility, for a total of $750 Million, maturing January 21, 2011.
Under the terms of the Global Credit Facility, the Fund shall, in addition to interest charged on any borrowings made by the Fund and other costs incurred by the Fund, pay its share of fees and expenses incurred in connection with the implementation and maintenance of the Global Credit Facility, based upon its relative share of the aggregate net assets of all of the Borrowers, including an annual commitment fee of 0.10% based upon the unused portion of the Global Credit Facility, which is reflected in other expenses on the Statement of Operations. During the year ended December 31, 2009, the Fund did not utilize the Global Credit Facility.
FSC-20
Franklin Templeton Variable Insurance Products Trust
Notes to Financial Statements (continued)
Franklin Small-Mid Cap Growth Securities Fund
9. FAIR VALUE MEASUREMENTS
The Fund follows a fair value hierarchy that distinguishes between market data obtained from independent sources (observable inputs) and the Fund’s own market assumptions (unobservable inputs). These inputs are used in determining the value of the Fund’s investments and are summarized in the following fair value hierarchy:
| | • | | Level 1 – quoted prices in active markets for identical securities |
| | • | | Level 2 – other significant observable inputs (including quoted prices for similar securities, interest rates, prepayment speed, credit risk, etc.) |
| | • | | Level 3 – significant unobservable inputs (including the Fund’s own assumptions in determining the fair value of investments) |
The inputs or methodology used for valuing securities are not an indication of the risk associated with investing in those securities.
The following is a summary of the inputs used as of December 31, 2009, in valuing the Fund’s assets carried at fair value:
| | | | | | | | | | | | |
| | | Level 1 | | Level 2 | | Level 3 | | Total |
| | | |
Assets: | | | | | | | | | | | | |
Investments in Securities | | | | | | | | | | | | |
Equity Investmenta | | $ | 889,818,716 | | $ | — | | $ | — | | $ | 889,818,716 |
Convertible Bonds | | | — | | | 1,198,835 | | | — | | | 1,198,835 |
Short Term Investments | | | 13,641,054 | | | — | | | — | | | 13,641,054 |
| | | |
Total Investments in Securities | | $ | 903,459,770 | | $ | 1,198,835 | | $ | — | | $ | 904,658,605 |
| | | |
a For detailed industry descriptions, see the accompanying Statement of Investments.
10. NEW ACCOUNTING PRONOUNCEMENTS
In January 2010, the Financial Accounting Standards Board issued Accounting Standards Update (ASU) No. 2010-6, Fair Value Measurements and Disclosures (Topic 820): Improving Disclosures about Fair Value Measurements. ASU No. 2010-6 enhances and clarifies existing fair value measurement disclosure requirements and is effective for interim and annual periods beginning after December 15, 2009. The Fund is currently evaluating the impact, if any, of applying the provisions of ASU No. 2010-6.
11. SUBSEQUENT EVENTS
The Fund has evaluated subsequent events through February 10, 2010, the issuance date of the financial statements and determined that no events have occurred that require disclosure.
ABBREVIATIONS
Selected Portfolio
ADR - American Depository Receipt
FSC-21
Franklin Templeton Variable Insurance Products Trust
Franklin Small-Mid Cap Growth Securities Fund
Report of Independent Registered Public Accounting Firm
To the Board of Trustees and Shareholders of Franklin Templeton Variable Insurance Products Trust
In our opinion, the accompanying statement of assets and liabilities, including the statement of investments, and the related statements of operations and of changes in net assets and the financial highlights present fairly, in all material respects, the financial position of Franklin Small-Mid Cap Growth Securities Fund (one of the funds constituting the Franklin Templeton Variable Insurance Products Trust, hereafter referred to as the “Fund”) at December 31, 2009, the results of its operations for the year then ended, the changes in its net assets and the financial highlights for the periods presented, in conformity with accounting principles generally accepted in the United States of America. These financial statements and financial highlights (hereafter referred to as “financial statements”) are the responsibility of the Fund’s management. Our responsibility is to express an opinion on these financial statements based on our audits. We conducted our audits of these financial statements in accordance with the standards of the Public Company Accounting Oversight Board (United States). Those standards require that we plan and perform the audit to obtain reasonable assurance about whether the financial statements are free of material misstatement. An audit includes examining, on a test basis, evidence supporting the amounts and disclosures in the financial statements, assessing the accounting principles used and significant estimates made by management, and evaluating the overall financial statement presentation. We believe that our audits, which included confirmation of securities at December 31, 2009 by correspondence with the custodian and brokers, provide a reasonable basis for our opinion.
PricewaterhouseCoopers LLP
San Francisco, California
February 10, 2010
FSC-22
FRANKLIN STRATEGIC INCOME SECURITIES FUND
We are pleased to bring you Franklin Strategic Income Securities Fund’s annual report for the fiscal year ended December 31, 2009.
Performance Summary as of 12/31/09
Average annual total return of Class 4 shares* represents the average annual change in value, assuming reinvestment of dividends and capital gains. Average returns smooth out variations in returns, which can be significant; they are not the same as year-by-year results.
Periods ended 12/31/09
| | | | | | |
| | | 1-Year | | 5-Year | | 10-Year |
Average Annual Total Return | | +25.52% | | +5.48% | | +7.14% |
*For the period beginning 2/29/08, Class 4 performance reflects a 12b-1 fee expense of 0.35% per year, which affects future performance. Class 4 performance prior to 2/29/08 reflects historical Class 1 performance, which does not include a 12b-1 fee expense. Since 2/29/08 (effective date), the average annual total return of Class 4 shares was +5.76%.
Total Return Index Comparison
for a Hypothetical $10,000 Investment (1/1/00–12/31/09)
The graph below shows the change in value of a hypothetical $10,000 investment in the Fund over the indicated period and includes reinvestment of any income or distributions. The Fund’s performance* is compared to the performance of the Barclays Capital (BC) U.S. Aggregate Index and the Lipper Multi-Sector Income Funds Classification Average. One cannot invest directly in an index, and an index is not representative of the Fund’s portfolio. Please see Important Notes to Performance Information preceding the Fund Summaries.
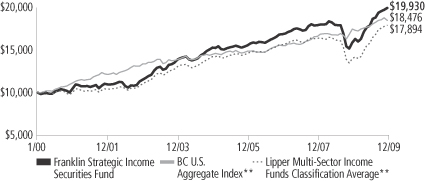
**Sources: © 2009 Morningstar; Lipper Inc. Please see Index Descriptions following the Fund Summaries.
Franklin Strategic Income Securities Fund – Class 4
Performance reflects the Fund’s Class 4 operating expenses, but does not include any contract fees, expenses or sales charges. If they had been included, performance would be lower. These charges and deductions, particularly for variable life policies, can have a significant effect on contract values and insurance benefits. See the contract prospectus for a complete description of these expenses, including sales charges.
Performance data represent past performance, which does not guarantee future results. Investment return and principal value will fluctuate, and you may have a gain or loss when you sell your shares. Current performance may differ from figures shown.
FSI-1
Fund Goals and Main Investments: Franklin Strategic Income Securities Fund seeks a high level of current income, with capital appreciation over the long term as a secondary goal. The Fund normally invests primarily to predominantly in U.S. and foreign debt securities, including those in emerging markets. Debt securities may be high yield and lower rated and include all varieties of fixed and floating rate income securities, including bonds, mortgage securities and other asset-backed and convertible securities.
Performance Overview
You can find the Fund’s one-year total return in the Performance Summary. Compared with its benchmarks for the same period, the Fund outperformed the BC U.S. Aggregate Index’s +5.93% total return, and underperformed the Lipper Multi-Sector Income Funds Classification Average’s +28.17% total return.1
Economic and Market Overview
The U.S. economy ended 2009 in much better shape than it began. Early in the period, the U.S. financial system was in crisis and consumer confidence fell to an all-time low. The financial system, however, avoided collapse, and financial markets stabilized in response to federal stimulus packages and the Federal Reserve Board’s (Fed’s) interventions.
Economic headwinds and benign inflation prompted policymakers to enact stimulus plans. During the period, the Fed kept the federal funds target rate in a range of 0% to 0.25%. The government implemented the American Recovery and Reinvestment Act, which included tax breaks, money for ailing state governments, aid to the poor and unemployed, and spending on infrastructure, renewable energy, health care and education. The Fed and U.S. Treasury Department also launched programs designed to shore up beleaguered banks’ capital, enable freer lending to businesses and consumers, help struggling home owners avoid foreclosure, and boost auto sales. Near period-end, the Fed assessed which of its support programs could be phased out.
In March, many investors reentered the stock market and started a rally that brought the major indexes off this cycle’s lows. Economic activity as measured by gross domestic product (GDP) turned from contraction to expansion. GDP registered annualized quarterly rates of -6.4%, -0.7%, 2.2% and an estimated 5.7% in 2009. These positive signs,
1. Sources: © 2009 Morningstar; Lipper Inc. One cannot invest directly in an index, and an index is not representative of the Fund’s portfolio. Please see Index Descriptions following the Fund Summaries.
Fund Risks: Because the Fund invests in bonds and other debt obligations, its share price and yield will be affected by interest rate movements. Bond prices generally move in the opposite direction of interest rates. Thus, as prices of bonds in the Fund adjust to a rise in interest rates, the Fund’s share price may decline. High yield, lower rated (junk) bonds generally have greater price swings and higher default risks than investment-grade bonds. Foreign investing, especially in emerging markets, involves additional risks, including currency fluctuations, economic instability, market volatility, and political and social instability. The Fund’s prospectus also includes a description of the main investment risks.
FSI-2
however, were constrained by a rising unemployment rate, which stood at 10.0% at period-end.2 Economic challenges remain, such as stalled consumer confidence and job prospects for the unemployed, as stimulus measures begin to wind down, but several reports pointed to a resumption of growth.
Many commodity prices generally rose as economic conditions improved. Oil prices moved up from $45 per barrel at the beginning of the period to $79 at year-end, still well below 2008 highs. Inflation remained muted, and December 2009’s inflation rate was an annualized 2.7.2 Core inflation, which excludes food and energy costs, rose at a 1.8% annualized rate, which was within the Fed’s informal target range of 1.5% to 2.0%.2 The core personal consumption expenditures price index reported a 12-month increase of 1.5%.3
The spread between two-year and 10-year Treasury yields increased to 271 basis points (100 basis points equal one percentage point) at the end of December from 149 basis points at the beginning of the reporting period. The two-year Treasury bill yield rose from 0.76% to 1.14% over the 12-month period, while the 10-year Treasury note yield rose from 2.25% to 3.85%.
After a dismal beginning, 2009 ended on a positive note for global financial markets. The extreme pessimism present at the height of the crisis early in the year subsided, fueling a general rally across risk assets. As the differences between economic conditions around the world became clearer later in the year, markets began to differentiate between currencies and securities. Early in the year, as the financial crisis reached its height, nearly all currencies sold off against the U.S. dollar, the Japanese yen and the Swiss franc, and sovereign credit spreads remained at historically wide levels. For much of the rest of the year, currency and credit exposures had a broad-based rally as the U.S. dollar fell and sovereign credit spreads declined from distressed levels. At year-end, particularly in December, the market began to price in a higher degree of differentiation, and the rally lost steam and many assets traded sideways.
One important outcome from the economic differentiation in December was the U.S. dollar’s rise against the Japanese yen. In December, a more optimistic outlook for the U.S. economy led government bond yields to rise. At the same time, Japanese domestic demand remained very weak, the economy was still in deflation, and prospects for interest rate hikes
2. Source: Bureau of Labor Statistics.
3. Source: Bureau of Economic Analysis.
FSI-3
Portfolio Breakdown
Franklin Strategic Income Securities Fund
Based on Total Net Assets
| | | | | |
| | | 12/31/09 | | | 12/31/08 |
| High Yield Corporate Bonds* | | 28.2% | | | 19.3% |
| Floating Rate Bank Loans** | | 14.2% | | | 11.3% |
| Investment Grade Corporate Bonds & Preferred Securities | | 13.4% | | | 15.2% |
| Other International Bonds (non-$US) | | 11.5% | | | 9.1% |
| Mortgages & Other Asset-Backed Bonds | | 10.2% | | | 21.9% |
| Emerging Market Bonds ($US) | | 6.1% | | | 3.9% |
| International Developed Country bonds (non-$US) | | 6.0% | | | 2.2% |
| U.S. Government & Agency Bonds*** | | 5.0% | | | 8.0% |
| Municipal Bonds | | 1.9% | | | 1.5% |
| Convertible Securities | | 0.0% | † | | 0.6% |
| Short-Term Investments & Other Net Assets†† | | 3.5% | | | 7.0% |
*Includes 0.19% of defaulted securities as of 12/31/09 and 0.15% as of 12/31/08.
**Includes 0.98% of defaulted securities as of 12/31/09 and 0.09% as of 12/31/08.
***Includes 2.4% Treasury Inflation Protected Securities as of 12/31/09 and 1.9% as of 12/31/08. Also includes agency preferred stock.
†Rounds to less than 0.1% of total net assets.
††Includes unrealized gains/losses on forward currency contracts. Does not include short-term foreign government securities.
The dollar value, number of shares or principal amount, and names of all portfolio holdings are listed in the Fund’s Statement of Investments.
were remote. This led to an increase in the interest rate differential between the U.S. and Japan, which favored the U.S. dollar.
A recovery in global trade, rebuilding of inventories and government spending during the year helped offset weakness in private consumption and investment. In the eurozone, third quarter gross domestic product improved relative to the second quarter but contracted 4.1% in annualized terms.4 The Dubai World debt standstill and Greece credit downgrade were the biggest headlines during the period, but other overleveraged credits also suffered. Investors recognized that these economies faced very difficult economic outlooks even as the global economy began to recover. In contrast, data from Asian emerging markets and certain developed and Latin American countries confirmed their economies were improving. Some economies experienced robust domestic demand, while others lacked sustainable growth drivers and continued to struggle with deleveraging. This differentiation favored some currencies and drove interest rates higher in certain economies.
4. Source: Eurostat.
FSI-4
Investment Strategy
We allocate our investments among the various types of debt available based on our assessment of changing economic, global market, industry and issuer conditions. We use a top-down analysis of macroeconomic trends, combined with a bottom-up fundamental analysis of market sectors, industries and issuers, seeking to take advantage of varying sector reactions to economic events. For example, we may evaluate business cycles, yield curves, country risk, and the relative interest rates among currencies, and values between and within markets. In selecting debt securities, we generally conduct our own analysis of the security’s intrinsic value rather than simply relying on the coupon rate or rating.
Manager’s Discussion
During 2009, global fixed income markets delivered strong performance, driven by a significant and broad credit market recovery. A combination of a rebound in global economic growth, led by many developing markets, a reopening in public credit markets, and historically cheap valuations in early 2009 drove unusually strong total return performance for many fixed income sectors. In this environment, Franklin Strategic Income Securities Fund outperformed the LB U.S. Aggregate Index and lagged the Lipper Multi-Sector Income Funds Classification Average. The Fund’s higher spread sector exposure and lower weightings in more U.S. interest-rate sensitive fixed income sectors (U.S. Treasuries, agency bonds and mortgage-backed securities) aided performance compared to the benchmark index. Compared with the peer average, the Fund’s lower exposure to certain higher beta sectors (such as high yield corporate bonds) and securities (including distressed bonds) hindered relative results.
During 2009, U.S. longer term interest rates rose and the yield curve steepened. As a result, U.S. Treasuries had negative returns. Agency debentures and mortgage-backed securities experienced some spread tightening relative to Treasuries and therefore posted positive total returns even with the rise in longer term rates. The Fund reduced its exposure to these more U.S. interest-rate sensitive sectors during the period, given the exceptionally low level of longer term interest rates. In this environment, Treasury Inflation Protected Securities (TIPS) significantly outperformed fixed-rate Treasuries, as inflation expectations rose along with improved prospects for U.S. economic growth. The Fund continued to hold a portion of its government bond exposure in TIPS during the period. Asset-backed securities (ABS) and commercial mortgage-backed securities (CMBS) also experienced significant spread
FSI-5
tightening during the year, aided by government programs that encouraged private investment in these securities. We reduced exposure to ABS given the price run-up in that sector, while generally maintaining our exposure to CMBS. The commercial real estate market’s fundamentals remained challenged going into 2010. However, we found what we believed was attractive relative value in certain CMBS while continuing to focus on the higher-tier tranches within these structures to reduce downside risks if property delinquencies increase. The Fund added to its municipal (tax-free) bond positions earlier in the period, but sold certain positions toward period-end given that sector’s spread tightening relative to Treasuries.
The corporate credit sector began its rebound in early 2009. For the full year, the investment-grade and noninvestment-grade markets posted one of their strongest annual returns, with high yield corporate bonds returning 54.22%, as measured by the Credit Suisse High Yield Index.1 Moreover, although year-over-year earnings remained down through 2009’s third quarter, fourth quarter comparisons were extremely positive. The outlook going into 2010 appeared more favorable to us given easing credit market conditions for refinancing and the significant cost cuts that many corporations instituted over the past couple years. We maintained positions in investment-grade and noninvestment-grade securities. However, we realized some gains by selling certain investment-grade corporate bond holdings toward period-end, and the Fund added exposure to the noninvestment-grade bank loan sector, due to the loans’ floating rate nature and what we viewed as still attractive valuations. Overall, the corporate bond sector contributed significantly to Fund performance during the fiscal year, and the Fund maintained significant exposure at period-end. We believed valuations generally still offered good long-term value, particularly considering the apparently improving outlook for corporate credit fundamentals.
During 2009, the U.S. dollar generally weakened versus a basket of foreign currencies. As a result, several of the Fund’s non-U.S. dollar bond and currency positions benefited performance. In particular, certain currencies experienced substantial gains versus the dollar. For example, the Fund’s local currency positions in South Korea, Brazil and Indonesia helped performance. The Fund added to its non-U.S. dollar exposure during the period, given an outlook that we believed favored currency appreciation, particularly in certain developing market countries. In addition, the Fund held a short position in the Japanese yen, given our outlook for Japan to have continued sub-par economic
FSI-6
growth relative to the U.S. Similar to the market’s other spread sectors, the Fund’s hard currency, U.S. dollar-denominated, emerging market sovereign positions performed well during 2009. Although by year-end, valuation levels had richened relative to longer term averages, the fundamental credit quality for many of these sovereign issuers had also improved significantly.
Thank you for your participation in Franklin Strategic Income Securities Fund. We look forward to serving your future investment needs.
The foregoing information reflects our analysis, opinions and portfolio holdings as of December 31, 2009, the end of the reporting period. The way we implement our main investment strategies and the resulting portfolio holdings may change depending on factors such as market and economic conditions. These opinions may not be relied upon as investment advice or an offer for a particular security. The information is not a complete analysis of every aspect of any market, country, industry, security or the Fund. Statements of fact are from sources considered reliable, but the investment manager makes no representation or warranty as to their completeness or accuracy. Although historical performance is no guarantee of future results, these insights may help you understand our investment management philosophy.
FSI-7
Fund Expenses
As an investor in a variable insurance contract (Contract) that indirectly provides for investment in an underlying mutual fund, you can incur transaction and/or ongoing expenses at both the Fund level and the Contract level.
| • | | Transaction expenses can include sales charges (loads) on purchases, redemption fees, surrender fees, transfer fees and premium taxes. |
| • | | Ongoing expenses can include management fees, distribution and service (12b-1) fees, contract fees, annual maintenance fees, mortality and expense risk fees and other fees and expenses. All mutual funds and Contracts have some types of ongoing expenses. |
The expenses shown in the table are meant to highlight ongoing expenses at the Fund level only and do not include ongoing expenses at the Contract level, or transaction expenses at either the Fund or Contract level. While the Fund does not have transaction expenses, if the transaction and ongoing expenses at the Contract level were included, the expenses shown below would be higher. You should consult your Contract prospectus or disclosure document for more information.
The table shows Fund-level ongoing expenses and can help you understand these expenses and compare them with those of other mutual funds offered through the Contract. The table assumes a $1,000 investment held for the six months indicated. Please refer to the Fund prospectus for additional information on operating expenses.
Actual Fund Expenses
The first line (Actual) of the table provides actual account values and expenses. The “Ending Account Value” is derived from the Fund’s actual return, which includes the effect of ongoing Fund expenses, but does not include the effect of ongoing Contract expenses.
You can estimate the Fund-level expenses you incurred during the period by following these steps. Of course, your account value and expenses will differ from those in this illustration:
| 1. | Divide your account value by $1,000. |
If an account had an $8,600 value, then $8,600 ÷ $1,000 = 8.6.
| 2. | Multiply the result by the number under the heading “Fund-Level Expenses Incurred During Period.” |
If Fund-Level Expenses Incurred During Period were $7.50, then 8.6 x $7.50 = $64.50.
In this illustration, the estimated expenses incurred this period at the Fund level are $64.50.
Franklin Strategic Income Securities Fund – Class 4
FSI-8
Hypothetical Example for Comparison with Other Mutual Funds
Information in the second line (Hypothetical) of the table can help you compare ongoing expenses of the Fund with those of other mutual funds offered through the Contract. This information may not be used to estimate the actual ending account balance or expenses you incurred during the period. The hypothetical “Ending Account Value” is based on the Fund’s actual expense ratio and an assumed 5% annual rate of return before expenses, which does not represent the Fund’s actual return. The figure under the heading “Fund-Level Expenses Incurred During Period” shows the hypothetical expenses your account would have incurred under this scenario. You can compare this figure with the 5% hypothetical examples that appear in shareholder reports of other funds offered through a Contract.
| | | | | | | | | |
| Class 4 | | Beginning
Account Value 7/1/09 | | Ending
Account
Value 12/31/09 | | Fund-Level Expenses Incurred
During Period* 7/1/09–12/31/09 |
Actual | | $ | 1,000 | | $ | 1,115.30 | | $ | 4.91 |
Hypothetical (5% return before expenses) | | $ | 1,000 | | $ | 1,020.57 | | $ | 4.69 |
*Expenses are calculated using the most recent six-month annualized expense ratio for the Fund’s Class 4 shares (0.92%), which does not include any ongoing expenses of the Contract for which the Fund is an investment option, multiplied by the average account value over the period, multiplied by 184/365 to reflect the one-half year period.
FSI-9
Franklin Templeton Variable Insurance Products Trust
Financial Highlights
Franklin Strategic Income Securities Fund
| | | | | | | | | | | | | | | | | | | | |
| | | Year Ended December 31, | |
| Class 1 | | 2009 | | | 2008 | | | 2007 | | | 2006 | | | 2005 | |
| | | | |
Per share operating performance | | | | | | | | | | | | | | | | | | | | |
(for a share outstanding throughout the year) | | | | | | | | | | | | | | | | | | | | |
Net asset value, beginning of year | | $ | 10.58 | | | $ | 12.78 | | | $ | 12.73 | | | $ | 12.43 | | | $ | 12.92 | |
| | | | |
Income from investment operationsa: | | | | | | | | | | | | | | | | | | | | |
Net investment incomeb | | | 0.70 | | | | 0.69 | | | | 0.73 | | | | 0.69 | | | | 0.65 | |
Net realized and unrealized gains (losses) | | | 1.95 | | | | (1.99 | ) | | | 0.04 | | | | 0.32 | | | | (0.44 | ) |
| | | | |
Total from investment operations | | | 2.65 | | | | (1.30 | ) | | | 0.77 | | | | 1.01 | | | | 0.21 | |
| | | | |
Less distributions from: | | | | | | | | | | | | | | | | | | | | |
Net investment income and net foreign currency gains | | | (0.95 | ) | | | (0.87 | ) | | | (0.68 | ) | | | (0.63 | ) | | | (0.60 | ) |
Net realized gains | | | — | | | | (0.03 | ) | | | (0.04 | ) | | | (0.08 | ) | | | (0.10 | ) |
| | | | |
Total distributions | | | (0.95 | ) | | | (0.90 | ) | | | (0.72 | ) | | | (0.71 | ) | | | (0.70 | ) |
| | | | |
Net asset value, end of year | | $ | 12.28 | | | $ | 10.58 | | | $ | 12.78 | | | $ | 12.73 | | | $ | 12.43 | |
| | | | |
| | | | | |
Total returnc | | | 26.11% | | | | (11.03)% | | | | 6.20% | | | | 8.51% | | | | 1.73% | |
Ratios to average net assets | | | | | | | | | | | | | | | | | | | | |
Expensesd | | | 0.58% | | | | 0.61% | | | | 0.62% | | | | 0.62% | | | | 0.66% | |
Net investment income | | | 6.13% | | | | 5.83% | | | | 5.72% | | | | 5.51% | | | | 5.21% | |
| | | | | |
Supplemental data | | | | | | | | | | | | | | | | | | | | |
Net assets, end of year (000’s) | | $ | 1,173,313 | | | $ | 903,358 | | | $ | 1,086,850 | | | $ | 902,071 | | | $ | 740,352 | |
Portfolio turnover rate | | | 56.19% | | | | 47.68% | | | | 46.88% | | | | 47.88% | | | | 40.56% | |
Portfolio turnover rate excluding mortgage dollar rollse | | | 56.19% | | | | 47.68% | | | | 46.43% | | | | 44.58% | | | | 40.07% | |
aThe amount shown for a share outstanding throughout the period may not correlate with the Statement of Operations for the period due to the timing of sales and repurchases of the Fund shares in relation to income earned and/or fluctuating market value of the investments of the Fund.
bBased on average daily shares outstanding.
cTotal return does not include any fees, charges or expenses imposed by the variable annuity and life insurance contracts for which the Franklin Templeton Variable Insurance Products Trust serves as an underlying investment vehicle.
dBenefit of expense reduction rounds to less than 0.01%.
eSee Note 1(e) regarding mortgage dollar rolls.
The accompanying notes are an integral part of these financial statements.
FSI-10
Franklin Templeton Variable Insurance Products Trust
Financial Highlights (continued)
Franklin Strategic Income Securities Fund
| | | | | | | | | | | | | | | | | | | | |
| | | Year Ended December 31, | |
| Class 2 | | 2009 | | | 2008 | | | 2007 | | | 2006 | | | 2005 | |
| | | | |
Per share operating performance | | | | | | | | | | | | | | | | | | | | |
(for a share outstanding throughout the year) | | | | | | | | | | | | | | | | | | | | |
Net asset value, beginning of year | | $ | 10.41 | | | $ | 12.60 | | | $ | 12.56 | | | $ | 12.27 | | | $ | 12.78 | |
| | | | |
Income from investment operationsa: | | | | | | | | | | | | | | | | | | | | |
Net investment incomeb | | | 0.66 | | | | 0.65 | | | | 0.69 | | | | 0.65 | | | | 0.61 | |
Net realized and unrealized gains (losses) | | | 1.91 | | | | (1.96 | ) | | | 0.05 | | | | 0.31 | | | | (0.44 | ) |
| | | | |
Total from investment operations | | | 2.57 | | | | (1.31 | ) | | | 0.74 | | | | 0.96 | | | | 0.17 | |
| | | | |
Less distributions from: | | | | | | | | | | | | | | | | | | | | |
Net investment income and net foreign currency gains | | | (0.93 | ) | | | (0.85 | ) | | | (0.66 | ) | | | (0.59 | ) | | | (0.58 | ) |
Net realized gains | | | — | | | | (0.03 | ) | | | (0.04 | ) | | | (0.08 | ) | | | (0.10 | ) |
| | | | |
Total distributions | | | (0.93 | ) | | | (0.88 | ) | | | (0.70 | ) | | | (0.67 | ) | | | (0.68 | ) |
| | | | |
Net asset value, end of year | | $ | 12.05 | | | $ | 10.41 | | | $ | 12.60 | | | $ | 12.56 | | | $ | 12.27 | |
| | | | |
| | | | | |
Total returnc | | | 25.75% | | | | (11.24)% | | | | 5.91% | | | | 8.24% | | | | 1.46% | |
Ratios to average net assets | | | | | | | | | | | | | | | | | | | | |
Expensesd | | | 0.83% | | | | 0.86% | | | | 0.87% | | | | 0.87% | | | | 0.91% | |
Net investment income | | | 5.88% | | | | 5.58% | | | | 5.47% | | | | 5.26% | | | | 4.96% | |
| | | | | |
Supplemental data | | | | | | | | | | | | | | | | | | | | |
Net assets, end of year (000’s) | | $ | 68,240 | | | $ | 33,155 | | | $ | 24,613 | | | $ | 11,753 | | | $ | 19,514 | |
Portfolio turnover rate | | | 56.19% | | | | 47.68% | | | | 46.88% | | | | 47.88% | | | | 40.56% | |
Portfolio turnover rate excluding mortgage dollar rollse | | | 56.19% | | | | 47.68% | | | | 46.43% | | | | 44.58% | | | | 40.07% | |
aThe amount shown for a share outstanding throughout the period may not correlate with the Statement of Operations for the period due to the timing of sales and repurchases of the Fund shares in relation to income earned and/or fluctuating market value of the investments of the Fund.
bBased on average daily shares outstanding.
cTotal return does not include any fees, charges or expenses imposed by the variable annuity and life insurance contracts for which the Franklin Templeton Variable Insurance Products Trust serves as an underlying investment vehicle.
dBenefit of expense reduction rounds to less than 0.01%.
eSee Note 1(e) regarding mortgage dollar rolls.
The accompanying notes are an integral part of these financial statements.
FSI-11
Franklin Templeton Variable Insurance Products Trust
Financial Highlights (continued)
Franklin Strategic Income Securities Fund
| | | | | | | | |
| | | Year Ended
December 31, | |
| Class 4 | | 2009 | | | 2008a | |
| | | | |
Per share operating performance | | | | | | | | |
(for a share outstanding throughout the year) | | | | | | | | |
Net asset value, beginning of year | | $ | 10.54 | | | $ | 12.84 | |
| | | | |
Income from investment operationsb: | | | | | | | | |
Net investment incomec | | | 0.66 | | | | 0.53 | |
Net realized and unrealized gains (losses) | | | 1.94 | | | | (1.93 | ) |
| | | | |
Total from investment operations | | | 2.60 | | | | (1.40 | ) |
| | | | |
Less distributions from: | | | | | | | | |
Net investment income and net foreign currency gains | | | (0.94 | ) | | | (0.87 | ) |
Net realized gains | | | — | | | | (0.03 | ) |
| | | | |
Total distributions | | | (0.94 | ) | | | (0.90 | ) |
| | | | |
Net asset value, end of year | | $ | 12.20 | | | $ | 10.54 | |
| | | | |
| | |
Total returnd | | | 25.52% | | | | (11.69)% | |
Ratios to average net assetse | | | | | | | | |
Expensesf | | | 0.93% | | | | 0.96% | |
Net investment income | | | 5.78% | | | | 5.48% | |
| | |
Supplemental data | | | | | | | | |
Net assets, end of year (000’s) | | $ | 162,074 | | | $ | 59,766 | |
Portfolio turnover rate | | | 56.19% | | | | 47.68% | |
aFor the period February 29, 2008 (effective date) to December 31, 2008.
bThe amount shown for a share outstanding throughout the period may not correlate with the Statement of Operations for the period due to the timing of sales and repurchases of the Fund shares in relation to income earned and/or fluctuating market value of the investments of the Fund.
cBased on average daily shares outstanding.
dTotal return does not include any fees, charges or expenses imposed by the variable annuity and life insurance contracts for which the Franklin Templeton Variable Insurance Products Trust serves as an underlying investment vehicle. Total Return is not annualized for periods less than one year.
eRatios are annualized for periods less than one year.
fBenefit of expense reduction rounds to less than 0.01%.
The accompanying notes are an integral part of these financial statements.
FSI-12
Franklin Templeton Variable Insurance Products Trust
Statement of Investments, December 31, 2009
| | | | | | | |
| Franklin Strategic Income Securities Fund | | Country/
Organization | | Shares | | Value |
Common Stocks (Cost $246,048) 0.0%a | | | | | | | |
Media 0.0%a | | | | | | | |
bCharter Communications Inc., A | | United States | | 7,456 | | $ | 264,688 |
| | | | | | | |
Convertible Preferred Stocks (Cost $2,200,000) 0.0%a | | | | | | | |
Banks 0.0%a | | | | | | | |
bFannie Mae, 8.75%, cvt. pfd. | | United States | | 44,000 | | | 75,680 |
| | | | | | | |
Preferred Stocks 0.1% | | | | | | | |
Banks 0.0%a | | | | | | | |
bFreddie Mac, 8.375%, pfd., Z | | United States | | 70,000 | | | 73,500 |
| | | | | | | |
Diversified Financials 0.1% | | | | | | | |
cGMAC Inc., 7.00%, pfd., 144A | | United States | | 804 | | | 529,987 |
| | | | | | | |
Total Preferred Stocks (Cost $2,035,420) | | | | | | | 603,487 |
| | | | | | | |
| | | |
| | | | | Principal
Amountd | | |
e,fSenior Floating Rate Interests 14.2% | | | | | | | |
Automobiles & Components 0.5% | | | | | | | |
gFederal-Mogul Corp., | | | | | | | |
Term Loan B, 2.168%, 12/27/14 | | United States | | 6,360,436 | | | 5,358,667 |
Term Loan C, 2.168%, 12/27/15 | | United States | | 1,285,990 | | | 1,083,447 |
| | | | | | | |
| | | | | | | 6,442,114 |
| | | | | | | |
Capital Goods 0.6% | | | | | | | |
RBS Global Inc. (Rexnord), | | | | | | | |
Incremental Tranche B-2, 2.50%, 7/22/13 | | United States | | 2,332,872 | | | 2,165,682 |
Tranche B-1 Term Loan B, 2.75% - 2.813%, 7/22/13 | | United States | | 4,061,406 | | | 3,835,491 |
TransDigm Inc., Term Loan B, 2.249%, 6/23/13 | | United States | | 2,726,867 | | | 2,623,635 |
| | | | | | | |
| | | | | | | 8,624,808 |
| | | | | | | |
Commercial & Professional Services 0.9% | | | | | | | |
ARAMARK Corp., | | | | | | | |
Synthetic L/C, 2.113%, 1/26/14 | | United States | | 425,163 | | | 404,170 |
Term Loan B, 2.126%, 1/26/14 | | United States | | 6,464,881 | | | 6,145,677 |
Duratek Inc. (EnergySolutions), Term Loan B, 4.01%, 6/07/13 | | United States | | 1,111,391 | | | 1,087,774 |
EnergySolutions LLC, | | | | | | | |
Synthetic A Deposit, 3.99%, 6/07/13 | | United States | | 44,385 | | | 43,165 |
Synthetic L/C, 3.99%, 6/07/13 | | United States | | 165,084 | | | 160,544 |
Term Loan B, 4.01%, 6/07/13 | | United States | | 2,316,482 | | | 2,267,257 |
hEnviroSolutions Inc., Initial Term Loan, PIK, 12.00%, 7/07/12 | | United States | | 1,627,616 | | | 1,204,436 |
gJohnsonDiversey Inc., Tranche B Dollar Term Loan, 5.50%, 11/24/15 | | United States | | 902,925 | | | 911,390 |
| | | | | | | |
| | | | | | | 12,224,413 |
| | | | | | | |
Consumer Durables & Apparel 0.3% | | | | | | | |
Jarden Corp., | | | | | | | |
Term Loan B1, 2.001%, 1/24/12 | | United States | | 101,353 | | | 97,869 |
Term Loan B2, 2.001%, 1/24/12 | | United States | | 868,752 | | | 840,518 |
Term Loan B4, 3.501%, 1/26/15 | | United States | | 2,019,099 | | | 2,003,451 |
Jostens IH Corp. (Visant Holding Corp.), Term Loan C, 2.235%, 10/04/11 | | United States | | 1,650,997 | | | 1,617,564 |
| | | | | | | |
| | | | | | | 4,559,402 |
| | | | | | | |
Consumer Services 0.9% | | | | | | | |
Education Management LLC, Term Loan C, 2.063%, 6/01/13 | | United States | | 5,054,079 | | | 4,758,203 |
h,iKuilima Resort Co. (Turtle Bay), First Lien Term Loan, PIK, 9.00%, 9/30/10 | | United States | | 12,942,153 | | | 3,774,799 |
FSI-13
Franklin Templeton Variable Insurance Products Trust
Statement of Investments, December 31, 2009 (continued)
| | | | | | | |
| Franklin Strategic Income Securities Fund | | Country/
Organization | | Principal
Amountd | | Value |
e,fSenior Floating Rate Interests (continued) | | | | | | | |
Consumer Services (continued) | | | | | | | |
Penn National Gaming Inc., Term Loan B, 1.98% - 2.03%, 10/03/12 | | United States | | 4,326,792 | | $ | 4,200,367 |
| | | | | | | |
| | | | | | | 12,733,369 |
| | | | | | | |
Food & Staples Retailing 0.6% | | | | | | | |
SUPERVALU Inc., Term Loan B, 1.531%, 6/02/12 | | United States | | 3,975,064 | | | 3,830,734 |
Wm. Wrigley Jr. Co., | | | | | | | |
gTerm Loan B, 5.75%, 10/06/14 | | United States | | 410,736 | | | 410,736 |
Term Loan B1, 3.063%, 12/17/12 | | United States | | 1,908,195 | | | 1,910,069 |
Term Loan B2, 3.313%, 10/06/14 | | United States | | 2,671,473 | | | 2,678,472 |
| | | | | | | |
| | | | | | | 8,830,011 |
| | | | | | | |
Food, Beverage & Tobacco 0.2% | | | | | | | |
Constellation Brands Inc., Term Loan B, 1.75%, 6/05/13 | | United States | | 1,095,540 | | | 1,060,756 |
Dean Foods Co., Term Loan B, 1.615% - 1.635%, 4/02/14 | | United States | | 1,753,959 | | | 1,675,657 |
Del Monte Foods Co., Term Loan B, 1.732% - 1.781%, 2/08/12 | | United States | | 377,425 | | | 375,538 |
| | | | | | | |
| | | | | | | 3,111,951 |
| | | | | | | |
Health Care Equipment & Services 2.0% | | | | | | | |
Community Health Systems Inc., | | | | | | | |
Delayed Draw Term Loan, 2.506%, 7/25/14 | | United States | | 401,686 | | | 379,705 |
Term Loan, 2.506%, 7/25/14 | | United States | | 7,857,651 | | | 7,427,665 |
gDaVita Inc., Term Loan B-1, 1.74% - 1.79%, 10/05/12 | | United States | | 2,951,253 | | | 2,871,735 |
DJO Finance LLC, Term Loan B, 3.231%, 5/20/14 | | United States | | 4,965,220 | | | 4,695,236 |
Fresenius Medical Care Holdings Inc., Term Loan B, 1.626% - 1.659%, 3/31/13 | | Germany | | 1,748,422 | | | 1,685,478 |
HCA Inc., | | | | | | | |
Term Loan A-1, 1.501%, 11/19/12 | | United States | | 1,508,562 | | | 1,444,028 |
Term Loan B-1, 2.501%, 11/18/13 | | United States | | 6,214,685 | | | 5,948,230 |
gLifePoint Hospitals Inc., Term Loan B, 1.887%, 4/15/12 | | United States | | 3,691,186 | | | 3,585,832 |
| | | | | | | |
| | | | | | | 28,037,909 |
| | | | | | | |
Insurance 0.3% | | | | | | | |
gConseco Inc., Term Loan, 7.50%, 10/10/13 | | United States | | 4,577,331 | | | 4,344,652 |
| | | | | | | |
Materials 2.3% | | | | | | | |
Ashland Inc., Term Loan B, 7.65%, 5/13/14 | | United States | | 4,049,218 | | | 4,117,042 |
Celanese U.S. Holdings LLC, Dollar Term Loan, 2.037%, 4/02/14 | | United States | | 5,649,440 | | | 5,373,244 |
Georgia-Pacific LLC, | | | | | | | |
Term Loan B, 2.251% - 2.256%, 12/20/12 | | United States | | 1,469,473 | | | 1,423,184 |
Term Loan C, 3.481% - 3.506%, 12/23/14 | | United States | | 1,833,200 | | | 1,829,076 |
gHexion Specialty Chemicals BV, Term Loan C-2, 2.563%, 5/03/13 | | Netherlands | | 1,211,898 | | | 1,060,411 |
gHexion Specialty Chemicals Inc., Term Loan C-1, 2.563%, 5/03/13 | | United States | | 5,591,875 | | | 4,892,890 |
Nalco Co., | | | | | | | |
Term Loan, 6.50%, 5/13/16 | | United States | | 3,072,347 | | | 3,120,737 |
Term Loan B, 2.063%, 11/04/10 | | United States | | 405,869 | | | 406,339 |
Novelis Corp., U.S. Term Loan, 2.24% - 2.26%, 7/07/14 | | United States | | 2,387,802 | | | 2,189,103 |
Rockwood Specialties Group Inc., Term Loan H, 6.00%, 5/15/14 | | United States | | 6,940,270 | | | 7,027,024 |
| | | | | | | |
| | | | | | | 31,439,050 |
| | | | | | | |
Media 2.9% | | | | | | | |
gCinemark USA Inc., Term Loan, 1.99% - 2.04%, 10/05/13 | | United States | | 2,336,671 | | | 2,230,687 |
CSC Holdings Inc. (Cablevision), Incremental Term Loan B-2, 2.004% - 2.046%, 3/29/16 | | United States | | 7,679,731 | | | 7,527,734 |
FSI-14
Franklin Templeton Variable Insurance Products Trust
Statement of Investments, December 31, 2009 (continued)
| | | | | | | |
| Franklin Strategic Income Securities Fund | | Country/
Organization | | Principal
Amountd | | Value |
e,fSenior Floating Rate Interests (continued) | | | | | | | |
Media (continued) | | | | | | | |
DIRECTV Holdings LLC, Term Loan B, 1.731%, 4/13/13 | | United States | | 1,086,809 | | $ | 1,063,545 |
Discovery Communications Inc., Term Loan B, 2.251%, 5/14/14 | | United States | | 977,591 | | | 956,206 |
g,iMetro-Goldwyn-Mayer Inc., Term Loan B, 20.50%, 4/08/12 | | United States | | 7,172,125 | | | 4,638,830 |
gR.H. Donnelley Inc., | | | | | | | |
Term Loan D-1, 6.00%, 6/30/11 | | United States | | 1,921,018 | | | 1,764,935 |
Term Loan D-2, 6.75%, 6/30/11 | | United States | | 3,547,965 | | | 3,257,032 |
Regal Cinemas Corp., Term Loan, 4.001%, 10/27/13 | | United States | | 2,039,554 | | | 2,036,581 |
g,iTribune Co., Incremental Term Loan, 5.25%, 5/14/14 | | United States | | 10,218,372 | | | 5,300,780 |
gUnivision Communications Inc., Initial Term Loan, 2.501%, 9/29/14 | | United States | | 6,362,520 | | | 5,551,298 |
UPC Financing Partnership, | | | | | | | |
Term Loan N, 1.985%, 12/31/14 | | Netherlands | | 2,875,426 | | | 2,701,103 |
Term Loan T, 3.735%, 12/31/16 | | Netherlands | | 2,892,130 | | | 2,816,573 |
| | | | | | | |
| | | | | | | 39,845,304 |
| | | | | | | |
Pharmaceuticals, Biotechnology & Life Sciences 0.5% | | | | | | | |
Mylan Inc., Term Loan B, 3.50% - 3.563%, 10/02/14 | | United States | | 6,938,964 | | | 6,797,152 |
| | | | | | | |
Retailing 0.3% | | | | | | | |
Dollar General Corp., Tranche B-1 Term Loan, 2.981% - 3.031%, 7/07/14 | | United States | | 4,897,147 | | | 4,742,887 |
| | | | | | | |
Software & Services 0.3% | | | | | | | |
Affiliated Computer Services Inc., Additional Term Loan, 2.231% - 2.234%, 3/20/13 | | United States | | 1,349,475 | | | 1,342,162 |
Lender Processing Services Inc., Term Loan B, 2.731%, 7/02/14 | | United States | | 1,290,161 | | | 1,281,291 |
SunGard Data Systems Inc., Tranche A U.S. Term Loan, 1.985%, 2/28/14 | | United States | | 2,219,042 | | | 2,104,275 |
| | | | | | | |
| | | | | | | 4,727,728 |
| | | | | | | |
Telecommunication Services 0.6% | | | | | | | |
Intelsat Corp. (Panamsat),
Tranche B-2-A, 2.735%, 1/03/14 | | United States | | 1,805,355 | | | 1,705,779 |
Tranche B-2-B, 2.735%, 1/03/14 | | United States | | 1,804,802 | | | 1,705,256 |
Tranche B-2-C, 2.735%, 1/03/14 | | United States | | 1,804,802 | | | 1,705,257 |
Incremental Term Loan B-2-A, 2.735%, 1/03/14 | | United States | | 96,459 | | | 91,139 |
Incremental Term Loan B-2-B, 2.735%, 1/03/14 | | United States | | 96,430 | | | 91,111 |
Incremental Term Loan B-2-C, 2.735%, 1/03/14 | | United States | | 96,430 | | | 91,111 |
NTELOS Inc., Term Loan B, 5.75%, 8/07/15 | | United States | | 1,492,571 | | | 1,505,630 |
Windstream Corp., Tranche B-2 Term Loan, 3.00%, 12/17/15 | | United States | | 1,748,073 | | | 1,709,055 |
| | | | | | | |
| | | | | | | 8,604,338 |
| | | | | | | |
Utilities 1.0% | | | | | | | |
gNRG Energy Inc.,
Credit Link, 2.001%, 2/01/13 | | United States | | 2,738,819 | | | 2,612,491 |
Term Loan, 1.981% - 2.001%, 2/01/13 | | United States | | 4,732,312 | | | 4,514,034 |
gTexas Competitive Electric Holdings Co. LLC, Term Loan B-2,
3.735% - 3.751%, 10/10/14 | | United States | | 7,718,308 | | | 6,304,893 |
| | | | | | | |
| | | | | | | 13,431,418 |
| | | | | | | |
Total Senior Floating Rate Interests (Cost $193,384,351) | | | | | | | 198,496,506 |
| | | | | | | |
Corporate Bonds 41.5% | | | | | | | |
Automobiles & Components 0.7% | | | | | | | |
cAmerican Axle & Manufacturing Holdings Inc., senior secured note, 144A, 1/15/17 | | United States | | 900,000 | | | 918,000 |
Ford Motor Credit Co. LLC, senior note,
9.875%, 8/10/11 | | United States | | 3,500,000 | | | 3,675,000 |
7.50%, 8/01/12 | | United States | | 2,500,000 | | | 2,522,598 |
cTRW Automotive Inc., senior note, 144A, 7.25%, 3/15/17 | | United States | | 2,900,000 | | | 2,827,500 |
| | | | | | | |
| | | | | | | 9,943,098 |
| | | | | | | |
FSI-15
Franklin Templeton Variable Insurance Products Trust
Statement of Investments, December 31, 2009 (continued)
| | | | | | | | |
| Franklin Strategic Income Securities Fund | | Country/
Organization | | Principal
Amountd | | | Value |
Corporate Bonds (continued) | | | | | | | | |
Banks 2.0% | | | | | | | | |
BB&T Capital Trust IV, junior sub. bond, 6.82%, 6/12/77 | | United States | | 3,300,000 | | | $ | 2,991,626 |
c,jBNP Paribas, 144A, 7.195%, Perpetual | | France | | 3,300,000 | | | | 3,069,000 |
Discover Bank, sub. note, 8.70%, 11/18/19 | | United States | | 3,200,000 | | | | 3,434,064 |
Regions Financial Corp., senior note, 7.75%, 11/10/14 | | United States | | 3,300,000 | | | | 3,257,763 |
Royal Bank of Scotland Group PLC, senior note, 6.40%, 10/21/19 | | United Kingdom | | 3,900,000 | | | | 3,866,558 |
Svensk Exportkredit AB, senior note, 7.625%, 6/30/14 | | Sweden | | 1,335,000 | NZD | | | 1,030,571 |
UBS AG Stamford, senior note, 5.875%, 12/20/17 | | United States | | 3,300,000 | | | | 3,396,746 |
Wells Fargo & Co., senior note, 5.625%, 12/11/17 | | United States | | 1,500,000 | | | | 1,562,726 |
jWells Fargo Capital XIII, pfd., 7.70%, Perpetual | | United States | | 2,900,000 | | | | 2,827,500 |
jWells Fargo Capital XV, pfd., 9.75%, Perpetual | | United States | | 2,300,000 | | | | 2,472,500 |
| | | | | | | | |
| | | | | | | | 27,909,054 |
| | | | | | | | |
Capital Goods 1.3% | | | | | | | | |
cAllison Transmission Inc., senior note, 144A, 11.00%, 11/01/15 | | United States | | 3,200,000 | | | | 3,376,000 |
Case New Holland Inc., senior note,
7.125%, 3/01/14 | | United States | | 3,200,000 | | | | 3,264,000 |
c144A, 7.75%, 9/01/13 | | United States | | 500,000 | | | | 513,750 |
Greenbrier Cos. Inc., senior note, 8.375%, 5/15/15 | | United States | | 1,100,000 | | | | 914,375 |
L-3 Communications Corp., senior sub. note,
5.875%, 1/15/15 | | United States | | 2,000,000 | | | | 2,007,500 |
6.375%, 10/15/15 | | United States | | 1,000,000 | | | | 1,008,750 |
RBS Global & Rexnord Corp., senior note, 9.50%, 8/01/14 | | United States | | 3,700,000 | | | | 3,727,750 |
RSC Equipment Rental Inc., senior note, 9.50%, 12/01/14 | | United States | | 3,700,000 | | | | 3,723,125 |
| | | | | | | | |
| | | | | | | | 18,535,250 |
| | | | | | | | |
Commercial & Professional Services 0.6% | | | | | | | | |
ARAMARK Corp., senior note, 8.50%, 2/01/15 | | United States | | 3,400,000 | | | | 3,519,000 |
cCasella Waste Systems Inc., senior secured note, 144A, 11.00%, 7/15/14 | | United States | | 1,400,000 | | | | 1,522,500 |
Clean Harbors Inc., senior secured note, 7.625%, 8/15/16 | | United States | | 800,000 | | | | 815,000 |
Iron Mountain Inc., senior sub. note, 8.75%, 7/15/18 | | United States | | 600,000 | | | | 625,500 |
c,hJohnsonDiversey Holdings Inc., senior note, 144A, PIK, 10.50%, 5/15/20 | | United States | | 2,400,000 | | | | 2,424,000 |
| | | | | | | | |
| | | | | | | | 8,906,000 |
| | | | | | | | |
Consumer Durables & Apparel 0.8% | | | | | | | | |
Jarden Corp., senior sub. note, 7.50%, 5/01/17 | | United States | | 3,400,000 | | | | 3,408,500 |
Jostens IH Corp., senior sub. note, 7.625%, 10/01/12 | | United States | | 3,700,000 | | | | 3,737,000 |
KB Home, senior note,
6.25%, 6/15/15 | | United States | | 2,000,000 | | | | 1,875,000 |
7.25%, 6/15/18 | | United States | | 500,000 | | | | 477,500 |
cNorcraft Cos. LP, senior secured note, 144A, 10.50%, 12/15/15 | | United States | | 1,100,000 | | | | 1,133,000 |
| | | | | | | | |
| | | | | | | | 10,631,000 |
| | | | | | | | |
Consumer Services 2.2% | | | | | | | | |
c,iFontainebleau Las Vegas, 144A, 10.25%, 6/15/15 | | United States | | 2,500,000 | | | | 37,500 |
cHarrah’s Operating Co. Inc., senior secured note, 144A, 11.25%, 6/01/17 | | United States | | 1,500,000 | | | | 1,576,875 |
cHarrah’s Operating Escrow, senior secured note, 144A, 11.25%, 6/01/17 | | United States | | 4,000,000 | | | | 4,205,000 |
Host Hotels & Resorts LP, senior note,
K, 7.125%, 11/01/13 | | United States | | 2,300,000 | | | | 2,348,875 |
M, 7.00%, 8/15/12 | | United States | | 1,100,000 | | | | 1,123,375 |
S, 6.875%, 11/01/14 | | United States | | 200,000 | | | | 202,250 |
MGM MIRAGE, senior note, 6.625%, 7/15/15 | | United States | | 5,400,000 | | | | 4,225,500 |
cNew York City IDA, 144A, 11.00%, 3/01/29 | | United States | | 600,000 | | | | 666,948 |
cNorwegian Cruise Line Ltd., senior secured note, 144A, 11.75%, 11/15/16 | | United States | | 3,300,000 | | | | 3,250,500 |
FSI-16
Franklin Templeton Variable Insurance Products Trust
Statement of Investments, December 31, 2009 (continued)
| | | | | | | | |
| Franklin Strategic Income Securities Fund | | Country/
Organization | | Principal
Amountd | | | Value |
Corporate Bonds (continued) | | | | | | | | |
Consumer Services (continued) | | | | | | | | |
Pinnacle Entertainment Inc.,
csenior note, 144A, 8.625%, 8/01/17 | | United States | | 2,400,000 | | | $ | 2,460,000 |
senior sub. note, 7.50%, 6/15/15 | | United States | | 900,000 | | | | 832,500 |
senior sub. note, 8.25%, 3/15/12 | | United States | | 129,000 | | | | 129,645 |
Royal Caribbean Cruises Ltd., senior deb., 7.25%, 3/15/18 | | United States | | 3,300,000 | | | | 3,085,500 |
Starwood Hotels & Resorts Worldwide Inc., senior note,
6.75%, 5/15/18 | | United States | | 3,500,000 | | | | 3,526,250 |
7.15%, 12/01/19 | | United States | | 500,000 | | | | 500,625 |
iStation Casinos Inc.,
senior note, 6.00%, 4/01/12 | | United States | | 700,000 | | | | 109,375 |
senior note, 7.75%, 8/15/16 | | United States | | 1,000,000 | | | | 161,250 |
senior sub. note, 6.50%, 2/01/14 | | United States | | 300,000 | | | | 3,000 |
senior sub. note, 6.875%, 3/01/16 | | United States | | 1,000,000 | | | | 10,000 |
cUniversal City Development,
senior note, 144A, 8.875%, 11/15/15 | | United States | | 2,000,000 | | | | 1,967,500 |
senior sub. note, 144A, 10.875%, 11/15/16 | | United States | | 400,000 | | | | 403,000 |
| | | | | | | | |
| | | | | | | | 30,825,468 |
| | | | | | | | |
Diversified Financials 4.6% | | | | | | | | |
American Express Co., senior note, 7.00%, 3/19/18 | | United States | | 2,000,000 | | | | 2,206,022 |
American Express Credit Corp., senior note, C, 7.30%, 8/20/13 | | United States | | 1,200,000 | | | | 1,349,742 |
Bank of America Corp., | | | | | | | | |
jpfd., sub. bond, M, 8.125%, Perpetual | | United States | | 5,000,000 | | | | 4,819,950 |
senior note, 5.65%, 5/01/18 | | United States | | 1,500,000 | | | | 1,525,931 |
cCantor Fitzgerald LP, 144A, 7.875%, 10/15/19 | | United States | | 2,500,000 | | | | 2,450,732 |
Capital One Capital V, pfd., 10.25%, 8/15/39 | | United States | | 1,700,000 | | | | 1,981,376 |
Capital One Financial Corp., senior note, 7.375%, 5/23/14 | | United States | | 2,400,000 | | | | 2,719,932 |
Citigroup Inc., | | | | | | | | |
senior note, 6.125%, 11/21/17 | | United States | | 1,800,000 | | | | 1,817,165 |
senior note, 8.125%, 7/15/39 | | United States | | 2,000,000 | | | | 2,293,280 |
sub. note, 5.00%, 9/15/14 | | United States | | 3,000,000 | | | | 2,895,048 |
The Export-Import Bank of Korea, senior note, 8.125%, 1/21/14 | | South Korea | | 2,770,000 | | | | 3,218,477 |
General Electric Capital Corp., senior note, A, 8.50%, 4/06/18 | | United States | | 64,000,000 | MXN | | | 4,433,558 |
cGMAC LLC, senior note, 144A, | | | | | | | | |
7.25%, 3/02/11 | | United States | | 1,583,000 | | | | 1,583,000 |
6.875%, 9/15/11 | | United States | | 1,400,000 | | | | 1,393,000 |
6.875%, 8/28/12 | | United States | | 2,000,000 | | | | 1,980,000 |
The Goldman Sachs Group Inc., | | | | | | | | |
senior note, 6.00%, 5/01/14 | | United States | | 300,000 | | | | 328,444 |
sub. note, 6.75%, 10/01/37 | | United States | | 3,700,000 | | | | 3,815,251 |
Jefferies Group Inc., senior bond, 8.50%, 7/15/19 | | United States | | 4,000,000 | | | | 4,379,756 |
JPMorgan Chase & Co., | | | | | | | | |
6.00%, 1/15/18 | | United States | | 1,500,000 | | | | 1,615,073 |
jjunior sub. note, 1, 7.90%, Perpetual | | United States | | 1,800,000 | | | | 1,862,701 |
JPMorgan Chase Capital XXII, sub. bond, 6.45%, 2/02/37 | | United States | | 4,500,000 | | | | 4,142,362 |
iLehman Brothers Holdings Inc., senior note, 6.20%, 9/26/14 | | United States | | 5,500,000 | | | | 1,100,000 |
Merrill Lynch & Co. Inc., senior note, 6.40%, 8/28/17 | | United States | | 3,500,000 | | | | 3,672,477 |
Morgan Stanley, senior note, 6.00%, 4/28/15 | | United States | | 4,000,000 | | | | 4,265,736 |
cTVN Finance Corp. PLC, senior note, 144A, 10.75%, 11/15/17 | | Poland | | 1,500,000 | EUR | | | 2,238,430 |
c,hWind Acquisition Holding, senior note, 144A, PIK, 12.25%, 7/15/17 | | Italy | | 500,000 | EUR | | | 684,114 |
| | | | | | | | |
| | | | | | | | 64,771,557 |
| | | | | | | | |
FSI-17
Franklin Templeton Variable Insurance Products Trust
Statement of Investments, December 31, 2009 (continued)
| | | | | | | |
| Franklin Strategic Income Securities Fund | | Country/
Organization | | Principal
Amountd | | Value |
Corporate Bonds (continued) | | | | | | | |
Energy 5.9% | | | | | | | |
Anadarko Petroleum Corp., senior note, 6.95%, 6/15/19 | | United States | | 2,300,000 | | $ | 2,612,846 |
cAntero Resources Finance, senior note, 144A, 9.375%, 12/01/17 | | United States | | 1,600,000 | | | 1,640,000 |
cArch Coal Inc., senior note, 144A, 8.75%, 8/01/16 | | United States | | 600,000 | | | 637,500 |
Berry Petroleum Co., senior note, 10.25%, 6/01/14 | | United States | | 2,200,000 | | | 2,403,500 |
Chesapeake Energy Corp., senior note, | | | | | | | |
7.625%, 7/15/13 | | United States | | 700,000 | | | 736,750 |
6.625%, 1/15/16 | | United States | | 100,000 | | | 99,500 |
6.25%, 1/15/18 | | United States | | 4,000,000 | | | 3,860,000 |
7.25%, 12/15/18 | | United States | | 300,000 | | | 303,750 |
Compagnie Generale de Geophysique-Veritas, senior note, | | | | | | | |
7.50%, 5/15/15 | | France | | 2,300,000 | | | 2,294,250 |
c144A, 9.50%, 5/15/16 | | France | | 100,000 | | | 104,492 |
7.75%, 5/15/17 | | France | | 900,000 | | | 897,750 |
Concho Resources Inc., senior note, 8.625%, 10/01/17 | | United States | | 1,200,000 | | | 1,266,000 |
Copano Energy LLC, senior note, | | | | | | | |
8.125%, 3/01/16 | | United States | | 3,500,000 | | | 3,552,500 |
7.75%, 6/01/18 | | United States | | 200,000 | | | 201,500 |
El Paso Corp., senior note, | | | | | | | |
12.00%, 12/12/13 | | United States | | 3,100,000 | | | 3,650,250 |
7.00%, 6/15/17 | | United States | | 900,000 | | | 897,113 |
Enterprise Products Operating LLC, | | | | | | | |
5.25%, 1/31/20 | | United States | | 1,300,000 | | | 1,288,476 |
ejunior sub. note, FRN, 7.034%, 1/15/68 | | United States | | 3,400,000 | | | 3,124,141 |
cExpro Finance Luxembourg, senior secured note, 144A, 8.50%, 12/15/16 | | United Kingdom | | 2,600,000 | | | 2,558,920 |
cGeneral Maritime Corp., senior note, 144A, 12.00%, 11/15/17 | | United States | | 2,100,000 | | | 2,197,125 |
cHolly Corp., senior note, 144A, 9.875%, 6/15/17 | | United States | | 1,000,000 | | | 1,057,500 |
Mariner Energy Inc., senior note, | | | | | | | |
7.50%, 4/15/13 | | United States | | 2,900,000 | | | 2,900,000 |
11.75%, 6/30/16 | | United States | | 500,000 | | | 560,000 |
MarkWest Energy Partners LP, senior note, 6.875%, 11/01/14 | | United States | | 3,200,000 | | | 3,072,000 |
cOPTI Canada Inc., senior secured note, 144A, 9.00%, 12/15/12 | | Canada | | 1,000,000 | | | 1,027,500 |
Peabody Energy Corp., senior note, B, 6.875%, 3/15/13 | | United States | | 3,400,000 | | | 3,455,250 |
Petrohawk Energy Corp., senior note, 10.50%, 8/01/14 | | United States | | 3,300,000 | | | 3,621,750 |
cPetroplus Finance Ltd., senior note, 144A, 6.75%, 5/01/14 | | Switzerland | | 2,700,000 | | | 2,531,737 |
Plains All American Pipeline LP, senior note, 5.75%, 1/15/20 | | United States | | 3,300,000 | | | 3,308,695 |
Plains Exploration & Production Co., senior note, | | | | | | | |
10.00%, 3/01/16 | | United States | | 500,000 | | | 550,000 |
7.625%, 6/01/18 | | United States | | 3,200,000 | | | 3,288,000 |
Quicksilver Resources Inc., senior note, | | | | | | | |
8.25%, 8/01/15 | | United States | | 3,200,000 | | | 3,296,000 |
11.75%, 1/01/16 | | United States | | 100,000 | | | 114,000 |
9.125%, 8/15/19 | | United States | | 300,000 | | | 313,500 |
cSandRidge Energy Inc., senior note, 144A, | | | | | | | |
8.00%, 6/01/18 | | United States | | 3,500,000 | | | 3,456,250 |
8.75%, 1/15/20 | | United States | | 500,000 | | | 502,500 |
Smith International Inc., senior note, 9.75%, 3/15/19 | | United States | | 3,300,000 | | | 4,186,934 |
Tesoro Corp., senior note, 6.50%, 6/01/17 | | United States | | 3,800,000 | | | 3,553,000 |
Weatherford International Ltd., senior note, | | | | | | | |
6.00%, 3/15/18 | | United States | | 2,700,000 | | | 2,723,166 |
9.625%, 3/01/19 | | United States | | 600,000 | | | 751,867 |
cWoodside Finance Ltd., 144A, 8.75%, 3/01/19 | | Australia | | 3,400,000 | | | 4,139,884 |
| | | | | | | |
| | | | | | | 82,735,896 |
| | | | | | | |
FSI-18
Franklin Templeton Variable Insurance Products Trust
Statement of Investments, December 31, 2009 (continued)
| | | | | | | |
| Franklin Strategic Income Securities Fund | | Country/
Organization | | Principal
Amountd | | Value |
Corporate Bonds (continued) | | | | | | | |
Food & Staples Retailing 0.5% | | | | | | | |
Duane Reade Inc., senior secured note, 11.75%, 8/01/15 | | United States | | 1,400,000 | | $ | 1,526,000 |
Rite Aid Corp., senior secured note, 9.75%, 6/12/16 | | United States | | 2,300,000 | | | 2,507,000 |
SUPERVALU Inc., senior note, 8.00%, 5/01/16 | | United States | | 2,600,000 | | | 2,652,000 |
| | | | | | | |
| | | | | | | 6,685,000 |
| | | | | | | |
Food, Beverage & Tobacco 1.4% | | | | | | | |
cAlliance One International Inc., senior note, 144A, 10.00%, 7/15/16 | | United States | | 500,000 | | | 527,500 |
Altria Group Inc., | | | | | | | |
senior bond, 9.25%, 8/06/19 | | United States | | 1,000,000 | | | 1,220,660 |
senior note, 9.70%, 11/10/18 | | United States | | 2,300,000 | | | 2,847,625 |
cAnheuser-Busch InBev NV, senior note, 144A, 7.75%, 1/15/19 | | United States | | 3,300,000 | | | 3,870,085 |
cCEDC Finance Corp. International Inc., senior secured note, 144A, 9.125%, 12/01/16 | | United States | | 1,800,000 | | | 1,863,000 |
cCott Beverages Inc., senior note, 144A, 8.375%, 11/15/17 | | United States | | 1,500,000 | | | 1,552,500 |
cDole Food Co. Inc., senior note, 144A, 13.875%, 3/15/14 | | United States | | 2,106,000 | | | 2,542,995 |
cJBS USA LLC, senior note, 144A, 11.625%, 5/01/14 | | United States | | 3,100,000 | | | 3,557,250 |
cPinnacle Foods Finance LLC, senior note, 144A, 9.25%, 4/01/15 | | United States | | 2,100,000 | | | 2,142,000 |
| | | | | | | |
| | | | | | | 20,123,615 |
| | | | | | | |
Health Care Equipment & Services 2.9% | | | | | | | |
cCareFusion Corp., senior note, 144A, 6.375%, 8/01/19 | | United States | | 3,300,000 | | | 3,539,085 |
Coventry Health Care Inc., senior note, | | | | | | | |
6.30%, 8/15/14 | | United States | | 1,500,000 | | | 1,468,593 |
5.95%, 3/15/17 | | United States | | 1,300,000 | | | 1,180,482 |
DaVita Inc., senior sub. note, 7.25%, 3/15/15 | | United States | | 3,400,000 | | | 3,425,500 |
FMC Finance III SA, senior note, 6.875%, 7/15/17 | | Germany | | 2,500,000 | | | 2,493,750 |
Fresenius Medical Care Capital Trust IV, 7.875%, 6/15/11 | | Germany | | 1,000,000 | | | 1,041,250 |
cFresenius US Finance II, senior note, 144A, 9.00%, 7/15/15 | | Germany | | 2,400,000 | | | 2,652,000 |
HCA Inc., | | | | | | | |
senior note, 6.50%, 2/15/16 | | United States | | 800,000 | | | 764,000 |
senior secured note, 9.125%, 11/15/14 | | United States | | 4,000,000 | | | 4,230,000 |
hsenior secured note, PIK, 9.625%, 11/15/16 | | United States | | 2,000,000 | | | 2,170,000 |
Medco Health Solutions Inc., 7.125%, 3/15/18 | | United States | | 3,300,000 | | | 3,715,509 |
cTenet Healthcare Corp., | | | | | | | |
senior note, 144A, 9.00%, 5/01/15 | | United States | | 1,150,000 | | | 1,247,750 |
senior note, 144A, 10.00%, 5/01/18 | | United States | | 1,500,000 | | | 1,687,500 |
senior secured note, 144A, 8.875%, 7/01/19 | | United States | | 900,000 | | | 981,000 |
hUnited Surgical Partners International Inc., senior sub. note, PIK, 9.25%, 5/01/17 | | United States | | 3,000,000 | | | 3,075,000 |
e,hUS Oncology Holdings Inc., senior note, PIK, FRN, 6.428%, 3/15/12 | | United States | | 3,369,000 | | | 3,166,860 |
US Oncology Inc., senior secured note, 9.125%, 8/15/17 | | United States | | 200,000 | | | 211,000 |
Vanguard Health Holding Co. II LLC, senior sub. note, 9.00%, 10/01/14 | | United States | | 3,400,000 | | | 3,540,250 |
| | | | | | | |
| | | | | | | 40,589,529 |
| | | | | | | |
Insurance 1.3% | | | | | | | |
Aflac Inc., senior note, 8.50%, 5/15/19 | | United States | | 1,800,000 | | | 2,077,025 |
American International Group Inc., senior note, 5.60%, 10/18/16 | | United States | | 4,000,000 | | | 3,314,592 |
Lincoln National Corp., senior note,
8.75%, 7/01/19 | | United States | | 3,300,000 | | | 3,776,837 |
6.25%, 2/15/20 | | United States | | 1,350,000 | | | 1,332,859 |
c,eMetLife Capital Trust X, secured bond, 144A, FRN, 9.25%, 4/08/68 | | United States | | 800,000 | | | 912,000 |
eMetLife Inc., junior sub. note, FRN, 6.40%, 12/15/66 | | United States | | 2,000,000 | | | 1,780,000 |
Reinsurance Group of America Inc., senior note, 6.45%, 11/15/19 | | United States | | 3,100,000 | | | 3,095,403 |
Willis North America Inc., senior note, 7.00%, 9/29/19 | | United States | | 1,500,000 | | | 1,530,063 |
| | | | | | | |
| | | | | | | 17,818,779 |
| | | | | | | |
FSI-19
Franklin Templeton Variable Insurance Products Trust
Statement of Investments, December 31, 2009 (continued)
| | | | | | | |
| Franklin Strategic Income Securities Fund | | Country/
Organization | | Principal
Amountd | | Value |
Corporate Bonds (continued) | | | | | | | |
Materials 3.4% | | | | | | | |
cAnglo American Capital PLC, senior note, 144A, 9.375%, 4/08/14 | | United Kingdom | | 3,000,000 | | $ | 3,603,054 |
Ball Corp., senior note,
7.125%, 9/01/16 | | United States | | 500,000 | | | 515,000 |
7.375%, 9/01/19 | | United States | | 500,000 | | | 516,250 |
cClearwater Paper Corp., senior note, 144A, 10.625%, 6/15/16 | | United States | | 2,600,000 | | | 2,915,250 |
Crown Americas Inc., senior note, 7.75%, 11/15/15 | | United States | | 3,100,000 | | | 3,224,000 |
cCrown Americas LLC and Crown Americas Capital Corp. II, senior note,
144A, 7.625%, 5/15/17 | | United States | | 100,000 | | | 104,250 |
Freeport-McMoRan Copper & Gold Inc., senior note, 8.375%, 4/01/17 | | United States | | 3,000,000 | | | 3,289,503 |
Huntsman International LLC,
csenior note, 144A, 5.50%, 6/30/16 | | United States | | 200,000 | | | 178,500 |
senior sub. note, 7.875%, 11/15/14 | | United States | | 3,400,000 | | | 3,340,500 |
cIneos Group Holdings PLC, senior secured note, 144A, 8.50%, 2/15/16 | | United Kingdom | | 2,800,000 | | | 1,897,000 |
cMacDermid Inc., senior sub. note, 144A, 9.50%, 4/15/17 | | United States | | 3,300,000 | | | 3,316,500 |
Nalco Co.,
csenior note, 144A, 8.25%, 5/15/17 | | United States | | 300,000 | | | 320,250 |
senior sub. note, 8.875%, 11/15/13 | | United States | | 3,100,000 | | | 3,208,500 |
NewPage Corp., senior secured note,
10.00%, 5/01/12 | | United States | | 1,300,000 | | | 936,000 |
c144A, 11.375%, 12/31/14 | | United States | | 2,700,000 | | | 2,740,500 |
Novelis Inc., senior note,
7.25%, 2/15/15 | | Canada | | 100,000 | | | 95,750 |
c144A, 11.50%, 2/15/15 | | Canada | | 1,000,000 | | | 1,076,250 |
Owens-Brockway Glass Container Inc., senior note,
6.75%, 12/01/14 | | United States | | 2,800,000 | | | 2,877,000 |
7.375%, 5/15/16 | | United States | | 500,000 | | | 518,750 |
Solo Cup Co.,
csenior secured note, 144A, 10.50%, 11/01/13 | | United States | | 500,000 | | | 531,250 |
senior sub. note, 8.50%, 2/15/14 | | United States | | 3,000,000 | | | 2,947,500 |
Solutia Inc., senior note, 8.75%, 11/01/17 | | United States | | 900,000 | | | 942,750 |
Teck Resources Ltd., senior secured note, 10.75%, 5/15/19 | | Canada | | 2,500,000 | | | 3,000,000 |
Weyerhaeuser Co., senior note, 7.375%, 10/01/19 | | United States | | 2,200,000 | | | 2,303,028 |
cXstrata Finance Canada Ltd., 144A, 5.80%, 11/15/16 | | United Kingdom | | 3,400,000 | | | 3,489,753 |
| | | | | | | |
| | | | | | | 47,887,088 |
| | | | | | | |
Media 3.9% | | | | | | | |
cBritish Sky Broadcasting Group PLC, senior note, 144A, 6.10%, 2/15/18 | | United Kingdom | | 3,300,000 | | | 3,501,416 |
cCablevision Systems Corp., senior note, 144A, 8.625%, 9/15/17 | | United States | | 500,000 | | | 523,125 |
cCCH II LLC/CCH II Capital Corp., senior note, 144A, 13.50%, 11/30/16 | | United States | | 2,713,498 | | | 3,181,576 |
CCO Holdings LLC, senior note, 8.75%, 11/15/13 | | United States | | 1,000,000 | | | 1,031,250 |
cClear Channel Worldwide Holdings Inc., senior note,
A, 144A, 9.25%, 12/15/17 | | United States | | 400,000 | | | 410,000 |
B, 144A, 9.25%, 12/15/17 | | United States | | 1,600,000 | | | 1,656,000 |
CSC Holdings Inc.,
senior deb., 7.625%, 7/15/18 | | United States | | 2,100,000 | | | 2,173,500 |
senior note, 6.75%, 4/15/12 | | United States | | 300,000 | | | 311,250 |
csenior note, 144A, 8.50%, 4/15/14 | | United States | | 1,000,000 | | | 1,070,000 |
i,kDex Media Inc.,
senior disc. note, 9.00%, 11/15/13 | | United States | | 600,000 | | | 154,500 |
senior note, B, 8.00%, 11/15/13 | | United States | | 1,600,000 | | | 412,000 |
i,kDex Media West Finance, senior sub. note, 9.875%, 8/15/13 | | United States | | 2,200,000 | | | 698,500 |
DIRECTV Holdings LLC, senior note, 7.625%, 5/15/16 | | United States | | 2,700,000 | | | 2,953,517 |
EchoStar DBS Corp., senior note,
6.375%, 10/01/11 | | United States | | 2,900,000 | | | 3,001,500 |
7.125%, 2/01/16 | | United States | | 1,500,000 | | | 1,539,375 |
FSI-20
Franklin Templeton Variable Insurance Products Trust
Statement of Investments, December 31, 2009 (continued)
| | | | | | | | |
| Franklin Strategic Income Securities Fund | | Country/
Organization | | Principal
Amountd | | | Value |
Corporate Bonds (continued) | | | | | | | | |
Media (continued) | | | | | | | | |
Lamar Media Corp.,
senior note, 9.75%, 4/01/14 | | United States | | 300,000 | | | $ | 332,625 |
senior sub. note, 7.25%, 1/01/13 | | United States | | 2,800,000 | | | | 2,807,000 |
senior sub. note, B, 6.625%, 8/15/15 | | United States | | 400,000 | | | | 386,000 |
Liberty Media Corp., senior note, 5.70%, 5/15/13 | | United States | | 3,400,000 | | | | 3,255,500 |
LIN Television Corp., senior sub. note, 6.50%, 5/15/13 | | United States | | 3,600,000 | | | | 3,492,000 |
Quebecor Media Inc., senior note, 7.75%, 3/15/16 | | Canada | | 3,400,000 | | | | 3,408,500 |
kRadio One Inc., senior sub. note, 6.375%, 2/15/13 | | United States | | 2,800,000 | | | | 2,068,500 |
cSinclair Television Group Inc., senior secured note, 144A, 9.25%, 11/01/17 | | United States | | 3,000,000 | | | | 3,135,000 |
Time Warner Inc., 7.625%, 4/15/31 | | United States | | 3,200,000 | | | | 3,727,667 |
cUPC Germany GmbH, senior note, 144A, 9.625%, 12/01/19 | | Germany | | 700,000 | EUR | | | 1,017,045 |
cUPC Holding BV, senior note, 144A, 9.875%, 4/15/18 | | Netherlands | | 800,000 | | | | 818,920 |
Viacom Inc., senior note, 6.875%, 4/30/36 | | United States | | 3,300,000 | | | | 3,579,586 |
cWMG Acquisition Corp., senior secured note, 144A, 9.50%, 6/15/16 | | United States | | 3,400,000 | | | | 3,659,250 |
| | | | | | | | |
| | | | | | | | 54,305,102 |
| | | | | | | | |
Pharmaceuticals, Biotechnology & Life Sciences 0.1% | | | | | | | | |
cTalecris Biotherapeutics Holdings Corp., senior note, 144A, 7.75%, 11/15/16 | | United States | | 1,900,000 | | | | 1,938,000 |
| | | | | | | | |
Real Estate 2.2% | | | | | | | | |
cDexus Finance Property Ltd., 144A, 7.125%, 10/15/14 | | Australia | | 4,000,000 | | | | 4,114,184 |
Duke Realty LP, senior note, 8.25%, 8/15/19 | | United States | | 4,000,000 | | | | 4,186,772 |
ERP Operating LP, 5.75%, 6/15/17 | | United States | | 1,100,000 | | | | 1,103,637 |
cFelCor Lodging Trust Inc., senior secured note, 144A, 10.00%, 10/01/14 | | United States | | 3,700,000 | | | | 3,750,875 |
Forest City Enterprises Inc., senior note, 7.625%, 6/01/15 | | United States | | 3,000,000 | | | | 2,700,000 |
Healthcare Realty Trust Inc., senior note, 6.50%, 1/17/17 | | United States | | 4,000,000 | | | | 3,967,808 |
Kimco Realty Corp., senior note, 6.875%, 10/01/19 | | United States | | 3,200,000 | | | | 3,259,674 |
Simon Property Group LP, senior note, 10.35%, 4/01/19 | | United States | | 3,300,000 | | | | 4,158,224 |
cWEA Finance/WT Finance Australia, senior note, 144A, 6.75%, 9/02/19 | | United States | | 3,300,000 | | | | 3,549,684 |
| | | | | | | | |
| | | | | | | | 30,790,858 |
| | | | | | | | |
Retailing 0.6% | | | | | | | | |
Dollar General Corp., senior note, 10.625%, 7/15/15 | | United States | | 2,510,000 | | | | 2,792,375 |
Michaels Stores Inc., senior note, 10.00%, 11/01/14 | | United States | | 3,500,000 | | | | 3,640,000 |
cQVC Inc., senior secured note, 144A, 7.50%, 10/01/19 | | United States | | 1,400,000 | | | | 1,435,000 |
| | | | | | | | |
| | | | | | | | 7,867,375 |
| | | | | | | | |
Semiconductors & Semiconductor Equipment 0.3% | | | | | | | | |
cAdvanced Micro Devices Inc., senior note, 144A, 8.125%, 12/15/17 | | United States | | 800,000 | | | | 801,000 |
Freescale Semiconductor Inc., senior note, 8.875%, 12/15/14 | | United States | | 3,700,000 | | | | 3,413,250 |
| | | | | | | | |
| | | | | | | | 4,214,250 |
| | | | | | | | |
Software & Services 0.3% | | | | | | | | |
SunGard Data Systems Inc.,
senior note, 9.125%, 8/15/13 | | United States | | 2,100,000 | | | | 2,163,000 |
senior sub. note, 10.25%, 8/15/15 | | United States | | 2,500,000 | | | | 2,675,000 |
| | | | | | | | |
| | | | | | | | 4,838,000 |
| | | | | | | | |
Technology Hardware & Equipment 0.4% | | | | | | | | |
Jabil Circuit Inc., senior note, 7.75%, 7/15/16 | | United States | | 1,800,000 | | | | 1,899,000 |
Sanmina-SCI Corp.,
c,esenior note, 144A, FRN, 3.004%, 6/15/14 | | United States | | 500,000 | | | | 461,250 |
senior sub. note, 6.75%, 3/01/13 | | United States | | 2,300,000 | | | | 2,279,875 |
cViaSat Inc., senior note, 144A, 8.875%, 9/15/16 | | United States | | 700,000 | | | | 735,000 |
| | | | | | | | |
| | | | | | | | 5,375,125 |
| | | | | | | | |
FSI-21
Franklin Templeton Variable Insurance Products Trust
Statement of Investments, December 31, 2009 (continued)
| | | | | | | | |
| Franklin Strategic Income Securities Fund | | Country/
Organization | | Principal
Amountd | | | Value |
Corporate Bonds (continued) | | | | | | | | |
Telecommunication Services 2.9% | | | | | | | | |
cCC Holdings GS V LLC, senior secured note, 144A, 7.75%, 5/01/17 | | United States | | 500,000 | | | $ | 535,000 |
Crown Castle International Corp., | | | | | | | | |
senior bond, 7.125%, 11/01/19 | | United States | | 200,000 | | | | 199,000 |
senior note, 9.00%, 1/15/15 | | United States | | 2,800,000 | | | | 2,996,000 |
cDigicel Group Ltd., senior note, 144A, | | | | | | | | |
8.875%, 1/15/15 | | Jamaica | | 3,400,000 | | | | 3,344,750 |
8.25%, 9/01/17 | | Jamaica | | 300,000 | | | | 294,000 |
Intelsat Bermuda Ltd., senior note, 11.25%, 6/15/16 | | Bermuda | | 2,500,000 | | | | 2,718,750 |
Intelsat Subsidiary Holding Co. Ltd., senior note, 8.50%, 1/15/13 | | Bermuda | | 3,500,000 | | | | 3,587,500 |
MetroPCS Wireless Inc., senior note, 9.25%, 11/01/14 | | United States | | 3,700,000 | | | | 3,764,750 |
Millicom International Cellular SA, senior note, 10.00%, 12/01/13 | | Luxembourg | | 3,400,000 | | | | 3,536,000 |
Qwest Communications International Inc., senior note, 7.50%, 2/15/14 | | United States | | 3,500,000 | | | | 3,530,625 |
Qwest Corp., senior note, 8.375%, 5/01/16 | | United States | | 1,600,000 | | | | 1,724,000 |
cSBA Telecommunications Inc., senior note, 144A, 8.25%, 8/15/19 | | United States | | 1,400,000 | | | | 1,491,000 |
Sprint Nextel Corp., senior note, 8.375%, 8/15/17 | | United States | | 1,600,000 | | | | 1,640,000 |
Telecom Italia Capital SA, senior note, | | | | | | | | |
4.95%, 9/30/14 | | Italy | | 3,500,000 | | | | 3,626,885 |
6.999%, 6/04/18 | | Italy | | 500,000 | | | | 551,030 |
Verizon New York Inc., senior deb., | | | | | | | | |
A, 6.875%, 4/01/12 | | United States | | 2,700,000 | | | | 2,939,177 |
B, 7.375%, 4/01/32 | | United States | | 400,000 | | | | 432,097 |
cWind Acquisition Finance SA, senior note, 144A, | | | | | | | | |
10.75%, 12/01/15 | | Italy | | 3,400,000 | | | | 3,655,000 |
11.75%, 7/15/17 | | Italy | | 400,000 | | | | 437,000 |
cWindstream Corp., senior note, 144A, 7.875%, 11/01/17 | | United States | | 400,000 | | | | 397,000 |
| | | | | | | | |
| | | | | | | | 41,399,564 |
| | | | | | | | |
Transportation 0.3% | | | | | | | | |
cCeva Group PLC, senior secured note, 144A, | | | | | | | | |
10.00%, 9/01/14 | | United Kingdom | | 3,200,000 | | | | 3,009,566 |
11.625%, 10/01/16 | | United Kingdom | | 100,000 | | | | 103,125 |
cDelta Air Lines Inc., senior secured note, 144A, 9.50%, 9/15/14 | | United States | | 1,100,000 | | | | 1,149,500 |
| | | | | | | | |
| | | | | | | | 4,262,191 |
| | | | | | | | |
Utilities 2.9% | | | | | | | | |
The AES Corp., senior note, 8.00%, | | | | | | | | |
10/15/17 | | United States | | 2,900,000 | | | | 2,990,625 |
6/01/20 | | United States | | 600,000 | | | | 613,500 |
Ameren Corp., senior note, 8.875%, 5/15/14 | | United States | | 3,400,000 | | | | 3,822,447 |
CenterPoint Energy Inc., senior note, | | | | | | | | |
6.125%, 11/01/17 | | United States | | 1,800,000 | | | | 1,862,690 |
6.50%, 5/01/18 | | United States | | 1,000,000 | | | | 1,031,076 |
CMS Energy Corp., senior note, 8.75%, 6/15/19 | | United States | | 1,800,000 | | | | 1,979,176 |
Dynegy Holdings Inc., senior note, 8.375%, 5/01/16 | | United States | | 4,000,000 | | | | 3,820,000 |
Edison Mission Energy, senior note, 7.00%, 5/15/17 | | United States | | 2,600,000 | | | | 2,067,000 |
cEnogex LLC, senior note, 144A, 6.25%, 3/15/20 | | United States | | 4,000,000 | | | | 3,920,600 |
cInfinis PLC, senior note, 144A, 9.125%, 12/15/14 | | United Kingdom | | 600,000 | GBP | | | 994,299 |
cIntergen NV, senior secured note, 144A, 9.00%, 6/30/17 | | Netherlands | | 3,400,000 | | | | 3,561,500 |
Mirant North America LLC, senior note, 7.375%, 12/31/13 | | United States | | 3,400,000 | | | | 3,378,750 |
NRG Energy Inc., senior note, | | | | | | | | |
7.25%, 2/01/14 | | United States | | 700,000 | | | | 710,500 |
7.375%, 2/01/16 | | United States | | 4,500,000 | | | | 4,516,875 |
FSI-22
Franklin Templeton Variable Insurance Products Trust
Statement of Investments, December 31, 2009 (continued)
| | | | | | | |
| Franklin Strategic Income Securities Fund | | Country/
Organization | | Principal
Amountd | | Value |
Corporate Bonds (continued) | | | | | | | |
Utilities (continued) | | | | | | | |
Texas Competitive Electric Holdings Co. LLC, senior note, A, | | | | | | | |
10.25%, 11/01/15 | | United States | | 6,000,000 | | $ | 4,890,000 |
| | | | | | | |
| | | | | | | 40,159,038 |
| | | | | | | |
Total Corporate Bonds (Cost $552,508,067) | | | | | | | 582,510,837 |
| | | | | | | |
Asset-Backed Securities and Commercial Mortgage-Backed Securities 5.9% | | | | | | | |
Banks 4.2% | | | | | | | |
eBanc of America Commercial Mortgage Inc., 2005-6, A4, FRN, 5.178%, 9/10/47 | | United States | | 2,000,000 | | | 1,967,352 |
eCitibank Credit Card Issuance Trust, 2005-A3, A3, FRN, 0.302%, 4/24/14 | | United States | | 1,000,000 | | | 985,232 |
Citigroup Commercial Mortgage Trust, | | | | | | | |
e2007-C6, AM, FRN, 5.70%, 6/10/17 | | United States | | 1,200,000 | | | 807,716 |
2008-C7, A4, 6.095%, 12/10/49 | | United States | | 8,700,000 | | | 7,833,699 |
Citigroup/Deutsche Bank Commercial Mortgage Trust, | | | | | | | |
e2005-CD1, A4, FRN, 5.224%, 7/15/44 | | United States | | 2,700,000 | | | 2,699,388 |
2006-CD3, A5, 5.617%, 10/15/48 | | United States | | 9,800,000 | | | 9,354,763 |
Countrywide Asset-Backed Certificates, 2005-11, AF4, 5.21%, 3/25/34 | | United States | | 1,275,000 | | | 562,127 |
GE Capital Commercial Mortgage Corp., 2003-C1, A4, 4.819%, 1/10/38 | | United States | | 934,225 | | | 949,384 |
Greenwich Capital Commercial Funding Corp., | | | | | | | |
2004-GG1, A7, 5.317%, 6/10/36 | | United States | | 3,005,000 | | | 3,053,708 |
2005-GG5, A5, 5.224%, 4/10/37 | | United States | | 4,995,000 | | | 4,740,319 |
e2006-GG7, A4, FRN, 5.883%, 7/10/38 | | United States | | 4,000,000 | | | 3,656,124 |
GS Mortgage Securities Corp. II, | | | | | | | |
2003-C1, A3, 4.608%, 1/10/40 | | United States | | 1,100,000 | | | 1,118,473 |
e2006-GG6, A4, FRN, 5.553%, 4/10/38 | | United States | | 4,000,000 | | | 3,656,623 |
LB-UBS Commercial Mortgage Trust, | | | | | | | |
e2002-C2, A4, FRN, 5.594%, 6/15/31 | | United States | | 1,000,000 | | | 1,046,747 |
2005-C5, A4, 4.954%, 9/15/30 | | United States | | 3,500,000 | | | 3,396,956 |
2006-C1, A4, 5.156%, 2/15/31 | | United States | | 5,700,000 | | | 5,527,455 |
eMorgan Stanley Capital I Trust, 2004-IQ7, A4, FRN, 5.402%, 6/15/38 | | United States | | 4,000,000 | | | 4,022,233 |
c,eSchiller Park CLO Ltd., 2007-1A, A2, 144A, FRN, 0.522%, 4/25/21 | | United States | | 4,400,000 | | | 3,936,174 |
| | | | | | | |
| | | | | | | 59,314,473 |
| | | | | | | |
Diversified Financials 1.7% | | | | | | | |
eAdvanta Business Card Master Trust, 2007-A4, A4, FRN, 0.263%, 4/22/13 | | United States | | 1,647,028 | | | 1,565,424 |
eAmerican Express Credit Account Master Trust, 2008-1, A, FRN, 0.683%, 8/15/13 | | United States | | 2,800,000 | | | 2,798,279 |
c,eBabson CLO Ltd., 2005-2A- A1, 144A, FRN, 0.534%, 07/20/19 | | Cayman Islands | | 2,045,349 | | | 1,883,123 |
eChase Issuance Trust, | | | | | | | |
2007-A9, A9, FRN, 0.263%, 6/16/14 | | United States | | 5,000,000 | | | 4,933,382 |
sub. note, 2006-A7, A, FRN, 0.243%, 2/15/13 | | United States | | 800,000 | | | 797,289 |
JPMorgan Chase Commercial Mortgage Securities Corp., | | | | | | | |
e2004-CB9, A4, FRN, 5.376%, 6/12/41 | | United States | | 5,096,445 | | | 5,140,018 |
2004-LN2, A2, 5.115%, 7/15/41 | | United States | | 412,616 | | | 402,438 |
2005-LDP2, AM, 4.78%, 7/15/42 | | United States | | 775,000 | | | 618,884 |
e2005-LDP5, A4, FRN, 5.179%, 12/15/44 | | United States | | 3,400,000 | | | 3,371,188 |
eMBNA Credit Card Master Note Trust, 2005-A4, A4, FRN, 0.273%, 11/15/12 | | United States | | 1,000,000 | | | 996,844 |
eMBNA Master Credit Card Trust II, 1997-B, A, FRN, 0.393%, 8/15/14 | | United States | | 1,000,000 | | | 980,535 |
Residential Asset Securities Corp., 2004-KS1, AI4, 4.213%, 4/25/32 | | United States | | 111,284 | | | 102,576 |
| | | | | | | |
| | | | | | | 23,589,980 |
| | | | | | | |
Total Asset-Backed Securities and Commercial Mortgage-Backed Securities (Cost $83,570,082) | | | | | | | 82,904,453 |
| | | | | | | |
FSI-23
Franklin Templeton Variable Insurance Products Trust
Statement of Investments, December 31, 2009 (continued)
| | | | | | | |
| Franklin Strategic Income Securities Fund | | Country/
Organization | | Principal
Amountd | | Value |
Mortgage-Backed Securities 4.3% | | | | | | | |
eFederal Home Loan Mortgage Corp. (FHLMC) Adjustable Rate 0.0%a | | | | | | | |
FHLMC, 4.062%, 1/01/33 | | United States | | 131,103 | | $ | 134,445 |
| | | | | | | |
Federal Home Loan Mortgage Corp. (FHLMC) Fixed Rate 2.1% | | | | | | | |
FHLMC Gold 15 Year, 4.50%, 10/01/18 - 6/01/19 | | United States | | 2,048,353 | | | 2,129,405 |
FHLMC Gold 15 Year, 5.00%, 12/01/17 - 9/01/19 | | United States | | 2,453,218 | | | 2,582,839 |
FHLMC Gold 15 Year, 5.50%, 7/01/17 - 7/01/19 | | United States | | 667,808 | | | 711,766 |
FHLMC Gold 15 Year, 6.00%, 5/01/17 | | United States | | 24,419 | | | 26,162 |
FHLMC Gold 15 Year, 6.50%, 5/01/16 | | United States | | 9,014 | | | 9,685 |
FHLMC Gold 30 Year, 5.00%, 4/01/34 - 9/01/38 | | United States | | 8,378,739 | | | 8,606,838 |
FHLMC Gold 30 Year, 5.50%, 3/01/33 - 6/01/36 | | United States | | 7,345,953 | | | 7,720,861 |
FHLMC Gold 30 Year, 6.00%, 4/01/33 - 6/01/37 | | United States | | 6,666,390 | | | 7,098,075 |
FHLMC Gold 30 Year, 6.50%, 12/01/23 - 6/01/36 | | United States | | 508,361 | | | 547,107 |
FHLMC Gold 30 Year, 7.00%, 9/01/21 - 1/01/32 | | United States | | 114,863 | | | 127,470 |
FHLMC Gold 30 Year, 7.50%, 3/01/30 - 7/01/31 | | United States | | 2,556 | | | 2,872 |
| | | | | | | |
| | | | | | | 29,563,080 |
| | | | | | | |
eFederal National Mortgage Association (FNMA) Adjustable Rate 0.1% | | | | | | | |
FNMA, 2.722%, 12/01/34 | | United States | | 544,516 | | | 562,071 |
FNMA, 4.244%, 4/01/20 | | United States | | 109,892 | | | 112,176 |
| | | | | | | |
| | | | | | | 674,247 |
| | | | | | | |
Federal National Mortgage Association (FNMA) Fixed Rate 1.8% | | | | | | | |
FNMA 15 Year, 4.50%, 6/01/19 - 3/01/20 | | United States | | 494,857 | | | 514,461 |
FNMA 15 Year, 5.00%, 10/01/17 - 6/01/18 | | United States | | 585,428 | | | 616,895 |
FNMA 15 Year, 5.50%, 10/01/16 - 4/01/21 | | United States | | 454,637 | | | 482,619 |
FNMA 15 Year, 6.00%, 4/01/16 - 7/01/16 | | United States | | 16,436 | | | 17,617 |
FNMA 15 Year, 7.00%, 5/01/12 | | United States | | 1,228 | | | 1,280 |
FNMA 30 Year, 4.50%, 4/01/39 | | United States | | 3,540,239 | | | 3,537,018 |
FNMA 30 Year, 5.00%, 4/01/34 - 3/01/37 | | United States | | 4,738,984 | | | 4,871,689 |
FNMA 30 Year, 5.50%, 8/01/33 - 9/01/35 | | United States | | 3,610,745 | | | 3,794,728 |
FNMA 30 Year, 6.00%, 6/01/34 - 10/01/38 | | United States | | 7,462,891 | | | 7,940,398 |
FNMA 30 Year, 6.50%, 6/01/28 - 10/01/37 | | United States | | 3,004,061 | | | 3,228,513 |
| | | | | | | |
| | | | | | | 25,005,218 |
| | | | | | | |
Government National Mortgage Association (GNMA) Fixed Rate 0.3% | | | | | | | |
GNMA I SF 30 Year, 5.00%, 11/15/33 - 7/15/34 | | United States | | 1,457,579 | | | 1,509,533 |
GNMA I SF 30 Year, 5.50%, 12/15/32 - 6/15/36 | | United States | | 1,907,003 | | | 2,010,730 |
GNMA I SF 30 Year, 6.50%, 11/15/31 - 2/15/32 | | United States | | 10,992 | | | 11,866 |
GNMA I SF 30 Year, 7.00%, 10/15/28 - 6/15/32 | | United States | | 105,347 | | | 117,203 |
GNMA I SF 30 Year, 7.50%, 9/15/30 | | United States | | 2,247 | | | 2,533 |
GNMA II SF 30 Year, 5.00%, 9/20/33 - 11/20/33 | | United States | | 412,270 | | | 426,910 |
GNMA II SF 30 Year, 6.00%, 11/20/34 | | United States | | 467,823 | | | 498,713 |
GNMA II SF 30 Year, 6.50%, 4/20/31 - 2/20/34 | | United States | | 172,729 | | | 185,770 |
GNMA II SF 30 Year, 7.50%, 1/20/28 - 4/20/32 | | United States | | 54,787 | | | 61,457 |
| | | | | | | |
| | | | | | | 4,824,715 |
| | | | | | | |
Total Mortgage-Backed Securities (Cost $57,575,278) | | | | | | | 60,201,705 |
| | | | | | | |
U.S. Government and Agency Securities 5.0% | | | | | | | |
FHLMC, | | | | | | | |
3.75%, 6/28/13 | | United States | | 3,000,000 | | | 3,164,217 |
5.625%, 3/15/11 | | United States | | 2,700,000 | | | 2,858,215 |
senior note, 4.75%, 3/05/12 | | United States | | 700,000 | | | 751,229 |
FSI-24
Franklin Templeton Variable Insurance Products Trust
Statement of Investments, December 31, 2009 (continued)
| | | | | | | | |
| Franklin Strategic Income Securities Fund | | Country/
Organization | | Principal
Amountd | | | Value |
U.S. Government and Agency Securities (continued) | | | | | | | | |
FNMA, | | | | | | | | |
1.375%, 4/28/11 | | United States | | 5,500,000 | | | $ | 5,542,251 |
4.125%, 4/15/14 | | United States | | 700,000 | | | | 745,209 |
U.S. Treasury Bond, | | | | | | | | |
4.50%, 2/15/16 | | United States | | 5,600,000 | | | | 6,042,316 |
4.50%, 5/15/17 | | United States | | 1,000,000 | | | | 1,069,297 |
7.125%, 2/15/23 | | United States | | 1,980,000 | | | | 2,539,970 |
7.875%, 2/15/21 | | United States | | 2,600,000 | | | | 3,495,375 |
U.S. Treasury Note, | | | | | | | | |
4.125%, 5/15/15 | | United States | | 6,700,000 | | | | 7,145,972 |
4.625%, 2/15/17 | | United States | | 600,000 | | | | 648,047 |
4.75%, 8/15/17 | | United States | | 2,900,000 | | | | 3,147,634 |
l Index Linked, 1.625%, 1/15/15 | | United States | | 9,962,539 | | | | 10,373,493 |
lIndex Linked, 2.00%, 1/15/14 | | United States | | 7,955,429 | | | | 8,422,811 |
lIndex Linked, 2.00%, 7/15/14 | | United States | | 3,440,435 | | | | 3,649,011 |
lIndex Linked, 2.00%, 1/15/16 | | United States | | 4,465,486 | | | | 4,721,207 |
lIndex Linked, 2.50%, 7/15/16 | | United States | | 5,887,235 | | | | 6,418,464 |
| | | | | | | | |
Total U.S. Government and Agency Securities
(Cost $67,830,470) | | | | | | | | 70,734,718 |
| | | | | | | | |
Foreign Government and Agency Securities 23.6% | | | | | | | | |
Corporacion Andina De Fomento, 8.125%, 6/04/19 | | Supranationalm | | 3,810,000 | | | | 4,415,409 |
cEmirate of Abu Dhabi, 144A, 6.75%, 4/08/19 | | United Arab Emirates | | 3,210,000 | | | | 3,533,610 |
European Investment Bank, senior note, 1612/37, 6.50%, 9/10/14 | | Supranationalm | | 4,555,000 | NZD | | | 3,409,753 |
e,nGovernment of Argentina, senior bond, FRN, 0.943%, 8/03/12 | | Argentina | | 37,962,000 | | | | 13,077,909 |
Government of Australia, TB123, 5.75%, 4/15/12 | | Australia | | 16,110,000 | AUD | | | 14,793,531 |
Government of Hungary,
3.50%, 7/18/16 | | Hungary | | 60,000 | EUR | | | 80,064 |
4.375%, 7/04/17 | | Hungary | | 225,000 | EUR | | | 314,495 |
5.75%, 6/11/18 | | Hungary | | 160,000 | EUR | | | 237,282 |
senior note, 3.875%, 2/24/20 | | Hungary | | 95,000 | EUR | | | 120,061 |
Government of Indonesia,
FR19, 14.25%, 6/15/13 | | Indonesia | | 35,480,000,000 | IDR | | | 4,376,181 |
FR20, 14.275%, 12/15/13 | | Indonesia | | 23,637,000,000 | IDR | | | 2,953,058 |
FR26, 11.00%, 10/15/14 | | Indonesia | | 1,800,000,000 | IDR | | | 206,355 |
FR34, 12.80%, 6/15/21 | | Indonesia | | 39,455,000,000 | IDR | | | 4,866,467 |
FR42, 10.25%, 7/15/27 | | Indonesia | | 28,000,000,000 | IDR | | | 2,866,844 |
FR44, 10.00%, 9/15/24 | | Indonesia | | 23,400,000,000 | IDR | | | 2,371,035 |
csenior bond, 144A, 6.625%, 2/17/37 | | Indonesia | | 330,000 | | | | 326,958 |
csenior bond, 144A, 7.75%, 1/17/38 | | Indonesia | | 4,000,000 | | | | 4,458,333 |
csenior bond, 144A, 8.50%, 10/12/35 | | Indonesia | | 360,000 | | | | 434,099 |
csenior note, 144A, 11.625%, 3/04/19 | | Indonesia | | 840,000 | | | | 1,218,840 |
Government of Israel, 2680, 7.00%, 4/29/11 | | Israel | | 12,235,000 | ILS | | | 3,419,902 |
cGovernment of Lithuania, 144A, 6.75%, 1/15/15 | | Lithuania | | 2,330,000 | | | | 2,386,969 |
Government of Malaysia,
2.509%, 8/27/12 | | Malaysia | | 3,600,000 | MYR | | | 1,038,398 |
3.461%, 7/31/13 | | Malaysia | | 6,400,000 | MYR | | | 1,874,331 |
3.756%, 4/28/11 | | Malaysia | | 40,605,000 | MYR | | | 12,069,741 |
3.814%, 2/15/17 | | Malaysia | | 11,400,000 | MYR | | | 3,275,835 |
3.833%, 9/28/11 | | Malaysia | | 27,100,000 | MYR | | | 8,082,591 |
3.869%, 4/13/10 | | Malaysia | | 8,750,000 | MYR | | | 2,569,400 |
4.24%, 2/07/18 | | Malaysia | | 6,600,000 | MYR | | | 1,936,861 |
Government of Mexico,
M 10, 8.00%, 12/17/15 | | Mexico | | 350,000 | o MXN | | | 2,736,189 |
M 20, 10.00%, 12/05/24 | | Mexico | | 1,516,000 | o MXN | | | 13,317,760 |
Government of Norway, 6.00%, 5/16/11 | | Norway | | 72,850,000 | NOK | | | 13,185,656 |
FSI-25
Franklin Templeton Variable Insurance Products Trust
Statement of Investments, December 31, 2009 (continued)
| | | | | | | | |
| Franklin Strategic Income Securities Fund | | Country/
Organization | | Principal
Amountd | | | Value |
Foreign Government and Agency Securities (continued) | | | | | | | | |
Government of Poland,
4.25%, 5/24/11 | | Poland | | 1,230,000 | PLN | | $ | 427,015 |
4.75%, 4/25/12 | | Poland | | 38,300,000 | PLN | | | 13,300,855 |
5.75%, 4/25/14 | | Poland | | 8,010,000 | PLN | | | 2,797,523 |
5.75%, 9/23/22 | | Poland | | 19,100,000 | PLN | | | 6,356,353 |
6.25%, 10/24/15 | | Poland | | 9,100,000 | PLN | | | 3,217,936 |
senior note, 6.375%, 7/15/19 | | Poland | | 6,000,000 | | | | 6,575,628 |
cGovernment of Russia, 144A, 7.50%, 3/31/30 | | Russia | | 21,804,240 | | | | 24,597,363 |
Government of South Africa,
6.875%, 5/27/19 | | South Africa | | 3,245,000 | | | | 3,662,794 |
senior note, 5.875%, 5/30/22 | | South Africa | | 3,500,000 | | | | 3,602,813 |
Government of Sri Lanka, A,
8.50%, 1/15/13 | | Sri Lanka | | 50,900,000 | LKR | | | 420,840 |
11.00%, 8/01/15 | | Sri Lanka | | 200,400,000 | LKR | | | 1,718,709 |
11.25%, 7/15/14 | | Sri Lanka | | 176,100,000 | LKR | | | 1,535,123 |
13.50%, 2/01/13 | | Sri Lanka | | 59,500,000 | LKR | | | 558,544 |
Government of Sweden,
5.25%, 3/15/11 | | Sweden | | 211,360,000 | SEK | | | 31,226,206 |
5.50%, 10/08/12 | | Sweden | | 13,990,000 | SEK | | | 2,151,619 |
Government of the Hellenic Republic, 6.00%, 7/19/19 | | Greece | | 6,500,000 | EUR | | | 9,404,085 |
Government of Venezuela,
10.75%, 9/19/13 | | Venezuela | | 7,830,000 | | | | 7,007,850 |
psenior bond, Reg S, 5.375%, 8/07/10 | | Venezuela | | 3,035,000 | | | | 2,974,300 |
KfW Bankengruppe, senior note, 6.50%, 11/15/11 | | Germany | | 3,588,000 | NZD | | | 2,695,630 |
Korea Development Bank, senior note, 8.00%, 1/23/14 | | South Korea | | 4,100,000 | | | | 4,728,940 |
Korea Treasury Bond, | | | | | | | | |
0400-1206, 4.00%, 6/10/12 | | South Korea | | 24,263,880,000 | KRW | | | 20,617,109 |
0475-1112, 4.75%, 12/10/11 | | South Korea | | 14,191,350,000 | KRW | | | 12,254,246 |
0525-1209, 5.25%, 9/10/12 | | South Korea | | 2,850,000,000 | KRW | | | 2,485,870 |
0525-1303, 5.25%, 3/10/13 | | South Korea | | 346,570,000 | KRW | | | 302,386 |
0550-1106, 5.50%, 6/10/11 | | South Korea | | 3,511,820,000 | KRW | | | 3,075,417 |
New South Wales Treasury Corp., senior note, 5.50%, 3/01/17 | | Australia | | 3,540,000 | AUD | | | 3,073,411 |
Nota Do Tesouro Nacional, | | | | | | | | |
10.00%, 1/01/12 | | Brazil | | 6,910 | q BRL | | | 3,839,601 |
10.00%, 1/01/14 | | Brazil | | 2,700 | q BRL | | | 1,426,600 |
10.00%, 1/01/17 | | Brazil | | 23,200 | q BRL | | | 11,420,067 |
rIndex Linked, 6.00%, 5/15/15 | | Brazil | | 4,340 | q BRL | | | 4,510,371 |
rIndex Linked, 6.00%, 5/15/45 | | Brazil | | 1,725 | q BRL | | | 1,742,227 |
Province of Ontario, 6.25%, 6/16/15 | | Canada | | 997,000 | NZD | | | 732,073 |
Queensland Treasury Corp., | | | | | | | | |
11, 6.00%, 6/14/11 | | Australia | | 890,000 | AUD | | | 813,267 |
13, 6.00%, 8/14/13 | | Australia | | 600,000 | AUD | | | 548,572 |
17, 6.00%, 9/14/17 | | Australia | | 1,200,000 | AUD | | | 1,070,102 |
c144A, 7.125%, 9/18/17 | | Australia | | 5,640,000 | NZD | | | 4,250,396 |
| | | | | | | | |
Total Foreign Government and Agency Securities (Cost $314,894,671) | | | | | | | | 331,075,758 |
| | | | | | | | |
Municipal Bonds 1.9% | | | | | | | | |
California State GO, | | | | | | | | |
Refunding, 5.00%, 4/01/38 | | United States | | 12,000,000 | | | | 10,785,720 |
Various Purpose, 6.00%, 4/01/38 | | United States | | 7,000,000 | | | | 7,138,390 |
Various Purpose, Refunding, 5.25%, 3/01/38 | | United States | | 2,335,000 | | | | 2,197,702 |
Clovis USD, GO, Capital Appreciation, Election of 2004, Series A, | | | | | | | | |
FGIC Insured, zero cpn., 8/01/27 | | United States | | 1,720,000 | | | | 607,710 |
NATL Insured, zero cpn., 8/01/25 | | United States | | 2,500,000 | | | | 1,017,175 |
NATL Insured, zero cpn., 8/01/26 | | United States | | 1,290,000 | | | | 489,065 |
NATL Insured, zero cpn., 8/01/29 | | United States | | 1,720,000 | | | | 525,684 |
FSI-26
Franklin Templeton Variable Insurance Products Trust
Statement of Investments, December 31, 2009 (continued)
| | | | | | | | |
| Franklin Strategic Income Securities Fund | | Country/
Organization | | Principal
Amountd | | | Value |
Municipal Bonds (continued) | | | | | | | | |
District of Columbia University Revenue, Georgetown University, Refunding, Series D, BHAC Insured, 5.50%, 4/01/36 | | United States | | 680,000 | | | $ | 740,928 |
Kentucky State Municipal Power Agency Power System Revenue, Prairie State Project, Series A, BHAC Insured, 5.25%, 9/01/42 | | United States | | 1,135,000 | | | | 1,184,304 |
Placentia-Yorba Linda USD, GO, 2008 Election, Series A, 5.25%, 8/01/32 | | United States | | 1,250,000 | | | | 1,289,100 |
Poway USD, GO, Election of 2008, ID 07-1-A, zero cpn., | | | | | | | | |
8/01/27 | | United States | | 370,000 | | | | 128,520 |
8/01/30 | | United States | | 370,000 | | | | 102,886 |
8/01/32 | | United States | | 460,000 | | | | 109,540 |
8/01/33 | | United States | | 245,000 | | | | 53,880 |
San Bernardino Community College District GO, Election of 2002, Series A, 6.50%, | | | | | | | | |
8/01/27 | | United States | | 305,000 | | | | 357,436 |
8/01/28 | | United States | | 125,000 | | | | 145,801 |
San Mateo County Community College District GO, Election of 2001, Series C, NATL Insured, zero cpn., | | | | | | | | |
9/01/30 | | United States | | 895,000 | | | | 265,439 |
3/01/31 | | United States | | 245,000 | | | | 69,521 |
| | | | | | | | |
Total Municipal Bonds (Cost $27,424,747) | | | | | | | | 27,208,801 |
| | | | | | | | |
Total Investments before Short Term Investments
(Cost $1,301,669,134) | | | | | | | | 1,354,076,633 |
| | | | | | | | |
Short Term Investments | | | | | | | | |
Foreign Government and Agency Securities (Cost $907,568) 0.1% | | | | | | | | |
sIsrael Treasury Bill, 10/06/10 | | Israel | | 3,420,000 | ILS | | | 888,749 |
| | | | | | | | |
Total Investments before Money Market Funds
(Cost $1,302,576,702) | | | | | | | | 1,354,965,382 |
| | | | | | | | |
| | | |
| | | | | Shares | | | |
Money Market Funds (Cost $43,133,443) 3.0% | | | | | | | | |
tInstitutional Fiduciary Trust Money Market Portfolio, 0.00% | | United States | | 43,133,443 | | | | 43,133,443 |
| | | | | | | | |
Total Investments (Cost $1,345,710,145) 99.6% | | | | | | | | 1,398,098,825 |
Other Assets, less Liabilities 0.4% | | | | | | | | 5,527,784 |
| | | | | | | | |
Net Assets 100.0% | | | | | | | $ | 1,403,626,609 |
| | | | | | | | |
FSI-27
Franklin Templeton Variable Insurance Products Trust
Statement of Investments, December 31, 2009 (continued)
| | | | | | |
| Franklin Strategic Income Securities Fund | | | | | | |
aRounds to less than 0.1% of net assets.
bNon-income producing.
cSecurity was purchased pursuant to Rule 144A under the Securities Act of 1933 and may be sold in transactions exempt from registration only to qualified institutional buyers or in a public offering registered under the Securities Act of 1933. These securities have been deemed liquid under guidelines approved by the Trust’s Board of Trustees. At December 31, 2009, the aggregate value of these securities was $213,986,496, representing 15.25% of net assets.
dThe principal amount is stated in U.S. dollars unless otherwise indicated.
eThe coupon rate shown represents the rate at period end.
fSee Note 1(f) regarding senior floating rate interests.
gA portion or all of the security purchased on a delayed delivery basis. See Note 1(c).
hIncome may be received in additional securities and/or cash.
iSee Note 8 regarding defaulted securities.
jPerpetual security with no stated maturity date.
kSee Note 10 regarding other considerations.
lPrincipal amount of security is adjusted for inflation. See Note 1(h).
mA supranational organization is an entity formed by two or more central governments through international treaties.
nThe principal amount is stated in original face, and scheduled paydowns are reflected in the market price on ex-date.
oPrincipal amount is stated in 100 Mexican Peso Units.
pSecurity was purchased pursuant to Regulation S under the Securities Act of 1933, which exempts from registration securities offered and sold outside of the United States. Such a security cannot be sold in the United States without either an effective registration statement filed pursuant to the Securities Act of 1933, or pursuant to an exemption from registration. This security has been deemed liquid under guidelines approved by the Trust’s Board of Trustees. At December 31, 2009, the value of this security was $2,974,300, representing 0.21% of net assets.
qPrincipal amount is stated in 1,000 Brazilian Real Units.
rRedemption price at maturity is adjusted for inflation. See Note 1(h).
sThe security is traded on a discount basis with no stated coupon rate.
tSee Note 7 regarding investments in the Institutional Fiduciary Trust Money Market Portfolio. The rate shown is the annualized seven-day yield at period end.
The accompanying notes are an integral part of these financial statements.
FSI-28
Franklin Templeton Variable Insurance Products Trust
Statement of Investments, December 31, 2009 (continued)
| | | | | | |
| Franklin Strategic Income Securities Fund | | | | | | |
At December 31, 2009, the Fund had the following forward exchange contracts outstanding. See Note 1(d).
| | | | | | | | | | | | | | | | | | | | | |
| Currency | | Counterparty | | Type | | Quantity | | Contract
Amount* | | | | | Settlement
Date | | Unrealized
Appreciation | | Unrealized
Depreciation | |
Mexican Peso | | DBAB | | Sell | | 36,540,000 | | $ | 2,698,073 | | | | | 1/04/10 | | $ | — | | $ | (93,886 | ) |
Mexican Peso | | DBAB | | Buy | | 36,540,000 | | | 2,807,530 | | | | | 1/04/10 | | | — | | | (15,570 | ) |
Euro | | DBAB | | Sell | | 2,187,000 | | | 2,971,040 | | | | | 1/12/10 | | | — | | | (159,482 | ) |
Philippine Peso | | JPHQ | | Buy | | 41,361,000 | | | 887,075 | | | | | 1/13/10 | | | 982 | | | — | |
United States Dollar | | JPHQ | | Buy | | 2,500,000 | | | 1,792,564 | | | EUR | | 1/13/10 | | | — | | | (65,913 | ) |
Euro | | BZWS | | Sell | | 2,912,410 | | | 4,108,449 | | | | | 1/20/10 | | | — | | | (60,387 | ) |
Mexican Peso | | CITI | | Sell | | 3,907,000 | | | 286,605 | | | | | 1/29/10 | | | — | | | (11,022 | ) |
New Zealand Dollar | | UBSW | | Sell | | 394,863 | | | 257,016 | | | | | 1/29/10 | | | — | | | (28,793 | ) |
New Zealand Dollar | | UBSW | | Buy | | 394,863 | | | 291,014 | | | | | 1/29/10 | | | — | | | (5,205 | ) |
Euro | | DBAB | | Sell | | 3,556,000 | | | 5,033,020 | | | | | 2/04/10 | | | — | | | (56,924 | ) |
Euro | | UBSW | | Sell | | 2,151,000 | | | 3,051,387 | | | | | 2/11/10 | | | — | | | (27,443 | ) |
Singapore Dollar | | HSBC | | Sell | | 7,535,000 | | | 5,000,000 | | | | | 2/17/10 | | | — | | | (357,860 | ) |
Singapore Dollar | | BZWS | | Sell | | 7,527,500 | | | 5,000,000 | | | | | 2/17/10 | | | — | | | (352,527 | ) |
Singapore Dollar | | BZWS | | Buy | | 7,527,500 | | | 5,293,228 | | | | | 2/17/10 | | | 59,299 | | | — | |
Singapore Dollar | | HSBC | | Buy | | 7,535,000 | | | 5,298,502 | | | | | 2/17/10 | | | 59,358 | | | — | |
Mexican Peso | | CITI | | Sell | | 5,244,070 | | | 387,722 | | | | | 3/22/10 | | | — | | | (9,344 | ) |
Singapore Dollar | | UBSW | | Sell | | 2,278,000 | | | 1,499,819 | | | | | 3/23/10 | | | — | | | (119,570 | ) |
Singapore Dollar | | UBSW | | Buy | | 2,278,000 | | | 1,601,406 | | | | | 3/23/10 | | | 17,983 | | | — | |
Indian Rupee | | DBAB | | Buy | | 20,841,000 | | | 402,771 | | | | | 4/09/10 | | | 42,756 | | | — | |
Indian Rupee | | DBAB | | Buy | | 44,691,000 | | | 863,094 | | | | | 4/12/10 | | | 92,026 | | | — | |
Indian Rupee | | JPHQ | | Buy | | 30,019,000 | | | 575,407 | | | | | 4/13/10 | | | 66,089 | | | — | |
Indian Rupee | | JPHQ | | Buy | | 29,466,000 | | | 575,395 | | | | | 4/15/10 | | | 54,170 | | | — | |
Indian Rupee | | JPHQ | | Buy | | 14,719,000 | | | 288,495 | | | | | 4/19/10 | | | 25,874 | | | — | |
Indian Rupee | | DBAB | | Buy | | 10,360,000 | | | 201,949 | | | | | 4/19/10 | | | 19,320 | | | — | |
Indian Rupee | | DBAB | | Buy | | 20,931,000 | | | 403,906 | | | | | 4/26/10 | | | 42,855 | | | — | |
Chilean Peso | | CITI | | Buy | | 235,141,000 | | | 400,410 | | | | | 4/27/10 | | | 65,289 | | | — | |
Chilean Peso | | JPHQ | | Buy | | 234,301,000 | | | 400,412 | | | | | 4/27/10 | | | 63,624 | | | — | |
Indian Rupee | | JPHQ | | Buy | | 2,986,000 | | | 57,700 | | | | | 4/27/10 | | | 6,028 | | | — | |
Chilean Peso | | CITI | | Buy | | 377,668,000 | | | 640,658 | | | | | 4/28/10 | | | 107,352 | | | — | |
Chilean Peso | | UBSW | | Buy | | 47,289,000 | | | 80,083 | | | | | 4/28/10 | | | 13,578 | | | — | |
Indian Rupee | | JPHQ | | Buy | | 14,815,000 | | | 288,510 | | | | | 4/28/10 | | | 27,651 | | | — | |
Indian Rupee | | JPHQ | | Buy | | 14,829,000 | | | 288,502 | | | | | 4/30/10 | | | 27,901 | | | — | |
Euro | | DBAB | | Sell | | 683,564 | | | 1,021,586 | | | | | 5/20/10 | | | 43,439 | | | — | |
Indian Rupee | | DBAB | | Buy | | 28,359,000 | | | 577,824 | | | | | 6/01/10 | | | 25,515 | | | — | |
Indian Rupee | | HSBC | | Buy | | 841,000 | | | 17,340 | | | | | 6/02/10 | | | 550 | | | — | |
Indian Rupee | | HSBC | | Buy | | 4,160,000 | | | 86,667 | | | | | 6/03/10 | | | 1,821 | | | — | |
Indian Rupee | | HSBC | | Buy | | 27,770,000 | | | 577,819 | | | | | 6/04/10 | | | 12,827 | | | — | |
Indian Rupee | | DBAB | | Buy | | 13,885,000 | | | 288,910 | | | | | 6/07/10 | | | 6,334 | | | — | |
Indian Rupee | | DBAB | | Buy | | 7,004,000 | | | 145,311 | | | | | 6/08/10 | | | 3,605 | | | — | |
Indian Rupee | | HSBC | | Buy | | 5,576,000 | | | 115,565 | | | | | 6/08/10 | | | 2,990 | | | — | |
Indian Rupee | | DBAB | | Buy | | 5,655,000 | | | 116,238 | | | | | 6/10/10 | | | 3,974 | | | — | |
Indian Rupee | | HSBC | | Buy | | 5,667,000 | | | 116,246 | | | | | 6/11/10 | | | 4,210 | | | — | |
Indian Rupee | | BZWS | | Buy | | 8,457,000 | | | 174,371 | | | | | 6/11/10 | | | 5,389 | | | — | |
Indian Rupee | | DBAB | | Buy | | 14,156,000 | | | 290,618 | | | | | 6/16/10 | | | 10,143 | | | — | |
Indian Rupee | | DBAB | | Buy | | 12,894,000 | | | 261,542 | | | | | 6/21/10 | | | 12,283 | | | — | |
Euro | | UBSW | | Sell | | 4,274,000 | | | 5,960,264 | | | | | 6/29/10 | | | — | | | (154,792 | ) |
New Zealand Dollar | | DBAB | | Sell | | 9,750,548 | | | 6,000,000 | | | | | 7/06/10 | | | — | | | (968,523 | ) |
New Zealand Dollar | | DBAB | | Buy | | 1,030,548 | | | 754,052 | | | | | 7/06/10 | | | — | | | (17,540 | ) |
New Zealand Dollar | | DBAB | | Buy | | 8,720,000 | | | 6,042,960 | | | | | 7/06/10 | | | 189,050 | | | — | |
New Zealand Dollar | | DBAB | | Sell | | 979,356 | | | 630,215 | | | | | 7/30/10 | | | — | | | (68,076 | ) |
New Zealand Dollar | | DBAB | | Buy | | 979,356 | | | 714,930 | | | | | 7/30/10 | | | — | | | (16,639 | ) |
New Zealand Dollar | | DBAB | | Sell | | 975,630 | | | 626,696 | | | | | 8/03/10 | | | — | | | (68,668 | ) |
New Zealand Dollar | | BZWS | | Sell | | 381,918 | | | 245,192 | | | | | 8/03/10 | | | — | | | (27,014 | ) |
New Zealand Dollar | | BZWS | | Buy | | 381,918 | | | 277,502 | | | | | 8/03/10 | | | — | | | (5,296 | ) |
FSI-29
Franklin Templeton Variable Insurance Products Trust
Statement of Investments, December 31, 2009 (continued)
| | | | | | |
| Franklin Strategic Income Securities Fund | | | | | | |
| | | | | | | | | | | | | | | | | | | | |
| Currency | | Counterparty | | Type | | Quantity | | Contract
Amount* | | | | Settlement
Date | | Unrealized
Appreciation | | Unrealized
Depreciation | |
New Zealand Dollar | | DBAB | | Sell | | 386,535 | | $ | 246,957 | | | | 8/04/10 | | $ | — | | $ | (28,512 | ) |
New Zealand Dollar | | BZWS | | Sell | | 352,796 | | | 226,495 | | | | 8/04/10 | | | — | | | (24,930 | ) |
New Zealand Dollar | | DBAB | | Buy | | 386,535 | | | 282,054 | | | | 8/04/10 | | | — | | | (6,585 | ) |
New Zealand Dollar | | HSBC | | Sell | | 10,696,000 | | | 6,918,173 | | | | 8/05/10 | | | — | | | (703,738 | ) |
New Zealand Dollar | | HSBC | | Buy | | 10,696,000 | | | 7,799,523 | | | | 8/05/10 | | | — | | | (177,613 | ) |
New Zealand Dollar | | CITI | | Sell | | 968,880 | | | 632,703 | | | | 8/05/10 | | | — | | | (57,716 | ) |
New Zealand Dollar | | DBAB | | Sell | | 526,935 | | | 343,456 | | | | 8/05/10 | | | — | | | (32,035 | ) |
Indonesian Rupiah | | HSBC | | Buy | | 41,320,000,000 | | | 4,000,000 | | | | 8/06/10 | | | 185,552 | | | — | |
New Zealand Dollar | | CITI | | Sell | | 695,629 | | | 454,604 | | | | 8/06/10 | | | — | | | (41,049 | ) |
New Zealand Dollar | | FBCO | | Sell | | 347,171 | | | 226,095 | | | | 8/06/10 | | | — | | | (21,273 | ) |
New Zealand Dollar | | CITI | | Sell | | 686,387 | | | 451,272 | | | | 8/09/10 | | | — | | | (37,653 | ) |
New Zealand Dollar | | DBAB | | Sell | | 689,485 | | | 453,543 | | | | 8/09/10 | | | — | | | (37,589 | ) |
New Zealand Dollar | | FBCO | | Sell | | 678,558 | | | 447,136 | | | | 8/09/10 | | | — | | | (36,213 | ) |
New Zealand Dollar | | FBCO | | Sell | | 679,748 | | | 451,441 | | | | 8/11/10 | | | — | | | (32,661 | ) |
New Zealand Dollar | | DBAB | | Sell | | 3,696,487 | | | 2,408,776 | | | | 8/12/10 | | | — | | | (223,527 | ) |
New Zealand Dollar | | DBAB | | Sell | | 1,940,000 | | | 1,259,254 | | | | 8/13/10 | | | — | | | (122,104 | ) |
New Zealand Dollar | | DBAB | | Sell | | 2,046,000 | | | 1,350,565 | | | | 8/16/10 | | | — | | | (105,845 | ) |
Brazilian Real | | DBAB | | Buy | | 231,000 | | | 11,218,977 | | JPY | | 8/17/10 | | | 4,915 | | | — | |
New Israeli Shekel | | CITI | | Buy | | 2,500,000 | | | 659,735 | | | | 8/17/10 | | | — | | | (1,519 | ) |
Japanese Yen | | UBSW | | Sell | | 32,055,000 | | | 337,933 | | | | 8/17/10 | | | — | | | (7,634 | ) |
Brazilian Real | | DBAB | | Buy | | 171,000 | | | 8,233,650 | | JPY | | 8/18/10 | | | 4,383 | | | — | |
Chilean Peso | | JPHQ | | Buy | | 1,543,470,600 | | | 2,820,000 | | | | 8/18/10 | | | 246,972 | | | — | |
Japanese Yen | | JPHQ | | Sell | | 15,928,000 | | | 168,961 | | | | 8/18/10 | | | — | | | (2,753 | ) |
Brazilian Real | | DBAB | | Buy | | 256,000 | | | 12,033,536 | | JPY | | 8/19/10 | | | 9,683 | | | — | |
Chilean Peso | | JPHQ | | Buy | | 509,866,000 | | | 922,000 | | | | 8/19/10 | | | 91,143 | | | — | |
New Israeli Shekel | | CITI | | Buy | | 1,250,000 | | | 329,772 | | | | 8/19/10 | | | — | | | (670 | ) |
New Israeli Shekel | | DBAB | | Buy | | 250,000 | | | 65,859 | | | | 8/19/10 | | | — | | | (38 | ) |
New Israeli Shekel | | CITI | | Buy | | 1,251,000 | | | 329,124 | | | | 8/19/10 | | | 241 | | | — | |
Japanese Yen | | HSBC | | Sell | | 15,854,000 | | | 168,516 | | | | 8/19/10 | | | — | | | (2,404 | ) |
Euro | | BZWS | | Sell | | 2,124,000 | | | 3,001,318 | | | | 8/20/10 | | | — | | | (36,297 | ) |
Euro | | UBSW | | Sell | | 1,750,000 | | | 2,466,888 | | | | 8/20/10 | | | — | | | (35,856 | ) |
New Israeli Shekel | | CITI | | Buy | | 959,500 | | | 251,040 | | | | 8/20/10 | | | 1,576 | | | — | |
Japanese Yen | | DBAB | | Sell | | 15,915,000 | | | 168,523 | | | | 8/20/10 | | | — | | | (3,058 | ) |
Japanese Yen | | BZWS | | Sell | | 15,895,000 | | | 168,776 | | | | 8/20/10 | | | — | | | (2,589 | ) |
Euro | | UBSW | | Sell | | 1,750,000 | | | 2,475,305 | | | | 8/23/10 | | | — | | | (27,376 | ) |
New Israeli Shekel | | CITI | | Buy | | 1,637,500 | | | 429,429 | | | | 8/23/10 | | | 1,677 | | | — | |
Japanese Yen | | CITI | | Sell | | 31,757,000 | | | 337,544 | | | | 8/23/10 | | | — | | | (4,852 | ) |
Japanese Yen | | FBCO | | Sell | | 31,524,000 | | | 337,543 | | | | 8/23/10 | | | — | | | (2,341 | ) |
Japanese Yen | | JPHQ | | Sell | | 31,689,000 | | | 337,539 | | | | 8/24/10 | | | — | | | (4,131 | ) |
Japanese Yen | | BZWS | | Sell | | 31,584,000 | | | 337,544 | | | | 8/24/10 | | | — | | | (2,994 | ) |
New Zealand Dollar | | FBCO | | Sell | | 1,598,800 | | | 1,054,217 | | | | 8/24/10 | | | — | | | (82,977 | ) |
Japanese Yen | | DBAB | | Sell | | 15,708,000 | | | 168,776 | | | | 8/25/10 | | | — | | | (590 | ) |
New Zealand Dollar | | DBAB | | Sell | | 1,591,000 | | | 1,063,584 | | | | 8/27/10 | | | — | | | (67,733 | ) |
Brazilian Real | | DBAB | | Buy | | 171,000 | | | 7,989,633 | | JPY | | 8/31/10 | | | 6,701 | | | — | |
Euro | | DBAB | | Sell | | 1,390,000 | | | 1,993,260 | | | | 9/01/10 | | | 5,565 | | | — | |
Japanese Yen | | JPHQ | | Sell | | 15,743,000 | | | 168,771 | | | | 9/01/10 | | | — | | | (998 | ) |
Mexican Peso | | DBAB | | Sell | | 26,215,919 | | | 1,880,491 | | | | 9/01/10 | | | — | | | (62,716 | ) |
Brazilian Real | | DBAB | | Buy | | 256,000 | | | 11,836,672 | | JPY | | 9/02/10 | | | 11,302 | | | — | |
Japanese Yen | | HSBC | | Sell | | 15,578,000 | | | 168,770 | | | | 9/02/10 | | | 778 | | | — | |
Euro | | BZWS | | Sell | | 2,785,000 | | | 3,966,954 | | | | 9/07/10 | | | — | | | (15,388 | ) |
Japanese Yen | | HSBC | | Sell | | 23,462,000 | | | 253,156 | | | | 9/09/10 | | | 107 | | | — | |
Japanese Yen | | DBAB | | Sell | | 19,230,000 | | | 209,486 | | | | 9/10/10 | | | 2,078 | | | — | |
Japanese Yen | | HSBC | | Sell | | 23,382,000 | | | 253,162 | | | | 9/10/10 | | | 971 | | | — | |
Japanese Yen | | UBSW | | Sell | | 15,974,000 | | | 174,572 | | | | 9/13/10 | | | 2,271 | | | — | |
Brazilian Real | | DBAB | | Buy | | 384,000 | | | 17,904,883 | | JPY | | 9/15/10 | | | 14,639 | | | — | |
Japanese Yen | | UBSW | | Sell | | 18,929,000 | | | 209,482 | | | | 9/15/10 | | | 5,299 | | | — | |
FSI-30
Franklin Templeton Variable Insurance Products Trust
Statement of Investments, December 31, 2009 (continued)
| | | | | | |
| Franklin Strategic Income Securities Fund | | | | | | |
| | | | | | | | | | | | | | | | | | | | |
| Currency | | Counterparty | | Type | | Quantity | | Contract
Amount* | | | | Settlement
Date | | Unrealized
Appreciation | | Unrealized
Depreciation | |
Japanese Yen | | HSBC | | Sell | | 12,709,000 | | $ | 139,656 | | | | 9/15/10 | | $ | 2,567 | | $ | — | |
Japanese Yen | | BZWS | | Sell | | 12,568,000 | | | 139,652 | | | | 9/15/10 | | | 4,084 | | | — | |
Japanese Yen | | HSBC | | Sell | | 18,851,000 | | | 209,479 | | | | 9/16/10 | | | 6,133 | | | — | |
Japanese Yen | | DBAB | | Sell | | 6,319,000 | | | 69,823 | | | | 9/16/10 | | | 1,660 | | | — | |
Japanese Yen | | DBAB | | Sell | | 634,550,000 | | | 7,000,000 | | | | 9/17/10 | | | 154,971 | | | — | |
United States Dollar | | UBSW | | Buy | | 3,000,000 | | | 2,044,850 | | EUR | | 9/20/10 | | | 76,332 | | | — | |
Japanese Yen | | HSBC | | Sell | | 6,266,000 | | | 69,824 | | | | 9/21/10 | | | 2,226 | | | — | |
Japanese Yen | | JPHQ | | Sell | | 12,639,000 | | | 139,657 | | | | 9/21/10 | | | 3,307 | | | — | |
Japanese Yen | | JPHQ | | Sell | | 3,050,000 | | | 33,704 | | | | 9/24/10 | | | 798 | | | — | |
Japanese Yen | | JPHQ | | Sell | | 302,000 | | | 3,356 | | | | 9/27/10 | | | 98 | | | — | |
Euro | | UBSW | | Sell | | 2,850,000 | | | 4,164,990 | | | | 10/04/10 | | | 90,525 | | | — | |
Philippine Peso | | DBAB | | Buy | | 21,010,000 | | | 435,477 | | | | 10/04/10 | | | 3,443 | | | — | |
Philippine Peso | | HSBC | | Buy | | 16,853,000 | | | 348,382 | | | | 10/04/10 | | | 3,694 | | | — | |
Philippine Peso | | DBAB | | Buy | | 25,119,000 | | | 522,561 | | | | 10/05/10 | | | 2,172 | | | — | |
Philippine Peso | | HSBC | | Buy | | 25,126,000 | | | 522,580 | | | | 10/05/10 | | | 2,300 | | | — | |
Philippine Peso | | JPHQ | | Buy | | 6,636,000 | | | 139,353 | | | | 10/06/10 | | | — | | | (735 | ) |
Philippine Peso | | DBAB | | Buy | | 20,621,000 | | | 435,483 | | | | 10/07/10 | | | — | | | (4,757 | ) |
Euro | | BZWS | | Sell | | 2,749,000 | | | 4,047,903 | | | | 10/08/10 | | | 117,911 | | | — | |
Philippine Peso | | DBAB | | Buy | | 16,501,000 | | | 348,387 | | | | 10/08/10 | | | — | | | (3,737 | ) |
Philippine Peso | | HSBC | | Buy | | 16,532,000 | | | 348,383 | | | | 10/08/10 | | | — | | | (3,085 | ) |
Philippine Peso | | JPHQ | | Buy | | 8,232,000 | | | 174,182 | | | | 10/08/10 | | | — | | | (2,243 | ) |
Philippine Peso | | CITI | | Buy | | 8,254,000 | | | 174,194 | | | | 10/08/10 | | | — | | | (1,796 | ) |
Philippine Peso | | DBAB | | Buy | | 4,913,000 | | | 104,510 | | | | 10/12/10 | | | — | | | (1,915 | ) |
Philippine Peso | | JPHQ | | Buy | | 18,311,000 | | | 391,264 | | | | 10/13/10 | | | — | | | (8,908 | ) |
Philippine Peso | | HSBC | | Buy | | 8,192,000 | | | 174,187 | | | | 10/13/10 | | | — | | | (3,128 | ) |
Euro | | DBAB | | Sell | | 2,030,000 | | | 3,019,016 | | | | 10/19/10 | | | 117,076 | | | — | |
Japanese Yen | | DBAB | | Sell | | 722,080,000 | | | 8,000,000 | | | | 10/19/10 | | | 203,520 | | | — | |
Philippine Peso | | JPHQ | | Buy | | 237,550,000 | | | 5,000,000 | | | | 10/22/10 | | | — | | | (42,004 | ) |
Chinese Yuan | | HSBC | | Buy | | 4,344,052 | | | 659,809 | | | | 10/25/10 | | | — | | | (19,334 | ) |
Japanese Yen | | JPHQ | | Sell | | 270,990,000 | | | 3,000,000 | | | | 10/25/10 | | | 73,472 | | | — | |
Chinese Yuan | | HSBC | | Buy | | 7,365,718 | | | 1,115,646 | | | | 10/26/10 | | | — | | | (29,625 | ) |
Euro | | BZWS | | Sell | | 1,993,000 | | | 2,981,727 | | | | 10/26/10 | | | 132,782 | | | — | |
Chinese Yuan | | HSBC | | Buy | | 4,405,928 | | | 666,001 | | | | 10/27/10 | | | — | | | (16,355 | ) |
Euro | | UBSW | | Sell | | 2,679,000 | | | 4,011,936 | | | | 10/27/10 | | | 182,390 | | | — | |
Chinese Yuan | | HSBC | | Buy | | 73,370,000 | | | 11,000,000 | | | | 10/29/10 | | | — | | | (180,939 | ) |
Japanese Yen | | JPHQ | | Sell | | 360,360,000 | | | 4,000,000 | | | | 11/02/10 | | | 107,301 | | | — | |
Euro | | UBSW | | Sell | | 1,480,440 | | | 2,200,733 | | | | 11/17/10 | | | 84,718 | | | — | |
Philippine Peso | | JPHQ | | Buy | | 191,280,000 | | | 4,000,000 | | | | 11/26/10 | | | — | | | (15,000 | ) |
Euro | | DBAB | | Sell | | 5,029,668 | | | 7,496,720 | | | | 11/29/10 | | | 308,183 | | | — | |
Japanese Yen | | BOFA | | Sell | | 620,288,000 | | | 7,000,006 | | | | 11/29/10 | | | 293,512 | | | — | |
Euro | | UBSW | | Sell | | 3,920,000 | | | 5,857,852 | | | | 12/02/10 | | | 255,368 | | | — | |
Japanese Yen | | BZWS | | Sell | | 257,790,000 | | | 3,000,000 | | | | 12/02/10 | | | 212,523 | | | — | |
Mexican Peso | | CITI | | Sell | | 3,870,000 | | | 284,957 | | | | 12/02/10 | | | 2,034 | | | — | |
Japanese Yen | | UBSW | | Sell | | 351,760,000 | | | 4,000,000 | | | | 12/10/10 | | | 195,420 | | | — | |
Euro | | UBSW | | Sell | | 3,400,000 | | | 4,988,922 | | | | 12/13/10 | | | 129,898 | | | — | |
British Pound | | DBAB | | Sell | | 600,000 | | | 971,700 | | | | 12/15/10 | | | 4,594 | | | — | |
Euro | | DBAB | | Sell | | 486,875 | | | 709,815 | | | | 12/15/10 | | | 14,017 | | | — | |
Euro | | CITI | | Sell | | 3,868,000 | | | 5,655,635 | | | | 12/16/10 | | | 127,866 | | | — | |
Euro | | UBSW | | Sell | | 2,137,312 | | | 3,097,286 | | | | 12/17/10 | | | 42,863 | | | — | |
Philippine Peso | | HSBC | | Buy | | 142,980,000 | | | 3,000,000 | | | | 12/28/10 | | | — | | | (26,206 | ) |
| | | | | | | | | | | | | | | | | |
Unrealized appreciation (depreciation) | | | | | | | | | | | | | | 4,669,876 | | | (5,104,198 | ) |
| | | | | | | | | | | | | | | | | |
Net unrealized appreciation (depreciation) | | | | | | | | | | | | | $ | — | | $ | (434,322 | ) |
| | | | | | | | | | | | | | | | | |
*In U.S. dollars unless otherwise indicated.
See Abbreviations on page FSI-44.
FSI-31
The accompanying notes are an integral part of these financial statements.
Franklin Templeton Variable Insurance Products Trust
Financial Statements
Statement of Assets and Liabilities
December 31, 2009
| | | | |
| | | Franklin Strategic
Income
Securities Fund | |
Assets: | | | | |
Investments in securities: | | | | |
Cost - Unaffiliated issuers | | $ | 1,302,576,702 | |
Cost - Sweep Money Fund (Note 7) | | | 43,133,443 | |
| | | | |
Total cost of investments | | $ | 1,345,710,145 | |
| | | | |
Value - Unaffiliated issuers | | $ | 1,354,965,382 | |
Value - Sweep Money Fund (Note 7) | | | 43,133,443 | |
| | | | |
Total value of investments | | | 1,398,098,825 | |
Cash | | | 1,065,469 | |
Receivables: | | | | |
Investment securities sold | | | 3,446,194 | |
Capital shares sold | | | 597,237 | |
Interest | | | 19,030,170 | |
Due from Brokers | | | 1,230,000 | |
Unrealized appreciation on forward exchange contracts | | | 4,669,876 | |
Other assets | | | 157 | |
| | | | |
Total assets | | | 1,428,137,928 | |
| | | | |
Liabilities: | | | | |
Payables: | | | | |
Investment securities purchased | | | 16,506,506 | |
Capital shares redeemed | | | 1,859,049 | |
Affiliates | | | 758,732 | |
Unrealized depreciation on forward exchange contracts | | | 5,104,198 | |
Accrued expenses and other liabilities | | | 282,834 | |
| | | | |
Total liabilities | | | 24,511,319 | |
| | | | |
Net assets, at value | | $ | 1,403,626,609 | |
| | | | |
Net assets consist of: | | | | |
Paid-in capital | | $ | 1,359,161,329 | |
Undistributed net investment income | | | 66,211,757 | |
Net unrealized appreciation (depreciation) | | | 51,988,558 | |
Accumulated net realized gain (loss) | | | (73,735,035 | ) |
| | | | |
Net assets, at value | | $ | 1,403,626,609 | |
| | | | |
The accompanying notes are an integral part of these financial statements.
FSI-32
Franklin Templeton Variable Insurance Products Trust
Financial Statements (continued)
Statement of Assets and Liabilities (continued)
December 31, 2009
| | | |
| | | Franklin Strategic
Income
Securities Fund |
Class 1: | | | |
Net assets, at value | | $ | 1,173,313,059 |
| | | |
Shares outstanding | | | 95,539,698 |
| | | |
Net asset value and maximum offering price per share | | $ | 12.28 |
| | | |
Class 2: | | | |
Net assets, at value | | $ | 68,239,895 |
| | | |
Shares outstanding | | | 5,663,098 |
| | | |
Net asset value and maximum offering price per share | | $ | 12.05 |
| | | |
Class 4: | | | |
Net assets, at value | | $ | 162,073,655 |
| | | |
Shares outstanding | | | 13,287,506 |
| | | |
Net asset value and maximum offering price per share | | $ | 12.20 |
| | | |
The accompanying notes are an integral part of these financial statements.
FSI-33
Franklin Templeton Variable Insurance Products Trust
Financial Statements (continued)
Statement of Operations
for the year ended December 31, 2009
| | | | |
| | | Franklin Strategic
Income
Securities Fund | |
Investment income: | | | | |
Dividends: | | | | |
Unaffiliated issuers | | $ | 1,201,431 | |
Sweep Money Fund (Note 7) | | | 22,812 | |
Interest | | | 79,335,528 | |
| | | | |
Total investment income | | | 80,559,771 | |
| | | | |
Expenses: | | | | |
Management fees (Note 3a) | | | 4,211,722 | |
Administrative fees (Note 3b) | | | 2,398,126 | |
Distribution fees: (Note 3c) | | | | |
Class 2 | | | 123,448 | |
Class 4 | | | 383,282 | |
Unaffiliated transfer agent fees | | | 1,151 | |
Custodian fees (Note 4) | | | 113,252 | |
Reports to shareholders | | | 84,541 | |
Professional fees | | | 121,347 | |
Trustees’ fees and expenses | | | 7,725 | |
Other | | | 75,739 | |
| | | | |
Total expenses | | | 7,520,333 | |
Expense reductions (Note 4) | | | (2,083 | ) |
| | | | |
Net expenses | | | 7,518,250 | |
| | | | |
Net investment income | | | 73,041,521 | |
| | | | |
Realized and unrealized gains (losses): | | | | |
Net realized gain (loss) from: | | | | |
Investments | | | (19,356,913 | ) |
Foreign currency transactions | | | 17,520,126 | |
| | | | |
Net realized gain (loss) | | | (1,836,787 | ) |
| | | | |
Net change in unrealized appreciation (depreciation) on: | | | | |
Investments | | | 224,398,517 | |
Translation of other assets and liabilities denominated in foreign currencies | | | (20,299,048 | ) |
| | | | |
Net change in unrealized appreciation (depreciation) | | | 204,099,469 | |
| | | | |
Net realized and unrealized gain (loss) | | | 202,262,682 | |
| | | | |
Net increase (decrease) in net assets resulting from operations | | $ | 275,304,203 | |
| | | | |
The accompanying notes are an integral part of these financial statements.
FSI-34
Franklin Templeton Variable Insurance Products Trust
Financial Statements (continued)
Statements of Changes in Net Assets
| | | | | | | | |
| | | Franklin Strategic Income
Securities Fund | |
| | | Year Ended December 31, | |
| | | 2009 | | | 2008 | |
| | | | |
Increase (decrease) in net assets: | | | | | | | | |
Operations: | | | | | | | | |
Net investment income | | $ | 73,041,521 | | | $ | 64,527,920 | |
Net realized gain (loss) from investments and foreign currency transactions | | | (1,836,787 | ) | | | (45,932,001 | ) |
Net change in unrealized appreciation (depreciation) on investments and translation of other assets and liabilities denominated in foreign currencies | | | 204,099,469 | | | | (149,242,637 | ) |
| | | | |
Net increase (decrease) in net assets resulting from operations | | | 275,304,203 | | | | (130,646,718 | ) |
| | | | |
Distributions to shareholders from: | | | | | | | | |
Net investment income and net foreign currency gains: | | | | | | | | |
Class 1 | | | (82,420,054 | ) | | | (75,447,333 | ) |
Class 2 | | | (3,695,069 | ) | | | (2,134,730 | ) |
Class 4 | | | (8,181,980 | ) | | | (378,318 | ) |
Net realized gains: | | | | | | | | |
Class 1 | | | — | | | | (2,612,141 | ) |
Class 2 | | | — | | | | (75,424 | ) |
Class 4 | | | — | | | | (13,098 | ) |
| | | | |
Total distributions to shareholders | | | (94,297,103 | ) | | | (80,661,044 | ) |
| | | | |
Capital share transactions: (Note 2) | | | | | | | | |
Class 1 | | | 112,467,004 | | | | 17,384,945 | |
Class 2 | | | 27,727,705 | | | | 14,711,199 | |
Class 4 | | | 86,145,347 | | | | 64,028,404 | |
| | | | |
Total capital share transactions | | | 226,340,056 | | | | 96,124,548 | |
| | | | |
Net increase (decrease) in net assets | | | 407,347,156 | | | | (115,183,214 | ) |
Net assets: | | | | | | | | |
Beginning of year | | | 996,279,453 | | | | 1,111,462,667 | |
| | | | |
End of year | | $ | 1,403,626,609 | | | $ | 996,279,453 | |
| | | | |
Undistributed net investment income included in net assets: | | | | | | | | |
End of year | | $ | 66,211,757 | | | $ | 73,893,369 | |
| | | | |
The accompanying notes are an integral part of these financial statements.
FSI-35
Franklin Templeton Variable Insurance Products Trust
Notes to Financial Statements
Franklin Strategic Income Securities Fund
1. ORGANIZATION AND SIGNIFICANT ACCOUNTING POLICIES
Franklin Templeton Variable Insurance Products Trust (Trust) is registered under the Investment Company Act of 1940, as amended, (1940 Act) as an open-end investment company, consisting of twenty-two separate funds. The Franklin Strategic Income Securities Fund (Fund) is included in this report. The financial statements of the remaining funds in the Trust are presented separately. Shares of the Fund are generally sold only to insurance company separate accounts to fund the benefits of variable life insurance policies or variable annuity contracts. At December 31, 2009, 95.99% of the Fund’s shares were held through one insurance company. The Fund offers three classes of shares: Class 1, Class 2, and Class 4. Each class of shares differs by its distribution fees, voting rights on matters affecting a single class and its exchange privilege.
The following summarizes the Fund’s significant accounting policies.
a. Security Valuation
Equity and other securities listed on a securities exchange or on the NASDAQ National Market System are valued at the last quoted sale price or the official closing price of the day, respectively. Over-the-counter securities and listed securities for which there is no reported sale are valued within the range of the most recent quoted bid and ask prices. Securities that trade in multiple markets or on multiple exchanges are valued according to the broadest and most representative market. Certain equity securities are valued based upon fundamental characteristics or relationships to similar securities. Investments in open-end mutual funds and are valued at the closing net asset value.
Corporate debt securities, government securities, municipal securities, mortgage backed securities, asset-backed securities, collateralized debt obligations and other debt securities generally trade in the over-the-counter market rather than on a securities exchange. The Fund may utilize independent pricing services, quotations from bond dealers, and information with respect to bond and note transactions, to assist in determining a current market value for each security. The Fund’s pricing services may use valuation models or matrix pricing which considers information with respect to comparable bond and note transactions, quotations from bond dealers, or by reference to other securities that are considered comparable in such characteristics as rating, interest rate and maturity date, option adjusted spread models, prepayment projections, interest rate spreads and yield curves, to determine current value. Debt securities denominated in a foreign currency are converted into their U.S. dollar equivalent at the foreign exchange rate in effect at the close of the NYSE on the date that the values of the foreign debt securities are determined.
Senior secured corporate loans with floating or variable interest rates generally trade in the over-the-counter market rather than on a securities exchange. The Fund may utilize independent pricing services, quotations from loan dealers and other financial institutions, and information with respect to bond and note transactions, to assist in determining a current market value for each security. The Fund’s pricing services use independent market quotations from loan dealers or financial institutions and may incorporate valuation methodologies that consider multiple bond characteristics such as dealer quotes, issuer type, coupon, maturity, weighted average maturity, interest rate spreads and yield curves, cash flow and credit risk/quality analysis, to determine current value.
The Fund has procedures to determine the fair value of individual securities and other assets for which market prices are not readily available or which may not be reliably priced. Methods for valuing these securities may include: fundamental analysis based upon the underlying investment book value, anticipated future cash flows, market changes in comparable or similar securities, matrix pricing, discounts from market prices of similar securities, or discounts applied due to the nature and duration of restrictions on the disposition of the securities. Due to the inherent uncertainty of valuations of such securities, the fair values may differ significantly from the values that would have been used had a ready market for such investments existed. Occasionally, events occur between the time at which trading in a security is completed and the close of the NYSE that might call into question the availability (including the reliability) of the value of a portfolio security held by the Fund. These price movements are measured against established trigger thresholds for each specific market proxy to assist in determining if an event has occurred. If such an event occurs, the securities may be valued using fair value procedures, which may include the use of independent pricing services. All security valuation procedures are approved by the Fund’s Board of Trustees.
FSI-36
Franklin Templeton Variable Insurance Products Trust
Notes to Financial Statements (continued)
Franklin Strategic Income Securities Fund
1. ORGANIZATION AND SIGNIFICANT ACCOUNTING POLICIES (continued)
b. Foreign Currency Translation
Portfolio securities and other assets and liabilities denominated in foreign currencies are translated into U.S. dollars based on the exchange rate of such currencies against U.S. dollars on the date of valuation. The Fund may enter into foreign currency exchange contracts to facilitate transactions denominated in a foreign currency. Purchases and sales of securities, income and expense items denominated in foreign currencies are translated into U.S. dollars at the exchange rate in effect on the transaction date. Occasionally, events may impact the availability or reliability of foreign exchange rates used to convert the U.S. dollar equivalent value. If such an event occurs, the foreign exchange rate will be valued at fair value using procedures established and approved by the Fund’s Board of Trustees.
The Fund does not separately report the effect of changes in foreign exchange rates from changes in market prices on securities held. Such changes are included in net realized and unrealized gain or loss from investments on the Statement of Operations.
Realized foreign exchange gains or losses arise from sales of foreign currencies, currency gains or losses realized between the trade and settlement dates on securities transactions and the difference between the recorded amounts of dividends, interest, and foreign withholding taxes and the U.S. dollar equivalent of the amounts actually received or paid. Net unrealized foreign exchange gains and losses arise from changes in foreign exchange rates on foreign denominated assets and liabilities other than investments in securities held at the end of the reporting period.
c. Securities Purchased on a Delayed Delivery Basis
The Fund may purchase securities on a delayed delivery basis, with payment and delivery scheduled for a future date. These transactions are subject to market fluctuations and are subject to the risk that the value at delivery may be more or less than the trade date purchase price. Although the Fund will generally purchase these securities with the intention of holding the securities, it may sell the securities before the settlement date. Sufficient assets have been segregated for these securities.
d. Derivative Financial Instruments
The Fund may invest in derivative financial instruments (derivatives) in order to manage risk or gain exposure to various other investments or markets. Derivatives are financial contracts based on an underlying or notional amount, require no initial investment or an initial net investment that is smaller than would normally be required to have a similar response to changes in market factors, and require or permit net settlement. Derivatives may contain various risks including the potential inability of the counterparty to fulfill their obligations under the terms of the contract, the potential for an illiquid secondary market, and the potential for market movements which may expose the Fund to gains or losses in excess of the amounts shown on the Statement of Assets and Liabilities.
Derivatives are marked to market daily based upon quotations from market makers or the Fund’s independent pricing services and the Fund’s net benefit or obligation under the contract, as measured by the fair market value of the contract, is included in net assets. Realized gain and loss and unrealized appreciation and depreciation on these contracts for the period are included in the Statement of Operations.
The Fund generally enters into forward exchange contracts in order to hedge against fluctuations in foreign exchange rates or to gain exposure to certain foreign currencies. A forward exchange contract is an agreement between the Fund and a counterparty to buy or sell a foreign currency for a specific exchange rate on a future date. Pursuant to the terms of the forward exchange contracts, cash or securities may be required to be deposited as collateral.
See Note 9 regarding other derivative information.
FSI-37
Franklin Templeton Variable Insurance Products Trust
Notes to Financial Statements (continued)
Franklin Strategic Income Securities Fund
1. ORGANIZATION AND SIGNIFICANT ACCOUNTING POLICIES (continued)
e. Mortgage Dollar Rolls
The Fund may enter into mortgage dollar rolls, typically on a to-be-announced (TBA) basis. Mortgage dollar rolls are agreements between the Fund and a financial institution to simultaneously sell and repurchase mortgage-backed securities at a future date. Gains or losses are realized on the initial sale, and the difference between the repurchase price and the sale price is recorded as an unrealized gain or loss to the Fund upon entering into the mortgage dollar roll. In addition, the Fund may invest the cash proceeds that are received from the initial sale. During the period between the sale and repurchase, the Fund is not entitled to principal and interest paid on the mortgage backed securities. The risks of mortgage dollar roll transactions include the potential inability of the counterparty to fulfill its obligations.
f. Senior Floating Rate Interests
Senior secured corporate loans pay interest at rates which are periodically reset by reference to a base lending rate plus a spread. These base lending rates are generally the prime rate offered by a designated U.S. bank or the London InterBank Offered Rate (LIBOR). Senior secured corporate loans often require prepayment of principal from excess cash flows or at the discretion of the borrower. As a result, actual maturity may be substantially less than the stated maturity.
Senior secured corporate loans in which the Fund invests are generally readily marketable, but may be subject to some restrictions on resale.
g. Income Taxes
No provision has been made for U.S. income taxes because it is the Fund’s policy to qualify as a regulated investment company under the Internal Revenue Code and to distribute to shareholders substantially all of its taxable income and net realized gains.
The Fund has reviewed the tax positions, taken on federal income tax returns, for each of the three open tax years and as of December 31, 2009, and has determined that no provision for income tax is required in the Fund’s financial statements.
h. Security Transactions, Investment Income, Expenses and Distributions
Security transactions are accounted for on trade date. Realized gains and losses on security transactions are determined on a specific identification basis. Interest income and estimated expenses are accrued daily. Amortization of premium and accretion of discount on debt securities are included in interest income. Facility fees are recognized as income over the expected term of the loan. Dividend income is recorded on the ex-dividend date. Distributions to shareholders are recorded on the ex-dividend date and are determined according to income tax regulations (tax basis). Distributable earnings determined on a tax basis may differ from earnings recorded in accordance with accounting principles generally accepted in the United States of America. These differences may be permanent or temporary. Permanent differences are reclassified among capital accounts to reflect their tax character. These reclassifications have no impact on net assets or the results of operations. Temporary differences are not reclassified, as they may reverse in subsequent periods.
Common expenses incurred by the Trust are allocated among the funds based on the ratio of net assets of each fund to the combined net assets of the Trust. Fund specific expenses are charged directly to the fund that incurred the expense.
Realized and unrealized gains and losses and net investment income, not including class specific expenses, are allocated daily to each class of shares based upon the relative proportion of net assets of each class. Differences in per share distributions, by class, are generally due to differences in class specific expenses.
Inflation-indexed bonds provide an inflation hedge through periodic increases or decreases in the security’s interest accruals and principal redemption value, by amounts corresponding to the current rate of inflation. Any such adjustments, including adjustments to principal redemption value, are recorded as interest income.
FSI-38
Franklin Templeton Variable Insurance Products Trust
Notes to Financial Statements (continued)
Franklin Strategic Income Securities Fund
1. ORGANIZATION AND SIGNIFICANT ACCOUNTING POLICIES (continued)
i. Accounting Estimates
The preparation of financial statements in accordance with accounting principles generally accepted in the United States of America requires management to make estimates and assumptions that affect the reported amounts of assets and liabilities at the date of the financial statements and the amounts of income and expenses during the reporting period. Actual results could differ from those estimates.
j. Guarantees and Indemnifications
Under the Trust’s organizational documents, its officers and trustees are indemnified by the Trust against certain liabilities arising out of the performance of their duties to the Trust. Additionally, in the normal course of business, the Trust, on behalf of the Fund, enters into contracts with service providers that contain general indemnification clauses. The Trust’s maximum exposure under these arrangements is unknown as this would involve future claims that may be made against the Trust that have not yet occurred. Currently, the Trust expects the risk of loss to be remote.
2. SHARES OF BENEFICIAL INTEREST
At December 31, 2009, there were an unlimited number of shares authorized (without par value). Transactions in the Fund’s shares were as follows:
| | | | | | | | | | | | | | |
| | | Year Ended December 31, | |
| | | 2009 | | | 2008a | |
| Class 1 Shares: | | Shares | | | Amount | | | Shares | | | Amount | |
Shares sold | | 9,412,738 | | | $ | 106,695,495 | | | 6,009,961 | | | $ | 75,187,150 | |
Shares issued in reinvestment of distributions | | 7,520,078 | | | | 82,420,054 | | | 6,504,956 | | | | 78,059,474 | |
Shares redeemed | | (6,784,394 | ) | | | (76,648,545 | ) | | (12,154,687 | ) | | | (135,861,679 | ) |
| | | | |
Net increase (decrease) | | 10,148,422 | | | $ | 112,467,004 | | | 360,230 | | | $ | 17,384,945 | |
| | | | |
Class 2 Shares: | | | | | | | | | | | | | | |
Shares sold | | 2,996,388 | | | $ | 33,743,716 | | | 1,884,648 | | | $ | 21,711,802 | |
Shares issued in reinvestment of distributions | | 343,408 | | | | 3,695,069 | | | 186,984 | | | | 2,210,154 | |
Shares redeemed | | (862,128 | ) | | | (9,711,080 | ) | | (839,920 | ) | | | (9,210,757 | ) |
| | | | |
Net increase (decrease) | | 2,477,668 | | | $ | 27,727,705 | | | 1,231,712 | | | $ | 14,711,199 | |
| | | | |
Class 4 Shares: | | | | | | | | | | | | | | |
Shares sold | | 7,159,387 | | | $ | 81,195,127 | | | 5,781,965 | | | $ | 65,263,343 | |
Shares issued on reinvestment of distributions | | 750,640 | | | | 8,181,980 | | | 32,643 | | | | 391,067 | |
Shares redeemed | | (291,537 | ) | | | (3,231,760 | ) | | (145,592 | ) | | | (1,626,006 | ) |
| | | | |
Net increase (decrease) | | 7,618,490 | | | $ | 86,145,347 | | | 5,669,016 | | | $ | 64,028,404 | |
| | | | |
| a | For the period February 29, 2008 (effective date) to December 31, 2008 for Class 4. |
FSI-39
Franklin Templeton Variable Insurance Products Trust
Notes to Financial Statements (continued)
Franklin Strategic Income Securities Fund
3. TRANSACTIONS WITH AFFILIATES
Franklin Resources, Inc. is the holding company for various subsidiaries that together are referred to as Franklin Templeton Investments. Certain officers and trustees of the Trust are also officers and/or directors of the following subsidiaries:
| | |
| Subsidiary | | Affiliation |
Franklin Advisers, Inc. (Advisers) | | Investment manager |
Franklin Templeton Services, LLC (FT Services) | | Administrative manager |
Franklin Templeton Distributors, Inc. (Distributors) | | Principal underwriter |
Franklin Templeton Investor Services, LLC (Investor Services) | | Transfer agent |
a. Management Fees
The Fund pays an investment management fee to Advisers based on the average daily net assets of the Fund as follows:
| | |
| Annualized Fee Rate | | Net Assets |
| 0.425% | | Up to and including $500 million |
| 0.325% | | Over $500 million, up to and including $1 billion |
| 0.280% | | Over $1 billion, up to and including $1.5 billion |
| 0.235% | | Over $1.5 billion, up to and including $6.5 billion |
| 0.215% | | Over $6.5 billion, up to and including $11.5 billion |
| 0.200% | | Over $11.5 billion, up to and including $16.5 billion |
| 0.190% | | Over $16.5 billion, up to and including $19 billion |
| 0.180% | | Over $19 billion, up to and including $21.5 billion |
| 0.170% | | In excess of $21.5 billion |
b. Administrative Fees
The Fund pays an administrative fee to FT Services of 0.20% per year of the average daily net assets of the Fund.
c. Distribution Fees
The Fund’s Board of Trustees has adopted distribution plans for Class 2 and Class 4 shares pursuant to Rule 12b-1 under the 1940 Act. Under the Fund’s compensation distribution plans, the Fund pays Distributors for costs incurred in connection with the servicing, sale and distribution of the Fund’s shares up to 0.25% and 0.35% per year of its average daily net assets of Class 2 and Class 4, respectively.
d. Transfer Agent Fees
Investor Services, under terms of an agreement, performs shareholder servicing for the Fund and is not paid by the Fund for the services.
4. EXPENSE OFFSET ARRANGEMENT
The Fund has entered into an arrangement with its custodian whereby credits realized as a result of uninvested cash balances are used to reduce a portion of the Fund’s custodian expenses. During the year ended December 31, 2009, the custodian fees were reduced as noted in the Statement of Operations.
FSI-40
Franklin Templeton Variable Insurance Products Trust
Notes to Financial Statements (continued)
Franklin Strategic Income Securities Fund
5. INCOME TAXES
For tax purposes, capital losses may be carried over to offset future capital gains, if any. At December 31, 2009, the capital loss carryforwards were as follows:
| | | |
Capital loss carryforwards expiring in: | | | |
2016 | | $ | 40,547,914 |
2017 | | | 32,675,865 |
| | | |
| | $ | 73,223,779 |
| | | |
The tax character of distributions paid during the years ended December 31, 2009 and 2008, was as follows:
| | | | | | |
| | | 2009 | | 2008 |
Distributions paid from: | | | | | | |
Ordinary income | | $ | 94,297,103 | | $ | 79,728,267 |
Long term capital gain | | | — | | | 932,777 |
| | | |
| | $ | 94,297,103 | | $ | 80,661,044 |
| | | |
At December 31, 2009, the cost of investments, net unrealized appreciation (depreciation), and undistributed ordinary income for income tax purposes were as follows:
| | | | |
Cost of investments | | $ | 1,349,236,718 | |
| | | | |
| |
Unrealized appreciation | | $ | 77,278,352 | |
Unrealized depreciation | | | (28,416,245 | ) |
| | | | |
Net unrealized appreciation (depreciation) | | $ | 48,862,107 | |
| | | | |
Distributable earnings - undistributed ordinary income | | $ | 69,251,356 | |
| | | | |
Net investment income (loss) differs for financial statement and tax purposes primarily due to differing treatments of defaulted securities, foreign currency transactions, mortgage dollar rolls, paydown losses, payments-in-kind, bond discounts and premiums, and inflation related adjustments on foreign securities.
Net realized gains (losses) differ for financial statement and tax purposes primarily due to differing treatments of wash sales, foreign currency transactions, mortgage dollar rolls, paydown losses, payments-in-kind, bond discounts and premiums, and inflation related adjustments on foreign securities.
6. INVESTMENT TRANSACTIONS
Purchases and sales of investments (excluding short term securities) for the year ended December 31, 2009, aggregated $873,924,853 and $647,159,985, respectively.
7. INVESTMENTS IN INSTITUTIONAL FIDUCIARY TRUST MONEY MARKET PORTFOLIO
The Fund may invest in the Institutional Fiduciary Trust Money Market Portfolio (Sweep Money Fund), an open-end investment company managed by Advisers. Management fees paid by the Fund are reduced on assets invested in the Sweep Money Fund, in an amount not to exceed the management and administrative fees paid by the Sweep Money Fund.
FSI-41
Franklin Templeton Variable Insurance Products Trust
Notes to Financial Statements (continued)
Franklin Strategic Income Securities Fund
8. CREDIT RISK AND DEFAULTED SECURITIES
At December 31, 2009, the Fund had 45.42% of its portfolio invested in high yield, senior secured floating rate notes, or other securities rated below investment grade. These securities may be more sensitive to economic conditions causing greater price volatility and are potentially subject to a greater risk of loss due to default than higher rated securities.
The Fund held defaulted securities and/or other securities for which the income has been deemed uncollectible. At December 31, 2009, the aggregate value of these securities was $16,400,534, representing 1.17% of the Fund’s net assets. The Fund discontinues accruing income on securities for which income has been deemed uncollectible and provides an estimate for losses on interest receivable. The securities have been identified on the accompanying Statement of Investments.
9. OTHER DERIVATIVE INFORMATION
At December 31, 2009, the Fund has invested in derivative contracts which are reflected on the Statement of Assets and Liabilities as follows:
| | | | | | | | | | |
| | | Asset Derivatives | | Liability Derivatives |
Derivative Contracts Not Accounted
for as Hedging Instruments | | Statement of Assets and
Liabilities Location | | Fair
Value
Amount | | Statement of Assets and
Liabilities Location | | Fair
Value
Amount |
Foreign exchange contracts | | Unrealized appreciation on forward exchange contracts | | $ | 4,669,876 | | Unrealized depreciation on forward exchange contracts | | $ | 5,104,198 |
For the year ended December 31, 2009, the effect of derivative contracts on the Fund’s Statement of Operations was as follows:
| | | | | | | | | | | |
Derivative Contracts Not Accounted
for as Hedging Instruments | | Statement of Operations Locations | | Realized Gain
(Loss) for the
Year Ended
December 31, 2009 | | Change in
Unrealized
Appreciation
(Depreciation)
for the
Year Ended
December 31, 2009 | | | Average
Notional
Amount
Outstanding
During the
Yeara |
Foreign exchange contracts | | Net realized gain (loss) from foreign currency transactions/Net change in unrealized appreciation (depreciation) on translation of other assets and liabilities denominated in foreign currencies | | $ | 18,166,843 | | $ | (20,482,591 | ) | | 203,451,409 |
a Notional amount represents the U.S. dollar equivalent based on the foreign exchange rate at the time of contract entry.
See Note 1(d) regarding derivative financial instruments.
10. OTHER CONSIDERATIONS
From time to time, officers, directors or employees of the Fund’s Investment Manager may have discussions or enter into agreements with issuers, underwriters or creditors’ committees which, pursuant to the Fund’s policies and requirements of applicable securities laws, could prevent the Fund from trading in the securities of such company for limited or extended periods of time.
FSI-42
Franklin Templeton Variable Insurance Products Trust
Notes to Financial Statements (continued)
Franklin Strategic Income Securities Fund
11. CREDIT FACILITY
The Fund, together with other U.S. registered and foreign investment funds (collectively “Borrowers”), managed by Franklin Templeton Investments, are borrowers in a joint syndicated senior unsecured credit facility totaling $725 million (Global Credit Facility) to provide a source of funds to the Borrowers for temporary and emergency purposes, including the ability to meet future unanticipated or unusually large redemption requests. Effective January 22, 2010, the Fund renewed the Global Credit Facility, for a total of $750 million, maturing January 21, 2011.
Under the terms of the Global Credit Facility, the Fund shall, in addition to interest charged on any borrowings made by the Fund and other costs incurred by the Fund, pay its share of fees and expenses incurred in connection with the implementation and maintenance of the Global Credit Facility, based upon its relative share of the aggregate net assets of all of the Borrowers, including an annual commitment fee of 0.10% based upon the unused portion of the Global Credit Facility, which is reflected in other expenses on the Statement of Operations. During the year ended December 31, 2009, the Fund did not utilize the Global Credit Facility.
12. FAIR VALUE MEASUREMENTS
The Fund follow a fair value hierarchy that distinguishes between market data obtained from independent sources (observable inputs) and the Fund’s own market assumptions (unobservable inputs). These inputs are used in determining the value of the Fund’s investments and are summarized in the following fair value hierarchy:
| | • | | Level 1 – quoted prices in active markets for identical securities |
| | • | | Level 2 – other significant observable inputs (including quoted prices for similar securities, interest rates, prepayment speed, credit risk, etc.) |
| | • | | Level 3 – significant unobservable inputs (including the Fund’s own assumptions in determining the fair value of investments) |
The inputs or methodology used for valuing securities are not an indication of the risk associated with investing in those securities.
The following is a summary of the inputs used as of December 31, 2009, in valuing the Fund’s assets and liabilities carried at fair value:
| | | | | | | | | | | | |
| | | Level 1 | | Level 2 | | Level 3 | | Total |
| | | |
Assets: | | | | | | | | | | | | |
Investments in Securities | | | | | | | | | | | | |
Equity Investments:a | | | | | | | | | | | | |
Banks | | $ | 73,500 | | $ | 75,680 | | $ | — | | $ | 149,180 |
Diversified Financials | | | — | | | 529,987 | | | — | | | 529,987 |
Media | | | 264,688 | | | — | | | — | | | 264,688 |
Senior Floating Rate Interests | | | — | | | 198,496,506 | | | — | | | 198,496,506 |
Corporate Bonds | | | — | | | 582,510,837 | | | — | | | 582,510,837 |
Asset-Backed Securities and Commercial Mortgage-Backed Securities | | | — | | | 82,904,453 | | | — | | | 82,904,453 |
Mortgage-Backed Securities | | | — | | | 60,201,705 | | | — | | | 60,201,705 |
U.S. Government and Agency Securities | | | — | | | 70,734,718 | | | — | | | 70,734,718 |
Foreign Government and Agency Securities | | | — | | | 331,075,758 | | | — | | | 331,075,758 |
Municipal Bonds | | | — | | | 27,208,801 | | | — | | | 27,208,801 |
Short Term Investments | | | 43,133,443 | | | 888,749 | | | — | | | 44,022,192 |
| | | |
Total Investments in Securities | | $ | 43,471,631 | | $ | 1,354,627,194 | | $ | — | | $ | 1,398,098,825 |
| | | |
Forward Exchange Contracts | | | — | | | 4,669,876 | | | — | | | 4,669,876 |
Liabilities: | | | | | | | | | | | | |
Forward Exchange Contracts | | | — | | | 5,104,198 | | | — | | | 5,104,198 |
aIncludes common, preferred and convertible preferred.
FSI-43
Franklin Templeton Variable Insurance Products Trust
Notes to Financial Statements (continued)
Franklin Strategic Income Securities Fund
12. FAIR VALUE MEASUREMENTS (continued)
At December 31, 2009, the reconciliation of assets in which significant unobservable inputs (Level 3) were used in determining fair value, was as follows:
| | | | | | | | | | | | | | | | | | | |
| | | Balance at
Beginning of
Year | | Net Realized
Gain (Loss) | | Net Change in
Unrealized
Appreciation
(Depreciation) | | Net Purchases
(Sales) | | Transfer In (Out) of
Level 3 | | | Balance at End of
Year |
| | | |
Assets | | | | | | | | | | | | | | | | | | | |
Equity Investments: | | | | | | | | | | | | | | | | | | | |
Diversified Financials | | $ | 285,420 | | $ | — | | $ | — | | $ | — | | $ | (285,420 | ) | | $ | — |
13. NEW ACCOUNTING PRONOUNCEMENTS
In January 2010, the Financial Accounting Standards Board issued Accounting Standards Update (ASU) No. 2010-6, Fair Value Measurements and Disclosures (Topic 820): Improving Disclosures about Fair Value Measurements. ASU No. 2010-6 enhances and clarifies existing fair value measurement disclosure requirements and is effective for interim and annual periods beginning after December 15, 2009. The Fund is currently evaluating the impact, if any, of applying the provisions of ASU No. 2010-6.
14. SUBSEQUENT EVENTS
The Fund has evaluated subsequent events through February 10, 2010, the issuance date of the financial statements and determined that no events have occurred that require disclosure.
ABBREVIATIONS
Counterparty
BOFA - Bank of America N.A
BZWS - Barclays Bank PLC
CITI - Citibank N.A.
DBAB - Deutsche Bank AG
FBCO - Credit Suisse International
HSBC - HSBC Bank USA
JPHQ - JPMorgan Chase Bank, N.A.
UBSW - UBS AG
Currency
AUD - Australian Dollar
BRL - Brazilian Real
EUR - Euro
GBP - British Pound
IDR - Indonesian Rupiah
ILS - New Israeli Shekel
JPY - Japanese Yen
KRW - South Korean Won
LKR - Sri Lankan Rupee
MXN - Mexican Peso
MYR - Malaysian Ringgit
NOK - Norwegian Krone
NZD - New Zealand Dollar
PLN - Polish Zloty
SEK - Swedish Krona
Selected Portfolio
BHAC - Berkshire Hathaway Assurance Corp.
CLO - Collateralized Loan Obligation
FGIC - Financial Guaranty Insurance Co.
FRN - Floating Rate Note
GO - General Obligation
ID - Improvement District
IDA - Industrial Development Authority/Agency
L/C - Letter of Credit
NATL - National Public Financial Guarantee Corp.
PIK - Payment-In-Kind
SF - Single Family
USD - Unified/Union School District
FSI-44
Franklin Templeton Variable Insurance Products Trust
Franklin Strategic Income Securities Fund
Report of Independent Registered Public Accounting Firm
To the Board of Trustees and Shareholders of Franklin Templeton Variable Insurance Products Trust
In our opinion, the accompanying statement of assets and liabilities, including the statement of investments, and the related statements of operations and of changes in net assets and the financial highlights present fairly, in all material respects, the financial position of Franklin Strategic Income Securities Fund (one of the funds constituting the Franklin Templeton Variable Insurance Products Trust, hereafter referred to as the “Fund”) at December 31, 2009, the results of its operations for the year then ended, the changes in its net assets and the financial highlights for the periods presented, in conformity with accounting principles generally accepted in the United States of America. These financial statements and financial highlights (hereafter referred to as “financial statements”) are the responsibility of the Fund’s management. Our responsibility is to express an opinion on these financial statements based on our audits. We conducted our audits of these financial statements in accordance with the standards of the Public Company Accounting Oversight Board (United States). Those standards require that we plan and perform the audit to obtain reasonable assurance about whether the financial statements are free of material misstatement. An audit includes examining, on a test basis, evidence supporting the amounts and disclosures in the financial statements, assessing the accounting principles used and significant estimates made by management, and evaluating the overall financial statement presentation. We believe that our audits, which included confirmation of securities at December 31, 2009 by correspondence with the custodian and brokers, provide a reasonable basis for our opinion.
PricewaterhouseCoopers LLP
San Francisco, California
February 10, 2010
FSI-45
FRANKLIN TEMPLETON VIP FOUNDING FUNDS ALLOCATION FUND
We are pleased to bring you Franklin Templeton VIP Founding Funds Allocation Fund’s annual report for the fiscal year ended December 31, 2009.
Performance Summary as of 12/31/09
Average annual total return of Class 4 shares* represents the average annual change in value, assuming reinvestment of dividends and capital gains. Average returns smooth out variations in returns, which can be significant; they are not the same as year-by-year results.
Periods ended 12/31/09
| | | | |
| | | 1-Year | | Since Inception
(7/2/07) |
Average Annual Total Return | | +30.06% | | -9.54% |
*For the period beginning 2/29/08, Class 4 performance reflects a 12b-1 fee expense of 0.35% per year, which affects future performance. Class 4 performance prior to 2/29/08 reflects historical Class 1 performance, which does not include a 12b-1 fee expense. Since 2/29/08 (effective date), the average annual total return of Class 4 shares was -5.57%. The Fund’s administrator has contractually agreed to waive or limit its fee and to assume as its own expense certain expenses of the Fund so that common annual Fund operating expenses (i.e., a combination of fund administration fees and other expenses, but excluding Rule 12b-1 fees and acquired fund fees and expenses) do not exceed 0.10% (other than certain nonroutine expenses or costs, including those relating to litigation, indemnification, reorganizations and liquidations) until 4/30/10. If the administrator had not waived fees, the Fund’s total returns would have been lower.
Total Return Index Comparison for a Hypothetical $10,000 Investment (7/2/07–12/31/09)
The graph below shows the change in value of a hypothetical $10,000 investment in the Fund over the indicated period and includes reinvestment of any income or distributions. The Fund’s performance* is compared to the performance of the Standard & Poor’s 500 Index (S&P 500) and the Morgan Stanley Capital International (MSCI) World Index. One cannot invest directly in an index, and an index is not representative of the Fund’s portfolio. Please see Important Notes to Performance Information preceding the Fund Summaries.
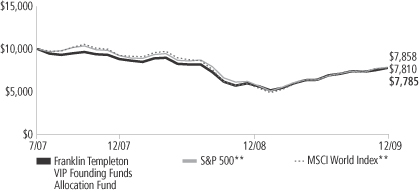
**Source: © 2009 Morningstar. Please see Index Descriptions following the Fund Summaries.
Franklin Templeton VIP Founding Funds Allocation Fund – Class 4
Performance reflects the Fund’s Class 4 operating expenses, but does not include any contract fees, expenses or sales charges. If they had been included, performance would be lower. These charges and deductions, particularly for variable life policies, can have a significant effect on contract values and insurance benefits. See the contract prospectus for a complete description of these expenses, including sales charges.
Performance data represent past performance, which does not guarantee future results. Investment return and principal value will fluctuate, and you may have a gain or loss when you sell your shares.
Current performance may differ from figures shown.
FFA-1
Fund Goals and Main Investments: Franklin Templeton VIP Founding Funds Allocation Fund seeks capital appreciation, with income as a secondary goal. The Fund normally invests equal portions in Class 1 shares of Franklin Income Securities Fund, Mutual Shares Securities Fund and Templeton Growth Securities Fund.
Performance Overview
You can find the Fund’s one-year total return in the Performance Summary. The Fund outperformed the S&P 500’s +26.46% total return and performed comparably to the MSCI World Index’s +30.79% total return for the same period.1
Economic and Market Overview
The U.S. economy ended 2009 in much better shape than it began. After several quarters of contraction, economic activity expanded in the third and fourth quarters. In the year’s second half, corporate profit growth was higher than earlier estimates, which may allow businesses to build inventory following a long period of inventory drawdowns. Economic challenges remain, such as stalled consumer confidence and job prospects for the unemployed, as stimulus measures wind down, but several reports pointed to improving economic conditions.
Throughout the year, the Federal Open Market Committee kept U.S. monetary policy unchanged, announcing it intends to hold the federal funds target rate in the 0% to 0.25% range “for an extended period” as it lays the groundwork for an eventual tightening of monetary policy. Late in the period, the labor market improved somewhat as the economy lost fewer jobs than expected and the unemployment rate fell slightly, dropping from a period high of 10.2% in October to 10.0% at period-end.2
Globally, equity markets entered 2009 largely pricing in a possible economic depression and systemic solvency crisis, scenarios that were ultimately averted by one of the most aggressive global policy responses in financial history. As government monetary and fiscal intervention began to gain traction toward the end of the first quarter, equities bottomed and largely reversed their decline, economic growth stabilized and rebounded, and confidence was rekindled as investors began to believe the global financial system was finally on the mend. Emerging market economies fueled the global recovery as governments aggressively incentivized lending and consumption, resulting in a
1. Source: © 2009 Morningstar. One cannot invest directly in an index, and an index is not representative of the Fund’s portfolio. Please see Index Descriptions following the Fund Summaries.
2. Source: Bureau of Labor Statistics.
Fund Risks: Because the Fund invests in underlying funds that may engage in a variety of investment strategies involving certain risks, this Fund may be subject to those same risks. Investments in stocks offer the potential for long-term gains but can be subject to short-term price fluctuations. Because the underlying funds invest in bonds and other debt obligations, the Fund’s share price and yield will be affected by interest rate movements. Bond prices generally move in the opposite direction from interest rates. Thus, as prices of bonds in the Fund adjust to a rise in interest rates, the Fund’s share price may decline. High yield, lower-rated (junk) bonds generally have greater price swings and higher default risks than investment grade bonds. Foreign investing, especially in emerging markets, involves additional risks, including currency fluctuations, economic instability, market volatility, and political and social instability. The Fund’s prospectus also includes a description of the main investment risks.
FFA-2
dramatic recovery that laid the groundwork for the developing world’s equity rally. Growing demand from emerging markets supported commodity prices, which also posted record gains during the year. For most of the year, the fading U.S. dollar also helped underpin the rally in hard assets, while continued euro and yen strength created headwinds for regional recoveries.
For the 12 months under review, the blue chip stocks of the Dow Jones Industrial Average delivered a total return of +22.68%, while the broader S&P 500 posted a +26.46% total return and the technology-heavy NASDAQ Composite Index returned +45.32%.3 Global developed and emerging markets, as measured by the MSCI All Country World Index, delivered a +35.41% total return.3
Investment Strategy
The Fund invests its assets in an equally weighted combination of Class 1 shares of Franklin Income Securities Fund, Mutual Shares Securities Fund and Templeton Growth Securities Fund. These underlying funds, in turn, invest in a variety of U.S. and foreign equity securities and, to a lesser extent, fixed income and money market securities. As market conditions affect the underlying funds, we rebalance the Fund’s allocations seeking to maintain equal weightings of approximately 33 1/3% of total net assets in each underlying fund whenever the actual allocations exceed plus or minus 3% of the fixed allocation percentages.
Manager’s Discussion
The Fund’s performance can be attributed largely to its allocation among the underlying funds and their investments in domestic and foreign equities, fixed income securities, and short-term investments and other net assets.
During the fiscal year under review, all three underlying funds produced positive returns. Franklin Income Securities Fund – Class 1 outperformed the S&P 500, Templeton Growth Securities Fund – Class 1 performed comparably to the MSCI World Index, and Mutual Shares Securities Fund – Class 1 performed comparably to the S&P 500.
3. Source: © 2009 Morningstar. Please see Index Descriptions following the Fund Summaries.
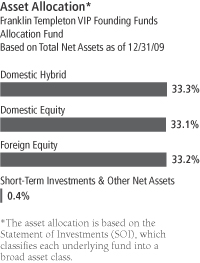
The dollar value, number of shares or principal amount, and names of all portfolio holdings are listed in the Fund’s SOI.
FFA-3
Thank you for your participation in Franklin Templeton VIP Founding Funds Allocation Fund. We look forward to serving your future investment needs.
The foregoing information reflects our analysis, opinions and portfolio holdings as of December 31, 2009, the end of the reporting period. The way we implement our main investment strategies and the resulting portfolio holdings may change depending on factors such as market and economic conditions. These opinions may not be relied upon as investment advice or an offer for a particular security. The information is not a complete analysis of every aspect of any market, country, industry, security or the Fund. Statements of fact are from sources considered reliable, but the investment manager makes no representation or warranty as to their completeness or accuracy. Although historical performance is no guarantee of future results, these insights may help you understand our investment management philosophy.
FFA-4
Fund Expenses
As an investor in a variable insurance contract (Contract) that indirectly provides for investment in an underlying mutual fund, you can incur transaction and/or ongoing expenses at both the Fund level and the Contract level.
| • | | Transaction expenses can include sales charges (loads) on purchases, redemption fees, surrender fees, transfer fees and premium taxes. |
| • | | Ongoing expenses can include management fees, distribution and service (12b-1) fees, contract fees, annual maintenance fees, mortality and expense risk fees and other fees and expenses. All mutual funds and Contracts have some types of ongoing expenses. |
The expenses shown in the table are meant to highlight ongoing expenses at the Fund level only and do not include ongoing expenses at the Contract level, or transaction expenses at either the Fund or Contract levels. While the Fund does not have transaction expenses, if the transaction and ongoing expenses at the Contract level were included, the expenses shown below would be higher. You should consult your Contract prospectus or disclosure document for more information.
The table shows Fund-level ongoing expenses and can help you understand these expenses and compare them with those of other mutual funds offered through the Contract. The table assumes a $1,000 investment held for the six months indicated. Please refer to the Fund prospectus for additional information on operating expenses.
Actual Fund Expenses
The first line (Actual) of the table provides actual account values and expenses. The “Ending Account Value” is derived from the Fund’s actual return, which includes the effect of ongoing Fund expenses, but does not include the effect of ongoing Contract expenses.
You can estimate the Fund-level expenses you incurred during the period by following these steps. Of course, your account value and expenses will differ from those in this illustration:
| 1. | Divide your account value by $1,000. |
If an account had an $8,600 value, then $8,600 ÷ $1,000 = 8.6.
| 2. | Multiply the result by the number under the heading “Fund-Level Expenses Incurred During Period.” |
If Fund-Level Expenses Incurred During Period were $7.50, then 8.6 x $7.50 = $64.50.
In this illustration, the estimated expenses incurred this period at the Fund level are $64.50.
Franklin Templeton VIP Founding Funds Allocation Fund – Class 4
FFA-5
Hypothetical Example for Comparison with Other Mutual Funds
Information in the second line (Hypothetical) of the table can help you compare ongoing expenses of the Fund with those of other mutual funds offered through the Contract. This information may not be used to estimate the actual ending account balance or expenses you incurred during the period. The hypothetical “Ending Account Value” is based on the Fund’s actual expense ratio and an assumed 5% annual rate of return before expenses, which does not represent the Fund’s actual return. The figure under the heading “Fund-Level Expenses Incurred During Period” shows the hypothetical expenses your account would have incurred under this scenario. You can compare this figure with the 5% hypothetical examples that appear in shareholder reports of other funds offered through a Contract.
| | | | | | | | | | | | |
| Class 4 | | Beginning
Account Value 7/1/09 | | Ending
Account Value 12/31/09 | | Fund-Level Expenses Incurred During Period* 7/1/09–12/31/09 | | Fund-Level
Expenses Incurred
During Period**
7/1/09–12/31/09 |
Actual | | $ | 1,000 | | $ | 1,211.80 | | $ | 2.51 | | $ | 6.41 |
Hypothetical (5% return before expenses) | | $ | 1,000 | | $ | 1,022.94 | | $ | 2.29 | | $ | 5.85 |
*Expenses are calculated using the most recent six-month annualized expense ratio excluding expenses of the underlying funds, net of expense waivers, for the Fund’s Class 4 shares (0.45%), which does not include any ongoing expenses of the Contract for which the Fund is an investment option, multiplied by the average account value over the period, multiplied by 184/365 to reflect the one-half year period.
**Expenses are calculated using the most recent six-month annualized expense ratio including expenses of the underlying funds, net of expense waivers, for the Fund’s Class 4 shares (1.15%), which does not include any ongoing expenses of the Contract for which the Fund is an investment option, multiplied by the average account value over the period, multiplied by 184/365 to reflect the one-half year period.
FFA-6
Franklin Templeton Variable Insurance Products Trust
Financial Highlights
Franklin Templeton VIP Founding Funds Allocation Fund
| | | | | | | | | | | | |
| | | Year Ended December 31, | |
| Class 1 | | 2009 | | | 2008 | | | 2007a | |
| | | | |
Per share operating performance | | | | | | | | | | | | |
(for a share outstanding throughout the year) | | | | | | | | | | | | |
Net asset value, beginning of year | | $ | 5.61 | | | $ | 9.33 | | | $ | 10.00 | |
| | | | |
Income from investment operationsb: | | | | | | | | | | | | |
Net investment income (loss)c,d | | | 0.26 | | | | 0.28 | | | | (0.19 | ) |
Net realized and unrealized gains (losses) | | | 1.46 | | | | (3.64 | ) | | | (0.48 | ) |
| | | | |
Total from investment operations | | | 1.72 | | | | (3.36 | ) | | | (0.67 | ) |
| | | | |
Less distributions from: | | | | | | | | | | | | |
Net investment income | | | (0.18 | ) | | | (0.19 | ) | | | — | |
Net realized gains | | | — | | | | (0.17 | ) | | | — | |
| | | | |
Total distributions | | | (0.18 | ) | | | (0.36 | ) | | | — | |
| | | | |
Net asset value, end of year | | $ | 7.15 | | | $ | 5.61 | | | $ | 9.33 | |
| | | | |
| | | |
Total returne | | | 30.47% | | | | (35.75)% | | | | (6.70)% | |
Ratios to average net assetsf | | | | | | | | | | | | |
Expenses before waiver and payments by affiliatesg | | | 0.12% | | | | 0.13% | | | | 0.41% | |
Expenses net of waiver and payments by affiliatesg | | | 0.10% | | | | 0.13% | | | | 0.41% | |
Net investment income (loss)d | | | 4.16% | | | | 3.81% | | | | (0.41)% | |
| | | |
Supplemental data | | | | | | | | | | | | |
Net assets, end of year (000’s) | | $ | 629 | | | $ | 339 | | | $ | 466 | |
Portfolio turnover rate | | | 4.23% | | | | 22.09% | | | | 0.04% | |
aFor the period July 2, 2007 (commencement of operations) to December 31, 2007.
bThe amount shown for a share outstanding throughout the period may not correlate with the Statement of Operations for the period due to the timing of sales and repurchases of the Fund shares in relation to income earned and/or fluctuating market value of the investments of the Fund.
cBased on average daily shares outstanding.
dRecognition of net investment income by the Fund is affected by the timing of declaration of dividends by the Underlying Funds in which the Fund invests.
eTotal return does not include any fees, charges or expenses imposed by the variable annuity and life insurance contracts for which the Franklin Templeton Variable Insurance Products Trust serves as an underlying investment vehicle. Total return is not annualized for periods less than one year.
fRatios are annualized for periods less than one year.
gDoes not include expenses of the Underlying Funds in which the Fund invests. The annualized weighted average expense ratio of the Underlying Funds was 0.70% for the year ended December 31, 2009.
The accompanying notes are an integral part of these financial statements.
FFA-7
Franklin Templeton Variable Insurance Products Trust
Financial Highlights (continued)
Franklin Templeton VIP Founding Funds Allocation Fund
| | | | | | | | | | | | |
| | | Year Ended December 31, | |
| Class 2 | | 2009 | | | 2008 | | | 2007a | |
| | | | |
Per share operating performance | | | | | | | | | | | | |
(for a share outstanding throughout the year) | | | | | | | | | | | | |
Net asset value, beginning of year | | $ | 5.61 | | | $ | 9.31 | | | $ | 10.00 | |
| | | | |
Income from investment operationsb: | | | | | | | | | | | | |
Net investment income (loss)c,d | | | 0.26 | | | | 0.27 | | | | (0.03 | ) |
Net realized and unrealized gains (losses) | | | 1.44 | | | | (3.63 | ) | | | (0.66 | ) |
| | | | |
Total from investment operations | | | 1.70 | | | | (3.36 | ) | | | (0.69 | ) |
| | | | |
Less distributions from: | | | | | | | | | | | | |
Net investment income | | | (0.17 | ) | | | (0.17 | ) | | | — | |
Net realized gains | | | — | | | | (0.17 | ) | | | — | |
| | | | |
Total distributions | | | (0.17 | ) | | | (0.34 | ) | | | — | |
| | | | |
Net asset value, end of year | | $ | 7.14 | | | $ | 5.61 | | | $ | 9.31 | |
| | | | |
| | | |
Total returne | | | 30.25% | | | | (35.87)% | | | | (6.90)% | |
Ratios to average net assetsf | | | | | | | | | | | | |
Expenses before waiver and payments by affiliatesg | | | 0.37% | | | | 0.38% | | | | 0.66% | |
Expenses net of waiver and payments by affiliatesg | | | 0.35% | | | | 0.38% | | | | 0.66% | |
Net investment income (loss)d | | | 3.91% | | | | 3.56% | | | | (0.66)% | |
| | | |
Supplemental data | | | | | | | | | | | | |
Net assets, end of year (000’s) | | $ | 474,176 | | | $ | 338,320 | | | $ | 131,710 | |
Portfolio turnover rate | | | 4.23% | | | | 22.09% | | | | 0.04% | |
aFor the period July 2, 2007 (commencement of operations) to December 31, 2007.
bThe amount shown for a share outstanding throughout the period may not correlate with the Statement of Operations for the period due to the timing of sales and repurchases of the Fund shares in relation to income earned and/or fluctuating market value of the investments of the Fund.
cBased on average daily shares outstanding.
dRecognition of net investment income by the Fund is affected by the timing of declaration of dividends by the Underlying Funds in which the Fund invests.
eTotal return does not include any fees, charges or expenses imposed by the variable annuity and life insurance contracts for which the Franklin Templeton Variable Insurance Products Trust serves as an underlying investment vehicle. Total return is not annualized for periods less than one year.
fRatios are annualized for periods less than one year.
gDoes not include expenses of the Underlying Funds in which the Fund invests. The annualized weighted average expense ratio of the Underlying Funds was 0.70% for the year ended December 31, 2009.
The accompanying notes are an integral part of these financial statements.
FFA-8
Franklin Templeton Variable Insurance Products Trust
Financial Highlights (continued)
Franklin Templeton VIP Founding Funds Allocation Fund
| | | | | | | | |
| | | Year Ended
December 31, | |
| Class 4 | | 2009 | | | 2008a | |
| | | | |
Per share operating performance | | | | | | | | |
(for a share outstanding throughout the year) | | | | | | | | |
Net asset value, beginning of year | | $ | 5.62 | | | $ | 8.65 | |
| | | | |
Income from investment operationsb: | | | | | | | | |
Net investment incomec,d | | | 0.23 | | | | 0.19 | |
Net realized and unrealized gains (losses) | | | 1.46 | | | | (2.87 | ) |
| | | | |
Total from investment operations | | | 1.69 | | | | (2.68 | ) |
| | | | |
Less distributions from: | | | | | | | | |
Net investment income | | | (0.17 | ) | | | (0.18 | ) |
Net realized gains | | | — | | | | (0.17 | ) |
| | | | |
Total distributions | | | (0.17 | ) | | | (0.35 | ) |
| | | | |
Net asset value, end of year | | $ | 7.14 | | | $ | 5.62 | |
| | | | |
| | |
Total returne | | | 30.06% | | | | (30.81)% | |
Ratios to average net assetsf | | | | | | | | |
Expenses before waiver and payments by affiliatesg | | | 0.47% | | | | 0.48% | |
Expenses net of waiver and payments by affiliatesg | | | 0.45% | | | | 0.48% | |
Net investment incomed | | | 3.81% | | | | 3.46% | |
| | |
Supplemental data | | | | | | | | |
Net assets, end of year (000’s) | | $ | 1,424,479 | | | $ | 263,001 | |
Portfolio turnover rate | | | 4.23% | | | | 22.09% | |
aFor the period February 29, 2008 (effective date) to December 31, 2008.
bThe amount shown for a share outstanding throughout the period may not correlate with the Statement of Operations for the period due to the timing of sales and repurchases of the Fund shares in relation to income earned and/or fluctuating market value of the investments of the Fund.
cBased on average daily shares outstanding.
dRecognition of net investment income by the Fund is affected by the timing of declaration of dividends by the Underlying Funds in which the Fund invests.
eTotal return does not include any fees, charges or expenses imposed by the variable annuity and life insurance contracts for which the Franklin Templeton Variable Insurance Products Trust serves as an underlying investment vehicle. Total return is not annualized for periods less than one year.
fRatios are annualized for periods less than one year.
gDoes not include expenses of the Underlying Funds in which the Fund invests. The annualized weighted average expense ratio of the Underlying Funds was 0.70% for the year ended December 31, 2009.
The accompanying notes are an integral part of these financial statements.
FFA-9
Franklin Templeton Variable Insurance Products Trust
Statement of Investments, December 31, 2009
| | | | | |
| Franklin Templeton VIP Founding Funds Allocation Fund | | Shares | | Value |
Investments in Underlying Fundsa | | | | | |
Domestic Equity 33.1% | | | | | |
Mutual Shares Securities Fund, Class 1 | | 42,654,858 | | $ | 629,159,153 |
| | | | | |
Domestic Hybrid 33.3% | | | | | |
Franklin Income Securities Fund, Class 1 | | 43,863,503 | | | 632,950,343 |
| | | | | |
Foreign Equity 33.2% | | | | | |
Templeton Growth Securities Fund, Class 1 | | 59,551,683 | | | 628,865,774 |
| | | | | |
Total Investments in Underlying Funds (Cost $1,764,555,222) 99.6% | | | | | 1,890,975,270 |
Other Assets, less Liabilities 0.4% | | | | | 8,308,603 |
| | | | | |
Net Assets 100.0% | | | | $ | 1,899,283,873 |
| | | | | |
aSee Note 6 regarding investments in Underlying Funds.
The accompanying notes are an integral part of these financial statements.
FFA-10
Franklin Templeton Variable Insurance Products Trust
Financial Statements
Statement of Assets and Liabilities
December 31, 2009
| | | | |
| | | Franklin Templeton
VIP Founding
Funds Allocation
Fund | |
Assets: | | | | |
Investments in Underlying Funds (Note 6): | | | | |
Cost | | $ | 1,764,555,222 | |
| | | | |
Value | | $ | 1,890,975,270 | |
Cash | | | 4,708,673 | |
Receivables: | | | | |
Investment securities sold | | | 124,391 | |
Capital shares sold | | | 4,724,635 | |
Other assets | | | 95 | |
| | | | |
Total assets | | | 1,900,533,064 | |
| | | | |
Liabilities: | | | | |
Payables: | | | | |
Capital shares redeemed | | | 98,785 | |
Affiliates | | | 1,069,069 | |
Accrued expenses and other liabilities | | | 81,337 | |
| | | | |
Total liabilities | | | 1,249,191 | |
| | | | |
Net assets, at value | | $ | 1,899,283,873 | |
| | | | |
Net assets consist of: | | | | |
Paid-in capital | | $ | 1,849,799,974 | |
Undistributed net investment income | | | 391,645 | |
Net unrealized appreciation (depreciation) | | | 126,420,048 | |
Accumulated net realized gain (loss) | | | (77,327,794 | ) |
| | | | |
Net assets, at value | | $ | 1,899,283,873 | |
| | | | |
Class 1: | | | | |
Net assets, at value | | $ | 629,091 | |
| | | | |
Shares outstanding | | | 87,927 | |
| | | | |
Net asset value and maximum offering price per share | | $ | 7.15 | |
| | | | |
Class 2: | | | | |
Net assets, at value | | $ | 474,175,516 | |
| | | | |
Shares outstanding | | | 66,398,771 | |
| | | | |
Net asset value and maximum offering price per share | | $ | 7.14 | |
| | | | |
Class 4: | | | | |
Net assets, at value | | $ | 1,424,479,266 | |
| | | | |
Shares outstanding | | | 199,410,932 | |
| | | | |
Net asset value and maximum offering price per share | | $ | 7.14 | |
| | | | |
The accompanying notes are an integral part of these financial statements.
FFA-11
Franklin Templeton Variable Insurance Products Trust
Financial Statements (continued)
Statement of Operations
for the year ended December 31, 2009
| | | | |
| | | Franklin Templeton
VIP Founding
Funds Allocation
Fund | |
Investment income: | | | | |
Dividends from Underlying Funds (Note 6) | | $ | 46,295,493 | |
| | | | |
Expenses: | | | | |
Administrative fees (Note 3a) | | | 1,082,643 | |
Distribution fees: (Note 3b) | | | | |
Class 2 | | | 1,003,881 | |
Class 4 | | | 2,392,963 | |
Unaffiliated transfer agent fees | | | 1,690 | |
Reports to shareholders | | | 132,128 | |
Professional fees | | | 38,031 | |
Trustees’ fees and expenses | | | 5,377 | |
Other | | | 30,953 | |
| | | | |
Total expenses | | | 4,687,666 | |
Expenses waived/paid by affiliates (Note 3d) | | | (160,269 | ) |
| | | | |
Net expenses | | | 4,527,397 | |
| | | | |
Net investment income | | | 41,768,096 | |
| | | | |
Realized and unrealized gains (losses): | | | | |
Net realized gain (loss) from sale of investments in Underlying Funds | | | (33,084,814 | ) |
Net change in unrealized appreciation (depreciation) on investments in Underlying Funds | | | 315,119,406 | |
| | | | |
Net realized and unrealized gain (loss) | | | 282,034,592 | |
| | | | |
Net increase (decrease) in net assets resulting from operations | | $ | 323,802,688 | |
| | | | |
The accompanying notes are an integral part of these financial statements.
FFA-12
Franklin Templeton Variable Insurance Products Trust
Financial Statements (continued)
Statements of Changes in Net Assets
| | | | | | | | |
| | | Franklin Templeton VIP Founding
Funds Allocation Fund | |
| | | Year Ended December 31, | |
| | | 2009 | | | 2008 | |
| | | | |
Increase (decrease) in net assets: | | | | | | | | |
Operations: | | | | | | | | |
Net investment income | | $ | 41,768,096 | | | $ | 13,322,810 | |
Net realized gain (loss) from Underlying Funds | | | (33,084,814 | ) | | | (25,937,367 | ) |
Net change in unrealized appreciation (depreciation) on investments in Underlying Funds | | | 315,119,406 | | | | (187,235,978 | ) |
| | | | |
Net increase (decrease) in net assets resulting from operations | | | 323,802,688 | | | | (199,850,535 | ) |
| | | | |
Distributions to shareholders from: | | | | | | | | |
Net investment income: | | | | | | | | |
Class 1 | | | (15,661 | ) | | | (10,512 | ) |
Class 2 | | | (10,747,497 | ) | | | (9,341,768 | ) |
Class 4 | | | (30,912,074 | ) | | | (6,456,197 | ) |
Net realized gains: | | | | | | | | |
Class 1 | | | — | | | | (9,690 | ) |
Class 2 | | | — | | | | (9,265,863 | ) |
Class 4 | | | — | | | | (6,240,747 | ) |
| | | | |
Total distributions to shareholders | | | (41,675,232 | ) | | | (31,324,777 | ) |
| | | | |
Capital share transactions: (Note 2) | | | | | | | | |
Class 1 | | | 178,968 | | | | 90,126 | |
Class 2 | | | 33,157,540 | | | | 361,467,772 | |
Class 4 | | | 982,159,582 | | | | 339,101,312 | |
| | | | |
Total capital share transactions | | | 1,015,496,090 | | | | 700,659,210 | |
| | | | |
Net increase (decrease) in net assets | | | 1,297,623,546 | | | | 469,483,898 | |
Net assets: | | | | | | | | |
Beginning of year | | | 601,660,327 | | | | 132,176,429 | |
| | | | |
End of year | | $ | 1,899,283,873 | | | $ | 601,660,327 | |
| | | | |
Undistributed net investment income included in net assets: | | | | | | | | |
End of year | | $ | 391,645 | | | $ | 298,781 | |
| | | | |
The accompanying notes are an integral part of these financial statements.
FFA-13
Franklin Templeton Variable Insurance Products Trust
Notes to Financial Statements
Franklin Templeton VIP Founding Funds Allocation Fund
1. ORGANIZATION AND SIGNIFICANT ACCOUNTING POLICIES
Franklin Templeton Variable Insurance Products Trust (Trust) is registered under the Investment Company Act of 1940, as amended, (1940 Act) as an open-end investment company, consisting of twenty-two separate funds. The Franklin Templeton VIP Founding Funds Allocation Fund (Fund) is included in this report. The financial statements of the remaining funds in the Trust are presented separately. The Fund invests primarily in other funds of the Trust (Underlying Funds). Shares of the Fund are generally sold only to insurance company separate accounts to fund the benefits of variable life insurance policies or variable annuity contracts. The Fund offers three classes of shares: Class 1, Class 2, and Class 4. Each class of shares differs by its distribution fees, voting rights on matters affecting a single class and its exchange privilege.
The following summarizes the Fund’s significant accounting policies.
a. Security Valuation
Net asset value per share is calculated as of the close of trading of the NYSE. Investments in the Underlying Funds are valued at their closing net asset value each trading day.
b. Income Taxes
No provision has been made for U.S. income taxes because it is the Fund’s policy to qualify as a regulated investment company under the Internal Revenue Code and to distribute to shareholders substantially all of its taxable income and net realized gains.
The Fund has reviewed the tax positions, taken on federal income tax returns, for the two open tax years and as of December 31, 2009, and has determined that no provision for income tax is required in the Fund’s financial statements.
c. Security Transactions, Investment Income, Expenses and Distributions
Security transactions are accounted for on trade date. Realized gains and losses on security transactions are determined on a specific identification basis. Estimated expenses are accrued daily. Dividend income and realized gain distributions by Underlying Funds are recorded on the ex-dividend date. Distributions to shareholders are recorded on the ex-dividend date and are determined according to income tax regulations (tax basis). Distributable earnings determined on a tax basis may differ from earnings recorded in accordance with accounting principles generally accepted in the United States of America. These differences may be permanent or temporary. Permanent differences are reclassified among capital accounts to reflect their tax character. These reclassifications have no impact on net assets or the results of operations. Temporary differences are not reclassified, as they may reverse in subsequent periods.
Common expenses incurred by the Trust are allocated among the funds based on the ratio of net assets of each fund to the combined net assets of the Trust. Fund specific expenses are charged directly to the fund that incurred the expense.
The Fund indirectly bears its proportionate share of expenses from the Underlying Funds. Since the Underlying Funds have varied expense levels and the Fund may own different proportions of the Underlying Funds at different times, the amount of expenses incurred indirectly by the Fund will vary.
Realized and unrealized gains and losses and net investment income, not including class specific expenses, are allocated daily to each class of shares based upon the relative proportion of net assets of each class. Differences in per share distributions, by class, are generally due to differences in class specific expenses.
d. Accounting Estimates
The preparation of financial statements in accordance with accounting principles generally accepted in the United States of America requires management to make estimates and assumptions that affect the reported amounts of assets and liabilities at the date of the financial statements and the amounts of income and expenses during the reporting period. Actual results could differ from those estimates.
FFA-14
Franklin Templeton Variable Insurance Products Trust
Notes to Financial Statements (continued)
Franklin Templeton VIP Founding Funds Allocation Fund
1. ORGANIZATION AND SIGNIFICANT ACCOUNTING POLICIES (continued)
e. Guarantees and Indemnifications
Under the Trust’s organizational documents, its officers and trustees are indemnified by the Trust against certain liabilities arising out of the performance of their duties to the Trust. Additionally, in the normal course of business, the Trust, on behalf of the Fund, enters into contracts with service providers that contain general indemnification clauses. The Trust’s maximum exposure under these arrangements is unknown as this would involve future claims that may be made against the Trust that have not yet occurred. Currently, the Trust expects the risk of loss to be remote.
2. SHARES OF BENEFICIAL INTEREST
At December 31, 2009, there were an unlimited number of shares authorized (without par value). Transactions in the Fund’s shares were as follows:
| | | | | | | | | | | | | | |
| | | Year Ended December 31, | |
| | | 2009 | | | 2008a | |
| Class 1 Shares: | | Shares | | | Amount | | | Shares | | | Amount | |
Shares sold | | 30,232 | | | $ | 193,836 | | | 13,307 | | | $ | 107,831 | |
Shares issued in reinvestment of distributions | | 2,209 | | | | 15,661 | | | 3,776 | | | | 20,201 | |
Shares redeemed | | (4,934 | ) | | | (30,529 | ) | | (6,663 | ) | | | (37,906 | ) |
| | | | |
Net increase (decrease) | | 27,507 | | | $ | 178,968 | | | 10,420 | | | $ | 90,126 | |
| | | | |
Class 2 Shares: | | | | | | | | | | | | | | |
Shares sold | | 14,864,113 | | | $ | 87,081,355 | | | 47,997,548 | | | $ | 380,425,736 | |
Shares issued in reinvestment of distributions | | 1,519,236 | | | | 10,747,497 | | | 3,484,575 | | | | 18,607,631 | |
Shares redeemed | | (10,330,403 | ) | | | (64,671,312 | ) | | (5,276,048 | ) | | | (37,565,595 | ) |
| | | | |
Net increase (decrease) | | 6,052,946 | | | $ | 33,157,540 | | | 46,206,075 | | | $ | 361,467,772 | |
| | | | |
Class 4 Shares: | | | | | | | | | | | | | | |
Shares sold | | 166,538,372 | | | $ | 1,052,248,327 | | | 62,420,570 | | | $ | 442,309,673 | |
Shares issued on reinvestment of distributions | | 4,364,502 | | | | 30,912,074 | | | 2,373,260 | | | | 12,696,943 | |
Shares redeemed | | (18,323,686 | ) | | | (101,000,819 | ) | | (17,962,086 | ) | | | (115,905,304 | ) |
| | | | |
Net increase (decrease) | | 152,579,188 | | | $ | 982,159,582 | | | 46,831,744 | | | $ | 339,101,312 | |
| | | | |
| aFor | the period February 29, 2008 (effective date) to December 31, 2008 for Class 4. |
3. TRANSACTIONS WITH AFFILIATES
Franklin Resources, Inc. is the holding company for various subsidiaries that together are referred to as Franklin Templeton Investments. Certain officers and trustees of the Trust are also officers and/or directors of certain of the Underlying Funds and of the following subsidiaries:
| | |
| Subsidiary | | Affiliation |
Franklin Templeton Services, LLC (FT Services) | | Administrative manager |
Franklin Templeton Distributors, Inc. (Distributors) | | Principal underwriter |
Franklin Templeton Investor Services, LLC (Investor Services) | | Transfer agent |
FFA-15
Franklin Templeton Variable Insurance Products Trust
Notes to Financial Statements (continued)
Franklin Templeton VIP Founding Funds Allocation Fund
3. TRANSACTIONS WITH AFFILIATES (continued)
a. Administrative Fees
The Fund pays an administrative fee to FT Services of 0.10% per year of the average daily net assets of the Fund for administrative services including monitoring and rebalancing the percentage of the Fund’s investment in the Underlying Funds.
b. Distribution Fees
The Fund’s Board of Trustees has adopted distribution plans for Class 2 and Class 4 shares pursuant to Rule 12b-1 under the 1940 Act. Under the Fund’s compensation distribution plans, the Fund pays Distributors for costs incurred in connection with the servicing, sale and distribution of the Fund’s shares up to 0.35% per year of its average daily net assets of each class. The Board of Trustees has agreed to limit the current rate to 0.25% per year for Class 2.
c. Transfer Agent Fees
Investor Services, under terms of an agreement, performs shareholder servicing for the Fund and is not paid by the Fund for the services.
d. Waiver and Expense Reimbursements
FT Services has contractually agreed in advance to waive or limit its fees and to assume as their own expense certain expenses otherwise payable by the Fund so that the common expenses (i.e. a combination of fund administrative fees and other expenses, but excluding distribution fees and acquired fund fees and expenses) for each class of the Fund do not exceed 0.10% (other than certain non-routine expenses or costs, including those relating to litigation, indemnification, reorganizations, and liquidations) until April 30, 2010.
4. INCOME TAXES
For tax purposes, capital losses may be carried over to offset future capital gains, if any. At December 31, 2009, the Fund had tax basis capital losses of $24,705 expiring in 2017.
The tax character of distributions paid during the years ended December 31, 2009 and 2008, was as follows:
| | | | | | |
| | | 2009 | | 2008 |
Distributions paid from: | | | | | | |
Ordinary Income | | $ | 41,675,232 | | $ | 15,846,479 |
Long term capital gain | | | — | | | 15,478,298 |
| | | |
| | | $41,675,232 | | | $31,324,777 |
| | | |
At December 31, 2009, the cost of investments, net unrealized appreciation (depreciation) and undistributed ordinary income for income tax purposes were as follows:
| | | |
Cost of investments | | $ | 1,841,858,312 |
| | | |
| |
Unrealized appreciation | | $ | 49,116,958 |
Unrealized depreciation | | | — |
| | | |
Net unrealized appreciation (depreciation) | | $ | 49,116,958 |
| | | |
Distributable earnings – undistributed ordinary income | | $ | 391,645 |
| | | |
Net realized gains (losses) differ for financial statement and tax purposes primarily due to differing treatment of wash sales.
FFA-16
Franklin Templeton Variable Insurance Products Trust
Notes to Financial Statements (continued)
Franklin Templeton VIP Founding Funds Allocation Fund
5. INVESTMENT TRANSACTIONS
Purchases and sales of Underlying Funds (excluding short term securities) for the year ended December 31, 2009, aggregated $1,063,295,493 and $45,760,896, respectively.
6. INVESTMENTS IN UNDERLYING FUNDS
The Fund invests primarily in the Underlying Funds which are managed by affiliates of the Fund’s administrative manager, FT Services. The Fund does not invest in the Underlying Funds for the purpose of exercising management or control. At December 31, 2009, the Fund held the following positions which exceed 5% of the Underlying Funds’ shares outstanding:
| | | |
| Name of Issuer | | % of Shares Held | |
Templeton Growth Securities Fund | | 23.95 | % |
Mutual Shares Securities Fund | | 12.82 | % |
Franklin Income Securities Fund | | 8.43 | % |
7. CREDIT FACILITY
The Fund, together with other U.S. registered and foreign investment funds (collectively “Borrowers”), managed by Franklin Templeton Investments, are borrowers in a joint syndicated senior unsecured credit facility totaling $725 million (Global Credit Facility) to provide a source of funds to the Borrowers for temporary and emergency purposes, including the ability to meet future unanticipated or unusually large redemption requests. Effective January 22, 2010, the Fund renewed the Global Credit Facility, for a total of $750 million, maturing January 21, 2011.
Under the terms of the Global Credit Facility, the Fund shall, in addition to interest charged on any borrowings made by the Fund and other costs incurred by the Fund, pay its share of fees and expenses incurred in connection with the implementation and maintenance of the Global Credit Facility, based upon its relative share of the aggregate net assets of all of the Borrowers, including an annual commitment fee of 0.10% based upon the unused portion of the Global Credit Facility, which is reflected in other expenses on the Statement of Operations. During the year ended December 31, 2009, the Fund did not utilize the Global Credit Facility.
8. FAIR VALUE MEASUREMENTS
The Fund follows a fair value hierarchy that distinguishes between market data obtained from independent sources (observable inputs) and the Fund’s own market assumptions (unobservable inputs). These inputs are used in determining the value of the Fund’s investments and are summarized in the following fair value hierarchy:
| | • | | Level 1 – quoted prices in active markets for identical securities |
| | • | | Level 2 – other significant observable inputs (including quoted prices for similar securities, interest rates, prepayment speed, credit risk, etc.) |
| | • | | Level 3 – significant unobservable inputs (including the Fund’s own assumptions in determining the fair value of investments) |
The inputs or methodology used for valuing securities are not an indication of the risk associated with investing in those securities.
At December 31, 2009, all of the Fund’s investments in Underlying Funds carried at fair value were in Level 1 inputs. For detailed Underlying Fund categories, see the accompanying Statement of Investments.
FFA-17
Franklin Templeton Variable Insurance Products Trust
Notes to Financial Statements (continued)
Franklin Templeton VIP Founding Funds Allocation Fund
9. NEW ACCOUNTING PRONOUNCEMENTS
In January 2010, the Financial Accounting Standards Board issued Accounting Standards Update (ASU) No. 2010-6, Fair Value Measurements and Disclosures (Topic 820): Improving Disclosures about Fair Value Measurements. ASU No. 2010-6 enhances and clarifies existing fair value measurement disclosure requirements and is effective for interim and annual periods beginning after December 15, 2009. The Fund is currently evaluating the impact, if any, of applying the provisions of ASU No. 2010-6.
10. SUBSEQUENT EVENTS
The Fund has evaluated subsequent events through February 10, 2010, the issuance date of the financial statements and determined that no events have occurred that require disclosure.
FFA-18
Franklin Templeton Variable Insurance Products Trust
Franklin Templeton VIP Founding Funds Allocation Fund
Report of Independent Registered Public Accounting Firm
To the Board of Trustees and Shareholders of Franklin Templeton Variable Insurance Products Trust
In our opinion, the accompanying statement of assets and liabilities, including the statement of investments, and the related statements of operations and of changes in net assets and the financial highlights present fairly, in all material respects, the financial position of Franklin Templeton VIP Founding Funds Allocation Fund (one of the funds constituting the Franklin Templeton Variable Insurance Products Trust, hereafter referred to as the “Fund”) at December 31, 2009, the results of its operations for the year then ended, the changes in its net assets and the financial highlights for the periods presented, in conformity with accounting principles generally accepted in the United States of America. These financial statements and financial highlights (hereafter referred to as “financial statements”) are the responsibility of the Fund’s management. Our responsibility is to express an opinion on these financial statements based on our audits. We conducted our audits of these financial statements in accordance with the standards of the Public Company Accounting Oversight Board (United States). Those standards require that we plan and perform the audit to obtain reasonable assurance about whether the financial statements are free of material misstatement. An audit includes examining, on a test basis, evidence supporting the amounts and disclosures in the financial statements, assessing the accounting principles used and significant estimates made by management, and evaluating the overall financial statement presentation. We believe that our audits, which included confirmation of investments in the Underlying Funds at December 31, 2009 by correspondence with the transfer agent of the Underlying Funds, provide a reasonable basis for our opinion.
PricewaterhouseCoopers LLP
San Francisco, California
February 10, 2010
FFA-19
Franklin Templeton Variable Insurance Products Trust
Tax Designation (unaudited)
Franklin Templeton VIP Founding Funds Allocation Fund
Under Section 854(b)(2) of the Internal Revenue Code, the Fund designates 26.27% of the ordinary income dividends as income qualifying for the dividends received deduction for the fiscal year ended December 31, 2009.
FFA-20
FRANKLIN U.S. GOVERNMENT FUND
This annual report for Franklin U.S. Government Fund covers the fiscal year ended December 31, 2009.
Performance Summary as of 12/31/09
Average annual total return of Class 4 shares* represents the average annual change in value, assuming reinvestment of dividends and capital gains. Average returns smooth out variations in returns, which can be significant; they are not the same as year-by-year results.
Periods ended 12/31/09
| | | | | | |
| | | 1-Year | | 5-Year | | 10-Year |
Average Annual Total Return | | +2.98% | | +4.86% | | +5.96% |
*For the period beginning 2/29/08, Class 4 performance reflects a 12b-1 fee expense of 0.35% per year, which affects future performance. Class 4 performance prior to 2/29/08 reflects historical Class 1 performance, which does not include a 12b-1 fee expense. Since 2/29/08 (effective date), the average annual total return of Class 4 shares was +4.42%.
Total Return Index Comparison
for a Hypothetical $10,000 Investment (1/1/00–12/31/09)
The graph below shows the change in value of a hypothetical $10,000 investment in the Fund over the indicated period and includes reinvestment of any income or distributions. The Fund’s performance* is compared to the performance of the Barclays Capital (BC) U.S. Government: Intermediate Index, the Lipper VIP General U.S. Government Funds Classification Average, and the Consumer Price Index (CPI). One cannot invest directly in an index, and an index is not representative of the Fund’s portfolio. Please see Important Notes to Performance Information preceding the Fund Summaries.
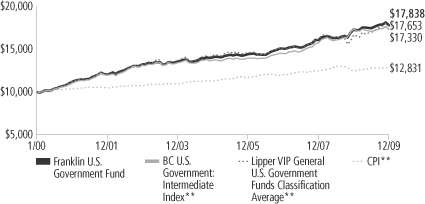
**Sources: © 2009 Morningstar; Lipper Inc. Please see Index Descriptions following the Fund Summaries.
Franklin U.S. Government Fund – Class 4
Performance reflects the Fund’s Class 4 operating expenses, but does not include any contract fees, expenses or sales charges. If they had been included, performance would be lower. These charges and deductions, particularly for variable life policies, can have a significant effect on contract values and insurance benefits. See the contract prospectus for a complete description of these expenses, including sales charges.
Performance data represent past performance, which does not guarantee future results. Investment return and principal value will fluctuate, and you may have a gain or loss when you sell your shares.
Current performance may differ from figures shown.
FUS-1
Fund Goal and Main Investments: Franklin U.S. Government Fund seeks income. The Fund normally invests at least 80% of its net assets in U.S. government securities and normally invests primarily in fixed and variable rate mortgage-backed securities.
Performance Overview
You can find the Fund’s one-year total return in the Performance Summary. Compared with its benchmarks for the same period, the Fund outperformed the BC U.S. Government: Intermediate Index’s -0.32% return but underperformed the Lipper VIP General U.S. Government Funds Classification Average’s +5.99% return.1
Economic and Market Overview
The U.S. economy ended 2009 in much better shape than it began. Early in the period, the U.S. financial system was in crisis and consumer confidence fell to an all-time low. The financial system, however, avoided collapse, and financial markets stabilized in response to federal stimulus packages and the Federal Reserve Board’s (Fed’s) interventions.
Economic headwinds and benign inflation prompted policymakers to enact stimulus plans. During the period, the Fed kept the federal funds target rate in a range of 0% to 0.25%. The government implemented the American Recovery and Reinvestment Act, which included tax breaks, money for ailing state governments, aid to the poor and unemployed, and spending on infrastructure, renewable energy, health care and education. The Fed and U.S. Treasury Department also launched programs designed to shore up beleaguered banks’ capital, enable freer lending to businesses and consumers, help struggling home owners avoid foreclosure, and boost auto sales. Near period-end, the Fed assessed which of its support programs could be phased out.
In March, many investors reentered the stock market and started a rally that brought the major indexes off this cycle’s lows. Economic activity as measured by gross domestic product (GDP) turned from contraction to expansion. GDP registered annualized quarterly rates of -6.4%, -0.7%, 2.2% and an estimated 5.7% in 2009. These positive signs, however, were constrained by a rising unemployment rate, which stood
1. Sources: © 2009 Morningstar; Lipper, Inc. One cannot invest directly in an index, and an index is not representative of the Fund’s portfolio. Please see Index Descriptions following the Fund Summaries.
Fund Risks: Interest rate movements and mortgage prepayment rates may impact the Fund’s share price and yield. Bond prices generally move in the opposite direction of interest rates. Thus, as prices of bonds in the Fund’s portfolio adjust to a rise in interest rates, the Fund’s share price may decline. U.S. government securities owned by the Fund, but not shares of the Fund, may be guaranteed by the U.S. government, its agencies or instrumentalities as to the timely payment of principal and interest. The Fund’s yield and share price are not guaranteed and will fluctuate with market conditions. The Fund’s prospectus also includes a description of the main investment risks.
FUS-2
at 10.0% by period-end.2 Economic challenges remain, such as stalled consumer confidence and job prospects for the unemployed as stimulus measures begin to wind down, but several reports pointed to a resumption of growth.
Many commodity prices generally rose as economic conditions improved. Oil prices moved up from $45 per barrel at the beginning of the period to $79 at year-end, still well below 2008 highs. Inflation remained muted, and December 2009’s inflation rate was an annualized 2.7%.2 Core inflation, which excludes food and energy costs, rose at a 1.8% annualized rate, which was within the Fed’s informal target range of 1.5% to 2.0%.2 The core personal consumption expenditures price index reported a 12-month increase of 1.5%.3
The spread between two-year and 10-year Treasury yields increased to 271 basis points (100 basis points equal one percentage point) at the end of December from 149 basis points at the beginning of the reporting period. The two-year Treasury bill yield rose from 0.76% to 1.14% over the 12-month period, while the 10-year Treasury note yield rose from 2.25% to 3.85%.
Investment Strategy
Using our straightforward investment approach, we seek to produce current income with a high degree of credit safety from a conservatively managed portfolio of U.S. government securities. Analyzing securities using proprietary and nonproprietary research, we seek to identify attractive investment opportunities.
Manager’s Discussion
Ginnie Mae (GNMA) mortgage-backed securities (MBS) remained relatively attractive in the recent environment as the GNMA current coupon yielded 4.51% at period-end, an income opportunity over both 5- and 10-year Treasuries, which yielded 2.69% and 3.85%.
Although agency MBS markets were supported by the Fed’s Agency Mortgage-Backed Securities Purchase Program during the period, the market started to focus on how the Fed’s purchase programs will end, which created less favorable technical conditions. The overall MBS market delivered strong performance since the announcement of the Fed’s MBS purchase program at the end of November 2008. Prepayment risk for higher coupon MBS remained restrained as declining
2. Source: Bureau of Labor Statistics.
3. Source: Bureau of Economic Analysis.

The dollar value, number of shares or principal amount, and names of all portfolio holdings are listed in the Fund’s Statement of Investments.
FUS-3
home price appreciation, loss of home equity and tighter underwriting standards lessened prepayment activity.
During the period, GNMA MBS outperformed comparable high credit-quality U.S. Treasuries, but lagged their conventional Fannie Mae (FNMA) and Freddie Mac (FHLMC) MBS counterparts. Within the sector, higher coupon GNMAs (6.0% and 6.5%) outperformed their lower coupon counterparts (4.5% and 5.0%).
Franklin U.S. Government Fund takes a consistent and disciplined approach and invests significantly in GNMA mortgage pass-throughs, which remain the only MBS backed by the full faith and credit of the U.S. government.4 The Fund took a collateral intensive research approach to uncover opportunities across the GNMA and agency MBS universe. We believe our experience and continual investment in new technologies can help us identify specified pools and individual securities that offer strong cash flow fundamentals and valuations. Over the period, GNMA I securities (comprising single-issuer pools) underperformed the GNMA II sector (comprising multiple-issuer pools). We decreased the Fund’s allocation to GNMA II securities, as we felt GNMA Is offered better value on a historical price spread basis. We decreased exposure to conventional mortgages, which delivered strong performance and became more fairly valued in our view. We increased the portfolio’s allocation to some lower and mid-coupon MBS (4.5% and 5.0%). At year-end, our heaviest allocation was in coupons in the 5.0% through 6.0% range.
Thank you for your participation in Franklin U.S. Government Fund. We look forward to serving your future investment needs.
4. Securities owned by the Fund, but not shares of the Fund, are guaranteed by the U.S. government, its agencies or instrumentalities as to timely payment of principal and interest. The Fund’s yield and share price are not guaranteed and will vary with market conditions.
The foregoing information reflects our analysis, opinions and portfolio holdings as of December 31, 2009, the end of the reporting period. The way we implement our main investment strategies and the resulting portfolio holdings may change depending on factors such as market and economic conditions. These opinions may not be relied upon as investment advice or an offer for a particular security. The information is not a complete analysis of every aspect of any market, country, industry, security or the Fund. Statements of fact are from sources considered reliable, but the investment manager makes no representation or warranty as to their completeness or accuracy. Although historical performance is no guarantee of future results, these insights may help you understand our investment management philosophy.
FUS-4
Fund Expenses
As an investor in a variable insurance contract (Contract) that indirectly provides for investment in an underlying mutual fund, you can incur transaction and/or ongoing expenses at both the Fund level and the Contract level.
| • | | Transaction expenses can include sales charges (loads) on purchases, redemption fees, surrender fees, transfer fees and premium taxes. |
| • | | Ongoing expenses can include management fees, distribution and service (12b-1) fees, contract fees, annual maintenance fees, mortality and expense risk fees and other fees and expenses. All mutual funds and Contracts have some types of ongoing expenses. |
The expenses shown in the table are meant to highlight ongoing expenses at the Fund level only and do not include ongoing expenses at the Contract level, or transaction expenses at either the Fund or Contract level. While the Fund does not have transaction expenses, if the transaction and ongoing expenses at the Contract level were included, the expenses shown below would be higher. You should consult your Contract prospectus or disclosure document for more information.
The table shows Fund-level ongoing expenses and can help you understand these expenses and compare them with those of other mutual funds offered through the Contract. The table assumes a $1,000 investment held for the six months indicated. Please refer to the Fund prospectus for additional information on operating expenses.
Actual Fund Expenses
The first line (Actual) of the table provides actual account values and expenses. The “Ending Account Value” is derived from the Fund’s actual return, which includes the effect of ongoing Fund expenses, but does not include the effect of ongoing Contract expenses.
You can estimate the Fund-level expenses you incurred during the period by following these steps. Of course, your account value and expenses will differ from those in this illustration:
| 1. | Divide your account value by $1,000. |
If an account had an $8,600 value, then $8,600 ÷ $1,000 = 8.6.
| 2. | Multiply the result by the number under the heading “Fund-Level Expenses Incurred During Period.” |
If Fund-Level Expenses Incurred During Period were $7.50, then 8.6 x $7.50 = $64.50.
In this illustration, the estimated expenses incurred this period at the Fund level are $64.50.
Franklin U.S. Government Fund – Class 4
FUS-5
Hypothetical Example for Comparison with Other Mutual Funds
Information in the second line (Hypothetical) of the table can help you compare ongoing expenses of the Fund with those of other mutual funds offered through the Contract. This information may not be used to estimate the actual ending account balance or expenses you incurred during the period. The hypothetical “Ending Account Value” is based on the Fund’s actual expense ratio and an assumed 5% annual rate of return before expenses, which does not represent the Fund’s actual return. The figure under the heading “Fund-Level Expenses Incurred During Period” shows the hypothetical expenses your account would have incurred under this scenario. You can compare this figure with the 5% hypothetical examples that appear in shareholder reports of other funds offered through a Contract.
| | | | | | | | | |
| Class 4 | | Beginning
Account Value 7/1/09 | | Ending
Account Value 12/31/09 | | Fund-Level
Expenses Incurred
During Period*
7/1/09–12/31/09 |
Actual | | $ | 1,000 | | $ | 1,019.60 | | $ | 4.53 |
Hypothetical (5% return before expenses) | | $ | 1,000 | | $ | 1,020.72 | | $ | 4.53 |
*Expenses are calculated using the most recent six-month annualized expense ratio for the Fund’s Class 4 shares (0.89%), which does not include any ongoing expenses of the Contract for which the Fund is an investment option, multiplied by the average account value over the period, multiplied by 184/365 to reflect the one-half year period.
FUS-6
Franklin Templeton Variable Insurance Products Trust
Financial Highlights
Franklin U.S. Government Fund
| | | | | | | | | | | | | | | | | | | | |
| | | Year Ended December 31, | |
| Class 1 | | 2009 | | | 2008 | | | 2007 | | | 2006 | | | 2005 | |
| | | | |
Per share operating performance | | | | | | | | | | | | | | | | | | | | |
(for a share outstanding throughout the year) | | | | | | | | | | | | | | | | | | | | |
Net asset value, beginning of year | | $ | 13.19 | | | $ | 12.89 | | | $ | 12.69 | | | $ | 12.75 | | | $ | 12.99 | |
| | | | |
Income from investment operationsa: | | | | | | | | | | | | | | | | | | | | |
Net investment incomeb | | | 0.51 | | | | 0.58 | | | | 0.61 | | | | 0.59 | | | | 0.54 | |
Net realized and unrealized gains (losses) | | | (0.08 | ) | | | 0.39 | | | | 0.22 | | | | (0.07 | ) | | | (0.20 | ) |
| | | | |
Total from investment operations | | | 0.43 | | | | 0.97 | | | | 0.83 | | | | 0.52 | | | | 0.34 | |
| | | | |
Less distributions from net investment income | | | (0.54 | ) | | | (0.67 | ) | | | (0.63 | ) | | | (0.58 | ) | | | (0.58 | ) |
| | | | |
Net asset value, end of year | | $ | 13.08 | | | $ | 13.19 | | | $ | 12.89 | | | $ | 12.69 | | | $ | 12.75 | |
| | | | |
| | | | | |
Total returnc | | | 3.34% | | | | 7.91% | | | | 6.85% | | | | 4.31% | | | | 2.65% | |
Ratios to average net assets | | | | | | | | | | | | | | | | | | | | |
Expenses | | | 0.53% | | | | 0.53%d | | | | 0.53%d | | | | 0.54%d | | | | 0.52%d | |
Net investment income | | | 3.91% | | | | 4.54% | | | | 4.83% | | | | 4.67% | | | | 4.18% | |
| | | | | |
Supplemental data | | | | | | | | | | | | | | | | | | | | |
Net assets, end of year (000’s) | | $ | 162,524 | | | $ | 173,018 | | | $ | 167,700 | | | $ | 187,867 | | | $ | 217,165 | |
Portfolio turnover rate | | | 27.51% | | | | 17.06% | | | | 27.50% | | | | 23.46% | | | | 21.46% | |
Portfolio turnover rate excluding mortgage dollar rollse | | | 27.51% | | | | 17.06% | | | | 27.50% | | | | 23.46% | | | | 15.62% | |
aThe amount shown for a share outstanding throughout the period may not correlate with the Statement of Operations for the period due to the timing of sales and repurchases of the Fund shares in relation to income earned and/or fluctuating market value of the investments of the Fund.
bBased on average daily shares outstanding.
cTotal return does not include any fees, charges or expenses imposed by the variable annuity and life insurance contracts for which the Franklin Templeton Variable Insurance Products Trust serves as an underlying investment vehicle.
dBenefit of expense reduction rounds to less than 0.01%.
eSee Note 1(d) regarding mortgage dollar rolls.
The accompanying notes are an integral part of these financial statements.
FUS-7
Franklin Templeton Variable Insurance Products Trust
Financial Highlights (continued)
Franklin U.S. Government Fund
| | | | | | | | | | | | | | | | | | | | |
| | | Year Ended December 31, | |
| Class 2 | | 2009 | | | 2008 | | | 2007 | | | 2006 | | | 2005 | |
| | | | |
Per share operating performance | | | | | | | | | | | | | | | | | | | | |
(for a share outstanding throughout the year) | | | | | | | | | | | | | | | | | | | | |
Net asset value, beginning of year | | $ | 12.99 | | | $ | 12.71 | | | $ | 12.52 | | | $ | 12.59 | | | $ | 12.84 | |
| | | | |
Income from investment operationsa: | | | | | | | | | | | | | | | | | | | | |
Net investment incomeb | | | 0.47 | | | | 0.54 | | | | 0.57 | | | | 0.55 | | | | 0.50 | |
Net realized and unrealized gains (losses) | | | (0.08 | ) | | | 0.38 | | | | 0.22 | | | | (0.07 | ) | | | (0.20 | ) |
| | | | |
Total from investment operations | | | 0.39 | | | | 0.92 | | | | 0.79 | | | | 0.48 | | | | 0.30 | |
| | | | |
Less distributions from net investment income | | | (0.51 | ) | | | (0.64 | ) | | | (0.60 | ) | | | (0.55 | ) | | | (0.55 | ) |
| | | | |
Net asset value, end of year | | $ | 12.87 | | | $ | 12.99 | | | $ | 12.71 | | | $ | 12.52 | | | $ | 12.59 | |
| | | | |
| | | | | |
Total returnc | | | 3.09% | | | | 7.59% | | | | 6.61% | | | | 4.02% | | | | 2.40% | |
Ratios to average net assets | | | | | | | | | | | | | | | | | | | | |
Expenses | | | 0.78% | | | | 0.78%d | | | | 0.78%d | | | | 0.79%d | | | | 0.77%d | |
Net investment income | | | 3.66% | | | | 4.29% | | | | 4.58% | | | | 4.42% | | | | 3.93% | |
| | | | | |
Supplemental data | | | | | | | | | | | | | | | | | | | | |
Net assets, end of year (000’s) | | $ | 557,809 | | | $ | 450,603 | | | $ | 379,386 | | | $ | 374,323 | | | $ | 379,662 | |
Portfolio turnover rate | | | 27.51% | | | | 17.06% | | | | 27.50% | | | | 23.46% | | | | 21.46% | |
Portfolio turnover rate excluding mortgage dollar rollse | | | 27.51% | | | | 17.06% | | | | 27.50% | | | | 23.46% | | | | 15.62% | |
aThe amount shown for a share outstanding throughout the period may not correlate with the Statement of Operations for the period due to the timing of sales and repurchases of the Fund shares in relation to income earned and/or fluctuating market value of the investments of the Fund.
bBased on average daily shares outstanding.
cTotal return does not include any fees, charges or expenses imposed by the variable annuity and life insurance contracts for which the Franklin Templeton Variable Insurance Products Trust serves as an underlying investment vehicle.
dBenefit of expense reduction rounds to less than 0.01%.
eSee Note 1(d) regarding mortgage dollar rolls.
The accompanying notes are an integral part of these financial statements.
FUS-8
Franklin Templeton Variable Insurance Products Trust
Financial Highlights (continued)
Franklin U.S. Government Fund
| | | | | | | | |
| | | Year Ended
December 31, | |
| Class 4 | | 2009 | | | 2008a | |
| | | | |
Per share operating performance | | | | | | | | |
(for a share outstanding throughout the year) | | | | | | | | |
Net asset value, beginning of year | | $ | 13.15 | | | $ | 13.19 | |
| | | | |
Income from investment operationsb: | | | | | | | | |
Net investment incomec | | | 0.47 | | | | 0.45 | |
Net realized and unrealized gains (losses) | | | (0.09 | ) | | | 0.18 | |
| | | | |
Total from investment operations | | | 0.38 | | | | 0.63 | |
| | | | |
Less distributions from net investment income | | | (0.50 | ) | | | (0.67 | ) |
| | | | |
Net asset value, end of year | | $ | 13.03 | | | $ | 13.15 | |
| | | | |
| | |
Total returnd | | | 2.98% | | | | 5.14% | |
Ratios to average net assetse | | | | | | | | |
Expenses | | | 0.88% | | | | 0.88%f | |
Net investment income | | | 3.56% | | | | 4.19% | |
| | |
Supplemental data | | | | | | | | |
Net assets, end of year (000’s) | | $ | 5 | | | $ | 5 | |
Portfolio turnover rate | | | 27.51% | | | | 17.06% | |
aFor the period February 29, 2008 (effective date) to December 31, 2008.
bThe amount shown for a share outstanding throughout the period may not correlate with the Statement of Operations for the period due to the timing of sales and repurchases of the Fund shares in relation to income earned and/or fluctuating market value of the investments of the Fund.
cBased on average daily shares outstanding.
dTotal return does not include any fees, charges or expenses imposed by the variable annuity and life insurance contracts for which the Franklin Templeton Variable Insurance Products Trust serves as an underlying investment vehicle. Total return is not annualized for periods less than one year.
eRatios are annualized for periods less than one year.
fBenefit of expense reduction rounds to less than 0.01%.
The accompanying notes are an integral part of these financial statements.
FUS-9
Franklin Templeton Variable Insurance Products Trust
Statement of Investments, December 31, 2009
| | | | | | |
| Franklin U.S. Government Fund | | Principal
Amount | | Value |
Mortgage-Backed Securities 64.5% | | | | | | |
aFederal Home Loan Mortgage Corp. (FHLMC) Adjustable Rate 0.0%b | | | | | | |
FHLMC, 3.295%, 6/01/22 | | $ | 200,376 | | $ | 203,814 |
FHLMC, 3.964%, 2/01/19 | | | 139,673 | | | 142,607 |
| | | | | | |
| | | | | | 346,421 |
| | | | | | |
Federal Home Loan Mortgage Corp. (FHLMC) Fixed Rate 5.2% | | | | | | |
FHLMC Gold 30 Year, 5.00%, 9/01/33 - 6/01/37 | | | 12,099,902 | | | 12,442,616 |
FHLMC Gold 30 Year, 5.50%, 11/01/34 | | | 7,073,672 | | | 7,442,460 |
FHLMC Gold 30 Year, 5.50%, 7/01/33 - 1/01/35 | | | 3,148,549 | | | 3,313,027 |
FHLMC Gold 30 Year, 6.00%, 1/01/24 - 8/01/35 | | | 7,737,707 | | | 8,272,963 |
FHLMC Gold 30 Year, 6.50%, 11/01/23 - 5/01/35 | | | 2,800,906 | | | 3,022,064 |
FHLMC Gold 30 Year, 7.00%, 4/01/24 - 10/01/32 | | | 1,055,687 | | | 1,171,514 |
FHLMC Gold 30 Year, 7.50%, 12/01/22 - 5/01/24 | | | 62,395 | | | 69,957 |
FHLMC Gold 30 Year, 8.00%, 7/01/21 - 5/01/22 | | | 43,831 | | | 50,055 |
FHLMC Gold 30 Year, 8.50%, 10/01/21 - 7/01/31 | | | 1,502,452 | | | 1,740,201 |
FHLMC PC 30 Year, 8.00%, 1/01/17 - 9/01/17 | | | 8,129 | | | 8,952 |
FHLMC PC 30 Year, 8.50%, 9/01/20 | | | 2,036 | | | 2,318 |
| | | | | | |
| | | | | | 37,536,127 |
| | | | | | |
aFederal National Mortgage Association (FNMA) Adjustable Rate 0.3% | | | | | | |
FNMA, 2.989%, 9/01/18 | | | 389,359 | | | 397,956 |
FNMA, 3.038%, 1/01/18 | | | 1,158,805 | | | 1,178,894 |
FNMA, 3.084%, 2/01/19 | | | 155,549 | | | 157,795 |
FNMA, 4.78%, 7/01/19 | | | 128,735 | | | 130,340 |
FNMA, 6.265%, 3/01/20 | | | 113,385 | | | 114,643 |
| | | | | | |
| | | | | | 1,979,628 |
| | | | | | |
Federal National Mortgage Association (FNMA) Fixed Rate 9.7% | | | | | | |
FNMA 15 Year, 5.50%, 6/01/16 - 11/01/17 | | | 1,140,833 | | | 1,214,709 |
FNMA 15 Year, 6.00%, 8/01/17 - 9/01/17 | | | 1,279,821 | | | 1,371,772 |
FNMA 30 Year, 5.00%, 3/01/34 - 7/01/35 | | | 7,172,694 | | | 7,380,451 |
FNMA 30 Year, 5.50%, 12/01/32 - 8/01/35 | | | 13,251,930 | | | 13,929,406 |
FNMA 30 Year, 6.00%, 3/01/36 | | | 9,294,952 | | | 9,874,434 |
FNMA 30 Year, 6.00%, 1/01/24 - 2/01/37 | | | 20,017,252 | | | 21,269,595 |
FNMA 30 Year, 6.50%, 1/01/24 - 9/01/36 | | | 8,180,020 | | | 8,796,906 |
FNMA 30 Year, 7.50%, 4/01/23 - 8/01/25 | | | 126,049 | | | 141,946 |
FNMA 30 Year, 8.00%, 7/01/16 - 2/01/25 | | | 227,085 | | | 259,880 |
FNMA 30 Year, 8.50%, 10/01/19 - 8/01/21 | | | 3,879 | | | 4,345 |
FNMA 30 Year, 9.00%, 10/01/26 | | | 460,788 | | | 533,852 |
FNMA GL 30 Year, 8.00%, 8/01/19 - 6/01/20 | | | 62,815 | | | 69,032 |
FNMA PL 30 Year, 5.50%, 4/01/34 | | | 4,690,795 | | | 4,922,896 |
| | | | | | |
| | | | | | 69,769,224 |
| | | | | | |
Government National Mortgage Association (GNMA) Fixed Rate 49.3% | | | | | | |
GNMA I SF 30 Year, 4.50%, 3/15/39 | | | 7,803,145 | | | 7,824,619 |
GNMA I SF 30 Year, 4.50%, 3/15/39 | | | 7,773,492 | | | 7,794,885 |
GNMA I SF 30 Year, 4.50%, 9/15/39 | | | 9,957,029 | | | 9,984,431 |
cGNMA I SF 30 Year, 4.50%, 1/01/39 - 11/15/39 | | | 28,403,509 | | | 28,470,837 |
GNMA I SF 30 Year, 5.00%, 8/15/39 | | | 12,235,007 | | | 12,596,249 |
cGNMA I SF 30 Year, 5.00%, 6/15/30 - 1/01/40 | | | 69,023,158 | | | 71,229,368 |
GNMA I SF 30 Year, 5.50%, 11/15/28 - 11/15/39 | | | 59,237,529 | | | 62,292,383 |
GNMA I SF 30 Year, 6.00%, 11/15/23 - 11/15/38 | | | 32,160,014 | | | 34,102,975 |
GNMA I SF 30 Year, 6.50%, 5/15/23 - 9/15/38 | | | 8,448,967 | | | 9,081,394 |
GNMA I SF 30 Year, 7.00%, 3/15/22 - 1/15/32 | | | 2,263,925 | | | 2,513,069 |
FUS-10
Franklin Templeton Variable Insurance Products Trust
Statement of Investments, December 31, 2009 (continued)
| | | | | | |
| Franklin U.S. Government Fund | | Principal
Amount | | Value |
Mortgage-Backed Securities (continued) | | | | | | |
Government National Mortgage Association (GNMA) Fixed Rate (continued) | | | | | | |
GNMA I SF 30 Year, 7.50%, 2/15/17 - 8/15/33 | | $ | 2,108,670 | | $ | 2,367,430 |
GNMA I SF 30 Year, 8.00%, 2/15/17 - 6/15/24 | | | 596,446 | | | 678,505 |
GNMA I SF 30 Year, 8.25%, 4/15/25 | | | 20,313 | | | 23,274 |
GNMA I SF 30 Year, 8.50%, 6/15/22 - 12/15/24 | | | 194,766 | | | 224,667 |
GNMA I SF 30 Year, 9.00%, 6/15/16 - 5/15/20 | | | 77,060 | | | 86,897 |
GNMA I SF 30 Year, 9.50%, 7/15/16 - 6/15/21 | | | 241,938 | | | 273,566 |
GNMA I SF 30 Year, 10.00%, 10/15/17 - 8/15/21 | | | 146,594 | | | 165,269 |
GNMA II SF 30 Year, 4.50%, 10/20/39 - 12/20/39 | | | 7,733,551 | | | 7,740,372 |
GNMA II SF 30 Year, 5.00%, 9/20/33 | | | 7,271,322 | | | 7,532,459 |
GNMA II SF 30 Year, 5.00%, 10/20/33 - 12/20/39 | | | 12,434,582 | | | 12,845,179 |
GNMA II SF 30 Year, 5.50%, 2/20/36 | | | 16,063,739 | | | 16,879,524 |
GNMA II SF 30 Year, 5.50%, 5/20/34 - 6/20/38 | | | 26,712,667 | | | 28,103,124 |
GNMA II SF 30 Year, 6.00%, 1/20/36 | | | 7,021,689 | | | 7,454,249 |
GNMA II SF 30 Year, 6.00%, 11/20/23 - 12/20/38 | | | 20,466,721 | | | 21,788,212 |
GNMA II SF 30 Year, 6.50%, 12/20/27 - 4/20/34 | | | 2,311,984 | | | 2,499,505 |
GNMA II SF 30 Year, 7.00%, 5/20/32 | | | 37,489 | | | 41,426 |
GNMA II SF 30 Year, 7.50%, 5/20/17 - 5/20/33 | | | 444,909 | | | 497,680 |
GNMA II SF 30 Year, 8.00%, 7/20/16 - 8/20/26 | | | 41,918 | | | 46,992 |
GNMA II SF 30 Year, 9.50%, 4/20/25 | | | 3,200 | | | 3,687 |
| | | | | | |
| | | | | | 355,142,227 |
| | | | | | |
Total Mortgage-Backed Securities (Cost $450,438,949) | | | | | | 464,773,627 |
| | | | | | |
U.S. Government and Agency Securities 33.3% | | | | | | |
FFCB, 4.45%, 8/27/10 | | | 15,000,000 | | | 15,379,965 |
FHLB,
2.75%, 6/18/10 | | | 6,000,000 | | | 6,069,690 |
3.625%, 5/29/13 | | | 4,500,000 | | | 4,722,646 |
4.875%, 5/14/10 | | | 10,000,000 | | | 10,171,790 |
5.125%, 8/14/13 | | | 11,000,000 | | | 12,118,865 |
5.375%, 8/19/11 | | | 12,000,000 | | | 12,814,512 |
FHLMC,
3.75%, 3/27/19 | | | 13,000,000 | | | 12,770,095 |
5.125%, 11/17/17 | | | 10,000,000 | | | 10,905,110 |
dFICO,
15, Strip, 3/07/16 | | | 15,000,000 | | | 11,720,340 |
16, Strip, 10/05/10 | | | 4,745,000 | | | 4,705,303 |
FNMA,
1.75%, 3/23/11 | | | 7,000,000 | | | 7,087,682 |
senior note, 5.375%, 6/12/17 | | | 26,000,000 | | | 28,872,402 |
HUD, 96-A,
7.63%, 8/01/14 | | | 2,010,000 | | | 2,016,848 |
7.66%, 8/01/15 | | | 2,120,000 | | | 2,126,892 |
SBA,
aFRN, 2.85%, 6/25/19 | | | 411,595 | | | 416,230 |
aFRN, 3.125%, 3/25/18 | | | 623,108 | | | 629,826 |
PC, 1995-20L, 1, 6.45%, 12/01/15 | | | 528,704 | | | 572,182 |
PC, 1996-20L, 1, 6.70%, 12/01/16 | | | 570,859 | | | 622,698 |
PC, 1997-20G, 1, 6.85%, 7/01/17 | | | 676,935 | | | 721,862 |
PC, 1998-20I, 1, 6.00%, 9/01/18 | | | 1,910,715 | | | 2,050,225 |
TVA,
5.88%, 4/01/36 | | | 10,000,000 | | | 10,718,150 |
zero cpn. to 4/15/12, 8.25% thereafter, 4/15/42 | | | 6,000,000 | | | 5,874,426 |
FUS-11
Franklin Templeton Variable Insurance Products Trust
Statement of Investments, December 31, 2009 (continued)
| | | | | | | |
| Franklin U.S. Government Fund | | Principal
Amount | | Value | |
U.S. Government and Agency Securities (continued) | | | | | | | |
U.S. Treasury Bond, 2.75%, 2/15/19 | | $ | 20,500,000 | | $ | 18,879,229 | |
U.S. Treasury Note,
2.375%, 8/31/14 | | | 8,000,000 | | | 7,943,752 | |
2.375%, 9/30/14 | | | 17,000,000 | | | 16,861,841 | |
2.375%, 10/31/14 | | | 7,000,000 | | | 6,926,171 | |
3.125%, 8/31/13 | | | 12,000,000 | | | 12,473,448 | |
3.125%, 5/15/19 | | | 5,000,000 | | | 4,736,720 | |
4.75%, 5/15/14 | | | 8,000,000 | | | 8,805,008 | |
| | | | | | | |
Total U.S. Government and Agency Securities (Cost $232,419,680) | | | | | | 239,713,908 | |
| | | | | | | |
Total Investments before Short Term Investments (Cost $682,858,629) | | | | | | 704,487,535 | |
| | | | | | | |
Short Term Investments (Cost $19,190,858) 2.7% | | | | | | | |
Repurchase Agreements 2.7% | | | | | | | |
eJoint Repurchase Agreement, 0.003%, 1/04/10 (Maturity Value $19,190,864) | | | 19,190,858 | | | 19,190,858 | |
Banc of America Securities LLC (Maturity Value $2,254,735) | | | | | | | |
BNP Paribas Securities Corp. (Maturity Value $4,509,278) | | | | | | | |
Credit Suisse Securities (USA) LLC (Maturity Value $3,757,955) | | | | | | | |
Deutsche Bank Securities Inc. (Maturity Value $1,153,179) | | | | | | | |
HSBC Securities (USA) Inc. (Maturity Value $3,757,955) | | | | | | | |
Morgan Stanley & Co. Inc. (Maturity Value $3,006,249) | | | | | | | |
UBS Securities LLC (Maturity Value $751,514) | | | | | | | |
Collateralized by U.S. Government Agency Securities, 0.50% - 7.625%, 3/30/10 - 2/09/28;
dU.S. Government Agency Discount Notes, 9/21/10; dU.S. Treasury Bills, 8/26/10 - 12/16/10;
and U.S. Treasury Notes, 0.875% - 4.25%, 5/31/11 - 11/15/14 | | | | | | | |
| | | | | | | |
Total Investments (Cost $702,049,487) 100.5% | | | | | | 723,678,393 | |
Other Assets, less Liabilities (0.5)% | | | | | | (3,340,400 | ) |
| | | | | | | |
Net Assets 100.0% | | | | | $ | 720,337,993 | |
| | | | | | | |
See Abbreviations on page FUS-21.
aThe coupon rate shown represents the rate at period end.
bRounds to less than 0.1% of net assets.
cSecurity purchased on a TBA basis. See Note 1(c).
dThe security is traded on a discount basis with no stated coupon rate.
eSee Note 1(b) regarding joint repurchase agreement.
The accompanying notes are an integral part of these financial statements.
FUS-12
Franklin Templeton Variable Insurance Products Trust
Financial Statements
Statement of Assets and Liabilities
December 31, 2009
| | | | |
| | | Franklin U.S.
Government Fund | |
Assets: | | | | |
Investments in securities: | | | | |
Cost - Unaffiliated issuers | | $ | 682,858,629 | |
Cost - Repurchase agreements | | | 19,190,858 | |
| | | | |
Total cost of investments | | $ | 702,049,487 | |
| | | | |
Value - Unaffiliated issuers | | $ | 704,487,535 | |
Value - Repurchase agreements | | | 19,190,858 | |
| | | | |
Total value of investments | | | 723,678,393 | |
Receivables: | | | | |
Investment securities sold | | | 11,022 | |
Capital shares sold | | | 666,003 | |
Interest | | | 3,914,200 | |
| | | | |
Total assets | | | 728,269,618 | |
| | | | |
Liabilities: | | | | |
Payables: | | | | |
Investment securities purchased | | | 7,006,951 | |
Capital shares redeemed | | | 229,033 | |
Affiliates | | | 530,615 | |
Accrued expenses and other liabilities | | | 165,026 | |
| | | | |
Total liabilities | | | 7,931,625 | |
| | | | |
Net assets, at value | | $ | 720,337,993 | |
| | | | |
Net assets consist of: | | | | |
Paid-in capital | | $ | 687,901,192 | |
Undistributed net investment income | | | 25,992,959 | |
Net unrealized appreciation (depreciation) | | | 21,628,906 | |
Accumulated net realized gain (loss) | | | (15,185,064 | ) |
| | | | |
Net assets, at value | | $ | 720,337,993 | |
| | | | |
Class 1: | | | | |
Net assets, at value | | $ | 162,524,125 | |
| | | | |
Shares outstanding | | | 12,424,587 | |
| | | | |
Net asset value and maximum offering price per share | | $ | 13.08 | |
| | | | |
Class 2: | | | | |
Net assets, at value | | $ | 557,808,928 | |
| | | | |
Shares outstanding | | | 43,338,285 | |
| | | | |
Net asset value and maximum offering price per share | | $ | 12.87 | |
| | | | |
Class 4: | | | | |
Net assets, at value | | $ | 4,940 | |
| | | | |
Shares outstanding | | | 379 | |
| | | | |
Net asset value and maximum offering price per share | | $ | 13.03 | |
| | | | |
The accompanying notes are an integral part of these financial statements.
FUS-13
Franklin Templeton Variable Insurance Products Trust
Financial Statements (continued)
Statement of Operations
for the year ended December 31, 2009
| | | | |
| | | Franklin U.S.
Government Fund | |
Investment income: | | | | |
Interest | | $ | 30,006,854 | |
| | | | |
Expenses: | | | | |
Management fees (Note 3a) | | | 3,290,354 | |
Distribution fees: (Note 3c) | | | | |
Class 2 | | | 1,267,831 | |
Class 4 | | | 18 | |
Unaffiliated transfer agent fees | | | 1,073 | |
Custodian fees (Note 4) | | | 10,305 | |
Reports to shareholders | | | 199,571 | |
Professional fees | | | 40,310 | |
Trustees’ fees and expenses | | | 4,617 | |
Other | | | 33,413 | |
| | | | |
Total expenses | | | 4,847,492 | |
| | | | |
Net investment income | | | 25,159,362 | |
| | | | |
Realized and unrealized gains (losses): | | | | |
Net realized gain (loss) from investments | | | 1,136,390 | |
Net change in unrealized appreciation (depreciation) on investments | | | (5,729,636 | ) |
| | | | |
Net realized and unrealized gain (loss) | | | (4,593,246 | ) |
| | | | |
Net increase (decrease) in net assets resulting from operations | | $ | 20,566,116 | |
| | | | |
The accompanying notes are an integral part of these financial statements.
FUS-14
Franklin Templeton Variable Insurance Products Trust
Financial Statements (continued)
Statements of Changes in Net Assets
| | | | | | | | |
| | | Franklin U.S.
Government Fund | |
| | | Year Ended December 31, | |
| | | 2009 | | | 2008 | |
| | | | |
Increase (decrease) in net assets: | | | | | | | | |
Operations: | | | | | | | | |
Net investment income | | $ | 25,159,362 | | | $ | 24,862,789 | |
Net realized gain (loss) from investments | | | 1,136,390 | | | | (160,442 | ) |
Net change in unrealized appreciation (depreciation) on investments | | | (5,729,636 | ) | | | 18,507,270 | |
| | | | |
Net increase (decrease) in net assets resulting from operations | | | 20,566,116 | | | | 43,209,617 | |
| | | | |
Distributions to shareholders from net investment income: | | | | | | | | |
Class 1 | | | (6,764,185 | ) | | | (8,197,357 | ) |
Class 2 | | | (18,929,900 | ) | | | (19,267,295 | ) |
Class 4 | | | (189 | ) | | | (253 | ) |
| | | | |
Total distributions to shareholders | | | (25,694,274 | ) | | | (27,464,905 | ) |
| | | | |
Capital share transactions: (Note 2) | | | | | | | | |
Class 1 | | | (9,317,944 | ) | | | 1,035,597 | |
Class 2 | | | 111,158,235 | | | | 59,754,476 | |
Class 4 | | | — | | | | 5,000 | |
| | | | |
Total capital share transactions | | | 101,840,291 | | | | 60,795,073 | |
| | | | |
Net increase (decrease) in net assets | | | 96,712,133 | | | | 76,539,785 | |
Net assets: | | | | | | | | |
Beginning of year | | | 623,625,860 | | | | 547,086,075 | |
| | | | |
End of year | | $ | 720,337,993 | | | $ | 623,625,860 | |
| | | | |
Undistributed net investment income included in net assets: | | | | | | | | |
End of year | | $ | 25,992,959 | | | $ | 25,082,928 | |
| | | | |
The accompanying notes are an integral part of these financial statements.
FUS-15
Franklin Templeton Variable Insurance Products Trust
Notes to Financial Statements
Franklin U.S. Government Fund
1. ORGANIZATION AND SIGNIFICANT ACCOUNTING POLICIES
Franklin Templeton Variable Insurance Products Trust (Trust) is registered under the Investment Company Act of 1940, as amended, (1940 Act) as an open-end investment company, consisting of twenty-two separate funds. The Franklin U.S. Government Fund (Fund) is included in this report. The financial statements of the remaining funds in the Trust are presented separately. Shares of the Fund are generally sold only to insurance company separate accounts to fund the benefits of variable life insurance policies or variable annuity contracts. At December 31, 2009, 66.38% of the Fund’s shares were held through one insurance company. The Fund offers three classes of shares: Class 1, Class 2, and Class 4. Each class of shares differs by its distribution fees, voting rights on matters affecting a single class and its exchange privilege.
The following summarizes the Fund’s significant accounting policies.
a. Security Valuation
Government securities, mortgage backed securities, asset-backed securities, collateralized debt obligations and other debt securities generally trade in the over-the-counter market rather than on a securities exchange. The Fund may utilize independent pricing services, quotations from bond dealers, and information with respect to bond and note transactions, to assist in determining a current market value for each security. The Fund’s pricing services may use valuation models or matrix pricing which considers information with respect to comparable bond and note transactions, quotations from bond dealers, or by reference to other securities that are considered comparable in such characteristics as rating, interest rate and maturity date, option adjusted spread models, prepayment projections, interest rate spreads and yield curves, to determine current value.
The Fund has procedures to determine the fair value of individual securities and other assets for which market prices are not readily available or which may not be reliably priced. Methods for valuing these securities may include: fundamental analysis based upon the underlying investment book value, anticipated future cash flows, market changes in comparable or similar securities, matrix pricing, discounts from market prices of similar securities, or discounts applied due to the nature and duration of restrictions on the disposition of the securities. Due to the inherent uncertainty of valuations of such securities, the fair values may differ significantly from the values that would have been used had a ready market for such investments existed. Occasionally, events occur between the time at which trading in a security is completed and the close of the NYSE that might call into question the availability (including the reliability) of the value of a portfolio security held by the Fund. If such an event occurs, the securities may be valued using fair value procedures, which may include the use of independent pricing services. All security valuation procedures are approved by the Fund’s Board of Trustees.
b. Joint Repurchase Agreement
The Fund may enter into a joint repurchase agreement whereby its uninvested cash balance is deposited into a joint cash account with other funds managed by the investment manager or an affiliate of the investment manager and is used to invest in one or more repurchase agreements. The value and face amount of the joint repurchase agreement are allocated to the funds based on their pro-rata interest. A repurchase agreement is accounted for as a loan by the Fund to the seller, collateralized by securities which are delivered to the Fund’s custodian. The market value, including accrued interest, of the initial collateralization is required to be at least 102% of the dollar amount invested by the funds, with the value of the underlying securities marked to market daily to maintain coverage of at least 100%. The joint repurchase agreement held by the Fund at year end had been entered into on December 31, 2009. The joint repurchase agreement is valued at cost which approximates market value.
c. Securities Purchased on a TBA Basis
The Fund may purchase securities on a to-be-announced (TBA) basis, with payment and delivery scheduled for a future date. These transactions are subject to market fluctuations and are subject to the risk that the value at delivery may be more or less than the trade date purchase price. Although the Fund will generally purchase these securities with the intention of holding the securities, it may sell the securities before the settlement date. Sufficient assets have been segregated for these securities.
FUS-16
Franklin Templeton Variable Insurance Products Trust
Notes to Financial Statements (continued)
Franklin U.S. Government Fund
1. ORGANIZATION AND SIGNIFICANT ACCOUNTING POLICIES (continued)
d. Mortgage Dollar Rolls
The Fund may enter into mortgage dollar rolls, typically on a TBA basis. Mortgage dollar rolls are agreements between the Fund and a financial institution to simultaneously sell and repurchase mortgage-backed securities at a future date. Gains or losses are realized on the initial sale, and the difference between the repurchase price and the sale price is recorded as an unrealized gain or loss to the Fund upon entering into the mortgage dollar roll. In addition, the Fund may invest the cash proceeds that are received from the initial sale. During the period between the sale and repurchase, the Fund is not entitled to principal and interest paid on the mortgage backed securities. The risks of mortgage dollar roll transactions include the potential inability of the counterparty to fulfill its obligations.
e. Income Taxes
No provision has been made for U.S. income taxes because it is the Fund’s policy to qualify as a regulated investment company under the Internal Revenue Code and to distribute to shareholders substantially all of its taxable income and net realized gains.
The Fund has reviewed the tax positions, taken on federal income tax returns, for each of the three open tax years and as of December 31, 2009, and has determined that no provision for income tax is required in the Fund’s financial statements.
f. Security Transactions, Investment Income, Expenses and Distributions
Security transactions are accounted for on trade date. Realized gains and losses on security transactions are determined on a specific identification basis. Interest income and estimated expenses are accrued daily. Amortization of premium and accretion of discount on debt securities are included in interest income. Distributions to shareholders are recorded on the ex-dividend date and are determined according to income tax regulations (tax basis). Distributable earnings determined on a tax basis may differ from earnings recorded in accordance with accounting principles generally accepted in the United States of America. These differences may be permanent or temporary. Permanent differences are reclassified among capital accounts to reflect their tax character. These reclassifications have no impact on net assets or the results of operations. Temporary differences are not reclassified, as they may reverse in subsequent periods.
Common expenses incurred by the Trust are allocated among the funds based on the ratio of net assets of each fund to the combined net assets of the Trust. Fund specific expenses are charged directly to the fund that incurred the expense.
Realized and unrealized gains and losses and net investment income, not including class specific expenses, are allocated daily to each class of shares based upon the relative proportion of net assets of each class. Differences in per share distributions, by class, are generally due to differences in class specific expenses.
g. Accounting Estimates
The preparation of financial statements in accordance with accounting principles generally accepted in the United States of America requires management to make estimates and assumptions that affect the reported amounts of assets and liabilities at the date of the financial statements and the amounts of income and expenses during the reporting period. Actual results could differ from those estimates.
h. Guarantees and Indemnifications
Under the Trust’s organizational documents, its officers and trustees are indemnified by the Trust against certain liabilities arising out of the performance of their duties to the Trust. Additionally, in the normal course of business, the Trust, on behalf of the Fund, enters into contracts with service providers that contain general indemnification clauses. The Trust’s maximum exposure under these arrangements is unknown as this would involve future claims that may be made against the Trust that have not yet occurred. Currently, the Trust expects the risk of loss to be remote.
FUS-17
Franklin Templeton Variable Insurance Products Trust
Notes to Financial Statements (continued)
Franklin U.S. Government Fund
2. SHARES OF BENEFICIAL INTEREST
At December 31, 2009, there were an unlimited number of shares authorized (without par value). Transactions in the Fund’s shares were as follows:
| | | | | | | | | | | | | | |
| | | Year Ended December 31, | |
| | | 2009 | | | 2008a | |
| Class 1 Shares: | | Shares | | | Amount | | | Shares | | | Amount | |
Shares sold | | 763,621 | | | $ | 10,042,333 | | | 1,508,316 | | | $ | 19,454,640 | |
Shares issued in reinvestment of distributions | | 531,776 | | | | 6,764,185 | | | 670,267 | | | | 8,197,357 | |
Shares redeemed | | (1,989,207 | ) | | | (26,124,462 | ) | | (2,067,820 | ) | | | (26,616,400 | ) |
| | | | |
Net increase (decrease) | | (693,810 | ) | | $ | (9,317,944 | ) | | 110,763 | | | $ | 1,035,597 | |
| | | | |
Class 2 Shares: | | | | | | | | | | | | | | |
Shares sold | | 18,952,917 | | | $ | 245,236,722 | | | 13,882,490 | | | $ | 175,369,056 | |
Shares issued in reinvestment of distributions | | 1,510,766 | | | | 18,929,900 | | | 1,597,620 | | | | 19,267,295 | |
Shares redeemed | | (11,812,087 | ) | | | (153,008,387 | ) | | (10,646,552 | ) | | | (134,881,875 | ) |
| | | | |
Net increase (decrease) | | 8,651,596 | | | $ | 111,158,235 | | | 4,833,558 | | | $ | 59,754,476 | |
| | | | |
Class 4 Shares: | | | | | | | | | | | | | | |
Shares sold | | — | | | $ | — | | | 379 | | | $ | 5,000 | |
| | | | |
| a | For the period February 29, 2008 (effective date) to December 31, 2008 for Class 4. |
3. TRANSACTIONS WITH AFFILIATES
Franklin Resources, Inc. is the holding company for various subsidiaries that together are referred to as Franklin Templeton Investments. Certain officers and trustees of the Trust are also officers and/or directors of the following subsidiaries:
| | |
| Subsidiary | | Affiliation |
Franklin Advisers, Inc. (Advisers) | | Investment manager |
Franklin Templeton Services, LLC (FT Services) | | Administrative manager |
Franklin Templeton Distributors, Inc. (Distributors) | | Principal underwriter |
Franklin Templeton Investor Services, LLC (Investor Services) | | Transfer agent |
a. Management Fees
The Fund pays an investment management fee to Advisers based on the average daily net assets of the Fund as follows:
| | |
| Annualized Fee Rate | | Net Assets |
| 0.625% | | Up to and including $100 million |
| 0.500% | | Over $100 million, up to and including $250 million |
| 0.450% | | Over $250 million, up to and including $7.5 billion |
| 0.440% | | Over $7.5 billion, up to and including $10 billion |
| 0.430% | | Over $10 billion, up to and including $12.5 billion |
| 0.420% | | Over $12.5 billion, up to and including $15 billion |
| 0.400% | | In excess of $15 billion |
b. Administrative Fees
Under an agreement with Advisers, FT Services provides administrative services to the Fund. The fee is paid by Advisers based on average daily net assets, and is not an additional expense of the Fund.
FUS-18
Franklin Templeton Variable Insurance Products Trust
Notes to Financial Statements (continued)
Franklin U.S. Government Fund
3. TRANSACTIONS WITH AFFILIATES (continued)
c. Distribution Fees
The Fund’s Board of Trustees has adopted distribution plans for Class 2 and Class 4 shares pursuant to Rule 12b-1 under the 1940 Act. Under the Fund’s compensation distribution plans, the Fund pays Distributors for costs incurred in connection with the servicing, sale and distribution of the Fund’s shares up to 0.35% per year of its average daily net assets of each class. The Board of Trustees has agreed to limit the current rate to 0.25% per year for Class 2.
d. Transfer Agent Fees
Investor Services, under terms of an agreement, performs shareholder servicing for the Fund and is not paid by the Fund for the services.
4. EXPENSE OFFSET ARRANGEMENT
The Fund has entered into an arrangement with its custodian whereby credits realized as a result of uninvested cash balances are used to reduce a portion of the Fund’s custodian expenses. During the year ended December 31, 2009, there were no credits earned.
5. INCOME TAXES
For tax purposes, capital losses may be carried over to offset future capital gains, if any. At December 31, 2009, the capital loss carryforwards were as follows:
| | |
Capital loss carryforwards expiring in: | | |
2011 | | $ 4,558,723 |
2012 | | 3,331,578 |
2013 | | 2,102,640 |
2014 | | 1,618,397 |
2015 | | 2,329,071 |
2016 | | 841,479 |
2017 | | 401,851 |
| | |
| | $15,183,739 |
| | |
The tax character of distributions paid during the years ended December 31, 2009 and 2008, was as follows:
| | | | | | |
| | | 2009 | | 2008 |
Distributions paid from ordinary income: | | $ | 25,694,274 | | $ | 27,464,905 |
| | | |
At December 31, 2009, the cost of investments, net unrealized appreciation (depreciation), and undistributed ordinary income for income tax purposes were as follows:
| | | | |
Cost of investments | | $ | 702,846,109 | |
| | | | |
| |
Unrealized appreciation | | $ | 24,434,013 | |
Unrealized depreciation | | | (3,601,729 | ) |
| | | | |
Net unrealized appreciation (depreciation) | | $ | 20,832,284 | |
| | | | |
Distributable earnings – undistributed ordinary income | | $ | 26,788,252 | |
| | | | |
FUS-19
Franklin Templeton Variable Insurance Products Trust
Notes to Financial Statements (continued)
Franklin U.S. Government Fund
5. INCOME TAXES (continued)
Net investment income differs for financial statement and tax purposes primarily due to differing treatments of mortgage dollar rolls, paydown losses and bond discounts and premiums.
Net realized gains (losses) differ for financial statement and tax purposes primarily due to differing treatments of wash sales, mortgage dollar rolls, paydown losses and bond discounts and premiums.
6. INVESTMENT TRANSACTIONS
Purchases and sales of investments (excluding short term securities) for the year ended December 31, 2009, aggregated $292,113,452 and $178,283,302, respectively.
7. CREDIT FACILITY
The Fund, together with other U.S. registered and foreign investment funds (collectively “Borrowers”), managed by Franklin Templeton Investments, are borrowers in a joint syndicated senior unsecured credit facility totaling $725 million (Global Credit Facility) to provide a source of funds to the Borrowers for temporary and emergency purposes, including the ability to meet future unanticipated or unusually large redemption requests. Effective January 22, 2010, the Fund renewed the Global Credit Facility, for a total of $750 million, maturing January 21, 2011.
Under the terms of the Global Credit Facility, the Fund shall, in addition to interest charged on any borrowings made by the Fund and other costs incurred by the Fund, pay its share of fees and expenses incurred in connection with the implementation and maintenance of the Global Credit Facility, based upon its relative share of the aggregate net assets of all of the Borrowers, including an annual commitment fee of 0.10% based upon the unused portion of the Global Credit Facility, which is reflected in other expenses on the Statement of Operations. During the year ended December 31, 2009, the Fund did not utilize the Global Credit Facility.
8. FAIR VALUE MEASUREMENTS
The Fund follows a fair value hierarchy that distinguishes between market data obtained from independent sources (observable inputs) and the Fund’s own market assumptions (unobservable inputs). These inputs are used in determining the value of the Fund’s investments and are summarized in the following fair value hierarchy:
| | • | | Level 1 – quoted prices in active markets for identical securities |
| | • | | Level 2 – other significant observable inputs (including quoted prices for similar securities, interest rates, prepayment speed, credit risk, etc.) |
| | • | | Level 3 – significant unobservable inputs (including the Fund’s own assumptions in determining the fair value of investments) |
The inputs or methodology used for valuing securities are not an indication of the risk associated with investing in those securities.
At December 31, 2009, all of the Fund’s investments in securities carried at fair value were in Level 2 inputs. For detailed industry descriptions, see the accompanying Statement of Investments.
FUS-20
Franklin Templeton Variable Insurance Products Trust
Notes to Financial Statements (continued)
Franklin U.S. Government Fund
9. NEW ACCOUNTING PRONOUNCEMENTS
In January 2010, the Financial Accounting Standards Board issued Accounting Standards Update (ASU) No. 2010-6, Fair Value Measurements and Disclosures (Topic 820): Improving Disclosures about Fair Value Measurements. ASU No. 2010-6 enhances and clarifies existing fair value measurement disclosure requirements and is effective for interim and annual periods beginning after December 15, 2009. The Fund is currently evaluating the impact, if any, of applying the provisions of ASU No. 2010-6.
10. SUBSEQUENT EVENTS
The Fund has evaluated subsequent events through February 10, 2010, the issuance date of the financial statements and determined that no events have occurred that require disclosure.
ABBREVIATIONS
Selected Portfolio
FFCB - Federal Farm Credit Bank
FHLB - Federal Home Loan Bank
FICO - Financing Corp.
FRN - Floating Rate Note
GL - Government Loan
HUD - Housing and Urban Development
PC - Participation Certificate
PL - Project Loan
SBA - Small Business Administration
SF - Single Family
TVA - Tennessee Valley Authority
FUS-21
Franklin Templeton Variable Insurance Products Trust
Franklin U.S. Government Fund
Report of Independent Registered Public Accounting Firm
To the Board of Trustees and Shareholders of Franklin Templeton Variable Insurance Products Trust
In our opinion, the accompanying statement of assets and liabilities, including the statement of investments, and the related statements of operations and of changes in net assets and the financial highlights present fairly, in all material respects, the financial position of Franklin U.S. Government Fund (one of the funds constituting the Franklin Templeton Variable Insurance Products Trust, hereafter referred to as the “Fund”) at December 31, 2009, the results of its operations for the year then ended, the changes in its net assets and the financial highlights for the periods presented, in conformity with accounting principles generally accepted in the United States of America. These financial statements and financial highlights (hereafter referred to as “financial statements”) are the responsibility of the Fund’s management. Our responsibility is to express an opinion on these financial statements based on our audits. We conducted our audits of these financial statements in accordance with the standards of the Public Company Accounting Oversight Board (United States). Those standards require that we plan and perform the audit to obtain reasonable assurance about whether the financial statements are free of material misstatement. An audit includes examining, on a test basis, evidence supporting the amounts and disclosures in the financial statements, assessing the accounting principles used and significant estimates made by management, and evaluating the overall financial statement presentation. We believe that our audits, which included confirmation of securities at December 31, 2009 by correspondence with the custodian and brokers, provide a reasonable basis for our opinion.
PricewaterhouseCoopers LLP
San Francisco, California
February 10, 2010
FUS-22
MUTUAL GLOBAL DISCOVERY SECURITIES FUND
(MUTUAL DISCOVERY SECURITIES FUNDBEFORE MAY 1, 2009)
This annual report for Mutual Global Discovery Securities Fund covers the fiscal year ended December 31, 2009.
Performance Summary as of 12/31/09
Average annual total return of Class 4 shares* represents the average annual change in value, assuming reinvestment of dividends and capital gains. Average returns smooth out variations in returns, which can be significant; they are not the same as year-by-year results.
Periods ended 12/31/09
| | | | | | |
| | | 1-Year | | 5-Year | | 10-Year |
Average Annual Total Return | | +23.19% | | +7.21% | | +8.14% |
*For the period beginning 2/29/08, Class 4 performance reflects a 12b-1 fee expense of 0.35% per year, which affects future performance. Class 4 performance prior to 2/29/08 reflects historical Class 1 performance, which does not include a 12b-1 fee expense. Since 2/29/08 (effective date), the average annual total return of Class 4 shares was -3.16%.
Total Return Index Comparison for a Hypothetical $10,000 Investment (1/1/00–12/31/09)
The graph below shows the change in value of a hypothetical $10,000 investment in the Fund over the indicated period and includes reinvestment of any income or distributions. The Fund’s performance* is compared to the performance of the Standard & Poor’s 500 Index (S&P 500) and the Morgan Stanley Capital International (MSCI) World Index. One cannot invest directly in an index, and an index is not representative of the Fund’s portfolio. Please see Important Notes to Performance Information preceding the Fund Summaries.
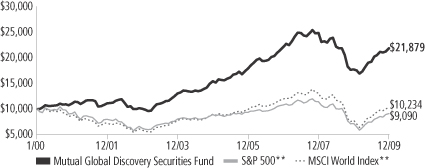
**Source: © 2009 Morningstar. Please see Index Descriptions following the Fund Summaries.
Mutual Global Discovery Securities Fund – Class 4
Performance reflects the Fund’s Class 4 operating expenses, but does not include any contract fees, expenses or sales charges. If they had been included, performance would be lower. These charges and deductions, particularly for variable life policies, can have a significant effect on contract values and insurance benefits. See the contract prospectus for a complete description of these expenses, including sales charges.
Performance data represent past performance, which does not guarantee future results. Investment return and principal value will fluctuate, and you may have a gain or loss when you sell your shares.
Current performance may differ from figures shown.
MGD-1
Fund Goal and Main Investments: Mutual Global Discovery Securities Fund seeks capital appreciation. The Fund normally invests primarily in U.S. and foreign equity securities that the manager believes are undervalued. The Fund invests, to a lesser extent, in risk arbitrage securities and distressed companies.
Performance Overview
You can find the Fund’s one-year total return in the Performance Summary. Compared with its benchmarks, the Fund underperformed the MSCI World Index, which had a +30.79% total return, and the S&P 500, which had a +26.46% total return for the same period.1 The Fund’s goal and main investment strategy have not changed; however, we changed the Fund’s name to better reflect its strategy of seeking opportunities around the world.
Economic and Market Overview
Equity markets entered 2009 largely pricing in a possible economic depression and systemic solvency crisis, scenarios that were ultimately averted by one of the most aggressive global policy responses in financial history. As government monetary and fiscal intervention began to gain traction toward the end of the first quarter, equities bottomed and largely reversed their decline, economic growth stabilized and rebounded, and confidence was rekindled as investors began to believe the global financial system was finally on the mend. Global equities rallied 73% from their March lows, led by the riskier, lower quality stocks that had been most vulnerable to a systemic meltdown or funding collapse.2 Emerging market economies fueled the recovery as governments aggressively incentivized lending and consumption, resulting in a dramatic statistical recovery that laid the groundwork for the developing world’s best annual equity rally on record. Growing demand from emerging markets supported commodity prices, which also posted record gains during the year. For most of the year, the fading U.S. dollar also helped underpin the rally in hard assets, while continued euro and yen strength created headwinds for regional recoveries.
Nonetheless, developed economies technically recovered by year-end, with Germany and France leading the eurozone out of a recession and both Japan and the U.S. exiting their longest recessions since World
1. Source: © 2009 Morningstar. One cannot invest directly in an index, and an index is not representative of the Fund’s portfolio. Please see Index Descriptions following the Fund Summaries.
2. As measured by the MSCI All Country World Index. Source: © 2009 Morningstar. Please see Index Descriptions following the Fund Summaries.
Fund Risks: The Fund’s investments in stocks may offer the potential for long-term gains but can be subject to short-term price fluctuations. Investments in companies involved in mergers, liquidations, reorganizations and distressed bankruptcy, which may include defaulted debt, involve higher credit and other risks. Foreign investing, especially in emerging markets, involves additional risks, including currency fluctuations, economic instability, market volatility, and political and social instability. Smaller and midsize company securities involve special risks, such as relatively small revenues, limited product lines and small market share. The Fund’s prospectus also includes a description of the main investment risks.
MGD-2
War II. Credit spreads narrowed as access to capital expanded and the private sector significantly reduced debt, though largely by transferring their liabilities to the public balance sheet. The growing indebtedness of sovereign governments exposed structural weaknesses in places like Dubai, Greece and Ireland, temporarily roiling markets toward the end of the year. Policymakers remained firmly committed to stimulus throughout the period, indicating that deflation worries persisted despite signs of economic stabilization. The U.S. Federal Reserve Board announced its intention to keep the benchmark lending rate “exceptionally low” for an extended period; the new Japanese administration trumpeted its fight against deflation; and even China restated its commitment to “moderately loose” policy. Still, policymakers began discussing exit strategies by period-end as interest rates remained at record lows and economic indicators rebounded.
Investment Strategy
At Mutual Series, we are committed to our distinctive value approach to investing. Our major investment strategy is investing in undervalued stocks. When selecting undervalued equities, we are attracted to fundamentally strong companies with healthy balance sheets, high-quality assets, substantial free cash flow and shareholder-oriented management teams and whose stocks are trading at discounts to our assessment of the companies’ intrinsic or business value. We also look for asset rich companies whose shares may be trading at depressed levels due to concerns over short-term earnings disappointments, litigation, management strategy or other perceived negatives. While the vast majority of our undervalued equity investments are made in publicly traded companies globally, we may invest occasionally in privately held companies as well.
We complement this more traditional investment strategy with two others. One is distressed investing, which is complex and can take many forms. The most common distressed investment the Fund undertakes is the purchase of financially troubled or bankrupt companies’ debt at a substantial discount to face value. After the financially distressed company is reorganized, often in bankruptcy court, the old debt is typically replaced with new securities issued by the financially stronger company.
The other piece of our investment strategy is participating in arbitrage situations, another highly specialized field. When companies announce proposed mergers or takeovers, commonly referred to as “deals,” the
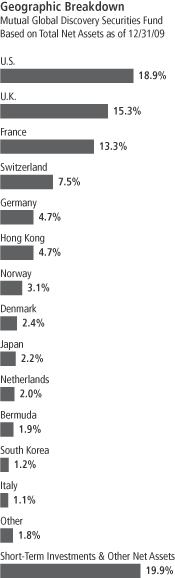
MGD-3
target company may trade at a discount to the bid it ultimately accepts. One form of arbitrage involves purchasing the target company’s stock when it is trading below the value we believe it would receive in a deal. In keeping with our commitment to a relatively conservative investment approach, we typically focus our arbitrage efforts on announced deals, and eschew rumored deals or other situations we consider relatively risky.
In addition, it is our practice to hedge the Fund’s currency exposure when we deem it advantageous for our shareholders.
Manager’s Discussion
During 2009, the Fund’s top performers included Seadrill, a Norwegian deepwater contract driller; The Link Real Estate Investment Trust (REIT), a Hong Kong-based property manager with a portfolio of about 180 mostly retail properties; and Schindler Holding, a Swiss elevator and escalator manufacturer.
Seadrill, one the world’s largest offshore drilling companies, owns a fleet of nine ultra-deepwater assets, with three additional units scheduled for 2011 delivery. The company benefited from increased demand for rigs capable of drilling in deep water basins including the Santos Basin near Brazil (Tupi oil field), U.S. Gulf of Mexico, and offshore West Africa. Seadrill has entered into long-term contracts for much of its deepwater fleet, with three contracts that extend beyond 2014. This long order book gives the company and investors a higher degree of visibility in forecasting future results. Seadrill’s stock price gained strength as the company restructured its balance sheet and as oil prices more than doubled from first quarter lows.
The Link REIT is a portfolio of retail properties that were once owned and managed by Hong Kong’s government. According to our analysis, privatization facilitated better management of the properties, helping Link REIT’s investment value rally during 2009 as management executed its strategy of upgrading its portfolio of properties while delivering vastly improved yields. The company is currently making improvements to a portion of its portfolio, and as this floor space comes back into service, we believe it could garner significantly higher yields than before, adding further impetus to the company’s valuation. Additionally, we found the dividend paid by Link REIT quite attractive.
Top 10 Sectors/Industries
Mutual Global Discovery Securities Fund
Based on Equity Securities
12/31/09
| | |
| | | % of Total
Net Assets |
| Tobacco | | 14.1% |
| Food Products | | 11.1% |
| Commercial Banks | | 4.8% |
| Beverages | | 4.7% |
| Energy Equipment & Services | | 4.5% |
| Industrial Conglomerates | | 3.8% |
| Diversified Financial Services | | 3.3% |
| Food & Staples Retailing | | 3.1% |
| Insurance | | 2.7% |
| Software | | 2.7% |
MGD-4
Schindler shares performed well largely due to the company’s resilient earnings coming from its long-term equipment maintenance contracts. A big drop in new orders throughout 2009 came as no surprise to us, given historically weak global construction markets. However, Schindler’s extensive order book enabled the company to adjust its cost base in a timely fashion and allowed it to protect its group margins. We found that the substantial prepayments stemming from the company’s maintenance contracts, in combination with low capital expenditure needs, have thus far enabled Schindler to generate sizable free cash flows in a variety of economic scenarios.
Despite the Fund’s 2009 gain, several holdings detracted from performance. These included South Korean tobacco and ginseng product manufacturer KT&G; Japanese video game and handheld device maker Nintendo; and Germany-based Siemens (sold by period-end), one of the world’s largest electronics and industrial engineering firms.
For the most part, KT&G shares performed weakly in 2009 as the company lost market share to other competitors within its domestic tobacco market.
Nintendo is one of the world’s largest producers of entertainment hardware and software. During 2009, its share price was negatively impacted by lower-than-expected sales of Wii gaming consoles. In addition to lower Wii sales, stronger-than-expected currency appreciation of the Japanese yen versus the U.S. dollar during Nintendo’s fiscal first half (ended September 30, 2009) caused the company to lower its sales and profit estimates. We began purchasing Nintendo shares in fourth quarter 2009 as we believed the company was trading at a significant discount to its intrinsic value at that time. Nintendo retains the leading market share in console-based and portable gaming devices, and its software business has produced many of the top selling games of all time. The company’s balance sheet is strong, with net cash and equivalents making up about 30% of its market capitalization. At period-end, we believed the stock stood to further benefit from the already large, installed base of Nintendo-branded devices.
Siemens’ stock price declined from the beginning of the year through March 2009 as concerns over economic growth roiled markets worldwide. Although the stock recovered some of its losses before it was sold toward the end of June, its overall impact on the Fund’s performance was negative, as investors remained concerned at the capital spending outlook for Siemens customers in the industrial, energy and health care markets.
Top 10 Holdings
Mutual Global Discovery
Securities Fund
12/31/09
| | |
Company
Sector/Industry,
Country | | % of Total
Net Assets |
British American
Tobacco PLC | | 3.7% |
| Tobacco, U.K. | | |
| Imperial Tobacco Group PLC | | 3.2% |
| Tobacco, U.K. | | |
| Danone | | 3.0% |
| Food Products, France | | |
| Cadbury PLC | | 3.0% |
| Food Products, U.K. | | |
| Nestle SA | | 2.7% |
| Food Products, Switzerland | | |
| Carlsberg AS, A&B | | 2.3% |
| Beverages, Denmark | | |
| Vodafone Group PLC | | 2.0% |
Wireless Telecommunication
Services, U.K. |
| Pernod Ricard SA | | 1.9% |
| Beverages, France | | |
| Eutelsat Communications | | 1.9% |
| Media, France | | |
| The Link REIT | | 1.8% |
Real Estate Investment Trusts,
Hong Kong |
The dollar value, number of shares or principal amount, and names of all portfolio holdings are listed in the Fund’s Statement of Investments.
MGD-5
Finally, investors should note that we maintained our currency hedging posture of being generally hedged to the U.S. dollar for most of our non-U.S. holdings. Since the dollar was weaker compared with most foreign currencies during the first half of 2009, our hedging strategy negatively impacted performance.
Thank you for your participation in Mutual Global Discovery Securities Fund. We look forward to serving your future investment needs.
The foregoing information reflects our analysis, opinions and portfolio holdings as of December 31, 2009, the end of the reporting period. The way we implement our main investment strategies and the resulting portfolio holdings may change depending on factors such as market and economic conditions. These opinions may not be relied upon as investment advice or an offer for a particular security. The information is not a complete analysis of every aspect of any market, country, industry, security or the Fund. Statements of fact are from sources considered reliable, but the investment manager makes no representation or warranty as to their completeness or accuracy. Although historical performance is no guarantee of future results, these insights may help you understand our investment management philosophy.
MGD-6
Fund Expenses
As an investor in a variable insurance contract (Contract) that indirectly provides for investment in an underlying mutual fund, you can incur transaction and/or ongoing expenses at both the Fund level and the Contract level.
| • | | Transaction expenses can include sales charges (loads) on purchases, redemption fees, surrender fees, transfer fees and premium taxes. |
| • | | Ongoing expenses can include management fees, distribution and service (12b-1) fees, contract fees, annual maintenance fees, mortality and expense risk fees and other fees and expenses. All mutual funds and Contracts have some types of ongoing expenses. |
The expenses shown in the table are meant to highlight ongoing expenses at the Fund level only and do not include ongoing expenses at the Contract level, or transaction expenses at either the Fund or Contract level. While the Fund does not have transaction expenses, if the transaction and ongoing expenses at the Contract level were included, the expenses shown below would be higher. You should consult your Contract prospectus or disclosure document for more information.
The table shows Fund-level ongoing expenses and can help you understand these expenses and compare them with those of other mutual funds offered through the Contract. The table assumes a $1,000 investment held for the six months indicated. Please refer to the Fund prospectus for additional information on operating expenses.
Actual Fund Expenses
The first line (Actual) of the table provides actual account values and expenses. The “Ending Account Value” is derived from the Fund’s actual return, which includes the effect of ongoing Fund expenses, but does not include the effect of ongoing Contract expenses.
You can estimate the Fund-level expenses you incurred during the period by following these steps. Of course, your account value and expenses will differ from those in this illustration:
| 1. | Divide your account value by $1,000. |
If an account had an $8,600 value, then $8,600 ÷ $1,000 = 8.6.
| 2. | Multiply the result by the number under the heading “Fund-Level Expenses Incurred During Period.” |
If Fund-Level Expenses Incurred During Period were $7.50, then 8.6 x $7.50 = $64.50.
In this illustration, the estimated expenses incurred this period at the Fund level are $64.50.
Mutual Global Discovery Securities Fund – Class 4
MGD-7
Hypothetical Example for Comparison with Other Mutual Funds
Information in the second line (Hypothetical) of the table can help you compare ongoing expenses of the Fund with those of other mutual funds offered through the Contract. This information may not be used to estimate the actual ending account balance or expenses you incurred during the period. The hypothetical “Ending Account Value” is based on the Fund’s actual expense ratio and an assumed 5% annual rate of return before expenses, which does not represent the Fund’s actual return. The figure under the heading “Fund-Level Expenses Incurred During Period” shows the hypothetical expenses your account would have incurred under this scenario. You can compare this figure with the 5% hypothetical examples that appear in shareholder reports of other funds offered through a Contract.
| | | | | | | | | |
| Class 4 | | Beginning
Account Value 7/1/09 | | Ending
Account Value 12/31/09 | | Fund-Level Expenses Incurred
During Period* 7/1/09–12/31/09 |
Actual | | $ | 1,000 | | $ | 1,135.80 | | $ | 7.54 |
Hypothetical (5% return before expenses) | | $ | 1,000 | | $ | 1,018.15 | | $ | 7.12 |
*Expenses are calculated using the most recent six-month annualized expense ratio for the Fund’s Class 4 shares (1.40%), which does not include any ongoing expenses of the Contract for which the Fund is an investment option, multiplied by the average account value over the period, multiplied by 184/365 to reflect the one-half year period.
MGD-8
Franklin Templeton Variable Insurance Products Trust
Financial Highlights
Mutual Global Discovery Securities Fund
| | | | | | | | | | | | | | | | | | | | |
| | | Year Ended December 31, | |
| Class 1 | | 2009 | | | 2008 | | | 2007 | | | 2006 | | | 2005 | |
| | | | |
Per share operating performance | | | | | | | | | | | | | | | | | | | | |
(for a share outstanding throughout the year) | | | | | | | | | | | | | | | | | | | | |
Net asset value, beginning of year | | $ | 16.12 | | | $ | 24.08 | | | $ | 22.05 | | | $ | 18.85 | | | $ | 16.44 | |
| | | | |
Income from investment operationsa: | | | | | | | | | | | | | | | | | | | | |
Net investment incomeb | | | 0.19 | c | | | 0.37 | | | | 0.47 | | | | 0.52 | | | | 0.25 | |
Net realized and unrealized gains (losses) | | | 3.57 | | | | (6.95 | ) | | | 2.22 | | | | 3.69 | | | | 2.40 | |
| | | | |
Total from investment operations | | | 3.76 | | | | (6.58 | ) | | | 2.69 | | | | 4.21 | | | | 2.65 | |
| | | | |
Less distributions from: | | | | | | | | | | | | | | | | | | | | |
Net investment income | | | (0.26 | ) | | | (0.52 | ) | | | (0.38 | ) | | | (0.25 | ) | | | (0.24 | ) |
Net realized gains | | | (0.48 | ) | | | (0.86 | ) | | | (0.28 | ) | | | (0.76 | ) | | | — | |
| | | | |
Total distributions | | | (0.74 | ) | | | (1.38 | ) | | | (0.66 | ) | | | (1.01 | ) | | | (0.24 | ) |
| | | | |
Net asset value, end of year | | $ | 19.14 | | | $ | 16.12 | | | $ | 24.08 | | | $ | 22.05 | | | $ | 18.85 | |
| | | | |
| | | | | |
Total returnd | | | 23.63% | | | | (28.29)% | | | | 12.17% | | | | 23.32% | | | | 16.28% | |
Ratios to average net assets | | | | | | | | | | | | | | | | | | | | |
Expensese,f | | | 1.06% | | | | 0.98% | | | | 0.97% | | | | 1.03% | | | | 1.02% | |
Expenses - excluding dividend expense on securities sold shortf | | | 0.97% | | | | 0.97% | | | | 0.97% | | | | 1.00% | | | | 1.00% | |
Net investment income | | | 1.07% | c | | | 1.82% | | | | 1.96% | | | | 2.44% | | | | 1.37% | |
| | | | | |
Supplemental data | | | | | | | | | | | | | | | | | | | | |
Net assets, end of year (000’s) | | $ | 86,755 | | | $ | 81,320 | | | $ | 142,751 | | | $ | 146,229 | | | $ | 136,508 | |
Portfolio turnover rate | | | 43.35% | | | | 22.76% | | | | 28.20% | | | | 19.83% | | | | 22.94% | |
aThe amount shown for a share outstanding throughout the period may not correlate with the Statement of Operations for the period due to the timing of sales and repurchases of the Fund shares in relation to income earned and/or fluctuating market value of the investments of the Fund.
bBased on average daily shares outstanding.
cNet investment income per share includes approximately $(0.03) per share related to an adjustment for uncollectible interest as disclosed on the Statement of Operations. Excluding the effect of this adjustment, the ratio of net investment income to average net assets would have been 1.26%. See Note 7.
dTotal return does not include any fees, charges or expenses imposed by the variable annuity and life insurance contracts for which the Franklin Templeton Variable Insurance Products Trust serves as an underlying investment vehicle.
eIncludes dividend expense on securities sold short which varies from period to period. See below for expense ratios that reflect only operating expenses.
fBenefit of expense reduction rounds to less than 0.01%.
The accompanying notes are an integral part of these financial statements.
MGD-9
Franklin Templeton Variable Insurance Products Trust
Financial Highlights (continued)
Mutual Global Discovery Securities Fund
| | | | | | | | | | | | | | | | | | | | |
| | | Year Ended December 31, | |
| Class 2 | | 2009 | | | 2008 | | | 2007 | | | 2006 | | | 2005 | |
| | | | |
Per share operating performance | | | | | | | | | | | | | | | | | | | | |
(for a share outstanding throughout the year) | | | | | | | | | | | | | | | | | | | | |
Net asset value, beginning of year | | $ | 15.85 | | | $ | 23.69 | | | $ | 21.73 | | | $ | 18.60 | | | $ | 16.25 | |
| | | | |
Income from investment operationsa: | | | | | | | | | | | | | | | | | | | | |
Net investment incomeb | | | 0.14 | c | | | 0.32 | | | | 0.40 | | | | 0.43 | | | | 0.19 | |
Net realized and unrealized gains (losses) | | | 3.50 | | | | (6.84 | ) | | | 2.18 | | | | 3.68 | | | | 2.38 | |
| | | | |
Total from investment operations | | | 3.64 | | | | (6.52 | ) | | | 2.58 | | | | 4.11 | | | | 2.57 | |
| | | | |
Less distributions from: | | | | | | | | | | | | | | | | | | | | |
Net investment income | | | (0.20 | ) | | | (0.46 | ) | | | (0.34 | ) | | | (0.22 | ) | | | (0.22 | ) |
Net realized gains | | | (0.48 | ) | | | (0.86 | ) | | | (0.28 | ) | | | (0.76 | ) | | | — | |
| | | | |
Total distributions | | | (0.68 | ) | | | (1.32 | ) | | | (0.62 | ) | | | (0.98 | ) | | | (0.22 | ) |
| | | | |
Net asset value, end of year | | $ | 18.81 | | | $ | 15.85 | | | $ | 23.69 | | | $ | 21.73 | | | $ | 18.60 | |
| | | | |
| | | | | |
Total returnd | | | 23.31% | | | | (28.45)% | | | | 11.85% | | | | 23.06% | | | | 15.97% | |
Ratios to average net assets | | | | | | | | | | | | | | | | | | | | |
Expensese,f | | | 1.31% | | | | 1.23% | | | | 1.22% | | | | 1.28% | | | | 1.28% | |
Expenses - excluding dividend expense on securities sold shortf | | | 1.22% | | | | 1.22% | | | | 1.22% | | | | 1.25% | | | | 1.25% | |
Net investment income | | | 0.82% | c | | | 1.57% | | | | 1.71% | | | | 2.19% | | | | 1.12% | |
| | | | | |
Supplemental data | | | | | | | | | | | | | | | | | | | | |
Net assets, end of year (000’s) | | $ | 1,309,852 | | | $ | 1,113,720 | | | $ | 1,867,484 | | | $ | 1,365,575 | | | $ | 811,975 | |
Portfolio turnover rate | | | 43.35% | | | | 22.76% | | | | 28.20% | | | | 19.83% | | | | 22.94% | |
aThe amount shown for a share outstanding throughout the period may not correlate with the Statement of Operations for the period due to the timing of sales and repurchases of the Fund shares in relation to income earned and/or fluctuating market value of the investments of the Fund.
bBased on average daily shares outstanding.
cNet investment income per share includes approximately $(0.03) per share related to an adjustment for uncollectible interest as disclosed on the Statement of Operations. Excluding the effect of this adjustment, the ratio of net investment income to average net assets would have been 1.01%. See Note 7.
dTotal return does not include any fees, charges or expenses imposed by the variable annuity and life insurance contracts for which the Franklin Templeton Variable Insurance Products Trust serves as an underlying investment vehicle.
eIncludes dividend expense on securities sold short which varies from period to period. See below for expense ratios that reflect only operating expenses.
fBenefit of expense reduction rounds to less than 0.01%.
The accompanying notes are an integral part of these financial statements.
MGD-10
Franklin Templeton Variable Insurance Products Trust
Financial Highlights (continued)
Mutual Global Discovery Securities Fund
| | | | | | | | |
| | | Year Ended
December 31, | |
| Class 4 | | 2009 | | | 2008a | |
| | | | |
Per share operating performance | | | | | | | | |
(for a share outstanding throughout the year) | | | | | | | | |
Net asset value, beginning of year | | $ | 16.07 | | | $ | 22.50 | |
| | | | |
Income from investment operationsb: | | | | | | | | |
Net investment incomec | | | 0.11 | d | | | 0.09 | |
Net realized and unrealized gains (losses) | | | 3.56 | | | | (5.14 | ) |
| | | | |
Total from investment operations | | | 3.67 | | | | (5.05 | ) |
| | | | |
Less distributions from: | | | | | | | | |
Net investment income | | | (0.24 | ) | | | (0.52 | ) |
Net realized gains | | | (0.48 | ) | | | (0.86 | ) |
| | | | |
Total distributions | | | (0.72 | ) | | | (1.38 | ) |
| | | | |
Net asset value, end of year | | $ | 19.02 | | | $ | 16.07 | |
| | | | |
| | |
Total returne | | | 23.19% | | | | (23.48)% | |
Ratios to average net assetsf | | | | | | | | |
Expensesg,h | | | 1.41% | | | | 1.33% | |
Expenses - excluding dividend expense on securities sold shorth | | | 1.32% | | | | 1.32% | |
Net investment income | | | 0.72% | d | | | 1.47% | |
| | |
Supplemental data | | | | | | | | |
Net assets, end of year (000’s) | | $ | 59,178 | | | $ | 23,981 | |
Portfolio turnover rate | | | 43.35% | | | | 22.76% | |
aFor the period February 29, 2008 (effective date) to December 31, 2008.
bThe amount shown for a share outstanding throughout the period may not correlate with the Statement of Operations for the period due to the timing of sales and repurchases of the Fund shares in relation to income earned and/or fluctuating market value of the investments of the Fund.
cBased on average daily shares outstanding.
dNet investment income per share includes approximately $(0.03) per share related to an adjustment for uncollectible interest as disclosed on the Statement of Operations. Excluding the effect of this adjustment, the ratio of net investment income to average net assets would have been 0.91%. See Note 7.
eTotal return does not include any fees, charges or expenses imposed by the variable annuity and life insurance contracts for which the Franklin Templeton Variable Insurance Products Trust serves as an underlying investment vehicle. Total return is not annualized for periods less than one year.
fRatios are annualized for periods less than one year.
gIncludes dividend expense on securities sold short which varies from period to period. See below for expense ratios that reflect only operating expenses.
hBenefit of expense reduction rounds to less than 0.01%.
The accompanying notes are an integral part of these financial statements.
MGD-11
Franklin Templeton Variable Insurance Products Trust
Statement of Investments, December 31, 2009
| | | | | | | |
| Mutual Global Discovery Securities Fund | | Country | | Shares/
Warrants/
Contracts | | Value |
Common Stocks and Other Equity Interests 78.5% | | | | | | | |
Airlines 0.0%a | | | | | | | |
b,cNorthwest Airlines Corp., Contingent Distribution | | United States | | 8,167,000 | | $ | 5,145 |
| | | | | | | |
Auto Components 0.2% | | | | | | | |
b,c,dCollins & Aikman Products Co., Contingent Distribution | | United States | | 218,708 | | | 2,187 |
b,c,dDana Holding Corp., Contingent Distribution | | United States | | 2,673,000 | | | — |
b,eIACNA Investor LLC | | United States | | 47,271 | | | 473 |
b,e,fInternational Automotive Components Group Brazil LLC | | Brazil | | 424,073 | | | 475,564 |
b,e,fInternational Automotive Components Group Japan LLC | | Japan | | 74,174 | | | 284,084 |
b,e,fInternational Automotive Components Group LLC | | Luxembourg | | 1,512,200 | | | 1,030,957 |
b,e,fInternational Automotive Components Group NA LLC, A | | United States | | 1,353,608 | | | 411,970 |
| | | | | | | |
| | | | | | | 2,205,235 |
| | | | | | | |
Beverages 4.7% | | | | | | | |
Carlsberg AS, A | | Denmark | | 7,100 | | | 534,718 |
Carlsberg AS, B | | Denmark | | 442,162 | | | 32,662,327 |
Dr. Pepper Snapple Group Inc. | | United States | | 255,214 | | | 7,222,556 |
Pernod Ricard SA | | France | | 327,808 | | | 28,112,215 |
| | | | | | | |
| | | | | | | 68,531,816 |
| | | | | | | |
Capital Markets 2.3% | | | | | | | |
Deutsche Bank AG (EUR Traded) | | Germany | | 131,611 | | | 9,340,603 |
Deutsche Bank AG (USD Traded) | | Germany | | 5,900 | | | 418,369 |
Man Group PLC | | United Kingdom | | 904,960 | | | 4,499,225 |
Morgan Stanley | | United States | | 291,530 | | | 8,629,288 |
bUBS AG | | Switzerland | | 722,056 | | | 11,195,478 |
| | | | | | | |
| | | | | | | 34,082,963 |
| | | | | | | |
Chemicals 1.2% | | | | | | | |
b,c,dDow Corning Corp., Contingent Distribution | | United States | | 300,000 | | | — |
Sika AG | | Switzerland | | 11,082 | | | 17,289,697 |
| | | | | | | |
| | | | | | | 17,289,697 |
| | | | | | | |
Commercial Banks 4.8% | | | | | | | |
b,e,gThe Bankshares Inc. | | United States | | 800,000 | | | 2,862,639 |
Barclays PLC | | United Kingdom | | 3,661,201 | | | 16,307,180 |
BNP Paribas | | France | | 241,436 | | | 19,319,240 |
b,eElephant Capital Holdings Ltd. | | Japan | | 1,903 | | | — |
bIntesa Sanpaolo SpA | | Italy | | 3,120,854 | | | 14,072,142 |
b,eNCB Warrant Holdings Ltd., A | | Japan | | 9,306 | | | — |
Societe Generale, A | | France | | 151,899 | | | 10,643,484 |
Wells Fargo & Co. | | United States | | 235,700 | | | 6,361,543 |
| | | | | | | |
| | | | | | | 69,566,228 |
| | | | | | | |
Commercial Services & Supplies 0.0%a | | | | | | | |
bComdisco Holding Co. Inc. | | United States | | 44 | | | 440 |
b,c,dComdisco Holding Co. Inc., Contingent Distribution | | United States | | 1,863,000 | | | — |
| | | | | | | |
| | | | | | | 440 |
| | | | | | | |
Communications Equipment 0.4% | | | | | | | |
Tandberg ASA | | Norway | | 220,178 | | | 6,267,575 |
| | | | | | | |
Computers & Peripherals 1.4% | | | | | | | |
b,eDecisionOne Corp. | | United States | | 21,716 | | | 36,049 |
b,eDecisionOne Corp., wts., 6/08/17 | | United States | | 11,923 | | | — |
MGD-12
Franklin Templeton Variable Insurance Products Trust
Statement of Investments, December 31, 2009 (continued)
| | | | | | | |
| Mutual Global Discovery Securities Fund | | Country | | Shares/
Warrants/
Contracts | | Value |
Common Stocks and Other Equity Interests (continued) | | | | | | | |
Computers & Peripherals (continued) | | | | | | | |
bDell Inc. | | United States | | 166,275 | | $ | 2,387,709 |
bSun Microsystems Inc. | | United States | | 1,908,700 | | | 17,884,519 |
| | | | | | | |
| | | | | | | 20,308,277 |
| | | | | | | |
Construction Materials 0.2% | | | | | | | |
Ciments Francais SA | | France | | 19,086 | | | 2,021,728 |
CRH PLC | | Ireland | | 5,517 | | | 150,128 |
| | | | | | | |
| | | | | | | 2,171,856 |
| | | | | | | |
Consumer Finance 0.1% | | | | | | | |
b,eCerberus CG Investor I LLC | | United States | | 2,161,828 | | | 453,984 |
b,e Cerberus CG Investor II LLC | | United States | | 2,161,828 | | | 453,984 |
b,eCerberus CG Investor III LLC | | United States | | 1,080,914 | | | 226,992 |
b,eGMAC Inc. | | United States | | 56 | | | 621,913 |
| | | | | | | |
| | | | | | | 1,756,873 |
| | | | | | | |
Diversified Financial Services 2.9% | | | | | | | |
Bank of America Corp. | | United States | | 947,220 | | | 14,265,133 |
bCIT Group Inc. | | United States | | 83,417 | | | 2,303,143 |
Deutsche Boerse AG | | Germany | | 268,739 | | | 22,311,815 |
b,c,dMarconi Corp., Contingent Distribution | | United Kingdom | | 1,739,100 | | | — |
b,eNorth American Financial Holdings Inc., 144A | | United States | | 133,700 | | | 2,674,000 |
b,eNorth American Financial Holdings Inc., 144A, non-voting | | United States | | 60,700 | | | 1,214,000 |
| | | | | | | |
| | | | | | | 42,768,091 |
| | | | | | | |
Diversified Telecommunication Services 1.7% | | | | | | | |
b,eAboveNet Inc. | | United States | | 36,827 | | | 2,395,228 |
b,eAboveNet Inc., stock grant, grant price $10.475, expiration date 9/09/13 | | United States | | 23 | | | 5,020 |
b,eAboveNet Inc., stock grant, grant price $30, expiration date 9/07/18 | | United States | | 5 | | | 701 |
b,eAboveNet Inc., wts., 9/08/10 | | United States | | 739 | | | 73,900 |
Cable & Wireless PLC | | United Kingdom | | 2,207,410 | | | 5,041,644 |
b,c,dGlobal Crossing Holdings Ltd., Contingent Distribution | | United States | | 2,236,777 | | | — |
hKoninklijke KPN NV | | Netherlands | | 980,420 | | | 16,616,520 |
| | | | | | | |
| | | | | | | 24,133,013 |
| | | | | | | |
Electric Utilities 1.0% | | | | | | | |
b,c,dCalpine Corp., Contingent Distribution | | United States | | 1,400,000 | | | — |
E.ON AG | | Germany | | 221,860 | | | 9,244,798 |
Prime Infrastructure Group | | Australia | | 1,361,600 | | | 5,046,165 |
| | | | | | | |
| | | | | | | 14,290,963 |
| | | | | | | |
Energy Equipment & Services 4.5% | | | | | | | |
Bourbon SA | | France | | 132,625 | | | 5,002,444 |
bBW Offshore Ltd. | | Norway | | 3,825,934 | | | 5,610,455 |
bCompagnie Generale de Geophysique SA | | France | | 345,440 | | | 7,382,588 |
bDockwise Ltd. | | Norway | | 108,076 | | | 3,356,166 |
b,eMPF Corp. Ltd. | | Norway | | 1,460,000 | | | — |
bPride International Inc. | | United States | | 319,600 | | | 10,198,436 |
Seadrill Ltd. | | Bermuda | | 941,356 | | | 24,035,727 |
bTransocean Ltd. | | United States | | 117,343 | | | 9,716,000 |
| | | | | | | |
| | | | | | | 65,301,816 |
| | | | | | | |
MGD-13
Franklin Templeton Variable Insurance Products Trust
Statement of Investments, December 31, 2009 (continued)
| | | | | | | |
| Mutual Global Discovery Securities Fund | | Country | | Shares/
Warrants/
Contracts | | Value |
Common Stocks and Other Equity Interests (continued) | | | | | | | |
Food & Staples Retailing 3.1% | | | | | | | |
Carrefour SA | | France | | 448,729 | | $ | 21,556,701 |
CVS Caremark Corp. | | United States | | 707,690 | | | 22,794,695 |
Koninklijke Ahold NV | | Netherlands | | 39,681 | | | 525,980 |
| | | | | | | |
| | | | | | | 44,877,376 |
| | | | | | | |
Food Products 11.4% | | | | | | | |
Cadbury PLC | | United Kingdom | | 3,378,235 | | | 43,435,285 |
bCermaq ASA | | Norway | | 90,181 | | | 871,254 |
CSM NV | | Netherlands | | 462,612 | | | 12,168,035 |
hDanone | | France | | 721,986 | | | 44,264,244 |
Farmer Brothers Co. | | United States | | 61,700 | | | 1,217,958 |
Lotte Confectionary Co. Ltd. | | South Korea | | 198 | | | 218,873 |
b,iMarine Harvest | | Norway | | 16,240,743 | | | 11,854,700 |
Nestle SA | | Switzerland | | 815,931 | | | 39,568,890 |
Nong Shim Co. Ltd. | | South Korea | | 24,215 | | | 5,170,795 |
bPremier Foods PLC | | United Kingdom | | 7,381,282 | | | 4,262,335 |
Rieber & Son ASA | | Norway | | 400,605 | | | 2,833,622 |
| | | | | | | |
| | | | | | | 165,865,991 |
| | | | | | | |
Health Care Providers & Services 1.0% | | | | | | | |
Rhoen-Klinikum AG | | Germany | | 608,573 | | | 14,913,949 |
| | | | | | | |
Household Durables 0.1% | | | | | | | |
Black & Decker Corp. | | United States | | 29,100 | | | 1,886,553 |
| | | | | | | |
Industrial Conglomerates 3.8% | | | | | | | |
Jardine Matheson Holdings Ltd. | | Hong Kong | | 398,522 | | | 12,027,394 |
Jardine Strategic Holdings Ltd. | | Hong Kong | | 1,157,650 | | | 20,374,640 |
Keppel Corp. Ltd. | | Singapore | | 1,474,063 | | | 8,631,475 |
Orkla ASA | | Norway | | 1,494,240 | | | 14,655,225 |
| | | | | | | |
| | | | | | | 55,688,734 |
| | | | | | | |
Insurance 2.7% | | | | | | | |
ACE Ltd. | | United States | | 89,490 | | | 4,510,296 |
bAlleghany Corp. | | United States | | 4,067 | | | 1,122,492 |
bBerkshire Hathaway Inc., A | | United States | | 45 | | | 4,464,000 |
bBerkshire Hathaway Inc., B | | United States | | 5,762 | | | 18,933,932 |
E-L Financial Corp. Ltd. | | Canada | | 8,478 | | | 3,736,361 |
b,eImagine Group Holdings Ltd. | | Bermuda | | 239,310 | | | 2,579,068 |
b,eOlympus Re Holdings Ltd. | | United States | | 2,140 | | | 4,571 |
Zurich Financial Services AG | | Switzerland | | 20,860 | | | 4,564,353 |
| | | | | | | |
| | | | | | | 39,915,073 |
| | | | | | | |
IT Services 0.1% | | | | | | | |
bAffiliated Computer Services Inc., A | | United States | | 22,100 | | | 1,319,149 |
| | | | | | | |
Machinery 1.6% | | | | | | | |
b,e,fMCII Holdings Inc. | | United States | | 383 | | | — |
Schindler Holding AG, PC | | Switzerland | | 266,386 | | | 20,497,169 |
Schindler Holding AG, Registered | | Switzerland | | 42,060 | | | 3,183,501 |
| | | | | | | |
| | | | | | | 23,680,670 |
| | | | | | | |
MGD-14
Franklin Templeton Variable Insurance Products Trust
Statement of Investments, December 31, 2009 (continued)
| | | | | | | |
| Mutual Global Discovery Securities Fund | | Country | | Shares/
Warrants/
Contracts | | Value |
Common Stocks and Other Equity Interests (continued) | | | | | | | |
Marine 0.1% | | | | | | | |
A P Moller - Maersk AS | | Denmark | | 243 | | $ | 1,710,889 |
| | | | | | | |
Media 2.1% | | | | | | | |
bAdelphia Recovery Trust | | United States | | 5,379,562 | | | 172,146 |
b,cAdelphia Recovery Trust, Arahova Contingent Value Vehicle, Contingent Distribution | | United States | | 386,774 | | | 80,256 |
b,c,dCentury Communications Corp., Contingent Distribution | | United States | | 1,074,000 | | | — |
CJ CGV Co. Ltd. | | South Korea | | 82,411 | | | 1,554,824 |
Daekyo Co. Ltd. | | South Korea | | 5,820 | | | 29,597 |
Eutelsat Communications | | France | | 837,952 | | | 26,940,466 |
bJC Decaux SA | | France | | 86,520 | | | 2,109,769 |
b,dTVMAX Holdings Inc. | | United States | | 8,935 | | | — |
| | | | | | | |
| | | | | | | 30,887,058 |
| | | | | | | |
Multi-Utilities 0.0%a | | | | | | | |
GDF Suez | | France | | 6,584 | | | 285,426 |
| | | | | | | |
Office Electronics 0.2% | | | | | | | |
Xerox Corp. | | United States | | 301,600 | | | 2,551,536 |
| | | | | | | |
Oil, Gas & Consumable Fuels 3.4% | | | | | | | |
BP PLC | | United Kingdom | | 233,063 | | | 2,261,365 |
hRoyal Dutch Shell PLC, A | | United Kingdom | | 451,747 | | | 13,644,384 |
hTotal SA, B | | France | | 226,886 | | | 14,616,543 |
hTotal SA, B, ADR | | France | | 19,340 | | | 1,238,534 |
XTO Energy Inc. | | United States | | 385,284 | | | 17,927,265 |
| | | | | | | |
| | | | | | | 49,688,091 |
| | | | | | | |
Personal Products 0.2% | | | | | | | |
L’Oreal SA | | France | | 26,750 | | | 2,986,721 |
| | | | | | | |
Professional Services 0.5% | | | | | | | |
Teleperformance | | France | | 216,676 | | | 7,034,449 |
| | | | | | | |
Real Estate Investment Trust (REIT) 1.8% | | | | | | | |
The Link REIT | | Hong Kong | | 10,505,000 | | | 26,852,870 |
| | | | | | | |
Real Estate Management & Development 0.9% | | | | | | | |
b,dCanary Wharf Group PLC | | United Kingdom | | 185,900 | | | 985,974 |
Great Eagle Holdings Ltd. | | Hong Kong | | 1,613,524 | | | 4,203,565 |
Swire Pacific Ltd., B | | Hong Kong | | 2,078,228 | | | 4,556,518 |
bSwiss Prime Site AG | | Switzerland | | 55,913 | | | 3,132,835 |
| | | | | | | |
| | | | | | | 12,878,892 |
| | | | | | | |
Road & Rail 1.0% | | | | | | | |
Burlington Northern Santa Fe Corp. | | United States | | 146,090 | | | 14,407,396 |
| | | | | | | |
Software 2.5% | | | | | | | |
hMicrosoft Corp. | | United States | | 806,798 | | | 24,599,271 |
Nintendo Co. Ltd. | | Japan | | 47,500 | | | 11,259,411 |
| | | | | | | |
| | | | | | | 35,858,682 |
| | | | | | | |
Tobacco 14.2% | | | | | | | |
Altria Group Inc. | | United States | | 604,821 | | | 11,872,636 |
hBritish American Tobacco PLC | | United Kingdom | | 1,697,048 | | | 55,275,427 |
hImperial Tobacco Group PLC | | United Kingdom | | 1,514,860 | | | 47,885,396 |
ITC Ltd. | | India | | 1,453,259 | | | 7,854,989 |
MGD-15
Franklin Templeton Variable Insurance Products Trust
Statement of Investments, December 31, 2009 (continued)
| | | | | | | | |
| Mutual Global Discovery Securities Fund | | Country | | Shares/
Warrants/
Contracts | | Value |
Common Stocks and Other Equity Interests (continued) | | | | | | | | |
Tobacco (continued) | | | | | | | | |
Japan Tobacco Inc. | | Japan | | | 6,184 | | $ | 20,817,294 |
KT&G Corp. | | South Korea | | | 201,576 | | | 11,132,641 |
Lorillard Inc. | | United States | | | 311,020 | | | 24,953,135 |
Philip Morris International Inc. | | United States | | | 204,981 | | | 9,878,034 |
Reynolds American Inc. | | United States | | | 314,950 | | | 16,682,902 |
| | | | | | | | |
| | | | | | | | 206,352,454 |
| | | | | | | | |
Trading Companies & Distributors 0.8% | | | | | | | | |
bKloeckner & Co. SE | | Germany | | | 467,280 | | | 11,973,095 |
| | | | | | | | |
Transportation Infrastructure 0.1% | | | | | | | | |
Groupe Eurotunnel SA | | France | | | 197,824 | | | 1,851,966 |
| | | | | | | | |
Wireless Telecommunication Services 1.5% | | | | | | | | |
Vodafone Group PLC | | United Kingdom | | | 9,177,469 | | | 21,279,719 |
| | | | | | | | |
Total Common Stocks and Other Equity Interests
(Cost $964,305,101) | | | | | | | | 1,143,426,727 |
| | | | | | | | |
Preferred Stocks 0.5% | | | | | | | | |
Diversified Financial Services 0.4% | | | | | | | | |
bBank of America Corp., pfd. | | United States | | | 363,600 | | | 5,424,912 |
| | | | | | | | |
Diversified Telecommunication Services 0.0%a | | | | | | | | |
b,ePTV Inc., 10.00%, pfd., A | | United Kingdom | | | 4,289 | | | 710 |
| | | | | | | | |
Machinery 0.1% | | | | | | | | |
e,f,jMCII Holdings Inc., PIK, pfd., A | | United States | | | 2,897 | | | 1,346,452 |
| | | | | | | | |
Total Preferred Stocks (Cost $8,321,482) | | | | | | | | 6,772,074 |
| | | | | | | | |
| | | |
| | | | | Principal
Amount | | |
Corporate Bonds, Notes and Senior Floating Rate Interests 3.0% | | | | | | | | |
American General Finance Corp., senior note, J, 6.90%, 12/15/17 | | United States | | $ | 365,000 | | | 253,787 |
kBP Capital Markets PLC, FRN, 1.253%, 3/17/11 | | United Kingdom | | | 9,894,000 | | | 10,019,298 |
e,lCerberus CG Investor I LLC, 12.00%, 7/31/14 | | United States | | | 1,897,400 | | | 398,454 |
e,lCerberus CG Investor II LLC, 12.00%, 7/31/14 | | United States | | | 1,897,400 | | | 398,454 |
e,lCerberus CG Investor III LLC, 12.00%, 7/31/14 | | United States | | | 948,700 | | | 199,227 |
kCharter Communications Operating LLC, Term Loan B, FRN, 2.26%, 3/06/14 | | United States | | | 447,134 | | | 420,119 |
CIT Group Inc., | | | | | | | | |
kNew Term Loan Tranche 1B, FRN, 13.00%, 1/20/12 | | United States | | | 445,000 | | | 462,383 |
senior secured sub. bond, 7.00%, 5/01/13 | | United States | | | 136,967 | | | 128,749 |
senior secured sub. bond, 7.00%, 5/01/14 | | United States | | | 205,454 | | | 191,329 |
senior secured sub. bond, 7.00%, 5/01/15 | | United States | | | 205,454 | | | 184,909 |
senior secured sub. bond, 7.00%, 5/01/16 | | United States | | | 342,424 | | | 303,045 |
senior secured sub. bond, 7.00%, 5/01/17 | | United States | | | 479,394 | | | 418,271 |
kTerm Loan Tranche 1A, FRN, 9.50%, 1/20/12 | | United States | | | 2,552,000 | | | 2,622,180 |
ConocoPhillips, senior note, 8.75%, 5/25/10 | | United States | | | 796,000 | | | 822,602 |
DecisionOne Corp., | | | | | | | | |
esenior secured note, 15.00%, 11/30/13 | | United States | | | 28,852 | | | 28,852 |
dTerm Loan B, 15.00%, 8/29/13 | | United States | | | 5,046 | | | 5,046 |
kFirst Data Corp., Term Loan B-1, FRN, 2.982%, 9/24/14 | | United States | | | 5,085,513 | | | 4,526,107 |
d,f,kInternational Automotive Components Group NA Inc., Revolver, FRN, 6.25%, 1/18/14 | | United States | | | 268,430 | | | 268,430 |
MGD-16
Franklin Templeton Variable Insurance Products Trust
Statement of Investments, December 31, 2009 (continued)
| | | | | | | | |
| Mutual Global Discovery Securities Fund | | Country | | Principal
Amount | | Value |
Corporate Bonds, Notes and Senior Floating Rate Interests (continued) | | | | | | |
e,f,lInternational Automotive Components Group NA LLC, 9.00%, 4/01/17 | | United States | | $ | 407,500 | | $ | 408,409 |
k,mRoche Holdings Inc., 144A, FRN, 1.262%, 2/25/10 | | Switzerland | | | 9,322,000 | | | 9,324,125 |
Seadrill Ltd., cvt., senior note, 3.625%, 11/08/12 | | Bermuda | | | 1,400,000 | | | 1,414,700 |
Telecom Italia Capital SA, 4.875%, 10/01/10 | | Italy | | | 2,309,000 | | | 2,367,426 |
k,nTexas Competitive Electric Holdings Co. LLC, Delayed Draw Term Loan, FRN, 3.735%, 10/10/14 | | United States | | | 11,088,932 | | | 8,932,135 |
d,jTVMAX Holdings Inc., PIK,
11.50%, 3/31/10 | | United States | | | 39,155 | | | 8,693 |
14.00%, 3/31/10 | | United States | | | 68,703 | | | 13,641 |
| | | | | | | | |
Total Corporate Bonds, Notes and Senior Floating Rate Interests (Cost $45,848,175) | | | | | | | | 44,120,371 |
| | | | | | | | |
Corporate Bonds and Notes in Reorganization (Cost $90) 0.0%a | | | | | | | | |
d,lSafety Kleen Services, senior sub. note, 9.25%, 6/01/08 | | United States | | | 3,000 | | | 15 |
| | | | | | | | |
| | | |
| | | | | Shares | | |
Companies in Liquidation (Cost $—) 0.0% | | | | | | | | |
b,e,lFIM Coinvestor Holdings I LLC | | United States | | | 2,077,368 | | | — |
| | | | | | | | |
Total Investments before Short Term Investments (Cost $1,018,474,848) | | | | | | | | 1,194,319,187 |
| | | | | | | | |
| | | |
| | | | | Principal
Amount | | |
Short Term Investments 17.2% | | | | | | | | |
Corporate Bonds, Notes and Senior Floating Rate Interests 0.8% | | | | | | | | |
k,oLyondell Chemical Co., DIP Delayed Draw Term Loan, FRN, 13.00%, 4/06/10 | | United States | | $ | 208,165 | | | 217,688 |
Telecom Italia Capital SA, senior note, 4.00%, 1/15/10 | | Italy | | | 4,389,000 | | | 4,392,406 |
Vodafone Group PLC, senior note, 7.75%, 2/15/10 | | United Kingdom | | | 7,253,000 | | | 7,308,616 |
| | | | | | | | |
Total Corporate Bonds, Notes and Senior Floating Rate Interests (Cost $12,114,993) | | | | | | | | 11,918,710 |
| | | | | | | | |
U.S. Government and Agency Securities 16.4% | | | | | | | | |
pFHLB, 1/04/10 | | United States | | | 3,700,000 | | | 3,700,000 |
pU.S. Treasury Bills, | | | | | | | | |
2/28/10 | | United States | | | 16,900,000 | | | 16,899,476 |
q3/11/10 | | United States | | | 10,000,000 | | | 9,999,360 |
4/15/10 | | United States | | | 20,000,000 | | | 19,995,960 |
q5/06/10 | | United States | | | 50,000,000 | | | 49,982,700 |
5/13/10 | | United States | | | 20,000,000 | | | 19,991,620 |
5/20/10 | | United States | | | 20,000,000 | | | 19,989,800 |
5/27/10 | | United States | | | 20,000,000 | | | 19,988,080 |
q1/07/10 - 9/23/10 | | United States | | | 78,300,000 | | | 78,259,894 |
| | | | | | | | |
Total U.S. Government and Agency Securities (Cost $238,738,991) | | | | | | | | 238,806,890 |
| | | | | | | | |
Total Investments before Cash Collateral Received for Loaned Securities (Cost $1,269,328,832) | | | | | | | | 1,445,044,787 |
| | | | | | | | |
MGD-17
Franklin Templeton Variable Insurance Products Trust
Statement of Investments, December 31, 2009 (continued)
| | | | | | | | |
| Mutual Global Discovery Securities Fund | | Country | | Shares | | Value | |
rInvestments from Cash Collateral Received for Loaned Securities 0.1% | | | | | | |
Money Market Funds 0.1% | | | | | | | | |
Bank of New York Institutional Cash Reserve Fund, | | | | | | | | |
sSeries A, 0.01% | | United States | | 1,251,000 | | $ | 1,251,000 | |
bSeries B | | United States | | 31,953 | | | 25,562 | |
| | | | | | | | |
Total Investments from Cash Collateral Received for Loaned Securities (Cost $1,282,953) | | | | | | | 1,276,562 | |
| | | | | | | | |
Total Investments (Cost $1,270,611,785) 99.3% | | | | | | | 1,446,321,349 | |
Options Written (0.4)% | | | | | | | (5,747,264 | ) |
Securities Sold Short (1.5)% | | | | | | | (22,200,455 | ) |
Other Assets, less Liabilities 2.6% | | | | | | | 37,411,828 | |
| | | | | | | | |
Net Assets 100.0% | | | | | | $ | 1,455,785,458 | |
| | | | | | | | |
| | | |
| | | | | Contracts | | | |
tOptions Written (0.4)% | | | | | | | | |
Call Options (0.4)% | | | | | | | | |
Diversified Telecommunication Services (0.1)% | | | | | | | | |
Koninklijke KPN NV, Jun. 10 EUR Calls, 6/18/10 | | Netherlands | | 315,000 | | $ | (758,822 | ) |
| | | | | | | | |
Food Products (0.1)% | | | | | | | | |
Danone, Jun. 37.74 EUR Calls, 6/18/10 | | France | | 126,000 | | | (956,409 | ) |
| | | | | | | | |
Oil, Gas & Consumable Fuels (0.1)% | | | | | | | | |
Royal Dutch Shell PLC, A, Jun. 19 EUR Calls, 6/18/10 | | United Kingdom | | 283,000 | | | (901,186 | ) |
Total SA, B, ADR, Jun. 40 EUR Calls, 6/18/10 | | France | | 82,000 | | | (653,503 | ) |
Total SA, B, Jun. 40 EUR Calls, 6/18/10 | | France | | 80,000 | | | (628,395 | ) |
| | | | | | | | |
| | | | | | | (2,183,084 | ) |
| | | | | | | | |
Software (0.0)%a | | | | | | | | |
Microsoft Corp., Jan. $26 Calls, 1/16/10 | | United States | | 300 | | | (136,500 | ) |
| | | | | | | | |
Tobacco (0.1)% | | | | | | | | |
British American Tobacco PLC, Mar. 18 GBP Calls, | | | | | | | | |
3/19/10 | | United Kingdom | | 185,000 | | | (514,941 | ) |
3/19/10 | | United Kingdom | | 185,000 | | | (508,881 | ) |
Imperial Tobacco Group PLC, Mar. 17 GBP Calls, 3/19/10 | | United Kingdom | | 195,000 | | | (688,627 | ) |
| | | | | | | | |
| | | | | | | (1,712,449 | ) |
| | | | | | | | |
Total Options Written (Premiums received $4,181,131) | | | | | | | (5,747,264 | ) |
| | | | | | | | |
| | | |
| | | | | Shares | | | |
uSecurities Sold Short (1.5)% | | | | | | | | |
Food Products (0.2)% | | | | | | | | |
Kraft Foods Inc., A | | United States | | 130,694 | | | (3,552,263 | ) |
| | | | | | | | |
Oil & Gas & Consumable Fuels (1.3)% | | | | | | | | |
Exxon Mobil Corp. | | United States | | 273,474 | | | (18,648,192 | ) |
| | | | | | | | |
Total Securities Sold Short (Proceeds $22,272,297) | | | | | | $ | (22,200,455 | ) |
| | | | | | | | |
MGD-18
Franklin Templeton Variable Insurance Products Trust
Statement of Investments, December 31, 2009 (continued)
| | | | | | |
| Mutual Global Discovery Securities Fund | | | | | | |
aRounds to less than 0.1% of net assets.
bNon-income producing.
cContingent distributions represent the right to receive additional distributions, if any, during the reorganization of the underlying company. Shares represent total underlying principal of debt securities.
dSecurity has been deemed illiquid because it may not be able to be sold within seven days. At December 31, 2009, the aggregate value of these securities was $1,283,986, representing 0.09% of net assets.
eSee Note 9 regarding restricted securities.
fSee Note 14 regarding other considerations.
gSee Note 13 regarding holdings of 5% voting securities.
hA portion or all of the security is held in connection with written option contracts open at year end.
iA portion or all of the security is on loan at December 31, 2009. See Note 1(f).
jIncome may be received in additional securities and/or cash.
kThe coupon rate shown represents the rate at period end.
lSee Note 7 regarding credit risk and defaulted securities.
mSecurity was purchased pursuant to Rule 144A under the Securities Act of 1933 and may be sold in transactions exempt from registration only to qualified institutional buyers or in a public offering registered under the Securities Act of 1933. This security has been deemed liquid under guidelines approved by the Trust’s Board of Trustees. At December 31, 2009, the value of this security was $9,324,125, representing 0.64% of net assets.
nA portion or all of the security purchased on a delayed delivery basis. See Note 1(c).
oSee Note 10 regarding unfunded loan commitments.
pThe security is traded on a discount basis with no stated coupon rate.
qSecurity or a portion of the security has been segregated as collateral for securities sold short and open written option contracts. At December 31, 2009, the aggregate value of these securities and/or cash pledged amounted to $35,321,724.
rSee Note 1(f) regarding securities on loan.
sThe rate shown is the annualized seven-day yield at period end.
tSee Note 1(d) regarding written options.
uSee Note 1(e) regarding securities sold short.
MGD-19
Franklin Templeton Variable Insurance Products Trust
Statement of Investments, December 31, 2009 (continued)
| | | | | | |
| Mutual Global Discovery Securities Fund | | | | | | |
At December 31, 2009, the Fund had the following forward exchange contracts outstanding. See Note 1(d).
Forward Exchange Contracts
| | | | | | | | | | | | | | | | | | |
| Currency | | Counterparty | | Type | | Quantity | | Contract
Amount | | Settlement
Date | | Unrealized
Appreciation | | Unrealized
Depreciation | |
British Pound | | DBAB | | Sell | | 2,046,501 | | $ | 3,284,494 | | 1/13/10 | | $ | — | | $ | (20,871 | ) |
British Pound | | SSBT | | Sell | | 674,129 | | | 1,075,296 | | 1/13/10 | | | — | | | (13,510 | ) |
British Pound | | BOFA | | Sell | | 920,000 | | | 1,476,508 | | 1/13/10 | | | — | | | (9,412 | ) |
British Pound | | BOFA | | Sell | | 8,344,729 | | | 13,830,314 | | 1/13/10 | | | 352,490 | | | — | |
British Pound | | DBAB | | Sell | | 1,669,800 | | | 2,732,794 | | 1/13/10 | | | 35,850 | | | — | |
British Pound | | SSBT | | Sell | | 2,238,117 | | | 3,626,335 | | 1/13/10 | | | 13,941 | | | — | |
Euro | | SSBT | | Buy | | 71,760 | | | 107,570 | | 1/14/10 | | | — | | | (4,851 | ) |
Euro | | DBAB | | Sell | | 10,341,701 | | | 15,313,066 | | 1/14/10 | | | 509,768 | | | — | |
Euro | | SSBT | | Sell | | 32,356,178 | | | 47,227,997 | | 1/14/10 | | | 912,777 | | | — | |
Euro | | BZWS | | Sell | | 3,880,000 | | | 5,732,914 | | 1/14/10 | | | 179,012 | | | — | |
Euro | | HSBC | | Sell | | 560,000 | | | 840,571 | | 1/14/10 | | | 38,977 | | | — | |
South Korean Won | | BOFA | | Sell | | 6,963,348,000 | | | 5,930,000 | | 1/15/10 | | | — | | | (38,541 | ) |
South Korean Won | | DBAB | | Sell | | 2,431,275,000 | | | 2,100,000 | | 1/15/10 | | | 16,065 | | | — | |
South Korean Won | | BOFA | | Sell | | 10,217,970,000 | | | 8,820,000 | | 1/15/10 | | | 61,803 | | | — | |
Australian Dollar | | BOFA | | Buy | | 1,130,000 | | | 1,025,859 | | 1/19/10 | | | — | | | (13,867 | ) |
Australian Dollar | | DBAB | | Buy | | 570,000 | | | 520,035 | | 1/19/10 | | | — | | | (9,561 | ) |
Australian Dollar | | BOFA | | Sell | | 170,000 | | | 152,082 | | 1/19/10 | | | — | | | (165 | ) |
Australian Dollar | | DBAB | | Sell | | 3,400,000 | | | 3,141,600 | | 1/19/10 | | | 96,667 | | | — | |
Swedish Krona | | HAND | | Buy | | 12,100,000 | | | 1,700,741 | | 1/19/10 | | | — | | | (10,551 | ) |
Swedish Krona | | SSBT | | Buy | | 1,284,576 | | | 180,137 | | 1/19/10 | | | — | | | (700 | ) |
Swedish Krona | | SSBT | | Sell | | 3,720,000 | | | 546,902 | | 1/19/10 | | | 27,273 | | | — | |
Swedish Krona | | HAND | | Sell | | 9,664,576 | | | 1,420,861 | | 1/19/10 | | | 70,863 | | | — | |
Canadian Dollar | | DBAB | | Sell | | 3,577,146 | | | 3,342,502 | | 1/29/10 | | | — | | | (60,600 | ) |
Euro | | SSBT | | Buy | | 218,536 | | | 324,152 | | 1/29/10 | | | — | | | (11,343 | ) |
Euro | | SSBT | | Sell | | 918,100 | | | 1,362,552 | | 1/29/10 | | | 48,399 | | | — | |
Euro | | BZWS | | Sell | | 31,200,000 | | | 46,032,480 | | 1/29/10 | | | 1,373,302 | | | — | |
British Pound | | BZWS | | Sell | | 1,940,000 | | | 3,202,119 | | 2/10/10 | | | 69,279 | | | — | |
British Pound | | DBAB | | Sell | | 47,150,000 | | | 77,886,123 | | 2/10/10 | | | 1,745,171 | | | — | |
British Pound | | BOFA | | Sell | | 470,000 | | | 779,495 | | 2/10/10 | | | 20,508 | | | — | |
Euro | | DBAB | | Sell | | 14,800,000 | | | 22,234,040 | | 2/16/10 | | | 1,050,288 | | | — | |
Euro | | BZWS | | Sell | | 14,800,000 | | | 22,244,400 | | 2/16/10 | | | 1,060,648 | | | — | |
Euro | | BOFA | | Sell | | 540,000 | | | 810,054 | | 2/16/10 | | | 37,133 | | | — | |
Euro | | SSBT | | Sell | | 15,900,000 | | | 23,945,400 | | 2/16/10 | | | 1,187,180 | | | — | |
Norwegian Krone | | HAND | | Sell | | 1,852,534 | | | 320,000 | | 2/16/10 | | | — | | | (3,682 | ) |
Norwegian Krone | | SSBT | | Sell | | 33,486,420 | | | 5,924,893 | | 2/16/10 | | | 159,875 | | | — | |
Norwegian Krone | | BZWS | | Sell | | 64,000,000 | | | 11,324,026 | | 2/16/10 | | | 305,794 | | | — | |
Norwegian Krone | | DBAB | | Sell | | 81,356,277 | | | 14,369,448 | | 2/16/10 | | | 363,161 | | | — | |
Norwegian Krone | | HAND | | Sell | | 1,171,627 | | | 210,000 | | 2/16/10 | | | 8,293 | | | — | |
Norwegian Krone | | BOFA | | Sell | | 1,119,600 | | | 200,000 | | 2/16/10 | | | 7,250 | | | — | |
Euro | | DBAB | | Sell | | 33,592,840 | | | 50,046,003 | | 2/26/10 | | | 1,954,469 | | | — | |
Euro | | BOFA | | Sell | | 809,619 | | | 1,212,020 | | 2/26/10 | | | 53,206 | | | — | |
Euro | | HSBC | | Sell | | 310,000 | | | 468,850 | | 2/26/10 | | | 25,145 | | | — | |
Euro | | BZWS | | Sell | | 21,200,000 | | | 31,922,960 | | 2/26/10 | | | 1,579,252 | | | — | |
British Pound | | BOFA | | Sell | | 11,500,000 | | | 18,503,500 | | 3/15/10 | | | — | | | (63,638 | ) |
British Pound | | BZWS | | Sell | | 11,500,000 | | | 18,506,950 | | 3/15/10 | | | — | | | (60,188 | ) |
British Pound | | BOFA | | Buy | | 1,775,000 | | | 2,922,662 | | 3/15/10 | | | — | | | (56,865 | ) |
British Pound | | SSBT | | Buy | | 1,297,029 | | | 2,132,288 | | 3/15/10 | | | — | | | (38,192 | ) |
British Pound | | DBAB | | Buy | | 1,320,000 | | | 2,163,744 | | 3/15/10 | | | — | | | (32,559 | ) |
Euro | | BZWS | | Sell | | 15,298,930 | | | 22,963,694 | | 3/15/10 | | | 1,067,099 | | | — | |
MGD-20
Franklin Templeton Variable Insurance Products Trust
Statement of Investments, December 31, 2009 (continued)
| | | | | | |
| Mutual Global Discovery Securities Fund | | | | | | |
Forward Exchange Contracts (continued)
| | | | | | | | | | | | | | | | | | |
| Currency | | Counterparty | | Type | | Quantity | | Contract
Amount | | Settlement
Date | | Unrealized
Appreciation | | Unrealized
Depreciation | |
Singapore Dollar | | SSBT | | Sell | | 11,987,776 | | $ | 8,478,397 | | 3/24/10 | | $ | — | | $ | (43,458 | ) |
Singapore Dollar | | BOFA | | Sell | | 331,444 | | | 235,000 | | 3/24/10 | | | — | | | (617 | ) |
Singapore Dollar | | SSBT | | Buy | | 459,400 | | | 326,824 | | 3/24/10 | | | — | | | (247 | ) |
Singapore Dollar | | SSBT | | Buy | | 1,348,084 | | | 957,631 | | 3/24/10 | | | 2,181 | | | — | |
British Pound | | DBAB | | Sell | | 18,750,000 | | | 31,312,500 | | 4/12/10 | | | 1,045,154 | | | — | |
Japanese Yen | | HAND | | Buy | | 57,893,760 | | | 640,000 | | 4/20/10 | | | — | | | (16,912 | ) |
Japanese Yen | | DBAB | | Buy | | 31,778,600 | | | 350,000 | | 4/20/10 | | | — | | | (7,979 | ) |
Japanese Yen | | BOFA | | Buy | | 58,651,775 | | | 637,000 | | 4/20/10 | | | — | | | (5,754 | ) |
Japanese Yen | | DBAB | | Sell | | 1,465,930,267 | | | 16,123,314 | | 4/20/10 | | | 346,073 | | | — | |
Japanese Yen | | SSBT | | Sell | | 50,400,000 | | | 569,844 | | 4/20/10 | | | 27,408 | | | — | |
Japanese Yen | | BOFA | | Sell | | 67,958,660 | | | 770,000 | | 4/20/10 | | | 38,587 | | | — | |
Danish Krone | | HAND | | Buy | | 2,210,120 | | | 440,000 | | 4/23/10 | | | — | | | (15,413 | ) |
Danish Krone | | HAND | | Sell | | 100,215,259 | | | 20,127,548 | | 4/23/10 | | | 875,152 | | | — | |
Danish Krone | | SSBT | | Sell | | 63,606,241 | | | 12,756,845 | | 4/23/10 | | | 537,423 | | | — | |
Danish Krone | | BOFA | | Sell | | 3,015,535 | | | 610,000 | | 4/23/10 | | | 30,684 | | | — | |
Danish Krone | | DBAB | | Sell | | 3,113,702 | | | 620,000 | | 4/23/10 | | | 21,825 | | | — | |
Swiss Franc | | DBAB | | Sell | | 22,500,000 | | | 21,176,471 | | 5/10/10 | | | — | | | (580,071 | ) |
Swiss Franc | | SSBT | | Sell | | 21,300,000 | | | 20,056,497 | | 5/10/10 | | | — | | | (539,695 | ) |
Swiss Franc | | BZWS | | Sell | | 12,843,690 | | | 12,095,009 | | 5/10/10 | | | — | | | (324,292 | ) |
Swiss Franc | | BOFA | | Sell | | 4,128,555 | | | 3,896,480 | | 5/10/10 | | | — | | | (95,656 | ) |
Swiss Franc | | FBCO | | Sell | | 295,171 | | | 285,000 | | 5/10/10 | | | — | | | (418 | ) |
Swiss Franc | | BZWS | | Sell | | 1,689,595 | | | 1,660,000 | | 5/10/10 | | | 26,233 | | | — | |
Swiss Franc | | DBAB | | Sell | | 2,194,745 | | | 2,155,892 | | 5/10/10 | | | 33,668 | | | — | |
Swiss Franc | | SSBT | | Sell | | 7,411,236 | | | 7,246,628 | | 5/10/10 | | | 80,278 | | | — | |
Swiss Franc | | BOFA | | Sell | | 1,012,717 | | | 1,010,000 | | 5/10/10 | | | 30,746 | | | — | |
Swiss Franc | | HSBC | | Sell | | 313,410 | | | 310,000 | | 5/10/10 | | | 6,946 | | | — | |
British Pound | | DBAB | | Sell | | 11,250,000 | | | 18,806,625 | | 5/12/10 | | | 649,214 | | | — | |
| | | | | | | | | | | | | | | |
Unrealized appreciation (depreciation) | | | | | | | | | | 18,182,510 | | | (2,079,608 | ) |
| | | | | | | | | | | | | | | |
Net unrealized appreciation (depreciation) | | | | | | | | | $ | 16,102,902 | | | | |
| | | | | | | | | | | | | | | | | | |
See Abbreviations on page MGD-38.
The accompanying notes are an integral part of these financial statements.
MGD-21
Franklin Templeton Variable Insurance Products Trust
Financial Statements
Statement of Assets and Liabilities
December 31, 2009
| | | | |
| | | Mutual Global
Discovery
Securities Fund | |
Assets: | | | | |
Investments in securities: | | | | |
Cost - Unaffiliated issuers | | $ | 1,262,611,785 | |
Cost - Non-controlled affiliated issuers (Note 13) | | | 8,000,000 | |
| | | | |
Total cost of investments | | $ | 1,270,611,785 | |
| | | | |
Value - Unaffiliated issuers | | $ | 1,443,458,710 | |
Value - Non-controlled affiliated issuers (Note 13) | | | 2,862,639 | |
| | | | |
Total value of investments (includes securities loaned in the amount of $1,170,306) | | | 1,446,321,349 | |
Cash | | | 144,838 | |
Foreign currency, at value (cost $3,452,124) | | | 3,450,905 | |
Receivables: | | | | |
Investment securities sold | | | 4,114,574 | |
Capital shares sold | | | 188,397 | |
Dividends and interest | | | 2,962,527 | |
Due from brokers | | | 20,783,687 | |
Unrealized appreciation on forward exchange contracts | | | 18,182,510 | |
Unrealized appreciation on unfunded loan commitments (Note 10) | | | 3,973 | |
Other assets | | | 190 | |
| | | | |
Total assets | | | 1,496,152,950 | |
| | | | |
Liabilities: | | | | |
Payables: | | | | |
Investment securities purchased | | | 5,124,777 | |
Capital shares redeemed | | | 1,751,873 | |
Affiliates | | | 1,701,390 | |
Options written, at value (premiums received $4,181,131) | | | 5,747,264 | |
Securities sold short, at value (proceeds $22,272,297) | | | 22,200,455 | |
Payable upon return of securities loaned | | | 1,282,953 | |
Unrealized depreciation on forward exchange contracts | | | 2,079,608 | |
Accrued expenses and other liabilities | | | 479,172 | |
| | | | |
Total liabilities | | | 40,367,492 | |
| | | | |
Net assets, at value | | $ | 1,455,785,458 | |
| | | | |
Net assets consist of: | | | | |
Paid-in capital | | $ | 1,322,907,937 | |
Undistributed net investment income | | | 12,778,372 | |
Net unrealized appreciation (depreciation) | | | 190,406,942 | |
Accumulated net realized gain (loss) | | | (70,307,793 | ) |
| | | | |
Net assets, at value | | $ | 1,455,785,458 | |
| | | | |
The accompanying notes are an integral part of these financial statements.
MGD-22
Franklin Templeton Variable Insurance Products Trust
Financial Statements (continued)
Statement of Assets and Liabilities (continued)
December 31, 2009
| | | |
| | | Mutual Global
Discovery
Securities Fund |
Class 1: | | | |
Net assets, at value | | $ | 86,755,239 |
| | | |
Shares outstanding | | | 4,533,120 |
| | | |
Net asset value and maximum offering price per share | | $ | 19.14 |
| | | |
Class 2: | | | |
Net assets, at value | | $ | 1,309,852,108 |
| | | |
Shares outstanding | | | 69,639,714 |
| | | |
Net asset value and maximum offering price per share | | $ | 18.81 |
| | | |
Class 4: | | | |
Net assets, at value | | $ | 59,178,111 |
| | | |
Shares outstanding | | | 3,110,713 |
| | | |
Net asset value and maximum offering price per share | | $ | 19.02 |
| | | |
The accompanying notes are an integral part of these financial statements.
MGD-23
Franklin Templeton Variable Insurance Products Trust
Financial Statements (continued)
Statement of Operations
for the year ended December 31, 2009
| | | | |
| | | Mutual Global
Discovery
Securities Fund | |
Investment income: | | | | |
Dividends (net of foreign taxes withheld of $1,897,005) | | $ | 26,213,700 | |
Interest | | | 4,179,994 | |
Adjustment for uncollectible interest (Note 7) | | | (2,475,271 | ) |
Income from securities loaned | | | 24,826 | |
| | | | |
Total investment income | | | 27,943,249 | |
| | | | |
Expenses: | | | | |
Management fees (Note 3a) | | | 10,477,203 | |
Administrative fees (Note 3b) | | | 1,555,488 | |
Distribution fees: (Note 3c) | | | | |
Class 2 | | | 2,965,686 | |
Class 4 | | | 148,245 | |
Unaffiliated transfer agent fees | | | 1,578 | |
Custodian fees (Note 4) | | | 173,087 | |
Reports to shareholders | | | 292,872 | |
Registration and filing fees | | | 1,617 | |
Professional fees | | | 120,559 | |
Trustees’ fees and expenses | | | 8,144 | |
Dividends on securities sold short | | | 1,176,858 | |
Other | | | 117,446 | |
| | | | |
Total expenses | | | 17,038,783 | |
Expense reductions (Note 4) | | | (56,822 | ) |
| | | | |
Net expenses | | | 16,981,961 | |
| | | | |
Net investment income | | | 10,961,288 | |
| | | | |
Realized and unrealized gains (losses): | | | | |
Net realized gain (loss) from: | | | | |
Investments | | | (3,803,833 | ) |
Written options | | | (1,294,698 | ) |
Foreign currency transactions | | | (27,930,857 | ) |
Securities sold short | | | (5,123,581 | ) |
| | | | |
Net realized gain (loss) | | | (38,152,969 | ) |
| | | | |
Net change in unrealized appreciation (depreciation) on: | | | | |
Investments | | | 306,404,054 | |
Translation of other assets and liabilities denominated in foreign currencies | | | (1,429,264 | ) |
| | | | |
Net change in unrealized appreciation (depreciation) | | | 304,974,790 | |
| | | | |
Net realized and unrealized gain (loss) | | | 266,821,821 | |
| | | | |
Net increase (decrease) in net assets resulting from operations | | $ | 277,783,109 | |
| | | | |
The accompanying notes are an integral part of these financial statements.
MGD-24
Franklin Templeton Variable Insurance Products Trust
Financial Statements (continued)
Statements of Changes in Net Assets
| | | | | | | | |
| | | Mutual Global Discovery
Securities Fund | |
| | | Year Ended December 31, | |
| | | 2009 | | | 2008 | |
| | | | |
Increase (decrease) in net assets: | | | | | | | | |
Operations: | | | | | | | | |
Net investment income | | $ | 10,961,288 | | | $ | 26,038,671 | |
Net realized gain (loss) from investments, written options, securities sold short, and foreign currency transactions | | | (38,152,969 | ) | | | (12,964 | ) |
Net change in unrealized appreciation (depreciation) on investments and translation of other assets and liabilities denominated in foreign currencies | | | 304,974,790 | | | | (568,610,877 | ) |
| | | | |
Net increase (decrease) in net assets resulting from operations | | | 277,783,109 | | | | (542,585,170 | ) |
| | | | |
Distributions to shareholders from: | | | | | | | | |
Net investment income: | | | | | | | | |
Class 1 | | | (1,156,170 | ) | | | (2,657,059 | ) |
Class 2 | | | (13,893,915 | ) | | | (34,278,128 | ) |
Class 4 | | | (663,709 | ) | | | (368,895 | ) |
Net realized gains: | | | | | | | | |
Class 1 | | | (2,188,207 | ) | | | (4,424,672 | ) |
Class 2 | | | (32,783,395 | ) | | | (64,218,477 | ) |
Class 4 | | | (1,312,205 | ) | | | (614,304 | ) |
| | | | |
Total distributions to shareholders | | | (51,997,601 | ) | | | (106,561,535 | ) |
| | | | |
Capital share transactions: (Note 2) | | | | | | | | |
Class 1 | | | (8,448,336 | ) | | | (18,342,463 | ) |
Class 2 | | | (8,110,790 | ) | | | (152,581,891 | ) |
Class 4 | | | 27,537,134 | | | | 28,857,728 | |
| | | | |
Total capital share transactions | | | 10,978,008 | | | | (142,066,626 | ) |
| | | | |
Net increase (decrease) in net assets | | | 236,763,516 | | | | (791,213,331 | ) |
Net assets: | | | | | | | | |
Beginning of year | | | 1,219,021,942 | | | | 2,010,235,273 | |
| | | | |
End of year | | $ | 1,455,785,458 | | | $ | 1,219,021,942 | |
| | | | |
Undistributed net investment income included in net assets: | | | | | | | | |
End of year | | $ | 12,778,372 | | | $ | 15,379,305 | |
| | | | |
The accompanying notes are an integral part of these financial statements.
MGD-25
Franklin Templeton Variable Insurance Products Trust
Notes to Financial Statements
Mutual Global Discovery Securities Fund
1. ORGANIZATION AND SIGNIFICANT ACCOUNTING POLICIES
Franklin Templeton Variable Insurance Products Trust (Trust) is registered under the Investment Company Act of 1940, as amended, (1940 Act) as an open-end investment company, consisting of twenty-two separate funds. The Mutual Global Discovery Securities Fund (Fund) is included in this report. The financial statements of the remaining funds in the Trust are presented separately. Shares of the Fund are generally sold only to insurance company separate accounts to fund the benefits of variable life insurance policies or variable annuity contracts. At December 31, 2009, 55.29% of the Fund’s shares were held through one insurance company. The Fund offers three classes of shares: Class 1, Class 2, and Class 4. Each class of shares differs by its distribution fees, voting rights on matters affecting a single class and its exchange privilege.
Effective May 1, 2009, the Mutual Discovery Securities Fund was renamed the Mutual Global Discovery Securities Fund.
The following summarizes the Fund’s significant accounting policies.
a. Security Valuation
Equity and other securities listed on a securities exchange or on the NASDAQ National Market System are valued at the last quoted sale price or the official closing price of the day, respectively. Over-the-counter securities and listed securities for which there is no reported sale are valued within the range of the most recent quoted bid and ask prices. Securities that trade in multiple markets or on multiple exchanges are valued according to the broadest and most representative market. Certain equity securities are valued based upon fundamental characteristics or relationships to similar securities. Investments in non-registered money funds are valued at the closing net asset value.
Corporate debt securities and government securities generally trade in the over-the-counter market rather than on a securities exchange. The Fund may utilize independent pricing services, quotations from bond dealers, and information with respect to bond and note transactions, to assist in determining a current market value for each security. The Fund’s pricing services may use valuation models or matrix pricing which considers information with respect to comparable bond and note transactions, quotations from bond dealers, or by reference to other securities that are considered comparable in such characteristics as rating, interest rate and maturity date, option adjusted spread models, prepayment projections, interest rate spreads and yield curves, to determine current value.
Senior secured corporate loans with floating or variable interest rates generally trade in the over-the-counter market rather than on a securities exchange. The Fund may utilize independent pricing services, quotations from loan dealers and other financial institutions, and information with respect to bond and note transactions, to assist in determining a current market value for each security. The Fund’s pricing services use independent market quotations from loan dealers or financial institutions and may incorporate valuation methodologies that consider multiple bond characteristics such as dealer quotes, issuer type, coupon, maturity, weighted average maturity, interest rate spreads and yield curves, cash flow and credit risk/quality analysis, to determine current value.
Foreign equity securities are valued as of the close of trading on the foreign stock exchange on which the security is primarily traded, or the NYSE, whichever is earlier. If no sale is reported at that time, the foreign equity security will be valued within the range of the most recent quoted bid and ask prices. The value is then converted into its U.S. dollar equivalent at the foreign exchange rate in effect at the close of the NYSE on the day that the value of the security is determined.
The Fund has procedures to determine the fair value of individual securities and other assets for which market prices are not readily available or which may not be reliably priced. Methods for valuing these securities may include: fundamental analysis based upon the underlying investment book value, anticipated future cash flows, market changes in comparable or similar securities, matrix pricing, discounts from market prices of similar securities, or discounts applied due to the nature and duration of restrictions on the disposition of the securities. Due to the inherent uncertainty of valuations of such securities, the fair values may differ significantly from the values that would have been used had a ready market for such investments existed.
MGD-26
Franklin Templeton Variable Insurance Products Trust
Notes to Financial Statements (continued)
Mutual Global Discovery Securities Fund
1. ORGANIZATION AND SIGNIFICANT ACCOUNTING POLICIES (continued)
a. Security Valuation (continued)
Occasionally, events occur between the time at which trading in a security is completed and the close of the NYSE that might call into question the availability (including the reliability) of the value of a portfolio security held by the Fund. The investment manager monitors price movements following the close of trading in foreign stock markets through a series of country specific market proxies (such as baskets of American Depository Receipts, futures contracts and exchange traded funds). These price movements are measured against established trigger thresholds for each specific market proxy to assist in determining if an event has occurred. If such an event occurs, the securities may be valued using fair value procedures, which may include the use of independent pricing services. All security valuation procedures are approved by the Fund’s Board of Trustees.
b. Foreign Currency Translation
Portfolio securities and other assets and liabilities denominated in foreign currencies are translated into U.S. dollars based on the exchange rate of such currencies against U.S. dollars on the date of valuation. The Fund may enter into foreign currency exchange contracts to facilitate transactions denominated in a foreign currency. Purchases and sales of securities, income and expense items denominated in foreign currencies are translated into U.S. dollars at the exchange rate in effect on the transaction date. Occasionally, events may impact the availability or reliability of foreign exchange rates used to convert the U.S. dollar equivalent value. If such an event occurs, the foreign exchange rate will be valued at fair value using procedures established and approved by the Fund’s Board of Trustees.
The Fund does not separately report the effect of changes in foreign exchange rates from changes in market prices on securities held. Such changes are included in net realized and unrealized gain or loss from investments on the Statement of Operations.
Realized foreign exchange gains or losses arise from sales of foreign currencies, currency gains or losses realized between the trade and settlement dates on securities transactions and the difference between the recorded amounts of dividends, interest, and foreign withholding taxes and the U.S. dollar equivalent of the amounts actually received or paid. Net unrealized foreign exchange gains and losses arise from changes in foreign exchange rates on foreign denominated assets and liabilities other than investments in securities held at the end of the reporting period.
c. Securities Purchased on a Delayed Delivery Basis
The Fund may purchase securities on a delayed delivery basis, with payment and delivery scheduled for a future date. These transactions are subject to market fluctuations and are subject to the risk that the value at delivery may be more or less than the trade date purchase price. Although the Fund will generally purchase these securities with the intention of holding the securities, it may sell the securities before the settlement date. Sufficient assets have been segregated for these securities.
d. Derivative Financial Instruments
The Fund may invest in derivative financial instruments (derivatives) in order to manage risk or gain exposure to various other investments or markets. Derivatives are financial contracts based on an underlying or notional amount, require no initial investment or an initial net investment that is smaller than would normally be required to have a similar response to changes in market factors, and require or permit net settlement. Derivatives may contain various risks including the potential inability of the counterparty to fulfill their obligations under the terms of the contract, the potential for an illiquid secondary market, and the potential for market movements which may expose the Fund to gains or losses in excess of the amounts shown on the Statement of Assets and Liabilities.
Derivatives are marked to market daily based upon quotations from market makers or the Fund’s independent pricing services and the Fund’s net benefit or obligation under the contract, as measured by the fair market value of the contract, is included in net assets. Realized gain and loss and unrealized appreciation and depreciation on these contracts for the period are included in the Statement of Operations.
MGD-27
Franklin Templeton Variable Insurance Products Trust
Notes to Financial Statements (continued)
Mutual Global Discovery Securities Fund
1. ORGANIZATION AND SIGNIFICANT ACCOUNTING POLICIES (continued)
d. Derivative Financial Instruments (continued)
The Fund generally enters into forward exchange contracts in order to hedge against fluctuations in foreign exchange rates. A forward exchange contract is an agreement between the Fund and a counterparty to buy or sell a foreign currency for a specific exchange rate on a future date. Pursuant to the terms of the forward exchange contracts, cash or securities may be required to be deposited as collateral.
The Fund generally purchases or writes option contracts in order to manage or gain exposure to equity price risk. An option is a contract entitling the holder to purchase or sell a specific amount of shares or units of a particular security, currency or index, or notional amount of a swap (swaption), at a specified price. Options purchased are recorded as an asset while options written are recorded as a liability. Upon exercise of an option, the acquisition cost or sales proceeds of the security is adjusted by any premium paid or received. Upon expiration of an option, any premium paid or received is recorded as a realized loss or gain. Upon closing an option other than through expiration or exercise, the difference between the premium and the cost to close the position is recorded as a realized gain or loss.
See Note 12 regarding other derivative information.
e. Securities Sold Short
The Fund is engaged in selling securities short, which obligates the Fund to replace a borrowed security with the same security at current market value. The Fund incurs a loss if the price of the security increases between the date of the short sale and the date on which the Fund replaces the borrowed security. The Fund realizes a gain if the price of the security declines between those dates. Gains are limited to the price at which the Fund sold the security short, while losses are potentially unlimited in size.
The Fund is required to establish a margin account with the broker lending the security sold short. While the short sale is outstanding, the broker retains the proceeds of the short sale and the Fund must maintain a deposit with broker consisting of cash and/or securities having a value equal to a specified percentage of the value of the securities sold short. The Fund is obligated to pay the counterparty any dividends or interest due on securities sold short. Such dividends or interest is recorded as an expense to the Fund.
f. Securities Lending
The Fund participates in an agency based security lending program. The Fund receives cash collateral against the loaned securities in an amount equal to at least 102% of the market value of the loaned securities. Collateral is maintained over the life of the loan in an amount not less than 100% of the market value of loaned securities, as determined at the close of Fund business each day; any additional collateral required due to changes in security values is delivered to the Fund on the next business day. The collateral is invested in a non-registered money fund (Bank of New York Institutional Cash Reserve Fund or ICRF), managed by the Fund’s custodian on the Fund’s behalf. The Fund receives income from the investment of cash collateral, in addition to lending fees and rebates paid by the borrower. The Fund bears the market risk with respect to the collateral investment, securities loaned, and the risk that the agent may default on its obligations to the Fund. The securities lending agent has agreed to indemnify the Fund in the event of default by a third party borrower.
In September of 2008, the Bank of New York Mellon advised the Fund that the ICRF had exposure to certain defaulted debt obligations of Lehman Brothers Holdings, Inc. and that they had created a separate sleeve (Series B) of the ICRF to hold these securities apart from the main investments. Each investor in the ICRF was allocated its pro-rata portion of Series B. The Fund’s position in Series B is disclosed on the Statement of Investments at fair value and any unrealized loss attributable to the position is included in net assets.
MGD-28
Franklin Templeton Variable Insurance Products Trust
Notes to Financial Statements (continued)
Mutual Global Discovery Securities Fund
1. ORGANIZATION AND SIGNIFICANT ACCOUNTING POLICIES (continued)
g. Senior Floating Rate Interests
Senior secured corporate loans pay interest at rates which are periodically reset by reference to a base lending rate plus a spread. These base lending rates are generally the prime rate offered by a designated U.S. bank or the London InterBank Offered Rate (LIBOR). Senior secured corporate loans often require prepayment of principal from excess cash flows or at the discretion of the borrower. As a result, actual maturity may be substantially less than the stated maturity.
Senior secured corporate loans in which the Fund invests are generally readily marketable, but may be subject to some restrictions on resale.
h. Income Taxes
No provision has been made for U.S. income taxes because it is the Fund’s policy to qualify as a regulated investment company under the Internal Revenue Code and to distribute to shareholders substantially all of its taxable income and net realized gains.
The Fund has reviewed the tax positions, taken on federal income tax returns, for each of the three open tax years and as of December 31, 2009, and has determined that no provision for income tax is required in the Fund’s financial statements.
Foreign securities held by the Fund may be subject to foreign taxation on dividend income received. Foreign taxes, if any, are recorded based on the tax regulations and rates that exist in the foreign markets in which the Fund invests.
i. Security Transactions, Investment Income, Expenses and Distributions
Security transactions are accounted for on trade date. Realized gains and losses on security transactions are determined on a specific identification basis. Interest income and estimated expenses are accrued daily. Amortization of premium and accretion of discount on debt securities are included in interest income. Facility fees are recognized as income over the expected term of the loan. Dividend income and dividends declared on securities sold short are recorded on the ex-dividend date except that certain dividends from foreign securities are recognized as soon as the Fund is notified of the ex-dividend date. Distributions to shareholders are recorded on the ex-dividend date and are determined according to income tax regulations (tax basis). Distributable earnings determined on a tax basis may differ from earnings recorded in accordance with accounting principles generally accepted in the United States of America. These differences may be permanent or temporary. Permanent differences are reclassified among capital accounts to reflect their tax character. These reclassifications have no impact on net assets or the results of operations. Temporary differences are not reclassified, as they may reverse in subsequent periods.
Common expenses incurred by the Trust are allocated among the funds based on the ratio of net assets of each fund to the combined net assets of the Trust. Fund specific expenses are charged directly to the fund that incurred the expense.
Realized and unrealized gains and losses and net investment income, not including class specific expenses, are allocated daily to each class of shares based upon the relative proportion of net assets of each class. Differences in per share distributions, by class, are generally due to differences in class specific expenses.
j. Accounting Estimates
The preparation of financial statements in accordance with accounting principles generally accepted in the United States of America requires management to make estimates and assumptions that affect the reported amounts of assets and liabilities at the date of the financial statements and the amounts of income and expenses during the reporting period. Actual results could differ from those estimates.
MGD-29
Franklin Templeton Variable Insurance Products Trust
Notes to Financial Statements (continued)
Mutual Global Discovery Securities Fund
1. ORGANIZATION AND SIGNIFICANT ACCOUNTING POLICIES (continued)
k. Guarantees and Indemnifications
Under the Trust’s organizational documents, its officers and trustees are indemnified by the Trust against certain liabilities arising out of the performance of their duties to the Trust. Additionally, in the normal course of business, the Trust, on behalf of the Fund, enters into contracts with service providers that contain general indemnification clauses. The Trust’s maximum exposure under these arrangements is unknown as this would involve future claims that may be made against the Trust that have not yet occurred. Currently, the Trust expects the risk of loss to be remote.
2. SHARES OF BENEFICIAL INTEREST
At December 31, 2009, there were an unlimited number of shares authorized (without par value). Transactions in the Fund’s shares were as follows:
| | | | | | | | | | | | | | |
| | | Year Ended December 31, | |
| | | 2009 | | | 2008a | |
| Class 1 Shares: | | Shares | | | Amount | | | Shares | | | Amount | |
Shares sold | | 81,769 | | | $ | 1,439,153 | | | 91,837 | | | $ | 2,015,607 | |
Shares issued in reinvestment of distributions | | 186,941 | | | | 3,344,377 | | | 365,038 | | | | 7,081,731 | |
Shares redeemed | | (780,395 | ) | | | (13,231,866 | ) | | (1,340,440 | ) | | | (27,439,801 | ) |
| | | | |
Net increase (decrease) | | (511,685 | ) | | $ | (8,448,336 | ) | | (883,565 | ) | | $ | (18,342,463 | ) |
| | | | |
Class 2 Shares: | | | | | | | | | | | | | | |
Shares sold | | 4,897,346 | | | $ | 81,796,690 | | | 7,042,696 | | | $ | 147,206,623 | |
Shares issued in reinvestment of distributions | | 2,653,628 | | | | 46,677,309 | | | 5,159,592 | | | | 98,496,605 | |
Shares redeemed | | (8,181,894 | ) | | | (136,584,789 | ) | | (20,749,426 | ) | | | (398,285,119 | ) |
| | | | |
Net increase (decrease) | | (630,920 | ) | | $ | (8,110,790 | ) | | (8,547,138 | ) | | $ | (152,581,891 | ) |
| | | | |
Class 4 Shares: | | | | | | | | | | | | | | |
Shares sold | | 1,651,459 | | | $ | 28,116,459 | | | 1,455,745 | | | $ | 28,125,030 | |
Shares issued on reinvestment of distributions | | 111,006 | | | | 1,975,914 | | | 50,743 | | | | 982,892 | |
Shares redeemed | | (143,749 | ) | | | (2,555,239 | ) | | (14,491 | ) | | | (250,194 | ) |
| | | | |
Net increase (decrease) | | 1,618,716 | | | $ | 27,537,134 | | | 1,491,997 | | | $ | 28,857,728 | |
| | | | |
| aFor | the period February 29, 2008 (effective date) to December 31, 2008 for Class 4. |
3. TRANSACTIONS WITH AFFILIATES
Franklin Resources, Inc. is the holding company for various subsidiaries that together are referred to as Franklin Templeton Investments. Certain officers and trustees of the Trust are also officers and/or directors of the following subsidiaries:
| | |
| Subsidiary | | Affiliation |
Franklin Mutual Advisers, LLC (Franklin Mutual) | | Investment manager |
Franklin Templeton Services, LLC (FT Services) | | Administrative manager |
Franklin Templeton Distributors, Inc. (Distributors) | | Principal underwriter |
Franklin Templeton Investors Services, LLC (Investor Services) | | Transfer Agent |
MGD-30
Franklin Templeton Variable Insurance Products Trust
Notes to Financial Statements (continued)
Mutual Global Discovery Securities Fund
3. TRANSACTIONS WITH AFFILIATES (continued)
a. Management Fees
The Fund pays an investment management fee to Franklin Mutual based on the average daily net assets of the Fund as follows:
| | |
| Annualized Fee Rate | | Net Assets |
| 0.800% | | Up to and including $4 billion |
| 0.770% | | Over $4 billion, up to and including $7 billion |
| 0.750% | | Over $7 billion, up to and including $10 billion |
| 0.730% | | In excess of $10 billion |
Effective December 7, 2009, Franklin Templeton Investment Management Limited, an affiliate of Franklin Mutual, no longer provides subadvisory services to the Fund.
b. Administrative Fees
The Fund pays an administrative fee to FT Services based on the Fund’s average daily net assets as follows:
| | |
| Annualized Fee Rate | | Net Assets |
| 0.150% | | Up to and including $200 million |
| 0.135% | | Over $200 million, up to and including $700 million |
| 0.100% | | Over $700 million, up to and including $1.2 billion |
| 0.075% | | In excess of $1.2 billion |
c. Distribution Fees
The Fund’s Board of Trustees has adopted distribution plans for Class 2 and Class 4 shares pursuant to Rule 12b-1 under the 1940 Act. Under the Fund’s compensation distribution plans, the Fund pays Distributors for costs incurred in connection with the servicing, sale and distribution of the Fund’s shares up to 0.35% per year of its average daily net assets of each class. The Board of Trustees has agreed to limit the current rate to 0.25% per year for Class 2.
d. Transfer Agent Fees
Investor Services, under terms of an agreement, performs shareholder servicing for the Fund and is not paid by the Fund for the services.
4. EXPENSE OFFSET ARRANGEMENT
The Fund has entered into an arrangement with its custodian whereby credits realized as a result of uninvested cash balances are used to reduce a portion of the Fund’s custodian expenses. During the year ended December 31, 2009, the custodian fees were reduced as noted in the Statement of Operations.
5. INCOME TAXES
For tax purposes, capital losses may be carried over to offset future capital gains, if any. At December 31, 2009, the Fund had tax basis capital losses of $49,219,769 expiring in 2017.
MGD-31
Franklin Templeton Variable Insurance Products Trust
Notes to Financial Statements (continued)
Mutual Global Discovery Securities Fund
5. INCOME TAXES (continued)
The tax character of distributions paid during the years ended December 31, 2009 and 2008, was as follows:
| | | | | | |
| | | 2009 | | 2008 |
Distributions paid from: | | | | | | |
Ordinary income | | $ | 51,997,601 | | $ | 41,021,959 |
Long term capital gain | | | — | | | 65,539,576 |
| | | |
| | $ | 51,997,601 | | $ | 106,561,535 |
| | | |
At December 31, 2009, the cost of investments, net unrealized appreciation (depreciation) and undistributed ordinary income for income tax purposes were as follows:
| | | | |
Cost of investments | | $ | 1,276,800,904 | |
| | | | |
Unrealized appreciation | | $ | 250,526,027 | |
Unrealized depreciation | | | (81,005,582 | ) |
| | | | |
Net unrealized appreciation (depreciation) | | $ | 169,520,445 | |
| | | | |
Distributable earnings – undistributed ordinary income | | $ | 17,613,393 | |
| | | | |
Net investment income differs for financial statement and tax purposes primarily due to differing treatments of defaulted securities, foreign currency transactions, passive foreign investment company shares, pass-through entity income, payments-in-kind, bond discounts and premiums, certain dividends on securities sold short and certain corporate actions.
Net realized gains (losses) differ for financial statement and tax purposes primarily due to differing treatments of wash sales, foreign currency transactions, passive foreign investment company shares, pass-through entity income, payments-in-kind, bond discounts and premiums, tax straddles, certain dividends on securities sold short and certain corporate actions.
6. INVESTMENT TRANSACTIONS
Purchases and sales of investments (excluding short term securities and securities sold short) for the year ended December 31, 2009, aggregated $656,941,896 and $404,873,902, respectively.
Transactions in options written during the year ended December 31, 2009, were as follows:
| | | | | | | |
| | | Number of
Contracts | | | Premiums
Received | |
Options outstanding at December 31, 2008 | | 7,628 | | | $ | 3,243,889 | |
Options written | | 4,609,325 | | | | 12,949,318 | |
Options expired | | (7,997 | ) | | | (3,745,878 | ) |
Options exercised | | (1,862,415 | ) | | | (4,752,739 | ) |
Options closed | | (1,295,241 | ) | | | (3,513,459 | ) |
| | | | |
Options outstanding at December 31, 2009 | | 1,451,300 | | | $ | 4,181,131 | |
| | | | |
7. CREDIT RISK AND DEFAULTED SECURITIES
The Fund may purchase the pre-default or defaulted debt of distressed companies. Distressed companies are financially troubled and are about to be/or are already involved in financial restructuring or bankruptcy. Risks associated with purchasing these securities include the possibility that the bankruptcy or other restructuring process takes longer than expected, or that
MGD-32
Franklin Templeton Variable Insurance Products Trust
Notes to Financial Statements (continued)
Mutual Global Discovery Securities Fund
7. CREDIT RISK AND DEFAULTED SECURITIES (continued)
distributions in restructuring are less than anticipated, either or both of which may result in unfavorable consequences to the Fund. If it becomes probable that income on debt securities, including those of distressed companies, will not be collected, the Fund discontinues accruing income and recognizes an adjustment for uncollectible interest. For the year ended December 31, 2009, the Fund recorded an adjustment for uncollectible interest of $2,475,271, as noted in the Statement of Operations.
At December 31, 2009, the aggregate value of distressed company securities and securities for which interest has been discontinued was $1,404,559, representing 0.10% of the Fund’s net assets. For information as to specific securities, see the accompanying Statement of Investments.
8. CONCENTRATION OF RISK
Investing in foreign securities may include certain risks and considerations not typically associated with investing in U.S. securities, such as fluctuating currency values and changing local and regional economic, political and social conditions, which may result in greater market volatility. In addition, certain foreign securities may not be as liquid as U.S. securities.
9. RESTRICTED SECURITIES
The Fund may invest in securities that are restricted under the Securities Act of 1933 (1933 Act) or which are subject to legal, contractual, or other agreed upon restrictions on resale. Restricted securities are often purchased in private placement transactions, and cannot be sold without prior registration unless the sale is pursuant to an exemption under the 1933 Act. Disposal of these securities may require greater effort and expense, and prompt sale at an acceptable price may be difficult. The Fund may have registration rights for restricted securities. The issuer generally incurs all registration costs.
At December 31, 2009, the Fund held investments in restricted securities, excluding 144A securities deemed to be liquid, valued in accordance with procedures approved by the Fund’s Board of Trustees as reflecting fair value, as follows:
| | | | | | | | | | |
Principal
Amount/
Shares/
Warrants/
Contracts | | Issuer | | Acquisition
Dates | | Cost | | Value |
| 36,827 | | AboveNet Inc. | | 10/02/01 - 9/08/09 | | $ | 910,432 | | $ | 2,395,228 |
| 23 | | AboveNet Inc., stock grant, grant price $10.475, expiration date 9/09/13 | | 4/17/06 - 9/08/06 | | | — | | | 5,020 |
| 5 | | AboveNet Inc., stock grant, grant price $30, expiration date 9/07/18 | | 9/08/09 | | | — | | | 701 |
| 739 | | AboveNet Inc., wts., 9/08/10 | | 10/02/01 - 9/07/07 | | | 76,964 | | | 73,900 |
| 800,000 | | The Bankshares Inc. | | 3/22/07 | | | 8,000,000 | | | 2,862,639 |
| 2,161,828 | | Cerberus CG Investor I LLC | | 7/26/07 - 6/17/08 | | | 2,154,424 | | | 453,984 |
| 1,897,400 | | Cerberus CG Investor I LLC, 12.00%, 7/31/14 | | 7/26/07 | | | 1,897,400 | | | 398,454 |
| 2,161,828 | | Cerberus CG Investor II LLC | | 7/26/07 - 6/17/08 | | | 2,154,424 | | | 453,984 |
| 1,897,400 | | Cerberus CG Investor II LLC, 12.00%, 7/31/14 | | 7/26/07 | | | 1,897,400 | | | 398,454 |
| 1,080,914 | | Cerberus CG Investor III LLC | | 7/26/07 - 6/17/08 | | | 1,077,212 | | | 226,992 |
| 948,700 | | Cerberus CG Investor III LLC, 12.00%, 7/31/14 | | 7/26/07 | | | 948,700 | | | 199,227 |
| 21,716 | | aDecisionOne Corp. | | 9/28/99 - 7/18/00 | | | 16,482 | | | 36,049 |
| 28,852 | | aDecisionOne Corp., senior secured note, 15.00%, 11/30/13 | | 6/01/09 - 10/15/09 | | | 28,852 | | | 28,852 |
| 11,923 | | aDecisionOne Corp., wts., 6/08/17 | | 7/09/07 | | | — | | | — |
| 1,903 | | Elephant Capital Holdings Ltd. | | 8/23/04 - 3/10/08 | | | 294,226 | | | — |
| 2,077,368 | | FIM Coinvestor Holdings I LLC | | 11/20/06 - 6/02/09 | | | — | | | — |
| 56 | | GMAC Inc. | | 11/13/09 | | | 8,120,426 | | | 621,913 |
| 47,271 | | IACNA Investor LLC | | 7/24/08 | | | 17,133 | | | 473 |
| 239,310 | | Imagine Group Holdings Ltd. | | 8/31/04 | | | 2,450,893 | | | 2,579,068 |
MGD-33
Franklin Templeton Variable Insurance Products Trust
Notes to Financial Statements (continued)
Mutual Global Discovery Securities Fund
9. RESTRICTED SECURITIES (continued)
| | | | | | | | | | |
Principal
Amount/
Shares/
Warrants/
Contracts | | Issuer | | Acquisition
Dates | | Cost | | Value |
| 424,073 | | International Automotive Components Group Brazil LLC | | 4/13/06 - 12/26/08 | | $ | 282,031 | | $ | 475,564 |
| 74,174 | | International Automotive Components Group Japan LLC | | 9/26/06 - 3/27/07 | | | 643,892 | | | 284,084 |
| 1,512,200 | | International Automotive Components Group LLC | | 1/12/06 - 10/16/06 | | | 1,512,447 | | | 1,030,957 |
| 407,500 | | International Automotive Components Group NA LLC, 9.00%, 4/01/17 | | 3/30/07 | | | 413,613 | | | 408,409 |
| 1,353,608 | | bInternational Automotive Components Group NA LLC, A | | 3/30/07 -10/10/07 | | | 1,368,532 | | | 411,970 |
| 383 | | MCII Holdings Inc. | | 4/17/09 | | | 440,952 | | | — |
| 2,897 | | MCII Holdings Inc., PIK, pfd., A | | 4/17/09 -10/01/09 | | | 2,864,780 | | | 1,346,452 |
| 1,460,000 | | MPF Corp. Ltd. | | 5/08/06 | | | 7,500,856 | | | — |
| 9,306 | | NCB Warrant Holdings Ltd., A | | 12/06/05 - 3/10/08 | | | 87,597 | | | — |
| 133,700 | | North American Financial Holdings Inc., 144A | | 12/16/09 | | | 2,674,000 | | | 2,674,000 |
| 60,700 | | North American Financial Holdings Inc., 144A, non-voting | | 12/16/09 | | | 1,214,000 | | | 1,214,000 |
| 2,140 | | Olympus Re Holdings Ltd. | | 12/19/01 | | | 206,942 | | | 4,571 |
| 4,289 | | PTV Inc., 10.00%, pfd., A | | 12/07/01 - 3/06/02 | | | 2,702 | | | 710 |
| | | | | | | | | | |
| | Total Restricted Securities (1.28% of Net Assets) | | | | | | | $ | 18,585,655 |
| | | | | | | | | | |
aThe Fund also invests in unrestricted securities of the issuer, valued at $5,046 as of December 31, 2009.
bThe Fund also invests in unrestricted securities of the issuer, valued at $268,430 as of December 31, 2009.
10. UNFUNDED LOAN COMMITMENTS
The Fund may enter into certain credit agreements, all or a portion of which may be unfunded. The Fund is obligated to fund these loan commitments at the borrowers’ discretion. Funded portions of credit agreements are presented on the Statement of Investments.
At December 31, 2009, unfunded commitments were as follows:
| | | |
| Borrower | | Unfunded
Commitment |
Lyondell Chemical Co., DIP Delayed Draw Term Loan, FRN,
13.00%, 4/06/10 | | $ | 104,035 |
| | | |
Unfunded loan commitments and funded portions of credit agreements are marked to market daily and any unrealized appreciation or depreciation is included in the Statement of Assets and Liabilities and Statement of Operations.
11. UNFUNDED CAPITAL COMMITMENTS
The Fund may enter into certain capital commitments and may be obligated to perform on such agreements at a future date. Unfunded capital commitments requiring recognition are monitored for impairment and any unrealized deprecation is included in the Statement of Assets and Liabilities and the Statement of Operations. At December 31, 2009, the Fund had aggregate unfunded capital commitments of $6,191,979, for which no depreciation has been recognized.
MGD-34
Franklin Templeton Variable Insurance Products Trust
Notes to Financial Statements (continued)
Mutual Global Discovery Securities Fund
12. OTHER DERIVATIVE INFORMATION
At December 31, 2009, the Fund has invested in derivative contracts which are reflected on the Statement of Assets and Liabilities as follows:
| | | | | | | | | | |
| | | Asset Derivatives | | Liability Derivatives |
Derivative Contracts Not Accounted
for as Hedging Instruments | | Statement of Assets and
Liabilities Location | | Fair
Value
Amount | | Statement of Assets and
Liabilities Location | | Fair
Value
Amount |
Foreign exchange contracts | | Unrealized appreciation on forward exchange contracts | | $ | 18,182,510 | | Unrealized depreciation on forward exchange contracts | | $ | 2,079,608 |
Equity contracts | | | | | | | Options written, at value | | | 5,747,264 |
For the year ended December 31, 2009, the effect of derivative contracts on the Fund’s Statement of Operations was as follows:
| | | | | | | | | | | | |
Derivative Contracts Not Accounted
for as Hedging Instruments | | Statement of Operations Locations | | Realized Gain
(Loss) for the
Year Ended
December 31, 2009 | | | Change in
Unrealized
Appreciation
(Depreciation)
for the
Year Ended
December 31, 2009 | | | Average
Amount
Outstanding
During the
Yeara |
Foreign exchange contracts | | Net realized gain (loss) from foreign currency transactions / Net change in unrealized appreciation (depreciation) on translation of other assets and liabilities denominated in foreign currencies | | $ | (28,461,236 | ) | | $ | (1,597,200 | ) | | 594,727,261 |
Equity contracts | | Net realized gain (loss) from investments and written options / Net change in unrealized appreciation (depreciation) on investments | | | (3,208,057 | ) | | | (1,538,584 | ) | | 1,908,706 |
aRepresents the average number of option contracts or notional amount for other derivative contracts outstanding during the period. For derivative contracts denominated in foreign currencies, notional amounts are converted to U.S. dollars.
13. HOLDINGS OF 5% VOTING SECURITIES OF PORTFOLIO COMPANIES
The 1940 Act defines “affiliated companies” to include investments in portfolio companies in which a fund owns 5% or more of the outstanding voting securities. Investments in “affiliated companies” for the Fund for the year ended December 31, 2009, were as shown below.
| | | | | | | | | | | | | | | | | |
| Name of Issuer | | Number of Shares
Held at Beginning
of Year | | Gross
Additions | | Gross
Reductions | | Number of Shares
Held at End of
Year | | Value at
End of
Year | | Investment
Income | | Realized Capital
Gain (Loss) |
Non-Controlled Affiliates | | | | | | | | | | | | | | | | | |
The Bankshares Inc. (0.20% of Net Assets) | | 800,000 | | — | | — | | 800,000 | | $ | 2,862,639 | | $ | — | | $ | — |
| | | | | | | | | | | |
14. OTHER CONSIDERATIONS
Officers, directors or employees of the Fund’s Investment Manager, may serve from time to time as members of bondholders’ steering committees, official creditors’ committees, or boards of directors of companies in which the Fund invests. Such
MGD-35
Franklin Templeton Variable Insurance Products Trust
Notes to Financial Statements (continued)
Mutual Global Discovery Securities Fund
14. OTHER CONSIDERATIONS (continued)
participation may result in the possession by the Investment Manager of material non-public information which, pursuant to the Fund’s policies and the requirements of applicable securities laws, could prevent the Fund from trading in the securities of such companies for limited or extended periods of time.
15. CREDIT FACILITY
The Fund, together with other U.S. registered and foreign investment funds (collectively “Borrowers”), managed by Franklin Templeton Investments, are borrowers in a joint syndicated senior unsecured credit facility totaling $725 million (Global Credit Facility) to provide a source of funds to the Borrowers for temporary and emergency purposes, including the ability to meet future unanticipated or unusually large redemption requests. Effective January 22, 2010, the Fund renewed the Global Credit Facility, for a total of $750 million, maturing January 21, 2011.
Under the terms of the Global Credit Facility, the Fund shall, in addition to interest charged on any borrowings made by the Fund and other costs incurred by the Fund, pay its share of fees and expenses incurred in connection with the implementation and maintenance of the Global Credit Facility, based upon its relative share of the aggregate net assets of all of the Borrowers, including an annual commitment fee of 0.10% based upon the unused portion of the Global Credit Facility, which is reflected in other expenses on the Statement of Operations. During the year ended December 31, 2009, the Fund did not utilize the Global Credit Facility.
16. FAIR VALUE MEASUREMENTS
The Fund follows a fair value hierarchy that distinguishes between market data obtained from independent sources (observable inputs) and the Fund’s own market assumptions (unobservable inputs). These inputs are used in determining the value of the Fund’s investments and are summarized in the following fair value hierarchy:
| | • | | Level 1 – quoted prices in active markets for identical securities |
| | • | | Level 2 – other significant observable inputs (including quoted prices for similar securities, interest rates, prepayment speed, credit risk, etc.) |
| | • | | Level 3 – significant unobservable inputs (including the Fund’s own assumptions in determining the fair value of investments) |
The inputs or methodology used for valuing securities are not an indication of the risk associated with investing in those securities.
MGD-36
Franklin Templeton Variable Insurance Products Trust
Notes to Financial Statements (continued)
Mutual Global Discovery Securities Fund
16. FAIR VALUE MEASUREMENTS (continued)
The following is a summary of the inputs used as of December 31, 2009, in valuing the Fund’s assets and liabilities carried at fair value:
| | | | | | | | | | | | | |
| | | Level 1 | | Level 2 | | Level 3 | | | Total |
| | | |
Assets: | | | | | | | | | | | | | |
Investments in Securities | | | | | | | | | | | | | |
Equity Investments:a | | | | | | | | | | | | | |
Airlines | | $ | — | | $ | 5,145 | | $ | — | | | $ | 5,145 |
Auto Components | | | — | | | — | | | 2,205,235 | b | | | 2,205,235 |
Commercial Banks | | | 66,703,589 | | | — | | | 2,862,639 | b | | | 69,566,228 |
Computers & Peripherals | | | 20,272,228 | | | — | | | 36,049 | b | | | 20,308,277 |
Consumer Finance | | | — | | | — | | | 1,756,873 | | | | 1,756,873 |
Diversified Financial Services | | | 44,305,003 | | | — | | | 3,888,000 | b | | | 48,193,003 |
Diversified Telecommunication Services | | | 24,059,113 | | | 74,610 | | | — | b | | | 24,133,723 |
Insurance | | | 37,331,434 | | | — | | | 2,583,639 | | | | 39,915,073 |
Machinery | | | 23,680,670 | | | — | | | 1,346,452 | b | | | 25,027,122 |
Media | | | 30,634,656 | | | 252,402 | | | — | b | | | 30,887,058 |
Real Estate Management & Development | | | 11,892,918 | | | — | | | 985,974 | | | | 12,878,892 |
All Other Equity Investmentsc | | | 875,322,172 | | | — | | | — | b | | | 875,322,172 |
Corporate Bonds, Notes and Senior Floating Rate Interests | | | — | | | 42,391,165 | | | 1,729,206 | | | | 44,120,371 |
Corporate Bonds and Notes in Reorganization | | | — | | | — | | | 15 | | | | 15 |
Companies in Liquidation | | | — | | | — | | | — | b | | | — |
Short Term Investments | | | 235,106,890 | | | 16,895,272 | | | — | | | | 252,002,162 |
| | | |
Total Investments in Securities | | $ | 1,369,308,673 | | $ | 59,618,594 | | $ | 17,394,082 | | | $ | 1,446,321,349 |
| | | |
Forward Exchange Contracts | | | — | | | 18,182,510 | | | — | | | | 18,182,510 |
Unfunded Loan Commitments | | | — | | | 3,973 | | | — | | | | 3,973 |
Liabilities: | | | | | | | | | | | | | |
Options Written | | | 136,500 | | | 5,610,764 | | | — | | | | 5,747,264 |
Securities Sold Short | | | 22,200,455 | | | — | | | — | | | | 22,200,455 |
Forward Exchange Contracts | | | — | | | 2,079,608 | | | — | | | | 2,079,608 |
aIncludes common and preferred stock as well as other equity investments.
bIncludes securities determined to have no value at December 31, 2009.
cFor detailed industry descriptions, see the accompanying Statement of Investments.
MGD-37
Franklin Templeton Variable Insurance Products Trust
Notes to Financial Statements (continued)
Mutual Global Discovery Securities Fund
16. FAIR VALUE MEASUREMENTS (continued)
At December 31, 2009, the reconciliation of assets in which significant unobservable inputs (Level 3) were used in determining fair value, were as follows:
| | | | | | | | | | | | | | | | | | | | | | | | | | | |
| | | Balance at
Beginning of
Year | | Net
Realized
Gain (Loss) | | | Net Change in
Unrealized
Appreciation
(Depreciation) | | | Net
Purchases
(Sales) | | | Transfer In
(Out) of
Level 3 | | | Balance at
End of
Year | | | Net Change in
Unrealized
Appreciation
(Depreciation)
on Assets
Held at
Year End | |
Assets | | | | | | | | | | | | | | | | | | | | | | | | | | | |
Investments in Securities: | | | | | | | | | | | | | | | | | | | | | | | | | | | |
Equity Investments:a | | | | | | | | | | | | | | | | | | | | | | | | | | | |
Auto Components | | $ | 897,816 | | $ | — | | | $ | 1,307,419 | | | $ | — | | | $ | — | | | $ | 2,205,235 | b | | $ | 1,307,419 | |
Commercial Banks | | | 5,163,550 | | | — | | | | (2,300,911 | ) | | | — | | | | — | | | | 2,862,639 | b | | | (2,363,493 | ) |
Computers & Peripherals | | | — | | | — | | | | 36,049 | | | | — | | | | — | | | | 36,049 | b | | | 36,049 | |
Consumer Finance | | | 1,080,914 | | | — | | | | (7,444,467 | ) | | | 8,120,426 | | | | — | | | | 1,756,873 | | | | (7,444,467 | ) |
Diversified Financial Services | | | — | | | — | | | | — | | | | 3,888,000 | | | | — | | | | 3,888,000 | b | | | — | |
Diversified Telecommunication Services | | | 923,558 | | | — | | | | 551,290 | | | | — | | | | (1,474,848 | ) | | | — | b | | | — | |
Food Products | | | 3,714 | | | — | | | | (721 | ) | | | — | | | | (2,993 | ) | | | — | | | | — | |
Health Care Providers & Services | | | 865,249 | | | — | | | | 41,202 | | | | — | | | | (906,451 | ) | | | — | | | | — | |
Insurance | | | 3,705,159 | | | (115,500 | ) | | | 1,054,563 | | | | (2,060,583 | ) | | | — | | | | 2,583,639 | | | | 618,666 | |
Machinery | | | — | | | — | | | | (1,959,280 | ) | | | 3,305,732 | | | | — | | | | 1,346,452 | b | | | (1,959,280 | ) |
Real Estate Management & Development | | | 716,584 | | | — | | | | 269,390 | | | | — | | | | — | | | | 985,974 | | | | 269,390 | |
Corporate Bonds, Notes and Senior Floating Rate interests | | | 8,965,397 | | | (2,663,941 | ) | | | 9,771,136 | | | | (14,343,386 | ) | | | — | | | | 1,729,206 | | | | 199,832 | |
Corporate Bonds and Notes in Reorganization | | | 63,418 | | | (1,881,500 | ) | | | 2,259,049 | | | | (440,952 | ) | | | — | | | | 15 | | | | — | |
Companies in Liquidation | | | 434,133 | | | — | | | | (461,751 | ) | | | 27,618 | | | | — | | | | — | b | | | (461,751 | ) |
| | | | |
Total | | $ | 22,819,492 | | $ | (4,660,941 | ) | | $ | 3,122,968 | | | $ | (1,503,145 | ) | | $ | (2,384,292 | ) | | $ | 17,394,082 | | | $ | (9,797,635 | ) |
| | | | |
aIncludes common and preferred stock as well as other equity investments.
bIncludes securities determined to have no value at December 31, 2009.
17. NEW ACCOUNTING PRONOUNCEMENTS
In January 2010, the Financial Accounting Standards Board issued Accounting Standards Update (ASU) No. 2010-6, Fair Value Measurements and Disclosures (Topic 820): Improving Disclosures about Fair Value Measurements. ASU No. 2010-6 enhances and clarifies existing fair value measurement disclosure requirements and is effective for interim and annual periods beginning after December 15, 2009. The Fund is currently evaluating the impact, if any, of applying the provisions of ASU No. 2010-6.
18. SUBSEQUENT EVENTS
The Fund has evaluated subsequent events through February 10, 2010, the issuance date of the financial statements and determined that no events have occurred that require disclosure.
| | | | |
| ABBREVIATIONS | | | | |
| Counterparty | | Currency | | Selected Portfolio |
| BOFA - Bank of America N.A. | | EUR - EUR | | ADR - American Depository Receipt |
| BZWS - Barclays Bank PLC | | GBP - British Pound | | DIP - Debtor-in-Possession |
| DBAB - Deutsche Bank AG | | USD - United States Dollar | | FHLB - Federal Home Loan Bank |
| FBCO - Credit Suisse International | | | | FRN - Floating Rate Note |
| HAND - Svenska Handelsbanken | | | | PC - Participation Certificate |
| HSBC - HSBC Bank USA | | | | PIK - Payment-In-Kind |
| SSBT - State Street Bank and Trust Co., N.A. | | | | |
MGD-38
Franklin Templeton Variable Insurance Products Trust
Mutual Global Discovery Securities Fund
Report of Independent Registered Public Accounting Firm
To the Board of Trustees and Shareholders of Franklin Templeton Variable Insurance Products Trust
In our opinion, the accompanying statement of assets and liabilities, including the statement of investments, and the related statements of operations and of changes in net assets and the financial highlights present fairly, in all material respects, the financial position of Mutual Global Discovery Securities Fund, formerly Mutual Discovery Securities Fund (one of the funds constituting the Franklin Templeton Variable Insurance Products Trust, hereafter referred to as the “Fund”) at December 31, 2009, the results of its operations for the year then ended, the changes in its net assets and the financial highlights for the periods presented, in conformity with accounting principles generally accepted in the United States of America. These financial statements and financial highlights (hereafter referred to as “financial statements”) are the responsibility of the Fund’s management. Our responsibility is to express an opinion on these financial statements based on our audits. We conducted our audits of these financial statements in accordance with the standards of the Public Company Accounting Oversight Board (United States). Those standards require that we plan and perform the audit to obtain reasonable assurance about whether the financial statements are free of material misstatement. An audit includes examining, on a test basis, evidence supporting the amounts and disclosures in the financial statements, assessing the accounting principles used and significant estimates made by management, and evaluating the overall financial statement presentation. We believe that our audits, which included confirmation of securities at December 31, 2009 by correspondence with the custodian and brokers, provide a reasonable basis for our opinion.
PricewaterhouseCoopers LLP
San Francisco, California
February 10, 2010
MGD-39
Franklin Templeton Variable Insurance Products Trust
Tax Designation (unaudited)
Mutual Global Discovery Securities Fund
Under Section 854(b)(2) of the Internal Revenue Code (Code), the Fund designates 9.65% of the ordinary income dividends as income qualifying for the dividends received deduction for the fiscal year ended December 31, 2009.
At December 31, 2009, more than 50% of the Fund’s total assets were invested in securities of foreign issuers. In most instances, foreign taxes were withheld from income paid to the Fund on these investments. The Fund elects to treat foreign taxes paid as allowed under Section 853 of the Code. This election will allow shareholders of record as of the 2010 (future distribution) distribution date, to treat their proportionate share of foreign taxes paid by the Fund as having been paid directly by them. The shareholder shall consider these amounts as foreign taxes paid in the tax year in which they receive the Fund distribution.
MGD-40
MUTUAL INTERNATIONAL SECURITIES FUND
We are pleased to bring you Mutual International Securities Fund’s annual report for the period from inception on June 15, 2009, through December 31, 2009.
Performance Summary as of 12/31/09
Aggregate total return of Class 4 shares* represents the change in value, assuming reinvestment of dividends and capital gains. Because the Fund has existed for less than one year, average annual total returns are not available.
Periods ended 12/31/09
| | |
| | | Inception
(6/15/09) |
Aggregate Total Return | | +23.76% |
*The investment manager and administrator have contractually agreed to waive or limit their respective fees and to assume as their own expense certain expenses otherwise payable by the Fund, so that common expenses (i.e., a combination of investment management fees, fund administration fees, and other expenses, but excluding Rule 12b-1 fees) do not exceed 0.95% (other than certain nonroutine expenses or costs, including those relating to litigation, indemnification, reorganizations and liquidations) until 4/30/10. If the manager and administrator had not waived fees, the Fund’s total return would have been lower.
Total Return Index Comparison for a Hypothetical $10,000 Investment (6/15/09–12/31/09)
The graph below shows the change in value of a hypothetical $10,000 investment in the Fund over the indicated period and includes reinvestment of any income or distributions. The Fund’s performance* is compared to the performance of the Morgan Stanley Capital International (MSCI) Europe, Australasia, Far East (EAFE) Index Net Return (Local Currency). One cannot invest directly in an index, and an index is not representative of the Fund’s portfolio. Please see Important Notes to Performance Information preceding the Fund Summaries.
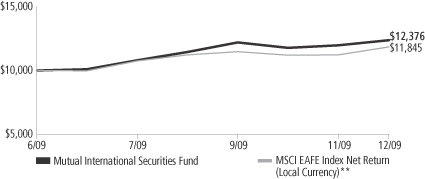
**Source: © 2009 Morningstar. Please see Index Descriptions following the Fund Summaries.
Mutual International Securities Fund – Class 4
Performance reflects the Fund’s Class 4 operating expenses, but does not include any contract fees, expenses or sales charges. If they had been included, performance would be lower. These charges and deductions, particularly for variable life policies, can have a significant effect on contract values and insurance benefits. See the contract prospectus for a complete description of these expenses, including sales charges.
Performance data represent past performance, which does not guarantee future results. Investment return and principal value will fluctuate, and you may have a gain or loss when you sell your shares.
Current performance may differ from figures shown.
MI-1
Fund Goals and Main Investments: Mutual International Securities Fund seeks capital appreciation, which may occasionally be short term, with income as a secondary goal. The Fund normally invests at least 80% of its net assets in securities of non-U.S. issuers and invests primarily in equity securities that the manager believes are undervalued. The Fund also invests, to a lesser extent, in risk arbitrage securities and distressed companies.
Performance Overview
You can find the Fund’s total return since inception in the Performance Summary. The Fund outperformed its benchmark, the MSCI EAFE Index Net Return (Local Currency), which had a +17.04% total return for the same period.1
Economic and Market Overview
Equity markets entered 2009 largely pricing in a possible economic depression and systemic solvency crisis, scenarios that were ultimately averted by one of the most aggressive global policy responses in financial history. As government monetary and fiscal intervention began to gain traction toward the end of the first quarter, equities bottomed and largely reversed their decline, economic growth stabilized and rebounded, and largely confidence was rekindled as investors began to believe the global financial system was finally on the mend. Global equities rallied 73% from their March lows, led by the riskier, lower quality stocks that had been most vulnerable to a systemic meltdown or funding collapse.2 Emerging market economies fueled the recovery as governments aggressively incentivized lending and consumption, resulting in a dramatic statistical recovery that laid the groundwork for the developing world’s best annual equity rally on record. Growing demand from emerging markets supported commodity prices, which also posted record gains during the year. For most of the year, the fading U.S. dollar also helped underpin the rally in hard assets, while continued euro and yen strength created headwinds for regional recoveries.
Nonetheless, developed economies technically recovered by year-end, with Germany and France leading the eurozone out of a recession and both Japan and the U.S. exiting their longest recessions since World War II. Credit spreads narrowed as access to capital expanded and the private sector significantly reduced debt, though largely by transferring
1. Source: © 2009 Morningstar. One cannot invest directly in an index, and an index is not representative of the Fund’s portfolio. Please see Index Descriptions following the Fund Summaries.
2. As measured by the MSCI All Country (AC) World Index. Source: © 2009 Morningstar. Please see Index Descriptions following the Fund Summaries.
Fund Risks: The Fund’s investments in stocks may offer the potential for long-term gains but can be subject to short-term price fluctuations. Foreign investing, especially in emerging markets, involves additional risks, including currency fluctuations, economic instability, market volatility, and political and social instability. Investments in companies involved in mergers, liquidations, reorganizations and distressed bankruptcy, which may include defaulted debt, involve higher credit and other risks. Smaller and midsize company securities involve special risks, such as relatively small revenues, limited product lines and small market share. The Fund’s prospectus also includes a description of the main investment risks.
MI-2
their liabilities to the public balance sheet. The growing indebtedness of sovereign governments exposed structural weaknesses in places like Dubai, Greece and Ireland, temporarily roiling markets toward the end of the year. Policymakers remained firmly committed to stimulus throughout the period, indicating that deflation worries persisted despite signs of economic stabilization. The U.S. Federal Reserve Board announced its intention to keep the benchmark lending rate “exceptionally low” for an extended period; the new Japanese administration trumpeted its fight against deflation; and even China restated its commitment to “moderately loose” policy. Still, policymakers began discussing exit strategies by period-end as interest rates remained at record lows and economic indicators rebounded.
Investment Strategy
At Mutual Series, we are committed to our distinctive value approach to investing. Our major investment strategy is investing in undervalued stocks in Asia and Europe. When selecting undervalued equities, we are attracted to fundamentally strong companies with healthy balance sheets, high-quality assets, substantial free cash flow and shareholder-oriented management teams and whose stocks are trading at discounts to our assessment of the companies’ intrinsic or business value. We also look for asset rich companies whose shares may be trading at depressed levels due to concerns over short-term earnings disappointments, litigation, management strategy or other perceived negatives. While the vast majority of our undervalued equity investments are made in publicly traded companies internationally, we may invest occasionally in privately held companies as well.
We complement this more traditional investment strategy with two others. One is distressed investing, which is complex and can take many forms. The most common distressed investment the Fund undertakes is the purchase of financially troubled or bankrupt companies’ debt at a substantial discount to face value. After the financially distressed company is reorganized, often in bankruptcy court, the old debt is typically replaced with new securities issued by the financially stronger company.
The other piece of our investment strategy is participating in arbitrage situations, another highly specialized field. When companies announce proposed mergers or takeovers, commonly referred to as “deals,” the target company may trade at a discount to the bid it ultimately accepts. One form of arbitrage involves purchasing the target company’s stock
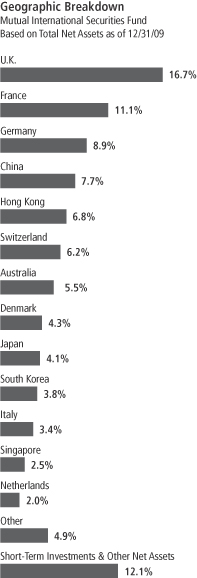
MI-3
when it is trading below the value we believe it would receive in a deal. In keeping with our commitment to a relatively conservative investment approach, we typically focus our arbitrage efforts on announced deals, and eschew rumored deals or other situations we consider relatively risky.
In addition, it is our practice to hedge the Fund’s currency exposure when we deem it advantageous for our shareholders.
Manager’s Discussion
During the period under review, the Fund outperformed its benchmark index with the help of several investments. Three of the largest contributors during the period were Chinese economy hotel operator Home Inns & Hotels Management (sold by period-end); German automotive manufacturer Daimler; and VisionChina Media, which operates a vast advertising network of digital television displays primarily within China’s bus and subway transportation systems.
Home Inns & Hotels is China’s leading business hotel chain. We saw value embedded in the company’s portfolio of newly built hotels, many of whose businesses had yet to mature. Given an abundant number of owners of large and small businesses increasingly traveling around China in an effort to grow their franchises, Home Inns & Hotels was able to expand rapidly by bringing newly built hotels to profitability quickly. When investors recognized this situation, the company’s stock price rose sharply, allowing us to take profits on our holdings.
Daimler made sizable gains during the period, following second and third quarter 2009 results that beat market expectations. In particular, solid cash generation lifted the company’s net industrial liquidity significantly above consensus estimates. At period-end, we believed the stock still harbored meaningful appreciation potential as Daimler management continues to implement its cost reduction strategy, and as its end-markets begin to improve from the low levels reached during the global recession.
VisionChina Media provides content for televisions mounted in Chinese mass transit services in about 20 major cities. It pays local TV networks for exclusive rights to stream that content into its network of more than 81,000 TVs, and then charges advertisers for space, just as a TV network would. Fast-moving consumer goods companies have found this advertising to be very successful as it catches the consumer en route, closer to the point of sale. As the advertisements are streaming,
Top 10 Sectors/Industries
Mutual International Securities Fund
Based on Equity Securities
12/31/09
| | |
| | | % of Total
Net Assets |
| Insurance | | 9.0% |
| Food Products | | 8.2% |
| Commercial Banks | | 6.4% |
| Media | | 5.9% |
| Food & Staples Retailing | | 5.8% |
| Multi-Utilities | | 3.6% |
| Diversified Financial Services | | 3.5% |
| Wireless Telecommunication Services | | 3.2% |
| Electric Utilities | | 3.0% |
| Capital Markets | | 2.9% |
MI-4
they can also be used to promote special sale items instantly, unlike traditional outdoor advertising billboards. After the 2008 Beijing Olympics, VisionChina’s stock reacted positively to its resilient 2009 earnings. In our view, however, its share price does not yet reflect the potential increase in advertising demand that could result from either the Shanghai World Trade Fair or the company’s acquisition of a major competitor.
Among the top detractors from the Fund’s performance during the period were China Digital TV Holding (CDTV), Swiss asset manager UBS and Japanese video game and handheld device maker Nintendo.
CDTV controls over 50% of China’s Conditional Access Card (CAC) market. CACs provide the encryption that allows set-top boxes to talk to the cable companies that provide televised content. In our view, CDTV is an investment in China’s growing population of TV viewers and the government-mandated switch to an all-digital signal from analog by 2015. The business suffered from uncertainty surrounding consolidation of China’s fragmented cable industry, causing CAC shipments to stagnate. However, as 2015 approaches, we see the inevitable need for CACs and believe CDTV is one of the companies best positioned to benefit from the trend.
We began accumulating shares of UBS in the summer of 2009 and continued to selectively do so as its share price weakened through year-end. With its leading global wealth management platform, UBS could be a big beneficiary of customers’ willingness to convert savings to investments. In addition, we think the earnings from UBS’s wealth management division could offset any slippage that might come from the investment bank, as it underperformed its peers during 2009’s robust fixed income market advance.
Nintendo is one of the world’s largest producers of entertainment hardware and software. During 2009, its share price was negatively impacted by lower-than-expected sales of Wii gaming consoles. In addition to lower Wii sales, stronger-than-expected currency appreciation of the Japanese yen versus the U.S. dollar during Nintendo’s fiscal first half (ended September 30, 2009) caused the company to lower its sales and profit estimates. Nintendo retains the leading market share in console-based and portable gaming devices, and its software business has produced many of the top selling games of all time. The company’s balance sheet is strong, with net cash and equivalents making up over 30% of its market capitalization. At period-end, we believed the stock
Top 10 Holdings
Mutual International Securities Fund
12/31/09
| | |
Company
Sector/Industry,
Country | | % of Total
Net Assets |
| Sinomedia Holding Ltd. | | 2.0% |
| Media, China | | |
Intesa Sanpaolo SpA,
ord. & di Risp | | 2.0% |
| Commercial Banks, Italy | | |
| Aiful Corp., senior note, 144A, 4.45%, 2/16/10 | | 1.9% |
| Corporate Bonds & Notes, Japan | | |
| REXLot Holdings, Ltd., fgn. | | 1.9% |
| Hotels, Restaurants & Leisure, Bermuda | | |
| Vodafone Group PLC | | 1.7% |
| Wireless Telecommunication Services, U.K. | | |
| Zurich Financial Services AG | | 1.7% |
| Insurance, Switzerland | | |
| China Fishery Group Ltd. | | 1.7% |
| Food Products, China | | |
| Nestle SA | | 1.6% |
| Food Products, Switzerland | | |
| Cadbury PLC | | 1.6% |
| Food Products, U.K. | | |
| Cable & Wireless PLC | | 1.6% |
| Diversified Telecommunication Services, U.K. |
The dollar value, number of shares or principal amount, and names of all portfolio holdings are listed in the Fund’s Statement of Investments.
MI-5
stood to further benefit from the already large, installed base of Nintendo-branded devices.
Finally, investors should note that we maintained our currency hedging posture of being generally hedged to the U.S. dollar for most of our non-U.S. holdings. Since the dollar was weaker compared with most foreign currencies during the reporting period, our hedging strategy negatively impacted performance.
Thank you for your participation in Mutual International Securities Fund. We look forward to serving your future investment needs.
The foregoing information reflects our analysis, opinions and portfolio holdings as of December 31, 2009, the end of the reporting period. The way we implement our main investment strategies and the resulting portfolio holdings may change depending on factors such as market and economic conditions. These opinions may not be relied upon as investment advice or an offer for a particular security. The information is not a complete analysis of every aspect of any market, country, industry, security or the Fund. Statements of fact are from sources considered reliable, but the investment manager makes no representation or warranty as to their completeness or accuracy. Although historical performance is no guarantee of future results, these insights may help you understand our investment management philosophy.
MI-6
Fund Expenses
As an investor in a variable insurance contract (Contract) that indirectly provides for investment in an underlying mutual fund, you can incur transaction and/or ongoing expenses at both the Fund level and the Contract level.
| • | | Transaction expenses can include sales charges (loads) on purchases, redemption fees, surrender fees, transfer fees and premium taxes. |
| • | | Ongoing expenses can include management fees, distribution and service (12b-1) fees, contract fees, annual maintenance fees, mortality and expense risk fees and other fees and expenses. All mutual funds and Contracts have some types of ongoing expenses. |
The expenses shown in the table are meant to highlight ongoing expenses at the Fund level only and do not include ongoing expenses at the Contract level, or transaction expenses at either the Fund or Contract level. While the Fund does not have transaction expenses, if the transaction and ongoing expenses at the Contract level were included, the expenses shown below would be higher. You should consult your Contract prospectus or disclosure document for more information.
The table shows Fund-level ongoing expenses and can help you understand these expenses and compare them with those of other mutual funds offered through the Contract. The table assumes a $1,000 investment held for the six months indicated. Please refer to the Fund prospectus for additional information on operating expenses.
Actual Fund Expenses
The first line (Actual) of the table provides actual account values and expenses. The “Ending Account Value” is derived from the Fund’s actual return, which includes the effect of ongoing Fund expenses, but does not include the effect of ongoing Contract expenses.
You can estimate the Fund-level expenses you incurred during the period by following these steps. Of course, your account value and expenses will differ from those in this illustration:
| 1. | Divide your account value by $1,000. |
If an account had an $8,600 value, then $8,600 ÷ $1,000 = 8.6.
| 2. | Multiply the result by the number under the heading “Fund-Level Expenses Incurred During Period.” |
If Fund-Level Expenses Incurred During Period were $7.50, then 8.6 x $7.50 = $64.50.
In this illustration, the estimated expenses incurred this period at the Fund level are $64.50.
Mutual International Securities Fund – Class 4
MI-7
Hypothetical Example for Comparison with Other Mutual Funds
Information in the second line (Hypothetical) of the table can help you compare ongoing expenses of the Fund with those of other mutual funds offered through the Contract. This information may not be used to estimate the actual ending account balance or expenses you incurred during the period. The hypothetical “Ending Account Value” is based on the Fund’s actual expense ratio and an assumed 5% annual rate of return before expenses, which does not represent the Fund’s actual return. The figure under the heading “Fund-Level Expenses Incurred During Period” shows the hypothetical expenses your account would have incurred under this scenario. You can compare this figure with the 5% hypothetical examples that appear in shareholder reports of other funds offered through a Contract.
| | | | | | | | | |
| Class 4 | | Beginning
Account Value 7/1/09 | | Ending Account Value 12/31/09 | | Fund-Level
Expenses Incurred
During Period*
7/1/09–12/31/09 |
Actual | | $ | 1,000 | | $ | 1,225.40 | | $ | 7.35 |
Hypothetical (5% return before expenses) | | $ | 1,000 | | $ | 1,018.60 | | $ | 6.67 |
*Expenses are calculated using the most recent six-month annualized expense ratio, net of expense waivers, for the Fund’s Class 4 shares (1.31%), which does not include any ongoing expenses of the Contract for which the Fund is an investment option, multiplied by the average account value over the period, multiplied by 184/365 to reflect the one-half year period.
MI-8
Franklin Templeton Variable Insurance Products Trust
Financial Highlights
Mutual International Securities Fund
| | | | |
| Class 2 | | Period Ended
December 31, 2009a | |
| | | | |
Per share operating performance | | | | |
(for a share outstanding throughout the period) | | | | |
Net asset value, beginning of period | | $ | 10.00 | |
| | | | |
Income from investment operationsb: | | | | |
Net investment incomec | | | 0.08 | |
Net realized and unrealized gains (losses) | | | 2.30 | |
| | | | |
Total from investment operations | | | 2.38 | |
| | | | |
Less distributions from: | | | | |
Net investment income | | | (0.13 | ) |
Net realized gains | | | (0.43 | ) |
| | | | |
Total distributions | | | (0.56 | ) |
| | | | |
Net asset value, end of period | | $ | 11.82 | |
| | | | |
| |
Total returnd | | | 23.91% | |
Ratios to average net assetse | | | | |
Expenses before waiver and payments by affiliatesf,g | | | 8.61% | |
Expenses net of waiver and payments by affiliatesf,g | | | 1.21% | |
Expenses - excluding dividend expense on securities sold short: | | | | |
Expenses before waiver and payments by affiliatef | | | 8.60% | |
Expenses net of waiver and payments by affiliatesf | | | 1.20% | |
Net investment income | | | 1.27% | |
| |
Supplemental data | | | | |
Net assets, end of period (000’s) | | $ | 1,182 | |
Portfolio turnover rate | | | 41.84% | |
aFor the period June 15, 2009 (commencement of operations) to December 31, 2009.
bThe amount shown for a share outstanding throughout the period may not correlate with the Statement of Operations for the period due to the timing of sales and repurchases of the Fund shares in relation to income earned and/or fluctuating market value of the investments of the Fund.
cBased on average daily shares outstanding.
dTotal return does not include any fees, charges or expenses imposed by the variable annuity and life insurance contracts for which the Franklin Templeton Variable Insurance Products Trust serves as an underlying investment vehicle. Total return is not annualized for periods less than one year.
eRatios are annualized for periods less than one year.
fBenefit of expense reduction rounds to less than 0.01%.
gIncludes dividend expense on securities sold short which varies from period to period. See below for expense ratios that reflect only operating expenses.
The accompanying notes are an integral part of these financial statements.
MI-9
Franklin Templeton Variable Insurance Products Trust
Financial Highlights (continued)
Mutual International Securities Fund
| | | | |
| | | Period Ended
December 31, 2009a | |
| Class 4 | | | |
Per share operating performance | | | | |
(for a share outstanding throughout the period) | | | | |
Net asset value, beginning of period | | $ | 10.00 | |
| | | | |
Income from investment operationsb: | | | | |
Net investment incomec | | | 0.07 | |
Net realized and unrealized gains (losses) | | | 2.29 | |
| | | | |
Total from investment operations | | | 2.36 | |
| | | | |
Less distributions from: | | | | |
Net investment income | | | (0.12 | ) |
Net realized gains | | | (0.43 | ) |
| | | | |
Total distributions | | | (0.55 | ) |
| | | | |
Net asset value, end of period | | $ | 11.81 | |
| | | | |
| |
Total returnd | | | 23.76% | |
Ratios to average net assetse | | | | |
Expenses before waiver and payments by affiliatesf,g | | | 8.71% | |
Expenses net of waiver and payments by affiliatesf,g | | | 1.31% | |
Expenses - excluding dividend expense on securities sold short: | | | | |
Expenses before waiver and payments by affiliatesf | | | 8.70% | |
Expenses net of waiver and payments by affiliatesf | | | 1.30% | |
Net investment income | | | 1.17% | |
| |
Supplemental data | | | | |
Net assets, end of period (000’s) | | $ | 1,181 | |
Portfolio turnover rate | | | 41.84% | |
aFor the period June 15, 2009 (commencement of operations) to December 31, 2009.
bThe amount shown for a share outstanding throughout the period may not correlate with the Statement of Operations for the period due to the timing of sales and repurchases of the Fund shares in relation to income earned and/or fluctuating market value of the investments of the Fund.
cBased on average daily shares outstanding.
dTotal return does not include any fees, charges or expenses imposed by the variable annuity and life insurance contracts for which the Franklin Templeton Variable Insurance Products Trust serves as an underlying investment vehicle. Total return is not annualized for periods less than one year.
eRatios are annualized for periods less than one year.
fBenefit of expense reduction rounds to less than 0.01%.
gIncludes dividend expense on securities sold short which varies from period to period. See below for expense ratios that reflect only operating expenses.
The accompanying notes are an integral part of these financial statements.
MI-10
Franklin Templeton Variable Insurance Products Trust
Statement of Investments, December 31, 2009
| | | | | | | |
| Mutual International Securities Fund | | Country | | Shares | | Value |
Common Stocks 86.9% | | | | | | | |
Air Freight & Logistics 1.7% | | | | | | | |
Sinotrans Ltd., H | | China | | 88,000 | | $ | 23,153 |
TNT NV | | Netherlands | | 530 | | | 16,311 |
| | | | | | | |
| | | | | | | 39,464 |
| | | | | | | |
Automobiles 1.3% | | | | | | | |
Daimler AG | | Germany | | 564 | | | 30,009 |
| | | | | | | |
Beverages 2.2% | | | | | | | |
Carlsberg AS, B | | Denmark | | 399 | | | 29,474 |
Pernod Ricard SA | | France | | 275 | | | 23,583 |
| | | | | | | |
| | | | | | | 53,057 |
| | | | | | | |
Capital Markets 2.9% | | | | | | | |
Deutsche Bank AG | | Germany | | 59 | | | 4,187 |
ISIS Asset Management PLC | | United Kingdom | | 23,340 | | | 28,501 |
Man Group PLC | | United Kingdom | | 4,832 | | | 24,024 |
aUBS AG | | Switzerland | | 723 | | | 11,210 |
| | | | | | | |
| | | | | | | 67,922 |
| | | | | | | |
Chemicals 0.8% | | | | | | | |
Linde AG | | Germany | | 159 | | | 19,155 |
| | | | | | | |
Commercial Banks 6.4% | | | | | | | |
Barclays PLC | | United Kingdom | | 6,111 | | | 27,219 |
BNP Paribas | | France | | 371 | | | 29,687 |
aIntesa Sanpaolo SpA | | Italy | | 7,596 | | | 34,251 |
Intesa Sanpaolo SpA, di Risp | | Italy | | 3,977 | | | 13,350 |
aJyske Bank AS | | Denmark | | 936 | | | 36,461 |
Societe Generale, A | | France | | 160 | | | 11,211 |
| | | | | | | |
| | | | | | | 152,179 |
| | | | | | | |
Communications Equipment 0.7% | | | | | | | |
Tandberg ASA | | Norway | | 566 | | | 16,112 |
| | | | | | | |
Computers & Peripherals 1.0% | | | | | | | |
China Digital TV Holding Co., ADR | | China | | 3,990 | | | 24,299 |
| | | | | | | |
Construction & Engineering 0.6% | | | | | | | |
aBoart Longyear Group | | Australia | | 41,289 | | | 13,153 |
| | | | | | | |
Construction Materials 2.5% | | | | | | | |
CRH PLC | | Ireland | | 1,268 | | | 34,505 |
SA des Ciments Vicat | | France | | 297 | | | 24,998 |
| | | | | | | |
| | | | | | | 59,503 |
| | | | | | | |
Containers & Packaging 0.0%b | | | | | | | |
Rexam PLC | | United Kingdom | | 18 | | | 84 |
| | | | | | | |
Diversified Financial Services 3.5% | | | | | | | |
Deutsche Boerse AG | | Germany | | 388 | | | 32,213 |
First Pacific Co. Ltd. | | Hong Kong | | 39,752 | | | 24,301 |
Guoco Group Ltd. | | Hong Kong | | 2,500 | | | 26,681 |
| | | | | | | |
| | | | | | | 83,195 |
| | | | | | | |
Diversified Telecommunication Services 1.6% | | | | | | | |
Cable & Wireless PLC | | United Kingdom | | 16,660 | | | 38,051 |
| | | | | | | |
MI-11
Franklin Templeton Variable Insurance Products Trust
Statement of Investments, December 31, 2009 (continued)
| | | | | | | |
| Mutual International Securities Fund | | Country | | Shares | | Value |
Common Stocks (continued) | | | | | | | |
Electric Utilities 3.0% | | | | | | | |
E.ON AG | | Germany | | 821 | | $ | 34,211 |
Iride SpA | | Italy | | 5,718 | | | 10,886 |
Prime Infrastructure Group | | Australia | | 6,987 | | | 25,894 |
| | | | | | | |
| | | | | | | 70,991 |
| | | | | | | |
Electrical Equipment 1.0% | | | | | | | |
Alstom SA | | France | | 334 | | | 23,456 |
| | | | | | | |
Electronic Equipment, Instruments & Component 0.8% | | | | | | | |
aHollysys Automation Technologies Ltd. | | United States | | 1,500 | | | 18,015 |
| | | | | | | |
Food & Staples Retailing 5.8% | | | | | | | |
aAWB Ltd. | | Australia | | 25,887 | | | 26,250 |
Familymart Co. Ltd. | | Japan | | 825 | | | 24,356 |
Koninklijke Ahold NV | | Netherlands | | 2,404 | | | 31,866 |
Lawson Inc. | | Japan | | 556 | | | 24,517 |
Shinsegae Food System Co. Ltd. | | South Korea | | 439 | | | 29,252 |
| | | | | | | |
| | | | | | | 136,241 |
| | | | | | | |
Food Products 8.2% | | | | | | | |
Cadbury PLC | | United Kingdom | | 2,970 | | | 38,186 |
aChina Fishery Group Ltd. | | China | | 40,132 | | | 39,404 |
Danone | | France | | 294 | | | 18,025 |
Lotte Confectionery Co. Ltd. | | South Korea | | 31 | | | 34,268 |
Nestle SA | | Switzerland | | 801 | | | 38,845 |
Nong Shim Co. Ltd. | | South Korea | | 119 | | | 25,411 |
| | | | | | | |
| | | | | | | 194,139 |
| | | | | | | |
Hotels, Restaurants & Leisure 2.8% | | | | | | | |
Accor SA | | France | | 428 | | | 23,434 |
REXLot Holdings Ltd., fgn | | Bermuda | | 390,918 | | | 43,863 |
| | | | | | | |
| | | | | | | 67,297 |
| | | | | | | |
Household Durables 1.4% | | | | | | | |
aBerkeley Group Holdings PLC | | United Kingdom | | 2,524 | | | 33,797 |
| | | | | | | |
Industrial Conglomerates 2.8% | | | | | | | |
Jardine Matheson Holdings Ltd. | | Hong Kong | | 473 | | | 14,275 |
Jardine Strategic Holdings Ltd. | | Hong Kong | | 864 | | | 15,207 |
Siemens AG | | Germany | | 387 | | | 35,659 |
| | | | | | | |
| | | | | | | 65,141 |
| | | | | | | |
Insurance 9.0% | | | | | | | |
Austbrokers Holdings Ltd. | | Australia | | 6,367 | | | 30,567 |
AXA SA | | France | | 813 | | | 19,249 |
Brit Insurance Holdings NV | | United Kingdom | | 7,286 | | | 23,031 |
Catlin Group Ltd. | | United Kingdom | | 4,631 | | | 25,485 |
cCNinsure Inc., ADR | | China | | 810 | | | 16,265 |
Hiscox Ltd. | | United Kingdom | | 120 | | | 615 |
Lancashire Holdings Ltd. | | United Kingdom | | 2,925 | | | 20,954 |
aResolution Ltd. | | United Kingdom | | 16,390 | | | 23,747 |
aTower Australia Group Ltd. | | Australia | | 4,917 | | | 12,619 |
Zurich Financial Services AG | | Switzerland | | 185 | | | 40,477 |
| | | | | | | |
| | | | | | | 213,009 |
| | | | | | | |
Machinery 1.5% | | | | | | | |
Schindler Holding AG, PC | | Switzerland | | 456 | | | 35,087 |
| | | | | | | |
MI-12
Franklin Templeton Variable Insurance Products Trust
Statement of Investments, December 31, 2009 (continued)
| | | | | | | |
| Mutual International Securities Fund | | Country | | Shares | | Value |
Common Stocks (continued) | | | | | | | |
Marine 1.5% | | | | | | | |
A P Moller - Maersk AS | | Denmark | | 5 | | $ | 35,204 |
| | | | | | | |
Media 5.9% | | | | | | | |
Eutelsat Communications | | France | | 785 | | | 25,238 |
Seven Network Ltd. | | Australia | | 5,437 | | | 33,713 |
Sinomedia Holding Ltd. | | China | | 154,017 | | | 48,070 |
aVisionChina Media Inc., ADR | | China | | 2,960 | | | 32,324 |
| | | | | | | |
| | | | | | | 139,345 |
| | | | | | | |
Metals & Mining 0.4% | | | | | | | |
cBHP Billiton PLC, ADR | | United Kingdom | | 160 | | | 10,216 |
| | | | | | | |
Multi-Utilities 3.6% | | | | | | | |
Enia SpA | | Italy | | 2,807 | | | 21,256 |
GDF Suez | | France | | 758 | | | 32,860 |
RWE AG | | Germany | | 326 | | | 31,840 |
| | | | | | | |
| | | | | | | 85,956 |
| | | | | | | |
Oil, Gas & Consumable Fuels 1.7% | | | | | | | |
Royal Dutch Shell PLC, A | | United Kingdom | | 283 | | | 8,547 |
Total SA, B | | France | | 480 | | | 30,923 |
| | | | | | | |
| | | | | | | 39,470 |
| | | | | | | |
Pharmaceuticals 0.9% | | | | | | | |
Novartis AG | | Switzerland | | 386 | | | 21,068 |
| | | | | | | |
Real Estate Investment Trust (REIT) 1.2% | | | | | | | |
The Link REIT | | Hong Kong | | 11,000 | | | 28,118 |
| | | | | | | |
Real Estate Management & Development 2.1% | | | | | | | |
Parkway Life REIT | | Singapore | | 30,000 | | | 26,040 |
Wheelock Properties Ltd. | | Hong Kong | | 35,000 | | | 22,886 |
| | | | | | | |
| | | | | | | 48,926 |
| | | | | | | |
Software 2.2% | | | | | | | |
Nintendo Co. Ltd. | | Japan | | 100 | | | 23,704 |
aRCG Holdings Ltd. | | Hong Kong | | 22,000 | | | 29,168 |
| | | | | | | |
| | | | | | | 52,872 |
| | | | | | | |
Thrifts & Mortgage Finance 0.2% | | | | | | | |
Paragon Group Cos. PLC | | United Kingdom | | 2,235 | | | 4,736 |
| | | | | | | |
Tobacco 2.5% | | | | | | | |
British American Tobacco PLC | | United Kingdom | | 1,081 | | | 35,210 |
Japan Tobacco Inc. | | Japan | | 7 | | | 23,564 |
| | | | | | | |
| | | | | | | 58,774 |
| | | | | | | |
Wireless Telecommunication Services 3.2% | | | | | | | |
MobileOne Ltd. | | Singapore | | 25,000 | | | 33,618 |
Vodafone Group PLC | | United Kingdom | | 17,696 | | | 41,032 |
| | | | | | | |
| | | | | | | 74,650 |
| | | | | | | |
Total Common Stocks (Cost $1,767,137) | | | | | | | 2,052,691 |
| | | | | | | |
Preferred Stocks (Cost $22,242) 0.9% | | | | | | | |
Automobiles 0.9% | | | | | | | |
Porsche Automobile Holding SE, pfd. | | Germany | | 357 | | | 22,127 |
| | | | | | | |
MI-13
Franklin Templeton Variable Insurance Products Trust
Statement of Investments, December 31, 2009 (continued)
| | | | | | | | | |
| Mutual International Securities Fund | | Country | | Principal
Amountd | | | Value | |
Corporate Bonds and Notes (Cost $12,987) 0.5% | | | | | | | | | |
e,fBank of Ireland Holdings PLC, sub. note, FRN, 7.40%, Perpetual | | United Kingdom | | 14,000 | EUR | | $ | 11,323 | |
| | | | | | | | | |
Total Investments before Short Term Investments
(Cost $1,802,366) | | | | | | | | 2,086,141 | |
| | | | | | | | | |
Short Term Investments (Cost $43,419) 1.9% | | | | | | | | | |
Corporate Bonds and Notes 1.9% | | | | | | | | | |
gAiful Corp., senior note, 144A, 4.45%, 2/16/10 | | Japan | | 48,000 | | | | 46,080 | |
| | | | | | | | | |
Total Investments (Cost $1,845,785) 90.2% | | | | | | | | 2,132,221 | |
Securities Sold Short (0.4)% | | | | | | | | (10,721 | ) |
Other Assets, less Liabilities 10.2% | | | | | | | | 241,311 | |
| | | | | | | | | |
Net Assets 100.0% | | | | | | | $ | 2,362,811 | |
| | | | | | | | | |
| | | |
| | | | | Shares | | | | |
hSecurities Sold Short (Proceeds $9,284) (0.4)% | | | | | | | | | |
Metals & Mining (0.4)% | | | | | | | | | |
BHP Billiton Ltd., ADR | | Australia | | 140 | | | | (10,721 | ) |
| | | | | | | | | |
aNon-income producing.
bRounds to less than 0.1% of net assets.
cSecurity or a portion of the security has been segregated as collateral for securities sold short. At December 31, 2009, the aggregate value of these securities and/or cash pledged amounted to $63,943.
dThe principal amount is stated in U.S. dollars unless otherwise indicated.
eThe coupon rate shown represents the rate at period end.
fPerpetual security with no stated maturity date.
gSecurity was purchased pursuant to Rule 144A under the Securities Act of 1933 and may be sold in transactions exempt from registration only to qualified institutional buyers or in a public offering registered under the Securities Act of 1933. This security has been deemed liquid under guidelines approved by the Trust’s Board of Trustees. At December 31, 2009, the value of this security was $46,080, representing 1.95% of net assets.
hSee Note 1(d) regarding securities sold short.
MI-14
Franklin Templeton Variable Insurance Products Trust
Statement of Investments, December 31, 2009 (continued)
|
| Mutual International Securities Fund |
At December 31, 2009, the Fund had the following forward exchange contracts outstanding. See Note 1(c).
| | | | | | | | | | | | | | | | | | |
| Currency | | Counterparty | | Type | | Quantity | | Contract
Amount | | Settlement
Date | | Unrealized
Appreciation | | Unrealized
Depreciation | |
British Pound | | BOFA | | Sell | | 22,900 | | $ | 36,789 | | 1/13/10 | | $ | — | | $ | (198 | ) |
British Pound | | BOFA | | Sell | | 157,300 | | | 262,376 | | 1/13/10 | | | 8,316 | | | — | |
Euro | | SSBT | | Buy | | 90,000 | | | 132,841 | | 1/14/10 | | | — | | | (4,013 | ) |
Euro | | BOFA | | Buy | | 41,300 | | | 59,216 | | 1/14/10 | | | — | | | (98 | ) |
Euro | | SSBT | | Buy | | 64,600 | | | 92,061 | | 1/14/10 | | | 409 | | | — | |
Euro | | SSBT | | Sell | | 557,650 | | | 824,173 | | 1/14/10 | | | 25,943 | | | — | |
Australian Dollar | | SSBT | | Buy | | 2,500 | | | 2,270 | | 1/19/10 | | | — | | | (31 | ) |
Australian Dollar | | SSBT | | Buy | | 95,790 | | | 84,825 | | 1/19/10 | | | 962 | | | — | |
Australian Dollar | | SSBT | | Sell | | 98,290 | | | 90,967 | | 1/19/10 | | | 2,942 | | | — | |
Singapore Dollar | | SSBT | | Sell | | 110,000 | | | 78,862 | | 3/24/10 | | | 665 | | | — | |
Japanese Yen | | SSBT | | Sell | | 5,300,000 | | | 59,995 | | 4/20/10 | | | 2,954 | | | — | |
Danish Krone | | SSBT | | Sell | | 320,000 | | | 63,299 | | 4/23/10 | | | 1,824 | | | — | |
Swiss Franc | | SSBT | | Sell | | 98,500 | | | 92,750 | | 5/10/10 | | | — | | | (2,496 | ) |
Swiss Franc | | BOFA | | Sell | | 33,000 | | | 31,857 | | 5/10/10 | | | — | | | (52 | ) |
| | | | | | | | | | | | | | | |
Unrealized appreciation (depreciation) | | | | | | | | | | 44,015 | | | (6,888 | ) |
| | | | | | | | | | | | | | | |
Net unrealized appreciation (depreciation) | | | | | | | | | $ | 37,127 | | | | |
| | | | | | | | | | | | | | | | | | |
See abbreviations on page MI-26
The accompanying notes are an integral part of these financial statements.
MI-15
Franklin Templeton Variable Insurance Products Trust
Financial Statements
Statement of Assets and Liabilities
December 31, 2009
| | | | |
| | | Mutual
International
Securities Fund | |
Assets: | | | | |
Investments in securities: | | | | |
Cost | | $ | 1,845,785 | |
| | | | |
Value | | $ | 2,132,221 | |
Cash | | | 149,971 | |
Foreign currency, at value (cost $5,869) | | | 5,902 | |
Receivables: | | | | |
Investment securities sold | | | 15,466 | |
Dividends and interest | | | 8,134 | |
Due from brokers | | | 37,462 | |
Affiliates | | | 63,378 | |
Offering costs | | | 1,849 | |
Unrealized appreciation on forward exchange contracts | | | 44,015 | |
| | | | |
Total assets | | | 2,458,398 | |
| | | | |
Liabilities: | | | | |
Payables: | | | | |
Professional fees | | | 71,265 | |
Securities sold short, at value (proceeds $9,284) | | | 10,721 | |
Unrealized depreciation on forward exchange contracts | | | 6,888 | |
Accrued expenses and other liabilities | | | 6,713 | |
| | | | |
Total liabilities | | | 95,587 | |
| | | | |
Net assets, at value | | $ | 2,362,811 | |
| | | | |
Net assets consist of: | | | | |
Paid-in capital | | $ | 1,998,124 | |
Distributions in excess of net investment income | | | (11,926 | ) |
Net unrealized appreciation (depreciation) | | | 321,824 | |
Accumulated net realized gain (loss) | | | 54,789 | |
| | | | |
Net assets, at value | | $ | 2,362,811 | |
| | | | |
Class 2: | | | | |
Net assets, at value | | $ | 1,181,547 | |
| | | | |
Shares outstanding | | | 100,000 | |
| | | | |
Net asset value and maximum offering price per share | | $ | 11.82 | |
| | | | |
Class 4: | | | | |
Net assets, at value | | $ | 1,181,264 | |
| | | | |
Shares outstanding | | | 100,000 | |
| | | | |
Net asset value and maximum offering price per share | | $ | 11.81 | |
| | | | |
The accompanying notes are an integral part of these financial statements.
MI-16
Franklin Templeton Variable Insurance Products Trust
Financial Statements (continued)
Statement of Operations
for the period ended December 31, 2009a
| | | | |
| | | Mutual
International
Securities Fund | |
Investment income: | | | | |
Dividends | | $ | 20,289 | |
Interest | | | 10,665 | |
| | | | |
Total investment income | | | 30,954 | |
| | | | |
Expenses: | | | | |
Management fees (Note 3a) | | | 9,975 | |
Administrative fees (Note 3b) | | | 3,117 | |
Distribution fees: (Note 3c) | | | | |
Class 2 | | | 1,559 | |
Class 4 | | | 2,182 | |
Unaffiliated transfer agent fees | | | 27 | |
Custodian fees (Note 4) | | | 553 | |
Reports to shareholders | | | 9,443 | |
Registration and filing fees | | | 1,641 | |
Professional fees | | | 72,460 | |
Amortization of offering costs | | | 2,217 | |
Dividends on securities sold short | | | 115 | |
Other | | | 4,731 | |
| | | | |
Total expenses | | | 108,020 | |
Expense reductions (Note 4) | | | (6 | ) |
Expenses waived/paid by affiliates (Note 3e) | | | (92,315 | ) |
| | | | |
Net expenses | | | 15,699 | |
| | | | |
Net investment income | | | 15,255 | |
| | | | |
Realized and unrealized gains (losses): | | | | |
Net realized gain (loss) from: | | | | |
Investments | | | 173,984 | |
Foreign currency transactions | | | (36,712 | ) |
| | | | |
Net realized gain (loss) | | | 137,272 | |
| | | | |
Net change in unrealized appreciation (depreciation) on: | | | | |
Investments | | | 284,999 | |
Translation of other assets and liabilities denominated in foreign currencies | | | 36,825 | |
| | | | |
Net change in unrealized appreciation (depreciation) | | | 321,824 | |
| | | | |
Net realized and unrealized gain (loss) | | | 459,096 | |
| | | | |
Net increase (decrease) in net assets resulting from operations | | $ | 474,351 | |
| | | | |
aFor the period June 15, 2009 (commencement of operations) to December 31, 2009.
The accompanying notes are an integral part of these financial statements.
MI-17
Franklin Templeton Variable Insurance Products Trust
Financial Statements (continued)
Statement of Changes in Net Assets
| | | | |
| | | Mutual International
Securities Fund | |
| | | Period Ended
December 31, 2009a | |
| | | | |
Increase (decrease) in net assets: | | | | |
Operations: | | | | |
Net investment income | | $ | 15,255 | |
Net realized gain (loss) from investments and foreign currency transactions | | | 137,272 | |
Net change in unrealized appreciation (depreciation) on investments and translation of other assets and liabilities denominated in foreign currencies | | | 321, 824 | |
| | | | |
Net increase (decrease) in net assets resulting from operations | | | 474,351 | |
| | | | |
Distributions to shareholders from: | | | | |
Net investment income: | | | | |
Class 2 | | | (12,710 | ) |
Class 4 | | | (12,330 | ) |
Net realized gains: | | | | |
Class 2 | | | (43,250 | ) |
Class 4 | | | (43,250 | ) |
| | | | |
Total distributions to shareholders | | | (111,540 | ) |
| | | | |
Capital share transactions: (Note 2) | | | | |
Class 2 | | | 1,000,000 | |
Class 4 | | | 1,000,000 | |
| | | | |
Total capital share transactions | | | 2,000,000 | |
| | | | |
Net increase (decrease) in net assets | | | 2,362,811 | |
Net assets: | | | | |
Beginning of period | | | — | |
| | | | |
End of period | | $ | 2,362,811 | |
| | | | |
Distributions in excess of net investment income included in net assets: | | | | |
End of period | | $ | (11,926 | ) |
| | | | |
aFor the period June 15, 2009 (commencement of operations) to December 31, 2009.
The accompanying notes are an integral part of these financial statements.
MI-18
Franklin Templeton Variable Insurance Products Trust
Notes to Financial Statements
Mutual International Securities Fund
1. ORGANIZATION AND SIGNIFICANT ACCOUNTING POLICIES
Franklin Templeton Variable Insurance Products Trust (Trust) is registered under the Investment Company Act of 1940, as amended, (1940 Act) as an open-end investment company, consisting of twenty-two separate funds. The Mutual International Securities Fund (Fund) is included in this report. The financial statements of the remaining funds in the Trust are presented separately. Shares of the Fund are generally sold only to insurance company separate accounts to fund the benefits of variable life insurance policies or variable annuity contracts. Effective June 15, 2009, the Fund commenced operations offering two classes of shares: Class 2 and Class 4. Each class of shares differs by its distribution fees, voting rights on matters affecting a single class and its exchange privilege.
The following summarizes the Fund’s significant accounting policies.
a. Security Valuation
Equity and other securities listed on a securities exchange or on the NASDAQ National Market System are valued at the last quoted sale price or the official closing price of the day, respectively. Over-the-counter securities and listed securities for which there is no reported sale are valued within the range of the most recent quoted bid and ask prices. Securities that trade in multiple markets or on multiple exchanges are valued according to the broadest and most representative market. Certain equity securities are valued based upon fundamental characteristics or relationships to similar securities.
Corporate debt securities and government securities generally trade in the over-the-counter market rather than on a securities exchange. The Fund may utilize independent pricing services, quotations from bond dealers, and information with respect to bond and note transactions, to assist in determining a current market value for each security. The Fund’s pricing services may use valuation models or matrix pricing which considers information with respect to comparable bond and note transactions, quotations from bond dealers, or by reference to other securities that are considered comparable in such characteristics as rating, interest rate and maturity date, option adjusted spread models, prepayment projections, interest rate spreads and yield curves, to determine current value. Debt securities denominated in a foreign currency are converted into their U.S. dollar equivalent at the foreign exchange rate in effect at the close of the NYSE on the date that the values of the foreign debt securities are determined.
Foreign equity securities are valued as of the close of trading on the foreign stock exchange on which the security is primarily traded, or the NYSE, whichever is earlier. If no sale is reported at that time, the foreign equity security will be valued within the range of the most recent quoted bid and ask prices. The value is then converted into its U.S. dollar equivalent at the foreign exchange rate in effect at the close of the NYSE on the day that the value of the security is determined.
The Fund has procedures to determine the fair value of individual securities and other assets for which market prices are not readily available or which may not be reliably priced. Methods for valuing these securities may include: fundamental analysis based upon the underlying investment book value, anticipated future cash flows, market changes in comparable or similar securities, matrix pricing, discounts from market prices of similar securities, or discounts applied due to the nature and duration of restrictions on the disposition of the securities. Due to the inherent uncertainty of valuations of such securities, the fair values may differ significantly from the values that would have been used had a ready market for such investments existed. Occasionally, events occur between the time at which trading in a security is completed and the close of the NYSE that might call into question the availability (including the reliability) of the value of a portfolio security held by the Fund. The investment manager monitors price movements following the close of trading in foreign stock markets through a series of country specific market proxies (such as baskets of American Depository Receipts, futures contracts and exchange traded funds). These price movements are measured against established trigger thresholds for each specific market proxy to assist in determining if an event has occurred. If such an event occurs, the securities may be valued using fair value procedures, which may include the use of independent pricing services. All security valuation procedures are approved by the Fund’s Board of Trustees.
b. Foreign Currency Translation
Portfolio securities and other assets and liabilities denominated in foreign currencies are translated into U.S. dollars based on the exchange rate of such currencies against U.S. dollars on the date of valuation. The Fund may enter into foreign currency
MI-19
Franklin Templeton Variable Insurance Products Trust
Notes to Financial Statements (continued)
Mutual International Securities Fund
1. ORGANIZATION AND SIGNIFICANT ACCOUNTING POLICIES (continued)
b. Foreign Currency Translation (continued)
exchange contracts to facilitate transactions denominated in a foreign currency. Purchases and sales of securities, income and expense items denominated in foreign currencies are translated into U.S. dollars at the exchange rate in effect on the transaction date. Occasionally, events may impact the availability or reliability of foreign exchange rates used to convert the U.S. dollar equivalent value. If such an event occurs, the foreign exchange rate will be valued at fair value using procedures established and approved by the Fund’s Board of Trustees.
The Fund does not separately report the effect of changes in foreign exchange rates from changes in market prices on securities held. Such changes are included in net realized and unrealized gain or loss from investments on the Statement of Operations.
Realized foreign exchange gains or losses arise from sales of foreign currencies, currency gains or losses realized between the trade and settlement dates on securities transactions and the difference between the recorded amounts of dividends, interest, and foreign withholding taxes and the U.S. dollar equivalent of the amounts actually received or paid. Net unrealized foreign exchange gains and losses arise from changes in foreign exchange rates on foreign denominated assets and liabilities other than investments in securities held at the end of the reporting period.
c. Derivative Financial Instruments
The Fund may invest in derivative financial instruments (derivatives) in order to manage risk or gain exposure to various other investments or markets. Derivatives are financial contracts based on an underlying or notional amount, require no initial investment or an initial net investment that is smaller than would normally be required to have a similar response to changes in market factors, and require or permit net settlement. Derivatives may contain various risks including the potential inability of the counterparty to fulfill their obligations under the terms of the contract, the potential for an illiquid secondary market, and the potential for market movements which may expose the Fund to gains or losses in excess of the amounts shown on the Statement of Assets and Liabilities.
Derivatives are marked to market daily based upon quotations from market makers or the Fund’s independent pricing services and the Fund’s net benefit or obligation under the contract, as measured by the fair market value of the contract, is included in net assets. Realized gain and loss and unrealized appreciation and depreciation on these contracts for the period are included in the Statement of Operations.
The Fund generally enters into forward exchange contracts in order to hedge against fluctuations in foreign exchange rates. A forward exchange contract is an agreement between the Fund and a counterparty to buy or sell a foreign currency for a specific exchange rate on a future date. Pursuant to the terms of the forward exchange contracts, cash or securities may be required to be deposited as collateral.
See Note 8 regarding other derivative information.
d. Securities Sold Short
The Fund is engaged in selling securities short, which obligates the Fund to replace a borrowed security with the same security at current market value. The Fund incurs a loss if the price of the security increases between the date of the short sale and the date on which the Fund replaces the borrowed security. The Fund realizes a gain if the price of the security declines between those dates. Gains are limited to the price at which the Fund sold the security short, while losses are potentially unlimited in size.
The Fund is required to establish a margin account with the broker lending the security sold short. While the short sale is outstanding, the broker retains the proceeds of the short sale and the Fund must maintain a deposit with broker consisting of
MI-20
Franklin Templeton Variable Insurance Products Trust
Notes to Financial Statements (continued)
Mutual International Securities Fund
1. ORGANIZATION AND SIGNIFICANT ACCOUNTING POLICIES (continued)
d. Securities Sold Short (continued)
cash and/or securities having a value equal to a specified percentage of the value of the securities sold short. The Fund is obligated to pay the counterparty any dividends or interest due on securities sold short. Such dividends or interest are recorded as an expense to the Fund.
e. Income Taxes
No provision has been made for U.S. income taxes because it is the Fund’s policy to qualify as a regulated investment company under the Internal Revenue Code and to distribute to shareholders substantially all of its taxable income and net realized gains.
The Fund has reviewed the tax position as of December 31, 2009, and has determined that no provision for income tax is required in the Fund’s financial statements.
f. Security Transactions, Investment Income, Expenses and Distributions
Security transactions are accounted for on trade date. Realized gains and losses on security transactions are determined on a specific identification basis. Interest income and estimated expenses are accrued daily. Amortization of premium and accretion of discount on debt securities are included in interest income. Dividend income and dividends declared on securities sold short are recorded on the ex-dividend date except that certain dividends from foreign securities are recognized as soon as the Fund is notified of the ex-dividend date. Distributions to shareholders are recorded on the ex-dividend date and are determined according to income tax regulations (tax basis). Distributable earnings determined on a tax basis may differ from earnings recorded in accordance with accounting principles generally accepted in the United States of America. These differences may be permanent or temporary. Permanent differences are reclassified among capital accounts to reflect their tax character. These reclassifications have no impact on net assets or the results of operations. Temporary differences are not reclassified, as they may reverse in subsequent periods.
Common expenses incurred by the Trust are allocated among the funds based on the ratio of net assets of each fund to the combined net assets of the Trust. Fund specific expenses are charged directly to the fund that incurred the expense.
Realized and unrealized gains and losses and net investment income, not including class specific expenses, are allocated daily to each class of shares based upon the relative proportion of net assets of each class. Differences in per share distributions, by class, are generally due to differences in class specific expenses.
g. Offering Costs
Offering costs are amortized on a straight line basis over twelve months.
h. Accounting Estimates
The preparation of financial statements in accordance with accounting principles generally accepted in the United States of America requires management to make estimates and assumptions that affect the reported amounts of assets and liabilities at the date of the financial statements and the amounts of income and expenses during the reporting period. Actual results could differ from those estimates.
i. Guarantees and Indemnifications
Under the Trust’s organizational documents, its officers and trustees are indemnified by the Trust against certain liabilities arising out of the performance of their duties to the Trust. Additionally, in the normal course of business, the Trust, on behalf of the
MI-21
Franklin Templeton Variable Insurance Products Trust
Notes to Financial Statements (continued)
Mutual International Securities Fund
1. ORGANIZATION AND SIGNIFICANT ACCOUNTING POLICIES (continued)
i. Guarantees and Indemnifications (continued)
Fund, enters into contracts with service providers that contain general indemnification clauses. The Trust’s maximum exposure under these arrangements is unknown as this would involve future claims that may be made against the Trust that have not yet occurred. Currently, the Trust expects the risk of loss to be remote.
2. SHARES OF BENEFICIAL INTEREST
At December 31, 2009, there were an unlimited number of shares authorized (without par value). Transactions in the Fund’s shares were as follows:
| | | | | |
| | | Period Ended
December 31, 2009a |
| Class 2 Shares: | | Shares | | Amount |
Shares sold | | 100,000 | | $ | 1,000,000 |
| | | |
Class 4 Shares: | | | | | |
Shares sold | | 100,000 | | $ | 1,000,000 |
| | | |
| a | For the period June 15, 2009 (commencement of operations) to December 31, 2009. |
3. TRANSACTIONS WITH AFFILIATES
Franklin Resources, Inc. is the holding company for various subsidiaries that together are referred to as Franklin Templeton Investments. Certain officers and trustees of the Trust are also officers and/or directors of the following subsidiaries:
| | |
| Subsidiary | | Affiliation |
Franklin Mutual Advisers, LLC (Franklin Mutual) | | Investment manager |
Franklin Templeton Services, LLC (FT Services) | | Administrative manager |
Franklin Templeton Distributors, Inc. (Distributors) | | Principal underwriter |
Franklin Templeton Investor Services, LLC (Investor Services) | | Transfer agent |
a. Management Fees
The Fund pays an investment management fee to Franklin Mutual based on the average daily net assets of the Fund as follows:
| | |
| Annualized Fee Rate | | Net Assets |
| 0.800% | | Up to and including $4 billion |
| 0.770% | | Over $4 billion, up to and including $7 billion |
| 0.750% | | Over $7 billion, up to and including $10 billion |
| 0.730% | | In excess of $10 billion |
b. Administrative Fees
The Fund pays an administrative fee to FT Services of 0.25% per year of the average daily net assets of the Fund.
c. Distribution Fees
The Fund’s Board of Trustees has adopted distribution plans for Class 2 and Class 4 shares pursuant to Rule 12b-1 under the 1940 Act. Under the Fund’s compensation distribution plans, the Fund pays Distributors for costs incurred in connection with
MI-22
Franklin Templeton Variable Insurance Products Trust
Notes to Financial Statements (continued)
Mutual International Securities Fund
3. TRANSACTIONS WITH AFFILIATES (continued)
c. Distribution Fees (continued)
the servicing, sale and distribution of the Fund’s shares up to 0.35% per year of its average daily net assets of each class. The Board of Trustees has agreed to limit the current rate to 0.25% per year for Class 2.
d. Transfer Agent Fees
Investor Services, under terms of an agreement, performs shareholder servicing for the Fund and is not paid by the Fund for the services.
e. Waiver and Expense Reimbursements
FT Services and Franklin Mutual have contractually agreed in advance to waive or limit their respective fees and to assume as their own expense certain expenses otherwise payable by the Fund so that the common expenses (i.e. a combination of management fees, administrative fees, and other expenses, but excluding distribution fees and dividend expense on securities sold short) for each class of the Fund do not exceed 0.95% (other than certain non-routine expenses or costs, including those relating to litigation, indemnification, reorganizations, and liquidations) until April 30, 2010.
f. Other Affiliated Transactions
At December 31, 2009, Franklin Advisers Inc. owned 100% of the Fund’s outstanding shares.
4. EXPENSE OFFSET ARRANGEMENT
The Fund has entered into an arrangement with its custodian whereby credits realized as a result of uninvested cash balances are used to reduce a portion of the Fund’s custodian expenses. During the period ended December 31, 2009, the custodian fees were reduced as noted in the Statement of Operations.
5. INCOME TAXES
The tax character of distributions paid during the period ended December 31, 2009, was as follows:
| | | |
Distributions paid from ordinary income | | $ | 111,540 |
| | | |
At December 31, 2009, the cost of investments, net unrealized appreciation (depreciation), undistributed ordinary income and undistributed long term capital gains for income tax purposes were as follows:
| | | | |
| |
Cost of investments | | $ | 1,877,025 | |
| | | | |
Unrealized appreciation | | $ | 287,596 | |
Unrealized depreciation | | | (32,400 | ) |
| | | | |
Net unrealized appreciation (depreciation) | | $ | 255,196 | |
| | | | |
Undistributed ordinary income | | $ | 106,677 | |
Undistributed long term capital gains | | | 2,063 | |
| | | | |
Distributable earnings | | $ | 108,740 | |
| | | | |
MI-23
Franklin Templeton Variable Insurance Products Trust
Notes to Financial Statements (continued)
Mutual International Securities Fund
5. INCOME TAXES (continued)
Net investment income differs for financial statement and tax purposes primarily due to differing treatments of foreign currency transactions, passive foreign investment company shares and non-deductible expenses.
Net realized gains (losses) differ for financial statement and tax purposes primarily due to differing treatments of foreign currency transactions and passive foreign investment company shares.
6. INVESTMENT TRANSACTIONS
Purchases and sales of investments (excluding short term securities and securities sold short) for the period ended December 31, 2009, aggregated $2,449,460 and $821,867, respectively.
7. CONCENTRATION OF RISK
Investing in foreign securities may include certain risks and considerations not typically associated with investing in U.S. securities, such as fluctuating currency values and changing local and regional economic, political and social conditions, which may result in greater market volatility. In addition, certain foreign securities may not be as liquid as U.S. securities.
8. OTHER DERIVATIVE INFORMATION
At December 31, 2009, the Fund has invested in derivative contracts which are reflected on the Statement of Assets and Liabilities as follows:
| | | | | | | | | | |
| | | Asset Derivatives | | Liability Derivatives |
Derivative Contracts Not Accounted
for as Hedging Instruments | | Statement of Assets and
Liabilities Location | | Fair
Value
Amount | | Statement of Assets and
Liabilities Location | | Fair
Value
Amount |
Foreign exchange contracts | | Unrealized appreciation on forward exchange contracts | | $ | 44,015 | | Unrealized depreciation on forward exchange contracts | | $ | 6,888 |
For the period ended December 31, 2009, the effect of derivative contracts on the Fund’s Statement of Operations was as follows:
| | | | | | | | | | | | |
Derivative Contracts Not Accounted
for as Hedging Instruments | | Statement of Operations Locations | | Realized Gain
(Loss) for the
Period Ended
December 31, 2009 | | | Change in
Unrealized
Appreciation
(Depreciation)
for the
Period Ended
December 31, 2009 | | Average
Notional
Amount
Outstanding
During the
Perioda |
Foreign exchange contracts | | Net realized gain (loss) from foreign currency transactions / Net change in unrealized appreciation (depreciation) on translation of other assets and liabilities denominated in foreign currencies | | $ | (31,199 | ) | | $ | 37,127 | | $ | 1,132,189 |
a Notional amount represents the U.S. dollar equivalent based on the foreign exchange rate at the time of contract entry.
See Note 1(c) regarding derivative financial instruments.
MI-24
Franklin Templeton Variable Insurance Products Trust
Notes to Financial Statements (continued)
Mutual International Securities Fund
9. CREDIT FACILITY
On January 22, 2010, the Fund, together with other U.S. registered and foreign investment funds (collectively “Borrowers”), managed by Franklin Templeton Investments, entered into a 364-day joint syndicated senior unsecured credit facility totaling $750 million (Global Credit Facility) to provide a source of funds to the Borrowers for temporary and emergency purposes, including the ability to meet future unanticipated or unusually large redemption requests.
Under the terms of the Global Credit Facility, the Fund shall, in addition to interest charged on any borrowings made by the Fund and other costs incurred by the Fund, pay its share of fees and expenses incurred in connection with the implementation and maintenance of the Global Credit Facility, based upon its relative share of the aggregate net assets of all of the Borrowers, including an annual commitment fee of 0.10% based upon the unused portion of the Global Credit Facility.
10. FAIR VALUE MEASUREMENTS
The Fund follows a fair value hierarchy that distinguishes between market data obtained from independent sources (observable inputs) and the Fund’s own market assumptions (unobservable inputs). These inputs are used in determining the value of the Fund’s investments and are summarized in the following fair value hierarchy:
| | • | | Level 1 – quoted prices in active markets for identical securities |
| | • | | Level 2 – other significant observable inputs (including quoted prices for similar securities, interest rates, prepayment speed, credit risk, etc.) |
| | • | | Level 3 – significant unobservable inputs (including the Fund’s own assumptions in determining the fair value of investments) |
The inputs or methodology used for valuing securities are not an indication of the risk associated with investing in those securities.
The following is a summary of the inputs used as of December 31, 2009, in valuing the Fund’s assets and liabilities carried at fair value:
| | | | | | | | | | | | |
| | | Level 1 | | Level 2 | | Level 3 | | Total |
| | | |
Assets: | | | | | | | | | | | | |
Investments in Securities | | | | | | | | | | | | |
Equity Investmentsa,b | | $ | 2,074,818 | | $ | — | | $ | — | | $ | 2,074,818 |
Corporate Bonds & Notes | | | — | | | 57,403 | | | — | | | 57,403 |
| | | |
Total Investments in Securities | | $ | 2,074,818 | | $ | 57,403 | | $ | — | | $ | 2,132,221 |
| | | |
Forward Exchange Contracts | | | — | | | 44,015 | | | — | | | 44,015 |
Liabilities: | | | | | | | | | | | | |
Securities Sold Short | | | 10,721 | | | — | | | — | | | 10,721 |
Forward Exchange Contracts | | | — | | | 6,888 | | | — | | | 6,888 |
aIncludes common and preferred stock.
bFor detailed industry descriptions, see the accompanying Statement of Investments.
11. NEW ACCOUNTING PRONOUNCEMENTS
In January 2010, the Financial Accounting Standards Board issued Accounting Standards Update (ASU) No. 2010-6, Fair Value Measurements and Disclosure (Topic 820): Improving Disclosures about Fair Value Measurements. ASU No. 2010-6 enhances and clarifies existing fair value measurement disclosure requirements and is effective for interim and annual periods beginning after December 15, 2009. The Fund is currently evaluating the impact, if any, of applying the provisions of ASU No. 2010-6.
12. SUBSEQUENT EVENTS
The Fund has evaluated subsequent events through February 10, 2010, the issuance date of the financial statements and determined that no events have occurred that require disclosure.
MI-25
Franklin Templeton Variable Insurance Products Trust
Notes to Financial Statements (continued)
Mutual International Securities Fund
ABBREVIATIONS
| | | | |
Counterparty BOFA - Bank of America N.A. SSBT - State Street Bank and Trust Co. | | Currency EUR - Euro | | Selected Portfolio ADR - American Depository Receipt FRN - Floating Rate Note PC - Participation Certificate REIT - Real Estate Investment Trust |
MI-26
Franklin Templeton Variable Insurance Products Trust
Mutual International Securities Fund
Report of Independent Registered Public Accounting Firm
To the Board of Trustees and Shareholders of Franklin Templeton Variable Insurance Products Trust
In our opinion, the accompanying statement of assets and liabilities, including the statement of investments, and the related statements of operations and of changes in net assets and the financial highlights present fairly, in all material respects, the financial position of Mutual International Securities Fund (one of the funds constituting the Franklin Templeton Variable Insurance Products Trust, hereafter referred to as the “Fund”) at December 31, 2009, and the results of its operations, the changes in its net assets and the financial highlights for the period June 15, 2009 (commencement of operations) through December 31, 2009, in conformity with accounting principles generally accepted in the United States of America. These financial statements and financial highlights (hereafter referred to as “financial statements”) are the responsibility of the Fund’s management. Our responsibility is to express an opinion on these financial statements based on our audit. We conducted our audit of these financial statements in accordance with the standards of the Public Company Accounting Oversight Board (United States). Those standards require that we plan and perform the audit to obtain reasonable assurance about whether the financial statements are free of material misstatement. An audit includes examining, on a test basis, evidence supporting the amounts and disclosures in the financial statements, assessing the accounting principles used and significant estimates made by management, and evaluating the overall financial statement presentation. We believe that our audit, which included confirmation of securities at December 31, 2009 by correspondence with the custodian and brokers, provides a reasonable basis for our opinion.
PricewaterhouseCoopers LLP
San Francisco, California
February 10, 2010
MI-27
Franklin Templeton Variable Insurance Products Trust
Tax Designation (unaudited)
Mutual International Securities Fund
At December 31, 2009, more than 50% of the Fund’s total assets were invested in securities of foreign issuers. In most instances, foreign taxes were withheld from income paid to the Fund on these investments. As shown in the table below, the Fund designates to shareholders the foreign source income and foreign taxes paid, pursuant to Section 853 of the Code. This designation will allow shareholders of record on December 11, 2009, to treat their proportionate share of foreign taxes paid by the Fund as having been paid directly by them. The shareholder shall consider these amounts as foreign taxes paid in the tax year in which they receive the Fund distribution.
The following table provides a detailed analysis of foreign tax paid and foreign source income as designated by the Fund, to Class 2 and Class 4 shareholders of record.
| | | | | | |
| Class | | Foreign Tax
Paid
Per Share | | Foreign
Source Income
Per Share |
Class 2 | | $ | 0.0044 | | $ | 0.1426 |
Class 4 | | $ | 0.0044 | | $ | 0.1416 |
Foreign Tax Paid Per Share (Column 1) is the amount per share available to you, as a tax credit (assuming you held your shares in the Fund for a minimum of 16 days during the 31-day period beginning 15 days before the ex-dividend date of the Fund’s distribution to which the foreign taxes relate), or, as a tax deduction.
Foreign Source Income Per Share (Column 2) is the amount per share of income dividends paid to you that is attributable to foreign securities held by the Fund, plus any foreign taxes withheld on these dividends.
MI-28
MUTUAL SHARES SECURITIES FUND
We are pleased to bring you Mutual Shares Securities Fund’s annual report for the fiscal year ended December 31, 2009.
Performance Summary as of 12/31/09
Average annual total return of Class 4 shares* represents the average annual change in value, assuming reinvestment of dividends and capital gains. Average returns smooth out variations in returns, which can be significant; they are not the same as year-by-year results.
Periods ended 12/31/09
| | | | | | |
| | | 1-Year | | 5-Year | | 10-Year |
Average Annual Total Return | | +25.94% | | +1.55% | | +5.13% |
*For the period beginning 2/29/08, Class 4 performance reflects a 12b-1 fee expense of 0.35% per year, which affects future performance. Class 4 performance prior to 2/29/08 reflects historical Class 1 performance, which does not include a 12b-1 fee expense. Since 2/29/08 (effective date), the average annual total return of Class 4 shares was -8.17%.
Total Return Index Comparison for a Hypothetical $10,000 Investment (1/1/00–12/31/09)
The graph below shows the change in value of a hypothetical $10,000 investment in the Fund over the indicated period and includes reinvestment of any income or distributions. The Fund’s performance* is compared to the performance of the Standard & Poor’s 500 Index (S&P 500). One cannot invest directly in an index, and an index is not representative of the Fund’s portfolio. Please see Important Notes to Performance Information preceding the Fund Summaries.
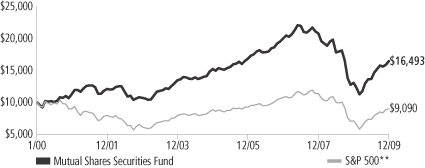
**Source: © 2009 Morningstar. Please see Index Descriptions following the Fund Summaries.
Mutual Shares Securities Fund – Class 4
Performance reflects the Fund’s Class 4 operating expenses, but does not include any contract fees, expenses or sales charges. If they had been included, performance would be lower. These charges and deductions, particularly for variable life policies, can have a significant effect on contract values and insurance benefits. See the contract prospectus for a complete description of these expenses, including sales charges.
Performance data represent past performance, which does not guarantee future results. Investment return and principal value will fluctuate, and you may have a gain or loss when you sell your shares.
Current performance may differ from figures shown.
MS-1
Fund Goals and Main Investments: Mutual Shares Securities Fund seeks capital appreciation, with income as a secondary goal. The Fund normally invests primarily in U.S. and foreign equity securities that the manager believes are undervalued. The Fund also invests, to a lesser extent, in risk arbitrage securities and distressed companies.
Performance Overview
You can find the Fund’s one-year total return in the Performance Summary. The Fund performed comparably with its benchmark, the S&P 500, which had a +26.46% total return for the period under review.1
Economic and Market Overview
The U.S. economy ended 2009 in much better shape than it began. After several quarters of contraction, economic activity expanded in the third and fourth quarters. In the year’s second half, corporate profit growth was higher than earlier estimates, which may allow businesses to build inventory following a long period of inventory drawdowns. Economic challenges remain, such as stalled consumer confidence and job prospects for the unemployed as stimulus measures wind down. However, several reports pointed to improving economic conditions.
Throughout the year, the Federal Open Market Committee kept U.S. monetary policy unchanged, announcing it intends to hold the federal funds target rate in the 0% to 0.25% range “for an extended period” as it lays the groundwork for an eventual tightening of monetary policy. Late in the period, the labor market improved somewhat as the economy lost fewer jobs than expected and the unemployment rate fell slightly, dropping from a period high of 10.2% in October to 10.0% at period-end.2
Globally, equity markets entered 2009 largely pricing in a possible economic depression and systemic solvency crisis, scenarios that were ultimately averted by one of the most aggressive global policy responses in financial history. As government monetary and fiscal intervention began to gain traction toward the end of the first quarter, equities bottomed and largely reversed their decline, economic growth stabilized and rebounded, and confidence was rekindled as investors began to believe the global financial system was finally on the mend. Emerging market economies fueled the global recovery as governments aggressively incentivized lending and consumption, resulting in a
1. Source: © 2009 Morningstar. One cannot invest directly in an index, and an index is not representative of the Fund’s portfolio. Please see Index Descriptions following the Fund Summaries.
2. Source: Bureau of Labor Statistics.
Fund Risks: The Fund’s investments in stocks may offer the potential for long-term gains but can be subject to short-term price fluctuations. Investments in companies involved in mergers, liquidations, reorganizations and distressed bankruptcy, which may include defaulted debt, involve higher credit and other risks. Foreign investing, especially in emerging markets, involves additional risks, including currency fluctuations, economic instability, market volatility, and political and social instability. Smaller and midsize company securities involve special risks, such as relatively small revenues, limited product lines and small market share. The Fund’s prospectus also includes a description of the main investment risks.
MS-2
dramatic recovery that laid the groundwork for the developing world’s equity rally. Growing demand from emerging markets supported commodity prices, which also posted record gains during the year. For most of the year, the fading U.S. dollar also helped underpin the rally in hard assets, while continued euro and yen strength created headwinds for regional recoveries.
For the 12 months under review, the blue chip stocks of the Dow Jones Industrial Average delivered a total return of +22.68%, while the broader S&P 500 posted a +26.46% total return and the technology-heavy NASDAQ Composite Index returned +45.32%.1 Global developed and emerging markets, as measured by the Morgan Stanley Capital International (MSCI) All Country World Index, delivered a +35.41% total return.1
Investment Strategy
At Mutual Series, we are committed to our distinctive value approach to investing. Our major investment strategy is investing in undervalued stocks. When selecting undervalued equities, we are attracted to fundamentally strong companies with healthy balance sheets, high-quality assets, substantial free cash flow and shareholder-oriented management teams and whose stocks are trading at discounts to our assessment of the companies’ intrinsic or business value. We also look for asset rich companies whose shares may be trading at depressed levels due to concerns over short-term earnings disappointments, litigation, management strategy or other perceived negatives. While the vast majority of our undervalued equity investments are made in publicly traded companies globally, we may invest occasionally in privately held companies as well.
We complement this more traditional investment strategy with two others. One is distressed investing, which is complex and can take many forms. The most common distressed investment the Fund undertakes is the purchase of financially troubled or bankrupt companies’ debt at a substantial discount to face value. After the financially distressed company is reorganized, often in bankruptcy court, the old debt is typically replaced with new securities issued by the financially stronger company.
The other piece of our investment strategy is participating in arbitrage situations, another highly specialized field. When companies announce proposed mergers or takeovers, commonly referred to as “deals,” the target company may trade at a discount to the bid it ultimately accepts. One
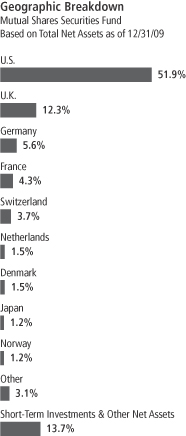
MS-3
form of arbitrage involves purchasing the target company’s stock when it is trading below the value we believe it would receive in a deal. In keeping with our commitment to a relatively conservative investment approach, we typically focus our arbitrage efforts on announced deals, and eschew rumored deals or other situations we consider relatively risky.
In addition, it is our practice to hedge the Fund’s currency exposure when we deem it advantageous for our shareholders.
Manager’s Discussion
As the stock market broadly rebounded in 2009, most of the Fund’s investments increased in value. Our equity portfolio was the strongest contributor to performance during the year under review. Three of our top-performing positions were software giant Microsoft, U.K.-based communications services provider Virgin Media (VMED), and International Paper (IP), the world’s largest forest products company.
In 2009 Microsoft posted significant positive returns as unexpected cost discipline throughout the company protected earnings during the downturn and helped position the company well for the rebound. Early in 2009, Microsoft shares fell as the economic slowdown adversely affected information technology budgets and hurt revenue in divisions tied to PC sales. In response, Microsoft laid off employees for the first time in the company’s history, protecting earnings, while positioning itself to expand margins in the event of economic recovery. As 2009 progressed, the economy stabilized and demand began to return just as Microsoft launched new products, including the well-reviewed Windows 7. Our investment appreciated substantially as the market began to anticipate the resumption of growth and the stabilization of earnings.
VMED is a cable operator providing broadband, telephony and video services to consumers and small businesses. VMED’s leveraged balance sheet and operating exposure to reduced consumer spending heightened investor concerns in late 2008 and early 2009. In 2009’s second quarter, VMED management took advantage of better credit conditions to refinance $1.6 billion of its near-term maturities. In addition, the company’s second quarter 2009 earnings reflected continued improvement in subscriber metrics and earnings growth. The company took advantage of new product introductions and improvements in service to pass along subscriber price increases in May. In the meantime, consolidation among U.K. broadband providers led to a more benign competitive environment while regulatory rulings regarding the wholesale distribution of premium content favored VMED, potentially improving the video component of its bundled offer. At
Top 10 Sectors/Industries
Mutual Shares Securities Fund
Based on Equity Securities
12/31/09
| | |
| | | % of Total
Net Assets |
| Tobacco | | 9.2% |
| Food Products | | 5.4% |
| Insurance | | 5.3% |
| Food & Staples Retailing | | 5.0% |
| Beverages | | 4.3% |
| Oil, Gas & Consumable Fuels | | 4.1% |
| Media | | 3.5% |
| Industrial Conglomerates | | 3.5% |
| Paper & Forest Products | | 3.2% |
| Electric Utilities | | 3.0% |
MS-4
year-end, we believed VMED management’s focus on driving efficiencies while differentiating its product portfolio to attract new customers could continue to bear fruit in 2010.
IP is North America’s largest producer of cardboard boxes and the second-largest producer of copy paper. Our investment in IP appreciated considerably, despite dramatic share price drops in 2008 and early 2009. Facing lower demand and significant curtailments in production, which raised unit costs, the company expanded margins partly through productivity initiatives, among other things, helping it deliver strong operating results and free cash flow (much of which was used to pay down debt). IP also successfully integrated the Weyerhaeuser box business which was purchased in August 2008.
In addition to those companies cited above, one of the best performing areas of the portfolio was the Fund’s investments in distressed securities. At the end of 2008 and the beginning of 2009, as fear was gripping the credit markets and yield spreads were widening to historically high levels, we found opportunities we felt were compelling in distressed debt — specifically in the debt of companies that had amassed debt in the preceding few years when credit was widely available. A number of these positions appreciated significantly over 2009 as capital flowed back into credit and yield spreads tightened considerably.
Although the Fund performed well during 2009, it had some disappointments. Three investments that declined in value were Eastman Kodak, Kroger and Deutsche Post.
Photographic equipment company Eastman Kodak’s stock depreciated as operational losses and revaluation of post-retirement assets and liabilities significantly eroded its book value in 2009’s first quarter. Kodak’s weak cash flow performance also weighed on its share price, largely due to an unprofitable consumer inkjet business and operating earnings declines among its traditional businesses. In September, to alleviate potential bankruptcy concerns, the company entered into a number of capital markets transactions, including the issuance of expensive, high-coupon debt to Kohlberg Kravis Roberts as well as dilutive warrants, which increased its debt burden.
Kroger operates 2,469 supermarkets, 773 convenience stores and more than 100 supercenters in 31 states. Supermarket stocks in general, including Kroger, did not perform well in 2009 as food price deflation in the second half of the year contributed to lower-than-expected operating earnings.
Top 10 Holdings
Mutual Shares Securities Fund
12/31/09
| | |
Company
Sector/Industry,
Country | | % of Total
Net Assets |
| British American Tobacco PLC, ord. & ADR | | 2.6% |
| Tobacco, U.K. | | |
| CVS Caremark Corp. | | 2.4% |
| Food & Staples Retailing, U.S. |
| Microsoft Corp. | | 2.1% |
| Software, U.S. | | |
| Imperial Tobacco Group PLC | | 2.0% |
| Tobacco, U.K. | | |
| News Corp., A | | 1.9% |
| Media, U.S. | | |
| Berkshire Hathaway Inc., A & B | | 1.8% |
| Insurance, U.S. | | |
| Altria Group Inc. | | 1.8% |
| Tobacco, U.S. | | |
| Nestle SA | | 1.6% |
| Food Products, Switzerland | | |
| Transocean Ltd. | | 1.5% |
| Energy Equipment & Services, U.S. |
| Cadbury PLC | | 1.4% |
| Food Products, U.K. | | |
The dollar value, number of shares or principal amount, and names of all portfolio holdings are listed in the Fund’s Statement of Investments.
MS-5
The Fund’s shares of German mail and express mail carrier Deutsche Post declined in value during the time we held them, primarily due to concerns about the negative outlook for global growth. In addition, concerns grew about Deutsche Bank’s ability to close the Postbank sale and evidence of Deutsche Post’s exposure to a Postbank rights issue. Lastly, rumors swirled that the company might cut its dividend. The Fund sold its position prior to the dividend cut announcement in early 2009.
Finally, investors should note that we maintained our currency hedging posture of being generally hedged to the U.S. dollar for most of our non-U.S. holdings. Since the dollar was weaker compared with most foreign currencies during 2009, our hedging strategy negatively impacted performance.
Thank you for your participation in Mutual Shares Securities Fund. We look forward to serving your future investment needs.
The foregoing information reflects our analysis, opinions and portfolio holdings as of December 31, 2009, the end of the reporting period. The way we implement our main investment strategies and the resulting portfolio holdings may change depending on factors such as market and economic conditions. These opinions may not be relied upon as investment advice or an offer for a particular security. The information is not a complete analysis of every aspect of any market, country, industry, security or the Fund. Statements of fact are from sources considered reliable, but the investment manager makes no representation or warranty as to their completeness or accuracy. Although historical performance is no guarantee of future results, these insights may help you understand our investment management philosophy.
MS-6
Fund Expenses
As an investor in a variable insurance contract (Contract) that indirectly provides for investment in an underlying mutual fund, you can incur transaction and/or ongoing expenses at both the Fund level and the Contract level.
| • | | Transaction expenses can include sales charges (loads) on purchases, redemption fees, surrender fees, transfer fees and premium taxes. |
| • | | Ongoing expenses can include management fees, distribution and service (12b-1) fees, contract fees, annual maintenance fees, mortality and expense risk fees and other fees and expenses. All mutual funds and Contracts have some types of ongoing expenses. |
The expenses shown in the table are meant to highlight ongoing expenses at the Fund level only and do not include ongoing expenses at the Contract level, or transaction expenses at either the Fund or Contract level. While the Fund does not have transaction expenses, if the transaction and ongoing expenses at the Contract level were included, the expenses shown below would be higher. You should consult your Contract prospectus or disclosure document for more information.
The table shows Fund-level ongoing expenses and can help you understand these expenses and compare them with those of other mutual funds offered through the Contract. The table assumes a $1,000 investment held for the six months indicated. Please refer to the Fund prospectus for additional information on operating expenses.
Actual Fund Expenses
The first line (Actual) of the table provides actual account values and expenses. The “Ending Account Value” is derived from the Fund’s actual return, which includes the effect of ongoing Fund expenses, but does not include the effect of ongoing Contract expenses.
You can estimate the Fund-level expenses you incurred during the period by following these steps. Of course, your account value and expenses will differ from those in this illustration:
| 1. | Divide your account value by $1,000. |
If an account had an $8,600 value, then $8,600 ÷ $1,000 = 8.6.
| 2. | Multiply the result by the number under the heading “Fund-Level Expenses Incurred During Period.” |
If Fund-Level Expenses Incurred During Period were $7.50, then 8.6 x $7.50 = $64.50.
In this illustration, the estimated expenses incurred this period at the Fund level are $64.50.
Mutual Shares Securities Fund – Class 4
MS-7
Hypothetical Example for Comparison with Other Mutual Funds
Information in the second line (Hypothetical) of the table can help you compare ongoing expenses of the Fund with those of other mutual funds offered through the Contract. This information may not be used to estimate the actual ending account balance or expenses you incurred during the period. The hypothetical “Ending Account Value” is based on the Fund’s actual expense ratio and an assumed 5% annual rate of return before expenses, which does not represent the Fund’s actual return. The figure under the heading “Fund-Level Expenses Incurred During Period” shows the hypothetical expenses your account would have incurred under this scenario. You can compare this figure with the 5% hypothetical examples that appear in shareholder reports of other funds offered through a Contract.
| | | | | | | | | |
| Class 4 | | Beginning
Account Value 7/1/09 | | Ending
Account Value 12/31/09 | | Fund-Level Expenses Incurred
During Period* 7/1/09–12/31/09 |
Actual | | $ | 1,000 | | $ | 1,202.70 | | $ | 6.16 |
Hypothetical (5% return before expenses) | | $ | 1,000 | | $ | 1,019.61 | | $ | 5.65 |
*Expenses are calculated using the most recent six-month annualized expense ratio for the Fund’s Class 4 shares (1.11%), which does not include any ongoing expenses of the Contract for which the Fund is an investment option, multiplied by the average account value over the period, multiplied by 184/365 to reflect the one-half year period.
MS-8
Franklin Templeton Variable Insurance Products Trust
Financial Highlights
Mutual Shares Securities Fund
| | | | | | | | | | | | | | | | | | | | |
| | | Year Ended December 31, | |
| Class 1 | | 2009 | | | 2008 | | | 2007 | | | 2006 | | | 2005 | |
| | | | |
Per share operating performance | | | | | | | | | | | | | | | | | | | | |
(for a share outstanding throughout the year) | | | | | | | | | | | | | | | | | | | | |
Net asset value, beginning of year | | $ | 11.92 | | | $ | 20.42 | | | $ | 20.67 | | | $ | 18.35 | | | $ | 16.78 | |
| | | | |
Income from investment operationsa: | | | | | | | | | | | | | | | | | | | | |
Net investment incomeb | | | 0.23 | c | | | 0.34 | | | | 0.54 | | | | 0.40 | | | | 0.34 | |
Net realized and unrealized gains (losses) | | | 2.89 | | | | (7.54 | ) | | | 0.31 | | | | 2.86 | | | | 1.47 | |
| | | | |
Total from investment operations | | | 3.12 | | | | (7.20 | ) | | | 0.85 | | | | 3.26 | | | | 1.81 | |
| | | | |
Less distributions from: | | | | | | | | | | | | | | | | | | | | |
Net investment income | | | (0.29 | ) | | | (0.57 | ) | | | (0.35 | ) | | | (0.29 | ) | | | (0.18 | ) |
Net realized gains | | | — | | | | (0.73 | ) | | | (0.75 | ) | | | (0.65 | ) | | | (0.06 | ) |
| | | | |
Total distributions | | | (0.29 | ) | | | (1.30 | ) | | | (1.10 | ) | | | (0.94 | ) | | | (0.24 | ) |
| | | | |
Net asset value, end of year | | $ | 14.75 | | | $ | 11.92 | | | $ | 20.42 | | | $ | 20.67 | | | $ | 18.35 | |
| | | | |
| | | | | |
Total returnd | | | 26.35% | | | | (36.93)% | | | | 3.72% | | | | 18.66% | | | | 10.83% | |
Ratios to average net assets | | | | | | | | | | | | | | | | | | | | |
Expensese,f | | | 0.78% | | | | 0.73% | | | | 0.72% | | | | 0.81% | | | | 0.78% | |
Expenses - excluding dividend expense on securities sold shortf | | | 0.72% | | | | 0.73% | | | | 0.72% | | | | 0.74% | | | | 0.74% | |
Net investment income | | | 1.85% | c | | | 2.16% | | | | 2.58% | | | | 2.02% | | | | 1.97% | |
| | | | | |
Supplemental data | | | | | | | | | | | | | | | | | | | | |
Net assets, end of year (000’s) | | $ | 767,553 | | | $ | 319,703 | | | $ | 272,509 | | | $ | 259,943 | | | $ | 260,317 | |
Portfolio turnover rate | | | 49.33% | | | | 44.11% | | | | 41.73% | g | | | 19.75% | | | | 19.59% | |
aThe amount shown for a share outstanding throughout the period may not correlate with the Statement of Operations for the period due to the timing of sales and repurchases of the Fund shares in relation to income earned and/or fluctuating market value of the investments of the Fund.
bBased on average daily shares outstanding.
cNet investment income per share includes approximately $(0.03) per share related to an adjustment for uncollectible interest as disclosed on the Statement of Operations. Excluding the effect of this adjustment, the ratio of net investment income to average net assets would have been 2.08%. See Note 7.
dTotal return does not include any fees, charges or expenses imposed by the variable annuity and life insurance contracts for which the Franklin Templeton Variable Insurance Products Trust serves as an underlying investment vehicle.
eIncludes dividend expense on securities sold short which varies from period to period. See below for expense ratios that reflect only operating expenses.
fBenefit of expense reduction rounds to less than 0.01%.
gExcludes the value of portfolio securities delivered as a result of redemption in-kind.
The accompanying notes are an integral part of these financial statements.
MS-9
Franklin Templeton Variable Insurance Products Trust
Financial Highlights (continued)
Mutual Shares Securities Fund
| | | | | | | | | | | | | | | | | | | | |
| | | Year Ended December 31, | |
| Class 2 | | 2009 | | | 2008 | | | 2007 | | | 2006 | | | 2005 | |
| | | | |
Per share operating performance | | | | | | | | | | | | | | | | | | | | |
(for a share outstanding throughout the year) | | | | | | | | | | | | | | | | | | | | |
Net asset value, beginning of year | | $ | 11.78 | | | $ | 20.19 | | | $ | 20.46 | | | $ | 18.18 | | | $ | 16.64 | |
| | | | |
Income from investment operationsa: | | | | | | | | | | | | | | | | | | | | |
Net investment incomeb | | | 0.20 | c | | | 0.32 | | | | 0.48 | | | | 0.34 | | | | 0.29 | |
Net realized and unrealized gains (losses) | | | 2.85 | | | | (7.49 | ) | | | 0.31 | | | | 2.84 | | | | 1.46 | |
| | | | |
Total from investment operations | | | 3.05 | | | | (7.17 | ) | | | 0.79 | | | | 3.18 | | | | 1.75 | |
| | | | |
Less distributions from: | | | | | | | | | | | | | | | | | | | | |
Net investment income | | | (0.25 | ) | | | (0.51 | ) | | | (0.31 | ) | | | (0.25 | ) | | | (0.15 | ) |
Net realized gains | | | — | | | | (0.73 | ) | | | (0.75 | ) | | | (0.65 | ) | | | (0.06 | ) |
| | | | |
Total distributions | | | (0.25 | ) | | | (1.24 | ) | | | (1.06 | ) | | | (0.90 | ) | | | (0.21 | ) |
| | | | |
Net asset value, end of year | | $ | 14.58 | | | $ | 11.78 | | | $ | 20.19 | | | $ | 20.46 | | | $ | 18.18 | |
| | | | |
| | | | | |
Total returnd | | | 26.05% | | | | (37.11)% | | | | 3.48% | | | | 18.38% | | | | 10.55% | |
Ratios to average net assets | | | | | | | | | | | | | | | | | | | | |
Expensese,f | | | 1.03% | | | | 0.98% | | | | 0.97% | | | | 1.06% | | | | 1.03% | |
Expenses - excluding dividend expense on securities sold shortf | | | 0.97% | | | | 0.98% | | | | 0.97% | | | | 0.99% | | | | 0.99% | |
Net investment income | | | 1.60% | c | | | 1.91% | | | | 2.33% | | | | 1.77% | | | | 1.72% | |
| | | | | |
Supplemental data | | | | | | | | | | | | | | | | | | | | |
Net assets, end of year (000’s) | | $ | 3,953,435 | | | $ | 3,303,761 | | | $ | 5,925,551 | | | $ | 5,140,878 | | | $ | 3,596,889 | |
Portfolio turnover rate | | | 49.33% | | | | 44.11% | | | | 41.73% | g | | | 19.75% | | | | 19.59% | |
aThe amount shown for a share outstanding throughout the period may not correlate with the Statement of Operations for the period due to the timing of sales and repurchases of the Fund shares in relation to income earned and/or fluctuating market value of the investments of the Fund.
bBased on average daily shares outstanding.
cNet investment income per share includes approximately $(0.03) per share related to an adjustment for uncollectible interest as disclosed on the Statement of Operations. Excluding the effect of this adjustment, the ratio of net investment income to average net assets would have been 1.83%. See Note 7.
dTotal return does not include any fees, charges or expenses imposed by the variable annuity and life insurance contracts for which the Franklin Templeton Variable Insurance Products Trust serves as an underlying investment vehicle.
eIncludes dividend expense on securities sold short which varies from period to period. See below for expense ratios that reflect only operating expenses.
fBenefit of expense reduction rounds to less than 0.01%.
gExcludes the value of portfolio securities delivered as a result of redemption in-kind.
The accompanying notes are an integral part of these financial statements.
MS-10
Franklin Templeton Variable Insurance Products Trust
Financial Highlights (continued)
Mutual Shares Securities Fund
| | | | | | | | |
| | | Year Ended
December 31, | |
| Class 4 | | 2009 | | | 2008a | |
| | | | |
Per share operating performance | | | | | | | | |
(for a share outstanding throughout the year) | | | | | | | | |
Net asset value, beginning of year | | $ | 11.88 | | | $ | 18.91 | |
| | | | |
Income from investment operationsb: | | | | | | | | |
Net investment incomec | | | 0.19 | d | | | 0.17 | |
Net realized and unrealized gains (losses) | | | 2.87 | | | | (5.90 | ) |
| | | | |
Total from investment operations | | | 3.06 | | | | (5.73 | ) |
| | | | |
Less distributions from: | | | | | | | | |
Net investment income | | | (0.28 | ) | | | (0.57 | ) |
Net realized gains | | | — | | | | (0.73 | ) |
| | | | |
Total distributions | | | (0.28 | ) | | | (1.30 | ) |
| | | | |
Net asset value, end of year | | $ | 14.66 | | | $ | 11.88 | |
| | | | |
| | |
Total returne | | | 25.94% | | | | (32.12)% | |
Ratios to average net assetsf | | | | | | | | |
Expensesg,h | | | 1.13% | | | | 1.08% | |
Expenses - excluding dividend expense on securities sold shorth | | | 1.07% | | | | 1.08% | |
Net investment income | | | 1.50% | d | | | 1.81% | |
| | |
Supplemental data | | | | | | | | |
Net assets, end of year (000’s) | | $ | 141,446 | | | $ | 57,266 | |
Portfolio turnover rate | | | 49.33% | | | | 44.11% | |
aFor the period February 29, 2008 (effective date) to December 31, 2008.
bThe amount shown for a share outstanding throughout the period may not correlate with the Statement of Operations for the period due to the timing of sales and repurchases of the Fund shares in relation to income earned and/or fluctuating market value of the investments of the Fund.
cBased on average daily shares outstanding.
dNet investment income per share includes approximately $(0.03) per share related to an adjustment for uncollectible interest as disclosed on the Statement of Operations. Excluding the effect of this adjustment, the ratio of net investment income to average net assets would have been 1.73%. See Note 7.
eTotal return does not include any fees, charges or expenses imposed by the variable annuity and life insurance contracts for which the Franklin Templeton Variable Insurance Products Trust serves as an underlying investment vehicle. Total return is not annualized for periods less than one year.
fRatios are annualized for periods less than one year.
gIncludes dividend expense on securities sold short which varies from period to period. See below for expense ratios that reflect only operating expenses.
hBenefit of expense reduction rounds to less than 0.01%.
The accompanying notes are an integral part of these financial statements.
MS-11
Franklin Templeton Variable Insurance Products Trust
Statement of Investments, December 31, 2009
| | | | | | | |
| Franklin Mutual Shares Securities Fund | | Country | | Shares/
Warrants/
Contracts | | Value |
Common Stocks and Other Equity Interests 81.6% | | | | | | | |
Aerospace & Defense 0.1% | | | | | | | |
aGenCorp Inc. | | United States | | 494,180 | | $ | 3,459,260 |
| | | | | | | |
Air Freight & Logistics 0.5% | | | | | | | |
TNT NV | | Netherlands | | 868,685 | | | 26,734,804 |
| | | | | | | |
Airlines 0.0%b | | | | | | | |
a,cNorthwest Airlines Corp., Contingent Distribution | | United States | | 27,670,000 | | | 17,432 |
| | | | | | | |
Auto Components 0.2% | | | | | | | |
a,c,dCollins & Aikman Products Co., Contingent Distribution | | United States | | 929,505 | | | 9,295 |
a,c,dDana Holding Corp., Contingent Distribution | | United States | | 10,339,000 | | | — |
a,eIACNA Investor LLC | | United States | | 168,957 | | | 1,689 |
a,e,fInternational Automotive Components Group Brazil LLC | | Brazil | | 1,730,515 | | | 1,940,634 |
a,e,fInternational Automotive Components Group Japan LLC | | Japan | | 269,643 | | | 1,032,723 |
a,e,fInternational Automotive Components Group LLC | | Luxembourg | | 6,170,474 | | | 4,206,783 |
a,e,fInternational Automotive Components Group NA LLC, A | | United States | | 4,838,053 | | | 1,472,461 |
| | | | | | | |
| | | | | | | 8,663,585 |
| | | | | | | |
Automobiles 0.5% | | | | | | | |
Daimler AG | | Germany | | 445,347 | | | 23,695,580 |
| | | | | | | |
Beverages 4.3% | | | | | | | |
Brown-Forman Corp., A | | United States | | 7,455 | | | 420,089 |
Brown-Forman Corp., B | | United States | | 107,219 | | | 5,743,721 |
Carlsberg AS, B | | Denmark | | 296,066 | | | 21,870,275 |
Dr. Pepper Snapple Group Inc. | | United States | | 2,383,127 | | | 67,442,494 |
Pepsi Bottling Group Inc. | | United States | | 1,132,080 | | | 42,453,000 |
PepsiAmericas Inc. | | United States | | 441,790 | | | 12,926,776 |
Pernod Ricard SA | | France | | 697,971 | | | 59,856,719 |
| | | | | | | |
| | | | | | | 210,713,074 |
| | | | | | | |
Building Products 0.5% | | | | | | | |
aOwens Corning Inc. | | United States | | 1,004,331 | | | 25,751,047 |
| | | | | | | |
Capital Markets 1.9% | | | | | | | |
Deutsche Bank AG (EUR Traded) | | Germany | | 411,749 | | | 29,222,360 |
Deutsche Bank AG (USD Traded) | | Germany | | 18,400 | | | 1,304,744 |
Morgan Stanley | | United States | | 1,147,920 | | | 33,978,432 |
aUBS AG | | Switzerland | | 1,756,278 | | | 27,231,089 |
| | | | | | | |
| | | | | | | 91,736,625 |
| | | | | | | |
Chemicals 1.0% | | | | | | | |
a,c,dDow Corning Corp., Contingent Distribution | | United States | | 650,000 | | | 25,000 |
Linde AG | | Germany | | 409,050 | | | 49,278,596 |
| | | | | | | |
| | | | | | | 49,303,596 |
| | | | | | | |
Commercial Banks 2.3% | | | | | | | |
Barclays PLC | | United Kingdom | | 11,141,292 | | | 49,623,893 |
a,eElephant Capital Holdings Ltd. | | Japan | | 11,728 | | | — |
aGuaranty Bancorp | | United States | | 1,288,316 | | | 1,700,577 |
aIntesa Sanpaolo SpA | | Italy | | 5,663,270 | | | 25,536,068 |
a,eNCB Warrant Holdings Ltd., A | | Japan | | 57,295 | | | — |
Societe Generale, A | | France | | 187,110 | | | 13,110,701 |
a,eState Bank and Trust Co. | | United States | | 433,000 | | | 6,170,250 |
Wells Fargo & Co. | | United States | | 568,700 | | | 15,349,214 |
| | | | | | | |
| | | | | | | 111,490,703 |
| | | | | | | |
MS-12
Franklin Templeton Variable Insurance Products Trust
Statement of Investments, December 31, 2009 (continued)
| | | | | | | |
| Franklin Mutual Shares Securities Fund | | Country | | Shares/
Warrants/
Contracts | | Value |
Common Stocks and Other Equity Interests (continued) | | | | | | | |
Commercial Services & Supplies 0.0%b | | | | | | | |
aComdisco Holding Co. Inc. | | United States | | 180 | | $ | 1,800 |
a,c,dComdisco Holding Co. Inc., Contingent Distribution | | United States | | 7,473,000 | | | — |
| | | | | | | |
| | | | | | | 1,800 |
| | | | | | | |
Communications Equipment 0.8% | | | | | | | |
aMotorola Inc. | | United States | | 4,081,783 | | | 31,674,636 |
Tandberg ASA | | Norway | | 182,188 | | | 5,186,153 |
| | | | | | | |
| | | | | | | 36,860,789 |
| | | | | | | |
Computers & Peripherals 1.5% | | | | | | | |
a,eDecisionOne Corp. | | United States | | 108,227 | | | 179,657 |
a,eDecisionOne Corp., wts., 6/08/17 | | United States | | 59,425 | | | — |
aDell Inc. | | United States | | 3,319,965 | | | 47,674,697 |
aSun Microsystems Inc. | | United States | | 2,511,539 | | | 23,533,121 |
| | | | | | | |
| | | | | | | 71,387,475 |
| | | | | | | |
Consumer Finance 0.4% | | | | | | | |
a,eCerberus CG Investor I LLC | | United States | | 8,172,654 | | | 1,716,257 |
a,eCerberus CG Investor II LLC | | United States | | 8,172,654 | | | 1,716,257 |
a,eCerberus CG Investor III LLC | | United States | | 4,086,327 | | | 858,129 |
a,eGMAC Inc. | | United States | | 1,592 | | | 17,553,796 |
| | | | | | | |
| | | | | | | 21,844,439 |
| | | | | | | |
Diversified Consumer Services 0.3% | | | | | | | |
H&R Block Inc. | | United States | | 368,732 | | | 8,340,718 |
Hillenbrand Inc. | | United States | | 342,585 | | | 6,454,301 |
| | | | | | | |
| | | | | | | 14,795,019 |
| | | | | | | |
Diversified Financial Services 1.8% | | | | | | | |
Bank of America Corp. | | United States | | 2,215,590 | | | 33,366,785 |
a,eBond Street Holdings LLC, A, 144A | | United States | | 315,800 | | | 6,316,000 |
aCIT Group Inc. | | United States | | 412,212 | | | 11,381,173 |
Deutsche Boerse AG | | Germany | | 442,280 | | | 36,719,901 |
a,c,dMarconi Corp., Contingent Distribution | | United Kingdom | | 9,945,700 | | | — |
| | | | | | | |
| | | | | | | 87,783,859 |
| | | | | | | |
Diversified Telecommunication Services 2.6% | | | | | | | |
a,eAboveNet Inc. | | United States | | 124,923 | | | 8,124,992 |
a,eAboveNet Inc., stock grant, grant price $10.475, expiration date 9/09/13 | | United States | | 78 | | | 17,024 |
a,eAboveNet Inc., stock grant, grant price $30, expiration date 9/07/18 | | United States | | 17 | | | 2,383 |
a,eAboveNet Inc., wts., 9/08/10 | | United States | | 2,995 | | | 299,500 |
Cable & Wireless PLC | | United Kingdom | | 19,688,272 | | | 44,967,295 |
a,c,dGlobal Crossing Holdings Ltd., Contingent Distribution | | United States | | 9,005,048 | | | — |
Koninklijke KPN NV | | Netherlands | | 2,670,983 | | | 45,268,806 |
Telefonica SA | | Spain | | 938,460 | | | 26,222,361 |
| | | | | | | |
| | | | | | | 124,902,361 |
| | | | | | | |
Electric Utilities 3.0% | | | | | | | |
a,c,dCalpine Corp., Contingent Distribution | | United States | | 4,555,000 | | | — |
E.ON AG | | Germany | | 1,645,663 | | | 68,573,973 |
Entergy Corp. | | United States | | 319,190 | | | 26,122,510 |
Exelon Corp. | | United States | | 663,717 | | | 32,435,850 |
Prime Infrastructure Group | | Australia | | 4,709,226 | | | 17,452,652 |
| | | | | | | |
| | | | | | | 144,584,985 |
| �� | | | | | | |
MS-13
Franklin Templeton Variable Insurance Products Trust
Statement of Investments, December 31, 2009 (continued)
| | | | | | | |
| Franklin Mutual Shares Securities Fund | | Country | | Shares/
Warrants/
Contracts | | Value |
Common Stocks and Other Equity Interests (continued) | | | | | | | |
Electronic Equipment, Instruments & Component 0.5% | | | | | | | |
Tyco Electronics Ltd. | | United States | | 917,192 | | $ | 22,517,064 |
| | | | | | | |
Energy Equipment & Services 2.5% | | | | | | | |
Baker Hughes Inc. | | United States | | 346,652 | | | 14,032,473 |
aExterran Holding Inc. | | United States | | 613,890 | | | 13,167,940 |
aPride International Inc. | | United States | | 601,244 | | | 19,185,696 |
aTransocean Ltd. | | United States | | 892,107 | | | 73,866,460 |
| | | | | | | |
| | | | | | | 120,252,569 |
| | | | | | | |
Food & Staples Retailing 5.0% | | | | | | | |
Carrefour SA | | France | | 518,075 | | | 24,888,045 |
CVS Caremark Corp. | | United States | | 3,623,125 | | | 116,700,856 |
Kroger Co. | | United States | | 2,609,258 | | | 53,568,067 |
SUPERVALU Inc. | | United States | | 850,804 | | | 10,813,719 |
Wal-Mart Stores Inc. | | United States | | 683,162 | | | 36,515,009 |
| | | | | | | |
| | | | | | | 242,485,696 |
| | | | | | | |
Food Products 5.4% | | | | | | | |
Cadbury PLC | | United Kingdom | | 5,445,354 | | | 70,013,042 |
Danone | | France | | 272,661 | | | 16,716,575 |
General Mills Inc. | | United States | | 517,410 | | | 36,637,802 |
Kraft Foods Inc., A | | United States | | 2,269,151 | | | 61,675,524 |
Nestle SA | | Switzerland | | 1,618,603 | | | 78,494,779 |
| | | | | | | |
| | | | | | | 263,537,722 |
| | | | | | | |
Health Care Equipment & Supplies 0.7% | | | | | | | |
Becton Dickinson and Co. | | United States | | 409,654 | | | 32,305,314 |
| | | | | | | |
Health Care Providers & Services 2.8% | | | | | | | |
aCommunity Health Systems Inc. | | United States | | 1,277,022 | | | 45,461,983 |
aKindred Healthcare Inc. | | United States | | 167,311 | | | 3,088,561 |
aTenet Healthcare Corp. | | United States | | 6,379,987 | | | 34,388,130 |
UnitedHealth Group Inc. | | United States | | 1,676,070 | | | 51,086,614 |
| | | | | | | |
| | | | | | | 134,025,288 |
| | | | | | | |
Hotels, Restaurants & Leisure 0.1% | | | | | | | |
a,e,gGLCP Harrah’s Investment LP | | United States | | 5,565,600 | | | — |
Thomas Cook Group PLC | | United Kingdom | | 1,474,171 | | | 5,512,373 |
| | | | | | | |
| | | | | | | 5,512,373 |
| | | | | | | |
Household Durables 0.0%b | | | | | | | |
Black & Decker Corp. | | United States | | 7,400 | | | 479,742 |
| | | | | | | |
Independent Power Producers & Energy Traders 0.3% | | | | | | | |
NRG Energy Inc. | | United States | | 623,900 | | | 14,730,279 |
| | | | | | | |
Industrial Conglomerates 3.5% | | | | | | | |
Keppel Corp. Ltd. | | Singapore | | 3,424,936 | | | 20,054,944 |
Orkla ASA | | Norway | | 5,362,549 | | | 52,594,871 |
Siemens AG | | Germany | | 663,515 | | | 61,137,892 |
Tyco International Ltd. | | United States | | 986,415 | | | 35,195,287 |
| | | | | | | |
| | | | | | | 168,982,994 |
| | | | | | | |
Insurance 5.3% | | | | | | | |
ACE Ltd. | | United States | | 843,175 | | | 42,496,020 |
aAlleghany Corp. | | United States | | 23,818 | | | 6,573,768 |
MS-14
Franklin Templeton Variable Insurance Products Trust
Statement of Investments, December 31, 2009 (continued)
| | | | | | | |
| Franklin Mutual Shares Securities Fund | | Country | | Shares/
Warrants/
Contracts | | Value |
Common Stocks and Other Equity Interests (continued) | | | | | | | |
Insurance (continued) | | | | | | | |
aBerkshire Hathaway Inc., A | | United States | | 149 | | $ | 14,780,800 |
aBerkshire Hathaway Inc., B | | United States | | 21,970 | | | 72,193,420 |
aConseco Inc. | | United States | | 964,957 | | | 4,824,785 |
Old Republic International Corp. | | United States | | 2,329,142 | | | 23,384,586 |
a,eOlympus Re Holdings Ltd. | | United States | | 16,280 | | | 34,774 |
The Travelers Cos. Inc. | | United States | | 320,496 | | | 15,979,931 |
White Mountains Insurance Group Ltd. | | United States | | 140,935 | | | 46,883,437 |
Zurich Financial Services AG | | Switzerland | | 137,066 | | | 29,991,256 |
| | | | | | | |
| | | | | | | 257,142,777 |
| | | | | | | |
IT Services 0.5% | | | | | | | |
aAffiliated Computer Services Inc., A | | United States | | 431,470 | | | 25,754,444 |
| | | | | | | |
Leisure Equipment & Products 1.5% | | | | | | | |
aEastman Kodak Co. | | United States | | 2,112,040 | | | 8,912,809 |
Mattel Inc. | | United States | | 3,226,859 | | | 64,472,643 |
| | | | | | | |
| | | | | | | 73,385,452 |
| | | | | | | |
Life Sciences Tools & Services 0.1% | | | | | | | |
aMDS Inc. | | Canada | | 825,217 | | | 6,429,651 |
| | | | | | | |
Machinery 0.1% | | | | | | | |
Federal Signal Corp. | | United States | | 930,921 | | | 5,604,144 |
a,e,f,gMCII Holdings Inc. | | United States | | 2,219 | | | — |
| | | | | | | |
| | | | | | | 5,604,144 |
| | | | | | | |
Marine 1.0% | | | | | | | |
A P Moller - Maersk AS | | Denmark | | 7,009 | | | 49,348,235 |
| | | | | | | |
Media 3.5% | | | | | | | |
aAdelphia Recovery Trust | | United States | | 29,283,354 | | | 937,067 |
a,cAdelphia Recovery Trust, Arahova Contingent Value Vehicle, Contingent Distribution | | United States | | 1,955,453 | | | 405,757 |
a,c,dCentury Communications Corp., Contingent Distribution | | United States | | 5,487,000 | | | — |
News Corp., A | | United States | | 6,920,069 | | | 94,735,745 |
Time Warner Cable Inc. | | United States | | 682,949 | | | 28,267,259 |
a,dTVMAX Holdings Inc. | | United States | | 35,609 | | | — |
Virgin Media Inc. | | United Kingdom | | 2,861,769 | | | 48,163,572 |
| | | | | | | |
| | | | | | | 172,509,400 |
| | | | | | | |
Metals & Mining 0.7% | | | | | | | |
aAnglo American PLC | | United Kingdom | | 729,218 | | | 31,920,261 |
| | | | | | | |
Multi-Utilities 0.7% | | | | | | | |
GDF Suez | | France | | 794,532 | | | 34,444,127 |
| | | | | | | |
Office Electronics 0.6% | | | | | | | |
Xerox Corp. | | United States | | 3,683,990 | | | 31,166,555 |
| | | | | | | |
Oil, Gas & Consumable Fuels 4.1% | | | | | | | |
Marathon Oil Corp. | | United States | | 1,775,334 | | | 55,425,928 |
Noble Energy Inc. | | United States | | 222,579 | | | 15,852,076 |
Royal Dutch Shell PLC, A | | United Kingdom | | 1,954,104 | | | 59,020,969 |
Total SA, B | | France | | 548,419 | | | 35,330,474 |
XTO Energy Inc. | | United States | | 768,679 | | | 35,766,634 |
| | | | | | | |
| | | | | | | 201,396,081 |
| | | | | | | |
MS-15
Franklin Templeton Variable Insurance Products Trust
Statement of Investments, December 31, 2009 (continued)
| | | | | | | |
| Franklin Mutual Shares Securities Fund | | Country | | Shares/
Warrants/
Contracts | | Value |
Common Stocks and Other Equity Interests (continued) | | | | | | | |
Paper & Forest Products 3.2% | | | | | | | |
aDomtar Corp. | | United States | | 304,139 | | $ | 16,852,342 |
International Paper Co. | | United States | | 1,274,864 | | | 34,140,858 |
MeadWestvaco Corp. | | United States | | 1,553,006 | | | 44,462,562 |
Weyerhaeuser Co. | | United States | | 1,407,287 | | | 60,710,361 |
| | | | | | | |
| | | | | | | 156,166,123 |
| | | | | | | |
Personal Products 0.3% | | | | | | | |
L’Oreal SA | | France | | 136,540 | | | 15,245,115 |
| | | | | | | |
Pharmaceuticals 0.9% | | | | | | | |
Novartis AG | | Switzerland | | 823,647 | | | 44,955,857 |
| | | | | | | |
Real Estate Investment Trusts (REITs) 0.8% | | | | | | | |
aAlexander’s Inc. | | United States | | 49,326 | | | 15,015,821 |
The Link REIT | | Hong Kong | | 8,630,556 | | | 22,061,418 |
| | | | | | | |
| | | | | | | 37,077,239 |
| | | | | | | |
Real Estate Management & Development 0.5% | | | | | | | |
a,dCanary Wharf Group PLC | | United Kingdom | | 1,535,898 | | | 8,146,075 |
aForestar Group Inc. | | United States | | 330,463 | | | 7,263,577 |
aThe St. Joe Co. | | United States | | 314,282 | | | 9,079,607 |
| | | | | | | |
| | | | | | | 24,489,259 |
| | | | | | | |
Road & Rail 0.6% | | | | | | | |
Burlington Northern Santa Fe Corp. | | United States | | 307,940 | | | 30,369,043 |
| | | | | | | |
Semiconductors & Semiconductor Equipment 1.4% | | | | | | | |
aLSI Corp. | | United States | | 7,019,253 | | | 42,185,711 |
Maxim Integrated Products Inc. | | United States | | 1,234,198 | | | 25,054,219 |
| | | | | | | |
| | | | | | | 67,239,930 |
| | | | | | | |
Software 2.7% | | | | | | | |
Microsoft Corp. | | United States | | 3,325,773 | | | 101,402,819 |
hNintendo Co. Ltd. | | Japan | | 123,923 | | | 29,374,735 |
| | | | | | | |
| | | | | | | 130,777,554 |
| | | | | | | |
Tobacco 9.2% | | | | | | | |
Altria Group Inc. | | United States | | 4,336,384 | | | 85,123,218 |
British American Tobacco PLC | | United Kingdom | | 3,805,987 | | | 123,966,770 |
British American Tobacco PLC, ADR | | United Kingdom | | 4,218 | | | 272,736 |
Imperial Tobacco Group PLC | | United Kingdom | | 3,149,559 | | | 99,558,955 |
Japan Tobacco Inc. | | Japan | | 8,960 | | | 30,162,185 |
KT&G Corp. | | South Korea | | 554,296 | | | 30,612,664 |
Lorillard Inc. | | United States | | 250,360 | | | 20,086,383 |
Philip Morris International Inc. | | United States | | 500,960 | | | 24,141,262 |
Reynolds American Inc. | | United States | | 589,286 | | | 31,214,480 |
| | | | | | | |
| | | | | | | 445,138,653 |
| | | | | | | |
Transportation Infrastructure 0.2% | | | | | | | |
Groupe Eurotunnel SA | | France | | 1,235,859 | | | 11,569,721 |
| | | | | | | |
Wireless Telecommunication Services 1.2% | | | | | | | |
Vodafone Group PLC | | United Kingdom | | 24,936,390 | | | 57,819,793 |
| | | | | | | |
Total Common Stocks and Other Equity Interests
(Cost $3,875,515,259) | | | | | | | 3,968,504,888 |
| | | | | | | |
MS-16
Franklin Templeton Variable Insurance Products Trust
Statement of Investments, December 31, 2009 (continued)
| | | | | | | | |
| Franklin Mutual Shares Securities Fund | | Country | | Shares/
Warrants/
Contracts | | | Value |
Preferred Stocks 0.6% | | | | | | | | |
Diversified Financial Services 0.4% | | | | | | | | |
aBank of America Corp., pfd. | | United States | | 1,337,100 | | | $ | 19,949,532 |
| | | | | | | | |
Diversified Telecommunication Services 0.0%b | | | | | | | | |
a,ePTV Inc., 10.00%, pfd., A | | United Kingdom | | 17,300 | | | | 2,863 |
| | | | | | | | |
Machinery 0.2% | | | | | | | | |
.e,f,g,iMCII Holdings Inc., PIK, pfd., A | | United States | | 16,805 | | | | 7,810,403 |
| | | | | | | | |
Total Preferred Stocks (Cost $36,702,540) | | | | | | | | 27,762,798 |
| | | | | | | | |
| | | |
| | | | | Principal
Amountj | | | |
Corporate Bonds, Notes and Senior Floating Rate Interests 4.9% | | | | | | |
American General Finance Corp., senior note, J, 6.90%, 12/15/17 | | United States | | 6,255,000 | | | | 4,349,139 |
kBoston Generating LLC, FRN, | | | | | | | | |
Revolver, 0.126%, 12/21/13 | | United States | | 469,092 | | | | 364,803 |
Synthetic Letter of Credit, 0.126%, 12/21/13 | | United States | | 1,675,285 | | | | 1,302,834 |
Term Loan B, 2.501%, 12/21/13 | | United States | | 7,344,972 | | | | 5,712,031 |
e,lCerberus CG Investor I LLC, 12.00%, 7/31/14 | | United States | | 7,173,000 | | | | 1,506,330 |
e,lCerberus CG Investor II LLC, 12.00%, 7/31/14 | | United States | | 7,173,000 | | | | 1,506,330 |
e,lCerberus CG Investor III LLC, 12.00%, 7/31/14 | | United States | | 3,586,500 | | | | 753,165 |
kCharter Communications Operating LLC, FRN, | | | | | | | | |
Incremental Term Loan, 7.25%, 3/06/14 | | United States | | 4,477,633 | | | | 4,575,021 |
Term Loan B, 2.26%, 3/06/14 | | United States | | 25,670,297 | | | | 24,119,375 |
CIT Group Inc., | | | | | | | | |
kNew Term Loan Tranche 1B, FRN, 13.00%, 1/20/12 | | United States | | 6,821,000 | | | | 7,087,449 |
senior secured sub. bond, 7.00%, 5/01/13 | | United States | | 2,029,774 | | | | 1,907,988 |
senior secured sub. bond, 7.00%, 5/01/14 | | United States | | 3,044,660 | | | | 2,835,340 |
senior secured sub. bond, 7.00%, 5/01/15 | | United States | | 3,044,660 | | | | 2,740,194 |
senior secured sub. bond, 7.00%, 5/01/16 | | United States | | 5,074,436 | | | | 4,490,876 |
senior secured sub. bond, 7.00%, 5/01/17 | | United States | | 7,104,211 | | | | 6,198,424 |
kTerm Loan Tranche 2A, FRN, 9.50%, 1/20/12 | | United States | | 19,912,000 | | | | 20,459,580 |
DecisionOne Corp., | | | | | | | | |
esenior secured note, 15.00%, 11/30/13 | | United States | | 143,788 | | | | 143,788 |
dTerm Loan B, 15.00%, 8/29/13 | | United States | | 25,150 | | | | 25,150 |
Exterran Holding Inc., senior note, cvt., 4.25%, 6/15/14 | | United States | | 4,517,000 | | | | 5,307,475 |
kFirst Data Corp., Term Loan, FRN, | | | | | | | | |
B-1, 2.982%, 9/24/14 | | United States | | 22,320,902 | | | | 19,865,603 |
B-2, 2.999%, 9/24/14 | | United States | | 13,377,618 | | | | 11,936,180 |
B-3, 2.999%, 9/24/14 | | United States | | 1,466,645 | | | | 1,303,481 |
d,f,kInternational Automotive Components Group NA Inc., Revolver,
FRN, 6.25%, 1/18/14 | | United States | | 959,420 | | | | 959,420 |
e,f,lInternational Automotive Components Group NA LLC, 9.00%, 4/01/17 | | United States | | 1,456,500 | | | | 1,459,749 |
Realogy Corp., | | | | | | | | |
h,kDelayed Draw Term B Loan, FRN, 3.287%, 10/10/13 | | United States | | 21,390,560 | | | | 19,073,256 |
h,kInitial Term Loan B, FRN, 3.287%, 10/10/13 | | United States | | 29,896,167 | | | | 26,657,425 |
Second Lien Tranche A Term Loan, 13.50%, 10/15/17 | | United States | | 1,642,000 | | | | 1,741,888 |
h,kSynthetic Letter of Credit, FRN, 0.094%, 10/10/13 | | United States | | 8,048,983 | | | | 7,177,012 |
kSpectrum Brands Inc., FRN, | | | | | | | | |
Dollar Term Loan B, 8.00%, 6/30/12 | | United States | | 919,965 | | | | 912,778 |
Euro Term Loan, 8.50%, 6/30/12 | | United States | | 2,893,663 | EUR | | | 4,010,166 |
Letter of Credit Commitment, 1.50%, 6/30/12 | | United States | | 47,217 | | | | 46,800 |
MS-17
Franklin Templeton Variable Insurance Products Trust
Statement of Investments, December 31, 2009 (continued)
| | | | | | | | | |
| Franklin Mutual Shares Securities Fund | | Country | | Principal
Amountj | | | Value | |
Corporate Bonds, Notes and Senior Floating Rate Interests (continued) | | | | | | | |
kTexas Competitive Electric Holdings Co. LLC, FRN, | | | | | | | | | |
hDelayed Draw Term Loan, 3.735%, 10/10/14 | | United States | | 27,451,537 | | | $ | 22,112,213 | |
Initial Tranche B-1 Term Loan, 3.775%, 10/10/14 | | United States | | 18,676,174 | | | | 15,221,082 | |
Tranche B-2 Term Loan, 3.735%, 10/10/14 | | United States | | 2,944,941 | | | | 2,405,649 | |
Tranche B-3 Term Loan, 3.735%, 10/10/14 | | United States | | 10,413,700 | | | | 8,429,890 | |
d,iTVMAX Holdings Inc., PIK, | | | | | | | | | |
11.50%, 3/31/10 | | United States | | 82,599 | | | | 18,339 | |
14.00%, 3/31/10 | | United States | | 237,470 | | | | 47,151 | |
| | | | | | | | | |
Total Corporate Bonds, Notes and Senior Floating Rate Interests (Cost $226,205,615) | | | | | | | | 238,763,374 | |
| | | | | | | | | |
Corporate Bonds and Notes in Reorganization 0.0%b | | | | | | | | | |
d,lSafety Kleen Services, senior sub. note, 9.25%, 6/01/08 | | United States | | 5,000 | | | | 25 | |
f,lWimar OPCO LLC/Finance Corp., senior sub. note, 9.625%, 12/15/14 | | United States | | 18,305,000 | | | | 102,966 | |
| | | | | | | | | |
Total Corporate Bonds and Notes in Reorganization
(Cost $12,081,041) | | | | | | | | 102,991 | |
| | | | | | | | | |
| | | |
| | | | | Shares | | | | |
Companies in Liquidation 0.0% | | | | | | | | | |
a,e,f,gCB FIM Coinvestors LLC | | United States | | 6,400,507 | | | | — | |
a,e,lFIM Coinvestor Holdings I, LLC | | United States | | 8,006,950 | | | | — | |
| | | |
| | | | | Principal
Amountj | | | | |
dPeregrine Investments Holdings Ltd., 6.70%, 1/15/98 | | Hong Kong | | 5,000,000 | JPY | | | — | |
dPIV Investment Finance (Cayman) Ltd., 4.50%, 12/01/00 | | Hong Kong | | 12,200,000 | | | | — | |
| | | | | | | | | |
Total Companies in Liquidation (Cost $—) | | | | | | | | — | |
| | | | | | | | | |
Total Investments before Short Term Investments
(Cost $4,150,504,455) | | | | | | | | 4,235,134,051 | |
| | | | | | | | | |
Short Term Investments 11.8% | | | | | | | | | |
Senior Floating Rate Interests (Cost $619,472) 0.0%b | | | | | | | | | |
k,mLyondell Chemical Co., DIP Delayed Draw Term Loan, FRN, 13.00%, 4/06/10 | | United States | | 623,229 | | | | 651,741 | |
| | | | | | | | | |
U.S. Government and Agency Securities 11.8% | | | | | | | | | |
nFHLB, 1/04/10 | | United States | | 13,500,000 | | | | 13,500,000 | |
nU.S. Treasury Bills,
5/06/10 | | United States | | 50,000,000 | | | | 49,982,700 | |
o1/07/10 - 6/10/10 | | United States | | 510,000,000 | | | | 509,907,595 | |
| | | | | | | | | |
Total U.S. Government and Agency Securities
(Cost $573,299,541) | | | | | | | | 573,390,295 | |
| | | | | | | | | |
Total Investments (Cost $4,724,423,468) 98.9% | | | | | | | | 4,809,176,087 | |
Securities Sold Short (0.8)% | | | | | | | | (37,204,123 | ) |
Other Assets, less Liabilities 1.9% | | | | | | | | 90,462,726 | |
| | | | | | | | | |
Net Assets 100.0% | | | | | | | $ | 4,862,434,690 | |
| | | | | | | | | |
MS-18
Franklin Templeton Variable Insurance Products Trust
Statement of Investments, December 31, 2009 (continued)
| | | | | | | | |
| Franklin Mutual Shares Securities Fund | | Country | | Shares | | Value | |
pSecurities Sold Short (Proceeds $37,688,929) (0.8)% | | | | | | | | |
Oil & Gas & Consumable Fuels (0.8)% | | | | | | | | |
Exxon Mobil Corp. | | United States | | 545,595 | | $ | (37,204,123 | ) |
| | | | | | | | |
aNon-income producing.
bRounds to less than 0.1% of net assets.
cContingent distributions represent the right to receive additional distributions, if any, during the reorganization of the underlying company. Shares represent total underlying principal of debt securities.
dSecurity has been deemed illiquid because it may not be able to be sold within seven days. At December 31, 2009, the aggregate value of these securities was $9,230,455, representing 0.19% of net assets.
eSee Note 9 regarding restricted securities.
fSee Note 14 regarding other considerations.
gSee Note 13 regarding holdings of 5% voting securities.
hA portion or all of the security purchased on a delayed delivery basis. See Note 1(c).
iIncome may be received in additional securities and/or cash.
jThe principal amount is stated in U.S. dollars unless otherwise indicated.
kThe coupon rate shown represents the rate at period end.
lSee Note 7 regarding credit risk and defaulted securities.
mSee Note 10 regarding unfunded loan commitments.
nThe security is traded on a discount basis with no stated coupon rate.
oSecurity or a portion of the security has been segregated as collateral for securities sold short. At December 31, 2009, the value of these securities and/or cash pledged amounted to $56,184,512.
pSee Note 1(e) regarding securities sold short.
MS-19
Franklin Templeton Variable Insurance Products Trust
Statement of Investments, December 31, 2009 (continued)
| | | | | | |
| Franklin Mutual Shares Securities Fund | | | | | | |
At December 31, 2009, the Fund had the following forward exchange contracts outstanding. See Note 1(d).
Forward Exchange Contracts
| | | | | | | | | | | | | | | | | | |
| Currency | | Counterparty | | Type | | Quantity | | Contract
Amount | | Settlement
Date | | Unrealized
Appreciation | | Unrealized
Depreciation | |
British Pound | | DBAB | | Sell | | 2,249,379 | | $ | 3,616,772 | | 1/13/10 | | $ | — | | $ | (16,268 | ) |
British Pound | | BOFA | | Sell | | 1,300,000 | | | 2,086,370 | | 1/13/10 | | | — | | | (13,299 | ) |
British Pound | | SSBT | | Sell | | 62,653 | | | 99,936 | | 1/13/10 | | | — | | | (1,256 | ) |
British Pound | | BOFA | | Sell | | 9,032,390 | | | 15,090,826 | | 1/13/10 | | | 502,340 | | | — | |
British Pound | | SSBT | | Sell | | 13,593,612 | | | 22,603,768 | | 1/13/10 | | | 648,315 | | | — | |
British Pound | | DBAB | | Sell | | 11,591,475 | | | 19,082,266 | | 1/13/10 | | | 360,525 | | | — | |
Euro | | SSBT | | Buy | | 616,449 | | | 916,321 | | 1/14/10 | | | — | | | (33,924 | ) |
Euro | | BOFA | | Buy | | 396,995 | | | 584,496 | | 1/14/10 | | | — | | | (16,230 | ) |
Euro | | BZWS | | Sell | | 7,600,000 | | | 11,222,788 | | 1/14/10 | | | 344,010 | | | — | |
Euro | | SSBT | | Sell | | 142,051,602 | | | 208,839,832 | | 1/14/10 | | | 5,504,592 | | | — | |
Euro | | DBAB | | Sell | | 3,292,416 | | | 4,924,383 | | 1/14/10 | | | 211,559 | | | — | |
Euro | | HSBC | | Sell | | 1,050,000 | | | 1,576,071 | | 1/14/10 | | | 73,082 | | | — | |
South Korean Won | | BOFA | | Sell | | 7,902,918,000 | | | 6,730,000 | | 1/15/10 | | | — | | | (43,881 | ) |
South Korean Won | | DBAB | | Sell | | 2,720,712,500 | | | 2,350,000 | | 1/15/10 | | | 17,977 | | | — | |
South Korean Won | | BOFA | | Sell | | 11,688,515,000 | | | 10,090,000 | | 1/15/10 | | | 71,344 | | | — | |
Australian Dollar | | BOFA | | Buy | | 3,270,000 | | | 2,971,847 | | 1/19/10 | | | — | | | (43,338 | ) |
Australian Dollar | | DBAB | | Buy | | 1,870,000 | | | 1,705,962 | | 1/19/10 | | | — | | | (31,249 | ) |
Australian Dollar | | BOFA | | Sell | | 600,000 | | | 536,760 | | 1/19/10 | | | — | | | (581 | ) |
Australian Dollar | | DBAB | | Sell | | 11,000,000 | | | 10,164,000 | | 1/19/10 | | | 312,746 | | | — | |
Canadian Dollar | | DBAB | | Sell | | 888,516 | | | 830,234 | | 1/29/10 | | | — | | | (15,052 | ) |
Canadian Dollar | | BOFA | | Buy | | 888,516 | | | 837,354 | | 1/29/10 | | | 7,932 | | | — | |
Euro | | SSBT | | Sell | | 1,460,927 | | | 2,161,427 | | 1/29/10 | | | 70,279 | | | — | |
Euro | | BZWS | | Sell | | 68,000,000 | | | 100,327,200 | | 1/29/10 | | | 2,993,093 | | | — | |
British Pound | | BZWS | | Sell | | 3,490,000 | | | 5,762,983 | | 2/10/10 | | | 127,099 | | | — | |
British Pound | | DBAB | | Sell | | 57,295,000 | | | 94,653,990 | | 2/10/10 | | | 2,130,218 | | | — | |
British Pound | | SSBT | | Sell | | 328,022 | | | 537,227 | | 2/10/10 | | | 7,516 | | | — | |
British Pound | | BOFA | | Sell | | 830,000 | | | 1,376,555 | | 2/10/10 | | | 36,216 | | | — | |
Euro | | DBAB | | Sell | | 36,400,000 | | | 54,683,720 | | 2/16/10 | | | 2,583,140 | | | — | |
Euro | | BZWS | | Sell | | 36,400,000 | | | 54,709,200 | | 2/16/10 | | | 2,608,620 | | | — | |
Euro | | SSBT | | Sell | | 18,000,000 | | | 27,108,000 | | 2/16/10 | | | 1,343,977 | | | — | |
Norwegian Krone | | HAND | | Sell | | 8,220,621 | | | 1,420,000 | | 2/16/10 | | | — | | | (16,337 | ) |
Norwegian Krone | | DBAB | | Sell | | 110,000,000 | | | 19,470,060 | | 2/16/10 | | | 532,473 | | | — | |
Norwegian Krone | | SSBT | | Sell | | 56,344,778 | | | 9,969,527 | | 2/16/10 | | | 269,217 | | | — | |
Norwegian Krone | | BZWS | | Sell | | 110,000,000 | | | 19,463,170 | | 2/16/10 | | | 525,583 | | | — | |
Norwegian Krone | | BOFA | | Sell | | 6,270,786 | | | 1,120,000 | | 2/16/10 | | | 40,422 | | | — | |
Norwegian Krone | | HAND | | Sell | | 3,347,505 | | | 600,000 | | 2/16/10 | | | 23,694 | | | — | |
Euro | | DBAB | | Sell | | 29,591,513 | | | 44,568,319 | | 2/26/10 | | | 2,213,780 | | | — | |
Euro | | BZWS | | Sell | | 24,000,000 | | | 36,139,200 | | 2/26/10 | | | 1,787,833 | | | — | |
British Pound | | BOFA | | Sell | | 20,000,000 | | | 32,180,000 | | 3/15/10 | | | — | | | (110,675 | ) |
British Pound | | BZWS | | Sell | | 19,912,412 | | | 32,045,045 | | 3/15/10 | | | — | | | (104,217 | ) |
British Pound | | SSBT | | Sell | | 52,410,714 | | | 87,279,562 | | 3/15/10 | | | 2,660,695 | | | — | |
Euro | | BZWS | | Sell | | 37,975,537 | | | 57,001,280 | | 3/15/10 | | | 2,648,790 | | | — | |
Singapore Dollar | | SSBT | | Sell | | 15,515,021 | | | 10,973,055 | | 3/24/10 | | | — | | | (56,245 | ) |
Singapore Dollar | | BOFA | | Sell | | 535,952 | | | 380,000 | | 3/24/10 | | | — | | | (997 | ) |
Singapore Dollar | | SSBT | | Buy | | 644,800 | | | 458,722 | | 3/24/10 | | | — | | | (347 | ) |
Singapore Dollar | | SSBT | | Buy | | 2,273,000 | | | 1,614,452 | | 3/24/10 | | | 3,537 | | | — | |
Singapore Dollar | | SSBT | | Sell | | 2,131,500 | | | 1,525,049 | | 3/24/10 | | | 9,811 | | | — | |
British Pound | | DBAB | | Sell | | 43,750,000 | | | 73,062,500 | | 4/12/10 | | | 2,438,693 | | | — | |
Japanese Yen | | HAND | | Buy | | 82,317,690 | | | 910,000 | | 4/20/10 | | | — | | | (24,047 | ) |
MS-20
Franklin Templeton Variable Insurance Products Trust
Statement of Investments, December 31, 2009 (continued)
| | | | | | |
| Franklin Mutual Shares Securities Fund | | | | | | |
Forward Exchange Contracts (continued)
| | | | | | | | | | | | | | | | | | |
| Currency | | Counterparty | | Type | | Quantity | | Contract
Amount | | Settlement
Date | | Unrealized
Appreciation | | Unrealized
Depreciation | |
Japanese Yen | | DBAB | | Buy | | 40,858,200 | | $ | 450,000 | | 4/20/10 | | $ | — | | $ | (10,259 | ) |
Japanese Yen | | BOFA | | Buy | | 75,409,425 | | | 819,000 | | 4/20/10 | | | — | | | (7,397 | ) |
Japanese Yen | | DBAB | | Sell | | 1,839,874,539 | | | 20,225,497 | | 4/20/10 | | | 423,638 | | | — | |
Japanese Yen | | SSBT | | Sell | | 322,941,215 | | | 3,572,526 | | 4/20/10 | | | 96,834 | | | — | |
Japanese Yen | | BOFA | | Sell | | 30,007,720 | | | 340,000 | | 4/20/10 | | | 17,039 | | | — | |
Danish Krone | | HAND | | Buy | | 2,561,730 | | | 510,000 | | 4/23/10 | | | — | | | (17,865 | ) |
Danish Krone | | HAND | | Sell | | 60,479,890 | | | 12,153,356 | | 4/23/10 | | | 534,539 | | | — | |
Danish Krone | | SSBT | | Sell | | 38,000,000 | | | 7,628,454 | | 4/23/10 | | | 328,258 | | | — | |
Danish Krone | | BOFA | | Sell | | 1,730,225 | | | 350,000 | | 4/23/10 | | | 17,606 | | | — | |
Danish Krone | | DBAB | | Sell | | 1,707,514 | | | 340,000 | | 4/23/10 | | | 11,969 | | | — | |
Swiss Franc | | DBAB | | Sell | | 33,000,000 | | | 31,058,824 | | 5/10/10 | | | — | | | (850,771 | ) |
Swiss Franc | | SSBT | | Sell | | 34,745,666 | | | 32,777,222 | | 5/10/10 | | | — | | | (820,357 | ) |
Swiss Franc | | BZWS | | Sell | | 18,913,171 | | | 17,810,690 | | 5/10/10 | | | — | | | (477,541 | ) |
Swiss Franc | | BOFA | | Sell | | 12,863,302 | | | 12,140,230 | | 5/10/10 | | | — | | | (298,035 | ) |
Swiss Franc | | SSBT | | Buy | | 7,967,266 | | | 7,842,259 | | 5/10/10 | | | — | | | (138,252 | ) |
Swiss Franc | | FBCO | | Sell | | 201,959 | | | 195,000 | | 5/10/10 | | | — | | | (286 | ) |
Swiss Franc | | BZWS | | Sell | | 2,026,012 | | | 1,990,000 | | 5/10/10 | | | 30,933 | | | — | |
Swiss Franc | | DBAB | | Sell | | 2,796,259 | | | 2,760,001 | | 5/10/10 | | | 56,138 | | | — | |
Swiss Franc | | SSBT | | Sell | | 14,859,960 | | | 14,573,849 | | 5/10/10 | | | 204,901 | | | — | |
Swiss Franc | | BOFA | | Sell | | 1,854,325 | | | 1,840,000 | | 5/10/10 | | | 46,947 | | | — | |
Swiss Franc | | HSBC | | Sell | | 930,120 | | | 920,000 | | 5/10/10 | | | 20,614 | | | — | |
British Pound | | DBAB | | Sell | | 26,250,000 | | | 43,882,125 | | 5/12/10 | | | 1,514,833 | | | — | |
| | | | | | | | | | | | | | | |
Unrealized appreciation (depreciation) | | | | | | | | | | 36,413,357 | | | (3,148,706 | ) |
| | | | | | | | | | | | | | | |
Net unrealized appreciation (depreciation) | | | | | | | $ | 33,264,651 | | | | |
| | | | | | | | | | | | | | | | | | |
See Abbreviations on page MS-38.
The accompanying notes are an integral part of these financial statements.
MS-21
Franklin Templeton Variable Insurance Products Trust
Financial Statements
Statement of Assets and Liabilities
December 31, 2009
| | | | |
| | | Mutual Shares
Securities Fund | |
Assets: | | | | |
Investments in securities: | | | | |
Cost - Unaffiliated issuers | | $ | 4,699,681,681 | |
Cost - Non-controlled affiliated issuers (Note 13) | | | 24,741,787 | |
| | | | |
Total cost of investments | | $ | 4,724,423,468 | |
| | | | |
Value - Unaffiliated issuers | | $ | 4,801,365,684 | |
Value - Non-controlled affiliated issuers (Note 13) | | | 7,810,403 | |
| | | | |
Total value of investments | | | 4,809,176,087 | |
Cash | | | 2,924,881 | |
Foreign currency, at value (cost $29,476,955) | | | 29,442,867 | |
Receivables: | | | | |
Investment securities sold | | | 8,133,718 | |
Capital shares sold | | | 949,253 | |
Dividends and interest | | | 10,243,245 | |
Due from brokers | | | 35,937,962 | |
Unrealized appreciation on forward exchange contracts | | | 36,413,357 | |
Unrealized appreciation on unfunded loan commitments (Note 10) | | | 1,315,867 | |
Other assets | | | 498 | |
| | | | |
Total assets | | | 4,934,537,735 | |
| | | | |
Liabilities: | | | | |
Payables: | | | | |
Investment securities purchased | | | 21,332,519 | |
Capital shares redeemed | | | 2,522,236 | |
Affiliates | | | 4,514,292 | |
Securities sold short, at value (proceeds $37,688,929) | | | 37,204,123 | |
Unrealized depreciation on forward exchange contracts | | | 3,148,706 | |
Accrued expenses and other liabilities | | | 3,381,169 | |
| | | | |
Total liabilities | | | 72,103,045 | |
| | | | |
Net assets, at value | | $ | 4,862,434,690 | |
| | | | |
Net assets consist of: | | | | |
Paid-in capital | | $ | 5,318,141,976 | |
Undistributed net investment income | | | 67,796,719 | |
Net unrealized appreciation (depreciation) | | | 119,875,878 | |
Accumulated net realized gain (loss) | | | (643,379,883 | ) |
| | | | |
Net assets, at value | | $ | 4,862,434,690 | |
| | | | |
The accompanying notes are an integral part of these financial statements.
MS-22
Franklin Templeton Variable Insurance Products Trust
Financial Statements (continued)
Statement of Assets and Liabilities (continued)
December 31, 2009
| | | |
| | | Mutual Shares
Securities Fund |
Class 1: | | | |
Net assets, at value | | $ | 767,553,382 |
| | | |
Shares outstanding | | | 52,026,095 |
| | | |
Net asset value and maximum offering price per share | | $ | 14.75 |
| | | |
Class 2: | | | |
Net assets, at value | | $ | 3,953,435,436 |
| | | |
Shares outstanding | | | 271,129,786 |
| | | |
Net asset value and maximum offering price per share | | $ | 14.58 |
| | | |
Class 4: | | | |
Net assets, at value | | $ | 141,445,872 |
| | | |
Shares outstanding | | | 9,646,190 |
| | | |
Net asset value and maximum offering price per share | | $ | 14.66 |
| | | |
The accompanying notes are an integral part of these financial statements.
MS-23
Franklin Templeton Variable Insurance Products Trust
Financial Statements (continued)
Statement of Operations
for the year ended December 31, 2009
| | | | |
| | | Mutual Shares
Securities Fund | |
Investment income: | | | | |
Dividends: (net of foreign taxes of $4,817,656) | | | | |
Unaffiliated issuers | | $ | 88,824,713 | |
Non-controlled affiliated issuers (Note 13) | | | 694,811 | |
Interest | | | 25,645,727 | |
Adjustment for uncollectible interest (Note 7) | | | (9,452,062 | ) |
Income from securities loaned | | | 28,774 | |
| | | | |
Total investment income | | | 105,741,963 | |
| | | | |
Expenses: | | | | |
Management fees (Note 3a) | | | 24,128,390 | |
Administrative fees (Note 3b) | | | 3,591,049 | |
Distribution fees: (Note 3c) | | | | |
Class 2 | | | 8,611,680 | |
Class 4 | | | 339,119 | |
Unaffiliated transfer agent fees | | | 3,420 | |
Custodian fees (Note 4) | | | 297,923 | |
Reports to shareholders | | | 634,271 | |
Registration and filing fees | | | 1,481 | |
Professional fees | | | 161,859 | |
Trustees’ fees and expenses | | | 23,756 | |
Dividends on securities sold short | | | 2,422,881 | |
Other | | | 264,421 | |
| | | | |
Total expenses | | | 40,480,250 | |
Expense reductions (Note 4) | | | (43,221 | ) |
| | | | |
Net expenses | | | 40,437,029 | |
| | | | |
Net investment income | | | 65,304,934 | |
| | | | |
Realized and unrealized gains (losses): | | | | |
Net realized gain (loss) from: | | | | |
Investments | | | (350,165,962 | ) |
Written options | | | 315,789 | |
Foreign currency transactions | | | (51,171,986 | ) |
Securities sold short | | | (4,780,393 | ) |
| | | | |
Net realized gain (loss) | | | (405,802,552 | ) |
| | | | |
Net change in unrealized appreciation (depreciation) on: | | | | |
Investments | | | 1,304,914,793 | |
Translation of other assets and liabilities denominated in foreign currencies | | | 9,741,449 | |
| | | | |
Net change in unrealized appreciation (depreciation) | | | 1,314,656,242 | |
| | | | |
Net realized and unrealized gain (loss) | | | 908,853,690 | |
| | | | |
Net increase (decrease) in net assets resulting from operations | | $ | 974,158,624 | |
| | | | |
The accompanying notes are an integral part of these financial statements.
MS-24
Franklin Templeton Variable Insurance Products Trust
Financial Statements (continued)
Statements of Changes in Net Assets
| | | | | | | | |
| | | Mutual Shares
Securities Fund | |
| | | Year Ended December 31, | |
| | | 2009 | | | 2008 | |
| | | | |
Increase (decrease) in net assets: | | | | | | | | |
Operations: | | | | | | | | |
Net investment income | | $ | 65,304,934 | | | $ | 96,055,146 | |
Net realized gain (loss) from investments, written options, foreign currency transactions and securities sold short | | | (405,802,552 | ) | | | (246,411,311 | ) |
Net change in unrealized appreciation (depreciation) on investments and translation of other assets and liabilities denominated in foreign currencies | | | 1,314,656,242 | | | | (2,068,869,893 | ) |
| | | | |
Net increase (decrease) in net assets resulting from operations | | | 974,158,624 | | | | (2,219,226,058 | ) |
| | | | |
Distributions to shareholders from: | | | | | | | | |
Net investment income: | | | | | | | | |
Class 1 | | | (11,770,982 | ) | | | (11,945,567 | ) |
Class 2 | | | (67,085,076 | ) | | | (141,276,754 | ) |
Class 4 | | | (2,339,365 | ) | | | (1,103,934 | ) |
Net realized gains: | | | | | | | | |
Class 1 | | | — | | | | (15,383,580 | ) |
Class 2 | | | — | | | | (200,942,848 | ) |
Class 4 | | | — | | | | (1,421,653 | ) |
| | | | |
Total distributions to shareholders | | | (81,195,423 | ) | | | (372,074,336 | ) |
| | | | |
Capital share transactions: (Note 2) | | | | | | | | |
Class 1 | | | 334,577,934 | | | | 217,189,228 | |
Class 2 | | | (105,733,549 | ) | | | (215,728,827 | ) |
Class 4 | | | 59,897,038 | | | | 72,510,540 | |
| | | | |
Total capital share transactions | | | 288,741,423 | | | | 73,970,941 | |
| | | | |
Net increase (decrease) in net assets | | | 1,181,704,624 | | | | (2,517,329,453 | ) |
Net assets: | | | | | | | | |
Beginning of year | | | 3,680,730,066 | | | | 6,198,059,519 | |
| | | | |
End of year | | $ | 4,862,434,690 | | | $ | 3,680,730,066 | |
| | | | |
Undistributed net investment income included in net assets: | | | | | | | | |
End of year | | $ | 67,796,719 | | | $ | 82,483,212 | |
| | | | |
The accompanying notes are an integral part of these financial statements.
MS-25
Franklin Templeton Variable Insurance Products Trust
Notes to Financial Statements
Mutual Shares Securities Fund
1. ORGANIZATION AND SIGNIFICANT ACCOUNTING POLICIES
Franklin Templeton Variable Insurance Products Trust (Trust) is registered under the Investment Company Act of 1940, as amended, (1940 Act) as an open-end investment company, consisting of twenty-two separate funds. The Mutual Shares Securities Fund (Fund) is included in this report. The financial statements of the remaining funds in the Trust are presented separately. Shares of the Fund are generally sold only to insurance company separate accounts to fund the benefits of variable life insurance policies or variable annuity contracts. The Fund offers three classes of shares: Class 1, Class 2, and Class 4. Each class of shares differs by its distribution fees, voting rights on matters affecting a single class and its exchange privilege.
The following summarizes the Fund’s significant accounting policies.
a. Security Valuation
Equity and other securities listed on a securities exchange or on the NASDAQ National Market System are valued at the last quoted sale price or the official closing price of the day, respectively. Over-the-counter securities and listed securities for which there is no reported sale are valued within the range of the most recent quoted bid and ask prices. Securities that trade in multiple markets or on multiple exchanges are valued according to the broadest and most representative market. Certain equity securities are valued based upon fundamental characteristics or relationships to similar securities.
Corporate debt securities and government securities generally trade in the over-the-counter market rather than on a securities exchange. The Fund may utilize independent pricing services, quotations from bond dealers, and information with respect to bond and note transactions, to assist in determining a current market value for each security. The Fund’s pricing services may use valuation models or matrix pricing which considers information with respect to comparable bond and note transactions, quotations from bond dealers, or by reference to other securities that are considered comparable in such characteristics as rating, interest rate and maturity date, option adjusted spread models, prepayment projections, interest rate spreads and yield curves, to determine current value. Debt securities denominated in a foreign currency are converted into their U.S. dollar equivalent at the foreign exchange rate in effect at the close of the NYSE on the date that the values of the foreign debt securities are determined.
Senior secured corporate loans with floating or variable interest rates generally trade in the over-the-counter market rather than on a securities exchange. The Fund may utilize independent pricing services, quotations from loan dealers and other financial institutions, and information with respect to bond and note transactions, to assist in determining a current market value for each security. The Fund’s pricing services use independent market quotations from loan dealers or financial institutions and may incorporate valuation methodologies that consider multiple bond characteristics such as dealer quotes, issuer type, coupon, maturity, weighted average maturity, interest rate spreads and yield curves, cash flow and credit risk/quality analysis, to determine current value.
Foreign equity securities are valued as of the close of trading on the foreign stock exchange on which the security is primarily traded, or the NYSE, whichever is earlier. If no sale is reported at that time, the foreign equity security will be valued within the range of the most recent quoted bid and ask prices. The value is then converted into its U.S. dollar equivalent at the foreign exchange rate in effect at the close of the NYSE on the day that the value of the security is determined.
The Fund has procedures to determine the fair value of individual securities and other assets for which market prices are not readily available or which may not be reliably priced. Methods for valuing these securities may include: fundamental analysis based upon the underlying investment book value, anticipated future cash flows, market changes in comparable or similar securities, matrix pricing, discounts from market prices of similar securities, or discounts applied due to the nature and duration of restrictions on the disposition of the securities. Due to the inherent uncertainty of valuations of such securities, the fair values may differ significantly from the values that would have been used had a ready market for such investments existed. Occasionally, events occur between the time at which trading in a security is completed and the close of the NYSE that might call into question the availability (including the reliability) of the value of a portfolio security held by the Fund. The investment manager monitors price movements following the close of trading in foreign stock markets through a series of country specific
MS-26
Franklin Templeton Variable Insurance Products Trust
Notes to Financial Statements (continued)
Mutual Shares Securities Fund
1. ORGANIZATION AND SIGNIFICANT ACCOUNTING POLICIES (continued)
a. Security Valuation (continued)
market proxies (such as baskets of American Depository Receipts, futures contracts and exchange traded funds). These price movements are measured against established trigger thresholds for each specific market proxy to assist in determining if an event has occurred. If such an event occurs, the securities may be valued using fair value procedures, which may include the use of independent pricing services. All security valuation procedures are approved by the Fund’s Board of Trustees.
b. Foreign Currency Translation
Portfolio securities and other assets and liabilities denominated in foreign currencies are translated into U.S. dollars based on the exchange rate of such currencies against U.S. dollars on the date of valuation. The Fund may enter into foreign currency exchange contracts to facilitate transactions denominated in a foreign currency. Purchases and sales of securities, income and expense items denominated in foreign currencies are translated into U.S. dollars at the exchange rate in effect on the transaction date. Occasionally, events may impact the availability or reliability of foreign exchange rates used to convert the U.S. dollar equivalent value. If such an event occurs, the foreign exchange rate will be valued at fair value using procedures established and approved by the Fund’s Board of Trustees.
The Fund does not separately report the effect of changes in foreign exchange rates from changes in market prices on securities held. Such changes are included in net realized and unrealized gain or loss from investments on the Statement of Operations.
Realized foreign exchange gains or losses arise from sales of foreign currencies, currency gains or losses realized between the trade and settlement dates on securities transactions and the difference between the recorded amounts of dividends, interest, and foreign withholding taxes and the U.S. dollar equivalent of the amounts actually received or paid. Net unrealized foreign exchange gains and losses arise from changes in foreign exchange rates on foreign denominated assets and liabilities other than investments in securities held at the end of the reporting period.
c. Securities Purchased on a Delayed Delivery Basis
The Fund may purchase securities on a delayed delivery basis, with payment and delivery scheduled for a future date. These transactions are subject to market fluctuations and are subject to the risk that the value at delivery may be more or less than the trade date purchase price. Although the Fund will generally purchase these securities with the intention of holding the securities, it may sell the securities before the settlement date. Sufficient assets have been segregated for these securities.
d. Derivative Financial Instruments
The Fund may invest in derivative financial instruments (derivatives) in order to manage risk or gain exposure to various other investments or markets. Derivatives are financial contracts based on an underlying or notional amount, require no initial investment or an initial net investment that is smaller than would normally be required to have a similar response to changes in market factors, and require or permit net settlement. Derivatives may contain various risks including the potential inability of the counterparty to fulfill their obligations under the terms of the contract, the potential for an illiquid secondary market, and the potential for market movements which may expose the Fund to gains or losses in excess of the amounts shown on the Statement of Assets and Liabilities.
Derivatives are marked to market daily based upon quotations from market makers or the Fund’s independent pricing services and the Fund’s net benefit or obligation under the contract, as measured by the fair market value of the contract, is included in net assets. Realized gain and loss and unrealized appreciation and depreciation on these contracts for the period are included in the Statement of Operations.
MS-27
Franklin Templeton Variable Insurance Products Trust
Notes to Financial Statements (continued)
Mutual Shares Securities Fund
1. ORGANIZATION AND SIGNIFICANT ACCOUNTING POLICIES (continued)
d. Derivative Financial Instruments (continued)
The Fund generally enters into forward exchange contracts in order to hedge against fluctuations in foreign exchange rates. A forward exchange contract is an agreement between the Fund and a counterparty to buy or sell a foreign currency for a specific exchange rate on a future date. Pursuant to the terms of the forward exchange contracts, cash or securities may be required to be deposited as collateral.
The Fund generally purchases or writes option contracts in order to manage or gain exposure to equity price risk. An option is a contract entitling the holder to purchase or sell a specific amount of shares or units of a particular security, currency or index, or notional amount of a swap (swaption), at a specified price. Options purchased are recorded as an asset while options written are recorded as a liability. Upon exercise of an option, the acquisition cost or sales proceeds of the security is adjusted by any premium paid or received. Upon expiration of an option, any premium paid or received is recorded as a realized loss or gain. Upon closing an option other than through expiration or exercise, the difference between the premium and the cost to close the position is recorded as a realized gain or loss.
See Note 12 regarding other derivative information.
e. Securities Sold Short
The Fund is engaged in selling securities short, which obligates the Fund to replace a borrowed security with the same security at current market value. The Fund incurs a loss if the price of the security increases between the date of the short sale and the date on which the Fund replaces the borrowed security. The Fund realizes a gain if the price of the security declines between those dates. Gains are limited to the price at which the Fund sold the security short, while losses are potentially unlimited in size.
The Fund is required to establish a margin account with the broker lending the security sold short. While the short sale is outstanding, the broker retains the proceeds of the short sale and the Fund must maintain a deposit with broker consisting of cash and/or securities having a value equal to a specified percentage of the value of the securities sold short. The Fund is obligated to pay the counterparty any dividends or interest due on securities sold short. Such dividends or interest are recorded as an expense to the Fund.
f. Securities Lending
The Fund participates in an agency based security lending program. The Fund receives cash collateral against the loaned securities in an amount equal to at least 102% of the market value of the loaned securities. Collateral is maintained over the life of the loan in an amount not less than 100% of the market value of loaned securities, as determined at the close of Fund business each day; any additional collateral required due to changes in security values is delivered to the Fund on the next business day. The collateral is invested in a non-registered money fund (Bank of New York Institutional Cash Reserve Fund or ICRF), managed by the Fund’s custodian on the Fund’s behalf. The Fund receives income from the investment of cash collateral, in addition to lending fees and rebates paid by the borrower. The Fund bears the market risk with respect to the collateral investment, securities loaned, and the risk that the agent may default on its obligations to the Fund. The securities lending agent has agreed to indemnify the Fund in the event of default by a third party borrower. At December 31, 2009, the Fund had no securities on loan.
g. Senior Floating Rate Interests
Senior secured corporate loans pay interest at rates which are periodically reset by reference to a base lending rate plus a spread. These base lending rates are generally the prime rate offered by a designated U.S. bank or the London InterBank Offered Rate (LIBOR). Senior secured corporate loans often require prepayment of principal from excess cash flows or at the discretion of the borrower. As a result, actual maturity may be substantially less than the stated maturity.
MS-28
Franklin Templeton Variable Insurance Products Trust
Notes to Financial Statements (continued)
Mutual Shares Securities Fund
1. ORGANIZATION AND SIGNIFICANT ACCOUNTING POLICIES (continued)
g. Senior Floating Rate Interests (continued)
Senior secured corporate loans in which the Fund invests are generally readily marketable, but may be subject to some restrictions on resale.
h. Income Taxes
No provision has been made for U.S. income taxes because it is the Fund’s policy to qualify as a regulated investment company under the Internal Revenue Code and to distribute to shareholders substantially all of its taxable income and net realized gains.
The Fund has reviewed the tax positions, taken on federal income tax returns, for each of the three open tax years and as of December 31, 2009, and has determined that no provision for income tax is required in the Fund’s financial statements.
Foreign securities held by the Fund may be subject to foreign taxation on dividend and interest income received. Foreign taxes, if any, are recorded based on the tax regulations and rates that exist in the foreign markets in which the Fund invests.
i. Security Transactions, Investment Income, Expenses and Distributions
Security transactions are accounted for on trade date. Realized gains and losses on security transactions are determined on a specific identification basis. Interest income and estimated expenses are accrued daily. Amortization of premium and accretion of discount on debt securities are included in interest income. Facility fees are recognized as income over the expected term of the loan. Dividend income and dividends declared on securities sold short are recorded on the ex-dividend date except that certain dividends from foreign securities are recognized as soon as the Fund is notified of the ex-dividend date. Distributions to shareholders are recorded on the ex-dividend date and are determined according to income tax regulations (tax basis). Distributable earnings determined on a tax basis may differ from earnings recorded in accordance with accounting principles generally accepted in the United States of America. These differences may be permanent or temporary. Permanent differences are reclassified among capital accounts to reflect their tax character. These reclassifications have no impact on net assets or the results of operations. Temporary differences are not reclassified, as they may reverse in subsequent periods.
Common expenses incurred by the Trust are allocated among the funds based on the ratio of net assets of each fund to the combined net assets of the Trust. Fund specific expenses are charged directly to the fund that incurred the expense.
Realized and unrealized gains and losses and net investment income, not including class specific expenses, are allocated daily to each class of shares based upon the relative proportion of net assets of each class. Differences in per share distributions, by class, are generally due to differences in class specific expenses.
j. Accounting Estimates
The preparation of financial statements in accordance with accounting principles generally accepted in the United States of America requires management to make estimates and assumptions that affect the reported amounts of assets and liabilities at the date of the financial statements and the amounts of income and expenses during the reporting period. Actual results could differ from those estimates.
k. Guarantees and Indemnifications
Under the Trust’s organizational documents, its officers and trustees are indemnified by the Trust against certain liabilities arising out of the performance of their duties to the Trust. Additionally, in the normal course of business, the Trust, on behalf of the Fund, enters into contracts with service providers that contain general indemnification clauses. The Trust’s maximum exposure under these arrangements is unknown as this would involve future claims that may be made against the Trust that have not yet occurred. Currently, the Trust expects the risk of loss to be remote.
MS-29
Franklin Templeton Variable Insurance Products Trust
Notes to Financial Statements (continued)
Mutual Shares Securities Fund
2. SHARES OF BENEFICIAL INTEREST
At December 31, 2009, there were an unlimited number of shares authorized (without par value). Transactions in the Fund’s shares were as follows:
| | | | | | | | | | | | | | |
| | | Year Ended December 31, | |
| | | 2009 | | | 2008a | |
| Class 1 Shares: | | Shares | | | Amount | | | Shares | | | Amount | |
Shares sold | | 27,788,529 | | | $ | 362,470,917 | | | 15,807,156 | | | $ | 251,864,457 | |
Shares issued in reinvestment of distributions | | 864,242 | | | | 11,770,982 | | | 1,694,305 | | | | 27,329,147 | |
Shares redeemed | | (3,455,041 | ) | | | (39,663,965 | ) | | (4,017,273 | ) | | | (62,004,376 | ) |
| | | | |
Net increase (decrease) | | 25,197,730 | | | $ | 334,577,934 | | | 13,484,188 | | | $ | 217,189,228 | |
| | | | |
Class 2 Shares: | | | | | | | | | | | | | | |
Shares sold | | 26,685,456 | | | $ | 332,016,404 | | | 29,551,202 | | | $ | 460,631,440 | |
Shares issued in reinvestment of distributions | | 4,980,332 | | | | 67,085,076 | | | 21,455,774 | | | | 342,219,602 | |
Shares redeemed | | (41,070,597 | ) | | | (504,835,029 | ) | | (64,008,262 | ) | | | (1,018,579,869 | ) |
| | | | |
Net increase (decrease) | | (9,404,809 | ) | | $ | (105,733,549 | ) | | (13,001,286 | ) | | $ | (215,728,827 | ) |
| | | | |
| Class 4 Shares: | | | | | | | | | | | | | | |
Shares sold | | 4,731,346 | | | $ | 58,567,480 | | | 4,692,500 | | | $ | 70,463,022 | |
Shares issued on reinvestment of distributions | | 172,647 | | | | 2,339,365 | | | 156,848 | | | | 2,525,245 | |
Shares redeemed | | (78,048 | ) | | | (1,009,807 | ) | | (29,103 | ) | | | (477,727 | ) |
| | | | |
Net increase (decrease) | | 4,825,945 | | | $ | 59,897,038 | | | 4,820,245 | | | $ | 72,510,540 | |
| | | | |
| aFor | the period February 29, 2008 (effective date) to December 31, 2008 for Class 4. |
3. TRANSACTIONS WITH AFFILIATES
Franklin Resources, Inc. is the holding company for various subsidiaries that together are referred to as Franklin Templeton Investments. Certain officers and trustees of the Trust are also officers and/or directors of the following subsidiaries:
| | |
| Subsidiary | | Affiliation |
Franklin Mutual Advisers, LLC (Franklin Mutual) | | Investment manager |
Franklin Templeton Services, LLC (FT Services) | | Administrative manager |
Franklin Templeton Distributors, Inc. (Distributors) | | Principal underwriter |
Franklin Templeton Investor Services, LLC (Investor Services) | | Transfer agent |
a. Management Fees
The Fund pays an investment management fee to Franklin Mutual based on the average daily net assets of the Fund as follows:
| | |
| Annualized Fee Rate | | Net Assets |
| 0.600% | | Up to and including $5 billion |
| 0.570% | | Over $5 billion, up to and including $10 billion |
| 0.550% | | Over $10 billion, up to and including $15 billion |
| 0.530% | | Over $15 billion, up to and including $20 billion |
| 0.510% | | In excess of $20 billion |
MS-30
Franklin Templeton Variable Insurance Products Trust
Notes to Financial Statements (continued)
Mutual Shares Securities Fund
3. TRANSACTIONS WITH AFFILIATES (continued)
b. Administrative Fees (continued)
The Fund pays an administrative fee to FT Services based on the Fund’s average daily net assets as follows:
| | |
| Annualized Fee Rate | | Net Assets |
| 0.150% | | Up to and including $200 million |
| 0.135% | | Over $200 million, up to and including $700 million |
| 0.100% | | Over $700 million, up to and including $1.2 billion |
| 0.075% | | In excess of $1.2 billion |
c. Distribution Fees
The Fund’s Board of Trustees has adopted distribution plans for Class 2 and Class 4 shares pursuant to Rule 12b-1 under the 1940 Act. Under the Fund’s compensation distribution plans, the Fund pays Distributors for costs incurred in connection with the servicing, sale and distribution of the Fund’s shares up to 0.35% per year of its average daily net assets of each class, respectively. The Board of Trustees has agreed to limit the current rate to 0.25% per year for Class 2.
d. Transfer Agent Fees
Investor Services, under terms of an agreement, performs shareholder servicing for the Fund and is not paid by the Fund for the services.
4. EXPENSE OFFSET ARRANGEMENT
The Fund has entered into an arrangement with its custodian whereby credits realized as a result of uninvested cash balances are used to reduce a portion of the Fund’s custodian expenses. During the year ended December 31, 2009, the custodian fees were reduced as noted in the Statement of Operations.
5. INCOME TAXES
For tax purposes, capital losses may be carried over to offset future capital gains, if any. At December 31, 2009, the capital loss carryforwards were as follows:
| | | |
Capital loss carryforwards expiring in: | | | |
2016 | | $ | 49,725,101 |
2017 | | | 557,680,420 |
| | | |
| | $ | 607,405,521 |
| | | |
The tax character of distributions paid during the years ended December 31, 2009 and 2008, was as follows:
| | | | | | |
| | | 2009 | | 2008 |
Distributions paid from: | | | | | | |
Ordinary income | | $ | 81,195,423 | | $ | 198,602,819 |
Long term capital gain | | | — | | | 173,471,517 |
| | | |
| | $ | 81,195,423 | | $ | 372,074,336 |
| | | |
MS-31
Franklin Templeton Variable Insurance Products Trust
Notes to Financial Statements (continued)
Mutual Shares Securities Fund
5. INCOME TAXES (continued)
At December 31, 2009, the cost of investments, net unrealized appreciation (depreciation) and undistributed ordinary income for income tax purposes were as follows:
| | | | |
Cost of investments | | $ | 4,739,553,561 | |
| | | | |
| |
Unrealized appreciation | | $ | 570,690,921 | |
Unrealized depreciation | | | (501,068,395 | ) |
| | | | |
Net unrealized appreciation (depreciation) | | $ | 69,622,526 | |
| | | | |
Undistributed ordinary income | | $ | 79,386,837 | |
| | | | |
Net investment income differs for financial statement and tax purposes primarily due to differing treatments of defaulted securities, passive foreign investment company shares, pass-through entity income, payments-in-kind, and bond discounts and premiums.
Net realized gains (losses) differ for financial statement and tax purposes primarily due to differing treatments of wash sales, pass-through entity income, and bond discounts and premiums.
6. INVESTMENT TRANSACTIONS
Purchases and sales of investments (excluding short term securities and securities sold short) for the year ended December 31, 2009, aggregated $1,951,701,509 and $1,729,999,864, respectively.
Transactions in options written during the year ended December 31, 2009, were as follows:
| | | | | | | |
| | | Number of
Contracts | | | Premiums
Received | |
Options outstanding at December 31, 2008 | | 1,958 | | | $ | 315,789 | |
Options written | | 7,701 | | | | 978,287 | |
Options expired | | (1,958 | ) | | | (315,789 | ) |
Options exercised | | (7,701 | ) | | | (978,287 | ) |
Options closed | | — | | | | — | |
| | | | |
Options outstanding at December 31, 2009 | | — | | | $ | — | |
| | | | |
7. CREDIT RISK AND DEFAULTED SECURITIES
The Fund may purchase the pre-default or defaulted debt of distressed companies. Distressed companies are financially troubled and are about to be/or are already involved in financial restructuring or bankruptcy. Risks associated with purchasing these securities include the possibility that the bankruptcy or other restructuring process takes longer than expected, or that distributions in restructuring are less than anticipated, either or both of which may result in unfavorable consequences to the Fund. If it becomes probable that income on debt securities, including those of distressed companies, will not be collected, the Fund discontinues accruing income and recognizes an adjustment for uncollectible interest. For the year ended December 31, 2009, the Fund recorded an adjustment for uncollectable interest of $9,452,062, as noted in the Statement of Operations.
At December 31, 2009, the aggregate value of distressed company securities and securities for which interest has been discontinued was $5,328,565, representing 0.11% of the Fund’s net assets. For information as to specific securities, see the accompanying Statements of Investments.
8. CONCENTRATION OF RISK
Investing in foreign securities may include certain risks and considerations not typically associated with investing in U.S. securities, such as fluctuating currency values and changing local and regional economic, political and social conditions, which may result in greater market volatility. In addition, certain foreign securities may not be as liquid as U.S. securities.
MS-32
Franklin Templeton Variable Insurance Products Trust
Notes to Financial Statements (continued)
Mutual Shares Securities Fund
9. RESTRICTED SECURITIES
The Fund may invest in securities that are restricted under the Securities Act of 1933 (1933 Act) or which are subject to legal, contractual, or other agreed upon restrictions on resale. Restricted securities are often purchased in private placement transactions, and cannot be sold without prior registration unless the sale is pursuant to an exemption under the 1933 Act. Disposal of these securities may require greater effort and expense, and prompt sale at an acceptable price may be difficult. The Fund may have registration rights for restricted securities. The issuer generally incurs all registration costs.
At December 31, 2009, the Fund held investments in restricted securities, excluding 144A securities deemed to be liquid, valued in accordance with procedures approved by the Fund’s Board of Trustees as reflecting fair value, as follows:
| | | | | | | | | | |
Principal
Amount/
Shares/
Warrants/
Contracts | | Issuer | | Acquisition
Dates | | Cost | | Value |
| 124,923 | | AboveNet Inc. | | 10/02/01 - 9/08/09 | | $ | 3,452,748 | | $ | 8,124,992 |
| 78 | | AboveNet Inc., stock grant, grant price $10.475, expiration date 9/09/13 | | 4/17/06 - 9/08/06 | | | — | | | 17,024 |
| 17 | | AboveNet Inc., stock grant, grant price $30, expiration date 9/07/18 | | 9/08/09 | | | — | | | 2,383 |
| 2,995 | | AboveNet Inc., wts., 9/08/10 | | 10/02/01 - 9/07/07 | | | 315,092 | | | 299,500 |
| 315,800 | | Bond Street Holdings LLC, A, 144A | | 11/04/09 | | | 6,316,000 | | | 6,316,000 |
| 6,400,507 | | CB FIM Coinvestors LLC | | 1/15/09 - 6/02/09 | | | — | | | — |
| 8,172,654 | | Cerberus CG Investor I LLC | | 7/26/07 - 6/17/08 | | | 8,144,664 | | | 1,716,257 |
| 7,173,000 | | Cerberus CG Investor I LLC, 12.00%, 7/31/14 | | 7/26/07 | | | 7,173,000 | | | 1,506,330 |
| 8,172,654 | | Cerberus CG Investor II LLC | | 7/26/07 - 6/17/08 | | | 8,144,664 | | | 1,716,257 |
| 7,173,000 | | Cerberus CG Investor II LLC, 12.00%, 7/31/14 | | 7/26/07 | | | 7,173,000 | | | 1,506,330 |
| 4,086,327 | | Cerberus CG Investor III LLC | | 7/26/07 - 6/17/08 | | | 4,072,332 | | | 858,129 |
| 3,586,500 | | Cerberus CG Investor III LLC, 12.00%, 7/31/14 | | 7/26/07 | | | 3,586,500 | | | 753,165 |
| 108,227 | | aDecisionOne Corp. | | 3/12/99 - 7/18/00 | | | 76,619 | | | 179,657 |
| 143,788 | | aDecisionOne Corp., senior secured note, 15.00%, 11/30/13 | | 6/1/09 - 10/15/09 | | | 143,788 | | | 143,788 |
| 59,425 | | aDecisionOne Corp., wts., 6/08/17 | | 7/09/07 | | | — | | | — |
| 11,728 | | Elephant Capital Holdings Ltd. | | 8/29/03 - 3/10/08 | | | 1,813,542 | | | — |
| 8,006,950 | | FIM Coinvestor Holdings I, LLC | | 11/20/06 - 6/2/09 | | | — | | | — |
| 5,565,600 | | GLCP Harrah’s Investment LP | | 1/15/08 | | | 5,569,218 | | | — |
| 1,592 | | GMAC Inc | | 11/13/09 | | | 37,699,659 | | | 17,553,796 |
| 168,957 | | IACNA Investor LLC | | 7/24/08 | | | 61,233 | | | 1,689 |
| 1,730,515 | | International Automotive Components Group Brazil LLC | | 4/13/06 - 12/26/08 | | | 1,150,884 | | | 1,940,634 |
| 269,643 | | International Automotive Components Group Japan LLC | | 9/26/06 - 3/27/07 | | | 2,340,729 | | | 1,032,723 |
| 6,170,474 | | International Automotive Components Group LLC | | 1/12/06 - 10/16/06 | | | 6,171,475 | | | 4,206,783 |
| 1,456,500 | | International Automotive Components Group NA LLC, 9.00%, 4/01/17 | | 3/30/07 | | | 1,478,348 | | | 1,459,749 |
| 4,838,053 | | bInternational Automotive Components Group NA LLC, A | | 3/30/07 -10/10/07 | | | 5,147,879 | | | 1,472,461 |
| 2,219 | | MCII Holdings Inc. | | 4/17/09 | | | 2,554,757 | | | — |
| 16,805 | | MCII Holdings Inc., PIK, pfd., A | | 4/17/09 - 10/1/09 | | | 16,617,811 | | | 7,810,403 |
| 57,295 | | NCB Warrant Holdings Ltd., A | | 12/16/05 -3/10/08 | | | 539,528 | | | — |
| 16,280 | | Olympus Re Holdings Ltd. | | 12/19/01 | | | 1,574,304 | | | 34,774 |
| 17,300 | | PTV Inc., 10.00%, pfd., A | | 12/7/01 - 3/6/02 | | | 10,899 | | | 2,863 |
| 433,000 | | State Bank and Trust Co. | | 7/24/09 | | | 4,330,000 | | | 6,170,250 |
| | | | | | | | | | |
| | Total Restricted Securities (1.33% of Net Assets) | | | | | | | $ | 64,825,937 |
| | | | | | | | | | |
aThe Fund also invests in unrestricted securities of the issuer, valued at $25,150 as of December 31, 2009.
bThe Fund also invests in unrestricted securities of the issuer, valued at $959,420 as of December 31, 2009.
MS-33
Franklin Templeton Variable Insurance Products Trust
Notes to Financial Statements (continued)
Mutual Shares Securities Fund
10. UNFUNDED LOAN COMMITMENTS
The Fund may enter into certain credit agreements, all or a portion of which may be unfunded. The Fund is obligated to fund these loan commitments at the borrowers’ discretion. Funded portions of credit agreements are presented on the Statement of Investments.
At December 31, 2009, unfunded commitments were as follows:
| | | |
| Borrower | | Unfunded
Commitment |
Lyondell Chemical Co., DIP Delayed Draw Term Loan, FRN, 13.00%, 4/06/10 | | $ | 311,471 |
Realogy Corp., Revolver, FRN, 2.504%, 4/10/13 | | | 11,080,500 |
| | | |
| | $ | 11,391,971 |
| | | |
Unfunded loan commitments and funded portions of credit agreements are marked to market daily and any unrealized appreciation or depreciation is included in the Statement of Assets and Liabilities and Statement of Operations.
11. UNFUNDED CAPITAL COMMITMENTS
The Fund may enter into certain capital commitments and may be obligated to perform on such agreements at a future date. Unfunded capital commitments requiring recognition are monitored for impairment and any unrealized deprecation is included in the Statement of Assets and Liabilities and the Statement of Operations. At December 31, 2009, the Fund had aggregate unfunded capital commitments of $5,936,277, for which no depreciation has been recognized.
12. OTHER DERIVATIVE INFORMATION
At December 31, 2009, the Fund has invested in derivative contracts which are reflected on the Statement of Assets and Liabilities as follows:
| | | | | | | | | | |
| | | Asset Derivatives | | Liability Derivatives |
Derivative Contracts Not Accounted for as
Hedging Instruments | | Statement of Assets and
Liabilities Location | | Fair
Value
Amount | | Statement of Assets and
Liabilities Location | | Fair
Value
Amount |
Foreign exchange contracts | | Unrealized appreciation on forward exchange contracts | | $ | 36,413,357 | | Unrealized depreciation on forward exchange contracts | | $ | 3,148,706 |
For the year ended December 31, 2009, the effect of derivative contracts on the Fund’s Statement of Operations was as follows:
| | | | | | | | | | | | |
Derivative Contracts Not
Accounted for as Hedging
Instruments | | Statement of Operations Locations | | Realized Gain
(Loss) for the
Year Ended
December 31, 2009 | | | Change in
Unrealized
Appreciation
(Depreciation)
for the
Year Ended
December 31, 2009 | | | Average
Amount
Outstanding
During the
Yeara |
Foreign exchange contracts | | Net realized gain (loss) from foreign currency transactions / Net change in unrealized appreciation (depreciation) on translation of other assets and liabilities denominated in foreign currencies | | $ | (51,135,499 | ) | | $ | 9,641,666 | | | 1,111,127,991 |
Equity contracts | | Net realized gain (loss) from investments and written options / Net change in unrealized appreciation (depreciation) on investments | | | (12,849,665 | ) | | | (227,254 | ) | | 2,874 |
aRepresents the average number of option contracts or notional amount for other derivative contracts outstanding during the period. For derivative contracts denominated in foreign currencies, notional amounts are converted into U.S. dollars.
MS-34
Franklin Templeton Variable Insurance Products Trust
Notes to Financial Statements (continued)
Mutual Shares Securities Fund
12. OTHER DERIVATIVE INFORMATION (continued)
See Note 1(d) regarding derivative financial instruments.
13. HOLDINGS OF 5% VOTING SECURITIES OF PORTFOLIO COMPANIES
The 1940 Act defines “affiliated companies” to include investments in portfolio companies in which a fund owns 5% or more of the outstanding voting securities. Investments in “affiliated companies” for the Fund for the year ended December 31, 2009, were as shown below.
| | | | | | | | | | | | | | | | | |
| Name of Issuer | | Number of Shares
Held at Beginning
of Year | | Gross
Additions | | Gross
Reductions | | Number of Shares
Held at End of
Year | | Value at
End of
Year | | Investment
Income | | Realized Capital
Gain (Loss) |
Non-Controlled Affiliates | | | | | | | | | | | | | | | | | |
CB FIM Coinvestors LLC | | — | | 6,400,507 | | — | | 6,400,507 | | $ | — | | $ | — | | $ | — |
GLCP Harrah’s Investment LP | | 5,565,600 | | — | | — | | 5,565,600 | | | — | | | — | | | — |
MCII Holdings Inc. | | — | | 2,219 | | — | | 2,219 | | | — | | | — | | | — |
MCII Holdings Inc., PIK, pfd., A | | — | | 16,805 | | — | | 16,805 | | | 7,810,403 | | | 694,811 | | | — |
| | | | | | | | | | | |
Total Affiliated Securities (0.16% of Net Assets) | | | | | | $ | 7,810,403 | | $ | 694,811 | | $ | — |
| | | | | | | | | | | |
14. OTHER CONSIDERATIONS
Officers, directors or employees of the Fund’s Investment Manager, may serve from time to time as members of bondholders’ steering committees, official creditors’ committees, or boards of directors of companies in which the Fund invests. Such participation may result in the possession by the Investment Manager of material non-public information which, pursuant to the Fund’s policies and the requirements of applicable securities laws, could prevent the Fund from trading in the securities of such companies for limited or extended periods of time.
15. CREDIT FACILITY
The Fund, together with other U.S. registered and foreign investment funds (collectively “Borrowers”), managed by Franklin Templeton Investments, are borrowers in a joint syndicated senior unsecured credit facility totaling $725 million (Global Credit Facility) to provide a source of funds to the Borrowers for temporary and emergency purposes, including the ability to meet future unanticipated or unusually large redemption requests. Effective January 22, 2010, the Fund renewed the Global Credit Facility, for a total of $750 million, maturing January 21, 2011.
Under the terms of the Global Credit Facility, the Fund shall, in addition to interest charged on any borrowings made by the Fund and other costs incurred by the Fund, pay its share of fees and expenses incurred in connection with the implementation and maintenance of the Global Credit Facility, based upon its relative share of the aggregate net assets of all of the Borrowers, including an annual commitment fee of 0.10% based upon the unused portion of the Global Credit Facility, which is reflected in other expenses on the Statement of Operations. During the year ended December 31, 2009, the Fund did not utilize the Global Credit Facility.
MS-35
Franklin Templeton Variable Insurance Products Trust
Notes to Financial Statements (continued)
Mutual Shares Securities Fund
16. FAIR VALUE MEASUREMENTS
The Fund follow a fair value hierarchy that distinguishes between market data obtained from independent sources (observable inputs) and the Fund’s own market assumptions (unobservable inputs). These inputs are used in determining the value of the Fund’s investments and are summarized in the following fair value hierarchy:
| | • | | Level 1 – quoted prices in active markets for identical securities |
| | • | | Level 2 – other significant observable inputs (including quoted prices for similar securities, interest rates, prepayment speed, credit risk, etc.) |
| | • | | Level 3 – significant unobservable inputs (including the Fund’s own assumptions in determining the fair value of investments) |
The inputs or methodology used for valuing securities are not an indication of the risk associated with investing in those securities.
The following is a summary of the inputs used as of December 31, 2009, in valuing the Fund’s assets and liabilities carried at fair value:
| | | | | | | | | | | | | |
| | | Level 1 | | Level 2 | | Level 3 | | | Total |
| | | |
Assets: | | | | | | | | | | | | | |
Investments in Securities: | | | | | | | | | | | | | |
Equity Investments:a | | | | | | | | | | | | | |
Airlines | | $ | — | | $ | 17,432 | | $ | — | | | $ | 17,432 |
Auto Components | | | — | | | — | | | 8,663,585 | b | | | 8,663,585 |
Chemicals | | | 49,278,596 | | | — | | | 25,000 | | | | 49,303,596 |
Commercial Banks | | | 105,320,453 | | | 6,170,250 | | | — | b | | | 111,490,703 |
Computers & Peripherals | | | 71,207,818 | | | — | | | 179,657 | b | | | 71,387,475 |
Consumer Finance | | | — | | | — | | | 21,844,439 | | | | 21,844,439 |
Diversified Financial Services | | | 101,417,391 | | | — | | | 6,316,000 | b | | | 107,733,391 |
Diversified Telecommunication Services | | | 124,602,861 | | | 302,363 | | | — | b | | | 124,905,224 |
Insurance | | | 257,108,003 | | | — | | | 34,774 | | | | 257,142,777 |
Machinery | | | 5,604,144 | | | — | | | 7,810,403 | b | | | 13,414,547 |
Media | | | 171,166,576 | | | 1,342,824 | | | — | b | | | 172,509,400 |
Real Estate Management & Development | | | 16,343,184 | | | — | | | 8,146,075 | | | | 24,489,259 |
All Other Equity Investmentsc | | | 3,033,365,858 | | | — | | | — | b | | | 3,033,365,858 |
Corporate Bonds, Notes and Senior Floating Rate Interests | | | — | | | 232,343,952 | | | 6,419,422 | | | | 238,763,374 |
Corporate Bonds and Notes in Reorganization | | | — | | | 102,966 | | | 25 | | | | 102,991 |
Companies in Liquidation | | | — | | | — | | | — | b | | | — |
Short Term Investments | | | 559,890,295 | | | 14,151,741 | | | — | | | | 574,042,036 |
| | | |
Total Investments in Securities | | $ | 4,495,305,179 | | $ | 254,431,528 | | $ | 59,439,380 | | | $ | 4,809,176,087 |
| | | |
Forward Exchange Contracts | | | — | | | 36,413,357 | | | — | | | | 36,413,357 |
Unfunded Loan Commitments | | | — | | | 1,315,867 | | | — | | | | 1,315,867 |
| | | | |
Liabilities: | | | | | | | | | | | | | |
Securities Sold Short | | | 37,204,123 | | | — | | | — | | | | 37,204,123 |
Forward Exchange Contracts | | | — | | | 3,148,706 | | | — | | | | 3,148,706 |
aIncludes common and preferred stock as well as other equity investments.
bIncludes securities determined to have no value at December 31, 2009.
cFor detailed industry descriptions, see the accompanying Statements of Investments.
MS-36
Franklin Templeton Variable Insurance Products Trust
Notes to Financial Statements (continued)
Mutual Shares Securities Fund
16. FAIR VALUE MEASUREMENTS (continued)
At December 31, 2009, the reconciliation of assets in which significant unobservable inputs (Level 3) were used in determining fair value, were as follows:
| | | | | | | | | | | | | | | | | | | | | | | | | | | |
| | | Beginning
Balance | | Net Realized
Gain (Loss) | | | Net Change in
Unrealized
Appreciation
(Depreciation) | | | Net
Purchases
(Sales) | | | Transfer In
(Out) of
Level 3 | | | Ending
Balance | | | Net Change in
Unrealized
Appreciation
(Depreciation) on
Assets Held at
Period End | |
| | | | |
Assets | | | | | | | | | | | | | | | | | | | | | | | | | | | |
Investments in Securities: | | | | | | | | | | | | | | | | | | | | | | | | | | | |
Equity Investments:a | | | | | | | | | | | | | | | | | | | | | | | | | | | |
Auto Components | | $ | 3,516,464 | | $ | — | | | $ | 5,147,121 | | | $ | — | | | $ | — | | | $ | 8,663,585 | b | | $ | 5,147,121 | |
Chemicals | | | 25,000 | | | — | | | | — | | | | — | | | | — | | | | 25,000 | | | | — | |
Commercial Banks | | | — | | | — | | | | (255,167 | ) | | | 4,330,000 | | | | (4,074,833 | ) | | | — | b | | | — | |
Computers & Peripherals | | | — | | | — | | | | 179,657 | | | | — | | | | — | | | | 179,657 | b | | | 179,657 | |
Consumer Finance | | | 4,086,327 | | | — | | | | (19,941,548 | ) | | | 37,699,660 | | | | — | | | | 21,844,439 | | | | (19,941,548 | ) |
Diversified Financial Services | | | — | | | — | | | | — | | | | 6,316,000 | | | | — | | | | 6,316,000 | b | | | — | |
Diversified Telecommunication Services | | | 3,134,806 | | | — | | | | 1,895,936 | | | | — | | | | (5,030,742 | ) | | | — | b | | | — | |
Health Care Providers & Services | | | 2,069,470 | | | — | | | | 98,546 | | | | — | | | | (2,168,016 | ) | | | — | | | | — | |
Hotels, Restaurants & Leisure | | | 1,669,680 | | | — | | | | (1,669,680 | ) | | | — | | | | — | | | | — | b | | | (1,669,680 | ) |
Insurance | | | 38,219 | | | — | | | | (3,445 | ) | | | — | | | | — | | | | 34,774 | | | | (3,445 | ) |
Machinery | | | — | | | — | | | | (11,362,166 | ) | | | 19,172,569 | | | | — | | | | 7,810,403 | b | | | (11,362,166 | ) |
Multi-Utilities | | | — | | | 238,771 | | | | 5,895 | | | | (244,666 | ) | | | — | | | | — | | | | — | |
Real Estate Management & Development | | | 5,920,384 | | | — | | | | 2,225,691 | | | | — | | | | — | | | | 8,146,075 | | | | 2,225,691 | |
Corporate Bonds, Notes and Senior Floating Rate Interests | | | 25,333,705 | | | (8,593,908 | ) | | | 15,996,272 | | | | (26,316,647 | ) | | | — | | | | 6,419,422 | | | | 761,214 | |
Corporate Bonds and Notes in Reorganization | | | 367,870 | | | (10,919,436 | ) | | | 13,106,348 | | | | (2,554,757 | ) | | | — | | | | 25 | | | | — | |
Companies in Liquidation | | | 6,692,286 | | | — | | | | (6,692,286 | ) | | | — | | | | — | | | | — | b | | | — | |
| | | | |
Total | | $ | 52,854,211 | | $ | (19,274,573 | ) | | $ | (1,268,826 | ) | | $ | 38,402,159 | | | $ | (11,273,591 | ) | | $ | 59,439,380 | | | $ | (24,663,155 | ) |
| | | | |
aIncludes common and preferred stock as well as other equity investments.
bIncludes securities determined to have no value at December 31, 2009.
17. NEW ACCOUNTING PRONOUNCEMENTS
In January 2010, the Financial Accounting Standards Board issued Accounting Standards Update (ASU) No. 2010-6, Fair Value Measurements and Disclosures (Topic 820): Improving Disclosures about Fair Value Measurements. ASU No. 2010-6 enhances and clarifies existing fair value measurement disclosure requirements and is effective for interim and annual periods beginning after December 15, 2009. The Fund is currently evaluating the impact, if any, of applying the provisions of ASU No. 2010-6.
18. SUBSEQUENT EVENTS
The Fund has evaluated subsequent events through February 10, 2010, the issuance date of the financial statements and determined that no events have occurred that require disclosure.
MS-37
Franklin Templeton Variable Insurance Products Trust
Notes to Financial Statements (continued)
Mutual Shares Securities Fund
| | | | |
| ABBREVIATIONS | | | | |
| | | | |
| Counterparty | | Currency | | Selected Portfolio |
| BOFA - Bank of America N.A. | | EUR - Euro | | ADR - American Depository Receipt |
| BZWS - Barclays Bank PLC | | JPY - Japanese Yen | | DIP - Debtor-In-Possession |
| DBAB - Deutsche Bank AG | | | | FHLB - Federal Home Loan Bank |
| FBCO - Credit Suisse International | | | | FRN - Floating Rate Note |
| HAND - Svenska Handelsbanken | | | | PIK - Payment-In-Kind |
| HSBC - HSBC Bank USA | | | | |
| SSBT - State Street Bank and Trust Co., N.A. | | | | |
MS-38
Franklin Templeton Variable Insurance Products Trust
Mutual Shares Securities Fund
Report of Independent Registered Public Accounting Firm
To the Board of Trustees and Shareholders of Franklin Templeton Variable Insurance Products Trust
In our opinion, the accompanying statement of assets and liabilities, including the statement of investments, and the related statements of operations and of changes in net assets and the financial highlights present fairly, in all material respects, the financial position of Mutual Shares Securities Fund (one of the funds constituting the Franklin Templeton Variable Insurance Products Trust, hereafter referred to as the “Fund”) at December 31, 2009, the results of its operations for the year then ended, the changes in its net assets and the financial highlights for the periods presented, in conformity with accounting principles generally accepted in the United States of America. These financial statements and financial highlights (hereafter referred to as “financial statements”) are the responsibility of the Fund’s management. Our responsibility is to express an opinion on these financial statements based on our audits. We conducted our audits of these financial statements in accordance with the standards of the Public Company Accounting Oversight Board (United States). Those standards require that we plan and perform the audit to obtain reasonable assurance about whether the financial statements are free of material misstatement. An audit includes examining, on a test basis, evidence supporting the amounts and disclosures in the financial statements, assessing the accounting principles used and significant estimates made by management, and evaluating the overall financial statement presentation. We believe that our audits, which included confirmation of securities at December 31, 2009 by correspondence with the custodian and brokers, provide a reasonable basis for our opinion.
PricewaterhouseCoopers LLP
San Francisco, California
February 10, 2010
MS-39
Franklin Templeton Variable Insurance Products Trust
Tax Designation (unaudited)
Mutual Shares Securities Fund
Under Section 854(b)(2) of the Internal Revenue Code (Code), the Fund designates 52.60% of the ordinary income dividends as income qualifying for the dividends received deduction for the fiscal year ended December 31, 2009.
MS-40
TEMPLETON DEVELOPING MARKETS SECURITIES FUND
This annual report for Templeton Developing Markets Securities Fund covers the fiscal year ended December 31, 2009.
Performance Summary as of 12/31/09
Average annual total return of Class 4 shares* represents the average annual change in value, assuming reinvestment of dividends and capital gains. Average returns smooth out variations in returns, which can be significant; they are not the same as year-by-year results.
Periods ended 12/31/09
| | | | | | |
| | | 1-Year | | 5-Year | | 10-Year |
Average Annual Total Return | | +72.45% | | +11.53% | | +7.59% |
*Performance prior to the 5/1/00 merger reflects historical performance of Templeton Developing Markets Fund. For the period beginning 2/29/08, Class 4 performance reflects a 12b-1 fee expense of 0.35% per year, which affects future performance. Class 4 performance prior to 2/29/08 reflects historical Class 1 performance, which does not include a 12b-1 fee expense. Since 2/29/08 (effective date), the average annual total return of Class 4 shares was -6.41%.
Total Return Index Comparison
for a Hypothetical $10,000 Investment (1/1/00–12/31/09)
The graph below shows the change in value of a hypothetical $10,000 investment in the Fund over the indicated period and includes reinvestment of any income or distributions. The Fund’s performance* is compared to the performance of the Morgan Stanley Capital International (MSCI) Emerging Markets (EM) Index and the Standard & Poor’s/International Finance Corporation Investable (S&P/IFCI) Composite Index. One cannot invest directly in an index, and an index is not representative of the Fund’s portfolio. Please see Important Notes to Performance Information preceding the Fund Summaries.
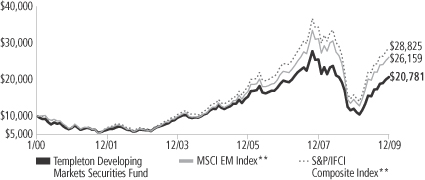
**Source: © 2009 Morningstar. Please see Index Descriptions following the Fund Summaries.
Templeton Developing Markets Securities Fund Class 4
Performance reflects the Fund’s Class 4 operating expenses, but does not include any contract fees, expenses or sales charges. If they had been included, performance would be lower. These charges and deductions, particularly for variable life policies, can have a significant effect on contract values and insurance benefits. See the contract prospectus for a complete description of these expenses, including sales charges.
Performance data represent past performance, which does not guarantee future results. Investment return and principal value will fluctuate, and you may have a gain or loss when you sell your shares.
Current performance may differ from figures shown.
TD-1
Fund Goal and Main Investments: Templeton Developing Markets Securities Fund seeks long-term capital appreciation. The Fund normally invests at least 80% of its net assets in emerging market investments and normally invests predominantly in equity securities.
Performance Overview
You can find the Fund’s one-year total return in the Performance Summary. The Fund underperformed the MSCI EM Index’s +79.02% total return, and the S&P/IFCI Composite Index’s +81.03% total return for the same period.1 Please note that index performance numbers are purely for reference and that we do not attempt to track an index, but rather undertake investments on the basis of fundamental research.
Economic and Market Overview
After falling dramatically until March, emerging markets experienced a tremendous surge. Some stock markets doubled in returns and pushed emerging markets as a whole to a record year. The substantial rally was a result of many factors but most significantly the rapid increase in money supply and liquidity supplied by governments globally to prevent an economic depression, which led to a huge influx of funds in the emerging markets asset class. In 2009, net inflows were nearly US$83 billion.2
Another critical factor for emerging market equity strength in 2009 was the resilience of China and India, the world’s two most populous countries. Despite the global economic downturn’s severity, annualized gross domestic product expanded 7.7% in China and 5.6% in India for the first nine months of 2009.3
The year was not without setbacks, but they were few and far between. One was the Dubai debt crisis, which was set off by an announcement from the Dubai government-owned conglomerate Dubai World on a debt payment standstill. Fears of contagion beyond the Gulf region triggered sharp selloffs in global equity markets, but most markets rebounded quickly after the United Arab Emirates offered fresh funding to its regional banks and neighboring Abu Dhabi stepped in with its own liquidity offer. In general, as long as global money supply continues its upward trend, we believe the bullish investor sentiment surrounding emerging markets stocks could be sustained.
1. Source: © 2009 Morningstar. One cannot invest directly in an index, and an index is not representative of the Fund’s portfolio. Please see Index Descriptions following the Fund Summaries.
2. Source: EPFR Global.
3. Sources: National Bureau of Statistics, China; Central Statistical Organisation, India. Figures are an average of quarterly year-over-year growth rates.
Fund Risks: The Fund’s investments in stocks may offer the potential for long-term gains but can be subject to short-term price fluctuations. Investing in emerging markets is subject to all the risks of foreign investing generally as well as additional, heightened risks, including currency fluctuations, economic instability, market volatility, political and social instability, the relatively smaller size and lesser liquidity of these markets, and less government supervision and regulation of business and industry practices. By having significant investments in one or more countries or in particular sectors or industries from time to time, the Fund may carry greater risk of adverse developments in a country, sector or industry than a fund that invests more broadly. The Fund’s prospectus also includes a description of the main investment risks.
TD-2
From a regional perspective, Latin America was the top performing emerging market in 2009. A rebound in commodity prices from their 2008 lows and stronger local currencies supported Latin American equity prices. In particular, Brazil’s stocks rallied mainly due to the country’s solid economic fundamentals, strong fiscal and monetary policies, and resilience amid the world financial crisis. Asia overall delivered a +74.21% return in U.S. dollar terms with India and Indonesia gaining more than 100%, as measured by the MSCI EM Asia Index, but nonetheless Asia underperformed its Latin American and Eastern European counterparts for the year.1 In Eastern Europe, lower interest rates, subsiding credit crunch worries and what we considered attractive valuations helped stock markets there stage a strong recovery in the latter part of 2009 after a period of underperformance earlier in the year, and within that region, Russia and Turkey were standouts.
Investment Strategy
Our investment philosophy is bottom up, value oriented and long term. In choosing investments, we may make on-site visits to companies to assess critical factors such as management strength and local conditions. In addition, we focus on the market price of a company’s securities relative to our evaluation of the company’s potential long-term (typically five years) earnings, asset value and cash flow potential. Among factors we consider are a company’s historical value measures, including price/earnings ratio, profit margins and liquidation value. We perform in-depth research to construct an action list from which we make our investment decisions.
Manager’s Discussion
During the 12 months under review, among the most significant contributors to the Fund’s absolute performance were Brazil’s two resources giants, Petrobras (Petroleo Brasileiro) in oil and gas, and Vale in iron ore. Rebounding commodity prices lifted stock prices of energy and metals and mining companies, and we increased the Fund’s positions in Petrobras and Vale largely due to our expectations of a long-term uptrend in commodity prices. Another key contributor was India’s Tata Consultancy Services, which continued to benefit from the IT services outsourcing trend. We also increased the Fund’s exposure to Tata during the reporting period.
In contrast, some of the largest detractors from absolute Fund performance were China Mobile, the country’s market leader in wireless services, Telmex (Telefonos de Mexico), a telecommunications
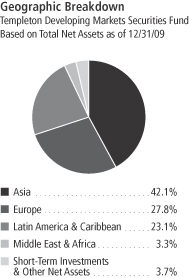
TD-3
conglomerate, and China Construction Bank, a major commercial bank. These stocks underperformed their emerging markets peers, and we eliminated these positions by period-end.
At year-end, our assessment of the energy and commodities sectors remains positive. Based on our analysis, we believe commodity prices could maintain a long-term upward trend because of commodities’ relatively inelastic supply and strong demand from emerging markets. In particular, growing energy demand boosted crude oil prices, and demand for hard commodities such as metals rose due to ongoing infrastructure development. Moreover, several emerging markets countries are major suppliers and consumers of various commodities. In line with our strategy, we considered many commodity-related companies attractive investment opportunities, and we believe they are well positioned to remain profitable.
It is also important to recognize the effect of currency movements on the Fund’s performance. In general, if the value of the U.S. dollar goes up compared with a foreign currency, an investment traded in that foreign currency will go down in value because it will be worth fewer U.S. dollars. This can have a negative effect on Fund performance. Conversely, when the U.S. dollar weakens in relation to a foreign currency, an investment traded in that foreign currency will increase in value, which can contribute to Fund performance. For the 12 months ended December 31, 2009, the U.S. dollar declined in value relative to most non-U.S. currencies. As a result, the Fund’s performance was positively affected by the portfolio’s predominant investment in securities with non-U.S. currency exposure. However, one cannot expect the same result in future periods.
During the review period, we increased the Fund’s holdings in Russia, India and South Korea as we searched for attractive investment opportunities. We also made select purchases in Austria, Brazil and Thailand due to attractive fundamentals in our view. Among our major purchases, we added to the Fund’s existing position in Russia’s Gazprom, the world’s largest gas producer, and initiated new positions in Sesa Goa, India’s biggest iron ore exporter, and SK Energy, a major South Korean oil refiner. By industry, we made key investments in oil and gas, diversified metals and mining, and construction and engineering companies, including PetroChina, one of the country’s largest oil and gas companies, and GS Engineering and Construction, South Korea’s leading construction company.
Top 10 Holdings
Templeton Developing Markets Securities Fund
12/31/09
| | |
Company
Sector/Industry,
Country | | % of Total
Net Assets |
| Vale SA, ADR, pfd., A | | 4.6% |
| Metals & Mining, Brazil | | |
| Petrobras (Petroleo Brasileiro SA), ADR, pfd. | | 4.3% |
| Oil, Gas & Consumable Fuels, Brazil | | |
| PetroChina Co. Ltd., H | | 3.6% |
| Oil, Gas & Consumable Fuels, China | | |
| Gazprom, ADR | | 3.4% |
| Oil, Gas & Consumable Fuels, Russia | | |
Tata Consultancy
Services Ltd. | | 3.2% |
| IT Services, India | | |
| Sesa Goa Ltd. | | 3.0% |
| Metals & Mining, India | | |
Itau Unibanco Holding
SA, ADR | | 2.8% |
| Commercial Banks, Brazil | | |
| LUKOIL Holdings, ADR | | 2.6% |
| Oil, Gas & Consumable Fuels, Russia | | |
| OTP Bank Ltd. | | 2.3% |
| Commercial Banks, Hungary | | |
| Anglo American PLC | | 2.2% |
| Metals & Mining, U.K. | | |
The dollar value, number of shares or principal amount, and names of all portfolio holdings are listed in the Fund’s Statement of Investments.
TD-4
Conversely, we reduced the Fund’s exposure to South Africa, Mexico and China via Hong Kong-listed China H and Red Chip shares.4 Key sales during the period included ICBC (Industrial and Commercial Bank of China), a major commercial bank, and MTN Group, a South African cellular telecommunication services provider. These sales allowed the Fund to focus on stocks we deemed to be relatively more attractively valued within our investment universe. Industry-wise, we made large sales of holdings in telecommunication services, banks and tobacco.
Thank you for your participation in Templeton Developing Markets Securities Fund. We look forward to serving your future investment needs.
4. “China H” denotes shares of China-incorporated, Hong Kong-listed companies with most businesses in China. “Red Chip” denotes shares of Hong Kong-listed companies with significant exposure to China. China H and Red Chip shares are traded on the Hong Kong Stock Exchange.
The foregoing information reflects our analysis, opinions and portfolio holdings as of December 31, 2009, the end of the reporting period. The way we implement our main investment strategies and the resulting portfolio holdings may change depending on factors such as market and economic conditions. These opinions may not be relied upon as investment advice or an offer for a particular security. The information is not a complete analysis of every aspect of any market, country, industry, security or the Fund. Statements of fact are from sources considered reliable, but the investment manager makes no representation or warranty as to their completeness or accuracy. Although historical performance is no guarantee of future results, these insights may help you understand our investment management philosophy.
Top 10 Countries
Templeton Developing Markets Securities Fund
12/31/09
| | |
| | | % of Total
Net Assets |
| Brazil | | 19.2% |
| India | | 15.4% |
| Russia | | 14.0% |
| China | | 11.2% |
| South Korea | | 4.9% |
| Turkey | | 3.6% |
| U.K. | | 3.6% |
| Austria | | 2.9% |
| South Africa | | 2.8% |
| Hungary | | 2.7% |
TD-5
Fund Expenses
As an investor in a variable insurance contract (Contract) that indirectly provides for investment in an underlying mutual fund, you can incur transaction and/or ongoing expenses at both the Fund level and the Contract level.
| • | | Transaction expenses can include sales charges (loads) on purchases, redemption fees, surrender fees, transfer fees and premium taxes. |
| • | | Ongoing expenses can include management fees, distribution and service (12b-1) fees, contract fees, annual maintenance fees, mortality and expense risk fees and other fees and expenses. All mutual funds and Contracts have some types of ongoing expenses. |
The expenses shown in the table are meant to highlight ongoing expenses at the Fund level only and do not include ongoing expenses at the Contract level, or transaction expenses at either the Fund or Contract level. While the Fund does not have transaction expenses, if the transaction and ongoing expenses at the Contract level were included, the expenses shown below would be higher. You should consult your Contract prospectus or disclosure document for more information.
The table shows Fund-level ongoing expenses and can help you understand these expenses and compare them with those of other mutual funds offered through the Contract. The table assumes a $1,000 investment held for the six months indicated. Please refer to the Fund prospectus for additional information on operating expenses.
Actual Fund Expenses
The first line (Actual) of the table provides actual account values and expenses. The “Ending Account Value” is derived from the Fund’s actual return, which includes the effect of ongoing Fund expenses, but does not include the effect of ongoing Contract expenses.
You can estimate the Fund-level expenses you incurred during the period by following these steps. Of course, your account value and expenses will differ from those in this illustration:
| 1. | Divide your account value by $1,000. |
If an account had an $8,600 value, then $8,600 ÷ $1,000 = 8.6.
| 2. | Multiply the result by the number under the heading “Fund-Level Expenses Incurred During Period.” |
If Fund-Level Expenses Incurred During Period were $7.50, then 8.6 x $7.50 = $64.50.
In this illustration, the estimated expenses incurred this period at the Fund level are $64.50.
Templeton Developing Markets Securities Fund Class 4
TD-6
Hypothetical Example for Comparison with Other Mutual Funds
Information in the second line (Hypothetical) of the table can help you compare ongoing expenses of the Fund with those of other mutual funds offered through the Contract. This information may not be used to estimate the actual ending account balance or expenses you incurred during the period. The hypothetical “Ending Account Value” is based on the Fund’s actual expense ratio and an assumed 5% annual rate of return before expenses, which does not represent the Fund’s actual return. The figure under the heading “Fund-Level Expenses Incurred During Period” shows the hypothetical expenses your account would have incurred under this scenario. You can compare this figure with the 5% hypothetical examples that appear in shareholder reports of other funds offered through a Contract.
| | | | | | | | | |
| Class 4 | | Beginning
Account Value 7/1/09 | | Ending
Account Value 12/31/09 | | Fund-Level Expenses Incurred
During Period* 7/1/09–12/31/09 |
Actual | | $ | 1,000 | | $ | 1,342.50 | | $ | 10.16 |
Hypothetical (5% return before expenses) | | $ | 1,000 | | $ | 1,016.53 | | $ | 8.74 |
*Expenses are calculated using the most recent six-month annualized expense ratio for the Fund’s Class 4 shares (1.72%), which does not include any ongoing expenses of the Contract for which the Fund is an investment option, multiplied by the average account value over the period, multiplied by 184/365 to reflect the one-half year period.
TD-7
Franklin Templeton Variable Insurance Products Trust
Financial Highlights
Templeton Developing Markets Securities Fund
| | | | | | | | | | | | | | | | | | | | |
| | | Year Ended December 31, | |
| Class 1 | | 2009 | | | 2008 | | | 2007 | | | 2006 | | | 2005 | |
| | | | |
Per share operating performance | | | | | | | | | | | | | | | | | | | | |
(for a share outstanding throughout the year) | | | | | | | | | | | | | | | | | | | | |
Net asset value, beginning of year | | $ | 6.11 | | | $ | 16.16 | | | $ | 13.92 | | | $ | 10.99 | | | $ | 8.73 | |
| | | | |
Income from investment operationsa: | | | | | | | | | | | | | | | | | | | | |
Net investment incomeb | | | 0.12 | | | | 0.16 | | | | 0.32 | | | | 0.24 | | | | 0.17 | |
Net realized and unrealized gains (losses) | | | 4.02 | | | | (7.40 | ) | | | 3.51 | | | | 2.84 | | | | 2.23 | |
| | | | |
Total from investment operations | | | 4.14 | | | | (7.24 | ) | | | 3.83 | | | | 3.08 | | | | 2.40 | |
| | | | |
Less distributions from: | | | | | | | | | | | | | | | | | | | | |
Net investment income | | | (0.36 | ) | | | (0.37 | ) | | | (0.38 | ) | | | (0.15 | ) | | | (0.14 | ) |
Net realized gains | | | (0.03 | ) | | | (2.44 | ) | | | (1.21 | ) | | | — | | | | — | |
| | | | |
Total distributions | | | (0.39 | ) | | | (2.81 | ) | | | (1.59 | ) | | | (0.15 | ) | | | (0.14 | ) |
| | | | |
Redemption feesc | | | — | | | | — | | | | — | | | | — | | | | — | |
| | | | |
Net asset value, end of year | | $ | 9.86 | | | $ | 6.11 | | | $ | 16.16 | | | $ | 13.92 | | | $ | 10.99 | |
| | | | |
| | | | | |
Total returnd | | | 73.32% | | | | (52.62)% | | | | 29.09% | | | | 28.43% | | | | 27.76% | |
Ratios to average net assets | | | | | | | | | | | | | | | | | | | | |
Expensese | | | 1.45% | | | | 1.52% | | | | 1.48% | | | | 1.47% | | | | 1.53% | |
Net investment income | | | 1.64% | | | | 1.52% | | | | 2.07% | | | | 1.93% | | | | 1.77% | |
| | | | | |
Supplemental data | | | | | | | | | | | | | | | | | | | | |
Net assets, end of year (000’s) | | $ | 325,927 | | | $ | 234,213 | | | $ | 753,843 | | | $ | 749,120 | | | $ | 651,826 | |
Portfolio turnover rate | | | 56.58% | f | | | 75.11% | f | | | 98.32% | | | | 53.65% | | | | 31.24% | |
aThe amount shown for a share outstanding throughout the period may not correlate with the Statement of Operations for the period due to the timing of sales and repurchases of the Fund shares in relation to income earned and/or fluctuating market value of the investments of the Fund.
bBased on average daily shares outstanding.
cAmount rounds to less than $0.01 per share.
dTotal return does not include any fees, charges or expenses imposed by the variable annuity and life insurance contracts for which the Franklin Templeton Variable Insurance Products Trust serves as an underlying investment vehicle.
eBenefit of expense reduction rounds to less than 0.01%.
fExcludes the value of portfolio securities delivered as a result of redemptions in-kind. See Note 10.
The accompanying notes are an integral part of these financial statements.
TD-8
Franklin Templeton Variable Insurance Products Trust
Financial Highlights (continued)
Templeton Developing Markets Securities Fund
| | | | | | | | | | | | | | | | | | | | |
| | | Year Ended December 31, | |
| Class 2 | | 2009 | | | 2008 | | | 2007 | | | 2006 | | | 2005 | |
| | | | |
Per share operating performance | | | | | | | | | | | | | | | | | | | | |
(for a share outstanding throughout the year) | | | | | | | | | | | | | | | | | | | | |
Net asset value, beginning of year | | $ | 6.04 | | | $ | 15.99 | | | $ | 13.79 | | | $ | 10.90 | | | $ | 8.67 | |
| | | | |
Income from investment operationsa: | | | | | | | | | | | | | | | | | | | | |
Net investment incomeb | | | 0.11 | | | | 0.15 | | | | 0.27 | | | | 0.20 | | | | 0.14 | |
Net realized and unrealized gains (losses) | | | 3.98 | | | | (7.33 | ) | | | 3.49 | | | | 2.82 | | | | 2.21 | |
| | | | |
Total from investment operations | | | 4.09 | | | | (7.18 | ) | | | 3.76 | | | | 3.02 | | | | 2.35 | |
| | | | |
Less distributions from: | | | | | | | | | | | | | | | | | | | | |
Net investment income | | | (0.32 | ) | | | (0.33 | ) | | | (0.35 | ) | | | (0.13 | ) | | | (0.12 | ) |
Net realized gains | | | (0.03 | ) | | | (2.44 | ) | | | (1.21 | ) | | | — | | | | — | |
| | | | |
Total distributions | | | (0.35 | ) | | | (2.77 | ) | | | (1.56 | ) | | | (0.13 | ) | | | (0.12 | ) |
| | | | |
Redemption feesc | | | — | | | | — | | | | — | | | | — | | | | — | |
| | | | |
Net asset value, end of year | | $ | 9.78 | | | $ | 6.04 | | | $ | 15.99 | | | $ | 13.79 | | | $ | 10.90 | |
| | | | |
| | | | | |
Total returnd | | | 72.59% | | | | (52.70)% | | | | 28.78% | | | | 28.09% | | | | 27.43% | |
Ratios to average net assets | | | | | | | | | | | | | | | | | | | | |
Expensese | | | 1.70% | | | | 1.77% | | | | 1.73% | | | | 1.72% | | | | 1.78% | |
Net investment income | | | 1.39% | | | | 1.27% | | | | 1.82% | | | | 1.68% | | | | 1.52% | |
Supplemental data | | | | | | | | | | | | | | | | | | | | |
Net assets, end of year (000’s) | | $ | 435,947 | | | $ | 264,186 | | | $ | 1,090,549 | | | $ | 857,514 | | | $ | 650,646 | |
Portfolio turnover rate | | | 56.58% | f | | | 75.11% | f | | | 98.32% | | | | 53.65% | | | | 31.24% | |
aThe amount shown for a share outstanding throughout the period may not correlate with the Statement of Operations for the period due to the timing of sales and repurchases of the Fund shares in relation to income earned and/or fluctuating market value of the investments of the Fund.
bBased on average daily shares outstanding.
cAmount rounds to less than $0.01 per share.
dTotal return does not include any fees, charges or expenses imposed by the variable annuity and life insurance contracts for which the Franklin Templeton Variable Insurance Products Trust serves as an underlying investment vehicle.
eBenefit of expense reduction rounds to less than 0.01%.
fExcludes the value of portfolio securities delivered as a result of redemptions in-kind. See Note 10.
The accompanying notes are an integral part of these financial statements.
TD-9
Franklin Templeton Variable Insurance Products Trust
Financial Highlights (continued)
Templeton Developing Markets Securities Fund
| | | | | | | | | | | | | | | | | | | | |
| | | Year Ended December 31, | |
| Class 3 | | 2009 | | | 2008 | | | 2007 | | | 2006 | | | 2005 | |
| | | | |
Per share operating performance | | | | | | | | | | | | | | | | | | | | |
(for a share outstanding throughout the year) | | | | | | | | | | | | | | | | | | | | |
Net asset value, beginning of year | | $ | 6.02 | | | $ | 15.96 | | | $ | 13.78 | | | $ | 10.90 | | | $ | 8.68 | |
| | | | |
Income from investment operationsa: | | | | | | | | | | | | | | | | | | | | |
Net investment incomeb | | | 0.10 | | | | 0.11 | | | | 0.24 | | | | 0.20 | | | | 0.04 | |
Net realized and unrealized gains (losses) | | | 3.97 | | | | (7.27 | ) | | | 3.52 | | | | 2.83 | | | | 2.32 | |
| | | | |
Total from investment operations | | | 4.07 | | | | (7.16 | ) | | | 3.76 | | | | 3.03 | | | | 2.36 | |
| | | | |
Less distributions from: | | | | | | | | | | | | | | | | | | | | |
Net investment income | | | (0.33 | ) | | | (0.34 | ) | | | (0.37 | ) | | | (0.15 | ) | | | (0.14 | ) |
Net realized gains | | | (0.03 | ) | | | (2.44 | ) | | | (1.21 | ) | | | — | | | | — | |
| | | | |
Total distributions | | | (0.36 | ) | | | (2.78 | ) | | | (1.58 | ) | | | (0.15 | ) | | | (0.14 | ) |
| | | | |
Redemption feesc | | | — | | | | — | | | | — | | | | — | | | | — | |
| | | | |
Net asset value, end of year | | $ | 9.73 | | | $ | 6.02 | | | $ | 15.96 | | | $ | 13.78 | | | $ | 10.90 | |
| | | | |
| | | | | |
Total returnd | | | 72.63% | | | | (52.67)% | | | | 28.70% | | | | 28.17% | | | | 27.45% | |
Ratios to average net assets | | | | | | | | | | | | | | | | | | | | |
Expensese | | | 1.70% | | | | 1.77% | | | | 1.73% | | | | 1.72% | | | | 1.78% | |
Net investment income | | | 1.39% | | | | 1.27% | | | | 1.82% | | | | 1.68% | | | | 1.52% | |
| | | | | |
Supplemental data | | | | | | | | | | | | | | | | | | | | |
Net assets, end of year (000’s) | | $ | 66,718 | | | $ | 32,953 | | | $ | 100,961 | | | $ | 43,372 | | | $ | 11,521 | |
Portfolio turnover rate | | | 56.58% | f | | | 75.11% | f | | | 98.32% | | | | 53.65% | | | | 31.24% | |
aThe amount shown for a share outstanding throughout the period may not correlate with the Statement of Operations for the period due to the timing of sales and repurchases of the Fund shares in relation to income earned and/or fluctuating market value of the investments of the Fund.
bBased on average daily shares outstanding.
cAmount rounds to less than $0.01 per share.
dTotal return does not include any fees, charges or expenses imposed by the variable annuity and life insurance contracts for which the Franklin Templeton Variable Insurance Products Trust serves as an underlying investment vehicle.
eBenefit of expense reduction rounds to less than 0.01%.
fExcludes the value of portfolio securities delivered as a result of redemptions in-kind. See Note 10.
The accompanying notes are an integral part of these financial statements.
TD-10
Franklin Templeton Variable Insurance Products Trust
Financial Highlights (continued)
Templeton Developing Markets Securities Fund
| | | | | | | | |
| | | Year Ended
December 31, | |
| Class 4 | | 2009 | | | 2008a | |
| | | | |
Per share operating performance | | | | | | | | |
(for a share outstanding throughout the year) | | | | | | | | |
Net asset value, beginning of year | | $ | 6.09 | | | $ | 14.88 | |
| | | | |
Income from investment operationsb: | | | | | | | | |
Net investment income (loss)c | | | 0.09 | | | | (0.33 | ) |
Net realized and unrealized gains (losses) | | | 4.00 | | | | (5.65 | ) |
| | | | |
Total from investment operations | | | 4.09 | | | | (5.98 | ) |
| | | | |
Less distributions from: | | | | | | | | |
Net investment income | | | (0.35 | ) | | | (0.37 | ) |
Net realized gains | | | (0.03 | ) | | | (2.44 | ) |
| | | | |
Total distributions | | | (0.38 | ) | | | (2.81 | ) |
| | | | |
Redemption feesd | | | — | | | | — | |
| | | | |
Net asset value, end of year | | $ | 9.80 | | | $ | 6.09 | |
| | | | |
| | |
Total returne | | | 72.45% | | | | (48.66)% | |
Ratios to average net assetsf | | | | | | | | |
Expensesg | | | 1.80% | | | | 1.87% | |
Net investment income | | | 1.29% | | | | 1.17% | |
| | |
Supplemental data | | | | | | | | |
Net assets, end of year (000’s) | | $ | 26,362 | | | $ | 7,208 | |
Portfolio turnover rate | | | 56.58% | h | | | 75.11% | h |
aFor the period February 29, 2008 (effective date) to December 31, 2008
bThe amount shown for a share outstanding throughout the period may not correlate with the Statement of Operations for the period due to the timing of sales and repurchases of the Fund shares in relation to income earned and/or fluctuating market value of the investments of the Fund.
cBased on average daily shares outstanding.
dAmount rounds to less than $0.01 per share.
eTotal return does not include any fees, charges or expenses imposed by the variable annuity and life insurance contracts for which the Franklin Templeton Variable Insurance Products Trust serves as an underlying investment vehicle. Total return is not annualized for periods less than one year.
fRatios are annualized for periods less than one year.
gBenefit of expense reduction rounds to less than 0.01%.
hExcludes the value of portfolio securities delivered as a result of redemptions in-kind. See Note 10.
The accompanying notes are an integral part of these financial statements.
TD-11
Franklin Templeton Variable Insurance Products Trust
Statement of Investments, December 31, 2009
| | | | | | | |
| Templeton Developing Markets Securities Fund | | Industry | | Shares | | Value |
Common Stocks 85.0% | | | | | | | |
Argentina 0.4% | | | | | | | |
Tenaris SA, ADR | | Energy Equipment & Services | | 84,900 | | $ | 3,620,985 |
| | | | | | | |
Austria 2.9% | | | | | | | |
Erste Group Bank AG | | Commercial Banks | | 217,767 | | | 8,123,492 |
aIMMOEAST AG | | Real Estate Management &
Development | | 787,051 | | | 4,337,503 |
OMV AG | | Oil, Gas & Consumable Fuels | | 205,986 | | | 9,052,161 |
Raiffeisen International Bank Holding AG | | Commercial Banks | | 54,545 | | | 3,084,099 |
| | | | | | | |
| | | | | | | 24,597,255 |
| | | | | | | |
Brazil 8.4% | | | | | | | |
AES Tiete SA | | Independent Power
Producers & Energy Traders | | 687,291 | | | 6,782,218 |
Companhia de Bebidas das Americas (AmBev) | | Beverages | | 214,255 | | | 18,131,160 |
Itau Unibanco Holding SA, ADR | | Commercial Banks | | 1,031,374 | | | 23,556,582 |
Natura Cosmeticos SA | | Personal Products | | 823,138 | | | 17,147,528 |
Souza Cruz SA | | Tobacco | | 199,070 | | | 6,596,835 |
| | | | | | | |
| | | | | | | 72,214,323 |
| | | | | | | |
China 11.2% | | | | | | | |
aAluminum Corp. of China Ltd., H | | Metals & Mining | | 7,701,000 | | | 8,491,888 |
Angang Steel Co. Ltd., H | | Metals & Mining | | 2,156,000 | | | 4,760,401 |
China Coal Energy Co., H | | Oil, Gas & Consumable Fuels | | 6,513,000 | | | 11,961,402 |
China Dongxiang Group Co. | | Textiles, Apparel & Luxury
Goods | | 4,097,000 | | | 3,170,357 |
China Molybdenum Co. Ltd., H | | Metals & Mining | | 3,393,391 | | | 2,730,923 |
China Petroleum and Chemical Corp., H | | Oil, Gas & Consumable Fuels | | 1,212,000 | | | 1,080,119 |
China Shipping Development Co. Ltd., H | | Marine | | 4,110,000 | | | 6,180,610 |
CNOOC Ltd. | | Oil, Gas & Consumable Fuels | | 3,077,000 | | | 4,841,482 |
Denway Motors Ltd. | | Automobiles | | 12,353,959 | | | 7,870,895 |
aHidili Industry International Development Ltd. | | Metals & Mining | | 8,689,000 | | | 10,948,519 |
Lonking Holdings Ltd. | | Machinery | | 4,058,000 | | | 2,820,927 |
PetroChina Co. Ltd., H | | Oil, Gas & Consumable Fuels | | 25,710,000 | | | 30,903,594 |
| | | | | | | |
| | | | | | | 95,761,117 |
| | | | | | | |
Hong Kong 1.6% | | | | | | | |
Dairy Farm International Holdings Ltd. | | Food & Staples Retailing | | 1,014,733 | | | 6,078,251 |
aGOME Electrical Appliances Holdings Ltd. | | Specialty Retail | | 9,247,000 | | | 3,363,109 |
VTech Holdings Ltd. | | Communications Equipment | | 456,000 | | | 4,369,630 |
| | | | | | | |
| | | | | | | 13,810,990 |
| | | | | | | |
Hungary 2.7% | | | | | | | |
aMOL Hungarian Oil and Gas Nyrt. | | Oil, Gas & Consumable Fuels | | 39,364 | | | 3,540,303 |
aOTP Bank Ltd. | | Commercial Banks | | 677,397 | | | 19,552,841 |
| | | | | | | |
| | | | | | | 23,093,144 |
| | | | | | | |
India 15.4% | | | | | | | |
GAIL India Ltd. | | Gas Utilities | | 955,643 | | | 8,506,273 |
Grasim Industries Ltd. | | Construction Materials | | 38,057 | | | 2,031,757 |
Hindalco Industries Ltd. | | Metals & Mining | | 3,973,579 | | | 13,763,258 |
Infosys Technologies Ltd. | | IT Services | | 135,890 | | | 7,628,257 |
National Aluminium Co. Ltd. | | Metals & Mining | | 519,824 | | | 4,682,448 |
Oil & Natural Gas Corp. Ltd. | | Oil, Gas & Consumable Fuels | | 601,056 | | | 15,250,452 |
aOil India Ltd. | | Oil, Gas & Consumable Fuels | | 158,994 | | | 4,247,548 |
Sesa Goa Ltd. | | Metals & Mining | | 2,931,337 | | | 25,937,374 |
TD-12
Franklin Templeton Variable Insurance Products Trust
Statement of Investments, December 31, 2009 (continued)
| | | | | | | |
| Templeton Developing Markets Securities Fund | | Industry | | Shares | | Value |
Common Stocks (continued) | | | | | | | |
India (continued) | | | | | | | |
Steel Authority of India Ltd. | | Metals & Mining | | 1,057,892 | | $ | 5,485,493 |
Tata Chemicals Ltd. | | Chemicals | | 1,120,158 | | | 7,776,663 |
Tata Consultancy Services Ltd. | | IT Services | | 1,690,483 | | | 27,309,624 |
Tata Steel Ltd. | | Metals & Mining | | 693,000 | | | 9,222,081 |
| | | | | | | |
| | | | | | | 131,841,228 |
| | | | | | | |
Indonesia 1.8% | | | | | | | |
PT Astra International Tbk | | Automobiles | | 2,815,500 | | | 10,365,819 |
PT Bank Central Asia Tbk | | Commercial Banks | | 9,120,500 | | | 4,693,308 |
| | | | | | | |
| | | | | | | 15,059,127 |
| | | | | | | |
Israel 0.6% | | | | | | | |
aTaro Pharmaceutical Industries Ltd. | | Pharmaceuticals | | 543,219 | | | 4,823,785 |
| | | | | | | |
Mexico 2.7% | | | | | | | |
America Movil SAB de CV, L, ADR | | Wireless Telecommunication Services | | 307,367 | | | 14,440,102 |
Grupo Televisa SA | | Media | | 1,023,475 | | | 4,258,595 |
Kimberly Clark de Mexico SAB de CV, A | | Household Products | | 978,888 | | | 4,382,874 |
| | | | | | | |
| | | | | | | 23,081,571 |
| | | | | | | |
Pakistan 1.3% | | | | | | | |
MCB Bank Ltd. | | Commercial Banks | | 2,265,271 | | | 5,891,315 |
Oil & Gas Development Co. Ltd. | | Oil, Gas & Consumable Fuels | | 4,074,200 | | | 5,324,458 |
| | | | | | | |
| | | | | | | 11,215,773 |
| | | | | | | |
Peru 0.3% | | | | | | | |
Credicorp Ltd. | | Commercial Banks | | 30,700 | | | 2,364,514 |
| | | | | | | |
Qatar 0.3% | | | | | | | |
Qatar National Bank | | Commercial Banks | | 62,134 | | | 2,530,232 |
| | | | | | | |
Russia 14.0% | | | | | | | |
Gazprom, ADR | | Oil, Gas & Consumable Fuels | | 921,400 | | | 23,081,070 |
Gazprom, ADR (London Exchange) | | Oil, Gas & Consumable Fuels | | 235,100 | | | 6,016,209 |
LUKOIL Holdings, ADR | | Oil, Gas & Consumable Fuels | | 75,208 | | | 4,241,731 |
LUKOIL Holdings, ADR (London Exchange) | | Oil, Gas & Consumable Fuels | | 317,168 | | | 18,173,727 |
aMining and Metallurgical Co. Norilsk Nickel, ADR | | Metals & Mining | | 1,140,600 | | | 16,367,610 |
Mobile TeleSystems | | Wireless Telecommunication Services | | 617,683 | | | 4,517,266 |
Mobile TeleSystems, ADR | | Wireless Telecommunication Services | | 209,000 | | | 10,218,010 |
Rosneft Oil Co., GDR | | Oil, Gas & Consumable Fuels | | 988,100 | | | 8,477,898 |
aRusHydro | | Electric Utilities | | 2,869,265 | | | 107,715 |
Sberbank RF | | Commercial Banks | | 5,005,590 | | | 14,060,702 |
TNK-BP | | Oil, Gas & Consumable Fuels | | 4,531,950 | | | 7,817,614 |
a,bUralkali, GDR, Reg S | | Chemicals | | 220,500 | | | 4,654,755 |
aWimm-Bill-Dann Foods | | Food Products | | 44,628 | | | 2,000,741 |
| | | | | | | |
| | | | | | | 119,735,048 |
| | | | | | | |
Singapore 0.4% | | | | | | | |
Fraser and Neave Ltd. | | Industrial Conglomerates | | 1,139,041 | | | 3,403,751 |
| | | | | | | |
South Africa 2.8% | | | | | | | |
Lewis Group Ltd. | | Specialty Retail | | 289,766 | | | 2,072,550 |
Naspers Ltd., N | | Media | | 218,591 | | | 8,849,838 |
Remgro Ltd. | | Diversified Financial Services | | 465,961 | | | 5,609,163 |
Standard Bank Group Ltd. | | Commercial Banks | | 510,761 | | | 7,030,718 |
| | | | | | | |
| | | | | | | 23,562,269 |
| | | | | | | |
TD-13
Franklin Templeton Variable Insurance Products Trust
Statement of Investments, December 31, 2009 (continued)
| | | | | | | |
| Templeton Developing Markets Securities Fund | | Industry | | Shares | | Value |
Common Stocks (continued) | | | | | | | |
South Korea 4.9% | | | | | | | |
CJ Internet Corp. | | Media | | 107,764 | | $ | 1,275,341 |
GS Engineering & Construction Corp. | | Construction & Engineering | | 106,518 | | | 9,911,200 |
Hyundai Development Co. | | Construction & Engineering | | 121,970 | | | 3,948,603 |
Samsung Electronics Co. Ltd. | | Semiconductors & Semiconductor
Equipment | | 15,392 | | | 10,546,670 |
Shinhan Financial Group Co. Ltd. | | Commercial Banks | | 209,975 | | | 7,779,019 |
SK Energy Co. Ltd. | | Oil, Gas & Consumable Fuels | | 87,734 | | | 8,840,551 |
| | | | | | | |
| | | | | | | 42,301,384 |
| | | | | | | |
Sweden 1.1% | | | | | | | |
Oriflame Cosmetics SA, SDR | | Personal Products | | 149,765 | | | 8,963,267 |
| | | | | | | |
Taiwan 1.9% | | | | | | | |
MediaTek Inc. | | Semiconductors & Semiconductor
Equipment | | 162,624 | | | 2,836,642 |
President Chain Store Corp. | | Food & Staples Retailing | | 4,167,075 | | | 9,912,923 |
Taiwan Semiconductor Manufacturing Co. Ltd. | | Semiconductors & Semiconductor
Equipment | | 1,843,169 | | | 3,716,299 |
| | | | | | | |
| | | | | | | 16,465,864 |
| | | | | | | |
Thailand 2.0% | | | | | | | |
Kasikornbank Public Co. Ltd., fgn. | | Commercial Banks | | 752,200 | | | 1,961,673 |
PTT Exploration and Production Public Co. Ltd., fgn. | | Oil, Gas & Consumable Fuels | | 665,700 | | | 2,933,390 |
PTT Public Co. Ltd., fgn. | | Oil, Gas & Consumable Fuels | | 1,064,000 | | | 7,846,043 |
Thai Beverages Co. Ltd., fgn. | | Beverages | | 26,566,000 | | | 4,630,857 |
| | | | | | | |
| | | | | | | 17,371,963 |
| | | | | | | |
Turkey 3.6% | | | | | | | |
Akbank TAS | | Commercial Banks | | 2,034,234 | | | 12,848,223 |
Anadolu Efes Biracilik Ve Malt Sanayii AS | | Beverages | | 145,281 | | | 1,631,280 |
Tupras-Turkiye Petrol Rafinerileri AS | | Oil, Gas & Consumable Fuels | | 521,504 | | | 10,369,432 |
Turkcell Iletisim Hizmetleri AS | | Wireless Telecommunication
Services | | 786,337 | | | 5,570,894 |
| | | | | | | |
| | | | | | | 30,419,829 |
| | | | | | | |
United Arab Emirates 1.1% | | | | | | | |
DP World Ltd. | | Transportation Infrastructure | | 1,520,546 | | | 653,835 |
aEmaar Properties PJSC | | Real Estate Management &
Development | | 8,649,160 | | | 9,089,630 |
| | | | | | | |
| | | | | | | 9,743,465 |
| | | | | | | |
United Kingdom 3.6% | | | | | | | |
aAnglo American PLC | | Metals & Mining | | 441,920 | | | 19,053,849 |
Antofagasta PLC | | Metals & Mining | | 704,479 | | | 11,305,133 |
| | | | | | | |
| | | | | | | 30,358,982 |
| | | | | | | |
Total Common Stocks (Cost $486,850,080) | | | | | | | 726,339,866 |
| | | | | | | |
Preferred Stocks 11.3% | | | | | | | |
Brazil 10.8% | | | | | | | |
Banco Bradesco SA, ADR, pfd. | | Commercial Banks | | 429,613 | | | 9,395,636 |
Itausa—Investimentos Itau SA, pfd. | | Commercial Banks | | 1,011,868 | | | 6,879,309 |
Petroleo Brasileiro SA, ADR, pfd. | | Oil, Gas & Consumable Fuels | | 864,888 | | | 36,662,602 |
Vale SA, ADR, pfd., A | | Metals & Mining | | 1,587,075 | | | 39,391,202 |
| | | | | | | |
| | | | | | | 92,328,749 |
| | | | | | | |
TD-14
Franklin Templeton Variable Insurance Products Trust
Statement of Investments, December 31, 2009 (continued)
| | | | | | | |
| Templeton Developing Markets Securities Fund | | Industry | | Shares | | Value |
Preferred Stocks (continued) | | | | | | | |
Chile 0.5% | | | | | | | |
Embotelladora Andina SA, pfd., A | | Beverages | | 1,467,125 | | $ | 4,134,376 |
| | | | | | | |
Total Preferred Stocks (Cost $45,308,797) | | | | | | | 96,463,125 |
| | | | | | | |
Total Investments before Short Term Investments
(Cost $532,158,877) | | | | | | | 822,802,991 |
| | | | | | | |
Short Term Investments (Cost $28,389,812) 3.3% | | | | | | | |
Money Market Funds 3.3% | | | | | | | |
c Institutional Fiduciary Trust Money Market Portfolio, 0.00% | | | | 28,389,812 | | | 28,389,812 |
| | | | | | | |
Total Investments (Cost $560,548,689) 99.6% | | | | | | | 851,192,803 |
Other Assets, less Liabilities 0.4% | | | | | | | 3,761,747 |
| | | | | | | |
Net Assets 100.0% | | | | | | $ | 854,954,550 |
| | | | | | | |
See Abbreviations on page TD-26.
aNon-income producing.
bSecurity was purchased pursuant to Regulation S under the Securities Act of 1933, which exempts from registration securities offered and sold outside of the United States. Such a security cannot be sold in the United States without either an effective registration statement filed pursuant to the Securities Act of 1933, or pursuant to an exemption from registration. This security has been deemed liquid under guidelines approved by the Trust’s Board of Trustees. At December 31, 2009, the value of this security was $4,654,755, representing 0.54% of net assets.
cSee Note 7 regarding investments in the Institutional Fiduciary Trust Money Market Portfolio. The rate shown is the annualized seven-day yield at period end.
The accompanying notes are an integral part of these financial statements.
TD-15
Franklin Templeton Variable Insurance Products Trust
Financial Statements
Statements of Assets and Liabilities
December 31, 2009
| | | | |
| | | Templeton
Developing Markets
Securities Fund | |
Assets: | | | | |
Investments in securities: | | | | |
Cost - Unaffiliated issuers | | $ | 532,158,877 | |
Cost - Sweep Money Fund (Note 7) | | | 28,389,812 | |
| | | | |
Total cost of investments | | $ | 560,548,689 | |
| | | | |
Value - Unaffiliated issuers | | $ | 822,802,991 | |
Value - Sweep Money Fund (Note 7) | | | 28,389,812 | |
| | | | |
Total value of investments | | | 851,192,803 | |
Cash | | | 72,973 | |
Receivables: | | | | |
Investment securities sold | | | 7,567,210 | |
Capital shares sold | | | 514,092 | |
Dividends | | | 1,955,029 | |
Foreign tax | | | 244,317 | |
Other assets | | | 85 | |
| | | | |
Total assets | | | 861,546,509 | |
| | | | |
Liabilities: | | | | |
Payables: | | | | |
Capital shares redeemed | | | 2,142,101 | |
Affiliates | | | 1,202,462 | |
Deferred tax | | | 2,868,645 | |
Accrued expenses and other liabilities | | | 378,751 | |
| | | | |
Total liabilities | | | 6,591,959 | |
| | | | |
Net assets, at value | | $ | 854,954,550 | |
| | | | |
Net assets consist of: | | | | |
Paid-in capital | | $ | 782,935,443 | |
Undistributed net investment income | | | 6,700,234 | |
Net unrealized appreciation (depreciation) | | | 287,754,645 | |
Accumulated net realized gain (loss) | | | (222,435,772 | ) |
| | | | |
Net assets, at value | | $ | 854,954,550 | |
| | | | |
The accompanying notes are an integral part of these financial statements.
TD-16
Franklin Templeton Variable Insurance Products Trust
Financial Statements (continued)
Statements of Assets and Liabilities (continued)
December 31, 2009
| | | |
| | | Templeton
Developing Markets
Securities Fund |
Class 1: | | | |
Net assets, at value | | $ | 325,926,745 |
| | | |
Shares outstanding | | | 33,041,033 |
| | | |
Net asset value and maximum offering price per share | | $ | 9.86 |
| | | |
Class 2: | | | |
Net assets, at value | | $ | 435,947,440 |
| | | |
Shares outstanding | | | 44,564,759 |
| | | |
Net asset value and maximum offering price per share | | $ | 9.78 |
| | | |
Class 3: | | | |
Net assets, at value | | $ | 66,718,047 |
| | | |
Shares outstanding | | | 6,858,706 |
| | | |
Net asset value and maximum offering price per sharea | | $ | 9.73 |
| | | |
Class 4: | | | |
Net assets, at value | | $ | 26,362,318 |
| | | |
Shares outstanding | | | 2,690,463 |
| | | |
Net asset value and maximum offering price per share | | $ | 9.80 |
| | | |
aRedemption price is equal to net asset value less any redemption fees retained by the Fund.
The accompanying notes are an integral part of these financial statements.
TD-17
Franklin Templeton Variable Insurance Products Trust
Financial Statements (continued)
Statements of Operations
for the year ended December 31, 2009
| | | | |
| | | Templeton
Developing Markets
Securities Fund | |
Investment income: | | | | |
Dividends (net of foreign taxes of $1,780,796) | | | | |
Unaffiliated issuers | | $ | 19,708,307 | |
Sweep Money Fund (Note 7) | | | 15,597 | |
Interest | | | 3,938 | |
| | | | |
Total investment income | | | 19,727,842 | |
| | | | |
Expenses: | | | | |
Management fees (Note 3a) | | | 7,895,479 | |
Administrative fees (Note 3b) | | | 877,357 | |
Distribution fees: (Note 3c) | | | | |
Class 2 | | | 841,138 | |
Class 3 | | | 118,237 | |
Class 4 | | | 53,628 | |
Unaffiliated transfer agent fees | | | 2,876 | |
Custodian fees (Note 4) | | | 179,928 | |
Reports to shareholders | | | 171,990 | |
Professional fees | | | 89,728 | |
Trustees’ fees and expenses | | | 3,992 | |
Other | | | 49,946 | |
| | | | |
Total expenses | | | 10,284,299 | |
Expense reductions (Note 4) | | | (413 | ) |
| | | | |
Net expenses | | | 10,283,886 | |
| | | | |
Net investment income | | | 9,443,956 | |
| | | | |
Realized and unrealized gains (losses): | | | | |
Net realized gain (loss) from: | | | | |
Investments (includes losses from a redemption in-kind of $6,207,989) (Note 10) | | | (56,237,916 | ) |
Foreign currency transactions | | | (252,324 | ) |
| | | | |
Net realized gain (loss) | | | (56,490,240 | ) |
| | | | |
Net change in unrealized appreciation (depreciation) on: | | | | |
Investments | | | 390,113,598 | |
Translation of other assets and liabilities denominated in foreign currencies | | | (6,402 | ) |
Change in deferred taxes on unrealized appreciation | | | (2,868,645 | ) |
| | | | |
Net change in unrealized appreciation (depreciation) | | | 387,238,551 | |
| | | | |
Net realized and unrealized gain (loss) | | | 330,748,311 | |
| | | | |
Net increase (decrease) in net assets resulting from operations | | $ | 340,192,267 | |
| | | | |
The accompanying notes are an integral part of these financial statements.
TD-18
Franklin Templeton Variable Insurance Products Trust
Financial Statements (continued)
Statements of Changes in Net Assets
| | | | | | | | |
| | | Templeton Developing Markets
Securities Fund | |
| | | Year Ended December 31, | |
| | | 2009 | | | 2008 | |
| | | | | | | |
Increase (decrease) in net assets: | | | | | | | | |
Operations: | | | | | | | | |
Net investment income | | $ | 9,443,956 | | | $ | 17,230,649 | |
Net realized gain (loss) from investments and foreign currency transactions | | | (56,490,240 | ) | | | (131,179,941 | ) |
Net change in unrealized appreciation (depreciation) on investments, translation of other assets and liabilities denominated in foreign currencies and deferred taxes | | | 387,238,551 | | | | (761,427,069 | ) |
| | | | |
Net increase (decrease) in net assets resulting from operations | | | 340,192,267 | | | | (875,376,361 | ) |
| | | | |
Distributions to shareholders from: | | | | | | | | |
Net investment income: | | | | | | | | |
Class 1 | | | (13,652,950 | ) | | | (15,246,189 | ) |
Class 2 | | | (13,921,115 | ) | | | (18,272,202 | ) |
Class 3 | | | (1,779,543 | ) | | | (1,805,309 | ) |
Class 4 | | | (467,339 | ) | | | (58,997 | ) |
Net realized gains: | | | | | | | | |
Class 1 | | | (1,172,623 | ) | | | (101,141,199 | ) |
Class 2 | | | (1,344,137 | ) | | | (136,962,950 | ) |
Class 3 | | | (166,799 | ) | | | (13,097,616 | ) |
Class 4 | | | (41,022 | ) | | | (391,385 | ) |
| | | | |
Total distributions to shareholders | | | (32,545,528 | ) | | | (286,975,847 | ) |
| | | | |
Capital share transactions: (Note 2) | | | | | | | | |
Class 1 | | | (15,950,150 | ) | | | (54,850,288 | ) |
Class 2 | | | 3,177,398 | | | | (192,193,242 | ) |
Class 3 | | | 10,244,457 | | | | (8,380,444 | ) |
Class 4 | | | 11,266,396 | | | | 10,948,393 | |
| | | | |
Total capital share transactions | | | 8,738,101 | | | | (244,475,581 | ) |
| | | | |
Redemption fees | | | 10,133 | | | | 34,017 | |
| | | | |
Net increase (decrease) in net assets | | | 316,394,973 | | | | (1,406,793,772 | ) |
Net assets: | | | | | | | | |
Beginning of year | | | 538,559,577 | | | | 1,945,353,349 | |
| | | | |
End of year | | $ | 854,954,550 | | | $ | 538,559,577 | |
| | | | |
Undistributed net investment income included in net assets: | | | | | | | | |
End of year | | $ | 6,700,234 | | | $ | 20,812,671 | |
| | | | |
The accompanying notes are an integral part of these financial statements.
TD-19
Franklin Templeton Variable Insurance Products Trust
Notes to Financial Statements
Templeton Developing Markets Securities Fund
1. ORGANIZATION AND SIGNIFICANT ACCOUNTING POLICIES
Franklin Templeton Variable Insurance Products Trust (Trust) is registered under the Investment Company Act of 1940, as amended, (1940 Act) as an open-end investment company, consisting of twenty-two separate funds. The Templeton Developing Markets Securities Fund (Fund) is included in this report. The financial statements of the remaining funds in the Trust are presented separately. Shares of the Fund are generally sold only to insurance company separate accounts to fund the benefits of variable life insurance policies or variable annuity contracts. The Fund offers four classes of shares: Class 1, Class 2, Class 3, and Class 4. Each class of shares differs by its distribution fees, voting rights on matters affecting a single class and its exchange privilege.
The following summarizes the Fund’s significant accounting policies.
a. Security Valuation
Equity and other securities listed on a securities exchange or on the NASDAQ National Market System are valued at the last quoted sale price or the official closing price of the day, respectively. Over-the-counter securities and listed securities for which there is no reported sale are valued within the range of the most recent quoted bid and ask prices. Securities that trade in multiple markets or on multiple exchanges are valued according to the broadest and most representative market. Certain equity securities are valued based upon fundamental characteristics or relationships to similar securities. Investments in open-end mutual funds are valued at the closing net asset value.
Foreign equity securities are valued as of the close of trading on the foreign stock exchange on which the security is primarily traded, or the NYSE, whichever is earlier. If no sale is reported at that time, the foreign equity security will be valued within the range of the most recent quoted bid and ask prices. The value is then converted into its U.S. dollar equivalent at the foreign exchange rate in effect at the close of the NYSE on the day that the value of the security is determined.
The Fund has procedures to determine the fair value of individual securities and other assets for which market prices are not readily available or which may not be reliably priced. Methods for valuing these securities may include: fundamental analysis based upon the underlying investment book value, anticipated future cash flows, market changes in comparable or similar securities, matrix pricing, discounts from market prices of similar securities, or discounts applied due to the nature and duration of restrictions on the disposition of the securities. Due to the inherent uncertainty of valuations of such securities, the fair values may differ significantly from the values that would have been used had a ready market for such investments existed. Occasionally, events occur between the time at which trading in a security is completed and the close of the NYSE that might call into question the availability (including the reliability) of the value of a portfolio security held by the Fund. The investment manager monitors price movements following the close of trading in foreign stock markets through a series of country specific market proxies (such as baskets of American Depository Receipts, futures contracts and exchange traded funds). These price movements are measured against established trigger thresholds for each specific market proxy to assist in determining if an event has occurred. If such an event occurs, the securities may be valued using fair value procedures, which may include the use of independent pricing services. All security valuation procedures are approved by the Fund’s Board of Trustees.
b. Foreign Currency Translation
Portfolio securities and other assets and liabilities denominated in foreign currencies are translated into U.S. dollars based on the exchange rate of such currencies against U.S. dollars on the date of valuation. The Fund may enter into foreign currency exchange contracts to facilitate transactions denominated in a foreign currency. Purchases and sales of securities, income and expense items denominated in foreign currencies are translated into U.S. dollars at the exchange rate in effect on the transaction date. Occasionally, events may impact the availability or reliability of foreign exchange rates used to convert the U.S. dollar equivalent value. If such an event occurs, the foreign exchange rate will be valued at fair value using procedures established and approved by the Fund’s Board of Trustees.
The Fund does not separately report the effect of changes in foreign exchange rates from changes in market prices on securities held. Such changes are included in net realized and unrealized gain or loss from investments on the Statement of Operations.
TD-20
Franklin Templeton Variable Insurance Products Trust
Notes to Financial Statements (continued)
Templeton Developing Markets Securities Fund
1. ORGANIZATION AND SIGNIFICANT ACCOUNTING POLICIES (continued)
b. Foreign Currency Translation (continued)
Realized foreign exchange gains or losses arise from sales of foreign currencies, currency gains or losses realized between the trade and settlement dates on securities transactions and the difference between the recorded amounts of dividends, interest, and foreign withholding taxes and the U.S. dollar equivalent of the amounts actually received or paid. Net unrealized foreign exchange gains and losses arise from changes in foreign exchange rates on foreign denominated assets and liabilities other than investments in securities held at the end of the reporting period.
c. Income and Deferred Taxes
No provision has been made for U.S. income taxes because it is the Fund’s policy to qualify as a regulated investment company under the Internal Revenue Code and to distribute to shareholders substantially all of its taxable income and net realized gains.
The Fund has reviewed the tax positions, taken on federal income tax returns, for each of the three open tax years and as of December 31, 2009, and has determined that no provision for income tax is required in the Fund’s financial statements.
Foreign securities held by the Fund may be subject to foreign taxation on dividend and interest income received. Foreign taxes, if any, are recorded based on the tax regulations and rates that exist in the foreign markets in which the Fund invests.
The Fund may be subject to a tax imposed on net realized gains on securities of certain foreign countries. The Fund records an estimated deferred tax liability for net unrealized gains on these securities in an amount that would be payable if the securities were disposed of on the valuation date.
d. Security Transactions, Investment Income, Expenses and Distributions
Security transactions are accounted for on trade date. Realized gains and losses on security transactions are determined on a specific identification basis. Estimated expenses are accrued daily. Dividend income is recorded on the ex-dividend date except that certain dividends from foreign securities are recognized as soon as the Fund is notified of the ex-dividend date. Distributions to shareholders are recorded on the ex-dividend date and are determined according to income tax regulations (tax basis). Distributable earnings determined on a tax basis may differ from earnings recorded in accordance with accounting principles generally accepted in the United States of America. These differences may be permanent or temporary. Permanent differences are reclassified among capital accounts to reflect their tax character. These reclassifications have no impact on net assets or the results of operations. Temporary differences are not reclassified, as they may reverse in subsequent periods.
Common expenses incurred by the Trust are allocated among the funds based on the ratio of net assets of each fund to the combined net assets of the Trust. Fund specific expenses are charged directly to the fund that incurred the expense.
Realized and unrealized gains and losses and net investment income, not including class specific expenses, are allocated daily to each class of shares based upon the relative proportion of net assets of each class. Differences in per share distributions, by class, are generally due to differences in class specific expenses.
e. Accounting Estimates
The preparation of financial statements in accordance with accounting principles generally accepted in the United States of America requires management to make estimates and assumptions that affect the reported amounts of assets and liabilities at the date of the financial statements and the amounts of income and expenses during the reporting period. Actual results could differ from those estimates.
TD-21
Franklin Templeton Variable Insurance Products Trust
Notes to Financial Statements (continued)
Templeton Developing Markets Securities Fund
1. ORGANIZATION AND SIGNIFICANT ACCOUNTING POLICIES (continued)
f. Redemption Fees
Redemptions and exchanges of interests in an insurance company subaccount that invests in Class 3 shares of the Fund will be subject to a 1.0% short term trading fee if the interest in the subaccount has been held for less than 60 days. Such fees are retained by the Fund and accounted for as an addition to paid-in capital.
g. Guarantees and Indemnifications
Under the Trust’s organizational documents, its officers and trustees are indemnified by the Trust against certain liabilities arising out of the performance of their duties to the Trust. Additionally, in the normal course of business, the Trust, on behalf of the Fund, enters into contracts with service providers that contain general indemnification clauses. The Trust’s maximum exposure under these arrangements is unknown as this would involve future claims that may be made against the Trust that have not yet occurred. Currently, the Trust expects the risk of loss to be remote.
2. SHARES OF BENEFICIAL INTEREST
At December 31, 2009, there were an unlimited number of shares authorized (without par value). Transactions in the Fund’s shares were as follows:
| | | | | | | | | | | | | | |
| | | Year Ended December 31, | |
| | | 2009 | | | 2008a | |
| Class 1 Shares: | | Shares | | | Amount | | | Shares | | | Amount | |
Shares sold | | 8,168,810 | | | $ | 63,707,152 | | | 2,353,700 | | | $ | 25,940,524 | |
Shares issued in reinvestment of distributions | | 2,750,570 | | | | 14,825,573 | | | 10,523,272 | | | | 116,387,388 | |
Shares redeemed in-kind (Note 10) | | (7,688,598 | ) | | | (41,966,671 | ) | | (4,035,054 | ) | | | (26,002,704 | ) |
Shares redeemed | | (8,503,331 | ) | | | (52,516,204 | ) | | (17,164,161 | ) | | | (171,175,496 | ) |
| | | | |
Net increase (decrease) | | (5,272,549 | ) | | $ | (15,950,150 | ) | | (8,322,243 | ) | | $ | (54,850,288 | ) |
| | | | |
Class 2 Shares: | | | | | | | | | | | | | | |
Shares sold | | 10,529,364 | | | $ | 81,012,897 | | | 11,623,915 | | | $ | 125,237,066 | |
Shares issued in reinvestment of distributions | | 2,847,995 | | | | 15,265,252 | | | 14,189,685 | | | | 155,235,152 | |
Shares redeemed in-kind (Note 10) | | — | | | | — | | | (16,334,498 | ) | | | (160,666,736 | ) |
Shares redeemed | | (12,555,978 | ) | | | (93,100,751 | ) | | (33,921,710 | ) | | | (311,998,724 | ) |
| | | | |
Net increase (decrease) | | 821,381 | | | $ | 3,177,398 | | | (24,442,608 | ) | | $ | (192,193,242 | ) |
| | | | |
Class 3 Shares: | | | | | | | | | | | | | | |
Shares sold | | 2,627,098 | | | $ | 19,856,055 | | | 1,019,532 | | | $ | 12,310,616 | |
Shares issued in reinvestment of distributions | | 365,167 | | | | 1,946,341 | | | 1,367,241 | | | | 14,902,925 | |
Shares redeemed | | (1,609,465 | ) | | | (11,557,938 | ) | | (3,236,638 | ) | | | (35,593,985 | ) |
| | | | |
Net increase (decrease) | | 1,382,800 | | | $ | 10,244,457 | | | (849,865 | ) | | $ | (8,380,444 | ) |
| | | | |
Class 4 Shares: | | | | | | | | | | | | | | |
Shares sold | | 1,613,355 | | | $ | 12,381,956 | | | 1,437,741 | | | $ | 12,416,230 | |
Shares issued on reinvestment of distributions | | 94,491 | | | | 508,362 | | | 40,710 | | | | 449,439 | |
Shares redeemed | | (201,223 | ) | | | (1,623,922 | ) | | (294,611 | ) | | | (1,917,276 | ) |
| | | | |
Net increase (decrease) | | 1,506,623 | | | $ | 11,266,396 | | | 1,183,840 | | | $ | 10,948,393 | |
| | | | |
| a | For the period February 29, 2008 (effective date) to December 31, 2008 for Class 4. |
TD-22
Franklin Templeton Variable Insurance Products Trust
Notes to Financial Statements (continued)
Templeton Developing Markets Securities Fund
3. TRANSACTIONS WITH AFFILIATES
Franklin Resources, Inc. is the holding company for various subsidiaries that together are referred to as Franklin Templeton Investments. Certain officers and trustees of the Trust are also officers and/or directors of the following subsidiaries:
| | |
| Subsidiary | | Affiliation |
Templeton Asset Management Ltd. (TAML) | | Investment manager |
Franklin Templeton Services, LLC (FT Services) | | Administrative manager |
Franklin Templeton Distributors, Inc. (Distributors) | | Principal underwriter |
Franklin Templeton Investor Services, LLC (Investor Services) | | Transfer agent |
a. Management Fees
The Fund pays an investment management fee to TAML based on the average daily net assets of the Fund as follows:
| | |
| Annualized Fee Rate | | Net Assets |
| 1.250% | | Up to and including $1 billion |
| 1.200% | | Over $1 billion, up to and including $5 billion |
| 1.150% | | Over $5 billion, up to and including $10 billion |
| 1.100% | | Over $10 billion, up to and including $15 billion |
| 1.050% | | Over $15 billion, up to and including $20 billion |
| 1.000% | | In excess of $20 billion |
b. Administrative Fees
The Fund pays an administrative fee to FT Services based on the Fund’s average daily net assets as follows:
| | |
| Annualized Fee Rate | | Net Assets |
| 0.150% | | Up to and including $200 million |
| 0.135% | | Over $200 million, up to and including $700 million |
| 0.100% | | Over $700 million, up to and including $1.2 billion |
| 0.075% | | In excess of $1.2 billion |
c. Distribution Fees
The Fund’s Board of Trustees has adopted distribution plans for Class 2, Class 3, and Class 4 shares pursuant to Rule 12b-1 under the 1940 Act. Under the Fund’s compensation distribution plans, the Fund pays Distributors for costs incurred in connection with the servicing, sale and distribution of the Fund’s shares up to 0.25%, 0.35%, and 0.35% per year of its average daily net assets of Class 2, Class 3, and Class 4, respectively. The Board of Trustees has agreed to limit the current rate to 0.25% per year for Class 3.
d. Transfer Agent Fees
Investor Services, under terms of an agreement, performs shareholder servicing for the Fund and is not paid by the Fund for the services.
TD-23
Franklin Templeton Variable Insurance Products Trust
Notes to Financial Statements (continued)
Templeton Developing Markets Securities Fund
4. EXPENSE OFFSET ARRANGEMENT
The Fund has entered into an arrangement with its custodian whereby credits realized as a result of uninvested cash balances are used to reduce a portion of the Fund’s custodian expenses. During the year ended December 31, 2009, the custodian fees were reduced as noted in the Statement of Operations.
5. INCOME TAXES
For tax purposes, capital losses may be carried over to offset future capital gains, if any. At December 31, 2009, the Fund had tax basis capital losses of $212,573,452 expiring in 2017.
For tax purposes, realized capital losses occurring subsequent to October 31, may be deferred and treated as occurring on the first day of the following fiscal year. At December 31, 2009, the Fund deferred realized capital losses of $805,355.
The tax character of distributions paid during the years ended December 31, 2009 and 2008, was as follows:
| | | | | | |
| | | 2009 | | 2008 |
Distributions paid from: | | | | | | |
Ordinary income | | $ | 29,826,261 | | $ | 55,303,760 |
Long term capital gain | | | 2,719,267 | | | 231,672,087 |
| | | | | |
| | $ | 32,545,528 | | $ | 286,975,847 |
| | | | | |
At December 31, 2009, the cost of investments, net unrealized appreciation (depreciation), and undistributed ordinary income for income tax purposes were as follows:
| | | | |
Cost of investments | | $ | 575,460,903 | |
| | | | |
Unrealized appreciation | | $ | 298,171,574 | |
Unrealized depreciation | | | (22,439,674 | ) |
| | | | |
Net unrealized appreciation (depreciation) | | $ | 275,731,900 | |
| | | | |
Distributable earnings – undistributed ordinary income | | $ | 12,555,477 | |
| | | | |
Net investment income differs for financial statement and tax purposes primarily due to differing treatments of foreign currency transactions, passive foreign investment company shares, and corporate actions.
Net realized gains (losses) differ for financial statement and tax purposes primarily due to differing treatments of wash sales, foreign currency transactions, passive foreign investment company shares, gains (losses) realized on in-kind shareholder redemptions, and corporate actions.
6. INVESTMENT TRANSACTIONS
Purchases and sales of investments (excluding short term securities) for the year ended December 31, 2009, aggregated $345,983,915 and $343,554,233, respectively. Sales of investments excludes redemption in-kind of $41,966,671.
TD-24
Franklin Templeton Variable Insurance Products Trust
Notes to Financial Statements (continued)
Templeton Developing Markets Securities Fund
7. INVESTMENTS IN INSTITUTIONAL FIDUCIARY TRUST MONEY MARKET PORTFOLIO
The Fund may invest in the Institutional Fiduciary Trust Money Market Portfolio (Sweep Money Fund), an open-end investment company managed by Franklin Advisers, Inc. (an affiliate of the investment manager). Management fees paid by the Fund are reduced on assets invested in the Sweep Money Fund, in an amount not to exceed the management and administrative fees paid by the Sweep Money Fund.
8. CONCENTRATION OF RISK
Investing in foreign securities may include certain risks and considerations not typically associated with investing in U.S. securities, such as fluctuating currency values and changing local and regional economic, political and social conditions, which may result in greater market volatility. In addition, certain foreign securities may not be as liquid as U.S. securities.
9. CREDIT FACILITY
The Fund, together with other U.S. registered and foreign investment funds (collectively “Borrowers”), managed by Franklin Templeton Investments, are borrowers in a joint syndicated senior unsecured credit facility totaling $725 million (Global Credit Facility) to provide a source of funds to the Borrowers for temporary and emergency purposes, including the ability to meet future unanticipated or unusually large redemption requests. Effective January 22, 2010, the Fund renewed the Global Credit Facility, for a total of $750 million, maturing January 21, 2011.
Under the terms of the Global Credit Facility, the Fund shall, in addition to interest charged on any borrowings made by the Fund and other costs incurred by the Fund, pay its share of fees and expenses incurred in connection with the implementation and maintenance of the Global Credit Facility, based upon its relative share of the aggregate net assets of all of the Borrowers, including an annual commitment fee of 0.10% based upon the unused portion of the Global Credit Facility. During the year ended December 31, 2009, the Fund did not utilize the Global Credit Facility.
10. REDEMPTION IN-KIND
During the year ended December 31,2009, the Fund realized $6,207,989 of net losses resulting from a redemption in-kind in which a shareholder redeemed fund shares for securities held by the Fund rather than for cash. Because such gains are not taxable to the Fund and are not distributed to remaining shareholders, they have been reclassified from accumulated net realized losses to paid-in capital.
During the year ended December 31,2008, the Fund realized $8,268,018 of net gains resulting from redemptions in-kind in which a shareholder redeemed fund shares for securities held by the Fund rather than for cash. Because such losses are not taxable to the Fund and are not netted with capital gains that are distributed to remaining shareholders, they have been reclassified from accumulated net realized gains to paid-in capital.
11. FAIR VALUE MEASUREMENTS
The Fund follow a fair value hierarchy that distinguishes between market data obtained from independent sources (observable inputs) and the Fund’s own market assumptions (unobservable inputs). These inputs are used in determining the value of the Fund’s investments and are summarized in the following fair value hierarchy:
| | • | | Level 1 – quoted prices in active markets for identical securities |
| | • | | Level 2 – other significant observable inputs (including quoted prices for similar securities, interest rates, prepayment speed, credit risk, etc.) |
| | • | | Level 3 – significant unobservable inputs (including the Fund’s own assumptions in determining the fair value of investments) |
TD-25
Franklin Templeton Variable Insurance Products Trust
Notes to Financial Statements (continued)
Templeton Developing Markets Securities Fund
The inputs or methodology used for valuing securities are not an indication of the risk associated with investing in those securities.
At December 31, 2009, all of the Fund’s investments in securities carried at fair value were in Level 1 inputs. For detailed industry/country descriptions, see the accompanying Statement of Investments.
12. NEW ACCOUNTING PRONOUNCEMENTS
In January 2010, the Financial Accounting Standards Board issued Accounting Standards Update (ASU) No. 2010-6, Fair Value Measurements and Disclosures (Topic 820): Improving Disclosures about Fair Value Measurements. ASU No. 2010-6 enhances and clarifies existing fair value measurement disclosure requirements and is effective for interim and annual periods beginning after December 15, 2009. The Fund is currently evaluating the impact, if any, of applying the provisions of ASU No. 2010-6.
13. SUBSEQUENT EVENTS
The Fund has evaluated subsequent events through February 10, 2010, the issuance date of the financial statements and determined that no events have occurred that require disclosure.
ABBREVIATIONS
Selected Portfolio
ADR - American Depository Receipt
GDR - Global Depository Receipt
SDR - Swedish Depository Receipt
TD-26
Franklin Templeton Variable Insurance Products Trust
Templeton Developing Markets Securities Fund
Report of Independent Registered Public Accounting Firm
To the Board of Trustees and Shareholders of Franklin Templeton Variable Insurance Products Trust
In our opinion, the accompanying statement of assets and liabilities, including the statement of investments, and the related statements of operations and of changes in net assets and the financial highlights present fairly, in all material respects, the financial position of Templeton Developing Markets Securities Fund (one of the funds constituting the Franklin Templeton Variable Insurance Products Trust, hereafter referred to as the “Fund”) at December 31, 2009, the results of its operations for the year then ended, the changes in its net assets and the financial highlights for the periods presented, in conformity with accounting principles generally accepted in the United States of America. These financial statements and financial highlights (hereafter referred to as “financial statements”) are the responsibility of the Fund’s management. Our responsibility is to express an opinion on these financial statements based on our audits. We conducted our audits of these financial statements in accordance with the standards of the Public Company Accounting Oversight Board (United States). Those standards require that we plan and perform the audit to obtain reasonable assurance about whether the financial statements are free of material misstatement. An audit includes examining, on a test basis, evidence supporting the amounts and disclosures in the financial statements, assessing the accounting principles used and significant estimates made by management, and evaluating the overall financial statement presentation. We believe that our audits, which included confirmation of securities at December 31, 2009 by correspondence with the custodian and brokers, provide a reasonable basis for our opinion.
PricewaterhouseCoopers LLP
San Francisco, California
February 10, 2010
TD-27
Franklin Templeton Variable Insurance Products Trust
Tax Designation (unaudited)
Templeton Developing Markets Securities Fund
Under Section 852(b)(3)(C) of the Internal Revenue Code (Code), the Fund designates the maximum amount allowable but no less than $2,719,267 as a long term capital gain dividend for the fiscal year ended December 31, 2009.
At December 31, 2009, more than 50% of the Fund’s total assets were invested in securities of foreign issuers. In most instances, foreign taxes were withheld from income paid to the Fund on these investments. The Fund elects to treat foreign taxes paid as allowed under Section 853 of the Code. This election will allow shareholders of record as of the 2010 distribution date, to treat their proportionate share of foreign taxes paid by the Fund as having been paid directly by them. The shareholder shall consider these amounts as foreign taxes paid in the tax year in which they receive the Fund distribution.
TD-28
TEMPLETON FOREIGN SECURITIES FUND
We are pleased to bring you Templeton Foreign Securities Fund’s annual report for the fiscal year ended December 31, 2009.
Performance Summary as of 12/31/09
Average annual total return of Class 4 shares* represents the average annual change in value, assuming reinvestment of dividends and capital gains. Average returns smooth out variations in returns, which can be significant; they are not the same as year-by-year results.
Periods ended 12/31/09
| | | | | | |
| | | 1-Year | | 5-Year | | 10-Year |
Average Annual Total Return | | +36.84% | | +4.87% | | +3.00% |
*Performance prior to the 5/1/00 merger reflects historical performance of Templeton International Fund. For the period beginning 2/29/08, Class 4 performance reflects a 12b-1 fee expense of 0.35% per year, which affects future performance. Class 4 performance prior to 2/29/08 reflects historical Class 1 performance, which does not include a 12b-1 fee expense. Since 2/29/08 (effective date), the average annual total return of Class 4 shares was -6.29%.
Total Return Index Comparison for a Hypothetical $10,000 Investment (1/1/00–12/31/09)
The graph below shows the change in value of a hypothetical $10,000 investment in the Fund over the indicated period and includes reinvestment of any income or distributions. The Fund’s performance* is compared to the performance of the Morgan Stanley Capital International (MSCI) Europe, Australasia, Far East (EAFE) Index. One cannot invest directly in an index, and an index is not representative of the Fund’s portfolio. Please see Important Notes to Performance Information preceding the Fund Summaries.
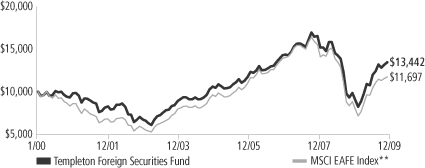
**Source: © 2009 Morningstar. Please see Index Descriptions following the Fund Summaries.
Templeton Foreign Securities Fund – Class 4
Performance reflects the Fund’s Class 4 operating expenses, but does not include any contract fees, expenses or sales charges. If they had been included, performance would be lower. These charges and deductions, particularly for variable life policies, can have a significant effect on contract values and insurance benefits. See the contract prospectus for a complete description of these expenses, including sales charges.
Performance data represent past performance, which does not guarantee future results. Investment return and principal value will fluctuate, and you may have a gain or loss when you sell your shares.
Current performance may differ from figures shown.
TF-1
Fund Goal and Main Investments: Templeton Foreign Securities Fund seeks long-term capital growth. The Fund normally invests at least 80% of its net assets in investments of issuers located outside the U.S., including those in emerging markets, and normally invests predominantly in equity securities.
Performance Overview
You can find the Fund’s one-year total return in the Performance Summary. The Fund outperformed its benchmark, the MSCI EAFE Index, which delivered a total return of +32.46% for the same period. 1 Please note that index performance information is provided for reference and that we do not attempt to track the index but rather undertake investments on the basis of fundamental research.
Economic and Market Overview
Equity markets entered 2009 largely pricing in a possible economic depression and systemic solvency crisis, scenarios that were ultimately averted by one of the most aggressive global policy responses in financial history. As government monetary and fiscal intervention began to gain traction toward the end of the first quarter, equities bottomed and largely reversed their decline, economic growth stabilized and rebounded, and confidence was rekindled as investors began to believe the global financial system was finally on the mend. Global equities rallied 73% from their March lows, led by the riskier, lower quality stocks that had been most vulnerable to a systemic meltdown or funding collapse.2 Emerging market economies fueled the recovery as governments aggressively incentivized lending and consumption, resulting in a dramatic statistical recovery that laid the groundwork for the developing world’s best annual equity rally on record. Growing demand from emerging markets supported commodity prices, which also posted record gains during the year. For most of the year, the fading U.S. dollar also helped underpin the rally in hard assets, while continued euro and yen strength created headwinds for regional recoveries.
Nonetheless, developed economies technically recovered by year-end, with Germany and France leading the eurozone out of a recession and both Japan and the U.S. exiting their longest recessions since World War II. Credit spreads narrowed as access to capital expanded and the private sector significantly reduced debt, though largely by transferring its liabilities to the public balance sheet. The growing indebtedness of sovereign governments exposed structural weaknesses in places like
1. Source: © 2009 Morningstar. One cannot invest directly in an index, and an index is not representative of the Fund’s portfolio. Please see Index Descriptions following the Fund Summaries.
2. As measured by the MSCI All Country World Index. Source: © 2009 Morningstar. Please see Index Descriptions following the Fund Summaries.
Fund Risks: The Fund’s investments in stocks may offer the potential for long-term gains but can be subject to short-term price fluctuations. Foreign investing, especially in emerging markets, involves additional risks, including currency fluctuations, economic instability, market volatility, and political and social instability. By having significant investments in one or more countries or in particular sectors (such as financial services) from time to time, the Fund may carry greater risk of adverse developments in a country or sector than a fund that invests more broadly. The Fund’s prospectus also includes a description of the main investment risks.
TF-2
Dubai, Greece and Ireland, temporarily roiling markets toward the end of the year. Policymakers remained firmly committed to stimulus throughout the period, indicating that deflation worries persisted despite signs of economic stabilization. The U.S. Federal Reserve Board announced its intention to keep the benchmark lending rate “exceptionally low” for an extended period; the new Japanese administration trumpeted its fight against deflation; and even China restated its commitment to “moderately loose” policy. Still, policymakers began discussing exit strategies by period-end as interest rates remained at record lows and economic indicators rebounded.
Investment Strategy
Our investment philosophy is bottom up, value oriented and long term. In choosing investments, we generally focus on the market price of a company’s securities relative to our evaluation of the company’s potential long-term earnings, asset value and cash flow. Among factors we consider are a company’s historical value measures, including price/earnings ratio, profit margins and liquidation value. We do in-depth research to construct a bargain list from which we buy.
Manager’s Discussion
During the year under review, stock selection in the information technology sector benefited the Fund’s results relative to the benchmark MSCI EAFE Index.3 Within the sector, semiconductor and semiconductor equipment manufacturers Taiwan Semiconductor Manufacturing,4 South Korea’s Samsung Electronics4 and Germany’s Infineon Technologies performed well. Additionally, Singapore’s Flextronics International4 and Taiwan’s Lite-On Technologies4 were contributors in the sector. An underweighted allocation to the utilities sector and stock selection in the industrials sector also boosted relative performance.5 Key industrials sector contributors included the Netherlands’ Randstad Holding and Switzerland’s Adecco, both in the professional services industry. Other positions that helped relative results included Norway’s Telenor in the telecommunication services sector, the U.K.’s Kingfisher in the consumer discretionary sector and India’s Reliance Industries4 in the energy sector.6
3. The information technology sector comprises communications equipment; computers and peripherals; electronic equipment, instruments and components; semiconductors and semiconductor equipment; and software in the SOI.
4. This holding is not an index component.
5. The utilities sector comprises electric utilities and multi-utilities in the SOI.
6. The telecommunication services sector comprises diversified telecommunication services and wireless telecommunication services in the SOI. The consumer discretionary sector comprises automobiles; hotels, restaurants and leisure; media; multiline retail; specialty retail; and textiles, apparel and luxury goods in the SOI. The energy sector comprises energy equipment and services; and oil, gas and consumable fuels in the SOI.
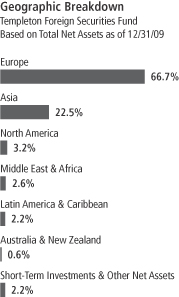
TF-3
Detractors from relative performance included stock selection and underweighted allocations in the materials and financials sectors.7 In the materials sector, Canadian mining company Barrick Gold4 and Finnish paper products manufacturer UPM-Kymmene hurt results, while in the financials sector, insurers ACE4 and Swiss Reinsurance underperformed. Other key detractors were France Telecom, French media and telecommunications conglomerate Vivendi, and U.K. mobile telecommunications company Vodafone Group. In the health care sector, Swiss biotechnology and chemicals company Lonza Group and Japan’s Takeda Pharmaceuticals also hindered results.8
From a geographic perspective, the Fund’s exposure to Asia boosted relative performance, as our investments in non-index components Taiwan and South Korea outperformed the benchmark index. Our sizable underweighting in Japan was also beneficial. In contrast, the Fund’s underweighted allocation to Australia, which performed well, was a drag on performance, as was stock selection in Europe, particularly in France and Sweden.
It is also important to recognize the effect of currency movements on the Fund’s performance. In general, if the value of the U.S. dollar goes up compared with a foreign currency, an investment traded in that foreign currency will go down in value because it will be worth fewer U.S. dollars. This can have a negative effect on Fund performance. Conversely, when the U.S. dollar weakens in relation to a foreign currency, an investment traded in that foreign currency will increase in value, which can contribute to Fund performance. For the 12 months ended December 31, 2009, the U.S. dollar declined in value relative to most non-U.S. currencies. As a result, the Fund’s performance was positively affected by the portfolio’s predominant investment in securities with non-U.S. currency exposure. However, one cannot expect the same result in future periods.
Thank you for your participation in Templeton Foreign Securities Fund. We look forward to serving your future investment needs.
7. The materials sector comprises containers and packaging, and metals and mining in the SOI. The financials sector comprises capital markets, commercial banks, diversified financial services, insurance, and real estate management and development in the SOI.
8. The health care sector comprises health care providers and services, life sciences tools and services, and pharmaceuticals in the SOI.
The foregoing information reflects our analysis, opinions and portfolio holdings as of December 31, 2009, the end of the reporting period. The way we implement our main investment strategies and the resulting portfolio holdings may change depending on factors such as market and economic conditions. These opinions may not be relied upon as investment advice or an offer for a particular security. The information is not a complete analysis of every aspect of any market, country, industry, security or the Fund. Statements of fact are from sources considered reliable, but the investment manager makes no representation or warranty as to their completeness or accuracy. Although historical performance is no guarantee of future results, these insights may help you understand our investment management philosophy.
Top 10 Holdings
Templeton Foreign Securities Fund
12/31/09
| | |
Company
Sector/Industry,
Country | | % of Total Net Assets |
| Vodafone Group PLC, ADR | | 3.0% |
| Wireless Telecommunication Services, U.K. | | |
| Telenor ASA | | 2.7% |
| Diversified Telecommunication Services, Norway | | |
| Samsung Electronics Co. Ltd. | | 2.3% |
| Semiconductors & Semiconductor Equipment, South Korea | | |
| Siemens AG | | 2.2% |
| Industrial Conglomerates, Germany | | |
| Sanofi-Aventis | | 2.2% |
| Pharmaceuticals, France | | |
| Total SA, B | | 2.2% |
| Oil, Gas & Consumable Fuels, France | | |
| Statoil ASA | | 2.1% |
| Oil, Gas & Consumable Fuels, Norway | | |
| Adecco SA | | 2.1% |
| Professional Services, Switzerland | | |
| GlaxoSmithKline PLC | | 2.0% |
| Pharmaceuticals, U.K. | | |
| ING Groep NV | | 2.0% |
| Diversified Financial Services, Netherlands | | |
The dollar value, number of shares or principal amount, and names of all portfolio holdings are listed in the Fund’s Statement of Investments (SOI).
TF-4
Fund Expenses
As an investor in a variable insurance contract (Contract) that indirectly provides for investment in an underlying mutual fund, you can incur transaction and/or ongoing expenses at both the Fund level and the Contract level.
| • | | Transaction expenses can include sales charges (loads) on purchases, redemption fees, surrender fees, transfer fees and premium taxes. |
| • | | Ongoing expenses can include management fees, distribution and service (12b-1) fees, contract fees, annual maintenance fees, mortality and expense risk fees and other fees and expenses. All mutual funds and Contracts have some types of ongoing expenses. |
The expenses shown in the table are meant to highlight ongoing expenses at the Fund level only and do not include ongoing expenses at the Contract level, or transaction expenses at either the Fund or Contract level. While the Fund does not have transaction expenses, if the transaction and ongoing expenses at the Contract level were included, the expenses shown below would be higher. You should consult your Contract prospectus or disclosure document for more information.
The table shows Fund-level ongoing expenses and can help you understand these expenses and compare them with those of other mutual funds offered through the Contract. The table assumes a $1,000 investment held for the six months indicated. Please refer to the Fund prospectus for additional information on operating expenses.
Actual Fund Expenses
The first line (Actual) of the table provides actual account values and expenses. The “Ending Account Value” is derived from the Fund’s actual return, which includes the effect of ongoing Fund expenses, but does not include the effect of ongoing Contract expenses.
You can estimate the Fund-level expenses you incurred during the period by following these steps. Of course, your account value and expenses will differ from those in this illustration:
| 1. | Divide your account value by $1,000. |
If an account had an $8,600 value, then $8,600 ÷ $1,000 = 8.6.
| 2. | Multiply the result by the number under the heading “Fund-Level Expenses Incurred During Period.” |
If Fund-Level Expenses Incurred During Period were $7.50, then 8.6 x $7.50 = $64.50.
In this illustration, the estimated expenses incurred this period at the Fund level are $64.50.
Templeton Foreign Securities Fund – Class 4
TF-5
Hypothetical Example for Comparison with Other Mutual Funds
Information in the second line (Hypothetical) of the table can help you compare ongoing expenses of the Fund with those of other mutual funds offered through the Contract. This information may not be used to estimate the actual ending account balance or expenses you incurred during the period. The hypothetical “Ending Account Value” is based on the Fund’s actual expense ratio and an assumed 5% annual rate of return before expenses, which does not represent the Fund’s actual return. The figure under the heading “Fund-Level Expenses Incurred During Period” shows the hypothetical expenses your account would have incurred under this scenario. You can compare this figure with the 5% hypothetical examples that appear in shareholder reports of other funds offered through a Contract.
| | | | | | | | | |
| Class 4 | | Beginning
Account Value 7/1/09 | | Ending
Account Value 12/31/09 | | Fund-Level Expenses Incurred
During Period* 7/1/09–12/31/09 |
Actual | | $ | 1,000 | | $ | 1,253.70 | | $ | 6.25 |
Hypothetical (5% return before expenses) | | $ | 1,000 | | $ | 1,019.66 | | $ | 5.60 |
*Expenses are calculated using the most recent six-month annualized expense ratio for the Fund’s Class 4 shares (1.10%), which does not include any ongoing expenses of the Contract for which the Fund is an investment option, multiplied by the average account value over the period, multiplied by 184/365 to reflect the one-half year period.
TF-6
Franklin Templeton Variable Insurance Products Trust
Financial Highlights
Templeton Foreign Securities Fund
| | | | | | | | | | | | | | | | | | | | |
| | | Year Ended December 31, | |
| Class 1 | | 2009 | | | 2008 | | | 2007 | | | 2006 | | | 2005 | |
| | | | |
Per share operating performance | | | | | | | | | | | | | | | | | | | | |
(for a share outstanding throughout the year) | | | | | | | | | | | | | | | | | | | | |
Net asset value, beginning of year | | $ | 10.95 | | | $ | 20.57 | | | $ | 19.00 | | | $ | 15.84 | | | $ | 14.53 | |
| | | | |
Income from investment operationsa: | | | | | | | | | | | | | | | | | | | | |
Net investment incomeb | | | 0.25 | | | | 0.45 | | | | 0.45 | | | | 0.46 | | | | 0.30 | |
Net realized and unrealized gains (losses) | | | 3.39 | | | | (8.01 | ) | | | 2.46 | | | | 2.94 | | | | 1.20 | |
| | | | |
Total from investment operations | | | 3.64 | | | | (7.56 | ) | | | 2.91 | | | | 3.40 | | | | 1.50 | |
| | | | |
Less distributions from: | | | | | | | | | | | | | | | | | | | | |
Net investment income | | | (0.43 | ) | | | (0.45 | ) | | | (0.44 | ) | | | (0.24 | ) | | | (0.19 | ) |
Net realized gains | | | (0.48 | ) | | | (1.61 | ) | | | (0.90 | ) | | | — | | | | — | |
| | | | |
Total distributions | | | (0.91 | ) | | | (2.06 | ) | | | (1.34 | ) | | | (0.24 | ) | | | (0.19 | ) |
| | | | |
Redemption feesc | | | — | | | | — | | | | — | | | | — | | | | — | |
| | | | |
Net asset value, end of year | | $ | 13.68 | | | $ | 10.95 | | | $ | 20.57 | | | $ | 19.00 | | | $ | 15.84 | |
| | | | |
| | | | | |
Total returnd | | | 37.34% | | | | (40.23)% | | | | 15.79% | | | | 21.70% | | | | 10.48% | |
Ratios to average net assets | | | | | | | | | | | | | | | | | | | | |
Expensese | | | 0.78% | | | | 0.77% | | | | 0.75% | | | | 0.75% | | | | 0.77% | |
Net investment income | | | 2.28% | | | | 2.82% | | | | 2.22% | | | | 2.63% | | | | 2.03% | |
| | | | | |
Supplemental data | | | | | | | | | | | | | | | | | | | | |
Net assets, end of year (000’s) | | $ | 318,173 | | | $ | 262,725 | | | $ | 531,377 | | | $ | 594,991 | | | $ | 531,775 | |
Portfolio turnover rate | | | 22.50% | | | | 18.27% | | | | 26.74% | | | | 18.97% | f | | | 14.61% | |
aThe amount shown for a share outstanding throughout the period may not correlate with the Statement of Operations for the period due to the timing of sales and repurchases of the Fund shares in relation to income earned and/or fluctuating market value of the investments of the Fund.
bBased on average daily shares outstanding.
cAmount rounds to less than $0.01 per share.
dTotal return does not include any fees, charges or expenses imposed by the variable annuity and life insurance contracts for which the Franklin Templeton Variable Insurance Products Trust serves as an underlying investment vehicle.
eBenefit of expense reduction rounds to less than 0.01%.
fExcludes the value of portfolio securities delivered as a result of redemption in-kind.
The accompanying notes are an integral part of these financial statements.
TF-7
Franklin Templeton Variable Insurance Products Trust
Financial Highlights (continued)
Templeton Foreign Securities Fund
| | | | | | | | | | | | | | | | | | | | |
| | | Year Ended December 31, | |
| Class 2 | | 2009 | | | 2008 | | | 2007 | | | 2006 | | | 2005 | |
| | | | |
Per share operating performance | | | | | | | | | | | | | | | | | | | | |
(for a share outstanding throughout the year) | | | | | | | | | | | | | | | | | | | | |
Net asset value, beginning of year | | $ | 10.76 | | | $ | 20.25 | | | $ | 18.73 | | | $ | 15.63 | | | $ | 14.35 | |
| | | | |
Income from investment operationsa: | | | | | | | | | | | | | | | | | | | | |
Net investment incomeb | | | 0.22 | | | | 0.40 | | | | 0.38 | | | | 0.40 | | | | 0.26 | |
Net realized and unrealized gains (losses) | | | 3.34 | | | | (7.89 | ) | | | 2.44 | | | | 2.91 | | | | 1.19 | |
| | | | |
Total from investment operations | | | 3.56 | | | | (7.49 | ) | | | 2.82 | | | | 3.31 | | | | 1.45 | |
| | | | |
Less distributions from: | | | | | | | | | | | | | | | | | | | | |
Net investment income | | | (0.39 | ) | | | (0.39 | ) | | | (0.40 | ) | | | (0.21 | ) | | | (0.17 | ) |
Net realized gains | | | (0.48 | ) | | | (1.61 | ) | | | (0.90 | ) | | | — | | | | — | |
| | | | |
Total distributions | | | (0.87 | ) | | | (2.00 | ) | | | (1.30 | ) | | | (0.21 | ) | | | (0.17 | ) |
| | | | |
Redemption feesc | | | — | | | | — | | | | — | | | | — | | | | — | |
| | | | |
Net asset value, end of year | | $ | 13.45 | | | $ | 10.76 | | | $ | 20.25 | | | $ | 18.73 | | | $ | 15.63 | |
| | | | |
| | | | | |
Total returnd | | | 37.04% | | | | (40.38)% | | | | 15.46% | | | | 21.44% | | | | 10.17% | |
Ratios to average net assets | | | | | | | | | | | | | | | | | | | | |
Expensese | | | 1.03% | | | | 1.02% | | | | 1.00% | | | | 1.00% | | | | 1.02% | |
Net investment income | | | 2.03% | | | | 2.57% | | | | 1.97% | | | | 2.38% | | | | 1.78% | |
| | | | | |
Supplemental data | | | | | | | | | | | | | | | | | | | | |
Net assets, end of year (000’s) | | $ | 2,010,268 | | | $ | 1,702,038 | | | $ | 3,255,154 | | | $ | 2,941,374 | | | $ | 2,232,990 | |
Portfolio turnover rate | | | 22.50% | | | | 18.27% | | | | 26.74% | | | | 18.97% | f | | | 14.61% | |
aThe amount shown for a share outstanding throughout the period may not correlate with the Statement of Operations for the period due to the timing of sales and repurchases of the Fund shares in relation to income earned and/or fluctuating market value of the investments of the Fund.
bBased on average daily shares outstanding.
cAmount rounds to less than $0.01 per share.
dTotal return does not include any fees, charges or expenses imposed by the variable annuity and life insurance contracts for which the Franklin Templeton Variable Insurance Products Trust serves as an underlying investment vehicle.
eBenefit of waiver and payment by affiliate and expense reduction rounds to less than 0.01%.
fExcludes the value of portfolio securities delivered as a result of redemption in-kind.
The accompanying notes are an integral part of these financial statements.
TF-8
Franklin Templeton Variable Insurance Products Trust
Financial Highlights (continued)
Templeton Foreign Securities Fund
| | | | | | | | | | | | | | | | | | | | |
| | | Year Ended December 31, | |
| Class 3 | | 2009 | | | 2008 | | | 2007 | | | 2006 | | | 2005 | |
| | | | |
Per share operating performance | | | | | | | | | | | | | | | | | | | | |
(for a share outstanding throughout the year) | | | | | | | | | | | | | | | | | | | | |
Net asset value, beginning of year | | $ | 10.70 | | | $ | 20.18 | | | $ | 18.68 | | | $ | 15.60 | | | $ | 14.35 | |
| | | | |
Income from investment operationsa: | | | | | | | | | | | | | | | | | | | | |
Net investment incomeb | | | 0.25 | | | | 0.39 | | | | 0.37 | | | | 0.37 | | | | 0.25 | |
Net realized and unrealized gains (losses) | | | 3.30 | | | | (7.84 | ) | | | 2.45 | | | | 2.94 | | | | 1.18 | |
| | | | |
Total from investment operations | | | 3.55 | | | | (7.45 | ) | | | 2.82 | | | | 3.31 | | | | 1.43 | |
| | | | |
Less distributions from: | | | | | | | | | | | | | | | | | | | | |
Net investment income | | | (0.40 | ) | | | (0.42 | ) | | | (0.42 | ) | | | (0.23 | ) | | | (0.18 | ) |
Net realized gains | | | (0.48 | ) | | | (1.61 | ) | | | (0.90 | ) | | | — | | | | — | |
| | | | |
Total distributions | | | (0.88 | ) | | | (2.03 | ) | | | (1.32 | ) | | | (0.23 | ) | | | (0.18 | ) |
| | | | |
Redemption feesc | | | — | | | | — | | | | — | | | | — | | | | — | |
| | | | |
Net asset value, end of year | | $ | 13.37 | | | $ | 10.70 | | | $ | 20.18 | | | $ | 18.68 | | | $ | 15.60 | |
| | | | |
| | | | | |
Total returnd | | | 37.20% | | | | (40.39)% | | | | 15.45% | | | | 21.46% | | | | 10.13% | |
Ratios to average net assets | | | | | | | | | | | | | | | | | | | | |
Expensese | | | 1.03% | | | | 1.02% | | | | 1.00% | | | | 1.00% | | | | 1.02% | |
Net investment income | | | 2.03% | | | | 2.57% | | | | 1.97% | | | | 2.38% | | | | 1.78% | |
| | | | | |
Supplemental data | | | | | | | | | | | | | | | | | | | | |
Net assets, end of year (000’s) | | $ | 115,364 | | | $ | 271,061 | | | $ | 313,505 | | | $ | 150,417 | | | $ | 47,462 | |
Portfolio turnover rate | | | 22.50% | | | | 18.27% | | | | 26.74% | | | | 18.97% | f | | | 14.61% | |
aThe amount shown for a share outstanding throughout the period may not correlate with the Statement of Operations for the period due to the timing of sales and repurchases of the Fund shares in relation to income earned and/or fluctuating market value of the investments of the Fund.
bBased on average daily shares outstanding.
cAmount rounds to less than $0.01 per share.
dTotal return does not include any fees, charges or expenses imposed by the variable annuity and life insurance contracts for which the Franklin Templeton Variable Insurance Products Trust serves as an underlying investment vehicle.
eBenefit of expense reduction rounds to less than 0.01%.
fExcludes the value of portfolio securities delivered as a result of redemption in-kind.
The accompanying notes are an integral part of these financial statements.
TF-9
Franklin Templeton Variable Insurance Products Trust
Financial Highlights (continued)
Templeton Foreign Securities Fund
| | | | | | | | |
| | | Year Ended
December 31, | |
| Class 4 | | 2009 | | | 2008a | |
| | | | |
Per share operating performance | | | | | | | | |
(for a share outstanding throughout the year) | | | | | | | | |
Net asset value, beginning of year | | $ | 10.91 | | | $ | 18.90 | |
| | | | |
Income from investment operationsb: | | | | | | | | |
Net investment incomec | | | 0.21 | | | | 0.15 | |
Net realized and unrealized gains (losses) | | | 3.37 | | | | (6.08 | ) |
| | | | |
Total from investment operations | | | 3.58 | | | | (5.93 | ) |
| | | | |
Less distributions from: | | | | | | | | |
Net investment income | | | (0.42 | ) | | | (0.45 | ) |
Net realized gains | | | (0.48 | ) | | | (1.61 | ) |
| | | | |
Total distributions | | | (0.90 | ) | | | (2.06 | ) |
| | | | |
Redemption feesd | | | — | | | | — | |
| | | | |
Net asset value, end of year | | $ | 13.59 | | | $ | 10.91 | |
| | | | |
| | |
Total returne | | | 36.84% | | | | (35.15)% | |
Ratios to average net assetsf | | | | | | | | |
Expensesg | | | 1.13% | | | | 1.12% | |
Net investment income | | | 1.93% | | | | 2.47% | |
| | |
Supplemental data | | | | | | | | |
Net assets, end of year (000’s) | | $ | 48,501 | | | $ | 14,287 | |
Portfolio turnover rate | | | 22.50% | | | | 18.27% | |
aFor the period February 29, 2008 (effective date) to December 31, 2008.
bThe amount shown for a share outstanding throughout the period may not correlate with the Statement of Operations for the period due to the timing of sales and repurchases of the Fund shares in relation to income earned and/or fluctuating market value of the investments of the Fund.
cBased on average daily shares outstanding.
dAmount rounds to less than $0.01 per share.
eTotal return does not include any fees, charges or expenses imposed by the variable annuity and life insurance contracts for which the Franklin Templeton Variable Insurance Products Trust serves as an underlying investment vehicle. Total return is not annualized for periods less than one year.
fRatios are annualized for periods less than one year.
gBenefit of expense reduction rounds to less than 0.01%.
The accompanying notes are an integral part of these financial statements.
TF-10
Franklin Templeton Variable Insurance Products Trust
Statement of Investments, December 31, 2009
| | | | | | | |
| Templeton Foreign Securities Fund | | Country | | Shares/
Units | | Value |
Common Stocks and Other Equity Interests 96.3% | | | | | | | |
Aerospace & Defense 1.4% | | | | | | | |
BAE Systems PLC | | United Kingdom | | 3,375,990 | | | $ 19,543,796 |
Embraer-Empresa Brasileira de Aeronautica SA, ADR | | Brazil | | 700,030 | | | 15,477,663 |
| | | | | | | |
| | | | | | | 35,021,459 |
| | | | | | | |
Air Freight & Logistics 0.8% | | | | | | | |
Deutsche Post AG | | Germany | | 1,087,912 | | | 21,101,303 |
| | | | | | | |
Automobiles 1.9% | | | | | | | |
Bayerische Motoren Werke AG | | Germany | | 354,040 | | | 16,217,298 |
Toyota Motor Corp., ADR | | Japan | | 380,380 | | | 32,012,781 |
| | | | | | | |
| | | | | | | 48,230,079 |
| | | | | | | |
Capital Markets 0.4% | | | | | | | |
aKKR & Co. (Guernsey) LP | | United States | | 1,155,000 | | | 9,817,500 |
| | | | | | | |
Commercial Banks 3.1% | | | | | | | |
DBS Group Holdings Ltd. | | Singapore | | 2,585,520 | | | 28,329,426 |
aKB Financial Group Inc., ADR | | South Korea | | 793,291 | | | 40,338,847 |
Mitsubishi UFJ Financial Group Inc. | | Japan | | 1,571,600 | | | 7,639,957 |
| | | | | | | |
| | | | | | | 76,308,230 |
| | | | | | | |
Commercial Services & Supplies 0.6% | | | | | | | |
Brambles Ltd. | | Australia | | 2,375,538 | | | 14,452,851 |
| | | | | | | |
Communications Equipment 1.1% | | | | | | | |
Telefonaktiebolaget LM Ericsson, B, ADR | | Sweden | | 2,929,600 | | | 26,923,024 |
| | | | | | | |
Computers & Peripherals 2.1% | | | | | | | |
Compal Electronics Inc. | | Taiwan | | 12,981,833 | | | 17,997,633 |
Lite-On Technology Corp. | | Taiwan | | 22,930,764 | | | 34,442,739 |
| | | | | | | |
| | | | | | | 52,440,372 |
| | | | | | | |
Containers & Packaging 0.5% | | | | | | | |
Rexam PLC | | United Kingdom | | 2,609,190 | | | 12,217,819 |
| | | | | | | |
Diversified Financial Services 2.0% | | | | | | | |
aING Groep NV | | Netherlands | | 5,078,534 | | | 50,160,708 |
| | | | | | | |
Diversified Telecommunication Services 10.7% | | | | | | | |
China Telecom Corp. Ltd., H | | China | | 73,292,357 | | | 30,626,312 |
Chunghwa Telecom Co. Ltd., ADR | | Taiwan | | 641,569 | | | 11,913,936 |
France Telecom SA | | France | | 1,868,953 | | | 46,630,704 |
Singapore Telecommunications Ltd. | | Singapore | | 20,278,000 | | | 44,869,854 |
Telefonica SA, ADR | | Spain | | 593,854 | | | 49,598,686 |
Telekom Austria AG | | Austria | | 1,155,630 | | | 16,459,555 |
aTelenor ASA | | Norway | | 4,844,334 | | | 67,737,436 |
| | | | | | | |
| | | | | | | 267,836,483 |
| | | | | | | |
Electric Utilities 2.0% | | | | | | | |
E.ON AG | | Germany | | 519,730 | | | 21,656,895 |
Iberdrola SA | | Spain | | 2,862,677 | | | 27,332,188 |
| | | | | | | |
| | | | | | | 48,989,083 |
| | | | | | | |
Electrical Equipment 0.4% | | | | | | | |
Shanghai Electric Group Co. Ltd. | | China | | 22,524,000 | | | 10,428,719 |
| | | | | | | |
TF-11
Franklin Templeton Variable Insurance Products Trust
Statement of Investments, December 31, 2009 (continued)
| | | | | | | |
| Templeton Foreign Securities Fund | | Country | | Shares/
Units | | Value |
Common Stocks and Other Equity Interests (continued) | | | | | | | |
Electronic Equipment, Instruments & Components 1.3% | | | | | | | |
aFlextronics International Ltd. | | Singapore | | 4,284,910 | | $ | 31,322,692 |
| | | | | | | |
Energy Equipment & Services 0.7% | | | | | | | |
Aker Solutions ASA | | Norway | | 1,386,290 | | | 18,044,921 |
| | | | | | | |
Food Products 3.3% | | | | | | | |
Nestle SA | | Switzerland | | 900,480 | | | 43,669,126 |
Unilever PLC | | United Kingdom | | 1,170,483 | | | 37,680,111 |
| | | | | | | |
| | | | | | | 81,349,237 |
| | | | | | | |
Health Care Providers & Services 0.5% | | | | | | | |
Celesio AG | | Germany | | 440,310 | | | 11,219,016 |
| | | | | | | |
Hotels, Restaurants & Leisure 0.7% | | | | | | | |
aAutogrill SpA | | Italy | | 1,429,290 | | | 18,045,343 |
| | | | | | | |
Industrial Conglomerates 3.1% | | | | | | | |
Hutchison Whampoa Ltd. | | Hong Kong | | 3,276,709 | | | 22,566,808 |
Siemens AG | | Germany | | 598,694 | | | 55,165,127 |
| | | | | | | |
| | | | | | | 77,731,935 |
| | | | | | | |
Insurance 7.0% | | | | | | | |
ACE Ltd. | | United States | | 351,869 | | | 17,734,197 |
Aviva PLC | | United Kingdom | | 4,759,280 | | | 30,519,086 |
AXA SA | | France | | 1,750,958 | | | 41,456,004 |
Muenchener Rueckversicherungs-Gesellschaft AG | | Germany | | 215,170 | | | 33,532,517 |
Partnerre Ltd. | | Bermuda | | 169,680 | | | 12,668,309 |
Swiss Reinsurance Co. | | Switzerland | | 792,220 | | | 38,197,073 |
| | | | | | | |
| | | | | | | 174,107,186 |
| | | | | | | |
IT Services 0.9% | | | | | | | |
Cap Gemini | | France | | 492,960 | | | 22,559,555 |
| | | | | | | |
Life Sciences Tools & Services 0.5% | | | | | | | |
Lonza Group AG | | Switzerland | | 175,440 | | | 12,372,236 |
| | | | | | | |
Media 5.1% | | | | | | | |
British Sky Broadcasting Group PLC | | United Kingdom | | 2,941,216 | | | 26,699,492 |
Pearson PLC | | United Kingdom | | 3,409,246 | | | 49,120,519 |
Reed Elsevier NV | | Netherlands | | 1,742,483 | | | 21,453,280 |
Vivendi SA | | France | | 980,449 | | | 29,185,030 |
| | | | | | | |
| | | | | | | 126,458,321 |
| | | | | | | |
Metals & Mining 1.1% | | | | | | | |
Barrick Gold Corp. | | Canada | | 663,561 | | | 26,172,515 |
| | | | | | | |
Multi-Utilities 1.0% | | | | | | | |
GDF Suez | | France | | 602,301 | | | 26,110,631 |
| | | | | | | |
Multiline Retail 0.5% | | | | | | | |
Marks & Spencer Group PLC | | United Kingdom | | 2,029,740 | | | 13,166,607 |
| | | | | | | |
Oil, Gas & Consumable Fuels 11.4% | | | | | | | |
BP PLC | | United Kingdom | | 4,406,715 | | | 42,757,505 |
Gazprom, ADR | | Russia | | 1,132,600 | | | 28,371,630 |
Reliance Industries Ltd. | | India | | 862,000 | | | 20,234,062 |
Royal Dutch Shell PLC, B | | United Kingdom | | 1,116,613 | | | 32,672,380 |
Sasol, ADR | | South Africa | | 971,480 | | | 38,800,911 |
TF-12
Franklin Templeton Variable Insurance Products Trust
Statement of Investments, December 31, 2009 (continued)
| | | | | | | |
| Templeton Foreign Securities Fund | | Country | | Shares/
Units | | Value |
Common Stocks and Other Equity Interests (continued) | | | | | | | |
Oil, Gas & Consumable Fuels (continued) | | | | | | | |
Statoil ASA | | Norway | | 2,120,780 | | $ | 52,979,253 |
Talisman Energy Inc. | | Canada | | 752,500 | | | 14,095,728 |
Total SA, B | | France | | 846,266 | | | 54,518,496 |
| | | | | | | |
| | | | | | | 284,429,965 |
| | | | | | | |
Pharmaceuticals 8.2% | | | | | | | |
GlaxoSmithKline PLC | | United Kingdom | | 2,394,405 | | | 51,032,491 |
Merck KGaA | | Germany | | 276,540 | | | 25,611,702 |
Novartis AG | | Switzerland | | 551,140 | | | 30,082,027 |
Roche Holding AG | | Switzerland | | 152,830 | | | 25,955,189 |
Sanofi-Aventis | | France | | 697,965 | | | 55,010,559 |
Takeda Pharmaceutical Co. Ltd. | | Japan | | 421,454 | | | 17,360,387 |
| | | | | | | |
| | | | | | | 205,052,355 |
| | | | | | | |
Professional Services 4.7% | | | | | | | |
Adecco SA | | Switzerland | | 956,590 | | | 52,720,340 |
Hays PLC | | United Kingdom | | 10,335,597 | | | 17,295,578 |
aRandstad Holding NV | | Netherlands | | 931,390 | | | 46,530,016 |
| | | | | | | |
| | | | | | | 116,545,934 |
| | | | | | | |
Real Estate Management & Development 1.3% | | | | | | | |
Cheung Kong (Holdings) Ltd. | | Hong Kong | | 2,483,922 | | | 32,131,418 |
| | | | | | | |
Semiconductors & Semiconductor Equipment 5.3% | | | | | | | |
aInfineon Technologies AG | | Germany | | 4,811,535 | | | 26,723,392 |
Samsung Electronics Co. Ltd. | | South Korea | | 83,750 | | | 57,385,889 |
Taiwan Semiconductor Manufacturing Co. Ltd. | | Taiwan | | 23,992,526 | | | 48,375,052 |
| | | | | | | |
| | | | | | | 132,484,333 |
| | | | | | | |
Software 4.6% | | | | | | | |
aCheck Point Software Technologies Ltd. | | Israel | | 792,311 | | | 26,843,497 |
Nintendo Co. Ltd. | | Japan | | 143,700 | | | 34,062,680 |
The Sage Group PLC | | United Kingdom | | 2,045,770 | | | 7,286,268 |
SAP AG, ADR | | Germany | | 1,002,230 | | | 46,914,386 |
| | | | | | | |
| | | | | | | 115,106,831 |
| | | | | | | |
Specialty Retail 2.8% | | | | | | | |
Kingfisher PLC | | United Kingdom | | 11,676,836 | | | 43,267,156 |
USS Co. Ltd. | | Japan | | 431,520 | | | 26,268,049 |
| | | | | | | |
| | | | | | | 69,535,205 |
| | | | | | | |
Textiles, Apparel & Luxury Goods 0.5% | | | | | | | |
Yue Yuen Industrial Holdings Ltd. | | Hong Kong | | 3,874,500 | | | 11,243,181 |
| | | | | | | |
Wireless Telecommunication Services 4.8% | | | | | | | |
Mobile TeleSystems, ADR | | Russia | | 316,030 | | | 15,450,707 |
Turkcell Iletisim Hizmetleri AS, ADR | | Turkey | | 1,669,150 | | | 29,193,433 |
Vodafone Group PLC, ADR | | United Kingdom | | 3,266,090 | | | 75,414,018 |
| | | | | | | |
| | | | | | | 120,058,158 |
| | | | | | | |
Total Common Stocks and Other Equity Interests (Cost $2,255,951,404) | | | | | | | 2,399,175,205 |
| | | | | | | |
TF-13
Franklin Templeton Variable Insurance Products Trust
Statement of Investments, December 31, 2009 (continued)
| | | | | | | | |
| Templeton Foreign Securities Fund | | Country | | Shares/
Units | | Value | |
Preferred Stocks (Cost $5,545,353) 1.5% | | | | | | | | |
Metals & Mining 1.5% | | | | | | | | |
Vale SA, ADR, pfd., A | | Brazil | | 1,548,762 | | $ | 38,440,273 | |
| | | | | | | | |
Total Investments before Short Term Investments
(Cost $2,261,496,757) | | | | | | | 2,437,615,478 | |
| | | | | | | | |
Short Term Investments (Cost $55,464,638) 2.2% | | | | | | | | |
Money Market Funds 2.2% | | | | | | | | |
bInstitutional Fiduciary Trust Money Market Portfolio, 0.00% | | United States | | 55,464,638 | | | 55,464,638 | |
| | | | | | | | |
Total Investments (Cost $2,316,961,395) 100.0% | | | | | | | 2,493,080,116 | |
Other Assets, less Liabilities 0.0%c | | | | | | | (774,496 | ) |
| | | | | | | | |
Net Assets 100.0% | | | | | | $ | 2,492,305,620 | |
| | | | | | | | |
See Abbreviations on page TF-24.
aNon-income producing.
bSee Note 7 regarding investments in the Institutional Fiduciary Trust Money Market Portfolio. The rate shown is the annualized seven-day yield at period end.
cRounds to less than 0.1% of net assets.
The accompanying notes are an integral part of these financial statements.
TF-14
Franklin Templeton Variable Insurance Products Trust
Financial Statements
Statement of Assets and Liabilities
December 31, 2009
| | | | |
| | | Templeton
Foreign
Securities Fund | |
Assets: | | | | |
Investments in securities: | | | | |
Cost - Unaffiliated issuers | | $ | 2,261,496,757 | |
Cost - Sweep Money Fund (Note 7) | | | 55,464,638 | |
| | | | |
Total cost of investments | | $ | 2,316,961,395 | |
| | | | |
Value - Unaffiliated issuers | | $ | 2,437,615,478 | |
Value - Sweep Money Fund (Note 7) | | | 55,464,638 | |
| | | | |
Total value of investments | | | 2,493,080,116 | |
Cash | | | 68,387 | |
Receivables: | | | | |
Capital shares sold | | | 1,154,445 | |
Dividends | | | 6,051,755 | |
Other assets | | | 350 | |
| | | | |
Total assets | | | 2,500,355,053 | |
| | | | |
Liabilities: | | | | |
Payables: | | | | |
Investment securities purchased | | | 25,188 | |
Capital shares redeemed | | | 3,362,500 | |
Affiliates | | | 2,435,174 | |
Reports to shareholders | | | 466,748 | |
Deferred tax | | | 1,550,561 | |
Accrued expenses and other liabilities | | | 209,262 | |
| | | | |
Total liabilities | | | 8,049,433 | |
| | | | |
Net assets, at value | | $ | 2,492,305,620 | |
| | | | |
Net assets consist of: | | | | |
Paid-in capital | | $ | 2,575,812,281 | |
Undistributed net investment income | | | 45,063,070 | |
Net unrealized appreciation (depreciation) | | | 174,631,468 | |
Accumulated net realized gain (loss) | | | (303,201,199 | ) |
| | | | |
Net assets, at value | | $ | 2,492,305,620 | |
| | | | |
The accompanying notes are an integral part of these financial statements.
TF-15
Franklin Templeton Variable Insurance Products Trust
Financial Statements (continued)
Statement of Assets and Liabilities (continued)
December 31, 2009
| | | |
| | | Templeton
Foreign
Securities Fund |
Class 1: | | | |
Net assets, at value | | $ | 318,172,632 |
| | | |
Shares outstanding | | | 23,261,868 |
| | | |
Net asset value and maximum offering price per share | | $ | 13.68 |
| | | |
Class 2: | | | |
Net assets, at value | | $ | 2,010,267,713 |
| | | |
Shares outstanding | | | 149,492,367 |
| | | |
Net asset value and maximum offering price per share | | $ | 13.45 |
| | | |
Class 3: | | | |
Net assets, at value | | $ | 115,364,346 |
| | | |
Shares outstanding | | | 8,631,616 |
| | | |
Net asset value and maximum offering price per sharea | | $ | 13.37 |
| | | |
Class 4: | | | |
Net assets, at value | | $ | 48,500,929 |
| | | |
Shares outstanding | | | 3,568,015 |
| | | |
Net asset value and maximum offering price per share | | $ | 13.59 |
| | | |
aRedemption price is equal to net asset value less any redemption fees retained by the Fund.
The accompanying notes are an integral part of these financial statements.
TF-16
Franklin Templeton Variable Insurance Products Trust
Financial Statements (continued)
Statement of Operations
for the year ended December 31, 2009
| | | | |
| | | Templeton
Foreign
Securities Fund | |
Investment income: | | | | |
Dividends (net of foreign taxes of $6,385,391) | | | | |
Unaffiliated issuers | | $ | 69,318,538 | |
Sweep Money Fund (Note 7) | | | 120,719 | |
| | | | |
Total investment income | | | 69,439,257 | |
| | | | |
Expenses: | | | | |
Management fees (Note 3a) | | | 14,398,241 | |
Administrative fees (Note 3b) | | | 2,275,940 | |
Distribution fees: (Note 3c) | | | | |
Class 2 | | | 4,382,816 | |
Class 3 | | | 495,346 | |
Class 4 | | | 105,558 | |
Unaffiliated transfer agent fees | | | 5,239 | |
Custodian fees (Note 4) | | | 352,271 | |
Reports to shareholders | | | 438,443 | |
Professional fees | | | 98,345 | |
Trustees’ fees and expenses | | | 15,510 | |
Other | | | 93,345 | |
| | | | |
Total expenses | | | 22,661,054 | |
Expense reductions (Note 4) | | | (512 | ) |
| | | | |
Net expenses | | | 22,660,542 | |
| | | | |
Net investment income | | | 46,778,715 | |
| | | | |
Realized and unrealized gains (losses): | | | | |
Net realized gain (loss) from: | | | | |
Investments | | | (271,485,203 | ) |
Foreign currency transactions | | | (1,095,768 | ) |
| | | | |
Net realized gain (loss) | | | (272,580,971 | ) |
| | | | |
Net change in unrealized appreciation (depreciation) on: | | | | |
Investments | | | 931,843,371 | |
Translation of other assets and liabilities denominated in foreign currencies | | | 168,773 | |
Change in deferred taxes on unrealized appreciation | | | (1,550,561 | ) |
| | | | |
Net change in unrealized appreciation (depreciation) | | | 930,461,583 | |
| | | | |
Net realized and unrealized gain (loss) | | | 657,880,612 | |
| | | | |
Net increase (decrease) in net assets resulting from operations | | $ | 704,659,327 | |
| | | | |
The accompanying notes are an integral part of these financial statements.
TF-17
Franklin Templeton Variable Insurance Products Trust
Financial Statements (continued)
Statements of Changes in Net Assets
| | | | | | | | |
| | | Templeton Foreign
Securities Fund | |
| | | Year Ended December 31, | |
| | | 2009 | | | 2008 | |
| | | | |
Increase (decrease) in net assets: | | | | | | | | |
Operations: | | | | | | | | |
Net investment income | | $ | 46,778,715 | | | $ | 84,658,819 | |
Net realized gain (loss) from investments and foreign currency transactions | | | (272,580,971 | ) | | | 63,949,798 | |
Net change in unrealized appreciation (depreciation) on investments, translation of other assets and liabilities denominated in foreign currencies and deferred taxes | | | 930,461,583 | | | | (1,758,879,925 | ) |
| | | | |
Net increase (decrease) in net assets resulting from operations | | | 704,659,327 | | | | (1,610,271,308 | ) |
| | | | |
Distributions to shareholders from: | | | | | | | | |
Net investment income: | | | | | | | | |
Class 1 | | | (10,082,097 | ) | | | (10,823,949 | ) |
Class 2 | | | (60,860,305 | ) | | | (60,137,896 | ) |
Class 3 | | | (10,601,203 | ) | | | (8,627,614 | ) |
Class 4 | | | (654,024 | ) | | | (47,077 | ) |
Net realized gains: | | | | | | | | |
Class 1 | | | (11,279,713 | ) | | | (39,165,092 | ) |
Class 2 | | | (75,080,881 | ) | | | (246,128,397 | ) |
Class 3 | | | (12,814,465 | ) | | | (33,305,113 | ) |
Class 4 | | | (749,197 | ) | | | (170,343 | ) |
| | | | |
Total distributions to shareholders | | | (182,121,885 | ) | | | (398,405,481 | ) |
| | | | |
Capital share transactions: (Note 2) | | | | | | | | |
Class 1 | | | (11,544,985 | ) | | | (20,239,535 | ) |
Class 2 | | | (118,629,302 | ) | | | (11,580,062 | ) |
Class 3 | | | (174,980,330 | ) | | | 173,017,254 | |
Class 4 | | | 24,793,775 | | | | 17,522,726 | |
| | | | |
Total capital share transactions | | | (280,360,842 | ) | | | 158,720,383 | |
| | | | |
Redemption fees | | | 18,230 | | | | 31,545 | |
| | | | |
Net increase (decrease) in net assets | | | 242,194,830 | | | | (1,849,924,861 | ) |
Net assets: | | | | | | | | |
Beginning of year | | | 2,250,110,790 | | | | 4,100,035,651 | |
| | | | |
End of year | | $ | 2,492,305,620 | | | $ | 2,250,110,790 | |
| | | | |
Undistributed net investment income included in net assets: | | | | | | | | |
End of year | | $ | 45,063,070 | | | $ | 80,222,837 | |
| | | | |
The accompanying notes are an integral part of these financial statements.
TF-18
Franklin Templeton Variable Insurance Products Trust
Notes to Financial Statements
Templeton Foreign Securities Fund
1. ORGANIZATION AND SIGNIFICANT ACCOUNTING POLICIES
Franklin Templeton Variable Insurance Products Trust (Trust) is registered under the Investment Company Act of 1940, as amended, (1940 Act) as an open-end investment company, consisting of twenty-two separate funds. The Templeton Foreign Securities Fund (Fund) is included in this report. The financial statements of the remaining funds in the Trust are presented separately. Shares of the Fund are generally sold only to insurance company separate accounts to fund the benefits of variable life insurance policies or variable annuity contracts. The Fund offers four classes of shares: Class 1, Class 2, Class 3, and Class 4. Each class of shares differs by its distribution fees, voting rights on matters affecting a single class and its exchange privilege.
The following summarizes the Fund’s significant accounting policies.
a. Security Valuation
Equity and other securities listed on a securities exchange or on the NASDAQ National Market System are valued at the last quoted sale price or the official closing price of the day, respectively. Over-the-counter securities and listed securities for which there is no reported sale are valued within the range of the most recent quoted bid and ask prices. Securities that trade in multiple markets or on multiple exchanges are valued according to the broadest and most representative market. Certain equity securities are valued based upon fundamental characteristics or relationships to similar securities. Investments in open-end mutual funds are valued at the closing net asset value.
Foreign equity securities are valued as of the close of trading on the foreign stock exchange on which the security is primarily traded, or the NYSE, whichever is earlier. If no sale is reported at that time, the foreign equity security will be valued within the range of the most recent quoted bid and ask prices. The value is then converted into its U.S. dollar equivalent at the foreign exchange rate in effect at the close of the NYSE on the day that the value of the security is determined.
The Fund has procedures to determine the fair value of individual securities and other assets for which market prices are not readily available or which may not be reliably priced. Methods for valuing these securities may include: fundamental analysis based upon the underlying investment book value, anticipated future cash flows, market changes in comparable or similar securities, matrix pricing, discounts from market prices of similar securities, or discounts applied due to the nature and duration of restrictions on the disposition of the securities. Due to the inherent uncertainty of valuations of such securities, the fair values may differ significantly from the values that would have been used had a ready market for such investments existed. Occasionally, events occur between the time at which trading in a security is completed and the close of the NYSE that might call into question the availability (including the reliability) of the value of a portfolio security held by the Fund. The investment manager monitors price movements following the close of trading in foreign stock markets through a series of country specific market proxies (such as baskets of American Depository Receipts, futures contracts and exchange traded funds). These price movements are measured against established trigger thresholds for each specific market proxy to assist in determining if an event has occurred. If such an event occurs, the securities may be valued using fair value procedures, which may include the use of independent pricing services. All security valuation procedures are approved by the Fund’s Board of Trustees.
b. Foreign Currency Translation
Portfolio securities and other assets and liabilities denominated in foreign currencies are translated into U.S. dollars based on the exchange rate of such currencies against U.S. dollars on the date of valuation. The Fund may enter into foreign currency exchange contracts to facilitate transactions denominated in a foreign currency. Purchases and sales of securities, income and expense items denominated in foreign currencies are translated into U.S. dollars at the exchange rate in effect on the transaction date. Occasionally, events may impact the availability or reliability of foreign exchange rates used to convert the U.S. dollar equivalent value. If such an event occurs, the foreign exchange rate will be valued at fair value using procedures established and approved by the Fund’s Board of Trustees.
The Fund does not separately report the effect of changes in foreign exchange rates from changes in market prices on securities held. Such changes are included in net realized and unrealized gain or loss from investments on the Statement of Operations.
TF-19
Franklin Templeton Variable Insurance Products Trust
Notes to Financial Statements (continued)
Templeton Foreign Securities Fund
1. ORGANIZATION AND SIGNIFICANT ACCOUNTING POLICIES (continued)
b. Foreign Currency Translation (continued)
Realized foreign exchange gains or losses arise from sales of foreign currencies, currency gains or losses realized between the trade and settlement dates on securities transactions and the difference between the recorded amounts of dividends, interest, and foreign withholding taxes and the U.S. dollar equivalent of the amounts actually received or paid. Net unrealized foreign exchange gains and losses arise from changes in foreign exchange rates on foreign denominated assets and liabilities other than investments in securities held at the end of the reporting period.
c. Income and Deferred Taxes
No provision has been made for U.S. income taxes because it is the Fund’s policy to qualify as a regulated investment company under the Internal Revenue Code and to distribute to shareholders substantially all of its taxable income and net realized gains.
The Fund has reviewed the tax positions, taken on federal income tax returns, for each of the three open tax years and as of December 31, 2009, and has determined that no provision for income tax is required in the Fund’s financial statements.
Foreign securities held by the Fund may be subject to foreign taxation on dividend income received. Foreign taxes, if any, are recorded based on the tax regulations and rates that exist in the foreign markets in which the Fund invests.
The Fund may be subject to a tax imposed on net realized gains on securities of certain foreign countries. The Fund records an estimated deferred tax liability for net unrealized gains on these securities in an amount that would be payable if the securities were disposed of on the valuation date.
d. Security Transactions, Investment Income, Expenses and Distributions
Security transactions are accounted for on trade date. Realized gains and losses on security transactions are determined on a specific identification basis. Interest income and estimated expenses are accrued daily. Dividend income is recorded on the ex-dividend date except that certain dividends from foreign securities are recognized as soon as the Fund is notified of the ex-dividend date. Distributions to shareholders are recorded on the ex-dividend date and are determined according to income tax regulations (tax basis). Distributable earnings determined on a tax basis may differ from earnings recorded in accordance with accounting principles generally accepted in the United States of America. These differences may be permanent or temporary. Permanent differences are reclassified among capital accounts to reflect their tax character. These reclassifications have no impact on net assets or the results of operations. Temporary differences are not reclassified, as they may reverse in subsequent periods.
Common expenses incurred by the Trust are allocated among the funds based on the ratio of net assets of each fund to the combined net assets of the Trust. Fund specific expenses are charged directly to the fund that incurred the expense.
Realized and unrealized gains and losses and net investment income, not including class specific expenses, are allocated daily to each class of shares based upon the relative proportion of net assets of each class. Differences in per share distributions, by class, are generally due to differences in class specific expenses.
e. Accounting Estimates
The preparation of financial statements in accordance with accounting principles generally accepted in the United States of America requires management to make estimates and assumptions that affect the reported amounts of assets and liabilities at the date of the financial statements and the amounts of income and expenses during the reporting period. Actual results could differ from those estimates.
TF-20
Franklin Templeton Variable Insurance Products Trust
Notes to Financial Statements (continued)
Templeton Foreign Securities Fund
1. ORGANIZATION AND SIGNIFICANT ACCOUNTING POLICIES (continued)
f. Redemption Fees
Redemptions and exchanges of interests in an insurance company subaccount that invests in Class 3 shares of the Fund will be subject to a 1.0% short term trading fee if the interest in the subaccount has been held for less than 60 days. Such fees are retained by the Fund and accounted for as an addition to paid-in capital.
g. Guarantees and Indemnifications
Under the Trust’s organizational documents, its officers and trustees are indemnified by the Trust against certain liabilities arising out of the performance of their duties to the Trust. Additionally, in the normal course of business, the Trust, on behalf of the Fund, enters into contracts with service providers that contain general indemnification clauses. The Trust’s maximum exposure under these arrangements is unknown as this would involve future claims that may be made against the Trust that have not yet occurred. Currently, the Trust expects the risk of loss to be remote.
2. SHARES OF BENEFICIAL INTEREST
At December 31, 2009, there were an unlimited number of shares authorized (without par value). Transactions in the Fund’s shares were as follows:
| | | | | | | | | | | | | | |
| | | Year Ended December 31, | |
| | | 2009 | | | 2008a | |
| Class 1 Shares: | | Shares | | | Amount | | | Shares | | | Amount | |
Shares sold | | 984,005 | | | $ | 11,607,893 | | | 1,086,211 | | | $ | 16,606,956 | |
Shares issued in reinvestment of distributions | | 2,337,178 | | | | 21,361,810 | | | 2,996,945 | | | | 49,989,041 | |
Shares redeemed | | (4,055,131 | ) | | | (44,514,688 | ) | | (5,914,630 | ) | | | (86,835,532 | ) |
| | | | |
Net increase (decrease) | | (733,948 | ) | | $ | (11,544,985 | ) | | (1,831,474 | ) | | $ | (20,239,535 | ) |
| | | | |
Class 2 Shares: | | | | | | | | | | | | | | |
Shares sold | | 17,636,013 | | | $ | 191,261,657 | | | 18,662,528 | | | $ | 282,933,070 | |
Shares issued in reinvestment of distributions | | 15,030,410 | | | | 135,423,993 | | | 18,582,156 | | | | 305,119,000 | |
Shares redeemed | | (41,328,787 | ) | | | (445,314,952 | ) | | (39,817,365 | ) | | | (599,632,132 | ) |
| | | | |
Net increase (decrease) | | (8,662,364 | ) | | $ | (118,629,302 | ) | | (2,572,681 | ) | | $ | (11,580,062 | ) |
| | | | |
Class 3 Shares: | | | | | | | | | | | | | | |
Shares sold | | 2,721,038 | | | $ | 28,784,908 | | | 8,547,568 | | | $ | 149,148,052 | |
Shares issued in reinvestment of distributions | | 2,619,202 | | | | 23,415,667 | | | 2,567,834 | | | | 41,932,727 | |
Shares redeemed | | (22,034,601 | ) | | | (227,180,905 | ) | | (1,325,100 | ) | | | (18,063,525 | ) |
| | | | |
Net increase (decrease) | | (16,694,361 | ) | | $ | (174,980,330 | ) | | 9,790,302 | | | $ | 173,017,254 | |
| | | | |
Class 4 Shares: | | | | | | | | | | | | | | |
Shares sold | | 2,965,551 | | | $ | 33,480,588 | | | 1,321,338 | | | $ | 17,596,379 | |
Shares issued on reinvestment of distributions | | 154,031 | | | | 1,403,220 | | | 13,018 | | | | 216,877 | |
Shares redeemed | | (860,936 | ) | | | (10,090,033 | ) | | (24,987 | ) | | | (290,530 | ) |
| | | | |
Net increase (decrease) | | 2,258,646 | | | $ | 24,793,775 | | | 1,309,369 | | | $ | 17,522,726 | |
| | | | |
| a | For the period February 29, 2008 (effective date) to December 31, 2008 for Class 4. |
TF-21
Franklin Templeton Variable Insurance Products Trust
Notes to Financial Statements (continued)
Templeton Foreign Securities Fund
3. TRANSACTIONS WITH AFFILIATES
Franklin Resources, Inc. is the holding company for various subsidiaries that together are referred to as Franklin Templeton Investments. Certain officers and trustees of the Trust are also officers and/or directors of the following subsidiaries:
| | |
| Subsidiary | | Affiliation |
Templeton Investment Counsel, LLC (TIC) | | Investment manager |
Franklin Templeton Services, LLC (FT Services) | | Administrative manager |
Franklin Templeton Distributors, Inc. (Distributors) | | Principal underwriter |
Franklin Templeton Investor Services, LLC (Investor Services) | | Transfer agent |
a. Management Fees
The Fund pays an investment management fee to TIC based on the average daily net assets of the Fund as follows:
| | |
| Annualized Fee Rate | | Net Assets |
| 0.750% | | Up to and including $200 million |
| 0.675% | | over $200 million, up to and including $1.3 billion |
| 0.600% | | over $1.3 billion, up to and including $10 billion |
| 0.580% | | over $10 billion, up to and including $15 billion |
| 0.560% | | over $15 billion, up to and including $20 billion |
| 0.540% | | In excess of $20 billion |
b. Administrative Fees
The Fund pays an administrative fee to FT Services based on the Fund’s average daily net assets as follows:
| | |
| Annualized Fee Rate | | Net Assets |
| 0.150% | | Up to and including $200 million |
| 0.135% | | over $200 million, up to and including $700 million |
| 0.100% | | over $700 million, up to and including $1.2 billion |
| 0.075% | | In excess of $1.2 billion |
c. Distribution Fees
The Fund’s Board of Trustees has adopted distribution plans for Class 2, Class 3, and Class 4 shares pursuant to Rule 12b-1 under the 1940 Act. Under the Fund’s compensation distribution plans, the Fund pays Distributors for costs incurred in connection with the servicing, sale and distribution of the Fund’s shares up to 0.25%, 0.35%, and 0.35% per year of its average daily net assets of Class 2, Class 3, and Class 4, respectively. The Board of Trustees has agreed to limit the current rate to 0.25% per year for Class 3.
d. Transfer Agent Fees
Investor Services, under terms of an agreement, performs shareholder servicing for the Fund and is not paid by the Fund for the services.
4. EXPENSE OFFSET ARRANGEMENT
The Fund has entered into an arrangement with its custodian whereby credits realized as a result of uninvested cash balances are used to reduce a portion of the Fund’s custodian expenses. During the year ended December 31, 2009, the custodian fees were reduced as noted in the Statement of Operations.
TF-22
Franklin Templeton Variable Insurance Products Trust
Notes to Financial Statements (continued)
Templeton Foreign Securities Fund
5. INCOME TAXES
For tax purposes, capital losses may be carried over to offset future capital gains, if any. At December 31, 2009, the Fund had tax basis capital losses of $300,458,970 expiring in 2017.
For tax purposes, realized capital losses occurring subsequent to October 31, may be deferred and treated as occurring on the first day of the following fiscal year. At December 31, 2009, the Fund deferred realized capital losses of $2,300,196.
The tax character of distributions paid during the years ended December 31, 2009 and 2008, was as follows:
| | | | | | |
| | | 2009 | | 2008 |
Distributions paid from: | | | | | | |
Ordinary income | | $ | 82,201,258 | | $ | 109,101,243 |
Long term capital gain | | | 99,920,627 | | | 289,304,238 |
| | | |
| | $ | 182,121,885 | | $ | 398,405,481 |
| | | |
At December 31, 2009, the cost of investments, net unrealized appreciation (depreciation) and undistributed ordinary income for income tax purposes were as follows:
| | | | |
Cost of investments | | $ | 2,317,403,432 | |
| | | | |
| |
Unrealized appreciation | | $ | 412,350,953 | |
Unrealized depreciation | | | (236,674,269 | ) |
| | | | |
Net unrealized appreciation (depreciation) | | $ | 175,676,684 | |
| | | | |
| | | | |
Distributable earnings – undistributed ordinary income | | $ | 45,063,070 | |
| | | | |
Net investment income differs for financial statement and tax purposes primarily due to differing treatments of foreign currency transactions and pass-through entity income.
Net realized gains (losses) differ for financial statement and tax purposes primarily due to differing treatments of wash sales, foreign currency transactions and pass-through entity income.
6. INVESTMENT TRANSACTIONS
Purchases and sales of investments (excluding short term securities) for the year ended December 31, 2009, aggregated $484,149,676 and $828,657,231, respectively.
7. INVESTMENTS IN INSTITUTIONAL FIDUCIARY TRUST MONEY MARKET PORTFOLIO
The Fund may invest in the Institutional Fiduciary Trust Money Market Portfolio (Sweep Money Fund), an open-end investment company managed by Franklin Advisers, Inc. (an affiliate of the investment manager). Management fees paid by the Fund are reduced on assets invested in the Sweep Money Fund, in an amount not to exceed the management and administrative fees paid by the Sweep Money Fund.
8. CONCENTRATION OF RISK
Investing in foreign securities may include certain risks and considerations not typically associated with investing in U.S. securities, such as fluctuating currency values and changing local and regional economic, political and social conditions, which may result in greater market volatility. In addition, certain foreign securities may not be as liquid as U.S. securities.
TF-23
Franklin Templeton Variable Insurance Products Trust
Notes to Financial Statements (continued)
Templeton Foreign Securities Fund
9. CREDIT FACILITY
The Fund, together with other U.S. registered and foreign investment funds (collectively “Borrowers”), managed by Franklin Templeton Investments, are borrowers in a joint syndicated senior unsecured credit facility totaling $725 million (Global Credit Facility) to provide a source of funds to the Borrowers for temporary and emergency purposes, including the ability to meet future unanticipated or unusually large redemption requests. Effective January 22, 2010, the Fund renewed the Global Credit Facility, for a total of $750 million, maturing January 21, 2011.
Under the terms of the Global Credit Facility, the Fund shall, in addition to interest charged on any borrowings made by the Fund and other costs incurred by the Fund, pay its share of fees and expenses incurred in connection with the implementation and maintenance of the Global Credit Facility, based upon its relative share of the aggregate net assets of all of the Borrowers, including an annual commitment fee of 0.10% based upon the unused portion of the Global Credit Facility, which is reflected in other expenses on the Statement of Operations. During the year ended December 31, 2009, the Fund did not utilize the Global Credit Facility.
10. FAIR VALUE MEASUREMENTS
The Fund follows a fair value hierarchy that distinguishes between market data obtained from independent sources (observable inputs) and the Fund’s own market assumptions (unobservable inputs). These inputs are used in determining the value of the Fund’s investments and are summarized in the following fair value hierarchy:
| | • | | Level 1 – quoted prices in active markets for identical securities |
| | • | | Level 2 – other significant observable inputs (including quoted prices for similar securities, interest rates, prepayment speed, credit risk, etc.) |
| | • | | Level 3 – significant unobservable inputs (including the Fund’s own assumptions in determining the fair value of investments) |
The inputs or methodology used for valuing securities are not an indication of the risk associated with investing in those securities.
At December 31, 2009, all of the Fund’s investments in securities carried at fair value were in Level 1 inputs. For detailed industry descriptions, see the accompanying Statement of Investments.
11. NEW ACCOUNTING PRONOUNCEMENTS
In January 2010, the Financial Accounting Standards Board issued Accounting Standards Update (ASU) No. 2010-6, Fair Value Measurements and Disclosures (Topic 820): Improving Disclosures about Fair Value Measurements. ASU No. 2010-6 enhances and clarifies existing fair value measurement disclosure requirements and is effective for interim and annual periods beginning after December 15, 2009. The Fund is currently evaluating the impact, if any, of applying the provisions of ASU No. 2010-6.
12. SUBSEQUENT EVENTS
The Fund has evaluated subsequent events through February 10, 2010, the issuance date of the financial statements and determined that no events have occurred that require disclosure.
ABBREVIATIONS
Selected Portfolio
ADR - American Depository Receipt
TF-24
Franklin Templeton Variable Insurance Products Trust
Templeton Foreign Securities Fund
Report of Independent Registered Public Accounting Firm
To the Board of Trustees and Shareholders of Franklin Templeton Variable Insurance Products Trust
In our opinion, the accompanying statement of assets and liabilities, including the statement of investments, and the related statements of operations and of changes in net assets and the financial highlights present fairly, in all material respects, the financial position of Templeton Foreign Securities Fund (one of the funds constituting the Franklin Templeton Variable Insurance Products Trust, hereafter referred to as the “Fund”) at December 31, 2009, the results of its operations for the year then ended, the changes in its net assets and the financial highlights for the periods presented, in conformity with accounting principles generally accepted in the United States of America. These financial statements and financial highlights (hereafter referred to as “financial statements”) are the responsibility of the Fund’s management. Our responsibility is to express an opinion on these financial statements based on our audits. We conducted our audit of these financial statements in accordance with the standards of the Public Company Accounting Oversight Board (United States). Those standards require that we plan and perform the audits to obtain reasonable assurance about whether the financial statements are free of material misstatement. An audit includes examining, on a test basis, evidence supporting the amounts and disclosures in the financial statements, assessing the accounting principles used and significant estimates made by management, and evaluating the overall financial statement presentation. We believe that our audits, which included confirmation of securities at December 31, 2009 by correspondence with the custodian and brokers, provide a reasonable basis for our opinion.
PricewaterhouseCoopers LLP
San Francisco, California
February 10, 2010
TF-25
Franklin Templeton Variable Insurance Products Trust
Tax Designation (unaudited)
Templeton Foreign Securities Fund
Under Section 825(b)(3)(c) of the Internal Revenue Code (Code), the Fund designates the maximum amount allowable but no less than $99,920,627 as a long term capital gain dividend for the fiscal year ended December 31, 2009.
At December 31, 2009, more than 50% of the Fund’s total assets were invested in securities of foreign issuers. In most instances, foreign taxes were withheld from income paid to the Fund on these investments. The Fund elects to treat foreign taxes paid as allowed under Section 853 of the Code. This election will allow shareholders of record as of the 2010 distribution date, to treat their proportionate share of foreign taxes paid by the Fund as having been paid directly by them. The shareholder shall consider these amounts as foreign taxes paid in the tax year in which they receive the Fund distribution.
TF-26
TEMPLETON GLOBAL ASSET ALLOCATION FUND
We are pleased to bring you Templeton Global Asset Allocation Fund’s annual report for the fiscal year ended December 31, 2009.
Performance Summary as of 12/31/09
Average annual total return of Class 4 shares* represents the average annual change in value, assuming reinvestment of dividends and capital gains. Average returns smooth out variations in returns, which can be significant; they are not the same as year-by-year results.
Periods ended 12/31/09
| | | | | | |
| | | 1-Year | | 5-Year | | 10-Year |
Average Annual Total Return | | +21.76% | | +4.86% | | +5.37% |
*Performance prior to the 5/1/00 merger reflects historical performance of Templeton Asset Allocation Fund. Class 4 performance prior to 2/29/08 reflects historical Class 1 performance, which does not include a 12b-1 fee expense. For the period beginning 2/29/08, Class 4 performance reflects a 12b-1 fee expense of 0.35% per year, which affects future performance. Since 2/29/08 (effective date), the average annual total return of Class 4 shares was -3.03%. Past fee waivers and expense reductions by the investment manager and administrator increased total returns. If these actions had not been taken, performance would be lower.
Total Return Index Comparison
for a Hypothetical $10,000 Investment (1/1/00–12/31/09)
The graph below shows the change in value of a hypothetical $10,000 investment in the Fund over the indicated period and includes reinvestment of any income or distributions. The Fund’s performance* is compared to the performance of the Morgan Stanley Capital International (MSCI) All Country (AC) World Index and the J.P. Morgan (JPM) Global Government Bond Index (GGBI). One cannot invest directly in an index, and an index is not representative of the Fund’s portfolio. Please see Important Notes to Performance Information preceding the Fund Summaries.
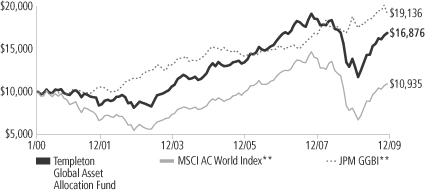
**Source: © 2009 Morningstar. Please see Index Descriptions following the Fund Summaries.
Templeton Global Asset Allocation Fund – Class 4
Performance reflects the Fund’s Class 4 operating expenses, but does not include any contract fees, expenses or sales charges. If they had been included, performance would be lower. These charges and deductions, particularly for variable life policies, can have a significant effect on contract values and insurance benefits. See the contract prospectus for a complete description of these expenses, including sales charges.
Performance data represent past performance, which does not guarantee future results. Investment return and principal value will fluctuate, and you may have a gain or loss when you sell your shares.
Current performance may differ from figures shown.
TGA-1
1. Source: © 2009 Morningstar. One cannot invest directly in an index, and an index is not representative of the Fund’s portfolio. Please see Index Descriptions following the Fund Summaries.
2. As measured by the MSCI AC World Index. Source: © 2009 Morningstar. Please see Index Descriptions following the Fund Summaries.
Fund Goal and Main Investments: Templeton Global Asset Allocation Fund seeks high total return. The Fund normally invests in equity securities of companies of any country, debt securities of companies and governments of any country, and in money market securities. The Fund normally invests substantially to primarily in equity securities.
Performance Overview
You can find the Fund’s one-year total return in the Performance Summary. The Fund underperformed its broad equity benchmark, the MSCI AC World Index, which had a +35.41% total return for the year under review, and outperformed its fixed income benchmark, the JPM GGBI, which had a +1.90% total return for the same period.1
Economic and Market Overview
Equity markets entered 2009 largely pricing in a possible economic depression and systemic solvency crisis, scenarios that were ultimately averted by one of the most aggressive global policy responses in financial history. As government monetary and fiscal intervention began to gain traction toward the end of the first quarter, equities bottomed and largely reversed their decline, economic growth stabilized and rebounded, and confidence was rekindled as investors began to believe the global financial system was finally on the mend. Global equities rallied 73% from their March lows, led by the riskier, lower quality stocks that had been most vulnerable to a systemic meltdown or funding collapse.2 Emerging market economies fueled the recovery as governments aggressively incentivized lending and consumption, resulting in a dramatic statistical recovery that laid the groundwork for the developing world’s best annual equity rally on record. Growing demand from emerging markets supported commodity prices, which also posted record gains during the year. For most of the year, the fading U.S. dollar also helped underpin the rally in hard assets, while continued euro and yen strength created headwinds for regional recoveries.
Nonetheless, developed economies technically recovered by year-end, with Germany and France leading the eurozone out of a recession and both Japan and the U.S. exiting their longest recessions since World War II. Credit spreads narrowed as access to capital expanded and the
Fund Risks: The Fund’s investments in stocks may offer the potential for long-term gains but can be subject to short-term price fluctuations. Foreign investing, especially in emerging markets, involves additional risks, including currency fluctuations, economic instability, market volatility, and political and social instability. Because the Fund invests in bonds and other debt obligations, its share price and yield will be affected by interest rate movements. Bond prices generally move in the opposite direction of interest rates. Thus, as prices of bonds in the Fund adjust to a rise in interest rates, the Fund’s share price may decline. High yield, lower rated (junk) bonds generally have greater price swings and higher default risks than investment-grade bonds. The Fund’s prospectus also includes a description of the main investment risks.
TGA-2
private sector significantly reduced debt, though largely by transferring its liabilities to the public balance sheet. The growing indebtedness of sovereign governments exposed structural weaknesses in places like Dubai, Greece and Ireland, temporarily roiling markets toward the end of the year. Policymakers remained firmly committed to stimulus throughout the period, indicating that deflation worries persisted despite signs of economic stabilization. The U.S. Federal Reserve Board announced its intention to keep the benchmark lending rate “exceptionally low” for an extended period; the new Japanese administration trumpeted its fight against deflation; and even China restated its commitment to “moderately loose” policy. Still, policymakers began discussing exit strategies by period-end as interest rates remained at record lows and economic indicators rebounded.
After a dismal beginning, 2009 ended on a positive note for global financial markets. The extreme pessimism present at the height of the crisis early in the year subsided, fueling a general rally across risk assets. As the differences between economic conditions around the world became clearer later in the year, markets began to differentiate between currencies and securities.
During the first quarter of the year, as the financial crisis reached its height, nearly all currencies sold off against the U.S. dollar, the Japanese yen and the Swiss franc, and sovereign credit spreads remained at historically wide levels. For much of the rest of the year, currency and credit exposures had a broad-based rally as the U.S. dollar fell indiscriminately and sovereign credit spreads declined from distressed levels. At year-end, particularly in December, the market began to price in a higher degree of differentiation. The indiscriminate rally lost steam and many assets traded sideways.
The U.S. labor market remained quite weak although it showed signs of improving toward the end of the year. The unemployment rate reached an almost 20-year high of 10.2% in October before declining to 10.0% in November.3 The housing market also showed signs of stabilizing as pending home sales recorded gains in September and October and in some areas, home prices increased each month since May. In the eurozone, third quarter gross domestic product improved relative to the second quarter but contracted 4.1% in annualized terms.4
3. Source: Bureau of Labor Statistics.
4. Source: Eurostat.
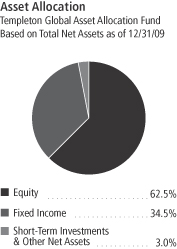
TGA-3
A recovery in global trade, rebuilding of inventories and government spending in the third quarter helped offset weakness in private consumption and investment.
The Dubai World debt standstill and Greece credit downgrade grabbed headlines toward the end of the period, but other overleveraged credits also suffered. Investors recognized that these economies faced very difficult economic outlooks even as the global economy began to recover. In contrast, data from Asian emerging markets as well as certain developed and Latin American countries confirmed their economies were improving. Some economies experienced robust domestic demand, but others lacked sustainable growth drivers and continued to struggle with deleveraging. This differentiation favored some currencies and drove interest rates higher in certain economies.
One important outcome from the recognition of economic differentiation in December was the U.S. dollar’s rise against the Japanese yen. In December, a more optimistic outlook for the U.S. economy led government bond yields to rise. At the same time, Japanese domestic demand remained very weak, the economy was still in deflation, and prospects for interest rate hikes appeared remote. This led to an increase in the interest rate differential between the U.S. and Japan, which favored the U.S. dollar.
Investment Strategy
Our investment philosophy is bottom up, value oriented and long term. In choosing equity investments, we will focus on the market price of a company’s securities relative to our evaluation of the company’s potential long-term earnings, asset value and cash flow. Among factors we may consider are a company’s historical value measures, including price/earnings ratio, profit margins and liquidation value.
In choosing debt investments, we allocate our assets among issuers, geographic regions and currencies based upon our assessment of relative interest rates among currencies, our outlook for changes in interest rates among currencies, and credit risks. With respect to debt securities, we may utilize forward currency exchange contracts.
Manager’s Discussion
Equity
During the fiscal year, stock selection and underweightings in the consumer staples and utilities sectors benefited the Fund’s performance
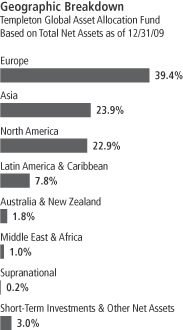
TGA-4
5. The consumer staples sector comprises beverages and food products in the SOI. The utilities sector comprises electric utilities and multi-utilities in the SOI.
6. The telecommunication services sector comprises diversified telecommunication services and wireless telecommunication services in the SOI.
7. The information technology sector comprises communications equipment; computers and peripherals; electronic equipment, instruments and components; Internet software and services; IT services; semiconductors and semiconductor equipment; and software in the SOI.
8. This holding is not an index component.
9. The financials sector comprises capital markets, commercial banks, diversified financial services, insurance, and real estate management and development in the SOI.
10. The materials sector comprises construction materials, metals and mining, and paper and forest products in the SOI.
relative to the MSCI AC World Index.5 Consumer staples sector holdings Dr. Pepper Snapple Group and Unilever each delivered positive results, while the Fund’s utilities sector holdings outperformed those of the index. Stock selection in the telecommunication services sector also boosted relative results, especially in the diversified telecommunication services industry where Norwegian company Telenor performed particularly well.6 Several information technology sector holdings also contributed to relative performance including U.S.-based hard drive and digital solutions provider Seagate Technology, South Korean semiconductor and electronics manufacturer Samsung Electronics, and Taiwan-based optical devices manufacturer Lite-On Technology. 7 We sold our Seagate position by period-end. Elsewhere, financials sector positions DBS Group Holdings, a holding company for Singapore’s largest bank, and KB Financial Group,8 a South Korean financial services firm, also performed well.9
It is also important to recognize the effect of currency movements on the Fund’s performance. In general, if the value of the U.S. dollar goes up compared with a foreign currency, an investment traded in that foreign currency will go down in value because it will be worth fewer U.S. dollars. This can have a negative effect on Fund performance. Conversely, when the U.S. dollar weakens in relation to a foreign currency, an investment traded in that foreign currency will increase in value, which can contribute to Fund performance. For the 12 months ended December 31, 2009, the U.S. dollar declined in value relative to most non-U.S. currencies. As a result, the Fund’s (equity portion) performance was positively affected by the portfolio’s significant investment in securities with non-U.S. currency exposure. However, one cannot expect the same result in future periods.
Detractors from performance included stock selection and an underweighting in the financials and materials sectors, which outperformed the index.10 Financials holdings that detracted from performance included global insurer ACE, while in the materials sector, Finnish paper and
Top Five Countries
Templeton Global Asset Allocation Fund
12/31/09
| | |
| | | % of Total
Net Assets |
| U.S. | | 22.8% |
| U.K. | | 10.6% |
| South Korea | | 7.8% |
| Malaysia | | 6.8% |
| Brazil | | 6.0% |
Top Five Sectors/Industries
Templeton Global Asset Allocation Fund
Based on Equity Securities
12/31/09
| | |
| | | % of Total
Net Assets |
| Pharmaceuticals | | 8.5% |
| Media | | 6.0% |
| Diversified Telecommunication Services | | 5.9% |
| Oil, Gas & Consumable Fuels | | 5.4% |
| Software | | 4.9% |
The dollar value, number of shares or principal amount, and names of all portfolio holdings are listed in the Fund’s Statement of Investments (SOI).
TGA-5
forest products company UPM-Kymmene (sold by period-end) hurt results. In other sectors, video game maker Nintendo, in the information technology sector, and diversified telecommunication services company France Telecom hindered performance. Health care sector holdings including Japan’s Takeda Pharmaceuticals and U.S.-based Amgen were significant detractors, as was U.S. cable operator Comcast.11
Fixed Income
The Fund’s total return for the reporting period was influenced by various factors, including interest rate developments, currency movements, and exposure to sovereign debt markets.
During the year under review, market volatility enabled us to build positions in currencies such as the Brazilian real and South Korean won at levels not reached since previous crises, even though their underlying fundamentals were much stronger than those in past periods. We sought to capitalize on similar opportunities in duration and sovereign credit exposures. We felt the positions we built at distressed levels had strong underlying fundamentals and they provided the base for the Fund’s double-digit returns. More importantly, this meant that we were not exposed to the blowups that took place in specific markets.
Interest Rate Strategy
In the beginning of 2009, developed economies undertook their final interest rate cuts to counter the global recession. Although target interest rates fell 150 basis points (100 basis points equal one percentage point) in the eurozone and the U.K. during the year, and were unchanged at historical lows in the U.S. and Japan, government bond yields rose across the majority of developed economies as the economic outlook improved and high fiscal deficits led to increased government bond issuance. Despite policymakers’ efforts to reassure markets they would maintain historically loose monetary policy for an extended period, attention increasingly shifted to how monetary stimulus eventually would be unwound. This led to steepening yield curves in developed countries. Even in an environment of generally rising government bond yields, the Fund’s duration exposure contributed positively to relative and absolute returns largely through its selective duration exposure in countries like Indonesia and Chile and lack of exposure to U.S. Treasuries and Japanese government bonds. Government bond yields in these nondeveloped economies had lagged the rally in core
11. The health care sector comprises biotechnology, health care equipment and supplies, health care providers and services, and pharmaceuticals in the SOI.
What is duration?
Duration is a measure of a bond’s price sensitivity to interest rate changes. In general, a portfolio of securities with a lower duration can be expected to be less sensitive to interest rate changes than a portfolio with a higher duration.
TGA-6
developed government bonds. The Fund sought to take advantage of this risk aversion-fueled underperformance to build positions in economies we feel have strong fundamentals that could allow for significant monetary policy easing to cushion the impact of the global recession. Toward period-end, we took profits in several such duration positions where interest rates had fallen to historical lows, and where we viewed an economic recovery as being likely, such as in South Korea and Chile. However, we continued to see the potential for lower long-term government bond yields in a select few credits such as Indonesia and Brazil, where we believed aggressive interest rate hikes were already priced in and where improved monetary and fiscal policy would likely lower the risk premium embedded in long-term government bonds.
Currency Strategy
The Fund’s diverse, actively managed currency exposure provided strong returns during the year. The U.S. dollar fell 5.87% against its major trading partners due to the recovery in risk appetite and exceptionally loose monetary and fiscal policy.12 The U.S. dollar weakened against the majority of Latin American currencies as these countries benefited from improved economic outlooks and prospects for economic recoveries before those in the developed world. The Fund benefited from its Brazilian real position as the real appreciated 33.78% versus the U.S. dollar during the year.13 Brazil’s domestic demand-led economy was the most resilient among the large regional economies. Outside of Brazil, the Fund also benefited from exposures to the Mexican peso and Chilean peso.
The Fund’s net negative euro exposure benefited relative performance as well. Our analysis indicated the euro was overvalued near its peak in 2008. The market had priced in a situation where the U.S. would suffer a recession but Europe would decouple, which we considered unlikely. Despite large swings in the euro’s value during the year, it closed only 3.22% stronger against the U.S. dollar.13 Eurozone economic recovery began, although the pace moderated in the fourth quarter. Given the eurozone’s relatively slow recovery, investors became concerned regarding the sustainability of debt dynamics of some of the less developed eurozone countries such as Greece. Differentiation was also present in non-euro European countries, as Scandinavian and Polish economies were relatively strong and the Fund’s exposure to these
12. Source: Federal H10 Report.
13. Source: IDC/Exshare.
TGA-7
peripheral currencies benefited its relative performance. Norway was one of the first economies to begin tightening monetary policy with interest rate hikes in October and December. Israel also increased interest rates, although our recently added exposure to the shekel detracted marginally. The outlook for strong recoveries in these economies made their exceptionally loose monetary policy inappropriate well ahead of the U.K. or eurozone.
Asian currencies benefited the Fund’s relative and absolute returns. We believe recent economic data, such as accelerating economic activity and resilient domestic demand, largely confirmed our view that the region would likely continue to show strong growth relative to other parts of the world. Inflation remained low throughout the region even as gaps between supply and demand began to close. This allowed governments to generally maintain their stimulus policies. However, there were some signs that policymakers were beginning to lean toward tightening as several countries took steps to limit property price appreciation, and Australia raised interest rates. The Fund’s returns benefited from large exposures to the South Korean won and Indonesian rupiah, which appreciated 8.16% and 16.02% against the U.S. dollar.13 We added to these positions at distressed levels early in the year, and then benefited as the market priced in what we considered more appropriate valuations based on their robust fundamentals. Such gains were only partially offset by losses from our negative exposures to the New Zealand dollar and Singapore dollar. We added these positions as partial risk hedges during the year in case of a return of risk aversion, which did not materialize. The correlation between the interest rate differential and exchange rate of the U.S. with Japan has been strong historically, and we expect it to continue going forward due to large portfolio flows and corporate hedging activities. Thus, we positioned the Fund to benefit if government bond yields rise in the U.S. through a net negative exposure to the Japanese yen. This strategy contributed strongly toward the end of the year, but yen exposure for the year as a whole still marginally detracted.
Global Sovereign Debt Strategy
The Fund’s outperformance during the period benefited significantly from its sovereign credit exposure, an area where we had very little exposure before the sell-off in 2008. Valuations for credit exposure improved significantly during the crisis, allowing us to add exposure to countries with strong underlying fundamentals at distressed levels. Emerging sovereign credit provided exceptionally strong returns during
TGA-8
the year as spreads compressed from the historically high levels at the height of the crisis. Despite this exceptional performance, we found what we considered attractive opportunities as relative fundamentals continued to favor emerging markets. Emerging markets, especially in Asia, experienced stronger relative growth as they were not plagued to the same extent by the causes of the financial crisis, particularly an overreliance on leverage. They remained creditors to the rest of the world and received increasing capital inflows due to higher available returns. Their better outlooks also meant that policy responses did not need to be as aggressive, which led to lower government deficits and smaller increases in public debt burdens relative to the developed world. Furthermore, a slower growth environment reopened the need for financing by some sovereigns with solid credit fundamentals. These sovereigns had not come to the markets in several years and could provide additional investment opportunities.
Thank you for your participation in Templeton Global Asset Allocation Fund. We look forward to serving your future investment needs.
The foregoing information reflects our analysis, opinions and portfolio holdings as of December 31, 2009, the end of the reporting period. The way we implement our main investment strategies and the resulting portfolio holdings may change depending on factors such as market and economic conditions. These opinions may not be relied upon as investment advice or an offer for a particular security. The information is not a complete analysis of every aspect of any market, country, industry, security or the Fund. Statements of fact are from sources considered reliable, but the investment manager makes no representation or warranty as to their completeness or accuracy. Although historical performance is no guarantee of future results, these insights may help you understand our investment management philosophy.
TGA-9
Fund Expenses
As an investor in a variable insurance contract (Contract) that indirectly provides for investment in an underlying mutual fund, you can incur transaction and/or ongoing expenses at both the Fund level and the Contract level.
| • | | Transaction expenses can include sales charges (loads) on purchases, redemption fees, surrender fees, transfer fees and premium taxes. |
| • | | Ongoing expenses can include management fees, distribution and service (12b-1) fees, contract fees, annual maintenance fees, mortality and expense risk fees and other fees and expenses. All mutual funds and Contracts have some types of ongoing expenses. |
The expenses shown in the table are meant to highlight ongoing expenses at the Fund level only and do not include ongoing expenses at the Contract level, or transaction expenses at either the Fund or Contract level. While the Fund does not have transaction expenses, if the transaction and ongoing expenses at the Contract level were included, the expenses shown below would be higher. You should consult your Contract prospectus or disclosure document for more information.
The table shows Fund-level ongoing expenses and can help you understand these expenses and compare them with those of other mutual funds offered through the Contract. The table assumes a $1,000 investment held for the six months indicated. Please refer to the Fund prospectus for additional information on operating expenses.
Actual Fund Expenses
The first line (Actual) of the table provides actual account values and expenses. The “Ending Account Value” is derived from the Fund’s actual return, which includes the effect of ongoing Fund expenses, but does not include the effect of ongoing Contract expenses.
You can estimate the Fund-level expenses you incurred during the period by following these steps. Of course, your account value and expenses will differ from those in this illustration:
| 1. | Divide your account value by $1,000. |
If an account had an $8,600 value, then $8,600 ÷ $1,000 = 8.6.
| 2. | Multiply the result by the number under the heading “Fund-Level Expenses Incurred During Period.” |
If Fund-Level Expenses Incurred During Period were $7.50, then 8.6 x $7.50 = $64.50.
In this illustration, the estimated expenses incurred this period at the Fund level are $64.50.
Templeton Global Asset Allocation Fund – Class 4
TGA-10
Hypothetical Example for Comparison with Other Mutual Funds
Information in the second line (Hypothetical) of the table can help you compare ongoing expenses of the Fund with those of other mutual funds offered through the Contract. This information may not be used to estimate the actual ending account balance or expenses you incurred during the period. The hypothetical “Ending Account Value” is based on the Fund’s actual expense ratio and an assumed 5% annual rate of return before expenses, which does not represent the Fund’s actual return. The figure under the heading “Fund-Level Expenses Incurred During Period” shows the hypothetical expenses your account would have incurred under this scenario. You can compare this figure with the 5% hypothetical examples that appear in shareholder reports of other funds offered through a Contract.
| | | | | | | | | |
| Class 4 | | Beginning
Account Value 7/1/09 | | Ending
Account Value 12/31/09 | | Fund-Level Expenses Incurred
During Period* 7/1/09–12/31/09 |
Actual | | $ | 1,000 | | $ | 1,176.50 | | $ | 6.47 |
Hypothetical (5% return before expenses) | | $ | 1,000 | | $ | 1,019.26 | | $ | 6.01 |
*Expenses are calculated using the most recent six-month annualized expense ratio for the Fund’s Class 4 shares (1.18%), which does not include any ongoing expenses of the Contract for which the Fund is an investment option, multiplied by the average account value over the period, multiplied by 184/365 to reflect the one-half year period.
TGA-11
SUPPLEMENT DATED FEBRUARY 15, 2010
TOTHE PROSPECTUS
DATED MAY 1, 2009
AS PREVIOUSLY AMENDED
OF TEMPLETON GLOBAL ASSET ALLOCATION FUND
(A series of Franklin Templeton Variable Insurance Products Trust)
The prospectus is amended to add the following:
On July 9, 2009, the Board of Trustees (the “Board”) of Franklin Templeton Variable Insurance Products Trust (the “Trust”) approved a proposal to liquidate the Templeton Global Asset Allocation Fund (the “Fund”) on or after April 23, 2010 (the “liquidation”). The liquidation is currently planned for April 30, 2010, and may be delayed if unforeseen circumstances arise.
The Board approved the liquidation in the ordinary course of business after considering a number of factors including the Fund’s significant decline in assets over the last decade as well as limited future opportunities for asset growth.
Contract owners should refer to documents provided by their insurance companies concerning the effect of the liquidation and any steps they may need to take. In addition, in considering new purchases or transfers, contract owners may want to refer to their contract and Trust prospectuses or consult with their investment representatives to consider other investment options.
Please keep this supplement for future reference.
TGA-12
Franklin Templeton Variable Insurance Products Trust
Financial Highlights
Templeton Global Asset Allocation Fund
| | | | | | | | | | | | | | | | | | | | |
| | | Year Ended December 31, | |
| Class 1 | | 2009 | | | 2008 | | | 2007 | | | 2006 | | | 2005 | |
| | | | |
Per share operating performance | | | | | | | | | | | | | | | | | | | | |
(for a share outstanding throughout the year) | | | | | | | | | | | | | | | | | | | | |
Net asset value, beginning of year | | $ | 8.63 | | | $ | 14.75 | | | $ | 21.96 | | | $ | 21.06 | | | $ | 21.11 | |
| | | | |
Income from investment operationsa: | | | | | | | | | | | | | | | | | | | | |
Net investment incomeb | | | 0.27 | | | | 0.39 | | | | 0.53 | | | | 0.64 | | | | 0.49 | |
Net realized and unrealized gains (losses) | | | 1.45 | | | | (3.40 | ) | | | 1.58 | | | | 3.36 | | | | 0.28 | |
| | | | |
Total from investment operations | | | 1.72 | | | | (3.01 | ) | | | 2.11 | | | | 4.00 | | | | 0.77 | |
| | | | |
Less distributions from: | | | | | | | | | | | | | | | | | | | | |
Net investment income and net foreign currency gains | | | (0.87 | ) | | | (1.40 | ) | | | (4.06 | ) | | | (1.66 | ) | | | (0.82 | ) |
Net realized gains | | | (0.13 | ) | | | (1.71 | ) | | | (5.26 | ) | | | (1.44 | ) | | | — | |
| | | | |
Total distributions | | | (1.00 | ) | | | (3.11 | ) | | | (9.32 | ) | | | (3.10 | ) | | | (0.82 | ) |
| | | | |
Net asset value, end of year | | $ | 9.35 | | | $ | 8.63 | | | $ | 14.75 | | | $ | 21.96 | | | $ | 21.06 | |
| | | | |
| | | | | |
Total returnc | | | 22.21% | | | | (24.97)% | | | | 10.32% | | | | 21.39% | | | | 3.85% | |
Ratios to average net assets | | | | | | | | | | | | | | | | | | | | |
Expenses before waiver and payments by affiliates | | | 0.98% | | | | 0.94% | | | | 0.88% | | | | 0.84% | | | | 0.85% | |
Expenses net of waiver and payments by affiliatesd | | | 0.83% | | | | 0.83% | | | | 0.85% | | | | 0.84% | | | | 0.85% | |
Net investment income | | | 3.20% | | | | 3.34% | | | | 2.77% | | | | 2.91% | | | | 2.36% | |
| | | | | |
Supplemental data | | | | | | | | | | | | | | | | | | | | |
Net assets, end of year (000’s) | | $ | 40,471 | | | $ | 37,619 | | | $ | 63,316 | | | $ | 276,790 | | | $ | 638,006 | |
Portfolio turnover rate | | | 15.80% | | | | 20.11% | | | | 30.08% | e | | | 23.74% | e | | | 26.23% | |
aThe amount shown for a share outstanding throughout the period may not correlate with the Statement of Operations for the period due to the timing of sales and repurchases of the Fund shares in relation to income earned and/or fluctuating market value of the investments of the Fund.
bBased on average daily shares outstanding.
cTotal return does not include any fees, charges or expenses imposed by the variable annuity and life insurance contracts for which the Franklin Templeton Variable Insurance Products Trust serves as an underlying investment vehicle.
dBenefit of expense reduction rounds to less than 0.01%.
eExcludes the value of portfolio securities delivered as a result of a redemption in-kind.
The accompanying notes are an integral part of these financial statements.
TGA-13
Franklin Templeton Variable Insurance Products Trust
Financial Highlights (continued)
Templeton Global Asset Allocation Fund
| | | | | | | | | | | | | | | | | | | | |
| | | Year Ended December 31, | |
| Class 2 | | 2009 | | | 2008 | | | 2007 | | | 2006 | | | 2005 | |
| | | | |
Per share operating performance | | | | | | | | | | | | | | | | | | | | |
(for a share outstanding throughout the year) | | | | | | | | | | | | | | | | | | | | |
Net asset value, beginning of year | | $ | 8.46 | | | $ | 14.52 | | | $ | 21.75 | | | $ | 20.88 | | | $ | 20.94 | |
| | | | |
Income from investment operationsa: | | | | | | | | | | | | | | | | | | | | |
Net investment incomeb | | | 0.25 | | | | 0.35 | | | | 0.46 | | | | 0.52 | | | | 0.43 | |
Net realized and unrealized gains (losses) | | | 1.42 | | | | (3.34 | ) | | | 1.58 | | | | 3.40 | | | | 0.29 | |
| | | | |
Total from investment operations | | | 1.67 | | | | (2.99 | ) | | | 2.04 | | | | 3.92 | | | | 0.72 | |
| | | | |
Less distributions from: | | | | | | | | | | | | | | | | | | | | |
Net investment income and net foreign currency gains | | | (0.84 | ) | | | (1.36 | ) | | | (4.01 | ) | | | (1.61 | ) | | | (0.78 | ) |
Net realized gains | | | (0.13 | ) | | | (1.71 | ) | | | (5.26 | ) | | | (1.44 | ) | | | — | |
| | | | |
Total distributions | | | (0.97 | ) | | | (3.07 | ) | | | (9.27 | ) | | | (3.05 | ) | | | (0.78 | ) |
| | | | |
Net asset value, end of year | | $ | 9.16 | | | $ | 8.46 | | | $ | 14.52 | | | $ | 21.75 | | | $ | 20.88 | |
| | | | |
| | | | | |
Total returnc | | | 21.81% | | | | (25.10)% | | | | 10.01% | | | | 21.11% | | | | 3.55% | |
Ratios to average net assets | | | | | | | | | | | | | | | | | | | | |
Expenses before waiver and payments by affiliates | | | 1.23% | | | | 1.19% | | | | 1.13% | | | | 1.09% | | | | 1.10% | |
Expenses net of waiver and payments by affiliatesd | | | 1.08% | | | | 1.08% | | | | 1.10% | | | | 1.09% | | | | 1.10% | |
Net investment income | | | 2.95% | | | | 3.09% | | | | 2.52% | | | | 2.66% | | | | 2.11% | |
| | | | | |
Supplemental data | | | | | | | | | | | | | | | | | | | | |
Net assets, end of year (000’s) | | $ | 52,649 | | | $ | 48,351 | | | $ | 78,613 | | | $ | 78,021 | | | $ | 68,385 | |
Portfolio turnover rate | | | 15.80% | | | | 20.11% | | | | 30.08% | e | | | 23.74% | e | | | 26.23% | |
aThe amount shown for a share outstanding throughout the period may not correlate with the Statement of Operations for the period due to the timing of sales and repurchases of the Fund shares in relation to income earned and/or fluctuating market value of the investments of the Fund.
bBased on average daily shares outstanding.
cTotal return does not include any fees, charges or expenses imposed by the variable annuity and life insurance contracts for which the Franklin Templeton Variable Insurance Products Trust serves as an underlying investment vehicle.
dBenefit of expense reduction rounds to less than 0.01%.
eExcludes the value of portfolio securities delivered as a result of a redemption in-kind.
The accompanying notes are an integral part of these financial statements.
TGA-14
Franklin Templeton Variable Insurance Products Trust
Financial Highlights (continued)
Templeton Global Asset Allocation Fund
| | | | | | | | |
| | | Year Ended
December 31, | |
| Class 4 | | 2009 | | | 2008a | |
| | | | |
Per share operating performance | | | | | | | | |
(for a share outstanding throughout the year) | | | | | | | | |
Net asset value, beginning of year | | $ | 8.61 | | | $ | 14.23 | |
| | | | |
Income from investment operationsb: | | | | | | | | |
Net investment incomec | | | 0.24 | | | | 0.31 | |
Net realized and unrealized gains (losses) | | | 1.44 | | | | (2.82 | ) |
| | | | |
Total from investment operations | | | 1.68 | | | | (2.51 | ) |
| | | | |
Less distributions from: | | | | | | | | |
Net investment income and net foreign currency gains | | | (0.83 | ) | | | (1.40 | ) |
Net realized gains | | | (0.13 | ) | | | (1.71 | ) |
| | | | |
Total distributions | | | (0.96 | ) | | | (3.11 | ) |
| | | | |
Net asset value, end of year | | $ | 9.33 | | | $ | 8.61 | |
| | | | |
| | |
Total returnd | | | 21.76% | | | | (22.39)% | |
Ratios to average net assetse | | | | | | | | |
Expenses before waiver and payments by affiliates | | | 1.33% | | | | 1.29% | |
Expenses net of waiver and payments by affiliatesf | | | 1.18% | | | | 1.18% | |
Net investment income | | | 2.85% | | | | 2.99% | |
| | |
Supplemental data | | | | | | | | |
Net assets, end of year (000’s) | | $ | 3 | | | $ | 3 | |
Portfolio turnover rate | | | 15.80% | | | | 20.11% | |
aFor the period February 29, 2008 (effective date) to December 31, 2008.
bThe amount shown for a share outstanding throughout the period may not correlate with the Statement of Operations for the period due to the timing of sales and repurchase of the Fund shares in relation to income earned and/or fluctuating market value of the investments of the Fund.
cBased on average daily shares outstanding.
dTotal return does not include any fees, charges or expenses imposed by the variable annuity and life insurance contracts for which the Franklin Templeton Variable Insurance Products Trust serves as an underlying investment vehicle. Total return is not annualized for periods less than one year.
eRatios are annualized for periods less than one year.
fBenefit of expense reduction rounds to less than 0.01%.
The accompanying notes are an integral part of these financial statements.
TGA-15
Franklin Templeton Variable Insurance Products Trust
Statement of Investments, December 31, 2009
| | | | | | | |
| Templeton Global Asset Allocation Fund | | Country/
Organization | | Shares/
Warrants | | Value |
Common Stocks and Other Equity Interests 61.3% | | | | | | | |
Aerospace & Defense 1.4% | | | | | | | |
BAE Systems PLC | | United Kingdom | | 117,072 | | $ | 677,736 |
aRaytheon Co., wts., 6/16/11 | | United States | | 63 | | | 913 |
aRolls-Royce Group PLC | | United Kingdom | | 83,152 | | | 649,261 |
a,bRolls-Royce Group PLC, C | | United Kingdom | | 4,989,120 | | | 8,059 |
| | | | | | | |
| | | | | | | 1,335,969 |
| | | | | | | |
Air Freight & Logistics 1.5% | | | | | | | |
Deutsche Post AG | | Germany | | 44,767 | | | 868,306 |
United Parcel Service Inc., B | | United States | | 9,570 | | | 549,031 |
| | | | | | | |
| | | | | | | 1,417,337 |
| | | | | | | |
Automobiles 1.2% | | | | | | | |
Bayerische Motoren Werke AG | | Germany | | 17,098 | | | 783,198 |
Toyota Motor Corp., ADR | | Japan | | 3,590 | | | 302,134 |
| | | | | | | |
| | | | | | | 1,085,332 |
| | | | | | | |
Beverages 1.2% | | | | | | | |
Dr. Pepper Snapple Group Inc. | | United States | | 38,290 | | | 1,083,607 |
| | | | | | | |
Biotechnology 1.0% | | | | | | | |
aAmgen Inc. | | United States | | 16,290 | | | 921,525 |
| | | | | | | |
Capital Markets 0.5% | | | | | | | |
The Bank of New York Mellon Corp. | | United States | | 15,410 | | | 431,018 |
Nomura Holdings Inc. | | Japan | | 6 | | | 44 |
| | | | | | | |
| | | | | | | 431,062 |
| | | | | | | |
Commercial Banks 2.8% | | | | | | | |
DBS Group Holdings Ltd. | | Singapore | | 89,229 | | | 977,678 |
HSBC Holdings PLC | | United Kingdom | | 22,723 | | | 261,996 |
aIntesa Sanpaolo SpA | | Italy | | 111,770 | | | 503,979 |
aKB Financial Group Inc., ADR | | South Korea | | 11,131 | | | 566,011 |
Mitsubishi UFJ Financial Group Inc. | | Japan | | 36,000 | | | 175,005 |
Sumitomo Mitsui Financial Group Inc. | | Japan | | 4,800 | | | 136,546 |
| | | | | | | |
| | | | | | | 2,621,215 |
| | | | | | | |
Commercial Services & Supplies 0.7% | | | | | | | |
G4S PLC | | United Kingdom | | 151,608 | | | 640,619 |
| | | | | | | |
Communications Equipment 0.9% | | | | | | | |
aCisco Systems Inc. | | United States | | 35,880 | | | 858,967 |
| | | | | | | |
Computers & Peripherals 0.7% | | | | | | | |
Lite-On Technology Corp. | | Taiwan | | 426,050 | | | 639,941 |
| | | | | | | |
Construction Materials 0.2% | | | | | | | |
CRH PLC | | Ireland | | 7,908 | | | 215,191 |
| | | | | | | |
Diversified Financial Services 0.7% | | | | | | | |
aING Groep NV | | Netherlands | | 68,641 | | | 677,968 |
| | | | | | | |
Diversified Telecommunication Services 5.9% | | | | | | | |
China Telecom Corp. Ltd., H | | China | | 657,000 | | | 274,538 |
Chunghwa Telecom Co. Ltd., ADR | | Taiwan | | 14,408 | | | 267,557 |
France Telecom SA, ADR | | France | | 47,413 | | | 1,196,704 |
Singapore Telecommunications Ltd. | | Singapore | | 403,525 | | | 892,894 |
Telefonica SA, ADR | | Spain | | 17,573 | | | 1,467,697 |
TGA-16
Franklin Templeton Variable Insurance Products Trust
Statement of Investments, December 31, 2009 (continued)
| | | | | | | |
| Templeton Global Asset Allocation Fund | | Country/
Organization | | Shares/
Warrants | | Value |
Common Stocks and Other Equity Interests (continued) | | | | | | | |
Diversified Telecommunication Services (continued) | | | | | | | |
Telekom Austria AG, ADR | | Austria | | 12,980 | | $ | 365,257 |
aTelenor ASA | | Norway | | 74,594 | | | 1,043,034 |
| | | | | | | |
| | | | | | | 5,507,681 |
| | | | | | | |
Electric Utilities 0.8% | | | | | | | |
E.ON AG | | Germany | | 17,130 | | | 713,799 |
| | | | | | | |
Electrical Equipment 0.3% | | | | | | | |
aVestas Wind Systems AS | | Denmark | | 4,342 | | | 264,779 |
| | | | | | | |
Electronic Equipment, Instruments & Components 0.7% | | | | | | | |
FUJIFILM Holdings Corp. | | Japan | | 15,011 | | | 450,427 |
Tyco Electronics Ltd. | | United States | | 8,326 | | | 204,403 |
| | | | | | | |
| | | | | | | 654,830 |
| | | | | | | |
Food Products 1.1% | | | | | | | |
Unilever PLC | | United Kingdom | | 30,710 | | | 988,614 |
| | | | | | | |
Health Care Equipment & Supplies 0.4% | | | | | | | |
Covidien PLC | | United States | | 8,326 | | | 398,732 |
| | | | | | | |
Health Care Providers & Services 0.9% | | | | | | | |
Quest Diagnostics Inc. | | United States | | 13,890 | | | 838,678 |
| | | | | | | |
Hotels, Restaurants & Leisure 0.5% | | | | | | | |
Compass Group PLC | | United Kingdom | | 71,608 | | | 517,022 |
| | | | | | | |
Industrial Conglomerates 2.6% | | | | | | | |
General Electric Co. | | United States | | 23,450 | | | 354,798 |
Koninklijke Philips Electronics NV | | Netherlands | | 21,170 | | | 626,683 |
Siemens AG, ADR | | Germany | | 12,220 | | | 1,120,574 |
Tyco International Ltd. | | United States | | 8,326 | | | 297,072 |
| | | | | | | |
| | | | | | | 2,399,127 |
| | | | | | | |
Insurance 3.7% | | | | | | | |
ACE Ltd. | | United States | | 17,838 | | | 899,035 |
Aviva PLC | | United Kingdom | | 64,186 | | | 411,596 |
AXA SA | | France | | 40,041 | | | 948,018 |
aProgressive Corp. | | United States | | 34,660 | | | 623,533 |
Swiss Reinsurance Co. | | Switzerland | | 5,310 | | | 256,023 |
Torchmark Corp. | | United States | | 6,350 | | | 279,083 |
| | | | | | | |
| | | | | | | 3,417,288 |
| | | | | | | |
Internet Software & Services 0.0%c | | | | | | | |
aAOL Inc. | | United States | | 1,832 | | | 42,771 |
| | | | | | | |
IT Services 1.0% | | | | | | | |
Accenture PLC, A | | United States | | 22,100 | | | 917,150 |
| | | | | | | |
Media 6.0% | | | | | | | |
British Sky Broadcasting Group PLC | | United Kingdom | | 35,591 | | | 323,085 |
Comcast Corp., A | | United States | | 53,133 | | | 850,659 |
News Corp., A | | United States | | 64,570 | | | 883,963 |
Pearson PLC | | United Kingdom | | 63,912 | | | 920,846 |
Reed Elsevier NV | | Netherlands | | 37,947 | | | 467,200 |
Time Warner Cable Inc. | | United States | | 5,057 | | | 209,309 |
Time Warner Inc. | | United States | | 20,149 | | | 587,142 |
TGA-17
Franklin Templeton Variable Insurance Products Trust
Statement of Investments, December 31, 2009 (continued)
| | | | | | | |
| Templeton Global Asset Allocation Fund | | Country/
Organization | | Shares/
Warrants | | Value |
Common Stocks and Other Equity Interests (continued) | | | | | | | |
Media (continued) | | | | | | | |
aViacom Inc., B | | United States | | 28,204 | | $ | 838,505 |
Vivendi SA | | France | | 16,213 | | | 482,612 |
| | | | | | | |
| | | | | | | 5,563,321 |
| | | | | | | |
Multi-Utilities 0.8% | | | | | | | |
PG&E Corp. | | United States | | 15,830 | | | 706,810 |
| | | | | | | |
Multiline Retail 1.0% | | | | | | | |
Target Corp. | | United States | | 18,767 | | | 907,760 |
| | | | | | | |
Oil, Gas & Consumable Fuels 5.1% | | | | | | | |
BP PLC | | United Kingdom | | 130,321 | | | 1,264,480 |
Chevron Corp. | | United States | | 5,790 | | | 445,772 |
Eni SpA | | Italy | | 24,592 | | | 626,600 |
Royal Dutch Shell PLC, B | | United Kingdom | | 38,652 | | | 1,130,967 |
Statoil ASA | | Norway | | 18,900 | | | 472,141 |
Total SA, B | | France | | 12,240 | | | 788,530 |
| | | | | | | |
| | | | | | | 4,728,490 |
| | | | | | | |
Pharmaceuticals 8.5% | | | | | | | |
Abbott Laboratories | | United States | | 9,627 | | | 519,762 |
Bristol-Myers Squibb Co. | | United States | | 23,584 | | | 595,496 |
GlaxoSmithKline PLC | | United Kingdom | | 30,757 | | | 655,531 |
Merck & Co. Inc. | | United States | | 24,820 | | | 906,923 |
Merck KGaA | | Germany | | 4,760 | | | 440,846 |
Novartis AG | | Switzerland | | 11,760 | | | 641,878 |
Pfizer Inc. | | United States | | 60,304 | | | 1,096,930 |
Roche Holding AG | | Switzerland | | 1,610 | | | 273,427 |
Sanofi-Aventis | | France | | 13,311 | | | 1,049,115 |
Takeda Pharmaceutical Co. Ltd. | | Japan | | 14,786 | | | 609,060 |
aWatson Pharmaceuticals Inc. | | United States | | 29,652 | | | 1,174,515 |
| | | | | | | |
| | | | | | | 7,963,483 |
| | | | | | | |
Professional Services 0.4% | | | | | | | |
Adecco SA | | Switzerland | | 6,810 | | | 375,318 |
| | | | | | | |
Real Estate Management & Development 0.5% | | | | | | | |
Cheung Kong (Holdings) Ltd. | | Hong Kong | | 37,748 | | | 488,299 |
| | | | | | | |
Semiconductors & Semiconductor Equipment 1.8% | | | | | | | |
Samsung Electronics Co. Ltd. | | South Korea | | 2,200 | | | 1,507,450 |
Taiwan Semiconductor Manufacturing Co. Ltd. | | Taiwan | | 90,449 | | | 182,368 |
| | | | | | | |
| | | | | | | 1,689,818 |
| | | | | | | |
Software 4.9% | | | | | | | |
aCheck Point Software Technologies Ltd. | | Israel | | 27,306 | | | 925,127 |
Microsoft Corp. | | United States | | 39,012 | | | 1,189,476 |
Nintendo Co. Ltd. | | Japan | | 2,341 | | | 554,911 |
Oracle Corp. | | United States | | 61,267 | | | 1,503,492 |
SAP AG, ADR | | Germany | | 7,470 | | | 349,671 |
| | | | | | | |
| | | | | | | 4,522,677 |
| | | | | | | |
Specialty Retail 0.2% | | | | | | | |
The Home Depot Inc. | | United States | | 5,020 | | | 145,229 |
| | | | | | | |
TGA-18
Franklin Templeton Variable Insurance Products Trust
Statement of Investments, December 31, 2009 (continued)
| | | | | | | | |
| Templeton Global Asset Allocation Fund | | Country/
Organization | | Shares/
Warrants | | | Value |
Common Stocks and Other Equity Interests (continued) | | | | | | | | |
Trading Companies & Distributors 0.2% | | | | | | | | |
aWolseley PLC | | United Kingdom | | 11,609 | | | $ | 234,205 |
| | | | | | | | |
Wireless Telecommunication Services 1.2% | | | | | | | | |
Vodafone Group PLC, ADR | | United Kingdom | | 50,593 | | | | 1,168,192 |
| | | | | | | | |
Total Common Stocks and Other Equity Interests
(Cost $50,267,270) | | | | | | | | 57,082,806 |
| | | | | | | | |
Preferred Stocks 1.2% | | | | | | | | |
Metals & Mining 0.9% | | | | | | | | |
Vale SA, ADR, pfd., A | | Brazil | | 33,728 | | | | 837,129 |
| | | | | | | | |
Oil, Gas & Consumable Fuels 0.3% | | | | | | | | |
Petroleo Brasileiro SA, ADR, pfd. | | Brazil | | 6,070 | | | | 257,308 |
| | | | | | | | |
Total Preferred Stocks (Cost $194,930) | | | | | | | | 1,094,437 |
| | | | | | | | |
| | | |
| | | | | Principald
Amount | | | |
Foreign Government and Agency Securities 34.5% | | | | | | | | |
European Investment Bank, senior note, 1612/37, 6.50%, 9/10/14 | | Supranationale | | 291,000 | NZD | | $ | 217,835 |
f,gGovernment of Argentina, senior bond, FRN, 0.943%, 8/03/12 | | Argentina | | 1,334,000 | | | | 459,563 |
Government of Australia, TB123, 5.75%, 4/15/12 | | Australia | | 340,000 | AUD | | | 312,216 |
Government of Indonesia,
FR31, 11.00%, 11/15/20 | | Indonesia | | 12,000,000,000 | IDR | | | 1,341,962 |
FR37, 12.00%, 9/15/26 | | Indonesia | | 3,140,000,000 | IDR | | | 366,472 |
FR40, 11.00%, 9/15/25 | | Indonesia | | 9,900,000,000 | IDR | | | 1,076,658 |
Government of Malaysia,
3.756%, 4/28/11 | | Malaysia | | 13,480,000 | MYR | | | 4,006,898 |
3.833%, 9/28/11 | | Malaysia | | 35,000 | MYR | | | 10,439 |
3.461%, 7/31/13 | | Malaysia | | 1,340,000 | MYR | | | 392,438 |
3.814%, 2/15/17 | | Malaysia | | 6,640,000 | MYR | | | 1,908,030 |
Government of Mexico, M 20, 10.00%, 12/05/24 | | Mexico | | 142,000 | h MXN | | | 1,247,442 |
Government of Poland,
4.75%, 4/25/12 | | Poland | | 10,050,000 | PLN | | | 3,490,172 |
5.75%, 9/23/22 | | Poland | | 4,075,000 | PLN | | | 1,356,133 |
Government of Sweden,
5.25%, 3/15/11 | | Sweden | | 22,030,000 | SEK | | | 3,254,700 |
5.50%, 10/08/12 | | Sweden | | 8,620,000 | SEK | | | 1,325,730 |
KfW Bankengruppe, senior note, 6.50%, 11/15/11 | | Germany | | 250,000 | NZD | | | 187,823 |
Korea Treasury Bond,
0400-1206, 4.00%, 6/10/12 | | South Korea | | 2,222,800,000 | KRW | | | 1,888,721 |
0475-1112, 4.75%, 12/10/11 | | South Korea | | 1,029,770,000 | KRW | | | 889,207 |
0525-1209, 5.25%, 9/10/12 | | South Korea | | 1,840,000,000 | KRW | | | 1,604,912 |
0525-1303, 5.25%, 3/10/13 | | South Korea | | 79,210,000 | KRW | | | 69,112 |
0550-1106, 5.50%, 6/10/11 | | South Korea | | 800,240,000 | KRW | | | 700,797 |
New South Wales Treasury Corp., 6.00%, 5/01/12 | | Australia | | 1,025,000 | AUD | | | 938,519 |
Nota Do Tesouro Nacional,
10.00%, 1/01/12 | | Brazil | | 1,900 | i BRL | | | 1,055,751 |
jIndex Linked, 6.00%, 5/15/15 | | Brazil | | 1,885 | i BRL | | | 1,958,998 |
jIndex Linked, 6.00%, 5/15/45 | | Brazil | | 1,430 | i BRL | | | 1,444,281 |
Province of Ontario, 6.25%, 6/16/15 | | Canada | | 64,000 | NZD | | | 46,994 |
TGA-19
Franklin Templeton Variable Insurance Products Trust
Statement of Investments, December 31, 2009 (continued)
| | | | | | | | |
| Templeton Global Asset Allocation Fund | | Country/
Organization | | Principald
Amount | | | Value |
Foreign Government and Agency Securities (continued) | | | | | | | | |
Queensland Treasury Corp., 11, 6.00%, 6/14/11 | | Australia | | 510,000 | AUD | | $ | 466,029 |
Svensk Exportkredit AB, senior note, 7.625%, 6/30/14 | | Sweden | | 85,000 | NZD | | | 65,617 |
| | | | | | | | |
Total Foreign Government and Agency Securities
(Cost $30,993,922) | | | | | | | | 32,083,449 |
| | | | | | | | |
Total Investments before Short Term Investments
(Cost $81,456,122) | | | | | | | | 90,260,692 |
| | | | | | | | |
| | | |
| | | | | Shares | | | |
Short Term Investments (Cost $2,646,128) 2.8% | | | | | | | | |
Money Market Funds 2.8% | | | | | | | | |
kInstitutional Fiduciary Trust Money Market Portfolio, 0.00% | | United States | | 2,646,128 | | | | 2,646,128 |
| | | | | | | | |
Total Investments (Cost $84,102,250) 99.8% | | | | | | | | 92,906,820 |
Other Assets, less Liabilities 0.2% | | | | | | | | 216,549 |
| | | | | | | | |
Net Assets 100.0% | | | | | | | $ | 93,123,369 |
| | | | | | | | |
aNon-income producing.
bSecurity has been deemed illiquid because it may not be able to be sold within seven days. At December 31, 2009, the value of this security was $8,059, representing 0.01% of net assets.
cRounds to less than 0.1% of net assets.
dThe principal amount is stated in U.S. dollars unless otherwise indicated.
eA supranational organization is an entity formed by two or more central governments through international treaties.
fThe coupon rate shown represents the rate at period end.
gThe principal amount is stated in original face, and scheduled paydowns are reflected in the market price on ex-date.
hPrincipal amount is stated in 100 Mexican Peso Units.
iPrincipal amount is stated in 1,000 Brazilian Real Units.
jRedemption price at maturity is adjusted for inflation. See Note 1(e).
kSee Note 7 regarding investments in the Institutional Fiduciary Trust Money Market Portfolio. The rate shown is the annualized seven-day yield at period end.
TGA-20
Franklin Templeton Variable Insurance Products Trust
Statement of Investments, December 31, 2009 (continued)
| | | | | | |
| Templeton Global Asset Allocation Fund | | | | | | |
At December 31, 2009, the Fund had the following forward exchange contracts outstanding. See Note 1(c).
| | | | | | | | | | | | | | | | | | |
| Currency | | Counterparty | | Type | | Quantity | | Contract
Amount* | | Settlement
Date | | Unrealized
Appreciation | | Unrealized
Depreciation | |
Euro | | DBAB | | Sell | | 329,000 | | $ | 456,323 | | 1/11/10 | | $ | — | | $ | (14,616 | ) |
Euro | | JPHQ | | Sell | | 144,000 | | | 200,318 | | 1/13/10 | | | — | | | (5,806 | ) |
Chilean Peso | | DBAB | | Buy | | 51,350,000 | | | 81,301 | | 1/28/10 | | | 20,059 | | | — | |
Chilean Peso | | DBAB | | Buy | | 118,180,000 | | | 188,366 | | 1/29/10 | | | 44,924 | | | — | |
Chilean Peso | | JPHQ | | Buy | | 15,570,000 | | | 24,793 | | 1/29/10 | | | 5,943 | | | — | |
Mexican Peso | | DBAB | | Sell | | 3,500,000 | | | 256,856 | | 1/29/10 | | | — | | | (9,766 | ) |
Mexican Peso | | CITI | | Sell | | 1,099,000 | | | 80,619 | | 1/29/10 | | | — | | | (3,100 | ) |
New Zealand Dollar | | UBSW | | Sell | | 177,046 | | | 115,239 | | 1/29/10 | | | — | | | (12,910 | ) |
Chilean Peso | | DBAB | | Buy | | 24,790,000 | | | 39,664 | | 2/02/10 | | | 9,285 | | | — | |
New Zealand Dollar | | DBAB | | Sell | | 892,571 | | | 451,230 | | 2/02/10 | | | — | | | (194,648 | ) |
Chilean Peso | | DBAB | | Buy | | 46,510,000 | | | 74,357 | | 2/03/10 | | | 17,486 | | | — | |
Chinese Yuan | | DBAB | | Buy | | 2,351,000 | | | 333,322 | | 2/03/10 | | | 11,161 | | | — | |
Chilean Peso | | DBAB | | Buy | | 24,390,000 | | | 39,659 | | 2/12/10 | | | 8,534 | | | — | |
Chilean Peso | | DBAB | | Buy | | 60,030,000 | | | 99,141 | | 2/16/10 | | | 19,506 | | | — | |
Chilean Peso | | DBAB | | Buy | | 59,930,000 | | | 99,717 | | 2/17/10 | | | 18,740 | | | — | |
Chilean Peso | | CITI | | Buy | | 102,710,000 | | | 169,521 | | 2/26/10 | | | 33,622 | | | — | |
Chilean Peso | | DBAB | | Buy | | 30,220,000 | | | 49,852 | | 2/26/10 | | | 9,918 | | | — | |
New Zealand Dollar | | DBAB | | Sell | | 2,625,063 | | | 1,316,469 | | 2/26/10 | | | — | | | (579,980 | ) |
Chilean Peso | | DBAB | | Buy | | 30,070,000 | | | 49,851 | | 3/03/10 | | | 9,634 | | | — | |
Chilean Peso | | DBAB | | Buy | | 48,850,000 | | | 79,768 | | 3/04/10 | | | 16,868 | | | — | |
Chilean Peso | | DBAB | | Buy | | 30,610,000 | | | 49,853 | | 3/05/10 | | | 10,700 | | | — | |
Chilean Peso | | DBAB | | Buy | | 28,870,000 | | | 46,926 | | 3/08/10 | | | 10,185 | | | — | |
Chilean Peso | | DBAB | | Buy | | 30,670,000 | | | 49,850 | | 3/09/10 | | | 10,821 | | | — | |
Indian Rupee | | DBAB | | Buy | | 3,875,000 | | | 74,888 | | 4/09/10 | | | 7,950 | | | — | |
Indian Rupee | | DBAB | | Buy | | 8,310,000 | | | 160,487 | | 4/12/10 | | | 17,112 | | | — | |
Indian Rupee | | JPHQ | | Buy | | 5,581,000 | | | 106,977 | | 4/13/10 | | | 12,287 | | | — | |
Indian Rupee | | JPHQ | | Buy | | 5,479,000 | | | 106,991 | | 4/15/10 | | | 10,072 | | | — | |
Indian Rupee | | DBAB | | Buy | | 1,921,000 | | | 37,446 | | 4/19/10 | | | 3,582 | | | — | |
Indian Rupee | | JPHQ | | Buy | | 2,737,000 | | | 53,646 | | 4/19/10 | | | 4,811 | | | — | |
Chilean Peso | | CITI | | Buy | | 58,723,000 | | | 100,090 | | 4/23/10 | | | 16,190 | | | — | |
Chilean Peso | | CITI | | Buy | | 57,341,000 | | | 97,825 | | 4/26/10 | | | 15,734 | | | — | |
Indian Rupee | | DBAB | | Buy | | 3,892,000 | | | 75,104 | | 4/26/10 | | | 7,969 | | | — | |
Chilean Peso | | JPHQ | | Buy | | 45,343,000 | | | 77,490 | | 4/27/10 | | | 12,313 | | | — | |
Chilean Peso | | CITI | | Buy | | 45,505,000 | | | 77,488 | | 4/27/10 | | | 12,635 | | | — | |
Indian Rupee | | JPHQ | | Buy | | 555,000 | | | 10,725 | | 4/27/10 | | | 1,120 | | | — | |
Chilean Peso | | CITI | | Buy | | 73,088,000 | | | 123,983 | | 4/28/10 | | | 20,775 | | | — | |
Chilean Peso | | UBSW | | Buy | | 9,151,000 | | | 15,497 | | 4/28/10 | | | 2,627 | | | — | |
Indian Rupee | | JPHQ | | Buy | | 2,755,000 | | | 53,651 | | 4/28/10 | | | 5,142 | | | — | |
Indian Rupee | | JPHQ | | Buy | | 2,757,000 | | | 53,638 | | 4/30/10 | | | 5,187 | | | — | |
Indian Rupee | | DBAB | | Buy | | 5,273,000 | | | 107,439 | | 6/01/10 | | | 4,744 | | | — | |
New Zealand Dollar | | UBSW | | Sell | | 264,563 | | | 184,818 | | 6/01/10 | | | — | | | (4,841 | ) |
New Zealand Dollar | | DBAB | | Sell | | 262,969 | | | 183,681 | | 6/01/10 | | | — | | | (4,835 | ) |
New Zealand Dollar | | CITI | | Sell | | 149,669 | | | 104,377 | | 6/01/10 | | | — | | | (2,918 | ) |
Indian Rupee | | HSBC | | Buy | | 156,000 | | | 3,216 | | 6/02/10 | | | 102 | | | — | |
New Zealand Dollar | | BZWS | | Sell | | 219,298 | | | 154,447 | | 6/02/10 | | | — | | | (2,749 | ) |
New Zealand Dollar | | DBAB | | Sell | | 113,427 | | | 80,040 | | 6/02/10 | | | — | | | (1,266 | ) |
New Zealand Dollar | | FBCO | | Sell | | 37,431 | | | 26,389 | | 6/02/10 | | | — | | | (442 | ) |
Indian Rupee | | HSBC | | Buy | | 774,000 | | | 16,125 | | 6/03/10 | | | 339 | | | — | |
Indian Rupee | | HSBC | | Buy | | 5,163,000 | | | 107,428 | | 6/04/10 | | | 2,385 | | | — | |
Indian Rupee | | DBAB | | Buy | | 2,582,000 | | | 53,725 | | 6/07/10 | | | 1,178 | | | — | |
Indian Rupee | | HSBC | | Buy | | 1,037,000 | | | 21,492 | | 6/08/10 | | | 556 | | | — | |
TGA-21
Franklin Templeton Variable Insurance Products Trust
Statement of Investments, December 31, 2009 (continued)
| | | | | | |
| Templeton Global Asset Allocation Fund | | | | | | |
| | | | | | | | | | | | | | | | | | | |
| Currency | | Counterparty | | Type | | Quantity | | Contract
Amount* | | | Settlement
Date | | Unrealized
Appreciation | | Unrealized
Depreciation | |
Indian Rupee | | DBAB | | Buy | | 1,302,000 | | $ | 27,012 | | | 6/08/10 | | $ | 670 | | $ | — | |
New Zealand Dollar | | BZWS | | Sell | | 219,298 | | | 154,355 | | | 6/09/10 | | | — | | | (2,747 | ) |
Indian Rupee | | DBAB | | Buy | | 1,051,000 | | | 21,603 | | | 6/10/10 | | | 739 | | | — | |
Indian Rupee | | BZWS | | Buy | | 1,572,000 | | | 32,412 | | | 6/11/10 | | | 1,002 | | | — | |
Indian Rupee | | HSBC | | Buy | | 1,054,000 | | | 21,621 | | | 6/11/10 | | | 783 | | | — | |
Indian Rupee | | DBAB | | Buy | | 2,632,000 | | | 54,034 | | | 6/16/10 | | | 1,886 | | | — | |
Indian Rupee | | DBAB | | Buy | | 2,397,000 | | | 48,621 | | | 6/21/10 | | | 2,283 | | | — | |
Indian Rupee | | JPHQ | | Buy | | 2,756,000 | | | 55,903 | | | 6/22/10 | | | 2,620 | | | — | |
Indian Rupee | | DBAB | | Buy | | 4,171,000 | | | 83,864 | | | 6/24/10 | | | 4,689 | | | — | |
Indian Rupee | | HSBC | | Buy | | 2,801,000 | | | 55,908 | | | 6/25/10 | | | 3,554 | | | — | |
Malaysian Ringgit | | JPHQ | | Buy | | 1,685,000 | | | 474,849 | | | 6/29/10 | | | 13,770 | | | — | |
Indian Rupee | | JPHQ | | Buy | | 2,771,000 | | | 55,901 | | | 7/09/10 | | | 2,859 | | | — | |
Indian Rupee | | DBAB | | Buy | | 2,769,000 | | | 55,906 | | | 7/09/10 | | | 2,812 | | | — | |
Indian Rupee | | JPHQ | | Buy | | 1,683,000 | | | 33,554 | | | 7/12/10 | | | 2,126 | | | — | |
Indian Rupee | | DBAB | | Buy | | 1,399,000 | | | 27,952 | | | 7/12/10 | | | 1,707 | | | — | |
New Zealand Dollar | | DBAB | | Sell | | 439,116 | | | 282,571 | | | 7/30/10 | | | — | | | (30,523 | ) |
New Zealand Dollar | | DBAB | | Sell | | 437,445 | | | 280,993 | | | 8/03/10 | | | — | | | (30,789 | ) |
New Zealand Dollar | | BZWS | | Sell | | 171,242 | | | 109,937 | | | 8/03/10 | | | — | | | (12,112 | ) |
New Zealand Dollar | | DBAB | | Sell | | 173,312 | | | 110,729 | | | 8/04/10 | | | — | | | (12,784 | ) |
New Zealand Dollar | | BZWS | | Sell | | 86,282 | | | 55,393 | | | 8/04/10 | | | — | | | (6,097 | ) |
New Zealand Dollar | | HSBC | | Sell | | 705,000 | | | 455,994 | | | 8/05/10 | | | — | | | (46,385 | ) |
New Zealand Dollar | | CITI | | Sell | | 434,419 | | | 283,687 | | | 8/05/10 | | | — | | | (25,878 | ) |
New Zealand Dollar | | DBAB | | Sell | | 128,871 | | | 83,998 | | | 8/05/10 | | | — | | | (7,835 | ) |
New Zealand Dollar | | CITI | | Sell | | 170,128 | | | 111,181 | | | 8/06/10 | | | — | | | (10,039 | ) |
New Zealand Dollar | | FBCO | | Sell | | 84,907 | | | 55,295 | | | 8/06/10 | | | — | | | (5,203 | ) |
New Zealand Dollar | | CITI | | Sell | | 167,867 | | | 110,366 | | | 8/09/10 | | | — | | | (9,209 | ) |
New Zealand Dollar | | DBAB | | Sell | | 168,625 | | | 110,921 | | | 8/09/10 | | | — | | | (9,193 | ) |
New Zealand Dollar | | FBCO | | Sell | | 165,953 | | | 109,355 | | | 8/09/10 | | | — | | | (8,856 | ) |
New Zealand Dollar | | FBCO | | Sell | | 166,244 | | | 110,408 | | | 8/11/10 | | | — | | | (7,988 | ) |
New Zealand Dollar | | DBAB | | Sell | | 156,084 | | | 101,954 | | | 8/12/10 | | | — | | | (9,195 | ) |
Brazilian Real | | DBAB | | Buy | | 118,000 | | | 5,730,906 | JPY | | 8/17/10 | | | 2,511 | | | — | |
Japanese Yen | | UBSW | | Sell | | 16,359,000 | | | 172,461 | | | 8/17/10 | | | — | | | (3,896 | ) |
Brazilian Real | | DBAB | | Buy | | 87,000 | | | 4,189,050 | JPY | | 8/18/10 | | | 2,230 | | | — | |
Japanese Yen | | JPHQ | | Sell | | 8,129,000 | | | 86,231 | | | 8/18/10 | | | — | | | (1,405 | ) |
Brazilian Real | | DBAB | | Buy | | 131,000 | | | 6,157,786 | JPY | | 8/19/10 | | | 4,955 | | | — | |
Japanese Yen | | HSBC | | Sell | | 8,091,000 | | | 86,001 | | | 8/19/10 | | | — | | | (1,227 | ) |
Japanese Yen | | DBAB | | Sell | | 8,122,000 | | | 86,004 | | | 8/20/10 | | | — | | | (1,561 | ) |
Japanese Yen | | BZWS | | Sell | | 8,112,000 | | | 86,135 | | | 8/20/10 | | | — | | | (1,321 | ) |
Japanese Yen | | CITI | | Sell | | 16,207,000 | | | 172,264 | | | 8/23/10 | | | — | | | (2,476 | ) |
Japanese Yen | | FBCO | | Sell | | 16,088,000 | | | 172,262 | | | 8/23/10 | | | — | | | (1,195 | ) |
Japanese Yen | | JPHQ | | Sell | | 16,172,000 | | | 172,258 | | | 8/24/10 | | | — | | | (2,108 | ) |
Japanese Yen | | BZWS | | Sell | | 16,118,000 | | | 172,256 | | | 8/24/10 | | | — | | | (1,528 | ) |
New Zealand Dollar | | FBCO | | Sell | | 152,518 | | | 100,567 | | | 8/24/10 | | | — | | | (7,916 | ) |
Japanese Yen | | DBAB | | Sell | | 8,016,000 | | | 86,129 | | | 8/25/10 | | | — | | | (301 | ) |
New Zealand Dollar | | DBAB | | Sell | | 152,000 | | | 101,612 | | | 8/27/10 | | | — | | | (6,471 | ) |
Brazilian Real | | DBAB | | Buy | | 87,000 | | | 4,064,901 | JPY | | 8/31/10 | | | 3,409 | | | — | |
Japanese Yen | | JPHQ | | Sell | | 8,034,000 | | | 86,127 | | | 9/01/10 | | | — | | | (509 | ) |
Brazilian Real | | DBAB | | Buy | | 131,000 | | | 6,057,047 | JPY | | 9/02/10 | | | 5,783 | | | — | |
Japanese Yen | | HSBC | | Sell | | 7,950,000 | | | 86,129 | | | 9/02/10 | | | 397 | | | — | |
Japanese Yen | | HSBC | | Sell | | 11,973,000 | | | 129,189 | | | 9/09/10 | | | 55 | | | — | |
Japanese Yen | | DBAB | | Sell | | 10,480,000 | | | 114,166 | | | 9/10/10 | | | 1,132 | | | — | |
Japanese Yen | | HSBC | | Sell | | 11,932,000 | | | 129,190 | | | 9/10/10 | | | 495 | | | — | |
Japanese Yen | | UBSW | | Sell | | 8,706,000 | | | 95,143 | | | 9/13/10 | | | 1,237 | | | — | |
TGA-22
Franklin Templeton Variable Insurance Products Trust
Statement of Investments, December 31, 2009 (continued)
| | | | | | |
| Templeton Global Asset Allocation Fund | | | | | | |
| | | | | | | | | | | | | | | | | | | |
| Currency | | Counterparty | | Type | | Quantity | | Contract
Amount* | | | Settlement
Date | | Unrealized
Appreciation | | Unrealized
Depreciation | |
Brazilian Real | | DBAB | | Buy | | 196,000 | | $ | 9,138,950 | JPY | | 9/15/10 | | $ | 7,472 | | $ | — | |
Japanese Yen | | UBSW | | Sell | | 10,316,000 | | | 114,164 | | | 9/15/10 | | | 2,888 | | | — | |
Japanese Yen | | BZWS | | Sell | | 6,850,000 | | | 76,115 | | | 9/15/10 | | | 2,226 | | | — | |
Japanese Yen | | HSBC | | Sell | | 6,926,000 | | | 76,108 | | | 9/15/10 | | | 1,399 | | | — | |
Japanese Yen | | DBAB | | Sell | | 3,444,000 | | | 38,055 | | | 9/16/10 | | | 905 | | | — | |
Japanese Yen | | HSBC | | Sell | | 10,274,000 | | | 114,168 | | | 9/16/10 | | | 3,343 | | | — | |
Japanese Yen | | HSBC | | Sell | | 3,415,000 | | | 38,054 | | | 9/21/10 | | | 1,213 | | | — | |
Japanese Yen | | JPHQ | | Sell | | 6,888,000 | | | 76,111 | | | 9/21/10 | | | 1,802 | | | — | |
Swedish Krona | | UBSW | | Buy | | 3,000,000 | | | 295,069 | EUR | | 9/23/10 | | | — | | | (2,223 | ) |
Japanese Yen | | JPHQ | | Sell | | 5,861,000 | | | 64,766 | | | 9/24/10 | | | 1,533 | | | — | |
Japanese Yen | | JPHQ | | Sell | | 583,000 | | | 6,479 | | | 9/27/10 | | | 188 | | | — | |
Japanese Yen | | JPHQ | | Sell | | 2,180,000 | | | 24,225 | | | 9/28/10 | | | 703 | | | — | |
Japanese Yen | | JPHQ | | Sell | | 3,634,000 | | | 40,382 | | | 9/29/10 | | | 1,171 | | | — | |
Chinese Yuan | | HSBC | | Buy | | 205,268 | | | 31,178 | | | 10/25/10 | | | — | | | (914 | ) |
Chinese Yuan | | HSBC | | Buy | | 351,200 | | | 53,194 | | | 10/26/10 | | | — | | | (1,413 | ) |
Chinese Yuan | | HSBC | | Buy | | 213,420 | | | 32,261 | | | 10/27/10 | | | — | | | (792 | ) |
Japanese Yen | | DBAB | | Sell | | 17,595,000 | | | 196,428 | | | 11/15/10 | | | 6,280 | | | — | |
Japanese Yen | | JPHQ | | Sell | | 8,786,000 | | | 98,211 | | | 11/16/10 | | | 3,259 | | | — | |
Japanese Yen | | BZWS | | Sell | | 4,235,000 | | | 47,137 | | | 11/16/10 | | | 1,368 | | | — | |
Japanese Yen | | HSBC | | Sell | | 4,591,000 | | | 51,068 | | | 11/17/10 | | | 1,451 | | | — | |
Japanese Yen | | UBSW | | Sell | | 7,019,000 | | | 78,574 | | | 11/17/10 | | | 2,715 | | | — | |
Japanese Yen | | BZWS | | Sell | | 17,543,000 | | | 196,422 | | | 11/17/10 | | | 6,824 | | | — | |
Japanese Yen | | BZWS | | Sell | | 24,464,000 | | | 274,996 | | | 11/18/10 | | | 10,590 | | | — | |
Japanese Yen | | BZWS | | Sell | | 27,643,000 | | | 314,283 | | | 11/29/10 | | | 15,410 | | | — | |
Japanese Yen | | BOFA | | Sell | | 18,972,000 | | | 214,101 | | | 11/29/10 | | | 8,977 | | | — | |
Japanese Yen | | CITI | | Sell | | 6,861,000 | | | 78,569 | | | 11/29/10 | | | 4,388 | | | — | |
Japanese Yen | | DBAB | | Sell | | 17,012,000 | | | 196,428 | | | 12/01/10 | | | 12,483 | | | — | |
Mexican Peso | | CITI | | Sell | | 1,088,000 | | | 80,112 | | | 12/02/10 | | | 572 | | | — | |
Chinese Yuan | | HSBC | | Buy | | 220,000 | | | 33,218 | | | 12/06/10 | | | — | | | (731 | ) |
Chinese Yuan | | HSBC | | Buy | | 277,000 | | | 27,834 | EUR | | 12/06/10 | | | 1,123 | | | — | |
| | | | | | | | | | | | | | | | |
Unrealized appreciation (depreciation) | | | | | | 586,183 | | | (1,110,697 | ) |
| | | | | | | | | | | | | | | | |
Net unrealized appreciation (depreciation) | | | | | | | | $ | (524,514 | ) |
| | | | | | | | | | | | | | | | | | | |
*In U.S. dollars unless otherwise indicated.
See Abbreviations on page TGA-36
The accompanying notes are an integral part of these financial statements.
TGA-23
Franklin Templeton Variable Insurance Products Trust
Financial Statements
Statement of Assets and Liabilities
December 31, 2009
| | | | |
| | | Templeton
Global Asset
Allocation Fund | |
Assets: | | | | |
Investments in securities: | | | | |
Cost - Unaffiliated issuers | | $ | 81,456,122 | |
Cost - Sweep Money Fund (Note 7) | | | 2,646,128 | |
| | | | |
Total cost of investments | | $ | 84,102,250 | |
| | | | |
Value - Unaffiliated issuers | | $ | 90,260,692 | |
Value - Sweep Money Fund (Note 7) | | | 2,646,128 | |
| | | | |
Total value of investments | | | 92,906,820 | |
Cash | | | 16 | |
Foreign currency, at value (cost and $201,233) | | | 222,402 | |
Receivables: | | | | |
Capital shares sold | | | 73,713 | |
Dividends and interest | | | 728,468 | |
Unrealized appreciation on forward exchange contracts | | | 586,183 | |
Other assets | | | 12 | |
| | | | |
Total assets | | | 94,517,614 | |
| | | | |
Liabilities: | | | | |
Payables: | | | | |
Capital shares redeemed | | | 149,728 | |
Affiliates | | | 67,914 | |
Unrealized depreciation on forward exchange contracts | | | 1,110,697 | |
Accrued expenses and other liabilities | | | 65,906 | |
| | | | |
Total liabilities | | | 1,394,245 | |
| | | | |
Net assets, at value | | $ | 93,123,369 | |
| | | | |
Net assets consist of: | | | | |
Paid-in capital | | $ | 87,204,329 | |
Undistributed net investment income | | | 1,142,697 | |
Net unrealized appreciation (depreciation) | | | 8,338,100 | |
Accumulated net realized gain (loss) | | | (3,561,757 | ) |
| | | | |
Net assets, at value | | $ | 93,123,369 | |
| | | | |
The accompanying notes are an integral part of these financial statements.
TGA-24
Franklin Templeton Variable Insurance Products Trust
Financial Statements (continued)
Statement of Assets and Liabilities (continued)
December 31, 2009
| | | |
| | | Templeton
Global Asset
Allocation Fund |
Class 1: | | | |
Net assets, at value | | $ | 40,471,114 |
| | | |
Shares outstanding | | | 4,329,825 |
| | | |
Net asset value and maximum offering price per share | | $ | 9.35 |
| | | |
Class 2: | | | |
Net assets, at value | | $ | 52,648,979 |
| | | |
Shares outstanding | | | 5,747,687 |
| | | |
Net asset value and maximum offering price per share | | $ | 9.16 |
| | | |
Class 4: | | | |
Net assets, at value | | $ | 3,276 |
| | | |
Shares outstanding | | | 351 |
| | | |
Net asset value and maximum offering price per share | | $ | 9.33 |
| | | |
The accompanying notes are an integral part of these financial statements.
TGA-25
Franklin Templeton Variable Insurance Products Trust
Financial Statements (continued)
Statements of Operations
for the year ended December 31, 2009
| | | | |
| | | Templeton
Global Asset
Allocation Fund | |
Investment income: | | | | |
Dividends: (net of foreign taxes of $122,973) | | | | |
Unaffiliated issuers | | $ | 1,473,320 | |
Sweep Money Fund (Note 7) | | | 515 | |
Interest (net of foreign taxes of $42,707) | | | 1,923,186 | |
| | | | |
Total investment income | | | 3,397,021 | |
| | | | |
Expenses: | | | | |
Management fees (Note 3a) | | | 542,664 | |
Administrative fees (Note 3b) | | | 126,518 | |
Distribution fees: (Note 3c) | | | | |
Class 2 | | | 118,875 | |
Class 4 | | | 10 | |
Unaffiliated transfer agent fees | | | 1,658 | |
Custodian fees (Note 4) | | | 28,834 | |
Reports to shareholders | | | 61,717 | |
Professional fees | | | 40,709 | |
Trustees’ fees and expenses | | | 455 | |
Other | | | 20,310 | |
| | | | |
Total expenses | | | 941,750 | |
Expense reductions (Note 4) | | | (3 | ) |
Expenses waived/paid by affiliates (Note 3e) | | | (123,771 | ) |
| | | | |
Net expenses | | | 817,976 | |
| | | | |
Net investment income | | | 2,579,045 | |
| | | | |
Realized and unrealized gains (losses): | | | | |
Net realized gain (loss) from: | | | | |
Investments | | | (3,985,264 | ) |
Foreign currency transactions | | | 1,407,894 | |
| | | | |
Net realized gain (loss) | | | (2,577,370 | ) |
| | | | |
Net change in unrealized appreciation (depreciation) on: | | | | |
Investments | | | 19,121,392 | |
Translation of other assets and liabilities denominated in foreign currencies | | | (2,365,708 | ) |
| | | | |
Net change in unrealized appreciation (depreciation) | | | 16,755,684 | |
| | | | |
Net realized and unrealized gain (loss) | | | 14,178,314 | |
| | | | |
Net increase (decrease) in net assets resulting from operations | | $ | 16,757,359 | |
| | | | |
The accompanying notes are an integral part of these financial statements.
TGA-26
Franklin Templeton Variable Insurance Products Trust
Financial Statements (continued)
Statements of Changes in Net Assets
| | | | | | | | |
| | | Templeton Global Asset
Allocation Fund | |
| | | Year Ended December 31, | |
| | | 2009 | | | 2008 | |
| | | | |
Increase (decrease) in net assets: | | | | | | | | |
Operations: | | | | | | | | |
Net investment income | | $ | 2,579,045 | | | $ | 3,746,471 | |
Net realized gain (loss) from investments and foreign currency transactions | | | (2,577,370 | ) | | | 3,371,334 | |
Net change in unrealized appreciation (depreciation) on investments and translation of other
assets and liabilities denominated in foreign currencies | | | 16,755,684 | | | | (39,963,692 | ) |
| | | | |
Net increase (decrease) in net assets resulting from operations | | | 16,757,359 | | | | (32,845,887 | ) |
| | | | |
Distributions to shareholders from: | | | | | | | | |
Net investment income and net foreign currency gains: | | | | | | | | |
Class 1 | | | (3,515,579 | ) | | | (5,575,011 | ) |
Class 2 | | | (4,506,554 | ) | | | (7,025,343 | ) |
Class 4 | | | (293 | ) | | | (492 | ) |
Net realized gains: | | | | | | | | |
Class 1 | | | (545,877 | ) | | | (6,781,816 | ) |
Class 2 | | | (725,422 | ) | | | (8,788,767 | ) |
Class 4 | | | (47 | ) | | | (599 | ) |
| | | | |
Total distributions to shareholders | | | (9,293,772 | ) | | | (28,172,028 | ) |
| | | | |
Capital share transactions: (Note 2) | | | | | | | | |
Class 1 | | | (426,291 | ) | | | 756,427 | |
Class 2 | | | 113,313 | | | | 4,300,548 | |
Class 4 | | | — | | | | 5,000 | |
| | | | |
Total capital share transactions | | | (312,978 | ) | | | 5,061,975 | |
| | | | |
Net increase (decrease) in net assets | | | 7,150,609 | | | | (55,955,940 | ) |
Net assets: | | | | | | | | |
Beginning of year | | | 85,972,760 | | | | 141,928,700 | |
| | | | |
End of year | | $ | 93,123,369 | | | $ | 85,972,760 | |
| | | | |
Undistributed net investment income included in net assets: | | | | | | | | |
End of year | | $ | 1,142,697 | | | $ | 6,406,237 | |
| | | | |
The accompanying notes are an integral part of these financial statements.
TGA-27
Franklin Templeton Variable Insurance Products Trust
Notes to Financial Statements
Templeton Global Asset Allocation Fund
1. ORGANIZATION AND SIGNIFICANT ACCOUNTING POLICIES
Franklin Templeton Variable Insurance Products Trust (Trust) is registered under the Investment Company Act of 1940, as amended, (1940 Act) as an open-end investment company, consisting of twenty-two separate funds. The Templeton Global Asset Allocation Fund (Fund) is included in this report. The financial statements of the remaining funds in the Trust are presented separately. Shares of the Fund are generally sold only to insurance company separate accounts to fund the benefits of variable life insurance policies or variable annuity contracts. The Fund offers three classes of shares: Class 1, Class 2, and Class 4. Each class of shares differs by its distribution fees, voting rights on matters affecting a single class and its exchange privilege.
The following summarizes the Fund’s significant accounting policies.
a. Security Valuation
Equity and other securities listed on a securities exchange or on the NASDAQ National Market System are valued at the last quoted sale price or the official closing price of the day, respectively. Over-the-counter securities and listed securities for which there is no reported sale are valued within the range of the most recent quoted bid and ask prices. Securities that trade in multiple markets or on multiple exchanges are valued according to the broadest and most representative market. Certain equity securities are valued based upon fundamental characteristics or relationships to similar securities. Investments in open-end mutual funds are valued at the closing net asset value.
Government securities generally trade in the over-the-counter market rather than on a securities exchange. The Fund may utilize independent pricing services, quotations from bond dealers, and information with respect to bond and note transactions, to assist in determining a current market value for each security. The Fund’s pricing services may use valuation models or matrix pricing which considers information with respect to comparable bond and note transactions, quotations from bond dealers, or by reference to other securities that are considered comparable in such characteristics as rating, interest rate and maturity date, option adjusted spread models, prepayment projections, interest rate spreads and yield curves, to determine current value. Debt securities denominated in a foreign currency are converted into their U.S. dollar equivalent at the foreign exchange rate in effect at the close of the NYSE on the date that the values of the foreign debt securities are determined.
Foreign equity securities are valued as of the close of trading on the foreign stock exchange on which the security is primarily traded, or the NYSE, whichever is earlier. If no sale is reported at that time, the foreign equity security will be valued within the range of the most recent quoted bid and ask prices. The value is then converted into its U.S. dollar equivalent at the foreign exchange rate in effect at the close of the NYSE on the day that the value of the security is determined.
The Fund has procedures to determine the fair value of individual securities and other assets for which market prices are not readily available or which may not be reliably priced. Methods for valuing these securities may include: fundamental analysis based upon the underlying investment book value, anticipated future cash flows, market changes in comparable or similar securities, matrix pricing, discounts from market prices of similar securities, or discounts applied due to the nature and duration of restrictions on the disposition of the securities. Due to the inherent uncertainty of valuations of such securities, the fair values may differ significantly from the values that would have been used had a ready market for such investments existed. Occasionally, events occur between the time at which trading in a security is completed and the close of the NYSE that might call into question the availability (including the reliability) of the value of a portfolio security held by the Fund. The investment manager monitors price movements following the close of trading in foreign stock markets through a series of country specific market proxies (such as baskets of American Depository Receipts, futures contracts and exchange traded funds). These price movements are measured against established trigger thresholds for each specific market proxy to assist in determining if an event has occurred. If such an event occurs, the securities may be valued using fair value procedures, which may include the use of independent pricing services. All security valuation procedures are approved by the Fund’s Board of Trustees.
TGA-28
Franklin Templeton Variable Insurance Products Trust
Notes to Financial Statements (continued)
Templeton Global Asset Allocation Fund
1. ORGANIZATION AND SIGNIFICANT ACCOUNTING POLICIES (continued)
b. Foreign Currency Translation
Portfolio securities and other assets and liabilities denominated in foreign currencies are translated into U.S. dollars based on the exchange rate of such currencies against U.S. dollars on the date of valuation. The Fund may enter into foreign currency exchange contracts to facilitate transactions denominated in a foreign currency. Purchases and sales of securities, income and expense items denominated in foreign currencies are translated into U.S. dollars at the exchange rate in effect on the transaction date. Occasionally, events may impact the availability or reliability of foreign exchange rates used to convert the U.S. dollar equivalent value. If such an event occurs, the foreign exchange rate will be valued at fair value using procedures established and approved by the Fund’s Board of Trustees.
The Fund does not separately report the effect of changes in foreign exchange rates from changes in market prices on securities held. Such changes are included in net realized and unrealized gain or loss from investments on the Statement of Operations.
Realized foreign exchange gains or losses arise from sales of foreign currencies, currency gains or losses realized between the trade and settlement dates on securities transactions and the difference between the recorded amounts of dividends, interest, and foreign withholding taxes and the U.S. dollar equivalent of the amounts actually received or paid. Net unrealized foreign exchange gains and losses arise from changes in foreign exchange rates on foreign denominated assets and liabilities other than investments in securities held at the end of the reporting period.
c. Derivative Financial Instruments
The Fund may invest in derivative financial instruments (derivatives) in order to manage risk or gain exposure to various other investments or markets. Derivatives are financial contracts based on an underlying or notional amount, require no initial investment or an initial net investment that is smaller than would normally be required to have a similar response to changes in market factors, and require or permit net settlement. Derivatives may contain various risks including the potential inability of the counterparty to fulfill their obligations under the terms of the contract, the potential for an illiquid secondary market, and the potential for market movements which may expose the Fund to gains or losses in excess of the amounts shown on the Statement of Assets and Liabilities.
Derivatives are marked to market daily based upon quotations from market makers or the Fund’s independent pricing services and the Fund’s net benefit or obligation under the contract, as measured by the fair market value of the contract, is included in net assets. Realized gain and loss and unrealized appreciation and depreciation on these contracts for the period are included in the Statement of Operations.
The Fund generally enters into forward exchange contracts in order to hedge against fluctuations in foreign exchange rates or to gain exposure to certain foreign currencies. A forward exchange contract is an agreement between the Fund and a counterparty to buy or sell a foreign currency for a specific exchange rate on a future date. Pursuant to the terms of the forward exchange contracts, cash or securities may be required to be deposited as collateral.
See Note 9 regarding other derivative information.
d. Income Taxes
No provision has been made for U.S. income taxes because it is the Fund’s policy to qualify as a regulated investment company under the Internal Revenue Code and to distribute to shareholders substantially all of its taxable income and net realized gains.
The Fund has reviewed the tax positions, taken on federal income tax returns, for each of the three open tax years and as of December 31, 2009, and has determined that no provision for income tax is required in the Fund’s financial statements.
TGA-29
Franklin Templeton Variable Insurance Products Trust
Notes to Financial Statements (continued)
Templeton Global Asset Allocation Fund
1. ORGANIZATION AND SIGNIFICANT ACCOUNTING POLICIES (continued)
d. Income Taxes (continued)
Foreign securities held by the Fund may be subject to foreign taxation on dividend and interest income received. Foreign taxes, if any, are recorded based on the tax regulations and rates that exist in the foreign markets in which the Fund invests.
e. Security Transactions, Investment Income, Expenses and Distributions
Security transactions are accounted for on trade date. Realized gains and losses on security transactions are determined on a specific identification basis. Interest income and estimated expenses are accrued daily. Amortization of premium and accretion of discount on debt securities are included in interest income. Dividend income is recorded on the ex-dividend date except that certain dividends from foreign securities are recognized as soon as the Fund is notified of the ex-dividend date. Distributions to shareholders are recorded on the ex-dividend date and are determined according to income tax regulations (tax basis). Distributable earnings determined on a tax basis may differ from earnings recorded in accordance with accounting principles generally accepted in the United States of America. These differences may be permanent or temporary. Permanent differences are reclassified among capital accounts to reflect their tax character. These reclassifications have no impact on net assets or the results of operations. Temporary differences are not reclassified, as they may reverse in subsequent periods.
Common expenses incurred by the Trust are allocated among the funds based on the ratio of net assets of each fund to the combined net assets of the Trust. Fund specific expenses are charged directly to the fund that incurred the expense.
Realized and unrealized gains and losses and net investment income, not including class specific expenses, are allocated daily to each class of shares based upon the relative proportion of net assets of each class. Differences in per share distributions, by class, are generally due to differences in class specific expenses.
Inflation-indexed bonds provide an inflation hedge through periodic increases or decreases in the security’s interest accruals and principal redemption value, by amounts corresponding to the current rate of inflation. Any such adjustments, including adjustments to principal redemption value, are recorded as interest income.
f. Accounting Estimates
The preparation of financial statements in accordance with accounting principles generally accepted in the United States of America requires management to make estimates and assumptions that affect the reported amounts of assets and liabilities at the date of the financial statements and the amounts of income and expenses during the reporting period. Actual results could differ from those estimates.
g. Guarantees and Indemnifications
Under the Trust’s organizational documents, its officers and trustees are indemnified by the Trust against certain liabilities arising out of the performance of their duties to the Trust. Additionally, in the normal course of business, the Trust, on behalf of the Fund, enters into contracts with service providers that contain general indemnification clauses. The Trust’s maximum exposure under these arrangements is unknown as this would involve future claims that may be made against the Trust that have not yet occurred. Currently, the Trust expects the risk of loss to be remote.
TGA-30
Franklin Templeton Variable Insurance Products Trust
Notes to Financial Statements (continued)
Templeton Global Asset Allocation Fund
2. SHARES OF BENEFICIAL INTEREST
At December 31, 2009, there were an unlimited number of shares authorized (without par value). Transactions in the Fund’s shares were as follows:
| | | | | | | | | | | | | | |
| | | Year Ended December 31, | |
| | | 2009 | | | 2008a | |
| Class 1 Shares: | | Shares | | | Amount | | | Shares | | | Amount | |
Shares sold | | 213,266 | | | $ | 1,748,254 | | | 55,105 | | | $ | 667,145 | |
Shares issued in reinvestment of distributions | | 518,705 | | | | 4,061,456 | | | 1,123,348 | | | | 12,356,827 | |
Shares redeemed | | (761,763 | ) | | | (6,236,001 | ) | | (1,111,660 | ) | | | (12,267,545 | ) |
| | | | |
Net increase (decrease) | | (29,792 | ) | | $ | (426,291 | ) | | 66,793 | | | $ | 756,427 | |
| | | | |
Class 2 Shares: | | | | | | | | | | | | | | |
Shares sold | | 765,013 | | | $ | 6,329,267 | | | 806,174 | | | $ | 9,220,122 | |
Shares issued in reinvestment of distributions | | 680,361 | | | | 5,231,976 | | | 1,464,269 | | | | 15,814,110 | |
Shares redeemed | | (1,409,785 | ) | | | (11,447,930 | ) | | (1,971,137 | ) | | | (20,733,684 | ) |
| | | | |
Net increase (decrease) | | 35,589 | | | $ | 113,313 | | | 299,306 | | | $ | 4,300,548 | |
| | | | |
Class 4 Shares: | | | | | | | | | | | | | | |
Shares sold | | — | | | $ | — | | | 351 | | | $ | 5,000 | |
| | | | |
Net increase (decrease) | | — | | | $ | — | | | 351 | | | $ | 5,000 | |
| | | | |
| aFor | the period February 29, 2008 (effective date) to December 31, 2008 for Class 4. |
3. TRANSACTIONS WITH AFFILIATES
Franklin Resources, Inc. is the holding company for various subsidiaries that together are referred to as Franklin Templeton Investments. Certain officers and trustees of the Trust are also officers and/or directors of certain of the Underlying Funds and of the following subsidiaries:
| | |
| Subsidiary | | Affiliation |
Templeton Investment Counsel, LLC (Investment Counsel) | | Investment manager |
Franklin Advisers, Inc. (Advisers) | | Investment manager |
Franklin Templeton Services, LLC (FT Services) | | Administrative manager |
Franklin Templeton Distributors, Inc. (Distributors) | | Principal underwriter |
Franklin Templeton Investor Services, LLC (Investor Services) | | Transfer agent |
a. Management Fees
The Fund pays an investment management fee to Investment Counsel based on the average daily net assets of the Fund as follows:
| | |
| Annualized Fee Rate | | Net Assets |
| 0.650% | | Up to and including $200 million |
| 0.585% | | Over $200 million, up to and including $1.3 billion |
| 0.520% | | In excess of $1.3 billion |
Under a subadvisory agreement, Advisers, an affiliate of Investment Counsel, provides subadvisory services to the Fund and receives from Investment Counsel fees based on the average daily net assets of the Fund.
TGA-31
Franklin Templeton Variable Insurance Products Trust
Notes to Financial Statements (continued)
Templeton Global Asset Allocation Fund
3. TRANSACTIONS WITH AFFILIATES (continued)
b. Administrative Fees
The Fund pays an administrative fee to FT Services based on the Fund’s average daily net assets as follows:
| | |
| Annualized Fee Rate | | Net Assets |
| 0.150% | | Up to and including $200 million |
| 0.135% | | Over $200 million, up to and including $700 million |
| 0.100% | | Over $700 million, up to and including $1.2 billion |
| 0.075% | | In excess of $1.2 billion |
c. Distribution Fees
The Fund’s Board of Trustees has adopted distribution plans for Class 2 and Class 4 shares pursuant to Rule 12b-1 under the 1940 Act. Under the Fund’s compensation distribution plans, the Fund pays Distributors for costs incurred in connection with the servicing, sale and distribution of the Fund’s shares up to 0.25% and 0.35% per year of its average daily net assets of Class 2 and Class 4, respectively.
d. Transfer Agent Fees
Investor Services, under terms of an agreement, performs shareholder servicing for the Fund and is not paid by the Fund for the services.
e. Waiver and Expense Reimbursements
FT Services has contractually agreed in advance to waive or limit its fees and to assume as its own expense certain expenses otherwise payable by the Fund so that the common expenses (i.e. a combination of management fees, administrative fees, and other expenses, but excluding distribution fees and acquired fund fees and expenses) for each class of the Fund do not exceed 0.83% (other than certain non-routine expenses or costs, including those relating to litigation, indemnification, reorganizations, and liquidations) until April 30, 2010. After April 30, 2010, FT Services may discontinue this waiver at any time upon notice to the Fund’s Board of Trustees.
4. EXPENSE OFFSET ARRANGEMENT
The Fund has entered into an arrangement with its custodian whereby credits realized as a result of uninvested cash balances are used to reduce a portion of the Fund’s custodian expenses. During the year ended December 31, 2009, the custodian fees were reduced as noted in the Statement of Operations.
5. INCOME TAXES
For tax purposes, capital losses may be carried over to offset future capital gains, if any. At December 31, 2009, the Fund had tax basis capital losses of $3,131,503 expiring in 2017.
For tax purposes, realized capital losses occurring subsequent to October 31, may be deferred and treated as occurring on the first day of the following fiscal year. At December 31, 2009, the Fund deferred realized capital losses of $430,253.
TGA-32
Franklin Templeton Variable Insurance Products Trust
Notes to Financial Statements (continued)
Templeton Global Asset Allocation Fund
5. INCOME TAXES (continued)
The tax character of distributions paid during the years ended December 31, 2009 and 2008, was as follows:
| | | | | | |
| | | 2009 | | 2008 |
Distributions paid from: | | | | | | |
Ordinary income | | $ | 8,023,314 | | $ | 13,669,367 |
Long term capital gain | | | 1,270,458 | | | 14,502,661 |
| | | |
| | $ | 9,293,772 | | $ | 28,172,028 |
| | | |
At December 31, 2009, the cost of investments, net unrealized appreciation (depreciation) and undistributed ordinary income for income tax purposes were as follows:
| | | | |
Cost of investments | | $ | 84,265,405 | |
| | | | |
| |
Unrealized appreciation | | $ | 14,920,357 | |
Unrealized depreciation | | | (6,278,942 | ) |
| | | | |
Net unrealized appreciation (depreciation) | | $ | 8,641,415 | |
| | | | |
Distributable earnings – undistributed ordinary income | | $ | 412,625 | |
| | | | |
Net investment income (loss) differs for financial statement and tax purposes primarily due to differing treatments of foreign currency transactions, bond discounts and premiums and inflation related adjustments on foreign securities.
Net realized gains (losses) differ for financial statement and tax purposes primarily due to differing treatments of foreign currency transactions and bond discounts and premiums.
6. INVESTMENT TRANSACTIONS
Purchases and sales of investments (excluding short term securities) for the year ended December 31, 2009, aggregated $12,740,026 and $19,548,097, respectively.
7. INVESTMENTS IN INSTITUTIONAL FIDUCIARY TRUST MONEY MARKET PORTFOLIO
The Fund may invest in the Institutional Fiduciary Trust Money Market Portfolio (Sweep Money Fund), an open-end investment company managed by Advisers. Management fees paid by the Fund are reduced on assets invested in the Sweep Money Fund, in an amount not to exceed the management and administrative fees paid by the Sweep Money Fund.
8. CONCENTRATION OF RISK
Investing in foreign securities may include certain risks and considerations not typically associated with investing in U.S. securities, such as fluctuating currency values and changing local and regional economic, political and social conditions, which may result in greater market volatility. In addition, certain foreign securities may not be as liquid as U.S. securities.
TGA-33
Franklin Templeton Variable Insurance Products Trust
Notes to Financial Statements (continued)
Templeton Global Asset Allocation Fund
9. OTHER DERIVATIVE INFORMATION
At December 31, 2009, the Fund has invested in derivative contracts which are reflected on the Statement of Assets and Liabilities as follows:
| | | | | | | | | | |
| | | Asset Derivatives | | Liability Derivatives |
Derivative Contracts Not Accounted
for as Hedging Instruments | | Statement of Assets and
Liabilities Location | | Fair
Value
Amount | | Statement of Assets and
Liabilities Location | | Fair
Value
Amount |
Foreign exchange contracts | | Unrealized appreciation on forward exchange contracts | | $ | 586,183 | | Unrealized depreciation on forward exchange contracts | | $ | 1,110,697 |
For the year ended December 31, 2009, the effect of derivative contracts on the Fund’s Statement of Operations was as follows:
| | | | | | | | | | | |
Derivative Contracts Not Accounted
for as Hedging Instruments | | Statement of Operations Locations | | Realized Gain
(Loss) for the
Year Ended
December 31, 2009 | | Change in
Unrealized
Appreciation
(Depreciation)
for the
Year Ended
December 31, 2009 | | | Average
Notional
Amount
Outstanding
During the
Yeara |
Foreign exchange contracts | | Net realized gain (loss) from foreign currency transactions/Net change in unrealized appreciation (depreciation) on translation of other assets and liabilities denominated in foreign currencies | | $ | 1,288,713 | | $ | (2,405,137 | ) | | 19,863,683 |
a Notional amount represents the U.S. dollar equivalent based on the foreign exchange rate at the time of contract entry.
See Note 1(c) regarding derivative financial instruments.
10. UPCOMING LIQUIDATION
On July 9, 2009, the Board of Trustees for the Templeton Global Asset Allocation Fund approved a proposal to liquidate the Fund. The Fund is scheduled to liquidate on April 30, 2010.
11. CREDIT FACILITY
The Fund, together with other U.S. registered and foreign investment funds (collectively “Borrowers”), managed by Franklin Templeton Investments, are borrowers in a joint syndicated senior unsecured credit facility totaling $725 million (Global Credit Facility) to provide a source of funds to the Borrowers for temporary and emergency purposes, including the ability to meet future unanticipated or unusually large redemption requests. Effective January 22, 2010, the Fund renewed the Global Credit Facility, for a total of $750 million, maturing January 21, 2011.
Under the terms of the Global Credit Facility, the Fund shall, in addition to interest charged on any borrowings made by the Fund and other costs incurred by the Fund, pay its share of fees and expenses incurred in connection with the implementation and maintenance of the Global Credit Facility, based upon its relative share of the aggregate net assets of all of the Borrowers, including an annual commitment fee of 0.10% based upon the unused portion of the Global Credit Facility, which is reflected in other expenses on the Statement of Operations. During the year ended December 31, 2009, the Fund did not utilize the Global Credit Facility.
TGA-34
Franklin Templeton Variable Insurance Products Trust
Notes to Financial Statements (continued)
Templeton Global Asset Allocation Fund
12. FAIR VALUE MEASUREMENTS
The Fund follow a fair value hierarchy that distinguishes between market data obtained from independent sources (observable inputs) and the Fund’s own market assumptions (unobservable inputs). These inputs are used in determining the value of the Fund’s investments and are summarized in the following fair value hierarchy:
| | • | | Level 1 – quoted prices in active markets for identical securities |
| | • | | Level 2 – other significant observable inputs (including quoted prices for similar securities, interest rates, prepayment speed, credit risk, etc.) |
| | • | | Level 3 – significant unobservable inputs (including the Fund’s own assumptions in determining the fair value of investments) |
The inputs or methodology used for valuing securities are not an indication of the risk associated with investing in those securities.
The following is a summary of the inputs used as of December 31, 2009, in valuing the Fund’s assets and liabilities carried at fair value:
| | | | | | | | | | | | |
| | | Level 1 | | Level 2 | | Level 3 | | Total |
| | | |
Assets: | | | | | | | | | | | | |
Investments in Securities | | | | | | | | | | | | |
Equity Investmentsa: | | | | | | | | | | | | |
Aerospace & Defense | | $ | 1,327,910 | | $ | — | | $ | 8,059 | | $ | 1,335,969 |
All Other Equity Investmentsb | | | 56,841,274 | | | — | | | — | | | 56,841,274 |
Foreign Government and Agency Securities | | | — | | | 32,083,449 | | | — | | | 32,083,449 |
Short Term Investments | | | 2,646,128 | | | — | | | — | | | 2,646,128 |
| | | |
Total Investments in Securities | | $ | 60,815,312 | | $ | 32,083,449 | | $ | 8,059 | | $ | 92,906,820 |
| | | |
Forward Exchange Contracts | | | — | | | 586,183 | | | — | | | 586,183 |
Liabilities: | | | | | | | | | | | | |
Forward Exchange Contracts | | | — | | | 1,110,697 | | | — | | | 1,110,697 |
aIncludes common and preferred stock.
bFor detailed industry descriptions, see the accompanying Statement of Investments.
At December 31, 2009, the reconciliation of assets in which significant unobservable inputs (Level 3) were used in determining fair value, were as follows:
| | | | | | | | | | | | | | | | | | | | | |
| | | Balance at
Beginning of
Year | | Net Realized
Gain (Loss) | | Net Change in
Unrealized
Appreciation
(Depreciation) | | Net
Purchases
(Sales) | | Transfer In (Out)
of Level 3 | | Balance at End
of Year | | Net Change in
Unrealized
Appreciation
(Depreciation)
on Assets Held
at Year End |
| | | |
Assets | | | | | | | | | | | | | | | | | | | | | |
Aerospace & Defense | | $ | — | | $ | — | | $ | — | | $ | — | | $ | 8,059 | | $ | 8,059 | | $ | — |
TGA-35
Franklin Templeton Variable Insurance Products Trust
Notes to Financial Statements (continued)
Templeton Global Asset Allocation Fund
13. NEW ACCOUNTING PRONOUNCEMENTS
In January 2010, the Financial Accounting Standards Board issued Accounting Standards Update (ASU) No. 2010-6, Fair Value Measurements and Disclosures (Topic 820): Improving Disclosures about Fair Value Measurements. ASU No. 2010-6 enhances and clarifies existing fair value measurement disclosure requirements and is effective for interim and annual periods beginning after December 15, 2009. The Fund is currently evaluating the impact, if any, of applying the provisions of ASU No. 2010-6.
14. SUBSEQUENT EVENTS
The Fund has evaluated subsequent events through February 10, 2010, the issuance date of the financial statements and determined that no events have occurred that require disclosure.
ABBREVIATIONS
Counterparty
BOFA - Bank of America N.A
BZWS - Barclays Bank PLC
CITI - Citibank N.A.
DBAB - Deutsche Bank AG
FBCO - Credit Suisse International
HSBC - HSBC Bank USA
JPHQ - JPMorgan Chase Bank, N.A.
UBSW - UBS AG
Currency
AUD - Australian Dollar
BRL - Brazilian Real
EUR - Euro
IDR - Indonesian Rupiah
JPY - Japanese Yen
KRW - South Korean Won
MXN - Mexican Peso
MYR - Malaysian Ringgit
NZD - New Zealand Dollar
PLN - Polish Zloty
SEK - Swedish Krona
Selected Portfolio
ADR - American Depository Receipt
FRN - Floating Rate Note
TGA-36
Franklin Templeton Variable Insurance Products Trust
Templeton Global Asset Allocation Fund
Report of Independent Registered Public Accounting Firm
To the Board of Trustees and Shareholders of
Franklin Templeton Variable Insurance Products Trust
In our opinion, the accompanying statement of assets and liabilities, including the statement of investments, and the related statements of operations and of changes in net assets and the financial highlights present fairly, in all material respects, the financial position of Templeton Global Asset Allocation Fund (one of the funds constituting the Franklin Templeton Variable Insurance Products Trust, hereafter referred to as the “Fund”) at December 31, 2009, the results of its operations for the year then ended, the changes in its net assets and the financial highlights for the periods presented, in conformity with accounting principles generally accepted in the United States of America. These financial statements and financial highlights (hereafter referred to as “financial statements”) are the responsibility of the Fund’s management. Our responsibility is to express an opinion on these financial statements based on our audits. We conducted our audits of these financial statements in accordance with the standards of the Public Company Accounting Oversight Board (United States). Those standards require that we plan and perform the audit to obtain reasonable assurance about whether the financial statements are free of material misstatement. An audit includes examining, on a test basis, evidence supporting the amounts and disclosures in the financial statements, assessing the accounting principles used and significant estimates made by management, and evaluating the overall financial statement presentation. We believe that our audits, which included confirmation of securities at December 31, 2009 by correspondence with the custodian and brokers, provide a reasonable basis for our opinion.
As more fully described in Note 10, the Fund’s Board of Trustees approved a proposal to liquidate the Fund on April 30, 2010.
PricewaterhouseCoopers LLP
San Francisco, California
February 10, 2010
TGA-37
Franklin Templeton Variable Insurance Products Trust
Tax Designation (unaudited)
Templeton Global Asset Allocation Fund
Under Section 852(b)(3)(C) of the Internal Revenue Code (Code), the Fund designates the maximum amount allowable but no less than $1,270,458 as a long term capital gain dividend for the fiscal year ended December 31, 2009.
Under Section 854(b)(2) of the Code, the Fund designates 3.92% of the ordinary income dividends as income qualifying for the dividends received deduction for the fiscal year ended December 31, 2009.
At December 31, 2009, more than 50% of the Fund’s total assets were invested in securities of foreign issuers. In most instances, foreign taxes were withheld from income paid to the Fund on these investments. The Fund elects to treat foreign taxes paid as allowed under Section 853 of the Code. This election will allow shareholders of record as of the 2010 distribution date, to treat their proportionate share of foreign taxes paid by the Fund as having been paid directly by them. The shareholder shall consider these amounts as foreign taxes paid in the tax year in which they receive the Fund distribution.
TGA-38
TEMPLETON GLOBAL BOND SECURITIES FUND
(TEMPLETON GLOBAL INCOME SECURITIES FUNDBEFORE MAY 1, 2009)
We are pleased to bring you Templeton Global Bond Securities Fund’s annual report for the fiscal year ended December 31, 2009.
Performance Summary as of 12/31/09
Average annual total return of Class 4 shares* represents the average annual change in value, assuming reinvestment of dividends and capital gains. Average returns smooth out variations in returns, which can be significant; they are not the same as year-by-year results.
Periods ended 12/31/09
| | | | | | |
| | | 1-Year | | 5-Year | | 10-Year |
Average Annual Total Return | | +18.58% | | +9.00% | | +10.94% |
*For the period beginning 2/29/08, Class 4 performance reflects a 12b-1 fee expense of 0.35% per year, which affects future performance. Class 4 performance prior to 2/29/08 reflects historical Class 1 performance, which does not include a 12b-1 fee expense. Since 2/29/08 (effective date), the average annual total return of Class 4 shares was +9.87%.
Total Return Index Comparison for a Hypothetical $10,000 Investment (1/1/00–12/31/09)
The graph below shows the change in value of a hypothetical $10,000 investment in the Fund over the indicated period and includes reinvestment of any income or distributions. The Fund’s performance* is compared to the performance of the J.P. Morgan (JPM) Global Government Bond Index (GGBI), the Citigroup World Government Bond Index (WGBI) and the Consumer Price Index (CPI). One cannot invest directly in an index, and an index is not representative of the Fund’s portfolio. Please see Important Notes to Performance Information preceding the Fund Summaries.
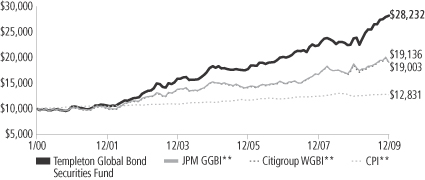
**Source: © 2009 Morningstar. Please see Index Descriptions following the Fund Summaries.
Templeton Global Bond Securities Fund – Class 4
Performance reflects the Fund’s Class 4 operating expenses, but does not include any contract fees, expenses or sales charges. If they had been included, performance would be lower. These charges and deductions, particularly for variable life policies, can have a significant effect on contract values and insurance benefits. See the contract prospectus for a complete description of these expenses, including sales charges.
Performance data represent past performance, which does not guarantee future results. Investment return and principal value will fluctuate, and you may have a gain or loss when you sell your shares.
Current performance may differ from figures shown.
TGB-1
Fund Goal and Main Investments: Templeton Global Bond Securities Fund seeks high current income, consistent with preservation of capital, with capital appreciation as a secondary consideration. The Fund normally invests at least 80% of its net assets in bonds, which include debt securities of any maturity. The Fund normally invests at least 40% of its net assets in foreign securities, and may invest a portion of its total assets in bonds rated below investment grade and a significant portion of its assets in emerging markets.
Performance Overview
You can find the Fund’s one-year total return in the Performance Summary. The Fund outperformed its benchmarks, the JPM GGBI, which had a +1.90% total return in U.S. dollar terms for the year under review, and the Citigroup WGBI, which had a +2.55% total return for the same period.1
Economic and Market Overview
After a dismal beginning, 2009 ended on a positive note for global financial markets. The extreme pessimism present at the height of the crisis early in the year subsided, fueling a general rally across risk assets. As the differences between economic conditions around the world became clearer later in the year, markets began to differentiate between currencies and securities.
During the first quarter of the year, as the financial crisis reached its height, nearly all currencies sold off against the U.S. dollar, the Japanese yen and the Swiss franc, and sovereign credit spreads remained at historically wide levels. For much of the rest of the year, currency and credit exposures had a broad-based rally as the U.S. dollar fell indiscriminately and sovereign credit spreads declined from distressed levels. At year-end, particularly in December, the market began to price in a higher degree of differentiation. The indiscriminate rally lost steam and many assets traded sideways.
The U.S. labor market remained quite weak although it showed signs of improving toward the end of the year. The unemployment rate reached an almost 20-year high of 10.2% in October before declining to 10.0% in November.2 The housing market also showed signs of stabilizing as pending home sales recorded gains in September and October and in some areas, home prices increased each month since May. In the
Fund Risks: Because the Fund invests in bonds and other debt obligations, its share price and yield will be affected by interest rate movements. Bond prices generally move in the opposite direction of interest rates. Thus, as prices of bonds in the Fund adjust to a rise in interest rates, the Fund’s share price may decline. High yield, lower rated (junk) bonds generally have greater price swings and higher default risks than investment-grade bonds. Foreign investing, especially in emerging markets, involves additional risks, including currency fluctuations, economic instability, market volatility, and political and social instability. The Fund’s prospectus also includes a description of the main investment risks.
TGB-2
1. Source: © 2009 Morningstar. One cannot invest directly in an index, and an index is not representative of the Fund’s portfolio. Please see Index Descriptions following the Fund Summaries.
2. Source: Bureau of Labor Statistics.
eurozone, third quarter gross domestic product improved relative to the second quarter but contracted 4.1% in annualized terms.3 A recovery in global trade, rebuilding of inventories and government spending in the third quarter helped offset weakness in private consumption and investment.
The Dubai World debt standstill and Greece credit downgrade grabbed headlines toward the end of the period, but other overleveraged credits also suffered. Investors recognized that these economies faced very difficult economic outlooks even as the global economy began to recover. In contrast, data from Asian emerging markets as well as certain developed and Latin American countries confirmed their economies were improving. Some economies experienced robust domestic demand, but others lacked sustainable growth drivers and continued to struggle with deleveraging. This differentiation favored some currencies and drove interest rates higher in certain economies.
One important outcome from the recognition of economic differentiation in December was the U.S. dollar’s rise against the Japanese yen. In December, a more optimistic outlook for the U.S. economy led government bond yields to rise. At the same time, Japanese domestic demand remained very weak, the economy was still in deflation, and prospects for interest rate hikes appeared remote. This led to an increase in the interest rate differential between the U.S. and Japan, which favored the U.S. dollar.
Investment Strategy
We allocate the Fund’s assets among issuers, geographic regions, and currencies based upon our assessment of relative interest rates among currencies, our outlook for changes in interest rates and currencies, and credit risks. In considering these factors, we may evaluate a country’s changing market, economic and political conditions, such as inflation rate, growth prospects, global trade patterns and government policies. We seek to manage the Fund’s exposure to various currencies and may utilize forward currency exchange contracts.
Manager’s Discussion
The Fund’s total return for the reporting period was influenced by various factors, including interest rate developments, currency movements, and exposure to sovereign debt markets.
3. Source: Eurostat.
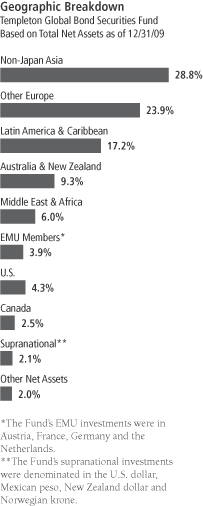
TGB-3
During the year under review, market volatility enabled us to build positions in currencies such as the Brazilian real and South Korean won at levels not reached since previous crises, even though their underlying fundamentals were much stronger than those in past periods. We sought to capitalize on similar opportunities in duration and sovereign credit exposures. We felt the positions we built at distressed levels had strong underlying fundamentals and they provided the base for the Fund’s double-digit returns. More importantly, this meant that we were not exposed to the blowups that took place in specific markets.
Interest Rate Strategy
In the beginning of 2009, developed economies undertook their final interest rate cuts to counter the global recession. Although target interest rates fell 150 basis points (100 basis points equal one percentage point) in the eurozone and the U.K. during the year, and were unchanged at historical lows in the U.S. and Japan, government bond yields rose across the majority of developed economies as the economic outlook improved and high fiscal deficits led to increased government bond issuance. Despite policymakers’ efforts to reassure markets they would maintain historically loose monetary policy for an extended period, attention increasingly shifted to how monetary stimulus eventually would be unwound. This led to steepening yield curves in developed countries. Even in an environment of generally rising government bond yields, the Fund’s duration exposure contributed positively to relative and absolute returns largely through its selective duration exposure in countries like Indonesia and Chile and lack of exposure to U.S. Treasuries and Japanese government bonds. Government bond yields in these nondeveloped economies had lagged the rally in core developed government bonds. The Fund sought to take advantage of this risk aversion-fueled underperformance to build positions in economies we feel have strong fundamentals that could allow for significant monetary policy easing to cushion the impact of the global recession. Toward period-end, we took profits in several such duration positions where interest rates had fallen to historical lows, and where we viewed an economic recovery as being likely, such as in South Korea and Chile. However, we continued to see the potential for lower long-term government bond yields in a select few credits such as Indonesia and Brazil, where we believed aggressive interest rate hikes were already priced in and where improved monetary and fiscal policy would likely lower the risk premium embedded in long-term government bonds.
Currency Breakdown
Templeton Global Bond Securities Fund
12/31/09
| | |
| | | % of Total
Net Assets |
| |
Americas | | 60.5% |
U.S. Dollar | | 41.4% |
Mexican Peso | | 7.0% |
Brazilian Real | | 5.6% |
Chilean Peso | | 4.9% |
Peruvian Nuevo Sol | | 1.6% |
| |
Asia Pacific | | 32.7% |
South Korean Won | | 14.1% |
Malaysian Ringgit | | 10.4% |
Australian Dollar | | 7.6% |
Indonesian Rupiah | | 6.9% |
Indian Rupee | | 6.0% |
Philippine Peso | | 4.7% |
Chinese Yuan | | 4.1% |
Sri Lankan Rupee | | 1.8% |
New Zealand Dollar* | | -8.8% |
Japanese Yen* | | -14.1% |
| |
Europe | | 4.2% |
Swedish Krona | | 9.4% |
Polish Zloty | | 6.6% |
Norwegian Krone | | 5.0% |
Euro* | | -16.8% |
| |
Middle East & Africa | | 2.6% |
Israeli New Shekel | | 2.6% |
*Euro = -16.8%, Japanese yen = -14.1% and New Zealand dollar = -8.8% due to forward exchange contracts.
The dollar value, number of shares or principal amount, and names of all portfolio holdings are listed in the Fund’s Statement of Investments.
What is duration?
Duration is a measure of a bond’s price sensitivity to interest rate changes. In general, a portfolio of securities with a lower duration can be expected to be less sensitive to interest rate changes than a portfolio with a higher duration.
TGB-4
Currency Strategy
The Fund’s diverse, actively managed currency exposure provided strong returns during the year. The U.S. dollar fell 5.87% against its major trading partners due to the recovery in risk appetite and exceptionally loose monetary and fiscal policy.4 The U.S. dollar weakened against the majority of Latin American currencies as these countries benefited from improved economic outlooks and prospects for economic recoveries before those in the developed world. The Fund benefited from its Brazilian real position as the real appreciated 33.78% versus the U.S. dollar during the year.5 Brazil’s domestic demand-led economy was the most resilient among the large regional economies. Outside of Brazil, the Fund also benefited from exposures to the Mexican peso and Chilean peso.
The Fund’s net negative euro exposure benefited relative performance as well. Our analysis indicated the euro was overvalued near its peak in 2008. The market had priced in a situation where the U.S. would suffer a recession but Europe would decouple, which we considered unlikely. Despite large swings in the euro’s value during the year, it closed only 3.22% stronger against the U.S. dollar.5 Eurozone economic recovery began, although the pace moderated in the fourth quarter. Given the eurozone’s relatively slow recovery, investors became concerned regarding the sustainability of debt dynamics of some of the less developed eurozone countries such as Greece. Differentiation was also present in non-euro European countries, as Scandinavian and Polish economies were relatively strong and the Fund’s exposure to these peripheral currencies benefited its relative performance. Norway was one of the first economies to begin tightening monetary policy with interest rate hikes in October and December. Israel also increased interest rates, although our recently added exposure to the shekel detracted marginally. The outlook for strong recoveries in these economies made the exceptionally loose monetary policy inappropriate well ahead of the U.K. or eurozone.
Asian currencies benefited the Fund’s relative and absolute returns. We believe recent economic data, such as accelerating economic activity and resilient domestic demand, largely confirmed our view that the
4. Source: Federal H10 Report.
5. Source: IDC/Exshare.
TGB-5
region would likely continue to show strong growth relative to other parts of the world. Inflation remained low throughout the region even as gaps between supply and demand began to close. This allowed governments to generally maintain their stimulus policies. However, there were some signs that policymakers were beginning to lean toward tightening as several countries took steps to limit property price appreciation, and Australia raised interest rates. The Fund’s returns benefited from large exposures to the South Korean won and Indonesian rupiah, which appreciated 8.16% and 16.02% against the U.S. dollar.5 We added to these positions at distressed levels early in the year, and then benefited as the market priced in what we considered more appropriate valuations based on their robust fundamentals. Such gains were only partially offset by losses from our negative exposures to the New Zealand dollar and Singapore dollar. We added these positions as partial risk hedges during the year in case of a return of risk aversion, which did not materialize. The correlation between the interest rate differential and exchange rate of the U.S. with Japan has been strong historically, and we expect it to continue going forward due to large portfolio flows and corporate hedging activities. Thus, we positioned the Fund to benefit if government bond yields rise in the U.S. through a net negative exposure to the Japanese yen. This strategy contributed strongly toward the end of the year, but yen exposure for the year as a whole still marginally detracted.
Global Sovereign Debt Strategy
The Fund’s outperformance during the period benefited significantly from its sovereign credit exposure, an area where we had very little exposure before the sell-off in 2008. Valuations for credit exposure improved significantly during the crisis, allowing us to add exposure to countries with strong underlying fundamentals at distressed levels. Emerging sovereign credit provided exceptionally strong returns during the year as spreads compressed from the historically high levels at the height of the crisis. Despite this exceptional performance, we found what we considered attractive opportunities as relative fundamentals continued to favor emerging markets. Emerging markets, especially in Asia, experienced stronger relative growth as they were not plagued to the same extent by the causes of the financial crisis, particularly an overreliance on leverage. They remained creditors to the rest of the world and received increasing capital inflows due to higher available returns. Their better outlooks also meant that policy responses did not need to be as aggressive, which led to lower government deficits and smaller increases in public debt burdens relative to the developed world.
TGB-6
Furthermore, a slower growth environment reopened the need for financing by some sovereigns with solid credit fundamentals. These sovereigns had not come to the markets in several years and could provide additional investment opportunities.
Thank you for your participation in Templeton Global Bond Securities Fund. We look forward to serving your future investment needs.
The foregoing information reflects our analysis, opinions and portfolio holdings as of December 31, 2009, the end of the reporting period. The way we implement our main investment strategies and the resulting portfolio holdings may change depending on factors such as market and economic conditions. These opinions may not be relied upon as investment advice or an offer for a particular security. The information is not a complete analysis of every aspect of any market, country, industry, security or the Fund. Statements of fact are from sources considered reliable, but the investment manager makes no representation or warranty as to their completeness or accuracy. Although historical performance is no guarantee of future results, these insights may help you understand our investment management philosophy.
TGB-7
Fund Expenses
As an investor in a variable insurance contract (Contract) that indirectly provides for investment in an underlying mutual fund, you can incur transaction and/or ongoing expenses at both the Fund level and the Contract level.
| • | | Transaction expenses can include sales charges (loads) on purchases, redemption fees, surrender fees, transfer fees and premium taxes. |
| • | | Ongoing expenses can include management fees, distribution and service (12b-1) fees, contract fees, annual maintenance fees, mortality and expense risk fees and other fees and expenses. All mutual funds and Contracts have some types of ongoing expenses. |
The expenses shown in the table are meant to highlight ongoing expenses at the Fund level only and do not include ongoing expenses at the Contract level, or transaction expenses at either the Fund or Contract level. While the Fund does not have transaction expenses, if the transaction and ongoing expenses at the Contract level were included, the expenses shown below would be higher. You should consult your Contract prospectus or disclosure document for more information.
The table shows Fund-level ongoing expenses and can help you understand these expenses and compare them with those of other mutual funds offered through the Contract. The table assumes a $1,000 investment held for the six months indicated. Please refer to the Fund prospectus for additional information on operating expenses.
Actual Fund Expenses
The first line (Actual) of the table provides actual account values and expenses. The “Ending Account Value” is derived from the Fund’s actual return, which includes the effect of ongoing Fund expenses, but does not include the effect of ongoing Contract expenses.
You can estimate the Fund-level expenses you incurred during the period by following these steps. Of course, your account value and expenses will differ from those in this illustration:
| 1. | Divide your account value by $1,000. |
If an account had an $8,600 value, then $8,600 ÷ $1,000 = 8.6.
| 2. | Multiply the result by the number under the heading “Fund-Level Expenses Incurred During Period.” |
If Fund-Level Expenses Incurred During Period were $7.50, then 8.6 x $7.50 = $64.50.
In this illustration, the estimated expenses incurred this period at the Fund level are $64.50.
Templeton Global Bond Securities Fund – Class 4
TGB-8
Hypothetical Example for Comparison with Other Mutual Funds
Information in the second line (Hypothetical) of the table can help you compare ongoing expenses of the Fund with those of other mutual funds offered through the Contract. This information may not be used to estimate the actual ending account balance or expenses you incurred during the period. The hypothetical “Ending Account Value” is based on the Fund’s actual expense ratio for each class and an assumed 5% annual rate of return before expenses, which does not represent the Fund’s actual return. The figure under the heading “Fund-Level Expenses Incurred During Period” shows the hypothetical expenses your account would have incurred under this scenario. You can compare this figure with the 5% hypothetical examples that appear in shareholder reports of other funds offered through a Contract.
| | | | | | | | | |
| Class 4 | | Beginning
Account Value 7/1/09 | | Ending
Account Value 12/31/09 | | Fund-Level Expenses Incurred During Period* 7/1/09–12/31/09 |
Actual | | $ | 1,000 | | $ | 1,104.10 | | $ | 4.61 |
Hypothetical (5% return before expenses) | | $ | 1,000 | | $ | 1,020.82 | | $ | 4.43 |
*Expenses are calculated using the most recent six-month annualized expense ratio, for the Fund’s Class 4 shares (0.87%), which does not include any ongoing expenses of the Contract for which the Fund is an investment option, multiplied by the average account value over the period, multiplied by 184/365 to reflect the one-half year period.
TGB-9
Franklin Templeton Variable Insurance Products Trust
Financial Highlights
Templeton Global Bond Securities Fund
| | | | | | | | | | | | | | | | | | | | |
| | | Year Ended December 31, | |
| Class 1 | | 2009 | | | 2008 | | | 2007 | | | 2006 | | | 2005 | |
| | | | |
Per share operating performance | | | | | | | | | | | | | | | | | | | | |
(for a share outstanding throughout the year) | | | | | | | | | | | | | | | | | | | | |
Net asset value, beginning of year | | $ | 17.42 | | | $ | 17.00 | | | $ | 15.73 | | | $ | 14.36 | | | $ | 15.80 | |
| | | | |
Income from investment operationsa: | | | | | | | | | | | | | | | | | | | | |
Net investment incomeb | | | 0.99 | | | | 0.80 | | | | 0.77 | | | | 0.61 | | | | 0.57 | |
Net realized and unrealized gains (losses) | | | 2.01 | | | | 0.27 | | | | 0.97 | | | | 1.24 | | | | (1.03 | ) |
| | | | |
Total from investment operations | | | 3.00 | | | | 1.07 | | | | 1.74 | | | | 1.85 | | | | (0.46 | ) |
| | | | |
Less distributions from net investment income and net foreign currency gains | | | (2.70 | ) | | | (0.65 | ) | | | (0.47 | ) | | | (0.48 | ) | | | (0.98 | ) |
| | | | |
Redemption feesc | | | — | | | | — | | | | — | | | | — | | | | — | |
| | | | |
Net asset value, end of year | | $ | 17.72 | | | $ | 17.42 | | | $ | 17.00 | | | $ | 15.73 | | | $ | 14.36 | |
| | | | |
| | | | | |
Total returnd | | | 18.98% | | | | 6.46% | | | | 11.27% | | | | 13.14% | | | | (2.91)% | |
Ratios to average net assets | | | | | | | | | | | | | | | | | | | | |
Expenses before expense reduction | | | 0.54% | | | | 0.58% | | | | 0.64% | | | | 0.80% | | | | 0.78% | |
Expenses net of expense reduction | | | 0.54% | e | | | 0.58% | e | | | 0.64% | e | | | 0.72% | | | | 0.74% | |
Net investment income | | | 5.73% | | | | 4.66% | | | | 4.70% | | | | 4.09% | | | | 3.81% | |
| | | | | |
Supplemental data | | | | | | | | | | | | | | | | | | | | |
Net assets, end of year (000’s) | | $ | 195,662 | | | $ | 220,588 | | | $ | 137,700 | | | $ | 75,843 | | | $ | 53,115 | |
Portfolio turnover rate | | | 20.84% | | | | 28.46% | | | | 47.33% | | | | 30.65% | | | | 30.28% | |
aThe amount shown for a share outstanding throughout the period may not correlate with the Statement of Operations for the period due to the timing of sales and repurchases of the Fund shares in relation to income earned and/or fluctuating market value of the investments of the Fund.
bBased on average daily shares outstanding.
cAmount rounds to less than $0.01 per share.
dTotal return does not include any fees, charges or expenses imposed by the variable annuity and life insurance contracts for which the Franklin Templeton Variable Insurance Products Trust serves as an underlying investment vehicle.
eBenefit of expense reduction rounds to less than 0.01%.
The accompanying notes are an integral part of these financial statements.
TGB-10
Franklin Templeton Variable Insurance Products Trust
Financial Highlights (continued)
Templeton Global Bond Securities Fund
| | | | | | | | | | | | | | | | | | | | |
| | | Year Ended December 31, | |
| Class 2 | | 2009 | | | 2008 | | | 2007 | | | 2006 | | | 2005 | |
| | | | |
Per share operating performance | | | | | | | | | | | | | | | | | | | | |
(for a share outstanding throughout the year) | | | | | | | | | | | | | | | | | | | | |
Net asset value, beginning of year | | $ | 17.10 | | | $ | 16.72 | | | $ | 15.50 | | | $ | 14.19 | | | $ | 15.64 | |
| | | | |
Income from investment operationsa: | | | | | | | | | | | | | | | | | | | | |
Net investment incomeb | | | 0.93 | | | | 0.74 | | | | 0.72 | | | | 0.57 | | | | 0.52 | |
Net realized and unrealized gains (losses) | | | 1.98 | | | | 0.27 | | | | 0.96 | | | | 1.21 | | | | (1.00 | ) |
| | | | |
Total from investment operations | | | 2.91 | | | | 1.01 | | | | 1.68 | | | | 1.78 | | | | (0.48 | ) |
| | | | |
Less distributions from net investment income and net foreign currency gains | | | (2.67 | ) | | | (0.63 | ) | | | (0.46 | ) | | | (0.47 | ) | | | (0.97 | ) |
| | | | |
Redemption feesc | | | — | | | | — | | | | — | | | | — | | | | — | |
| | | | |
Net asset value, end of year | | $ | 17.34 | | | $ | 17.10 | | | $ | 16.72 | | | $ | 15.50 | | | $ | 14.19 | |
| | | | |
| | | | | |
Total returnd | | | 18.68% | | | | 6.21% | | | | 11.00% | | | | 12.77% | | | | (3.08)% | |
Ratios to average net assets | | | | | | | | | | | | | | | | | | | | |
Expenses before expense reduction | | | 0.79% | | | | 0.83% | | | | 0.89% | | | | 1.05% | | | | 1.03% | |
Expenses net of expense reduction | | | 0.79% | e | | | 0.83% | e | | | 0.89% | e | | | 0.97% | | | | 0.99% | |
Net investment income | | | 5.48% | | | | 4.41% | | | | 4.45% | | | | 3.84% | | | | 3.56% | |
| | | | | |
Supplemental data | | | | | | | | | | | | | | | | | | | | |
Net assets, end of year (000’s) | | $ | 1,262,783 | | | $ | 793,881 | | | $ | 480,649 | | | $ | 205,768 | | | $ | 61,255 | |
Portfolio turnover rate | | | 20.84% | | | | 28.46% | | | | 47.33% | | | | 30.65% | | | | 30.28% | |
aThe amount shown for a share outstanding throughout the period may not correlate with the Statement of Operations for the period due to the timing of sales and repurchases of the Fund shares in relation to income earned and/or fluctuating market value of the investments of the Fund.
bBased on average daily shares outstanding.
cAmount rounds to less than $0.01 per share.
dTotal return does not include any fees, charges or expenses imposed by the variable annuity and life insurance contracts for which the Franklin Templeton Variable Insurance Products Trust serves as an underlying investment vehicle.
eBenefit of expense reduction rounds to less than 0.01%.
The accompanying notes are an integral part of these financial statements.
TGB-11
Franklin Templeton Variable Insurance Products Trust
Financial Highlights (continued)
Templeton Global Bond Securities Fund
| | | | | | | | | | | | | | | | | | | | |
| | | Year Ended December 31, | |
| Class 3 | | 2009 | | | 2008 | | | 2007 | | | 2006 | | | 2005a | |
| | | | |
Per share operating performance | | | | | | | | | | | | | | | | | | | | |
(for a share outstanding throughout the year) | | | | | | | | | | | | | | | | | | | | |
Net asset value, beginning of year | | $ | 17.08 | | | $ | 16.70 | | | $ | 15.49 | | | $ | 14.18 | | | $ | 15.27 | |
| | | | |
Income from investment operationsb: | | | | | | | | | | | | | | | | | | | | |
Net investment incomec | | | 0.93 | | | | 0.74 | | | | 0.72 | | | | 0.58 | | | | 0.38 | |
Net realized and unrealized gains (losses) | | | 1.98 | | | | 0.27 | | | | 0.95 | | | | 1.21 | | | | (0.50 | ) |
| | | | |
Total from investment operations | | | 2.91 | | | | 1.01 | | | | 1.67 | | | | 1.79 | | | | (0.12 | ) |
| | | | |
Less distributions from net investment income and net foreign currency gains | | | (2.66 | ) | | | (0.63 | ) | | | (0.46 | ) | | | (0.48 | ) | | | (0.97 | ) |
| | | | |
Redemption feesd | | | — | | | | — | | | | — | | | | — | | | | — | |
| | | | |
Net asset value, end of year | | $ | 17.33 | | | $ | 17.08 | | | $ | 16.70 | | | $ | 15.49 | | | $ | 14.18 | |
| | | | |
| | | | | |
Total returne | | | 18.69% | | | | 6.21% | | | | 11.03% | | | | 12.84% | | | | (0.80)% | |
Ratios to average net assetsf | | | | | | | | | | | | | | | | | | | | |
Expenses before expense reduction | | | 0.79% | | | | 0.83% | | | | 0.89% | | | | 1.05% | | | | 1.03% | |
Expenses net of expense reduction | | | 0.79% | g | | | 0.83% | g | | | 0.89% | g | | | 0.97% | | | | 0.99% | |
Net investment income | | | 5.48% | | | | 4.41% | | | | 4.45% | | | | 3.84% | | | | 3.56% | |
| | | | | |
Supplemental data | | | | | | | | | | | | | | | | | | | | |
Net assets, end of year (000’s) | | $ | 143,264 | | | $ | 128,155 | | | $ | 91,162 | | | $ | 35,572 | | | $ | 5,769 | |
Portfolio turnover rate | | | 20.84% | | | | 28.46% | | | | 47.33% | | | | 30.65% | | | | 30.28% | |
aFor the period April 1, 2005 (effective date) to December 31, 2005.
bThe amount shown for a share outstanding throughout the period may not correlate with the Statement of Operations for the period due to the timing of sales and repurchases of the Fund shares in relation to income earned and/or fluctuating market value of the investments of the Fund.
cBased on average daily shares outstanding.
dAmount rounds to less than $0.01 per share.
eTotal return does not include any fees, charges or expenses imposed by the variable annuity and life insurance contracts for which the Franklin Templeton Variable Insurance Products Trust serves as an underlying investment vehicle. Total return is not annualized for periods less than one year.
fRatios are annualized for periods less than one year.
gBenefit of expense reduction rounds to less than 0.01%.
The accompanying notes are an integral part of these financial statements.
TGB-12
Franklin Templeton Variable Insurance Products Trust
Financial Highlights (continued)
Templeton Global Bond Securities Fund
| | | | | | | | |
| | | Year Ended December 31, | |
| Class 4 | | 2009 | | | 2008a | |
| | | | |
Per share operating performance | | | | | | | | |
(for a share outstanding throughout the year) | | | | | | | | |
Net asset value, beginning of year | | $ | 17.37 | | | $ | 18.00 | |
| | | | |
Income from investment operationsb: | | | | | | | | |
Net investment incomec | | | 0.93 | | | | 0.66 | |
Net realized and unrealized gains (losses) | | | 2.00 | | | | (0.64 | ) |
| | | | |
Total from investment operations | | | 2.93 | | | | 0.02 | |
| | | | |
Less distributions from net investment income and net foreign currency gains | | | (2.69 | ) | | | (0.65 | ) |
| | | | |
Redemption feesd | | | — | | | | — | |
| | | | |
Net asset value, end of year | | $ | 17.61 | | | $ | 17.37 | |
| | | | |
| | |
Total returne | | | 18.58% | | | | 0.26% | |
Ratios to average net assetsf | | | | | | | | |
Expensesg | | | 0.89% | | | | 0.93% | |
Net investment income | | | 5.38% | | | | 4.31% | |
| | |
Supplemental data | | | | | | | | |
Net assets, end of year (000’s) | | $ | 108,910 | | | $ | 43,069 | |
Portfolio turnover rate | | | 20.84% | | | | 28.46% | |
aFor the period February 29, 2008 (effective date) to December 31, 2008.
bThe amount shown for a share outstanding throughout the period may not correlate with the Statement of Operations for the period due to the timing of sales and repurchases of the Fund shares in relation to income earned and/or fluctuating market value of the investments of the Fund.
cBased on average daily shares outstanding.
dAmount rounds to less than $0.01 per share.
eTotal return does not include any fees, charges or expenses imposed by the variable annuity and life insurance contracts for which the Franklin Templeton Variable Insurance Products Trust serves as an underlying investment vehicle. Total return is not annualized for periods less than one year.
fRatios are annualized for periods less than one year.
gBenefit of expense reduction rounds to less than 0.01%.
The accompanying notes are an integral part of these financial statements.
TGB-13
Franklin Templeton Variable Insurance Products Trust
Statement of Investments, December 31, 2009
| | | | | | |
| Templeton Global Bond Securities Fund | | Principal Amounta | | | Value |
Foreign Government and Agency Securities 92.6% | | | | | | |
Argentina 2.2% | | | | | | |
b,cGovernment of Argentina, senior bond, FRN, 0.943%, 8/03/12 | | 107,485,000 | | | $ | 37,028,582 |
| | | | | | |
Australia 9.3% | | | | | | |
Government of Australia, TB123, 5.75%, 4/15/12 | | 43,700,000 | AUD | | | 40,128,944 |
New South Wales Treasury Corp.,
6.00%, 5/01/12 | | 13,180,000 | AUD | | | 12,067,978 |
senior note, 5.50%, 3/01/17 | | 32,225,000 | AUD | | | 27,977,586 |
Queensland Treasury Corp.,
11, 6.00%, 6/14/11 | | 22,050,000 | AUD | | | 20,148,919 |
13, 6.00%, 8/14/13 | | 24,450,000 | AUD | | | 22,354,307 |
17, 6.00%, 9/14/17 | | 13,160,000 | AUD | | | 11,735,449 |
d144A, 7.125%, 9/18/17 | | 33,340,000 | NZD | | | 25,125,567 |
| | | | | | |
| | | | | | 159,538,750 |
| | | | | | |
Austria 0.0%e | | | | | | |
dGovernment of Austria, senior bond, 144A, 5.00%, 7/15/12 | | 400,000 | EUR | | | 617,510 |
| | | | | | |
Brazil 4.6% | | | | | | |
Nota Do Tesouro Nacional,
10.00%, 1/01/12 | | 38,245 | f BRL | | | 21,251,165 |
10.00%, 1/01/14 | | 7,100 | f BRL | | | 3,751,428 |
10.00%, 1/01/17 | | 22,490 | f BRL | | | 11,070,574 |
gIndex Linked, 6.00%, 5/15/11 | | 2,055 | f BRL | | | 2,209,735 |
gIndex Linked, 6.00%, 5/15/15 | | 27,735 | f BRL | | | 28,823,766 |
gIndex Linked, 6.00%, 5/15/45 | | 10,825 | f BRL | | | 10,933,107 |
| | | | | | |
| | | | | | 78,039,775 |
| | | | | | |
Canada 2.5% | | | | | | |
Province of Manitoba, 6.375%, 9/01/15 | | 39,310,000 | NZD | | | 28,369,975 |
Province of Ontario, 6.25%, 6/16/15 | | 20,165,000 | NZD | | | 14,806,671 |
| | | | | | |
| | | | | | 43,176,646 |
| | | | | | |
France 1.8% | | | | | | |
Government of France, 4.25%, 10/25/17 | | 20,450,000 | EUR | | | 31,243,208 |
| | | | | | |
Germany 1.0% | | | | | | |
KfW Bankengruppe, senior note, 6.375%, 2/17/15 | | 8,730,000 | NZD | | | 6,489,576 |
Landwirtschaftliche Rentenbank, senior note, 8.50%, 2/22/16 | | 137,707,000 | MXN | | | 10,694,959 |
| | | | | | |
| | | | | | 17,184,535 |
| | | | | | |
Hungary 1.9% | | | | | | |
Government of Hungary,
3.50%, 7/18/16 | | 1,055,000 | EUR | | | 1,407,794 |
4.375%, 7/04/17 | | 5,380,000 | EUR | | | 7,519,915 |
5.75%, 6/11/18 | | 13,795,000 | EUR | | | 20,458,136 |
senior note, 3.875%, 2/24/20 | | 3,120,000 | EUR | | | 3,943,059 |
| | | | | | |
| | | | | | 33,328,904 |
| | | | | | |
Indonesia 8.9% | | | | | | |
Government of Indonesia,
FR20, 14.275%, 12/15/13 | | 14,267,000,000 | IDR | | | 1,782,429 |
FR31, 11.00%, 11/15/20 | | 167,351,000,000 | IDR | | | 18,714,896 |
FR34, 12.80%, 6/15/21 | | 207,810,000,000 | IDR | | | 25,631,742 |
FR35, 12.90%, 6/15/22 | | 66,582,000,000 | IDR | | | 8,247,692 |
FR36, 11.50%, 9/15/19 | | 30,075,000,000 | IDR | | | 3,470,192 |
FR37, 12.00%, 9/15/26 | | 8,230,000,000 | IDR | | | 960,531 |
FR39, 11.75%, 8/15/23 | | 5,491,000,000 | IDR | | | 630,664 |
TGB-14
Franklin Templeton Variable Insurance Products Trust
Statement of Investments, December 31, 2009 (continued)
| | | | | | |
| Templeton Global Bond Securities Fund | | Principal Amounta | | | Value |
Foreign Government and Agency Securities (continued) | | | | | | |
Indonesia (continued) | | | | | | |
Government of Indonesia (continued) | | | | | | |
FR40, 11.00%, 9/15/25 | | 61,856,000,000 | IDR | | $ | 6,727,044 |
FR42, 10.25%, 7/15/27 | | 88,574,000,000 | IDR | | | 9,068,853 |
FR43, 10.25%, 7/15/22 | | 68,340,000,000 | IDR | | | 7,105,911 |
FR44, 10.00%, 9/15/24 | | 4,454,000,000 | IDR | | | 451,307 |
FR46, 9.50%, 7/15/23 | | 226,780,000,000 | IDR | | | 22,256,915 |
FR47, 10.00%, 2/15/28 | | 61,737,000,000 | IDR | | | 6,190,079 |
FR48, 9.00%, 9/15/18 | | 16,920,000,000 | IDR | | | 1,705,465 |
FR49, 9.00%, 9/15/13 | | 35,030,000,000 | IDR | | | 3,744,588 |
dsenior bond, 144A, 8.50%, 10/12/35 | | 9,119,000 | | | | 10,995,979 |
dsenior bond, 144A, 6.625%, 2/17/37 | | 2,240,000 | | | | 2,219,350 |
dsenior bond, 144A, 7.75%, 1/17/38 | | 10,980,000 | | | | 12,238,125 |
dsenior note, 144A, 11.625%, 3/04/19 | | 6,410,000 | | | | 9,300,910 |
| | | | | | |
| | | | | | 151,442,672 |
| | | | | | |
Iraq 0.4% | | | | | | |
Government of Iraq, | | | | | | |
d144A, 5.80%, 1/15/28 | | 5,055,000 | | | | 3,917,625 |
hReg S, 5.80%, 1/15/28 | | 3,440,000 | | | | 2,666,000 |
| | | | | | |
| | | | | | 6,583,625 |
| | | | | | |
Israel 1.6% | | | | | | |
Government of Israel, 2680, 7.00%, 4/29/11 | | 99,205,000 | ILS | | | 27,729,580 |
| | | | | | |
Lithuania 1.2% | | | | | | |
dGovernment of Lithuania, 144A, 6.75%, 1/15/15 | | 19,480,000 | | | | 19,956,286 |
| | | | | | |
Malaysia 3.2% | | | | | | |
Government of Malaysia,
3.869%, 4/13/10 | | 1,690,000 | MYR | | | 496,261 |
3.756%, 4/28/11 | | 106,560,000 | MYR | | | 31,674,711 |
3.833%, 9/28/11 | | 3,660,000 | MYR | | | 1,091,597 |
3.461%, 7/31/13 | | 12,600,000 | MYR | | | 3,690,089 |
3.814%, 2/15/17 | | 18,885,000 | MYR | | | 5,426,680 |
4.24%, 2/07/18 | | 44,360,000 | MYR | | | 13,018,054 |
| | | | | | |
| | | | | | 55,397,392 |
| | | | | | |
Mexico 8.3% | | | | | | |
Government of Mexico,
7.25%, 12/15/16 | | 250,000i | MXN | | | 1,868,499 |
d144A, 7.50%, 3/08/10 | | 450,000 | EUR | | | 651,915 |
M 10, 8.00%, 12/17/15 | | 726,000i | MXN | | | 5,675,637 |
M 10, 7.75%, 12/14/17 | | 4,473,000i | MXN | | | 33,961,062 |
M 20, 10.00%, 12/05/24 | | 8,569,800i | MXN | | | 75,283,997 |
M 30, 10.00%, 11/20/36 | | 1,755,000i | MXN | | | 15,246,578 |
MI10, 9.00%, 12/20/12 | | 265,000i | MXN | | | 2,147,906 |
MI10, 8.00%, 12/19/13 | | 794,500i | MXN | | | 6,270,800 |
| | | | | | |
| | | | | | 141,106,394 |
| | | | | | |
Netherlands 1.1% | | | | | | |
Government of the Netherlands, 4.50%, 7/15/17 | | 12,280,000 | EUR | | | 19,049,696 |
| | | | | | |
Norway 3.0% | | | | | | |
Government of Norway,
6.00%, 5/16/11 | | 230,250,000 | NOK | | | 41,674,638 |
6.50%, 5/15/13 | | 49,400,000 | NOK | | | 9,438,277 |
| | | | | | |
| | | | | | 51,112,915 |
| | | | | | |
TGB-15
Franklin Templeton Variable Insurance Products Trust
Statement of Investments, December 31, 2009 (continued)
| | | | | | |
| Templeton Global Bond Securities Fund | | Principal Amounta | | | Value |
Foreign Government and Agency Securities (continued) | | | | | | |
Peru 0.3% | | | | | | |
Government of Peru,
7.84%, 8/12/20 | | 4,945,000 | PEN | | $ | 1,973,437 |
Sereis 7, 8.60%, 8/12/17 | | 6,185,000 | PEN | | | 2,620,363 |
| | | | | | |
| | | | | | 4,593,800 |
| | | | | | |
Philippines 0.0%e | | | | | | |
hGovernment of the Philippines, Reg S, 9.125%, 2/22/10 | | 330,000 | EUR | | | 478,283 |
| | | | | | |
Poland 6.4% | | | | | | |
Government of Poland,
4.75%, 4/25/12 | | 44,940,000 | PLN | | | 15,606,799 |
5.75%, 4/25/14 | | 92,590,000 | PLN | | | 32,337,410 |
6.25%, 10/24/15 | | 44,730,000 | PLN | | | 15,817,394 |
5.75%, 9/23/22 | | 48,750,000 | PLN | | | 16,223,675 |
senior note, 6.375%, 7/15/19 | | 27,200,000 | | | | 29,809,514 |
| | | | | | |
| | | | | | 109,794,792 |
| | | | | | |
Qatar 0.8% | | | | | | |
dGovernment of Qatar, senior note, 144A, 6.55%, 4/09/19 | | 12,060,000 | | | | 13,402,278 |
| | | | | | |
Russia 4.4% | | | | | | |
dGovernment of Russia, 144A, 7.50%, 3/31/30 | | 66,586,780 | | | | 75,116,547 |
| | | | | | |
South Africa 2.1% | | | | | | |
Government of South Africa,
5.25%, 5/16/13 | | 3,590,000 | EUR | | | 5,370,156 |
4.50%, 4/05/16 | | 1,874,000 | EUR | | | 2,694,730 |
6.875%, 5/27/19 | | 21,215,000 | | | | 23,946,431 |
senior note, 6.50%, 6/02/14 | | 805,000 | | | | 881,266 |
senior note, 5.875%, 5/30/22 | | 3,485,000 | | | | 3,587,372 |
| | | | | | |
| | | | | | 36,479,955 |
| | | | | | |
South Korea 14.9% | | | | | | |
The Export-Import Bank of Korea,
4.625%, 2/20/17 | | 230,000 | EUR | | | 327,711 |
5.125%, 3/16/15 | | 350,000 | | | | 364,525 |
hReg S, 5.25%, 2/10/14 | | 345,000 | | | | 362,556 |
senior note, 8.125%, 1/21/14 | | 1,170,000 | | | | 1,359,429 |
Government of Korea, senior bond, 5.625%, 11/03/25 | | 730,000 | | | | 740,192 |
Korea Deposit Insurance Corp.,
07-1, 5.57%, 9/14/12 | | 6,600,000,000 | KRW | | | 5,749,729 |
08-1, 5.28%, 2/15/13 | | 880,000,000 | KRW | | | 759,298 |
Korea Development Bank, senior note, 8.00%, 1/23/14 | | 3,875,000 | | | | 4,469,425 |
Korea Treasury Bond,
0400-1206, 4.00%, 6/10/12 | | 126,527,650,000 | KRW | | | 107,511,012 |
0475-1112, 4.75%, 12/10/11 | | 77,103,490,000 | KRW | | | 66,578,948 |
0500-1609, 5.00%, 9/10/16 | | 2,806,000,000 | KRW | | | 2,375,133 |
0525-1209, 5.25%, 9/10/12 | | 28,539,000,000 | KRW | | | 24,892,715 |
0525-1303, 5.25%, 3/10/13 | | 1,940,790,000 | KRW | | | 1,693,360 |
0550-1106, 5.50%, 6/10/11 | | 19,791,570,000 | KRW | | | 17,332,135 |
senior note, 7.125%, 4/16/19 | | 18,370,000 | | | | 21,100,829 |
| | | | | | |
| | | | | | 255,616,997 |
| | | | | | |
Sri Lanka 1.8% | | | | | | |
Government of Sri Lanka, A,
8.50%, 1/15/13 | | 694,400,000 | LKR | | | 5,741,280 |
13.50%, 2/01/13 | | 674,300,000 | LKR | | | 6,329,850 |
11.25%, 7/15/14 | | 773,000,000 | LKR | | | 6,738,501 |
11.00%, 8/01/15 | | 1,349,700,000 | LKR | | | 11,575,555 |
| | | | | | |
| | | | | | 30,385,186 |
| | | | | | |
TGB-16
Franklin Templeton Variable Insurance Products Trust
Statement of Investments, December 31, 2009 (continued)
| | | | | | |
| Templeton Global Bond Securities Fund | | Principal Amounta | | | Value |
Foreign Government and Agency Securities (continued) | | | | | | |
jSupranational 2.1% | | | | | | |
Corporacion Andina De Fomento, 8.125%, 6/04/19 | | 9,880,000 | | | $ | 11,449,932 |
European Investment Bank, senior note,
4.50%, 5/15/13 | | 33,700,000 | NOK | | | 5,964,896 |
1612/37, 6.50%, 9/10/14 | | 7,850,000 | NZD | | | 5,876,304 |
Inter-American Development Bank,
6.00%, 12/15/17 | | 575,000 | NZD | | | 411,788 |
senior note, 7.50%, 12/05/24 | | 200,000,000 | MXN | | | 12,751,075 |
| | | | | | |
| | | | | | 36,453,995 |
| | | | | | |
Sweden 6.2% | | | | | | |
Government of Sweden, 5.25%, 3/15/11 | | 712,870,000 | SEK | | | 105,319,008 |
| | | | | | |
United Arab Emirates 0.8% | | | | | | |
dEmirate of Abu Dhabi, 144A, 6.75%, 4/08/19 | | 11,840,000 | | | | 13,033,626 |
| | | | | | |
Venezuela 1.8% | | | | | | |
Government of Venezuela, | | | | | | |
10.75%, 9/19/13 | | 13,570,000 | | | | 12,145,150 |
hsenior bond, Reg S, 5.375%, 8/07/10 | | 11,235,000 | | | | 11,010,300 |
Petroleos de Venezuela SA, senior bond, zero cpn., 7/10/11 | | 10,250,000 | | | | 8,338,375 |
| | | | | | |
| | | | | | 31,493,825 |
| | | | | | |
Total Foreign Government and Agency Securities (Cost $1,493,197,175) | | | | | | 1,584,704,762 |
| | | | | | |
Municipal Bonds 3.3% | | | | | | |
United States and U.S. Territories 3.3% | | | | | | |
Alabama Public Housing Authorities Capital Program Revenue, Series B, FSA Insured, 4.45%, 1/01/24 | | 330,000 | | | | 331,865 |
Alabama State University Revenue, General Tuition and Fee, Assured Guaranty, | | | | | | |
5.00%, 9/01/29 | | 175,000 | | | | 183,456 |
5.75%, 9/01/39 | | 175,000 | | | | 190,248 |
Bay Area Toll Authority Toll Bridge Revenue, San Francisco Bay Area, Refunding, Series F-1, | | | | | | |
5.00%, 4/01/39 | | 1,330,000 | | | | 1,339,722 |
5.50%, 4/01/43 | | 2,810,000 | | | | 2,928,694 |
Bexar County Hospital District GO, Certificates of Obligation, 5.00%, 2/15/32 | | 1,615,000 | | | | 1,644,005 |
Bexar County Revenue, Venue Project, Refunding, Series A, BHAC Insured, 5.25%, 8/15/47 | | 1,450,000 | | | | 1,486,235 |
California State GO, | | | | | | |
Refunding, 5.125%, 4/01/33 | | 4,725,000 | | | | 4,408,189 |
Refunding, 5.00%, 4/01/38 | | 1,985,000 | | | | 1,784,138 |
Various Purpose, 6.00%, 4/01/38 | | 11,650,000 | | | | 11,880,320 |
Florida State Hurricane Catastrophe Fund Finance Corp. Revenue, Series A, 4.25%, 7/01/14 | | 4,545,000 | | | | 4,817,064 |
Hamilton County Sales Tax Revenue, sub. bond, Refunding, Series A, FSA Insured, 5.00%, 12/01/32 | | 3,650,000 | | | | 3,750,557 |
Illinois Municipal Electricity Agency Power Supply Revenue, Series A, BHAC Insured, 5.00%, 2/01/35 | | 2,155,000 | | | | 2,193,424 |
Las Vegas Valley Water District GO, Refunding, Series A, NATL Insured, 5.00%, 6/01/26 | | 860,000 | | | | 884,123 |
Lewisville ISD, GO, School Building, 5.00%, 8/15/26 | | 1,200,000 | | | | 1,295,556 |
Los Angeles USD, GO, Series I, 5.00%, | | | | | | |
7/01/26 | | 400,000 | | | | 417,500 |
7/01/27 | | 425,000 | | | | 442,927 |
Minneapolis Health Care System Revenue, Fairview Health Services, Series B, Assured
Guaranty, 6.50%, 11/15/38 | | 1,790,000 | | | | 2,001,864 |
MTA Revenue, | | | | | | |
Series B, Assured Guaranty, 5.25%, 11/15/20 | | 950,000 | | | | 1,068,874 |
Transportation, Series A, FSA Insured, 5.50%, 11/15/21 | | 900,000 | | | | 1,036,557 |
North Carolina Eastern Municipal Power Agency Power System Revenue, Refunding, Series A, Assured Guaranty, 5.25%, 1/01/19 | | 2,400,000 | | | | 2,623,944 |
TGB-17
Franklin Templeton Variable Insurance Products Trust
Statement of Investments, December 31, 2009 (continued)
| | | | | | |
| Templeton Global Bond Securities Fund | | Principal Amounta | | | Value |
Municipal Bonds (continued) | | | | | | |
United States and U.S. Territories (continued) | | | | | | |
Palomar Pomerado Health GO, Election of 2004, Series A, NATL Insured, 5.125%, 8/01/37 | | 4,570,000 | | | $ | 4,284,969 |
Philadelphia GO, Refunding, Series A, Assured Guaranty, 5.00%, 8/01/24 | | 500,000 | | | | 522,020 |
Puerto Rico Commonwealth GO, Public Improvement, Refunding, Series A, NATL Insured, 5.50%, 7/01/21 | | 875,000 | | | | 888,396 |
Regional Transportation District Sales Tax Revenue, Fastracks Project, Series A, AMBAC Insured,
5.00%, 11/01/27 | | 1,290,000 | | | | 1,350,566 |
Tarrant County Cultural Education Facilities Finance Corp. Revenue, Christus Health, Refunding, Series A, Assured Guaranty, 6.25%, 7/01/28 | | 1,500,000 | | | | 1,665,330 |
| | | | | | |
Total Municipal Bonds (Cost $53,453,737) | | | | | | 55,420,543 |
| | | | | | |
Total Investments before Short Term Investments (Cost $1,546,650,912) | | | | | | 1,640,125,305 |
| | | | | | |
Short Term Investments 2.1% | | | | | | |
Foreign Government and Agency Securities 1.1% | | | | | | |
Israel 0.3% | | | | | | |
kIsrael Treasury Bill, 10/6/10 | | 20,240,000 | ILS | | | 5,259,731 |
| | | | | | |
Norway 0.8% | | | | | | |
kNorway Treasury Bill, 3/17/10 | | 76,400,000 | NOK | | | 13,134,463 |
| | | | | | |
Total Foreign Government and Agency Securities (Cost $17,210,359) | | | | | | 18,394,194 |
| | | | | | |
Total Investments before Repurchase Agreements (Cost $1,563,861,271) | | | | | | 1,658,519,499 |
| | | | | | |
Repurchase Agreements (Cost $18,122,943) 1.0% | | | | | | |
lJoint Repurchase Agreement, 0.003%, 1/04/10 (Maturity Value $18,122,949) | | 18,122,943 | | | | 18,122,943 |
Banc of America Securities LLC (Maturity Value $2,129,265) BNP Paribas Securities Corp. (Maturity Value $4,258,349) Credit Suisse Securities (USA) LLC (Maturity Value $3,548,836) Deutsche Bank Securities Inc. (Maturity Value $1,089,008) HSBC Securities (USA) Inc. (Maturity Value $3,548,836) Morgan Stanley & Co. Inc. (Maturity Value $2,838,960) UBS Securities LLC (Maturity Value $709,695) | | | | | | |
Collateralized by U.S. Government Agency Securities, 0.50% - 7.625%, 3/30/10 - 2/09/28;
kU.S. Government Agency Discount Notes, 9/21/10; kU.S. Treasury Bills,
8/26/10 - 12/16/10; and U.S. Treasury Notes, 0.875% - 4.25%, 5/31/11 - 11/15/14 | | | | | | |
| | | | | | |
Total Investments (Cost $1,581,984,214) 98.0% | | | | | | 1,676,642,442 |
Other Assets, less Liabilities 2.0% | | | | | | 33,976,648 |
| | | | | | |
Net Assets 100.0% | | | | | $ | 1,710,619,090 |
| | | | | | |
aThe principal amount is stated in U.S. dollars unless otherwise indicated.
bThe coupon rate shown represents the rate at period end.
cThe principal amount is stated in original face, and scheduled paydowns are reflected in the market price on ex-date.
dSecurity was purchased pursuant to Rule 144A under the Securities Act of 1933 and may be sold in transactions exempt from registration only to qualified institutional buyers or in a public offering registered under the Securities Act of 1933. These securities have been deemed liquid under guidelines approved by the Trust’s Board of Trustees. At December 31, 2009, the aggregate value of these securities was $186,575,718, representing 10.91% of net assets.
eRounds to less than 0.1% of net assets.
fPrincipal amount is stated in 1,000 Brazilian Real Units.
gRedemption price at maturity is adjusted for inflation. See Note 1(f).
hSecurity was purchased pursuant to Regulation S under the Securities Act of 1933, which exempts from registration securities offered and sold outside of the United States. Such a security cannot be sold in the United States without either an effective registration statement filed pursuant to the Securities Act of 1933, or pursuant to an exemption from registration. These securities have been deemed liquid under guidelines approved by the Trust’s Board of Trustees. At December 31, 2009, the aggregate value of these securities was $14,517,139, representing 0.85% of net assets.
iPrincipal amount is stated in 100 Mexican Peso Units.
jA supranational organization is an entity formed by two or more central governments through international treaties.
kThe security is traded on a discount basis with no stated coupon rate.
lSee Note 1(c) regarding joint repurchase agreement.
TGB-18
Franklin Templeton Variable Insurance Products Trust
Statement of Investments, December 31, 2009 (continued)
| | | | | | |
| Templeton Global Bond Securities Fund |
At December 31, 2009, the Fund had the following forward exchange contracts outstanding. See Note 1(d).
| | | | | | | | | | | | | | | | | | | |
| Currency | | Counterparty | | Type | | Quantity | | Contract
Amount* | | | | Settlement
Date | | Unrealized
Appreciation | | Unrealized
Depreciation | |
Malaysian Ringgit | | JPHQ | | Sell | | 56,089,316 | | 16,337,329 | | | | 1/04/10 | | $ | — | | $ | (41,027 | ) |
Malaysian Ringgit | | JPHQ | | Buy | | 56,089,316 | | 16,085,264 | | | | 1/04/10 | | | 293,091 | | | — | |
Swedish Krona | | DBAB | | Sell | | 136,332,733 | | 13,172,245 | | EUR | | 1/05/10 | | | — | | | (186,943 | ) |
Swedish Krona | | DBAB | | Buy | | 136,332,733 | | 12,649,755 | | EUR | | 1/05/10 | | | 934,855 | | | — | |
Euro | | UBSW | | Sell | | 13,846,000 | | 19,140,433 | | | | 1/11/10 | | | — | | | (679,077 | ) |
Euro | | DBAB | | Sell | | 9,460,000 | | 13,121,020 | | | | 1/11/10 | | | — | | | (420,260 | ) |
Euro | | BOFA | | Sell | | 2,800,000 | | 3,881,080 | | | | 1/11/10 | | | — | | | (126,910 | ) |
Euro | | CITI | | Sell | | 2,240,000 | | 3,113,130 | | | | 1/11/10 | | | — | | | (93,262 | ) |
Euro | | FBCO | | Sell | | 1,726,000 | | 2,391,805 | | | | 1/11/10 | | | — | | | (78,835 | ) |
Malaysian Ringgit | | DBAB | | Buy | | 11,434,805 | | 3,219,258 | | | | 1/11/10 | | | 118,738 | | | — | |
Euro | | JPHQ | | Sell | | 937,000 | | 1,303,461 | | | | 1/13/10 | | | — | | | (37,780 | ) |
Mexican Peso | | DBAB | | Sell | | 92,844,000 | | 6,676,302 | | | | 1/13/10 | | | — | | | (410,034 | ) |
Philippine Peso | | JPHQ | | Buy | | 432,590,000 | | 9,275,111 | | | | 1/13/10 | | | 12,969 | | | — | |
Euro | | DBAB | | Sell | | 4,856,000 | | 6,783,201 | | | | 1/15/10 | | | — | | | (167,755 | ) |
Philippine Peso | | DBAB | | Buy | | 66,125,000 | | 1,423,267 | | | | 1/15/10 | | | — | | | (3,857 | ) |
Philippine Peso | | HSBC | | Buy | | 115,942,000 | | 2,490,698 | | | | 1/15/10 | | | — | | | (1,938 | ) |
Philippine Peso | | JPHQ | | Buy | | 165,119,000 | | 3,558,139 | | | | 1/19/10 | | | — | | | (15,516 | ) |
Philippine Peso | | DBAB | | Buy | | 41,372,000 | | 889,529 | | | | 1/19/10 | | | — | | | (1,894 | ) |
Mexican Peso | | DBAB | | Sell | | 15,775,146 | | 1,158,021 | | | | 1/20/10 | | | — | | | (45,002 | ) |
Mexican Peso | | DBAB | | Buy | | 15,775,146 | | 1,063,374 | | | | 1/20/10 | | | 139,650 | | | — | |
Mexican Peso | | HSBC | | Sell | | 234,622,679 | | 17,218,370 | | | | 1/21/10 | | | — | | | (671,956 | ) |
Mexican Peso | | HSBC | | Buy | | 234,622,679 | | 15,950,603 | | | | 1/21/10 | | | 1,939,723 | | | — | |
Euro | | CITI | | Sell | | 4,998,400 | | 7,136,815 | | | | 1/27/10 | | | — | | | (17,837 | ) |
Mexican Peso | | DBAB | | Sell | | 14,600,000 | | 1,079,187 | | | | 1/27/10 | | | — | | | (33,279 | ) |
Chilean Peso | | DBAB | | Buy | | 2,227,910,000 | | 3,527,407 | | | | 1/28/10 | | | 870,276 | | | — | |
New Zealand Dollar | | BZWS | | Sell | | 12,970,535 | | 6,582,546 | | | | 1/28/10 | | | — | | | (2,806,502 | ) |
Chilean Peso | | DBAB | | Buy | | 5,127,860,000 | | 8,173,239 | | | | 1/29/10 | | | 1,949,269 | | | — | |
Chilean Peso | | JPHQ | | Buy | | 675,370,000 | | 1,075,430 | | | | 1/29/10 | | | 257,765 | | | — | |
Euro | | DBAB | | Sell | | 31,205,000 | | 44,106,083 | | | | 1/29/10 | | | — | | | (560,252 | ) |
Euro | | UBSW | | Sell | | 5,540,000 | | 7,774,005 | | | | 1/29/10 | | | — | | | (155,862 | ) |
Mexican Peso | | CITI | | Sell | | 54,328,000 | | 3,985,329 | | | | 1/29/10 | | | — | | | (153,264 | ) |
New Zealand Dollar | | UBSW | | Sell | | 7,565,376 | | 4,924,303 | | | | 1/29/10 | | | — | | | (551,660 | ) |
Singapore Dollar | | HSBC | | Sell | | 53,093,000 | | 35,406,213 | | | | 1/29/10 | | | — | | | (2,355,971 | ) |
Singapore Dollar | | BZWS | | Sell | | 13,275,000 | | 8,821,800 | | | | 1/29/10 | | | — | | | (619,991 | ) |
Singapore Dollar | | UBSW | | Sell | | 13,281,000 | | 8,826,989 | | | | 1/29/10 | | | — | | | (619,069 | ) |
Singapore Dollar | | HSBC | | Buy | | 53,093,000 | | 38,293,487 | | | | 1/29/10 | | | — | | | (531,303 | ) |
Singapore Dollar | | BZWS | | Buy | | 13,275,000 | | 9,525,005 | | | | 1/29/10 | | | — | | | (83,215 | ) |
Singapore Dollar | | UBSW | | Buy | | 13,281,000 | | 9,521,386 | | | | 1/29/10 | | | — | | | (75,328 | ) |
Chilean Peso | | DBAB | | Buy | | 1,075,430,000 | | 1,720,688 | | | | 2/02/10 | | | 402,800 | | | — | |
New Zealand Dollar | | DBAB | | Sell | | 9,712,629 | | 4,910,123 | | | | 2/02/10 | | | — | | | (2,118,088 | ) |
Singapore Dollar | | HSBC | | Sell | | 13,298,000 | | 8,849,581 | | | | 2/02/10 | | | — | | | (608,069 | ) |
Singapore Dollar | | BZWS | | Sell | | 5,320,000 | | 3,539,587 | | | | 2/02/10 | | | — | | | (244,042 | ) |
Singapore Dollar | | HSBC | | Buy | | 13,298,000 | | 9,571,382 | | | | 2/02/10 | | | — | | | (113,732 | ) |
Singapore Dollar | | BZWS | | Buy | | 5,320,000 | | 3,817,177 | | | | 2/02/10 | | | — | | | (33,548 | ) |
Chilean Peso | | DBAB | | Buy | | 2,018,040,000 | | 3,226,283 | | | | 2/03/10 | | | 758,709 | | | — | |
Chinese Yuan | | DBAB | | Buy | | 102,053,000 | | 14,468,949 | | | | 2/03/10 | | | 484,493 | | | — | |
New Zealand Dollar | | DBAB | | Sell | | 12,744,985 | | 6,363,571 | | | | 2/03/10 | | | — | | | (2,858,274 | ) |
Singapore Dollar | | HSBC | | Sell | | 16,660,000 | | 11,062,490 | | | | 2/03/10 | | | — | | | (786,081 | ) |
Singapore Dollar | | HSBC | | Buy | | 16,660,000 | | 11,991,219 | | | | 2/03/10 | | | — | | | (142,647 | ) |
Indian Rupee | | JPHQ | | Buy | | 21,500,000 | | 423,228 | | | | 2/04/10 | | | 38,798 | | | — | |
Singapore Dollar | | HSBC | | Sell | | 16,752,000 | | 11,062,099 | | | | 2/04/10 | | | — | | | (851,741 | ) |
TGB-19
Franklin Templeton Variable Insurance Products Trust
Statement of Investments, December 31, 2009 (continued)
| | | | | | | | | | | | | | | | | | | |
| Templeton Global Bond Securities Fund | |
| | | | | | | | |
| Currency | | Counterparty | | Type | | Quantity | | Contract
Amount* | | | | Settlement
Date | | Unrealized
Appreciation | | Unrealized
Depreciation | |
Singapore Dollar | | HSBC | | Buy | | 16,752,000 | | 12,003,697 | | | | 2/04/10 | | $ | — | | $ | (89,858 | ) |
Mexican Peso | | DBAB | | Sell | | 46,717,000 | | 3,472,092 | | | | 2/05/10 | | | — | | | (83,898 | ) |
Singapore Dollar | | HSBC | | Sell | | 13,362,000 | | 8,849,886 | | | | 2/05/10 | | | — | | | (652,893 | ) |
Singapore Dollar | | HSBC | | Buy | | 13,362,000 | | 9,574,582 | | | | 2/05/10 | | | — | | | (71,804 | ) |
Euro | | HSBC | | Sell | | 1,200,000 | | 1,728,792 | | | | 2/08/10 | | | 11,164 | | | — | |
Euro | | JPHQ | | Sell | | 300,000 | | 431,850 | | | | 2/08/10 | | | 2,443 | | | — | |
Mexican Peso | | DBAB | | Sell | | 81,332,000 | | 5,956,199 | | | | 2/08/10 | | | — | | | (232,532 | ) |
Mexican Peso | | DBAB | | Buy | | 81,332,000 | | 5,299,365 | | | | 2/08/10 | | | 889,367 | | | — | |
Singapore Dollar | | JPHQ | | Sell | | 10,525,000 | | 6,991,033 | | | | 2/08/10 | | | — | | | (493,824 | ) |
Singapore Dollar | | JPHQ | | Buy | | 10,525,000 | | 7,546,967 | | | | 2/08/10 | | | — | | | (62,110 | ) |
Singapore Dollar | | JPHQ | | Sell | | 13,338,000 | | 8,857,750 | | | | 2/09/10 | | | — | | | (627,443 | ) |
Singapore Dollar | | JPHQ | | Buy | | 13,338,000 | | 9,589,474 | | | | 2/09/10 | | | — | | | (104,281 | ) |
Singapore Dollar | | BZWS | | Sell | | 5,284,900 | | 3,543,037 | | | | 2/11/10 | | | — | | | (215,168 | ) |
Singapore Dollar | | BZWS | | Buy | | 5,284,900 | | 3,785,542 | | | | 2/11/10 | | | — | | | (27,337 | ) |
Chilean Peso | | DBAB | | Buy | | 1,058,220,000 | | 1,720,683 | | | | 2/12/10 | | | 370,268 | | | — | |
Malaysian Ringgit | | DBAB | | Buy | | 97,443,480 | | 26,843,934 | | | | 2/12/10 | | | 1,563,670 | | | — | |
New Zealand Dollar | | HSBC | | Sell | | 2,945,715 | | 1,530,005 | | | | 2/12/10 | | | — | | | (600,116 | ) |
South Korean Won | | HSBC | | Buy | | 16,244,000,000 | | 11,944,118 | | | | 2/12/10 | | | 1,966,890 | | | — | |
Chilean Peso | | DBAB | | Buy | | 2,604,680,000 | | 4,301,701 | | | | 2/16/10 | | | 846,346 | | | — | |
Chilean Peso | | DBAB | | Buy | | 2,600,220,000 | | 4,326,489 | | | | 2/17/10 | | | 813,098 | | | — | |
Malaysian Ringgit | | HSBC | | Buy | | 4,899,000 | | 1,343,480 | | | | 2/17/10 | | | 84,450 | | | — | |
New Zealand Dollar | | HSBC | | Sell | | 3,931,416 | | 1,966,495 | | | | 2/22/10 | | | — | | | (874,485 | ) |
Chilean Peso | | CITI | | Buy | | 4,456,290,000 | | 7,355,035 | | | | 2/26/10 | | | 1,458,743 | | | — | |
Chilean Peso | | DBAB | | Buy | | 1,311,360,000 | | 2,163,246 | | | | 2/26/10 | | | 430,399 | | | — | |
New Zealand Dollar | | DBAB | | Sell | | 2,852,731 | | 1,430,644 | | | | 2/26/10 | | | — | | | (630,280 | ) |
Chilean Peso | | DBAB | | Buy | | 1,304,870,000 | | 2,163,246 | | | | 3/03/10 | | | 418,082 | | | — | |
Chilean Peso | | DBAB | | Buy | | 2,119,640,000 | | 3,461,202 | | | | 3/04/10 | | | 731,912 | | | — | |
Chilean Peso | | DBAB | | Buy | | 1,328,230,000 | | 2,163,241 | | | | 3/05/10 | | | 464,281 | | | — | |
Chilean Peso | | DBAB | | Buy | | 1,252,750,000 | | 2,036,230 | | | | 3/08/10 | | | 441,952 | | | — | |
Chilean Peso | | DBAB | | Buy | | 1,330,940,000 | | 2,163,251 | | | | 3/09/10 | | | 469,598 | | | — | |
New Zealand Dollar | | DBAB | | Sell | | 11,084,376 | | 5,470,140 | | | | 3/12/10 | | | — | | | (2,529,492 | ) |
New Zealand Dollar | | DBAB | | Sell | | 11,089,511 | | 5,596,876 | | | | 3/16/10 | | | — | | | (2,404,088 | ) |
Singapore Dollar | | JPHQ | | Sell | | 8,859,000 | | 5,757,083 | | | | 3/17/10 | | | — | | | (540,775 | ) |
Singapore Dollar | | JPHQ | | Buy | | 8,859,000 | | 6,368,799 | | | | 3/17/10 | | | — | | | (70,941 | ) |
Mexican Peso | | CITI | | Sell | | 65,351,230 | | 4,831,766 | | | | 3/22/10 | | | — | | | (116,442 | ) |
Australian Dollar | | BZWS | | Sell | | 4,356,970 | | 2,963,393 | | | | 3/24/10 | | | — | | | (912,372 | ) |
Indian Rupee | | DBAB | | Buy | | 159,915,000 | | 3,090,503 | | | | 4/09/10 | | | 328,073 | | | — | |
Indian Rupee | | DBAB | | Buy | | 342,913,000 | | 6,622,499 | | | | 4/12/10 | | | 706,111 | | | — | |
Indian Rupee | | JPHQ | | Buy | | 230,330,000 | | 4,414,989 | | | | 4/13/10 | | | 507,091 | | | — | |
Indian Rupee | | JPHQ | | Buy | | 226,092,000 | | 4,414,997 | | | | 4/15/10 | | | 415,642 | | | — | |
Indian Rupee | | JPHQ | | Buy | | 112,941,000 | | 2,213,661 | | | | 4/19/10 | | | 198,538 | | | — | |
Indian Rupee | | DBAB | | Buy | | 79,271,000 | | 1,545,244 | | | | 4/19/10 | | | 147,830 | | | — | |
Malaysian Ringgit | | JPHQ | | Buy | | 4,069,213 | | 1,123,999 | | | | 4/19/10 | | | 59,149 | | | — | |
Malaysian Ringgit | | JPHQ | | Buy | | 11,659,000 | | 3,246,999 | | | | 4/20/10 | | | 142,798 | | | — | |
Chilean Peso | | CITI | | Buy | | 1,945,145,000 | | 3,315,400 | | | | 4/23/10 | | | 536,271 | | | — | |
Chilean Peso | | CITI | | Buy | | 1,899,362,000 | | 3,240,347 | | | | 4/26/10 | | | 521,188 | | | — | |
Indian Rupee | | DBAB | | Buy | | 160,601,000 | | 3,099,125 | | | | 4/26/10 | | | 328,821 | | | — | |
Chilean Peso | | JPHQ | | Buy | | 1,501,938,000 | | 2,566,757 | | | | 4/27/10 | | | 407,849 | | | — | |
Chilean Peso | | CITI | | Buy | | 1,507,329,000 | | 2,566,759 | | | | 4/27/10 | | | 418,524 | | | — | |
Indian Rupee | | JPHQ | | Buy | | 22,911,000 | | 442,725 | | | | 4/27/10 | | | 46,255 | | | — | |
Chilean Peso | | CITI | | Buy | | 2,420,966,000 | | 4,106,813 | | | | 4/28/10 | | | 688,161 | | | — | |
Chilean Peso | | UBSW | | Buy | | 303,134,000 | | 513,351 | | | | 4/28/10 | | | 87,037 | | | — | |
TGB-20
Franklin Templeton Variable Insurance Products Trust
Statement of Investments, December 31, 2009 (continued)
| | | | | | | | | | | | | | | | | | | |
| Templeton Global Bond Securities Fund | |
| | | | | | | | |
| Currency | | Counterparty | | Type | | Quantity | | Contract
Amount* | | | | Settlement
Date | | Unrealized
Appreciation | | Unrealized
Depreciation | |
Indian Rupee | | DBAB | | Buy | | 71,377,981 | | 1,394,101 | | | | 4/28/10 | | $ | 129,149 | | $ | — | |
Indian Rupee | | JPHQ | | Buy | | 113,671,000 | | 2,213,651 | | | | 4/28/10 | | | 212,158 | | | — | |
New Zealand Dollar | | DBAB | | Sell | | 2,329,569 | | 1,274,973 | | | | 4/28/10 | | | — | | | (399,898 | ) |
Peruvian Nuevo Sol | | DBAB | | Buy | | 32,777,510 | | 10,568,277 | | | | 4/29/10 | | | 751,249 | | | — | |
Indian Rupee | | JPHQ | | Buy | | 113,782,000 | | 2,213,658 | | | | 4/30/10 | | | 214,080 | | | — | |
Swedish Krona | | BZWS | | Buy | | 122,773,200 | | 11,484,864 | | EUR | | 4/30/10 | | | 723,653 | | | — | |
Peruvian Nuevo Sol | | DBAB | | Buy | | 1,998,991 | | 665,222 | | | | 5/07/10 | | | 25,108 | | | — | |
Peruvian Nuevo Sol | | DBAB | | Buy | | 5,300,000 | | 1,771,983 | | | | 5/10/10 | | | 58,303 | | | — | |
Chilean Peso | | DBAB | | Buy | | 420,740,000 | | 733,840 | | | | 5/18/10 | | | 100,250 | | | — | |
Peruvian Nuevo Sol | | DBAB | | Buy | | 19,235,857 | | 6,268,181 | | | | 5/18/10 | | | 374,570 | | | — | |
Chilean Peso | | DBAB | | Buy | | 145,512,000 | | 260,681 | | | | 5/26/10 | | | 27,894 | | | — | |
Chilean Peso | | CITI | | Buy | | 41,560,000 | | 74,480 | | | | 5/26/10 | | | 7,940 | | | — | |
Chilean Peso | | DBAB | | Buy | | 187,450,000 | | 331,770 | | | | 5/28/10 | | | 40,010 | | | — | |
Chilean Peso | | CITI | | Buy | | 187,520,000 | | 331,776 | | | | 5/28/10 | | | 40,142 | | | — | |
Chilean Peso | | CITI | | Buy | | 74,780,000 | | 132,706 | | | | 6/01/10 | | | 15,636 | | | — | |
Indian Rupee | | DBAB | | Buy | | 217,594,000 | | 4,433,546 | | | | 6/01/10 | | | 195,769 | | | — | |
New Zealand Dollar | | UBSW | | Sell | | 11,305,079 | | 7,897,502 | | | | 6/01/10 | | | — | | | (206,844 | ) |
New Zealand Dollar | | DBAB | | Sell | | 11,236,978 | | 7,848,917 | | | | 6/01/10 | | | — | | | (206,610 | ) |
New Zealand Dollar | | CITI | | Sell | | 6,395,559 | | 4,460,135 | | | | 6/01/10 | | | — | | | (124,692 | ) |
Indian Rupee | | HSBC | | Buy | | 6,451,000 | | 133,010 | | | | 6/02/10 | | | 4,222 | | | — | |
New Zealand Dollar | | BZWS | | Sell | | 9,370,868 | | 6,599,715 | | | | 6/02/10 | | | — | | | (117,468 | ) |
New Zealand Dollar | | DBAB | | Sell | | 4,846,894 | | 3,420,211 | | | | 6/02/10 | | | — | | | (54,118 | ) |
New Zealand Dollar | | FBCO | | Sell | | 1,599,481 | | 1,127,634 | | | | 6/02/10 | | | — | | | (18,899 | ) |
Indian Rupee | | HSBC | | Buy | | 31,921,000 | | 665,021 | | | | 6/03/10 | | | 13,976 | | | — | |
Indian Rupee | | HSBC | | Buy | | 213,076,000 | | 4,433,541 | | | | 6/04/10 | | | 98,424 | | | — | |
Poland Zloty | | DBAB | | Buy | | 15,778,000 | | 3,468,378 | | EUR | | 6/04/10 | | | 480,708 | | | — | |
Indian Rupee | | DBAB | | Buy | | 106,538,000 | | 2,216,771 | | | | 6/07/10 | | | 48,597 | | | — | |
Poland Zloty | | DBAB | | Buy | | 14,926,000 | | 3,251,639 | | EUR | | 6/07/10 | | | 495,888 | | | — | |
Indian Rupee | | HSBC | | Buy | | 42,784,000 | | 886,715 | | | | 6/08/10 | | | 22,939 | | | — | |
Indian Rupee | | DBAB | | Buy | | 53,739,000 | | 1,114,917 | | | | 6/08/10 | | | 27,658 | | | — | |
Poland Zloty | | CITI | | Buy | | 5,990,000 | | 1,300,545 | | EUR | | 6/08/10 | | | 205,140 | | | — | |
Mexican Peso | | DBAB | | Sell | | 266,049,641 | | 19,073,710 | | | | 6/09/10 | | | — | | | (875,899 | ) |
New Zealand Dollar | | BZWS | | Sell | | 9,370,868 | | 6,595,779 | | | | 6/09/10 | | | — | | | (117,396 | ) |
Indian Rupee | | DBAB | | Buy | | 43,392,000 | | 891,922 | | | | 6/10/10 | | | 30,493 | | | — | |
Indian Rupee | | BZWS | | Buy | | 64,888,000 | | 1,337,897 | | | | 6/11/10 | | | 41,349 | | | — | |
Indian Rupee | | HSBC | | Buy | | 43,481,000 | | 891,918 | | | | 6/11/10 | | | 32,305 | | | — | |
Indian Rupee | | DBAB | | Buy | | 108,614,000 | | 2,229,809 | | | | 6/16/10 | | | 77,825 | | | — | |
Indian Rupee | | DBAB | | Buy | | 98,937,000 | | 2,006,836 | | | | 6/21/10 | | | 94,251 | | | — | |
Indian Rupee | | JPHQ | | Buy | | 79,054,000 | | 1,603,529 | | | | 6/22/10 | | | 75,158 | | | — | |
Indian Rupee | | DBAB | | Buy | | 119,627,000 | | 2,405,288 | | | | 6/24/10 | | | 134,496 | | | — | |
Indian Rupee | | HSBC | | Buy | | 80,337,000 | | 1,603,533 | | | | 6/25/10 | | | 101,937 | | | — | |
Peruvian Nuevo Sol | | DBAB | | Buy | | 6,318,000 | | 2,063,020 | | | | 6/28/10 | | | 118,614 | | | — | |
Swedish Krona | | UBSW | | Buy | | 60,129,000 | | 5,405,923 | | EUR | | 6/28/10 | | | 672,189 | | | — | |
Malaysian Ringgit | | JPHQ | | Buy | | 14,772,000 | | 4,162,886 | | | | 6/29/10 | | | 120,716 | | | — | |
Swedish Krona | | UBSW | | Buy | | 43,662,000 | | 3,940,258 | | EUR | | 6/29/10 | | | 466,972 | | | — | |
Indian Rupee | | DBAB | | Buy | | 79,423,000 | | 1,603,533 | | | | 7/09/10 | | | 80,654 | | | — | |
Indian Rupee | | JPHQ | | Buy | | 79,487,000 | | 1,603,530 | | | | 7/09/10 | | | 82,014 | | | — | |
Malaysian Ringgit | | DBAB | | Buy | | 9,014,572 | | 2,535,531 | | | | 7/09/10 | | | 77,810 | | | — | |
Indian Rupee | | DBAB | | Buy | | 40,128,000 | | 801,758 | | | | 7/12/10 | | | 48,975 | | | — | |
Indian Rupee | | JPHQ | | Buy | | 48,258,000 | | 962,120 | | | | 7/12/10 | | | 60,974 | | | — | |
Malaysian Ringgit | | DBAB | | Buy | | 18,006,622 | | 5,046,935 | | | | 7/12/10 | | | 172,788 | | | — | |
Malaysian Ringgit | | JPHQ | | Buy | | 4,594,000 | | 1,279,844 | | | | 7/13/10 | | | 51,819 | | | — | |
TGB-21
Franklin Templeton Variable Insurance Products Trust
Statement of Investments, December 31, 2009 (continued)
| | | | | | | | | | | | | | | | | | | |
| Templeton Global Bond Securities Fund | |
| | | | | | | | |
| Currency | | Counterparty | | Type | | Quantity | | Contract
Amount* | | | | Settlement
Date | | Unrealized
Appreciation | | Unrealized
Depreciation | |
Malaysian Ringgit | | DBAB | | Buy | | 2,637,000 | | 732,907 | | | | 7/16/10 | | $ | 31,417 | | $ | — | |
Malaysian Ringgit | | DBAB | | Buy | | 11,455,000 | | 2,280,737 | | EUR | | 7/16/10 | | | 57,469 | | | — | |
Indian Rupee | | CITI | | Buy | | 19,711,000 | | 394,220 | | | | 7/19/10 | | | 23,442 | | | — | |
Indian Rupee | | JPHQ | | Buy | | 19,711,000 | | 394,220 | | | | 7/20/10 | | | 23,411 | | | — | |
Malaysian Ringgit | | DBAB | | Buy | | 4,160,000 | | 1,165,005 | | | | 7/20/10 | | | 40,623 | | | — | |
Malaysian Ringgit | | DBAB | | Buy | | 12,933,000 | | 2,569,998 | | EUR | | 7/20/10 | | | 71,770 | | | — | |
Malaysian Ringgit | | DBAB | | Buy | | 5,058,000 | | 1,428,410 | | | | 7/23/10 | | | 37,351 | | | — | |
Malaysian Ringgit | | DBAB | | Buy | | 16,628,000 | | 3,304,189 | | EUR | | 7/23/10 | | | 92,090 | | | — | |
Malaysian Ringgit | | JPHQ | | Buy | | 5,318,000 | | 1,498,028 | | | | 7/27/10 | | | 42,910 | | | — | |
Malaysian Ringgit | | JPHQ | | Buy | | 16,628,000 | | 3,293,913 | | EUR | | 7/27/10 | | | 106,419 | | | — | |
Malaysian Ringgit | | HSBC | | Buy | | 3,005,000 | | 852,168 | | | | 7/30/10 | | | 18,486 | | | — | |
New Zealand Dollar | | DBAB | | Sell | | 18,763,956 | | 12,074,605 | | | | 7/30/10 | | | — | | | (1,304,294 | ) |
New Zealand Dollar | | DBAB | | Sell | | 18,692,571 | | 12,007,173 | | | | 8/03/10 | | | — | | | (1,315,642 | ) |
New Zealand Dollar | | BZWS | | Sell | | 7,317,361 | | 4,697,746 | | | | 8/03/10 | | | — | | | (517,580 | ) |
New Zealand Dollar | | DBAB | | Sell | | 7,405,811 | | 4,731,573 | | | | 8/04/10 | | | — | | | (546,281 | ) |
New Zealand Dollar | | BZWS | | Sell | | 3,686,939 | | 2,367,015 | | | | 8/04/10 | | | — | | | (260,533 | ) |
New Zealand Dollar | | CITI | | Sell | | 18,563,255 | | 12,122,269 | | | | 8/05/10 | | | — | | | (1,105,803 | ) |
New Zealand Dollar | | DBAB | | Sell | | 5,506,806 | | 3,589,336 | | | | 8/05/10 | | | — | | | (334,783 | ) |
Malaysian Ringgit | | HSBC | | Buy | | 6,100,000 | | 1,743,854 | | | | 8/06/10 | | | 23,192 | | | — | |
New Zealand Dollar | | CITI | | Sell | | 7,269,764 | | 4,750,900 | | | | 8/06/10 | | | — | | | (428,990 | ) |
New Zealand Dollar | | FBCO | | Sell | | 3,628,158 | | 2,362,838 | | | | 8/06/10 | | | — | | | (222,316 | ) |
Malaysian Ringgit | | JPHQ | | Buy | | 1,100,000 | | 313,837 | | | | 8/09/10 | | | 4,784 | | | — | |
New Zealand Dollar | | CITI | | Sell | | 7,173,180 | | 4,716,079 | | | | 8/09/10 | | | — | | | (393,501 | ) |
New Zealand Dollar | | DBAB | | Sell | | 7,205,549 | | 4,739,810 | | | | 8/09/10 | | | — | | | (392,827 | ) |
New Zealand Dollar | | FBCO | | Sell | | 7,091,362 | | 4,672,853 | | | | 8/09/10 | | | — | | | (378,447 | ) |
New Zealand Dollar | | FBCO | | Sell | | 7,103,800 | | 4,717,847 | | | | 8/11/10 | | | — | | | (341,329 | ) |
Poland Zloty | | DBAB | | Buy | | 59,155,000 | | 14,078,825 | | EUR | | 8/11/10 | | | 179,699 | | | — | |
New Zealand Dollar | | DBAB | | Sell | | 24,938,679 | | 16,238,792 | | | | 8/12/10 | | | — | | | (1,520,280 | ) |
New Zealand Dollar | | DBAB | | Sell | | 8,453,000 | | 5,486,842 | | | | 8/13/10 | | | — | | | (532,035 | ) |
New Zealand Dollar | | DBAB | | Sell | | 8,915,000 | | 5,884,792 | | | | 8/16/10 | | | — | | | (461,198 | ) |
Brazilian Real | | DBAB | | Buy | | 5,465,000 | | 265,418,655 | | JPY | | 8/17/10 | | | 116,281 | | | — | |
New Israeli Shekel | | CITI | | Buy | | 14,794,000 | | 3,904,048 | | | | 8/17/10 | | | — | | | (8,991 | ) |
Japanese Yen | | UBSW | | Sell | | 758,781,000 | | 7,999,294 | | | | 8/17/10 | | | — | | | (180,698 | ) |
Brazilian Real | | DBAB | | Buy | | 4,037,000 | | 194,381,550 | | JPY | | 8/18/10 | | | 103,474 | | | — | |
Japanese Yen | | JPHQ | | Sell | | 377,047,000 | | 3,999,650 | | | | 8/18/10 | | | — | | | (65,165 | ) |
Brazilian Real | | DBAB | | Buy | | 6,056,000 | | 284,668,336 | | JPY | | 8/19/10 | | | 229,058 | | | — | |
New Israeli Shekel | | CITI | | Buy | | 7,400,000 | | 1,952,249 | | | | 8/19/10 | | | — | | | (3,968 | ) |
New Israeli Shekel | | DBAB | | Buy | | 1,482,000 | | 390,411 | | | | 8/19/10 | | | — | | | (228 | ) |
New Israeli Shekel | | CITI | | Buy | | 7,402,000 | | 1,947,382 | | | | 8/19/10 | | | 1,425 | | | — | |
Japanese Yen | | HSBC | | Sell | | 375,298,000 | | 3,989,137 | | | | 8/19/10 | | | — | | | (56,904 | ) |
Euro | | UBSW | | Sell | | 6,270,000 | | 8,838,506 | | | | 8/20/10 | | | — | | | (128,467 | ) |
Indian Rupee | | DBAB | | Buy | | 143,891,000 | | 2,881,278 | | | | 8/20/10 | | | 160,340 | | | — | |
New Israeli Shekel | | CITI | | Buy | | 5,678,400 | | 1,485,675 | | | | 8/20/10 | | | 9,326 | | | — | |
Japanese Yen | | DBAB | | Sell | | 376,727,000 | | 3,989,146 | | | | 8/20/10 | | | — | | | (72,383 | ) |
Japanese Yen | | BZWS | | Sell | | 376,247,000 | | 3,995,063 | | | | 8/20/10 | | | — | | | (61,292 | ) |
Euro | | UBSW | | Sell | | 6,274,000 | | 8,874,322 | | | | 8/23/10 | | | — | | | (98,148 | ) |
Indian Rupee | | DBAB | | Buy | | 124,700,000 | | 2,497,112 | | | | 8/23/10 | | | 138,246 | | | — | |
New Israeli Shekel | | CITI | | Buy | | 9,690,400 | | 2,541,278 | | | | 8/23/10 | | | 9,924 | | | — | |
Japanese Yen | | CITI | | Sell | | 751,731,000 | | 7,990,126 | | | | 8/23/10 | | | — | | | (114,850 | ) |
Japanese Yen | | FBCO | | Sell | | 746,218,000 | | 7,990,128 | | | | 8/23/10 | | | — | | | (55,408 | ) |
Japanese Yen | | JPHQ | | Sell | | 750,133,000 | | 7,990,126 | | | | 8/24/10 | | | — | | | (97,785 | ) |
Japanese Yen | | BZWS | | Sell | | 747,636,000 | | 7,990,125 | | | | 8/24/10 | | | — | | | (70,863 | ) |
TGB-22
Franklin Templeton Variable Insurance Products Trust
Statement of Investments, December 31, 2009 (continued)
| | | | | | | | | | | | | | | | | | | |
| Templeton Global Bond Securities Fund | |
| | | | | | | | |
| Currency | | Counterparty | | Type | | Quantity | | Contract
Amount* | | | | Settlement
Date | | Unrealized
Appreciation | | Unrealized
Depreciation | |
New Zealand Dollar | | FBCO | | Sell | | 6,517,276 | | 4,297,361 | | | | 8/24/10 | | $ | — | | $ | (338,245 | ) |
Japanese Yen | | DBAB | | Sell | | 371,821,000 | | 3,995,068 | | | | 8/25/10 | | | — | | | (13,976 | ) |
New Zealand Dollar | | DBAB | | Sell | | 6,486,000 | | 4,335,891 | | | | 8/27/10 | | | — | | | (276,127 | ) |
Brazilian Real | | DBAB | | Buy | | 4,043,000 | | 188,901,089 | | JPY | | 8/31/10 | | | 158,431 | | | — | |
Indian Rupee | | DBAB | | Buy | | 88,183,000 | | 1,767,194 | | | | 9/01/10 | | | 95,169 | | | — | |
Japanese Yen | | JPHQ | | Sell | | 372,662,000 | | 3,995,069 | | | | 9/01/10 | | | — | | | (23,613 | ) |
Brazilian Real | | DBAB | | Buy | | 6,065,000 | | 280,427,405 | | JPY | | 9/02/10 | | | 267,751 | | | — | |
Japanese Yen | | HSBC | | Sell | | 368,756,000 | | 3,995,060 | | | | 9/02/10 | | | 18,418 | | | — | |
Euro | | BZWS | | Sell | | 6,230,000 | | 8,874,012 | | | | 9/07/10 | | | — | | | (34,423 | ) |
Euro | | HSBC | | Sell | | 8,279,000 | | 11,790,952 | | | | 9/08/10 | | | — | | | (47,302 | ) |
United States Dollar | | JPHQ | | Buy | | 11,099,031 | | 7,817,044 | | EUR | | 9/08/10 | | | — | | | (78,667 | ) |
Japanese Yen | | HSBC | | Sell | | 555,382,000 | | 5,992,598 | | | | 9/09/10 | | | 2,543 | | | — | |
Japanese Yen | | HSBC | | Sell | | 553,476,000 | | 5,992,594 | | | | 9/10/10 | | | 22,976 | | | — | |
Japanese Yen | | DBAB | | Sell | | 516,285,000 | | 5,624,265 | | | | 9/10/10 | | | 55,776 | | | — | |
Japanese Yen | | UBSW | | Sell | | 428,870,000 | | 4,686,899 | | | | 9/13/10 | | | 60,960 | | | — | |
Brazilian Real | | DBAB | | Buy | | 9,097,000 | | 424,168,548 | | JPY | | 9/15/10 | | | 346,789 | | | — | |
Japanese Yen | | HSBC | | Sell | | 341,214,000 | | 3,749,522 | | | | 9/15/10 | | | 68,921 | | | — | |
Japanese Yen | | BZWS | | Sell | | 337,439,000 | | 3,749,531 | | | | 9/15/10 | | | 109,650 | | | — | |
Japanese Yen | | UBSW | | Sell | | 508,216,000 | | 5,624,285 | | | | 9/15/10 | | | 142,270 | | | — | |
United States Dollar | | UBSW | | Buy | | 7,760,297 | | 5,315,636 | | EUR | | 9/15/10 | | | 159,839 | | | — | |
Japanese Yen | | HSBC | | Sell | | 506,130,000 | | 5,624,292 | | | | 9/16/10 | | | 164,668 | | | — | |
Japanese Yen | | DBAB | | Sell | | 169,665,000 | | 1,874,751 | | | | 9/16/10 | | | 44,575 | | | — | |
New Zealand Dollar | | DBAB | | Sell | | 17,768,247 | | 12,117,945 | | | | 9/16/10 | | | — | | | (492,091 | ) |
United States Dollar | | CITI | | Buy | | 7,760,297 | | 5,328,410 | | EUR | | 9/16/10 | | | 141,637 | | | — | |
United States Dollar | | HSBC | | Buy | | 14,772,566 | | 10,076,784 | | EUR | | 9/17/10 | | | 364,712 | | | — | |
Euro | | BZWS | | Sell | | 1,426,600 | | 2,100,455 | | | | 9/20/10 | | | 60,743 | | | — | |
United States Dollar | | UBSW | | Buy | | 9,232,854 | | 6,293,268 | | EUR | | 9/20/10 | | | 234,921 | | | — | |
Japanese Yen | | JPHQ | | Sell | | 339,332,000 | | 3,749,525 | | | | 9/21/10 | | | 88,779 | | | — | |
Japanese Yen | | HSBC | | Sell | | 168,241,000 | | 1,874,760 | | | | 9/21/10 | | | 59,761 | | | — | |
Euro | | UBSW | | Sell | | 9,307,428 | | 13,646,830 | | | | 9/23/10 | | | 339,670 | | | — | |
Swedish Krona | | UBSW | | Buy | | 30,000,000 | | 2,950,694 | | EUR | | 9/23/10 | | | — | | | (22,234 | ) |
Euro | | JPHQ | | Sell | | 4,095,317 | | 6,063,526 | | | | 9/24/10 | | | 208,355 | | | — | |
Japanese Yen | | JPHQ | | Sell | | 281,276,000 | | 3,108,194 | | | | 9/24/10 | | | 73,577 | | | — | |
Indian Rupee | | DBAB | | Buy | | 25,000,000 | | 725,900 | | NZD | | 9/27/10 | | | 12,334 | | | — | |
Japanese Yen | | JPHQ | | Sell | | 27,971,000 | | 310,823 | | | | 9/27/10 | | | 9,033 | | | — | |
Japanese Yen | | JPHQ | | Sell | | 103,324,000 | | 1,148,172 | | | | 9/28/10 | | | 33,331 | | | — | |
Malaysian Ringgit | | JPHQ | | Buy | | 8,340,000 | | 1,635,968 | | EUR | | 9/28/10 | | | 73,527 | | | — | |
Japanese Yen | | JPHQ | | Sell | | 172,207,000 | | 1,913,624 | | | | 9/29/10 | | | 55,490 | | | — | |
Euro | | UBSW | | Sell | | 6,370,000 | | 9,309,118 | | | | 10/04/10 | | | 202,332 | | | — | |
Philippine Peso | | HSBC | | Buy | | 156,866,000 | | 3,242,708 | | | | 10/04/10 | | | 34,380 | | | — | |
Philippine Peso | | DBAB | | Buy | | 195,560,000 | | 4,053,393 | | | | 10/04/10 | | | 32,051 | | | — | |
Philippine Peso | | HSBC | | Buy | | 233,867,000 | | 4,864,056 | | | | 10/05/10 | | | 21,405 | | | — | |
Philippine Peso | | DBAB | | Buy | | 233,811,000 | | 4,864,070 | | | | 10/05/10 | | | 20,220 | | | — | |
Philippine Peso | | JPHQ | | Buy | | 61,767,000 | | 1,297,081 | | | | 10/06/10 | | | — | | | (6,841 | ) |
Philippine Peso | | DBAB | | Buy | | 191,936,000 | | 4,053,387 | | | | 10/07/10 | | | — | | | (44,280 | ) |
Philippine Peso | | DBAB | | Buy | | 153,588,000 | | 3,242,716 | | | | 10/08/10 | | | — | | | (34,779 | ) |
Philippine Peso | | HSBC | | Buy | | 153,878,000 | | 3,242,711 | | | | 10/08/10 | | | — | | | (28,717 | ) |
Philippine Peso | | JPHQ | | Buy | | 76,627,000 | | 1,621,358 | | | | 10/08/10 | | | — | | | (20,878 | ) |
Philippine Peso | | CITI | | Buy | | 76,826,000 | | 1,621,349 | | | | 10/08/10 | | | — | | | (16,712 | ) |
Malaysian Ringgit | | DBAB | | Buy | | 11,434,805 | | 3,317,898 | | | | 10/12/10 | | | — | | | (11,369 | ) |
Philippine Peso | | DBAB | | Buy | | 45,732,000 | | 972,814 | | | | 10/12/10 | | | — | | | (17,826 | ) |
Malaysian Ringgit | | DBAB | | Buy | | 4,934,783 | | 1,452,988 | | | | 10/13/10 | | | — | | | (26,063 | ) |
TGB-23
Franklin Templeton Variable Insurance Products Trust
Statement of Investments, December 31, 2009 (continued)
| | | | | | | | | | | | | | | | | | | |
| Templeton Global Bond Securities Fund | |
| | | | | | | | |
| Currency | | Counterparty | | Type | | Quantity | | Contract
Amount* | | | | Settlement
Date | | Unrealized
Appreciation | | Unrealized
Depreciation | |
Philippine Peso | | JPHQ | | Buy | | 194,374,000 | | 4,151,141 | | | | 10/13/10 | | $ | — | | $ | (92,381 | ) |
Philippine Peso | | HSBC | | Buy | | 76,252,000 | | 1,621,348 | | | | 10/13/10 | | | — | | | (29,116 | ) |
Chinese Yuan | | HSBC | | Buy | | 35,001,331 | | 3,554,330 | | EUR | | 10/15/10 | | | 77,482 | | | — | |
Philippine Peso | | JPHQ | | Buy | | 25,032,000 | | 533,731 | | | | 10/15/10 | | | — | | | (11,088 | ) |
Chinese Yuan | | HSBC | | Buy | | 35,172,030 | | 3,560,830 | | EUR | | 10/18/10 | | | 93,998 | | | — | |
Philippine Peso | | JPHQ | | Buy | | 83,120,000 | | 1,779,072 | | | | 10/18/10 | | | — | | | (43,880 | ) |
Chinese Yuan | | HSBC | | Buy | | 47,143,455 | | 4,759,196 | | EUR | | 10/19/10 | | | 145,762 | | | — | |
Philippine Peso | | DBAB | | Buy | | 41,880,000 | | 889,550 | | | | 10/19/10 | | | — | | | (15,319 | ) |
Chinese Yuan | | HSBC | | Buy | | 29,130,000 | | 4,414,640 | | | | 10/21/10 | | | — | | | (120,428 | ) |
Philippine Peso | | DBAB | | Buy | | 167,411,000 | | 3,558,151 | | | | 10/21/10 | | | — | | | (63,870 | ) |
Philippine Peso | | JPHQ | | Buy | | 84,061,000 | | 1,779,069 | | | | 10/21/10 | | | — | | | (24,508 | ) |
Chinese Yuan | | HSBC | | Buy | | 36,599,833 | | 5,559,074 | | | | 10/25/10 | | | — | | | (162,898 | ) |
Philippine Peso | | HSBC | | Buy | | 247,998,000 | | 5,204,575 | | | | 10/25/10 | | | — | | | (29,324 | ) |
Philippine Peso | | DBAB | | Buy | | 165,158,000 | | 3,469,706 | | | | 10/25/10 | | | — | | | (23,170 | ) |
Philippine Peso | | JPHQ | | Buy | | 82,631,000 | | 1,734,852 | | | | 10/25/10 | | | — | | | (10,499 | ) |
Chilean Peso | | CITI | | Buy | | 921,291,798 | | 1,745,697 | | | | 10/26/10 | | | 86,295 | | | — | |
Chinese Yuan | | HSBC | | Buy | | 62,115,025 | | 9,408,231 | | | | 10/26/10 | | | — | | | (249,830 | ) |
Indian Rupee | | DBAB | | Buy | | 639,477,000 | | 13,466,076 | | | | 10/26/10 | | | — | | | (13,582 | ) |
Indian Rupee | | HSBC | | Buy | | 213,392,000 | | 4,488,683 | | | | 10/26/10 | | | 383 | | | — | |
Philippine Peso | | HSBC | | Buy | | 214,449,000 | | 4,510,623 | | | | 10/26/10 | | | — | | | (35,710 | ) |
Chinese Yuan | | HSBC | | Buy | | 37,116,032 | | 5,610,465 | | | | 10/27/10 | | | — | | | (137,779 | ) |
Indian Rupee | | HSBC | | Buy | | 317,880,000 | | 6,733,034 | | | | 10/27/10 | | | — | | | (46,337 | ) |
Chilean Peso | | JPHQ | | Buy | | 597,828,000 | | 1,138,178 | | | | 10/28/10 | | | 50,640 | | | — | |
Philippine Peso | | DBAB | | Buy | | 66,285,000 | | 1,387,877 | | | | 10/28/10 | | | — | | | (4,850 | ) |
Japanese Yen | | CITI | | Sell | | 341,992,119 | | 3,779,658 | | | | 11/08/10 | | | 84,640 | | | — | |
Japanese Yen | | BZWS | | Sell | | 335,950,000 | | 3,751,221 | | | | 11/10/10 | | | 121,245 | | | — | |
Japanese Yen | | UBSW | | Sell | | 340,600,700 | | 3,804,362 | | | | 11/12/10 | | | 123,891 | | | — | |
Japanese Yen | | BZWS | | Sell | | 429,663,000 | | 4,795,078 | | | | 11/12/10 | | | 152,216 | | | — | |
Japanese Yen | | DBAB | | Sell | | 796,770,000 | | 8,895,004 | | | | 11/15/10 | | | 284,393 | | | — | |
Japanese Yen | | JPHQ | | Sell | | 397,873,000 | | 4,447,496 | | | | 11/16/10 | | | 147,582 | | | — | |
Japanese Yen | | BZWS | | Sell | | 191,800,000 | | 2,134,788 | | | | 11/16/10 | | | 61,956 | | | — | |
Japanese Yen | | HSBC | | Sell | | 207,909,000 | | 2,312,695 | | | | 11/17/10 | | | 65,696 | | | — | |
Japanese Yen | | BZWS | | Sell | | 794,439,000 | | 8,894,998 | | | | 11/17/10 | | | 309,011 | | | — | |
Japanese Yen | | UBSW | | Sell | | 317,836,000 | | 3,557,998 | | | | 11/17/10 | | | 122,950 | | | — | |
Euro | | DBAB | | Sell | | 933,877 | | 1,387,741 | | | | 11/18/10 | | | 52,944 | | | — | |
Euro | | UBSW | | Sell | | 4,794,427 | | 7,161,915 | | | | 11/18/10 | | | 309,205 | | | — | |
Japanese Yen | | BZWS | | Sell | | 1,107,834,000 | | 12,453,002 | | | | 11/18/10 | | | 479,567 | | | — | |
Euro | | DBAB | | Sell | | 1,300,570 | | 1,948,904 | | | | 11/29/10 | | | 90,094 | | | — | |
Japanese Yen | | BOFA | | Sell | | 859,147,000 | | 9,695,551 | | | | 11/29/10 | | | 406,536 | | | — | |
Japanese Yen | | BZWS | | Sell | | 1,251,786,000 | | 14,231,997 | | | | 11/29/10 | | | 697,808 | | | — | |
Japanese Yen | | CITI | | Sell | | 310,702,000 | | 3,557,996 | | | | 11/29/10 | | | 198,716 | | | — | |
Norwegian Krone | | UBSW | | Buy | | 71,182,000 | | 8,325,088 | | EUR | | 11/29/10 | | | 175,381 | | | — | |
Japanese Yen | | DBAB | | Sell | | 770,370,000 | | 8,895,008 | | | | 12/01/10 | | | 565,291 | | | — | |
Norwegian Krone | | UBSW | | Buy | | 23,030,000 | | 2,670,145 | | EUR | | 12/01/10 | | | 89,718 | | | — | |
Mexican Peso | | CITI | | Sell | | 53,811,000 | | 3,962,227 | | | | 12/02/10 | | | 28,276 | | | — | |
Chinese Yuan | | HSBC | | Buy | | 14,977,000 | | 2,261,362 | | | | 12/06/10 | | | — | | | (49,772 | ) |
Chinese Yuan | | HSBC | | Buy | | 18,870,000 | | 1,896,155 | | EUR | | 12/06/10 | | | 76,515 | | | — | |
Euro | | UBSW | | Sell | | 1,343,551 | | 2,021,333 | | | | 12/07/10 | | | 101,172 | | | — | |
Chinese Yuan | | JPHQ | | Buy | | 11,237,841 | | 1,689,901 | | | | 12/13/10 | | | — | | | (30,027 | ) |
Chinese Yuan | | HSBC | | Buy | | 22,539,443 | | 3,389,900 | | | | 12/14/10 | | | — | | | (60,612 | ) |
Chinese Yuan | | HSBC | | Buy | | 22,626,632 | | 3,404,805 | | | | 12/15/10 | | | — | | | (62,515 | ) |
Malaysian Ringgit | | JPHQ | | Buy | | 13,361,013 | | 3,917,037 | | | | 12/16/10 | | | — | | | (59,560 | ) |
TGB-24
Franklin Templeton Variable Insurance Products Trust
Statement of Investments, December 31, 2009 (continued)
| | | | | | | | | | | | | | | | | | | |
| Templeton Global Bond Securities Fund | |
| | | | | | | | |
| Currency | | Counterparty | | Type | | Quantity | | Contract
Amount* | | | | Settlement
Date | | Unrealized
Appreciation | | Unrealized
Depreciation | |
Malaysian Ringgit | | JPHQ | | Buy | | 12,406,016 | | 3,638,235 | | | | 12/17/10 | | $ | — | | $ | (56,563 | ) |
Malaysian Ringgit | | JPHQ | | Buy | | 14,845,634 | | 4,334,492 | | | | 12/21/10 | | | — | | | (48,904 | ) |
Malaysian Ringgit | | HSBC | | Buy | | 19,742,443 | | 5,743,239 | | | | 12/22/10 | | | — | | | (44,194 | ) |
Malaysian Ringgit | | HSBC | | Buy | | 9,639,266 | | 2,802,438 | | | | 12/23/10 | | | — | | | (19,941 | ) |
Japanese Yen | | CITI | | Sell | | 286,112,008 | | 3,133,740 | | | | 12/28/10 | | | 37,352 | | | — | |
Japanese Yen | | BZWS | | Sell | | 285,057,504 | | 3,133,740 | | | | 12/28/10 | | | 48,765 | | | — | |
Japanese Yen | | JPHQ | | Sell | | 285,510,329 | | 3,133,740 | | | | 12/28/10 | | | 43,864 | | | — | |
Malaysian Ringgit | | HSBC | | Buy | | 10,905,927 | | 3,166,278 | | | | 12/28/10 | | | — | | | (18,521 | ) |
Malaysian Ringgit | | JPHQ | | Buy | | 56,089,316 | | 16,324,490 | | | | 1/04/11 | | | — | | | (138,265 | ) |
Swedish Krona | | DBAB | | Buy | | 136,332,733 | | 13,223,991 | | EUR | | 1/04/11 | | | 179,865 | | | — | |
| | | | | | | | | | | | | | | | |
Unrealized appreciation (depreciation) | | | | | | | | | | | | | 42,373,279 | | | (47,072,339 | ) |
| | | | | | | | | | | | | | | | |
Net unrealized appreciation (depreciation) | | | | | | | | | | | | | | | $ | (4,699,060 | ) |
| | | | | | | | | | | | | | | | | | | |
*In U.S. dollars unless otherwise indicated.
At December 31, 2009, the Fund had the following interest rate swap contracts outstanding. See Note 1(d).
| | | | | | | | | | | | | | | | | | |
| Counterparty | | Pay/Receive
Floating Rate | | Fixed
Rate | | Floating
Rate | | Notional Amount | | | | Expiration
Date | | Unrealized
Appreciation | | Unrealized
Depreciation |
MLCO | | Pay | | 7.094% | | Tasa Nominal Annual Rate | | 5,960,000,000 | | CLP | | 6/16/18 | | $ | 934,526 | | $ | — |
| | | | | | | | | | | | | | | |
See Abbreviations on page TGB-38.
TGB-25
Franklin Templeton Variable Insurance Products Trust
Financial Statements
Statement of Assets and Liabilities
December 31, 2009
| | | |
| | | Templeton
Global Bond
Securities Fund |
Assets: | | | |
Investments in securities: | | | |
Cost - Unaffiliated issuers | | $ | 1,563,861,271 |
Cost - Repurchase agreements | | | 18,122,943 |
| | | |
Total cost of investments | | $ | 1,581,984,214 |
| | | |
Value - Unaffiliated issuers | | $ | 1,658,519,499 |
Value - Repurchase agreements | | | 18,122,943 |
| | | |
Total value of investments | | | 1,676,642,442 |
Cash | | | 1,440,000 |
Foreign currency, at value (cost $1,458,856) | |
| 1,459,329
|
Receivables: | | | |
Investment securities sold | | | 252,065 |
Capital shares sold | | | 4,229,262 |
Interest | | | 30,372,551 |
Due from brokers | | | 4,310,000 |
Unrealized appreciation on forward exchange contracts | | | 42,373,279 |
Unrealized appreciation on swap contracts | | | 934,526 |
Other assets | | | 185 |
| | | |
Total assets | | | 1,762,013,639 |
| | | |
Liabilities: | | | |
Payables: | | | |
Capital shares redeemed | | | 1,075,765 |
Affiliates | | | 1,303,863 |
Due to brokers | | | 1,440,000 |
Unrealized depreciation on forward exchange contracts | | | 47,072,339 |
Accrued expenses and other liabilities | | | 502,582 |
| | | |
Total liabilities | | | 51,394,549 |
| | | |
Net assets, at value | | $ | 1,710,619,090 |
| | | |
Net assets consist of: | | | |
Paid-in capital | | $ | 1,593,198,360 |
Undistributed net investment income | | | 24,514,511 |
Net unrealized appreciation (depreciation) | | | 91,114,847 |
Accumulated net realized gain (loss) | | | 1,791,372 |
| | | |
Net assets, at value | | $ | 1,710,619,090 |
| | | |
The accompanying notes are an integral part of these financial statements.
TGB-26
Franklin Templeton Variable Insurance Products Trust
Financial Statements (continued)
Statement of Assets and Liabilities (continued)
December 31, 2009
| | | |
| | | Templeton
Global Bond
Securities Fund |
Class 1: | | | |
Net assets, at value | | $ | 195,662,342 |
| | | |
Shares outstanding | | | 11,039,984 |
| | | |
Net asset value and maximum offering price per share | | $ | 17.72 |
| | | |
Class 2: | | | |
Net assets, at value | | $ | 1,262,783,137 |
| | | |
Shares outstanding | | | 72,845,250 |
| | | |
Net asset value and maximum offering price per share | | $ | 17.34 |
| | | |
Class 3: | | | |
Net assets, at value | | $ | 143,263,974 |
| | | |
Shares outstanding | | | 8,267,331 |
| | | |
Net asset value and maximum offering price per sharea | | $ | 17.33 |
| | | |
Class 4: | | | |
Net assets, at value | | $ | 108,909,637 |
| | | |
Shares outstanding | | | 6,184,122 |
| | | |
Net asset value and maximum offering price per share | | $ | 17.61 |
| | | |
aRedemption price is equal to net asset value less contingent deferred sales charges, if applicable.
The accompanying notes are an integral part of these financial statements.
TGB-27
Franklin Templeton Variable Insurance Products Trust
Financial Statements (continued)
Statement of Operations
for the year ended December 31, 2009
| | | | |
| | | Templeton
Global Bond
Securities Fund | |
Investment income: | | | | |
Interest (net of foreign taxes of $2,040,409) | | $ | 87,426,778 | |
| | | | |
Expenses: | | | | |
Management fees (Note 3a) | | | 6,519,570 | |
Distribution fees: (Note 3c) | | | | |
Class 2 | | | 2,497,644 | |
Class 3 | | | 328,848 | |
Class 4 | | | 257,355 | |
Unaffiliated transfer agent fees | | | 3,226 | |
Custodian fees (Note 4) | | | 541,070 | |
Reports to shareholders | | | 280,355 | |
Professional fees | | | 71,644 | |
Trustees’ fees and expenses | | | 8,901 | |
Other | | | 79,828 | |
| | | | |
Total expenses | | | 10,588,441 | |
Expense reductions (Note 4) | | | (8,852 | ) |
| | | | |
Net expenses | | | 10,579,589 | |
| | | | |
Net investment income | | | 76,847,189 | |
| | | | |
Realized and unrealized gains (losses): | | | | |
Net realized gain (loss) from: | | | | |
Investments | | | (30,117,649 | ) |
Foreign currency transactions | | | 86,880,427 | |
Swap contracts | | | 6,565,243 | |
| | | | |
Net realized gain (loss) | | | 63,328,021 | |
| | | | |
Net change in unrealized appreciation (depreciation) on: | | | | |
Investments | | | 207,353,185 | |
Translation of other assets and liabilities denominated in foreign currencies | | | (107,914,839 | ) |
| | | | |
Net change in unrealized appreciation (depreciation) | | | 99,438,346 | |
| | | | |
Net realized and unrealized gain (loss) | | | 162,766,367 | |
| | | | |
Net increase (decrease) in net assets resulting from operations | | $ | 239,613,556 | |
| | | | |
The accompanying notes are an integral part of these financial statements.
TGB-28
Franklin Templeton Variable Insurance Products Trust
Financial Statements (continued)
Statements of Changes in Net Assets
| | | | | | | | |
| | | Templeton Global Bond
Securities Fund | |
| | | Year Ended December 31, | |
| | | 2009 | | | 2008 | |
| | | | |
Increase (decrease) in net assets: | | | | | | | | |
Operations: | | | | | | | | |
Net investment income | | $ | 76,847,189 | | | $ | 47,173,150 | |
Net realized gain (loss) from investments, foreign currency transactions and swap contracts | | | 63,328,021 | | | | 36,014,213 | |
Net change in unrealized appreciation (depreciation) on investments and translation of other assets and liabilities denominated in foreign currencies | | | 99,438,346 | | | | (32,739,812 | ) |
| | | | |
Net increase (decrease) in net assets resulting from operations | | | 239,613,556 | | | | 50,447,551 | |
| | | | |
Distributions to shareholders from: | | | | | | | | |
Net investment income and net foreign currency gains: | | | | | | | | |
Class 1 | | | (23,763,176 | ) | | | (8,184,833 | ) |
Class 2 | | | (139,472,843 | ) | | | (26,397,120 | ) |
Class 3 | | | (18,449,432 | ) | | | (4,932,732 | ) |
Class 4 | | | (10,152,433 | ) | | | (162,330 | ) |
| | | | |
Total distributions to shareholders | | | (191,837,884 | ) | | | (39,677,015 | ) |
| | | | |
Capital share transactions: (Note 2) | | | | | | | | |
Class 1 | | | (33,006,590 | ) | | | 81,904,183 | |
Class 2 | | | 435,496,396 | | | | 305,411,151 | |
Class 3 | | | 11,495,009 | | | | 36,362,798 | |
Class 4 | | | 63,139,007 | | | | 41,657,210 | |
| | | | |
Total capital share transactions | | | 477,123,822 | | | | 465,335,342 | |
| | | | |
Redemption fees | | | 26,899 | | | | 75,291 | |
| | | | |
Net increase (decrease) in net assets | | | 524,926,393 | | | | 476,181,169 | |
Net assets: | | | | | | | | |
Beginning of year | | | 1,185,692,697 | | | | 709,511,528 | |
| | | | |
End of year | | $ | 1,710,619,090 | | | $ | 1,185,692,697 | |
| | | | |
Undistributed net investment income included in net assets: | | | | | | | | |
End of year | | $ | 24,514,511 | | | $ | 109,190,320 | |
| | | | |
The accompanying notes are an integral part of these financial statements.
TGB-29
Franklin Templeton Variable Insurance Products Trust
Notes to Financial Statements
Templeton Global Bond Securities Fund
1. ORGANIZATION AND SIGNIFICANT ACCOUNTING POLICIES
Franklin Templeton Variable Insurance Products Trust (Trust) is registered under the Investment Company Act of 1940, as amended, (1940 Act) as an open-end investment company, consisting of twenty-two separate funds. The Templeton Global Bond Securities Fund (Fund) is included in this report. The financial statements of the remaining funds in the Trust are presented separately. Shares of the Fund are generally sold only to insurance company separate accounts to fund the benefits of variable life insurance policies or variable annuity contracts. The Fund offers four classes of shares: Class 1, Class 2, Class 3, and Class 4. Each class of shares differs by its distribution fees, voting rights on matters affecting a single class and its exchange privilege.
Effective May 1, 2009, the Templeton Global Income Securities Fund was renamed the Templeton Global Bond Securities Fund.
The following summarizes the Fund’s significant accounting policies.
a. Security Valuation
Government securities and municipal securities generally trade in the over-the-counter market rather than on a securities exchange. The Fund may utilize independent pricing services, quotations from bond dealers, and information with respect to bond and note transactions, to assist in determining a current market value for each security. The Fund’s pricing services may use valuation models or matrix pricing which considers information with respect to comparable bond and note transactions, quotations from bond dealers, or by reference to other securities that are considered comparable in such characteristics as rating, interest rate and maturity date, option adjusted spread models, prepayment projections, interest rate spreads and yield curves, to determine current value. Debt securities denominated in a foreign currency are converted into their U.S. dollar equivalent at the foreign exchange rate in effect at the close of the NYSE on the date that the values of the foreign debt securities are determined.
The Fund has procedures to determine the fair value of individual securities and other assets for which market prices are not readily available or which may not be reliably priced. Methods for valuing these securities may include: fundamental analysis based upon the underlying investment book value, anticipated future cash flows, market changes in comparable or similar securities, matrix pricing, discounts from market prices of similar securities, or discounts applied due to the nature and duration of restrictions on the disposition of the securities. Due to the inherent uncertainty of valuations of such securities, the fair values may differ significantly from the values that would have been used had a ready market for such investments existed. Occasionally, events occur between the time at which trading in a security is completed and the close of the NYSE that might call into question the availability (including the reliability) of the value of a portfolio security held by the Fund. If such an event occurs, the securities may be valued using fair value procedures, which may include the use of independent pricing services. All security valuation procedures are approved by the Fund’s Board of Trustees.
b. Foreign Currency Translation
Portfolio securities and other assets and liabilities denominated in foreign currencies are translated into U.S. dollars based on the exchange rate of such currencies against U.S. dollars on the date of valuation. The Fund may enter into foreign currency exchange contracts to facilitate transactions denominated in a foreign currency. Purchases and sales of securities, income and expense items denominated in foreign currencies are translated into U.S. dollars at the exchange rate in effect on the transaction date. Occasionally, events may impact the availability or reliability of foreign exchange rates used to convert the U.S. dollar equivalent value. If such an event occurs, the foreign exchange rate will be valued at fair value using procedures established and approved by the Fund’s Board of Trustees.
The Fund does not separately report the effect of changes in foreign exchange rates from changes in market prices on securities held. Such changes are included in net realized and unrealized gain or loss from investments on the Statement of Operations.
Realized foreign exchange gains or losses arise from sales of foreign currencies, currency gains or losses realized between the trade and settlement dates on securities transactions and the difference between the recorded amounts of dividends, interest, and
TGB-30
Franklin Templeton Variable Insurance Products Trust
Notes to Financial Statements (continued)
Templeton Global Bond Securities Fund
1. ORGANIZATION AND SIGNIFICANT ACCOUNTING POLICIES (continued)
b. Foreign Currency Translation (continued)
foreign withholding taxes and the U.S. dollar equivalent of the amounts actually received or paid. Net unrealized foreign exchange gains and losses arise from changes in foreign exchange rates on foreign denominated assets and liabilities other than investments in securities held at the end of the reporting period.
c. Joint Repurchase Agreement
The Fund may enter into a joint repurchase agreement whereby its uninvested cash balance is deposited into a joint cash account with other funds managed by the investment manager or an affiliate of the investment manager and is used to invest in one or more repurchase agreements. The value and face amount of the joint repurchase agreement are allocated to the funds based on their pro-rata interest. A repurchase agreement is accounted for as a loan by the fund to the seller, collateralized by securities which are delivered to the fund’s custodian. The market value, including accrued interest, of the initial collateralization is required to be at least 102% of the dollar amount invested by the funds, with the value of the underlying securities marked to market daily to maintain coverage of at least 100%. The joint repurchase agreement held by the Fund at year end had been entered into on December 31, 2009. The joint repurchase agreement is valued at cost which approximates market value.
d. Derivative Financial Instruments
The Fund may invest in derivative financial instruments (derivatives) in order to manage risk or gain exposure to various other investments or markets. Derivatives are financial contracts based on an underlying or notional amount, require no initial investment or an initial net investment that is smaller than would normally be required to have a similar response to changes in market factors, and require or permit net settlement. Derivatives may contain various risks including the potential inability of the counterparty to fulfill their obligations under the terms of the contract, the potential for an illiquid secondary market, and the potential for market movements which may expose the Fund to gains or losses in excess of the amounts shown on the Statement of Assets and Liabilities.
Derivatives are marked to market daily based upon quotations from market makers or the Fund’s independent pricing services and the Fund’s net benefit or obligation under the contract, as measured by the fair market value of the contract, is included in net assets. Realized gain and loss and unrealized appreciation and depreciation on these contracts for the period are included in the Statement of Operations.
The Fund generally enters into forward exchange contracts in order to hedge against fluctuations in foreign exchange rates or to gain exposure to certain foreign currencies. A forward exchange contract is an agreement between the Fund and a counterparty to buy or sell a foreign currency for a specific exchange rate on a future date. Pursuant to the terms of the forward exchange contracts, cash or securities may be required to be deposited as collateral.
The Fund generally enters into interest rate swap contracts in order to manage interest rate risk. An interest rate swap is an agreement between the Fund and a counterparty to exchange cash flows based on the difference between two interest rates, applied to a notional principal amount. Over the term of the contract, contractually required payments to be paid and to be received are accrued daily and recorded as unrealized depreciation and appreciation until the payments are made, at which time they are realized. Pursuant to the terms of the interest rate swap contract, cash or securities may be required to be deposited as collateral. At December 31, 2009, the Fund holds $1,440,000 in cash as collateral for derivative financial instruments. Unrestricted cash may be invested according to the Fund’s investment objectives.
See Note 9 regarding other derivative information.
e. Income Taxes
No provision has been made for U.S. income taxes because it is the Fund’s policy to qualify as a regulated investment company under the Internal Revenue Code and to distribute to shareholders substantially all of its taxable income and net realized gains.
TGB-31
Franklin Templeton Variable Insurance Products Trust
Notes to Financial Statements (continued)
Templeton Global Bond Securities Fund
1. ORGANIZATION AND SIGNIFICANT ACCOUNTING POLICIES (continued)
e. Income Taxes (continued)
The Fund has reviewed the tax positions, taken on federal income tax returns, for each of the three open tax years and as of December 31, 2009, and has determined that no provision for income tax is required in the Fund’s financial statements.
Foreign securities held by the Fund may be subject to foreign taxation on interest income received. Foreign taxes, if any, are recorded based on the tax regulations and rates that exist in the foreign markets in which the Fund invests.
f. Security Transactions, Investment Income, Expenses and Distributions
Security transactions are accounted for on trade date. Realized gains and losses on security transactions are determined on a specific identification basis. Interest income and estimated expenses are accrued daily. Amortization of premium and accretion of discount on debt securities are included in interest income. Distributions to shareholders are recorded on the ex-dividend date and are determined according to income tax regulations (tax basis). Distributable earnings determined on a tax basis may differ from earnings recorded in accordance with accounting principles generally accepted in the United States of America. These differences may be permanent or temporary. Permanent differences are reclassified among capital accounts to reflect their tax character. These reclassifications have no impact on net assets or the results of operations. Temporary differences are not reclassified, as they may reverse in subsequent periods.
Common expenses incurred by the Trust are allocated among the funds based on the ratio of net assets of each fund to the combined net assets of the Trust. Fund specific expenses are charged directly to the fund that incurred the expense.
Realized and unrealized gains and losses and net investment income, not including class specific expenses, are allocated daily to each class of shares based upon the relative proportion of net assets of each class. Differences in per share distributions, by class, are generally due to differences in class specific expenses.
Inflation-indexed bonds provide an inflation hedge through periodic increases or decreases in the security’s interest accruals and principal redemption value, by amounts corresponding to the current rate of inflation. Any such adjustments, including adjustments to principal redemption value, are recorded as interest income.
g. Accounting Estimates
The preparation of financial statements in accordance with accounting principles generally accepted in the United States of America requires management to make estimates and assumptions that affect the reported amounts of assets and liabilities at the date of the financial statements and the amounts of income and expenses during the reporting period. Actual results could differ from those estimates.
h. Redemption Fees
Redemptions and exchanges of interests in an insurance company subaccount that invests in Class 3 shares of the Fund will be subject to a 1.0% short term trading fee if the interest in the subaccount has been held for less than 60 days. Such fees are retained by the Fund and accounted for as an addition to paid-in capital.
i. Guarantees and Indemnifications
Under the Trust’s organizational documents, its officers and trustees are indemnified by the Trust against certain liabilities arising out of the performance of their duties to the Trust. Additionally, in the normal course of business, the Trust, on behalf of the Fund, enters into contracts with service providers that contain general indemnification clauses. The Trust’s maximum exposure under these arrangements is unknown as this would involve future claims that may be made against the Trust that have not yet occurred. Currently, the Trust expects the risk of loss to be remote.
TGB-32
Franklin Templeton Variable Insurance Products Trust
Notes to Financial Statements (continued)
Templeton Global Bond Securities Fund
2. SHARES OF BENEFICIAL INTEREST
At December 31, 2009, there were an unlimited number of shares authorized (without par value). Transactions in the Fund’s shares were as follows:
| | | | | | | | | | | | | | |
| | | Year Ended December 31, | |
| | | 2009 | | | 2008a | |
| | | Shares | | | Amount | | | Shares | | | Amount | |
Class 1 Shares: | | | | | | | | | | | | | | |
Shares sold | | 2,951,874 | | | $ | 50,898,302 | | | 8,101,454 | | | $ | 141,208,761 | |
Shares issued in reinvestment of distributions | | 1,490,789 | | | | 23,763,176 | | | 492,765 | | | | 8,184,833 | |
Shares redeemed | | (6,068,722 | ) | | | (107,668,068 | ) | | (4,030,383 | ) | | | (67,489,411 | ) |
| | | | |
Net increase (decrease) | | (1,626,059 | ) | | $ | (33,006,590 | ) | | 4,563,836 | | | $ | 81,904,183 | |
| | | | |
Class 2 Shares: | | | | | | | | | | | | | | |
Shares sold | | 24,341,548 | | | $ | 411,300,147 | | | 26,653,241 | | | $ | 454,110,268 | |
Shares issued in reinvestment of distributions | | 8,934,839 | | | | 139,472,843 | | | 1,616,480 | | | | 26,397,120 | |
Shares redeemed | | (6,858,618 | ) | | | (115,276,594 | ) | | (10,588,115 | ) | | | (175,096,237 | ) |
| | | | |
Net increase (decrease) | | 26,417,769 | | | $ | 435,496,396 | | | 17,681,606 | | | $ | 305,411,151 | |
| | | | |
Class 3 Shares: | | | | | | | | | | | | | | |
Shares sold | | 1,901,513 | | | $ | 32,238,548 | | | 4,221,478 | | | $ | 72,520,138 | |
Shares issued in reinvestment of distributions | | 1,182,656 | | | | 18,449,432 | | | 302,251 | | | | 4,932,732 | |
Shares redeemed | | (2,318,382 | ) | | | (39,192,971 | ) | | (2,479,464 | ) | | | (41,090,072 | ) |
| | | | |
Net increase (decrease) | | 765,787 | | | $ | 11,495,009 | | | 2,044,265 | | | $ | 36,362,798 | |
| | | | |
Class 4 Shares: | | | | | | | | | | | | | | |
Shares sold | | 3,243,291 | | | $ | 56,014,173 | | | 2,552,445 | | | $ | 42,834,654 | |
Shares issued on reinvestment of distributions | | 639,725 | | | | 10,152,433 | | | 9,768 | | | | 162,150 | |
Shares redeemed | | (178,649 | ) | | | (3,027,599 | ) | | (82,458 | ) | | | (1,339,594 | ) |
| | | | |
Net increase (decrease) | | 3,704,367 | | | $ | 63,139,007 | | | 2,479,755 | | | $ | 41,657,210 | |
| | | | |
| aFor | the period February 29, 2008 (effective date) to December 31, 2008 for Class 4. |
3. TRANSACTIONS WITH AFFILIATES
Franklin Resources, Inc. is the holding company for various subsidiaries that together are referred to as Franklin Templeton Investments. Certain officers and trustees of the Trust are also officers and/or directors of the following subsidiaries:
| | |
| Subsidiary | | Affiliation |
Franklin Advisers, Inc. (Advisers) | | Investment manager |
Franklin Templeton Services, LLC (FT Services) | | Administrative manager |
Franklin Templeton Distributors, Inc. (Distributors) | | Principal underwriter |
Franklin Templeton Investor Services, LLC (Investor Services) | | Transfer agent |
TGB-33
Franklin Templeton Variable Insurance Products Trust
Notes to Financial Statements (continued)
Templeton Global Bond Securities Fund
3. TRANSACTIONS WITH AFFILIATES (continued)
a. Management Fees
The Fund pays an investment management fee to Advisers based on the average daily net assets of the Fund as follows:
| | |
| Annualized Fee Rate | | Net Assets |
| 0.625% | | Up to and including $100 million |
| 0.500% | | Over $100 million, up to and including $250 million |
| 0.450% | | Over $250 million, up to and including $7.5 billion |
| 0.440% | | Over $7.5 billion, up to and including $10 billion |
| 0.430% | | Over $10 billion, up to and including $12.5 billion |
| 0.420% | | Over $12.5 billion, up to and including $15 billion |
| 0.400% | | In excess of $15 billion |
b. Administrative Fees
Under an agreement with Advisers, FT Services provides administrative services to the Fund. The fee is paid by Advisers based on average daily net assets, and is not an additional expense of the Fund.
c. Distribution Fees
The Fund’s Board of Trustees has adopted distribution plans for Class 2, Class 3, and Class 4 shares pursuant to Rule 12b-1 under the 1940 Act. Under the Fund’s compensation distribution plans, the Fund pays Distributors for costs incurred in connection with the servicing, sale and distribution of the Fund’s shares up to 0.25%, 0.35%, and 0.35% per year of its average daily net assets of Class 2, Class 3, and Class 4, respectively. The Board of Trustees has agreed to limit the current rate to 0.25% per year for Class 3.
d. Transfer Agent Fees
Investor Services, under terms of an agreement, performs shareholder servicing for the Fund and is not paid by the Fund for the services.
4. EXPENSE OFFSET ARRANGEMENT
The Fund has entered into an arrangement with its custodian whereby credits realized as a result of uninvested cash balances are used to reduce a portion of the Fund’s custodian expenses. During the year ended December 31, 2009, the custodian fees were reduced as noted in the Statement of Operations.
5. INCOME TAXES
During the year ended December 31, 2009, the Fund utilized $1,826,764 of capital loss carryforwards.
The tax character of distributions paid during the years ended December 31, 2009 and 2008, was as follows:
| | | | | | |
| | | 2009 | | 2008 |
Distributions paid from – ordinary income | | $ | 191,837,884 | | $ | 39,677,015 |
| | | | | |
TGB-34
Franklin Templeton Variable Insurance Products Trust
Notes to Financial Statements (continued)
Templeton Global Bond Securities Fund
5. INCOME TAXES (continued)
At December 31, 2009, the cost of investments, net unrealized appreciation (depreciation), undistributed ordinary income and undistributed long term capital gains for income tax purposes were as follows:
| | | | |
Cost of investments | | $ | 1,589,933,372 | |
| | | | |
| |
Unrealized appreciation | | $ | 136,465,368 | |
Unrealized depreciation | | | (49,756,298 | ) |
| | | | |
Net unrealized appreciation (depreciation) | | $ | 86,709,070 | |
| | | | |
Undistributed ordinary income | | $ | 25,236,218 | |
Undistributed long term capital gains | | | 4,479,007 | |
| | | | |
Distributable earnings | | $ | 29,715,225 | |
| | | | |
Net investment income differs for financial statement and tax purposes primarily due to differing treatments of foreign currency transactions, bond discounts and premiums, interest rate swaps, tax straddles and inflation related adjustments on foreign securities.
Net realized gains (losses) differ for financial statement and tax purposes primarily due to differing treatments of wash sales, foreign currency transactions, bond discounts and premiums, interest rate swaps, tax straddles, and inflation related adjustments on foreign securities.
6. INVESTMENT TRANSACTIONS
Purchases and sales of investments (excluding short term securities) for the year ended December 31, 2009, aggregated $777,496,199 and $258,530,446, respectively.
7. CREDIT RISK
At December 31, 2009, the Fund had 15.12% of its portfolio invested in high yield or other securities rated below investment grade. These securities may be more sensitive to economic conditions causing greater price volatility and are potentially subject to a greater risk of loss due to default than higher rated securities.
8. CONCENTRATION OF RISK
Investing in foreign securities may include certain risks and considerations not typically associated with investing in U.S. securities, such as fluctuating currency values and changing local and regional economic, political and social conditions, which may result in greater market volatility. In addition, certain foreign securities may not be as liquid as U.S. securities.
TGB-35
Franklin Templeton Variable Insurance Products Trust
Notes to Financial Statements (continued)
Templeton Global Bond Securities Fund
9. OTHER DERIVATIVE INFORMATION
At December 31, 2009, the Fund has invested in derivative contracts which are reflected on the Statement of Assets and Liabilities as follows:
| | | | | | | | | | |
| | | Asset Derivatives | | Liability Derivatives |
Derivative Contracts Not Accounted
for as Hedging Instruments | | Statement of Assets and
Liabilities Location | | Fair Value
Amount | | Statement of Assets and
Liabilities Location | | Fair Value
Amount |
Interest rate contracts | | Unrealized appreciation on swap contracts | | $ | 934,526 | | Unrealized depreciation on swap contracts | | $ | — |
Foreign exchange contracts | | Unrealized appreciation on forward exchange contracts | | | 42,373,279 | | Unrealized depreciation on forward exchange contracts | | | 47,072,339 |
For the period ended December 31, 2009, the effect of derivative contracts on the Fund’s Statement of Operations was as follows:
| | | | | | | | | | | | |
Derivative Contracts Not
Accounted for as Hedging
Instruments | | Statement of Operations Locations | | Realized Gain
(Loss) for the
Year Ended
December 31, 2009 | | Change in
Unrealized
Appreciation
(Depreciation) for
the Year Ended
December 31, 2009 | | | Average
Notional
Amount
Outstanding
During the
Yeara |
Interest rate contracts | | Net realized gain (loss) from swap contracts / Net change in unrealized appreciation (depreciation) on translation of other assets and liabilities denominated in foreign currencies | | $ | 6,565,243 | | $ | (3,038,752 | ) | | $ | 5,217,109 |
Foreign exchange contracts | | Net realized gain (loss) from foreign currency transactions / Net change in unrealized appreciation (depreciation) on translation of other assets and liabilities denominated in foreign currencies | | | 85,551,382 | | | (109,920,788 | ) | | | 1,532,178,029 |
aNotional amount represents the U.S. dollar equivalent based on the foreign exchange rate at the time of contract entry.
See Note 1(d) regarding derivative financial instruments.
10. CREDIT FACILITY
The Fund, together with other U.S. registered and foreign investment funds (collectively “Borrowers”), managed by Franklin Templeton Investments, are borrowers in a joint syndicated senior unsecured credit facility totaling $725 million (Global Credit Facility) to provide a source of funds to the Borrowers for temporary and emergency purposes, including the ability to meet future unanticipated or unusually large redemption requests. Effective January 22, 2010, the Fund renewed the Global Credit Facility, for a total of $750 million, maturing on January 21, 2011.
Under the terms of the Global Credit Facility, the Fund shall, in addition to interest charged on any borrowings made by the Fund and other costs incurred by the Fund, pay its share of fees and expenses incurred in connection with the implementation and maintenance of the Global Credit Facility, based upon its relative share of the aggregate net assets of all of the Borrowers, including an annual commitment fee of 0.10% based upon the unused portion of the Global Credit Facility, which is reflected on the Statement of Operations. During the year ended December 31, 2009, the Fund did not utilize the Global Credit Facility.
TGB-36
Franklin Templeton Variable Insurance Products Trust
Notes to Financial Statements (continued)
Templeton Global Bond Securities Fund
11. FAIR VALUE MEASUREMENTS
The Fund follow a fair value hierarchy that distinguishes between market data obtained from independent sources (observable inputs) and the Fund’s own market assumptions (unobservable inputs). These inputs are used in determining the value of the Fund’s investments and are summarized in the following fair value hierarchy:
| | • | | Level 1 – quoted prices in active markets for identical securities |
| | • | | Level 2 – other significant observable inputs (including quoted prices for similar securities, interest rates, prepayment speed, credit risk, etc.) |
| | • | | Level 3 – significant unobservable inputs (including the Fund’s own assumptions in determining the fair value of investments) |
The inputs or methodology used for valuing securities are not an indication of the risk associated with investing in those securities.
The following is a summary of the inputs used as of December 31, 2009, in valuing the Fund’s assets and liabilities carried at fair value:
At December 31, 2009, all of the Fund’s investments in securities, swaps and forward exchange contracts carried at fair value were in Level 2 inputs. For detailed country descriptions, see the accompanying Statement of Investments.
12. NEW ACCOUNTING PRONOUNCEMENTS
In January 2010, the Financial Accounting Standards Board issued Accounting Standards Update (ASU) No. 2010-6, Fair Value Measurements and Disclosures (Topic 820): Improving Disclosures about Fair Value Measurements. ASU No. 2010-6 enhances and clarifies existing fair value measurement disclosure requirements and is effective for interim and annual periods beginning after December 15, 2009. The Fund is currently evaluating the impact, if any, of applying the provisions of ASU No. 2010-6.
13. SUBSEQUENT EVENTS
The Fund has evaluated subsequent events through February 10, 2010, the issuance date of the financial statements and determined that no events have occurred that require disclosure.
TGB-37
Franklin Templeton Variable Insurance Products Trust
Notes to Financial Statements (continued)
Templeton Global Bond Securities Fund
ABBREVIATIONS
| | | | |
Counterparty BOFA - Bank of America N.A. BZWS - Barclays Bank PLC CITI - Citibank N.A. DBAB - Deutsche Bank AG FBCO - - Credit Suisse International HSBC - HSBC Bank USA JPHQ - JPMorgan Chase Bank, N.A. MLCO - Merrill Lynch Capital Services, Inc. UBSW - UBS AG | | Currency AUD - Australian Dollar BRL - Brazilian Real CLP - Chilean Peso EUR - Euro IDR - Indonesian Rupiah ILS - New Israeli Shekel JPY - Japanese Yen KRW - South Korean Won LKR - Sri Lankan Rupee MXN - Mexican Peso MYR - Malaysian Ringgit NOK - Norwegian Krone NZD - - New Zealand Dollar PEN - Peruvian Nuevo Sol PLN - Polish Zloty SEK - Swedish Krona | | Selected Portfolio AMBAC - American Municipal Bond Assurance Corp. BHAC - Berkshire Hathaway Assurance Corp. FRN - Floating Rate Note FSA - Financial Security Assurance Inc. GO - General Obligation ISD - Independent School District MTA - Metropolitan Transit Authority NATL - - National Public Financial Guarantee Corp. USD - Unified/Union School District |
TGB-38
Franklin Templeton Variable Insurance Products Trust
Templeton Global Bond Securities Fund
Report of Independent Registered Public Accounting Firm
To the Board of Trustees and Shareholders of
Franklin Templeton Variable Insurance Products Trust
In our opinion, the accompanying statement of assets and liabilities, including the statement of investments, and the related statements of operations and of changes in net assets and the financial highlights present fairly, in all material respects, the financial position of Templeton Global Bond Securities Fund (formerly Templeton Global Income Securities Fund) (one of the funds constituting the Franklin Templeton Variable Insurance Products Trust, hereafter referred to as the “Fund”) at December 31, 2009, the results of its operations for the year then ended, the changes in its net assets for each of the two years in the period then ended and the financial highlights for the periods presented, in conformity with accounting principles generally accepted in the United States of America. These financial statements and financial highlights (hereafter referred to as “financial statements”) are the responsibility of the Fund’s management. Our responsibility is to express an opinion on these financial statements based on our audits. We conducted our audits of these financial statements in accordance with the standards of the Public Company Accounting Oversight Board (United States). Those standards require that we plan and perform the audit to obtain reasonable assurance about whether the financial statements are free of material misstatement. An audit includes examining, on a test basis, evidence supporting the amounts and disclosures in the financial statements, assessing the accounting principles used and significant estimates made by management, and evaluating the overall financial statement presentation. We believe that our audits, which included confirmation of securities at December 31, 2009 by correspondence with the custodian and brokers, provide a reasonable basis for our opinion.
PricewaterhouseCoopers LLP
San Francisco, California
February 10, 2010
TGB-39
Franklin Templeton Variable Insurance Products Trust
Tax Designation (unaudited)
Templeton Global Bond Securities Fund
At December 31, 2009, more than 50% of the Fund’s total assets were invested in securities of foreign issuers. In most instances, foreign taxes were withheld from income paid to the Fund on these investments. The Fund elects to treat foreign taxes paid as allowed under Section 853 of the Internal Revenue Code. This election will allow shareholders of record as of the 2010 distribution date, to treat their proportionate share of foreign taxes paid by the Fund as having been paid directly by them. The shareholder shall consider these amounts as foreign taxes paid in the tax year in which they receive the Fund distribution.
TGB-40
TEMPLETON GROWTH SECURITIES FUND
We are pleased to bring you Templeton Growth Securities Fund’s annual report for the fiscal year ended December 31, 2009.
Performance Summary as of 12/31/09
Average annual total return of Class 4 shares* represents the average annual change in value, assuming reinvestment of dividends and capital gains. Average returns smooth out variations in returns, which can be significant; they are not the same as year-by-year results.
Periods ended 12/31/09
| | | | | | |
| | | 1-Year | | 5-Year | | 10-Year |
Average Annual Total Return | | +30.98% | | +0.64% | | +2.73% |
*For the period beginning 2/29/08, Class 4 performance reflects a 12b-1 fee expense of 0.35% per year, which affects future performance. Class 4 performance prior to 2/29/08 reflects historical Class 1 performance, which does not include a 12b-1 fee expense. Since 2/29/08 (effective date), the average annual total return of Class 4 shares was -8.99%.
Total Return Index Comparison for a Hypothetical $10,000 Investment (1/1/00–12/31/09)
The graph below shows the change in value of a hypothetical $10,000 investment in the Fund over the indicated period and includes reinvestment of any income or distributions. The Fund’s performance* is compared to the performance of the Morgan Stanley Capital International (MSCI) World Index. One cannot invest directly in an index, and an index is not representative of the Fund’s portfolio. Please see Important Notes to Performance Information preceding the Fund Summaries.
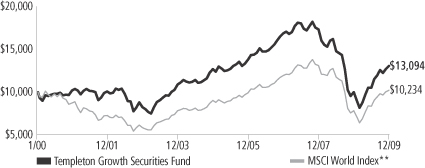
**Source: © 2009 Morningstar. Please see Index Descriptions following the Fund Summaries.
Templeton Growth Securities Fund – Class 4
Performance reflects the Fund’s Class 4 operating expenses, but does not include any contract fees, expenses or sales charges. If they had been included, performance would be lower. These charges and deductions, particularly for variable life policies, can have a significant effect on contract values and insurance benefits. See the contract prospectus for a complete description of these expenses, including sales charges.
Performance data represent past performance, which does not guarantee future results. Investment return and principal value will fluctuate, and you may have a gain or loss when you sell your shares.
Current performance may differ from figures shown.
TG-1
Fund Goal and Main Investments: Templeton Growth Securities Fund seeks long-term capital growth. The Fund normally invests primarily in equity securities of companies located anywhere in the world, including those in the U.S. and in emerging markets.
Performance Overview
You can find the Fund’s one-year total return in the Performance Summary. The Fund performed comparably to the +30.79% total return of the MSCI World Index for the period under review.1
Economic and Market Overview
Equity markets entered 2009 largely pricing in a possible economic depression and systemic solvency crisis, scenarios that were ultimately averted by one of the most aggressive global policy responses in financial history. As government monetary and fiscal intervention began to gain traction toward the end of the first quarter, equities bottomed and largely reversed their decline, economic growth stabilized and rebounded, and confidence was rekindled as investors began to believe the global financial system was finally on the mend. Global equities rallied 73% from their March lows, led by the riskier, lower quality stocks that had been most vulnerable to a systemic meltdown or funding collapse.2 Emerging market economies fueled the recovery as governments aggressively incentivized lending and consumption, resulting in a dramatic statistical recovery that laid the groundwork for the developing world’s best annual equity rally on record. Growing demand from emerging markets supported commodity prices, which also posted record gains during the year. For most of the year, the fading U.S. dollar also helped underpin the rally in hard assets, while continued euro and yen strength created headwinds for regional recoveries.
Nonetheless, developed economies technically recovered by year-end, with Germany and France leading the eurozone out of a recession and both Japan and the U.S. exiting their longest recessions since World War II. Credit spreads narrowed as access to capital expanded and the private sector significantly reduced debt, though largely by transferring its liabilities to the public balance sheet. The growing indebtedness of sovereign governments exposed structural weaknesses in places like Dubai, Greece and Ireland, temporarily roiling markets toward the end
1. Source: © 2009 Morningstar. One cannot invest directly in an index, and an index is not representative of the Fund’s portfolio. Please see Index Descriptions following the Fund Summaries.
2. As measured by the MSCI All Country World Index. Source: © 2009 Morningstar. Please see Index Descriptions following the Fund Summaries.
Fund Risks: The Fund’s investments in stocks may offer the potential for long-term gains but can be subject to short-term price fluctuations. Foreign investing, especially in emerging markets, involves additional risks, including currency fluctuations, economic instability, market volatility, and political and social instability. By having significant investments in one or more countries or in particular sectors from time to time, the Fund may be at greater risk of adverse developments in a country or sector than a fund that invests more broadly. The Fund’s prospectus also includes a description of the main investment risks.
TG-2
of the year. Policymakers remained firmly committed to stimulus throughout the period, indicating that deflation worries persisted despite signs of economic stabilization. The U.S. Federal Reserve Board announced its intention to keep the benchmark lending rate “exceptionally low” for an extended period; the new Japanese administration trumpeted its fight against deflation; and even China restated its commitment to “moderately loose” policy. Still, policymakers began discussing exit strategies by period-end as interest rates remained at record lows and economic indicators rebounded.
Investment Strategy
Our investment philosophy is bottom up, value oriented and long term. In choosing investments, we will focus on the market price of a company’s securities relative to our evaluation of the company’s potential long-term earnings, asset value and cash flow. Among factors we may consider are a company’s historical value measures, including price/earnings ratio, profit margins and liquidation value. We do in-depth research to construct a bargain list from which we buy.
Manager’s Discussion
In 2009, the Fund’s major contributors to performance relative to the MSCI World Index included U.S. technology hardware and equipment manufacturer Seagate Technology, South Korean electronic device manufacturer Samsung Electronics3 and car maker Hyundai Motor.3 Key detractors from relative performance included U.S. biotechnology company Amgen, French telecommunications provider France Telecom and U.S. pharmaceutical company Pfizer.
By sector, our overweighted allocation and stock selection in consumer discretionary boosted relative results.4 In addition to Hyundai Motor, key contributors from this sector included U.K.-based retailer Kingfisher and U.S.-based online travel company Expedia. The Fund’s overweighting and stock selection in the information technology sector, one of the strongest performers in the index, also aided relative results, with a contribution from U.S.-based computer technology giant Microsoft.5 Underweighting and stock selection in the consumer staples sector also helped performance.6 Within the sector, U.S.-based beverage
3. This holding is not an index component.
4. The consumer discretionary sector comprises auto components; automobiles; food products; hotels, restaurants and leisure; Internet and catalog retail; media; multiline retail; and specialty retail in the SOI.
5. The information technology sector comprises communications equipment; computers and peripherals; electronic equipment, instruments and components; Internet software and services; IT services; semiconductors and semiconductor equipment; and software in the SOI.
6. The consumer staples sector comprises food and staples retailing, and food products in the SOI.
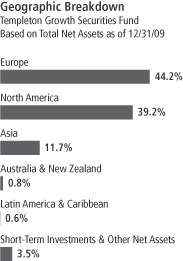
TG-3
company Dr. Pepper Snapple Group and Netherlands-based food, home care and personal products manufacturer Unilever performed well. We sold Dr. Pepper Snapple by period-end.
In contrast, some sectors weighed on the Fund’s relative performance. For example, our overweighted allocation and stock selection in health care hampered results.7 Our underweighting and stock selection in the materials sector, an index leader, also detracted from performance, mainly due to our small exposure to the robust metals and mining industry. 8 The Fund’s underweighting in the financials sector also hurt relative performance, largely resulting from lower-than-index allocations to the commercial banks and capital markets industries, which outperformed the sector and index.9
From a geographic perspective, the Fund’s underweighted allocation and stock selection in Asia helped relative results, particularly in Japan. Exposure to South Korea, which is not part of the index, also boosted performance. In addition, underweighting and stock selection in the U.S. was a key contributor to relative results. Stock selection in Europe hindered results relative to the MSCI World Index, particularly in France and the U.K. Underweighting in Australia also detracted from relative performance.
It is important to recognize the effect of currency movements on the Fund’s performance. In general, if the value of the U.S. dollar goes up compared with a foreign currency, an investment traded in that foreign currency will go down in value because it will be worth fewer U.S. dollars. This can have a negative effect on Fund performance. Conversely, when the U.S. dollar weakens in relation to a foreign currency, an investment traded in that foreign currency will increase in value, which can contribute to Fund performance. For the year ended December 31, 2009, the U.S. dollar fell in value relative to most non-U.S. currencies. As a result, the Fund’s performance was positively affected by the portfolio’s substantial investment in securities with non-U.S. currency exposure. However, one cannot expect the same result in future periods.
7. The health care sector comprises biotechnology, health care equipment and services, health care providers and services, life science tools and services, and pharmaceuticals in the SOI.
8. The materials sector comprises construction materials, metals and mining, and paper and forest products in the SOI.
9. The financials sector comprises capital markets, commercial banks, consumer finance, diversified financial services, insurance, and real estate management and development in the SOI
Top 10 Holdings
Templeton Growth Securities Fund 12/31/09
| | |
Company
Sector/Industry,
Country | | % of Total
Net Assets |
| Microsoft Corp. | | 3.3% |
| Software, U.S. | | |
| Oracle Corp. | | 2.9% |
| Software, U.S. | | |
| Accenture PLC, A | | 2.4% |
| IT Services, U.S. | | |
| Pfizer Inc. | | 2.3% |
| Pharmaceuticals, U.S. | | |
| Amgen Inc. | | 2.2% |
| Biotechnology, U.S. | | |
| Samsung Electronics Co. Ltd. | | 2.1% |
| Semiconductors & Semiconductor Equipment, South Korea | | |
| Sanofi-Aventis | | 1.9% |
| Pharmaceuticals, France | | |
| News Corp., A | | 1.9% |
| Media, U.S. | | |
| Vodafone Group PLC | | 1.9% |
| Wireless Telecommunication Services, U.K. | | |
| BP PLC | | 1.8% |
Oil, Gas & Consumable Fuels,
U.K. | | |
The dollar value, number of shares or principal amount, and names of all portfolio holdings are listed in the Fund’s Statement of Investments (SOI).
TG-4
Thank you for your participation in Templeton Growth Securities Fund. We look forward to serving your future investment needs.
The foregoing information reflects our analysis, opinions and portfolio holdings as of December 31, 2009, the end of the reporting period. The way we implement our main investment strategies and the resulting portfolio holdings may change depending on factors such as market and economic conditions. These opinions may not be relied upon as investment advice or an offer for a particular security. The information is not a complete analysis of every aspect of any market, country, industry, security or the Fund. Statements of fact are from sources considered reliable, but the investment manager makes no representation or warranty as to their completeness or accuracy. Although historical performance is no guarantee of future results, these insights may help you understand our investment management philosophy.
TG-5
Fund Expenses
As an investor in a variable insurance contract (Contract) that indirectly provides for investment in an underlying mutual fund, you can incur transaction and/or ongoing expenses at both the Fund level and the Contract level.
| • | | Transaction expenses can include sales charges (loads) on purchases, redemption fees, surrender fees, transfer fees and premium taxes. |
| • | | Ongoing expenses can include management fees, distribution and service (12b-1) fees, contract fees, annual maintenance fees, mortality and expense risk fees and other fees and expenses. All mutual funds and Contracts have some types of ongoing expenses. |
The expenses shown in the table are meant to highlight ongoing expenses at the Fund level only and do not include ongoing expenses at the Contract level, or transaction expenses at either the Fund or Contract level. While the Fund does not have transaction expenses, if the transaction and ongoing expenses at the Contract level were included, the expenses shown below would be higher. You should consult your Contract prospectus or disclosure document for more information.
The table shows Fund-level ongoing expenses and can help you understand these expenses and compare them with those of other mutual funds offered through the Contract. The table assumes a $1,000 investment held for the six months indicated. Please refer to the Fund prospectus for additional information on operating expenses.
Actual Fund Expenses
The first line (Actual) of the table provides actual account values and expenses. The “Ending Account Value” is derived from the Fund’s actual return, which includes the effect of ongoing Fund expenses, but does not include the effect of ongoing Contract expenses.
You can estimate the Fund-level expenses you incurred during the period by following these steps. Of course, your account value and expenses will differ from those in this illustration:
| 1. | Divide your account value by $1,000. |
If an account had an $8,600 value, then $8,600 ÷ $1,000 = 8.6.
| 2. | Multiply the result by the number under the heading “Fund-Level Expenses Incurred During Period.” |
If Fund-Level Expenses Incurred During Period were $7.50, then 8.6 x $7.50 = $64.50.
In this illustration, the estimated expenses incurred this period at the Fund level are $64.50.
Templeton Growth Securities Fund – Class 4
TG-6
Hypothetical Example for Comparison with Other Mutual Funds
Information in the second line (Hypothetical) of the table can help you compare ongoing expenses of the Fund with those of other mutual funds offered through the Contract. This information may not be used to estimate the actual ending account balance or expenses you incurred during the period. The hypothetical “Ending Account Value” is based on the Fund’s actual expense ratio and an assumed 5% annual rate of return before expenses, which does not represent the Fund’s actual return. The figure under the heading “Fund-Level Expenses Incurred During Period” shows the hypothetical expenses your account would have incurred under this scenario. You can compare this figure with the 5% hypothetical examples that appear in shareholder reports of other funds offered through a Contract.
| | | | | | | | | |
| Class 4 | | Beginning
Account Value 7/1/09 | | Ending
Account Value 12/31/09 | | Fund-Level Expenses Incurred
During Period* 7/1/09–12/31/09 |
Actual | | $ | 1,000 | | $ | 1,242.60 | | $ | 6.39 |
Hypothetical (5% return before expenses) | | $ | 1,000 | | $ | 1,019.51 | | $ | 5.75 |
*Expenses are calculated using the most recent six-month annualized expense ratio for the Fund’s Class 4 shares (1.13%), which does not include any ongoing expenses of the Contract for which the Fund is an investment option, multiplied by the average account value over the period, multiplied by 184/365 to reflect the one-half year period.
TG-7
Franklin Templeton Variable Insurance Products Trust
Financial Highlights
Templeton Growth Securities Fund
| | | | | | | | | | | | | | | | | | | | |
| | | Year Ended December 31, | |
| Class 1 | | 2009 | | | 2008 | | | 2007 | | | 2006 | | | 2005 | |
| | | | |
Per share operating performance | | | | | | | | | | | | | | | | | | | | |
(for a share outstanding throughout the year) | | | | | | | | | | | | | | | | | | | | |
Net asset value, beginning of year | | $ | 8.34 | | | $ | 15.68 | | | $ | 16.16 | | | $ | 13.98 | | | $ | 12.98 | |
| | | | |
Income from investment operationsa: | | | | | | | | | | | | | | | | | | | | |
Net investment incomeb | | | 0.17 | | | | 0.29 | | | | 0.27 | | | | 0.29 | | | | 0.24 | |
Net realized and unrealized gains (losses) | | | 2.36 | | | | (6.50 | ) | | | 0.19 | | | | 2.67 | | | | 0.92 | |
| | | | |
Total from investment operations | | | 2.53 | | | | (6.21 | ) | | | 0.46 | | | | 2.96 | | | | 1.16 | |
| | | | |
Less distributions from: | | | | | | | | | | | | | | | | | | | | |
Net investment income | | | (0.31 | ) | | | (0.26 | ) | | | (0.25 | ) | | | (0.23 | ) | | | (0.16 | ) |
Net realized gains | | | — | | | | (0.87 | ) | | | (0.69 | ) | | | (0.55 | ) | | | — | |
| | | | |
Total distributions | | | (0.31 | ) | | | (1.13 | ) | | | (0.94 | ) | | | (0.78 | ) | | | (0.16 | ) |
| | | | |
Net asset value, end of year | | $ | 10.56 | | | $ | 8.34 | | | $ | 15.68 | | | $ | 16.16 | | | $ | 13.98 | |
| | | | |
| | | | | |
Total returnc | | | 31.33% | | | | (42.13)% | | | | 2.55% | | | | 22.20% | | | | 9.06% | |
Ratios to average net assets | | | | | | | | | | | | | | | | | | | | |
Expenses before expense reduction | | | 0.79% | | | | 0.78% | | | | 0.77% | | | | 0.78% | | | | 0.82% | |
Expenses net of expense reduction | | | 0.79% | d | | | 0.78% | d | | | 0.76% | | | | 0.78% | d | | | 0.82% | d |
Net investment income | | | 2.00% | | | | 2.64% | | | | 1.64% | | | | 1.93% | | | | 1.81% | |
| | | | | |
Supplemental data | | | | | | | | | | | | | | | | | | | | |
Net assets, end of year (000’s) | | | $824,575 | | | | $371,700 | | | | $406,538 | | | | $413,871 | | | | $779,347 | |
Portfolio turnover rate | | | 14.95% | | | | 18.37% | | | | 20.45% | | | | 20.29%e | | | | 22.16% | |
aThe amount shown for a share outstanding throughout the period may not correlate with the Statement of Operations for the period due to the timing of sales and repurchases of the Fund shares in relation to income earned and/or fluctuating market value of the investments of the Fund.
bBased on average daily shares outstanding.
cTotal return does not include any fees, charges or expenses imposed by the variable annuity and life insurance contracts for which the Franklin Templeton Variable Insurance Products Trust serves as an underlying investment vehicle.
dBenefit of expense reduction rounds to less than 0.01%.
eExcludes the value of portfolio securities delivered as a result of a redemption in-kind.
The accompanying notes are an integral part of these financial statements.
TG-8
Franklin Templeton Variable Insurance Products Trust
Financial Highlights (continued)
Templeton Growth Securities Fund
| | | | | | | | | | | | | | | | | | | | |
| | | Year Ended December 31, | |
| Class 2 | | 2009 | | | 2008 | | | 2007 | | | 2006 | | | 2005 | |
| | | | |
Per share operating performance | | | | | | | | | | | | | | | | | | | | |
(for a share outstanding throughout the year) | | | | | | | | | | | | | | | | | | | | |
Net asset value, beginning of year | | $ | 8.20 | | | $ | 15.44 | | | $ | 15.93 | | | $ | 13.81 | | | $ | 12.83 | |
| | | | |
Income from investment operationsa: | | | | | | | | | | | | | | | | | | | | |
Net investment incomeb | | | 0.16 | | | | 0.29 | | | | 0.22 | | | | 0.24 | | | | 0.20 | |
Net realized and unrealized gains (losses) | | | 2.32 | | | | (6.44 | ) | | | 0.20 | | | | 2.63 | | | | 0.93 | |
| | | | |
Total from investment operations | | | 2.48 | | | | (6.15 | ) | | | 0.42 | | | | 2.87 | | | | 1.13 | |
Less distributions from: | | | | | | | | | | | | | | | | | | | | |
Net investment income | | | (0.28 | ) | | | (0.22 | ) | | | (0.22 | ) | | | (0.20 | ) | | | (0.15 | ) |
Net realized gains | | | — | | | | (0.87 | ) | | | (0.69 | ) | | | (0.55 | ) | | | — | |
| | | | |
Total distributions | | | (0.28 | ) | | | (1.09 | ) | | | (0.91 | ) | | | (0.75 | ) | | | (0.15 | ) |
| | | | |
Net asset value, end of year | | $ | 10.40 | | | $ | 8.20 | | | $ | 15.44 | | | $ | 15.93 | | | $ | 13.81 | |
| | | | |
| | | | | |
Total returnc | | | 31.10% | | | | (42.32)% | | | | 2.35% | | | | 21.81% | | | | 8.86% | |
Ratios to average net assets | | | | | | | | | | | | | | | | | | | | |
Expenses before expense reduction | | | 1.04% | | | | 1.03% | | | | 1.02% | | | | 1.03% | | | | 1.07% | |
Expenses net of expense reduction | | | 1.04% | d | | | 1.03% | d | | | 1.01% | | | | 1.03% | d | | | 1.07% | d |
Net investment income | | | 1.75% | | | | 2.39% | | | | 1.39% | | | | 1.68% | | | | 1.56% | |
| | | | | |
Supplemental data | | | | | | | | | | | | | | | | | | | | |
Net assets, end of year (000’s) | | | $1,718,894 | | | | $1,513,557 | | | | $3,182,203 | | | | $2,821,818 | | | | $1,912,825 | |
Portfolio turnover rate | | | 14.95% | | | | 18.37% | | | | 20.45% | | | | 20.29%e | | | | 22.16% | |
aThe amount shown for a share outstanding throughout the period may not correlate with the Statement of Operations for the period due to the timing of sales and repurchases of the Fund shares in relation to income earned and/or fluctuating market value of the investments of the Fund.
bBased on average daily shares outstanding.
cTotal return does not include any fees, charges or expenses imposed by the variable annuity and life insurance contracts for which the Franklin Templeton Variable Insurance Products Trust serves as an underlying investment vehicle.
dBenefit of expense reduction rounds to less than 0.01%.
eExcludes the value of portfolio securities delivered as a result of a redemption in-kind.
The accompanying notes are an integral part of these financial statements.
TG-9
Franklin Templeton Variable Insurance Products Trust
Financial Highlights (continued)
Templeton Growth Securities Fund
| | | | | | | | |
| | | Year Ended
December 31, | |
| Class 4 | | 2009 | | | 2008a | |
| | | | |
Per share operating performance | | | | | | | | |
(for a share outstanding throughout the year) | | | | | | | | |
Net asset value, beginning of year | | $ | 8.31 | | | $ | 14.08 | |
| | | | |
Income from investment operationsb: | | | | | | | | |
Net investment incomec | | | 0.14 | | | | 0.09 | |
Net realized and unrealized gains (losses) | | | 2.36 | �� | | | (4.73 | ) |
| | | | |
Total from investment operations | | | 2.50 | | | | (4.64 | ) |
| | | | |
Less distributions from: | | | | | | | | |
Net investment income | | | (0.31 | ) | | | (0.26 | ) |
Net realized gains | | | — | | | | (0.87 | ) |
| | | | |
Total distributions | | | (0.31 | ) | | | (1.13 | ) |
| | | | |
Net asset value, end of year | | $ | 10.50 | | | $ | 8.31 | |
| | | | |
| | |
Total returnd | | | 30.98% | | | | (35.79)% | |
Ratios to average net assetse | | | | | | | | |
Expensesf | | | 1.14% | | | | 1.13% | |
Net investment income | | | 1.65% | | | | 2.29% | |
| | |
Supplemental data | | | | | | | | |
Net assets, end of year (000’s) | | | $56,218 | | | | $24,877 | |
Portfolio turnover rate | | | 14.95% | | | | 18.37% | |
aFor the period February 29, 2008 (effective date) to December 31, 2008.
bThe amount shown for a share outstanding throughout the period may not correlate with the Statement of Operations for the period due to the timing of sales and repurchases of the Fund shares in relation to income earned and/or fluctuating market value of the investments of the Fund.
cBased on average daily shares outstanding.
dTotal return does not include any fees, charges or expenses imposed by the variable annuity and life insurance contracts for which the Franklin Templeton Variable Insurance Products Trust serves as an underlying investment vehicle. Total return is not annualized for periods less than one year.
eRatios are annualized for periods less than one year.
fBenefit of expense reduction rounds to less than 0.01%.
The accompanying notes are an integral part of these financial statements.
TG-10
Franklin Templeton Variable Insurance Products Trust
Statement of Investments, December 31, 2009
| | | | | | | |
| Templeton Growth Securities Fund | | Country | | Shares | | Value |
Common Stocks 95.6% | | | | | | | |
Aerospace & Defense 0.5% | | | | | | | |
BAE Systems PLC | | United Kingdom | | 2,237,601 | | $ | 12,953,598 |
aBAE Systems PLC, 144A | | United Kingdom | | 376 | | | 2,176 |
| | | | | | | |
| | | | | | | 12,955,774 |
| | | | | | | |
Air Freight & Logistics 2.8% | | | | | | | |
Deutsche Post AG | | Germany | | 1,087,062 | | | 21,084,816 |
FedEx Corp. | | United States | | 162,010 | | | 13,519,734 |
United Parcel Service Inc., B | | United States | | 657,270 | | | 37,707,580 |
| | | | | | | |
| | | | | | | 72,312,130 |
| | | | | | | |
Airlines 0.5% | | | | | | | |
bBritish Airways PLC | | United Kingdom | | 1,690,910 | | | 5,121,080 |
Qantas Airways Ltd. | | Australia | | 2,761,530 | | | 7,409,396 |
| | | | | | | |
| | | | | | | 12,530,476 |
| | | | | | | |
Auto Components 0.5% | | | | | | | |
Compagnie Generale des Etablissements Michelin, B | | France | | 180,850 | | | 13,870,670 |
| | | | | | | |
Automobiles 2.9% | | | | | | | |
Bayerische Motoren Werke AG | | Germany | | 413,707 | | | 18,950,429 |
Harley-Davidson Inc. | | United States | | 281,760 | | | 7,100,352 |
Hyundai Motor Co. Ltd. | | South Korea | | 268,950 | | | 27,908,111 |
Toyota Motor Corp. | | Japan | | 514,400 | | | 21,465,605 |
| | | | | | | |
| | | | | | | 75,424,497 |
| | | | | | | |
Biotechnology 2.6% | | | | | | | |
bAmgen Inc. | | United States | | 1,032,850 | | | 58,428,325 |
bBiogen Idec Inc. | | United States | | 165,200 | | | 8,838,200 |
| | | | | | | |
| | | | | | | 67,266,525 |
| | | | | | | |
Capital Markets 0.6% | | | | | | | |
The Bank of New York Mellon Corp. | | United States | | 133,400 | | | 3,731,198 |
bUBS AG | | Switzerland | | 725,948 | | | 11,255,823 |
| | | | | | | |
| | | | | | | 14,987,021 |
| | | | | | | |
Commercial Banks 4.5% | | | | | | | |
DBS Group Holdings Ltd. | | Singapore | | 784,000 | | | 8,590,254 |
HSBC Holdings PLC | | United Kingdom | | 2,174,976 | | | 25,077,428 |
ICICI Bank Ltd., ADR | | India | | 174,110 | | | 6,565,688 |
bIntesa Sanpaolo SpA | | Italy | | 5,720,440 | | | 25,793,851 |
bKB Financial Group Inc. | | South Korea | | 459,244 | | | 23,512,096 |
Mitsubishi UFJ Financial Group Inc. | | Japan | | 1,535,570 | | | 7,464,806 |
bUniCredit SpA | | Italy | | 5,673,777 | | | 19,025,149 |
| | | | | | | |
| | | | | | | 116,029,272 |
| | | | | | | |
Commercial Services & Supplies 0.5% | | | | | | | |
Brambles Ltd. | | Australia | | 2,234,040 | | | 13,591,973 |
| | | | | | | |
Communications Equipment 1.7% | | | | | | | |
bCisco Systems Inc. | | United States | | 1,108,480 | | | 26,537,011 |
Telefonaktiebolaget LM Ericsson, B | | Sweden | | 1,809,414 | | | 16,654,383 |
| | | | | | | |
| | | | | | | 43,191,394 |
| | | | | | | |
Computers & Peripherals 1.3% | | | | | | | |
bDell Inc. | | United States | | 724,720 | | | 10,406,979 |
Seagate Technology | | United States | | 1,364,178 | | | 24,814,398 |
| | | | | | | |
| | | | | | | 35,221,377 |
| | | | | | | |
TG-11
Franklin Templeton Variable Insurance Products Trust
Statement of Investments, December 31, 2009 (continued)
| | | | | | | |
| Templeton Growth Securities Fund | | Country | | Shares | | Value |
Common Stocks (continued) | | | | | | | |
Construction Materials 0.8% | | | | | | | |
CRH PLC | | Ireland | | 729,006 | | $ | 19,837,614 |
| | | | | | | |
Consumer Finance 0.6% | | | | | | | |
American Express Co. | | United States | | 359,270 | | | 14,557,620 |
| | | | | | | |
Diversified Financial Services 0.9% | | | | | | | |
bING Groep NV | | Netherlands | | 2,376,270 | | | 23,470,432 |
| | | | | | | |
Diversified Telecommunication Services 5.5% | | | | | | | |
AT&T Inc. | | United States | | 358,660 | | | 10,053,240 |
France Telecom SA | | France | | 1,547,880 | | | 38,619,877 |
KT Corp., ADR | | South Korea | | 862,201 | | | 14,502,221 |
Singapore Telecommunications Ltd. | | Singapore | | 15,434,000 | | | 34,151,362 |
Telefonica SA | | Spain | | 990,090 | | | 27,665,001 |
Telekom Austria AG | | Austria | | 526,010 | | | 7,491,923 |
bTelenor ASA | | Norway | | 682,327 | | | 9,540,853 |
| | | | | | | |
| | | | | | | 142,024,477 |
| | | | | | | |
Electronic Equipment, Instruments & Components 1.9% | | | | | | | |
bFlextronics International Ltd. | | Singapore | | 1,843,660 | | | 13,477,154 |
FUJIFILM Holdings Corp. | | Japan | | 428,310 | | | 12,852,064 |
Tyco Electronics Ltd. | | United States | | 967,238 | | | 23,745,693 |
| | | | | | | |
| | | | | | | 50,074,911 |
| | | | | | | |
Energy Equipment & Services 1.5% | | | | | | | |
Aker Solutions ASA | | Norway | | 519,840 | | | 6,766,601 |
Halliburton Co. | | United States | | 755,990 | | | 22,747,739 |
SBM Offshore NV | | Netherlands | | 548,602 | | | 10,817,458 |
| | | | | | | |
| | | | | | | 40,331,798 |
| | | | | | | |
Food & Staples Retailing 0.7% | | | | | | | |
CVS Caremark Corp. | | United States | | 330,830 | | | 10,656,034 |
Tesco PLC | | United Kingdom | | 1,043,835 | | | 7,207,883 |
| | | | | | | |
| | | | | | | 17,863,917 |
| | | | | | | |
Food Products 1.5% | | | | | | | |
Nestle SA | | Switzerland | | 480,840 | | | 23,318,522 |
Unilever NV | | Netherlands | | 462,727 | | | 15,068,931 |
| | | | | | | |
| | | | | | | 38,387,453 |
| | | | | | | |
Health Care Equipment & Supplies 2.2% | | | | | | | |
bBoston Scientific Corp. | | United States | | 1,587,930 | | | 14,291,370 |
Covidien PLC | | United States | | 594,418 | | | 28,466,678 |
Medtronic Inc. | | United States | | 344,060 | | | 15,131,759 |
Olympus Corp. | | Japan | | 800 | | | 25,640 |
| | | | | | | |
| | | | | | | 57,915,447 |
| | | | | | | |
Health Care Providers & Services 0.6% | | | | | | | |
Quest Diagnostics Inc. | | United States | | 265,060 | | | 16,004,323 |
| | | | | | | |
Hotels, Restaurants & Leisure 1.2% | | | | | | | |
Accor SA | | France | | 248,007 | | | 13,579,119 |
Compass Group PLC | | United Kingdom | | 2,415,126 | | | 17,437,614 |
| | | | | | | |
| | | | | | | 31,016,733 |
| | | | | | | |
Industrial Conglomerates 4.3% | | | | | | | |
General Electric Co. | | United States | | 1,217,400 | | | 18,419,262 |
TG-12
Franklin Templeton Variable Insurance Products Trust
Statement of Investments, December 31, 2009 (continued)
| | | | | | | |
| Templeton Growth Securities Fund | | Country | | Shares | | Value |
Common Stocks (continued) | | | | | | | |
Industrial Conglomerates (continued) | | | | | | | |
Koninklijke Philips Electronics NV | | Netherlands | | 660,198 | | $ | 19,543,437 |
Siemens AG | | Germany | | 504,024 | | | 46,442,002 |
Tyco International Ltd. | | United States | | 775,748 | | | 27,678,689 |
| | | | | | | |
| | | | | | | 112,083,390 |
| | | | | | | |
Insurance 5.0% | | | | | | | |
ACE Ltd. | | United States | | 260,030 | | | 13,105,512 |
Aviva PLC | | United Kingdom | | 3,808,161 | | | 24,419,995 |
AXA SA | | France | | 474,196 | | | 11,227,152 |
Muenchener Rueckversicherungs-Gesellschaft AG | | Germany | | 132,810 | | | 20,697,372 |
bProgressive Corp. | | United States | | 1,285,020 | | | 23,117,510 |
RenaissanceRe Holdings Ltd. | | United States | | 232,530 | | | 12,358,969 |
Standard Life PLC | | United Kingdom | | 1,990,499 | | | 6,992,959 |
Swiss Reinsurance Co. | | Switzerland | | 264,600 | | | 12,757,751 |
Torchmark Corp. | | United States | | 152,927 | | | 6,721,142 |
| | | | | | | |
| | | | | | | 131,398,362 |
| | | | | | | |
Internet & Catalog Retail 0.6% | | | | | | | |
bExpedia Inc. | | United States | | 606,620 | | | 15,596,200 |
| | | | | | | |
Internet Software & Services 0.1% | | | | | | | |
bAOL Inc. | | United States | | 63,651 | | | 1,486,249 |
| | | | | | | |
IT Services 2.4% | | | | | | | |
Accenture PLC, A | | United States | | 1,524,537 | | | 63,268,286 |
| | | | | | | |
Life Sciences Tools & Services 0.5% | | | | | | | |
Lonza Group AG | | Switzerland | | 179,380 | | | 12,650,089 |
| | | | | | | |
Media 9.0% | | | | | | | |
Comcast Corp., A | | United States | | 2,443,622 | | | 39,122,388 |
News Corp., A | | United States | | 3,614,422 | | | 49,481,437 |
Pearson PLC | | United Kingdom | | 1,647,248 | | | 23,733,599 |
Reed Elsevier NV | | Netherlands | | 14,589 | | | 179,618 |
Time Warner Cable Inc. | | United States | | 330,550 | | | 13,681,465 |
Time Warner Inc. | | United States | | 700,160 | | | 20,402,662 |
bViacom Inc., B | | United States | | 1,089,998 | | | 32,405,641 |
Vivendi SA | | France | | 1,363,265 | | | 40,580,315 |
The Walt Disney Co. | | United States | | 439,130 | | | 14,161,943 |
| | | | | | | |
| | | | | | | 233,749,068 |
| | | | | | | |
Metals & Mining 0.6% | | | | | | | |
Alcoa Inc. | | United States | | 1,054,330 | | | 16,995,800 |
| | | | | | | |
Multiline Retail 0.3% | | | | | | | |
Target Corp. | | United States | | 157,530 | | | 7,619,726 |
| | | | | | | |
Office Electronics 0.7% | | | | | | | |
Konica Minolta Holdings Ltd. | | Japan | | 1,733,800 | | | 17,751,964 |
| | | | | | | |
Oil, Gas & Consumable Fuels 7.7% | | | | | | | |
BG Group PLC | | United Kingdom | | 615,140 | | | 11,158,183 |
BP PLC | | United Kingdom | | 4,893,895 | | | 47,484,518 |
Chevron Corp. | | United States | | 76,870 | | | 5,918,221 |
El Paso Corp. | | United States | | 636,204 | | | 6,253,885 |
Eni SpA | | Italy | | 1,110,817 | | | 28,303,408 |
Gazprom, ADR | | Russia | | 475,980 | | | 11,923,299 |
Royal Dutch Shell PLC, B | | United Kingdom | | 1,245,697 | | | 36,449,411 |
TG-13
Franklin Templeton Variable Insurance Products Trust
Statement of Investments, December 31, 2009 (continued)
| | | | | | | |
| Templeton Growth Securities Fund | | Country | | Shares | | Value |
Common Stocks (continued) | | | | | | | |
Oil, Gas & Consumable Fuels (continued) | | | | | | | |
Statoil ASA | | Norway | | 291,950 | | $ | 7,293,210 |
Total SA, B | | France | | 703,120 | | | 45,296,685 |
| | | | | | | |
| | | | | | | 200,080,820 |
| | | | | | | |
Paper & Forest Products 0.5% | | | | | | | |
Svenska Cellulosa AB, B | | Sweden | | 999,463 | | | 13,324,405 |
| | | | | | | |
Pharmaceuticals 10.9% | | | | | | | |
Bristol-Myers Squibb Co. | | United States | | 282,710 | | | 7,138,428 |
GlaxoSmithKline PLC | | United Kingdom | | 2,156,543 | | | 45,962,884 |
Merck & Co. Inc. | | United States | | 770,771 | | | 28,163,972 |
Merck KGaA | | Germany | | 234,690 | | | 21,735,772 |
Novartis AG | | Switzerland | | 762,074 | | | 41,595,113 |
Pfizer Inc. | | United States | | 3,358,463 | | | 61,090,442 |
Roche Holding AG | | Switzerland | | 154,210 | | | 26,189,555 |
Sanofi-Aventis | | France | | 640,537 | | | 50,484,334 |
| | | | | | | |
| | | | | | | 282,360,500 |
| | | | | | | |
Professional Services 1.2% | | | | | | | |
Adecco SA | | Switzerland | | 261,060 | | | 14,387,744 |
Hays PLC | | United Kingdom | | 314,507 | | | 526,295 |
bRandstad Holding NV | | Netherlands | | 309,590 | | | 15,466,376 |
| | | | | | | |
| | | | | | | 30,380,415 |
| | | | | | | |
Real Estate Management & Development 0.9% | | | | | | | |
Cheung Kong (Holdings) Ltd. | | Hong Kong | | 1,199,833 | | | 15,520,751 |
Swire Pacific Ltd., A | | Hong Kong | | 580,046 | | | 7,032,040 |
| | | | | | | |
| | | | | | | 22,552,791 |
| | | | | | | |
Semiconductors & Semiconductor Equipment 2.8% | | | | | | | |
Samsung Electronics Co. Ltd. | | South Korea | | 80,600 | | | 55,227,494 |
Taiwan Semiconductor Manufacturing Co. Ltd. | | Taiwan | | 8,716,625 | | | 17,574,939 |
| | | | | | | |
| | | | | | | 72,802,433 |
| | | | | | | |
Software 7.2% | | | | | | | |
Microsoft Corp. | | United States | | 2,836,279 | | | 86,478,146 |
Oracle Corp. | | United States | | 3,116,770 | | | 76,485,536 |
SAP AG | | Germany | | 497,760 | | | 23,570,115 |
| | | | | | | |
| | | | | | | 186,533,797 |
| | | | | | | |
Specialty Retail 1.5% | | | | | | | |
The Home Depot Inc. | | United States | | 297,450 | | | 8,605,229 |
Inditex SA | | Spain | | 101,730 | | | 6,318,513 |
Kingfisher PLC | | United Kingdom | | 6,758,003 | | | 25,040,993 |
| | | | | | | |
| | | | | | | 39,964,735 |
| | | | | | | |
Trading Companies & Distributors 0.6% | | | | | | | |
Itochu Corp. | | Japan | | 1,734,540 | | | 12,722,696 |
bWolseley PLC | | United Kingdom | | 205,324 | | | 4,142,304 |
| | | | | | | |
| | | | | | | 16,865,000 |
| | | | | | | |
Wireless Telecommunication Services 3.0% | | | | | | | |
bSprint Nextel Corp. | | United States | | 4,179,020 | | | 15,295,213 |
Turkcell Iletisim Hizmetleri AS | | Turkey | | 465,865 | | | 3,300,474 |
Turkcell Iletisim Hizmetleri AS, ADR | | Turkey | | 536,560 | | | 9,384,434 |
TG-14
Franklin Templeton Variable Insurance Products Trust
Statement of Investments, December 31, 2009 (continued)
| | | | | | | | |
| Templeton Growth Securities Fund | | Country | | Shares | | Value |
Common Stocks (continued) | | | | | | | | |
Wireless Telecommunication Services (continued) | | | | | | | | |
Vodafone Group PLC | | United Kingdom | | | 21,285,754 | | $ | 49,355,095 |
| | | | | | | | |
| | | | | | | | 77,335,216 |
| | | | | | | | |
Total Common Stocks (Cost $2,539,129,427) | | | | | | | | 2,483,665,080 |
| | | | | | | | |
Preferred Stocks 0.9% | | | | | | | | |
Automobiles 0.3% | | | | | | | | |
Hyundai Motor Co., pfd. | | South Korea | | | 202,010 | | | 7,276,050 |
| | | | | | | | |
Metals & Mining 0.4% | | | | | | | | |
Vale SA, ADR, pfd., A | | Brazil | | | 421,400 | | | 10,459,148 |
| | | | | | | | |
Oil, Gas & Consumable Fuels 0.2% | | | | | | | | |
Petroleo Brasileiro SA, ADR, pfd. | | Brazil | | | 145,750 | | | 6,178,342 |
| | | | | | | | |
Total Preferred Stocks (Cost $18,400,870) | | | | | | | | 23,913,540 |
| | | | | | | | |
Total Investments before Short Term Investments
(Cost $2,557,530,297) | | | | | | | | 2,507,578,620 |
| | | | | | | | |
| | | |
| | | | | Principal
Amount | | |
Short Term Investments 3.5% | | | | | | | | |
Time Deposits (Cost $32,470,000) 1.2% | | | | | | | | |
Paribas Corp., 0.05%, 1/04/10 | | United States | | $ | 32,470,000 | | | 32,470,000 |
| | | | | | | | |
U.S. Government and Agency Securities 2.3% | | | | | | | | |
cFHLB, 1/04/10 - 4/14/10 | | United States | | | 4,315,000 | | | 4,314,750 |
cFHLMC, 3/24/10 | | United States | | | 25,000,000 | | | 24,997,800 |
cFHLMC, 6/25/10 | | United States | | | 30,000,000 | | | 29,979,930 |
| | | | | | | | |
Total U.S. Government and Agency Securities
(Cost $59,285,105) | | | | | | | | 59,292,480 |
| | | | | | | | |
Total Investments (Cost $2,649,285,402) 100.0% | | | | | | | | 2,599,341,100 |
Other Assets, less Liabilities 0.0%d | | | | | | | | 347,072 |
| | | | | | | | |
Net Assets 100.0% | | | | | | | $ | 2,599,688,172 |
| | | | | | | | |
See Abbreviations on page TG-24.
aSecurity was purchased pursuant to Rule 144A under the Securities Act of 1933 and may be sold in transactions exempt from registration only to qualified institutional buyers or in a public offering registered under the Securities Act of 1933. This security has been deemed liquid under guidelines approved by the Trust’s Board of Trustees. At December 31, 2009, the value of this security was $2,176, representing less than 0.01% of net assets.
bNon-income producing.
cThe security is traded on a discount basis with no stated coupon rate.
dRounds to less than 0.1% of net assets.
The accompanying notes are an integral part of these financial statements.
TG-15
Franklin Templeton Variable Insurance Products Trust
Financial Statements
Statement of Assets and Liabilities
December 31, 2009
| | | | |
| | | Templeton
Growth
Securities Fund | |
Assets: | | | | |
Investments in securities: | | | | |
Cost - Unaffiliated issuers | | $ | 2,649,285,402 | |
| | | | |
Value - Unaffiliated issuers | | $ | 2,599,341,100 | |
Cash | | | 2,191 | |
Receivables: | | | | |
Investment securities sold | | | 2,857,383 | |
Capital shares sold | | | 114,699 | |
Dividends | | | 4,461,760 | |
Other assets | | | 298 | |
| | | | |
Total assets | | | 2,606,777,431 | |
| | | | |
Liabilities: | | | | |
Payables: | | | | |
Investment securities purchased | | | 3,166,425 | |
Capital shares redeemed | | | 1,067,639 | |
Affiliates | | | 2,356,725 | |
Accrued expenses and other liabilities | | | 498,470 | |
| | | | |
Total liabilities | | | 7,089,259 | |
| | | | |
Net assets, at value | | $ | 2,599,688,172 | |
| | | | |
Net assets consist of: | | | | |
Paid-in capital | | $ | 3,030,991,535 | |
Undistributed net investment income | | | 37,872,811 | |
Net unrealized appreciation (depreciation) | | | (49,908,981 | ) |
Accumulated net realized gain (loss) | | | (419,267,193 | ) |
| | | | |
Net assets, at value | | $ | 2,599,688,172 | |
| | | | |
Class 1: | | | | |
Net assets, at value | | $ | 824,575,309 | |
| | | | |
Shares outstanding | | | 78,054,178 | |
| | | | |
Net asset value and maximum offering price per share | | $ | 10.56 | |
| | | | |
Class 2: | | | | |
Net assets, at value | | $ | 1,718,894,469 | |
| | | | |
Shares outstanding | | | 165,225,261 | |
| | | | |
Net asset value and maximum offering price per share | | $ | 10.40 | |
| | | | |
Class 4: | | | | |
Net assets, at value | | $ | 56,218,394 | |
| | | | |
Shares outstanding | | | 5,352,619 | |
| | | | |
Net asset value and maximum offering price per share | | $ | 10.50 | |
| | | | |
The accompanying notes are an integral part of these financial statements.
TG-16
Franklin Templeton Variable Insurance Products Trust
Financial Statements (continued)
Statement of Operations
for the year ended December 31, 2009
| | | | |
| | | Templeton
Growth
Securities Fund | |
Investment income: | | | | |
Dividends (net of foreign taxes of $4,114,182) | | $ | 57,965,982 | |
Interest | | | 206,884 | |
| | | | |
Total investment income | | | 58,172,866 | |
| | | | |
Expenses: | | | | |
Management fees (Note 3a) | | | 15,702,024 | |
Distribution fees: (Note 3b) | | | | |
Class 2 | | | 3,791,535 | |
Class 4 | | | 138,435 | |
Unaffiliated transfer agent fees | | | 1,629 | |
Custodian fees (Note 4) | | | 286,221 | |
Reports to shareholders | | | 322,458 | |
Professional fees | | | 70,685 | |
Trustees’ fees and expenses | | | 13,520 | |
Other | | | 90,207 | |
| | | | |
Total expenses | | | 20,416,714 | |
Expense reductions (Note 4) | | | (13,067 | ) |
| | | | |
Net expenses | | | 20,403,647 | |
| | | | |
Net investment income | | | 37,769,219 | |
| | | | |
Realized and unrealized gains (losses): | | | | |
Net realized gain (loss) from: | | | | |
Investments | | | (252,783,794 | ) |
Foreign currency transactions | | | (65,104 | ) |
| | | | |
Net realized gain (loss) | | | (252,848,898 | ) |
| | | | |
Net change in unrealized appreciation (depreciation) on: | | | | |
Investments | | | 807,687,705 | |
Translation of other assets and liabilities denominated in foreign currencies | | | 92,850 | |
| | | | |
Net change in unrealized appreciation (depreciation) | | | 807,780,555 | |
| | | | |
Net realized and unrealized gain (loss) | | | 554,931,657 | |
| | | | |
Net increase (decrease) in net assets resulting from operations | | $ | 592,700,876 | |
| | | | |
The accompanying notes are an integral part of these financial statements.
TG-17
Franklin Templeton Variable Insurance Products Trust
Financial Statements (continued)
Statements of Changes in Net Assets
| | | | | | | | |
| | | Templeton Growth
Securities Fund | |
| | | Year Ended December 31, | |
| | | 2009 | | | 2008 | |
| | | | |
Increase (decrease) in net assets: | | | | | | | | |
Operations: | | | | | | | | |
Net investment income | | $ | 37,769,219 | | | $ | 66,716,886 | |
Net realized gain (loss) from investments and foreign currency transactions | | | (252,848,898 | ) | | | (164,782,328 | ) |
Net change in unrealized appreciation (depreciation) on investments and translation of other assets and liabilities denominated in foreign currencies | | | 807,780,555 | | | | (1,358,004,510 | ) |
| | | | |
Net increase (decrease) in net assets resulting from operations | | | 592,700,876 | | | | (1,456,069,952 | ) |
| | | | |
Distributions to shareholders from: | | | | | | | | |
Net investment income: | | | | | | | | |
Class 1 | | | (17,057,443 | ) | | | (7,929,338 | ) |
Class 2 | | | (48,545,883 | ) | | | (42,575,426 | ) |
Class 4 | | | (1,318,174 | ) | | | (69,174 | ) |
Net realized gains: | | | | | | | | |
Class 1 | | | — | | | | (26,359,362 | ) |
Class 2 | | | — | | | | (167,773,428 | ) |
Class 4 | | | — | | | | (229,952 | ) |
| | | | |
Total distributions to shareholders | | | (66,921,500 | ) | | | (244,936,680 | ) |
| | | | |
Capital share transactions: (Note 2) | | | | | | | | |
Class 1 | | | 307,891,288 | | | | 216,063,635 | |
Class 2 | | | (164,033,071 | ) | | | (225,196,478 | ) |
Class 4 | | | 19,916,353 | | | | 31,532,804 | |
| | | | |
Total capital share transactions | | | 163,774,570 | | | | 22,399,961 | |
| | | | |
Net increase (decrease) in net assets | | | 689,553,946 | | | | (1,678,606,671 | ) |
Net assets: | | | | | | | | |
Beginning of year | | | 1,910,134,226 | | | | 3,588,740,897 | |
| | | | |
End of year | | $ | 2,599,688,172 | | | $ | 1,910,134,226 | |
| | | | |
Undistributed net investment income included in net assets: | | | | | | | | |
End of year | | $ | 37,872,811 | | | $ | 66,917,204 | |
| | | | |
The accompanying notes are an integral part of these financial statements.
TG-18
Franklin Templeton Variable Insurance Products Trust
Notes to Financial Statements
Templeton Growth Securities Fund
1. ORGANIZATION AND SIGNIFICANT ACCOUNTING POLICIES
Franklin Templeton Variable Insurance Products Trust (Trust) is registered under the Investment Company Act of 1940, as amended, (1940 Act) as an open-end investment company, consisting of twenty-two separate funds. The Templeton Growth Securities Fund (Fund) is included in this report. The financial statements of the remaining funds in the Trust are presented separately. Shares of the Fund are generally sold only to insurance company separate accounts to fund the benefits of variable life insurance policies or variable annuity contracts. The Fund offers three classes of shares: Class 1, Class 2, and Class 4. Each class of shares differs by its distribution fees, voting rights on matters affecting a single class and its exchange privilege.
The following summarizes the Fund’s significant accounting policies.
a. Security Valuation
Equity and other securities listed on a securities exchange or on the NASDAQ National Market System are valued at the last quoted sale price or the official closing price of the day, respectively. Over-the-counter securities and listed securities for which there is no reported sale are valued within the range of the most recent quoted bid and ask prices. Securities that trade in multiple markets or on multiple exchanges are valued according to the broadest and most representative market. Certain equity securities are valued based upon fundamental characteristics or relationships to similar securities. Investments in open-end mutual funds are valued at the closing net asset value.
Foreign equity securities are valued as of the close of trading on the foreign stock exchange on which the security is primarily traded, or the NYSE, whichever is earlier. If no sale is reported at that time, the foreign equity security will be valued within the range of the most recent quoted bid and ask prices. The value is then converted into its U.S. dollar equivalent at the foreign exchange rate in effect at the close of the NYSE on the day that the value of the security is determined.
The Fund has procedures to determine the fair value of individual securities and other assets for which market prices are not readily available or which may not be reliably priced. Methods for valuing these securities may include: fundamental analysis based upon the underlying investment book value, anticipated future cash flows, market changes in comparable or similar securities, matrix pricing, discounts from market prices of similar securities, or discounts applied due to the nature and duration of restrictions on the disposition of the securities. Due to the inherent uncertainty of valuations of such securities, the fair values may differ significantly from the values that would have been used had a ready market for such investments existed. Occasionally, events occur between the time at which trading in a security is completed and the close of the NYSE that might call into question the availability (including the reliability) of the value of a portfolio security held by the Fund. The investment manager monitors price movements following the close of trading in foreign stock markets through a series of country specific market proxies (such as baskets of American Depository Receipts, futures contracts and exchange traded funds). These price movements are measured against established trigger thresholds for each specific market proxy to assist in determining if an event has occurred. If such an event occurs, the securities may be valued using fair value procedures, which may include the use of independent pricing services. All security valuation procedures are approved by the Fund’s Board of Trustees.
b. Foreign Currency Translation
Portfolio securities and other assets and liabilities denominated in foreign currencies are translated into U.S. dollars based on the exchange rate of such currencies against U.S. dollars on the date of valuation. The Fund may enter into foreign currency exchange contracts to facilitate transactions denominated in a foreign currency. Purchases and sales of securities, income and expense items denominated in foreign currencies are translated into U.S. dollars at the exchange rate in effect on the transaction date. Occasionally, events may impact the availability or reliability of foreign exchange rates used to convert the U.S. dollar equivalent value. If such an event occurs, the foreign exchange rate will be valued at fair value using procedures established and approved by the Fund’s Board of Trustees.
The Fund does not separately report the effect of changes in foreign exchange rates from changes in market prices on securities held. Such changes are included in net realized and unrealized gain or loss from investments on the Statement of Operations.
TG-19
Franklin Templeton Variable Insurance Products Trust
Notes to Financial Statements (continued)
Templeton Growth Securities Fund
1. ORGANIZATION AND SIGNIFICANT ACCOUNTING POLICIES (continued)
b. Foreign Currency Translation (continued)
Realized foreign exchange gains or losses arise from sales of foreign currencies, currency gains or losses realized between the trade and settlement dates on securities transactions and the difference between the recorded amounts of dividends, interest, and foreign withholding taxes and the U.S. dollar equivalent of the amounts actually received or paid. Net unrealized foreign exchange gains and losses arise from changes in foreign exchange rates on foreign denominated assets and liabilities other than investments in securities held at the end of the reporting period.
c. Income Taxes
No provision has been made for U.S. income taxes because it is the Fund’s policy to qualify as a regulated investment company under the Internal Revenue Code and to distribute to shareholders substantially all of its taxable income and net realized gains.
The Fund has reviewed the tax positions, taken on federal income tax returns, for each of the three open tax years and as of December 31, 2009, and has determined that no provision for income tax is required in the Fund’s financial statements.
Foreign securities held by the Fund may be subject to foreign taxation on dividend income received. Foreign taxes, if any, are recorded based on the tax regulations and rates that exist in the foreign markets in which the Fund invests.
d. Security Transactions, Investment Income, Expenses and Distributions
Security transactions are accounted for on trade date. Realized gains and losses on security transactions are determined on a specific identification basis. Interest income and estimated expenses are accrued daily. Dividend income is recorded on the ex-dividend date except that certain dividends from foreign securities are recognized as soon as the Fund is notified of the ex-dividend date. Distributions to shareholders are recorded on the ex-dividend date and are determined according to income tax regulations (tax basis). Distributable earnings determined on a tax basis may differ from earnings recorded in accordance with accounting principles generally accepted in the United States of America. These differences may be permanent or temporary. Permanent differences are reclassified among capital accounts to reflect their tax character. These reclassifications have no impact on net assets or the results of operations. Temporary differences are not reclassified, as they may reverse in subsequent periods.
Common expenses incurred by the Trust are allocated among the funds based on the ratio of net assets of each fund to the combined net assets of the Trust. Fund specific expenses are charged directly to the fund that incurred the expense.
Realized and unrealized gains and losses and net investment income, not including class specific expenses, are allocated daily to each class of shares based upon the relative proportion of net assets of each class. Differences in per share distributions, by class, are generally due to differences in class specific expenses.
e. Accounting Estimates
The preparation of financial statements in accordance with accounting principles generally accepted in the United States of America requires management to make estimates and assumptions that affect the reported amounts of assets and liabilities at the date of the financial statements and the amounts of income and expenses during the reporting period. Actual results could differ from those estimates.
f. Guarantees and Indemnifications
Under the Trust’s organizational documents, its officers and trustees are indemnified by the Trust against certain liabilities arising out of the performance of their duties to the Trust. Additionally, in the normal course of business, the Trust, on behalf of the Fund, enters into contracts with service providers that contain general indemnification clauses. The Trust’s maximum exposure under these arrangements is unknown as this would involve future claims that may be made against the Trust that have not yet occurred. Currently, the Trust expects the risk of loss to be remote.
TG-20
Franklin Templeton Variable Insurance Products Trust
Notes to Financial Statements (continued)
Templeton Growth Securities Fund
2. SHARES OF BENEFICIAL INTEREST
At December 31, 2009, there were an unlimited number of shares authorized (without par value). Transactions in the Fund’s shares were as follows:
| | | | | | | | | | | | | | |
| | | Year Ended December 31, | |
| | | 2009 | | | 2008a | |
| Class 1 Shares: | | Shares | | | Amount | | | Shares | | | Amount | |
Shares sold | | 35,481,950 | | | $ | 324,792,496 | | | 22,693,927 | | | $ | 256,698,452 | |
Shares issued in reinvestment of distributions | | 2,018,632 | | | | 17,057,443 | | | 2,666,306 | | | | 34,288,699 | |
Shares redeemed | | (4,036,022 | ) | | | (33,958,651 | ) | | (6,697,989 | ) | | | (74,923,516 | ) |
| | | | |
Net increase (decrease) | | 33,464,560 | | | $ | 307,891,288 | | | 18,662,244 | | | $ | 216,063,635 | |
| | | | |
Class 2 Shares: | | | | | | | | | | | | | | |
Shares sold | | 7,712,666 | | | $ | 66,170,428 | | | 11,250,052 | | | $ | 134,476,026 | |
Shares issued in reinvestment of distributions | | 5,813,228 | | | | 48,424,190 | | | 16,568,591 | | | | 209,924,044 | |
Shares redeemed | | (32,845,464 | ) | | | (278,627,689 | ) | | (49,397,331 | ) | | | (569,596,548 | ) |
| | | | |
Net increase (decrease) | | (19,319,570 | ) | | $ | (164,033,071 | ) | | (21,578,688 | ) | | $ | (225,196,478 | ) |
| | | | |
Class 4 Shares: | | | | | | | | | | | | | | |
Shares sold | | 2,450,209 | | | $ | 20,937,774 | | | 2,983,902 | | | $ | 31,388,775 | |
Shares issued on reinvestment of distributions | | 156,739 | | | | 1,318,174 | | | 23,247 | | | | 298,725 | |
Shares redeemed | | (247,445 | ) | | | (2,339,595 | ) | | (14,033 | ) | | | (154,696 | ) |
| | | | |
Net increase (decrease) | | 2,359,503 | | | $ | 19,916,353 | | | 2,993,116 | | | $ | 31,532,804 | |
| | | | |
| a | For the period February 29, 2008 (effective date) to December 31, 2008 for Class 4. |
3. TRANSACTIONS WITH AFFILIATES
Franklin Resources, Inc. is the holding company for various subsidiaries that together are referred to as Franklin Templeton Investments. Certain officers and trustees of the Trust are also officers and/or directors of the following subsidiaries:
| | |
| Subsidiary | | Affiliation |
Templeton Global Advisors Limited (TGAL) | | Investment manager |
Templeton Asset Management Ltd. (TAML) | | Investment manager |
Franklin Templeton Services, LLC (FT Services) | | Administrative manager |
Franklin Templeton Distributors, Inc. (Distributors) | | Principal underwriter |
Franklin Templeton Investor Services, LLC (Investor Services) | | Transfer agent |
a. Management Fees
The Fund pays an investment management fee to TGAL based on the average daily net assets of the Fund as follows:
| | |
| Annualized Fee Rate | | Net Assets |
| 1.000% | | Up to and including $100 million |
| 0.900% | | over $100 million, up to and including $250 million |
| 0.800% | | over $250 million, up to and including $500 million |
| 0.750% | | over $500 million, up to and including $1 billion |
| 0.700% | | over $1 billion, up to and including $5 billion |
| 0.675% | | over $5 billion, up to and including $10 billion |
| 0.655% | | over $10 billion, up to and including $15 billion |
| 0.635% | | over $15 billion, up to and including $20 billion |
| 0.615% | | In excess of $20 billion |
TG-21
Franklin Templeton Variable Insurance Products Trust
Notes to Financial Statements (continued)
Templeton Growth Securities Fund
3. TRANSACTIONS WITH AFFILIATES (continued)
a. Management Fees (continued)
Under a subadvisory agreement, TAML, an affiliate of TGAL, provides subadvisory services to the Fund and receives from TGAL fees based on the average daily net assets of the Fund.
b. Administrative Fees
Under an agreement with TGAL, FT Services provides administrative services to the Fund. The fee is paid by TGAL based on average daily net assets, and is not an additional expense of the Fund.
c. Distribution Fees
The Fund’s Board of Trustees has adopted distribution plans for Class 2 and Class 4 shares pursuant to Rule 12b-1 under the 1940 Act. Under the Fund’s compensation distribution plans, the Fund pays Distributors for costs incurred in connection with the servicing, sale and distribution of the Fund’s shares up to 0.35% per year of its average daily net assets of each class. The Board of Trustees has agreed to limit the current rate to 0.25% per year for Class 2.
d. Transfer Agent Fees
Investor Services, under terms of an agreement, performs shareholder servicing for the Fund and is not paid by the Fund for the services.
4. EXPENSE OFFSET ARRANGEMENT
The Fund has entered into an arrangement with its custodian whereby credits realized as a result of uninvested cash balances are used to reduce a portion of the Fund’s custodian expenses. During the year ended December 31, 2009, the custodian fees were reduced as noted in the Statement of Operations.
5. INCOME TAXES
For tax purposes, capital losses may be carried over to offset future capital gains, if any. At December 31, 2009, the capital loss carryforwards were as follows:
| | | |
Capital loss carryforwards expiring in: | | | |
2016 | | $ | 103,405,910 |
2017 | | | 294,580,233 |
| | | |
| | $ | 397,986,143 |
| | | |
For tax purposes, realized capital losses occurring subsequent to October 31, may be deferred and treated as occurring on the first day of the following fiscal year. At December 31, 2009, the Fund deferred realized capital losses of $13,005,886.
The tax character of distributions paid during the years ended December 31, 2009 and 2008, was as follows:
| | | | | | |
| | | 2009 | | 2008 |
Distributions paid from: | | | | | | |
Ordinary income | | $ | 66,921,500 | | $ | 58,650,253 |
Long term capital gain | | | — | | | 186,286,427 |
| | | |
| | $ | 66,921,500 | | $ | 244,936,680 |
| | | |
TG-22
Franklin Templeton Variable Insurance Products Trust
Notes to Financial Statements (continued)
Templeton Growth Securities Fund
5. INCOME TAXES (continued)
At December 31, 2009, the cost of investments, net unrealized appreciation (depreciation) and undistributed ordinary income for income tax purposes were as follows:
| | | | |
Cost of investments | | $ | 2,657,560,568 | |
| | | | |
| |
Unrealized appreciation | | $ | 322,440,817 | |
Unrealized depreciation | | | (380,660,285 | ) |
| | | | |
Net unrealized appreciation (depreciation) | | $ | (58,219,468 | ) |
| | | | |
| | | | |
Distributable earnings – undistributed ordinary income | | $ | 37,872,811 | |
| | | | |
Net investment income differs for financial statement and tax purposes primarily due to differing treatment of foreign currency transactions.
Net realized gains (losses) differ for financial statement and tax purposes primarily due to differing treatments of wash sales, foreign currency transactions.
6. INVESTMENT TRANSACTIONS
Purchases and sales of investments (excluding short term securities) for the year ended December 31, 2009, aggregated $456,885,240 and $298,591,684, respectively.
7. CONCENTRATION OF RISK
Investing in foreign securities may include certain risks and considerations not typically associated with investing in U.S. securities, such as fluctuating currency values and changing local and regional economic, political and social conditions, which may result in greater market volatility. In addition, certain foreign securities may not be as liquid as U.S. securities.
8. CREDIT FACILITY
The Fund, together with other U.S. registered and foreign investment funds (collectively “Borrowers”), managed by Franklin Templeton Investments, are borrowers in a joint syndicated senior unsecured credit facility totaling $725 million (Global Credit Facility) to provide a source of funds to the Borrowers for temporary and emergency purposes, including the ability to meet future unanticipated or unusually large redemption requests. Effective January 22, 2010, the Fund renewed the Global Credit Facility, for a total of $750 million, maturing January 21, 2011.
Under the terms of the Global Credit Facility, the Fund shall, in addition to interest charged on any borrowings made by the Fund and other costs incurred by the Fund, pay its share of fees and expenses incurred in connection with the implementation and maintenance of the Global Credit Facility, based upon its relative share of the aggregate net assets of all of the Borrowers, including an annual commitment fee of 0.10% based upon the unused portion of the Global Credit Facility, which is reflected in other expenses on the Statement of Operations. During the year ended December 31, 2009, the Fund did not utilize the Global Credit Facility.
TG-23
Franklin Templeton Variable Insurance Products Trust
Notes to Financial Statements (continued)
Templeton Growth Securities Fund
9. FAIR VALUE MEASUREMENTS
The Fund follows a fair value hierarchy that distinguishes between market data obtained from independent sources (observable inputs) and the Fund’s own market assumptions (unobservable inputs). These inputs are used in determining the value of the Fund’s investments and are summarized in the following fair value hierarchy:
| | • | | Level 1 – quoted prices in active markets for identical securities |
| | • | | Level 2 – other significant observable inputs (including quoted prices for similar securities, interest rates, prepayment speed, credit risk, etc.) |
| | • | | Level 3 – significant unobservable inputs (including the Fund’s own assumptions in determining the fair value of investments) |
The inputs or methodology used for valuing securities are not an indication of the risk associated with investing in those securities.
| | | | | | | | | | | | |
| | | Level 1 | | Level 2 | | Level 3 | | Total |
| | | |
Assets: | | | | | | | | | | | | |
Investments in Securities | | | | | | | | | | | | |
Equity Investments:a | | $ | 2,507,578,620 | | $ | — | | $ | — | | $ | 2,507,578,620 |
Short Term Investments | | | — | | | 91,762,480 | | | — | | | 91,762,480 |
| | | |
Total Investments in Securities | | $ | 2,507,578,620 | | $ | 91,762,480 | | $ | — | | $ | 2,599,341,100 |
| | | |
aFor detailed industry descriptions, see the accompanying Statement of Investments.
10. NEW ACCOUNTING PRONOUNCEMENTS
In January 2010, the Financial Accounting Standards Board issued Accounting Standards Update (ASU) No. 2010-6, Fair Value Measurements and Disclosures (Topic 820): Improving Disclosures about Fair Value Measurements. ASU No. 2010-6 enhances and clarifies existing fair value measurement disclosure requirements and is effective for interim and annual periods beginning after December 15, 2009. The Fund is currently evaluating the impact, if any, of applying the provisions of ASU No. 2010-6.
11. SUBSEQUENT EVENTS
The Fund has evaluated subsequent events through February 10, 2010, the issuance date of the financial statements and determined that no events have occurred that require disclosure.
ABBREVIATIONS
Selected Portfolio
ADR - American Depository Receipt
FHLB - Federal Home Loan Bank
FHLMC - Federal Home Loan Mortgage Corp.
TG-24
Franklin Templeton Variable Insurance Products Trust
Templeton Growth Securities Fund
Report of Independent Registered Public Accounting Firm
To the Board of Trustees and Shareholders of Franklin Templeton Variable Insurance Products Trust
In our opinion, the accompanying statement of assets and liabilities, including the statement of investments, and the related statements of operations and of changes in net assets and the financial highlights present fairly, in all material respects, the financial position of Templeton Growth Securities Fund (one of the funds constituting the Franklin Templeton Variable Insurance Products Trust, hereafter referred to as the “Fund”) at December 31, 2009, the results of its operations for the year then ended, the changes in its net assets and the financial highlights for the periods presented, in conformity with accounting principles generally accepted in the United States of America. These financial statements and financial highlights (hereafter referred to as “financial statements”) are the responsibility of the Fund’s management. Our responsibility is to express an opinion on these financial statements based on our audits. We conducted our audit of these financial statements in accordance with the standards of the Public Company Accounting Oversight Board (United States). Those standards require that we plan and perform the audits to obtain reasonable assurance about whether the financial statements are free of material misstatement. An audit includes examining, on a test basis, evidence supporting the amounts and disclosures in the financial statements, assessing the accounting principles used and significant estimates made by management, and evaluating the overall financial statement presentation. We believe that our audits, which included confirmation of securities at December 31, 2009 by correspondence with the custodian and brokers, provide a reasonable basis for our opinion.
PricewaterhouseCoopers LLP
San Francisco, California
February 10, 2010
TG-25
Franklin Templeton Variable Insurance Products Trust
Tax Designation (unaudited)
Templeton Growth Securities Fund
Under Section 854(b)(2) of the Internal Revenue Code (Code), the Fund designates 18.83% of the ordinary income dividends as income qualifying for the dividends received deduction for the fiscal year ended December 31, 2009.
At December 31, 2009, more than 50% of the Fund’s total assets were invested in securities of foreign issuers. In most instances, foreign taxes were withheld from income paid to the Fund on these investments. The Fund elects to treat foreign taxes paid as allowed under Section 853 of the Code. This election will allow shareholders of record as of the 2010 distribution date, to treat their proportionate share of foreign taxes paid by the Fund as having been paid directly by them. The shareholder shall consider these amounts as foreign taxes paid in the tax year in which they receive the Fund distribution.
TG-26
INDEX DESCRIPTIONS
The indexes are unmanaged and include reinvested distributions.
Barclays Capital (BC) U.S. Aggregate Index is a market capitalization-weighted index representing the U.S. investment-grade, fixed-rate, taxable bond market with index components for government and corporate, mortgage pass-through and asset-backed securities. All issues included are SEC registered, taxable, dollar denominated and nonconvertible, must have at least one year to final maturity and must be rated investment grade (Baa3/BBB-/BBB- or higher) by Moody’s, Standard & Poor’s or Fitch, respectively.
Barclays Capital (BC) U.S. Government: Intermediate Index is the intermediate component of the BC U.S. Government Index. The index includes securities issued by the U.S. government or agency. These include obligations of the U.S. Treasury with remaining maturity of one year or more and publicly issued debt of U.S. governmental agencies, quasi-federal corporations, and corporate or foreign debt guaranteed by the U.S. government.
Citigroup World Government Bond Index is market capitalization weighted and tracks total returns of government bonds in 23 developed countries globally.
Consumer Price Index (CPI), calculated by the U.S. Bureau of Labor Statistics, is a commonly used measure of the inflation rate.
Credit Suisse (CS) High Yield Index is designed to mirror the investible universe of the U.S. dollar-denominated high yield debt market.
Dow Jones Industrial Average is price weighted based on the average market price of 30 blue chip stocks of companies that are generally industry leaders.
J.P. Morgan (JPM) Emerging Markets Bond Index (EMBI) Global tracks total returns for U.S. dollar-denominated debt instruments issued by emerging market sovereign and quasi-sovereign entities: Brady bonds, loans and Eurobonds.
J.P. Morgan (JPM) Global Government Bond Index (GGBI) tracks total returns for liquid, fixed-rate, domestic government bonds with maturities greater than one year issued by developed countries globally.
Lipper Multi-Sector Income Funds Classification Average is an equally weighted average calculation of performance figures for all funds within the Lipper Multi-Sector Income Funds classification in the Lipper Open-End underlying funds universe. Lipper Multi-Sector Income Funds are defined as funds that seek current income by allocating assets among different fixed income securities sectors (not primarily in one sector except for defensive purposes), including U.S. and foreign governments, with a significant portion rated below investment grade. For the 12-month period ended 12/31/09, there were 154 funds in this category. Lipper calculations do not include contract fees, expenses or sales charges, and may have been different if such charges had been considered.
Lipper VIP Equity Income Funds Classification Average is an equally weighted average calculation of performance figures for all funds within the Lipper Equity Income Funds classification in the Lipper VIP underlying funds universe. Lipper Equity Income Funds seek relatively high current income and growth of income through investing 65% or more of their portfolios in equities. For the 12-month period ended 12/31/09, there were 66 funds in this category. Lipper calculations do not include contract fees, expenses or sales charges, and may have been different if such charges had been considered.
Lipper VIP General Bond Funds Classification Average is an equally weighted average calculation of performance figures for all funds within the Lipper General Bond Funds classification in the Lipper VIP underlying funds universe. Lipper General Bond Funds do not have any quality or maturity restrictions, and tend to keep a bulk of assets in corporate and government debt issues. For the 12-month period ended 12/31/09, there were 59 funds in this category. Lipper calculations do not include contract fees, expenses or sales charges, and may have been different if such charges had been considered.
Lipper VIP General U.S. Government Funds Classification Average is an equally weighted average calculation of performance figures for all funds within the Lipper General U.S. Government Funds classification in the Lipper VIP underlying funds universe. Lipper General U.S. Government Funds invest at least 65% of assets in U.S. government and agency issues. For the 12-month period ended 12/31/09, there were 73 funds in this category. Lipper calculations do not include contract fees, expenses or sales charges, and may have been different if such charges had been considered.
Lipper VIP High Current Yield Funds Classification Average is an equally weighted average calculation of performance figures for all funds within the Lipper High Current Yield Funds in the Lipper VIP underlying funds universe. Lipper High Current Yield Funds aim at high (relative) current yield from fixed income securities, have no quality or maturity restrictions,
I-1
and tend to invest in lower grade debt issues. For the 12-month period ended 12/31/09, there were 111 funds in this category. Lipper calculations do not include contract fees, expenses or sales charges, and may have been different if such charges had been considered.
Merrill Lynch (ML) 2-Year Zero Coupon Bond Index includes zero coupon bonds that pay no interest and are issued at a discount from redemption price.
Morgan Stanley Capital International (MSCI) All Country (AC) World Index is a free float-adjusted, market capitalization-weighted index designed to measure equity market performance in global developed and emerging markets.
Morgan Stanley Capital International (MSCI) Emerging Markets (EM) Asia Index is a free float-adjusted, market capitalization weighted index designed to measure equity market performance in Asian emerging markets.
Morgan Stanley Capital International (MSCI) Emerging Markets (EM) Index is a free float-adjusted, market capitalization-weighted index designed to measure equity market performance in global emerging markets.
Morgan Stanley Capital International (MSCI) Europe, Australasia, Far East (EAFE) Index is a free float-adjusted, market capitalization-weighted index designed to measure equity market performance in global developed markets excluding the U.S. and Canada.
Morgan Stanley Capital International (MSCI) Europe, Australasia, Far East (EAFE) Index Net Return (Local Currency) is a free float-adjusted, market capitalization weighted index designed to measure equity market performance of global developed markets excluding the U.S. and Canada. The index is calculated in local currency and includes reinvested daily net dividends.
Morgan Stanley Capital International (MSCI) World Index is a free float-adjusted, market capitalization-weighted index designed to measure equity market performance in global developed markets.
NASDAQ Composite Index measures all NASDAQ domestic and international based common type stocks listed on The NASDAQ Stock Market. The index is market value weighted and includes more than 3,000 companies.
Russell 1000 Growth Index is market capitalization weighted and measures performance of those Russell 100 Index companies with higher price-to-book ratios and higher forecasted growth values.
Russell 1000® Index is market capitalization weighted and measures performance of the 1,000 largest companies in the Russell 3000 Index, which represents the majority of the U.S. market’s total capitalization.
Russell 1000 Value Index is market capitalization weighted and measures performance of those Russell 1000 Index companies with lower price-to-book ratios and lower forecasted growth values.
Russell 2500™ Index is market capitalization weighted and measures performance of the 2,500 smallest companies in the Russell 3000 Index, which represents a modest amount of the Russell 3000 Index’s total market capitalization.
Russell 2500 Value Index is market capitalization weighted and measures performance of those Russell 2500 Index companies with lower price-to-book ratios and lower forecasted growth values.
Russell 3000® Growth Index is market capitalization weighted and measures performance of those Russell 3000 Index companies with higher price-to-book ratios and higher forecasted growth values.
Russell 3000 Index is market capitalization weighted and measures performance of the 3,000 largest U.S. companies based on total market capitalization, which represents the majority of the investible U.S. equity market.
Russell Midcap® Growth Index is market capitalization weighted and measures performance of those Russell Midcap Index companies with higher price-to-book ratios and higher forecasted growth values.
Russell Midcap Index is market capitalization weighted and measures performance of the 800 smallest companies in the Russell 1000 Index, which represents a modest amount of the Russell 1000 Index’s total market capitalization.
Standard & Poor’s 500 Index (S&P 500) consists of 500 stocks chosen for market size, liquidity and industry group representation. Each stock’s weight in the index is proportionate to its market value. The S&P 500 is one of the most widely used benchmarks of U.S. equity performance.
Standard & Poor’s 500 (S&P 500) Utilities Index is a market capitalization-weighted index consisting of all utility stocks in the S&P 500.
I-2
Standard & Poor’s Global REIT Index is designed to measure performance of the investible universe of publicly traded real estate investment trusts. Index constituents generally derive more than 60% of revenue from real estate development, management, rental, and/or direct investment in physical property and with local REIT or property trust tax status.
Standard & Poor’s/International Finance Corporation Investable (S&P/IFCI) Composite Index is a free float-adjusted, market capitalization-weighted index designed to measure equity performance in global emerging markets.
I-3
Board Members and Officers
The name, year of birth and address of the officers and board members, as well as their affiliations, positions held with the Trust, principal occupation during the past five years and number of portfolios overseen in the Franklin Templeton Investments fund complex are shown below. Generally, each board member serves until that person’s successor is elected and qualified.
Independent Board Members
| | | | | | | | |
| Name, Year of Birth and Address | | Position | | Length of
Time Served | | Number of
Portfolios in Fund
Complex Overseen
by Board Member* | | Other Directorships Held |
HARRIS J. ASHTON (1932) One Franklin Parkway San Mateo, CA 94403-1906 | | Trustee | | Since 1988 | | 133 | | Bar-S Foods (meat packing company). |
|
Principal Occupation During Past 5 Years: Director of various companies; and formerly, Director, RBC Holdings, Inc. (bank holding company) (until 2002); and President, Chief Executive Officer and Chairman of the Board, General Host Corporation (nursery and craft centers) (until 1998). |
ROBERT F. CARLSON (1928) One Franklin Parkway San Mateo, CA 94403-1906 | | Trustee | | Since 1998 | | 110 | | None |
|
Principal Occupation During Past 5 Years: Retired; and formerly, Vice President, senior member and President, Board of Administration, California Public Employees Retirement Systems (CALPERS) (1971-2008); member and Chairman of the Board, Sutter Community Hospitals; member, Corporate Board, Blue Shield of California; and Chief Counsel, California Department of Transportation. |
SAM GINN (1937) One Franklin Parkway San Mateo, CA 94403-1906 | | Trustee | | Since 2007 | | 110 | | ICO Global Communications (Holdings) Limited (satellite company). |
|
Principal Occupation During Past 5 Years: Private investor; and formerly, Chairman of the Board, Vodafone AirTouch, PLC (wireless company); Chairman of the Board and Chief Executive Officer, AirTouch Communications (cellular communications) (1993-1998) and Pacific Telesis Groups (telephone holding company) (1988-1994). |
EDITH E. HOLIDAY (1952) One Franklin Parkway San Mateo, CA 94403-1906 | | Trustee | | Since 2005 | | 133 | | Hess Corporation (exploration and refining of oil and gas), H.J. Heinz Company (processed foods and allied products), RTI International Metals, Inc. (manufacture and distribution of titanium), Canadian National Railway (railroad) and White Mountains Insurance Group, Ltd. (holding company). |
|
Principal Occupation During Past 5 Years: Director or Trustee of various companies and trusts; and formerly, Assistant to the President of the United States and Secretary of the Cabinet (1990-1993); General Counsel to the United States Treasury Department (1989-1990); and Counselor to the Secretary and Assistant Secretary for Public Affairs and Public Liaison-United States Treasury Department (1988-1989). |
FRANK W.T. LAHAYE (1929) One Franklin Parkway San Mateo, CA 94403-1906 | | Trustee | | Since 1988 | | 109 | | None |
|
Principal Occupation During Past 5 Years: General Partner, Las Olas L.P. (Asset Management); and formerly, Chairman, Peregrine Venture Management Company (venture capital). |
BOD-1
| | | | | | | | |
| Name, Year of Birth and Address | | Position | | Length of
Time Served | | Number of
Portfolios in Fund
Complex Overseen
by Board Member* | | Other Directorships Held |
J. MICHAEL LUTTIG (1954) One Franklin Parkway San Mateo, CA 94403-1906 | | Trustee | | Since December 2009 | | 133 | | Boeing Capital Corporation (aircraft financing) |
|
Principal Occupation During Past 5 Years: Executive Vice President, General Counsel and member of Executive Council, The Boeing Company; and formerly, Federal Appeals Court Judge, U.S. Court of Appeals for the Fourth Circuit (1991-2006). |
FRANK A. OLSON (1932) One Franklin Parkway
San Mateo, CA 94403-1906 | | Trustee | | Since 2005 | | 133 | | Hess Corporation (exploration and refining of oil and gas). |
|
Principal Occupation During Past 5 Years: Chairman Emeritus, The Hertz Corporation (car rental) (since 2000) (Chairman of the Board (1980-2000) and Chief Executive Officer (1977-1999)); and formerly, Chairman of the Board, President and Chief Executive Officer, UAL Corporation (airlines). |
LARRY D. THOMPSON (1945) One Franklin Parkway San Mateo, CA 94403-1906 | | Trustee | | Since 2007 | | 141 | | None |
|
Principal Occupation During Past 5 Years: Senior Vice President—Government Affairs, General Counsel and Secretary, PepsiCo, Inc. (consumer products); and formerly, Director, Delta Airlines (aviation) (2003-2005) and Providian Financial Corp. (credit card provider) (1997-2001); Senior Fellow of The Brookings Institution (2003-2004); Visiting Professor, University of Georgia School of Law (2004); and Deputy Attorney General, U.S. Department of Justice (2001-2003). |
JOHN B. WILSON (1959) One Franklin Parkway San Mateo, CA 94403-1906 | | Lead Independent Trustee | | Trustee since 2007 and Lead Independent Trustee since 2008 | | 110 | | None |
|
Principal Occupation During Past 5 Years: President and Founder, Hyannis Port Capital, Inc. (real estate and private equity investing); serves on private and non-profit boards; and formerly, Chief Operating Officer and Executive Vice President, Gap, Inc. (retail) (1996-2000); Chief Financial Officer and Executive Vice President—Finance and Strategy, Staples, Inc. (office supplies) (1992-1996); Senior Vice President—Corporate Planning, Northwest Airlines, Inc. (airlines) (1990-1992); and Vice President and Partner, Bain & Company (consulting firm) (1986-1990). |
Interested Board Members and Officers
| | | | | | | | |
| Name, Year of Birth and Address | | Position | | Length of
Time Served | | Number of
Portfolios in Fund
Complex Overseen
by Board Member* | | Other Directorships Held |
**CHARLES B. JOHNSON (1933) One Franklin Parkway San Mateo, CA 94403-1906 | | Trustee and Chairman of the Board | | Trustee since 1988 and Chairman of the Board since 1993 | | 133 | | None |
|
Principal Occupation During Past 5 Years: Chairman of the Board, Member—Office of the Chairman and Director, Franklin Resources, Inc.; Director, Templeton Worldwide, Inc.; and officer and/or director or trustee, as the case may be, of some of the other subsidiaries of Franklin Resources, Inc. and of 41 of the investment companies in Franklin Templeton Investments. |
BOD-2
| | | | | | | | |
| Name, Year of Birth and Address | | Position | | Length of
Time Served | | Number of
Portfolios in Fund
Complex Overseen
by Board Member* | | Other Directorships Held |
**RUPERT H. JOHNSON, JR. (1940) One Franklin Parkway San Mateo, CA 94403-1906 | | Trustee, President and Chief Executive Officer—nvestment Management | | Trustee since 1988, President and Chief Executive Officer—Investment Management since 2002 | | 52 | | None |
|
Principal Occupation During Past 5 Years: Vice Chairman, Member—Office of the Chairman and Director, Franklin Resources, Inc.; Director, Franklin Advisers, Inc. and Templeton Worldwide, Inc.; Senior Vice President, Franklin Advisory Services, LLC; and officer and/or director or trustee, as the case may be, of some of the other subsidiaries of Franklin Resources, Inc. and of 43 of the investment companies in Franklin Templeton Investments. |
JAMES M. DAVIS (1952) One Franklin Parkway San Mateo, CA 94403-1906 | | Chief Compliance Officer and Vice President—AML Compliance | | Chief Compliance Officer since 2004 and Vice President—AML Compliance since 2006 | | Not
Applicable | | Not Applicable |
|
Principal Occupation During Past 5 Years: Director, Global Compliance, Franklin Resources, Inc.; officer of some of the other subsidiaries of Franklin Resources, Inc. and of 45 of the investment companies in Franklin Templeton Investments; and formerly, Director of Compliance, Franklin Resources, Inc. (1994-2001). |
LAURA F. FERGERSON (1962) One Franklin Parkway San Mateo, CA 94403-1906 | | Chief Executive Officer—Finance and Administration | | Since March 2009 | | Not
Applicable | | Not Applicable |
|
Principal Occupation During Past 5 Years: Senior Vice President, Franklin Templeton Services, LLC; officer of 45 of the investment companies in Franklin Templeton Investments; and formerly, Director and member of Audit and Valuation Committees, Runkel Funds, Inc. (2003-2004); Assistant Treasurer of most of the investment companies in Franklin Templeton Investments (1997-2003); and Vice President, Franklin Templeton Services, LLC (1997-2003). |
GASTON GARDEY (1967) One Franklin Parkway San Mateo, CA 94403-1906 | | Treasurer, Chief Financial Officer and Chief Accounting Officer | | Since March 2009 | | Not
Applicable | | Not Applicable |
|
Principal Occupation During Past 5 Years: Director, Fund Accounting, Franklin Templeton Investments; and officer of 27 of the investment companies in Franklin Templeton Investments. |
ALIYA S. GORDON (1973) One Franklin Parkway San Mateo, CA 94403-1906 | | Vice President | | Since March 2009 | | Not
Applicable | | Not Applicable |
|
Principal Occupation During Past 5 Years: Associate General Counsel, Franklin Templeton Investments; officer of 45 of the investment companies in Franklin Templeton Investments; and formerly, Litigation Associate, Steefel, Levitt & Weiss, LLP (2000-2004). |
DAVID P. GOSS (1947) One Franklin Parkway San Mateo, CA 94403-1906 | | Vice President | | Since 2000 | | Not
Applicable | | Not Applicable |
|
Principal Occupation During Past 5 Years: Senior Associate General Counsel, Franklin Templeton Investments; officer and/or director, as the case maybe, of some of the other subsidiaries of Franklin Resources, Inc. and of 45 of the investment companies in Franklin Templeton Investments. |
BOD-3
| | | | | | | | |
| Name, Year of Birth and Address | | Position | | Length of
Time Served | | Number of
Portfolios in Fund
Complex Overseen
by Board Member* | | Other Directorships Held |
STEVEN J. GRAY (1955) One Franklin Parkway San Mateo, CA 94403-1906 | | Vice President | | Since August 2009 | | Not
Applicable | | Not Applicable |
|
Principal Occupation During Past 5 Years: Senior Associate General Counsel, Franklin Templeton Investments; Vice President, Franklin Templeton Distributors, Inc.; and officer of 45 of the investment companies in Franklin Templeton Investments. |
ROBERT C. ROSSELOT (1960) 500 East Broward Blvd. Suite 2100 Fort Lauderdale, FL 33394-3091 | | Vice President | | Since August 2009 | | Not
Applicable | | Not Applicable |
|
Principal Occupation During Past 5 Years: Senior Associate General Counsel, Franklin Templeton Investments; Assistant Secretary, Franklin Resources, Inc.; Vice President and Secretary, Templeton Investment Counsel, LLC; Vice President, Secretary and Trust Officer, Fiduciary Trust International of the South; and officer of 45 of the investment companies in Franklin Templeton Investments. |
KAREN L. SKIDMORE (1952) One Franklin Parkway San Mateo, CA 94403-1906 | | Vice President and Secretary | | Since 2006 | | Not
Applicable | | Not Applicable |
|
Principal Occupation During Past 5 Years: Senior Associate General Counsel, Franklin Templeton Investments; and officer of 45 of the investment companies in Franklin Templeton Investments. |
CRAIG S. TYLE (1960) One Franklin Parkway San Mateo, CA 94403-1906 | | Vice President | | Since 2005 | | Not
Applicable | | Not Applicable |
|
Principal Occupation During Past 5 Years: General Counsel and Executive Vice President, Franklin Resources, Inc.; officer of some of the other subsidiaries of Franklin Resources, Inc. and of 45 of the investment companies in Franklin Templeton Investments; and formerly, Partner, Shearman & Sterling, LLP (2004-2005); and General Counsel, Investment Company Institute (ICI) (1997-2004). |
| *We | base the number of portfolios on each separate series of the U.S. registered investment companies within the Franklin Templeton Investments fund complex. These portfolios have a common investment manager or affiliated investment managers. |
| **Charles | B. Johnson and Rupert H. Johnson, Jr. are considered to be interested persons of the Trust under the federal securities laws due to their positions as officers and directors and major shareholders of Franklin Resources, Inc., which is the parent company of the Trust’s investment manager and distributor. |
Note 1: Charles B. Johnson and Rupert H. Johnson, Jr. are brothers.
Note 2: Officer information is current as of the date of this report. It is possible that after this date, information about officers may change.
BOD-4
The Sarbanes-Oxley Act of 2002 and Rules adopted by the Securities and Exchange Commission require the Fund to disclose whether the Fund’s Audit Committee includes at least one member who is an audit committee financial expert within the meaning of such Act and Rules. The Fund’s Board has determined that there is at least one such financial expert on the Audit Committee and has designated John B. Wilson as its audit committee financial expert. The Board believes that Mr. Wilson qualifies as such an expert in view of his extensive business background and experience, including service as chief financial officer of Staples, Inc. from 1992 to 1996. Mr. Wilson has been a Member and Chairman of the Fund’s Audit Committee since 2007. As a result of such background and experience, the Board believes that Mr. Wilson has acquired an understanding of generally accepted accounting principles and financial statements, the general application of such principles in connection with the accounting estimates, accruals and reserves, and analyzing and evaluating financial statements that present a breadth and level of complexity of accounting issues generally comparable to those of the Fund, as well as an understanding of internal controls and procedures for financial reporting and an understanding of audit committee functions. Mr. Wilson is an independent Board member as that term is defined under the relevant Securities and Exchange Commission Rules and Releases.
The Statement of Additional Information (SAI) includes additional information about the board members and is available, without charge, upon request. Shareholders may call (800) 321-8563 or their insurance companies to request the SAI.
BOD-5
Franklin Templeton Variable Insurance Products Trust
Shareholder Information
Proxy Voting Policies and Procedures
The Trust’s investment manager has established Proxy Voting Policies and Procedures (Policies) that the Trust uses to determine how to vote proxies relating to portfolio securities. Shareholders may view the Trust’s complete Policies online at franklintempleton.com. Alternatively, shareholders may request copies of the Policies free of charge by calling the Proxy Group collect at (954) 527-7678 or by sending a written request to: Franklin Templeton Companies, LLC, 500 East Broward Boulevard, Suite 1500, Fort Lauderdale, FL 33394, Attention: Proxy Group. Copies of the Trust’s proxy voting records are also made available online at franklintempleton.com and posted on the U.S. Securities and Exchange Commission’s website at sec.gov and reflect the most recent 12-month period ended June 30.
Quarterly Statement of Investments
The Trust files a complete statement of investments with the U.S. Securities and Exchange Commission for the first and third quarters for each fiscal year on Form N-Q. Shareholders may view the filed Form N-Q by visiting the Commission’s website at sec.gov. The filed form may also be viewed and copied at the Commission’s Public Reference Room in Washington, DC. Information regarding the operations of the Public Reference Room may be obtained by calling (800) SEC-0330
SI-1
| | |
 | | One Franklin Parkway San Mateo, CA 94403-1906 |
Annual Report
FRANKLIN TEMPLETON
VARIABLE INSURANCE PRODUCTS TRUST
Investment Managers
Franklin Advisers, Inc.
Franklin Advisory Services, LLC
Franklin Mutual Advisers, LLC
Franklin Templeton Institutional, LLC
Templeton Asset Management, Ltd.
Templeton Global Advisors Limited
Templeton Investment Counsel, LLC
Fund Administrator
Franklin Templeton Services, LLC
Distributor
Franklin Templeton Distributors, Inc.
Franklin Templeton Variable Insurance Products Trust (FTVIP) shares are generally sold only to insurance company separate accounts (Separate Account) to serve as the investment vehicles for both variable annuity and variable life insurance contracts.
Authorized for distribution to investors in Separate Accounts only when accompanied or preceded by the current prospectus for the applicable contract, which includes the Separate Account and the FTVIP prospectuses. Investors should carefully consider a fund’s investment goals, risks, charges and expenses before investing. The prospectus contains this and other information; please read it carefully before investing.
To ensure the highest quality of service, telephone calls to or from our service departments may be monitored, recorded and accessed. These calls can be identified by the presence of a regular beeping tone.
FTVIP A2009 02/10
| (a) | The Registrant has adopted a code of ethics that applies to its principal executive officers and principal financial and accounting officer. |
| (f) | Pursuant to Item 12(a)(1), the Registrant is attaching as an exhibit a copy of its code of ethics that applies to its principal executive officers and principal financial and accounting officer. |
| Item 3. | Audit Committee Financial Expert. |
| | |
| (a)(1) | | The Registrant has an audit committee financial expert serving on its audit committee. |
| |
| (2) | | The audit committee financial expert is John B. Wilson and he is “independent” as defined under the relevant Securities and Exchange Commission Rules and Releases. |
| Item 4. | Principal Accountant Fees and Services. |
The aggregate fees paid to the principal accountant for professional services rendered by the principal accountant for the audit of the registrant’s annual financial statements or for services that are normally provided by the principal accountant in connection with statutory and regulatory filings or engagements were $891,954 for the fiscal year ended December 31, 2009 and $848,307 for the fiscal year ended December 31, 2008.
There were no fees paid to the principal accountant for assurance and related services rendered by the principal accountant to the registrant that are reasonably related to the performance of the audit of the registrant’s financial statements and are not reported under paragraph (a) of Item 4.
There were no fees paid to the principal accountant for assurance and related services rendered by the principal accountant to the registrant’s investment adviser and any entity controlling, controlled by or under common control with the investment adviser that provides ongoing services to the registrant that are reasonably related to the performance of the audit of their financial statements.
The aggregate fees paid to the principal accountant for professional services rendered by the principal accountant to the registrant for tax compliance, tax advice and tax planning were $1,250 for the fiscal year ended December 31, 2009 and $1,290 for the fiscal year ended December 31, 2008. The services for which these fees were paid included tax compliance and advice.
The aggregate fees paid to the principal accountant for professional services rendered by the principal accountant to the registrant’s investment adviser and any entity controlling, controlled by or under common control with the investment adviser that provides ongoing services to the registrant for tax compliance, tax advice and tax planning were $2,762 for the fiscal year ended December 31, 2009 and $4,000 for the fiscal year ended December 31, 2008. The services for which these fees were paid included tax compliance and advice.
The aggregate fees paid to the principal accountant for products and services rendered by the principal accountant to the registrant not reported in paragraphs (a)-(c) of Item 4 were $0 for the fiscal year ended December 31, 2009 and $25,925 for the fiscal year ended December 31, 2008. The services for which these fees were paid include review of materials provided to the fund Board in connection with the investment management contract renewal process.
The aggregate fees paid to the principal accountant for products and services rendered by the principal accountant to the registrant’s investment adviser and any entity controlling, controlled by or under common control with the investment adviser that provides ongoing services to the registrant other than services reported in paragraphs (a)-(c) of Item 4 were $0 for the fiscal year ended December 31, 2009
and $258,152 for the fiscal year ended December 31, 2008. The services for which these fees were paid include review of materials provided to the fund Board in connection with the investment management contract renewal process.
(e) (1) The registrant’s audit committee is directly responsible for approving the services to be provided by the auditors, including:
(i) pre-approval of all audit and audit related services;
(ii) pre-approval of all non-audit related services to be provided to the Fund by the auditors;
(iii) pre-approval of all non-audit related services to be provided to the registrant by the auditors to the registrant’s investment adviser or to any entity that controls, is controlled by or is under common control with the registrant’s investment adviser and that provides ongoing services to the registrant where the non-audit services relate directly to the operations or financial reporting of the registrant; and
(iv) establishment by the audit committee, if deemed necessary or appropriate, as an alternative to committee pre-approval of services to be provided by the auditors, as required by paragraphs (ii) and (iii) above, of policies and procedures to permit such services to be pre-approved by other means, such as through establishment of guidelines or by action of a designated member or members of the committee; provided the policies and procedures are detailed as to the particular service and the committee is informed of each service and such policies and procedures do not include delegation of audit committee responsibilities, as contemplated under the Securities Exchange Act of 1934, to management; subject, in the case of (ii) through (iv), to any waivers, exceptions or exemptions that may be available under applicable law or rules.
(e) (2) None of the services provided to the registrant described in paragraphs (b)-(d) of Item 4 were approved by the audit committee pursuant to paragraph (c)(7)(i)(C) of Rule 2-01 of regulation S-X.
| (f) | No disclosures are required by this Item 4(f). |
(g) The aggregate non-audit fees paid to the principal accountant for services rendered by the principal accountant to the registrant and the registrant’s investment adviser and any entity controlling, controlled by or under common control with the investment adviser that provides ongoing services to the registrant were $4,012 for the fiscal year ended December 31, 2009 and $289,367 for the fiscal year ended December 31, 2008.
(h) The registrant’s audit committee of the board has considered whether the provision of non-audit services that were rendered to the registrant’s investment adviser (not including any sub-adviser whose role is primarily portfolio management and is subcontracted with or overseen by another investment adviser), and any entity controlling, controlled by, or under common control with the investment adviser that provides ongoing services to the registrant that were not pre-approved
pursuant to paragraph (c)(7)(ii) of Rule 2-01 of Regulation S-X is compatible with maintaining the principal accountant’s independence.
| Item 5. | Audit Committee of Listed Registrants. N/A |
| Item 6. | Schedule of Investments. N/A |
| Item 7. | Disclosure of Proxy Voting Policies and Procedures for Closed-End Management Investment Companies. N/A |
| Item 8. | Portfolio Managers of Closed-End Management Investment Companies. N/A |
| Item 9. | Purchases of Equity Securities by Closed-End Management Investment Companies and Affiliated Purchases. N/A |
| Item 10. | Submission of Matters to a vote of Security Holders. |
There have been no changes to the procedures by which shareholders may recommend nominees to the Registrant’s Board of Trustees that would require disclosure herein.
| Item 11. | Controls and Procedures. |
(a) Evaluation of Disclosure Controls and Procedures. The Registrant maintains disclosure controls and procedures that are designed to ensure that information required to be disclosed in the Registrant’s filings under the Securities Exchange Act of 1934 and the Investment Company Act of 1940 is recorded, processed, summarized and reported within the periods specified in the rules and forms of the Securities and Exchange Commission. Such information is accumulated and communicated to the Registrant’s management, including its principal executive officer and principal financial officer, as appropriate, to allow timely decisions regarding required disclosure. The Registrant’s management, including the principal executive officer and the principal financial officer, recognizes that any set of controls and procedures, no matter how well designed and operated, can provide only reasonable assurance of achieving the desired control objectives.
Within 90 days prior to the filing date of this Shareholder Report on Form N-CSR, the Registrant had carried out an evaluation, under the supervision and with the participation of the Registrant’s management, including the Registrant’s principal executive officer and the Registrant’s principal financial officer, of the effectiveness of the design and operation of the Registrant’s disclosure controls and procedures. Based on such evaluation, the Registrant’s principal executive officer and principal financial officer concluded that the Registrant’s disclosure controls and procedures are effective.
(b) Changes in Internal Controls. There have been no significant changes in the Registrant’s internal controls or in other factors that
could significantly affect the internal controls subsequent to the date of their evaluation in connection with the preparation of this Shareholder Report on Form N-CSR.
(a)(1) Code of Ethics
(a) (2) Certifications pursuant to Section 302 of the Sarbanes-Oxley Act of 2002 of Laura F. Fergerson, Chief Executive Officer—Finance and Administration, and Gaston Gardey, Chief Financial Officer and Chief Accounting Officer
(b) Certifications pursuant to Section 906 of the Sarbanes-Oxley Act of 2002 of Laura F. Fergerson, Chief Executive Officer—Finance and Administration, and Gaston Gardey, Chief Financial Officer and Chief Accounting Officer
SIGNATURES
Pursuant to the requirements of the Securities Exchange Act of 1934 and the Investment Company Act of 1940, the registrant has duly caused this report to be signed on its behalf by the undersigned, thereunto duly authorized.
| | |
| FRANKLIN TEMPLETON VARIABLE INSURANCE PRODUCTS TRUST |
| |
| By: | | /S/ LAURA F. FERGERSON |
| | Laura F. Fergerson Chief Executive Officer – Finance and Administration |
Date February 25, 2010
Pursuant to the requirements of the Securities Exchange Act of 1934 and the Investment Company Act of 1940, this report has been signed below by the following persons on behalf of the registrant and in the capacities and on the dates indicated.
| | |
| |
| By: | | /S/ LAURA F. FERGERSON |
| | Laura F. Fergerson Chief Executive Officer – Finance and Administration |
Date February 25, 2010
| | |
| |
| By: | | /S/ GASTON GARDEY |
| | Gaston Gardey Chief Financial Officer and Chief Accounting Officer |
Date February 25, 2010