UNITED STATES
SECURITIES AND EXCHANGE COMMISSION
Washington, D.C. 20549
FORM N-CSR
CERTIFIED SHAREHOLDER REPORT OF REGISTERED
MANAGEMENT INVESTMENT COMPANIES
Investment Company Act file number 811-05583
|
Franklin Templeton Variable Insurance Products Trust |
(Exact name of registrant as specified in charter)
|
| One Franklin Parkway, San Mateo, CA 94403-1906 |
(Address of principal executive offices) (Zip code)
|
| Craig S. Tyle, One Franklin Parkway, San Mateo, CA 94403-1906 |
(Name and address of agent for service)
Registrant’s telephone number, including area code: (650) 312-2000
Date of fiscal year end: 12/31
Date of reporting period: 12/31/10
| Item 1. | Reports to Stockholders. |

DECEMBER 31, 2010
FRANKLIN TEMPLETON
VARIABLE INSURANCE PRODUCTS TRUST
ANNUAL
REPORT

FRANKLIN TEMPLETON VARIABLE INSURANCE PRODUCTS TRUST ANNUAL REPORT
TABLEOF CONTENTS
NOT FDIC INSURED | MAY LOSE VALUE | NO BANK GUARANTEE
MASTER CLASS – 3
IMPORTANT NOTESTO PERFORMANCE INFORMATION
Performance data is historical and cannot predict or guarantee future results. Principal value and investment return will fluctuate with market conditions, and you may have a gain or loss when you withdraw your money. Inception dates of the funds may have preceded the effective dates of the subaccounts, contracts, or their availability in all states.
When reviewing the index comparisons, please keep in mind that indexes have a number of inherent performance differentials over the funds. First, unlike the funds, which must hold a minimum amount of cash to maintain liquidity, indexes do not have a cash component. Second, the funds are actively managed and, thus, are subject to management fees to cover salaries of securities analysts or portfolio managers in addition to other expenses. Indexes are unmanaged and do not include any commissions or other expenses typically associated with investing in securities. Third, indexes often contain a different mix of securities than the fund to which they are compared. Additionally, please remember that indexes are simply a measure of performance and cannot be invested in directly.
i
TEMPLETON DEVELOPING MARKETS SECURITIES FUND
This annual report for Templeton Developing Markets Securities Fund covers the fiscal year ended December 31, 2010.
Performance Summary as of 12/31/10
Average annual total return of Class 3 shares represents the average annual change in value, assuming reinvestment of dividends and capital gains. Average returns smooth out variations in returns, which can be significant; they are not the same as year-by-year results.
Periods ended 12/31/10
| | | | | | | | | | | | |
| | | 1-Year | | | 5-Year | | | 10-Year | |
Average Annual Total Return | | | +17.51% | | | | +9.63% | | | | +13.47% | |
*Since Class 3 shares were not offered until 5/1/04, performance prior to that date represents historical Class 2 performance. Since 5/1/04 (effective date), the average annual total return of Class 3 shares was +14.78%.
Total Return Index Comparison
for a Hypothetical $10,000 Investment (1/1/01–12/31/10)
The graph below shows the change in value of a hypothetical $10,000 investment in the Fund over the indicated period and includes reinvestment of any income or distributions. The Fund’s performance* is compared to the performance of the Morgan Stanley Capital International (MSCI) Emerging Markets (EM) Index and the Standard & Poor’s/International Finance Corporation Investable (S&P/IFCI) Composite Index. One cannot invest directly in an index, and an index is not representative of the Fund’s portfolio. Please see Important Notes to Performance Information preceding the Fund Summaries.
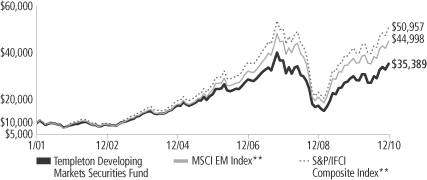
**Source: © 2011 Morningstar. Please see Index Descriptions following the Fund Summaries.
Templeton Developing Markets Securities Fund Class 3
Performance reflects the Fund’s Class 3 operating expenses, but does not include any contract fees, expenses or sales charges. If they had been included, performance would be lower. These charges and deductions, particularly for variable life policies, can have a significant effect on contract values and insurance benefits. See the contract prospectus for a complete description of these expenses, including sales charges.
Performance data represent past performance, which does not guarantee future results. Investment return and principal value will fluctuate, and you may have a gain or loss when you sell your shares.
Current performance may differ from figures shown.
TD-1
Fund Goal and Main Investments: Templeton Developing Markets Securities Fund seeks long-term capital appreciation. The Fund normally invests at least 80% of its net assets in emerging market investments.
Performance Overview
You can find the Fund’s one-year total return in the Performance Summary. The Fund underperformed the MSCI EM Index’s +19.20% total return, and the S&P/IFCI Composite Index’s +20.64% total return for the same period.1 Please note index performance numbers are for reference and we do not attempt to track an index but rather undertake investments on the basis of fundamental research.
Economic and Market Overview
In 2010, economic recovery was a major theme. Many emerging markets reported strong gross domestic product growth as they continued to recover from the impact of the 2008 global financial crisis. In several cases, robust domestic consumption, government expenditure and intra-regional trade offset weak external demand from developed markets. This led many countries in Asia and Latin America to return to pre-crisis growth levels faster than expected.
Following unprecedented fiscal and monetary expansion implemented by governments and central banks globally in 2009, the focus for many major emerging economies shifted from stimulating growth to managing inflation in 2010. Concerns about economic overheating and accelerating inflation in major economies such as China, India and Brazil led officials to steer toward the normalization of fiscal and monetary policies.
In an environment of low interest rates and ample liquidity, particularly in developed markets, the search for higher returns pushed fund flows into emerging markets toward record levels. Emerging market portfolios attracted US$88 billion in the first 11 months of 2010, already exceeding the 2009 total of US$83 billion.2
After rising 79.02% in 2009, emerging stock markets, as represented by the MSCI EM Index, were up 19.20% in U.S. dollar terms in 2010.1 However, equity prices experienced significant volatility throughout the year, as did exchange rates and commodity prices. Argentina’s market,
1. Source: © 2011 Morningstar. One cannot invest directly in an index, and an index is not representative of the Fund’s portfolio. Please see Index Descriptions following the Fund Summaries.
2. Source: EPFR Global.
Fund Risks: The Fund’s investments in stocks may offer the potential for long-term gains but can be subject to short-term price fluctuations. Investing in emerging or developing markets is subject to all the risks of foreign investing generally as well as additional, heightened risks, including currency fluctuations, economic instability, market volatility, political and social instability, the relatively smaller size and lesser liquidity of these markets, and less government supervision and regulation of business and industry practices. The Fund may have significant investments in one or more countries or in particular sectors or industries from time to time and may carry greater risk of adverse developments in a country, sector or industry than a fund that invests more broadly. Smaller and midsize company securities can increase the risk of greater price fluctuations, particularly over the short term. The manager applies various techniques and analyses in making investment decisions for the Fund, but there can be no guarantee that these decisions will produce the desired results. The Fund’s prospectus also includes a description of the main investment risks.
TD-2
although small and restricted, was one of the top performers with a total return of +77.37% in U.S. dollars.1 Investors anticipated long overdue market reforms after the death of former President Nestor Kirchner. Another strong performer was Thailand, with a +56.27% total return in U.S. dollar terms, as investors focused on the country’s strong fundamentals and put aside concerns regarding political turmoil earlier in the year.1 Other strong performers included South Africa; Chile, Colombia and Peru in Latin America; and Indonesia, Malaysia and the Philippines in Asia.
Investment Strategy
Our investment philosophy is bottom up, value oriented and long term. In choosing investments, we may make on-site visits to companies to assess critical factors such as management strength and local conditions. In addition, we focus on the market price of a company’s securities relative to our evaluation of the company’s potential long-term (typically five years) earnings, asset value and cash flow potential. Among factors we consider are a company’s historical value measures, including price/earnings ratio, profit margins and liquidation value. We perform in-depth research to construct an action list from which we make our investment decisions.
Manager’s Discussion
During the 12 months under review, key contributors to the Fund’s absolute performance included India’s Tata Consultancy Services, a major IT consulting company; Brazil’s AmBev (Companhia de Bebidas das Americas), one of the world’s largest beer and soft drink producers; and Russia’s Norilsk Nickel (Mining and Metallurgical Co. Norilsk Nickel), the world’s largest nickel and palladium producer. The outsourcing trend to Indian consulting companies continued to benefit Tata Consultancy Services, while greater beverage demand supported AmBev’s strong volume growth and high profitability. We increased the Fund’s positions in these two companies due to their attractive prospects in our view. In addition, higher nickel prices boosted Norilsk Nickel’s share price, as the company benefited from a strong market position and low production costs.
Some of the Fund’s largest detractors for the reporting period included Brazil’s Petrobras (Petroleo Brasileiro), a top global oil and gas
TD-3
company; Hungary’s OTP Bank, the country’s largest commercial bank; and India’s Sesa Goa, a leading iron ore exporter. Petrobras sold US$70 billion worth of shares to raise funds for its purchase of five billion barrels of undeveloped offshore oil reserves from the Brazilian government and for the company’s five-year investment plan. This share dilution pushed down Petrobras’ stock price and, as a result, we significantly reduced the Fund’s exposure to the company by period-end. Uncertainty surrounding the Hungarian economy and government plans for a temporary crisis tax on banks weighed on OTP Bank’s share price. We divested the Fund’s position and thus, our exposure to Hungary, by year-end. Sesa Goa’s stock declined in value because of India’s export ban on iron ore and the cancellation of mine leases.
It is also important to recognize the effect of currency movements on the Fund’s performance. In general, if the value of the U.S. dollar goes up compared with a foreign currency, an investment traded in that foreign currency will go down in value because it will be worth fewer U.S. dollars. This can have a negative effect on Fund performance. Conversely, when the U.S. dollar weakens in relation to a foreign currency, an investment traded in that foreign currency will increase in value, which can contribute to Fund performance. For the 12 months ended December 31, 2010, the U.S. dollar declined in value relative to most non-U.S. currencies. As a result, the Fund’s performance was positively affected by the portfolio’s predominant investment in securities with non-U.S. currency exposure. However, one cannot expect the same results in future periods.
During the review period, we increased the Fund’s holdings in Indonesia, Thailand and China via Hong Kong-listed Red Chip, Shanghai B and Shenzhen B shares, as we searched for attractive investment opportunities.3 Major purchases included Itau Unibanco Holding, one of Brazil’s largest financial conglomerates; CNOOC, China’s largest offshore oil and natural gas exploration and production company; and Kasikornbank Public, a major Thai bank. We made select purchases in companies engaged in automobile manufacturing; IT consulting and other services; and apparel, accessories and luxury goods. Key purchases included Astra International, Indonesia’s leading
3. “Red Chip” denotes shares of Hong Kong Stock Exchange-listed companies with significant exposure to China. “Shanghai B” denotes shares of China-incorporated, Shanghai Stock Exchange-listed companies that are traded in U.S. dollars and are eligible for foreign investment. “Shenzhen B” denotes shares of China-incorporated, Shenzhen Stock Exchange-listed companies that are traded in Hong Kong dollars.
Top 10 Holdings
Templeton Developing Markets Securities Fund 12/31/10
| | | | |
Company
Sector/Industry,
Country | | % of Total
Net Assets | |
| Vale SA, ADR, pfd., A | | | 6.5% | |
| Metals & Mining, Brazil | |
| Tata Consultancy Services Ltd. | | | 5.7% | |
| IT Services, India | |
| Itau Unibanco Holding SA, ADR | | | 4.6% | |
| Commercial Banks, Brazil | |
| AmBev (Companhia de Bebidas das Americas) | | | 4.2% | |
| Beverages, Brazil | |
Norilsk Nickel (Mining and Metallurgical Co. Norilsk Nickel), ADR | | | 3.6% | |
| Metals & Mining, Russia | |
| Gazprom, ADR | | | 3.3% | |
| Oil, Gas & Consumable Fuels, Russia | | | | |
| Natura Cosmeticos SA | | | 2.8% | |
| Personal Products, Brazil | |
| Anglo American PLC | | | 2.7% | |
| Metals & Mining, U.K. | |
| PT Astra International Tbk | | | 2.7% | |
| Automobiles, Indonesia | |
| LUKOIL Holdings, ADR | | | 2.6% | |
| Oil, Gas & Consumable Fuels, Russia | | | | |
The dollar value, number of shares or principal amount, and names of all portfolio holdings are listed in the Fund’s Statement of Investments.
TD-4
car and motorcycle manufacturer; Infosys Technologies, a major Indian IT consulting services provider; and Anta Sports Products, a leading Chinese sportswear producer and retailer.
Based on our analysis, consumer-related industries remained attractive due to large populations in emerging markets, where a growing middle class and greater domestic demand for goods and services could have an increasingly positive effect on these companies. We also had a favorable assessment of the IT consulting industry, which could continue to gain from the services outsourcing trend to emerging markets.
Conversely, we reduced or eliminated the Fund’s exposure to South Korea, Austria, Hungary and South Africa, which allowed us to focus on stocks we deemed to be relatively more attractively valued within our investment universe and raise funds for redemptions. We made large sales of holdings in oil and gas, banking, semiconductors, and wireless telecommunication services companies. Some Fund holdings reached their target sale prices, and we sold them by period-end. In addition to sales mentioned earlier, we eliminated the Fund’s position in South Korean electronics manufacturer Samsung Electronics by period-end.
Thank you for your participation in Templeton Developing Markets Securities Fund. We look forward to serving your future investment needs.
The foregoing information reflects our analysis, opinions and portfolio holdings as of December 31, 2010, the end of the reporting period. The way we implement our main investment strategies and the resulting portfolio holdings may change depending on factors such as market and economic conditions. These opinions may not be relied upon as investment advice or an offer for a particular security. The information is not a complete analysis of every aspect of any market, country, industry, security or the Fund. Statements of fact are from sources considered reliable, but the investment manager makes no representation or warranty as to their completeness or accuracy. Although historical performance is no guarantee of future results, these insights may help you understand our investment management philosophy.
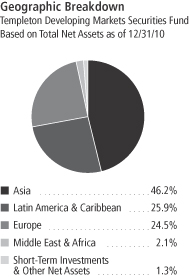
Top 10 Countries
Templeton Developing Markets Securities Fund
12/31/10
| | | | |
| | | % of Total Net Assets | |
| Brazil | | | 22.4% | |
| India | | | 16.5% | |
| Russia | | | 15.0% | |
| China | | | 13.2% | |
| U.K. | | | 4.8% | |
| Indonesia | | | 4.8% | |
| Thailand | | | 3.9% | |
| Turkey | | | 3.8% | |
| Mexico | | | 2.6% | |
| Hong Kong | | | 2.2% | |
TD-5
Fund Expenses
As an investor in a variable insurance contract (Contract) that indirectly provides for investment in an underlying mutual fund, you can incur transaction and/or ongoing expenses at both the Fund level and the Contract level.
| • | | Transaction expenses can include sales charges (loads) on purchases, redemption fees, surrender fees, transfer fees and premium taxes. |
| • | | Ongoing expenses can include management fees, distribution and service (12b-1) fees, contract fees, annual maintenance fees, mortality and expense risk fees and other fees and expenses. All mutual funds and Contracts have some types of ongoing expenses. |
The expenses shown in the table are meant to highlight ongoing expenses at the Fund level only and do not include ongoing expenses at the Contract level, or transaction expenses at either the Fund or Contract level. While the Fund does not have transaction expenses, if the transaction and ongoing expenses at the Contract level were included, the expenses shown below would be higher. You should consult your Contract prospectus or disclosure document for more information.
The table shows Fund-level ongoing expenses and can help you understand these expenses and compare them with those of other mutual funds offered through the Contract. The table assumes a $1,000 investment held for the six months indicated. Please refer to the Fund prospectus for additional information on operating expenses.
Actual Fund Expenses
The first line (Actual) of the table provides actual account values and expenses. The “Ending Account Value” is derived from the Fund’s actual return, which includes the effect of ongoing Fund expenses, but does not include the effect of ongoing Contract expenses.
You can estimate the Fund-level expenses you incurred during the period by following these steps. Of course, your account value and expenses will differ from those in this illustration:
| 1. | Divide your account value by $1,000. |
If an account had an $8,600 value, then $8,600 ÷ $1,000 = 8.6.
| 2. | Multiply the result by the number under the heading “Fund-Level Expenses Incurred During Period.” |
If Fund-Level Expenses Incurred During Period were $7.50, then 8.6 x $7.50 = $64.50.
In this illustration, the estimated expenses incurred this period at the Fund level are $64.50.
Templeton Developing Markets Securities Fund Class 3
TD-6
Hypothetical Example for Comparison with Other Mutual Funds
Information in the second line (Hypothetical) of the table can help you compare ongoing expenses of the Fund with those of other mutual funds offered through the Contract. This information may not be used to estimate the actual ending account balance or expenses you incurred during the period. The hypothetical “Ending Account Value” is based on the Fund’s actual expense ratio and an assumed 5% annual rate of return before expenses, which does not represent the Fund’s actual return. The figure under the heading “Fund-Level Expenses Incurred During Period” shows the hypothetical expenses your account would have incurred under this scenario. You can compare this figure with the 5% hypothetical examples that appear in shareholder reports of other funds offered through a Contract.
| | | | | | | | | | | | |
| Class 3 | | Beginning
Account Value 7/1/10 | | | Ending
Account Value 12/31/10 | | | Fund-Level Expenses Incurred
During Period* 7/1/10–12/31/10 | |
Actual | | $ | 1,000 | | | $ | 1,298.30 | | | $ | 10.14 | |
Hypothetical (5% return before expenses) | | $ | 1,000 | | | $ | 1,016.38 | | | $ | 8.89 | |
*Expenses are calculated using the most recent six-month annualized expense ratio for the Fund’s Class 3 shares (1.75%), which does not include any ongoing expenses of the Contract for which the Fund is an investment option, multiplied by the average account value over the period, multiplied by 184/365 to reflect the one-half year period.
TD-7
Franklin Templeton Variable Insurance Products Trust
Financial Highlights
Templeton Developing Markets Securities Fund
| | | | | | | | | | | | | | | | | | | | |
| | | Year Ended December 31, | |
| Class 1 | | 2010 | | | 2009 | | | 2008 | | | 2007 | | | 2006 | |
| | | | |
Per share operating performance | | | | | | | | | | | | | | | | | | | | |
(for a share outstanding throughout the year) | | | | | | | | | | | | | | | | | | | | |
Net asset value, beginning of year | | $ | 9.86 | | | $ | 6.11 | | | $ | 16.16 | | | $ | 13.92 | | | $ | 10.99 | |
| | | | |
Income from investment operationsa: | | | | | | | | | | | | | | | | | | | | |
Net investment incomeb | | | 0.09 | | | | 0.12 | | | | 0.16 | | | | 0.32 | | | | 0.24 | |
Net realized and unrealized gains (losses) | | | 1.63 | | | | 4.02 | | | | (7.40 | ) | | | 3.51 | | | | 2.84 | |
| | | | |
Total from investment operations | | | 1.72 | | | | 4.14 | | | | (7.24 | ) | | | 3.83 | | | | 3.08 | |
| | | | |
Less distributions from: | | | | | | | | | | | | | | | | | | | | |
Net investment income | | | (0.18 | ) | | | (0.36 | ) | | | (0.37 | ) | | | (0.38 | ) | | | (0.15 | ) |
Net realized gains | | | — | | | | (0.03 | ) | | | (2.44 | ) | | | (1.21 | ) | | | — | |
| | | | |
Total distributions | | | (0.18 | ) | | | (0.39 | ) | | | (2.81 | ) | | | (1.59 | ) | | | (0.15 | ) |
| | | | |
Redemption feesc | | | — | | | | — | | | | — | | | | — | | | | — | |
| | | | |
Net asset value, end of year | | $ | 11.40 | | | $ | 9.86 | | | $ | 6.11 | | | $ | 16.16 | | | $ | 13.92 | |
| | | | |
| | | | | |
Total returnd | | | 17.83% | | | | 73.32% | | | | (52.62)% | | | | 29.09% | | | | 28.43% | |
Ratios to average net assets | | | | | | | | | | | | | | | | | | | | |
Expensese | | | 1.49% | | | | 1.45% | | | | 1.52% | | | | 1.48% | | | | 1.47% | |
Net investment income | | | 0.87% | | | | 1.64% | | | | 1.52% | | | | 2.07% | | | | 1.93% | |
| | | | | |
Supplemental data | | | | | | | | | | | | | | | | | | | | |
Net assets, end of year (000’s) | | $ | 347,242 | | | $ | 325,927 | | | $ | 234,213 | | | $ | 753,843 | | | $ | 749,120 | |
Portfolio turnover rate | | | 24.41% | | | | 56.58% | f | | | 75.11% | f | | | 98.32% | | | | 53.65% | |
aThe amount shown for a share outstanding throughout the period may not correlate with the Statement of Operations for the period due to the timing of sales and repurchases of the Fund shares in relation to income earned and/or fluctuating market value of the investments of the Fund.
bBased on average daily shares outstanding.
cAmount rounds to less than $0.01 per share.
dTotal return does not include fees, charges or expenses imposed by the variable annuity and life insurance contracts for which the Franklin Templeton Variable Insurance Products Trust serves as an underlying investment vehicle.
eBenefit of expense reduction rounds to less than 0.01%.
fExcludes the value of portfolio securities delivered as a result of redemptions in-kind. See Note 10.
The accompanying notes are an integral part of these financial statements.
TD-8
Franklin Templeton Variable Insurance Products Trust
Financial Highlights (continued)
Templeton Developing Markets Securities Fund
| | | | | | | | | | | | | | | | | | | | |
| | | Year Ended December 31, | |
| Class 2 | | 2010 | | | 2009 | | | 2008 | | | 2007 | | | 2006 | |
| | | | |
Per share operating performance | | | | | | | | | | | | | | | | | | | | |
(for a share outstanding throughout the year) | | | | | | | | | | | | | | | | | | | | |
Net asset value, beginning of year | | $ | 9.78 | | | $ | 6.04 | | | $ | 15.99 | | | $ | 13.79 | | | $ | 10.90 | |
| | | | |
Income from investment operationsa: | | | | | | | | | | | | | | | | | | | | |
Net investment incomeb | | | 0.06 | | | | 0.11 | | | | 0.15 | | | | 0.27 | | | | 0.20 | |
Net realized and unrealized gains (losses) | | | 1.62 | | | | 3.98 | | | | (7.33 | ) | | | 3.49 | | | | 2.82 | |
| | | | |
Total from investment operations | | | 1.68 | | | | 4.09 | | | | (7.18 | ) | | | 3.76 | | | | 3.02 | |
| | | | |
Less distributions from: | | | | | | | | | | | | | | | | | | | | |
Net investment income | | | (0.16 | ) | | | (0.32 | ) | | | (0.33 | ) | | | (0.35 | ) | | | (0.13 | ) |
Net realized gains | | | — | | | | (0.03 | ) | | | (2.44 | ) | | | (1.21 | ) | | | — | |
| | | | |
Total distributions | | | (0.16 | ) | | | (0.35 | ) | | | (2.77 | ) | | | (1.56 | ) | | | (0.13 | ) |
| | | | |
Redemption feesc | | | — | | | | — | | | | — | | | | — | | | | — | |
| | | | |
Net asset value, end of year | | $ | 11.30 | | | $ | 9.78 | | | $ | 6.04 | | | $ | 15.99 | | | $ | 13.79 | |
| | | | |
| | | | | |
Total returnd | | | 17.58% | | | | 72.59% | | | | (52.70)% | | | | 28.78% | | | | 28.09% | |
Ratios to average net assets | | | | | | | | | | | | | | | | | | | | |
Expensese | | | 1.74% | | | | 1.70% | | | | 1.77% | | | | 1.73% | | | | 1.72% | |
Net investment income | | | 0.62% | | | | 1.39% | | | | 1.27% | | | | 1.82% | | | | 1.68% | |
| | | | | |
Supplemental data | | | | | | | | | | | | | | | | | | | | |
Net assets, end of year (000’s) | | $ | 392,546 | | | $ | 435,947 | | | $ | 264,186 | | | $ | 1,090,549 | | | $ | 857,514 | |
Portfolio turnover rate | | | 24.41% | | | | 56.58% | f | | | 75.11% | f | | | 98.32% | | | | 53.65% | |
aThe amount shown for a share outstanding throughout the period may not correlate with the Statement of Operations for the period due to the timing of sales and repurchases of the Fund shares in relation to income earned and/or fluctuating market value of the investments of the Fund.
bBased on average daily shares outstanding.
cAmount rounds to less than $0.01 per share.
dTotal return does not include fees, charges or expenses imposed by the variable annuity and life insurance contracts for which the Franklin Templeton Variable Insurance Products Trust serves as an underlying investment vehicle.
eBenefit of expense reduction rounds to less than 0.01%.
fExcludes the value of portfolio securities delivered as a result of redemptions in-kind. See Note 10.
The accompanying notes are an integral part of these financial statements.
TD-9
Franklin Templeton Variable Insurance Products Trust
Financial Highlights (continued)
Templeton Developing Markets Securities Fund
| | | | | | | | | | | | | | | | | | | | |
| | | Year Ended December 31, | |
| Class 3 | | 2010 | | | 2009 | | | 2008 | | | 2007 | | | 2006 | |
| | | | |
Per share operating performance | | | | | | | | | | | | | | | | | | | | |
(for a share outstanding throughout the year) | | | | | | | | | | | | | | | | | | | | |
Net asset value, beginning of year | | $ | 9.73 | | | $ | 6.02 | | | $ | 15.96 | | | $ | 13.78 | | | $ | 10.90 | |
| | | | |
Income from investment operationsa: | | | | | | | | | | | | | | | | | | | | |
Net investment incomeb | | | 0.06 | | | | 0.10 | | | | 0.11 | | | | 0.24 | | | | 0.20 | |
Net realized and unrealized gains (losses) | | | 1.60 | | | | 3.97 | | | | (7.27 | ) | | | 3.52 | | | | 2.83 | |
| | | | |
Total from investment operations | | | 1.66 | | | | 4.07 | | | | (7.16 | ) | | | 3.76 | | | | 3.03 | |
| | | | |
Less distributions from: | | | | | | | | | | | | | | | | | | | | |
Net investment income | | | (0.16 | ) | | | (0.33 | ) | | | (0.34 | ) | | | (0.37 | ) | | | (0.15 | ) |
Net realized gains | | | — | | | | (0.03 | ) | | | (2.44 | ) | | | (1.21 | ) | | | — | |
| | | | |
Total distributions | | | (0.16 | ) | | | (0.36 | ) | | | (2.78 | ) | | | (1.58 | ) | | | (0.15 | ) |
| | | | |
Redemption feesc | | | — | | | | — | | | | — | | | | — | | | | — | |
| | | | |
Net asset value, end of year | | $ | 11.23 | | | $ | 9.73 | | | $ | 6.02 | | | $ | 15.96 | | | $ | 13.78 | |
| | | | |
| | | | | |
Total returnd | | | 17.51% | | | | 72.63% | | | | (52.67)% | | | | 28.70% | | | | 28.17% | |
Ratios to average net assets | | | | | | | | | | | | | | | | | | | | |
Expensese | | | 1.74% | | | | 1.70% | | | | 1.77% | | | | 1.73% | | | | 1.72% | |
Net investment income | | | 0.62% | | | | 1.39% | | | | 1.27% | | | | 1.82% | | | | 1.68% | |
| | | | | |
Supplemental data | | | | | | | | | | | | | | | | | | | | |
Net assets, end of year (000’s) | | $ | 66,484 | | | $ | 66,718 | | | $ | 32,953 | | | $ | 100,961 | | | $ | 43,372 | |
Portfolio turnover rate | | | 24.41% | | | | 56.58% | f | | | 75.11% | f | | | 98.32% | | | | 53.65% | |
aThe amount shown for a share outstanding throughout the period may not correlate with the Statement of Operations for the period due to the timing of sales and repurchases of the Fund shares in relation to income earned and/or fluctuating market value of the investments of the Fund.
bBased on average daily shares outstanding.
cAmount rounds to less than $0.01 per share.
dTotal return does not include fees, charges or expenses imposed by the variable annuity and life insurance contracts for which the Franklin Templeton Variable Insurance Products Trust serves as an underlying investment vehicle.
eBenefit of expense reduction rounds to less than 0.01%.
fExcludes the value of portfolio securities delivered as a result of redemptions in-kind. See Note 10.
The accompanying notes are an integral part of these financial statements.
TD-10
Franklin Templeton Variable Insurance Products Trust
Financial Highlights (continued)
Templeton Developing Markets Securities Fund
| | | | | | | | | | | | |
| | | Year Ended December 31, | |
| Class 4 | | 2010 | | | 2009 | | | 2008a | |
| | | | |
Per share operating performance | | | | | | | | | | | | |
(for a share outstanding throughout the year) | | | | | | | | | | | | |
Net asset value, beginning of year | | $ | 9.80 | | | $ | 6.09 | | | $ | 14.88 | |
| | | | |
Income from investment operationsb: | | | | | | | | | | | | |
Net investment income (loss)c | | | 0.05 | | | | 0.09 | | | | (0.33 | ) |
Net realized and unrealized gains (losses) | | | 1.61 | | | | 4.00 | | | | (5.65 | ) |
| | | | |
Total from investment operations | | | 1.66 | | | | 4.09 | | | | (5.98 | ) |
| | | | |
Less distributions from: | | | | | | | | | | | | |
Net investment income | | | (0.16 | ) | | | (0.35 | ) | | | (0.37 | ) |
Net realized gains | | | — | | | | (0.03 | ) | | | (2.44 | ) |
| | | | |
Total distributions | | | (0.16 | ) | | | (0.38 | ) | | | (2.81 | ) |
| | | | |
Redemption feesd | | | — | | | | — | | | | — | |
| | | | |
Net asset value, end of year | | $ | 11.30 | | | $ | 9.80 | | | $ | 6.09 | |
| | | | |
| | | |
Total returne | | | 17.41% | | | | 72.45% | | | | (48.66)% | |
Ratios to average net assetsf | | | | | | | | | | | | |
Expensesg | | | 1.84% | | | | 1.80% | | | | 1.87% | |
Net investment income | | | 0.52% | | | | 1.29% | | | | 1.17% | |
| | | |
Supplemental data | | | | | | | | | | | | |
Net assets, end of year (000’s) | | $ | 37,198 | | | $ | 26,362 | | | $ | 7,208 | |
Portfolio turnover rate | | | 24.41% | | | | 56.58% | h | | | 75.11% | h |
aFor the period February 29, 2008 (effective date) to December 31, 2008.
bThe amount shown for a share outstanding throughout the period may not correlate with the Statement of Operations for the period due to the timing of sales and repurchases of the Fund shares in relation to income earned and/or fluctuating market value of the investments of the Fund.
cBased on average daily shares outstanding.
dAmount rounds to less than $0.01 per share.
eTotal return does not include fees, charges or expenses imposed by the variable annuity and life insurance contracts for which the Franklin Templeton Variable Insurance Products Trust serves as an underlying investment vehicle. Total return is not annualized for periods less than one year.
fRatios are annualized for periods less than one year.
gBenefit of expense reduction rounds to less than 0.01%.
hExcludes the value of portfolio securities delivered as a result of redemptions in-kind. See Note 10.
The accompanying notes are an integral part of these financial statements.
TD-11
Franklin Templeton Variable Insurance Products Trust
Statement of Investments, December 31, 2010
| | | | | | | | | | | | |
| Templeton Developing Markets Securities Fund | | Industry | | | Shares | | | Value | |
Common Stocks 88.3% | | | | | | | | | | | | |
Brazil 12.9% | | | | | | | | | | | | |
Companhia de Bebidas das Americas (AmBev) | | | Beverages | | | | 1,356,585 | | | $ | 35,476,960 | |
Itau Unibanco Holding SA, ADR | | | Commercial Banks | | | | 1,623,674 | | | | 38,984,413 | |
Natura Cosmeticos SA | | | Personal Products | | | | 823,138 | | | | 23,654,274 | |
Souza Cruz SA | | | Tobacco | | | | 199,070 | | | | 10,842,661 | |
| | | | | | | | | | | | |
| | | | | | | | | | | 108,958,308 | |
| | | | | | | | | | | | |
China 13.2% | | | | | | | | | | | | |
Ajisen China Holdings Ltd. | | | Hotels, Restaurants & Leisure | | | | 501,754 | | | | 845,671 | |
aAluminum Corp. of China Ltd., H | | | Metals & Mining | | | | 13,316,000 | | | | 12,146,727 | |
Anta Sports Products Ltd. | | | Textiles, Apparel & Luxury Goods | | | | 2,131,000 | | | | 3,416,180 | |
a,bChangsha Zoomlion Heavy Industry Science and Technology Development Co. Ltd., H, 144A | | | Machinery | | | | 450,600 | | | | 1,018,017 | |
China Coal Energy Co., H | | | Oil, Gas & Consumable Fuels | | | | 6,513,000 | | | | 10,172,765 | |
China Dongxiang Group Co. | | | Textiles, Apparel & Luxury Goods | | | | 5,428,000 | | | | 2,374,423 | |
China Shipping Development Co. Ltd., H | | | Marine | | | | 6,816,000 | | | | 9,085,077 | |
CNOOC Ltd. | | | Oil, Gas & Consumable Fuels | | | | 7,181,000 | | | | 17,129,075 | |
Golden Eagle Retail Group Ltd. | | | Multiline Retail | | | | 1,204,000 | | | | 2,958,688 | |
Great Wall Motor Co. Ltd., H | | | Automobiles | | | | 903,000 | | | | 2,823,146 | |
Guangzhou Automobile Group Co. Ltd., H | | | Automobiles | | | | 13,424,396 | | | | 18,584,304 | |
Inner Mongolia Yitai Coal Co. Ltd., B | | | Oil, Gas & Consumable Fuels | | | | 1,014,967 | | | | 7,241,790 | |
PetroChina Co. Ltd., H | | | Oil, Gas & Consumable Fuels | | | | 13,880,000 | | | | 18,072,126 | |
Yantai Changyu Pioneer Wine Co. Ltd., B | | | Beverages | | | | 472,400 | | | | 5,027,588 | |
| | | | | | | | | | | | |
| | | | | | | | | | | 110,895,577 | |
| | | | | | | | | | | | |
Hong Kong 2.2% | | | | | | | | | | | | |
Dairy Farm International Holdings Ltd. | | | Food & Staples Retailing | | | | 1,014,733 | | | | 9,426,870 | |
Daphne International Holdings Ltd. | | | Textiles, Apparel & Luxury Goods | | | | 874,000 | | | | 818,619 | |
VTech Holdings Ltd. | | | Communications Equipment | | | | 724,000 | | | | 8,541,756 | |
| | | | | | | | | | | | |
| | | | | | | | | | | 18,787,245 | |
| | | | | | | | | | | | |
India 16.5% | | | | | | | | | | | | |
aCoal India Ltd. | | | Oil, Gas & Consumable Fuels | | | | 581,875 | | | | 4,092,808 | |
a,bCoal India Ltd., 144A | | | Oil, Gas & Consumable Fuels | | | | 32,353 | | | | 227,565 | |
Grasim Industries Ltd. | | | Chemicals | | | | 40,253 | | | | 2,107,335 | |
Hindalco Industries Ltd. | | | Metals & Mining | | | | 2,542,079 | | | | 13,986,054 | |
Infosys Technologies Ltd. | | | IT Services | | | | 238,290 | | | | 18,359,721 | |
National Aluminium Co. Ltd. | | | Metals & Mining | | | | 561,104 | | | | 4,917,386 | |
Oil & Natural Gas Corp. Ltd. | | | Oil, Gas & Consumable Fuels | | | | 456,656 | | | | 13,209,704 | |
Sesa Goa Ltd. | | | Metals & Mining | | | | 2,421,060 | | | | 17,781,965 | |
Steel Authority of India Ltd. | | | Metals & Mining | | | | 1,451,892 | | | | 5,926,090 | |
Tata Chemicals Ltd. | | | Chemicals | | | | 1,172,718 | | | | 10,329,885 | |
Tata Consultancy Services Ltd. | | | IT Services | | | | 1,857,283 | | | | 48,394,242 | |
| | | | | | | | | | | | |
| | | | | | | | | | | 139,332,755 | |
| | | | | | | | | | | | |
Indonesia 4.8% | | | | | | | | | | | | |
PT Astra International Tbk | | | Automobiles | | | | 3,806,000 | | | | 23,042,986 | |
PT Bank Central Asia Tbk | | | Commercial Banks | | | | 15,933,532 | | | | 11,317,936 | |
PT Bank Rakyat Indonesia (Persero) Tbk | | | Commercial Banks | | | | 4,902,500 | | | | 5,713,235 | |
| | | | | | | | | | | | |
| | | | | | | | | | | 40,074,157 | |
| | | | | | | | | | | | |
Mexico 2.6% | | | | | | | | | | | | |
America Movil SAB de CV, L, ADR | | | Wireless Telecommunication Services | | | | 307,367 | | | | 17,624,424 | |
Kimberly Clark de Mexico SAB de CV, A | | | Household Products | | | | 730,258 | | | | 4,459,071 | |
| | | | | | | | | | | | |
| | | | | | | | | | | 22,083,495 | |
| | | | | | | | | | | | |
TD-12
Franklin Templeton Variable Insurance Products Trust
Statement of Investments, December 31, 2010 (continued)
| | | | | | | | | | | | |
| Templeton Developing Markets Securities Fund | | Industry | | | Shares | | | Value | |
Common Stocks (continued) | | | | | | | | | | | | |
Nigeria 0.1% | | | | | | | | | | | | |
Nigerian Breweries PLC | | | Beverages | | | | 1,586,265 | | | $ | 798,350 | |
| | | | | | | | | | | | |
Pakistan 1.7% | | | | | | | | | | | | |
MCB Bank Ltd. | | | Commercial Banks | | | | 2,302,989 | | | | 6,132,346 | |
Oil & Gas Development Co. Ltd. | | | Oil, Gas & Consumable Fuels | | | | 4,217,200 | | | | 8,377,810 | |
| | | | | | | | | | | | |
| | | | | | | | | | | 14,510,156 | |
| | | | | | | | | | | | |
Russia 15.0% | | | | | | | | | | | | |
Gazprom, ADR | | | Oil, Gas & Consumable Fuels | | | | 851,800 | | | | 21,669,792 | |
Gazprom, ADR (London Stock Exchange) | | | Oil, Gas & Consumable Fuels | | | | 235,100 | | | | 5,931,573 | |
cLUKOIL Holdings, ADR | | | Oil, Gas & Consumable Fuels | | | | 75,208 | | | | 4,303,402 | |
cLUKOIL Holdings, ADR (London Stock Exchange) | | | Oil, Gas & Consumable Fuels | | | | 317,168 | | | | 17,951,709 | |
Mining and Metallurgical Co. Norilsk Nickel, ADR | | | Metals & Mining | | | | 1,251,800 | | | | 30,093,272 | |
Mobile TeleSystems | |
| Wireless Telecommunication
Services |
| | | 302,083 | | | | 2,567,463 | |
Mobile TeleSystems, ADR | |
| Wireless Telecommunication
Services |
| | | 206,000 | | | | 4,299,220 | |
Sberbank RF | | | Commercial Banks | | | | 6,061,420 | | | | 20,651,258 | |
TNK-BP | | | Oil, Gas & Consumable Fuels | | | | 5,340,274 | | | | 14,316,063 | |
dUralkali, GDR, Reg S | | | Chemicals | | | | 122,196 | | | | 4,489,481 | |
| | | | | | | | | | | | |
| | | | | | | | | | | 126,273,233 | |
| | | | | | | | | | | | |
Singapore 0.6% | | | | | | | | | | | | |
Keppel Corp. Ltd. | | | Industrial Conglomerates | | | | 559,143 | | | | 4,933,358 | |
| | | | | | | | | | | | |
South Africa 1.0% | | | | | | | | | | | | |
Remgro Ltd. | | | Diversified Financial Services | | | | 504,061 | | | | 8,600,905 | |
| | | | | | | | | | | | |
South Korea 1.0% | | | | | | | | | | | | |
aSilicon Works Co. Ltd. | |
| Semiconductors &
Semiconductor Equipment |
| | | 1,632 | | | | 48,760 | |
SK Energy Co. Ltd. | | | Oil, Gas & Consumable Fuels | | | | 48,967 | | | | 8,472,328 | |
| | | | | | | | | | | | |
| | | | | | | | | | | 8,521,088 | |
| | | | | | | | | | | | |
Sweden 0.9% | | | | | | | | | | | | |
Oriflame Cosmetics SA, SDR | | | Personal Products | | | | 149,765 | | | | 7,897,398 | |
| | | | | | | | | | | | |
Taiwan 2.2% | | | | | | | | | | | | |
President Chain Store Corp. | | | Food & Staples Retailing | | | | 3,628,075 | | | | 16,728,697 | |
eUni-President China Holdings Ltd. | | | Food Products | | | | 2,679,000 | | | | 1,433,855 | |
| | | | | | | | | | | | |
| | | | | | | | | | | 18,162,552 | |
| | | | | | | | | | | | |
Thailand 3.9% | | | | | | | | | | | | |
Kasikornbank Public Co. Ltd., fgn. | | | Commercial Banks | | | | 2,739,100 | | | | 11,889,325 | |
PTT Exploration and Production Public Co. Ltd., fgn. | | | Oil, Gas & Consumable Fuels | | | | 1,961,100 | | | | 10,958,417 | |
PTT Public Co. Ltd., fgn. | | | Oil, Gas & Consumable Fuels | | | | 938,100 | | | | 9,984,766 | |
| | | | | | | | | | | | |
| | | | | | | | | | | 32,832,508 | |
| | | | | | | | | | | | |
Turkey 3.8% | | | | | | | | | | | | |
Akbank TAS | | | Commercial Banks | | | | 2,712,311 | | | | 15,092,826 | |
Koza Altin Isletmeleri AS | | | Metals & Mining | | | | 36,069 | | | | 481,887 | |
Tupras-Turkiye Petrol Rafinerileri AS | | | Oil, Gas & Consumable Fuels | | | | 667,504 | | | | 16,710,328 | |
| | | | | | | | | | | | |
| | | | | | | | | | | 32,285,041 | |
| | | | | | | | | | | | |
United Arab Emirates 1.0% | | | | | | | | | | | | |
aEmaar Properties PJSC | |
| Real Estate Management &
Development |
| | | 8,942,377 | | | | 8,642,918 | |
| | | | | | | | | | | | |
TD-13
Franklin Templeton Variable Insurance Products Trust
Statement of Investments, December 31, 2010 (continued)
| | | | | | | | | | | | |
| Templeton Developing Markets Securities Fund | | Industry | | | Shares | | | Value | |
Common Stocks (continued) | | | | | | | | | | | | |
United Kingdom 4.8% | | | | | | | | | | | | |
Anglo American PLC | | | Metals & Mining | | | | 444,762 | | | $ | 23,046,056 | |
Antofagasta PLC | | | Metals & Mining | | | | 704,479 | | | | 17,750,351 | |
| | | | | | | | | | | | |
| | | | | | | | | | | 40,796,407 | |
| | | | | | | | | | | | |
Vietnam 0.1% | | | | | | | | | | | | |
Petrovietnam Fertilizer and Chemical JSC | | | Chemicals | | | | 217,810 | | | | 424,505 | |
| | | | | | | | | | | | |
Total Common Stocks (Cost $438,404,828) | | | | | | | | | | | 744,809,956 | |
| | | | | | | | | | | | |
Preferred Stocks 10.4% | | | | | | | | | | | | |
Brazil 9.5% | | | | | | | | | | | | |
Banco Bradesco SA, ADR, pfd. | | | Commercial Banks | | | | 607,631 | | | | 12,328,833 | |
Itausa - Investimentos Itau SA, pfd. | | | Commercial Banks | | | | 1,018,810 | | | | 8,103,577 | |
Petroleo Brasileiro SA, ADR, pfd. | | | Oil, Gas & Consumable Fuels | | | | 130,588 | | | | 4,462,192 | |
Vale SA, ADR, pfd., A | | | Metals & Mining | | | | 1,817,625 | | | | 54,928,628 | |
| | | | | | | | | | | | |
| | | | | | | | | | | 79,823,230 | |
| | | | | | | | | | | | |
Chile 0.9% | | | | | | | | | | | | |
Embotelladora Andina SA, pfd., A | | | Beverages | | | | 1,918,947 | | | | 7,872,603 | |
| | | | | | | | | | | | |
Total Preferred Stocks (Cost $37,817,290) | | | | | | | | | | | 87,695,833 | |
| | | | | | | | | | | | |
Total Investments before Short Term Investments
(Cost $476,222,118) | | | | | | | | | | | 832,505,789 | |
| | | | | | | | | | | | |
Short Term Investments (Cost $12,023,709) 1.4% | | | | | | | | | | | | |
Money Market Funds 1.4% | | | | | | | | | | | | |
a,fInstitutional Fiduciary Trust Money Market Portfolio | | | | | | | 12,023,709 | | | | 12,023,709 | |
| | | | | | | | | | | | |
Total Investments (Cost $488,245,827) 100.1% | | | | | | | | | | | 844,529,498 | |
Other Assets, less Liabilities (0.1)% | | | | | | | | | | | (1,059,551 | ) |
| | | | | | | | | | | | |
Net Assets 100.0% | | | | | | | | | | $ | 843,469,947 | |
| | | | | | | | | | | | |
See Abbreviations on page TD-26.
aNon-income producing.
bSecurity was purchased pursuant to Rule 144A under the Securities Act of 1933 and may be sold in transactions exempt from registration only to qualified institutional buyers or in a public offering registered under the Securities Act of 1933. These securities have been deemed liquid under guidelines approved by the Trust’s Board of Trustees. At December 31, 2010, the aggregate value of these securities was $1,245,582, representing 0.15% of net assets.
cAt December 31, 2010, pursuant to the Fund’s policies and the requirements of applicable securities law, the Fund may be restricted from trading these securities for a limited or extended period of time due to ownership limits and/or potential possession of material non-public information.
dSecurity was purchased pursuant to Regulation S under the Securities Act of 1933, which exempts from registration securities offered and sold outside of the United States. Such a security cannot be sold in the United States without either an effective registration statement filed pursuant to the Securities Act of 1933, or pursuant to an exemption from registration. This security has been deemed liquid under guidelines approved by the Trust’s Board of Trustees. At December 31, 2010, the value of this security was $4,489,481, representing 0.53% of net assets.
eA portion of all of the security purchased on a delayed delivery basis. See note 1(c).
fSee Note 7 regarding investments in the Institutional Fiduciary Trust Money Market Portfolio.
The accompanying notes are an integral part of these financial statements.
TD-14
Franklin Templeton Variable Insurance Products Trust
Financial Statements
Statements of Assets and Liabilities
December 31, 2010
| | | | |
| | | Templeton
Developing Markets
Securities Fund | |
Assets: | | | | |
Investments in securities: | | | | |
Cost - Unaffiliated issuers | | $ | 476,222,118 | |
Cost - Sweep Money Fund (Note 7) | | | 12,023,709 | |
| | | | |
Total cost of investments | | $ | 488,245,827 | |
| | | | |
Value - Unaffiliated issuers | | $ | 832,505,789 | |
Value - Sweep Money Fund (Note 7) | | | 12,023,709 | |
| | | | |
Total value of investments | | | 844,529,498 | |
Foreign currency, at value (cost $255,156) | | | 254,727 | |
Receivables: | | | | |
Investment securities sold | | | 274,331 | |
Capital shares sold | | | 596,965 | |
Dividends | | | 571,719 | |
Foreign tax | | | 244,317 | |
Other assets | | | 122 | |
| | | | |
Total assets | | | 846,471,679 | |
| | | | |
Liabilities: | | | | |
Payables: | | | | |
Investment securities purchased | | | 802,548 | |
Capital shares redeemed | | | 601,838 | |
Affiliates | | | 1,167,902 | |
Reports to shareholders | | | 190,633 | |
Deferred tax | | | 53,321 | |
Accrued expenses and other liabilities | | | 185,490 | |
| | | | |
Total liabilities | | | 3,001,732 | |
| | | | |
Net assets, at value | | $ | 843,469,947 | |
| | | | |
Net assets consist of: | | | | |
Paid-in capital | | $ | 660,200,245 | |
Undistributed net investment income | | | 163,727 | |
Net unrealized appreciation (depreciation) | | | 356,211,712 | |
Accumulated net realized gain (loss) | | | (173,105,737 | ) |
| | | | |
Net assets, at value | | $ | 843,469,947 | |
| | | | |
The accompanying notes are an integral part of these financial statements.
TD-15
Franklin Templeton Variable Insurance Products Trust
Financial Statements (continued)
Statements of Assets and Liabilities (continued)
December 31, 2010
| | | | |
| | | Templeton
Developing Markets
Securities Fund | |
Class 1: | | | | |
Net assets, at value | | $ | 347,242,173 | |
| | | | |
Shares outstanding | | | 30,462,720 | |
| | | | |
Net asset value and maximum offering price per share | | $ | 11.40 | |
| | | | |
Class 2: | | | | |
Net assets, at value | | $ | 392,546,175 | |
| | | | |
Shares outstanding | | | 34,731,746 | |
| | | | |
Net asset value and maximum offering price per share | | $ | 11.30 | |
| | | | |
Class 3: | | | | |
Net assets, at value | | $ | 66,483,746 | |
| | | | |
Shares outstanding | | | 5,917,820 | |
| | | | |
Net asset value and maximum offering price per sharea | | $ | 11.23 | |
| | | | |
Class 4: | | | | |
Net assets, at value | | $ | 37,197,853 | |
| | | | |
Shares outstanding | | | 3,290,674 | |
| | | | |
Net asset value and maximum offering price per share | | $ | 11.30 | |
| | | | |
aRedemption price is equal to net asset value less redemption fees retained by the Fund.
The accompanying notes are an integral part of these financial statements.
TD-16
Franklin Templeton Variable Insurance Products Trust
Financial Statements (continued)
Statements of Operations
for the year ended December 31, 2010
| | | | |
| | | Templeton
Developing Markets
Securities Fund | |
Investment income: | | | | |
Dividends (net of foreign taxes of $2,096,520) | | $ | 18,390,972 | |
Interest | | | 567 | |
| | | | |
Total investment income | | | 18,391,539 | |
| | | | |
Expenses: | | | | |
Management fees (Note 3a) | | | 9,615,170 | |
Administrative fees (Note 3b) | | | 1,053,483 | |
Distribution fees (Note 3c) | | | | |
Class 2 | | | 950,322 | |
Class 3 | | | 151,963 | |
Class 4 | | | 104,197 | |
Unaffiliated transfer agent fees | | | 2,538 | |
Custodian fees (Note 4) | | | 564,413 | |
Reports to shareholders | | | 250,793 | |
Professional fees | | | 75,232 | |
Trustees’ fees and expenses | | | 3,523 | |
Other | | | 27,832 | |
| | | | |
Total expenses | | | 12,799,466 | |
Expense reductions (Note 4) | | | (3 | ) |
| | | | |
Net expenses | | | 12,799,463 | |
| | | | |
Net investment income | | | 5,592,076 | |
| | | | |
Realized and unrealized gains (losses): | | | | |
Net realized gain (loss) from: | | | | |
Investments | | | 49,859,979 | |
Foreign currency transactions | | | (98,901 | ) |
| | | | |
Net realized gain (loss) | | | 49,761,078 | |
| | | | |
Net change in unrealized appreciation (depreciation) on: | | | | |
Investments | | | 65,639,558 | |
Translation of other assets and liabilities denominated in foreign currencies | | | 2,185 | |
Change in deferred taxes on unrealized appreciation | | | 2,815,324 | |
| | | | |
Net change in unrealized appreciation (depreciation) | | | 68,457,067 | |
| | | | |
Net realized and unrealized gain (loss) | | | 118,218,145 | |
| | | | |
Net increase (decrease) in net assets resulting from operations | | $ | 123,810,221 | |
| | | | |
The accompanying notes are an integral part of these financial statements.
TD-17
Franklin Templeton Variable Insurance Products Trust
Financial Statements (continued)
Statements of Changes in Net Assets
| | | | | | | | |
| | | Templeton Developing Markets
Securities Fund | |
| | | Year Ended December 31, | |
| | | 2010 | | | 2009 | |
| | | | |
Increase (decrease) in net assets: | | | | | | | | |
Operations: | | | | | | | | |
Net investment income | | $ | 5,592,076 | | | $ | 9,443,956 | |
Net realized gain (loss) from investments and foreign currency transactions | | | 49,761,078 | | | | (56,490,240 | ) |
Net change in unrealized appreciation (depreciation) on investments, translation of other assets and liabilities denominated in foreign currencies and deferred taxes | | | 68,457,067 | | | | 387,238,551 | |
| | | | |
Net increase (decrease) in net assets resulting from operations | | | 123,810,221 | | | | 340,192,267 | |
| | | | |
Distributions to shareholders from: | | | | | | | | |
Net investment income: | | | | | | | | |
Class 1 | | | (5,483,924 | ) | | | (13,652,950 | ) |
Class 2 | | | (5,656,521 | ) | | | (13,921,115 | ) |
Class 3 | | | (947,886 | ) | | | (1,779,543 | ) |
Class 4 | | | (471,295 | ) | | | (467,339 | ) |
Net realized gains: | | | | | | | | |
Class 1 | | | — | | | | (1,172,623 | ) |
Class 2 | | | — | | | | (1,344,137 | ) |
Class 3 | | | — | | | | (166,799 | ) |
Class 4 | | | — | | | | (41,022 | ) |
| | | | |
Total distributions to shareholders | | | (12,559,626 | ) | | | (32,545,528 | ) |
| | | | |
Capital share transactions: (Note 2) | | | | | | | | |
Class 1 | | | (22,233,537 | ) | | | (15,950,150 | ) |
Class 2 | | | (97,764,544 | ) | | | 3,177,398 | |
Class 3 | | | (9,001,736 | ) | | | 10,244,457 | |
Class 4 | | | 6,238,252 | | | | 11,266,396 | |
| | | | |
Total capital share transactions | | | (122,761,565 | ) | | | 8,738,101 | |
| | | | |
Redemption fees | | | 26,367 | | | | 10,133 | |
| | | | |
Net increase (decrease) in net assets | | | (11,484,603 | ) | | | 316,394,973 | |
Net assets: | | | | | | | | |
Beginning of year | | | 854,954,550 | | | | 538,559,577 | |
| | | | |
End of year | | $ | 843,469,947 | | | $ | 854,954,550 | |
| | | | |
Undistributed net investment income included in net assets: | | | | | | | | |
End of year | | $ | 163,727 | | | $ | 6,700,234 | |
| | | | |
The accompanying notes are an integral part of these financial statements.
TD-18
Franklin Templeton Variable Insurance Products Trust
Notes to Financial Statements
Templeton Developing Markets Securities Fund
1. ORGANIZATION AND SIGNIFICANT ACCOUNTING POLICIES
Franklin Templeton Variable Insurance Products Trust (Trust) is registered under the Investment Company Act of 1940, as amended, (1940 Act) as an open-end investment company, consisting of twenty separate funds. The Templeton Developing Markets Securities Fund (Fund) is included in this report. The financial statements of the remaining funds in the Trust are presented separately. Shares of the Fund are generally sold only to insurance company separate accounts to fund the benefits of variable life insurance policies or variable annuity contracts. The Fund offers four classes of shares: Class 1, Class 2, Class 3, and Class 4. Each class of shares differs by its distribution fees, voting rights on matters affecting a single class and its exchange privilege.
The following summarizes the Fund’s significant accounting policies.
a. Financial Instrument Valuation
The Fund values its investments in securities and other assets and liabilities carried at fair value daily. Fair value is the price that would be received to sell an asset or paid to transfer a liability in an orderly transaction between market participants on the measurement date. Under procedures approved by the Trust’s Board of Trustees, the Fund may utilize independent pricing services, quotations from securities and financial instrument dealers, and other market sources to determine fair value.
Equity securities listed on an exchange or on the NASDAQ National Market System are valued at the last quoted sale price or the official closing price of the day, respectively. Foreign equity securities are valued as of the close of trading on the foreign stock exchange on which the security is primarily traded, or the NYSE, whichever is earlier. The value is then converted into its U.S. dollar equivalent at the foreign exchange rate in effect at the close of the NYSE on the day that the value of the security is determined. Over-the-counter securities are valued within the range of the most recent quoted bid and ask prices. Securities that trade in multiple markets or on multiple exchanges are valued according to the broadest and most representative market. Certain equity securities are valued based upon fundamental characteristics or relationships to similar securities. Investments in open-end mutual funds are valued at the closing net asset value.
The Fund has procedures to determine the fair value of securities and other financial instruments for which market prices are not readily available or which may not be reliably priced. Under these procedures, the Fund primarily employs a market-based approach which may use related or comparable assets or liabilities, recent transactions, market multiples, book values, and other relevant information for the investment to determine the fair value of the investment. The Fund may also use an income-based valuation approach in which the anticipated future cash flows of the investment are discounted to calculate fair value. Discounts may also be applied due to the nature or duration of any restrictions on the disposition of the investments. Due to the inherent uncertainty of valuations of such investments, the fair values may differ significantly from the values that would have been used had an active market existed.
Trading in securities on foreign securities stock exchanges and over-the-counter markets may be completed before the daily close of business on the NYSE. Occasionally, events occur between the time at which trading in a foreign security is completed and the close of the NYSE that might call into question the reliability of the value of a portfolio security held by the Fund. As a result, differences may arise between the value of the Fund’s portfolio securities as determined at the foreign market close and the latest indications of value at the close of the NYSE. In order to minimize the potential for these differences, the investment manager monitors price movements following the close of trading in foreign stock markets through a series of country specific market proxies (such as baskets of American Depository Receipts, futures contracts and exchange traded funds). These price movements are measured against established trigger thresholds for each specific market proxy to assist in determining if an event has occurred that may call into question the reliability of the values of the foreign securities held by the Fund. If such an event occurs, the securities may be valued using fair value procedures, which may include the use of independent pricing services.
b. Foreign Currency Translation
Portfolio securities and other assets and liabilities denominated in foreign currencies are translated into U.S. dollars based on the exchange rate of such currencies against U.S. dollars on the date of valuation. The Fund may enter into foreign currency
TD-19
Franklin Templeton Variable Insurance Products Trust
Notes to Financial Statements (continued)
Templeton Developing Markets Securities Fund
1. ORGANIZATION AND SIGNIFICANT ACCOUNTING POLICIES (continued)
b. Foreign Currency Translation (continued)
exchange contracts to facilitate transactions denominated in a foreign currency. Purchases and sales of securities, income and expense items denominated in foreign currencies are translated into U.S. dollars at the exchange rate in effect on the transaction date. Portfolio securities and assets and liabilities denominated in foreign currencies contain risks that those currencies will decline in value relative to the U.S. dollar. Occasionally, events may impact the availability or reliability of foreign exchange rates used to convert the U.S. dollar equivalent value. If such an event occurs, the foreign exchange rate will be valued at fair value using procedures established and approved by the Trust’s Board of Trustees.
The Fund does not separately report the effect of changes in foreign exchange rates from changes in market prices on securities held. Such changes are included in net realized and unrealized gain or loss from investments on the Statement of Operations.
Realized foreign exchange gains or losses arise from sales of foreign currencies, currency gains or losses realized between the trade and settlement dates on securities transactions and the difference between the recorded amounts of dividends, interest, and foreign withholding taxes and the U.S. dollar equivalent of the amounts actually received or paid. Net unrealized foreign exchange gains and losses arise from changes in foreign exchange rates on foreign denominated assets and liabilities other than investments in securities held at the end of the reporting period.
c. Securities Purchased on a Delayed Delivery Basis
The Fund may purchase securities on a delayed delivery basis, with payment and delivery scheduled for a future date. These transactions are subject to market fluctuations and are subject to the risk that the value at delivery may be more or less than the trade date purchase price. Although the Fund will generally purchase these securities with the intention of holding the securities, it may sell the securities before the settlement date. Sufficient assets have been segregated for these securities.
d. Income and Deferred Taxes
It is the Fund’s policy to qualify as a regulated investment company under the Internal Revenue Code. The Fund intends to distribute to shareholders substantially all of its taxable income and net realized gains to relieve it from federal income and excise taxes. As a result, no provision for U.S. federal income taxes is required. The Fund files U.S. income tax returns as well as tax returns in certain other jurisdictions. The Fund’s application of those tax rules is subject to its understanding. The Fund records a provision for taxes in its financial statements including penalties and interest, if any, for a tax position taken on a tax return (or expected to be taken) when it fails to meet the more likely than not (a greater than 50% probability) threshold and based on the technical merits, the tax position may not be sustained upon examination by the tax authorities. As of December 31, 2010, and for all open tax years, the Fund has determined that no provision for income tax is required in the Fund’s financial statements. Open tax years are those that remain subject to examination and are based on each tax jurisdiction statute of limitation. The Fund is not aware of any tax position for which it is reasonably possible that the total amounts of unrecognized tax effects will significantly change in the next twelve months.
The Fund may be subject to foreign taxation related to income received, capital gains on the sale of securities and certain foreign currency transactions in the foreign jurisdictions in which it invests. Foreign taxes, if any, are recorded based on the tax regulations and rates that exist in the foreign markets in which the Fund invests. When a capital gain tax is determined to apply the Fund records an estimated deferred tax liability for net unrealized gains on these securities in an amount that would be payable if the securities were disposed of on the valuation date.
e. Security Transactions, Investment Income, Expenses and Distributions
Security transactions are accounted for on trade date. Realized gains and losses on security transactions are determined on a specific identification basis. Dividend income is recorded on the ex-dividend date except that certain dividends from foreign securities are recognized as soon as the Fund is notified of the ex-dividend date. Distributions to shareholders are recorded on the ex-dividend date and are determined according to income tax regulations (tax basis). Distributable earnings determined on a
TD-20
Franklin Templeton Variable Insurance Products Trust
Notes to Financial Statements (continued)
Templeton Developing Markets Securities Fund
1. ORGANIZATION AND SIGNIFICANT ACCOUNTING POLICIES (continued)
e. Security Transactions, Investment Income, Expenses and Distributions (continued)
tax basis may differ from earnings recorded in accordance with accounting principles generally accepted in the United States of America. These differences may be permanent or temporary. Permanent differences are reclassified among capital accounts to reflect their tax character. These reclassifications have no impact on net assets or the results of operations. Temporary differences are not reclassified, as they may reverse in subsequent periods.
Common expenses incurred by the Trust are allocated among the funds based on the ratio of net assets of each fund to the combined net assets of the Trust. Fund specific expenses are charged directly to the fund that incurred the expense.
Realized and unrealized gains and losses and net investment income, not including class specific expenses, are allocated daily to each class of shares based upon the relative proportion of net assets of each class. Differences in per share distributions, by class, are generally due to differences in class specific expenses.
f. Accounting Estimates
The preparation of financial statements in accordance with accounting principles generally accepted in the United States of America requires management to make estimates and assumptions that affect the reported amounts of assets and liabilities at the date of the financial statements and the amounts of income and expenses during the reporting period. Actual results could differ from those estimates.
g. Redemption Fees
Redemptions and exchanges of interests in an insurance company subaccount that invests in Class 3 shares of the Fund will be subject to a 1.0% short term trading fee if the interest in the subaccount has been held for less than 60 days. Such fees are retained by the Fund and accounted for as an addition to paid-in capital, allocated to each class of shares based upon the relative proportion of net assets of each class.
h. Guarantees and Indemnifications
Under the Trust’s organizational documents, its officers and trustees are indemnified by the Trust against certain liabilities arising out of the performance of their duties to the Trust. Additionally, in the normal course of business, the Trust, on behalf of the Fund, enters into contracts with service providers that contain general indemnification clauses. The Trust’s maximum exposure under these arrangements is unknown as this would involve future claims that may be made against the Trust that have not yet occurred. Currently, the Trust expects the risk of loss to be remote.
2. SHARES OF BENEFICIAL INTEREST
At December 31, 2010, there were an unlimited number of shares authorized (without par value). Transactions in the Fund’s shares were as follows:
| | | | | | | | | | | | | | | | |
| | | Year Ended December 31, | |
| | | 2010 | | | 2009 | |
| | | Shares | | | Amount | | | Shares | | | Amount | |
Class 1 Shares: | | | | | | | | | | | | | | | | |
Shares sold | | | 4,235,745 | | | $ | 44,045,245 | | | | 8,168,810 | | | $ | 63,707,152 | |
Shares issued in reinvestment of distributions | | | 603,956 | | | | 5,483,924 | | | | 2,750,570 | | | | 14,825,573 | |
Shares redeemed in-kind (Note 10) | | | — | | | | — | | | | (7,688,598 | ) | | | (41,966,671 | ) |
Shares redeemed | | | (7,418,014 | ) | | | (71,762,706 | ) | | | (8,503,331 | ) | | | (52,516,204 | ) |
| | | | |
Net increase (decrease) | | | (2,578,313 | ) | | $ | (22,233,537 | ) | | | (5,272,549 | ) | | $ | (15,950,150 | ) |
| | | | |
TD-21
Franklin Templeton Variable Insurance Products Trust
Notes to Financial Statements (continued)
Templeton Developing Markets Securities Fund
2. SHARES OF BENEFICIAL INTEREST (continued)
| | | | | | | | | | | | | | | | |
| | | Year Ended December 31, | |
| | | 2010 | | | 2009 | |
| | | Shares | | | Amount | | | Shares | | | Amount | |
Class 2 Shares: | | | | | | | | | | | | | | | | |
Shares sold | | | 9,770,557 | | | $ | 97,538,996 | | | | 10,529,364 | | | $ | 81,012,897 | |
Shares issued in reinvestment of distributions | | | 627,805 | | | | 5,656,521 | | | | 2,847,995 | | | | 15,265,252 | |
Shares redeemed | | | (20,231,375 | ) | | | (200,960,061 | ) | | | (12,555,978 | ) | | | (93,100,751 | ) |
| | | | |
Net increase (decrease) | | | (9,833,013 | ) | | $ | (97,764,544 | ) | | | 821,381 | | | $ | 3,177,398 | |
| | | | |
Class 3 Shares: | | | | | | | | | | | | | | | | |
Shares sold | | | 1,343,547 | | | $ | 13,467,640 | | | | 2,627,098 | | | $ | 19,856,055 | |
Shares issued in reinvestment of distributions | | | 105,791 | | | | 947,886 | | | | 365,167 | | | | 1,946,341 | |
Shares redeemed | | | (2,390,224 | ) | | | (23,417,262 | ) | | | (1,609,465 | ) | | | (11,557,938 | ) |
| | | | |
Net increase (decrease) | | | (940,886 | ) | | $ | (9,001,736 | ) | | | 1,382,800 | | | $ | 10,244,457 | |
| | | | |
Class 4 Shares: | | | | | | | | | | | | | | | | |
Shares sold | | | 1,189,893 | | | $ | 11,893,157 | | | | 1,613,355 | | | $ | 12,381,956 | |
Shares issued on reinvestment of distributions | | | 52,250 | | | | 471,295 | | | | 94,491 | | | | 508,362 | |
Shares redeemed | | | (641,932 | ) | | | (6,126,200 | ) | | | (201,223 | ) | | | (1,623,922 | ) |
| | | | |
Net increase (decrease) | | | 600,211 | | | $ | 6,238,252 | | | | 1,506,623 | | | $ | 11,266,396 | |
| | | | |
3. TRANSACTIONS WITH AFFILIATES
Franklin Resources, Inc. is the holding company for various subsidiaries that together are referred to as Franklin Templeton Investments. Certain officers and trustees of the Fund are also officers and/or directors of the following subsidiaries:
| | |
| Subsidiary | | Affiliation |
Templeton Asset Management Ltd. (TAML) | | Investment manager |
Franklin Templeton Services, LLC (FT Services) | | Administrative manager |
Franklin Templeton Distributors, Inc. (Distributors) | | Principal underwriter |
Franklin Templeton Investor Services, LLC (Investor Services) | | Transfer agent |
a. Management Fees
The Fund pays an investment management fee to TAML based on the average daily net assets of the Fund as follows:
| | |
| Annualized Fee Rate | | Net Assets |
| 1.250% | | Up to and including $500 million |
| 1.200% | | Over $500 million, up to and including $3 billion |
| 1.150% | | Over $3 billion, up to and including $4 billion |
| 1.100% | | Over $4 billion, up to and including $15 billion |
| 1.050% | | Over $15 billion, up to and including $20 billion |
| 1.000% | | In excess of $20 billion |
Prior to May 1, 2010, the Fund paid an annualized fee rate of 1.25% on net assets up to and including $1 billion.
TD-22
Franklin Templeton Variable Insurance Products Trust
Notes to Financial Statements (continued)
Templeton Developing Markets Securities Fund
3. TRANSACTIONS WITH AFFILIATES (continued)
b. Administrative Fees
The Fund pays an administrative fee to FT Services based on the Fund’s average daily net assets as follows:
| | |
| Fee Rate | | Net Assets |
| 0.150% | | Up to and including $200 million |
| 0.135% | | Over $200 million, up to and including $700 million |
| 0.100% | | Over $700 million, up to and including $1.2 billion |
| 0.075% | | In excess of $1.2 billion |
c. Distribution Fees
The Trust’s Board of Trustees has adopted distribution plans for Class 2, Class 3, and Class 4 shares pursuant to Rule 12b-1 under the 1940 Act. Under the Fund’s compensation distribution plans, the Fund pays Distributors for costs incurred in connection with the servicing, sale and distribution of the Fund’s shares up to 0.25%, 0.35%, and 0.35% per year of its average daily net assets of Class 2, Class 3, and Class 4, respectively. The Board of Trustees has agreed to limit the current rate to 0.25% per year for Class 3.
d. Transfer Agent Fees
Investor Services, under terms of an agreement, performs shareholder servicing for the Fund and is not paid by the Fund for the services.
4. EXPENSE OFFSET ARRANGEMENT
The Fund has entered into an arrangement with its custodian whereby credits realized as a result of uninvested cash balances are used to reduce a portion of the Fund’s custodian expenses. During the year ended December 31, 2010, the custodian fees were reduced as noted in the Statement of Operations.
5. INCOME TAXES
For tax purposes, capital losses may be carried over to offset future capital gains, if any. At December 31, 2010, the Fund had tax basis capital losses of $166,405,957 expiring in 2017. During the year ended December 31, 2010, the Fund utilized $46,167,495 of capital loss carryforwards.
The tax character of distributions paid during the years ended December 31, 2010 and 2009, was as follows:
| | | | | | | | |
| | | 2010 | | | 2009 | |
Distributions paid from: | | | | | | | | |
Ordinary income | | $ | 12,559,626 | | | $ | 29,826,261 | |
Long term capital gain | | | — | | | | 2,719,267 | |
| | | | |
| | $ | 12,559,626 | | | $ | 32,545,528 | |
| | | | |
TD-23
Franklin Templeton Variable Insurance Products Trust
Notes to Financial Statements (continued)
Templeton Developing Markets Securities Fund
5. INCOME TAXES (continued)
At December 31, 2010, the cost of investments, net unrealized appreciation (depreciation) and undistributed ordinary income for income tax purposes were as follows:
| | | | |
Cost of investments | | $ | 502,554,307 | |
| | | | |
| |
Unrealized appreciation | | $ | 352,930,909 | |
Unrealized depreciation | | | (10,955.718 | ) |
| | | | |
Net unrealized appreciation (depreciation) | | $ | 341,975,191 | |
| | | | |
Distributable earnings – undistributed ordinary income | | $ | 7,772,423 | |
| | | | |
Net investment income differs for financial statement and tax purposes primarily due to differing treatments of foreign currency transactions, passive foreign investment company shares, and corporate actions.
Net realized gains (losses) differ for financial statement and tax purposes primarily due to differing treatments of wash sales, foreign currency transactions, passive foreign investment company shares, and corporate actions.
6. INVESTMENT TRANSACTIONS
Purchases and sales of investments (excluding short term securities) for the year ended December 31, 2010, aggregated $182,627,907 and $288,362,839, respectively.
7. INVESTMENTS IN INSTITUTIONAL FIDUCIARY TRUST MONEY MARKET PORTFOLIO
The Fund may invest in the Institutional Fiduciary Trust Money Market Portfolio (Sweep Money Fund), an open-end investment company managed by Franklin Advisers, Inc. (an affiliate of the investment manager). Management fees paid by the Fund are reduced on assets invested in the Sweep Money Fund, in an amount not to exceed the management and administrative fees paid by the Sweep Money Fund.
8. CONCENTRATION OF RISK
Investing in foreign securities may include certain risks and considerations not typically associated with investing in U.S. securities, such as fluctuating currency values and changing local and regional economic, political and social conditions, which may result in greater market volatility. In addition, certain foreign securities may not be as liquid as U.S. securities.
9. CREDIT FACILITY
The Fund, together with other U.S. registered and foreign investment funds (collectively “Borrowers”), managed by Franklin Templeton Investments, are borrowers in a joint syndicated senior unsecured credit facility totaling $750 million (Global Credit Facility) which matures on January 21, 2011. This Global Credit Facility provides a source of funds to the Borrowers for temporary and emergency purposes, including the ability to meet future unanticipated or unusually large redemption requests.
Under the terms of the Global Credit Facility, the Fund shall, in addition to interest charged on any borrowings made by the Fund and other costs incurred by the Fund, pay its share of fees and expenses incurred in connection with the implementation and maintenance of the Global Credit Facility, based upon its relative share of the aggregate net assets of all of the Borrowers, including an annual commitment fee of 0.10% based upon the unused portion of the Global Credit Facility, which is reflected in other expenses on the Statement of Operations. During the year ended December 31, 2010, the Fund did not use the Global Credit Facility.
TD-24
Franklin Templeton Variable Insurance Products Trust
Notes to Financial Statements (continued)
Templeton Developing Markets Securities Fund
9. CREDIT FACILITY (continued)
Effective January 21, 2011, the Borrowers renewed the Global Credit Facility for a total of $750 million, maturing January 20, 2012.
10. REDEMPTION IN-KIND
During the year ended December 31, 2009, the Fund realized $6,207,989 of net losses resulting from a redemption in-kind in which a shareholder redeemed fund shares for securities held by the Fund rather than for cash. Because such losses are not taxable to the Fund, and are not netted with capital gains that are distributed to remaining shareholders, they have been reclassified from accumulated net realized losses to paid in capital.
11. FAIR VALUE MEASUREMENTS
The Fund follows a fair value hierarchy that distinguishes between market data obtained from independent sources (observable inputs) and the Fund’s own market assumptions (unobservable inputs). These inputs are used in determining the value of the Fund’s investments and are summarized in the following fair value hierarchy:
| | • | | Level 1 – quoted prices in active markets for identical securities |
| | • | | Level 2 – other significant observable inputs (including quoted prices for similar securities, interest rates, prepayment speed, credit risk, etc.) |
| | • | | Level 3 – significant unobservable inputs (including the Fund’s own assumptions in determining the fair value of investments) |
The inputs or methodology used for valuing securities are not an indication of the risk associated with investing in those securities.
For movements between the levels within the fair value hierarchy, the Fund has adopted a policy of recognizing the transfers as of the date of the underlying event which caused the movement.
At December 31, 2010, all of the Fund’s investments in securities carried at fair value were in Level 1 inputs. For detailed industry/country descriptions, see the accompanying Statement of Investments.
TD-25
Franklin Templeton Variable Insurance Products Trust
Notes to Financial Statements (continued)
Templeton Developing Markets Securities Fund
12. SUBSEQUENT EVENTS
The Fund has evaluated subsequent events through the issuance of the financial statements and determined that no events have occurred that require disclosure other than those already disclosed in the financial statements.
| | | | |
ABBREVIATIONS | | | | |
| Selected Portfolio | | | | |
| | | | |
| ADR - American Depository Receipt | | | | |
| GDR - Global Depository Receipt | | | | |
| SDR - Swedish Depository Receipt | | | | |
TD-26
Franklin Templeton Variable Insurance Products Trust
Templeton Developing Markets Securities Fund
Report of Independent Registered Public Accounting Firm
To the Board of Trustees and Shareholders of Franklin Templeton Variable Insurance Products Trust
In our opinion, the accompanying statement of assets and liabilities, including the statement of investments, and the related statements of operations and of changes in net assets and the financial highlights present fairly, in all material respects, the financial position of Templeton Developing Markets Securities Fund (the “Fund”) at December 31, 2010, the results of its operations for the year then ended, the changes in its net assets for each of the two years in the period then ended and the financial highlights for each of the periods presented, in conformity with accounting principles generally accepted in the United States of America. These financial statements and financial highlights (hereafter referred to as “financial statements”) are the responsibility of the Fund’s management. Our responsibility is to express an opinion on these financial statements based on our audits. We conducted our audits of these financial statements in accordance with the standards of the Public Company Accounting Oversight Board (United States). Those standards require that we plan and perform the audit to obtain reasonable assurance about whether the financial statements are free of material misstatement. An audit includes examining, on a test basis, evidence supporting the amounts and disclosures in the financial statements, assessing the accounting principles used and significant estimates made by management, and evaluating the overall financial statement presentation. We believe that our audits, which included confirmation of securities at December 31, 2010 by correspondence with the custodian and brokers, provide a reasonable basis for our opinion.
PricewaterhouseCoopers LLP
San Francisco, California
February 10, 2011
TD-27
Franklin Templeton Variable Insurance Products Trust
Tax Designation (unaudited)
Templeton Developing Markets Securities Fund
At December 31, 2010, more than 50% of the Fund’s total assets were invested in securities of foreign issuers. In most instances, foreign taxes were withheld from income paid to the Fund on these investments. The Fund elects to treat foreign taxes paid as allowed under Section 853 of the Internal Revenue Code. This election will allow shareholders of record as of the 2011 distribution date, to treat their proportionate share of foreign taxes paid by the Funds as having been paid directly by them. The shareholder shall consider these amounts as foreign taxes paid in the tax year in which they receive the Fund distribution.
TD-28
TEMPLETON FOREIGN SECURITIES FUND
This annual report for Templeton Foreign Securities Fund covers the fiscal year ended December 31, 2010.
Performance Summary as of 12/31/10
Average annual total return of Class 3 shares* represents the average annual change in value, assuming reinvestment of dividends and capital gains. Average returns smooth out variations in returns, which can be significant; they are not the same as year-by-year results.
Periods ended 12/31/10
| | | | | | | | | | | | |
| | | 1-Year | | | 5-Year | | | 10-Year | |
Average Annual Total Return | | | +8.41% | | | | +4.45% | | | | +3.91% | |
*Since Class 3 shares were not offered until 5/1/04, performance prior to that date represents historical Class 2 performance. Since 5/1/04 (effective date), the average annual total return of Class 3 shares was +7.22%.
Total Return Index Comparison for a Hypothetical $10,000 Investment (1/1/01–12/31/10)
The graph below shows the change in value of a hypothetical $10,000 investment in the Fund over the indicated period and includes reinvestment of any income or distributions. The Fund’s performance* is compared to the performance of the Morgan Stanley Capital International (MSCI) Europe, Australasia, Far East (EAFE) Index. One cannot invest directly in an index, and an index is not representative of the Fund’s portfolio. Please see Important Notes to Performance Information preceding the Fund Summaries.
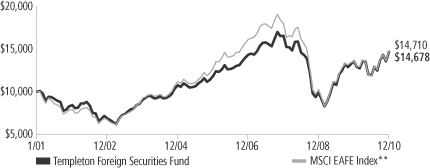
**Source: © 2011 Morningstar. Please see Index Descriptions following the Fund Summaries.
Templeton Foreign Securities Fund – Class 3
Performance reflects the Fund’s Class 3 operating expenses, but does not include any contract fees, expenses or sales charges. If they had been included, performance would be lower. These charges and deductions, particularly for variable life policies, can have a significant effect on contract values and insurance benefits. See the contract prospectus for a complete description of these expenses, including sales charges.
Performance data represent past performance, which does not guarantee future results. Investment return and principal value will fluctuate, and you may have a gain or loss when you sell your shares.
Current performance may differ from figures shown.
TF-1
Fund Goal and Main Investments: Templeton Foreign Securities Fund seeks long-term capital growth. The Fund normally invests at least 80% of its net assets in investments of issuers located outside the U.S., including those in emerging markets.
Performance Overview
You can find the Fund’s one-year total return in the Performance Summary. The Fund performed comparably to its benchmark, the MSCI EAFE Index, which delivered a total return of +8.21% for the same period.1 Please note, index performance information is provided for reference and we do not attempt to track the index but rather undertake investments on the basis of fundamental research.
Economic and Market Overview
During the year under review, equities advanced against a backdrop of heightened volatility and uneven global economic recovery. Emerging market regions primarily led growth, as they were generally unconstrained by the debt overhang burdening western economies and benefited from strong intrinsic demand and significant capital inflows. Policymakers in these regions began raising interest rates toward period-end to combat inflation and speculative investment. Developed economies grew at a more subdued pace, with demand recovery and asset price reflation heavily underpinned by government-sponsored, liquidity-enhancing measures. The U.S. Federal Reserve Board (Fed), having already brought official interest rates close to zero, began directly purchasing government securities as part of an extreme policy measure known as quantitative easing. Further promoting the U.S. recovery, the traditionally pro-business Republican Party gained control of the House of Representatives in mid-term elections and President Obama extended Bush-era tax cuts. In Europe, ballooning fiscal deficits took their toll on peripheral nations and growing concerns of potential sovereign defaults significantly roiled equity markets on several occasions during the period. The European Central Bank responded by pledging 750 billion euros in the spring with the intent to forestall defaults, stabilize markets and restore confidence in the euro currency, followed by further backstops in the autumn as Ireland and the rest of the periphery came under renewed duress.
1. Source: © 2011 Morningstar. One cannot invest directly in an index, and an index is not representative of the Fund’s portfolio. Please see Index Descriptions following the Fund Summaries.
Fund Risks: The Fund’s investments in stocks may offer the potential for long-term gains but can be subject to short-term price fluctuations. Foreign investing, especially in emerging markets, involves additional risks, including currency fluctuations, economic instability, market volatility, and political and social instability. The Fund may have significant investments in one or more countries or in particular sectors, such as technology and financial services from time to time, and may carry greater risk of adverse developments in a country or sector than a fund that invests more broadly. Smaller and midsize company securities can increase the risk of greater price fluctuations, particularly over the short term. The manager applies various techniques and analyses in making investment decisions for the Fund, but there can be no guarantee that these decisions will produce the desired results. The Fund’s prospectus also includes a description of the main investment risks.
TF-2
The combination of intrinsic growth drivers in emerging markets and stimulus-induced support in the developed world encouraged the global economic recovery, and equity markets responded favorably. By the end of 2010, global equity markets recouped all losses suffered since Lehman Brothers Holdings’ 2008 bankruptcy. Commodities surged in the second half of 2010 due to near-term supply constraints and emerging market demand increases, as well as longer term fears that overly accommodative monetary policies would ultimately have negative inflationary consequences. The dollar strengthened relative to the euro, which bore the burden of the region’s fiscal crisis, but weakened against the yen, which hit multi-decade highs amid persistent deflationary pressures. Meanwhile, U.S. Treasuries and corporate bonds finished the year with gains, though Treasury prices declined considerably in the final quarter as Fed policies appeared to improve growth expectations. Although market conditions remained accommodative and corporate profitability improved, critical economic fundamentals such as employment, home prices and credit creation remained substantially depressed at period-end, leading many investors to question the true health of the global economy and the sustainability of the recovery.
Investment Strategy
Our investment philosophy is bottom up, value oriented and long term. In choosing investments, we generally focus on the market price of a company’s securities relative to our evaluation of the company’s potential long-term earnings, asset value and cash flow. Among factors we consider are a company’s historical value measures, including price/earnings ratio, profit margins and liquidation value. We do in-depth research to construct a bargain list from which we buy.
Manager’s Discussion
During the year under review, our stock selection and underweighted allocation to the generally poor-performing financials sector benefited the Fund’s results relative to the benchmark MSCI EAFE Index.2 Within the sector, real estate conglomerate Cheung Kong Holdings (Hong Kong), insurer ACE3 (U.S.) and global private equity firm KKR & Co.3 (U.S.) produced strong returns. Our overweighting and stock selection in the information technology sector also aided performance, and key contributors included security software developer Check Point Software
2. The financials sector comprises capital markets, commercial banks, diversified financial services, insurance, and real estate management and development in the SOI.
3. Not an index component.
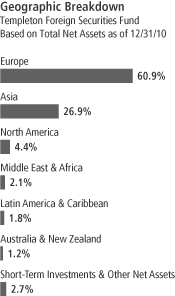
TF-3
Technologies3 (Israel) and semiconductor manufacturers Taiwan Semiconductor Manufacturing3 (Taiwan) and Infineon Technologies (Germany).4 Other positions that helped relative results included telecommunications provider Vodafone Group (U.K.) in the wireless telecommunication services industry, and electronic and electrical engineering company Siemens (Germany) and holding company Hutchison Whampoa (Hong Kong) in the industrial conglomerates industry.
In contrast, stock selection in the health care sector detracted from relative performance, as pharmaceutical developers Sanofi-Aventis (France) and Merck (Germany) underperformed.5 The Fund’s underweighted allocation and stock selection in the consumer staples sector hindered results, largely due to our position in personal products producer Unilever (U.K.).6 Other key detractors were insurer AXA (France) and telecommunication services providers Telefonica (Spain) and France Telecom.
From a geographic perspective, our overweighted allocation to North America boosted relative performance, as our investments in Canada3 and the U.S.3 outperformed. Our stock selection and overweighting in the Middle East were also beneficial, particularly stocks in Israel. In contrast, the Fund’s slight weighting in Australia hurt performance as that country’s stocks performed well.
Thank you for your participation in Templeton Foreign Securities Fund. We look forward to serving your future investment needs.
4. The information technology sector comprises communications equipment; computers and peripherals; electronic equipment, instruments and components; semiconductors and semiconductor equipment; and software in the SOI.
5. The health care sector comprises health care providers and services, life sciences tools and services, and pharmaceuticals in the SOI.
6. The consumer staples sector comprises food and staples retailing, and food products in the SOI.
The foregoing information reflects our analysis, opinions and portfolio holdings as of December 31, 2010, the end of the reporting period. The way we implement our main investment strategies and the resulting portfolio holdings may change depending on factors such as market and economic conditions. These opinions may not be relied upon as investment advice or an offer for a particular security. The information is not a complete analysis of every aspect of any market, country, industry, security or the Fund. Statements of fact are from sources considered reliable, but the investment manager makes no representation or warranty as to their completeness or accuracy. Although historical performance is no guarantee of future results, these insights may help you understand our investment management philosophy.
Top 10 Holdings
Templeton Foreign Securities Fund
12/31/10
| | | | |
Company
Sector/Industry,
Country | | % of Total
Net Assets | |
| Vodafone Group PLC, ADR | | | 3.5% | |
| Wireless Telecommunication Services, U.K. | | | | |
| Samsung Electronics Co. Ltd. | | | 2.7% | |
| Semiconductors & Semiconductor Equipment, South Korea | | | | |
| Sanofi-Aventis | | | 2.6% | |
| Pharmaceuticals, France | | | | |
| Taiwan Semiconductor Manufacturing Co. | | | 2.4% | |
| Semiconductors & Semiconductor Equipment, Taiwan | | | | |
| KB Financial Group Inc. | | | 2.3% | |
| Commercial Banks, South Korea | | | | |
| Siemens AG | | | 2.2% | |
| Industrial Conglomerates, Germany | | | | |
| Statoil ASA | | | 2.1% | |
| Oil, Gas & Consumable Fuels, Norway | | | | |
| ING Groep NV | | | 2.0% | |
| Diversified Financial Services, Netherlands | | | | |
| Singapore Telecommunications Ltd. | | | 2.0% | |
| Diversified Telecommunication Services, Singapore | | | | |
| Kingfisher PLC | | | 2.0% | |
| Specialty Retail, U.K. | | | | |
The dollar value, number of shares or principal amount, and names of all portfolio holdings are listed in the Fund’s Statement of Investments (SOI).
TF-4
Fund Expenses
As an investor in a variable insurance contract (Contract) that indirectly provides for investment in an underlying mutual fund, you can incur transaction and/or ongoing expenses at both the Fund level and the Contract level.
| • | | Transaction expenses can include sales charges (loads) on purchases, redemption fees, surrender fees, transfer fees and premium taxes. |
| • | | Ongoing expenses can include management fees, distribution and service (12b-1) fees, contract fees, annual maintenance fees, mortality and expense risk fees and other fees and expenses. All mutual funds and Contracts have some types of ongoing expenses. |
The expenses shown in the table are meant to highlight ongoing expenses at the Fund level only and do not include ongoing expenses at the Contract level, or transaction expenses at either the Fund or Contract level. While the Fund does not have transaction expenses, if the transaction and ongoing expenses at the Contract level were included, the expenses shown below would be higher. You should consult your Contract prospectus or disclosure document for more information.
The table shows Fund-level ongoing expenses and can help you understand these expenses and compare them with those of other mutual funds offered through the Contract. The table assumes a $1,000 investment held for the six months indicated. Please refer to the Fund prospectus for additional information on operating expenses.
Actual Fund Expenses
The first line (Actual) of the table provides actual account values and expenses. The “Ending Account Value” is derived from the Fund’s actual return, which includes the effect of ongoing Fund expenses, but does not include the effect of ongoing Contract expenses.
You can estimate the Fund-level expenses you incurred during the period by following these steps. Of course, your account value and expenses will differ from those in this illustration:
| 1. | Divide your account value by $1,000. |
If an account had an $8,600 value, then $8,600 ÷ $1,000 = 8.6.
| 2. | Multiply the result by the number under the heading “Fund-Level Expenses Incurred During Period.” |
If Fund-Level Expenses Incurred During Period were $7.50, then 8.6 x $7.50 = $64.50.
In this illustration, the estimated expenses incurred this period at the Fund level are $64.50.
Templeton Foreign Securities Fund – Class 3
TF-5
Hypothetical Example for Comparison with Other Mutual Funds
Information in the second line (Hypothetical) of the table can help you compare ongoing expenses of the Fund with those of other mutual funds offered through the Contract. This information may not be used to estimate the actual ending account balance or expenses you incurred during the period. The hypothetical “Ending Account Value” is based on the Fund’s actual expense ratio and an assumed 5% annual rate of return before expenses, which does not represent the Fund’s actual return. The figure under the heading “Fund-Level Expenses Incurred During Period” shows the hypothetical expenses your account would have incurred under this scenario. You can compare this figure with the 5% hypothetical examples that appear in shareholder reports of other funds offered through a Contract.
| | | | | | | | | | | | |
| Class 3 | | Beginning
Account Value 7/1/10 | | | Ending
Account Value 12/31/10 | | | Fund-Level Expenses Incurred
During Period* 7/1/10–12/31/10 | |
Actual | | $ | 1,000 | | | $ | 1,234.00 | | | $ | 5.80 | |
Hypothetical (5% return before expenses) | | $ | 1,000 | | | $ | 1,020.01 | | | $ | 5.24 | |
*Expenses are calculated using the most recent six-month annualized expense ratio for the Fund’s Class 3 shares (1.03%), which does not include any ongoing expenses of the Contract for which the Fund is an investment option, multiplied by the average account value over the period, multiplied by 184/365 to reflect the one-half year period.
TF-6
Franklin Templeton Variable Insurance Products Trust
Financial Highlights
Templeton Foreign Securities Fund
| | | | | | | | | | | | | | | | | | | | |
| | | Year Ended December 31, | |
| Class 1 | | 2010 | | | 2009 | | | 2008 | | | 2007 | | | 2006 | |
| | | | |
Per share operating performance | | | | | | | | | | | | | | | | | | | | |
(for a share outstanding throughout the year) | | | | | | | | | | | | | | | | | | | | |
Net asset value, beginning of year | | $ | 13.68 | | | $ | 10.95 | | | $ | 20.57 | | | $ | 19.00 | | | $ | 15.84 | |
| | | | |
Income from investment operationsa: | | | | | | | | | | | | | | | | | | | | |
Net investment incomeb | | | 0.28 | | | | 0.25 | | | | 0.45 | | | | 0.45 | | | | 0.46 | |
Net realized and unrealized gains (losses) | | | 0.86 | | | | 3.39 | | | | (8.01 | ) | | | 2.46 | | | | 2.94 | |
| | | | |
Total from investment operations | | | 1.14 | | | | 3.64 | | | | (7.56 | ) | | | 2.91 | | | | 3.40 | |
| | | | |
Less distributions from: | | | | | | | | | | | | | | | | | | | | |
Net investment income | | | (0.28 | ) | | | (0.43 | ) | | | (0.45 | ) | | | (0.44 | ) | | | (0.24 | ) |
Net realized gains | | | — | | | | (0.48 | ) | | | (1.61 | ) | | | (0.90 | ) | | | — | |
| | | | |
Total distributions | | | (0.28 | ) | | | (0.91 | ) | | | (2.06 | ) | | | (1.34 | ) | | | (0.24 | ) |
| | | | |
Redemption feesc | | | — | | | | — | | | | — | | | | — | | | | — | |
| | | | |
Net asset value, end of year | | $ | 14.54 | | | $ | 13.68 | | | $ | 10.95 | | | $ | 20.57 | | | $ | 19.00 | |
| | | | |
| | | | | |
Total returnd | | | 8.67% | | | | 37.34% | | | | (40.23)% | | | | 15.79% | | | | 21.70% | |
Ratios to average net assets | | | | | | | | | | | | | | | | | | | | |
Expensese | | | 0.78% | | | | 0.78% | | | | 0.77% | | | | 0.75% | | | | 0.75% | |
Net investment income | | | 2.10% | | | | 2.28% | | | | 2.82% | | | | 2.22% | | | | 2.63% | |
| | | | | |
Supplemental data | | | | | | | | | | | | | | | | | | | | |
Net assets, end of year (000’s) | | $ | 321,282 | | | $ | 318,173 | | | $ | 262,725 | | | $ | 531,377 | | | $ | 594,991 | |
Portfolio turnover rate | | | 19.16% | | | | 22.50% | | | | 18.27% | | | | 26.74% | | | | 18.97% | f |
aThe amount shown for a share outstanding throughout the period may not correlate with the Statement of Operations for the period due to the timing of sales and repurchases of the Fund shares in relation to income earned and/or fluctuating market value of the investments of the Fund.
bBased on average daily shares outstanding.
cAmount rounds to less than $0.01 per share.
dTotal return does not include fees, charges or expenses imposed by the variable annuity and life insurance contracts for which the Franklin Templeton Variable Insurance Products Trust serves as an underlying investment vehicle.
eBenefit of expense reduction rounds to less than 0.01%.
fExcludes the value of portfolio securities delivered as a result of redemption in-kind.
The accompanying notes are an integral part of these financial statements.
TF-7
Franklin Templeton Variable Insurance Products Trust
Financial Highlights (continued)
Templeton Foreign Securities Fund
| | | | | | | | | | | | | | | | | | | | |
| | | Year Ended December 31, | |
| Class 2 | | 2010 | | | 2009 | | | 2008 | | | 2007 | | | 2006 | |
| | | | |
Per share operating performance | | | | | | | | | | | | | | | | | | | | |
(for a share outstanding throughout the year) | | | | | | | | | | | | | | | | | | | | |
Net asset value, beginning of year | | $ | 13.45 | | | $ | 10.76 | | | $ | 20.25 | | | $ | 18.73 | | | $ | 15.63 | |
| | | | |
Income from investment operationsa: | | | | | | | | | | | | | | | | | | | | |
Net investment incomeb | | | 0.25 | | | | 0.22 | | | | 0.40 | | | | 0.38 | | | | 0.40 | |
Net realized and unrealized gains (losses) | | | 0.84 | | | | 3.34 | | | | (7.89 | ) | | | 2.44 | | | | 2.91 | |
| | | | |
Total from investment operations | | | 1.09 | | | | 3.56 | | | | (7.49 | ) | | | 2.82 | | | | 3.31 | |
| | | | |
Less distributions from: | | | | | | | | | | | | | | | | | | | | |
Net investment income | | | (0.25 | ) | | | (0.39 | ) | | | (0.39 | ) | | | (0.40 | ) | | | (0.21 | ) |
Net realized gains | | | — | | | | (0.48 | ) | | | (1.61 | ) | | | (0.90 | ) | | | — | |
| | | | |
Total distributions | | | (0.25 | ) | | | (0.87 | ) | | | (2.00 | ) | | | (1.30 | ) | | | (0.21 | ) |
| | | | |
Redemption feesc | | | — | | | | — | | | | — | | | | — | | | | — | |
| | | | |
Net asset value, end of year | | $ | 14.29 | | | $ | 13.45 | | | $ | 10.76 | | | $ | 20.25 | | | $ | 18.73 | |
| | | | |
| | | | | |
Total returnd | | | 8.41% | | | | 37.04% | | | | (40.38)% | | | | 15.46% | | | | 21.44% | |
Ratios to average net assets | | | | | | | | | | | | | | | | | | | | |
Expensese | | | 1.03% | | | | 1.03% | | | | 1.02% | | | | 1.00% | | | | 1.00% | |
Net investment income | | | 1.85% | | | | 2.03% | | | | 2.57% | | | | 1.97% | | | | 2.38% | |
| | | | | |
Supplemental data | | | | | | | | | | | | | | | | | | | | |
Net assets, end of year (000’s) | | $ | 2,090,757 | | | $ | 2,010,268 | | | $ | 1,702,038 | | | $ | 3,255,154 | | | $ | 2,941,374 | |
Portfolio turnover rate | | | 19.16% | | | | 22.50% | | | | 18.27% | | | | 26.74% | | | | 18.97% | f |
aThe amount shown for a share outstanding throughout the period may not correlate with the Statement of Operations for the period due to the timing of sales and repurchases of the Fund shares in relation to income earned and/or fluctuating market value of the investments of the Fund.
bBased on average daily shares outstanding.
cAmount rounds to less than $0.01 per share.
dTotal return does not include fees, charges or expenses imposed by the variable annuity and life insurance contracts for which the Franklin Templeton Variable Insurance Products Trust serves as an underlying investment vehicle.
eBenefit of expense reduction rounds to less than 0.01%.
fExcludes the value of portfolio securities delivered as a result of redemption in-kind.
The accompanying notes are an integral part of these financial statements.
TF-8
Franklin Templeton Variable Insurance Products Trust
Financial Highlights (continued)
Templeton Foreign Securities Fund
| | | | | | | | | | | | | | | | | | | | |
| | | Year Ended December 31, | |
| Class 3 | | 2010 | | | 2009 | | | 2008 | | | 2007 | | | 2006 | |
| | | | |
Per share operating performance | | | | | | | | | | | | | | | | | | | | |
(for a share outstanding throughout the year) | | | | | | | | | | | | | | | | | | | | |
Net asset value, beginning of year | | $ | 13.37 | | | $ | 10.70 | | | $ | 20.18 | | | $ | 18.68 | | | $ | 15.60 | |
| | | | |
Income from investment operationsa: | | | | | | | | | | | | | | | | | | | | |
Net investment incomeb | | | 0.25 | | | | 0.25 | | | | 0.39 | | | | 0.37 | | | | 0.37 | |
Net realized and unrealized gains (losses) | | | 0.84 | | | | 3.30 | | | | (7.84 | ) | | | 2.45 | | | | 2.94 | |
| | | | |
Total from investment operations | | | 1.09 | | | | 3.55 | | | | (7.45 | ) | | | 2.82 | | | | 3.31 | |
| | | | |
Less distributions from: | | | | | | | | | | | | | | | | | | | | |
Net investment income | | | (0.22 | ) | | | (0.40 | ) | | | (0.42 | ) | | | (0.42 | ) | | | (0.23 | ) |
Net realized gains | | | — | | | | (0.48 | ) | | | (1.61 | ) | | | (0.90 | ) | | | — | |
| | | | |
Total distributions | | | (0.22 | ) | | | (0.88 | ) | | | (2.03 | ) | | | (1.32 | ) | | | (0.23 | ) |
| | | | |
Redemption feesc | | | — | | | | — | | | | — | | | | — | | | | — | |
| | | | |
Net asset value, end of year | | $ | 14.24 | | | $ | 13.37 | | | $ | 10.70 | | | $ | 20.18 | | | $ | 18.68 | |
| | | | |
| | | | | |
Total returnd | | | 8.41% | | | | 37.20% | | | | (40.39)% | | | | 15.45% | | | | 21.46% | |
Ratios to average net assets | | | | | | | | | | | | | | | | | | | | |
Expensese | | | 1.03% | | | | 1.03% | | | | 1.02% | | | | 1.00% | | | | 1.00% | |
Net investment income | | | 1.85% | | | | 2.03% | | | | 2.57% | | | | 1.97% | | | | 2.38% | |
| | | | | |
Supplemental data | | | | | | | | | | | | | | | | | | | | |
Net assets, end of year (000’s) | | $ | 108,766 | | | $ | 115,364 | | | $ | 271,061 | | | $ | 313,505 | | | $ | 150,417 | |
Portfolio turnover rate | | | 19.16% | | | | 22.50% | | | | 18.27% | | | | 26.74% | | | | 18.97% | f |
aThe amount shown for a share outstanding throughout the period may not correlate with the Statement of Operations for the period due to the timing of sales and repurchases of the Fund shares in relation to income earned and/or fluctuating market value of the investments of the Fund.
bBased on average daily shares outstanding.
cAmount rounds to less than $0.01 per share.
dTotal return does not include fees, charges or expenses imposed by the variable annuity and life insurance contracts for which the Franklin Templeton Variable Insurance Products Trust serves as an underlying investment vehicle.
eBenefit of expense reduction rounds to less than 0.01%.
fExcludes the value of portfolio securities delivered as a result of redemption in-kind.
The accompanying notes are an integral part of these financial statements.
TF-9
Franklin Templeton Variable Insurance Products Trust
Financial Highlights (continued)
Templeton Foreign Securities Fund
| | | | | | | | | | | | |
| | | Year Ended December 31, | |
| Class 4 | | 2010 | | | 2009 | | | 2008a | |
| | | | |
Per share operating performance | | | | | | | | | | | | |
(for a share outstanding throughout the year) | | | | | | | | | | | | |
Net asset value, beginning of year | | $ | 13.59 | | | $ | 10.91 | | | $ | 18.90 | |
| | | | |
Income from investment operationsb: | | | | | | | | | | | | |
Net investment incomec | | | 0.17 | | | | 0.21 | | | | 0.15 | |
Net realized and unrealized gains (losses) | | | 0.92 | | | | 3.37 | | | | (6.08 | ) |
| | | | |
Total from investment operations | | | 1.09 | | | | 3.58 | | | | (5.93 | ) |
| | | | |
Less distributions from: | | | | | | | | | | | | |
Net investment income | | | (0.25 | ) | | | (0.42 | ) | | | (0.45 | ) |
Net realized gains | | | — | | | | (0.48 | ) | | | (1.61 | ) |
| | | | |
Total distributions | | | (0.25 | ) | | | (0.90 | ) | | | (2.06 | ) |
| | | | |
Redemption feesd | | | — | | | | — | | | | — | |
| | | | |
Net asset value, end of year | | $ | 14.43 | | | $ | 13.59 | | | $ | 10.91 | |
| | | | |
| | | |
Total returne | | | 8.38% | | | | 36.84% | | | | (35.15)% | |
Ratios to average net assetsf | | | | | | | | | | | | |
Expensesg | | | 1.13% | | | | 1.13% | | | | 1.12% | |
Net investment income | | | 1.75% | | | | 1.93% | | | | 2.47% | |
| | | |
Supplemental data | | | | | | | | | | | | |
Net assets, end of year (000’s) | | $ | 305,505 | | | $ | 48,501 | | | $ | 14,287 | |
Portfolio turnover rate | | | 19.16% | | | | 22.50% | | | | 18.27% | |
aFor the period February 29, 2008 (effective date) to December 31, 2008.
bThe amount shown for a share outstanding throughout the period may not correlate with the Statement of Operations for the period due to the timing of sales and repurchases of the Fund shares in relation to income earned and/or fluctuating market value of the investments of the Fund.
cBased on average daily shares outstanding.
dAmount rounds to less than $0.01 per share.
eTotal return does not include fees, charges or expenses imposed by the variable annuity and life insurance contracts for which the Franklin Templeton Variable Insurance Products Trust serves as an underlying investment vehicle. Total return is not annualized for periods less than one year.
fRatios are annualized for periods less than one year.
gBenefit of expense reduction rounds to less than 0.01%.
The accompanying notes are an integral part of these financial statements.
TF-10
Franklin Templeton Variable Insurance Products Trust
Statement of Investments, December 31, 2010
| | | | | | | | | | | | |
| Templeton Foreign Securities Fund | | Country | | | Shares/
Units | | | Value | |
Common Stocks and Other Equity Interests 96.0% | | | | | | | | | | | | |
Aerospace & Defense 1.2% | | | | | | | | | | | | |
BAE Systems PLC | | | United Kingdom | | | | 3,909,200 | | | $ | 20,144,794 | |
Embraer SA, ADR | | | Brazil | | | | 484,240 | | | | 14,236,656 | |
| | | | | | | | | | | | |
| | | | | | | | | | | 34,381,450 | |
| | | | | | | | | | | | |
Air Freight & Logistics 0.5% | | | | | | | | | | | | |
Deutsche Post AG | | | Germany | | | | 773,232 | | | | 13,074,704 | |
| | | | | | | | | | | | |
Automobiles 1.2% | | | | | | | | | | | | |
Toyota Motor Corp., ADR | | | Japan | | | | 440,460 | | | | 34,633,370 | |
| | | | | | | | | | | | |
Capital Markets 0.6% | | | | | | | | | | | | |
KKR & Co., LP | | | United States | | | | 1,155,000 | | | | 16,401,000 | |
| | | | | | | | | | | | |
Commercial Banks 5.4% | | | | | | | | | | | | |
DBS Group Holdings Ltd. | | | Singapore | | | | 2,993,520 | | | | 33,411,696 | |
HSBC Holdings PLC | | | United Kingdom | | | | 1,865,200 | | | | 19,125,949 | |
KB Financial Group Inc., ADR | | | South Korea | | | | 1,220,681 | | | | 64,561,818 | |
UniCredit SpA | | | Italy | | | | 10,439,019 | | | | 21,617,508 | |
United Overseas Bank Ltd. | | | Singapore | | | | 985,000 | | | | 13,972,720 | |
| | | | | | | | | | | | |
| | | | | | | | | | | 152,689,691 | |
| | | | | | | | | | | | |
Commercial Services & Supplies 1.2% | | | | | | | | | | | | |
Brambles Ltd. | | | Australia | | | | 2,750,737 | | | | 20,011,227 | |
Downer EDI Ltd. | | | Australia | | | | 3,200,569 | | | | 15,010,132 | |
| | | | | | | | | | | | |
| | | | | | | | | | | 35,021,359 | |
| | | | | | | | | | | | |
Communications Equipment 1.1% | | | | | | | | | | | | |
Telefonaktiebolaget LM Ericsson, B, ADR | | | Sweden | | | | 2,637,070 | | | | 30,405,417 | |
| | | | | | | | | | | | |
Computers & Peripherals 1.8% | | | | | | | | | | | | |
Compal Electronics Inc. | | | Taiwan | | | | 15,329,431 | | | | 20,311,365 | |
Lite-On Technology Corp. | | | Taiwan | | | | 23,045,407 | | | | 31,680,521 | |
| | | | | | | | | | | | |
| | | | | | | | | | | 51,991,886 | |
| | | | | | | | | | | | |
Construction Materials 0.5% | | | | | | | | | | | | |
CRH PLC | | | Ireland | | | | 659,820 | | | | 13,681,451 | |
| | | | | | | | | | | | |
Containers & Packaging 0.6% | | | | | | | | | | | | |
Rexam PLC | | | United Kingdom | | | | 3,021,290 | | | | 15,724,789 | |
| | | | | | | | | | | | |
Diversified Financial Services 2.0% | | | | | | | | | | | | |
aING Groep NV | | | Netherlands | | | | 5,880,644 | | | | 57,270,536 | |
| | | | | | | | | | | | |
Diversified Telecommunication Services 9.8% | | | | | | | | | | | | |
China Telecom Corp. Ltd., H | | | China | | | | 84,868,357 | | | | 44,112,983 | |
France Telecom SA | | | France | | | | 2,164,143 | | | | 45,148,810 | |
Singapore Telecommunications Ltd. | | | Singapore | | | | 23,481,000 | | | | 55,819,992 | |
Telefonica SA, ADR | | | Spain | | | | 801,544 | | | | 54,841,640 | |
Telekom Austria AG | | | Austria | | | | 1,711,400 | | | | 24,084,756 | |
Telenor ASA | | | Norway | | | | 3,226,804 | | | | 52,536,843 | |
| | | | | | | | | | | | |
| | | | | | | | | | | 276,545,024 | |
| | | | | | | | | | | | |
Electric Utilities 2.0% | | | | | | | | | | | | |
E.ON AG | | | Germany | | | | 917,590 | | | | 28,066,926 | |
Iberdrola SA | | | Spain | | | | 3,537,921 | | | | 27,299,102 | |
| | | | | | | | | | | | |
| | | | | | | | | | | 55,366,028 | |
| | | | | | | | | | | | |
TF-11
Franklin Templeton Variable Insurance Products Trust
Statement of Investments, December 31, 2010 (continued)
| | | | | | | | | | | | |
| Templeton Foreign Securities Fund | | Country | | | Shares/
Units | | | Value | |
Common Stocks and Other Equity Interests (continued) | | | | | | | | | | | | |
Electronic Equipment, Instruments & Components 1.4% | | | | | | | | | | | | |
aFlextronics International Ltd. | | | Singapore | | | | 4,961,670 | | | $ | 38,949,109 | |
| | | | | | | | | | | | |
Energy Equipment & Services 1.0% | | | | | | | | | | | | |
Aker Solutions ASA | | | Norway | | | | 1,617,940 | | | | 27,578,838 | |
| | | | | | | | | | | | |
Food & Staples Retailing 0.5% | | | | | | | | | | | | |
Tesco PLC | | | United Kingdom | | | | 2,056,090 | | | | 13,655,642 | |
| | | | | | | | | | | | |
Food Products 2.1% | | | | | | | | | | | | |
Nestle SA | | | Switzerland | | | | 518,760 | | | | 30,409,111 | |
Unilever PLC | | | United Kingdom | | | | 930,743 | | | | 28,562,782 | |
| | | | | | | | | | | | |
| | | | | | | | | | | 58,971,893 | |
| | | | | | | | | | | | |
Health Care Providers & Services 0.4% | | | | | | | | | | | | |
Celesio AG | | | Germany | | | | 509,850 | | | | 12,597,498 | |
| | | | | | | | | | | | |
Hotels, Restaurants & Leisure 0.8% | | | | | | | | | | | | |
aAutogrill SpA | | | Italy | | | | 1,655,033 | | | | 23,402,196 | |
| | | | | | | | | | | | |
Industrial Conglomerates 3.6% | | | | | | | | | | | | |
Hutchison Whampoa Ltd. | | | Hong Kong | | | | 3,794,709 | | | | 39,155,440 | |
Siemens AG | | | Germany | | | | 493,434 | | | | 61,500,712 | |
| | | | | | | | | | | | |
| | | | | | | | | | | 100,656,152 | |
| | | | | | | | | | | | |
Insurance 9.5% | | | | | | | | | | | | |
ACE Ltd. | | | United States | | | | 377,449 | | | | 23,496,200 | |
aAIA Group Ltd. | | | Hong Kong | | | | 7,983,000 | | | | 22,441,756 | |
a,bAIA Group Ltd., 144A | | | Hong Kong | | | | 3,128,000 | | | | 8,793,413 | |
Aviva PLC | | | United Kingdom | | | | 7,678,820 | | | | 47,225,598 | |
AXA SA | | | France | | | | 2,027,508 | | | | 33,768,122 | |
Muenchener Rueckversicherungs-Gesellschaft AG | | | Germany | | | | 249,150 | | | | 37,792,935 | |
aNKSJ Holdings Inc. | | | Japan | | | | 4,218,000 | | | | 31,073,163 | |
PartnerRe Ltd. | | | Bermuda | | | | 196,480 | | | | 15,787,168 | |
Swiss Reinsurance Co. | | | Switzerland | | | | 917,340 | | | | 49,402,786 | |
| | | | | | | | | | | | |
| | | | | | | | | | | 269,781,141 | |
| | | | | | | | | | | | |
Life Sciences Tools & Services 0.5% | | | | | | | | | | | | |
Lonza Group AG | | | Switzerland | | | | 175,440 | | | | 14,078,403 | |
| | | | | | | | | | | | |
Media 2.5% | | | | | | | | | | | | |
Pearson PLC | | | United Kingdom | | | | 875,466 | | | | 13,822,486 | |
Reed Elsevier NV | | | Netherlands | | | | 2,017,693 | | | | 24,986,206 | |
Vivendi SA | | | France | | | | 1,178,959 | | | | 31,858,480 | |
| | | | | | | | | | | | |
| | | | | | | | | | | 70,667,172 | |
| | | | | | | | | | | | |
Metals & Mining 1.3% | | | | | | | | | | | | |
Barrick Gold Corp. | | | Canada | | | | 663,561 | | | | 35,347,333 | |
| | | | | | | | | | | | |
Multi-Utilities 0.9% | | | | | | | | | | | | |
GDF Suez | | | France | | | | 697,431 | | | | 25,050,737 | |
| | | | | | | | | | | | |
Multiline Retail 0.5% | | | | | | | | | | | | |
Marks & Spencer Group PLC | | | United Kingdom | | | | 2,350,320 | | | | 13,538,017 | |
| | | | | | | | | | | | |
Oil, Gas & Consumable Fuels 11.0% | | | | | | | | | | | | |
BP PLC | | | United Kingdom | | | | 4,406,715 | | | | 32,041,574 | |
Gazprom, ADR | | | Russia | | | | 1,311,500 | | | | 33,364,560 | |
Reliance Industries Ltd. | | | India | | | | 998,145 | | | | 23,623,974 | |
Royal Dutch Shell PLC, B | | | United Kingdom | | | | 1,292,973 | | | | 42,815,746 | |
TF-12
Franklin Templeton Variable Insurance Products Trust
Statement of Investments, December 31, 2010 (continued)
| | | | | | | | | | | | |
| Templeton Foreign Securities Fund | | Country | | | Shares/
Units | | | Value | |
Common Stocks and Other Equity Interests (continued) | | | | | | | | | | | | |
Oil, Gas & Consumable Fuels (continued) | | | | | | | | | | | | |
Sasol, ADR | | | South Africa | | | | 701,210 | | | $ | 36,497,980 | |
Statoil ASA | | | Norway | | | | 2,455,740 | | | | 58,455,941 | |
Talisman Energy Inc. | | | Canada | | | | 1,506,600 | | | | 33,419,567 | |
Total SA, B | | | France | | | | 979,926 | | | | 51,977,029 | |
| | | | | | | | | | | | |
| | | | | | | | | | | 312,196,371 | |
| | | | | | | | | | | | |
Pharmaceuticals 8.0% | | | | | | | | | | | | |
GlaxoSmithKline PLC | | | United Kingdom | | | | 2,772,585 | | | | 53,659,670 | |
Merck KGaA | | | Germany | | | | 320,220 | | | | 25,813,837 | |
Novartis AG | | | Switzerland | | | | 360,330 | | | | 21,199,286 | |
Roche Holding AG | | | Switzerland | | | | 368,200 | | | | 54,007,923 | |
Sanofi-Aventis | | | France | | | | 1,127,925 | | | | 72,199,991 | |
| | | | | | | | | | | | |
| | | | | | | | | | | 226,880,707 | |
| | | | | | | | | | | | |
Professional Services 2.9% | | | | | | | | | | | | |
Adecco SA | | | Switzerland | | | | 481,280 | | | | 31,561,456 | |
Hays PLC | | | United Kingdom | | | | 11,353,070 | | | | 22,937,678 | |
aRandstad Holding NV | | | Netherlands | | | | 535,950 | | | | 28,320,202 | |
| | | | | | | | | | | | |
| | | | | | | | | | | 82,819,336 | |
| | | | | | | | | | | | |
Real Estate Management & Development 1.1% | | | | | | | | | | | | |
Cheung Kong (Holdings) Ltd. | | | Hong Kong | | | | 1,973,922 | | | | 30,424,684 | |
| | | | | | | | | | | | |
Semiconductors & Semiconductor Equipment 5.7% | | | | | | | | | | | | |
aInfineon Technologies AG | | | Germany | | | | 1,103,225 | | | | 10,342,682 | |
Samsung Electronics Co. Ltd. | | | South Korea | | | | 89,088 | | | | 75,402,017 | |
Siliconware Precision Industries Co. | | | Taiwan | | | | 6,412,000 | | | | 7,693,521 | |
Taiwan Semiconductor Manufacturing Co. Ltd. | | | Taiwan | | | | 27,781,526 | | | | 67,620,444 | |
| | | | | | | | | | | | |
| | | | | | | | | | | 161,058,664 | |
| | | | | | | | | | | | |
Software 5.5% | | | | | | | | | | | | |
aCheck Point Software Technologies Ltd. | | | Israel | | | | 494,361 | | | | 22,869,140 | |
Nintendo Co. Ltd. | | | Japan | | | | 166,400 | | | | 48,848,931 | |
The Sage Group PLC | | | United Kingdom | | | | 4,609,500 | | | | 19,704,742 | |
SAP AG, ADR | | | Germany | | | | 983,280 | | | | 49,763,801 | |
Trend Micro Inc. | | | Japan | | | | 464,100 | | | | 15,328,021 | |
| | | | | | | | | | | | |
| | | | | | | | | | | 156,514,635 | |
| | | | | | | | | | | | |
Specialty Retail 3.2% | | | | | | | | | | | | |
Kingfisher PLC | | | United Kingdom | | | | 13,521,086 | | | | 55,711,690 | |
USS Co. Ltd. | | | Japan | | | | 431,520 | | | | 35,297,725 | |
| | | | | | | | | | | | |
| | | | | | | | | | | 91,009,415 | |
| | | | | | | | | | | | |
Textiles, Apparel & Luxury Goods 0.6% | | | | | | | | | | | | |
Yue Yuen Industrial Holdings Ltd. | | | Hong Kong | | | | 4,486,500 | | | | 16,104,645 | |
| | | | | | | | | | | | |
Wireless Telecommunication Services 5.1% | | | | | | | | | | | | |
Mobile TeleSystems, ADR | | | Russia | | | | 914,865 | | | | 19,093,233 | |
Turkcell Iletisim Hizmetleri AS, ADR | | | Turkey | | | | 1,482,500 | | | | 25,395,225 | |
Vodafone Group PLC, ADR | | | United Kingdom | | | | 3,781,940 | | | | 99,956,674 | |
| | | | | | | | | | | | |
| | | | | | | | | | | 144,445,132 | |
| | | | | | | | | | | | |
Total Common Stocks and Other Equity Interests
(Cost $2,401,603,306) | | | | | | | | | | | 2,712,914,425 | |
| | | | | | | | | | | | |
TF-13
Franklin Templeton Variable Insurance Products Trust
Statement of Investments, December 31, 2010 (continued)
| | | | | | | | | | | | |
| Templeton Foreign Securities Fund | | Country | | | Shares/
Units | | | Value | |
Preferred Stocks (Cost $2,178,441) 1.3% | | | | | | | | | | | | |
Metals & Mining 1.3% | | | | | | | | | | | | |
Vale SA, ADR, pfd., A | | | Brazil | | | | 1,210,222 | | | $ | 36,572,909 | |
| | | | | | | | | | | | |
Total Investments before Short Term Investments (Cost $2,403,781,747) | | | | | | | | | | | 2,749,487,334 | |
| | | | | | | | | | | | |
Short Term Investments (Cost $74,399,334) 2.6% | | | | | | | | | | | | |
Money Market Funds 2.6% | | | | | | | | | | | | |
a,cInstitutional Fiduciary Trust Money Market Portfolio | | | United States | | | | 74,399,334 | | | | 74,399,334 | |
| | | | | | | | | | | | |
Total Investments (Cost $2,478,181,081) 99.9% | | | | | | | | | | | 2,823,886,668 | |
Other Assets, less Liabilities 0.1% | | | | | | | | | | | 2,423,491 | |
| | | | | | | | | | | | |
Net Assets 100.0% | | | | | | | | | | $ | 2,826,310,159 | |
| | | | | | | | | | | | |
See Abbreviations on page TF-25.
aNon-income producing.
bSecurity was purchased pursuant to Rule 144A under the Securities Act of 1933 and may be sold in transactions exempt from registration only to qualified institutional buyers or in a public offering registered under the Securities Act of 1933. This security has been deemed liquid under guidelines approved by the Trust’s Board of Trustees. At December 31, 2010, the value of this security was $8,793,413, representing 0.31% of net assets.
cSee Note 7 regarding investments in the Institutional Fiduciary Trust Money Market Portfolio.
TF-14
Franklin Templeton Variable Insurance Products Trust
Financial Statements
Statement of Assets and Liabilities
December 31, 2010
| | | | |
| | | Templeton
Foreign
Securities Fund | |
Assets: | | | | |
Investments in securities: | | | | |
Cost - Unaffiliated issuers | | $ | 2,403,781,747 | |
Cost - Sweep Money Fund (Note 7) | | | 74,399,334 | |
| | | | |
Total cost of investments | | $ | 2,478,181,081 | |
| | | | |
Value - Unaffiliated issuers | | $ | 2,749,487,334 | |
Value - Sweep Money Fund (Note 7) | | | 74,399,334 | |
| | | | |
Total value of investments | | | 2,823,886,668 | |
Cash | | | 160,166 | |
Receivables: | | | | |
Capital shares sold | | | 955,829 | |
Dividends | | | 6,524,598 | |
Other assets | | | 462 | |
| | | | |
Total assets | | | 2,831,527,723 | |
| | | | |
Liabilities: | | | | |
Payables: | | | | |
Capital shares redeemed | | | 1,791,426 | |
Affiliates | | | 2,806,757 | |
Reports to shareholders | | | 427,459 | |
Accrued expenses and other liabilities | | | 191,922 | |
| | | | |
Total liabilities | | | 5,217,564 | |
| | | | |
Net assets, at value | | $ | 2,826,310,159 | |
| | | | |
Net assets consist of: | | | | |
Paid-in capital | | $ | 2,700,376,228 | |
Undistributed net investment income | | | 46,209,487 | |
Net unrealized appreciation (depreciation) | | | 345,894,768 | |
Accumulated net realized gain (loss) | | | (266,170,324 | ) |
| | | | |
Net assets, at value | | $ | 2,826,310,159 | |
| | | | |
The accompanying notes are an integral part of these financial statements.
TF-15
Franklin Templeton Variable Insurance Products Trust
Financial Statements (continued)
Statement of Assets and Liabilities (continued)
December 31, 2010
| | | | |
| | | Templeton
Foreign
Securities Fund | |
Class 1: | | | | |
Net assets, at value | | $ | 321,281,861 | |
| | | | |
Shares outstanding | | | 22,089,453 | |
| | | | |
Net asset value and maximum offering price per share | | $ | 14.54 | |
| | | | |
Class 2: | | | | |
Net assets, at value | | $ | 2,090,756,821 | |
| | | | |
Shares outstanding | | | 146,276,558 | |
| | | | |
Net asset value and maximum offering price per share | | $ | 14.29 | |
| | | | |
Class 3: | | | | |
Net assets, at value | | $ | 108,766,254 | |
| | | | |
Shares outstanding | | | 7,637,341 | |
| | | | |
Net asset value and maximum offering price per sharea | | $ | 14.24 | |
| | | | |
Class 4: | | | | |
Net assets, at value | | $ | 305,505,223 | |
| | | | |
Shares outstanding | | | 21,171,205 | |
| | | | |
Net asset value and maximum offering price per share | | $ | 14.43 | |
| | | | |
aRedemption price is equal to net asset value less any redemption fees retained by the fund.
The accompanying notes are an integral part of these financial statements.
TF-16
Franklin Templeton Variable Insurance Products Trust
Financial Statements (continued)
Statement of Operations
for the year ended December 31, 2010
| | | | |
| | | Templeton
Foreign
Securities Fund | |
Investment income: | | | | |
Dividends (net of foreign taxes of $7,562,786) | | $ | 72,304,643 | |
Income from securities loaned | | | 360,920 | |
| | | | |
Total investment income | | | 72,665,563 | |
| | | | |
Expenses: | | | | |
Management fees (Note 3a) | | | 16,084,169 | |
Administrative fees (Note 3b) | | | 2,466,397 | |
Distribution fees: (Note 3c) | | | | |
Class 2 | | | 4,871,112 | |
Class 3 | | | 264,046 | |
Class 4 | | | 568,874 | |
Unaffiliated transfer agent fees | | | 4,430 | |
Custodian fees (Note 4) | | | 484,376 | |
Reports to shareholders | | | 529,930 | |
Registration and filing fees | | | 1,392 | |
Professional fees | | | 85,848 | |
Trustees’ fees and expenses | | | 11,617 | |
Other | | | 80,504 | |
| | | | |
Total expenses | | | 25,452,695 | |
Expense reductions (Note 4) | | | (19 | ) |
| | | | |
Net expenses | | | 25,452,676 | |
| | | | |
Net investment income | | | 47,212,887 | |
| | | | |
Realized and unrealized gains (losses): | | | | |
Net realized gain (loss) from: | | | | |
Investments | | | 37,030,875 | |
Foreign currency transactions | | | (1,115,391 | ) |
| | | | |
Net realized gain (loss) | | | 35,915,484 | |
| | | | |
Net change in unrealized appreciation (depreciation) on: | | | | |
Investments | | | 169,586,867 | |
Translation of other assets and liabilities denominated in foreign currencies | | | 125,872 | |
Change in deferred taxes on unrealized appreciation | | | 1,550,561 | |
| | | | |
Net change in unrealized appreciation (depreciation) | | | 171,263,300 | |
| | | | |
Net realized and unrealized gain (loss) | | | 207,178,784 | |
| | | | |
Net increase (decrease) in net assets resulting from operations | | $ | 254,391,671 | |
| | | | |
The accompanying notes are an integral part of these financial statements.
TF-17
Franklin Templeton Variable Insurance Products Trust
Financial Statements (continued)
Statements of Changes in Net Assets
| | | | | | | | |
| | | Templeton Foreign
Securities Fund | |
| | | Year Ended December 31, | |
| | | 2010 | | | 2009 | |
| | | | |
Increase (decrease) in net assets: | | | | | | | | |
Operations: | | | | | | | | |
Net investment income | | $ | 47,212,887 | | | $ | 46,778,715 | |
Net realized gain (loss) from investments and foreign currency transactions | | | 35,915,484 | | | | (272,580,971 | ) |
Net change in unrealized appreciation (depreciation) on investments, translation of other assets and liabilities denominated in foreign currencies and deferred taxes | | | 171,263,300 | | | | 930,461,583 | |
| | | | |
Net increase (decrease) in net assets resulting from operations | | | 254,391,671 | | | | 704,659,327 | |
| | | | |
Distributions to shareholders from: | | | | | | | | |
Net investment income: | | | | | | | | |
Class 1 | | | (6,186,591 | ) | | | (10,082,097 | ) |
Class 2 | | | (35,909,578 | ) | | | (60,860,305 | ) |
Class 3 | | | (1,738,264 | ) | | | (10,601,203 | ) |
Class 4 | | | (1,159,055 | ) | | | (654,024 | ) |
Net realized gains: | | | | | | | | |
Class 1 | | | — | | | | (11,279,713 | ) |
Class 2 | | | — | | | | (75,080,881 | ) |
Class 3 | | | — | | | | (12,814,465 | ) |
Class 4 | | | — | | | | (749,197 | ) |
| | | | |
Total distributions to shareholders | | | (44,993,488 | ) | | | (182,121,885 | ) |
| | | | |
Capital share transactions: (Note 2) | | | | | | | | |
Class 1 | | | (16,391,025 | ) | | | (11,544,985 | ) |
Class 2 | | | (56,686,127 | ) | | | (118,629,302 | ) |
Class 3 | | | (13,133,254 | ) | | | (174,980,330 | ) |
Class 4 | | | 210,807,534 | | | | 24,793,775 | |
| | | | |
Total capital share transactions | | | 124,597,128 | | | | (280,360,842 | ) |
| | | | |
Redemption fees | | | 9,228 | | | | 18,230 | |
| | | | |
Net increase (decrease) in net assets | | | 334,004,539 | | | | 242,194,830 | |
Net assets: | | | | | | | | |
Beginning of year | | | 2,492,305,620 | | | | 2,250,110,790 | |
| | | | |
End of year | | $ | 2,826,310,159 | | | $ | 2,492,305,620 | |
| | | | |
Undistributed net investment income included in net assets: | | | | | | | | |
End of year | | $ | 46,209,487 | | | $ | 45,063,070 | |
| | | | |
The accompanying notes are an integral part of these financial statements.
TF-18
Franklin Templeton Variable Insurance Products Trust
Notes to Financial Statements
Templeton Foreign Securities Fund
1. ORGANIZATION AND SIGNIFICANT ACCOUNTING POLICIES
Franklin Templeton Variable Insurance Products Trust (Trust) is registered under the Investment Company Act of 1940, as amended, (1940 Act) as an open-end investment company, consisting of twenty separate funds. The Templeton Foreign Securities Fund (Fund) is included in this report. The financial statements of the remaining funds in the Trust are presented separately. Shares of the Fund are generally sold only to insurance company separate accounts to fund the benefits of variable life insurance policies or variable annuity contracts. The Fund offers four classes of shares: Class 1, Class 2, Class 3, and Class 4. Each class of shares differs by its distribution fees, voting rights on matters affecting a single class and its exchange privilege.
The following summarizes the Fund’s significant accounting policies.
a. Financial Instrument Valuation
The Fund values its investments in securities and other assets and liabilities carried at fair value daily. Fair value is the price that would be received to sell an asset or paid to transfer a liability in an orderly transaction between market participants on the measurement date. Under procedures approved by the Trust’s Board of Trustees, the Fund may utilize independent pricing services, quotations from securities and financial instrument dealers, and other market sources to determine fair value.
Equity securities listed on an exchange or on the NASDAQ National Market System are valued at the last quoted sale price or the official closing price of the day, respectively. Foreign equity securities are valued as of the close of trading on the foreign stock exchange on which the security is primarily traded, or the NYSE, whichever is earlier. The value is then converted into its U.S. dollar equivalent at the foreign exchange rate in effect at the close of the NYSE on the day that the value of the security is determined. Over-the-counter securities are valued within the range of the most recent quoted bid and ask prices. Securities that trade in multiple markets or on multiple exchanges are valued according to the broadest and most representative market. Certain equity securities are valued based upon fundamental characteristics or relationships to similar securities. Investments in open-end mutual funds are valued at the closing net asset value.
The Fund has procedures to determine the fair value of securities and other financial instruments for which market prices are not readily available or which may not be reliably priced. Under these procedures, the Fund primarily employs a market-based approach which may use related or comparable assets or liabilities, recent transactions, market multiples, book values, and other relevant information for the investment to determine the fair value of the investment. The Fund may also use an income-based valuation approach in which the anticipated future cash flows of the investment are discounted to calculate fair value. Discounts may also be applied due to the nature or duration of any restrictions on the disposition of the investments. Due to the inherent uncertainty of valuations of such investments, the fair values may differ significantly from the values that would have been used had an active market existed.
Trading in securities on foreign securities stock exchanges and over-the-counter markets may be completed before the daily close of business on the NYSE. Occasionally, events occur between the time at which trading in a foreign security is completed and the close of the NYSE that might call into question the reliability of the value of a portfolio security held by the Fund. As a result, differences may arise between the value of the Fund’s portfolio securities as determined at the foreign market close and the latest indications of value at the close of the NYSE. In order to minimize the potential for these differences, the investment manager monitors price movements following the close of trading in foreign stock markets through a series of country specific market proxies (such as baskets of American Depository Receipts, futures contracts and exchange traded funds). These price movements are measured against established trigger thresholds for each specific market proxy to assist in determining if an event has occurred that may call into question the reliability of the values of the foreign securities held by the Fund. If such an event occurs, the securities may be valued using fair value procedures, which may include the use of independent pricing services.
TF-19
Franklin Templeton Variable Insurance Products Trust
Notes to Financial Statements (continued)
Templeton Foreign Securities Fund
1. ORGANIZATION AND SIGNIFICANT ACCOUNTING POLICIES (continued)
b. Foreign Currency Translation
Portfolio securities and other assets and liabilities denominated in foreign currencies are translated into U.S. dollars based on the exchange rate of such currencies against U.S. dollars on the date of valuation. The Fund may enter into foreign currency exchange contracts to facilitate transactions denominated in a foreign currency. Purchases and sales of securities, income and expense items denominated in foreign currencies are translated into U.S. dollars at the exchange rate in effect on the transaction date. Portfolio securities and assets and liabilities denominated in foreign currencies contain risks that those currencies will decline in value relative to the U.S. dollar. Occasionally, events may impact the availability or reliability of foreign exchange rates used to convert the U.S. dollar equivalent value. If such an event occurs, the foreign exchange rate will be valued at fair value using procedures established and approved by the Trust’s Board of Trustees.
The Funds does not separately report the effect of changes in foreign exchange rates from changes in market prices on securities held. Such changes are included in net realized and unrealized gain or loss from investments on the Statement of Operations.
Realized foreign exchange gains or losses arise from sales of foreign currencies, currency gains or losses realized between the trade and settlement dates on securities transactions and the difference between the recorded amounts of dividends, interest, and foreign withholding taxes and the U.S. dollar equivalent of the amounts actually received or paid. Net unrealized foreign exchange gains and losses arise from changes in foreign exchange rates on foreign denominated assets and liabilities other than investments in securities held at the end of the reporting period.
c. Securities Lending
The Fund participates in an agency based security lending program. The Fund receives cash collateral against the loaned securities in an amount equal to at least 102% of the market value of the loaned securities. Collateral is maintained over the life of the loan in an amount not less than 100% of the market value of loaned securities, as determined at the close of Fund business each day; any additional collateral required due to changes in security values is delivered to the Fund on the next business day. The collateral is invested in repurchase agreements and/or in a money market fund managed by the Fund’s custodian on the Fund’s behalf. The Fund receives income from the investment of cash collateral, in addition to lending fees and rebates paid by the borrower. The Fund bears the market risk with respect to the collateral investment, securities loaned, and the risk that the agent may default on its obligations to the fund. At December 31, 2010, the Fund had no securities on loan.
d. Income and Deferred Taxes
It is the Fund’s policy to qualify as a regulated investment company under the Internal Revenue Code. The Fund intends to distribute to shareholders substantially all of its taxable income and net realized gains to relieve it from federal income and excise taxes. As a result, no provision for U.S. federal income taxes is required. The Fund files U.S. income tax returns as well as tax returns in certain other jurisdictions. The Fund’s application of those tax rules is subject to its understanding. The Fund records a provision for taxes in its financial statements including penalties and interest, if any, for a tax position taken on a tax return (or expected to be taken) when it fails to meet the more likely than not (a greater than 50% probability) threshold and based on the technical merits, the tax position may not be sustained upon examination by the tax authorities. As of December 31, 2010, and for all open tax years, the Fund has determined that no provision for income tax is required in the Fund’s financial statements. Open tax years are those that remain subject to examination and are based on each tax jurisdiction statute of limitation. The Fund is not aware of any tax position for which it is reasonably possible that the total amounts of unrecognized tax effects will significantly change in the next twelve months.
The Fund may be subject to foreign taxation related to income received, capital gains on the sale of securities and certain foreign currency transactions in the foreign jurisdictions in which it invests. Foreign taxes, if any, are recorded based on the tax regulations and rates that exist in the foreign markets in which the Fund invests. When a capital gain tax is determined to apply
TF-20
Franklin Templeton Variable Insurance Products Trust
Notes to Financial Statements (continued)
Templeton Foreign Securities Fund
1. ORGANIZATION AND SIGNIFICANT ACCOUNTING POLICIES (continued)
d. Income and Deferred Taxes (continued)
the Fund records an estimated deferred tax liability for net unrealized gains on these securities in an amount that would be payable if the securities were disposed of on the valuation date.
e. Security Transactions, Investment Income, Expenses and Distributions
Security transactions are accounted for on trade date. Realized gains and losses on security transactions are determined on a specific identification basis. Estimated expenses are accrued daily. Dividend income is recorded on the ex-dividend date except that certain dividends from foreign securities are recognized as soon as the Fund is notified of the ex-dividend date. Distributions to shareholders are recorded on the ex-dividend date and are determined according to income tax regulations (tax basis). Distributable earnings determined on a tax basis may differ from earnings recorded in accordance with accounting principles generally accepted in the United States of America. These differences may be permanent or temporary. Permanent differences are reclassified among capital accounts to reflect their tax character. These reclassifications have no impact on net assets or the results of operations. Temporary differences are not reclassified, as they may reverse in subsequent periods.
Common expenses incurred by the Trust are allocated among the funds based on the ratio of net assets of each fund to the combined net assets of the Trust. Fund specific expenses are charged directly to the fund that incurred the expense.
Realized and unrealized gains and losses and net investment income, not including class specific expenses, are allocated daily to each class of shares based upon the relative proportion of net assets of each class. Differences in per share distributions, by class, are generally due to differences in class specific expenses.
f. Accounting Estimates
The preparation of financial statements in accordance with accounting principles generally accepted in the United States of America requires management to make estimates and assumptions that affect the reported amounts of assets and liabilities at the date of the financial statements and the amounts of income and expenses during the reporting period. Actual results could differ from those estimates.
g. Redemption Fees
Redemptions and exchanges of interests in an insurance company subaccount that invests in Class 3 shares of the Fund will be subject to a 1.0% short term trading fee if the interest in the subaccount has been held for less than 60 days. Such fees are retained by the Fund and accounted for as an addition to paid-in capital, allocated to each class of shares based upon the relative proportion of net assets of each class.
h. Guarantees and Indemnifications
Under the Trust’s organizational documents, its officers and trustees are indemnified by the Trust against certain liabilities arising out of the performance of their duties to the Trust. Additionally, in the normal course of business, the Trust, on behalf of the Fund, enters into contracts with service providers that contain general indemnification clauses. The Trust’s maximum exposure under these arrangements is unknown as this would involve future claims that may be made against the Trust that have not yet occurred. Currently, the Trust expects the risk of loss to be remote.
TF-21
Franklin Templeton Variable Insurance Products Trust
Notes to Financial Statements (continued)
Templeton Foreign Securities Fund
2. SHARES OF BENEFICIAL INTEREST
At December 31, 2010, there were an unlimited number of shares authorized (without par value). Transactions in the Fund’s shares were as follows:
| | | | | | | | | | | | | | | | |
| | | Year Ended December 31, | |
| | | 2010 | | | 2009 | |
| Class 1 Shares: | | Shares | | | Amount | | | Shares | | | Amount | |
Shares sold | | | 1,834,739 | | | $ | 24,009,210 | | | | 984,005 | | | $ | 11,607,893 | |
Shares issued in reinvestment of distributions | | | 500,533 | | | | 6,186,591 | | | | 2,337,178 | | | | 21,361,810 | |
Shares redeemed | | | (3,507,687 | ) | | | (46,586,826 | ) | | | (4,055,131 | ) | | | (44,514,688 | ) |
| | | | |
Net increase (decrease) | | | (1,172,415 | ) | | $ | (16,391,025 | ) | | | (733,948 | ) | | $ | (11,544,985 | ) |
| | | | |
Class 2 Shares: | | | | | | | | | | | | | | | | |
Shares sold | | | 24,359,823 | | | $ | 304,453,001 | | | | 17,636,013 | | | $ | 191,261,657 | |
Shares issued in reinvestment of distributions | | | 2,950,664 | | | | 35,909,578 | | | | 15,030,410 | | | | 135,423,993 | |
Shares redeemed | | | (30,526,296 | ) | | | (397,048,706 | ) | | | (41,328,787 | ) | | | (445,314,952 | ) |
| | | | |
Net increase (decrease) | | | (3,215,809 | ) | | $ | (56,686,127 | ) | | | (8,662,364 | ) | | $ | (118,629,302 | ) |
| | | | |
Class 3 Shares: | | | | | | | | | | | | | | | | |
Shares sold | | | 488,049 | | | $ | 6,145,010 | | | | 2,721,038 | | | $ | 28,784,908 | |
Shares issued in reinvestment of distributions | | | 143,421 | | | | 1,738,264 | | | | 2,619,202 | | | | 23,415,667 | |
Shares redeemed | | | (1,625,745 | ) | | | (21,016,528 | ) | | | (22,034,601 | ) | | | (227,180,905 | ) |
| | | | |
Net increase (decrease) | | | (994,275 | ) | | $ | (13,133,254 | ) | | | (16,694,361 | ) | | $ | (174,980,330 | ) |
| | | | |
Class 4 Shares: | | | | | | | | | | | | | | | | |
Shares sold | | | 19,836,996 | | | $ | 240,414,850 | | | | 2,965,551 | | | $ | 33,480,588 | |
Shares issued on reinvestment of distributions | | | 94,309 | | | | 1,159,055 | | | | 154,031 | | | | 1,403,220 | |
Shares redeemed | | | (2,328,115 | ) | | | (30,766,371 | ) | | | (860,936 | ) | | | (10,090,033 | ) |
| | | | |
Net increase (decrease) | | | 17,603,190 | | | $ | 210,807,534 | | | | 2,258,646 | | | $ | 24,793,775 | |
| | | | |
3. TRANSACTIONS WITH AFFILIATES
Franklin Resources, Inc. is the holding company for various subsidiaries that together are referred to as Franklin Templeton Investments. Certain officers and trustees of the Fund are also officers and/or directors of the following subsidiaries:
| | |
| Subsidiary | | Affiliation |
Templeton Investment Counsel, LLC (TIC) | | Investment manager |
Franklin Templeton Services, LLC (FT Services) | | Administrative manager |
Franklin Templeton Distributors, Inc. (Distributors) | | Principal underwriter |
Franklin Templeton Investor Services, LLC (Investor Services) | | Transfer agent |
TF-22
Franklin Templeton Variable Insurance Products Trust
Notes to Financial Statements (continued)
Templeton Foreign Securities Fund
3. TRANSACTIONS WITH AFFILIATES (continued)
a. Management Fees
The Fund pays an investment management fee to TIC based on the average daily net assets of the Fund as follows:
| | |
| Annualized Fee Rate | | Net Assets |
| 0.750% | | Up to and including $200 million |
| 0.675% | | Over $200 million, up to and including $1.3 billion |
| 0.600% | | Over $1.3 billion, up to and including $10 billion |
| 0.580% | | Over $10 billion, up to and including $15 billion |
| 0.560% | | Over $15 billion, up to and including $20 billion |
| 0.540% | | In excess of $20 billion |
b. Administrative Fees
The Fund pays an administrative fee to FT Services based on the Fund’s average daily net assets as follows:
| | |
| Annualized Fee Rate | | Net Assets |
| 0.150% | | Up to and including $200 million |
| 0.135% | | Over $200 million, up to and including $700 million |
| 0.100% | | Over $700 million, up to and including $1.2 billion |
| 0.075% | | In excess of $1.2 billion |
c. Distribution Fees
The Trust’s Board of Trustees has adopted distribution plans for Class 2, Class 3, and Class 4 shares pursuant to Rule 12b-1 under the 1940 Act. Under the Fund’s compensation distribution plans, the Fund pays Distributors for costs incurred in connection with the servicing, sale and distribution of the Fund’s shares up to 0.25%, 0.35%, and 0.35% per year of its average daily net assets of Class 2, Class 3, and Class 4, respectively. The Board of Trustees has agreed to limit the current rate to 0.25% per year for Class 3.
d. Transfer Agent Fees
Investor Services, under terms of an agreement, performs shareholder servicing for the Fund and is not paid by the Fund for the services.
4. EXPENSE OFFSET ARRANGEMENT
The Fund has entered into an arrangement with its custodian whereby credits realized as a result of uninvested cash balances are used to reduce a portion of the Fund’s custodian expenses. During the year ended December 31, 2010, the custodian fees were reduced as noted in the Statement of Operations.
5. INCOME TAXES
For tax purposes, capital losses may be carried over to offset future capital gains, if any. At December 31, 2010, the Fund had tax basis capital losses of $265,728,291 expiring in 2017. During the year ended December 31, 2010, the Fund utilized $34,730,679 of capital loss carryforwards.
TF-23
Franklin Templeton Variable Insurance Products Trust
Notes to Financial Statements (continued)
Templeton Foreign Securities Fund
5. INCOME TAXES (continued)
The tax character of distributions paid during the years ended December 31, 2010 and 2009, was as follows:
| | | | | | | | |
| | | 2010 | | | 2009 | |
Distributions paid from: | | | | | | | | |
Ordinary income | | $ | 44,993,488 | | | $ | 82,201,258 | |
Long term capital gain | | | — | | | | 99,920,627 | |
| | | | |
| | $ | 44,993,488 | | | $ | 182,121,885 | |
| | | | |
At December 31, 2010, the cost of investments, net unrealized appreciation (depreciation) and undistributed ordinary income for income tax purposes were as follows:
| | | | |
Cost of investments | | $ | 2,478,623,118 | |
| | | | |
| |
Unrealized appreciation | | $ | 556,653,681 | |
Unrealized depreciation | | | (211,390,131 | ) |
| | | | |
Net unrealized appreciation (depreciation) | | $ | 345,263,550 | |
| | | | |
Distributable earnings – undistributed ordinary income | | $ | 46,209,487 | |
| | | | |
Net investment income differs for financial statement and tax purposes primarily due to differing treatments of foreign currency transactions and pass-through entity income.
Net realized gains (losses) differ for financial statement and tax purposes primarily due to differing treatments of wash sales, foreign currency transactions and pass-through entity income.
6. INVESTMENT TRANSACTIONS
Purchases and sales of investments (excluding short term securities) for the year ended December 31, 2010, aggregated $565,830,247 and $461,804,103, respectively.
7. INVESTMENTS IN INSTITUTIONAL FIDUCIARY TRUST MONEY MARKET PORTFOLIO
The Fund may invest in the Institutional Fiduciary Trust Money Market Portfolio (Sweep Money Fund), an open-end investment company managed by Franklin Advisers, Inc. (an affiliate of the investment manager). Management fees paid by the Fund are reduced on assets invested in the Sweep Money Fund, in an amount not to exceed the management and administrative fees paid by the Sweep Money Fund.
8. CONCENTRATION OF RISK
Investing in foreign securities may include certain risks and considerations not typically associated with investing in U.S. securities, such as fluctuating currency values and changing local and regional economic, political and social conditions, which may result in greater market volatility. In addition, certain foreign securities may not be as liquid as U.S. securities.
9. CREDIT FACILITY
The Fund, together with other U.S. registered and foreign investment funds (collectively “Borrowers”), managed by Franklin Templeton Investments, are borrowers in a joint syndicated senior unsecured credit facility totaling $750 million (Global Credit
TF-24
Franklin Templeton Variable Insurance Products Trust
Notes to Financial Statements (continued)
Templeton Foreign Securities Fund
9. CREDIT FACILITY (continued)
Facility) which matures on January 21, 2011. This Global Credit Facility provides a source of funds to the Borrowers for temporary and emergency purposes, including the ability to meet future unanticipated or unusually large redemption requests.
Under the terms of the Global Credit Facility, the Fund shall, in addition to interest charged on any borrowings made by the Fund and other costs incurred by the Fund, pay its share of fees and expenses incurred in connection with the implementation and maintenance of the Global Credit Facility, based upon its relative share of the aggregate net assets of all of the Borrowers, including an annual commitment fee of 0.10% based upon the unused portion of the Global Credit Facility, which is reflected in other expenses on the Statement of Operations. During the year ended December 31, 2010, the Fund did not use the Global Credit Facility.
Effective January 21, 2011, the Borrowers renewed the Global Credit Facility for a total of $750 million, maturing January 20, 2012.
10. FAIR VALUE MEASUREMENTS
The Fund follows a fair value hierarchy that distinguishes between market data obtained from independent sources (observable inputs) and the Fund’s own market assumptions (unobservable inputs). These inputs are used in determining the value of the Fund’s investments and are summarized in the following fair value hierarchy:
| | • | | Level 1 – quoted prices in active markets for identical securities |
| | • | | Level 2 – other significant observable inputs (including quoted prices for similar securities, interest rates, prepayment speed, credit risk, etc.) |
| | • | | Level 3 – significant unobservable inputs (including the Fund’s own assumptions in determining the fair value of investments) |
The inputs or methodology used for valuing securities are not an indication of the risk associated with investing in those securities.
For movements between the levels within the fair value hierarchy, the Fund has adopted a policy of recognizing the transfers as of the date of the underlying event which caused the movement.
At December 31, 2010, all of the Fund’s investments in securities carried at fair value were in Level 1 inputs. For detailed industry descriptions, see the accompanying Statement of Investments.
11. SUBSEQUENT EVENTS
The Fund has evaluated subsequent events through the issuance of the financial statements and determined that no events have occurred that require disclosure other than those already disclosed in the financial statements.
|
ABBREVIATIONS |
| Selected Portfolio |
|
| ADR - American Depository Receipt |
TF-25
Franklin Templeton Variable Insurance Products Trust
Templeton Foreign Securities Fund
Report of Independent Registered Public Accounting Firm
To the Board of Trustees and Shareholders of Franklin Templeton Variable Insurance Products Trust
In our opinion, the accompanying statement of assets and liabilities, including the statement of investments, and the related statements of operations and of changes in net assets and the financial highlights present fairly, in all material respects, the financial position of Templeton Foreign Securities Fund (the “Fund”) at December 31, 2010, the results of its operations for the year then ended, the changes in its net assets for each of the two years in the period then ended and the financial highlights for each of the periods presented, in conformity with accounting principles generally accepted in the United States of America. These financial statements and financial highlights (hereafter referred to as “financial statements”) are the responsibility of the Fund’s management. Our responsibility is to express an opinion on these financial statements based on our audits. We conducted our audits of these financial statements in accordance with the standards of the Public Company Accounting Oversight Board (United States). Those standards require that we plan and perform the audit to obtain reasonable assurance about whether the financial statements are free of material misstatement. An audit includes examining, on a test basis, evidence supporting the amounts and disclosures in the financial statements, assessing the accounting principles used and significant estimates made by management, and evaluating the overall financial statement presentation. We believe that our audits, which included confirmation of securities at December 31, 2010 by correspondence with the custodian and brokers, provide a reasonable basis for our opinion.
PricewaterhouseCoopers LLP
San Francisco, California
February 10, 2011
TF-26
Franklin Templeton Variable Insurance Products Trust
Tax Designation (unaudited)
Templeton Foreign Securities Fund
At December 31, 2010, more than 50% of the Fund’s total assets were invested in securities of foreign issuers. In most instances, foreign taxes were withheld from income paid to the Fund on these investments. The Fund elects to treat foreign taxes paid as allowed under Section 853 of the Internal Revenue Code. This election will allow shareholders of record as of the 2011 distribution date, to treat their proportionate share of foreign taxes paid by the Fund as having been paid directly by them. The shareholder shall consider these amounts as foreign taxes paid in the tax year in which they receive the Fund distribution.
TF-27
TEMPLETON GLOBAL BOND SECURITIES FUND
We are pleased to bring you Templeton Global Bond Securities Fund’s annual report for the fiscal year ended December 31, 2010.
Performance Summary as of 12/31/10
Average annual total return of Class 3 shares* represents the average annual change in value, assuming reinvestment of dividends and capital gains. Average returns smooth out variations in returns, which can be significant; they are not the same as year-by-year results.
Periods ended 12/31/10
| | | | | | | | | | | | |
| | | 1-Year | | | 5-Year | | | 10-Year | |
Average Annual Total Return | | | +14.38% | | | | +12.55% | | | | +11.78% | |
*Class 3 performance prior to 4/1/05 reflects historical Class 2 performance. Since 4/1/05 (effective date), the average annual total return of Class 3 shares was +10.68%.
Total Return Index Comparison
for a Hypothetical $10,000 Investment (1/1/01–12/31/10)
The graph below shows the change in value of a hypothetical $10,000 investment in the Fund over the indicated period and includes reinvestment of any income or distributions. The Fund’s performance* is compared to the performance of the J.P. Morgan (JPM) Global Government Bond Index (GGBI), the Citigroup World Government Bond Index (WGBI) and the Consumer Price Index (CPI). One cannot invest directly in an index, and an index is not representative of the Fund’s portfolio. Please see Important Notes to Performance Information preceding the Fund Summaries.
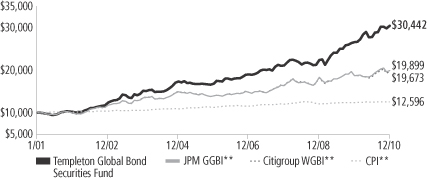
**Source: © 2011 Morningstar. Please see Index Descriptions following the Fund Summaries.
Templeton Global Bond Securities Fund – Class 3
Performance reflects the Fund’s Class 3 operating expenses, but does not include any contract fees, expenses or sales charges. If they had been included, performance would be lower. These charges and deductions, particularly for variable life policies, can have a significant effect on contract values and insurance benefits. See the contract prospectus for a complete description of these expenses, including sales charges.
Performance data represent past performance, which does not guarantee future results. Investment return and principal value will fluctuate, and you may have a gain or loss when you sell your shares.
Current performance may differ from figures shown.
TGB-1
Fund Goal and Main Investments: Templeton Global Bond Securities Fund seeks high current income, consistent with preservation of capital, with capital appreciation as a secondary consideration. The Fund normally invests at least 80% of its net assets in bonds, which include debt securities of any maturity, such as bonds, notes, bills and debentures.
Performance Overview
You can find the Fund’s one-year total return in the Performance Summary. The Fund outperformed its benchmarks, the JPM GGBI, which posted a +6.42% total return in U.S. dollar terms, and the Citigroup WGBI, which produced a +5.17% total return for the same period.1
Economic and Market Overview
Financial markets strengthened during the year under review as the global economy recovered, albeit at an uneven pace. Emerging economies generally enjoyed robust growth as they were less exposed than developed ones to many of the causes of the financial crisis, particularly overreliance on leverage. Many developing economies returned to trend growth levels, particularly in Asia, prompting some officials there to tighten fiscal and monetary policies. In contrast, the G-3 (U.S., eurozone and Japan) continued to struggle with recoveries that were not as robust as in previous episodes. Labor markets remained weak, and concerns regarding public sector balances led to periods of volatility during the year.
The first quarter of the year was broadly positive for most risk assets and currencies. Bond markets were generally supported by developed market policymakers’ reiterated commitment to keep interest rates low for an extended period. This commitment helped risk appetite broadly, and as the disparate nature of the recovery became more clear, emerging market sovereign credit spreads declined and currencies generally appreciated against the U.S. dollar. However, concerns regarding the Greek government’s ability to meet its financing needs, combined with heightened geopolitical tensions on the Korean peninsula and fears of a hard landing in China, led to a less favorable second quarter. In Greece, the public sector’s already substantial debt burden rose quickly as the government’s past manipulations of its fiscal balances came to light. Given Greece’s uncompetitive labor force, rising political tensions, and very weak growth, many observers questioned its ability to continue to
1. Source: © 2011 Morningstar. One cannot invest directly in an index, and an index is not representative of the Fund’s portfolio. Please see Index Descriptions following the Fund Summaries.
Fund Risks: Because the Fund invests in bonds and other debt obligations, its share price and yield will be affected by interest rate movements. Bond prices generally move in the opposite direction of interest rates. Thus, as prices of bonds in the Fund adjust to a rise in interest rates, the Fund’s share price may decline. High yield, lower rated (junk) bonds generally have greater price swings and higher default risks than investment-grade bonds. Foreign investing, especially in emerging markets, involves additional risks, including currency fluctuations, economic instability, market volatility, and political and social instability. The Fund’s investment in certain hedging and derivative instruments may involve a small investment relative to the risk assumed. As a nondiversified fund, the Fund may be more sensitive to economic, business, political or other changes affecting similar issuers or securities, which may result in greater fluctuation in the value of the Fund’s shares. The manager applies various techniques and analyses in making investment decisions for the Fund, but there can be no guarantee that these decisions will produce the desired results. The Fund’s prospectus also includes a description of the main investment risks.
TGB-2
meet its debt obligations, many of which were owned by Greek and other European banks. Chinese policymakers’ steps to remove the stimulus that had helped their economy counteract the global financial crisis in 2009 further dampened market sentiment. Although these steps proved to be gradual and in our view appropriate, the market appeared preoccupied by the prospect of a hard landing.
Financial markets recovered in 2010’s third quarter after the European Union and International Monetary Fund provided strong support to the Greek government. Loans made available to the government were sufficient to meet its financing needs for more than two years, which temporarily reduced fears that other highly indebted, non-eurozone European governments would have trouble meeting their financing needs. The euro and other European currencies strengthened against the U.S. dollar in this environment. Policymakers’ commitments in many developed economies to support their fragile recoveries kept bond yields low, even as additional countries that recovered quickly from the financial crisis were tightening policy. However, volatility returned in the fourth quarter largely due to renewed concerns in the eurozone, this time centered on Ireland. In addition, after reaching the lowest levels of the year early in the quarter in anticipation of the U.S. Federal Reserve Board’s announcing its second quantitative easing program, U.S. Treasury yields rose meaningfully near period-end, which created problems for many traditional fixed income investors. Overall, financial markets aside from bonds generally ended 2010 on a positive note, with equity markets at their highest levels since Lehman Brothers Holdings’ collapse in 2008. Currencies tended to reflect their economies’ underlying strength, with many emerging and select developed economies, such as Australia and Sweden, ending the year stronger against the U.S. dollar.
Investment Strategy
We allocate the Fund’s assets among issuers, geographic regions and currencies based upon our assessment of relative interest rates among currencies, our outlook for changes in interest rates and currencies, and credit risks. In considering these factors, we may evaluate a country’s changing market, economic and political conditions, such as inflation rate, growth prospects, global trade patterns and government policies. We seek to manage the Fund’s exposure to various currencies and may utilize forward currency exchange contracts.
What is a forward currency exchange contract?
A forward currency exchange contract is an agreement between the Fund and a counterparty to buy or sell a foreign currency for a specific exchange rate on a future date.
TGB-3
Manager’s Discussion
The Fund’s total return was influenced by various factors including interest rate developments, currency movements and exposure to sovereign debt markets. During the fiscal year under review, each of these sources of return benefited absolute and relative results.
Interest Rate Strategy
The Fund’s duration exposure was a major contributor to relative performance during the year. Government bond yields in many developed economies fell toward their historical lows reached at the height of the financial crisis. Monetary policymakers attempted to support their fragile economic recoveries by reiterating their commitment to keep rates low for an extended period and enacting further asset purchase programs. The Fund sought to capitalize on this low interest rate environment by maintaining long duration exposure only in economies with relatively high interest rates where we felt the full extent of any likely interest rate hikes had been priced in. In addition, we looked for areas where we believed long-term government bond yields were likely to benefit over time as risk premiums fell due to improved fiscal and inflation-fighting policies. This strategy contributed to relative performance during 2010’s first three quarters because of some select, overweighted exposures. In particular, long duration, local government bonds from Indonesia and Mexico were significant contributors. Each country’s central bank left rates unchanged throughout the year as inflation pressures were less than expected. Yields on Indonesia’s 10-year government bonds fell 244 basis points (bps; 100 bps equal one percentage point) during 2010’s first nine months, while Mexico’s declined 187 bps.
Toward period-end, yields began to rise in many developed economies, particularly in the U.S. Pushing yields higher were better-than-expected economic data and mounting concerns about many countries’ historically high fiscal deficits, which could be politically difficult to address and therefore may persist for some time. In this environment, the Fund’s underweighted exposures in euro- and U.S. dollar-denominated bonds and no exposure to yen-denominated bonds helped relative performance.
What is duration?
Duration is a measure of a bond’s price sensitivity to interest rate changes. In general, a portfolio of securities with a lower duration can be expected to be less sensitive to interest rate changes than a portfolio with a higher duration.
TGB-4
Currency Strategy
The Fund’s diverse, actively managed currency exposure provided strong returns during the year. Global currency markets increasingly reflected the underlying strengths of their respective economies. Although the U.S. dollar fell 1.06% against its major trading partners overall, this decline was the result of pronounced weakness against Asian currencies and select other emerging economies as the U.S. dollar strengthened against most European currencies.2 In the Americas, we concentrated the Fund’s currency exposure in a few emerging Latin American economies, which benefited performance. The Chilean peso, Mexican peso, and Brazilian real each appreciated more than 5% against the U.S. dollar as their domestically led recoveries outpaced that of the U.S.2 In addition, these economies benefited from high prices for the commodities they exported.
The Fund’s European currency exposure was a significant contributor to relative performance. Heightened tensions surrounding some non-eurozone European countries weighed on the euro periodically through the year. Combined with the market’s recognition of the relative strength of other European countries, this environment favored the Fund’s positioning in these currencies against the euro. For example, the Swedish krona appreciated 13.58% against the euro during the year as growth in Sweden outperformed, it did not suffer from the same concerns about unsustainable fiscal balances, and in the second half of the year the country’s central bank hiked its policy rate 100 bps.2 Norway and Poland similarly outperformed. In the Middle East, the Fund’s Egyptian pound position detracted from performance.
The Fund’s exposure to Asian currencies also contributed to results during the year, with one large exception, its negative exposure to the Japanese yen. The currencies of both emerging Asian economies and those of more developed economies, such as South Korea and Australia, appreciated as the region again had the world’s strongest growth. Although China’s economy led, with robust domestic demand despite steps by policymakers to tighten policy, the country’s demand and investment had a positive impact throughout the region. For example, Australia was one of the first developed economies to recover from the global financial crisis not only because it had not gone through a housing bubble and had much better government finances, but also because
2. Source: IDC/Exshare.
Currency Breakdown
Templeton Global Bond Securities Fund
12/31/10
| | | | |
| | | % of Total
Net Assets | |
| |
Americas | | | 61.8% | |
U.S. Dollar | | | 40.3% | |
Brazilian Real | | | 4.7% | |
Mexican Peso | | | 9.0% | |
Chilean Peso | | | 6.9% | |
Peruvian Nuevo Sol | | | 0.9% | |
| |
Asia Pacific | | | 32.2% | |
South Korean Won | | | 15.6% | |
Australian Dollar | | | 9.6% | |
Malaysian Ringgit | | | 9.4% | |
Indonesian Rupiah | | | 6.8% | |
Philippine Peso | | | 5.3% | |
Indian Rupee | | | 5.0% | |
Sri Lankan Rupee | | | 1.7% | |
Chinese Yuan | | | 0.7% | |
New Zealand Dollar* | | | -0.7% | |
Japanese Yen* | | | -21.2% | |
| |
Middle East & Africa | | | 9.1% | |
New Israeli Shekel | | | 4.6% | |
Egyptian Pound | | | 4.5% | |
| |
Europe* | | | -3.1% | |
Norwegian Krone | | | 8.3% | |
Swedish Krona | | | 7.9% | |
Polish Zloty | | | 6.8% | |
Euro* | | | -26.1% | |
*Holding is a negative percentage because of the Fund’s holdings of forward currency exchange contracts.
The dollar value, number of shares or principal amount, and names of all portfolio holdings are listed in the Fund’s Statement of Investments.
TGB-5
it has close links with China, which is Australia’s largest trading partner. Chinese demand supported prices for Australia’s commodity exports, and the Australian dollar appreciated 13.98% against the U.S. dollar.2 The Fund experienced similar benefits from regional emerging currencies from countries closely integrated with China, such as Malaysia, Indonesia and the Philippines. In contrast, the Fund’s underweighted position in the Japanese yen detracted significantly from performance. We held a long position in the U.S. dollar against the Japanese yen, through the use of forward contracts, in part to hedge the duration exposure of our U.S. dollar-denominated holdings. This position worked against us through most of the year as U.S. yields fell; however, even late in the year when interest rates rose, the yen remained strong. Historically the exchange rate and interest rate differentials between the U.S. and Japan have had a strong correlation. Although this relationship persists over longer periods, over the short term specific developments can cause it to break down. In particular, despite higher U.S. interest rates, the yen was stronger this year amid surprisingly good Japanese economic data, largely due to temporary stimulus measures and the rebuilding of inventories, and the market’s preoccupation with the second round of quantitative easing in the U.S.
Global Sovereign Debt Strategy
Sovereign credit exposure benefited performance as the broadly supportive risk environment led to spread tightening in most credits. Despite sovereign credits’ significant tightening since the financial crisis, we found opportunities we feel are attractive as we believe relative fundamentals continued to favor emerging markets. The enhanced resilience of such economies and the significant challenges facing highly indebted non-eurozone European countries drove reevaluation of traditional perceptions of sovereign risk. This situation, in conjunction with developed economies’ low interest rates, brought new investors to the asset class and pushed credit spreads lower for some of the largest, traditional emerging markets. We were selective in our sovereign credit exposure as the period progressed, but we managed to benefit somewhat from the rally. Specifically, exposures in Argentina and Venezuela were two of the Fund’s best performing sovereign credit positions, while outside Latin America, positions in Iraq, Lithuania and Indonesia contributed to performance.
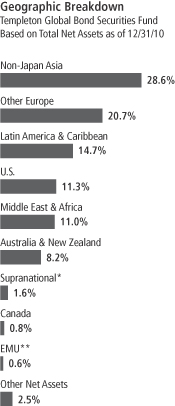
*The Fund’s supranational investments were denominated in the Mexican peso, Norwegian krone and U.S. dollar.
**The Fund’s EMU investment was in Germany.
TGB-6
Thank you for your participation in Templeton Global Bond Securities Fund. We look forward to serving your future investment needs.
The foregoing information reflects our analysis, opinions and portfolio holdings as of December 31, 2010, the end of the reporting period. The way we implement our main investment strategies and the resulting portfolio holdings may change depending on factors such as market and economic conditions. These opinions may not be relied upon as investment advice or an offer for a particular security. The information is not a complete analysis of every aspect of any market, country, industry, security or the Fund. Statements of fact are from sources considered reliable, but the investment manager makes no representation or warranty as to their completeness or accuracy. Although historical performance is no guarantee of future results, these insights may help you understand our investment management philosophy.
TGB-7
Fund Expenses
As an investor in a variable insurance contract (Contract) that indirectly provides for investment in an underlying mutual fund, you can incur transaction and/or ongoing expenses at both the Fund level and the Contract level.
| • | | Transaction expenses can include sales charges (loads) on purchases, redemption fees, surrender fees, transfer fees and premium taxes. |
| • | | Ongoing expenses can include management fees, distribution and service (12b-1) fees, contract fees, annual maintenance fees, mortality and expense risk fees and other fees and expenses. All mutual funds and Contracts have some types of ongoing expenses. |
The expenses shown in the table are meant to highlight ongoing expenses at the Fund level only and do not include ongoing expenses at the Contract level, or transaction expenses at either the Fund or Contract level. While the Fund does not have transaction expenses, if the transaction and ongoing expenses at the Contract level were included, the expenses shown below would be higher. You should consult your Contract prospectus or disclosure document for more information.
The table shows Fund-level ongoing expenses and can help you understand these expenses and compare them with those of other mutual funds offered through the Contract. The table assumes a $1,000 investment held for the six months indicated. Please refer to the Fund prospectus for additional information on operating expenses.
Actual Fund Expenses
The first line (Actual) of the table provides actual account values and expenses. The “Ending Account Value” is derived from the Fund’s actual return, which includes the effect of ongoing Fund expenses, but does not include the effect of ongoing Contract expenses.
You can estimate the Fund-level expenses you incurred during the period by following these steps. Of course, your account value and expenses will differ from those in this illustration:
| 1. | Divide your account value by $1,000. |
If an account had an $8,600 value, then $8,600 ÷ $1,000 = 8.6.
| 2. | Multiply the result by the number under the heading “Fund-Level Expenses Incurred During Period.” |
If Fund-Level Expenses Incurred During Period were $7.50, then 8.6 x $7.50 = $64.50.
In this illustration, the estimated expenses incurred this period at the Fund level are $64.50.
Templeton Global Bond Securities Fund – Class 3
TGB-8
Hypothetical Example for Comparison with Other Mutual Funds
Information in the second line (Hypothetical) of the table can help you compare ongoing expenses of the Fund with those of other mutual funds offered through the Contract. This information may not be used to estimate the actual ending account balance or expenses you incurred during the period. The hypothetical “Ending Account Value” is based on the Fund’s actual expense ratio for each class and an assumed 5% annual rate of return before expenses, which does not represent the Fund’s actual return. The figure under the heading “Fund-Level Expenses Incurred During Period” shows the hypothetical expenses your account would have incurred under this scenario. You can compare this figure with the 5% hypothetical examples that appear in shareholder reports of other funds offered through a Contract.
| | | | | | | | | | | | |
| Class 3 | | Beginning
Account Value 7/1/10 | | | Ending
Account Value 12/31/10 | | | Fund-Level Expenses Incurred
During Period* 7/1/10–12/31/10 | |
Actual | | $ | 1,000 | | | $ | 1,096.20 | | | $ | 4.28 | |
Hypothetical (5% return before expenses) | | $ | 1,000 | | | $ | 1,021.12 | | | $ | 4.13 | |
*Expenses are calculated using the most recent six-month annualized expense ratio for the Fund’s Class 3 shares (0.81%), which does not include any ongoing expenses of the Contract for which the Fund is an investment option, multiplied by the average account value over the period, multiplied by 184/365 to reflect the one-half year period.
TGB-9
Franklin Templeton Variable Insurance Products Trust
Financial Highlights
Templeton Global Bond Securities Fund
| | | | | | | | | | | | | | | | | | | | |
| | | Year Ended December 31, | |
| Class 1 | | 2010 | | | 2009 | | | 2008 | | | 2007 | | | 2006 | |
| | | | |
Per share operating performance | | | | | | | | | | | | | | | | | | | | |
(for a share outstanding throughout the year) | | | | | | | | | | | | | | | | | | | | |
Net asset value, beginning of year | | $ | 17.72 | | | $ | 17.42 | | | $ | 17.00 | | | $ | 15.73 | | | $ | 14.36 | |
| | | | |
Income from investment operationsa: | | | | | | | | | | | | | | | | | | | | |
Net investment incomeb | | | 1.00 | | | | 0.99 | | | | 0.80 | | | | 0.77 | | | | 0.61 | |
Net realized and unrealized gains (losses) | | | 1.58 | | | | 2.01 | | | | 0.27 | | | | 0.97 | | | | 1.24 | |
| | | | |
Total from investment operations | | | 2.58 | | | | 3.00 | | | | 1.07 | | | | 1.74 | | | | 1.85 | |
| | | | |
Less distributions from: | | | | | | | | | | | | | | | | | | | | |
Net investment income and net foreign currency gains | | | (0.31 | ) | | | (2.70 | ) | | | (0.65 | ) | | | (0.47 | ) | | | (0.48 | ) |
Net realized gains | | | (0.05 | ) | | | — | | | | — | | | | — | | | | — | |
| | | | |
Total distributions | | | (0.36 | ) | | | (2.70 | ) | | | (0.65 | ) | | | (0.47 | ) | | | (0.48 | ) |
| | | | |
Redemption feesc | | | — | | | | — | | | | — | | | | — | | | | — | |
| | | | |
Net asset value, end of year | | $ | 19.94 | | | $ | 17.72 | | | $ | 17.42 | | | $ | 17.00 | | | $ | 15.73 | |
| | | | |
| | | | | |
Total returnd | | | 14.71% | | | | 18.98% | | | | 6.46% | | | | 11.27% | | | | 13.14% | |
Ratios to average net assets | | | | | | | | | | | | | | | | | | | | |
Expenses before expense reduction | | | 0.55% | | | | 0.54% | | | | 0.58% | | | | 0.64% | | | | 0.80% | |
Expenses net of expense reduction | | | 0.55% | e | | | 0.54% | e | | | 0.58% | e | | | 0.64% | e | | | 0.72% | |
Net investment income | | | 5.27% | | | | 5.73% | | | | 4.66% | | | | 4.70% | | | | 4.09% | |
| | | | | |
Supplemental data | | | | | | | | | | | | | | | | | | | | |
Net assets, end of year (000’s) | | $ | 272,232 | | | $ | 195,662 | | | $ | 220,588 | | | $ | 137,700 | | | $ | 75,843 | |
Portfolio turnover rate | | | 8.77% | | | | 20.84% | | | | 28.46% | | | | 47.33% | | | | 30.65% | |
aThe amount shown for a share outstanding throughout the period may not correlate with the Statement of Operations for the period due to the timing of sales and repurchases of the Fund shares in relation to income earned and/or fluctuating market value of the investments of the Fund.
bBased on average daily shares outstanding.
cAmount rounds to less than $0.01 per share.
dTotal return does not include fees, charges or expenses imposed by the variable annuity and life insurance contracts for which the Franklin Templeton Variable Insurance Products Trust serves as an underlying investment vehicle.
eBenefit of expense reduction rounds to less than 0.01%.
The accompanying notes are an integral part of these financial statements.
TGB-10
Franklin Templeton Variable Insurance Products Trust
Financial Highlights (continued)
Templeton Global Bond Securities Fund
| | | | | | | | | | | | | | | | | | | | |
| | | Year Ended December 31, | |
| Class 2 | | 2010 | | | 2009 | | | 2008 | | | 2007 | | | 2006 | |
| | | | |
Per share operating performance | | | | | | | | | | | | | | | | | | | | |
(for a share outstanding throughout the year) | | | | | | | | | | | | | | | | | | | | |
Net asset value, beginning of year | | $ | 17.34 | | | $ | 17.10 | | | $ | 16.72 | | | $ | 15.50 | | | $ | 14.19 | |
| | | | |
Income from investment operationsa: | | | | | | | | | | | | | | | | | | | | |
Net investment incomeb | | | 0.93 | | | | 0.93 | | | | 0.74 | | | | 0.72 | | | | 0.57 | |
Net realized and unrealized gains (losses) | | | 1.54 | | | | 1.98 | | | | 0.27 | | | | 0.96 | | | | 1.21 | |
| | | | |
Total from investment operations | | | 2.47 | | | | 2.91 | | | | 1.01 | | | | 1.68 | | | | 1.78 | |
| | | | |
Less distributions from: | | | | | | | | | | | | | | | | | | | | |
Net investment income and net foreign currency gains | | | (0.27 | ) | | | (2.67 | ) | | | (0.63 | ) | | | (0.46 | ) | | | (0.47 | ) |
Net realized gains | | | (0.05 | ) | | | — | | | | — | | | | — | | | | — | |
| | | | |
Total distributions | | | (0.32 | ) | | | (2.67 | ) | | | (0.63 | ) | | | (0.46 | ) | | | (0.47 | ) |
| | | | |
Redemption feesc | | | — | | | | — | | | | — | | | | — | | | | — | |
| | | | |
Net asset value, end of year | | $ | 19.49 | | | $ | 17.34 | | | $ | 17.10 | | | $ | 16.72 | | | $ | 15.50 | |
| | | | |
| | | | | |
Total returnd | | | 14.45% | | | | 18.68% | | | | 6.21% | | | | 11.00% | | | | 12.77% | |
Ratios to average net assets | | | | | | | | | | | | | | | | | | | | |
Expenses before expense reduction | | | 0.80% | | | | 0.79% | | | | 0.83% | | | | 0.89% | | | | 1.05% | |
Expenses net of expense reduction | | | 0.80% | e | | | 0.79% | e | | | 0.83% | e | | | 0.89% | e | | | 0.97% | |
Net investment income | | | 5.02% | | | | 5.48% | | | | 4.41% | | | | 4.45% | | | | 3.84% | |
| | | | | |
Supplemental data | | | | | | | | | | | | | | | | | | | | |
Net assets, end of year (000’s) | | $ | 1,490,794 | | | $ | 1,262,783 | | | $ | 793,881 | | | $ | 480,649 | | | $ | 205,768 | |
Portfolio turnover rate | | | 8.77% | | | | 20.84% | | | | 28.46% | | | | 47.33% | | | | 30.65% | |
aThe amount shown for a share outstanding throughout the period may not correlate with the Statement of Operations for the period due to the timing of sales and repurchases of the Fund shares in relation to income earned and/or fluctuating market value of the investments of the Fund.
bBased on average daily shares outstanding.
cAmount rounds to less than $0.01 per share.
dTotal return does not include fees, charges or expenses imposed by the variable annuity and life insurance contracts for which the Franklin Templeton Variable Insurance Products Trust serves as an underlying investment vehicle.
eBenefit of expense reduction rounds to less than 0.01%.
The accompanying notes are an integral part of these financial statements.
TGB-11
Franklin Templeton Variable Insurance Products Trust
Financial Highlights (continued)
Templeton Global Bond Securities Fund
| | | | | | | | | | | | | | | | | | | | |
| | | Year Ended December 31, | |
| Class 3 | | 2010 | | | 2009 | | | 2008 | | | 2007 | | | 2006 | |
| | | | |
Per share operating performance | | | | | | | | | | | | | | | | | | | | |
(for a share outstanding throughout the year) | | | | | | | | | | | | | | | | | | | | |
Net asset value, beginning of year | | $ | 17.33 | | | $ | 17.08 | | | $ | 16.70 | | | $ | 15.49 | | | $ | 14.18 | |
| | | | |
Income from investment operationsa: | | | | | | | | | | | | | | | | | | | | |
Net investment incomeb | | | 0.93 | | | | 0.93 | | | | 0.74 | | | | 0.72 | | | | 0.58 | |
Net realized and unrealized gains (losses) | | | 1.54 | | | | 1.98 | | | | 0.27 | | | | 0.95 | | | | 1.21 | |
| | | | |
Total from investment operations | | | 2.47 | | | | 2.91 | | | | 1.01 | | | | 1.67 | | | | 1.79 | |
| | | | |
Less distributions from: | | | | | | | | | | | | | | | | | | | | |
Net investment income and net foreign currency gains | | | (0.27 | ) | | | (2.66 | ) | | | (0.63 | ) | | | (0.46 | ) | | | (0.48 | ) |
Net realized gains | | | (0.05 | ) | | | — | | | | — | | | | — | | | | — | |
| | | | |
Total distributions | | | (0.32 | ) | | | (2.66 | ) | | | (0.63 | ) | | | (0.46 | ) | | | (0.48 | ) |
| | | | |
Redemption feesc | | | — | | | | — | | | | — | | | | — | | | | — | |
| | | | |
Net asset value, end of year | | $ | 19.48 | | | $ | 17.33 | | | $ | 17.08 | | | $ | 16.70 | | | $ | 15.49 | |
| | | | |
| | | | | |
Total returnd | | | 14.38% | | | | 18.69% | | | | 6.21% | | | | 11.03% | | | | 12.84% | |
Ratios to average net assets | | | | | | | | | | | | | | | | | | | | |
Expenses before expense reduction | | | 0.80% | | | | 0.79% | | | | 0.83% | | | | 0.89% | | | | 1.05% | |
Expenses net of expense reduction | | | 0.80% | e | | | 0.79% | e | | | 0.83% | e | | | 0.89% | e | | | 0.97% | |
Net investment income | | | 5.02% | | | | 5.48% | | | | 4.41% | | | | 4.45% | | | | 3.84% | |
| | | | | |
Supplemental data | | | | | | | | | | | | | | | | | | | | |
Net assets, end of year (000’s) | | $ | 183,380 | | | $ | 143,264 | | | $ | 128,155 | | | $ | 91,162 | | | $ | 35,572 | |
Portfolio turnover rate | | | 8.77% | | | | 20.84% | | | | 28.46% | | | | 47.33% | | | | 30.65% | |
aThe amount shown for a share outstanding throughout the period may not correlate with the Statement of Operations for the period due to the timing of sales and repurchases of the Fund shares in relation to income earned and/or fluctuating market value of the investments of the Fund.
bBased on average daily shares outstanding.
cAmount rounds to less than $0.01 per share.
dTotal return does not include fees, charges or expenses imposed by the variable annuity and life insurance contracts for which the Franklin Templeton Variable Insurance Products Trust serves as an underlying investment vehicle.
eBenefit of expense reduction rounds to less than 0.01%.
The accompanying notes are an integral part of these financial statements.
TGB-12
Franklin Templeton Variable Insurance Products Trust
Financial Highlights (continued)
Templeton Global Bond Securities Fund
| | | | | | | | | | | | |
| | | Year Ended December 31, | |
| Class 4 | | 2010 | | | 2009 | | | 2008a | |
| | | | |
Per share operating performance | | | | | | | | | | | | |
(for a share outstanding throughout the year) | | | | | | | | | | | | |
Net asset value, beginning of year | | $ | 17.61 | | | $ | 17.37 | | | $ | 18.00 | |
| | | | |
Income from investment operationsb: | | | | | | | | | | | | |
Net investment incomec | | | 0.93 | | | | 0.93 | | | | 0.66 | |
Net realized and unrealized gains (losses) | | | 1.56 | | | | 2.00 | | | | (0.64 | ) |
| | | | |
Total from investment operations | | | 2.49 | | | | 2.93 | | | | 0.02 | |
| | | | |
Less distributions from: | | | | | | | | | | | | |
Net investment income and net foreign currency gains | | | (0.27 | ) | | | (2.69 | ) | | | (0.65 | ) |
Net realized gains | | | (0.05 | ) | | | — | | | | — | |
| | | | |
Total distributions | | | (0.32 | ) | | | (2.69 | ) | | | (0.65 | ) |
| | | | |
Redemption feesd | | | — | | | | — | | | | — | |
| | | | |
Net asset value, end of year | | $ | 19.78 | | | $ | 17.61 | | | $ | 17.37 | |
| | | | |
| | | |
Total returne | | | 14.28% | | | | 18.58% | | | | 0.26% | |
Ratios to average net assetsf | | | | | | | | | | | | |
Expensesg | | | 0.90% | | | | 0.89% | | | | 0.93% | |
Net investment income | | | 4.92% | | | | 5.38% | | | | 4.31% | |
| | | |
Supplemental data | | | | | | | | | | | | |
Net assets, end of year (000’s) | | | $150,891 | | | | $108,910 | | | | $43,069 | |
Portfolio turnover rate | | | 8.77% | | | | 20.84% | | | | 28.46% | |
aFor the period February 29, 2008 (effective date) to December 31, 2008.
bThe amount shown for a share outstanding throughout the period may not correlate with the Statement of Operations for the period due to the timing of sales and repurchases of the Fund shares in relation to income earned and/or fluctuating market value of the investments of the Fund.
cBased on average daily shares outstanding.
dAmount rounds to less than $0.01 per share.
eTotal return does not include fees, charges or expenses imposed by the variable annuity and life insurance contracts for which the Franklin Templeton Variable Insurance Products Trust serves as an underlying investment vehicle. Total return is not annualized for periods less than one year.
fRatios are annualized for periods less than one year.
gBenefit of expense reduction rounds to less than 0.01%.
The accompanying notes are an integral part of these financial statements.
TGB-13
Franklin Templeton Variable Insurance Products Trust
Statement of Investments, December 31, 2010
| | | | | | | | |
| Templeton Global Bond Securities Fund | | Principal
Amount* | | | Value | |
Foreign Government and Agency Securities 79.1% | | | | | | | | |
Argentina 1.2% | | | | | | | | |
a,bGovernment of Argentina, senior bond, FRN, 0.677%, 8/03/12 | | | 107,485,000 | | | $ | 25,748,032 | |
| | | | | | | | |
Australia 8.2% | | | | | | | | |
Government of Australia, TB123, 5.75%, 4/15/12 | | | 43,700,000 | AUD | | | 45,093,095 | |
New South Wales Treasury Corp., | | | | | | | | |
6.00%, 5/01/12 | | | 9,350,000 | AUD | | | 9,649,316 | |
6.00%, 5/01/12 (London Exchange) | | | 13,180,000 | AUD | | | 13,599,985 | |
senior note, 5.50%, 3/01/17 | | | 32,225,000 | AUD | | | 32,417,913 | |
Queensland Treasury Corp., | | | | | | | | |
6.00%, 6/14/11 | | | 22,050,000 | AUD | | | 22,635,972 | |
6.00%, 8/14/13 | | | 24,450,000 | AUD | | | 25,378,548 | |
6.00%, 9/14/17 | | | 13,160,000 | AUD | | | 13,577,613 | |
c144A, 7.125%, 9/18/17 | | | 4,380,000 | NZD | | | 3,648,265 | |
Western Australia Treasury Corp., 5.50%, 7/17/12 | | | 6,400,000 | AUD | | | 6,561,996 | |
| | | | | | | | |
| | | | | | | 172,562,703 | |
| | | | | | | | |
Brazil 4.2% | | | | | | | | |
Nota Do Tesouro Nacional, | | | | | | | | |
10.00%, 1/01/12 | | | 38,245 | d BRL | | | 22,634,425 | |
10.00%, 1/01/14 | | | 7,100 | d BRL | | | 4,050,044 | |
10.00%, 1/01/17 | | | 22,490 | d BRL | | | 12,432,821 | |
eIndex Linked, 6.00%, 5/15/11 | | | 2,055 | d BRL | | | 2,461,112 | |
eIndex Linked, 6.00%, 5/15/15 | | | 27,735 | d BRL | | | 32,870,412 | |
eIndex Linked, 6.00%, 5/15/45 | | | 10,825 | d BRL | | | 13,847,349 | |
| | | | | | | | |
| | | | | | | 88,296,163 | |
| | | | | | | | |
Canada 0.8% | | | | | | | | |
Province of Manitoba, 6.375%, 9/01/15 | | | 19,985,000 | NZD | | | 16,318,664 | |
| | | | | | | | |
Germany 0.6% | | | | | | | | |
Landwirtschaftliche Rentenbank, senior note, 8.50%, 2/22/16 | | | 137,707,000 | MXN | | | 12,001,377 | |
| | | | | | | | |
Hungary 1.6% | | | | | | | | |
Government of Hungary, senior note, | | | | | | | | |
3.50%, 7/18/16 | | | 1,055,000 | EUR | | | 1,217,067 | |
4.375%, 7/04/17 | | | 5,380,000 | EUR | | | 6,351,059 | |
5.75%, 6/11/18 | | | 13,795,000 | EUR | | | 17,226,294 | |
6.25%, 1/29/20 | | | 6,420,000 | | | | 6,259,500 | |
3.875%, 2/24/20 | | | 3,120,000 | EUR | | | 3,351,886 | |
| | | | | | | | |
| | | | | | | 34,405,806 | |
| | | | | | | | |
Indonesia 8.5% | | | | | | | | |
Government of Indonesia, | | | | | | | | |
FR20, 14.275%, 12/15/13 | | | 14,267,000,000 | IDR | | | 1,919,225 | |
FR31, 11.00%, 11/15/20 | | | 167,351,000,000 | IDR | | | 22,934,919 | |
FR34, 12.80%, 6/15/21 | | | 207,810,000,000 | IDR | | | 31,480,160 | |
FR35, 12.90%, 6/15/22 | | | 66,582,000,000 | IDR | | | 10,022,076 | |
FR36, 11.50%, 9/15/19 | | | 30,075,000,000 | IDR | | | 4,178,151 | |
FR37, 12.00%, 9/15/26 | | | 8,230,000,000 | IDR | | | 1,148,449 | |
FR39, 11.75%, 8/15/23 | | | 5,491,000,000 | IDR | | | 761,931 | |
FR40, 11.00%, 9/15/25 | | | 61,856,000,000 | IDR | | | 8,111,047 | |
FR42, 10.25%, 7/15/27 | | | 88,574,000,000 | IDR | | | 10,821,139 | |
FR43, 10.25%, 7/15/22 | | | 68,340,000,000 | IDR | | | 8,711,320 | |
FR44, 10.00%, 9/15/24 | | | 4,454,000,000 | IDR | | | 544,615 | |
FR46, 9.50%, 7/15/23 | | | 226,780,000,000 | IDR | | | 27,186,636 | |
TGB-14
Franklin Templeton Variable Insurance Products Trust
Statement of Investments, December 31, 2010 (continued)
| | | | | | | | |
| Templeton Global Bond Securities Fund | | Principal
Amount* | | | Value | |
Foreign Government and Agency Securities (continued) | | | | | | | | |
Indonesia (continued) | | | | | | | | |
FR47, 10.00%, 2/15/28 | | | 61,737,000,000 | IDR | | $ | 7,353,068 | |
FR48, 9.00%, 9/15/18 | | | 16,920,000,000 | IDR | | | 2,044,667 | |
FR49, 9.00%, 9/15/13 | | | 35,030,000,000 | IDR | | | 4,146,284 | |
csenior bond, 144A, 8.50%, 10/12/35 | | | 9,119,000 | | | | 12,103,573 | |
csenior bond, 144A, 6.625%, 2/17/37 | | | 2,240,000 | | | | 2,458,867 | |
csenior bond, 144A, 7.75%, 1/17/38 | | | 10,980,000 | | | | 13,439,063 | |
csenior note, 144A, 11.625%, 3/04/19 | | | 6,410,000 | | | | 9,525,527 | |
| | | | | | | | |
| | | | | | | 178,890,717 | |
| | | | | | | | |
Iraq 0.4% | | | | | | | | |
Government of Iraq, | | | | | | | | |
c144A, 5.80%, 1/15/28 | | | 5,055,000 | | | | 4,643,018 | |
fReg S, 5.80%, 1/15/28 | | | 3,440,000 | | | | 3,159,640 | |
| | | | | | | | |
| | | | | | | 7,802,658 | |
| | | | | | | | |
Israel 1.4% | | | | | | | | |
Government of Israel, 2680, 7.00%, 4/29/11 | | | 99,205,000 | ILS | | | 28,560,181 | |
| | | | | | | | |
Lithuania 1.7% | | | | | | | | |
cGovernment of Lithuania, 144A, | | | | | | | | |
6.75%, 1/15/15 | | | 19,480,000 | | | | 21,160,150 | |
7.375%, 2/11/20 | | | 12,690,000 | | | | 14,070,037 | |
| | | | | | | | |
| | | | | | | 35,230,187 | |
| | | | | | | | |
Malaysia 2.9% | | | | | | | | |
Government of Malaysia, senior bond, | | | | | | | | |
3.756%, 4/28/11 | | | 106,980,000 | MYR | | | 34,841,618 | |
3.833%, 9/28/11 | | | 3,860,000 | MYR | | | 1,262,416 | |
3.461%, 7/31/13 | | | 12,600,000 | MYR | | | 4,119,757 | |
3.814%, 2/15/17 | | | 18,885,000 | MYR | | | 6,201,587 | |
4.24%, 2/07/18 | | | 44,360,000 | MYR | | | 14,810,672 | |
0309, 2.711%, 2/14/12 | | | 20,000 | MYR | | | 6,477 | |
| | | | | | | | |
| | | | | | | 61,242,527 | |
| | | | | | | | |
Mexico 7.7% | | | | | | | | |
Government of Mexico, | | | | | | | | |
M, 9.00%, 6/20/13 | | | 385,600 | g MXN | | | 3,388,218 | |
M10, 8.00%, 12/17/15 | | | 726,000 | g MXN | | | 6,291,031 | |
M10, 7.25%, 12/15/16 | | | 250,000 | g MXN | | | 2,106,316 | |
M10, 7.75%, 12/14/17 | | | 4,473,000 | g MXN | | | 38,575,253 | |
M20, 10.00%, 12/05/24 | | | 8,569,800 | g MXN | | | 86,752,235 | |
M30, 10.00%, 11/20/36 | | | 1,440,600 | g MXN | | | 14,501,316 | |
MI10, 9.00%, 12/20/12 | | | 265,000 | g MXN | | | 2,302,017 | |
MI10, 8.00%, 12/19/13 | | | 794,500 | g MXN | | | 6,845,781 | |
| | | | | | | | |
| | | | | | | 160,762,167 | |
| | | | | | | | |
Norway 2.9% | | | | | | | | |
Government of Norway, | | | | | | | | |
6.00%, 5/16/11 | | | 300,110,000 | NOK | | | 52,243,241 | |
6.50%, 5/15/13 | | | 49,400,000 | NOK | | | 9,268,969 | |
| | | | | | | | |
| | | | | | | 61,512,210 | |
| | | | | | | | |
Peru 0.2% | | | | | | | | |
Government of Peru, 7.84%, 8/12/20 | | | 11,090,000 | PEN | | | 4,509,900 | |
| | | | | | | | |
TGB-15
Franklin Templeton Variable Insurance Products Trust
Statement of Investments, December 31, 2010 (continued)
| | | | | | | | |
| Templeton Global Bond Securities Fund | | Principal
Amount* | | | Value | |
Foreign Government and Agency Securities (continued) | | | | | | | | |
Philippines 0.2% | | | | | | | | |
Government of Philippine, senior bond, | | | | | | | | |
5.75%, 2/21/12 | | | 105,070,000 | PHP | | $ | 2,474,930 | |
8.75%, 3/03/13 | | | 64,160,000 | PHP | | | 1,598,896 | |
| | | | | | | | |
| | | | | | | 4,073,826 | |
| | | | | | | | |
Poland 5.9% | | | | | | | | |
Government of Poland, | | | | | | | | |
4.75%, 4/25/12 | | | 44,940,000 | PLN | | | 15,232,099 | |
5.75%, 4/25/14 | | | 92,590,000 | PLN | | | 31,868,572 | |
6.25%, 10/24/15 | | | 44,730,000 | PLN | | | 15,640,761 | |
5.75%, 9/23/22 | | | 48,750,000 | PLN | | | 15,998,694 | |
senior note, 6.375%, 7/15/19 | | | 27,200,000 | | | | 30,546,797 | |
Strip, 10/25/12 | | | 24,085,000 | PLN | | | 7,474,622 | |
Strip, 1/25/13 | | | 22,655,000 | PLN | | | 6,945,305 | |
| | | | | | | | |
| | | | | | | 123,706,850 | |
| | | | | | | | |
Qatar 0.7% | | | | | | | | |
cGovernment of Qatar, senior note, 144A, 6.55%, 4/09/19 | | | 12,060,000 | | | | 13,943,772 | |
| | | | | | | | |
Russia 3.5% | | | | | | | | |
cGovernment of Russia, 144A, 7.50%, 3/31/30 | | | 63,399,115 | | | | 73,229,148 | |
| | | | | | | | |
South Africa 1.8% | | | | | | | | |
Government of South Africa, | | | | | | | | |
5.25%, 5/16/13 | | | 3,590,000 | EUR | | | 5,072,058 | |
4.50%, 4/05/16 | | | 1,874,000 | EUR | | | 2,600,202 | |
6.875%, 5/27/19 | | | 21,215,000 | | | | 24,810,942 | |
senior note, 6.50%, 6/02/14 | | | 805,000 | | | | 910,391 | |
senior note, 5.875%, 5/30/22 | | | 3,485,000 | | | | 3,753,689 | |
| | | | | | | | |
| | | | | | | 37,147,282 | |
| | | | | | | | |
South Korea 13.6% | | | | | | | | |
The Export-Import Bank of Korea, 4.625%, 2/20/17 | | | 230,000 | EUR | | | 312,267 | |
Korea Deposit Insurance Corp., | | | | | | | | |
07-1, 5.57%, 9/14/12 | | | 6,600,000,000 | KRW | | | 6,087,908 | |
08-1, 5.28%, 2/15/13 | | | 880,000,000 | KRW | | | 811,581 | |
Korea Treasury Bond, | | | | | | | | |
4.75%, 12/10/11 | | | 77,103,490,000 | KRW | | | 70,004,186 | |
5.25%, 9/10/12 | | | 28,539,000,000 | KRW | | | 26,278,988 | |
4.25%, 12/10/12 | | | 2,473,000,000 | KRW | | | 2,242,513 | |
5.25%, 3/10/13 | | | 6,483,790,000 | KRW | | | 5,992,218 | |
5.00%, 9/10/16 | | | 2,806,000,000 | KRW | | | 2,599,992 | |
senior bond, 5.50%, 6/10/11 | | | 19,791,570,000 | KRW | | | 17,867,651 | |
senior bond, 4.00%, 6/10/12 | | | 126,527,650,000 | KRW | | | 114,099,181 | |
senior bond, 3.75%, 6/10/13 | | | 42,675,000,000 | KRW | | | 38,358,735 | |
| | | | | | | | |
| | | | | | | 284,655,220 | |
| | | | | | | | |
Sri Lanka 1.7% | | | | | | | | |
Government of Sri Lanka, | | | | | | | | |
A, 12.00%, 7/15/11 | | | 115,200,000 | LKR | | | 1,063,720 | |
A, 6.90%, 8/01/12 | | | 14,600,000 | LKR | | | 130,098 | |
A, 8.50%, 1/15/13 | | | 694,400,000 | LKR | | | 6,332,184 | |
A, 13.50%, 2/01/13 | | | 674,300,000 | LKR | | | 6,706,609 | |
A, 7.00%, 3/01/14 | | | 43,380,000 | LKR | | | 371,970 | |
A, 11.25%, 7/15/14 | | | 773,000,000 | LKR | | | 7,428,931 | |
A, 6.50%, 7/15/15 | | | 18,610,000 | LKR | | | 150,926 | |
TGB-16
Franklin Templeton Variable Insurance Products Trust
Statement of Investments, December 31, 2010 (continued)
| | | | | | | | |
| Templeton Global Bond Securities Fund | | Principal
Amount* | | | Value | |
Foreign Government and Agency Securities (continued) | | | | | | | | |
Sri Lanka (continued) | | | | | | | | |
A, 11.00%, 8/01/15 | | | 1,349,700,000 | LKR | | $ | 12,924,231 | |
B, 6.60%, 6/01/14 | | | 56,800,000 | LKR | | | 478,868 | |
| | | | | | | | |
| | | | | | | 35,587,537 | |
| | | | | | | | |
hSupranational 1.6% | | | | | | | | |
Corporacion Andina De Fomento, 8.125%, 6/04/19 | | | 9,880,000 | | | | 11,835,549 | |
European Investment Bank, senior note, 4.50%, 5/15/13 | | | 33,700,000 | NOK | | | 5,995,783 | |
Inter-American Development Bank, senior note, 7.50%, 12/05/24 | | | 200,000,000 | MXN | | | 16,232,651 | |
| | | | | | | | |
| | | | | | | 34,063,983 | |
| | | | | | | | |
Sweden 5.1% | | | | | | | | |
Government of Sweden, 5.25%, 3/15/11 | | | 712,870,000 | SEK | | | 107,028,194 | |
| | | | | | | | |
United Arab Emirates 0.7% | | | | | | | | |
cEmirate of Abu Dhabi, 144A, 6.75%, 4/08/19 | | | 11,840,000 | | | | 13,781,144 | |
| | | | | | | | |
Venezuela 1.4% | | | | | | | | |
Government of Venezuela, | | | | | | | | |
10.75%, 9/19/13 | | | 13,570,000 | | | | 13,038,734 | |
a,fReg S, FRN, 1.288%, 4/20/11 | | | 4,695,000 | | | | 4,636,313 | |
Petroleos de Venezuela SA, senior bond, zero cpn., 7/10/11 | | | 12,205,000 | | | | 11,644,498 | |
| | | | | | | | |
| | | | | | | 29,319,545 | |
| | | | | | | | |
Vietnam 0.6% | | | | | | | | |
cGovernment of Vietnam, 144A, 6.75%, 1/29/20 | | | 13,110,000 | | | | 13,355,812 | |
| | | | | | | | |
Total Foreign Government and Agency Securities (Cost $1,465,208,774) | | | | | | | 1,657,735,605 | |
| | | | | | | | |
Municipal Bonds 1.6% | | | | | | | | |
United States 1.6% | | | | | | | | |
Alabama State University Revenue, General Tuition and Fee, Assured Guaranty, 5.00%, 9/01/29 | | | 175,000 | | | | 177,074 | |
Bay Area Toll Authority Toll Bridge Revenue, Build America Bonds, Series S1, 6.793%, 4/01/30 | | | 3,460,000 | | | | 3,473,286 | |
Bexar County Revenue, Venue Project, Refunding, Series A, BHAC Insured, 5.25%, 8/15/47 | | | 1,450,000 | | | | 1,489,252 | |
California State GO, | | | | | | | | |
7.625%, 3/01/40 | | | 1,320,000 | | | | 1,378,621 | |
Refunding, 5.125%, 4/01/33 | | | 4,725,000 | | | | 4,352,717 | |
Refunding, 5.00%, 4/01/38 | | | 1,985,000 | | | | 1,783,701 | |
Various Purpose, 6.00%, 4/01/38 | | | 11,650,000 | | | | 11,883,699 | |
Illinois Municipal Electricity Agency Power Supply Revenue, Series A, BHAC Insured, 5.00%, 2/01/35 | | | 2,155,000 | | | | 2,087,484 | |
Los Angeles Community College District GO, 2008 Election, Series D, 6.68%, 8/01/36 | | | 1,700,000 | | | | 1,651,278 | |
Los Angeles USD, GO, Series KRY, 5.25%, 7/01/26 | | | 765,000 | | | | 784,538 | |
North Carolina Eastern Municipal Power Agency Power System Revenue, Refunding, Series A, Assured Guaranty,
5.25%, 1/01/19 | | | 2,400,000 | | | | 2,658,384 | |
Philadelphia GO, Refunding, Series A, Assured Guaranty,
5.00%, 8/01/24 | | | 500,000 | | | | 506,940 | |
Tarrant County Cultural Education Facilities Finance Corp. Revenue, Christus Health, Refunding, Series A, Assured Guaranty, 6.25%, 7/01/28 | | | 1,500,000 | | | | 1,600,875 | |
| | | | | | | | |
Total Municipal Bonds (Cost $33,800,373) | | | | | | | 33,827,849 | |
| | | | | | | | |
Total Investments before Short Term Investments (Cost $1,499,009,147) | | | | | | | 1,691,563,454 | |
| | | | | | | | |
Short Term Investments 16.8% | | | | | | | | |
Foreign Government and Agency Securities 7.1% | | | | | | | | |
Egypt 4.4% | | | | | | | | |
iEgypt Treasury Bills, 2/08/11 - 12/06/11 | | | 572,225,000 | EGP | | | 94,844,908 | |
| | | | | | | | |
Israel 1.5% | | | | | | | | |
iIsrael Treasury Bills, 6/01/11 - 10/05/11 | | | 116,818,900 | ILS | | | 32,682,811 | |
| | | | | | | | |
TGB-17
Franklin Templeton Variable Insurance Products Trust
Statement of Investments, December 31, 2010 (continued)
| | | | | | | | |
| Templeton Global Bond Securities Fund | | Principal
Amount* | | | Value | |
Short Term Investments (continued) | | | | | | | | |
Foreign Government and Agency Securities (continued) | | | | | | | | |
Malaysia 1.1% | | | | | | | | |
iBank of Negara Monetary Note, 1/06/11 - 10/13/11 | | | 8,270,000 | MYR | | $ | 2,630,757 | |
iMalaysia Treasury Bills, 4/05/11 - 12/15/11 | | | 62,895,000 | MYR | | | 19,903,901 | |
| | | | | | | | |
| | | | | | | 22,534,658 | |
| | | | | | | | |
Philippines 0.1% | | | | | | | | |
iPhilippine Treasury Bills, 11/16/11 - 11/29/11 | | | 55,180,000 | PHP | | | 1,241,894 | |
| | | | | | | | |
Sri Lanka 0.0%† | | | | | | | | |
iSri Lanka Treasury Bills, 7/08/11 - 9/16/11 | | | 53,690,000 | LKR | | | 464,901 | |
| | | | | | | | |
Total Foreign Government and Agency Securities (Cost $152,410,548) | | | | | | | 151,769,172 | |
| | | | | | | | |
Total Investments before Repurchase Agreements (Cost $1,651,419,695) | | | | | | | 1,843,332,626 | |
| | | | | | | | |
Repurchase Agreements (Cost $202,257,044) 9.7% | | | | | | | | |
jJoint Repurchase Agreement, 0.141%, 1/03/11 (Maturity Value $202,259,426) | | | 202,257,044 | | | | 202,257,044 | |
Barclays Capital Inc. (Maturity Value $34,823,006) | | | | | | | | |
BNP Paribas Securities Corp. (Maturity Value $35,816,100) | | | | | | | | |
Credit Suisse Securities (USA) LLC (Maturity Value $19,898,282) | | | | | | | | |
Deutsche Bank Securities Inc. (Maturity Value $32,126,887) | | | | | | | | |
HSBC Securities (USA) Inc. (Maturity Value $24,873,864) | | | | | | | | |
Merrill Lynch, Pierce, Fenner & Smith Inc. (Maturity Value $19,898,282) | | | | | | | | |
Morgan Stanley & Co. Inc. (Maturity Value $24,873,864) | | | | | | | | |
UBS Securities LLC (Maturity Value $9,949,141) | | | | | | | | |
Collateralized by U.S. Government Agency Securities, 0.50% - 5.75%, 1/07/11 - 10/26/15; iU.S. Treasury Bills, 5/12/11 - 7/28/11; and U.S. Treasury Notes, 0.375% - 1.875%, 9/30/11 - 9/30/17 (valued at $206,630,501) | | | | | | | | |
| | | | | | | | |
Total Investments (Cost $1,853,676,739) 97.5% | | | | | | | 2,045,589,670 | |
Other Assets, less Liabilities 2.5% | | | | | | | 51,707,831 | |
| | | | | | | | |
Net Assets 100.0% | | | | | | $ | 2,097,297,501 | |
| | | | | | | | |
*The principal amount is stated in U.S. dollars unless otherwise indicated.
†Rounds to less than 0.1% of net assets.
aThe coupon rate shown represents the rate at period end.
bThe principal amount is stated in original face, and scheduled paydowns are reflected in the market price on ex-date.
cSecurity was purchased pursuant to Rule 144A under the Securities Act of 1933 and may be sold in transactions exempt from registration only to qualified institutional buyers or in a public offering registered under the Securities Act of 1933. These securities have been deemed liquid under guidelines approved by the Trust’s Board of Trustees. At December 31, 2010, the aggregate value of these securities was $195,358,376, representing 9.31% of net assets.
dPrincipal amount is stated in 1,000 Brazilian Real Units.
eRedemption price at maturity is adjusted for inflation. See Note 1(f).
fSecurity was purchased pursuant to Regulation S under the Securities Act of 1933, which exempts from registration securities offered and sold outside of the United States. Such a security cannot be sold in the United States without either an effective registration statement filed pursuant to the Securities Act of 1933, or pursuant to an exemption from registration. These securities have been deemed liquid under guidelines approved by the Trust’s Board of Trustees. At December 31, 2010, the aggregate value of these securities was $7,795,953, representing 0.37% of net assets.
gPrincipal amount is stated in 100 Mexican Peso Units.
hA supranational organization is an entity formed by two or more central governments through international treaties.
iThe security is traded on a discount basis with no stated coupon rate.
jSee Note 1(c) regarding joint repurchase agreement.
TGB-18
Franklin Templeton Variable Insurance Products Trust
Statement of Investments, December 31, 2010 (continued)
| | | | | | |
| Templeton Global Bond Securities Fund | | | | | | |
At December 31, 2010, the Fund had the following financial futures contracts outstanding. See Note 1(d).
| | | | | | | | | | | | | | | | | | | | | | | | |
| Description | | Type | | | Number of
Contracts | | | Notional
Value | | | Expiration
Date | | | Unrealized
Appreciation | | | Unrealized
Depreciation | |
U.S. Treasury 10 Yr. Note | | | Short | | | | 1 | | | $ | 120,438 | | | | 3/22/11 | | | $ | 3,052 | | | $ | — | |
At December 31, 2010, the Fund had the following forward exchange contracts outstanding. See Note 1(d).
| | | | | | | | | | | | | | | | | | | | | | | | | | | | | | | | |
| Currency | | Counterparty | | | Type | | | Quantity | | | Contract
Amount* | | | | | | Settlement
Date | | | Unrealized
Appreciation | | | Unrealized
Depreciation | |
Malaysian Ringgit | | | JPHQ | | | | Buy | | | | 56,089,316 | | | | 16,324,490 | | | | | | | | 1/04/11 | | | $ | 1,860,230 | | | $ | — | |
Swedish Krona | | | DBAB | | | | Buy | | | | 136,332,733 | | | | 13,223,991 | | | | EUR | | | | 1/04/11 | | | | 2,615,117 | | | | — | |
Japanese Yen | | | BZWS | | | | Sell | | | | 277,330,000 | | | | 3,043,819 | | | | | | | | 1/07/11 | | | | — | | | | (372,903 | ) |
Japanese Yen | | | CITI | | | | Sell | | | | 138,680,000 | | | | 1,521,916 | | | | | | | | 1/07/11 | | | | — | | | | (186,631 | ) |
Japanese Yen | | | UBSW | | | | Sell | | | | 138,650,000 | | | | 1,521,870 | | | | | | | | 1/07/11 | | | | — | | | | (186,306 | ) |
Malaysian Ringgit | | | DBAB | | | | Buy | | | | 11,434,805 | | | | 3,372,104 | | | | | | | | 1/07/11 | | | | 334,346 | | | | — | |
New Israeli Shekel | | | DBAB | | | | Buy | | | | 117,806,600 | | | | 31,561,539 | | | | | | | | 1/07/11 | | | | 1,859,279 | | | | — | |
Euro | | | CITI | | | | Sell | | | | 2,240,000 | | | | 3,221,568 | | | | | | | | 1/10/11 | | | | 225,056 | | | | — | |
Euro | | | BZWS | | | | Sell | | | | 1,726,000 | | | | 2,481,298 | | | | | | | | 1/10/11 | | | | 172,378 | | | | — | |
Euro | | | BOFA | | | | Sell | | | | 2,800,000 | | | | 4,001,200 | | | | | | | | 1/11/11 | | | | 255,567 | | | | — | |
Euro | | | DBAB | | | | Sell | | | | 9,460,000 | | | | 13,521,273 | | | | | | | | 1/11/11 | | | | 866,382 | | | | — | |
Euro | | | UBSW | | | | Sell | | | | 13,846,000 | | | | 19,797,703 | | | | | | | | 1/11/11 | | | | 1,275,546 | | | | — | |
Japanese Yen | | | HSBC | | | | Sell | | | | 139,250,000 | | | | 1,521,858 | | | | | | | | 1/11/11 | | | | — | | | | (193,790 | ) |
Japanese Yen | | | DBAB | | | | Sell | | | | 139,110,000 | | | | 1,521,941 | | | | | | | | 1/11/11 | | | | — | | | | (191,982 | ) |
Euro | | | JPHQ | | | | Sell | | | | 937,000 | | | | 1,356,331 | | | | | | | | 1/13/11 | | | | 102,886 | | | | — | |
Japanese Yen | | | HSBC | | | | Sell | | | | 397,130,000 | | | | 4,329,997 | | | | | | | | 1/13/11 | | | | — | | | | (563,009 | ) |
Philippine Peso | | | JPHQ | | | | Buy | | | | 374,905,000 | | | | 8,061,299 | | | | | | | | 1/13/11 | | | | 529,854 | | | | — | |
Japanese Yen | | | BZWS | | | | Sell | | | | 394,150,000 | | | | 4,330,058 | | | | | | | | 1/14/11 | | | | — | | | | (526,289 | ) |
Japanese Yen | | | UBSW | | | | Sell | | | | 313,510,000 | | | | 3,463,992 | | | | | | | | 1/14/11 | | | | — | | | | (398,784 | ) |
Philippine Peso | | | HSBC | | | | Buy | | | | 60,160,000 | | | | 1,286,295 | | | | | | | | 1/14/11 | | | | 92,320 | | | | — | |
Euro | | | DBAB | | | | Sell | | | | 4,856,000 | | | | 7,024,544 | | | | | | | | 1/18/11 | | | | 528,619 | | | | — | |
Philippine Peso | | | DBAB | | | | Buy | | | | 66,125,000 | | | | 1,420,516 | | | | | | | | 1/18/11 | | | | 94,862 | | | | — | |
Philippine Peso | | | HSBC | | | | Buy | | | | 115,942,000 | | | | 2,483,709 | | | | | | | | 1/18/11 | | | | 173,318 | | | | — | |
Philippine Peso | | | JPHQ | | | | Buy | | | | 165,119,000 | | | | 3,542,946 | | | | | | | | 1/19/11 | | | | 241,106 | | | | — | |
Philippine Peso | | | DBAB | | | | Buy | | | | 41,372,000 | | | | 885,341 | | | | | | | | 1/19/11 | | | | 62,786 | | | | — | |
Brazilian Real | | | DBAB | | | | Buy | | | | 12,752,000 | | | | 580,709,502 | | | | JPY | | | | 1/26/11 | | | | 482,187 | | | | — | |
Japanese Yen | | | BZWS | | | | Sell | | | | 1,079,470,000 | | | | 12,019,178 | | | | | | | | 1/26/11 | | | | — | | | | (1,282,887) | |
Japanese Yen | | | UBSW | | | | Sell | | | | 944,420,000 | | | | 10,516,692 | | | | | | | | 1/26/11 | | | | — | | | | (1,121,182 | ) |
Japanese Yen | | | DBAB | | | | Sell | | | | 269,140,000 | | | | 3,004,801 | | | | | | | | 1/26/11 | | | | — | | | | (311,751 | ) |
Philippine Peso | | | HSBC | | | | Buy | | | | 154,149,000 | | | | 3,536,988 | | | | | | | | 1/26/11 | | | | — | | | | (4,053 | ) |
Brazilian Real | | | HSBC | | | | Buy | | | | 4,760,000 | | | | 217,473,737 | | | | JPY | | | | 1/27/11 | | | | 170,560 | | | | — | |
Chilean Peso | | | DBAB | | | | Buy | | | | 2,227,910,000 | | | | 4,431,888 | | | | | | | | 1/27/11 | | | | 318,099 | | | | — | |
Euro | | | CITI | | | | Sell | | | | 4,998,400 | | | | 7,056,491 | | | | | | | | 1/27/11 | | | | 370,174 | | | | — | |
Japanese Yen | | | HSBC | | | | Sell | | | | 928,300,000 | | | | 10,335,920 | | | | | | | | 1/27/11 | | | | — | | | | (1,103,443 | ) |
Chilean Peso | | | DBAB | | | | Buy | | | | 5,127,860,000 | | | | 10,123,107 | | | | | | | | 1/28/11 | | | | 808,787 | | | | — | |
Chilean Peso | | | JPHQ | | | | Buy | | | | 675,370,000 | | | | 1,327,509 | | | | | | | | 1/28/11 | | | | 112,288 | | | | — | |
New Zealand Dollar | | | BZWS | | | | Sell | | | | 12,970,535 | | | | 8,910,757 | | | | | | | | 1/28/11 | | | | — | | | | (1,165,485 | ) |
New Zealand Dollar | | | DBAB | | | | Sell | | | | 9,712,629 | | | | 6,684,717 | | | | | | | | 1/28/11 | | | | — | | | | (860,601 | ) |
New Zealand Dollar | | | UBSW | | | | Sell | | | | 7,565,376 | | | | 5,173,734 | | | | | | | | 1/28/11 | | | | — | | | | (703,477 | ) |
Chilean Peso | | | DBAB | | | | Buy | | | | 3,093,470,000 | | | | 5,966,966 | | | | | | | | 1/31/11 | | | | 626,271 | | | | — | |
Euro | | | UBSW | | | | Sell | | | | 5,540,000 | | | | 7,757,662 | | | | | | | | 1/31/11 | | | | 346,920 | | | | — | |
Euro | | | DBAB | | | | Sell | | | | 31,205,000 | | | | 43,732,247 | | | | | | | | 1/31/11 | | | | 1,989,971 | | | | — | |
Chinese Yuan | | | DBAB | | | | Buy | | | | 102,053,000 | | | | 15,368,270 | | | | | | | | 2/01/11 | | | | 70,983 | | | | — | |
Philippine Peso | | | HSBC | | | | Buy | | | | 55,600,000 | | | | 1,161,722 | | | | | | | | 2/03/11 | | | | 112,572 | | | | — | |
Philippine Peso | | | DBAB | | | | Buy | | | | 155,800,000 | | | | 3,253,968 | | | | | | | | 2/03/11 | | | | 316,805 | | | | — | |
TGB-19
Franklin Templeton Variable Insurance Products Trust
Statement of Investments, December 31, 2010 (continued)
| | | | | | |
| Templeton Global Bond Securities Fund | | | | | | |
| | | | | | | | | | | | | | | | | | | | | | | | | | | | | | | | |
| Currency | | Counterparty | | | Type | | | Quantity | | | Contract
Amount* | | | | | | Settlement
Date | | | Unrealized
Appreciation | | | Unrealized
Depreciation | |
Indian Rupee | | | JPHQ | | | | Buy | | | | 21,500,000 | | | | 455,412 | | | | | | | | 2/04/11 | | | $ | 22,366 | | | $ | — | |
New Zealand Dollar | | | DBAB | | | | Sell | | | | 12,744,985 | | | | 8,740,511 | | | | | | | | 2/04/11 | | | | — | | | | (1,155,071 | ) |
Philippine Peso | | | HSBC | | | | Buy | | | | 43,900,000 | | | | 923,278 | | | | | | | | 2/04/11 | | | | 82,853 | | | | — | |
Philippine Peso | | | BOFA | | | | Buy | | | | 43,900,000 | | | | 924,211 | | | | | | | | 2/04/11 | | | | 81,920 | | | | — | |
Philippine Peso | | | BOFA | | | | Buy | | | | 55,000,000 | | | | 1,161,563 | | | | | | | | 2/07/11 | | | | 98,922 | | | | — | |
Philippine Peso | | | JPHQ | | | | Buy | | | | 60,500,000 | | | | 1,279,070 | | | | | | | | 2/07/11 | | | | 107,464 | | | | — | |
Australian Dollar | | | MSCO | | | | Buy | | | | 10,560,886 | | | | 8,795,000 | | | | | | | | 2/08/11 | | | | 1,940,193 | | | | — | |
Australian Dollar | | | UBSW | | | | Buy | | | | 10,557,970 | | | | 8,795,000 | | | | | | | | 2/08/11 | | | | 1,937,229 | | | | — | |
Euro | | | UBSW | | | | Sell | | | | 4,929,000 | | | | 6,766,778 | | | | | | | | 2/08/11 | | | | 173,594 | | | | — | |
Euro | | | CITI | | | | Sell | | | | 6,572,000 | | | | 9,019,051 | | | | | | | | 2/08/11 | | | | 228,140 | | | | — | |
Euro | | | HSBC | | | | Sell | | | | 1,200,000 | | | | 1,641,060 | | | | | | | | 2/08/11 | | | | 35,903 | | | | — | |
Euro | | | JPHQ | | | | Sell | | | | 300,000 | | | | 410,190 | | | | | | | | 2/08/11 | | | | 8,901 | | | | — | |
Norwegian Krone | | | UBSW | | | | Buy | | | | 72,121,400 | | | | 8,654,603 | | | | EUR | | | | 2/08/11 | | | | 785,654 | | | | — | |
Australian Dollar | | | BZWS | | | | Buy | | | | 3,351,000 | | | | 247,404,330 | | | | JPY | | | | 2/09/11 | | | | 356,762 | | | | — | |
Australian Dollar | | | CITI | | | | Buy | | | | 3,351,000 | | | | 248,017,563 | | | | JPY | | | | 2/09/11 | | | | 349,204 | | | | — | |
Australian Dollar | | | DBAB | | | | Buy | | | | 3,351,000 | | | | 248,523,564 | | | | JPY | | | | 2/09/11 | | | | 342,968 | | | | — | |
Euro | | | HSBC | | | | Sell | | | | 600,000 | | | | 820,560 | | | | | | | | 2/09/11 | | | | 17,985 | | | | — | |
Euro | | | BZWS | | | | Sell | | | | 800,000 | | | | 1,091,740 | | | | | | | | 2/09/11 | | | | 21,640 | | | | — | |
Norwegian Krone | | | UBSW | | | | Buy | | | | 100,802,700 | | | | 12,116,437 | | | | EUR | | | | 2/09/11 | | | | 1,070,497 | | | | — | |
Norwegian Krone | | | DBAB | | | | Buy | | | | 144,025,000 | | | | 17,309,241 | | | | EUR | | | | 2/09/11 | | | | 1,532,846 | | | | — | |
Poland Zloty | | | DBAB | | | | Buy | | | | 17,528,000 | | | | 4,206,888 | | | | EUR | | | | 2/09/11 | | | | 269,243 | | | | — | |
South Korean Won | | | HSBC | | | | Buy | | | | 21,363,430,000 | | | | 18,100,000 | | | | | | | | 2/09/11 | | | | 910,275 | | | | — | |
Chilean Peso | | | MLCO | | | | Buy | | | | 1,145,000,000 | | | | 2,131,224 | | | | | | | | 2/10/11 | | | | 307,169 | | | | — | |
Chilean Peso | | | DBAB | | | | Buy | | | | 1,145,000,000 | | | | 2,131,224 | | | | | | | | 2/10/11 | | | | 307,169 | | | | — | |
Euro | | | BZWS | | | | Sell | | | | 612,000 | | | | 836,298 | | | | | | | | 2/10/11 | | | | 17,675 | | | | — | |
Euro | | | DBAB | | | | Sell | | | | 180,000 | | | | 246,114 | | | | | | | | 2/10/11 | | | | 5,343 | | | | — | |
Japanese Yen | | | MSCO | | | | Sell | | | | 394,373,000 | | | | 4,433,015 | | | | | | | | 2/10/11 | | | | — | | | | (427,498 | ) |
Poland Zloty | | | BZWS | | | | Buy | | | | 17,528,000 | | | | 4,183,493 | | | | EUR | | | | 2/10/11 | | | | 300,205 | | | | — | |
South Korean Won | | | HSBC | | | | Buy | | | | 5,578,000,000 | | | | 419,650,917 | | | | JPY | | | | 2/10/11 | | | | — | | | | (208,678 | ) |
Chilean Peso | | | DBAB | | | | Buy | | | | 1,058,220,000 | | | | 1,975,766 | | | | | | | | 2/11/11 | | | | 277,636 | | | | — | |
Chilean Peso | | | BZWS | | | | Buy | | | | 1,142,900,000 | | | | 2,131,183 | | | | | | | | 2/11/11 | | | | 302,539 | | | | — | |
Euro | | | UBSW | | | | Sell | | | | 657,000 | | | | 903,454 | | | | | | | | 2/11/11 | | | | 24,642 | | | | — | |
Chilean Peso | | | DBAB | | | | Buy | | | | 1,130,600,000 | | | | 2,131,197 | | | | | | | | 2/14/11 | | | | 275,743 | | | | — | |
Malaysian Ringgit | | | DBAB | | | | Buy | | | | 97,443,480 | | | | 28,224,035 | | | | | | | | 2/14/11 | | | | 3,281,504 | | | | — | |
New Zealand Dollar | | | HSBC | | | | Sell | | | | 2,945,715 | | | | 1,982,172 | | | | | | | | 2/14/11 | | | | — | | | | (303,229 | ) |
Poland Zloty | | | DBAB | | | | Buy | | | | 17,528,000 | | | | 4,220,462 | | | | EUR | | | | 2/14/11 | | | | 249,431 | | | | — | |
South Korean Won | | | JPHQ | | | | Buy | | | | 1,913,000,000 | | | | 144,924,242 | | | | JPY | | | | 2/14/11 | | | | — | | | | (84,292 | ) |
South Korean Won | | | DBAB | | | | Buy | | | | 1,658,000,000 | | | | 125,968,697 | | | | JPY | | | | 2/14/11 | | | | — | | | | (77,525 | ) |
South Korean Won | | | HSBC | | | | Buy | | | | 16,244,000,000 | | | | 13,918,259 | | | | | | | | 2/14/11 | | | | 533,377 | | | | — | |
Chilean Peso | | | MSCO | | | | Buy | | | | 2,254,600,000 | | | | 4,262,407 | | | | | | | | 2/16/11 | | | | 536,640 | | | | — | |
Euro | | | JPHQ | | | | Sell | | | | 1,971,000 | | | | 2,681,743 | | | | | | | | 2/16/11 | | | | 45,366 | | | | — | |
Euro | | | UBSW | | | | Sell | | | | 1,971,000 | | | | 2,680,363 | | | | | | | | 2/16/11 | | | | 43,987 | | | | — | |
South Korean Won | | | JPHQ | | | | Buy | | | | 1,116,000,000 | | | | 85,432,136 | | | | JPY | | | | 2/16/11 | | | | — | | | | (60,208 | ) |
Malaysian Ringgit | | | HSBC | | | | Buy | | | | 4,899,000 | | | | 1,424,045 | | | | | | | | 2/17/11 | | | | 159,649 | | | | — | |
Chilean Peso | | | DBAB | | | | Buy | | | | 526,900,000 | | | | 1,007,457 | | | | | | | | 2/18/11 | | | | 113,897 | | | | — | |
Chilean Peso | | | JPHQ | | | | Buy | | | | 1,055,800,000 | | | | 2,014,886 | | | | | | | | 2/18/11 | | | | 232,079 | | | | — | |
Euro | | | UBSW | | | | Sell | | | | 2,038,000 | | | | 2,799,825 | | | | | | | | 2/18/11 | | | | 73,855 | | | | — | |
Euro | | | DBAB | | | | Sell | | | | 2,038,000 | | | | 2,800,090 | | | | | | | | 2/18/11 | | | | 74,120 | | | | — | |
Chilean Peso | | | MSCO | | | | Buy | | | | 5,517,900,000 | | | | 10,517,860 | | | | | | | | 2/22/11 | | | | 1,221,562 | | | | — | |
Chilean Peso | | | DBAB | | | | Buy | | | | 2,364,060,000 | | | | 4,512,520 | | | | | | | | 2/22/11 | | | | 517,056 | | | | — | |
Chilean Peso | | | JPHQ | | | | Buy | | | | 1,792,000,000 | | | | 3,425,404 | | | | | | | | 2/22/11 | | | | 387,105 | | | | — | |
Japanese Yen | | | JPHQ | | | | Sell | | | | 385,700,000 | | | | 4,286,508 | | | | | | | | 2/22/11 | | | | — | | | | (467,666 | ) |
Japanese Yen | | | HSBC | | | | Sell | | | | 385,460,000 | | | | 4,287,033 | | | | | | | | 2/22/11 | | | | — | | | | (464,183 | ) |
TGB-20
Franklin Templeton Variable Insurance Products Trust
Statement of Investments, December 31, 2010 (continued)
| | | | | | |
| Templeton Global Bond Securities Fund | | | | | | |
| | | | | | | | | | | | | | | | | | | | | | | | | | | | | | | | |
| Currency | | Counterparty | | | Type | | | Quantity | | | Contract
Amount* | | | | | | Settlement
Date | | | Unrealized
Appreciation | | | Unrealized
Depreciation | |
Chilean Peso | | | MLCO | | | | Buy | | | | 1,062,800,000 | | | | 2,014,978 | | | | | | | | 2/23/11 | | | $ | 245,962 | | | $ | — | |
Chilean Peso | | | MSCO | | | | Buy | | | | 1,055,200,000 | | | | 2,014,894 | | | | | | | | 2/24/11 | | | | 229,695 | | | | — | |
Chilean Peso | | | MSCO | | | | Buy | | | | 2,254,540,000 | | | | 4,311,938 | | | | | | | | 2/25/11 | | | | 483,459 | | | | — | |
Chilean Peso | | | CITI | | | | Buy | | | | 2,285,090,000 | | | | 4,356,702 | | | | | | | | 2/25/11 | | | | 503,675 | | | | — | |
Chilean Peso | | | DBAB | | | | Buy | | | | 1,580,100,000 | | | | 3,022,380 | | | | | | | | 2/25/11 | | | | 338,487 | | | | — | |
Chilean Peso | | | JPHQ | | | | Buy | | | | 593,800,000 | | | | 1,128,897 | | | | | | | | 2/28/11 | | | | 133,804 | | | | — | |
Chilean Peso | | | DBAB | | | | Buy | | | | 1,304,870,000 | | | | 2,495,448 | | | | | | | | 2/28/11 | | | | 279,326 | | | | — | |
Chilean Peso | | | MSCO | | | | Buy | | | | 1,559,200,000 | | | | 2,972,736 | | | | | | | | 3/01/11 | | | | 342,595 | | | | — | |
Chilean Peso | | | MLCO | | | | Buy | | | | 576,500,000 | | | | 1,099,561 | | | | | | | | 3/01/11 | | | | 126,252 | | | | — | |
Chilean Peso | | | DBAB | | | | Buy | | | | 2,119,640,000 | | | | 4,052,849 | | | | | | | | 3/01/11 | | | | 454,147 | | | | — | |
Japanese Yen | | | UBSW | | | | Sell | | | | 447,200,000 | | | | 5,027,091 | | | | | | | | 3/01/11 | | | | — | | | | (485,512 | ) |
Japanese Yen | | | JPHQ | | | | Sell | | | | 401,100,000 | | | | 4,489,188 | | | | | | | | 3/01/11 | | | | — | | | | (455,143 | ) |
Japanese Yen | | | HSBC | | | | Sell | | | | 400,800,000 | | | | 4,488,393 | | | | | | | | 3/01/11 | | | | — | | | | (452,241 | ) |
Chilean Peso | | | DBAB | | | | Buy | | | | 388,300,000 | | | | 743,158 | | | | | | | | 3/02/11 | | | | 82,417 | | | | — | |
Chilean Peso | | | DBAB | | | | Buy | | | | 1,328,230,000 | | | | 2,539,637 | | | | | | | | 3/04/11 | | | | 283,876 | | | | — | |
Euro | | | BOFA | | | | Sell | | | | 5,225,000 | | | | 7,149,159 | | | | | | | | 3/07/11 | | | | 160,862 | | | | — | |
Euro | | | UBSW | | | | Sell | | | | 6,915,000 | | | | 9,471,890 | | | | | | | | 3/07/11 | | | | 223,264 | | | | — | |
Euro | | | HSBC | | | | Sell | | | | 1,844,000 | | | | 2,523,311 | | | | | | | | 3/08/11 | | | | 57,021 | | | | — | |
Chilean Peso | | | DBAB | | | | Buy | | | | 2,604,680,000 | | | | 5,160,337 | | | | | | | | 3/10/11 | | | | 373,852 | | | | — | |
Chilean Peso | | | MSCO | | | | Buy | | | | 662,100,000 | | | | 1,278,803 | | | | | | | | 3/15/11 | | | | 127,383 | | | | — | |
Chilean Peso | | | DBAB | | | | Buy | | | | 2,600,220,000 | | | | 5,038,698 | | | | | | | | 3/15/11 | | | | 483,717 | | | | — | |
Japanese Yen | | | CITI | | | | Sell | | | | 407,702,000 | | | | 4,526,593 | | | | | | | | 3/18/11 | | | | — | | | | (500,108 | ) |
Japanese Yen | | | UBSW | | | | Sell | | | | 330,530,000 | | | | 3,675,373 | | | | | | | | 3/18/11 | | | | — | | | | (399,847 | ) |
Japanese Yen | | | MSCO | | | | Sell | | | | 244,700,000 | | | | 2,715,811 | | | | | | | | 3/18/11 | | | | — | | | | (301,181 | ) |
Chilean Peso | | | JPHQ | | | | Buy | | | | 1,065,000,000 | | | | 2,063,554 | | | | | | | | 3/21/11 | | | | 197,193 | | | | — | |
Japanese Yen | | | BOFA | | | | Sell | | | | 242,774,840 | | | | 2,697,948 | | | | | | | | 3/22/11 | | | | — | | | | (295,446 | ) |
New Israeli Shekel | | | MSCO | | | | Buy | | | | 5,783,303 | | | | 1,540,202 | | | | | | | | 3/29/11 | | | | 98,776 | | | | — | |
Chilean Peso | | | DBAB | | | | Buy | | | | 1,252,750,000 | | | | 2,382,560 | | | | | | | | 3/31/11 | | | | 274,527 | | | | — | |
New Israeli Shekel | | | MSCO | | | | Buy | | | | 3,512,807 | | | | 936,948 | | | | | | | | 3/31/11 | | | | 58,548 | | | | — | |
Chilean Peso | | | DBAB | | | | Buy | | | | 1,330,940,000 | | | | 2,535,124 | | | | | | | | 4/04/11 | | | | 286,760 | | | | — | |
Euro | | | DBAB | | | | Sell | | | | 7,243,000 | | | | 9,787,683 | | | | | | | | 4/07/11 | | | | 101,609 | | | | — | |
Euro | | | HSBC | | | | Sell | | | | 8,692,000 | | | | 11,746,630 | | | | | | | | 4/07/11 | | | | 122,805 | | | | — | |
Euro | | | UBSW | | | | Sell | | | | 4,346,000 | | | | 5,871,011 | | | | | | | | 4/07/11 | | | | 59,099 | | | | — | |
Indian Rupee | | | DBAB | | | | Buy | | | | 159,915,000 | | | | 3,523,521 | | | | | | | | 4/11/11 | | | | — | | | | (14,390 | ) |
Indian Rupee | | | DBAB | | | | Buy | | | | 342,913,000 | | | | 7,554,814 | | | | | | | | 4/12/11 | | | | — | | | | (31,355 | ) |
Euro | | | UBSW | | | | Sell | | | | 3,907,000 | | | | 5,263,120 | | | | | | | | 4/13/11 | | | | 38,429 | | | | — | |
Indian Rupee | | | JPHQ | | | | Buy | | | | 230,330,000 | | | | 5,089,041 | | | | | | | | 4/13/11 | | | | — | | | | (36,529 | ) |
Euro | | | HSBC | | | | Sell | | | | 6,919,000 | | | | 9,445,404 | | | | | | | | 4/14/11 | | | | 192,916 | | | | — | |
Indian Rupee | | | JPHQ | | | | Buy | | | | 226,092,000 | | | | 4,995,404 | | | | | | | | 4/15/11 | | | | — | | | | (37,609 | ) |
Indian Rupee | | | JPHQ | | | | Buy | | | | 112,941,000 | | | | 2,484,951 | | | | | | | | 4/19/11 | | | | — | | | | (10,104 | ) |
Indian Rupee | | | DBAB | | | | Buy | | | | 79,271,000 | | | | 1,746,057 | | | | | | | | 4/19/11 | | | | — | | | | (9,013 | ) |
Malaysian Ringgit | | | JPHQ | | | | Buy | | | | 4,069,213 | | | | 1,247,077 | | | | | | | | 4/19/11 | | | | 63,429 | | | | — | |
Japanese Yen | | | UBSW | | | | Sell | | | | 261,900,000 | | | | 2,855,990 | | | | | | | | 4/20/11 | | | | — | | | | (374,473 | ) |
Japanese Yen | | | CITI | | | | Sell | | | | 261,800,000 | | | | 2,856,410 | | | | | | | | 4/20/11 | | | | — | | | | (372,819 | ) |
Malaysian Ringgit | | | JPHQ | | | | Buy | | | | 11,659,000 | | | | 3,590,146 | | | | | | | | 4/22/11 | | | | 163,989 | | | | — | |
Chilean Peso | | | MSCO | | | | Buy | | | | 5,015,940,000 | | | | 9,549,442 | | | | | | | | 4/25/11 | | | | 1,064,837 | | | | — | |
Indian Rupee | | | DBAB | | | | Buy | | | | 160,601,000 | | | | 3,546,059 | | | | | | | | 4/26/11 | | | | — | | | | (31,194 | ) |
Chilean Peso | | | JPHQ | | | | Buy | | | | 1,501,938,000 | | | | 2,859,473 | | | | | | | | 4/27/11 | | | | 318,207 | | | | — | |
Indian Rupee | | | JPHQ | | | | Buy | | | | 22,911,000 | | | | 505,538 | | | | | | | | 4/27/11 | | | | — | | | | (4,204 | ) |
Chilean Peso | | | CITI | | | | Buy | | | | 2,420,966,000 | | | | 4,637,866 | | | | | | | | 4/28/11 | | | | 483,746 | | | | — | |
Indian Rupee | | | JPHQ | | | | Buy | | | | 113,671,000 | | | | 2,508,186 | | | | | | | | 4/28/11 | | | | — | | | | (21,294 | ) |
Indian Rupee | | | DBAB | | | | Buy | | | | 71,377,981 | | | | 1,575,325 | | | | | | | | 4/28/11 | | | | — | | | | (13,719 | ) |
Indian Rupee | | | JPHQ | | | | Buy | | | | 113,782,000 | | | | 2,511,744 | | | | | | | | 4/29/11 | | | | — | | | | (22,862 | ) |
TGB-21
Franklin Templeton Variable Insurance Products Trust
Statement of Investments, December 31, 2010 (continued)
| | | | | | |
| Templeton Global Bond Securities Fund | | | | | | |
| | | | | | | | | | | | | | | | | | | | | | | | | | | | | | | | |
| Currency | | Counterparty | | | Type | | | Quantity | | | Contract
Amount* | | | | | | Settlement
Date | | | Unrealized
Appreciation | | | Unrealized
Depreciation | |
Peruvian Nuevo Sol | | | DBAB | | | | Buy | | | | 32,777,510 | | | | 11,430,692 | | | | | | | | 4/29/11 | | | $ | 190,592 | | | $ | — | |
Swedish Krona | | | BZWS | | | | Buy | | | | 122,773,200 | | | | 12,757,645 | | | | EUR | | | | 4/29/11 | | | | 1,144,988 | | | | — | |
Peruvian Nuevo Sol | | | DBAB | | | | Buy | | | | 7,298,991 | | | | 2,544,089 | | | | | | | | 5/06/11 | | | | 43,059 | | | | — | |
Chilean Peso | | | DBAB | | | | Buy | | | | 1,150,200,000 | | | | 2,166,102 | | | | | | | | 5/10/11 | | | | 264,483 | | | | — | |
Japanese Yen | | | CITI | | | | Sell | | | | 733,721,000 | | | | 8,237,235 | | | | | | | | 5/10/11 | | | | — | | | | (815,591 | ) |
Japanese Yen | | | UBSW | | | | Sell | | | | 733,361,000 | | | | 8,237,235 | | | | | | | | 5/10/11 | | | | — | | | | (811,150 | ) |
Japanese Yen | | | DBAB | | | | Sell | | | | 490,555,000 | | | | 5,491,492 | | | | | | | | 5/10/11 | | | | — | | | | (561,093 | ) |
Chilean Peso | | | DBAB | | | | Buy | | | | 420,740,000 | | | | 778,788 | | | | | | | | 5/19/11 | | | | 109,577 | | | | — | |
Indian Rupee | | | DBAB | | | | Buy | | | | 217,594,000 | | | | 4,578,998 | | | | | | | | 6/01/11 | | | | 153,163 | | | | — | |
Indian Rupee | | | HSBC | | | | Buy | | | | 251,448,000 | | | | 5,224,023 | | | | | | | | 6/03/11 | | | | 242,469 | | | | — | |
Indian Rupee | | | DBAB | | | | Buy | | | | 160,277,000 | | | | 3,315,619 | | | | | | | | 6/07/11 | | | | 166,372 | | | | — | |
Poland Zloty | | | CITI | | | | Buy | | | | 5,990,000 | | | | 1,436,451 | | | | EUR | | | | 6/07/11 | | | | 78,396 | | | | — | |
Poland Zloty | | | DBAB | | | | Buy | | | | 30,704,000 | | | | 7,358,658 | | | | EUR | | | | 6/07/11 | | | | 407,748 | | | | — | |
Indian Rupee | | | HSBC | | | | Buy | | | | 42,784,000 | | | | 898,257 | | | | | | | | 6/08/11 | | | | 31,055 | | | | — | |
Indian Rupee | | | DBAB | | | | Buy | | | | 43,392,000 | | | | 902,684 | | | | | | | | 6/10/11 | | | | 39,506 | | | | — | |
Indian Rupee | | | HSBC | | | | Buy | | | | 108,000,000 | | | | 2,247,098 | | | | | | | | 6/13/11 | | | | 96,723 | | | | — | |
Indian Rupee | | | DBAB | | | | Buy | | | | 108,614,000 | | | | 2,278,456 | | | | | | | | 6/16/11 | | | | 77,454 | | | | — | |
Indian Rupee | | | DBAB | | | | Buy | | | | 98,937,000 | | | | 2,078,072 | | | | | | | | 6/20/11 | | | | 66,439 | | | | — | |
Indian Rupee | | | JPHQ | | | | Buy | | | | 79,054,000 | | | | 1,658,012 | | | | | | | | 6/22/11 | | | | 54,926 | | | | — | |
Indian Rupee | | | DBAB | | | | Buy | | | | 119,627,000 | | | | 2,535,007 | | | | | | | | 6/24/11 | | | | 56,160 | | | | — | |
Indian Rupee | | | HSBC | | | | Buy | | | | 80,337,000 | | | | 1,690,949 | | | | | | | | 6/27/11 | | | | 48,271 | | | | — | |
Malaysian Ringgit | | | JPHQ | | | | Buy | | | | 14,772,000 | | | | 4,510,397 | | | | | | | | 6/29/11 | | | | 226,344 | | | | — | |
Swedish Krona | | | UBSW | | | | Buy | | | | 103,791,000 | | | | 10,806,797 | | | | EUR | | | | 6/29/11 | | | | 902,791 | | | | — | |
Indian Rupee | | | DBAB | | | | Buy | | | | 79,423,000 | | | | 1,637,588 | | | | | | | | 7/11/11 | | | | 78,436 | | | | — | |
Indian Rupee | | | JPHQ | | | | Buy | | | | 127,745,000 | | | | 2,632,289 | | | | | | | | 7/12/11 | | | | 127,409 | | | | — | |
Indian Rupee | | | DBAB | | | | Buy | | | | 40,128,000 | | | | 829,948 | | | | | | | | 7/12/11 | | | | 36,944 | | | | — | |
Malaysian Ringgit | | | DBAB | | | | Buy | | | | 18,006,622 | | | | 5,559,659 | | | | | | | | 7/12/11 | | | | 210,170 | | | | — | |
Malaysian Ringgit | | | DBAB | | | | Buy | | | | 13,610,000 | | | | 4,207,760 | | | | | | | | 7/13/11 | | | | 153,028 | | | | — | |
Indian Rupee | | | CITI | | | | Buy | | | | 19,711,000 | | | | 408,349 | | | | | | | | 7/18/11 | | | | 17,124 | | | | — | |
Malaysian Ringgit | | | DBAB | | | | Buy | | | | 11,455,000 | | | | 2,778,014 | | | | EUR | | | | 7/18/11 | | | | — | | | | (43,949 | ) |
Malaysian Ringgit | | | DBAB | | | | Buy | | | | 2,637,000 | | | | 813,763 | | | | | | | | 7/18/11 | | | | 30,928 | | | | — | |
Indian Rupee | | | JPHQ | | | | Buy | | | | 19,711,000 | | | | 407,673 | | | | | | | | 7/20/11 | | | | 17,684 | | | | — | |
Malaysian Ringgit | | | DBAB | | | | Buy | | | | 12,933,000 | | | | 3,082,647 | | | | EUR | | | | 7/20/11 | | | | 21,886 | | | | — | |
Malaysian Ringgit | | | DBAB | | | | Buy | | | | 4,160,000 | | | | 1,279,252 | | | | | | | | 7/20/11 | | | | 53,145 | | | | — | |
Malaysian Ringgit | | | DBAB | | | | Buy | | | | 16,628,000 | | | | 3,962,661 | | | | EUR | | | | 7/25/11 | | | | 27,762 | | | | — | |
Malaysian Ringgit | | | DBAB | | | | Buy | | | | 5,058,000 | | | | 1,555,111 | | | | | | | | 7/25/11 | | | | 64,460 | | | | — | |
Malaysian Ringgit | | | JPHQ | | | | Buy | | | | 16,628,000 | | | | 3,979,799 | | | | EUR | | | | 7/27/11 | | | | 4,326 | | | | — | |
Malaysian Ringgit | | | JPHQ | | | | Buy | | | | 5,318,000 | | | | 1,638,526 | | | | | | | | 7/27/11 | | | | 64,111 | | | | — | |
Malaysian Ringgit | | | HSBC | | | | Buy | | | | 3,005,000 | | | | 926,268 | | | | | | | | 7/29/11 | | | | 35,722 | | | | — | |
Malaysian Ringgit | | | HSBC | | | | Buy | | | | 6,100,000 | | | | 1,897,297 | | | | | | | | 8/08/11 | | | | 54,425 | | | | — | |
Malaysian Ringgit | | | JPHQ | | | | Buy | | | | 1,100,000 | | | | 341,827 | | | | | | | | 8/09/11 | | | | 10,103 | | | | — | |
Poland Zloty | | | DBAB | | | | Buy | | | | 59,155,000 | | | | 14,545,119 | | | | EUR | | | | 8/12/11 | | | | 207,003 | | | | — | |
Japanese Yen | | | UBSW | | | | Sell | | | | 758,781,000 | | | | 8,929,251 | | | | | | | | 8/18/11 | | | | — | | | | (448,314 | ) |
Japanese Yen | | | DBAB | | | | Sell | | | | 461,885,000 | | | | 5,435,540 | | | | | | | | 8/18/11 | | | | — | | | | (272,770 | ) |
Japanese Yen | | | JPHQ | | | | Sell | | | | 377,047,000 | | | | 4,414,037 | | | | | | | | 8/18/11 | | | | — | | | | (245,783 | ) |
Japanese Yen | | | HSBC | | | | Sell | | | | 375,298,000 | | | | 4,415,946 | | | | | | | | 8/19/11 | | | | — | | | | (222,346 | ) |
Euro | | | UBSW | | | | Sell | | | | 6,270,000 | | | | 8,074,004 | | | | | | | | 8/22/11 | | | | — | | | | (305,324 | ) |
Japanese Yen | | | BZWS | | | | Sell | | | | 376,247,000 | | | | 4,429,249 | | | | | | | | 8/22/11 | | | | — | | | | (221,036 | ) |
Japanese Yen | | | DBAB | | | | Sell | | | | 376,727,000 | | | | 4,440,441 | | | | | | | | 8/22/11 | | | | — | | | | (215,776 | ) |
Japanese Yen | | | MSCO | | | | Sell | | | | 300,000,000 | | | | 3,531,739 | | | | | | | | 8/22/11 | | | | — | | | | (176,159 | ) |
Euro | | | UBSW | | | | Sell | | | | 6,274,000 | | | | 8,065,980 | | | | | | | | 8/23/11 | | | | — | | | | (318,651 | ) |
Japanese Yen | | | FBCO | | | | Sell | | | | 746,218,000 | | | | 8,779,035 | | | | | | | | 8/23/11 | | | | — | | | | (444,139 | ) |
Japanese Yen | | | CITI | | | | Sell | | | | 751,731,000 | | | | 8,864,439 | | | | | | | | 8/23/11 | | | | — | | | | (426,876 | ) |
TGB-22
Franklin Templeton Variable Insurance Products Trust
Statement of Investments, December 31, 2010 (continued)
| | | | | | |
| Templeton Global Bond Securities Fund | | | | | | |
| | | | | | | | | | | | | | | | | | | | | | | | | | | | | | | | |
| Currency | | Counterparty | | | Type | | | Quantity | | | Contract
Amount* | | | | | | Settlement
Date | | | Unrealized
Appreciation | | | Unrealized
Depreciation | |
Japanese Yen | | | DBAB | | | | Sell | | | | 371,821,000 | | | | 4,391,829 | | | | | | | | 8/23/11 | | | $ | — | | | $ | (203,839 | ) |
Indian Rupee | | | HSBC | | | | Buy | | | | 143,891,000 | | | | 2,979,171 | | | | | | | | 8/24/11 | | | | 111,230 | | | | — | |
Indian Rupee | | | DBAB | | | | Buy | | | | 124,700,000 | | | | 2,577,511 | | | | | | | | 8/24/11 | | | | 100,718 | | | | — | |
Japanese Yen | | | JPHQ | | | | Sell | | | | 750,133,000 | | | | 8,840,695 | | | | | | | | 8/24/11 | | | | — | | | | (431,044 | ) |
Japanese Yen | | | BZWS | | | | Sell | | | | 747,636,000 | | | | 8,833,546 | | | | | | | | 8/24/11 | | | | — | | | | (407,330 | ) |
Euro | | | BZWS | | | | Sell | | | | 7,656,600 | | | | 9,689,427 | | | | | | | | 8/25/11 | | | | — | | | | (542,819 | ) |
Japanese Yen | | | DBAB | | | | Sell | | | | 685,950,000 | | | | 8,081,836 | | | | | | | | 8/25/11 | | | | — | | | | (396,753 | ) |
Japanese Yen | | | BZWS | | | | Sell | | | | 337,439,000 | | | | 3,976,420 | | | | | | | | 8/25/11 | | | | — | | | | (194,448 | ) |
United States Dollar | | | CITI | | | | Buy | | | | 7,760,297 | | | | 6,137,727 | | | | EUR | | | | 8/25/11 | | | | — | | | | (442,135 | ) |
Euro | | | UBSW | | | | Sell | | | | 9,307,428 | | | | 11,777,806 | | | | | | | | 8/26/11 | | | | — | | | | (660,536 | ) |
Euro | | | HSBC | | | | Sell | | | | 8,279,000 | | | | 10,443,296 | | | | | | | | 8/26/11 | | | | — | | | | (620,666 | ) |
Japanese Yen | | | HSBC | | | | Sell | | | | 2,493,199,000 | | | | 29,825,345 | | | | | | | | 8/26/11 | | | | — | | | | (992,076 | ) |
Japanese Yen | | | UBSW | | | | Sell | | | | 937,086,000 | | | | 11,163,361 | | | | | | | | 8/26/11 | | | | — | | | | (419,579 | ) |
Japanese Yen | | | JPHQ | | | | Sell | | | | 751,903,000 | | | | 8,880,234 | | | | | | | | 8/26/11 | | | | — | | | | (413,734 | ) |
Swedish Krona | | | UBSW | | | | Buy | | | | 30,000,000 | | | | 3,154,541 | | | | EUR | | | | 8/26/11 | | | | 208,027 | | | | — | |
United States Dollar | | | UBSW | | | | Buy | | | | 16,993,151 | | | | 13,425,892 | | | | EUR | | | | 8/26/11 | | | | — | | | | (949,059 | ) |
United States Dollar | | | HSBC | | | | Buy | | | | 14,772,566 | | | | 11,710,875 | | | | EUR | | | | 8/26/11 | | | | — | | | | (877,715 | ) |
United States Dollar | | | JPHQ | | | | Buy | | | | 11,099,031 | | | | 8,794,794 | | | | EUR | | | | 8/26/11 | | | | — | | | | (654,233 | ) |
Euro | | | JPHQ | | | | Sell | | | | 4,095,317 | | | | 5,170,338 | | | | | | | | 8/29/11 | | | | — | | | | (302,514 | ) |
Euro | | | JPHQ | | | | Sell | | | | 2,095,000 | | | | 2,647,452 | | | | | | | | 8/29/11 | | | | — | | | | (152,240 | ) |
Malaysian Ringgit | | | JPHQ | | | | Buy | | | | 8,340,000 | | | | 2,611,555 | | | | | | | | 8/29/11 | | | | 53,801 | | | | — | |
Japanese Yen | | | BZWS | | | | Sell | | | | 890,300,000 | | | | 10,574,388 | | | | | | | | 8/30/11 | | | | — | | | | (431,082 | ) |
Indian Rupee | | | DBAB | | | | Buy | | | | 88,183,000 | | | | 1,811,855 | | | | | | | | 9/01/11 | | | | 80,035 | | | | — | |
Japanese Yen | | | JPHQ | | | | Sell | | | | 372,662,000 | | | | 4,392,527 | | | | | | | | 9/01/11 | | | | — | | | | (214,319 | ) |
Indian Rupee | | | DBAB | | | | Buy | | | | 25,000,000 | | | | 511,876 | | | | | | | | 9/27/11 | | | | 22,598 | | | | — | |
Japanese Yen | | | JPHQ | | | | Sell | | | | 172,207,000 | | | | 2,055,712 | | | | | | | | 9/30/11 | | | | — | | | | (74,314 | ) |
Philippine Peso | | | HSBC | | | | Buy | | | | 49,600,000 | | | | 1,097,709 | | | | | | | | 9/30/11 | | | | 32,998 | | | | — | |
Philippine Peso | | | HSBC | | | | Buy | | | | 39,700,000 | | | | 878,562 | | | | | | | | 10/03/11 | | | | 26,433 | | | | — | |
Philippine Peso | | | HSBC | | | | Buy | | | | 156,866,000 | | | | 3,480,806 | | | | | | | | 10/04/11 | | | | 95,049 | | | | — | |
Philippine Peso | | | DBAB | | | | Buy | | | | 195,560,000 | | | | 4,346,164 | | | | | | | | 10/04/11 | | | | 111,744 | | | | — | |
Euro | | | UBSW | | | | Sell | | | | 6,370,000 | | | | 8,714,670 | | | | | | | | 10/05/11 | | | | 203,665 | | | | — | |
Philippine Peso | | | HSBC | | | | Buy | | | | 233,867,000 | | | | 5,225,144 | | | | | | | | 10/05/11 | | | | 105,941 | | | | — | |
Philippine Peso | | | DBAB | | | | Buy | | | | 233,811,000 | | | | 5,220,977 | | | | | | | | 10/05/11 | | | | 108,832 | | | | — | |
Philippine Peso | | | JPHQ | | | | Buy | | | | 61,767,000 | | | | 1,379,836 | | | | | | | | 10/06/11 | | | | 28,151 | | | | — | |
Philippine Peso | | | DBAB | | | | Buy | | | | 191,936,000 | | | | 4,314,526 | | | | | | | | 10/07/11 | | | | 60,638 | | | | — | |
Philippine Peso | | | CITI | | | | Buy | | | | 76,826,000 | | | | 1,737,044 | | | | | | | | 10/11/11 | | | | 14,126 | | | | — | |
Philippine Peso | | | JPHQ | | | | Buy | | | | 76,627,000 | | | | 1,729,768 | | | | | | | | 10/11/11 | | | | 16,867 | | | | — | |
Philippine Peso | | | DBAB | | | | Buy | | | | 153,588,000 | | | | 3,468,642 | | | | | | | | 10/11/11 | | | | 32,241 | | | | — | |
Philippine Peso | | | HSBC | | | | Buy | | | | 153,878,000 | | | | 3,469,706 | | | | | | | | 10/11/11 | | | | 37,787 | | | | — | |
Malaysian Ringgit | | | DBAB | | | | Buy | | | | 11,434,805 | | | | 3,645,721 | | | | | | | | 10/12/11 | | | | 872 | | | | — | |
Philippine Peso | | | DBAB | | | | Buy | | | | 45,732,000 | | | | 1,037,807 | | | | | | | | 10/12/11 | | | | 4,597 | | | | — | |
Malaysian Ringgit | | | DBAB | | | | Buy | | | | 4,934,783 | | | | 1,573,040 | | | | | | | | 10/13/11 | | | | 619 | | | | — | |
Philippine Peso | | | HSBC | | | | Buy | | | | 76,252,000 | | | | 1,717,581 | | | | | | | | 10/13/11 | | | | 20,471 | | | | — | |
Philippine Peso | | | JPHQ | | | | Buy | | | | 194,374,000 | | | | 4,386,190 | | | | | | | | 10/13/11 | | | | 44,279 | | | | — | |
Euro | | | HSBC | | | | Sell | | | | 3,762,000 | | | | 5,229,932 | | | | | | | | 10/17/11 | | | | 203,850 | | | | — | |
Philippine Peso | | | JPHQ | | | | Buy | | | | 108,152,000 | | | | 2,463,767 | | | | | | | | 10/17/11 | | | | 1,298 | | | | — | |
Euro | | | HSBC | | | | Sell | | | | 3,753,000 | | | | 5,264,333 | | | | | | | | 10/18/11 | | | | 250,304 | | | | — | |
Norwegian Krone | | | BZWS | | | | Buy | | | | 30,824,000 | | | | 3,765,775 | | | | EUR | | | | 10/18/11 | | | | 183,025 | | | | — | |
Euro | | | HSBC | | | | Sell | | | | 5,054,000 | | | | 7,058,416 | | | | | | | | 10/19/11 | | | | 306,284 | | | | — | |
Norwegian Krone | | | BZWS | | | | Buy | | | | 30,949,000 | | | | 3,765,727 | | | | EUR | | | | 10/19/11 | | | | 203,969 | | | | — | |
Philippine Peso | | | DBAB | | | | Buy | | | | 41,880,000 | | | | 950,954 | | | | | | | | 10/19/11 | | | | 3,581 | | | | — | |
Philippine Peso | | | HSBC | | | | Buy | | | | 154,149,000 | | | | 3,493,699 | | | | | | | | 10/19/11 | | | | 19,686 | | | | — | |
Philippine Peso | | | DBAB | | | | Buy | | | | 167,411,000 | | | | 3,771,877 | | | | | | | | 10/21/11 | | | | 43,700 | | | | — | |
TGB-23
Franklin Templeton Variable Insurance Products Trust
Statement of Investments, December 31, 2010 (continued)
| | | | | | |
| Templeton Global Bond Securities Fund | | | | | | |
| | | | | | | | | | | | | | | | | | | | | | | | | | | | | | | | |
| Currency | | Counterparty | | | Type | | | Quantity | | | Contract
Amount* | | | | | | Settlement
Date | | | Unrealized
Appreciation | | | Unrealized
Depreciation | |
Philippine Peso | | | JPHQ | | | | Buy | | | | 84,061,000 | | | | 1,894,460 | | | | | | | | 10/21/11 | | | $ | 21,431 | | | $ | — | |
Chilean Peso | | | CITI | | | | Buy | | | | 921,291,798 | | | | 1,849,984 | | | | | | | | 10/25/11 | | | | 66,491 | | | | — | |
Indian Rupee | | | HSBC | | | | Buy | | | | 213,392,000 | | | | 4,601,941 | | | | | | | | 10/26/11 | | | | — | | | | (56,130 | ) |
Indian Rupee | | | DBAB | | | | Buy | | | | 208,500,000 | | | | 4,488,698 | | | | | | | | 10/26/11 | | | | — | | | | (47,099 | ) |
Philippine Peso | | | JPHQ | | | | Buy | | | | 82,631,000 | | | | 1,873,634 | | | | | | | | 10/26/11 | | | | 9,570 | | | | — | |
Philippine Peso | | | HSBC | | | | Buy | | | | 154,149,000 | | | | 3,489,745 | | | | | | | | 10/26/11 | | | | 23,392 | | | | — | |
Philippine Peso | | | DBAB | | | | Buy | | | | 165,158,000 | | | | 3,744,145 | | | | | | | | 10/26/11 | | | | 19,892 | | | | — | |
Indian Rupee | | | HSBC | | | | Buy | | | | 317,880,000 | | | | 6,876,055 | | | | | | | | 10/27/11 | | | | — | | | | (105,207 | ) |
Indian Rupee | | | DBAB | | | | Buy | | | | 440,314,000 | | | | 9,473,193 | | | | | | | | 10/27/11 | | | | — | | | | (94,500 | ) |
Norwegian Krone | | | BZWS | | | | Buy | | | | 61,766,000 | | | | 7,531,521 | | | | EUR | | | | 10/27/11 | | | | 381,291 | | | | — | |
Philippine Peso | | | HSBC | | | | Buy | | | | 40,030,000 | | | | 911,637 | | | | | | | | 10/27/11 | | | | 658 | | | | — | |
Chilean Peso | | | BZWS | | | | Buy | | | | 199,342,000 | | | | 393,568 | | | | | | | | 10/28/11 | | | | 20,982 | | | | — | |
Chilean Peso | | | DBAB | | | | Buy | | | | 398,486,000 | | | | 787,133 | | | | | | | | 10/28/11 | | | | 41,555 | | | | — | |
Philippine Peso | | | DBAB | | | | Buy | | | | 146,355,000 | | | | 3,332,312 | | | | | | | | 10/28/11 | | | | 3,128 | | | | — | |
Philippine Peso | | | HSBC | | | | Buy | | | | 26,680,000 | | | | 607,745 | | | | | | | | 10/28/11 | | | | 294 | | | | — | |
Philippine Peso | | | HSBC | | | | Buy | | | | 52,110,000 | | | | 1,185,126 | | | | | | | | 10/31/11 | | | | 2,428 | | | | — | |
Philippine Peso | | | DBAB | | | | Buy | | | | 26,150,000 | | | | 607,843 | | | | | | | | 11/04/11 | | | | — | | | | (11,925 | ) |
Norwegian Krone | | | UBSW | | | | Buy | | | | 47,173,200 | | | | 5,682,902 | | | | EUR | | | | 11/07/11 | | | | 379,245 | | | | — | |
Japanese Yen | | | CITI | | | | Sell | | | | 341,992,119 | | | | 4,230,534 | | | | | | | | 11/08/11 | | | | — | | | | (3,597 | ) |
Japanese Yen | | | BZWS | | | | Sell | | | | 335,950,000 | | | | 4,156,254 | | | | | | | | 11/10/11 | | | | — | | | | (3,274 | ) |
Japanese Yen | | | BZWS | | | | Sell | | | | 429,663,000 | | | | 5,357,394 | | | | | | | | 11/14/11 | | | | 37,048 | | | | — | |
Japanese Yen | | | UBSW | | | | Sell | | | | 340,600,700 | | | | 4,246,521 | | | | | | | | 11/14/11 | | | | 28,998 | | | | — | |
Philippine Peso | | | DBAB | | | | Buy | | | | 48,500,000 | | | | 1,126,545 | | | | | | | | 11/14/11 | | | | — | | | | (21,417 | ) |
Japanese Yen | | | DBAB | | | | Sell | | | | 796,770,000 | | | | 9,733,480 | | | | | | | | 11/16/11 | | | | — | | | | (133,088 | ) |
Japanese Yen | | | JPHQ | | | | Sell | | | | 397,873,000 | | | | 4,862,190 | | | | | | | | 11/16/11 | | | | — | | | | (64,754 | ) |
Euro | | | UBSW | | | | Sell | | | | 4,794,427 | | | | 6,494,531 | | | | | | | | 11/17/11 | | | | 90,277 | | | | — | |
Japanese Yen | | | BZWS | | | | Sell | | | | 986,239,000 | | | | 11,990,310 | | | | | | | | 11/17/11 | | | | — | | | | (222,791 | ) |
Japanese Yen | | | UBSW | | | | Sell | | | | 317,836,000 | | | | 3,860,044 | | | | | | | | 11/17/11 | | | | — | | | | (75,882 | ) |
Japanese Yen | | | HSBC | | | | Sell | | | | 207,909,000 | | | | 2,515,231 | | | | | | | | 11/17/11 | | | | — | | | | (59,412 | ) |
Euro | | | DBAB | | | | Sell | | | | 933,877 | | | | 1,259,295 | | | | | | | | 11/18/11 | | | | 11,857 | | | | — | |
Japanese Yen | | | BZWS | | | | Sell | | | | 1,107,834,000 | | | | 13,360,275 | | | | | | | | 11/21/11 | | | | — | | | | (359,942 | ) |
Norwegian Krone | | | MSCO | | | | Buy | | | | 15,002,870 | | | | 1,807,891 | | | | EUR | | | | 11/25/11 | | | | 117,622 | | | | — | |
Euro | | | DBAB | | | | Sell | | | | 1,300,570 | | | | 1,737,236 | | | | | | | | 11/28/11 | | | | 85 | | | | — | |
Japanese Yen | | | BOFA | | | | Sell | | | | 859,147,000 | | | | 10,376,172 | | | | | | | | 11/28/11 | | | | — | | | | (265,946 | ) |
Norwegian Krone | | | MSCO | | | | Buy | | | | 23,130,000 | | | | 2,781,921 | | | | EUR | | | | 11/28/11 | | | | 187,842 | | | | — | |
Norwegian Krone | | | UBSW | | | | Buy | | | | 75,812,000 | | | | 9,179,975 | | | | EUR | | | | 11/28/11 | | | | 533,116 | | | | — | |
Japanese Yen | | | BZWS | | | | Sell | | | | 1,251,786,000 | | | | 15,116,363 | | | | | | | | 11/29/11 | | | | — | | | | (389,693 | ) |
Japanese Yen | | | CITI | | | | Sell | | | | 310,702,000 | | | | 3,754,253 | | | | | | | | 11/29/11 | | | | — | | | | (94,458 | ) |
Japanese Yen | | | DBAB | | | | Sell | | | | 770,370,000 | | | | 9,205,042 | | | | | | | | 12/01/11 | | | | — | | | | (338,111 | ) |
Norwegian Krone | | | UBSW | | | | Buy | | | | 23,030,000 | | | | 2,791,515 | | | | EUR | | | | 12/01/11 | | | | 157,562 | | | | — | |
Euro | | | DBAB | | | | Sell | | | | 5,440,000 | | | | 7,078,800 | | | | | | | | 12/02/11 | | | | — | | | | (187,152 | ) |
Euro | | | HSBC | | | | Sell | | | | 2,155,292 | | | | 2,824,079 | | | | | | | | 12/06/11 | | | | — | | | | (54,576 | ) |
Euro | | | UBSW | | | | Sell | | | | 1,343,551 | | | | 1,789,315 | | | | | | | | 12/07/11 | | | | — | | | | (5,151 | ) |
Euro | | | BZWS | | | | Sell | | | | 5,095,000 | | | | 6,732,533 | | | | | | | | 12/12/11 | | | | — | | | | (72,220 | ) |
Malaysian Ringgit | | | JPHQ | | | | Buy | | | | 13,361,013 | | | | 4,220,289 | | | | | | | | 12/16/11 | | | | 30,296 | | | | — | |
Japanese Yen | | | CITI | | | | Sell | | | | 286,112,008 | | | | 3,445,887 | | | | | | | | 12/28/11 | | | | — | | | | (100,741 | ) |
Japanese Yen | | | BZWS | | | | Sell | | | | 285,057,504 | | | | 3,434,883 | | | | | | | | 12/28/11 | | | | — | | | | (98,674 | ) |
Japanese Yen | | | JPHQ | | | | Sell | | | | 285,510,329 | | | | 3,463,124 | | | | | | | | 12/28/11 | | | | — | | | | (76,046 | ) |
| | | | | | | | | | | | | | | | | | | | | | | | | | | | |
Unrealized appreciation (depreciation) | | | | | | | | | | | | | | | | 55,649,899 | | | | (34,141,144 | ) |
| | | | | | | | | | | | | | | | | | | | | | | | | | | | |
Net unrealized appreciation (depreciation) | | | | | | | | | | | | | | | $ | 21,508,755 | | | | | |
| | | | | | | | | | | | | | | | | | | | | | | | | | | | | | | | |
*In U.S. dollars unless otherwise indicated.
See Abbreviations on page TGB-37.
The accompanying notes are an integral part of these financial statements.
TGB-24
Franklin Templeton Variable Insurance Products Trust
Financial Statements
Statement of Assets and Liabilities
December 31, 2010
| | | | |
| | | Templeton
Global Bond
Securities Fund | |
Assets: | | | | |
Investments in securities: | | | | |
Cost - Unaffiliated issuers | | $ | 1,651,419,695 | |
Cost - Repurchase agreements | | | 202,257,044 | |
| | | | |
Total cost of investments | | $ | 1,853,676,739 | |
| | | | |
Value - Unaffiliated issuers | | $ | 1,843,332,626 | |
Value - Repurchase agreements | | | 202,257,044 | |
| | | | |
Total value of investments | | | 2,045,589,670 | |
Foreign currency, at value (cost $285,816) | | | 286,145 | |
Receivables: | | | | |
Capital shares sold | | | 1,407,061 | |
Interest | | | 30,760,236 | |
Due from brokers | | | 760,000 | |
Variation margin | | | 1,147 | |
Unrealized appreciation on forward exchange contracts | | | 55,649,899 | |
Other assets | | | 236 | |
| | | | |
Total assets | | | 2,134,454,394 | |
| | | | |
Liabilities: | | | | |
Payables: | | | | |
Capital shares redeemed | | | 704,820 | |
Affiliates | | | 1,573,906 | |
Unrealized depreciation on forward exchange contracts | | | 34,141,144 | |
Accrued expenses and other liabilities | | | 737,023 | |
| | | | |
Total liabilities | | | 37,156,893 | |
| | | | |
Net assets, at value | | $ | 2,097,297,501 | |
| | | | |
Net assets consist of: | | | | |
Paid-in capital | | $ | 1,766,423,338 | |
Undistributed net investment income | | | 102,069,075 | |
Net unrealized appreciation (depreciation) | | | 214,138,569 | |
Accumulated net realized gain (loss) | | | 14,666,519 | |
| | | | |
Net assets, at value | | $ | 2,097,297,501 | |
| | | | |
The accompanying notes are an integral part of these financial statements.
TGB-25
Franklin Templeton Variable Insurance Products Trust
Financial Statements (continued)
Statement of Assets and Liabilities (continued)
December 31, 2010
| | | | |
| | | Templeton
Global Bond
Securities Fund | |
Class 1: | | | | |
Net assets, at value | | $ | 272,232,359 | |
| | | | |
Shares outstanding | | | 13,653,460 | |
| | | | |
Net asset value and maximum offering price per share | | $ | 19.94 | |
| | | | |
Class 2: | | | | |
Net assets, at value | | $ | 1,490,793,794 | |
| | | | |
Shares outstanding | | | 76,503,327 | |
| | | | |
Net asset value and maximum offering price per share | | $ | 19.49 | |
| | | | |
Class 3: | | | | |
Net assets, at value | | $ | 183,379,958 | |
| | | | |
Shares outstanding | | | 9,413,166 | |
| | | | |
Net asset value and maximum offering price per sharea | | $ | 19.48 | |
| | | | |
Class 4: | | | | |
Net assets, at value | | $ | 150,891,390 | |
| | | | |
Shares outstanding | | | 7,628,434 | |
| | | | |
Net asset value and maximum offering price per share | | $ | 19.78 | |
| | | | |
aRedemption price is equal to net asset value less redemption fees retained by the Fund.
The accompanying notes are an integral part of these financial statements.
TGB-26
Franklin Templeton Variable Insurance Products Trust
Financial Statements (continued)
Statement of Operations
for the year ended December 31, 2010
| | | | |
| | | Templeton
Global Bond
Securities Fund | |
Investment income: | | | | |
Interest (net of foreign taxes $1,720,413) | | $ | 107,781,185 | |
| | | | |
Expenses: | | | | |
Management fees (Note 3a) | | | 8,580,430 | |
Distribution fees: (Note 3c) | | | | |
Class 2 | | | 3,297,025 | |
Class 3 | | | 398,370 | |
Class 4 | | | 465,578 | |
Unaffiliated transfer agent fees | | | 2,199 | |
Custodian fees (Note 4) | | | 1,089,734 | |
Reports to shareholders | | | 413,669 | |
Professional fees | | | 69,959 | |
Trustees’ fees and expenses | | | 7,999 | |
Other | | | 45,625 | |
| | | | |
Total expenses | | | 14,370,588 | |
Expense reductions (Note 4) | | | (5,004 | ) |
| | | | |
Net expenses | | | 14,365,584 | |
| | | | |
Net investment income | | | 93,415,601 | |
| | | | |
Realized and unrealized gains (losses): | | | | |
Net realized gain (loss) from: | | | | |
Investments | | | 15,041,336 | |
Foreign currency transactions | | | 10,659,124 | |
Futures contracts | | | (9,179 | ) |
Swap contracts | | | 1,034,692 | |
| | | | |
Net realized gain (loss) | | | 26,725,973 | |
| | | | |
Net change in unrealized appreciation (depreciation) on: | | | | |
Investments | | | 96,323,232 | |
Translation of other assets and liabilities denominated in foreign currencies | | | 26,700,490 | |
| | | | |
Net change in unrealized appreciation (depreciation) | | | 123,023,722 | |
| | | | |
Net realized and unrealized gain (loss) | | | 149,749,695 | |
| | | | |
Net increase (decrease) in net assets resulting from operations | | $ | 243,165,296 | |
| | | | |
The accompanying notes are an integral part of these financial statements.
TGB-27
Franklin Templeton Variable Insurance Products Trust
Financial Statements (continued)
Statements of Changes in Net Assets
| | | | | | | | |
| | | Templeton Global Bond
Securities Fund | |
| | | Year Ended December 31, | |
| | | 2010 | | | 2009 | |
| | | | |
Increase (decrease) in net assets: | | | | | | | | |
Operations: | | | | | | | | |
Net investment income | | $ | 93,415,601 | | | $ | 76,847,189 | |
Net realized gain (loss) from investments, foreign currency transactions, futures contracts and swap contracts | | | 26,725,973 | | | | 63,328,021 | |
Net change in unrealized appreciation (depreciation) on investments and translation of other assets and liabilities denominated in foreign currencies | | | 123,023,722 | | | | 99,438,346 | |
| | | | |
Net increase (decrease) in net assets resulting from operations | | | 243,165,296 | | | | 239,613,556 | |
| | | | |
Distributions to shareholders from: | | | | | | | | |
Net investment income and net foreign currency gains: | | | | | | | | |
Class 1 | | | (3,860,853 | ) | | | (23,763,176 | ) |
Class 2 | | | (17,334,382 | ) | | | (139,472,843 | ) |
Class 3 | | | (2,167,994 | ) | | | (18,449,432 | ) |
Class 4 | | | (1,885,595 | ) | | | (10,152,433 | ) |
Net realized gains: | | | | | | | | |
Class 1 | | | (610,541 | ) | | | — | |
Class 2 | | | (3,135,836 | ) | | | — | |
Class 3 | | | (394,847 | ) | | | — | |
Class 4 | | | (338,834 | ) | | | — | |
| | | | |
Total distributions to shareholders | | | (29,728,882 | ) | | | (191,837,884 | ) |
| | | | |
Capital share transactions: (Note 2) | | | | | | | | |
Class 1 | | | 48,911,860 | | | | (33,006,590 | ) |
Class 2 | | | 75,615,219 | | | | 435,496,396 | |
Class 3 | | | 21,722,929 | | | | 11,495,009 | |
Class 4 | | | 26,968,281 | | | | 63,139,007 | |
| | | | |
Total capital share transactions | | | 173,218,289 | | | | 477,123,822 | |
| | | | |
Redemption fees | | | 23,708 | | | | 26,899 | |
| | | | |
Net increase (decrease) in net assets | | | 386,678,411 | | | | 524,926,393 | |
Net assets: | | | | | | | | |
Beginning of year | | | 1,710,619,090 | | | | 1,185,692,697 | |
| | | | |
End of year | | $ | 2,097,297,501 | | | $ | 1,710,619,090 | |
| | | | |
Undistributed net investment income included in net assets: | | | | | | | | |
End of year | | $ | 102,069,075 | | | $ | 24,514,511 | |
| | | | |
The accompanying notes are an integral part of these financial statements.
TGB-28
Franklin Templeton Variable Insurance Products Trust
Notes to Financial Statements
Templeton Global Bond Securities Fund
1. ORGANIZATION AND SIGNIFICANT ACCOUNTING POLICIES
Franklin Templeton Variable Insurance Products Trust (Trust) is registered under the Investment Company Act of 1940, as amended, (1940 Act) as an open-end investment company, consisting of twenty separate funds. The Templeton Global Bond Securities Fund (Fund) is included in this report. The financial statements of the remaining funds in the Trust are presented separately. Shares of the Fund are generally sold only to insurance company separate accounts to fund the benefits of variable life insurance policies or variable annuity contracts The Fund offers four classes of shares: Class 1, Class 2, Class 3, and Class 4. Each class of shares differs by its distribution fees, voting rights on matters affecting a single class and its exchange privilege.
The following summarizes the Fund’s significant accounting policies.
a. Financial Instrument Valuation
The Fund values its investments in securities and other assets and liabilities carried at fair value daily. Fair value is the price that would be received to sell an asset or paid to transfer a liability in an orderly transaction between market participants on the measurement date. Under procedures approved by the Trust’s Board of Trustees, the Fund may utilize independent pricing services, quotations from securities and financial instrument dealers, and other market sources to determine fair value.
Debt securities generally trade in the over-the-counter market rather than on a securities exchange. The Fund’s pricing services use multiple valuation techniques to determine fair value. In instances where sufficient market activity exists, the pricing services may utilize a market-based approach through which quotes from market makers are used to determine fair value. In instances where sufficient market activity may not exist or is limited, the pricing services also utilize proprietary valuation models which may consider market characteristics such as benchmark yield curves, option-adjusted spreads, credit spreads, estimated default rates, coupon rates, anticipated timing of principal repayments, underlying collateral, and other unique security features in order to estimate the relevant cash flows, which are then discounted to calculate the fair value. Securities denominated in a foreign currency are converted into their U.S. dollar equivalent at the foreign exchange rate in effect at the close of the NYSE on the date that the values of the foreign debt securities are determined. Repurchase agreements are valued at cost, which approximates market value.
Certain derivative financial instruments trade in the over-the-counter market. The Fund’s pricing services use various techniques including industry standard option pricing models and proprietary discounted cash flow models to determine the fair value of those instruments. The Fund’s net benefit or obligation under the derivative contract, as measured by the fair market value of the contract, is included in net assets.
The Fund has procedures to determine the fair value of securities and other financial instruments for which market prices are not readily available or which may not be reliably priced. Under these procedures, the Fund primarily employs a market-based approach which may use related or comparable assets or liabilities, recent transactions, market multiples, book values, and other relevant information for the investment to determine the fair value of the investment. The Fund may also use an income-based valuation approach in which the anticipated future cash flows of the investment are discounted to calculate fair value. Discounts may also be applied due to the nature or duration of any restrictions on the disposition of the investments. Due to the inherent uncertainty of valuations of such investments, the fair values may differ significantly from the values that would have been used had an active market existed.
Trading in securities on foreign exchanges and over-the-counter markets may be completed before the daily close of business on the NYSE. Occasionally, events occur between the time at which trading in a foreign security is completed and the close of the NYSE that might call into question the reliability of the value of a portfolio security held by the Fund. As a result, differences may arise between the value of the Fund’s portfolio securities as determined at the foreign market close and the latest indications of value at the close of the NYSE. In order to minimize the potential for these differences, the investment manager monitors price movements following the close of trading in foreign stock markets through a series of country specific market proxies (such as baskets of American Depository Receipts, futures contracts and exchange traded funds). These price movements are measured against established trigger thresholds for each specific market proxy to assist in determining if an event has occurred that may call into question the reliability of the values of the foreign securities held by the Fund. If such an event occurs, the securities may be valued using fair value procedures, which may include the use of independent pricing services.
TGB-29
Franklin Templeton Variable Insurance Products Trust
Notes to Financial Statements (continued)
Templeton Global Bond Securities Fund
1. ORGANIZATION AND SIGNIFICANT ACCOUNTING POLICIES (continued)
b. Foreign Currency Translation
Portfolio securities and other assets and liabilities denominated in foreign currencies are translated into U.S. dollars based on the exchange rate of such currencies against U.S. dollars on the date of valuation. The Fund may enter into foreign currency exchange contracts to facilitate transactions denominated in a foreign currency. Purchases and sales of securities, income and expense items denominated in foreign currencies are translated into U.S. dollars at the exchange rate in effect on the transaction date. Portfolio securities and assets and liabilities denominated in foreign currencies contain risks that those currencies will decline in value relative to the U.S. dollar. Occasionally, events may impact the availability or reliability of foreign exchange rates used to convert the U.S. dollar equivalent value. If such an event occurs, the foreign exchange rate will be valued at fair value using procedures established and approved by the Trust’s Board of Trustees.
The Fund does not separately report the effect of changes in foreign exchange rates from changes in market prices on securities held. Such changes are included in net realized and unrealized gain or loss from investments on the Statement of Operations.
Realized foreign exchange gains or losses arise from sales of foreign currencies, currency gains or losses realized between the trade and settlement dates on securities transactions and the difference between the recorded amounts of dividends, interest, and foreign withholding taxes and the U.S. dollar equivalent of the amounts actually received or paid. Net unrealized foreign exchange gains and losses arise from changes in foreign exchange rates on foreign denominated assets and liabilities other than investments in securities held at the end of the reporting period.
c. Joint Repurchase Agreement
The Fund may enter into a joint repurchase agreement whereby its uninvested cash balance is deposited into a joint cash account with other funds managed by the investment manager or an affiliate of the investment manager and is used to invest in one or more repurchase agreements. The value and face amount of the joint repurchase agreement are allocated to the funds based on their pro-rata interest. A repurchase agreement is accounted for as a loan by the fund to the seller, collateralized by securities which are delivered to the fund’s custodian. The market value, including accrued interest, of the initial collateralization is required to be at least 102% of the dollar amount invested by the funds, with the value of the underlying securities marked to market daily to maintain coverage of at least 100%. The joint repurchase agreement held by the Fund at year end had been entered into on December 31, 2010.
d. Derivative Financial Instruments
The Fund invested in derivative financial instruments (derivatives) in order to manage risk or gain exposure to various other investments or markets. Derivatives are financial contracts based on an underlying or notional amount, require no initial investment or an initial net investment that is smaller than would normally be required to have a similar response to changes in market factors, and require or permit net settlement. Derivatives contain various risks including the potential inability of the counterparty to fulfill their obligations under the terms of the contract, the potential for an illiquid secondary market, and/or the potential for market movements which expose the Fund to gains or losses in excess of the amounts shown on the Statement of Assets and Liabilities. Realized gain and loss and unrealized appreciation and depreciation on these contracts for the period are included in the Statement of Operations.
The Fund entered into futures contracts primarily to manage interest rate and/or foreign exchange rate risk. A futures contract is an agreement between the Fund and a counterparty to buy or sell a security for a specific price on a future date. Required initial margin deposits of cash or securities are pledged by the Fund. Subsequent payments, known as variation margin, are made or received by the Fund, depending on fluctuations in the value of the underlying security. Such variation margin is accounted for as unrealized appreciation or depreciation until the contract is closed, at which time the gains or losses are realized.
TGB-30
Franklin Templeton Variable Insurance Products Trust
Notes to Financial Statements (continued)
Templeton Global Bond Securities Fund
1. ORGANIZATION AND SIGNIFICANT ACCOUNTING POLICIES (continued)
d. Derivative Financial Instruments (continued)
The Fund entered into forward exchange contracts primarily to manage and/or gain exposure to certain foreign currencies. A forward exchange contract is an agreement between the Fund and a counterparty to buy or sell a foreign currency for a specific exchange rate on a future date. Pursuant to the terms of the forward exchange contracts, cash or securities may be required to be deposited as collateral. Unrestricted cash may be invested according to the Fund’s investment objectives.
The Fund entered into interest rate swap contracts primarily to manage interest rate risk. An interest rate swap is an agreement between the Fund and a counterparty to exchange cash flows based on the difference between two interest rates, applied to a notional principal amount. Over the term of the contract, contractually required payments to be paid and to be received are accrued daily and recorded as unrealized depreciation and appreciation until the payments are made, at which time they are realized. Pursuant to the terms of the interest rate swap contract, cash or securities may be required to be deposited as collateral. Unrestricted cash may be invested according to the Fund’s investment objectives.
See Note 9 regarding other derivative information.
e. Income Taxes
It is the Fund’s policy to qualify as a regulated investment company under the Internal Revenue Code. The Fund intends to distribute to shareholders substantially all of its taxable income and net realized gains to relieve it from federal income and excise taxes. As a result, no provision for U.S. federal income taxes is required. The Fund files U.S. income tax returns as well as tax returns in certain other jurisdictions. The Fund’s application of those tax rules is subject to its understanding. The Fund records a provision for taxes in its financial statements including penalties and interest, if any, for a tax position taken on a tax return (or expected to be taken) when it fails to meet the more likely than not (a greater than 50% probability) threshold and based on the technical merits, the tax position may not be sustained upon examination by the tax authorities. As of December 31, 2010, and for all open tax years, the Fund has determined that no provision for income tax is required in the Fund’s financial statements. Open tax years are those that remain subject to examination and are based on each tax jurisdiction statute of limitation. The Fund is not aware of any tax position for which it is reasonably possible that the total amounts of unrecognized tax effects will significantly change in the next twelve months.
The Fund may be subject to foreign taxation related to income received, capital gains on the sale of securities and certain foreign currency transactions in the foreign jurisdictions in which it invests. Foreign taxes, if any, are recorded based on the tax regulations and rates that exist in the foreign markets in which the Fund invests. When a capital gain tax is determined to apply the Fund records an estimated deferred tax liability for unrealized gains on these securities in an amount that would be payable if the securities were disposed of on the valuation date.
f. Security Transactions, Investment Income, Expenses and Distributions
Security transactions are accounted for on trade date. Realized gains and losses on security transactions are determined on a specific identification basis. Interest income and estimated expenses are accrued daily. Amortization of premium and accretion of discount on debt securities are included in interest income. Distributions to shareholders are recorded on the ex-dividend date and are determined according to income tax regulations (tax basis). Distributable earnings determined on a tax basis may differ from earnings recorded in accordance with accounting principles generally accepted in the United States of America. These differences may be permanent or temporary. Permanent differences are reclassified among capital accounts to reflect their tax character. These reclassifications have no impact on net assets or the results of operations. Temporary differences are not reclassified, as they may reverse in subsequent periods.
TGB-31
Franklin Templeton Variable Insurance Products Trust
Notes to Financial Statements (continued)
Templeton Global Bond Securities Fund
1. ORGANIZATION AND SIGNIFICANT ACCOUNTING POLICIES (continued)
f. Security Transactions, Investment Income, Expenses and Distributions (continued)
Common expenses incurred by the Trust are allocated among the funds based on the ratio of net assets of each fund to the combined net assets of the Trust. Fund specific expenses are charged directly to the fund that incurred the expense.
Realized and unrealized gains and losses and net investment income, not including class specific expenses, are allocated daily to each class of shares based upon the relative proportion of net assets of each class. Differences in per share distributions, by class, are generally due to differences in class specific expenses.
Inflation-indexed bonds are adjusted for inflation through periodic increases or decreases in the security’s interest accruals, face amount, or principal redemption value, by amounts corresponding to the rate of inflation as measured by an index. Any increase or decrease in the face amount or principal redemption value will be included as interest income on the Statement of Operations.
g. Accounting Estimates
The preparation of financial statements in accordance with accounting principles generally accepted in the United States of America requires management to make estimates and assumptions that affect the reported amounts of assets and liabilities at the date of the financial statements and the amounts of income and expenses during the reporting period. Actual results could differ from those estimates.
h. Redemption Fees
Redemptions and exchanges of interests in an insurance company subaccount that invests in Class 3 shares of the Fund will be subject to a 1.0% short term trading fee if the interest in the subaccount has been held for less than 60 days. Such fees are retained by the Fund and accounted for as an addition to paid-in capital, allocated to each class of shares based upon the relative proportion of net assets of each class.
i. Guarantees and Indemnifications
Under the Trust’s organizational documents, its officers and trustees are indemnified by the Trust against certain liabilities arising out of the performance of their duties to the Trust. Additionally, in the normal course of business, the Trust, on behalf of the Fund, enters into contracts with service providers that contain general indemnification clauses. The Trust’s maximum exposure under these arrangements is unknown as this would involve future claims that may be made against the Trust that have not yet occurred. Currently, the Trust expects the risk of loss to be remote.
2. SHARES OF BENEFICIAL INTEREST
At December 31, 2010, there were an unlimited number of shares authorized (without par value). Transactions in the Fund’s shares were as follows:
| | | | | | | | | | | | | | | | |
| | | Year Ended December 31, | |
| | | 2010 | | | 2009 | |
| Class 1 Shares: | | Shares | | | Amount | | | Shares | | | Amount | |
Shares sold | | | 4,522,323 | | | $ | 85,300,049 | | | | 2,951,874 | | | $ | 50,898,302 | |
Shares issued in reinvestment of distributions | | | 243,806 | | | | 4,471,394 | | | | 1,490,789 | | | | 23,763,176 | |
Shares redeemed | | | (2,152,653 | ) | | | (40,859,583 | ) | | | (6,068,722 | ) | | | (107,668,068 | ) |
| | | | |
Net increase (decrease) | | | 2,613,476 | | | $ | 48,911,860 | | | | (1,626,059 | ) | | $ | (33,006,590 | ) |
| | | | |
TGB-32
Franklin Templeton Variable Insurance Products Trust
Notes to Financial Statements (continued)
Templeton Global Bond Securities Fund
2. SHARES OF BENEFICIAL INTEREST (continued)
| | | | | | | | | | | | | | | | |
| | | Year Ended December 31, | |
| | | 2010 | | | 2009 | |
| Class 2 Shares: | | Shares | | | Amount | | | Shares | | | Amount | |
Shares sold | | | 23,116,184 | | | $ | 432,400,311 | | | | 24,341,548 | | | $ | 411,300,147 | |
Shares issued in reinvestment of distributions | | | 1,140,402 | | | | 20,470,218 | | | | 8,934,839 | | | | 139,472,843 | |
Shares redeemed | | | (20,598,509 | ) | | | (377,255,310 | ) | | | (6,858,618 | ) | | | (115,276,594 | ) |
| | | | |
Net increase (decrease) | | | 3,658,077 | | | $ | 75,615,219 | | | | 26,417,769 | | | $ | 435,496,396 | |
| | | | |
Class 3 Shares: | | | | | | | | | | | | | | | | |
Shares sold | | | 2,390,123 | | | $ | 44,722,862 | | | | 1,901,513 | | | $ | 32,238,548 | |
Shares issued in reinvestment of distributions | | | 142,856 | | | | 2,562,841 | | | | 1,182,656 | | | | 18,449,432 | |
Shares redeemed | | | (1,387,144 | ) | | | (25,562,774 | ) | | | (2,318,382 | ) | | | (39,192,971 | ) |
| | | | |
Net increase (decrease) | | | 1,145,835 | | | $ | 21,722,929 | | | | 765,787 | | | $ | 11,495,009 | |
| | | | |
Class 4 Shares: | | | | | | | | | | | | | | | | |
Shares sold | | | 1,871,353 | | | $ | 34,938,015 | | | | 3,243,291 | | | $ | 56,014,173 | |
Shares issued on reinvestment of distributions | | | 122,020 | | | | 2,224,429 | | | | 639,725 | | | | 10,152,433 | |
Shares redeemed | | | (549,061 | ) | | | (10,194,163 | ) | | | (178,649 | ) | | | (3,027,599 | ) |
| | | | |
Net increase (decrease) | | | 1,444,312 | | | $ | 26,968,281 | | | | 3,704,367 | | | $ | 63,139,007 | |
| | | | |
3. TRANSACTIONS WITH AFFILIATES
Franklin Resources, Inc. is the holding company for various subsidiaries that together are referred to as Franklin Templeton Investments. Certain officers and trustees of the Fund are also officers and/or directors of the following subsidiaries:
| | |
| Subsidiary | | Affiliation |
Franklin Advisers, Inc. (Advisers) | | Investment manager |
Franklin Templeton Services, LLC (FT Services) | | Administrative manager |
Franklin Templeton Distributors, Inc. (Distributors) | | Principal underwriter |
Franklin Templeton Investor Services, LLC (Investor Services) | | Transfer agent |
a. Management Fees
The Fund pays an investment management fee to Advisers based on the average daily net assets of the Fund as follows:
| | |
| Annualized Fee Rate | | Net Assets |
| 0.625% | | Up to and including $100 million |
| 0.500% | | Over $100 million, up to and including $250 million |
| 0.450% | | Over $250 million, up to and including $7.5 billion |
| 0.440% | | Over $7.5 billion, up to and including $10 billion |
| 0.430% | | Over $10 billion, up to and including $12.5 billion |
| 0.420% | | Over $12.5 billion, up to and including $15 billion |
| 0.400% | | In excess of $15 billion |
b. Administrative Fees
Under an agreement with Advisers, FT Services provides administrative services to the Fund. The fee is paid by Advisers based on average daily net assets, and is not an additional expense of the Fund.
TGB-33
Franklin Templeton Variable Insurance Products Trust
Notes to Financial Statements (continued)
Templeton Global Bond Securities Fund
3. TRANSACTIONS WITH AFFILIATES (contiued)
c. Distribution Fees
The Trust’s Board of Trustees has adopted distribution plans for Class 2, Class 3, and Class 4 shares pursuant to Rule 12b-1 under the 1940 Act. Under the Fund’s compensation distribution plans, the Fund pays Distributors for costs incurred in connection with the servicing, sale and distribution of the Fund’s shares up to 0.25%, 0.35%, and 0.35% per year of its average daily net assets of Class 2, Class 3, and Class 4, respectively. The Board of Trustees has agreed to limit the current rate to 0.25% per year for Class 3.
d. Transfer Agent Fees
Investor Services, under terms of an agreement, performs shareholder servicing for the Fund and is not paid by the Fund for the services.
4. EXPENSE OFFSET ARRANGEMENT
The Fund has entered into an arrangement with its custodian whereby credits realized as a result of uninvested cash balances are used to reduce a portion of the Fund’s custodian expenses. During the year ended December 31, 2010, the custodian fees were reduced as noted in the Statement of Operations.
5. INCOME TAXES
For tax purposes, realized capital losses occurring subsequent to October 31 may be deferred and treated as occurring on the first day of the following fiscal year. At December 31, 2010, the Fund deferred realized capital losses of $1,905,817.
The tax character of distributions paid during the years ended December 31, 2010 and 2009, was as follows:
| | | | | | | | |
| | | 2010 | | | 2009 | |
Distributions paid from: | | | | | | | | |
Ordinary income | | $ | 25,248,824 | | | $ | 191,837,884 | |
Long term capital gain | | | 4,480,058 | | | | — | |
| | | | | | | |
| | $ | 29,728,882 | | | $ | 191,837,884 | |
| | | | | | | |
At December 31, 2010, the cost of investments, net unrealized appreciation (depreciation), undistributed ordinary income and undistributed long term capital gains for income tax purposes were as follows:
| | | | |
Cost of investments | | $ | 1,872,391,708 | |
| | | | |
| |
Unrealized appreciation | | $ | 197,383,981 | |
Unrealized depreciation | | | (24,186,019 | ) |
| | | | |
Net unrealized appreciation (depreciation) | | $ | 173,197,962 | |
| | | | |
Undistributed ordinary income | | $ | 130,755,962 | |
Undistributed long term capital gains | | | 13,176,639 | |
| | | | |
Distributable earnings | | $ | 143,932,601 | |
| | | | |
TGB-34
Franklin Templeton Variable Insurance Products Trust
Notes to Financial Statements (continued)
Templeton Global Bond Securities Fund
5. INCOME TAXES (continued)
Net investment income differs for financial statement and tax purposes primarily due to differing treatments of foreign currency transactions, bond discounts and premiums, interest rate swaps, tax straddles, and inflation related adjustments on foreign securities.
Net realized gains (losses) differ for financial statement and tax purposes primarily due to differing treatments of foreign currency transactions, financial futures transactions, bond discounts and premiums, interest rate swaps, tax straddles, and inflation related adjustments on foreign securities.
6. INVESTMENT TRANSACTIONS
Purchases and sales of investments (excluding short term securities) for the year ended December 31, 2010, aggregated $143,386,820 and $208,264,205, respectively.
7. CREDIT RISK
At December 31, 2010, the Fund had 14.49% of its portfolio invested in high yield or other securities rated below investment grade. These securities may be more sensitive to economic conditions causing greater price volatility and are potentially subject to a greater risk of loss due to default than higher rated securities.
8. CONCENTRATION OF RISK
Investing in foreign securities may include certain risks and considerations not typically associated with investing in U.S. securities, such as fluctuating currency values and changing local and regional economic, political and social conditions, which may result in greater market volatility. In addition, certain foreign securities may not be as liquid as U.S. securities.
9. OTHER DERIVATIVE INFORMATION
At December 31, 2010, the Fund has invested in derivative contracts which are reflected on the Statement of Assets and Liabilities as follows:
| | | | | | | | | | | | |
| | | Asset Derivatives | | | Liability Derivatives | |
Derivative Contracts Not Accounted
for as Hedging Instruments | | Statement of Assets and
Liabilities Location | | Fair
Value
Amount | | | Statement of Assets and
Liabilities Location | | Fair
Value
Amount | |
Interest rate contracts | | Variation margin / Net assets consist of - net unrealized appreciation (depreciation) | | $ | 3,052a | | | Variation margin / Net assets consist of - net unrealized appreciation (depreciation) | | $ | —a | |
Foreign exchange contracts | | Unrealized appreciation on forward exchange contracts | | | 55,649,899 | | | Unrealized depreciation on forward exchange contracts | | | 34,141,144 | |
a Includes cumulative appreciation (depreciation) of futures contracts as reported in the Statement of Investments. Only current day’s variation margin is reported within the Statement of Assets and Liabilities.
TGB-35
Franklin Templeton Variable Insurance Products Trust
Notes to Financial Statements (continued)
Templeton Global Bond Securities Fund
9. OTHER DERIVATIVE INFORMATION (continued)
For the period ended December 31, 2010, the effect of derivative contracts on the Fund’s Statement of Operations was as follows:
| | | | | | | | | | | | | | |
Derivative Contracts Not Accounted
for as Hedging Instruments | | Statement of Operations Locations | | Realized Gain
(Loss) for the
Year | | | Change in
Unrealized
Appreciation
(Depreciation)
for the Year | | | Average
Amount
Outstanding
During the
Yeara | |
Interest rate contracts | | Net realized gain (loss) from futures and swap contracts / Net change in unrealized appreciation (depreciation) on investments | | $ | 1,025,513 | | | $ | (931,474 | ) | | | 580,921 | |
Foreign exchange contracts | | Net realized gain (loss) from foreign currency transactions / Net change in unrealized appreciation (depreciation) on translation of other assets and liabilities denominated in foreign currencies | | | 11,035,722 | | | | 26,207,815 | | | | 1,702,469,755 | |
aRepresents the average notional amount for other derivative contracts outstanding during the period. For derivative contracts denominated in foreign currencies, notional amounts are converted into U.S. dollars.
See Note 1(d) regarding derivative financial instruments.
10. CREDIT FACILITY
The Fund, together with other U.S. registered and foreign investment funds (collectively “Borrowers”), managed by Franklin Templeton Investments, are borrowers in a joint syndicated senior unsecured credit facility totaling $750 million (Global Credit Facility) which matures on January 21, 2011. This Global Credit Facility provides a source of funds to the Borrowers for temporary and emergency purposes, including the ability to meet future unanticipated or unusually large redemption requests.
Under the terms of the Global Credit Facility, the Fund shall, in addition to interest charged on any borrowings made by the Fund and other costs incurred by the Fund, pay its share of fees and expenses incurred in connection with the implementation and maintenance of the Global Credit Facility, based upon its relative share of the aggregate net assets of all of the Borrowers, including an annual commitment fee of 0.10% based upon the unused portion of the Global Credit Facility, which is reflected in other expenses on the Statement of Operations. During the year ended December 31, 2010, the Fund did not use the Global Credit Facility.
Effective January 21, 2011, the Borrowers renewed the Global Credit Facility for a total of $750 million, maturing January 20, 2012.
11. FAIR VALUE MEASUREMENTS
The Fund follows a fair value hierarchy that distinguishes between market data obtained from independent sources (observable inputs) and the Fund’s own market assumptions (unobservable inputs). These inputs are used in determining the value of the Fund’s investments and are summarized in the following fair value hierarchy:
| | • | | Level 1 – quoted prices in active markets for identical securities |
| | • | | Level 2 – other significant observable inputs (including quoted prices for similar securities, interest rates, prepayment speed, credit risk, etc.) |
| | • | | Level 3 – significant unobservable inputs (including the Fund’s own assumptions in determining the fair value of investments) |
TGB-36
Franklin Templeton Variable Insurance Products Trust
Notes to Financial Statements (continued)
Templeton Global Bond Securities Fund
11. FAIR VALUE MEASUREMENTS (continued)
The inputs or methodology used for valuing securities are not an indication of the risk associated with investing in those securities.
For movements between the levels within the fair value hierarchy, the Fund has adopted a policy of recognizing the transfers as of the date of the underlying event which caused the movement.
The following is a summary of the inputs used as of December 31, 2010, in valuing the Fund’s assets and liabilities carried at fair value:
| | | | | | | | | | | | | | | | |
| | | Level 1 | | | Level 2 | | | Level 3 | | | Total | |
| | | | |
Assets: | | | | | | | | | | | | | | | | |
Investments in Securities: | | | | | | | | | | | | | | | | |
Foreign Government and Agency Securities | | $ | — | | | $ | 1,657,735,605 | | | $ | — | | | $ | 1,657,735,605 | |
Municipal Bonds | | | — | | | | 33,827,849 | | | | — | | | | 33,827,849 | |
Short Term Investments | | | — | | | | 354,026,216 | | | | — | | | | 354,026,216 | |
| | | | |
Total Investments in Securities | | $ | — | | | $ | 2,045,589,670 | | | $ | — | | | $ | 2,045,589,670 | |
| | | | |
Forward Exchange Contracts | | | — | | | | 55,649,899 | | | | — | | | | 55,649,899 | |
Futures Contracts | | | 3,052 | | | | — | | | | — | | | | 3,052 | |
Liabilities: | | | | | | | | | | | | | | | | |
Forward Exchange Contracts | | | — | | | | 34,141,144 | | | | — | | | | 34,141,144 | |
12. SUBSEQUENT EVENTS
The Fund has evaluated subsequent events through the issuance of the financial statements and determined that no events have occurred that require disclosure other than those already disclosed in the financial statements.
| | | | |
ABBREVIATIONS | | | | |
| Counterparty | | Currency | | Selected Portfolio |
| | | | |
| BOFA - Bank of America Corp | | AUD - Australian Dollar | | BHAC - Berkshire Hathaway Assurance Corp. |
| BZWS - Barclays Bank PLC | | BRL - Brazilian Real | | FRN - Floating Rate Note |
| CITI - Citigroup, Inc. | | EGP - Egyptian Pound | | GO - General Obligation |
| DBAB - Deutsche Bank AG | | EUR - Euro | | USD - Unified/Union School District |
| FBCO - Credit Suisse Group AG | | IDR - Indonesian Rupiah | | |
| HSBC - HSBC Bank USA, N.A. | | ILS - New Israeli Shekel | | |
| JPHQ - JP Morgan Chase & Co. | | KRW - South Korean Won | | |
| MLCO - Merrill Lynch & Co., Inc. | | LKR - Sri Lankan Rupee | | |
| MSCO - Morgan Stanley | | MXN - Mexican Peso | | |
| UBSW - UBS AG | | MYR - Malaysian Ringgit | | |
| | NOK - Norwegian Krone | | |
| | NZD - New Zealand Dollar | | |
| | PEN - Peruvian Nuevo Sol | | |
| | PHP - Philippine Peso | | |
| | PLN - Polish Zloty | | |
| | SEK - Swedish Krona | | |
TGB-37
Franklin Templeton Variable Insurance Products Trust
Templeton Global Bond Securities Fund
Report of Independent Registered Public Accounting Firm
To the Board of Trustees and Shareholders of Franklin Templeton Variable Insurance Products Trust
In our opinion, the accompanying statement of assets and liabilities, including the statement of investments, and the related statements of operations and of changes in net assets and the financial highlights present fairly, in all material respects, the financial position of Templeton Global Bond Securities Fund (the “Fund”) at December 31, 2010, the results of its operations for the year then ended, the changes in its net assets for each of the two years in the period then ended and the financial highlights for each of the periods presented, in conformity with accounting principles generally accepted in the United States of America. These financial statements and financial highlights (hereafter referred to as “financial statements”) are the responsibility of the Fund’s management. Our responsibility is to express an opinion on these financial statements based on our audits. We conducted our audits of these financial statements in accordance with the standards of the Public Company Accounting Oversight Board (United States). Those standards require that we plan and perform the audit to obtain reasonable assurance about whether the financial statements are free of material misstatement. An audit includes examining, on a test basis, evidence supporting the amounts and disclosures in the financial statements, assessing the accounting principles used and significant estimates made by management, and evaluating the overall financial statement presentation. We believe that our audits, which included confirmation of securities at December 31, 2010 by correspondence with the custodian and brokers, provide a reasonable basis for our opinion.
PricewaterhouseCoopers LLP
San Francisco, California
February 10, 2011
TGB-38
Franklin Templeton Variable Insurance Products Trust
Tax Designation (unaudited)
Templeton Global Bond Securities Fund
Under Section 852(b)(3)(C) of the Internal Revenue Code (Code), the Fund designates the maximum amount allowable but no less than $4,480,058 as a long term capital gain dividend for the fiscal year ended December 31, 2010.
At December 31, 2010, more than 50% of the Fund’s total assets were invested in securities of foreign issuers. In most instances, foreign taxes were withheld from income paid to the Fund on these investments. The Fund elects to treat foreign taxes paid as allowed under Section 853 of the Code. This election will allow shareholders of record as of the 2011 distribution date, to treat their proportionate share of foreign taxes paid by the Fund as having been paid directly by them. The shareholder shall consider these amounts as foreign taxes paid in the tax year in which they receive the Fund distribution.
TGB-39
INDEX DESCRIPTIONS
The indexes are unmanaged and include reinvested distributions.
Barclays Capital (BC) U.S. Aggregate Index is a market capitalization-weighted index representing the U.S. investment-grade, fixed-rate, taxable bond market with index components for government and corporate, mortgage pass-through and asset-backed securities. All issues included are SEC registered, taxable, dollar denominated and nonconvertible, must have at least one year to final maturity and must be rated investment grade (Baa3/BBB-/BBB- or higher) using the middle rating of Moody’s, Standard & Poor’s and Fitch, respectively. STANDARD & POOR’S®, S&P® and S&P 500® are registered trademarks of Standard & Poor’s Financial Services LLC. Standard & Poor’s does not sponsor, endorse, sell or promote any S&P index-based product.
Barclays Capital (BC) U.S. Government Index: Intermediate Component is the intermediate component of the BC U.S. Government Index, which includes public obligations of the U.S. Treasury with at least one year to final maturity and publicly issued debt of U.S. government agencies, quasi-federal corporations, and corporate or foreign debt guaranteed by the U.S. government.
Citigroup World Government Bond Index is a market capitalization-weighted index consisting of investment-grade world government bond markets.
Consumer Price Index (CPI), calculated by the U.S. Bureau of Labor Statistics, is a commonly used measure of the inflation rate.
Credit Suisse (CS) High Yield Index is designed to mirror the investable universe of the U.S. dollar-denominated high yield debt market.
Dow Jones Industrial Average is price weighted based on the average market price of 30 blue chip stocks of companies that are generally industry leaders.
FTSE/EPRA NAREIT Developed Index is a free float-adjusted index designed to measure the performance of publicly traded real estate securities in the North American, European and Asian real estate markets.
J.P. Morgan (JPM) Global Government Bond Index (GGBI) tracks total returns for liquid, fixed-rate, domestic government bonds with maturities greater than one year issued by developed countries globally.
Lipper Multi-Sector Income Funds Classification Average is calculated by averaging the total returns of all funds within the Lipper Multi-Sector Income Funds classification in the Lipper Open-End underlying funds universe. Lipper Multi-Sector Income Funds are defined as funds that seek current income by allocating assets among different fixed income securities sectors (not primarily in one sector except for defensive purposes), including U.S. and foreign governments, with a significant portion rated below investment grade. For the one-year period ended 12/31/10, there were 164 funds in this category. Lipper calculations do not include contract fees, expenses or sales charges, and may have been different if such charges had been considered.
Lipper VIP Equity Income Funds Classification Average is an equally weighted average calculation of performance figures for all funds within the Lipper Equity Income Funds classification in the Lipper VIP underlying funds universe. Lipper Equity Income Funds seek relatively high current income and growth of income through investing 60% or more of their portfolios in equities. For the one-year period ended 12/31/10, there were 61 funds in this category. Lipper calculations do not include contract fees, expenses or sales charges, and may have been different if such charges had been considered.
Lipper VIP General U.S. Government Funds Classification Average is an equally weighted average calculation of performance figures for all funds within the Lipper General U.S. Government Funds classification in the Lipper VIP underlying funds universe. Lipper U.S. Government Funds invest primarily in U.S. government and agency issues. For the one-year period ended 12/31/10, there were 64 funds in this category. Lipper calculations do not include contract fees, expenses or sales charges, and may have been different if such charges had been considered.
Lipper VIP High Current Yield Funds Classification Average is an equally weighted average calculation of performance figures for all funds within the Lipper High Current Yield Funds Classification in the Lipper VIP underlying funds universe. Lipper High Current Yield Funds aim at high (relative) current yield from fixed income securities, have no quality or maturity restrictions, and tend to invest in lower grade debt issues. For the one-year period ended 12/31/10, there were 107 funds in this category. Lipper calculations do not include contract fees, expenses or sales charges, and may have been different if such charges had been considered.
Morgan Stanley Capital International (MSCI) All Country (AC) World Index is a free float-adjusted, market capitalization-weighted index designed to measure equity market performance in global developed and emerging markets.
I-1
Morgan Stanley Capital International (MSCI) Emerging Markets (EM) Index is a free float-adjusted, market capitalization-weighted index designed to measure equity market performance in global emerging markets.
Morgan Stanley Capital International (MSCI) Europe, Australasia, Far East (EAFE) Index is a free float-adjusted, market capitalization-weighted index designed to measure equity market performance in global developed markets excluding the U.S. and Canada.
Morgan Stanley Capital International (MSCI) Europe, Australasia, Far East (EAFE) Index Net Return (Local Currency) is a free float-adjusted, market capitalization-weighted index designed to measure equity market performance of global developed markets excluding the U.S. and Canada. The index is calculated in local currency and includes reinvested daily net dividends.
Morgan Stanley Capital International (MSCI) World Index is a free float-adjusted, market capitalization-weighted index designed to measure equity market performance in global developed markets.
NASDAQ Composite Index is a broad-based, market capitalization-weighted index designed to measure all NASDAQ domestic and international based common type stocks listed on The NASDAQ Stock Market.
Russell 1000® Growth Index is market capitalization weighted and measures performance of those Russell 1000 Index companies with higher price-to-book ratios and higher forecasted growth values.
Russell 1000 Index is market capitalization weighted and measures performance of the largest companies in the Russell 3000 Index, which represent the majority of the U.S. market’s total capitalization.
Russell 1000 Value Index is market capitalization weighted and measures performance of those Russell 1000 Index companies with lower price-to-book ratios and lower forecasted growth values.
Russell 2500™ Index is market capitalization weighted and measures performance of the smallest companies in the Russell 3000 Index, which represent a modest amount of the Russell 3000 Index’s total market capitalization.
Russell 2500 Value Index is market capitalization weighted and measures performance of those Russell 2500 Index companies with lower price-to-book ratios and lower forecasted growth values.
Russell 3000® Growth Index is market capitalization weighted and measures performance of those Russell 3000 Index companies with higher price-to-book ratios and higher forecasted growth values.
Russell 3000 Index is market capitalization weighted and measures performance of the largest U.S. companies based on total market capitalization and represents the majority of the investable U.S. equity market.
Russell Midcap® Growth Index is market capitalization weighted and measures performance of those Russell Midcap Index companies with higher price-to-book ratios and higher forecasted growth values.
Russell Midcap Index is market capitalization weighted and measures performance of the smallest companies in the Russell 1000 Index, which represent a modest amount of the Russell 1000 Index’s total market capitalization.
Standard & Poor’s 500 Index (S&P 500) is a market capitalization-weighted index of 500 stocks designed to measure total U.S. equity market performance.
Standard & Poor’s Global REIT Index is designed to measure performance of the investable universe of publicly traded real estate investment trusts. Index constituents generally derive the majority of their revenue from real estate development, management, rental, and/or direct investment in physical property and with local REIT or property trust tax status.
Standard & Poor’s/International Finance Corporation Investable (S&P/IFCI) Composite Index is a free float-adjusted, market capitalization-weighted index designed to measure equity performance in global emerging markets.
I-2
Board Members and Officers
The name, year of birth and address of the officers and board members, as well as their affiliations, positions held with the Trust, principal occupation during the past five years and number of portfolios overseen in the Franklin Templeton Investments fund complex are shown below. Generally, each board member serves until that person’s successor is elected and qualified.
Independent Board Members
| | | | | | | | |
| Name, Year of Birth and Address | | Position | | Length of
Time Served | | Number of
Portfolios in Fund
Complex Overseen
by Board Member* | | Other Directorships Held |
Harris J. Ashton (1932) One Franklin Parkway San Mateo, CA 94403-1906 | | Trustee | | Since 1988 | | 130 | | Bar-S Foods (meat packing company) (1981-2010). |
|
Principal Occupation During Past 5 Years: Director of various companies; and formerly, Director, RBC Holdings, Inc. (bank holding company) (until 2002); and President, Chief Executive Officer and Chairman of the Board, General Host Corporation (nursery and craft centers) (until 1998). |
Sam Ginn (1937) One Franklin Parkway San Mateo, CA 94403-1906 | | Trustee | | Since 2007 | | 106 | | ICO Global Communications (Holdings) Limited (satellite company). |
|
Principal Occupation During Past 5 Years: Private investor; and formerly, Chairman of the Board, Vodafone AirTouch, PLC (wireless company); Chairman of the Board and Chief Executive Officer, AirTouch Communications (cellular communications) (1993-1998) and Pacific Telesis Group (telephone holding company) (1988-1994). |
Edith E. Holiday (1952) One Franklin Parkway San Mateo, CA 94403-1906 | | Trustee | | Since 2005 | | 130 | | Hess Corporation (exploration and refining of oil and gas), H.J. Heinz Company (processed foods and allied products), RTI International Metals, Inc. (manufacture and distribution of titanium), Canadian National Railway (railroad) and White Mountains Insurance Group, Ltd. (holding company). |
|
Principal Occupation During Past 5 Years: Director or Trustee of various companies and trusts; and formerly, Assistant to the President of the United States and Secretary of the Cabinet (1990-1993); General Counsel to the United States Treasury Department (1989-1990); and Counselor to the Secretary and Assistant Secretary for Public Affairs and Public Liaison-United States Treasury Department (1988-1989). |
J. Michael Luttig (1954) One Franklin Parkway San Mateo, CA 94403-1906 | | Trustee | | Since 2009 | | 130 | | Boeing Capital Corporation (aircraft financing). |
|
Principal Occupation During Past 5 Years: Executive Vice President, General Counsel and member of Executive Council, The Boeing Company; and formerly, Federal Appeals Court Judge, U.S. Court of Appeals for the Fourth Circuit (1991-2006). |
Frank A. Olson (1932) One Franklin Parkway
San Mateo, CA 94403-1906 | | Trustee | | Since 2005 | | 130 | | Hess Corporation (exploration and refining of oil and gas). |
|
Principal Occupation During Past 5 Years: Chairman Emeritus, The Hertz Corporation (car rental) (since 2000) (Chairman of the Board (1980-2000) and Chief Executive Officer (1977-1999)); and formerly, Chairman of the Board, President and Chief Executive Officer, UAL Corporation (airlines). |
BOD-1
| | | | | | | | |
| Name, Year of Birth and Address | | Position | | Length of
Time Served | | Number of
Portfolios in Fund
Complex Overseen
by Board Member* | | Other Directorships Held |
Larry D. Thompson (1945) One Franklin Parkway San Mateo, CA 94403-1906 | | Trustee | | Since 2007 | | 138 | | Cbeyond, Inc. (business communications provider) and The Southern Company (energy company). |
|
Principal Occupation During Past 5 Years: Senior Vice President—Government Affairs, General Counsel and Secretary, PepsiCo, Inc. (consumer products); and formerly, Director, Delta Airlines (aviation) (2003-2005) and Providian Financial Corp. (credit card provider) (1997-2001); Senior Fellow of The Brookings Institution (2003-2004); Visiting Professor, University of Georgia School of Law (2004); and Deputy Attorney General, U.S. Department of Justice (2001-2003). |
John B. Wilson (1959) One Franklin Parkway San Mateo, CA 94403-1906 | | Lead Independent Trustee | | Trustee since 2007 and Lead Independent Trustee since 2008 | | 106 | | None |
|
Principal Occupation During Past 5 Years: President and Founder, Hyannis Port Capital, Inc. (real estate and private equity investing); serves on private and non-profit boards; and formerly, Chief Operating Officer and Executive Vice President, Gap, Inc. (retail) (1996-2000); Chief Financial Officer and Executive Vice President—Finance and Strategy, Staples, Inc. (office supplies) (1992-1996); Senior Vice President—Corporate Planning, Northwest Airlines, Inc. (airlines) (1990-1992); and Vice President and Partner, Bain & Company (consulting firm) (1986-1990). |
Interested Board Members and Officers
| | | | | | | | |
| Name, Year of Birth and Address | | Position | | Length of
Time Served | | Number of
Portfolios in Fund
Complex Overseen
by Board Member* | | Other Directorships Held |
**Charles B. Johnson (1933) One Franklin Parkway San Mateo, CA 94403-1906 | | Trustee and Chairman of the Board | | Trustee since 1988 and Chairman of the Board since 1993 | | 130 | | None |
|
Principal Occupation During Past 5 Years: Chairman of the Board, Member—Office of the Chairman and Director, Franklin Resources, Inc.; and officer and/or director or trustee, as the case may be, of some of the other subsidiaries of Franklin Resources, Inc. and of 41 of the investment companies in Franklin Templeton Investments. |
**Rupert H. Johnson, Jr. (1940) One Franklin Parkway San Mateo, CA 94403-1906 | | Trustee | | Since 1988 | | 50 | | None |
|
Principal Occupation During Past 5 Years: Vice Chairman, Member—Office of the Chairman and Director, Franklin Resources, Inc.; Director, Franklin Advisers, Inc.; Senior Vice President, Franklin Advisory Services, LLC; and officer and/or director or trustee, as the case may be, of some of the other subsidiaries of Franklin Resources, Inc. and of 25 of the investment companies in Franklin Templeton Investments. |
BOD-2
| | | | | | | | |
| Name, Year of Birth and Address | | Position | | Length of
Time Served | | Number of
Portfolios in Fund
Complex Overseen
by Board Member* | | Other Directorships Held |
James M. Davis (1952) One Franklin Parkway San Mateo, CA 94403-1906 | | Chief Compliance Officer and Vice President—AML Compliance | | Chief Compliance Officer since 2004 and Vice President—AML Compliance since 2006 | | Not
Applicable | | Not Applicable |
|
Principal Occupation During Past 5 Years: Director, Global Compliance, Franklin Resources, Inc.; officer of some of the other subsidiaries of Franklin Resources, Inc. and of 45 of the investment companies in Franklin Templeton Investments; and formerly, Director of Compliance, Franklin Resources, Inc. (1994-2001). |
Laura F. Fergerson (1962) One Franklin Parkway San Mateo, CA 94403-1906 | | Chief Executive Officer—Finance and Administration | | Since 2009 | | Not
Applicable | | Not Applicable |
|
Principal Occupation During Past 5 Years: Senior Vice President, Franklin Templeton Services, LLC; officer of 45 of the investment companies in Franklin Templeton Investments; and formerly, Director and member of Audit and Valuation Committees, Runkel Funds, Inc. (2003-2004); Assistant Treasurer of most of the investment companies in Franklin Templeton Investments (1997-2003); and Vice President, Franklin Templeton Services, LLC (1997-2003). |
Gaston Gardey (1967) One Franklin Parkway San Mateo, CA 94403-1906 | | Treasurer, Chief Financial Officer and Chief Accounting Officer | | Since 2009 | | Not
Applicable | | Not Applicable |
|
Principal Occupation During Past 5 Years: Director, Fund Accounting, Franklin Templeton Investments; and officer of 27 of the investment companies in Franklin Templeton Investments. |
Aliya S. Gordon (1973) One Franklin Parkway San Mateo, CA 94403-1906 | | Vice President | | Since 2009 | | Not
Applicable | | Not Applicable |
|
Principal Occupation During Past 5 Years: Senior Associate General Counsel, Franklin Templeton Investments; officer of 45 of the investment companies in Franklin Templeton Investments; and formerly, Litigation Associate, Steefel, Levitt & Weiss, LLP (2000-2004). |
David P. Goss (1947) One Franklin Parkway San Mateo, CA 94403-1906 | | Vice President | | Since 2000 | | Not
Applicable | | Not Applicable |
|
Principal Occupation During Past 5 Years:
Senior Associate General Counsel, Franklin Templeton Investments; and officer and/or director, as the case maybe, of some of the other subsidiaries of Franklin Resources, Inc. and of 46 of the investment companies in Franklin Templeton Investments. |
Steven J. Gray (1955) One Franklin Parkway San Mateo, CA 94403-1906 | | Vice President | | Since 2009 | | Not
Applicable | | Not Applicable |
|
Principal Occupation During Past 5 Years: Senior Associate General Counsel, Franklin Templeton Investments; Vice President, Franklin Templeton Distributors, Inc.; and officer of 45 of the investment companies in Franklin Templeton Investments. |
Edward B. Jamieson (1948) One Franklin Parkway San Mateo, CA 94403-1906 | | President and Chief Executive Officer—Investment Management | | Since
April 2010 | | Not
Applicable | | Not Applicable |
|
Principal Occupation During Past 5 Years: President, Chief Investment Officer and Director, Franklin Advisers, Inc.; Executive Vice President, Franklin Templeton Institutional, LLC; and officer and/or trustee, as the case may be, of some of the other subsidiaries of Franklin Resources, Inc. and of 10 of the investment companies in Franklin Templeton Investments. |
BOD-3
| | | | | | | | |
| Name, Year of Birth and Address | | Position | | Length of
Time Served | | Number of
Portfolios in Fund
Complex Overseen
by Board Member* | | Other Directorships Held |
Robert C. Rosselot (1960) 500 East Broward Blvd. Suite 2100 Fort Lauderdale, FL 33394-3091 | | Vice President | | Since 2009 | | Not
Applicable | | Not Applicable |
|
Principal Occupation During Past 5 Years: Senior Associate General Counsel, Franklin Templeton Investments; Assistant Secretary, Franklin Resources, Inc.; Vice President and Secretary, Templeton Investment Counsel, LLC; Vice President, Secretary and Trust Officer, Fiduciary Trust International of the South; and officer of 45 of the investment companies in Franklin Templeton Investments. |
Karen L. Skidmore (1952) One Franklin Parkway San Mateo, CA 94403-1906 | | Vice President and Secretary | | Since 2006 | | Not
Applicable | | Not Applicable |
|
Principal Occupation During Past 5 Years: Senior Associate General Counsel, Franklin Templeton Investments; and officer of 45 of the investment companies in Franklin Templeton Investments. |
Craig S. Tyle (1960) One Franklin Parkway San Mateo, CA 94403-1906 | | Vice President | | Since 2005 | | Not
Applicable | | Not Applicable |
|
Principal Occupation During Past 5 Years: General Counsel and Executive Vice President, Franklin Resources, Inc.; officer of some of the other subsidiaries of Franklin Resources, Inc. and of 45 of the investment companies in Franklin Templeton Investments; and formerly, Partner, Shearman & Sterling, LLP (2004-2005); and General Counsel, Investment Company Institute (ICI) (1997-2004). |
| *We | base the number of portfolios on each separate series of the U.S. registered investment companies within the Franklin Templeton Investments fund complex. These portfolios have a common investment manager or affiliated investment managers. |
| **Charles | B. Johnson and Rupert H. Johnson, Jr. are considered to be interested persons of the Trust under the federal securities laws due to their positions as officers and directors and major shareholders of Franklin Resources, Inc., which is the parent company of the Trust’s investment manager and distributor. |
Note 1: Charles B. Johnson and Rupert H. Johnson, Jr. are brothers.
Note 2: Officer information is current as of the date of this report. It is possible that after this date, information about officers may change.
Note 3: Prior to December 31, 2010, Frank W.T. LaHaye ceased to be a trustee of the Trust.
| *We | base the number of portfolios on each separate series of the U.S. registered investment companies within the Franklin Templeton Investments fund complex. These portfolios have a common investment manager or affiliated investment managers. |
| **Charles | B. Johnson and Rupert H. Johnson, Jr. are considered to be interested persons of the Trust under the federal securities laws due to their positions as officers and directors and major shareholders of Franklin Resources, Inc., which is the parent company of the Trust’s investment manager and distributor. |
Note 1: Charles B. Johnson and Rupert H. Johnson, Jr. are brothers and the father and uncle, respectively, of Jennifer J. Bolt.
Note 2: Officer information is current as of the date of this report. It is possible that after this date, information about officers may change.
The Sarbanes-Oxley Act of 2002 and Rules adopted by the Securities and Exchange Commission require the Fund to disclose whether the Fund’s Audit Committee includes at least one member who is an audit committee financial expert within the meaning of such Act and Rules. The Fund’s Board has determined that there is at least one such financial expert on the Audit Committee and has designated John B. Wilson as its audit committee financial expert. The Board believes that Mr. Wilson qualifies as such an expert in view of his extensive business background and experience, including service as chief financial officer of Staples, Inc. from 1992 to 1996. Mr. Wilson has been a Member and Chairman of the Fund’s Audit Committee since 2007. As a result of such background and experience, the Board believes that Mr. Wilson has acquired an understanding of generally accepted accounting principles and financial statements, the general application of such principles in connection with the accounting estimates, accruals and reserves, and analyzing and evaluating financial statements that present a breadth and level of complexity of accounting issues generally comparable to those of the Fund, as well as an understanding of internal controls and procedures for financial reporting and an understanding of audit committee functions. Mr. Wilson is an independent Board member as that term is defined under the relevant Securities and Exchange Commission Rules and Releases.
The Statement of Additional Information (SAI) includes additional information about the board members and is available, without charge, upon request. Shareholders may call (800) 321-8563 or their insurance companies to request the SAI.
BOD-4
Franklin Templeton Variable Insurance Products Trust
Shareholder Information
Proxy Voting Policies and Procedures
The Trust’s investment manager has established Proxy Voting Policies and Procedures (Policies) that the Trust uses to determine how to vote proxies relating to portfolio securities. Shareholders may view the Trust’s complete Policies online at franklintempleton.com. Alternatively, shareholders may request copies of the Policies free of charge by calling the Proxy Group collect at (954) 527-7678 or by sending a written request to: Franklin Templeton Companies, LLC, 500 East Broward Boulevard, Suite 1500, Fort Lauderdale, FL 33394, Attention: Proxy Group. Copies of the Trust’s proxy voting records are also made available online at franklintempleton.com and posted on the U.S. Securities and Exchange Commission’s website at sec.gov and reflect the most recent 12-month period ended June 30.
Quarterly Statement of Investments
The Trust files a complete statement of investments with the U.S. Securities and Exchange Commission for the first and third quarters for each fiscal year on Form N-Q. Shareholders may view the filed Form N-Q by visiting the Commission’s website at sec.gov. The filed form may also be viewed and copied at the Commission’s Public Reference Room in Washington, DC. Information regarding the operations of the Public Reference Room may be obtained by calling (800) SEC-0330.
SI-1
| | | | | | | | | | | | | | | | |
| VALUE | | BLEND | | GROWTH | | SECTOR | | GLOBAL | | INTERNATIONAL | | HYBRID | | ASSET ALLOCATION | | FIXED INCOME |
| | |
 | | < GAIN FROM OUR PERSPECTIVE® > |
Annual Report
FRANKLIN TEMPLETON
VARIABLE INSURANCE PRODUCTS TRUST
Investment Managers
Franklin Advisers, Inc.
Franklin Advisory Services, LLC
Franklin Mutual Advisers, LLC
Franklin Templeton Institutional, LLC
Templeton Asset Management, Ltd.
Templeton Global Advisors Limited
Templeton Investment Counsel, LLC
Fund Administrator
Franklin Templeton Services, LLC
Distributor
Franklin Templeton Distributors, Inc.
Franklin Templeton Variable Insurance Products Trust (FTVIP) shares are generally sold to insurance company separate accounts (Separate Account) to serve as the investment vehicles for both variable annuity and variable life insurance contracts and to certain funds of funds.
Authorized for distribution to investors in Separate Accounts only when accompanied or preceded by the current prospectus for the applicable contract, which includes the Separate Account and the FTVIP prospectuses. Investors should carefully consider a fund’s investment goals, risks, charges and expenses before investing. The prospectus contains this and other information; please read it carefully before investing.
To ensure the highest quality of service, telephone calls to or from our service departments may be monitored, recorded and accessed. These calls can be identified by the presence of a regular beeping tone.
| | |
| © 2011 Franklin Templeton Investments. All rights reserved. | | FTVIP A 02/11 |
| (a) | The Registrant has adopted a code of ethics that applies to its principal executive officers and principal financial and accounting officer. |
| (f) | Pursuant to Item 12 (a) (1), the Registrant is attaching as an exhibit a copy of its code of ethics that applies to its principal executive officers and principal financial and accounting officer. |
| Item 3. | Audit Committee Financial Expert. |
| | | | |
| (a) | | (1) | | The Registrant has an audit committee financial expert serving on its audit committee. |
| | |
| | (2) | | The audit committee financial expert is John B. Wilson and he is “independent” as defined under the relevant Securities and Exchange Commission Rules and Releases. |
| Item 4. | Principal Accountant Fees and Services. |
(a) Audit Fees
The aggregate fees paid to the principal accountant for professional services rendered by the principal accountant for the audit of the registrant’s annual financial statements or for services that are normally provided by the principal accountant in connection with statutory and regulatory filings or engagements were $849,457 for the fiscal year ended December 31, 2010 and $906,023 for the fiscal year ended December 31, 2009.
(b) Audit-Related Fees
There were no fees paid to the principal accountant for assurance and related services rendered by the principal accountant to the registrant that are reasonably related to the performance of the audit of the registrant’s financial statements and are not reported under paragraph (a) of Item 4.
There were no fees paid to the principal accountant for assurance and related services rendered by the principal accountant to the registrant’s investment adviser and any entity controlling, controlled by or under common control with the investment adviser that provides ongoing services to the registrant that are reasonably related to the performance of the audit of their financial statements.
(c) Tax Fees
The aggregate fees paid to the principal accountant for professional services rendered by the principal accountant to the registrant for tax compliance, tax advice and tax planning were $1,290 for the fiscal year ended December 31, 2010 and $1,250 for the fiscal year ended December 31, 2009. The services for which these fees were paid included preparation of tax returns for foreign governments.
The aggregate fees paid to the principal accountant for professional services rendered by the principal accountant to the registrant’s investment adviser and any entity controlling, controlled by or under common control with the investment adviser that provides ongoing services to the registrant for tax compliance, tax advice and tax planning were $35,000 for the fiscal year ended December 31, 2010 and $2,000 for the fiscal year ended December 31, 2009. The services for which these fees were paid included technical tax consultation for capital gain tax reporting to foreign governments and derivative instruments.
(d) All Other Fees
The aggregate fees paid to the principal accountant for products and services rendered by the principal accountant to the registrant not reported in paragraphs (a)-(c) of Item 4 were $12,501 for the fiscal year ended December 31, 2010 and $0 for the fiscal year ended December 31, 2009. The services for which these fees were paid include review of materials provided to the fund Board in connection with the investment management contract renewal process.
The aggregate fees paid to the principal accountant for products and services rendered by the principal accountant to the registrant’s investment adviser and any entity controlling, controlled by or under common control with the investment adviser that provides ongoing
services to the registrant other than services reported in paragraphs (a)-(c) of Item 4 were $132,299 for the fiscal year ended December 31, 2010 and $0 for the fiscal year ended December 31, 2009. The services for which these fees were paid include review of materials provided to the fund Board in connection with the investment management contract renewal process.
(e) (1) The registrant’s audit committee is directly responsible for approving the services to be provided by the auditors, including:
(i) pre-approval of all audit and audit related services;
(ii) pre-approval of all non-audit related services to be provided to the Fund by the auditors;
(iii) pre-approval of all non-audit related services to be provided to the registrant by the auditors to the registrant’s investment adviser or to any entity that controls, is controlled by or is under common control with the registrant’s investment adviser and that provides ongoing services to the registrant where the non-audit services relate directly to the operations or financial reporting of the registrant; and
(iv) establishment by the audit committee, if deemed necessary or appropriate, as an alternative to committee pre-approval of services to be provided by the auditors, as required by paragraphs (ii) and (iii) above, of policies and procedures to permit such services to be pre-approved by other means, such as through establishment of guidelines or by action of a designated member or members of the committee; provided the policies and procedures are detailed as to the particular service and the committee is informed of each service and such policies and procedures do not include delegation of audit committee responsibilities, as contemplated under the Securities Exchange Act of 1934, to management; subject, in the case of (ii) through (iv), to any waivers, exceptions or exemptions that may be available under applicable law or rules.
(e) (2) None of the services provided to the registrant described in paragraphs (b)-(d) of Item 4 were approved by the audit committee pursuant to paragraph (c)(7)(i)(C) of Rule 2-01 of regulation S-X.
(f) No disclosures are required by this Item 4(f).
(g) The aggregate non-audit fees paid to the principal accountant for services rendered by the principal accountant to the registrant and the registrant’s investment adviser and any entity controlling, controlled by or under common control with the investment adviser that provides ongoing services to the registrant were $181,090 for the fiscal year ended December 31, 2010 and $3,250 for the fiscal year ended December 31, 2009.
(h) The registrant’s audit committee of the board has considered whether the provision of non-audit services that were rendered to the registrant’s investment adviser (not including any sub-adviser whose role is primarily portfolio management and is subcontracted with or overseen by another investment adviser), and any entity controlling, controlled by, or under common control with the investment adviser that
provides ongoing services to the registrant that were not pre-approved pursuant to paragraph (c)(7)(ii) of Rule 2-01 of Regulation S-X is compatible with maintaining the principal accountant’s independence.
| Item 5. | Audit Committee of Listed Registrants. N/A |
| Item 6. | Schedule of Investments. N/A |
| Item 7. | Disclosure of Proxy Voting Policies and Procedures for Closed-End Management Investment Companies. N/A |
| Item 8. | Portfolio Managers of Closed-End Management Investment Companies. N/A |
| Item 9. | Purchases of Equity Securities by Closed-End Management Investment Companies and Affiliated Purchasers N/A |
| Item 10. | Submission of Matters to a vote of Security Holders. |
There have been no changes to the procedures by which shareholders may recommend nominees to the Registrant’s Board of Trustees that would require disclosure herein.
| Item 11. | Controls and Procedures. |
(a) Evaluation of Disclosure Controls and Procedures. The Registrant maintains disclosure controls and procedures that are designed to ensure that information required to be disclosed in the Registrant’s filings under the Securities Exchange Act of 1934 and the Investment Company Act of 1940 is recorded, processed, summarized and reported within the periods specified in the rules and forms of the Securities and Exchange Commission. Such information is accumulated and communicated to the Registrant’s management, including its principal executive officer and principal financial officer, as appropriate, to allow timely decisions regarding required disclosure. The Registrant’s management, including the principal executive officer and the principal financial officer, recognizes that any set of controls and procedures, no matter how well designed and operated, can provide only reasonable assurance of achieving the desired control objectives.
Within 90 days prior to the filing date of this Shareholder Report on Form N-CSR, the Registrant had carried out an evaluation, under the supervision and with the participation of the Registrant’s management, including the Registrant’s principal executive officer and the Registrant’s principal financial officer, of the effectiveness of the design and operation of the Registrant’s disclosure controls and procedures. Based on such evaluation, the Registrant’s principal executive officer and principal financial officer concluded that the Registrant’s disclosure controls and procedures are effective.
(b) Changes in Internal Controls. There have been no significant changes in the Registrant’s internal controls or in other factors that could significantly affect the internal controls subsequent to the date of their evaluation in connection with the preparation of this Shareholder Report on Form N-CSR.
(a) (1) Code of Ethics
(a) (2) Certifications pursuant to Section 302 of the Sarbanes-Oxley Act of 2002 of Laura F. Fergerson, Chief Executive Officer - Finance and Administration, and Gaston Gardey, Chief Financial Officer and Chief Accounting Officer
(b) Certifications pursuant to Section 906 of the Sarbanes-Oxley Act of 2002 of Laura F. Fergerson, Chief Executive Officer - Finance and Administration, and Gaston Gardey, Chief Financial Officer and Chief Accounting Officer
SIGNATURES
Pursuant to the requirements of the Securities Exchange Act of 1934 and the Investment Company Act of 1940, the registrant has duly caused this report to be signed on its behalf by the undersigned, thereunto duly authorized.
FRANKLIN TEMPLETON VARIABLE INSURANCE PRODUCTS TRUST
| | |
| By: | | /s/ Laura F. Fergerson |
| | Laura F. Fergerson |
| | Chief Executive Officer – Finance and Administration |
| Date | | February 25, 2011 |
Pursuant to the requirements of the Securities Exchange Act of 1934 and the Investment Company Act of 1940, this report has been signed below by the following persons on behalf of the registrant and in the capacities and on the dates indicated.
| | |
| By: | | /s/ Laura F. Fergerson |
| | Laura F. Fergerson |
| | Chief Executive Officer – Finance and Administration |
| Date | | February 25, 2011 |
| |
| By: | | /s/ Gaston Gardey |
| | Gaston Gardey |
| | |
| | Chief Financial Officer and |
| | Chief Accounting Officer |
| Date | | February 25, 2011 |