UNITED STATES
SECURITIES AND EXCHANGE COMMISSION
Washington, D.C. 20549
FORM N-CSR
CERTIFIED SHAREHOLDER REPORT OF REGISTERED
MANAGEMENT INVESTMENT COMPANIES
| | |
Investment Company Act file number | | 811-05583 |
Franklin Templeton Variable Insurance Products Trust
|
| (Exact name of registrant as specified in charter) |
| | |
| One Franklin Parkway, San Mateo, CA | | 94403-1906 |
| (Address of principal executive offices) | | (Zip code) |
Craig S. Tyle, One Franklin Parkway, San Mateo, CA 94403-1906
|
| (Name and address of agent for service) |
Registrant’s telephone number, including area code: (650) 312-2000
Date of fiscal year end: 12/31
Date of reporting period: 12/31/08
| Item 1. | Reports to Stockholders. |

DECEMBER 31, 2008
FRANKLIN TEMPLETON
VARIABLE INSURANCE PRODUCTS TRUST
ANNUAL REPORT

FRANKLIN TEMPLETON VARIABLE INSURANCE PRODUCTS TRUST ANNUAL REPORT
TABLEOF CONTENTS
*Not part of the annual report
NOT FDIC INSURED | MAY LOSE VALUE | NO BANK GUARANTEE
MASTER CLASS – 1
IMPORTANT NOTESTO PERFORMANCE INFORMATION
Performance data is historical and cannot predict or guarantee future results. Principal value and investment return will fluctuate with market conditions, and you may have a gain or loss when you withdraw your money. Inception dates of the funds may have preceded the effective dates of the subaccounts, contracts, or their availability in all states.
When reviewing the index comparisons, please keep in mind that indexes have a number of inherent performance differentials over the funds. First, unlike the funds, which must hold a minimum amount of cash to maintain liquidity, indexes do not have a cash component. Second, the funds are actively managed and, thus, are subject to management fees to cover salaries of securities analysts or portfolio managers in addition to other expenses. Indexes are unmanaged and do not include any commissions or other expenses typically associated with investing in securities. Third, indexes often contain a different mix of securities than the fund to which they are compared. Additionally, please remember that indexes are simply a measure of performance and cannot be invested in directly.
i
FRANKLIN GLOBAL COMMUNICATIONS SECURITIES FUND
This annual report for Franklin Global Communications Securities Fund covers the fiscal year ended December 31, 2008.
Performance Summary as of 12/31/08
Average annual total return of Class 1 shares represents the average annual change in value, assuming reinvestment of dividends and capital gains. Average returns smooth out variations in returns, which can be significant; they are not the same as year-by-year results.
Periods ended 12/31/08
| | | | | | |
| | | 1-Year | | 5-Year | | 10-Year |
Average Annual Total Return | | -45.96% | | +2.25% | | -3.59% |
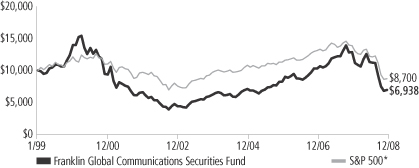
Total Return Index Comparison for a Hypothetical $10,000 Investment (1/1/99–12/31/08)
The graph below shows the change in value of a hypothetical $10,000 investment in the Fund over the indicated period and includes reinvestment of any income or distributions. The Fund’s performance is compared to the performance of the Standard & Poor’s 500 Index (S&P 500). One cannot invest directly in an index, nor is an index representative of the Fund’s portfolio. Please see Important Notes to Performance Information preceding the Fund Summaries.
*Source: © 2009 Morningstar. Please see Index Descriptions following the Fund Summaries.
Franklin Global Communications Securities Fund – Class 1
Performance reflects the Fund’s Class 1 operating expenses, but does not include any contract fees, expenses or sales charges. If they had been included, performance would be lower. These charges and deductions, particularly for variable life policies, can have a significant effect on contract values and insurance benefits. See the contract prospectus for a complete description of these expenses, including sales charges.
Performance data represent past performance, which does not guarantee future results. Investment return and principal value will fluctuate, and you may have a gain or loss when you sell your shares.
Current performance may differ from figures shown.
FGC-1
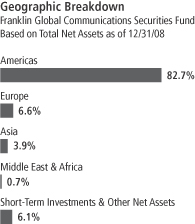
Fund Goals and Main Investments: Franklin Global Communications Securities Fund seeks capital appreciation and current income. The Fund normally invests at least 80% of its net assets in investments of communications companies anywhere in the world and normally invests primarily to predominantly in equity securities.
Performance Overview
You can find the Fund’s one-year total return in the Performance Summary. The Fund underperformed its broad benchmark, the S&P 500, which had a -37.00% total return for the period under review.1, 2
Economic and Market Overview
In 2008, economic conditions deteriorated. The Conference Board’s Consumer Confidence Index fell to an all-time low since it began in 1967 as the U.S. economy faltered and stock markets declined. The government’s abrupt conservatorship of Fannie Mae and Freddie Mac and the failure of several blue-chip banks and financial institutions roiled equity markets. Despite government interventions and massive emergency funding, the nation’s economic troubles were exacerbated as manufacturing activity weakened at its fastest pace in nearly 30 years and as home prices continued to fall. Jobless claims mounted and the unemployment rate rose to 7.2% by period-end.3 Economic growth, as measured by gross domestic product (GDP) rebounded from a 0.9% annualized rate in the first quarter of 2008 to a 2.8% annualized pace in the second quarter, largely due to strong exports and government spending. However, in the third and fourth quarters of 2008, GDP fell at annualized rates of 0.5% and an estimated 3.8%, reflecting a broad-based contraction in consumer spending, falling corporate profits and slowing export growth.
Oil prices soared to a record high in July, rising above $145 per barrel, before dramatically retreating to $45 by period-end. Many other commodities such as agricultural products and precious and base metals followed similar trends. Partially as a result of the steep price corrections, inflation declined significantly late in the review period, and December’s inflation rate was an annualized 0.1%.3 Core inflation, which excludes
1. Sources: © 2009 Morningstar. One cannot invest directly in an index, nor is an index representative of the Fund’s portfolio. Please see Index Descriptions following the Fund Summaries.
2. In past reports, we have included comparative performance information for the Bloomberg World Communications Index as a narrow benchmark; however, during the period under review, complete information for that index was not available as of the report’s print deadline.
3. Source: Bureau of Labor Statistics.
Fund Risks: The Fund’s investments in stocks offer the potential for long-term gains but can be subject to short-term price fluctuations. By investing predominantly in communications companies, the Fund carries much greater risk of adverse developments affecting the communications sector, and among those companies, than a fund that invests more broadly. Foreign investing, especially in emerging markets, involves additional risks, including currency fluctuations, economic instability, market volatility, and political and social instability. Smaller and midsize companies have historically been more volatile in price than larger company securities, especially over the short term. High portfolio turnover may involve additional expenses to the Fund. The Fund’s prospectus also includes a description of the main investment risks.
FGC-2
food and energy costs, rose at a 1.8% annual rate; this level was within the Federal Reserve Board’s (Fed’s) informal target range of 1.5%–2.0%.3
A slowing economy and decelerating inflation prompted policymakers to further lower interest rates and enact stimulus plans. During the year under review, the Fed lowered the federal funds target rate to a range of 0% to 0.25% from 4.25% at the start of the reporting period. The Fed and U.S. Treasury Department also introduced new programs such as the Primary Dealer Credit Facility (PDCF) and the Troubled Asset Relief Program (TARP), which were intended to enhance market liquidity.
Volatility remained high throughout the reporting period but intensified in the latter half of the year as stocks fluctuated wildly and Treasury prices soared. The year was among the worst in history for U.S. stock market performance. For the 12 months under review, the blue chip stocks of the Dow Jones Industrial Average had a total return of -31.93%, the broader S&P 500 a -37.00% total return, and the technology-heavy NASDAQ Composite Index a -40.03% total return.4 All sectors lost value, and the financials, materials and information technology sectors had the largest declines.
Investment Strategy
We are research-driven, fundamental investors. As bottom-up investors focusing primarily on individual securities, we seek companies that have identifiable drivers of future earnings growth and that present, in our opinion, the best trade-off between potential earnings growth, business and financial risk, and valuation. We rely on a team of analysts to help provide in-depth industry expertise within the communications industry and use both qualitative and quantitative analysis to evaluate companies for distinct, sustainable and competitive advantages likely to lead to growth in earnings and/or share price. Competitive advantages such as a particular marketing niche, proven technology, sound financial profits and records, or strong management are all factors we believe may contribute to growth in earnings or share price.
Manager’s Discussion
During this challenging year under review, the communications sector felt the negative effects of the global economic downturn and concerns that business and consumer spending might decline. Revenue growth for NII Holdings, which provides mobile communications services to Latin American markets, suffered in the fourth quarter due to significant depreciation of Latin American currencies. Norwegian
4. Source: © 2009 Morningstar. Please see Index Descriptions following the Fund Summaries.
FGC-3
diversified services provider Telenor experienced reduced revenue growth largely resulting from the global economic slowdown and strong competition in Asia. The Fund’s investment in U.S.-based wireless tower operator SBA Communications also declined due to weakened demand for wireless services.
In contrast, a few Fund holdings aided results. Shares of Centennial Communications, a U.S.-based wireless service provider, rose after the company announced it would be acquired by AT&T. BCE, Canada’s largest communications company, also had a share price increase after it reinstated dividends following the failure of its privatization plan. The Fund’s performance also benefited from its investment in F5 Networks. This U.S.-based manufacturer of computer network traffic routers received a significant boost in profits after demand for its new entry-level products outgrew supply and created a significant year-end backlog.
Thank you for your participation in Franklin Global Communications Securities Fund.
The foregoing information reflects our analysis, opinions and portfolio holdings as of December 31, 2008, the end of the reporting period. The way we implement our main investment strategies and the resulting portfolio holdings may change depending on factors such as market and economic conditions. These opinions may not be relied upon as investment advice or an offer for a particular security. The information is not a complete analysis of every aspect of any market, country, industry, security or the Fund. Statements of fact are from sources considered reliable, but the investment manager makes no representation or warranty as to their completeness or accuracy. Although historical performance is no guarantee of future results, these insights may help you understand our investment management philosophy.
Top 10 Holdings
Franklin Global Communications Securities Fund 12/31/08
| | |
Company
Sector/Industry | | % of Total
Net Assets |
| |
| American Tower Corp., A | | 5.0% |
| Wireless Telecommunication Services, U.S. | | |
| |
| QUALCOMM Inc. | | 4.8% |
| Communications Equipment, U.S. | | |
| |
| Rogers Communications Inc., B | | 4.7% |
| Wireless Telecommunication Services, Canada | | |
| |
| MetroPCS Communications Inc. | | 4.5% |
| Wireless Telecommunication Services, U.S. | | |
| |
| NII Holdings Inc. | | 4.3% |
| Wireless Telecommunication Services, U.S. | | |
| |
| Centennial Communications Corp., A | | 4.0% |
| Wireless Telecommunication Services, U.S. | | |
| |
| Nokia Corp., ADR | | 4.0% |
| Communications Equipment, Finland | | |
| |
| AT&T Inc. | | 3.8% |
| Diversified Telecommunication Services, U.S. | | |
| |
| SBA Communications Corp. | | 3.5% |
| Wireless Telecommunication Services, U.S. | | |
| |
| Apple Inc. | | 3.3% |
| Computers & Peripherals, U.S. | | |
The dollar value, number of shares or principal amount, and names of all portfolio holdings are listed in the Fund’s Statement of Investments.
FGC-4
Fund Expenses
As an investor in a variable insurance contract (Contract) that indirectly provides for investment in an underlying mutual fund, you can incur transaction and/or ongoing expenses at both the Fund level and the Contract level.
| • | | Transaction expenses can include sales charges (loads) on purchases, redemption fees, surrender fees, transfer fees and premium taxes. |
| • | | Ongoing expenses can include management fees, distribution and service (12b-1) fees, contract fees, annual maintenance fees, mortality and expense risk fees and other fees and expenses. All mutual funds and Contracts have some types of ongoing expenses. |
The expenses shown in the table are meant to highlight ongoing expenses at the Fund level only and do not include ongoing expenses at the Contract level, or transaction expenses at either the Fund or Contract level. While the Fund does not have transaction expenses, if the transaction and ongoing expenses at the Contract level were included, the expenses shown would be higher. You should consult your Contract prospectus or disclosure document for more information.
The table shows Fund-level ongoing expenses and can help you understand these expenses and compare them with those of other mutual funds offered through the Contract. The table assumes a $1,000 investment held for the six months indicated. Please refer to the Fund prospectus for additional information on operating expenses.
Actual Fund Expenses
The first line (Actual) of the table provides actual account values and expenses. The “Ending Account Value” is derived from the Fund’s actual return, which includes the effect of ongoing Fund expenses, but does not include the effect of ongoing Contract expenses.
You can estimate the Fund-level expenses you incurred during the period by following these steps. Of course, your account value and expenses will differ from those in this illustration:
| 1. | Divide your account value by $1,000. |
If an account had an $8,600 value, then $8,600 ÷ $1,000 = 8.6.
| 2. | Multiply the result by the number under the heading “Fund-Level Expenses Incurred During Period.” |
If Fund-Level Expenses Incurred During Period were $7.50, then 8.6 x $7.50 = $64.50.
In this illustration, the estimated expenses incurred this period at the Fund level are $64.50.
Franklin Global Communications Securities Fund – Class 1
FGC-5
Hypothetical Example for Comparison with Other Mutual Funds
Information in the second line (Hypothetical) of the table can help you compare ongoing expenses of the Fund with those of other mutual funds offered through the Contract. This information may not be used to estimate the actual ending account balance or expenses you incurred during the period. The hypothetical “Ending Account Value” is based on the Fund’s actual expense ratio and an assumed 5% annual rate of return before expenses, which does not represent the Fund’s actual return. The figure under the heading “Fund-Level Expenses Incurred During Period” shows the hypothetical expenses your account would have incurred under this scenario. You can compare this figure with the 5% hypothetical examples that appear in shareholder reports of other funds offered through a Contract.
| | | | | | | | | |
| Class 1 | | Beginning
Account
Value 7/1/08 | | Ending
Account
Value 12/31/08 | | Fund-Level
Expenses Incurred
During Period*
7/1/08–12/31/08 |
Actual | | $ | 1,000 | | $ | 615.30 | | $ | 2.68 |
Hypothetical (5% return before expenses) | | $ | 1,000 | | $ | 1,021.82 | | $ | 3.35 |
*Expenses are calculated using the most recent six-month annualized expense ratio for the Fund’s Class 1 shares (0.66%), which does not include any ongoing expenses of the Contract for which the Fund is an investment option, multiplied by the average account value over the period, multiplied by 184/366 to reflect the one-half year period.
FGC-6
SUPPLEMENT DATED OCTOBER 15, 2008
TOTHE PROSPECTUS DATED MAY 1, 2008
OF
FRANKLIN GLOBAL COMMUNICATIONS SECURITIES FUND
ASERIESOF FRANKLIN TEMPLETON VARIABLE INSURANCE PRODUCTS TRUST
The prospectus is amended to add the following:
On September 19, 2008, the Board of Trustees (the “Board”) of Franklin Templeton Variable Insurance Products Trust (the “Trust”) approved a proposal to liquidate the Franklin Global Communications Securities Fund (the “Fund”) on or after April 24, 2009 (the “liquidation”).
The Board approved the liquidation in the ordinary course of business after considering a number of factors including the Fund’s significant decline in assets over the last decade as well as limited future opportunities for asset growth.
Contract owners should refer to documents provided by their insurance companies concerning the effect of the liquidation and any steps they may need to take. In addition, in considering new purchases or transfers, contract owners may want to refer to their contract and Trust prospectuses or consult with their investment representatives to consider other investment options.
Please keep this supplement for future reference.
FGC-7
Franklin Templeton Variable Insurance Products Trust
Financial Highlights
Franklin Global Communications Securities Fund
| | | | | | | | | | | | | | | | | | | |
| | | Year Ended December 31, | |
| Class 1 | | 2008 | | | 2007 | | 2006 | | | 2005 | | | 2004 | |
| | | | |
Per share operating performance | | | | | | | | | | | | | | | | | | | |
(for a share outstanding throughout the year) | | | | | | | | | | | | | | | | | | | |
Net asset value, beginning of year | | $ | 12.52 | | | $ | 10.06 | | $ | 8.09 | | | $ | 7.17 | | | $ | 6.32 | |
| | | | |
Income from investment operationsa: | | | | | | | | | | | | | | | | | | | |
Net investment income (loss)b | | | 0.03 | | | | 0.04 | | | (0.01 | ) | | | 0.04 | | | | 0.05 | |
Net realized and unrealized gains (losses) | | | (5.77 | ) | | | 2.42 | | | 2.01 | | | | 1.08 | | | | 0.87 | |
| | | | |
Total from investment operations | | | (5.74 | ) | | | 2.46 | | | 2.00 | | | | 1.12 | | | | 0.92 | |
| | | | |
Less distributions from net investment income | | | (0.03 | ) | | | — | | | (0.03 | ) | | | (0.20 | ) | | | (0.07 | ) |
| | | | |
Net asset value, end of year | | $ | 6.75 | | | $ | 12.52 | | $ | 10.06 | | | $ | 8.09 | | | $ | 7.17 | |
| | | | |
| | | | | |
Total returnc | | | (45.96)% | | | | 24.58% | | | 24.69% | | | | 16.12% | | | | 14.66% | |
Ratios to average net assets | | | | | | | | | | | | | | | | | | | |
Expensesd | | | 0.65% | | | | 0.61% | | | 0.67% | | | | 0.65% | | | | 0.64% | |
Net investment income (loss) | | | 0.35% | | | | 0.30% | | | (0.13)% | | | | 0.63% | | | | 0.85% | |
| | | | | |
Supplemental data | | | | | | | | | | | | | | | | | | | |
Net assets, end of year (000’s) | | $ | 69,480 | | | $ | 152,519 | | $ | 145,425 | | | $ | 138,015 | | | $ | 142,898 | |
Portfolio turnover rate | | | 37.97% | | | | 93.43% | | | 134.21% | | | | 170.40% | | | | 178.52% | |
aThe amount shown for a share outstanding throughout the period may not correlate with the Statement of Operations for the period due to the timing of sales and repurchases of the Fund shares in relation to income earned and/or fluctuating market value of the investments of the Fund.
bBased on average daily shares outstanding.
cTotal return does not include any fees, charges or expenses imposed by the variable annuity and life insurance contracts for which the Franklin Templeton Variable Insurance Products Trust serves as an underlying investment vehicle.
dBenefit of expense reduction rounds to less than 0.01%.
The accompanying notes are an integral part of these financial statements.
FGC-8
Franklin Templeton Variable Insurance Products Trust
Financial Highlights (continued)
Franklin Global Communications Securities Fund
| | | | | | | | | | | | | | | | | | | | |
| | | Year Ended December 31, | |
| Class 2 | | 2008 | | | 2007 | | | 2006 | | | 2005 | | | 2004 | |
| | | | |
Per share operating performance | | | | | | | | | | | | | | | | | | | | |
(for a share outstanding throughout the year) | | | | | | | | | | | | | | | | | | | | |
Net asset value, beginning of year | | $ | 12.34 | | | $ | 9.94 | | | $ | 8.00 | | | $ | 7.10 | | | $ | 6.28 | |
| | | | |
Income from investment operationsa: | | | | | | | | | | | | | | | | | | | | |
Net investment income (loss)b | | | 0.01 | | | | (0.01 | ) | | | (0.03 | ) | | | 0.03 | | | | 0.04 | |
Net realized and unrealized gains (losses) | | | (5.70 | ) | | | 2.41 | | | | 1.99 | | | | 1.06 | | �� | | 0.84 | |
| | | | |
Total from investment operations | | | (5.69 | ) | | | 2.40 | | | | 1.96 | | | | 1.09 | | | | 0.88 | |
| | | | |
Less distributions from net investment income | | | — | | | | — | | | | (0.02 | ) | | | (0.19 | ) | | | (0.06 | ) |
| | | | |
Net asset value, end of year | | $ | 6.65 | | | $ | 12.34 | | | $ | 9.94 | | | $ | 8.00 | | | $ | 7.10 | |
| | | | |
| | | | | |
Total returnc | | | (46.15)% | | | | 24.25% | | | | 24.56% | | | | 15.79% | | | | 14.18% | |
Ratios to average net assets | | | | | | | | | | | | | | | | | | | | |
Expensesd | | | 0.90% | | | | 0.86% | | | | 0.92% | | | | 0.90% | | | | 0.89% | |
Net investment income (loss) | | | 0.10% | | | | 0.05% | | | | (0.38)% | | | | 0.38% | | | | 0.60% | |
| | | | | |
Supplemental data | | | | | | | | | | | | | | | | | | | | |
Net assets, end of year (000’s) | | $ | 46,052 | | | $ | 143,078 | | | $ | 78,975 | | | $ | 38,613 | | | $ | 23,704 | |
Portfolio turnover rate | | | 37.97% | | | | 93.43% | | | | 134.21% | | | | 170.40% | | | | 178.52% | |
aThe amount shown for a share outstanding throughout the period may not correlate with the Statement of Operations for the period due to the timing of sales and repurchases of the Fund shares in relation to income earned and/or fluctuating market value of the investments of the Fund.
bBased on average daily shares outstanding.
cTotal return does not include any fees, charges or expenses imposed by the variable annuity and life insurance contracts for which the Franklin Templeton Variable Insurance Products Trust serves as an underlying investment vehicle.
dBenefit of expense reduction rounds to less than 0.01%.
The accompanying notes are an integral part of these financial statements.
FGC-9
Franklin Templeton Variable Insurance Products Trust
Financial Highlights (continued)
Franklin Global Communications Securities Fund
| | | | |
| Class 4 | | Period Ended
December 31,
2008a | |
| | | | |
Per share operating performance | | | | |
(for a share outstanding throughout the period) | | | | |
Net asset value, beginning of period | | $ | 10.55 | |
| | | | |
Income from investment operationsb: | | | | |
Net investment income (loss)c | | | — | d |
Net realized and unrealized gains (losses) | | | (3.78 | ) |
| | | | |
Total from investment operations | | | (3.78 | ) |
| | | | |
Less distributions from net investment income | | | (0.03 | ) |
| | | | |
Net asset value, end of period | | $ | 6.74 | |
| | | | |
| |
Total returne | | | (35.96)% | |
Ratios to average net assetsf | | | | |
Expensesg | | | 1.00% | |
Net investment income | | | — | h |
| |
Supplemental data | | | | |
Net assets, end of period (000’s) | | $ | 3 | |
Portfolio turnover rate | | | 37.97% | |
aFor the period February 29, 2008 (effective date) to December 31, 2008.
bThe amount shown for a share outstanding throughout the period may not correlate with the Statement of Operations for the period due to the timing of sales and repurchases of the Fund shares in relation to income earned and/or fluctuating market value of the investments of the Fund.
cBased on average daily shares outstanding.
dAmount rounds to less than $0.01 per share.
eTotal return does not include any fees, charges or expenses imposed by the variable annuity and life insurance contracts for which the Franklin Templeton Variable Insurance Products Trust serves as an underlying investment vehicle. Total return is not annualized for periods less than one year.
fRatios are annualized for periods less than one year.
gBenefit of expense reduction rounds to less than 0.01%.
hRounds to less than 0.01%.
The accompanying notes are an integral part of these financial statements.
FGC-10
Franklin Templeton Variable Insurance Products Trust
Statement of Investments, December 31, 2008
| | | | | | | |
| Franklin Global Communications Securities Fund | | Country | | Shares/
Warrants | | Value |
Common Stocks and Warrants 93.5% | | | | | | | |
Aerospace & Defense 0.7% | | | | | | | |
aOrbital Sciences Corp. | | United States | | 41,300 | | $ | 806,589 |
| | | | | | | |
Communications Equipment 20.4% | | | | | | | |
aCisco Systems Inc. | | United States | | 194,800 | | | 3,175,240 |
a,bDilithium Networks Inc., wts., 3/20/09 | | United States | | 10,275 | | | — |
aF5 Networks Inc. | | United States | | 67,800 | | | 1,549,908 |
Harris Corp. | | United States | | 84,000 | | | 3,196,200 |
aInfinera Corp. | | United States | | 154,500 | | | 1,384,320 |
Nokia Corp., ADR | | Finland | | 293,900 | | | 4,584,840 |
QUALCOMM Inc. | | United States | | 154,600 | | | 5,539,318 |
aResearch In Motion Ltd. | | Canada | | 42,000 | | | 1,704,360 |
aRiverbed Technology Inc. | | United States | | 88,600 | | | 1,009,154 |
aTandberg ASA | | Norway | | 56,400 | | | 611,452 |
Telefonaktiebolaget LM Ericsson, B, ADR | | Sweden | | 106,000 | | | 827,860 |
| | | | | | | |
| | | | | | | 23,582,652 |
| | | | | | | |
Computers & Peripherals 3.3% | | | | | | | |
aApple Inc. | | United States | | 44,100 | | | 3,763,935 |
| | | | | | | |
Diversified Telecommunication Services 6.5% | | | | | | | |
AT&T Inc. | | United States | | 155,117 | | | 4,420,834 |
BCE Inc. | | Canada | | 62,000 | | | 1,270,380 |
Telenor ASA | | Norway | | 149,000 | | | 991,927 |
Telus Corp. | | Canada | | 28,600 | | | 812,812 |
| | | | | | | |
| | | | | | | 7,495,953 |
| | | | | | | |
Electronic Equipment, Instruments & Components 3.3% | | | | | | | |
aDolby Laboratories Inc., A | | United States | | 28,200 | | | 923,832 |
aFLIR Systems Inc. | | United States | | 95,700 | | | 2,936,076 |
| | | | | | | |
| | | | | | | 3,859,908 |
| | | | | | | |
Internet & Catalog Retail 0.6% | | | | | | | |
aAmazon.com Inc. | | United States | | 13,200 | | | 676,896 |
| | | | | | | |
Internet Software & Services 6.4% | | | | | | | |
aBaidu.com Inc., ADR | | China | | 4,400 | | | 574,508 |
aEquinix Inc. | | United States | | 35,300 | | | 1,877,607 |
aGoogle Inc., A | | United States | | 10,900 | | | 3,353,385 |
aMercadoLibre Inc. | | Argentina | | 34,400 | | | 564,504 |
aOmniture Inc. | | United States | | 95,400 | | | 1,015,056 |
| | | | | | | |
| | | | | | | 7,385,060 |
| | | | | | | |
IT Services 0.5% | | | | | | | |
aSAIC Inc. | | United States | | 32,000 | | | 623,360 |
| | | | | | | |
Media 3.8% | | | | | | | |
News Corp., A | | United States | | 175,600 | | | 1,596,204 |
aOutdoor Channel Holdings Inc. | | United States | | 129,500 | | | 969,955 |
The Walt Disney Co. | | United States | | 81,640 | | | 1,852,412 |
| | | | | | | |
| | | | | | | 4,418,571 |
| | | | | | | |
Semiconductors & Semiconductor Equipment 5.9% | | | | | | | |
aFormFactor Inc. | | United States | | 111,400 | | | 1,626,440 |
aHittite Microwave Corp. | | United States | | 19,200 | | | 565,632 |
Maxim Integrated Products Inc. | | United States | | 147,400 | | | 1,683,308 |
aMicrosemi Corp. | | United States | | 130,200 | | | 1,645,728 |
aMicrotune Inc. | | United States | | 319,800 | | | 652,392 |
aNetlogic Microsystems Inc. | | United States | | 28,300 | �� | | 622,883 |
| | | | | | | |
| | | | | | | 6,796,383 |
| | | | | | | |
FGC-11
Franklin Templeton Variable Insurance Products Trust
Statement of Investments, December 31, 2008 (continued)
| | | | | | | | | |
| Franklin Global Communications Securities Fund | | Country | | Shares/
Warrants | | Value | |
Common Stocks and Warrants (continued) | | | | | | | | | |
Software 5.7% | | | | | | | | | |
aActivision Blizzard Inc. | | United States | | | 306,100 | | $ | 2,644,704 | |
aAdobe Systems Inc. | | United States | | | 81,000 | | | 1,724,490 | |
Nintendo Co. Ltd. | | Japan | | | 4,100 | | | 1,565,526 | |
aUbiSoft Entertainment SA | | France | | | 30,000 | | | 582,672 | |
| | | | | | | | | |
| | | | | | | | 6,517,392 | |
| | | | | | | | | |
Wireless Telecommunication Services 36.4% | | | | | | | | | |
America Movil SAB de CV, L, ADR | | Mexico | | | 110,600 | | | 3,427,494 | |
aAmerican Tower Corp., A | | United States | | | 195,302 | | | 5,726,255 | |
Cellcom Israel Ltd. | | Israel | | | 36,000 | | | 795,600 | |
aCentennial Communications Corp., A | | United States | | | 578,400 | | | 4,661,904 | |
China Mobile (Hong Kong) Ltd., ADR | | China | | | 45,400 | | | 2,308,590 | |
aLeap Wireless International Inc. | | United States | | | 98,000 | | | 2,635,220 | |
aMetroPCS Communications Inc. | | United States | | | 352,300 | | | 5,231,655 | |
aNII Holdings Inc. | | United States | | | 271,800 | | | 4,941,324 | |
Rogers Communications Inc., B | | Canada | | | 179,100 | | | 5,385,658 | |
aSBA Communications Corp. | | United States | | | 248,600 | | | 4,057,152 | |
aSprint Nextel Corp. | | United States | | | 1,545,300 | | | 2,827,899 | |
| | | | | | | | | |
| | | | | | | | 41,998,751 | |
| | | | | | | | | |
Total Common Stocks and Warrants (Cost $130,492,802) | | | | | | | | 107,925,450 | |
| | | | | | | | | |
Preferred Stocks 0.4% | | | | | | | | | |
Communications Equipment 0.4% | | | | | | | | | |
a,bDilithium Networks Inc., depository receipt, D, pfd., 144A, PIPES | | United States | | | 309,399 | | | 451,723 | |
a,bDilithium Networks Inc., pfd., D, 11.00%, 3/20/09 | | United States | | | 11,970 | | | 11,970 | |
| | | | | | | | | |
Total Preferred Stocks (Cost $732,870) | | | | | | | | 463,693 | |
| | | | | | | | | |
Total Investments before Short Term Investments
(Cost $131,225,672) | | | | | | | | 108,389,143 | |
| | | | | | | | | |
| | | |
| | | | | Principal
Amount | | | |
Short Term Investments (Cost $10,324,416) 8.9% | | | | | | | | | |
Repurchase Agreements 8.9% | | | | | | | | | |
cJoint Repurchase Agreement, 0.019%, 1/02/09 (Maturity Value $10,324,427) | | United States | | $ | 10,324,416 | | | 10,324,416 | |
Banc of America Securities LLC (Maturity Value $1,593,471) | | | | | | | | | |
Barclays Capital Inc. (Maturity Value $1,517,691) | | | | | | | | | |
BNP Paribas Securities Corp. (Maturity Value $2,023,588) | | | | | | | | | |
Credit Suisse Securities (USA) LLC (Maturity Value $2,023,588) | | | | | | | | | |
Deutsche Bank Securities Inc. (Maturity Value $1,167,796) | | | | | | | | | |
HSBC Securities (USA) Inc. (Maturity Value $1,517,691) | | | | | | | | | |
UBS Securities LLC (Maturity Value $480,602) | | | | | | | | | |
Collateralized by U.S. Government Agency Securities, 3.50% - 7.00%, 6/15/09 - 5/20/22; dU.S. Government Agency Discount Notes, 1/05/09 - 10/19/09; dU.S. Treasury Bills, 1/15/09; and U.S. Treasury Notes, 0.875% - 4.625%, 7/15/09 - 2/28/11 | | | | | | | | | |
| | | | | | | | | |
Total Investments (Cost $141,550,088) 102.8% | | | | | | | | 118,713,559 | |
Other Assets, less Liabilities (2.8)% | | | | | | | | (3,177,935 | ) |
| | | | | | | | | |
Net Assets 100.0% | | | | | | | $ | 115,535,624 | |
| | | | | | | | | |
See Abbreviations on page FGC-22.
aNon-income producing for the twelve months ended December 31, 2008.
bSee Note 7 regarding restricted and illiquid securities.
cSee Note 1(c) regarding joint repurchase agreement.
dThe security is traded on a discount basis with no stated coupon rate.
The accompanying notes are an integral part of these financial statements.
FGC-12
Franklin Templeton Variable Insurance Products Trust
Financial Statements
Statement of Assets and Liabilities
December 31, 2008
| | | | |
| | | Franklin Global
Communications
Securities Fund | |
Assets: | | | | |
Investments in securities: | | | | |
Cost - Unaffiliated issuers | | $ | 131,225,672 | |
Cost - Repurchase agreements | | | 10,324,416 | |
| | | | |
Total cost of investments | | $ | 141,550,088 | |
| | | | |
Value - Unaffiliated issuers | | $ | 108,389,143 | |
Value - Repurchase agreements | | | 10,324,416 | |
| | | | |
Total value of investments | | | 118,713,559 | |
Receivables: | | | | |
Capital shares sold | | | 19,690 | |
Dividends | | | 106,329 | |
| | | | |
Total assets | | | 118,839,578 | |
| | | | |
Liabilities: | | | | |
Payables: | | | | |
Investment securities purchased | | | 3,007,575 | |
Capital shares redeemed | | | 113,155 | |
Affiliates | | | 76,897 | |
Funds advanced by custodian | | | 4,721 | |
Accrued expenses and other liabilities | | | 101,606 | |
| | | | |
Total liabilities | | | 3,303,954 | |
| | | | |
Net assets, at value | | $ | 115,535,624 | |
| | | | |
Net assets consist of: | | | | |
Paid-in capital | | $ | 341,579,562 | |
Undistributed net investment income | | | 348,406 | |
Net unrealized appreciation (depreciation) | | | (22,835,530 | ) |
Accumulated net realized gain (loss) | | | (203,556,814 | ) |
| | | | |
Net assets, at value | | $ | 115,535,624 | |
| | | | |
Class 1: | | | | |
Net assets, at value | | $ | 69,480,250 | |
| | | | |
Shares outstanding | | | 10,286,303 | |
| | | | |
Net asset value and maximum offering price per share | | $ | 6.75 | |
| | | | |
Class 2: | | | | |
Net assets, at value | | $ | 46,052,181 | |
| | | | |
Shares outstanding | | | 6,920,661 | |
| | | | |
Net asset value and maximum offering price per share | | $ | 6.65 | |
| | | | |
Class 4: | | | | |
Net assets, at value | | $ | 3,193 | |
| | | | |
Shares outstanding | | | 474 | |
| | | | |
Net asset value and maximum offering price per share | | $ | 6.74 | |
| | | | |
The accompanying notes are an integral part of these financial statements.
FGC-13
Franklin Templeton Variable Insurance Products Trust
Financial Statements (continued)
Statement of Operations
for the year ended December 31, 2008
| | | | |
| | | Franklin Global
Communications
Securities Fund | |
Investment income: | | | | |
Dividends (net of foreign taxes of $191,854) | | $ | 1,901,410 | |
Interest | | | 72,194 | |
Income from securities loaned | | | 1,957 | |
| | | | |
Total investment income | | | 1,975,561 | |
| | | | |
Expenses: | | | | |
Management fees (Note 3a) | | | 1,114,877 | |
Distribution fees: (Note 3c) | | | | |
Class 2 | | | 215,731 | |
Class 4 | | | 13 | |
Unaffiliated transfer agent fees | | | 278 | |
Custodian fees (Note 4) | | | 44,485 | |
Reports to shareholders | | | 75,299 | |
Professional fees | | | 42,500 | |
Trustees’ fees and expenses | | | 1,121 | |
Other | | | 13,981 | |
| | | | |
Total expenses | | | 1,508,285 | |
Expense reductions (Note 4) | | | (1,456 | ) |
| | | | |
Net expenses | | | 1,506,829 | |
| | | | |
Net investment income | | | 468,732 | |
| | | | |
Realized and unrealized gains (losses): | | | | |
Net realized gain (loss) from: | | | | |
Investments | | | 259,739 | |
Foreign currency transactions | | | 120,691 | |
| | | | |
Net realized gain (loss) | | | 380,430 | |
| | | | |
Net change in unrealized appreciation (depreciation) on: | | | | |
Investments | | | (117,392,201 | ) |
Translation of other assets and liabilities denominated in foreign currencies | | | 8,770 | |
Change in deferred taxes on unrealized appreciation (depreciation) | | | 150,034 | |
| | | | |
Net change in unrealized appreciation (depreciation) | | | (117,233,397 | ) |
| | | | |
Net realized and unrealized gain (loss) | | | (116,852,967 | ) |
| | | | |
Net increase (decrease) in net assets resulting from operations | | $ | (116,384,235 | ) |
| | | | |
The accompanying notes are an integral part of these financial statements.
FGC-14
Franklin Templeton Variable Insurance Products Trust
Financial Statements (continued)
Statements of Changes in Net Assets
| | | | | | | | |
| | | Franklin Global Communications
Securities Fund | |
| | | Year Ended December 31, | |
| | | 2008 | | | 2007 | |
| | | | |
Increase (decrease) in net assets: | | | | | | | | |
Operations: | | | | | | | | |
Net investment income | | $ | 468,732 | | | $ | 510,712 | |
Net realized gain (loss) from investments and foreign currency transactions | | | 380,430 | | | | 28,922,682 | |
Net change in unrealized appreciation (depreciation) on investments, translation of other assets and liabilities denominated in foreign currencies and deferred taxes | | | (117,233,397 | ) | | | 23,438,771 | |
| | | | |
Net increase (decrease) in net assets resulting from operations | | | (116,384,235 | ) | | | 52,872,165 | |
| | | | |
Distributions to shareholders from net investment income: | | | | | | | | |
Class 1 | | | (317,811 | ) | | | — | |
Class 4 | | | (13 | ) | | | — | |
| | | | |
Total distributions to shareholders | | | (317,824 | ) | | | — | |
| | | | |
Capital share transactions: (Note 2) | | | | | | | | |
Class 1 | | | (18,499,942 | ) | | | (25,800,362 | ) |
Class 2 | | | (44,864,246 | ) | | | 44,124,623 | |
Class 4 | | | 5,000 | | | | — | |
| | | | |
Total capital share transactions | | | (63,359,188 | ) | | | 18,324,261 | |
| | | | |
Net increase (decrease) in net assets | | | (180,061,247 | ) | | | 71,196,426 | |
Net assets: | | | | | | | | |
Beginning of year | | | 295,596,871 | | | | 224,400,445 | |
| | | | |
End of year | | $ | 115,535,624 | | | $ | 295,596,871 | |
| | | | |
Undistributed net investment income included in net assets: | | | | | | | | |
End of year | | $ | 348,406 | | | $ | 559,988 | |
| | | | |
The accompanying notes are an integral part of these financial statements.
FGC-15
Franklin Templeton Variable Insurance Products Trust
Notes to Financial Statements
Franklin Global Communications Securities Fund
1. ORGANIZATION AND SIGNIFICANT ACCOUNTING POLICIES
Franklin Templeton Variable Insurance Products Trust (Trust) is registered under the Investment Company Act of 1940, as amended, (1940 Act) as an open-end investment company, consisting of twenty-three separate funds. The Franklin Global Communications Securities Fund (Fund) is included in this report. The financial statements of the remaining funds in the Trust are presented separately. Shares of the Fund are sold only to insurance company separate accounts to fund the benefits of variable life insurance policies or variable annuity contracts. At December 31, 2008, 99.69% of the Fund’s shares were held through one insurance company. The Fund offers three classes of shares: Class 1, Class 2, and Class 4. Effective February 29, 2008, the Fund began offering a new class of shares, Class 4. Each class of shares differs by its distribution fees, voting rights on matters affecting a single class and its exchange privilege.
The following summarizes the Fund’s significant accounting policies.
a. Security Valuation
Securities listed on a securities exchange or on the NASDAQ National Market System are valued at the last quoted sale price or the official closing price of the day, respectively. Over-the-counter securities and listed securities for which there is no reported sale are valued within the range of the most recent quoted bid and ask prices. Securities that trade in multiple markets or on multiple exchanges are valued according to the broadest and most representative market.
Foreign securities are valued as of the close of trading on the foreign stock exchange on which the security is primarily traded, or the NYSE, whichever is earlier. If no sale is reported at that time, the foreign security will be valued within the range of the most recent quoted bid and ask prices. The value is then converted into its U.S. dollar equivalent at the foreign exchange rate in effect at the close of the NYSE on the day that the value of the foreign security is determined.
The Trust has procedures to determine the fair value of individual securities and other assets for which market prices are not readily available or which may not be reliably priced. Methods for valuing these securities may include: fundamental analysis, matrix pricing, discounts from market prices of similar securities, or discounts applied due to the nature and duration of restrictions on the disposition of the securities. Due to the inherent uncertainty of valuations of such securities, the fair values may differ significantly from the values that would have been used had a ready market for such investments existed. Occasionally, events occur between the time at which trading in a security is completed and the close of the NYSE that might call into question the availability (including the reliability) of the value of a portfolio security held by the Fund. The investment manager monitors price movements following the close of trading in foreign stock markets through a series of country specific market proxies (such as baskets of American Depository Receipts, futures contracts and exchange traded funds). These price movements are measured against established trigger thresholds for each specific market proxy to assist in determining if an event has occurred. If such an event occurs, the securities may be valued using fair value procedures, which may include the use of independent pricing services. At December 31, 2008, a portion of the securities held by the Fund were fair valued. All security valuation procedures are approved by the Trust’s Board of Trustees.
b. Foreign Currency Translation
Portfolio securities and other assets and liabilities denominated in foreign currencies are translated into U.S. dollars based on the exchange rate of such currencies against U.S. dollars on the date of valuation. Purchases and sales of securities, income and expense items denominated in foreign currencies are translated into U.S. dollars at the exchange rate in effect on the transaction date. Occasionally, events may impact the availability or reliability of foreign exchange rates used to convert the U.S. dollar equivalent value. If such an event occurs, the foreign exchange rate will be valued at fair value using procedures established and approved by the Trust’s Board of Trustees.
The Fund does not separately report the effect of changes in foreign exchange rates from changes in market prices on securities held. Such changes are included in net realized and unrealized gain or loss from investments on the Statement of Operations.
FGC-16
Franklin Templeton Variable Insurance Products Trust
Notes to Financial Statements (continued)
Franklin Global Communications Securities Fund
1. ORGANIZATION AND SIGNIFICANT ACCOUNTING POLICIES (continued)
b. Foreign Currency Translation (continued)
Realized foreign exchange gains or losses arise from sales of foreign currencies, currency gains or losses realized between the trade and settlement dates on securities transactions and the difference between the recorded amounts of dividends, interest, and foreign withholding taxes and the U.S. dollar equivalent of the amounts actually received or paid. Net unrealized foreign exchange gains and losses arise from changes in foreign exchange rates on foreign denominated assets and liabilities other than investments in securities held at the end of the reporting period.
c. Joint Repurchase Agreement
The Fund may enter into a joint repurchase agreement whereby its uninvested cash balance is deposited into a joint cash account with other funds managed by the investment manager or an affiliate of the investment manager and is used to invest in one or more repurchase agreements. The value and face amount of the joint repurchase agreement are allocated to the funds based on their pro-rata interest. A repurchase agreement is accounted for as a loan by the fund to the seller, collateralized by securities which are delivered to the fund’s custodian. The market value, including accrued interest, of the initial collateralization is required to be at least 102% of the dollar amount invested by the funds, with the value of the underlying securities marked to market daily to maintain coverage of at least 100%. The joint repurchase agreement held by the Fund at year end had been entered into on December 31, 2008. The joint repurchase agreement is valued at cost.
d. Foreign Currency Contracts
When the Fund purchases or sells foreign securities it may enter into foreign exchange contracts to minimize foreign exchange risk from the trade date to the settlement date of the transactions. A foreign exchange contract is an agreement between two parties to exchange different currencies at an agreed upon exchange rate at a future date. Realized and unrealized gains and losses on these contracts are included in the Statement of Operations.
The risks of these contracts include movement in the values of the foreign currencies relative to the U.S. dollar and the possible inability of the counterparties to fulfill their obligations under the contracts, which may be in excess of the amount reflected in the Statement of Assets and Liabilities.
e. Securities Lending
The Fund participates in a principal based security lending program. The Fund receives cash collateral against the loaned securities in an amount equal to at least 102% of the market value of the loaned securities. Collateral is maintained over the life of the loan in an amount not less than 100% of the market value of loaned securities, as determined at the close of Fund business each day; any additional collateral required due to changes in security values is delivered to the Fund on the next business day. The collateral is invested in a non-registered money market fund managed by the Fund’s custodian on the Fund’s behalf. The Fund receives income from the investment of cash collateral, in addition to lending fees and rebates paid by the borrower. The Fund bears the market risk with respect to the collateral investment, securities loaned, and the risk that the principal may default on its obligations to the Fund. At December 31, 2008, the Fund had no securities on loan.
f. Income and Deferred Taxes
No provision has been made for U.S. income taxes because it is the Fund’s policy to qualify as a regulated investment company under the Internal Revenue Code and to distribute to shareholders substantially all of its taxable income and net realized gains.
Foreign securities held by the Fund may be subject to foreign taxation on dividend income received. Foreign taxes, if any, are recorded based on the tax regulations and rates that exist in the foreign markets in which the Fund invests.
FGC-17
Franklin Templeton Variable Insurance Products Trust
Notes to Financial Statements (continued)
Franklin Global Communications Securities Fund
1. ORGANIZATION AND SIGNIFICANT ACCOUNTING POLICIES (continued)
f. Income and Deferred Taxes (continued)
The Fund may be subject to a tax imposed on net realized gains on securities of certain foreign countries. The Fund records an estimated deferred tax liability for net unrealized gains on these securities in an amount that would be payable if the securities were disposed of on the valuation date.
The Fund has reviewed the tax positions, taken on federal income tax returns, for each of the three open tax years and as of December 31, 2008, and has determined that no provision for income tax is required in the Fund’s financial statements.
g. Security Transactions, Investment Income, Expenses and Distributions
Security transactions are accounted for on trade date. Realized gains and losses on security transactions are determined on a specific identification basis. Interest income and estimated expenses are accrued daily. Dividend income is recorded on the ex-dividend date except that certain dividends from foreign securities are recognized as soon as the Fund is notified of the ex-dividend date. Distributions to shareholders are recorded on the ex-dividend date and are determined according to income tax regulations (tax basis). Distributable earnings determined on a tax basis may differ from earnings recorded in accordance with accounting principles generally accepted in the United States of America. These differences may be permanent or temporary. Permanent differences are reclassified among capital accounts to reflect their tax character. These reclassifications have no impact on net assets or the results of operations. Temporary differences are not reclassified, as they may reverse in subsequent periods.
Common expenses incurred by the Trust are allocated among the funds based on the ratio of net assets of each fund to the combined net assets of the Trust. Fund specific expenses are charged directly to the fund that incurred the expense.
Realized and unrealized gains and losses and net investment income, not including class specific expenses, are allocated daily to each class of shares based upon the relative proportion of net assets of each class. Differences in per share distributions, by class, are generally due to differences in class specific expenses.
h. Accounting Estimates
The preparation of financial statements in accordance with accounting principles generally accepted in the United States of America requires management to make estimates and assumptions that affect the reported amounts of assets and liabilities at the date of the financial statements and the amounts of income and expenses during the reporting period. Actual results could differ from those estimates.
i. Guarantees and Indemnifications
Under the Trust’s organizational documents, its officers and trustees are indemnified by the Trust against certain liabilities arising out of the performance of their duties to the Trust. Additionally, in the normal course of business, the Trust, on behalf of the Fund, enters into contracts with service providers that contain general indemnification clauses. The Trust’s maximum exposure under these arrangements is unknown as this would involve future claims that may be made against the Trust that have not yet occurred. Currently, the Trust expects the risk of loss to be remote.
FGC-18
Franklin Templeton Variable Insurance Products Trust
Notes to Financial Statements (continued)
Franklin Global Communications Securities Fund
2. SHARES OF BENEFICIAL INTEREST
At December 31, 2008, there were an unlimited number of shares authorized (without par value). Transactions in the Fund’s shares were as follows:
| | | | | | | | | | | | | | |
| | | Year Ended December 31, | |
| | | 2008a | | | 2007 | |
| Class 1 Shares: | | Shares | | | Amount | | | Shares | | | Amount | |
Shares sold | | 28,899 | | | $ | 305,197 | | | 30,242 | | | $ | 378,996 | |
Shares issued in reinvestment of distributions | | 27,374 | | | | 317,811 | | | — | | | | — | |
Shares redeemed | | (1,951,204 | ) | | | (19,122,950 | ) | | (2,311,298 | ) | | | (26,179,358 | ) |
| | | | |
Net increase (decrease) | | (1,894,931 | ) | | $ | (18,499,942 | ) | | (2,281,056 | ) | | $ | (25,800,362 | ) |
| | | | |
| Class 2 Shares: | | | | | | | | | | | | |
Shares sold | | 2,628,228 | | | $ | 27,203,400 | | | 7,011,538 | | | $ | 81,791,331 | |
Shares redeemed | | (7,299,177 | ) | | | (72,067,646 | ) | | (3,365,328 | ) | | | (37,666,708 | ) |
| | | | |
Net increase (decrease) | | (4,670,949 | ) | | $ | (44,864,246 | ) | | 3,646,210 | | | $ | 44,124,623 | |
| | | | |
| Class 4 Shares: | | | | | | | | | | | | |
Shares sold | | 474 | | | $ | 5,000 | | | | | | | | |
| | | | | | | | | | |
aFor | the period February 29, 2008 (effective date) to December 31, 2008, for Class 4. |
3. TRANSACTIONS WITH AFFILIATES
Franklin Resources, Inc. is the holding company for various subsidiaries that together are referred to as Franklin Templeton Investments. Certain officers and trustees of the Trust are also officers and/or directors of the following subsidiaries:
| | |
| Subsidiary | | Affiliation |
Franklin Advisers, Inc. (Advisers) | | Investment manager |
Franklin Templeton Services, LLC (FT Services) | | Administrative manager |
Franklin Templeton Distributors, Inc. (Distributors) | | Principal underwriter |
Franklin Templeton Investor Services, LLC (Investor Services) | | Transfer agent |
a. Management Fees
The Fund pays an investment management fee to Advisers based on the average daily net assets of the Fund as follows:
| | |
| Annualized Fee Rate | | Net Assets |
| 0.625% | | Up to and including $100 million |
| 0.500% | | Over $100 million, up to and including $250 million |
| 0.450% | | Over $250 million, up to and including $7.5 billion |
| 0.440% | | Over $7.5 billion, up to and including $10 billion |
| 0.430% | | Over $10 billion, up to and including $12.5 billion |
| 0.420% | | Over $12.5 billion, up to and including $15 billion |
| 0.400% | | In excess of $15 billion |
b. Administrative Fees
Under an agreement with Advisers, FT Services provides administrative services to the Fund. The fee is paid by Advisers based on average daily net assets, and is not an additional expense of the Fund.
FGC-19
Franklin Templeton Variable Insurance Products Trust
Notes to Financial Statements (continued)
Franklin Global Communications Securities Fund
3. TRANSACTIONS WITH AFFILIATES (continued)
c. Distribution Fees
The Fund’s Board of Trustees has adopted distribution plans for Class 2 and Class 4 shares pursuant to Rule 12b-1 under the 1940 Act. Under the Fund’s compensation distribution plans, the Fund pays Distributors for costs incurred in connection with the servicing, sale and distribution of the Fund’s shares up to 0.35% per year of its average daily net assets of each class. The Board of Trustees has agreed to limit the current rate to 0.25% per year for Class 2.
d. Transfer Agent Fees
Investor Services, under terms of an agreement, performs shareholder servicing for the Fund and is not paid by the Fund for the services.
4. EXPENSE OFFSET ARRANGEMENT
The Fund has entered into an arrangement with its custodian whereby credits realized as a result of uninvested cash balances are used to reduce a portion of the Fund’s custodian expenses. During the year ended December 31, 2008, the custodian fees were reduced as noted in the Statement of Operations.
5. INCOME TAXES
For tax purposes, capital losses may be carried over to offset future capital gains, if any. At December 31, 2008, the capital loss carryforwards were as follows:
| | | |
Capital loss carryforwards expiring in: | | | |
2009 | | $ | 88,941,545 |
2010 | | | 108,979,162 |
| | | |
| | $ | 197,920,707 |
| | | |
During the year ended December 31, 2008, the Fund utilized $3,416,781 of capital loss carryforwards.
For tax purposes, realized capital losses occurring subsequent to October 31, may be deferred and treated as occurring on the first day of the following fiscal year. At December 31, 2008, the Fund deferred realized capital losses of $2,033,398.
The tax character of distributions paid during the years ended December 31, 2008 and 2007, was as follows:
| | | | | | |
| | | 2008 | | 2007 |
Distributions paid from – ordinary income | | $ | 317,824 | | $ | — |
| | | |
At December 31, 2008, the cost of investments, net unrealized appreciation (depreciation), undistributed ordinary income for income tax purposes were as follows:
| | | | |
Cost of investments | | $ | 145,152,798 | |
| | | | |
| |
Unrealized appreciation | | $ | 11,423,960 | |
Unrealized depreciation | | | (37,863,199 | ) |
| | | | |
Net unrealized appreciation (depreciation) | | $ | (26,439,239 | ) |
| | | | |
Distributable earnings – undistributed ordinary income | | $ | 348,406 | |
| | | | |
FGC-20
Franklin Templeton Variable Insurance Products Trust
Notes to Financial Statements (continued)
Franklin Global Communications Securities Fund
5. INCOME TAXES (continued)
Net investment income differs for financial statement and tax purposes primarily due to differing treatments of foreign currency transactions and foreign capital gains tax.
Net realized gains (losses) differ for financial statement and tax purposes primarily due to differing treatments of wash sales, foreign currency transactions and foreign capital gains tax.
6. INVESTMENT TRANSACTIONS
Purchases and sales of investments (excluding short term securities) for the year ended December 31, 2008, aggregated $74,665,094 and $134,966,801, respectively.
7. RESTRICTED SECURITIES
The Fund may invest in securities that are restricted under the Securities Act of 1933 (1933 Act) or which are subject to legal, contractual, or other agreed upon restrictions on resale. Restricted securities are often purchased in private placement transactions, and cannot be sold without prior registration unless the sale is pursuant to an exemption under the 1933 Act. Disposal of these securities may require greater effort and expense, and prompt sale at an acceptable price may be difficult. The Fund may have registration rights for restricted securities. The issuer generally incurs all registration costs.
At December 31, 2008, the Fund held investments in restricted securities, excluding 144A securities deemed to be liquid, valued in accordance with procedures approved by the Fund’s Board of Trustees as reflecting fair value, as follows:
| | | | | | | | | | |
Shares/
Warrants | | Issuer | | Acquisition
Date | | Cost | | Value |
| 309,399 | | Dilithium Networks Inc., depository receipt, D, pfd., 144A, PIPES | | 7/13/2006 | | $ | 720,899 | | $ | 451,723 |
| 11,970 | | Dilithium Networks Inc., pfd., D, 11.00%, 3/20/09 | | 10/30/2008 | | | 11,971 | | | 11,970 |
| 10,275 | | Dilithium Networks Inc., wts., 3/20/09 | | 10/30/2008 | | | 1 | | | — |
| | | | | | | | | | |
| | Total Restricted Securities (0.40% of Net Assets) | | | | | | | $ | 463,693 |
| | | | | | | | | | |
8. UPCOMING LIQUIDATION
On September 19, 2008, the Board of Trustees for the Fund approved a proposal to liquidate the Fund. The Fund is scheduled to liquidate on April 24, 2009.
9. FAIR VALUE MEASUREMENTS
The Fund adopted Financial Accounting Standards Board (FASB) Statement No. 157, “Fair Value Measurement” (SFAS 157), on January 1, 2008. SFAS 157 defines fair value, establishes a framework for measuring fair value, and expands disclosures about fair value measurements. The Fund has determined that the implementation of SFAS 157 did not have a material impact on the Fund’s financial statements.
SFAS 157 establishes a fair value hierarchy that distinguishes between market data obtained from independent sources (observable inputs) and the Fund’s own market assumptions (unobservable inputs). These inputs are used in determining the value of the Fund’s investments and are summarized in the following fair value hierarchy:
| | • | | Level 1 – quoted prices in active markets for identical securities |
| | • | | Level 2 – other significant observable inputs (including quoted prices for similar securities, interest rates, prepayment speed, credit risk, etc.) |
| | • | | Level 3 – significant unobservable inputs (including the Fund’s own assumptions in determining the fair value of investments) |
FGC-21
Franklin Templeton Variable Insurance Products Trust
Notes to Financial Statements (continued)
Franklin Global Communications Securities Fund
9. FAIR VALUE MEASUREMENTS (continued)
The inputs or methodology used for valuing securities are not an indication of the risk associated with investing in those securities.
The following is a summary of the inputs used as of December 31, 2008, in valuing the Fund’s assets carried at fair value:
| | | | | | | | | | | | |
| | | Level 1 | | Level 2 | | Level 3 | | Total |
Assets: | | | | | | | | | | | | |
Investments in Securities | | $ | 106,359,924 | | $ | 11,889,942 | | $ | 463,693 | | $ | 118,713,559 |
At December 31, 2008, the reconciliation of assets in which significant unobservable inputs (Level 3) were used in determining fair value, is as follows:
| | | | |
| | | Investments
in Securities | |
Beginning Balance – January 1, 2008 | | $ | 1,067,426 | |
Net realized gain (loss) | | | — | |
Net change in unrealized appreciation (depreciation) | | | (615,704 | ) |
Net purchases (sales) | | | 11,971 | |
Transfers in and/or out of Level 3 | | | — | |
| | | | |
Ending Balance | | $ | 463,693 | |
| | | | |
Net change in unrealized appreciation (depreciation) attributable to assets still held at end of year | | $ | (615,704 | ) |
| | | | |
10. NEW ACCOUNTING PRONOUNCEMENT
In March 2008, the FASB issued FASB Statement No. 161, “Disclosures about Derivative Instruments and Hedging Activities, an amendment of FASB Statement No. 133” (SFAS 161), which expands disclosures about derivative investments and hedging activities. SFAS 161 is effective for fiscal years and interim periods beginning after November 15, 2008. The Fund is currently evaluating the impact, if any, of applying the various provisions of SFAS 161.
ABBREVIATIONS
Selected Portfolio
ADR - American Depository Receipt
PIPES - Private Investment in Public Equity Security
FGC-22
Franklin Templeton Variable Insurance Products Trust
Franklin Global Communications Securities Fund
Report of Independent Registered Public Accounting Firm
To the Board of Trustees and Shareholders of
Franklin Templeton Variable Insurance Products Trust
In our opinion, the accompanying statement of assets and liabilities, including the statement of investments, and the related statements of operations and of changes in net assets and the financial highlights present fairly, in all material respects, the financial position of Franklin Global Communications Securities Fund (one of the funds constituting the Franklin Templeton Variable Insurance Products Trust, hereafter referred to as the “Fund”) at December 31, 2008, the results of its operations for the year then ended, the changes in its net assets for each of the two years in the period then ended and the financial highlights for the periods presented, in conformity with accounting principles generally accepted in the United States of America. These financial statements and financial highlights (hereafter referred to as “financial statements”) are the responsibility of the Fund’s management. Our responsibility is to express an opinion on these financial statements based on our audits. We conducted our audits of these financial statements in accordance with the standards of the Public Company Accounting Oversight Board (United States). Those standards require that we plan and perform the audit to obtain reasonable assurance about whether the financial statements are free of material misstatement. An audit includes examining, on a test basis, evidence supporting the amounts and disclosures in the financial statements, assessing the accounting principles used and significant estimates made by management, and evaluating the overall financial statement presentation. We believe that our audits, which included confirmation of securities at December 31, 2008 by correspondence with the custodian and brokers, provide a reasonable basis for our opinion.
PricewaterhouseCoopers LLP
San Francisco, California
February 10, 2009
FGC-23
Franklin Templeton Variable Insurance Products Trust
Tax Designation (unaudited)
Franklin Global Communications Securities Fund
Under Section 854(b)(2) of the Internal Revenue Code, the Fund designates 100.00% of the ordinary income dividends as income qualifying for the dividends received deduction for the fiscal year ended December 31, 2008.
FGC-24
FRANKLIN GLOBAL REAL ESTATE SECURITIES FUND
This annual report for Franklin Global Real Estate Securities Fund covers the fiscal year ended December 31, 2008.
Performance Summary as of 12/31/08
Average annual total return of Class 1 shares* represents the average annual change in value, assuming reinvestment of dividends and capital gains. Average returns smooth out variations in returns, which can be significant; they are not the same as year-by-year results.
Periods ended 12/31/08
| | | | | | |
| | | 1-Year | | 5-Year | | 10-Year |
Average Annual Total Return | | -42.22% | | -3.59% | | +4.50% |
*The investment manager and administrator have contractually agreed to waive or limit their respective fees so that the increase in investment management and fund administration fees paid by the Fund are phased in over a five-year period, with there being no increase in the rate of such fees for the first year ended 4/30/08. For each of the four years thereafter through 4/30/12, the investment manager and administrator will receive one-fifth of the increase in the rate of fees. Beginning 5/1/12, the full new investment management and administration fees will then be in effect. If the manager and administrator had not waived fees, the Fund’s total returns would have been lower.
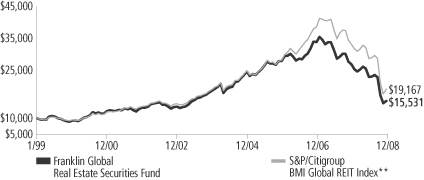
Total Return Index Comparison for a Hypothetical $10,000 Investment (1/1/99–12/31/08)
The graph below shows the change in value of a hypothetical $10,000 investment in the Fund over the indicated period and includes reinvestment of any income or distributions. The Fund’s performance* is compared to the performance of the Standard & Poor’s (S&P)/Citigroup BMI Global REIT Index (hedged into U.S. dollars). One cannot invest directly in an index, nor is an index representative of the Fund’s portfolio. Please see Important Notes to Performance Information preceding the Fund Summaries.
**Source: © 2009 Morningstar. Please see Index Descriptions following the Fund Summaries.
Franklin Global Real Estate Securities Fund Class 1
Performance reflects the Fund’s Class 1 operating expenses, but does not include any contract fees, expenses or sales charges. If they had been included, performance would be lower. These charges and deductions, particularly for variable life policies, can have a significant effect on contract values and insurance benefits. See the contract prospectus for a complete description of these expenses, including sales charges.
Performance data represent past performance, which does not guarantee future results. Investment return and principal value will fluctuate, and you may have a gain or loss when you sell your shares.
Current performance may differ from figures shown.
FGR-1
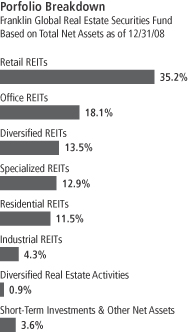
Fund Goal and Main Investments: Franklin Global Real Estate Securities Fund seeks high total return. The Fund normally invests at least 80% of its net assets in investments of companies located anywhere in the world that operate in the real estate sector and normally invests predominantly in equity securities.
Performance Overview
You can find the Fund’s one-year total return in the Performance Summary. The Fund performed comparably to its benchmark, the S&P/Citigroup BMI Global REIT Index (hedged into U.S. dollars), which had a -42.07% total return.1
Economic and Market Overview
The U.S. experienced a marked slowdown in gross domestic product (GDP) growth as housing prices declined, consumer demand softened, and a credit crisis originally related to U.S. subprime loan losses intensified and spread globally. Although GDP growth rebounded in the second quarter of 2008, largely due to fiscal stimulus, the domestic economy contracted in the third and fourth quarters. Fear of recession spanned the entire period, and in the summer most economists agreed that a recession had already begun. By then, the faltering U.S. economy — which is the world’s largest and accounts for roughly 25% of global GDP — had negatively impacted growth prospects around the world. Although signs of a global slowdown surfaced in the latter half of the reporting period, in the first half growth remained robust in developing economies, particularly in Asia.
The China-led demand for oil, natural gas, and industrial and agricultural commodities propelled commodity prices and those of related equities to higher levels. The steep rise in the price of oil, which peaked at $145 per barrel in early July, was one of the most extreme market trends during the year. As a result, oil was a major focus of attention due to its impact on everything from inflation to corporate earnings to consumer spending. The price boom for commodities in general was broadly based and included natural gas, precious metals and most agricultural and industrial commodities, all of which added to global inflationary pressures. In this environment, the world’s monetary authorities faced the choice of lowering short-term interest rates to stimulate growth or raising them to fight rising inflation. Stimulus provided through fiscal and monetary policies implemented around the globe sought to restore financial market stability and reignite economic growth.
1. Source: © 2009 Morningstar. One cannot invest directly in an index, nor is an index representative of the Fund’s portfolio. Please see Index Descriptions following the Fund Summaries.
Fund Risks: The Fund’s investments in stocks offer the potential for long-term gains but can be subject to short-term price fluctuations. As a nondiversified global fund that invests predominantly in companies that operate in the real estate sector, the Fund carries much greater risk of adverse developments affecting that sector than a fund that invests more broadly. Foreign investing, especially in emerging markets, involves additional risks, including currency fluctuations, economic instability, market volatility, and political and social instability. The Fund’s prospectus also includes a description of the main investment risks.
REITs are real estate investment trust companies, usually with publicly traded stock, that manage a portfolio of income-producing real estate properties such as apartments, hotels, industrial properties, office buildings or shopping centers. Equity REITs also take ownership positions in real estate. Shareholders of equity REITs generally receive income from rents received and receive capital gains when properties are sold at a profit. REITs are generally operated by experienced property management teams and typically concentrate on a specific geographic region or property type.
FGR-2
The U.S. Treasury and the Federal Reserve Board (Fed) took unprecedented steps, including lowering short-term rates to near 0% from 4.25%. The eurozone had made controlling inflation its main goal and kept rates steady at 4.00% until July, when the European Central Bank (ECB) joined many of the world’s central banks whose concerns about inflation had led them to raise rates. The potential for global recession, however, exacerbated by the virtual freeze in the global financial system in September and October, trumped inflationary concerns, and the world’s monetary authorities, including the ECB and the Bank of England, cut interest rates aggressively. The U.S. dollar, which had declined earlier in the period versus many of the world’s currencies, regained ground quickly toward period-end as a flight to the relative safety of U.S. Treasuries prevailed. The greenback appreciated 8.6% relative to most currencies during the year under review.2
In this challenging economic time, volatility came to define global equity markets. Virtually all local indexes ended the 12-month period with marked losses. Despite negative economic data and an outlook for decelerating corporate earnings and profit margins globally, many companies outside the financials sector retained relatively strong balance sheets.
Global Real Estate Market Overview
The global real estate market continued to deteriorate during 2008 as credit markets froze and economic growth slowed. In local currency terms, as measured by the S&P/Citigroup BMI Global REIT Index (hedged into U.S. dollars), the worst performing real estate market was Turkey’s, with a -57.31% total return, followed closely by Singapore’s with a -56.20% return and Australia’s with a -54.16% return.1 Other markets also suffered precipitous drops, including Italy (-50.24%), Germany (-49.43%), Japan (-48.93%) and the U.K. (-43.03%).1 None of the markets represented by the index posted positive results; however, several markets performed better than the overall index, including Taiwan (-7.82%), Malaysia (-14.84%) and Belgium (-17.62%).1
Investment Strategy
We are research-driven, fundamental investors. Our active investment strategy is centered on the belief that unsynchronized regional economic activity within the global economy provides consistent, attractive return opportunities in global real estate markets. When selecting investments for the Fund’s portfolio, we use a bottom-up, value-oriented stock selection process that incorporates macro-level views in the evaluation process.
2. Source: Federal Reserve H10 report.
FGR-3
Manager’s Discussion
During the fiscal year under review, significant detractors from Fund performance relative to the benchmark S&P/Citigroup BMI Global REIT Index (hedged into U.S. dollars) included Valad Property Group and ProLogis. During the period, Valad, an Australia-based listed property trust with a fund platform, suffered from less local investor interest in overseas funds, especially those invested in the U.K., where commercial property values declined substantially. We sold our Valad position by period-end. ProLogis, a U.S. industrial REIT, was hurt by impending debt refinancing needs and massive short covering in December following a management restructuring and a successful effort to raise cash. By country, the U.S. was a major detractor from relative Fund performance, largely due to an underweighted position in health care properties.
Contributors to relative performance included the Fund’s cash position, which averaged 4.5% of total net assets during the Fund’s fiscal year and mitigated the overall market’s decline. Notable contributors to relative Fund performance included U.S. holdings Equity Residential and Corporate Office Properties, and South Africa’s Growthpoint Properties.3 Equity Residential, the largest U.S. apartment REIT owner, benefited from its access to Freddie Mac and Fannie Mae funding, especially after their government rescue. New holding Corporate Office, an office REIT based in Washington, DC, was helped by having the U.S. government as a significant tenant. By country, South Africa helped relative results. We initiated our only South African position, Growthpoint Properties, during the period due to its reduced development pipeline and diversified tenant base.
We believe the REITs we own have quality management teams that have led their companies through past economic downturns and positioned them to navigate uncertain times with sufficient liquidity to survive and then capitalize on any distress in local property markets. With conservative balance sheets, free cash-flow generation exceeding dividend payout requirements, and the ownership of higher quality “hard” assets in their respective markets, many REITs, we believe, should be able to survive the current economic downturn. At the same time, REITs, including some of the strongest among them, traded at what we considered attractive valuations at period-end as measured by dividend yields, cash flow multiples and discounts to net asset value. In our analysis, distressed selling by some weaker REITs and overleveraged private real estate investors may occur in 2009, which may create opportunities for companies with solid balance sheets and access to capital to acquire quality assets.
Top 10 Holdings
Franklin Global Real Estate Securities Fund 12/31/08
| | |
Company
Sector/Industry,
Country | | % of Total
Net Assets |
| |
| Westfield Group | | 6.6% |
| Retail REITs, Australia | | |
| |
| Unibail-Rodamco | | 4.5% |
| Retail REITs, France | | |
| |
| Vornado Realty Trust | | 4.2% |
| Diversified REITs, U.S. | | |
| |
| Equity Residential | | 4.2% |
| Residential REITs, U.S. | | |
| |
| Public Storage | | 4.2% |
| Specialized REITs, U.S. | | |
| |
| Simon Property Group Inc. | | 4.1% |
| Retail REITs, U.S. | | |
| |
| Boston Properties Inc. | | 3.5% |
| Office REITs, U.S. | | |
| |
| Land Securities Group PLC | | 3.3% |
| Retail REITs, U.K. | | |
| |
| Nippon Building Fund Inc. | | 2.8% |
| Office REITs, Japan | | |
| |
| HCP Inc. | | 2.3% |
| Specialized REITs, U.S. | | |
The dollar value, number of shares or principal amount, and names of all portfolio holdings are listed in the Fund’s Statement of Investments.
3. This holding is not an index component.
FGR-4
In this challenging environment, we are confident that the portfolio’s relatively high income and low volatility, combined with an active management policy, have the potential to generate superior returns over time.
Thank you for your participation in Franklin Global Real Estate Securities Fund. We look forward to serving your future investment needs.
The foregoing information reflects our analysis, opinions and portfolio holdings as of December 31, 2008, the end of the reporting period. The way we implement our main investment strategies and the resulting portfolio holdings may change depending on factors such as market and economic conditions. These opinions may not be relied upon as investment advice or an offer for a particular security. The information is not a complete analysis of every aspect of any market, country, industry, security or the Fund. Statements of fact are from sources considered reliable, but the investment manager makes no representation or warranty as to their completeness or accuracy. Although historical performance is no guarantee of future results, these insights may help you understand our investment management philosophy.
FGR-5
Fund Expenses
As an investor in a variable insurance contract (Contract) that indirectly provides for investment in an underlying mutual fund, you can incur transaction and/or ongoing expenses at both the Fund level and the Contract level.
| • | | Transaction expenses can include sales charges (loads) on purchases, redemption fees, surrender fees, transfer fees and premium taxes. |
| • | | Ongoing expenses can include management fees, distribution and service (12b-1) fees, contract fees, annual maintenance fees, mortality and expense risk fees and other fees and expenses. All mutual funds and Contracts have some types of ongoing expenses. |
The expenses shown in the table are meant to highlight ongoing expenses at the Fund level only and do not include ongoing expenses at the Contract level, or transaction expenses at either the Fund or Contract level. While the Fund does not have transaction expenses, if the transaction and ongoing expenses at the Contract level were included, the expenses shown would be higher. You should consult your Contract prospectus or disclosure document for more information.
The table shows Fund-level ongoing expenses and can help you understand these expenses and compare them with those of other mutual funds offered through the Contract. The table assumes a $1,000 investment held for the six months indicated. Please refer to the Fund prospectus for additional information on operating expenses.
Actual Fund Expenses
The first line (Actual) of the table provides actual account values and expenses. The “Ending Account Value” is derived from the Fund’s actual return, which includes the effect of ongoing Fund expenses, but does not include the effect of ongoing Contract expenses.
You can estimate the Fund-level expenses you incurred during the period by following these steps. Of course, your account value and expenses will differ from those in this illustration:
| 1. | Divide your account value by $1,000. |
If an account had an $8,600 value, then $8,600 ÷ $1,000 = 8.6.
| 2. | Multiply the result by the number under the heading “Fund-Level Expenses Incurred During Period.” |
If Fund-Level Expenses Incurred During Period were $7.50, then 8.6 x $7.50 = $64.50.
In this illustration, the estimated expenses incurred this period at the Fund level are $64.50.
Franklin Global Real Estate Securities Fund Class 1
FGR-6
Hypothetical Example for Comparison with Other Mutual Funds
Information in the second line (Hypothetical) of the table can help you compare ongoing expenses of the Fund with those of other mutual funds offered through the Contract. This information may not be used to estimate the actual ending account balance or expenses you incurred during the period. The hypothetical “Ending Account Value” is based on the Fund’s actual expense ratio and an assumed 5% annual rate of return before expenses, which does not represent the Fund’s actual return. The figure under the heading “Fund-Level Expenses Incurred During Period” shows the hypothetical expenses your account would have incurred under this scenario. You can compare this figure with the 5% hypothetical examples that appear in shareholder reports of other funds offered through a Contract.
| | | | | | | | | |
| Class 1 | | Beginning
Account Value 7/1/08 | | Ending
Account
Value 12/31/08 | | Fund-Level
Expenses Incurred
During Period*
7/1/08–12/31/08 |
Actual | | $ | 1,000 | | $ | 675.40 | | $ | 2.70 |
Hypothetical (5% return before expenses) | | $ | 1,000 | | $ | 1,021.92 | | $ | 3.25 |
*Expenses are calculated using the most recent six-month annualized expense ratio, net of expense waiver, for the Fund’s Class 1 shares (0.64%), which does not include any ongoing expenses of the Contract for which the Fund is an investment option, multiplied by the average account value over the period, multiplied by 184/366 to reflect the one-half year period.
FGR-7
Franklin Templeton Variable Insurance Products Trust
Financial Highlights
Franklin Global Real Estate Securities Fund
| | | | | | | | | | | | | | | | | | | | |
| | | Year Ended December 31, | |
| Class 1 | | 2008 | | | 2007 | | | 2006 | | | 2005 | | | 2004 | |
| | | | |
Per share operating performance | | | | | | | | | | | | | | | | | | | | |
(for a share outstanding throughout the year) | | | | | | | | | | | | | | | | | | | | |
Net asset value, beginning of year | | $ | 25.42 | | | $ | 35.25 | | | $ | 32.55 | | | $ | 30.87 | | | $ | 23.91 | |
| | | | |
Income from investment operationsa: | | | | | | | | | | | | | | | | | | | | |
Net investment incomeb | | | 0.62 | | | | 0.80 | | | | 0.67 | | | | 0.70 | | | | 0.75 | |
Net realized and unrealized gains (losses) | | | (9.10 | ) | | | (7.56 | ) | | | 5.40 | | | | 3.38 | | | | 6.78 | |
| | | | |
Total from investment operations | | | (8.48 | ) | | | (6.76 | ) | | | 6.07 | | | | 4.08 | | | | 7.53 | |
| | | | |
Less distributions from: | | | | | | | | | | | | | | | | | | | | |
Net investment income | | | (0.32 | ) | | | (0.81 | ) | | | (0.75 | ) | | | (0.49 | ) | | | (0.53 | ) |
Net realized gains | | | (5.78 | ) | | | (2.26 | ) | | | (2.62 | ) | | | (1.91 | ) | | | (0.04 | ) |
| | | | |
Total distributions | | | (6.10 | ) | | | (3.07 | ) | | | (3.37 | ) | | | (2.40 | ) | | | (0.57 | ) |
| | | | |
Net asset value, end of year | | $ | 10.84 | | | $ | 25.42 | | | $ | 35.25 | | | $ | 32.55 | | | $ | 30.87 | |
| | | | |
| | | | | |
Total returnc | | | (42.22)% | | | | (20.65)% | | | | 20.87% | | | | 13.74% | | | | 32.19% | |
Ratios to average net assets | | | | | | | | | | | | | | | | | | | | |
Expenses before waiver and payments by affiliates | | | 1.08% | | | | 0.84% | | | | 0.50% | | | | 0.49% | | | | 0.50% | |
Expenses net of waiver and payments by affiliatesd | | | 0.60% | | | | 0.52% | | | | 0.50% | | | | 0.49% | | | | 0.50% | |
Net investment income | | | 3.41% | | | | 2.57% | | | | 2.04% | | | | 2.32% | | | | 3.00% | |
| | | | | |
Supplemental data | | | | | | | | | | | | | | | | | | | | |
Net assets, end of year (000’s) | | $ | 39,018 | | | $ | 83,250 | | | $ | 140,487 | | | $ | 145,425 | | | $ | 152,451 | |
Portfolio turnover rate | | | 77.28% | | | | 121.84% | | | | 31.39% | | | | 36.10% | | | | 39.42% | |
aThe amount shown for a share outstanding throughout the period may not correlate with the Statement of Operations for the period due to the timing of sales and repurchases of the Fund shares in relation to income earned and/or fluctuating market value of the investments of the Fund.
bBased on average daily shares outstanding .
cTotal return does not include any fees, charges or expenses imposed by the variable annuity and life insurance contracts for which the Franklin Templeton Variable Insurance Products Trust serves as an underlying investment vehicle.
dBenefit of expense reduction rounds to less than 0.01%.
The accompanying notes are an integral part of these financial statements.
FGR-8
Franklin Templeton Variable Insurance Products Trust
Financial Highlights (continued)
Franklin Global Real Estate Securities Fund
| | | | | | | | | | | | | | | | | | | | |
| | | Year Ended December 31, | |
| Class 2 | | 2008 | | | 2007 | | | 2006 | | | 2005 | | | 2004 | |
| | | | |
Per share operating performance | | | | | | | | | | | | | | | | | | | | |
(for a share outstanding throughout the year) | | | | | | | | | | | | | | | | | | | | |
Net asset value, beginning of year | | $ | 24.97 | | | $ | 34.67 | | | $ | 32.08 | | | $ | 30.49 | | | $ | 23.65 | |
| | | | |
Income from investment operationsa: | | | | | | | | | | | | | | | | | | | | |
Net investment incomeb | | | 0.56 | | | | 0.72 | | | | 0.58 | | | | 0.64 | | | | 0.72 | |
Net realized and unrealized gains (losses) | | | (8.93 | ) | | | (7.43 | ) | | | 5.31 | | | | 3.30 | | | | 6.65 | |
| | | | |
Total from investment operations | | | (8.37 | ) | | | (6.71 | ) | | | 5.89 | | | | 3.94 | | | | 7.37 | |
| | | | |
Less distributions from: | | | | | | | | | | | | | | | | | | | | |
Net investment income | | | (0.21 | ) | | | (0.73 | ) | | | (0.68 | ) | | | (0.44 | ) | | | (0.49 | ) |
Net realized gains | | | (5.78 | ) | | | (2.26 | ) | | | (2.62 | ) | | | (1.91 | ) | | | (0.04 | ) |
| | | | |
Total distributions | | | (5.99 | ) | | | (2.99 | ) | | | (3.30 | ) | | | (2.35 | ) | | | (0.53 | ) |
| | | | |
Net asset value, end of year | | $ | 10.61 | | | $ | 24.97 | | | $ | 34.67 | | | $ | 32.08 | | | $ | 30.49 | |
| | | | |
| | | | | |
Total returnc | | | (42.39)% | | | | (20.86)% | | | | 20.58% | | | | 13.47% | | | | 31.80% | |
Ratios to average net assets | | | | | | | | | | | | | | | | | | | | |
Expenses before waiver and payments by affiliates | | | 1.33% | | | | 1.09% | | | | 0.75% | | | | 0.74% | | | | 0.75% | |
Expenses net of waiver and payments by affiliatesd | | | 0.85% | | | | 0.77% | | | | 0.75% | | | | 0.74% | | | | 0.75% | |
Net investment income | | | 3.16% | | | | 2.32% | | | | 1.79% | | | | 2.07% | | | | 2.75% | |
| | | | | |
Supplemental data | | | | | | | | | | | | | | | | | | | | |
Net assets, end of year (000’s) | | $ | 343,701 | | | $ | 893,837 | | | $ | 1,491,571 | | | $ | 1,343,868 | | | $ | 1,005,647 | |
Portfolio turnover rate | | | 77.28% | | | | 121.84% | | | | 31.39% | | | | 36.10% | | | | 39.42% | |
aThe amount shown for a share outstanding throughout the period may not correlate with the Statement of Operations for the period due to the timing of sales and repurchases of the Fund shares in relation to income earned and/or fluctuating market value of the investments of the Fund.
bBased on average daily shares outstanding ..
cTotal return does not include any fees, charges or expenses imposed by the variable annuity and life insurance contracts for which the Franklin Templeton Variable Insurance Products Trust serves as an underlying investment vehicle.
dBenefit of expense reduction rounds to less than 0.01%.
The accompanying notes are an integral part of these financial statements.
FGR-9
Franklin Templeton Variable Insurance Products Trust
Financial Highlights (continued)
Franklin Global Real Estate Securities Fund
| | | | |
| | | Period Ended
December 31, | |
| Class 4 | | 2008a | |
| | | | |
Per share operating performance | | | | |
(for a share outstanding throughout the period) | | | | |
Net asset value, beginning of period | | $ | 23.34 | |
| | | | |
Income from investment operationsb: | | | | |
Net investment incomec | | | 0.45 | |
Net realized and unrealized gains (losses) | | | (6.89 | ) |
| | | | |
Total from investment operations | | | (6.44 | ) |
| | | | |
Less distributions from: | | | | |
Net investment income | | | (0.32 | ) |
Net realized gains | | | (5.78 | ) |
| | | | |
Total distributions | | | (6.10 | ) |
| | | | |
Net asset value, end of period | | $ | 10.80 | |
| | | | |
| |
Total returnd | | | (37.28)% | |
Ratios to average net assetse | | | | |
Expenses before waiver and payments by affiliates | | | 1.43% | |
Expenses net of waiver and payments by affiliatesf | | | 0.95% | |
Net investment income | | | 3.06% | |
| |
Supplemental data | | | | |
Net assets, end of period (000’s) | | $ | 2 | |
Portfolio turnover rate | | | 77.28% | |
aFor the period February 29, 2008 (effective date) to December 31, 2008.
bThe amount shown for a share outstanding throughout the period may not correlate with the Statement of Operations for the period due to the timing of sales and repurchases of the Fund shares in relation to income earned and/or fluctuating market value of the investments of the Fund.
cBased on average daily shares outstanding.
dTotal return does not include any fees, charges or expenses imposed by the variable annuity and life insurance contracts for which the Franklin Templeton Variable Insurance Products Trust serves as an underlying investment vehicle. Total return is not annualized for periods less than one year.
eRatios are annualized for periods less than one year.
fBenefit of expense reduction rounds to less than 0.01%.
The accompanying notes are an integral part of these financial statements.
FGR-10
Franklin Templeton Variable Insurance Products Trust
Statement of Investments, December 31, 2008
| | | | | | | |
| Franklin Global Real Estate Securities Fund | | Country | | Shares/
Rights | | Value |
Common Stocks and Rights 96.4% | | | | | | | |
Diversified Real Estate Activities 0.9% | | | | | | | |
Growthpoint Properties Ltd. | | South Africa | | 2,075,265 | | $ | 3,311,593 |
Growthpoint Properties Ltd., rts., 1/30/09 | | South Africa | | 206,337 | | | 40,609 |
| | | | | | | |
| | | | | | | 3,352,202 |
| | | | | | | |
Diversified REITs 13.5% | | | | | | | |
British Land Co. PLC | | United Kingdom | | 980,100 | | | 7,894,640 |
Canadian REIT | | Canada | | 112,900 | | | 2,094,143 |
Dexus Property Group | | Australia | | 4,137,127 | | | 2,402,868 |
GPT Group | | Australia | | 4,912,979 | | | 3,201,474 |
aKiwi Income Property Trust | | New Zealand | | 3,752,306 | | | 2,214,397 |
Liberty Property Trust | | United States | | 178,400 | | | 4,072,872 |
Mirvac Group | | Australia | | 1,561,956 | | | 1,416,107 |
bMirvac Group, 144A | | Australia | | 877,527 | | | 795,587 |
PS Business Parks Inc. | | United States | | 29,800 | | | 1,330,868 |
Stockland | | Australia | | 1,958,904 | | | 5,605,467 |
aTokyu REIT Inc. | | Japan | | 236 | | | 1,463,818 |
Vornado Realty Trust | | United States | | 265,500 | | | 16,022,925 |
Wereldhave NV | | Netherlands | | 38,550 | | | 3,395,981 |
| | | | | | | |
| | | | | | | 51,911,147 |
| | | | | | | |
Industrial REITs 4.3% | | | | | | | |
AMB Property Corp. | | United States | | 164,100 | | | 3,843,222 |
Ascendas REIT | | Singapore | | 1,848,000 | | | 1,767,372 |
EastGroup Properties Inc. | | United States | | 45,500 | | | 1,618,890 |
Goodman Group | | Australia | | 2,433,832 | | | 1,275,674 |
aJapan Logistics Fund Inc. | | Japan | | 231 | | | 1,401,112 |
ProLogis | | United States | | 330,400 | | | 4,589,256 |
Segro PLC | | United Kingdom | | 616,600 | | | 2,228,923 |
| | | | | | | |
| | | | | | | 16,724,449 |
| | | | | | | |
Office REITs 18.1% | | | | | | | |
aAMP NZ Office Trust | | New Zealand | | 2,744,633 | | | 1,603,689 |
Befimmo Sca | | Belgium | | 18,600 | | | 1,737,360 |
Boston Properties Inc. | | United States | | 246,000 | | | 13,530,000 |
Cofinimmo | | Belgium | | 23,600 | | | 3,119,149 |
Commonwealth Property Office Fund | | Australia | | 3,172,679 | | | 2,651,706 |
Corporate Office Properties Trust | | United States | | 228,800 | | | 7,024,160 |
Douglas Emmett Inc. | | United States | | 336,000 | | | 4,388,160 |
Highwoods Properties Inc. | | United States | | 239,300 | | | 6,547,248 |
ING Office Fund | | Australia | | 2,544,931 | | | 1,460,085 |
Japan Real Estate Investment Co. | | Japan | | 867 | | | 7,738,629 |
aNippon Building Fund Inc. | | Japan | | 962 | | | 10,565,332 |
aNomura Real Estate Office Fund Inc. | | Japan | | 349 | | | 2,268,941 |
ORIX JREIT Inc. | | Japan | | 521 | | | 2,472,383 |
Silic | | France | | 22,040 | | | 2,033,407 |
SL Green Realty Corp. | | United States | | 81,800 | | | 2,118,620 |
| | | | | | | |
| | | | | | | 69,258,869 |
| | | | | | | |
Residential REITs 11.5% | | | | | | | |
AvalonBay Communities Inc. | | United States | | 130,300 | | | 7,893,574 |
Camden Property Trust | | United States | | 80,800 | | | 2,532,272 |
Equity Lifestyle Properties Inc. | | United States | | 106,400 | | | 4,081,504 |
Equity Residential | | United States | | 536,900 | | | 16,010,358 |
FGR-11
Franklin Templeton Variable Insurance Products Trust
Statement of Investments, December 31, 2008 (continued)
| | | | | | | |
| Franklin Global Real Estate Securities Fund | | Country | | Shares/
Rights | | Value |
Common Stocks and Rights (continued) | | | | | | | |
Residential REITs (continued) | | | | | | | |
Essex Property Trust Inc. | | United States | | 54,500 | | $ | 4,182,875 |
Home Properties Inc. | | United States | | 44,200 | | | 1,794,520 |
aNippon Accommodations Fund Inc. | | Japan | | 372 | | | 1,589,925 |
UDR Inc. | | United States | | 422,700 | | | 5,829,033 |
| | | | | | | |
| | | | | | | 43,914,061 |
| | | | | | | |
Retail REITs 35.2% | | | | | | | |
CapitaMall Trust | | Singapore | | 1,561,400 | | | 1,733,072 |
Cedar Shopping Centers Inc. | | United States | | 161,700 | | | 1,144,836 |
CFS Retail Property Trust | | Australia | | 3,309,702 | | | 4,383,770 |
Corio NV | | Netherlands | | 95,230 | | | 4,379,636 |
Eurocommercial Properties NV | | Netherlands | | 78,130 | | | 2,621,980 |
Federal Realty Investment Trust | | United States | | 96,200 | | | 5,972,096 |
aFrontier Real Estate Investment Corp. | | Japan | | 411 | | | 2,273,776 |
Hammerson PLC | | United Kingdom | | 384,700 | | | 3,008,833 |
aJapan Retail Fund Investment Corp. | | Japan | | 456 | | | 1,967,996 |
Kimco Realty Corp. | | United States | | 228,400 | | | 4,175,152 |
Klepierre | | France | | 81,980 | | | 2,006,071 |
Land Securities Group PLC | | United Kingdom | | 947,900 | | | 12,750,833 |
Liberty International PLC | | United Kingdom | | 207,600 | | | 1,456,925 |
aLink REIT | | Hong Kong | | 3,627,100 | | | 5,990,411 |
Mercialys | | France | | 29,930 | | | 940,604 |
Realty Income Corp. | | United States | | 152,900 | | | 3,539,635 |
Regency Centers Corp. | | United States | | 119,600 | | | 5,585,320 |
RioCan REIT | | Canada | | 404,800 | | | 4,544,352 |
Simon Property Group Inc. | | United States | | 297,045 | | | 15,782,001 |
Suntec REIT | | Singapore | | 1,943,900 | | | 963,469 |
Tanger Factory Outlet Centers Inc. | | United States | | 137,600 | | | 5,176,512 |
Taubman Centers Inc. | | United States | | 66,700 | | | 1,698,182 |
Unibail-Rodamco | | France | | 116,683 | | | 17,376,310 |
Westfield Group | | Australia | | 2,750,527 | | | 25,229,169 |
| | | | | | | |
| | | | | | | 134,700,941 |
| | | | | | | |
Specialized REITs 12.9% | | | | | | | |
HCP Inc. | | United States | | 321,000 | | | 8,914,170 |
Health Care REIT Inc. | | United States | | 167,000 | | | 7,047,400 |
Host Hotels & Resorts Inc. | | United States | | 717,014 | | | 5,427,796 |
Nationwide Health Properties Inc. | | United States | | 211,400 | | | 6,071,408 |
Public Storage | | United States | | 200,900 | | | 15,971,550 |
Ventas Inc. | | United States | | 174,800 | | | 5,868,036 |
| | | | | | | |
| | | | | | | 49,300,360 |
| | | | | | | |
Total Common Stocks and Rights
(Cost $507,802,573) | | | | | | | 369,162,029 |
| | | | | | | |
FGR-12
Franklin Templeton Variable Insurance Products Trust
Statement of Investments, December 31, 2008 (continued)
| | | | | | | | | |
| Franklin Global Real Estate Securities Fund | | Country | | Principal
Amount | | Value | |
Short Term Investments (Cost $13,786,445) 3.6% | | | | | | | | | |
Repurchase Agreements 3.6% | | | | | | | | | |
cJoint Repurchase Agreement, 0.019%, 01/02/09 (Maturity Value $13,786,460) | | United States | | $ | 13,786,445 | | $ | 13,786,445 | |
Banc of America Securities LLC (Maturity Value $2,127,801) | | | | | | | | | |
Barclays Capital Inc. (Maturity Value $2,026,610) | | | | | | | | | |
BNP Paribas Securities Corp. (Maturity Value $2,702,146) | | | | | | | | | |
Credit Suisse Securities (USA) LLC (Maturity Value $2,702,146) | | | | | | | | | |
Deutsche Bank Securities Inc. (Maturity Value $1,559,387) | | | | | | | | | |
HSBC Securities (USA) Inc. (Maturity Value $2,026,610) | | | | | | | | | |
UBS Securities LLC (Maturity Value $641,760) | | | | | | | | | |
Collateralized by U.S. Government Agency Securities, 3.50% - 7.00%, 6/15/09 - 5/20/22;
dU.S. Government Agency Discount Notes, 1/05/09 - 10/19/09;
dU.S. Treasury Bills, 1/15/09; and U.S. Treasury Notes,
0.875% - 4.625%, 7/15/09 - 2/28/11 | | | | | | | | | |
| | | | | | | | | |
Total Investments (Cost $521,589,018) 100.0% | | | | | | | | 382,948,474 | |
Net Unrealized Depreciation on Forward Exchange
Contracts (0.4)% | | | | | | | | (1,637,170 | ) |
Other Assets, less Liabilities 0.4% | | | | | | | | 1,409,714 | |
| | | | | | | | | |
Net Assets 100.0% | | | | | | | $ | 382,721,018 | |
| | | | | | | | | |
See Abbreviations on page FGR-24.
aA portion or all of the security purchased on a delayed delivery basis. See Note 1(d).
bSecurity was purchased pursuant to Rule 144A under the Securities Act of 1933 and may be sold in transactions exempt from registration only to qualified institutional buyers or in a public offering registered under the Securities Act of 1933. This security has been deemed liquid under guidelines approved by the Trust’s Board of Trustees. At December 31, 2008, the value of this security was $795,587, representing 0.21% of net assets.
cSee Note 1(c) regarding joint repurchase agreement.
dThe security is traded on a discount basis with no stated coupon rate.
The accompanying notes are an integral part of these financial statements.
FGR-13
Franklin Templeton Variable Insurance Products Trust
Financial Statements
Statement of Assets and Liabilities
December 31, 2008
| | | | |
| | | Franklin Global
Real Estate
Securities Fund | |
Assets: | | | | |
Investments in securities: | | | | |
Cost - Unaffiliated issuers | | $ | 507,802,573 | |
Cost - Repurchase agreements | | | 13,786,445 | |
| | | | |
Total cost of investments | | $ | 521,589,018 | |
| | | | |
Value - Unaffiliated issuers | | $ | 369,162,029 | |
Value - Repurchase agreements | | | 13,786,445 | |
| | | | |
Total value of investments | | | 382,948,474 | |
Foreign currency, at value (cost $309) | | | 327 | |
Receivables: | | | | |
Capital shares sold | | | 108,859 | |
Dividends | | | 3,679,919 | |
Unrealized appreciation on forward exchange contracts (Note 7) | | | 6,846,585 | |
| | | | |
Total assets | | | 393,584,164 | |
| | | | |
Liabilities: | | | | |
Payables: | | | | |
Investment securities purchased | | | 1,720,106 | |
Capital shares redeemed | | | 69,049 | |
Affiliates | | | 333,508 | |
Unrealized depreciation on forward exchange contracts (Note 7) | | | 8,483,755 | |
Accrued expenses and other liabilities | | | 256,728 | |
| | | | |
Total liabilities | | | 10,863,146 | |
| | | | |
Net assets, at value | | $ | 382,721,018 | |
| | | | |
Net assets consist of: | | | | |
Paid-in capital | | $ | 728,689,363 | |
Undistributed net investment income | | | 48,180,845 | |
Net unrealized appreciation (depreciation) | | | (140,303,166 | ) |
Accumulated net realized gain (loss) | | | (253,846,024 | ) |
| | | | |
Net assets, at value | | $ | 382,721,018 | |
| | | | |
Class 1: | | | | |
Net assets, at value | | $ | 39,018,195 | |
| | | | |
Shares outstanding | | | 3,600,526 | |
| | | | |
Net asset value and maximum offering price per share | | $ | 10.84 | |
| | | | |
Class 2: | | | | |
Net assets, at value | | $ | 343,700,511 | |
| | | | |
Shares outstanding | | | 32,393,307 | |
| | | | |
Net asset value and maximum offering price per share | | $ | 10.61 | |
| | | | |
Class 4: | | | | |
Net assets, at value | | $ | 2,312 | |
| | | | |
Shares outstanding | | | 214 | |
| | | | |
Net asset value and maximum offering price per share | | $ | 10.80 | |
| | | | |
The accompanying notes are an integral part of these financial statements.
FGR-14
Franklin Templeton Variable Insurance Products Trust
Financial Statements (continued)
Statement of Operations
for the year ended December 31, 2008
| | | | |
| | | Franklin Global
Real Estate
Securities Fund | |
Investment income: | | | | |
Dividends (net of foreign taxes of $1,990,238) | | $ | 26,645,495 | |
Interest | | | 516,943 | |
| | | | |
Total investment income | | | 27,162,438 | |
| | | | |
Expenses: | | | | |
Management fees (Note 3a) | | | 5,225,378 | |
Administrative fees (Note 3b) | | | 1,696,396 | |
Distribution fees: (Note 3c) | | | | |
Class 2 | | | 1,535,866 | |
Class 4 | | | 11 | |
Unaffiliated transfer agent fees | | | 1,397 | |
Custodian fees (Note 4) | | | 90,171 | |
Reports to shareholders | | | 202,123 | |
Professional fees | | | 33,475 | |
Trustees’ fees and expenses | | | 3,866 | |
Other | | | 28,365 | |
| | | | |
Total expenses | | | 8,817,048 | |
Expense reductions (Note 4) | | | (4,782 | ) |
Expenses waived/paid by affiliates (Note 3e) | | | (3,195,511 | ) |
| | | | |
Net expenses | | | 5,616,755 | |
| | | | |
Net investment income | | | 21,545,683 | |
| | | | |
Realized and unrealized gains (losses): | | | | |
Net realized gain (loss) from: | | | | |
Investments | | | (219,061,824 | ) |
Foreign currency transactions | | | 30,605,492 | |
| | | | |
Net realized gain (loss) | | | (188,456,332 | ) |
| | | | |
Net change in unrealized appreciation (depreciation) on: | | | | |
Investments | | | (154,186,461 | ) |
Translation of other assets and liabilities denominated in foreign currencies | | | (9,156,992 | ) |
| | | | |
Net change in unrealized appreciation (depreciation) | | | (163,343,453 | ) |
| | | | |
Net realized and unrealized gain (loss) | | | (351,799,785 | ) |
| | | | |
Net increase (decrease) in net assets resulting from operations | | $ | (330,254,102 | ) |
| | | | |
The accompanying notes are an integral part of these financial statements.
FGR-15
Franklin Templeton Variable Insurance Products Trust
Financial Statements (continued)
Statements of Changes in Net Assets
| | | | | | | | |
| | | Franklin Global Real Estate
Securities Fund | |
| | | Year Ended December 31, | |
| | | 2008 | | | 2007 | |
| | | | |
Increase (decrease) in net assets: | | | | | | | | |
Operations: | | | | | | | | |
Net investment income | | $ | 21,545,683 | | | $ | 32,162,361 | |
Net realized gain (loss) from investments and foreign currency transactions | | | (188,456,332 | ) | | | 128,649,187 | |
Net change in unrealized appreciation (depreciation) on investments and translation of other assets and liabilities denominated in foreign currencies | | | (163,343,453 | ) | | | (461,184,314 | ) |
| | | | |
Net increase (decrease) in net assets resulting from operations | | | (330,254,102 | ) | | | (300,372,766 | ) |
| | | | |
Distributions to shareholders from: | | | | | | | | |
Net investment income: | | | | | | | | |
Class 1 | | | (938,439 | ) | | | (2,857,012 | ) |
Class 2 | | | (6,327,844 | ) | | | (29,449,245 | ) |
Class 4 | | | (68 | ) | | | — | |
Net realized gains: | | | | | | | | |
Class 1 | | | (17,121,915 | ) | | | (7,916,992 | ) |
Class 2 | | | (172,823,447 | ) | | | (91,299,137 | ) |
Class 4 | | | (1,237 | ) | | | — | |
| | | | |
Total distributions to shareholders | | | (197,212,950 | ) | | | (131,522,386 | ) |
| | | | |
Capital share transactions: (Note 2) | | | | | | | | |
Class 1 | | | 5,111,100 | | | | (22,282,799 | ) |
Class 2 | | | (72,014,922 | ) | | | (200,793,537 | ) |
Class 4 | | | 5,000 | | | | — | |
| | | | |
Total capital share transactions | | | (66,898,822 | ) | | | (223,076,336 | ) |
| | | | |
Net increase (decrease) in net assets | | | (594,365,874 | ) | | | (654,971,488 | ) |
Net assets: | | | | | | | | |
Beginning of year | | | 977,086,892 | | | | 1,632,058,380 | |
| | | | |
End of year | | $ | 382,721,018 | | | $ | 977,086,892 | |
| | | | |
Undistributed net investment income (distributions in excess of net investment income) included in net assets: | | | | | | | | |
End of year | | $ | 48,180,845 | | | $ | (2,396,222 | ) |
| | | | |
The accompanying notes are an integral part of these financial statements.
FGR-16
Franklin Templeton Variable Insurance Products Trust
Notes to Financial Statements
Franklin Global Real Estate Securities Fund
1. ORGANIZATION AND SIGNIFICANT ACCOUNTING POLICIES
Franklin Templeton Variable Insurance Products Trust (Trust) is registered under the Investment Company Act of 1940, as amended, (1940 Act) as an open-end investment company, consisting of twenty-three separate funds. The Franklin Global Real Estate Securities Fund (Fund) is included in this report. The financial statements of the remaining funds in the Trust are presented separately. Shares of the Fund are sold only to insurance company separate accounts to fund the benefits of variable life insurance policies or variable annuity contracts. At December 31, 2008, 62.27% of the Fund’s shares were held through one insurance company. The Fund offers three classes of shares: Class 1, Class 2, and Class 4. Effective February 29, 2008, the Fund began offering a new class of shares, Class 4. Each class of shares differs by its distribution fees, voting rights on matters affecting a single class and its exchange privilege.
The following summarizes the Fund’s significant accounting policies.
a. Security Valuation
Securities listed on a securities exchange or on the NASDAQ National Market System are valued at the last quoted sale price or the official closing price of the day, respectively. Over-the-counter securities and listed securities for which there is no reported sale are valued within the range of the most recent quoted bid and ask prices. Securities that trade in multiple markets or on multiple exchanges are valued according to the broadest and most representative market.
Foreign securities are valued as of the close of trading on the foreign stock exchange on which the security is primarily traded, or the NYSE, whichever is earlier. If no sale is reported at that time, the foreign security will be valued within the range of the most recent quoted bid and ask prices. The value is then converted into its U.S. dollar equivalent at the foreign exchange rate in effect at the close of the NYSE on the day that the value of the foreign security is determined.
The Trust has procedures to determine the fair value of individual securities and other assets for which market prices are not readily available or which may not be reliably priced. Methods for valuing these securities may include: fundamental analysis, matrix pricing, discounts from market prices of similar securities, or discounts applied due to the nature and duration of restrictions on the disposition of the securities. Due to the inherent uncertainty of valuations of such securities, the fair values may differ significantly from the values that would have been used had a ready market for such investments existed. Occasionally, events occur between the time at which trading in a security is completed and the close of the NYSE that might call into question the availability (including the reliability) of the value of a portfolio security held by the Fund. The investment manager monitors price movements following the close of trading in foreign stock markets through a series of country specific market proxies (such as baskets of American Depository Receipts, futures contracts and exchange traded funds). These price movements are measured against established trigger thresholds for each specific market proxy to assist in determining if an event has occurred. If such an event occurs, the securities may be valued using fair value procedures, which may include the use of independent pricing services. At December 31, 2008, a portion of the securities held by the Fund were fair valued. All security valuation procedures are approved by the Trust’s Board of Trustees.
b. Foreign Currency Translation
Portfolio securities and other assets and liabilities denominated in foreign currencies are translated into U.S. dollars based on the exchange rate of such currencies against U.S. dollars on the date of valuation. Purchases and sales of securities, income and expense items denominated in foreign currencies are translated into U.S. dollars at the exchange rate in effect on the transaction date. Occasionally, events may impact the availability or reliability of foreign exchange rates used to convert the U.S. dollar equivalent value. If such an event occurs, the foreign exchange rate will be valued at fair value using procedures established and approved by the Trust’s Board of Trustees.
FGR-17
Franklin Templeton Variable Insurance Products Trust
Notes to Financial Statements (continued)
Franklin Global Real Estate Securities Fund
1. ORGANIZATION AND SIGNIFICANT ACCOUNTING POLICIES (continued)
b. Foreign Currency Translation (continued)
The Fund does not separately report the effect of changes in foreign exchange rates from changes in market prices on securities held. Such changes are included in net realized and unrealized gain or loss from investments on the Statement of Operations.
Realized foreign exchange gains or losses arise from sales of foreign currencies, currency gains or losses realized between the trade and settlement dates on securities transactions and the difference between the recorded amounts of dividends, interest, and foreign withholding taxes and the U.S. dollar equivalent of the amounts actually received or paid. Net unrealized foreign exchange gains and losses arise from changes in foreign exchange rates on foreign denominated assets and liabilities other than investments in securities held at the end of the reporting period.
c. Joint Repurchase Agreement
The Fund may enter into a joint repurchase agreement whereby its uninvested cash balance is deposited into a joint cash account with other funds managed by the investment manager or an affiliate of the investment manager and is used to invest in one or more repurchase agreements. The value and face amount of the joint repurchase agreement are allocated to the funds based on their pro-rata interest. A repurchase agreement is accounted for as a loan by the fund to the seller, collateralized by securities which are delivered to the fund’s custodian. The market value, including accrued interest, of the initial collateralization is required to be at least 102% of the dollar amount invested by the funds, with the value of the underlying securities marked to market daily to maintain coverage of at least 100%. The joint repurchase agreement held by the Fund at year end had been entered into on December 31, 2008. The joint repurchase agreement is valued at cost.
d. Securities Purchased on a Delayed Delivery Basis
The Fund may purchase securities on a delayed delivery basis, with payment and delivery scheduled for a future date. These transactions are subject to market fluctuations and are subject to the risk that the value at delivery may be more or less than the trade date purchase price. Although the Fund will generally purchase these securities with the intention of holding the securities, it may sell the securities before the settlement date. Sufficient assets have been segregated for these securities.
e. Foreign Currency Contracts
When the Fund purchases or sells foreign securities it may enter into foreign exchange contracts to minimize foreign exchange risk from the trade date to the settlement date of the transactions. A foreign exchange contract is an agreement between two parties to exchange different currencies at an agreed upon exchange rate at a future date. Realized and unrealized gains and losses on these contracts are included in the Statement of Operations.
The Fund may also enter into forward exchange contracts to hedge against fluctuations in foreign exchange rates. These contracts are valued daily by the Fund and the unrealized appreciation or depreciation on the contracts, as measured by the difference between the contractual forward foreign exchange rates and the forward rates at the reporting date, are included in the Statement of Assets and Liabilities. Realized and unrealized gains and losses on these contracts are included in the Statement of Operations.
The risks of these contracts include movement in the values of the foreign currencies relative to the U.S. dollar and the possible inability of the counterparties to fulfill their obligations under the contracts, which may be in excess of the amount reflected in the Statement of Assets and Liabilities.
f. Income Taxes
No provision has been made for U.S. income taxes because it is the Fund’s policy to qualify as a regulated investment company under the Internal Revenue Code and to distribute to shareholders substantially all of its taxable income and net realized gains.
FGR-18
Franklin Templeton Variable Insurance Products Trust
Notes to Financial Statements (continued)
Franklin Global Real Estate Securities Fund
1. ORGANIZATION AND SIGNIFICANT ACCOUNTING POLICIES (continued)
f. Income Taxes (continued)
Foreign securities held by the Fund may be subject to foreign taxation on dividend income received. Foreign taxes, if any, are recorded based on the tax regulations and rates that exist in the foreign markets in which the Fund invests.
The Fund has reviewed the tax positions, taken on federal income tax returns, for each of the three open tax years and as of December 31, 2008, and has determined that no provision for income tax is required in the Fund’s financial statements.
g. Security Transactions, Investment Income, Expenses and Distributions
Security transactions are accounted for on trade date. Realized gains and losses on security transactions are determined on a specific identification basis. Interest income and estimated expenses are accrued daily. Dividend income is recorded on the ex-dividend date except that certain dividends from foreign securities are recognized as soon as the Fund is notified of the ex-dividend date. Distributions to shareholders are recorded on the ex-dividend date and are determined according to income tax regulations (tax basis). Distributable earnings determined on a tax basis may differ from earnings recorded in accordance with accounting principles generally accepted in the United States of America. These differences may be permanent or temporary. Permanent differences are reclassified among capital accounts to reflect their tax character. These reclassifications have no impact on net assets or the results of operations. Temporary differences are not reclassified, as they may reverse in subsequent periods.
Common expenses incurred by the Trust are allocated among the funds based on the ratio of net assets of each fund to the combined net assets of the Trust. Fund specific expenses are charged directly to the fund that incurred the expense.
Realized and unrealized gains and losses and net investment income, not including class specific expenses, are allocated daily to each class of shares based upon the relative proportion of net assets of each class. Differences in per share distributions, by class, are generally due to differences in class specific expenses.
Distributions received by the Trust from certain securities may be a return of capital (ROC). Such distributions reduce the cost basis of the securities, and any distributions in excess of the cost basis are recognized as capital gains.
h. Accounting Estimates
The preparation of financial statements in accordance with accounting principles generally accepted in the United States of America requires management to make estimates and assumptions that affect the reported amounts of assets and liabilities at the date of the financial statements and the amounts of income and expenses during the reporting period. Actual results could differ from those estimates.
i. Guarantees and Indemnifications
Under the Trust’s organizational documents, its officers and trustees are indemnified by the Trust against certain liabilities arising out of the performance of their duties to the Trust. Additionally, in the normal course of business, the Trust, on behalf of the Fund, enters into contracts with service providers that contain general indemnification clauses. The Trust’s maximum exposure under these arrangements is unknown as this would involve future claims that may be made against the Trust that have not yet occurred. Currently, the Trust expects the risk of loss to be remote.
FGR-19
Franklin Templeton Variable Insurance Products Trust
Notes to Financial Statements (continued)
Franklin Global Real Estate Securities Fund
2. SHARES OF BENEFICIAL INTEREST
At December 31, 2008, there were an unlimited number of shares authorized (without par value). Transactions in the Fund’s shares were as follows:
| | | | | | | | | | | | | | |
| | | Year Ended December 31, | |
| | | 2008a | | | 2007 | |
| Class 1 Shares: | | Shares | | | Amount | | | Shares | | | Amount | |
Shares sold | | 8,666 | | | $ | 137,517 | | | 9,797 | | | $ | 284,754 | |
Shares issued in reinvestment of distributions | | 1,051,855 | | | | 18,060,354 | | | 352,092 | | | | 10,774,004 | |
Shares redeemed | | (734,804 | ) | | | (13,086,771 | ) | | (1,072,312 | ) | | | (33,341,557 | ) |
| | | | |
Net increase (decrease) | | 325,717 | | | $ | 5,111,100 | | | (710,423 | ) | | $ | (22,282,799 | ) |
| | | | |
| Class 2 Shares: | | | | | | | | | | | | |
Shares sold | | 1,073,979 | | | $ | 16,369,385 | | | 1,033,159 | | | $ | 30,946,099 | |
Shares issued in reinvestment of distributions | | 10,644,759 | | | | 179,151,291 | | | 4,012,907 | | | | 120,748,382 | |
Shares redeemed | | (15,122,736 | ) | | | (267,535,598 | ) | | (12,264,638 | ) | | | (352,488,018 | ) |
| | | | |
Net increase (decrease) | | (3,403,998 | ) | | $ | (72,014,922 | ) | | (7,218,572 | ) | | $ | (200,793,537 | ) |
| | | | |
| Class 4 Shares: | | | | | | | | | | | | |
Shares sold | | 214 | | | $ | 5,000 | | | | | | | | |
| | | | | | | | | | |
a | For the period February 29, 2008 (effective date) to December 31, 2008 for Class 4. |
3. TRANSACTIONS WITH AFFILIATES
Franklin Resources, Inc. is the holding company for various subsidiaries that together are referred to as Franklin Templeton Investments. Certain officers and trustees of the Trust are also officers and/or directors of the following subsidiaries:
| | |
| Subsidiary | | Affiliation |
Franklin Templeton Institutional, LLC (FT Institutional) | | Investment manager |
Franklin Templeton Services, LLC (FT Services) | | Administrative manager |
Franklin Templeton Distributors, Inc. (Distributors) | | Principal underwriter |
Franklin Templeton Investor Services, LLC (Investor Services) | | Transfer agent |
a. Management Fees
The Fund pays an investment management fee to FT Institutional based on the average daily net assets of the Fund as follows:
| | |
| Annualized Fee Rate | | Net Assets |
| 0.800% | | Up to and including $500 million |
| 0.700% | | Over $500 million, up to and including $1 billion |
| 0.650% | | Over $1 billion, up to and including $1.5 billion |
| 0.600% | | Over $1.5 billion, up to and including $6.5 billion |
| 0.580% | | Over $6.5 billion, up to and including $11.5 billion |
| 0.560% | | Over $11.5 billion, up to and including $16.5 billion |
| 0.540% | | Over $16.5 billion, up to and including $19 billion |
| 0.530% | | Over $19 billion, up to and including $21.5 billion |
| 0.520% | | In excess of $21.5 billion |
Effective February 1, 2008, Franklin Advisers, Inc., an affiliate of FT Institutional, no longer provides subadvisory services to the Fund.
FGR-20
Franklin Templeton Variable Insurance Products Trust
Notes to Financial Statements (continued)
Franklin Global Real Estate Securities Fund
3. TRANSACTIONS WITH AFFILIATES (continued)
b. Administrative Fees
The Fund pays an administrative fee to FT Services of 0.25% per year of the average daily net assets of the Fund.
c. Distribution Fees
The Fund’s Board of Trustees has adopted distribution plans for Class 2 and Class 4 shares pursuant to Rule 12b-1 under the 1940 Act. Under the Fund’s compensation distribution plans, the Fund pays Distributors for costs incurred in connection with the servicing, sale and distribution of the Fund’s shares up to 0.35% per year of its average daily net assets of each class. The Board of Trustees has agreed to limit the current rate to 0.25% per year for Class 2.
d. Transfer Agent Fees
Investor Services, under terms of an agreement, performs shareholder servicing for the Fund and is not paid by the Fund for the services.
e. Waiver and Expense Reimbursements
FT Services and FT Institutional have agreed in advance to waive all or a portion of their respective fees through April 30, 2012. Total expenses waived are not subject to reimbursement by the Fund subsequent to the Fund’s fiscal year end.
4. EXPENSE OFFSET ARRANGEMENT
The Fund has entered into an arrangement with its custodian whereby credits realized as a result of uninvested cash balances are used to reduce a portion of the Fund’s custodian expenses. During the year ended December 31, 2008, the custodian fees were reduced as noted in the Statement of Operations.
5. INCOME TAXES
For tax purposes, capital losses may be carried over to offset future capital gains, if any. At December 31, 2008, the Fund had tax basis capital losses of $153,324,128 expiring in 2016.
For tax purposes, realized capital losses and realized currency losses occurring subsequent to October 31, may be deferred and treated as occurring on the first day of the following fiscal year. At December 31, 2008, the Fund deferred realized capital losses and realized currency losses of $50,972,782 and $5,502,294, respectively.
The tax character of distributions paid during the years ended December 31, 2008 and 2007, was as follows:
| | | | | | |
| | | 2008 | | 2007 |
Distributions paid from: | | | | | | |
Ordinary income | | $ | 7,267,385 | | $ | 37,911,390 |
Long term capital gain | | | 189,945,565 | | | 93,610,996 |
| | | |
| | $ | 197,212,950 | | $ | 131,522,386 |
| | | |
FGR-21
Franklin Templeton Variable Insurance Products Trust
Notes to Financial Statements (continued)
Franklin Global Real Estate Securities Fund
5. INCOME TAXES (continued)
At December 31, 2008, the cost of investments, net unrealized appreciation (depreciation), and undistributed ordinary income for income tax purposes were as follows:
| | | | |
Cost of investments | | $ | 567,299,504 | |
| | | | |
| |
Unrealized appreciation | | $ | 28,076,092 | |
Unrealized depreciation | | | (212,427,122 | ) |
| | | | |
Net unrealized appreciation (depreciation) | | $ | (184,351,030 | ) |
| | | | |
Distributable earnings-undistributed ordinary income | | $ | 48,294,653 | |
| | | | |
Net investment income differs for financial statement and tax purposes primarily due to differing treatments of foreign currency transactions and passive foreign investment company shares.
Net realized gains (losses) differ for financial statement and tax purposes primarily due to differing treatments of wash sales, foreign currency transactions, and passive foreign investment company shares.
6. INVESTMENT TRANSACTIONS
Purchases and sales of investments (excluding short term securities) for the year ended December 31, 2008, aggregated $507,082,171 and $703,032,863, respectively.
7. FORWARD EXCHANGE CONTRACTS
At December 31, 2008, the Fund had the following forward exchange contracts outstanding:
| | | | | | | | | | | | | |
| | | Contract
Amounta | | Settlement
Date | | Unrealized
Appreciation | | Unrealized
Depreciation | |
| Contracts to Buy | | | | | | | | | |
| 4,400,186 | | Australian Dollar | | 2,839,000 | | 1/12/09 | | $ | 273,163 | | $ | — | |
| 172,558,000 | | Japanese Yen | | 1,912,000 | | 1/13/09 | | | — | | | (9,511 | ) |
| 728,609,505 | | Japanese Yen | | 7,566,000 | | 1/13/09 | | | 467,078 | | | — | |
| 2,529,420 | | British Pound Sterling | | 3,783,000 | | 1/15/09 | | | — | | | (90,190 | ) |
| 1,867,910 | | Euro | | 2,363,000 | | 1/15/09 | | | 247,097 | | | — | |
| 7,010,598 | | British Pound Sterling | | 11,552,000 | | 1/16/09 | | | — | | | (1,317,205 | ) |
| 2,332,260 | | Canadian Dollar | | 1,890,000 | | 1/16/09 | | | 26,221 | | | — | |
| 200,575,944 | | Japanese Yen | | 2,148,000 | | 1/16/09 | | | 63,527 | | | — | |
| 2,830,616 | | Australian Dollar | | 1,875,000 | | 2/17/09 | | | 119,831 | | | — | |
| 237,932,590 | | Japanese Yen | | 2,471,000 | | 2/17/09 | | | 154,103 | | | — | |
FGR-22
Franklin Templeton Variable Insurance Products Trust
Notes to Financial Statements (continued)
Franklin Global Real Estate Securities Fund
7. FORWARD EXCHANGE CONTRACTS (continued)
| | | | | | | | | | | | | |
| | | Contract
Amounta | | Settlement
Date | | Unrealized
Appreciation | | Unrealized
Depreciation | |
| Contracts to Sell | | | | | | | | | |
| 10,823,146 | | Australian Dollar | | 7,110,788 | | 1/12/09 | | $ | — | | $ | (544,205 | ) |
| 1,343,730,329 | | Japanese Yen | | 13,720,434 | | 1/13/09 | | | — | | | (1,094,484 | ) |
| 5,528,648 | | British Pound Sterling | | 9,026,636 | | 1/15/09 | | | 955,121 | | | — | |
| 6,661,268 | | Euro | | 9,013,059 | | 1/15/09 | | | — | | | (294,966 | ) |
| 25,341,968 | | Australian Dollar | | 17,639,021 | | 1/16/09 | | | — | | | (276,240 | ) |
| 13,492,473 | | British Pound Sterling | | 23,444,179 | | 1/16/09 | | | 3,746,472 | | | — | |
| 4,344,499 | | Canadian Dollar | | 3,749,718 | | 1/16/09 | | | 180,211 | | | — | |
| 354,447,957 | | Japanese Yen | | 3,617,692 | | 1/16/09 | | | — | | | (290,410 | ) |
| 2,815,790 | | Singapore Dollar | | 1,933,369 | | 1/16/09 | | | — | | | (31,364 | ) |
| 2,482,598 | | Canadian Dollar | | 2,043,459 | | 1/23/09 | | | 3,948 | | | — | |
| 17,666,853 | | Australian Dollar | | 11,344,835 | | 2/17/09 | | | — | | | (1,105,597 | ) |
| 4,021,142 | | British Pound Sterling | | 6,018,845 | | 2/17/09 | | | 152,634 | | | — | |
| 7,556,418 | | Euro | | 9,465,170 | | 2/17/09 | | | — | | | (1,081,513 | ) |
| 937,860,053 | | Japanese Yen | | 9,900,823 | | 2/17/09 | | | — | | | (446,560 | ) |
| 1,322,712 | | Singapore Dollar | | 878,120 | | 2/17/09 | | | — | | | (43,663 | ) |
| 3,477,957 | | Canadian Dollar | | 2,788,947 | | 2/23/09 | | | — | | | (67,848 | ) |
| 8,050,185 | | Euro | | 10,720,431 | | 3/18/09 | | | — | | | (507,472 | ) |
| 20,645,478 | | Australian Dollar | | 13,742,320 | | 3/19/09 | | | — | | | (776,746 | ) |
| 5,079,017 | | British Pound Sterling | | 7,714,523 | | 3/19/09 | | | 307,511 | | | — | |
| 49,037,075 | | Hong Kong Dollar | | 6,330,795 | | 3/19/09 | | | 360 | | | — | |
| 984,669,158 | | Japanese Yen | | 10,889,272 | | 3/19/09 | | | 17,965 | | | — | |
| 4,001,768 | | New Zealand Dollar | | 2,191,088 | | 3/19/09 | | | — | | | (126,730 | ) |
| 1,859,934 | | Singapore Dollar | | 1,259,691 | | 3/19/09 | | | — | | | (35,347 | ) |
| 22,282,722 | | South African Rand | | 2,138,758 | | 3/19/09 | | | — | | | (181,664 | ) |
| 4,118,402 | | Australian Dollar | | 2,807,926 | | 3/25/09 | | | — | | | (87,272 | ) |
| 5,857,326 | | Euro | | 8,153,398 | | 3/25/09 | | | — | | | (14,702 | ) |
| 2,493,006 | | Singapore Dollar | | 1,708,357 | | 3/25/09 | | | — | | | (27,296 | ) |
| 504,978,291 | | Japanese Yen | | 5,618,361 | | 3/26/09 | | | 42,141 | | | — | |
| Unrealized appreciation (depreciation) on offsetting forward exchange contracts | | | | | | | 89,202 | | | (32,770 | ) |
| | | | | | | | | | |
| Unrealized appreciation (depreciation) on forward exchange contracts | | | | | | | 6,846,585 | | | (8,483,755 | ) |
| | | | | | | | | | |
| Net unrealized appreciation (depreciation) on forward exchange contracts | | | | | | | | | $ | (1,637,170 | ) |
| | | | | | | | | | | | | |
aIn | U.S. dollars unless otherwise indicated. |
8. FAIR VALUE MEASUREMENTS
The Fund adopted Financial Accounting Standards Board (FASB) Statement No. 157, “Fair Value Measurement” (SFAS 157), on January 1, 2008. SFAS 157 defines fair value, establishes a framework for measuring fair value, and expands disclosures about fair value measurements. The Fund has determined that the implementation of SFAS 157 did not have a material impact on the Fund’s financial statements.
SFAS 157 establishes a fair value hierarchy that distinguishes between market data obtained from independent sources (observable inputs) and the Trust’s own market assumptions (unobservable inputs). These inputs are used in determining the value of the Fund’s investments and are summarized in the following fair value hierarchy:
| | • | | Level 1 – quoted prices in active markets for identical securities |
| | • | | Level 2 – other significant observable inputs (including quoted prices for similar securities, interest rates, prepayment speed, credit risk, etc.) |
| | • | | Level 3 – significant unobservable inputs (including the Fund’s own assumptions in determining the fair value of investments) |
FGR-23
Franklin Templeton Variable Insurance Products Trust
Notes to Financial Statements (continued)
Franklin Global Real Estate Securities Fund
8. FAIR VALUE MEASUREMENTS (continued)
The inputs or methodology used for valuing securities are not an indication of the risk associated with investing in those securities.
The following is a summary of the inputs used as of December 31, 2008, in valuing the Fund’s assets and liabilities carried at fair value:
| | | | | | | | | | | | |
| | | Level 1 | | Level 2 | | Level 3 | | Total |
Assets: | | | | | | | | | | | | |
Investments in Securities | | $ | 337,420,117 | | $ | 45,528,357 | | $ | — | | $ | 382,948,474 |
Other Financial Instrumentsa | | | — | | | 6,846,585 | | | — | | | 6,846,585 |
Liabilities: | | | | | | | | | | | | |
Other Financial Instrumentsa | | | — | | | 8,483,755 | | | — | | | 8,483,755 |
aOther | financial instruments includes net unrealized appreciation (depreciation) of forward exchange contracts. |
9. NEW ACCOUNTING PRONOUNCEMENT
In March 2008, FASB issued FASB Statement No. 161, “Disclosures about Derivative Instruments and Hedging Activities, an amendment of FASB Statement No. 133” (SFAS 161), which expands disclosures about derivative investments and hedging activities. SFAS 161 is effective for fiscal years and interim periods beginning after November 15, 2008. The Fund is currently evaluating the impact, if any, of applying the various provisions of SFAS 161.
10. SUBSEQUENT EVENT
On January 23, 2009, the Fund entered into, along with certain other funds managed by Franklin Templeton Investments (individually, “Borrower”; collectively “Borrowers”), a $725 million senior unsecured syndicated global line of credit (“Global Credit Facility”) to provide a source of funds to the Borrowers for temporary and emergency purposes and to meet future unanticipated or unusually large redemption requests.
Under the terms of the Global Credit Facility, each Borrower has agreed to pay its proportionate share of fees and expenses incurred in connection with the implementation and maintenance of the Global Credit Facility.
ABBREVIATIONS
Selected Portfolio
REIT - Real Estate Investment Trust
FGR-24
Franklin Templeton Variable Insurance Products Trust
Franklin Global Real Estate Securities Fund
Report of Independent Registered Public Accounting Firm
To the Board of Trustees and Shareholders of Franklin Templeton Variable Insurance Products Trust
In our opinion, the accompanying statement of assets and liabilities, including the statement of investments, and the related statements of operations and of changes in net assets and the financial highlights present fairly, in all material respects, the financial position of Franklin Global Real Estate Securities Fund (one of the funds constituting the Franklin Templeton Variable Insurance Products Trust, hereafter referred to as the “Fund”) at December 31, 2008, the results of its operations for the year then ended, the changes in its net assets for each of the two years in the period then ended and the financial highlights for the periods presented, in conformity with accounting principles generally accepted in the United States of America. These financial statements and financial highlights (hereafter referred to as “financial statements”) are the responsibility of the Fund’s management. Our responsibility is to express an opinion on these financial statements based on our audits. We conducted our audits of these financial statements in accordance with the standards of the Public Company Accounting Oversight Board (United States). Those standards require that we plan and perform the audit to obtain reasonable assurance about whether the financial statements are free of material misstatement. An audit includes examining, on a test basis, evidence supporting the amounts and disclosures in the financial statements, assessing the accounting principles used and significant estimates made by management, and evaluating the overall financial statement presentation. We believe that our audits, which included confirmation of securities at December 31, 2008 by correspondence with the custodian and brokers, provide a reasonable basis for our opinion.
PricewaterhouseCoopers LLP
San Francisco, California
February 10, 2009
FGR-25
Franklin Templeton Variable Insurance Products Trust
Tax Designation (unaudited)
Franklin Global Real Estate Securities Fund
Under Section 852(b)(3)(C) of the Internal Revenue Code, the Fund designates the maximum amount allowable but no less than $189,945,566 as a long term capital gain dividend for the fiscal year ended December 31, 2008.
FGR-26
FRANKLIN GROWTHAND INCOME SECURITIES FUND
This annual report for Franklin Growth and Income Securities Fund covers the fiscal year ended December 31, 2008.
Performance Summary as of 12/31/08
Average annual total return of Class 1 shares represents the average annual change in value, assuming reinvestment of dividends and capital gains. Average returns smooth out variations in returns, which can be significant; they are not the same as year-by-year results.
Periods ended 12/31/08
| | | | | | |
| | | 1-Year | | 5-Year | | 10-Year |
Average Annual Total Return | | -34.95% | | -3.30% | | +0.51% |
Total Return Index Comparison for a Hypothetical $10,000 Investment (1/1/99–12/31/08)
The graph below shows the change in value of a hypothetical $10,000 investment in the Fund over the indicated period and includes reinvestment of any income or distributions. The Fund’s performance is compared to the performance of the Standard & Poor’s 500 Index (S&P 500), the Lipper VIP Equity Income Funds Classification Average and the Consumer Price Index (CPI). One cannot invest directly in an index, nor is an index representative of the Fund’s portfolio. Please see Important Notes to Performance Information preceding the Fund Summaries.
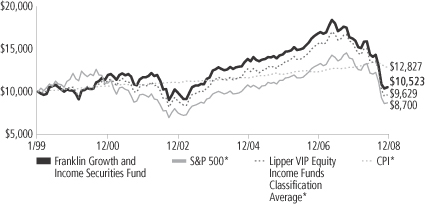
*Sources: © 2009 Morningstar; Lipper Inc. Please see Index Descriptions following the Fund Summaries.
Franklin Growth and Income Securities Fund Class 1
Performance reflects the Fund’s Class 1 operating expenses, but does not include any contract fees, expenses or sales charges. If they had been included, performance would be lower. These charges and deductions, particularly for variable life policies, can have a significant effect on contract values and insurance benefits. See the contract prospectus for a complete description of these expenses, including sales charges.
Performance data represent past performance, which does not guarantee future results. Investment return and principal value will fluctuate, and you may have a gain or loss when you sell your shares. Current performance may differ from figures shown.
FGI-1
Fund Goals and Main Investments: Franklin Growth and Income Securities Fund seeks capital appreciation with current income as a secondary goal. The Fund normally invests predominantly in a broadly diversified portfolio of equity securities, including securities convertible into common stock.
Performance Overview
You can find the Fund’s one-year total return in the Performance Summary. The Fund performed better than its benchmark, the S&P 500, which had a -37.00% total return.1 The Fund performed comparably to its peers as measured by the Lipper VIP Equity Income Funds Classification Average, which had a -35.83% return for the same period.2 Please note that the Fund invests primarily in stocks with above average dividend yields. As a result, its holdings and returns may differ from those of the S&P 500, which include nondividend-paying stocks and do not focus on dividend yield.
Economic and Market Overview
In 2008, economic conditions deteriorated. The Conference Board’s Consumer Confidence Index fell to an all-time low since it began in 1967 as the U.S. economy faltered and stock markets declined. The government’s abrupt conservatorship of Fannie Mae and Freddie Mac and the failure of several blue-chip banks and financial institutions roiled equity markets. Despite government interventions and massive emergency funding, the nation’s economic troubles were exacerbated as manufacturing activity weakened at its fastest pace in nearly 30 years and as home prices continued to fall. Jobless claims mounted and the unemployment rate rose to 7.2% by period-end.3 Economic growth, as measured by gross domestic product (GDP), rebounded from a 0.9% annualized rate in the first quarter of 2008 to a 2.8% annualized pace in the second quarter, largely due to strong exports and government spending. However, in the third and fourth quarters of 2008, GDP fell at annualized rates of 0.5% and an estimated 3.8%, reflecting a broad-based contraction in consumer spending, falling corporate profits and slowing export growth.
1. Source: © 2009 Morningstar.
2. Source: Lipper Inc.
One cannot invest directly in an index, nor is an index representative of the Fund’s portfolio. Please see Index Descriptions following the Fund Summaries.
3. Source: Bureau of Labor Statistics.
Fund Risks: The Fund’s investments in stocks offer the potential for long-term gains but can be subject to short-term price fluctuations. Common stocks with higher dividend yields can be sensitive to interest rate movements. By having significant investments in particular sectors from time to time, such as financial services, energy, health care/pharmaceuticals, technology and telecommunications, the Fund may be at greater risk of adverse developments in a sector than a fund that invests more broadly. Foreign investing, especially in emerging markets, involves additional risks, including currency fluctuations, economic instability, market volatility, and political and social instability. The Fund’s prospectus also includes a description of the main investment risks.
FGI-2
Oil prices soared to a record high in July, rising above $145 per barrel, before dramatically retreating to $45 by period-end. Many other commodities such as agricultural products and precious and base metals followed similar trends. Partially as a result of the steep price corrections, inflation declined significantly late in the review period, and December’s inflation rate was an annualized 0.1%.3 Core inflation, which excludes food and energy costs, rose at a 1.8% annual rate; this level was within the Federal Reserve Board’s (Fed’s) informal target range of 1.5%–2.0%.3
A slowing economy and decelerating inflation prompted policymakers to further lower interest rates and enact stimulus plans. During the year under review, the Fed lowered the federal funds target rate to a range of 0% to 0.25% from 4.25% at the start of the reporting period. The Fed and U.S. Treasury Department also introduced new programs such as the Primary Dealer Credit Facility (PDCF) and the Troubled Asset Relief Program (TARP), which were intended to enhance market liquidity.
Volatility remained high throughout the reporting period but intensified in the latter half of the year as stocks fluctuated wildly and Treasury prices soared. The year was among the worst in history for U.S. stock market performance. For the 12 months under review, the blue chip stocks of the Dow Jones Industrial Average had a total return of - -31.93%, the broader S&P 500 a -37.00% total return, and the technology-heavy NASDAQ Composite Index a -40.03% total return.4 All sectors lost value, and the financials, materials and information technology sectors had the largest declines.
Investment Strategy
We are research-driven, fundamental investors, pursuing a disciplined investment strategy. As bottom-up investors focusing primarily on individual securities, we seek companies that offer current dividend yields and present, in our opinion, the best trade-off between valuation, potential earnings growth and business risk. Special emphasis is placed upon dividend yield as we believe that high relative dividend yield can be a good indicator of value.
4. Source: © 2009 Morningstar. Please see Index Descriptions following the Fund Summaries.
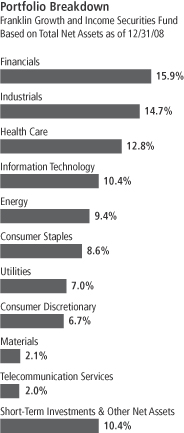
FGI-3
Manager’s Discussion
During the year under review, Fund performance was hurt by the challenging economic and market environment. The financials sector in particular weighed on Fund returns. Among the major detractors in financials were Citigroup and Lehman Brothers Holdings (sold by period-end).
A position in specialty retailer Nordstrom hindered the Fund’s absolute returns as a result of the contracting economy and a pullback in consumer spending. Other holdings that detracted from performance included aluminum producer Alcoa (sold by period-end) and oil and gas company Chesapeake Energy, whose shares fell as commodity prices sharply corrected in the second half of the year. Global chemical manufacturer Dow Chemical also hampered the Fund’s results as demand for many of its products softened during the period.
The Fund, however, also had some contributors to performance. During the review period, U.S. beer maker Anheuser-Busch (sold by period-end) was among the Fund’s top performers following its acquisition by Belgium-based brewer InBev. The Fund also benefited from a position in Capital One Financial Group (sold by period-end), which performed well for the period we held it. Other holdings that had positive returns during the reporting period included equity positions in homebuilder KB Home and defense contractor Raytheon (sold by period-end). A corporate bond position in global consumer finance company American Express and a convertible bond from cruise operator Carnival also contributed to performance.
Thank you for your participation in Franklin Growth and Income Securities Fund. We look forward to serving your future investment needs.
The foregoing information reflects our analysis, opinions and portfolio holdings as of December 31, 2008, the end of the reporting period. The way we implement our main investment strategies and the resulting portfolio holdings may change depending on factors such as market and economic conditions. These opinions may not be relied upon as investment advice or an offer for a particular security. The information is not a complete analysis of every aspect of any market, country, industry, security or the Fund. Statements of fact are from sources considered reliable, but the investment manager makes no representation or warranty as to their completeness or accuracy. Although historical performance is no guarantee of future results, these insights may help you understand our investment management philosophy.
Top 10 Holdings
Franklin Growth and Income Securities Fund
12/31/08
| | |
Company
Sector/Industry | | % of Total
Net Assets |
| |
| Roche Holding AG (Switzerland) | | 3.6% |
| Health Care | | |
| |
| The Coca-Cola Co. | | 2.8% |
| Consumer Staples | | |
| |
| Mylan Inc. | | 2.7% |
| Health Care | | |
| |
| ConocoPhillips | | 2.7% |
| Energy | | |
| |
| Schering-Plough Corp. | | 2.6% |
| Health Care | | |
| |
| Bank of America Corp. | | 2.5% |
| Financials | | |
| |
| PG&E Corp. | | 2.4% |
| Utilities | | |
| |
| Microchip Technology Inc. | | 2.4% |
| Information Technology | | |
| |
| Diageo PLC, ADR (U.K.) | | 2.4% |
| Consumer Staples | | |
| |
| American Express Credit Corp. | | 2.4% |
| Financials | | |
The dollar value, number of shares or principal amount, and names of all portfolio holdings are listed in the Fund’s Statement of Investments.
FGI-4
Fund Expenses
As an investor in a variable insurance contract (Contract) that indirectly provides for investment in an underlying mutual fund, you can incur transaction and/or ongoing expenses at both the Fund level and the Contract level.
| • | | Transaction expenses can include sales charges (loads) on purchases, redemption fees, surrender fees, transfer fees and premium taxes. |
| • | | Ongoing expenses can include management fees, distribution and service (12b-1) fees, contract fees, annual maintenance fees, mortality and expense risk fees and other fees and expenses. All mutual funds and Contracts have some types of ongoing expenses. |
The expenses shown in the table are meant to highlight ongoing expenses at the Fund level only and do not include ongoing expenses at the Contract level, or transaction expenses at either the Fund or Contract level. While the Fund does not have transaction expenses, if the transaction and ongoing expenses at the Contract level were included, the expenses shown would be higher. You should consult your Contract prospectus or disclosure document for more information.
The table shows Fund-level ongoing expenses and can help you understand these expenses and compare them with those of other mutual funds offered through the Contract. The table assumes a $1,000 investment held for the six months indicated. Please refer to the Fund prospectus for additional information on operating expenses.
Actual Fund Expenses
The first line (Actual) of the table provides actual account values and expenses. The “Ending Account Value” is derived from the Fund’s actual return, which includes the effect of ongoing Fund expenses, but does not include the effect of ongoing Contract expenses.
You can estimate the Fund-level expenses you incurred during the period by following these steps. Of course, your account value and expenses will differ from those in this illustration:
| 1. | Divide your account value by $1,000. |
If an account had an $8,600 value, then $8,600 ÷ $1,000 = 8.6.
| 2. | Multiply the result by the number under the heading “Fund-Level Expenses Incurred During Period.” |
If Fund-Level Expenses Incurred During Period were $7.50, then 8.6 x $7.50 = $64.50.
In this illustration, the estimated expenses incurred this period at the Fund level are $64.50.
Franklin Growth and Income Securities Fund Class 1
FGI-5
Hypothetical Example for Comparison with Other Mutual Funds
Information in the second line (Hypothetical) of the table can help you compare ongoing expenses of the Fund with those of other mutual funds offered through the Contract. This information may not be used to estimate the actual ending account balance or expenses you incurred during the period. The hypothetical “Ending Account Value” is based on the Fund’s actual expense ratio and an assumed 5% annual rate of return before expenses, which does not represent the Fund’s actual return. The figure under the heading “Fund-Level Expenses Incurred During Period” shows the hypothetical expenses your account would have incurred under this scenario. You can compare this figure with the 5% hypothetical examples that appear in shareholder reports of other funds offered through a Contract.
| | | | | | | | | |
| Class 1 | | Beginning
Account Value 7/1/08 | | Ending
Account
Value 12/31/08 | | Fund-Level
Expenses Incurred
During Period*
7/1/08–12/31/08 |
Actual | | $ | 1,000 | | $ | 735.20 | | $ | 2.53 |
Hypothetical (5% return before expenses) | | $ | 1,000 | | $ | 1,022.22 | | $ | 2.95 |
*Expenses are calculated using the most recent six-month annualized expense ratio for the Fund’s Class 1 shares (0.58%), which does not include any ongoing expenses of the Contract for which the Fund is an investment option, multiplied by the average account value over the period, multiplied by 184/366 to reflect the one-half year period.
FGI-6
Franklin Templeton Variable Insurance Products Trust
Financial Highlights
Franklin Growth and Income Securities Fund
| | | | | | | | | | | | | | | | | | | | |
| | | Year Ended December 31, | |
| Class 1 | | 2008 | | | 2007 | | | 2006 | | | 2005 | | | 2004 | |
| | | | |
Per share operating performance | | | | | | | | | | | | | | | | | | | | |
(for a share outstanding throughout the year) | | | | | | | | | | | | | | | | | | | | |
Net asset value, beginning of year | | $ | 15.07 | | | $ | 16.83 | | | $ | 15.60 | | | $ | 15.60 | | | $ | 14.44 | |
| | | | |
Income from investment operationsa: | | | | | | | | | | | | | | | | | | | | |
Net investment incomeb | | | 0.39 | | | | 0.41 | | | | 0.42 | | | | 0.42 | | | | 0.40 | |
Net realized and unrealized gains (losses) | | | (5.17 | ) | | | (0.82 | ) | | | 2.05 | | | | 0.15 | | | | 1.14 | |
| | | | |
Total from investment operations | | | (4.78 | ) | | | (0.41 | ) | | | 2.47 | | | | 0.57 | | | | 1.54 | |
| | | | |
Less distributions from: | | | | | | | | | | | | | | | | | | | | |
Net investment income | | | (0.45 | ) | | | (0.42 | ) | | | (0.43 | ) | | | (0.43 | ) | | | (0.38 | ) |
Net realized gains | | | (1.12 | ) | | | (0.93 | ) | | | (0.81 | ) | | | (0.14 | ) | | | — | |
| | | | |
Total distributions | | | (1.57 | ) | | | (1.35 | ) | | | (1.24 | ) | | | (0.57 | ) | | | (0.38 | ) |
| | | | |
Net asset value, end of year | | $ | 8.72 | | | $ | 15.07 | | | $ | 16.83 | | | $ | 15.60 | | | $ | 15.60 | |
| | | | |
| | | | | |
Total returnc | | | (34.95)% | | | | (3.46)% | | | | 17.05% | | | | 3.71% | | | | 10.91% | |
Ratios to average net assets | | | | | | | | | | | | | | | | | | | | |
Expensesd | | | 0.55% | | | | 0.52% | | | | 0.54% | | | | 0.51% | | | | 0.52% | |
Net investment income | | | 3.17% | | | | 2.47% | | | | 2.63% | | | | 2.74% | | | | 2.77% | |
| | | | | |
Supplemental data | | | | | | | | | | | | | | | | | | | | |
Net assets, end of year (000’s) | | $ | 162,936 | | | $ | 306,691 | | | $ | 388,751 | | | $ | 405,245 | | | $ | 471,596 | |
Portfolio turnover rate | | | 30.66% | | | | 36.66% | | | | 23.05% | | | | 43.89% | | | | 40.15% | |
aThe amount shown for a share outstanding throughout the period may not correlate with the Statement of Operations for the period due to the timing of sales and repurchases of the Fund shares in relation to income earned and/or fluctuating market value of the investments of the Fund.
bBased on average daily shares outstanding.
cTotal return does not include any fees, charges or expenses imposed by the variable annuity and life insurance contracts for which the Franklin Templeton Variable Insurance Products Trust serves as an underlying investment vehicle.
dBenefit of expense reduction rounds to less than 0.01%.
The accompanying notes are an integral part of these financial statements.
FGI-7
Franklin Templeton Variable Insurance Products Trust
Financial Highlights (continued)
Franklin Growth and Income Securities Fund
| | | | | | | | | | | | | | | | | | | | |
| | | Year Ended December 31, | |
| Class 2 | | 2008 | | | 2007 | | | 2006 | | | 2005 | | | 2004 | |
| | | | |
Per share operating performance | | | | | | | | | | | | | | | | | | | | |
(for a share outstanding throughout the year) | | | | | | | | | | | | | | | | | | | | |
Net asset value, beginning of year | | $ | 14.86 | | | $ | 16.62 | | | $ | 15.42 | | | $ | 15.43 | | | $ | 14.31 | |
| | | | |
Income from investment operationsa: | | | | | | | | | | | | | | | | | | | | |
Net investment incomeb | | | 0.35 | | | | 0.37 | | | | 0.37 | | | | 0.38 | | | | 0.37 | |
Net realized and unrealized gains (losses) | | | (5.10 | ) | | | (0.82 | ) | | | 2.03 | | | | 0.15 | | | | 1.12 | |
| | | | |
Total from investment operations | | | (4.75 | ) | | | (0.45 | ) | | | 2.40 | | | | 0.53 | | | | 1.49 | |
| | | | |
Less distributions from: | | | | | | | | | | | | | | | | | | | | |
Net investment income | | | (0.40 | ) | | | (0.38 | ) | | | (0.39 | ) | | | (0.40 | ) | | | (0.37 | ) |
Net realized gains | | | (1.12 | ) | | | (0.93 | ) | | | (0.81 | ) | | | (0.14 | ) | | | — | |
| | | | |
Total distributions | | | (1.52 | ) | | | (1.31 | ) | | | (1.20 | ) | | | (0.54 | ) | | | (0.37 | ) |
| | | | |
Net asset value, end of year | | $ | 8.59 | | | $ | 14.86 | | | $ | 16.62 | | | $ | 15.42 | | | $ | 15.43 | |
| | | | |
| | | | | |
Total returnc | | | (35.14)% | | | | (3.71)% | | | | 16.76% | | | | 3.51% | | | | 10.61% | |
Ratios to average net assets | | | | | | | | | | | | | | | | | | | | |
Expensesd | | | 0.80% | | | | 0.77% | | | | 0.79% | | | | 0.76% | | | | 0.77% | |
Net investment income | | | 2.92% | | | | 2.22% | | | | 2.38% | | | | 2.49% | | | | 2.52% | |
| | | | | |
Supplemental data | | | | | | | | | | | | | | | | | | | | |
Net assets, end of year (000’s) | | $ | 141,359 | | | $ | 312,692 | | | $ | 348,724 | | | $ | 313,286 | | | $ | 263,146 | |
Portfolio turnover rate | | | 30.66% | | | | 36.66% | | | | 23.05% | | | | 43.89% | | | | 40.15% | |
aThe amount shown for a share outstanding throughout the period may not correlate with the Statement of Operations for the period due to the timing of sales and repurchases of the Fund shares in relation to income earned and/or fluctuating market value of the investments of the Fund.
bBased on average daily shares outstanding.
cTotal return does not include any fees, charges or expenses imposed by the variable annuity and life insurance contracts for which the Franklin Templeton Variable Insurance Products Trust serves as an underlying investment vehicle.
dBenefit of expense reduction rounds to less than 0.01%.
The accompanying notes are an integral part of these financial statements.
FGI-8
Franklin Templeton Variable Insurance Products Trust
Financial Highlights (continued)
Franklin Growth and Income Securities Fund
| | | | |
| Class 4 | | Period Ended
December 31,
2008a | |
Per share operating performance | | | | |
(for a share outstanding throughout the period) | | | | |
Net asset value, beginning of period | | $ | 14.16 | |
| | | | |
Income from investment operationsb: | | | | |
Net investment incomec | | | 0.29 | |
Net realized and unrealized gains (losses) | | | (4.18 | ) |
| | | | |
Total from investment operations | | | (3.89 | ) |
| | | | |
Less distributions from: | | | | |
Net investment income | | | (0.45 | ) |
Net realized gains | | | (1.12 | ) |
| | | | |
Total distributions | | | (1.57 | ) |
| | | | |
Net asset value, end of period | | $ | 8.70 | |
| | | | |
| |
Total returnd | | | (31.00)% | |
Ratios to average net assetse | | | | |
Expensesf | | | 0.90% | |
Net investment income | | | 2.82% | |
| |
Supplemental data | | | | |
Net assets, end of period (000’s) | | $ | 3 | |
Portfolio turnover rate | | | 30.66% | |
aFor the period February 29, 2008 (effective date) to December 31, 2008.
bThe amount shown for a share outstanding throughout the period may not correlate with the Statement of Operations for the period due to the timing of sales and repurchases of the Fund shares in relation to income earned and/or fluctuating market value of the investments of the Fund.
cBased on average daily shares outstanding.
dTotal return does not include any fees, charges or expenses imposed by the variable annuity and life insurance contracts for which the Franklin Templeton Variable Insurance Products Trust serves as an underlying investment vehicle. Total return is not annualized for periods less than one year.
eRatios are annualized for periods less than one year.
fBenefit of expense reduction rounds to less than 0.01%.
The accompanying notes are an integral part of these financial statements.
FGI-9
Franklin Templeton Variable Insurance Products Trust
Statement of Investments, December 31, 2008
| | | | | | | |
| Franklin Growth and Income Securities Fund | | Country | | Shares | | Value |
Common Stocks 70.0% | | | | | | | |
Consumer Discretionary 5.2% | | | | | | | |
Autoliv Inc. | | Sweden | | 87,200 | | $ | 1,871,313 |
Best Buy Co. Inc. | | United States | | 166,600 | | | 4,683,126 |
The Home Depot Inc. | | United States | | 230,900 | | | 5,315,318 |
Nordstrom Inc. | | United States | | 305,000 | | | 4,059,550 |
| | | | | | | |
| | | | | | | 15,929,307 |
| | | | | | | |
Consumer Staples 7.4% | | | | | | | |
The Coca-Cola Co. | | United States | | 185,300 | | | 8,388,531 |
Diageo PLC, ADR | | United Kingdom | | 127,800 | | | 7,251,372 |
Unilever NV, N.Y. shs. | | Netherlands | | 274,600 | | | 6,741,430 |
| | | | | | | |
| | | | | | | 22,381,333 |
| | | | | | | |
Energy 9.4% | | | | | | | |
Chesapeake Energy Corp. | | United States | | 183,987 | | | 2,975,070 |
Chevron Corp. | | United States | | 88,100 | | | 6,516,757 |
ConocoPhillips | | United States | | 157,000 | | | 8,132,600 |
Exxon Mobil Corp. | | United States | | 81,944 | | | 6,541,589 |
Halliburton Co. | | United States | | 250,000 | | | 4,545,000 |
| | | | | | | |
| | | | | | | 28,711,016 |
| | | | | | | |
Financials 9.0% | | | | | | | |
AFLAC Inc. | | United States | | 118,300 | | | 5,422,872 |
Bank of America Corp. | | United States | | 311,112 | | | 4,380,457 |
Citigroup Inc. | | United States | | 299,600 | | | 2,010,316 |
iStar Financial Inc. | | United States | | 300,300 | | | 669,669 |
JPMorgan Chase & Co. | | United States | | 146,870 | | | 4,630,811 |
Marsh & McLennan Cos. Inc. | | United States | | 204,100 | | | 4,953,507 |
Wells Fargo & Co. | | United States | | 176,500 | | | 5,203,220 |
| | | | | | | |
| | | | | | | 27,270,852 |
| | | | | | | |
Health Care 7.5% | | | | | | | |
Johnson & Johnson | | United States | | 84,700 | | | 5,067,601 |
Pfizer Inc. | | United States | | 381,900 | | | 6,763,449 |
Roche Holding AG | | Switzerland | | 72,300 | | | 11,001,732 |
| | | | | | | |
| | | | | | | 22,832,782 |
| | | | | | | |
Industrials 14.7% | | | | | | | |
3M Co. | | United States | | 119,700 | | | 6,887,538 |
The Boeing Co. | | United States | | 106,300 | | | 4,535,821 |
Caterpillar Inc. | | United States | | 148,500 | | | 6,633,495 |
General Electric Co. | | United States | | 335,300 | | | 5,431,860 |
J.B. Hunt Transport Services Inc. | | United States | | 157,800 | | | 4,145,406 |
Pitney Bowes Inc. | | United States | | 188,000 | | | 4,790,240 |
United Parcel Service Inc., B | | United States | | 113,300 | | | 6,249,628 |
Waste Management Inc. | | United States | | 179,600 | | | 5,951,944 |
| | | | | | | |
| | | | | | | 44,625,932 |
| | | | | | | |
Information Technology 8.0% | | | | | | | |
Intel Corp. | | United States | | 489,200 | | | 7,171,672 |
Microsoft Corp. | | United States | | 304,500 | | | 5,919,480 |
Nokia Corp., ADR | | Finland | | 298,400 | | | 4,655,040 |
Paychex Inc. | | United States | | 249,400 | | | 6,554,232 |
| | | | | | | |
| | | | | | | 24,300,424 |
| | | | | | | |
FGI-10
Franklin Templeton Variable Insurance Products Trust
Statement of Investments, December 31, 2008 (continued)
| | | | | | | | |
| Franklin Growth and Income Securities Fund | | Country | | Shares | | Value |
Common Stocks (continued) | | | | | | | | |
Materials 2.1% | | | | | | | | |
The Dow Chemical Co. | | United States | | | 213,200 | | $ | 3,217,188 |
Weyerhaeuser Co. | | United States | | | 103,700 | | | 3,174,257 |
| | | | | | | | |
| | | | | | | | 6,391,445 |
| | | | | | | | |
Telecommunication Services 2.0% | | | | | | | | |
AT&T Inc. | | United States | | | 213,497 | | | 6,084,665 |
| | | | | | | | |
Utilities 4.7% | | | | | | | | |
Dominion Resources Inc. | | United States | | | 192,700 | | | 6,906,368 |
PG&E Corp. | | United States | | | 191,100 | | | 7,397,481 |
| | | | | | | | |
| | | | | | | | 14,303,849 |
| | | | | | | | |
Total Common Stocks (Cost $276,231,015) | | | | | | | | 212,831,605 |
| | | | | | | | |
Preferred Stocks (Cost $8,133,100) 0.1% | | | | | | | | |
Financials 0.1% | | | | | | | | |
Fannie Mae, 8.25%, pfd. | | United States | | | 325,000 | | | 269,750 |
| | | | | | | | |
Convertible Preferred Stocks 7.8% | | | | | | | | |
Consumer Discretionary 0.4% | | | | | | | | |
General Motors Corp., 6.25%, cvt. pfd., C | | United States | | | 420,000 | | | 1,344,000 |
| | | | | | | | |
Financials 2.5% | | | | | | | | |
Bank of America Corp., 7.25%, cvt. pfd., L | | United States | | | 5,100 | | | 3,315,000 |
Wachovia Corp., 7.50%, cvt. pfd., L | | United States | | | 5,600 | | | 4,200,000 |
| | | | | | | | |
| | | | | | | | 7,515,000 |
| | | | | | | | |
Health Care 2.6% | | | | | | | | |
Schering-Plough Corp., 6.00%, cvt. pfd. | | United States | | | 46,400 | | | 8,027,284 |
| | | | | | | | |
Utilities 2.3% | | | | | | | | |
Entergy Corp., 7.625%, cvt. pfd. | | United States | | | 135,000 | | | 6,857,325 |
| | | | | | | | |
Total Convertible Preferred Stocks (Cost $36,543,414) | | | | | | | | 23,743,609 |
| | | | | | | | |
| | | |
| | | | | Principal
Amount | | |
Corporate Bonds 5.5% | | | | | | | | |
Consumer Staples 1.2% | | | | | | | | |
Altria Group Inc., senior note, 8.50%, 11/10/13 | | United States | | $ | 3,500,000 | | | 3,628,678 |
| | | | | | | | |
Financials 4.3% | | | | | | | | |
American Express Credit Corp., C, 7.30%, 8/20/13 | | United States | | | 7,000,000 | | | 7,172,109 |
aJPMorgan Chase & Co., junior sub. note, 1, 7.90%, Perpetual | | United States | | | 7,000,000 | | | 5,838,182 |
| | | | | | | | |
| | | | | | | | 13,010,291 |
| | | | | | | | |
Total Corporate Bonds (Cost $16,737,910) | | | | | | | | 16,638,969 |
| | | | | | | | |
Convertible Bonds 6.2% | | | | | | | | |
Consumer Discretionary 1.1% | | | | | | | | |
Carnival Corp., cvt., senior deb., 2.00%, 4/15/21 | | United States | | | 3,656,000 | | | 3,317,820 |
| | | | | | | | |
Health Care 2.7% | | | | | | | | |
bMylan Inc., 144A, cvt., 3.75%, 9/15/15 | | United States | | | 9,000,000 | | | 8,190,000 |
| | | | | | | | |
FGI-11
Franklin Templeton Variable Insurance Products Trust
Statement of Investments, December 31, 2008 (continued)
| | | | | | | | |
| Franklin Growth and Income Securities Fund | | Country | | Principal
Amount | | Value |
Convertible Bonds (continued) | | | | | | | | |
Information Technology 2.4% | | | | | | | | |
Microchip Technology Inc., cvt., 2.125%, 12/15/37 | | United States | | $ | 11,600,000 | | $ | 7,395,000 |
| | | | | | | | |
Total Convertible Bonds (Cost $21,039,255) | | | | | | | | 18,902,820 |
| | | | | | �� | | |
Total Investments before Short Term Investments
(Cost $358,684,694) | | | | | | | | 272,386,753 |
| | | | | | | | |
Short Term Investments (Cost $30,848,802) 10.1% | | | | | | | | |
Repurchase Agreements 10.1% | | | | | | | | |
cJoint Repurchase Agreement, 0.019%, 1/02/09 (Maturity Value $30,848,835) | | United States | | | 30,848,802 | | | 30,848,802 |
Banc of America Securities LLC (Maturity Value $4,761,208) Barclays Capital Inc. (Maturity Value $4,534,779) BNP Paribas Securities Corp. (Maturity Value $6,046,372) Credit Suisse Securities (USA) LLC (Maturity Value $6,046,372) Deutsche Bank Securities Inc. (Maturity Value $3,489,312) HSBC Securities (USA) Inc. (Maturity Value $4,534,779) UBS Securities LLC (Maturity Value $1,436,013) | | | | | | | | |
Collateralized by U.S. Government Agency Securities, 3.50% - 7.00%, 6/15/09 - 5/20/22;
dU.S. Government Agency Discount Notes, 1/05/09 - 10/19/09; dU.S. Treasury Bills, 1/15/09; and U.S. Treasury Notes, 0.875% - 4.625%, 7/15/09 - 2/28/11 | | | | | | | | |
| | | | | | | | |
Total Investments (Cost $389,533,496) 99.7% | | | | | | | | 303,235,555 |
Other Assets, less Liabilities 0.3% | | | | | | | | 1,062,682 |
| | | | | | | | |
Net Assets 100.0% | | | | | | | $ | 304,298,237 |
| | | | | | | | |
See Abbreviations on page FGI - 21.
aPerpetual security with no stated maturity date.
bSecurity was purchased pursuant to Rule 144A under the Securities Act of 1933 and may be sold in transactions exempt from registration only to qualified institutional buyers or in a public offering registered under the Securities Act of 1933. This security has been deemed liquid under guidelines approved by the Trust’s Board of Trustees. At December 31, 2008, the value of this security was $8,190,000, representing 2.69% of net assets.
cSee Note 1(c) regarding joint repurchase agreement.
dThe security is traded on a discount basis with no stated coupon rate.
The accompanying notes are an integral part of these financial statements.
FGI-12
Franklin Templeton Variable Insurance Products Trust
Financial Statements
Statement of Assets and Liabilities
December 31, 2008
| | | | |
| | | Franklin Growth
and Income
Securities Fund | |
Assets: | | | | |
Investments in securities: | | | | |
Cost - Unaffiliated issuers | | $ | 358,684,694 | |
Cost - Repurchase agreements | | | 30,848,802 | |
| | | | |
Total cost of investments | | $ | 389,533,496 | |
| | | | |
Value - Unaffiliated issuers | | $ | 272,386,753 | |
Value - Repurchase agreements | | | 30,848,802 | |
| | | | |
Total value of investments | | | 303,235,555 | |
Receivables: | | | | |
Capital shares sold | | | 422 | |
Dividends and interest | | | 1,211,531 | |
Other assets | | | 245,689 | |
| | | | |
Total assets | | | 304,693,197 | |
| | | | |
Liabilities: | | | | |
Payables: | | | | |
Capital shares redeemed | | | 63,263 | |
Affiliates | | | 192,716 | |
Reports to shareholders | | | 105,913 | |
Professional fees | | | 27,286 | |
Accrued expenses and other liabilities | | | 5,782 | |
| | | | |
Total liabilities | | | 394,960 | |
| | | | |
Net assets, at value | | $ | 304,298,237 | |
| | | | |
Net assets consist of: | | | | |
Paid-in capital | | $ | 410,674,074 | |
Undistributed net investment income | | | 15,149,162 | |
Net unrealized appreciation (depreciation) | | | (86,300,983 | ) |
Accumulated net realized gain (loss) | | | (35,224,016 | ) |
| | | | |
Net assets, at value | | $ | 304,298,237 | |
| | | | |
Class 1: | | | | |
Net assets, at value | | $ | 162,936,334 | |
| | | | |
Shares outstanding | | | 18,692,734 | |
| | | | |
Net asset value and maximum offering price per share | | $ | 8.72 | |
| | | | |
Class 2: | | | | |
Net assets, at value | | $ | 141,358,833 | |
| | | | |
Shares outstanding | | | 16,455,686 | |
| | | | |
Net asset value and maximum offering price per share | | $ | 8.59 | |
| | | | |
Class 4: | | | | |
Net assets, at value | | $ | 3,070 | |
| | | | |
Shares outstanding | | | 353 | |
| | | | |
Net asset value and maximum offering price per share | | $ | 8.70 | |
| | | | |
The accompanying notes are an integral part of these financial statements.
FGI-13
Franklin Templeton Variable Insurance Products Trust
Financial Statements (continued)
Statement of Operations
for the year ended December 31, 2008
| | | | |
| | | Franklin Growth
and Income
Securities Fund | |
Investment income: | | | | |
Dividends | | $ | 16,640,158 | |
Interest | | | 784,570 | |
| | | | |
Total investment income | | | 17,424,728 | |
| | | | |
Expenses: | | | | |
Management fees (Note 3a) | | | 2,363,716 | |
Distribution fees: (Note 3c) | | | | |
Class 2 | | | 574,678 | |
Class 4 | | | 12 | |
Unaffiliated transfer agent fees | | | 750 | |
Custodian fees (Note 4) | | | 13,222 | |
Reports to shareholders | | | 132,308 | |
Professional fees | | | 43,950 | |
Trustees’ fees and expenses | | | 2,555 | |
Other | | | 20,925 | |
| | | | |
Total expenses | | | 3,152,116 | |
Expense reductions (Note 4) | | | (3,366 | ) |
| | | | |
Net expenses | | | 3,148,750 | |
| | | | |
Net investment income | | | 14,275,978 | |
| | | | |
Realized and unrealized gains (losses): | | | | |
Net realized gain (loss) from: | | | | |
Investments | | | (30,382,177 | ) |
Foreign currency transactions | | | (2,757 | ) |
| | | | |
Net realized gain (loss) | | | (30,384,934 | ) |
| | | | |
Net change in unrealized appreciation (depreciation) on: | | | | |
Investments | | | (174,273,745 | ) |
Translation of other assets and liabilities denominated in foreign currencies | | | (3,042 | ) |
| | | | |
Net change in unrealized appreciation (depreciation) | | | (174,276,787 | ) |
| | | | |
Net realized and unrealized gain (loss) | | | (204,661,721 | ) |
| | | | |
Net increase (decrease) in net assets resulting from operations | | $ | (190,385,743 | ) |
| | | | |
The accompanying notes are an integral part of these financial statements.
FGI-14
Franklin Templeton Variable Insurance Products Trust
Financial Statements (continued)
Statements of Changes in Net Assets
| | | | | | | | |
| | | Franklin Growth and Income
Securities Fund | |
| | | Year Ended December 31, | |
| | | 2008 | | | 2007 | |
| | | | |
Increase (decrease) in net assets: | | | | | | | | |
Operations: | | | | | | | | |
Net investment income | | $ | 14,275,978 | | | $ | 16,948,093 | |
Net realized gain (loss) from investments and foreign currency transactions | | | (30,384,934 | ) | | | 37,953,952 | |
Net change in unrealized appreciation (depreciation) on investments and translation of other assets and liabilities denominated in foreign currencies | | | (174,276,787 | ) | | | (76,998,728 | ) |
| | | | |
Net increase (decrease) in net assets resulting from operations | | | (190,385,743 | ) | | | (22,096,683 | ) |
| | | | |
Distributions to shareholders from: | | | | | | | | |
Net investment income: | | | | | | | | |
Class 1 | | | (8,476,479 | ) | | | (8,774,492 | ) |
Class 2 | | | (7,499,080 | ) | | | (8,436,065 | ) |
Class 4 | | | (160 | ) | | | — | |
Net realized gains: | | | | | | | | |
Class 1 | | | (20,947,837 | ) | | | (19,524,195 | ) |
Class 2 | | | (20,755,554 | ) | | | (20,561,240 | ) |
Class 4 | | | (395 | ) | | | — | |
| | | | |
Total distributions to shareholders | | | (57,679,505 | ) | | | (57,295,992 | ) |
| | | | |
Capital share transactions: (Note 2) | | | | | | | | |
Class 1 | | | (18,020,538 | ) | | | (44,846,830 | ) |
Class 2 | | | (49,003,980 | ) | | | 6,147,390 | |
Class 4 | | | 5,000 | | | | — | |
| | | | |
Total capital share transactions | | | (67,019,518 | ) | | | (38,699,440 | ) |
| | | | |
Net increase (decrease) in net assets | | | (315,084,766 | ) | | | (118,092,115 | ) |
Net assets: | | | | | | | | |
Beginning of year | | | 619,383,003 | | | | 737,475,118 | |
| | | | |
End of year | | $ | 304,298,237 | | | $ | 619,383,003 | |
| | | | |
Undistributed net investment income included in net assets: | | | | | | | | |
End of year | | $ | 15,149,162 | | | $ | 16,941,787 | |
| | | | |
The accompanying notes are an integral part of these financial statements.
FGI-15
Franklin Templeton Variable Insurance Products Trust
Notes to Financial Statements
Franklin Growth and Income Securities Fund
1. ORGANIZATION AND SIGNIFICANT ACCOUNTING POLICIES
Franklin Templeton Variable Insurance Products Trust (Trust) is registered under the Investment Company Act of 1940, as amended, (1940 Act) as an open-end investment company, consisting of twenty-three separate funds. The Franklin Growth and Income Securities Fund (Fund) is included in this report. The financial statements of the remaining funds in the Trust are presented separately. Shares of the Fund are sold only to insurance company separate accounts to fund the benefits of variable life insurance policies or variable annuity contracts. At December 31, 2008, 75.06% of the Fund’s shares were held through one insurance company. The Fund offers three classes of shares: Class 1, Class 2, and Class 4. Effective February 29, 2008, the Fund began offering a new class of shares, Class 4. Each class of shares differs by its distribution fees, voting rights on matters affecting a single class and its exchange privilege.
The following summarizes the Fund’s significant accounting policies.
a. Security Valuation
Securities listed on a securities exchange or on the NASDAQ National Market System are valued at the last quoted sale price or the official closing price of the day, respectively. Over-the-counter securities and listed securities for which there is no reported sale are valued within the range of the most recent quoted bid and ask prices. Securities that trade in multiple markets or on multiple exchanges are valued according to the broadest and most representative market.
Corporate debt securities generally trade in the over-the-counter market rather than on a securities exchange. The Trust may utilize independent pricing services, quotations from bond dealers, and information with respect to bond and note transactions, to assist in determining a current market value for each security. The Trust’s pricing services may use valuation models or matrix pricing which considers information with respect to comparable bond and note transactions, quotations from bond dealers, or by reference to other securities that are considered comparable in such characteristics as rating, interest rate and maturity date, option adjusted spread models, prepayment projections, interest rate spreads and yield curves, to determine current value.
Foreign securities are valued as of the close of trading on the foreign stock exchange on which the security is primarily traded, or the NYSE, whichever is earlier. If no sale is reported at that time, the foreign security will be valued within the range of the most recent quoted bid and ask prices. The value is then converted into its U.S. dollar equivalent at the foreign exchange rate in effect at the close of the NYSE on the day that the value of the foreign security is determined.
The Trust has procedures to determine the fair value of individual securities and other assets for which market prices are not readily available or which may not be reliably priced. Methods for valuing these securities may include: fundamental analysis, matrix pricing, discounts from market prices of similar securities, or discounts applied due to the nature and duration of restrictions on the disposition of the securities. Due to the inherent uncertainty of valuations of such securities, the fair values may differ significantly from the values that would have been used had a ready market for such investments existed. Occasionally, events occur between the time at which trading in a security is completed and the close of the NYSE that might call into question the availability (including the reliability) of the value of a portfolio security held by the Fund. The investment manager monitors price movements following the close of trading in foreign stock markets through a series of country specific market proxies (such as baskets of American Depository Receipts, futures contracts and exchange traded funds). These price movements are measured against established trigger thresholds for each specific market proxy to assist in determining if an event has occurred. If such an event occurs, the securities may be valued using fair value procedures, which may include the use of independent pricing services. All security valuation procedures are approved by the Trust’s Board of Trustees.
b. Foreign Currency Translation
Portfolio securities and other assets and liabilities denominated in foreign currencies are translated into U.S. dollars based on the exchange rate of such currencies against U.S. dollars on the date of valuation. Purchases and sales of securities, income and expense items denominated in foreign currencies are translated into U.S. dollars at the exchange rate in effect on the transaction
FGI-16
Franklin Templeton Variable Insurance Products Trust
Notes to Financial Statements (continued)
Franklin Growth and Income Securities Fund
1. ORGANIZATION AND SIGNIFICANT ACCOUNTING POLICIES (continued)
b. Foreign Currency Translation (continued)
date. Occasionally, events may impact the availability or reliability of foreign exchange rates used to convert the U.S. dollar equivalent value. If such an event occurs, the foreign exchange rate will be valued at fair value using procedures established and approved by the Trust’s Board of Trustees.
The Fund does not separately report the effect of changes in foreign exchange rates from changes in market prices on securities held. Such changes are included in net realized and unrealized gain or loss from investments on the Statement of Operations.
Realized foreign exchange gains or losses arise from sales of foreign currencies, currency gains or losses realized between the trade and settlement dates on securities transactions and the difference between the recorded amounts of dividends, interest, and foreign withholding taxes and the U.S. dollar equivalent of the amounts actually received or paid. Net unrealized foreign exchange gains and losses arise from changes in foreign exchange rates on foreign denominated assets and liabilities other than investments in securities held at the end of the reporting period.
c. Joint Repurchase Agreement
The Fund may enter into a joint repurchase agreement whereby its uninvested cash balance is deposited into a joint cash account with other funds managed by the investment manager or an affiliate of the investment manager and is used to invest in one or more repurchase agreements. The value and face amount of the joint repurchase agreement are allocated to the funds based on their pro-rata interest. A repurchase agreement is accounted for as a loan by the fund to the seller, collateralized by securities which are delivered to the fund’s custodian. The market value, including accrued interest, of the initial collateralization is required to be at least 102% of the dollar amount invested by the funds, with the value of the underlying securities marked to market daily to maintain coverage of at least 100%. The joint repurchase agreement held by the Fund at year end had been entered into on December 31, 2008. The joint repurchase agreement is valued at cost.
d. Foreign Currency Contracts
When the Fund purchases or sells foreign securities it may enter into foreign exchange contracts to minimize foreign exchange risk from the trade date to the settlement date of the transactions. A foreign exchange contract is an agreement between two parties to exchange different currencies at an agreed upon exchange rate at a future date. Realized and unrealized gains and losses on these contracts are included in the Statement of Operations.
The risks of these contracts include movement in the values of the foreign currencies relative to the U.S. dollar and the possible inability of the counterparties to fulfill their obligations under the contracts, which may be in excess of the amount reflected in the Statement of Assets and Liabilities.
e. Income Taxes
No provision has been made for U.S. income taxes because it is the Fund’s policy to qualify as a regulated investment company under the Internal Revenue Code and to distribute to shareholders substantially all of its taxable income and net realized gains.
The Fund has reviewed the tax positions, taken on federal income tax returns, for each of the three open tax years and as of December 31, 2008, and has determined that no provision for income tax is required in the Fund’s financial statements.
f. Security Transactions, Investment Income, Expenses and Distributions
Security transactions are accounted for on trade date. Realized gains and losses on security transactions are determined on a specific identification basis. Interest income and estimated expenses are accrued daily. Amortization of premium and accretion of discount on debt securities are included in interest income. Dividend income is recorded on the ex-dividend date except that
FGI-17
Franklin Templeton Variable Insurance Products Trust
Notes to Financial Statements (continued)
Franklin Growth and Income Securities Fund
1. ORGANIZATION AND SIGNIFICANT ACCOUNTING POLICIES (continued)
f. Security Transactions, Investment Income, Expenses and Distributions (continued)
certain dividends from foreign securities are recognized as soon as the Fund is notified of the ex-dividend date. Distributions to shareholders are recorded on the ex-dividend date and are determined according to income tax regulations (tax basis). Distributable earnings determined on a tax basis may differ from earnings recorded in accordance with accounting principles generally accepted in the United States of America. These differences may be permanent or temporary. Permanent differences are reclassified among capital accounts to reflect their tax character. These reclassifications have no impact on net assets or the results of operations. Temporary differences are not reclassified, as they may reverse in subsequent periods.
Common expenses incurred by the Trust are allocated among the funds based on the ratio of net assets of each fund to the combined net assets of the Trust. Fund specific expenses are charged directly to the fund that incurred the expense.
Realized and unrealized gains and losses and net investment income, not including class specific expenses, are allocated daily to each class of shares based upon the relative proportion of net assets of each class. Differences in per share distributions, by class, are generally due to differences in class specific expenses.
g. Accounting Estimates
The preparation of financial statements in accordance with accounting principles generally accepted in the United States of America requires management to make estimates and assumptions that affect the reported amounts of assets and liabilities at the date of the financial statements and the amounts of income and expenses during the reporting period. Actual results could differ from those estimates.
h. Guarantees and Indemnifications
Under the Trust’s organizational documents, its officers and trustees are indemnified by the Trust against certain liabilities arising out of the performance of their duties to the Trust. Additionally, in the normal course of business, the Trust, on behalf of the Fund, enters into contracts with service providers that contain general indemnification clauses. The Trust’s maximum exposure under these arrangements is unknown as this would involve future claims that may be made against the Trust that have not yet occurred. Currently, the Trust expects the risk of loss to be remote.
2. SHARES OF BENEFICIAL INTEREST
At December 31, 2008, there were an unlimited number of shares authorized (without par value). Transactions in the Fund’s shares were as follows:
| | | | | | | | | | | | | | |
| | | Year Ended December 31, | |
| | | 2008a | | | 2007 | |
| Class 1 Shares: | | Shares | | | Amount | | | Shares | | | Amount | |
Shares sold | | 16,555 | | | $ | 196,921 | | | 27,512 | | | $ | 465,422 | |
Shares issued in reinvestment of distributions | | 2,324,196 | | | | 29,424,315 | | | 1,649,108 | | | | 28,298,687 | |
Shares redeemed | | (4,003,019 | ) | | | (47,641,774 | ) | | (4,423,307 | ) | | | (73,610,939 | ) |
| | | | |
Net increase (decrease) | | (1,662,268 | ) | | $ | (18,020,538 | ) | | (2,746,687 | ) | | $ | (44,846,830 | ) |
| | | | |
| Class 2 Shares: | | | | | | | | | | | | |
Shares sold | | 705,175 | | | $ | 8,223,845 | | | 3,345,833 | | | $ | 57,300,105 | |
Shares issued in reinvestment of distributions | | 2,262,180 | | | | 28,254,634 | | | 1,710,755 | | | | 28,997,305 | |
Shares redeemed | | (7,557,698 | ) | | | (85,482,459 | ) | | (4,996,720 | ) | | | (80,150,020 | ) |
| | | | |
Net increase (decrease) | | (4,590,343 | ) | | $ | (49,003,980 | ) | | 59,868 | | | $ | 6,147,390 | |
| | | | |
| Class 4 Shares: | | | | | | | | | | | | |
Shares sold | | 353 | | | $ | 5,000 | | | | | | | | |
| | | | | | | | | | |
aFor | the period February 29, 2008 (effective date) to December 31, 2008 for Class 4. |
FGI-18
Franklin Templeton Variable Insurance Products Trust
Notes to Financial Statements (continued)
Franklin Growth and Income Securities Fund
3. TRANSACTIONS WITH AFFILIATES
Franklin Resources, Inc. is the holding company for various subsidiaries that together are referred to as Franklin Templeton Investments. Certain officers and trustees of the Trust are also officers and/or directors of the following subsidiaries:
| | |
| Subsidiary | | Affiliation |
Franklin Advisers, Inc. (Advisers) | | Investment manager |
Franklin Templeton Services, LLC (FT Services) | | Administrative manager |
Franklin Templeton Distributors, Inc. (Distributors) | | Principal underwriter |
Franklin Templeton Investor Services, LLC (Investor Services) | | Transfer agent |
a. Management Fees
The Fund pays an investment management fee to Advisers based on the average daily net assets of the Fund as follows:
| | |
| Annualized Fee Rate | | Net Assets |
| 0.625% | | Up to and including $100 million |
| 0.500% | | Over $100 million, up to and including $250 million |
| 0.450% | | Over $250 million, up to and including $7.5 billion |
| 0.440% | | Over $7.5 billion, up to and including $10 billion |
| 0.430% | | Over $10 billion, up to and including $12.5 billion |
| 0.420% | | Over $12.5 billion, up to and including $15 billion |
| 0.400% | | In excess of $15 billion |
b. Administrative Fees
Under an agreement with Advisers, FT Services provides administrative services to the Fund. The fee is paid by Advisers based on average daily net assets, and is not an additional expense of the Fund.
c. Distribution Fees
The Fund’s Board of Trustees has adopted distribution plans for Class 2 and Class 4 shares pursuant to Rule 12b-1 under the 1940 Act. Under the Fund’s compensation distribution plans, the Fund pays Distributors for costs incurred in connection with the servicing, sale and distribution of the Fund’s shares up to 0.35% per year of its average daily net assets of each class. The Board of Trustees has agreed to limit the current rate to 0.25% per year for Class 2.
d. Transfer Agent Fees
Investor Services, under terms of an agreement, performs shareholder servicing for the Fund and is not paid by the Fund for the services.
4. EXPENSE OFFSET ARRANGEMENT
The Fund has entered into an arrangement with its custodian whereby credits realized as a result of uninvested cash balances are used to reduce a portion of the Fund’s custodian expenses. During the year ended December 31, 2008, the custodian fees were reduced as noted in the Statement of Operations.
5. INCOME TAXES
For tax purposes, capital losses may be carried over to offset future capital gains, if any. At December 31, 2008, the Fund had tax basis capital losses of $21,008,426 expiring in 2016.
FGI-19
Franklin Templeton Variable Insurance Products Trust
Notes to Financial Statements (continued)
Franklin Growth and Income Securities Fund
5. INCOME TAXES (continued)
For tax purposes, realized capital losses and realized currency losses occurring subsequent to October 31, may be deferred and treated as occurring on the first day of the following fiscal year. At December 31, 2008, the Fund deferred realized capital losses and realized currency losses of $13,568,873 and $1,996, respectively.
The tax character of distributions paid during the years ended December 31, 2008 and 2007, was as follows:
| | | | | | |
| | | 2008 | | 2007 |
Distributions paid from: | | | | | | |
Ordinary Income | | $ | 18,802,624 | | $ | 22,500,691 |
Long term capital gain | | | 38,876,881 | | | 34,795,301 |
| | | |
| | $ | 57,679,505 | | $ | 57,295,992 |
| | | |
At December 31, 2008, the cost of investments, net unrealized appreciation (depreciation), and undistributed ordinary income for income tax purposes were as follows:
| | | | |
Cost of investments | | $ | 390,483,308 | |
| | | | |
| |
Unrealized appreciation | | $ | 19,050,310 | |
Unrealized depreciation | | | (106,298,063 | ) |
| | | | |
Net unrealized appreciation (depreciation) | | $ | (87,247,753 | ) |
| | | | |
Distributable earnings – undistributed ordinary income | | $ | 15,334,742 | |
| | | | |
Net investment income differs for financial statement and tax purposes primarily due to differing treatments of foreign currency transactions and bond discounts and premiums.
Net realized gains (losses) differ for financial statement and tax purposes primarily due to differing treatments of wash sales, foreign currency transactions, bond discounts and premiums, and pass-through entity income.
6. INVESTMENT TRANSACTIONS
Purchases and sales of investments (excluding short term securities) for the year ended December 31, 2008, aggregated $141,437,013 and $248,079,674, respectively.
7. CREDIT RISK
The Fund has 5.67% of its portfolio invested in high yield or other securities rated below investment grade. These securities may be more sensitive to economic conditions causing greater price volatility and are potentially subject to a greater risk of loss due to default than higher rated securities.
8. FAIR VALUE MEASUREMENTS
The Fund adopted Financial Accounting Standards Board (FASB) Statement No. 157, “Fair Value Measurement” (SFAS 157), on January 1, 2008. SFAS 157 defines fair value, establishes a framework for measuring fair value, and expands disclosures about fair value measurements. The Fund has determined that the implementation of SFAS 157 did not have a material impact on the Fund’s financial statements.
FGI-20
Franklin Templeton Variable Insurance Products Trust
Notes to Financial Statements (continued)
Franklin Growth and Income Securities Fund
8. FAIR VALUE MEASUREMENTS (continued)
SFAS 157 establishes a fair value hierarchy that distinguishes between market data obtained from independent sources (observable inputs) and the Fund’s own market assumptions (unobservable inputs). These inputs are used in determining the value of the Fund’s investments and are summarized in the following fair value hierarchy:
| | • | | Level 1 – quoted prices in active markets for identical securities |
| | • | | Level 2 – other significant observable inputs (including quoted prices for similar securities, interest rates, prepayment speed, credit risk, etc.) |
| | • | | Level 3 – significant unobservable inputs (including the Fund’s own assumptions in determining the fair value of investments) |
The inputs or methodology used for valuing securities are not an indication of the risk associated with investing in those securities.
The following is a summary of the inputs used as of December 31, 2008, in valuing the Fund’s assets carried at fair value:
| | | | | | | | | | | | |
| | | Level 1 | | Level 2 | | Level 3 | | Total |
Assets: | | | | | | | | | | | | |
Investments in Securities | | $ | 221,960,355 | | $ | 81,275,200 | | $ | — | | $ | 303,235,555 |
9. NEW ACCOUNTING PRONOUNCEMENT
In March 2008, FASB issued FASB Statement No. 161, “Disclosures about Derivative Instruments and Hedging Activities, an amendment of FASB Statement No. 133” (SFAS 161), which expands disclosures about derivative investments and hedging activities. SFAS 161 is effective for fiscal years and interim periods beginning after November 15, 2008. The Fund is currently evaluating the impact, if any, of applying the various provisions of SFAS 161.
10. SUBSEQUENT EVENT
On January 23, 2009, the Fund entered into, along with certain other funds managed by Franklin Templeton Investments (individually, “Borrower”; collectively “Borrowers”), a $725 million senior unsecured syndicated global line of credit (“Global Credit Facility”) to provide a source of funds to the Borrowers for temporary and emergency purposes and to meet future unanticipated or unusually large redemption requests.
Under the terms of the Global Credit Facility, each Borrower has agreed to pay its proportionate share of fees and expenses incurred in connection with the implementation and maintenance of the Global Credit Facility.
ABBREVIATIONS
Selected Portfolio
ADR - American Depository Receipt
FGI-21
Franklin Templeton Variable Insurance Products Trust
Franklin Growth and Income Securities Fund
Report of Independent Registered Public Accounting Firm
To the Board of Trustees and Shareholders of Franklin Templeton Variable Insurance Products Trust
In our opinion, the accompanying statement of assets and liabilities, including the statement of investments, and the related statements of operations and of changes in net assets and the financial highlights present fairly, in all material respects, the financial position of Franklin Growth and Income Securities Fund (one of the funds constituting the Franklin Templeton Variable Insurance Products Trust, hereafter referred to as the “Fund”) at December 31, 2008, the results of its operations for the year then ended, the changes in its net assets for each of the two years in the period then ended and the financial highlights for the periods presented, in conformity with accounting principles generally accepted in the United States of America. These financial statements and financial highlights (hereafter referred to as “financial statements”) are the responsibility of the Fund’s management. Our responsibility is to express an opinion on these financial statements based on our audits. We conducted our audits of these financial statements in accordance with the standards of the Public Company Accounting Oversight Board (United States). Those standards require that we plan and perform the audit to obtain reasonable assurance about whether the financial statements are free of material misstatement. An audit includes examining, on a test basis, evidence supporting the amounts and disclosures in the financial statements, assessing the accounting principles used and significant estimates made by management, and evaluating the overall financial statement presentation. We believe that our audits, which included confirmation of securities at December 31, 2008 by correspondence with the custodian, provide a reasonable basis for our opinion.
PricewaterhouseCoopers LLP
San Francisco, California
February 10, 2009
FGI-22
Franklin Templeton Variable Insurance Products Trust
Tax Designation (unaudited)
Franklin Growth and Income Securities Fund
Under Section 852(b)(3)(C) of the Internal Revenue Code (Code), the Fund designates the maximum amount allowable but no less than $38,876,881 as a long term capital gain dividend for the fiscal year ended December 31, 2008.
Under Section 854(b)(2) of the Code, the Fund designates 71.12% of the ordinary income dividends as income qualifying for the dividends received deduction for the fiscal year ended December 31, 2008.
FGI-23
FRANKLIN HIGH INCOME SECURITIES FUND
This annual report for Franklin High Income Securities Fund covers the fiscal year ended December 31, 2008.
Performance Summary as of 12/31/08
Average annual total return of Class 1 shares represents the average annual change in value, assuming reinvestment of dividends and capital gains. Average returns smooth out variations in returns, which can be significant; they are not the same as year-by-year results.
Periods ended 12/31/08
| | | | | | |
| | | 1-Year | | 5-Year | | 10-Year |
Average Annual Total Return | | -23.16% | | -0.22% | | +0.64% |
Total Return Index Comparison for a Hypothetical $10,000 Investment (1/1/99–12/31/08)
The graph below shows the change in value of a hypothetical $10,000 investment in the Fund over the indicated period and includes reinvestment of any income or distributions. The Fund’s performance is compared to the performance of the Credit Suisse (CS) High Yield Index and the Lipper VIP High Current Yield Funds Classification Average. One cannot invest directly in an index, nor is an index representative of the Fund’s portfolio. Please see Important Notes to Performance Information preceding the Fund Summaries.
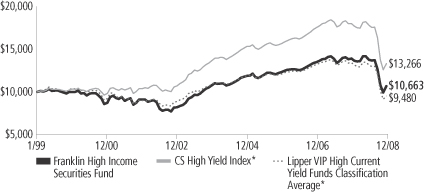
*Sources: © 2009 Morningstar; Lipper Inc. Please see Index Descriptions following the Fund Summaries.
Franklin High Income Securities Fund – Class 1
Performance reflects the Fund’s Class 1 operating expenses, but does not include any contract fees, expenses or sales charges. If they had been included, performance would be lower. These charges and deductions, particularly for variable life policies, can have a significant effect on contract values and insurance benefits. See the contract prospectus for a complete description of these expenses, including sales charges.
Performance data represent past performance, which does not guarantee future results. Investment return and principal value will fluctuate, and you may have a gain or loss when you sell your shares.
Current performance may differ from figures shown.
FH-1
Fund Goals and Main Investments: Franklin High Income Securities Fund seeks a high level of current income with capital appreciation as a secondary goal. The Fund normally invests primarily to predominantly in debt securities offering high yield and expected total return.
Performance Overview
You can find the Fund’s one-year total return in the Performance Summary. The Fund performed better than its benchmark, the CS High Yield Index, which had a -26.17% total return for the period under review.1 The Fund also performed better than its peers, as measured by the -26.93% return of the Lipper VIP High Current Yield Funds Classification Average.2
Economic and Market Overview
In 2008, economic conditions deteriorated. The Conference Board’s Consumer Confidence Index fell to an all-time low since it began in 1967 as the U.S. economy faltered and stock markets declined. The government’s abrupt conservatorship of Fannie Mae and Freddie Mac and the failure of several blue-chip banks and financial institutions roiled equity markets. Despite government interventions and massive emergency funding, the nation’s economic troubles were exacerbated as manufacturing activity weakened at its fastest pace in nearly 30 years and as home prices continued to fall. Jobless claims mounted and the unemployment rate rose to 7.2% by period-end.3 Economic growth, as measured by gross domestic product (GDP), rebounded from a 0.9% annualized rate in the first quarter of 2008 to a 2.8% annualized pace in the second quarter, largely due to strong exports and government spending. However, in the third and fourth quarters of 2008, GDP fell at annualized rates of 0.5% and an estimated 3.8%, reflecting a broad-based contraction in consumer spending, falling corporate profits and slowing export growth.
Oil prices soared to a record high in July, rising above $145 per barrel, before dramatically retreating to $45 by period-end. Many other commodities such as agricultural products and precious and base metals followed similar trends. Partially as a result of the steep price corrections, inflation declined significantly late in the review period, and December’s inflation rate was an annualized 0.1%.3 Core inflation, which excludes food and energy costs, rose at a 1.8% annual rate;
1. Source: © 2009 Morningstar. Please see Index Descriptions following the Fund Summaries.
2. Source: Lipper Inc. Please see Index Descriptions following the Fund Summaries.
One cannot invest directly in an index, nor is an index representative of the Fund’s portfolio. Please see Index Descriptions following the Fund Summaries.
3. Source: Bureau of Labor Statistics.
Fund Risks: Because the Fund invests in bonds and other debt obligations, its share price and yield will be affected by interest rate movements. Bond prices generally move in the opposite direction of interest rates. Thus, as prices of bonds in the Fund adjust to a rise in interest rates, the Fund’s share price may decline. The Fund invests primarily to predominantly in high yield, lower-rated (junk) bonds, which generally have greater price swings and higher risk of default and loss of principal than investment-grade bonds. Foreign investing, especially in emerging markets, involves additional risks including currency fluctuations, economic instability, market volatility, and political and social instability. The Fund’s prospectus also includes a description of the main investment risks.
FH-2
this level was within the Federal Reserve Board’s (Fed’s) informal target range of 1.5%–2.0%.3 The core personal consumption expenditures price index reported a 12-month increase of 1.7%.4
A slowing economy and decelerating inflation prompted policymakers to further lower interest rates and enact stimulus plans. During the year under review, the Fed lowered the federal funds target rate to a range of 0% to 0.25% from 4.25% at the start of the reporting period. The Fed and U.S. Treasury Department also introduced new programs such as the Primary Dealer Credit Facility (PDCF) and the Troubled Asset Relief Program (TARP), which were intended to stimulate market liquidity.
Volatility remained high throughout the reporting period but intensified in the latter half of the year as stocks fluctuated wildly, Treasury prices soared and yields across the maturity spectrum plummeted. Investors drove the yield on the three-month Treasury bill to a multi-decade low, and LIBOR (London InterBank Offered Rate) rates, which banks charge one another for loans, jumped to record highs. Fixed income spreads were generally wide relative to Treasury yields over the period due to heightened market turbulence and risk aversion. The yield curve steepened and the spread between the two-year Treasury yield and the 10-year Treasury yield increased to 149 basis points (100 basis points equal one percentage point) at the end of December from 99 basis points at the beginning of the reporting period. The two-year Treasury bill yield fell from 3.05% to 0.76% over the 12-month period. Over the same period, the 10-year U.S. Treasury note yield fell from 4.04% to 2.25%.
Although there were some signs of strength early in the year, Lehman Brothers’ demise in September and American International Group’s downgrade soon thereafter threw financial markets into disarray. The U.S. Treasury’s attempts to stabilize the financial system calmed market participants somewhat; however, the U.S. financial and economic problems spread overseas and brought global economic health into question. In this environment, the outlook for corporate earnings moved sharply lower, including for the commodities sector, causing equity markets to drop significantly. The high yield market could not escape the widespread sell-off, and spread premiums above U.S. Treasury securities nearly tripled during 2008, ending the year near an all-time wide spread of 17.3 percentage points versus 5.9 percentage points at the beginning of the year.5
4. Source: Bureau of Economic Analysis.
5. Source: Credit Suisse.
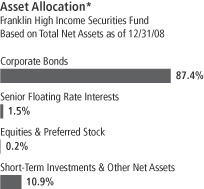
FH-3
Investment Strategy
We are research-driven, fundamental investors who rely on a team of analysts to provide in-depth industry expertise and use qualitative and quantitative analyses to evaluate companies. As bottom-up investors, we focus primarily on individual securities. We also consider sectors when choosing investments. In selecting securities for the Fund’s investment portfolio, we do not rely principally on ratings assigned by rating agencies, but perform our own independent analysis to evaluate an issuer’s creditworthiness. We consider a variety of factors, including an issuer’s experience and managerial strength, its sensitivity to economic conditions and its current financial condition.
Manager’s Discussion
In the context of unusually turbulent and distressed securities markets, the Fund had a negative return for the year under review. However, the Fund performed better than its benchmark, the CS High Yield Index, and its peer group, the Lipper VIP High Current Yield Funds Classification Average. We began the year somewhat conservatively positioned compared with the index, based on our view of market valuations versus our outlook for corporate fundamentals. However, beginning in the fall, investor risk appetites collapsed given the continued instability of numerous large financial institutions, increasing unemployment and a housing market that had not yet bottomed. The high yield market also experienced a marked uptick in default rates, and the lack of available credit for corporations and consumers increased concerns about many companies’ liquidity. These factors put significant downward pressure on secondary market prices; therefore, the Fund’s slightly more defensive positioning benefited results.
Certain industry positioning and specific holdings helped relative performance. Although we mainly use a bottom-up security selection process to manage the Fund, we also draw on our fundamental research process to take a broader view. For instance, the Fund increased its overweighted utilities position as we were attracted to the sector’s defensive nature, and utilities proved to be one of the best performing sectors in the CS High Yield Index during the year. Similarly, we maintained an overweighted position in the index’s top performing industry, wireless communications, which tends to be economically resilient and benefited during the year from some merger and acquisition activity.6 In addition, we were also overweighted in the industrials
6. Wireless communications holdings are in telecommunication services in the SOI.
FH-4
sector, despite concerns about the sector’s potential cyclicality.7 Several industrials companies appeared to us to be conservatively capitalized, therefore having ample liquidity to weather an economic recession. For this reason, we were comfortable taking an overweighted stance, which helped relative results since the sector performed better than the index.
Although the Fund’s overall positioning helped performance relative to the index, certain holdings and industry exposures hindered results. For example, the Fund initiated a position in Lehman Brothers during the year. Given the company’s subsequent default, our holding’s value declined. In terms of sector weightings, the Fund’s weightings in the chemicals and telecommunications industries versus the index hindered relative performance.8 The Fund was overweighted in chemicals during the year; however, the industry underperformed the overall index. The industry’s cyclical nature hurt performance, as might be expected, but the cancellation of some planned merger and acquisition activity also negatively affected the industry. In the telecommunications industry, the Fund was underweighted given our concerns about increased consumer transitions to wireless providers and generally high capital expenditure plans by major operators. Although we believed our concerns were valid, the industry performed better than the index largely due to its defensive characteristics and some positive price moves driven by corporate actions in the satellite sub-industry.
Thank you for your participation in Franklin High Income Securities Fund. We look forward to serving your future investment needs.
7. Industrials holdings are in capital goods and commercial and professional services in the SOI.
8. Chemicals holdings are in materials in the SOI; telecommunications holdings are in telecommunication services.
The foregoing information reflects our analysis, opinions and portfolio holdings as of December 31, 2008, the end of the reporting period. The way we implement our main investment strategies and the resulting portfolio holdings may change depending on factors such as market and economic conditions. These opinions may not be relied upon as investment advice or an offer for a particular security. The information is not a complete analysis of every aspect of any market, country, industry, security or the Fund. Statements of fact are from sources considered reliable, but the investment manager makes no representation or warranty as to their completeness or accuracy. Although historical performance is no guarantee of future results, these insights may help you understand our investment management philosophy.
Top 10 Sectors/Industries
Franklin High Income Securities Fund 12/31/08
| | |
| | | % of Total
Net Assets |
| |
| Energy | | 11.8% |
| |
| Utilities | | 9.3% |
| |
| Media | | 8.9% |
| |
| Health Care Equipment & Services | | 8.1% |
| |
| Materials | | 7.8% |
| |
| Telecommunication Services | | 7.5% |
| |
| Consumer Services | | 6.2% |
| |
| Capital Goods | | 5.5% |
| |
| Commercial & Professional Services | | 4.0% |
| |
| Diversified Financials | | 3.8% |
The dollar value, number of shares or principal amount, and names of all portfolio holdings are listed in the Fund’s Statement of Investments (SOI).
FH-5
Fund Expenses
As an investor in a variable insurance contract (Contract) that indirectly provides for investment in an underlying mutual fund, you can incur transaction and/or ongoing expenses at both the Fund level and the Contract level.
| • | | Transaction expenses can include sales charges (loads) on purchases, redemption fees, surrender fees, transfer fees and premium taxes. |
| • | | Ongoing expenses can include management fees, distribution and service (12b-1) fees, contract fees, annual maintenance fees, mortality and expense risk fees and other fees and expenses. All mutual funds and Contracts have some types of ongoing expenses. |
The expenses shown in the table are meant to highlight ongoing expenses at the Fund level only and do not include ongoing expenses at the Contract level, or transaction expenses at either the Fund or Contract level. While the Fund does not have transaction expenses, if the transaction and ongoing expenses at the Contract level were included, the expenses shown would be higher. You should consult your Contract prospectus or disclosure document for more information.
The table shows Fund-level ongoing expenses and can help you understand these expenses and compare them with those of other mutual funds offered through the Contract. The table assumes a $1,000 investment held for the six months indicated. Please refer to the Fund prospectus for additional information on operating expenses.
Actual Fund Expenses
The first line (Actual) of the table provides actual account values and expenses. The “Ending Account Value” is derived from the Fund’s actual return, which includes the effect of ongoing Fund expenses, but does not include the effect of ongoing Contract expenses.
You can estimate the Fund-level expenses you incurred during the period by following these steps. Of course, your account value and expenses will differ from those in this illustration:
| 1. | Divide your account value by $1,000. |
If an account had an $8,600 value, then $8,600 ÷ $1,000 = 8.6.
| 2. | Multiply the result by the number under the heading “Fund-Level Expenses Incurred During Period.” |
If Fund-Level Expenses Incurred During Period were $7.50, then 8.6 x $7.50 = $64.50.
In this illustration, the estimated expenses incurred this period at the Fund level are $64.50.
Franklin High Income Securities Fund – Class 1
FH-6
Hypothetical Example for Comparison with Other Mutual Funds
Information in the second line (Hypothetical) of the table can help you compare ongoing expenses of the Fund with those of other mutual funds offered through the Contract. This information may not be used to estimate the actual ending account balance or expenses you incurred during the period. The hypothetical “Ending Account Value” is based on the Fund’s actual expense ratio and an assumed 5% annual rate of return before expenses, which does not represent the Fund’s actual return. The figure under the heading “Fund-Level Expenses Incurred During Period” shows the hypothetical expenses your account would have incurred under this scenario. You can compare this figure with the 5% hypothetical examples that appear in shareholder reports of other funds offered through a Contract.
| | | | | | | | | |
| Class 1 | | Beginning
Account
Value 7/1/08 | | Ending
Account
Value 12/31/08 | | Fund-Level
Expenses Incurred
During Period*
7/1/08–12/31/08 |
Actual | | $ | 1,000 | | $ | 776.50 | | $ | 3.08 |
Hypothetical (5% return before expenses) | | $ | 1,000 | | $ | 1,021.67 | | $ | 3.51 |
*Expenses are calculated using the most recent six-month annualized expense ratio for the Fund’s Class 1 shares (0.69%), which does not include any ongoing expenses of the Contract for which the Fund is an investment option, multiplied by the average account value over the period, multiplied by 184/366 to reflect the one-half year period.
FH-7
Franklin Templeton Variable Insurance Products Trust
Financial Highlights
Franklin High Income Securities Fund
| | | | | | | | | | | | | | | | | | | | |
| | | Year Ended December 31, | |
| Class 1 | | 2008 | | | 2007 | | | 2006 | | | 2005 | | | 2004 | |
| | | | |
Per share operating performance | | | | | | | | | | | | | | | | | | | | |
(for a share outstanding throughout the year) | | | | | | | | | | | | | | | | | | | | |
Net asset value, beginning of year | | $ | 6.72 | | | $ | 6.96 | | | $ | 6.82 | | | $ | 6.99 | | | $ | 6.81 | |
| | | | |
Income from investment operationsa: | | | | | | | | | | | | | | | | | | | | |
Net investment incomeb | | | 0.50 | | | | 0.51 | | | | 0.49 | | | | 0.48 | | | | 0.49 | |
Net realized and unrealized gains (losses) | | | (1.92 | ) | | | (0.30 | ) | | | 0.12 | | | | (0.23 | ) | | | 0.15 | |
| | | | |
Total from investment operations | | | (1.42 | ) | | | 0.21 | | | | 0.61 | | | | 0.25 | | | | 0.64 | |
| | | | |
Less distributions from net investment income | | | (0.62 | ) | | | (0.45 | ) | | | (0.47 | ) | | | (0.42 | ) | | | (0.46 | ) |
| | | | |
Net asset value, end of year | | $ | 4.68 | | | $ | 6.72 | | | $ | 6.96 | | | $ | 6.82 | | | $ | 6.99 | |
| | | | |
| | | | | |
Total returnc | | | (23.16)% | | | | 3.02% | | | | 9.48% | | | | 3.72% | | | | 10.04% | |
Ratios to average net assets | | | | | | | | | | | | | | | | | | | | |
Expenses before expense reduction | | | 0.66% | | | | 0.61% | | | | 0.64% | | | | 0.60% | | | | 0.62% | |
Expenses net of expense reduction | | | 0.66% | d | | | 0.61% | d | | | 0.63% | | | | 0.60% | d | | | 0.62% | d |
Net investment income | | | 8.30% | | | | 7.38% | | | | 7.14% | | | | 6.96% | | | | 7.17% | |
| | | | | |
Supplemental data | | | | | | | | | | | | | | | | | | | | |
Net assets, end of year (000’s) | | $ | 38,225 | | | $ | 61,286 | | | $ | 77,641 | | | $ | 87,814 | | | $ | 109,569 | |
Portfolio turnover rate | | | 21.75% | | | | 40.65% | | | | 37.99% | | | | 47.60% | | | | 59.87% | |
aThe amount shown for a share outstanding throughout the period may not correlate with the Statement of Operations for the period due to the timing of sales and repurchases of the Fund shares in relation to income earned and/or fluctuating market value of the investments of the Fund.
bBased on average daily shares outstanding.
cTotal return does not include any fees, charges or expenses imposed by the variable annuity and life insurance contracts for which the Franklin Templeton Variable Insurance Products Trust serves as an underlying investment vehicle.
dBenefit of expense reduction rounds to less than 0.01%.
The accompanying notes are an integral part of these financial statements.
FH-8
Franklin Templeton Variable Insurance Products Trust
Financial Highlights (continued)
Franklin High Income Securities Fund
| | | | | | | | | | | | | | | | | | | | |
| | | Year Ended December 31, | |
| Class 2 | | 2008 | | | 2007 | | | 2006 | | | 2005 | | | 2004 | |
| | | | |
Per share operating performance | | | | | | | | | | | | | | | | | | | | |
(for a share outstanding throughout the year) | | | | | | | | | | | | | | | | | | | | |
Net asset value, beginning of year | | $ | 6.60 | | | $ | 6.85 | | | $ | 6.71 | | | $ | 6.90 | | | $ | 6.73 | |
| | | | |
Income from investment operationsa: | | | | | | | | | | | | | | | | | | | | |
Net investment incomeb | | | 0.47 | | | | 0.48 | | | | 0.46 | | | | 0.45 | | | | 0.46 | |
Net realized and unrealized gains (losses) | | | (1.88 | ) | | | (0.29 | ) | | | 0.13 | | | | (0.23 | ) | | | 0.16 | |
| | | | |
Total from investment operations | | | (1.41 | ) | | | 0.19 | | | | 0.59 | | | | 0.22 | | | | 0.62 | |
| | | | |
Less distributions from net investment income | | | (0.60 | ) | | | (0.44 | ) | | | (0.45 | ) | | | (0.41 | ) | | | (0.45 | ) |
| | | | |
Net asset value, end of year | | $ | 4.59 | | | $ | 6.60 | | | $ | 6.85 | | | $ | 6.71 | | | $ | 6.90 | |
| | | | |
| | | | | |
Total returnc | | | (23.38)% | | | | 2.72% | | | | 9.36% | | | | 3.31% | | | | 9.87% | |
Ratios to average net assets | | | | | | | | | | | | | | | | | | | | |
Expenses before expense reduction | | | 0.91% | | | | 0.86% | | | | 0.89% | | | | 0.85% | | | | 0.87% | |
Expenses net of expense reduction | | | 0.91% | d | | | 0.86% | d | | | 0.88% | | | | 0.85% | d | | | 0.87% | d |
Net investment income | | | 8.05% | | | | 7.13% | | | | 6.89% | | | | 6.71% | | | | 6.92% | |
| | | | | |
Supplemental data | | | | | | | | | | | | | | | | | | | | |
Net assets, end of year (000’s) | | $ | 84,396 | | | $ | 155,777 | | | $ | 166,318 | | | $ | 139,413 | | | $ | 122,579 | |
Portfolio turnover rate | | | 21.75% | | | | 40.65% | | | | 37.99% | | | | 47.60% | | | | 59.87% | |
aThe amount shown for a share outstanding throughout the period may not correlate with the Statement of Operations for the period due to the timing of sales
and repurchases of the Fund shares in relation to income earned and/or fluctuating market value of the investments of the Fund.
bBased on average daily shares outstanding.
cTotal return does not include any fees, charges or expenses imposed by the variable annuity and life insurance contracts for which the Franklin Templeton
Variable Insurance Products Trust serves as an underlying investment vehicle.
dBenefit of expense reduction rounds to less than 0.01%.
The accompanying notes are an integral part of these financial statements.
FH-9
Franklin Templeton Variable Insurance Products Trust
Financial Highlights (continued)
Franklin High Income Securities Fund
| | | | |
| | | Period Ended
December 31,
2008a | |
| Class 4 | |
Per share operating performance | | | | |
(for a share outstanding throughout the period) | | | | |
Net asset value, beginning of period | | $ | 6.55 | |
| | | | |
Income from investment operationsb: | | | | |
Net investment incomec | | | 0.39 | |
Net realized and unrealized gains (losses) | | | (1.65 | ) |
| | | | |
Total from investment operations | | | (1.26 | ) |
| | | | |
Less distributions from net investment income | | | (0.62 | ) |
| | | | |
Net asset value, end of period | | $ | 4.67 | |
| | | | |
| |
Total returnd | | | (21.34)% | |
Ratios to average net assetse | | | | |
Expenses before expense reduction | | | 1.01% | |
Expenses net of expense reductionf | | | 1.01% | |
Net investment income | | | 7.95% | |
| |
Supplemental data | | | | |
Net assets, end of period (000’s) | | $ | 2,244 | |
Portfolio turnover rate | | | 21.75% | |
aFor the period February 29, 2008 (effective date) to December 31, 2008.
bThe amount shown for a share outstanding throughout the period may not correlate with the Statement of Operations for the period due to the timing of sales and repurchases of the Fund shares in relation to income earned and/or fluctuating market value of the investments of the Fund.
cBased on average daily shares outstanding.
dTotal return does not include any fees, charges or expenses imposed by the variable annuity and life insurance contracts for which the Franklin Templeton Variable Insurance Products Trust serves as an underlying investment vehicle. Total return is not annualized for periods less than one year.
eRatios are annualized for periods less than one year.
fBenefit of expense reduction rounds to less than 0.01%.
The accompanying notes are an integral part of these financial statements.
FH-10
Franklin Templeton Variable Insurance Products Trust
Statement of Investments, December 31, 2008
| | | | | | | | |
| Franklin High Income Securities Fund | | Country | | Principal
Amounta | | Value |
b,cSenior Floating Rate Interests 1.5% | | | | | | | | |
Consumer Services 0.3% | | | | | | | | |
OSI Restaurant Partners LLC (Outback),
Pre-Funded Revolving Credit, 1.816%, 6/14/13 | | United States | | $ | 54,086 | | $ | 24,632 |
Term Loan B, 2.813%, 6/14/14 | | United States | | | 640,921 | | | 291,886 |
| | | | | | | | |
| | | | | | | | 316,518 |
| | | | | | | | |
Media 0.3% | | | | | | | | |
Univision Communications Inc., Initial Term Loan, 2.711%, 9/29/14 | | United States | | | 1,000,000 | | | 411,111 |
| | | | | | | | |
Utilities 0.9% | | | | | | | | |
Dynegy Holdings Inc.,
Term L/C Facility, 1.97%, 4/02/13 | | United States | | | 1,386,133 | | | 1,049,996 |
Term Loan B, 1.97%, 4/02/13 | | United States | | | 112,725 | | | 85,389 |
| | | | | | | | |
| | | | | | | | 1,135,385 |
| | | | | | | | |
Total Senior Floating Rate Interests (Cost $2,716,611) | | | | | | | | 1,863,014 |
| | | | | | | | |
Corporate Bonds 87.4% | | | | | | | | |
Automobiles & Components 2.8% | | | | | | | | |
Ford Motor Credit Co. LLC,
7.80%, 6/01/12 | | United States | | | 1,500,000 | | | 1,053,072 |
senior note, 9.875%, 8/10/11 | | United States | | | 2,200,000 | | | 1,623,822 |
dTRW Automotive Inc., senior note, 144A, 7.25%, 3/15/17 | | United States | | | 1,700,000 | | | 875,500 |
| | | | | | | | |
| | | | | | | | 3,552,394 |
| | | | | | | | |
Banks 1.2% | | | | | | | | |
eWells Fargo Capital XV, pfd., 9.75%, Perpetual | | United States | | | 1,500,000 | | | 1,516,413 |
| | | | | | | | |
Capital Goods 5.5% | | | | | | | | |
dAllison Transmission Inc., senior note, 144A, 11.00%, 11/01/15 | | United States | | | 1,800,000 | | | 891,000 |
DRS Technologies Inc., senior sub. note, 7.625%, 2/01/18 | | United States | | | 1,700,000 | | | 1,708,500 |
L-3 Communications Corp., senior sub. note, 5.875%, 1/15/15 | | United States | | | 1,000,000 | | | 905,000 |
RBS Global & Rexnord Corp., senior note, 9.50%, 8/01/14 | | United States | | | 2,000,000 | | | 1,500,000 |
Terex Corp., senior sub. note, 8.00%, 11/15/17 | | United States | | | 2,000,000 | | | 1,710,000 |
TransDigm Inc., senior sub. note, 7.75%, 7/15/14 | | United States | | | 200,000 | | | 165,000 |
| | | | | | | | |
| | | | | | | | 6,879,500 |
| | | | | | | | |
Commercial & Professional Services 4.0% | | | | | | | | |
Allied Waste North America Inc., senior secured note, 6.875%, 6/01/17 | | United States | | | 1,800,000 | | | 1,676,594 |
ARAMARK Corp., senior note, 8.50%, 2/01/15 | | United States | | | 1,500,000 | | | 1,365,000 |
f,gGoss Graphic Systems Inc., senior sub. note, 12.25%, 11/19/05 | | United States | | | 1,912,374 | | | 191 |
Iron Mountain Inc., senior sub. note, 8.75%, 7/15/18 | | United States | | | 700,000 | | | 607,250 |
JohnsonDiversey Holdings Inc., senior disc. note, 10.67%, 5/15/13 | | United States | | | 2,000,000 | | | 1,410,000 |
| | | | | | | | |
| | | | | | | | 5,059,035 |
| | | | | | | | |
Consumer Durables & Apparel 2.5% | | | | | | | | |
Jarden Corp., senior sub. note, 7.50%, 5/01/17 | | United States | | | 1,900,000 | | | 1,306,250 |
Jostens IH Corp., senior sub. note, 7.625%, 10/01/12 | | United States | | | 1,000,000 | | | 825,000 |
KB Home, senior note, 6.25%, 6/15/15 | | United States | | | 1,700,000 | | | 1,045,500 |
| | | | | | | | |
| | | | | | | | 3,176,750 |
| | | | | | | | |
Consumer Services 5.9% | | | | | | | | |
dFirekeepers Development Authority, senior secured note, 144A, 13.875%, 5/1/15 | | United States | | | 1,000,000 | | | 625,000 |
dFontainebleau Las Vegas, 144A, 10.25%, 6/15/15 | | United States | | | 1,700,000 | | | 174,250 |
Host Hotels & Resorts LP, senior note, M, 7.00%, 8/15/12 | | United States | | | 1,800,000 | | | 1,534,500 |
FH-11
Franklin Templeton Variable Insurance Products Trust
Statement of Investments, December 31, 2008 (continued)
| | | | | | | | |
| Franklin High Income Securities Fund | | Country | | Principal
Amounta | | Value |
Corporate Bonds (continued) | | | | | | | | |
Consumer Services (continued) | | | | | | | | |
MGM MIRAGE, senior note,
6.625%, 7/15/15 | | United States | | $ | 2,500,000 | | $ | 1,537,500 |
6.875%, 4/01/16 | | United States | | | 600,000 | | | 382,500 |
Pinnacle Entertainment Inc., senior sub. note, 8.75%, 10/01/13 | | United States | | | 2,100,000 | | | 1,669,500 |
Royal Caribbean Cruises Ltd.,
senior deb., 7.25%, 3/15/18 | | United States | | | 1,800,000 | | | 927,000 |
senior note, 6.875%, 12/01/13 | | United States | | | 400,000 | | | 226,000 |
Station Casinos Inc.,
senior note, 6.00%, 4/01/12 | | United States | | | 300,000 | | | 61,500 |
senior note, 7.75%, 8/15/16 | | United States | | | 800,000 | | | 156,000 |
senior sub. note, 6.50%, 2/01/14 | | United States | | | 100,000 | | | 6,250 |
senior sub. note, 6.875%, 3/01/16 | | United States | | | 1,000,000 | | | 62,500 |
| | | | | | | | |
| | | | | | | | 7,362,500 |
| | | | | | | | |
Diversified Financials 3.8% | | | | | | | | |
dGMAC LLC, senior note, 144A, 6.875%, 8/28/12 | | United States | | | 2,849,000 | | | 2,188,488 |
eJPMorgan Chase & Co., junior sub. note, 1, 7.90%, Perpetual | | United States | | | 1,500,000 | | | 1,251,039 |
gLehman Brothers Holdings Inc., senior note, 6.20%, 9/26/14 | | United States | | | 2,300,000 | | | 230,000 |
Merrill Lynch & Co. Inc., 6.875%, 4/25/18 | | United States | | | 1,000,000 | | | 1,047,825 |
| | | | | | | | |
| | | | | | | | 4,717,352 |
| | | | | | | | |
Energy 11.8% | | | | | | | | |
Chesapeake Energy Corp., senior note, 6.25%, 1/15/18 | | United States | | | 3,000,000 | | | 2,235,000 |
Compagnie Generale de Geophysique-Veritas, senior note, | | | | | | | | |
7.50%, 5/15/15 | | France | | | 500,000 | | | 312,500 |
7.75%, 5/15/17 | | France | | | 700,000 | | | 409,500 |
El Paso Corp., senior note, 6.875%, 6/15/14 | | United States | | | 2,000,000 | | | 1,624,630 |
Mariner Energy Inc., senior note, 7.50%, 4/15/13 | | United States | | | 2,100,000 | | | 1,354,500 |
MarkWest Energy Partners LP, senior note, 6.875%, 11/01/14 | | United States | | | 2,000,000 | | | 1,270,000 |
dPetroplus Finance Ltd., senior note, 144A, 6.75%, 5/01/14 | | Switzerland | | | 2,100,000 | | | 1,344,000 |
Plains Exploration & Production Co., senior note, 7.625%, 6/01/18 | | United States | | | 2,000,000 | | | 1,380,000 |
Quicksilver Resources Inc., senior note, 8.25%, 8/01/15 | | United States | | | 1,800,000 | | | 1,152,000 |
dSandRidge Energy Inc., senior note, 144A, 8.00%, 6/01/18 | | United States | | | 900,000 | | | 504,000 |
Tesoro Corp., senior note, 6.50%, 6/01/17 | | United States | | | 2,000,000 | | | 1,107,500 |
The Williams Cos. Inc., senior note, | | | | | | | | |
7.625%, 7/15/19 | | United States | | | 600,000 | | | 469,524 |
7.875%, 9/01/21 | | United States | | | 1,200,000 | | | 919,643 |
8.75%, 3/15/32 | | United States | | | 800,000 | | | 597,210 |
| | | | | | | | |
| | | | | | | | 14,680,007 |
| | | | | | | | |
Food, Beverage & Tobacco 1.5% | | | | | | | | |
Dean Foods Inc., senior note, 7.00%, 6/01/16 | | United States | | | 800,000 | | | 684,000 |
Smithfield Foods Inc., senior note, 7.75%,
5/15/13 | | United States | | | 1,500,000 | | | 971,250 |
7/01/17 | | United States | | | 300,000 | | | 172,500 |
| | | | | | | | |
| | | | | | | | 1,827,750 |
| | | | | | | | |
Health Care Equipment & Services 8.1% | | | | | | | | |
FMC Finance III SA, senior note, 6.875%, 7/15/17 | | Germany | | | 1,700,000 | | | 1,598,000 |
HCA Inc., senior secured note, 9.125%, 11/15/14 | | United States | | | 2,600,000 | | | 2,418,000 |
Tenet Healthcare Corp., senior note, 7.375%, 2/01/13 | | United States | | | 2,000,000 | | | 1,435,000 |
b,hU.S. Oncology Holdings Inc., senior note, PIK, FRN, 8.334%, 3/15/12 | | United States | | | 2,487,870 | | | 1,592,237 |
FH-12
Franklin Templeton Variable Insurance Products Trust
Statement of Investments, December 31, 2008 (continued)
| | | | | | | | |
| Franklin High Income Securities Fund | | Country | | Principal
Amounta | | Value |
Corporate Bonds (continued) | | | | | | | | |
Health Care Equipment & Services (continued) | | | | | | | | |
hUnited Surgical Partners International Inc., senior sub. note, PIK, 9.25%, 5/01/17 | | United States | | $ | 2,300,000 | | $ | 1,426,000 |
Vanguard Health Holding Co. II LLC, senior sub. note, 9.00%, 10/01/14 | | United States | | | 2,000,000 | | | 1,680,000 |
| | | | | | | | |
| | | | | | | | 10,149,237 |
| | | | | | | | |
Materials 7.8% | | | | | | | | |
Crown Americas Inc., senior note, 7.75%, 11/15/15 | | United States | | | 1,800,000 | | | 1,800,000 |
Freeport-McMoRan Copper & Gold Inc., senior note, 8.375%, 4/01/17 | | United States | | | 1,700,000 | | | 1,395,931 |
Huntsman International LLC, senior sub. note, 7.875%, 11/15/14 | | United States | | | 1,600,000 | | | 864,000 |
dIneos Group Holdings PLC, senior secured note, 144A, 8.50%, 2/15/16 | | United Kingdom | | | 2,300,000 | | | 218,500 |
dMacDermid Inc., senior sub. note, 144A, 9.50%, 4/15/17 | | United States | | | 2,000,000 | | | 1,050,000 |
Nalco Co., senior sub. note, 8.875%, 11/15/13 | | United States | | | 1,400,000 | | | 1,190,000 |
Novelis Inc., senior note, 7.25%, 2/15/15 | | Canada | | | 1,700,000 | | | 994,500 |
Owens-Illinois Inc., senior note, 7.80%, 5/15/18 | | United States | | | 2,000,000 | | | 1,790,000 |
Smurfit Kappa Funding PLC, senior sub. note, 7.75%, 4/01/15 | | Ireland | | | 800,000 | �� | | 440,000 |
| | | | | | | | |
| | | | | | | | 9,742,931 |
| | | | | | | | |
Media 8.9% | | | | | | | | |
f,gCallahan Nordrhein-Westfallen, senior note, 14.00%, 7/15/10 | | Germany | | | 2,750,000 | | | 275 |
CanWest Media Inc., senior sub. note, 8.00%, 9/15/12 | | Canada | | | 1,700,000 | | | 756,500 |
CCH II LLC, senior note, 10.25%, 9/15/10 | | United States | | | 3,500,000 | | | 1,627,500 |
Dex Media Inc., B, 8.00%, 11/15/13 | | United States | | | 600,000 | | | 114,000 |
DIRECTV Holdings LLC, senior note, 7.625%, 5/15/16 | | United States | | | 1,500,000 | | | 1,462,500 |
EchoStar DBS Corp., senior note, 7.125%, 2/01/16 | | United States | | | 2,000,000 | | | 1,680,000 |
Lamar Media Corp., senior sub. note, 7.25%, 1/01/13 | | United States | | | 2,000,000 | | | 1,605,000 |
Liberty Media Corp., senior note, 5.70%, 5/15/13 | | United States | | | 2,000,000 | | | 1,321,154 |
Quebecor Media Inc., senior note, 7.75%, 3/15/16 | | Canada | | | 2,000,000 | | | 1,360,000 |
R.H. Donnelley Corp., senior note, A-3, 8.875%, 1/15/16 | | United States | | | 2,400,000 | | | 372,000 |
Radio One Inc., senior sub. note, 6.375%, 2/15/13 | | United States | | | 2,000,000 | | | 685,000 |
d,hUnivision Communications Inc., senior note, 144A, PIK, 9.75%, 3/15/15 | | United States | | | 1,200,000 | | | 156,000 |
| | | | | | | | |
| | | | | | | | 11,139,929 |
| | | | | | | | |
Real Estate 0.6% | | | | | | | | |
Forest City Enterprises Inc., senior note, | | | | | | | | |
7.625%, 6/01/15 | | United States | | | 2,000,000 | | | 710,000 |
6.50%, 2/01/17 | | United States | | | 300,000 | | | 106,500 |
| | | | | | | | |
| | | | | | | | 816,500 |
| | | | | | | | |
Retailing 1.9% | | | | | | | | |
Dollar General Corp., senior note, 10.625%, 7/15/15 | | United States | | | 1,500,000 | | | 1,440,000 |
Michaels Stores Inc., senior note, 10.00%, 11/01/14 | | United States | | | 2,000,000 | | | 920,000 |
| | | | | | | | |
| | | | | | | | 2,360,000 |
| | | | | | | | |
Semiconductors & Semiconductor Equipment 0.5% | | | | | | | | |
Freescale Semiconductor Inc., senior note, 8.875%, 12/15/14 | | United States | | | 1,300,000 | | | 578,500 |
| | | | | | | | |
Software & Services 1.7% | | | | | | | | |
First Data Corp., senior note, 9.875%, 9/24/15 | | United States | | | 1,100,000 | | | 671,000 |
SunGard Data Systems Inc., senior sub. note, 10.25%, 8/15/15 | | United States | | | 2,100,000 | | | 1,396,500 |
| | | | | | | | |
| | | | | | | | 2,067,500 |
| | | | | | | | |
Technology Hardware & Equipment 2.1% | | | | | | | | |
Celestica Inc., senior sub. note, | | | | | | | | |
7.875%, 7/01/11 | | Canada | | | 1,000,000 | | | 915,000 |
7.625%, 7/01/13 | | Canada | | | 400,000 | | | 330,000 |
FH-13
Franklin Templeton Variable Insurance Products Trust
Statement of Investments, December 31, 2008 (continued)
| | | | | | | | |
| Franklin High Income Securities Fund | | Country | | Principal
Amounta | | Value |
Corporate Bonds (continued) | | | | | | | | |
Technology Hardware & Equipment (continued) | | | | | | | | |
dNortel Networks Ltd., senior note, 144A, 10.75%, 7/15/16 | | Canada | | $ | 1,800,000 | | $ | 395,163 |
Sanmina-SCI Corp.,
b,dsenior note, 144A, FRN, 4.746%, 6/15/14 | | United States | | | 1,000,000 | | | 545,000 |
senior sub. note, 6.75%, 3/01/13 | | United States | | | 1,000,000 | | | 435,000 |
| | | | | | | | |
| | | | | | | | 2,620,163 |
| | | | | | | | |
Telecommunication Services 7.5% | | | | | | | | |
Centennial Communications Corp., senior note, 10.00%, 1/01/13 | | United States | | | 1,000,000 | | | 1,040,000 |
dDigicel Group Ltd., senior note, 144A, 8.875%, 1/15/15 | | Jamaica | | | 2,000,000 | | | 1,310,000 |
dIntelsat Subsidiary Holding Co. Ltd., senior note, 144A, 8.50%, 1/15/13 | | Bermuda | | | 2,000,000 | | | 1,860,000 |
MetroPCS Wireless Inc., senior note, 9.25%, 11/01/14 | | United States | | | 2,000,000 | | | 1,800,000 |
Qwest Communications International Inc., senior note, B, 7.50%, 2/15/14 | | United States | | | 2,200,000 | | | 1,584,000 |
dWind Acquisition Finance SA, senior note, 144A, 10.75%, 12/01/15 | | Italy | | | 2,025,000 | | | 1,751,625 |
| | | | | | | | |
| | | | | | | | 9,345,625 |
| | | | | | | | |
Utilities 9.3% | | | | | | | | |
The AES Corp., senior note, 8.00%, 10/15/17 | | United States | | | 2,000,000 | | | 1,650,000 |
Aquila Inc., senior note, 14.875%, 7/01/12 | | United States | | | 1,300,000 | | | 1,313,918 |
Dynegy Holdings Inc., senior note, 8.375%, 5/01/16 | | United States | | | 1,000,000 | | | 715,000 |
Edison Mission Energy, senior note, 7.00%, 5/15/17 | | United States | | | 2,000,000 | | | 1,750,000 |
Mirant North America LLC, senior note, 7.375%, 12/31/13 | | United States | | | 1,900,000 | | | 1,833,500 |
NRG Energy Inc., senior note, | | | | | | | | |
7.25%, 2/01/14 | | United States | | | 400,000 | | | 375,000 |
7.375%, 2/01/16 | | United States | | | 1,700,000 | | | 1,585,250 |
PNM Resources Inc., senior note, 9.25%, 5/15/15 | | United States | | | 300,000 | | | 240,000 |
dTexas Competitive Electric Holdings Co. LLC, senior note, 144A, 10.25%, 11/01/15 | | United States | | | 3,000,000 | | | 2,145,000 |
| | | | | | | | |
| | | | | | | | 11,607,668 |
| | | | | | | | |
Total Corporate Bonds (Cost $162,503,952) | | | | | | | | 109,199,754 |
| | | | | | | | |
| | | |
| | | | | Shares | | |
Preferred Stocks (Cost $214,420) 0.2% | | | | | | | | |
Consumer Finance 0.2% | | | | | | | | |
dPreferred Blocker Inc., 9.00%, pfd., 144A | | United States | | | 604 | | | 214,420 |
| | | | | | | | |
Total Investments before Short Term Investments
(Cost $165,434,983) | | | | | | | | 111,277,188 |
| | | | | | | | |
FH-14
Franklin Templeton Variable Insurance Products Trust
Statement of Investments, December 31, 2008 (continued)
| | | | | | | | |
| Franklin High Income Securities Fund | | Country | | Principal
Amounta | | Value |
Short Term Investments (Cost $9,342,628) 7.5% | | | | | | | | |
Repurchase Agreements 7.5% | | | | | | | | |
iJoint Repurchase Agreement, 0.019%, 1/02/09 (Maturity Value $9,342,638) | | United States | | $ | 9,342,628 | | $ | 9,342,628 |
Banc of America Securities LLC (Maturity Value $1,441,942) Barclays Capital Inc. (Maturity Value $1,373,368) BNP Paribas Securities Corp. (Maturity Value $1,831,157) Credit Suisse Securities (USA) LLC (Maturity Value $1,831,157) Deutsche Bank Securities Inc. (Maturity Value $1,056,746) HSBC Securities (USA) Inc. (Maturity Value $1,373,368) UBS Securities LLC (Maturity Value $434,900) | | | | | | | | |
Collateralized by U.S. Government Agency Securities, 3.50% - 7.00%, 6/15/09 - 5/20/22; jU.S. Government Agency Discount Notes, 1/05/09 - 10/19/09; jU.S. Treasury Bills, 1/15/09; and U.S. Treasury Notes, 0.875% - 4.625%, 7/15/09 - 2/28/11 | | | | | | | | |
| | | | | | | | |
Total Investments (Cost $174,777,611) 96.6% | | | | | | | | 120,619,816 |
Other Assets, less Liabilities 3.4% | | | | | | | | 4,244,404 |
| | | | | | | | |
Net Assets 100.0% | | | | | | | $ | 124,864,220 |
| | | | | | | | |
See Abbreviations on page FH-26.
aThe principal amount is stated in U.S. dollars unless otherwise indicated.
bThe coupon rate shown represents the rate at period end.
cSee Note 1(c) regarding senior floating rate interests.
dSecurity was purchased pursuant to Rule 144A under the Securities Act of 1933 and may be sold in transactions exempt from registration only to qualified institutional buyers or in a public offering registered under the Securities Act of 1933. These securities have been deemed liquid under guidelines approved by the Trust’s Board of Trustees. At December 31, 2008, the aggregate value of these securities was $16,247,946, representing 13.01% of net assets.
ePerpetual security with no stated maturity date.
fSecurity has been deemed illiquid because it may not be able to be sold within seven days. At December 31, 2008, the aggregate value of these securities was $466, representing less than 0.01% of net assets.
gSee Note 7 regarding defaulted securities.
hIncome may be received in additional securities and/or cash.
iSee Note 1(b) regarding joint repurchase agreement.
jThe security is traded on a discount basis with no stated coupon rate.
The accompanying notes are an integral part of these financial statements.
FH-15
Franklin Templeton Variable Insurance Products Trust
Financial Statements
Statement of Assets and Liabilities
December 31, 2008
| | | | |
| | | Franklin High
Income
Securities Fund | |
Assets: | | | | |
Investments in securities: | | | | |
Cost - Unaffiliated issuers | | $ | 165,434,983 | |
Cost - Repurchase agreements | | | 9,342,628 | |
| | | | |
Total cost of investments | | $ | 174,777,611 | |
| | | | |
Value - Unaffiliated issuers | | $ | 111,277,188 | |
Value - Repurchase agreements | | | 9,342,628 | |
| | | | |
Total value of investments | | | 120,619,816 | |
Cash | | | 794,141 | |
Receivables: | | | | |
Investment securities sold | | | 85,595 | |
Capital shares sold | | | 307,641 | |
Interest | | | 3,253,651 | |
| | | | |
Total assets | | | 125,060,844 | |
| | | | |
Liabilities: | | | | |
Payables: | | | | |
Capital shares redeemed | | | 1,371 | |
Affiliates | | | 92,712 | |
Reports to shareholders | | | 70,457 | |
Professional fees | | | 29,719 | |
Accrued expenses and other liabilities | | | 2,365 | |
| | | | |
Total liabilities | | | 196,624 | |
| | | | |
Net assets, at value | | $ | 124,864,220 | |
| | | | |
Net assets consist of: | | | | |
Paid-in capital | | $ | 283,033,172 | |
Undistributed net investment income | | | 13,449,168 | |
Net unrealized appreciation (depreciation) | | | (54,157,795 | ) |
Accumulated net realized gain (loss) | | | (117,460,325 | ) |
| | | | |
Net assets, at value | | $ | 124,864,220 | |
| | | | |
The accompanying notes are an integral part of these financial statements.
FH-16
Franklin Templeton Variable Insurance Products Trust
Financial Statements (continued)
Statement of Assets and Liabilities (continued)
December 31, 2008
| | | |
| | | Franklin High
Income
Securities Fund |
Class 1: | | | |
Net assets, at value | | $ | 38,224,657 |
| | | |
Shares outstanding | | | 8,169,468 |
| | | |
Net asset value and maximum offering price per share | | $ | 4.68 |
| | | |
Class 2: | | | |
Net assets, at value | | $ | 84,395,583 |
| | | |
Shares outstanding | | | 18,392,272 |
| | | |
Net asset value and maximum offering price per share | | $ | 4.59 |
| | | |
Class 4: | | | |
Net assets, at value | | $ | 2,243,980 |
| | | |
Shares outstanding | | | 480,831 |
| | | |
Net asset value and maximum offering price per share | | $ | 4.67 |
| | | |
The accompanying notes are an integral part of these financial statements.
FH-17
Franklin Templeton Variable Insurance Products Trust
Financial Statements (continued)
Statement of Operations
for the year ended December 31, 2008
| | | | |
| | | Franklin High
Income
Securities Fund | |
Investment income: | | | | |
Interest | | $ | 15,599,753 | |
| | | | |
Expenses: | | | | |
Management fees (Note 3a) | | | 997,381 | |
Distribution fees: (Note 3c) | | | | |
Class 2 | | | 304,246 | |
Class 4 | | | 2,814 | |
Unaffiliated transfer agent fees | | | 254 | |
Custodian fees (Note 4) | | | 4,206 | |
Reports to shareholders | | | 97,770 | |
Professional fees | | | 33,731 | |
Trustees’ fees and expenses | | | 914 | |
Other | | | 11,869 | |
| | | | |
Total expenses | | | 1,453,185 | |
Expense reductions (Note 4) | | | (1,051 | ) |
| | | | |
Net expenses | | | 1,452,134 | |
| | | | |
Net investment income | | | 14,147,619 | |
| | | | |
Realized and unrealized gains (losses): | | | | |
Net realized gain (loss) from investments | | | (12,094,569 | ) |
Net change in unrealized appreciation (depreciation) on investments | | | (44,020,341 | ) |
| | | | |
Net realized and unrealized gain (loss) | | | (56,114,910 | ) |
| | | | |
Net increase (decrease) in net assets resulting from operations | | $ | (41,967,291 | ) |
| | | | |
The accompanying notes are an integral part of these financial statements.
FH-18
Franklin Templeton Variable Insurance Products Trust
Financial Statements (continued)
Statements of Changes in Net Assets
| | | | | | | | |
| | | Franklin High Income
Securities Fund | |
| | | Year Ended December 31, | |
| | | 2008 | | | 2007 | |
| | | | |
Increase (decrease) in net assets: | | | | | | | | |
Operations: | | | | | | | | |
Net investment income | | $ | 14,147,619 | | | $ | 17,541,563 | |
Net realized gain (loss) from investments | | | (12,094,569 | ) | | | 235,385 | |
Net change in unrealized appreciation (depreciation) on investments | | | (44,020,341 | ) | | | (11,924,906 | ) |
| | | | |
Net increase (decrease) in net assets resulting from operations | | | (41,967,291 | ) | | | 5,852,042 | |
| | | | |
Distributions to shareholders from net investment income: | | | | | | | | |
Class 1 | | | (5,331,940 | ) | | | (4,495,151 | ) |
Class 2 | | | (12,613,674 | ) | | | (11,904,068 | ) |
Class 4 | | | (40,112 | ) | | | — | |
| | | | |
Total distributions to shareholders | | | (17,985,726 | ) | | | (16,399,219 | ) |
| | | | |
Capital share transactions: (Note 2) | | | | | | | | |
Class 1 | | | (5,364,101 | ) | | | (14,109,266 | ) |
Class 2 | | | (29,589,130 | ) | | | (2,239,776 | ) |
Class 4 | | | 2,707,846 | | | | — | |
| | | | |
Total capital share transactions | | | (32,245,385 | ) | | | (16,349,042 | ) |
| | | | |
Net increase (decrease) in net assets | | | (92,198,402 | ) | | | (26,896,219 | ) |
Net assets: | | | | | | | | |
Beginning of year | | | 217,062,622 | | | | 243,958,841 | |
| | | | |
End of year | | $ | 124,864,220 | | | $ | 217,062,622 | |
| | | | |
Undistributed net investment income included in net assets: | | | | | | | | |
End of year | | $ | 13,449,168 | | | $ | 17,129,175 | |
| | | | |
The accompanying notes are an integral part of these financial statements.
FH-19
Franklin Templeton Variable Insurance Products Trust
Notes to Financial Statements
Franklin High Income Securities Fund
1. ORGANIZATION AND SIGNIFICANT ACCOUNTING POLICIES
Franklin Templeton Variable Insurance Products Trust (Trust) is registered under the Investment Company Act of 1940, as amended, (1940 Act) as an open-end investment company, consisting of twenty-three separate funds. The Franklin High Income Securities Fund (Fund) is included in this report. The financial statements of the remaining funds in the Trust are presented separately. Shares of the Fund are sold only to insurance company separate accounts to fund the benefits of variable life insurance policies or variable annuity contracts. At December 31, 2008, 91.20% of the Fund’s shares were held through one insurance company. The Fund offers three classes of shares: Class 1, Class 2, and Class 4. Effective February 29, 2008, the Fund began offering a new class of shares, Class 4. Each class of shares differs by its distribution fees, voting rights on matters affecting a single class and its exchange privilege.
The following summarizes the Fund’s significant accounting policies.
a. Security Valuation
Securities listed on a securities exchange or on the NASDAQ National Market System are valued at the last quoted sale price or the official closing price of the day, respectively. Over-the-counter securities and listed securities for which there is no reported sale are valued within the range of the most recent quoted bid and ask prices. Securities that trade in multiple markets or on multiple exchanges are valued according to the broadest and most representative market.
Corporate debt securities generally trade in the over-the-counter market rather than on a securities exchange. The Trust may utilize independent pricing services, quotations from bond dealers, and information with respect to bond and note transactions, to assist in determining a current market value for each security. The Trust’s pricing services may use valuation models or matrix pricing which considers information with respect to comparable bond and note transactions, quotations from bond dealers, or by reference to other securities that are considered comparable in such characteristics as rating, interest rate and maturity date, option adjusted spread models, prepayment projections, interest rate spreads and yield curves, to determine current value.
The Trust has procedures to determine the fair value of individual securities and other assets for which market prices are not readily available or which may not be reliably priced. Methods for valuing these securities may include: fundamental analysis, matrix pricing, discounts from market prices of similar securities, or discounts applied due to the nature and duration of restrictions on the disposition of the securities. Due to the inherent uncertainty of valuations of such securities, the fair values may differ significantly from the values that would have been used had a ready market for such investments existed. Occasionally, events occur between the time at which trading in a security is completed and the close of the NYSE that might call into question the availability (including the reliability) of the value of a portfolio security held by the Fund. If such an event occurs, the securities may be valued using fair value procedures, which may include the use of independent pricing services. All security valuation procedures are approved by the Trust’s Board of Trustees.
b. Joint Repurchase Agreement
The Fund may enter into a joint repurchase agreement whereby its uninvested cash balance is deposited into a joint cash account with other funds managed by the investment manager or an affiliate of the investment manager and is used to invest in one or more repurchase agreements. The value and face amount of the joint repurchase agreement are allocated to the funds based on their pro-rata interest. A repurchase agreement is accounted for as a loan by the fund to the seller, collateralized by securities which are delivered to the fund’s custodian. The market value, including accrued interest, of the initial collateralization is required to be at least 102% of the dollar amount invested by the funds, with the value of the underlying securities marked to market daily to maintain coverage of at least 100%. The joint repurchase agreement held by the Fund at year end had been entered into on December 31, 2008. The joint repurchase agreement is valued at cost.
FH-20
Franklin Templeton Variable Insurance Products Trust
Notes to Financial Statements (continued)
Franklin High Income Securities Fund
1. ORGANIZATION AND SIGNIFICANT ACCOUNTING POLICIES (continued)
c. Senior Floating Rate Interests
Senior secured corporate loans pay interest at rates which are periodically reset by reference to a base lending rate plus a spread. These base lending rates are generally the prime rate offered by a designated U.S. bank or the London InterBank Offered Rate (LIBOR). Senior secured corporate loans often require prepayment of principal from excess cash flows or at the discretion of the borrower. As a result, actual maturity may be substantially less than the stated maturity.
Senior secured corporate loans in which the Fund invests are generally readily marketable, but may be subject to some restrictions on resale.
d. Income Taxes
No provision has been made for U.S. income taxes because it is the Fund’s policy to qualify as a regulated investment company under the Internal Revenue Code and to distribute to shareholders substantially all of its taxable income and net realized gains.
The Fund has reviewed the tax positions, taken on federal income tax returns, for each of the three open tax years and as of December 31, 2008, and has determined that no provision for income tax is required in the Fund’s financial statements.
e. Security Transactions, Investment Income, Expenses and Distributions
Security transactions are accounted for on trade date. Realized gains and losses on security transactions are determined on a specific identification basis. Interest income and estimated expenses are accrued daily. Amortization of premium and accretion of discount on debt securities are included in interest income. Facility fees are recognized as income over the expected term of the loan. Distributions to shareholders are recorded on the ex-dividend date and are determined according to income tax regulations (tax basis). Distributable earnings determined on a tax basis may differ from earnings recorded in accordance with accounting principles generally accepted in the United States of America. These differences may be permanent or temporary. Permanent differences are reclassified among capital accounts to reflect their tax character. These reclassifications have no impact on net assets or the results of operations. Temporary differences are not reclassified, as they may reverse in subsequent periods.
Common expenses incurred by the Trust are allocated among the funds based on the ratio of net assets of each fund to the combined net assets of the Trust. Fund specific expenses are charged directly to the fund that incurred the expense.
Realized and unrealized gains and losses and net investment income, not including class specific expenses, are allocated daily to each class of shares based upon the relative proportion of net assets of each class. Differences in per share distributions, by class, are generally due to differences in class specific expenses.
f. Accounting Estimates
The preparation of financial statements in accordance with accounting principles generally accepted in the United States of America requires management to make estimates and assumptions that affect the reported amounts of assets and liabilities at the date of the financial statements and the amounts of income and expenses during the reporting period. Actual results could differ from those estimates.
g. Guarantees and Indemnifications
Under the Trust’s organizational documents, its officers and trustees are indemnified by the Trust against certain liabilities arising out of the performance of their duties to the Trust. Additionally, in the normal course of business, the Trust, on behalf of the Fund, enters into contracts with service providers that contain general indemnification clauses. The Trust’s maximum exposure
FH-21
Franklin Templeton Variable Insurance Products Trust
Notes to Financial Statements (continued)
Franklin High Income Securities Fund
1. ORGANIZATION AND SIGNIFICANT ACCOUNTING POLICIES (continued)
g. Guarantees and Indemnifications (continued)
under these arrangements is unknown as this would involve future claims that may be made against the Trust that have not yet occurred. Currently, the Trust expects the risk of loss to be remote.
2. SHARES OF BENEFICIAL INTEREST
At December 31, 2008, there were an unlimited number of shares authorized (without par value). Transactions in the Fund’s shares were as follows:
| | | | | | | | | | | | | | |
| | | Year Ended December 31, | |
| | | 2008a | | | 2007 | |
| Class 1 Shares: | | Shares | | | Amount | | | Shares | | | Amount | |
Shares sold | | 714,258 | | | $ | 4,273,846 | | | 730,046 | | | $ | 4,985,612 | |
Shares issued in reinvestment of distributions | | 864,172 | | | | 5,331,940 | | | 663,002 | | | | 4,495,151 | |
Shares redeemed | | (2,530,790 | ) | | | (14,969,887 | ) | | (3,418,532 | ) | | | (23,590,029 | ) |
| | | | |
Net increase (decrease) | | (952,360 | ) | | $ | (5,364,101 | ) | | (2,025,484 | ) | | $ | (14,109,266 | ) |
| | | | |
| Class 2 Shares: | | | | | | | | | | | | |
Shares sold | | 4,825,096 | | | $ | 27,974,845 | | | 7,186,912 | | | $ | 49,319,160 | |
Shares issued in reinvestment of distributions | | 2,081,464 | | | | 12,613,674 | | | 1,787,398 | | | | 11,904,068 | |
Shares redeemed | | (12,129,167 | ) | | | (70,177,649 | ) | | (9,639,217 | ) | | | (63,463,004 | ) |
| | | | |
Net increase (decrease) | | (5,222,607 | ) | | $ | (29,589,130 | ) | | (664,907 | ) | | $ | (2,239,776 | ) |
| | | | |
| Class 4 Shares: | | | | | | | | | | | | |
Shares sold | | 481,696 | | | $ | 2,702,636 | | | | | | | | |
Shares issued on reinvestment of distributions | | 6,424 | | | | 39,636 | | | | | | | | |
Shares redeemed | | (7,289 | ) | | | (34,426 | ) | | | | | | | |
| | | | | | | | | | |
Net increase (decrease) | | 480,831 | | | $ | 2,707,846 | | | | | | | | |
| | | | | | | | | | |
aFor | the period February 29, 2008 (effective date) to December 31, 2008 for Class 4. |
3. TRANSACTIONS WITH AFFILIATES
Franklin Resources, Inc. is the holding company for various subsidiaries that together are referred to as Franklin Templeton Investments. Certain officers and trustees of the Trust are also officers and/or directors of the following subsidiaries:
| | |
| Subsidiary | | Affiliation |
Franklin Advisers, Inc. (Advisers) | | Investment manager |
Franklin Templeton Services, LLC (FT Services) | | Administrative manager |
Franklin Templeton Distributors, Inc. (Distributors) | | Principal underwriter |
Franklin Templeton Investor Services, LLC (Investor Services) | | Transfer agent |
FH-22
Franklin Templeton Variable Insurance Products Trust
Notes to Financial Statements (continued)
Franklin High Income Securities Fund
3. TRANSACTIONS WITH AFFILIATES (continued)
a. Management Fees
The Fund pays an investment management fee to Adivsers based on the average daily net assets of the Fund as follows:
| | |
| Annualized Fee Rate | | Net Assets |
| 0.625% | | Up to and including $100 million |
| 0.500% | | Over $100 million, up to and including $250 million |
| 0.450% | | Over $250 million, up to and including $7.5 billion |
| 0.440% | | Over $7.5 billion, up to and including $10 billion |
| 0.430% | | Over $10 billion, up to and including $12.5 billion |
| 0.420% | | Over $12.5 billion, up to and including $15 billion |
| 0.400% | | In excess of $15 billion |
b. Administrative Fees
Under an agreement with Advisers, FT Services provides administrative services to the Fund. The fee is paid by Advisers based on average daily net assets, and is not an additional expense of the Fund.
c. Distribution Fees
The Fund’s Board of Trustees has adopted distribution plans for Class 2 and Class 4 shares pursuant to Rule 12b-1 under the 1940 Act. Under the Fund’s compensation distribution plans, the Fund pays Distributors for costs incurred in connection with the servicing, sale and distribution of the Fund’s shares up to 0.35% per year of its average daily net assets of each class. The Board of Trustees has agreed to limit the current rate to 0.25% per year for Class 2.
d. Transfer Agent Fees
Investor Services, under terms of an agreement, performs shareholder servicing for the Fund and is not paid by the Fund for the services.
4. EXPENSE OFFSET ARRANGEMENT
The Fund has entered into an arrangement with its custodian whereby credits realized as a result of uninvested cash balances are used to reduce a portion of the Fund’s custodian expenses. During the year ended December 31, 2008, the custodian fees were reduced as noted in the Statement of Operations.
5. INCOME TAXES
For tax purposes, capital losses may be carried over to offset future capital gains, if any. At December 31, 2008, the capital loss carryforwards were as follows:
| | | |
Capital loss carryforwards expiring in: | | | |
2009 | | $ | 14,152,532 |
2010 | | | 46,366,314 |
2011 | | | 24,711,916 |
2012 | | | 9,009,590 |
2013 | | | 6,321,190 |
2014 | | | 40,420 |
2015 | | | 4,493,289 |
2016 | | | 8,152,252 |
| | | |
| | $ | 113,247,503 |
| | | |
FH-23
Franklin Templeton Variable Insurance Products Trust
Notes to Financial Statements (continued)
Franklin High Income Securities Fund
5. INCOME TAXES (continued)
On December 31, 2008, the Fund had expired capital loss carryforwards of $26,944,467, which were reclassified to paid-in capital.
For tax purposes, realized capital losses occurring subsequent to October 31, may be deferred and treated as occurring on the first day of the following fiscal year. At December 31, 2008, the Fund deferred realized capital losses of $4,179,982.
The tax character of distributions paid during the years ended December 31, 2008 and 2007, was as follows:
| | | | | | |
| | | 2008 | | 2007 |
Distributions paid from ordinary income | | $ | 17,985,726 | | $ | 16,399,219 |
| | | |
At December 31, 2008, the cost of investments, net unrealized appreciation (depreciation), and undistributed ordinary income for income tax purposes were as follows:
| | | | |
Cost of investments | | $ | 175,435,131 | |
| | | | |
| |
Unrealized appreciation | | $ | 197,905 | |
Unrealized depreciation | | | (55,013,220 | ) |
| | | | |
Net unrealized appreciation (depreciation) | | $ | (54,815,315 | ) |
| | | | |
Distributable earnings – undistributed ordinary income | | $ | 14,121,042 | |
| | | | |
Net investment income differs for financial statement and tax purposes primarily due to differing treatments of defaulted securities, payments-in-kind, and bond discounts and premiums.
Net realized gains (losses) differ for financial statement and tax purposes primarily due to differing treatments of wash sales and bond discounts and premiums.
6. INVESTMENT TRANSACTIONS
Purchases and sales of investments (excluding short term securities) for the year ended December 31, 2008, aggregated $36,265,588 and $78,913,583, respectively.
7. CREDIT RISK AND DEFAULTED SECURITIES
The Fund has 86.61% of its portfolio invested in high yield, senior secured floating rate notes, or other securities rated below investment grade. These securities may be more sensitive to economic conditions causing greater price volatility and are potentially subject to a greater risk of loss due to default than higher rated securities.
The Fund held defaulted securities and/or other securities for which the income has been deemed uncollectible. At December 31, 2008, the aggregate value of these securities was $230,466, representing 0.18% of the Fund’s net assets. The Fund discontinues accruing income on securities for which income has been deemed uncollectible and provides an estimate for losses on interest receivable. The securities have been identified on the accompanying Statement of Investments.
FH-24
Franklin Templeton Variable Insurance Products Trust
Notes to Financial Statements (continued)
Franklin High Income Securities Fund
8. FAIR VALUE MEASUREMENTS
The Fund adopted Financial Accounting Standards Board (FASB) Statement No. 157, “Fair Value Measurement” (SFAS 157), on January 1, 2008. SFAS 157 defines fair value, establishes a framework for measuring fair value, and expands disclosures about fair value measurements. The Fund has determined that the implementation of SFAS 157 did not have a material impact on the Fund’s financial statements.
SFAS 157 establishes a fair value hierarchy that distinguishes between market data obtained from independent sources (observable inputs) and the Fund’s own market assumptions (unobservable inputs). These inputs are used in determining the value of the Fund’s investments and are summarized in the following fair value hierarchy:
| | • | | Level 1 – quoted prices in active markets for identical securities |
| | • | | Level 2 – other significant observable inputs (including quoted prices for similar securities, interest rates, prepayment speed, credit risk, etc.) |
| | • | | Level 3 – significant unobservable inputs (including the Fund’s own assumptions in determining the fair value of investments) |
The inputs or methodology used for valuing securities are not an indication of the risk associated with investing in those securities.
The following is a summary of the inputs used as of December 31, 2008, in valuing the Fund’s assets carried at fair value:
| | | | | | | | | | | | |
| | | Level 1 | | Level 2 | | Level 3 | | Total |
Assets: | | | | | | | | | | | | |
Investments in Securities | | $ | — | | $ | 120,404,930 | | $ | 214,886 | | $ | 120,619,816 |
At December 31, 2008, the reconciliation of assets in which significant unobservable inputs (Level 3) were used in determining fair value, is as follows:
| | | | |
| | | Investments
in Securities | |
Beginning Balance – January 1, 2008 | | $ | 275 | |
Net realized gain (loss) | | | (89,208 | ) |
Net change in unrealized appreciation (depreciation) | | | 89,399 | |
Net purchases (sales) | | | 214,420 | |
Transfers in and/or out of Level 3 | | | — | |
| | | | |
Ending Balance | | $ | 214,886 | |
| | | | |
Net change in unrealized appreciation (depreciation)
attributable to assets still held at end of year | | $ | 191 | |
| | | | |
9. NEW ACCOUNTING PRONOUNCEMENT
In March 2008, FASB issued FASB Statement No. 161, “Disclosures about Derivative Instruments and Hedging Activities, an amendment of FASB Statement No. 133” (SFAS 161), which expands disclosures about derivative investments and hedging activities. SFAS 161 is effective for fiscal years and interim periods beginning after November 15, 2008. The Fund is currently evaluating the impact, if any, of applying the various provisions of SFAS 161.
FH-25
Franklin Templeton Variable Insurance Products Trust
Notes to Financial Statements (continued)
Franklin High Income Securities Fund
10. SUBSEQUENT EVENT
On January 23, 2009, the Fund entered into, along with other funds managed by Franklin Templeton Investments (individually, “Borrower”; collectively “Borrowers”), a $725 million senior unsecured syndicated global line of credit (“Global Credit Facility”) to provide a source of funds to the Borrowers for temporary and emergency purposes and to meet future unanticipated or unusually large redemption requests.
Under the terms of the Global Credit Facility, each Borrower has agreed to pay its proportionate share of fees and expenses incurred in connection with the implementation and maintenance of the Global Credit Facility.
ABBREVIATIONS
Selected Portfolio
FRN - Floating Rate Note
L/C - Letter of Credit
PIK - Payment-In-Kind
FH-26
Franklin Templeton Variable Insurance Products Trust
Franklin High Income Securities Fund
Report of Independent Registered Public Accounting Firm
To the Board of Trustees and Shareholders of
Franklin Templeton Variable Insurance Products Trust
In our opinion, the accompanying statement of assets and liabilities, including the statement of investments, and the related statements of operations and of changes in net assets and the financial highlights present fairly, in all material respects, the financial position of Franklin High Income Securities Fund (one of the funds constituting the Franklin Templeton Variable Insurance Products Trust, hereafter referred to as the “Fund”) at December 31, 2008, the results of its operations for the year then ended, the changes in its net assets for each of the two years in the period then ended and the financial highlights for the periods presented, in conformity with accounting principles generally accepted in the United States of America. These financial statements and financial highlights (hereafter referred to as “financial statements”) are the responsibility of the Fund’s management. Our responsibility is to express an opinion on these financial statements based on our audits. We conducted our audits of these financial statements in accordance with the standards of the Public Company Accounting Oversight Board (United States). Those standards require that we plan and perform the audit to obtain reasonable assurance about whether the financial statements are free of material misstatement. An audit includes examining, on a test basis, evidence supporting the amounts and disclosures in the financial statements, assessing the accounting principles used and significant estimates made by management, and evaluating the overall financial statement presentation. We believe that our audits, which included confirmation of securities at December 31, 2008 by correspondence with the custodian, provide a reasonable basis for our opinion.
PricewaterhouseCoopers LLP
San Francisco, California
February 10, 2009
FH-27
FRANKLIN INCOME SECURITIES FUND
This annual report for Franklin Income Securities Fund covers the fiscal year ended December 31, 2008.
Performance Summary as of 12/31/08
Average annual total return of Class 1 shares represents the average annual change in value, assuming reinvestment of dividends and capital gains. Average returns smooth out variations in returns, which can be significant; they are not the same as year-by-year results.
Periods ended 12/31/08
| | | | | | |
| | | 1-Year | | 5-Year | | 10-Year |
Average Annual Total Return | | -29.41% | | +0.22% | | +4.68% |
Total Return Index Comparison
for a Hypothetical $10,000 Investment (1/1/99–12/31/08)
The graph below shows the change in value of a hypothetical $10,000 investment in the Fund over the indicated period and includes reinvestment of any income or distributions. The Fund’s performance is compared to the performance of the Standard & Poor’s 500 Index (S&P 500) and the Barclays Capital (BC) U.S. Aggregate Index. One cannot invest directly in an index, nor is an index representative of the Fund’s portfolio. Please see Important Notes to Performance Information preceding the Fund Summaries.
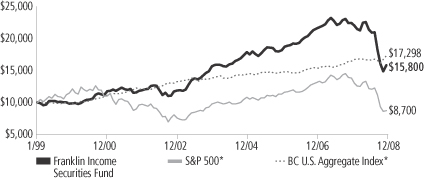
*Source: © 2009 Morningstar. Please see Index Descriptions following the Fund Summaries.
Franklin Income Securities Fund – Class 1
Performance reflects the Fund’s Class 1 operating expenses, but does not include any contract fees, expenses or sales charges. If they had been included, performance would be lower. These charges and deductions, particularly for variable life policies, can have a significant effect on contract values and insurance benefits. See the contract prospectus for a complete description of these expenses, including sales charges.
Performance data represent past performance, which does not guarantee future results. Investment return and principal value will fluctuate, and you may have a gain or loss when you sell your shares. Current performance may differ from figures shown.
FI-1
Fund Goal and Main Investments: Franklin Income Securities Fund seeks to maximize income while maintaining prospects for capital appreciation. The Fund normally invests in both equity and debt securities. The Fund seeks income by investing in corporate, foreign and U.S. Treasury bonds as well as stocks with dividend yields the manager believes are attractive.
Performance Overview
You can find the Fund’s one-year total return in the Performance Summary. The Fund performed better than its equity benchmark, the S&P 500, which had a -37.00% total return, and underperformed its fixed income benchmark, the BC U.S. Aggregate Index, which had a +5.24% total return for the same period.1
Economic and Market Overview
In 2008, economic conditions deteriorated. The Conference Board’s Consumer Confidence Index fell to an all-time low since it began in 1967 as the U.S. economy faltered and stock markets declined. The government’s abrupt conservatorship of Fannie Mae and Freddie Mac and the failure of several blue-chip banks and financial institutions roiled equity markets. Despite government interventions and massive emergency funding, the nation’s economic troubles were exacerbated as manufacturing activity weakened at its fastest pace in nearly 30 years and as home prices continued to fall. Jobless claims mounted and the unemployment rate rose to 7.2% by period-end.2 Economic growth, as measured by gross domestic product (GDP), rebounded from a 0.9% annualized rate in the first quarter of 2008 to a 2.8% annualized pace in the second quarter, largely due to strong exports and government spending. However, in the third and fourth quarters of 2008, GDP fell at annualized rates of 0.5% and an estimated 3.8%, reflecting a broad-based contraction in consumer spending, falling corporate profits and slowing export growth.
Oil prices soared to a record high in July, rising above $145 per barrel, before dramatically retreating to $45 by period-end. Many other commodities such as agricultural products and precious and base metals followed similar trends. Partially as a result of the steep price corrections, inflation declined significantly late in the review period, and December’s inflation rate was an annualized 0.1%.2 Core inflation,
1. Source: © 2009 Morningstar. One cannot invest directly in an index, nor is an index representative of the Fund’s portfolio. Please see Index Descriptions following the Fund Summaries.
2. Source: Bureau of Labor Statistics.
Fund Risks: The Fund’s investments in stocks offer the potential for long-term gains but can be subject to short-term price fluctuations. Because the Fund invests in bonds and other debt obligations, its share price and yield will be affected by interest rate movements. Bond prices generally move in the opposite direction of interest rates. Thus, as prices of bonds in the Fund adjust to a rise in interest rates, the Fund’s share price may decline. The Fund may invest a substantial portion of its assets in high yield, lower-rated (junk) bonds, which generally have greater price swings and higher risk of default and loss of principal than investment-grade bonds. Foreign investing involves additional risks, including currency fluctuations, economic instability, market volatility, and political and social instability. The Fund’s prospectus also includes a description of the main investment risks.
FI-2
which excludes food and energy costs, rose at a 1.8% annual rate; this level was within the Federal Reserve Board’s (Fed’s) informal target range of 1.5%-2.0%.2
A slowing economy and decelerating inflation prompted policymakers to further lower interest rates and enact stimulus plans. During the year under review, the Fed lowered the federal funds target rate to a range of 0% to 0.25% from 4.25% at the start of the reporting period. The Fed and U.S. Treasury Department also introduced new programs such as the Primary Dealer Credit Facility (PDCF) and the Troubled Asset Relief Program (TARP), which were intended to enhance market liquidity.
Volatility remained high throughout the reporting period but intensified in the latter half of the year as stocks fluctuated wildly and Treasury prices soared. The year was among the worst in history for U.S. stock market performance. For the 12 months under review, the blue chip stocks of the Dow Jones Industrial Average had a total return of -31.93%, the broader S&P 500 a -37.00% total return, and the technology-heavy NASDAQ Composite Index a -40.03% total return.1 All sectors lost value, and the financials, materials and information technology sectors had the largest declines.
Investment Strategy
We search for undervalued or out-of-favor securities we believe offer opportunities for income today and growth tomorrow. We generally perform independent analysis of the debt securities being considered for the Fund’s portfolio, rather than relying principally on ratings assigned by rating agencies. In analyzing debt and equity securities, we consider a variety of factors, including: a security’s relative value based on such factors as anticipated cash flow, interest or dividend coverage, asset coverage, and earnings prospects; the experience and strength of a company’s management; a company’s sensitivity to changes in interest rates and business conditions; a company’s debt maturity schedules and borrowing requirements; and a company’s changing financial condition and market recognition of the change.
Manager’s Discussion
Within equities, financial holdings generally detracted from Fund performance as the sector fared worse than other sectors. Some holdings significantly hurt performance even where we held securities higher in the capital structure such as Lehman Brothers Holdings convertible preferred stock (sold by period-end) and Fannie Mae and Freddie Mac preferred stocks. Wells Fargo was an exception and helped performance

FI-3
due to the perceived strength of the company’s position relative to competitors and ability to gain market share in customer deposits. Significant commodity price declines in the second half of 2008, particularly for oil, negatively impacted our holdings in Canadian Oil Sands Trust and ConocoPhillips. However, energy sector holding Halliburton (sold by period-end) rose during the first half of the year due to strong commodity price gains and presented us with the opportunity for profit-taking. In addition, some health care holdings contributed to the Fund’s performance including Johnson & Johnson (sold by period-end) and Genentech (Morgan Stanley equity-linked security).
Within fixed income, investment-grade and noninvestment-grade corporate bonds suffered from severe spread widening due to the credit crisis and weakening economic conditions during the year. Following the collapse of investment bank Lehman Brothers, corporate bond prices fell sharply and investors sought the safety of U.S. Treasury securities causing their yields to fall to extremely low levels. Additionally, highly leveraged companies, including Charter Communications and R.H. Donnelly, hurt Fund performance as the credit crisis raised investors’ concerns regarding the companies’ ability to access capital markets. Although bond prices remained highly volatile throughout the second half of the year, our auto finance company holdings in General Motors Acceptance Corp. (GMAC) and Ford Motor Credit Co. benefited performance as government efforts to help alleviate the credit crunch improved these companies’ access to capital.
Thank you for your participation in Franklin Income Securities Fund. We look forward to serving your future investment needs.
The foregoing information reflects our analysis, opinions and portfolio holdings as of December 31, 2008, the end of the reporting period. The way we implement our main investment strategies and the resulting portfolio holdings may change depending on factors such as market and economic conditions. These opinions may not be relied upon as investment advice or an offer for a particular security. The information is not a complete analysis of every aspect of any market, country, industry, security or the Fund. Statements of fact are from sources considered reliable, but the investment manager makes no representation or warranty as to their completeness or accuracy. Although historical performance is no guarantee of future results, these insights may help you understand our investment management philosophy.
Top Five Equity Holdings
Franklin Income Securities Fund 12/31/08
| | |
Company
Sector/Industry | | % of Total
Net Assets |
| |
| Pfizer Inc. | | 2.5% |
| Health Care | | |
| |
| Bank of America Corp. | | 1.8% |
| Financials | | |
| |
| PG&E Corp. | | 1.6% |
| Utilities | | |
| |
| The Southern Co. | | 1.4% |
| Utilities | | |
| |
| Merck & Co. Inc. | | 1.4% |
| Health Care | | |
Top Five Fixed Income and Senior Floating Rate Interests Holdings*
Franklin Income Securities Fund 12/31/08
| | |
Issuer
Sector/Industry | | % of Total
Net Assets |
| |
| Ford Motor Credit Co. LLC | | 4.6% |
| Consumer Discretionary | | |
| |
| GMAC LLC | | 3.0% |
| Financials | | |
| |
| Tenet Healthcare Corp. | | 2.8% |
| Health Care | | |
| |
| Dynegy Holdings Inc. | | 2.0% |
| Utilities | | |
| |
| Texas Competitive Electric Holdings Co. LLC | | 2.0% |
| Utilities | | |
*Does not include convertible bonds.
The dollar value, number of shares or principal amount, and names of all portfolio holdings are listed in the Fund’s Statement of Investments.
FI-4
Fund Expenses
As an investor in a variable insurance contract (Contract) that indirectly provides for investment in an underlying mutual fund, you can incur transaction and/or ongoing expenses at both the Fund level and the Contract level.
| • | | Transaction expenses can include sales charges (loads) on purchases, redemption fees, surrender fees, transfer fees and premium taxes. |
| • | | Ongoing expenses can include management fees, distribution and service (12b-1) fees, contract fees, annual maintenance fees, mortality and expense risk fees and other fees and expenses. All mutual funds and Contracts have some types of ongoing expenses. |
The expenses shown in the table are meant to highlight ongoing expenses at the Fund level only and do not include ongoing expenses at the Contract level, or transaction expenses at either the Fund or Contract level. While the Fund does not have transaction expenses, if the transaction and ongoing expenses at the Contract level were included, the expenses shown would be higher. You should consult your Contract prospectus or disclosure document for more information.
The table shows Fund-level ongoing expenses and can help you understand these expenses and compare them with those of other mutual funds offered through the Contract. The table assumes a $1,000 investment held for the six months indicated. Please refer to the Fund prospectus for additional information on operating expenses.
Actual Fund Expenses
The first line (Actual) of the table provides actual account values and expenses. The “Ending Account Value” is derived from the Fund’s actual return, which includes the effect of ongoing Fund expenses, but does not include the effect of ongoing Contract expenses.
You can estimate the Fund-level expenses you incurred during the period by following these steps. Of course, your account value and expenses will differ from those in this illustration:
| 1. | Divide your account value by $1,000. |
If an account had an $8,600 value, then $8,600 ÷ $1,000 = 8.6.
| 2. | Multiply the result by the number under the heading “Fund-Level Expenses Incurred During Period.” |
If Fund-Level Expenses Incurred During Period were $7.50, then 8.6 x $7.50 = $64.50.
In this illustration, the estimated expenses incurred this period at the Fund level are $64.50.
Franklin Income Securities Fund – Class 1
FI-5
Hypothetical Example for Comparison with Other Mutual Funds
Information in the second line (Hypothetical) of the table can help you compare ongoing expenses of the Fund with those of other mutual funds offered through the Contract. This information may not be used to estimate the actual ending account balance or expenses you incurred during the period. The hypothetical “Ending Account Value” is based on the Fund’s actual expense ratio and an assumed 5% annual rate of return before expenses, which does not represent the Fund’s actual return. The figure under the heading “Fund-Level Expenses Incurred During Period” shows the hypothetical expenses your account would have incurred under this scenario. You can compare this figure with the 5% hypothetical examples that appear in shareholder reports of other funds offered through a Contract.
| | | | | | | | | |
| Class 1 | | Beginning
Account Value 7/1/08 | | Ending
Account
Value 12/31/08 | | Fund-Level
Expenses Incurred
During Period*
7/1/08–12/31/08 |
Actual | | $ | 1,000 | | $ | 739.90 | | $ | 2.10 |
Hypothetical (5% return before expenses) | | $ | 1,000 | | $ | 1,022.72 | | $ | 2.44 |
*Expenses are calculated using the most recent six-month annualized expense ratio for the Fund’s Class 1 shares (0.48%), which does not include any ongoing expenses of the Contract for which the Fund is an investment option, multiplied by the average account value over the period, multiplied by 184/366 to reflect the one-half year period.
FI-6
Franklin Templeton Variable Insurance Products Trust
Financial Highlights
Franklin Income Securities Fund
| | | | | | | | | | | | | | | | | | | | |
| | | Year Ended December 31, | |
| Class 1 | | 2008 | | | 2007 | | | 2006 | | | 2005 | | | 2004 | |
| | | | |
Per share operating performance | | | | | | | | | | | | | | | | | | | | |
(for a share outstanding throughout the year) | | | | | | | | | | | | | | | | | | | | |
Net asset value, beginning of year | | $ | 17.63 | | | $ | 17.65 | | | $ | 15.56 | | | $ | 15.89 | | | $ | 14.40 | |
| | | | |
Income from investment operationsa: | | | | | | | | | | | | | | | | | | | | |
Net investment incomeb | | | 1.10 | | | | 1.03 | | | | 0.94 | | | | 0.85 | | | | 0.83 | |
Net realized and unrealized gains (losses) | | | (5.99 | ) | | | (0.31 | ) | | | 1.85 | | | | (0.56 | ) | | | 1.14 | |
| | | | |
Total from investment operations | | | (4.89 | ) | | | 0.72 | | | | 2.79 | | | | 0.29 | | | | 1.97 | |
| | | | |
Less distributions from: | | | | | | | | | | | | | | | | | | | | |
Net investment income | | | (0.86 | ) | | | (0.63 | ) | | | (0.62 | ) | | | (0.57 | ) | | | (0.48 | ) |
Net realized gains | | | (0.35 | ) | | | (0.11 | ) | | | (0.08 | ) | | | (0.05 | ) | | | — | |
| | | | |
Total distributions | | | (1.21 | ) | | | (0.74 | ) | | | (0.70 | ) | | | (0.62 | ) | | | (0.48 | ) |
| | | | |
Net asset value, end of year | | $ | 11.53 | | | $ | 17.63 | | | $ | 17.65 | | | $ | 15.56 | | | $ | 15.89 | |
| | | | |
| | | | | |
Total returnc | | | (29.41)% | | | | 4.01% | | | | 18.47% | | | | 1.83% | | | | 14.13% | |
Ratios to average net assets | | | | | | | | | | | | | | | | | | | | |
Expensesd | | | 0.47% | | | | 0.47% | | | | 0.47% | | | | 0.48% | | | | 0.49% | |
Net investment income | | | 7.28% | | | | 5.77% | | | | 5.70% | | | | 5.44% | | | | 5.71% | |
| | | | | |
Supplemental data | | | | | | | | | | | | | | | | | | | | |
Net assets, end of year (000’s) | | $ | 433,370 | | | $ | 455,932 | | | $ | 458,613 | | | $ | 457,625 | | | $ | 530,742 | |
Portfolio turnover rate | | | 43.89% | | | | 32.11% | | | | 25.05% | | | | 34.76% | | | | 44.02% | |
aThe amount shown for a share outstanding throughout the period may not correlate with the Statement of Operations for the period due to the timing of sales and repurchases of the Fund shares in relation to income earned and/or fluctuating market value of the investments of the Fund.
bBased on average daily shares outstanding.
cTotal return does not include any fees, charges or expenses imposed by the variable annuity and life insurance contracts for which the Franklin Templeton Variable Insurance Products Trust serves as an underlying investment vehicle.
dBenefit of expense reduction rounds to less than 0.01%.
The accompanying notes are an integral part of these financial statements.
FI-7
Franklin Templeton Variable Insurance Products Trust
Financial Highlights (continued)
Franklin Income Securities Fund
| | | | | | | | | | | | | | | | | | | | |
| | | Year Ended December 31, | |
| Class 2 | | 2008 | | | 2007 | | | 2006 | | | 2005 | | | 2004 | |
| | | | |
Per share operating performance | | | | | | | | | | | | | | | | | | | | |
(for a share outstanding throughout the year) | | | | | | | | | | | | | | | | | | | | |
Net asset value, beginning of year | | $ | 17.31 | | | $ | 17.36 | | | $ | 15.32 | | | $ | 15.67 | | | $ | 14.23 | |
| | | | |
Income from investment operationsa: | | | | | | | | | | | | | | | | | | | | |
Net investment incomeb | | | 1.04 | | | | 0.97 | | | | 0.89 | | | | 0.80 | | | | 0.80 | |
Net realized and unrealized gains (losses) | | | (5.87 | ) | | | (0.30 | ) | | | 1.82 | | | | (0.55 | ) | | | 1.11 | |
| | | | |
Total from investment operations | | | (4.83 | ) | | | 0.67 | | | | 2.71 | | | | 0.25 | | | | 1.91 | |
| | | | |
Less distributions from: | | | | | | | | | | | | | | | | | | | | |
Net investment income | | | (0.83 | ) | | | (0.61 | ) | | | (0.59 | ) | | | (0.55 | ) | | | (0.47 | ) |
Net realized gains | | | (0.35 | ) | | | (0.11 | ) | | | (0.08 | ) | | | (0.05 | ) | | | — | |
| | | | |
Total distributions | | | (1.18 | ) | | | (0.72 | ) | | | (0.67 | ) | | | (0.60 | ) | | | (0.47 | ) |
| | | | |
Net asset value, end of year | | $ | 11.30 | | | $ | 17.31 | | | $ | 17.36 | | | $ | 15.32 | | | $ | 15.67 | |
| | | | |
| | | | | |
Total returnc | | | (29.66)% | | | | 3.76% | | | | 18.24% | | | | 1.60% | | | | 13.85% | |
Ratios to average net assets | | | | | | | | | | | | | | | | | | | | |
Expensesd | | | 0.72% | | | | 0.72% | | | | 0.72% | | | | 0.73% | | | | 0.74% | |
Net investment income | | | 7.03% | | | | 5.52% | | | | 5.45% | | | | 5.19% | | | | 5.46% | |
| | | | | |
Supplemental data | | | | | | | | | | | | | | | | | | | | |
Net assets, end of year (000’s) | | $ | 4,944,457 | | | $ | 7,429,064 | | | $ | 5,109,373 | | | $ | 2,865,361 | | | $ | 1,631,184 | |
Portfolio turnover rate | | | 43.89% | | | | 32.11% | | | | 25.05% | | | | 34.76% | | | | 44.02% | |
aThe amount shown for a share outstanding throughout the period may not correlate with the Statement of Operations for the period due to the timing of sales and repurchases of the Fund shares in relation to income earned and/or fluctuating market value of the investments of the Fund.
bBased on average daily shares outstanding.
cTotal return does not include any fees, charges or expenses imposed by the variable annuity and life insurance contracts for which the Franklin Templeton Variable Insurance Products Trust serves as an underlying investment vehicle.
dBenefit of expense reduction rounds to less than 0.01%.
The accompanying notes are an integral part of these financial statements.
FI-8
Franklin Templeton Variable Insurance Products Trust
Financial Highlights (continued)
Franklin Income Securities Fund
| | | | |
| Class 4 | | Period Ended
December 31,
2008a | |
Per share operating performance | | | | |
(for a share outstanding throughout the period) | | | | |
Net asset value, beginning of period | | $ | 16.90 | |
| | | | |
Income from investment operationsb: | | | | |
Net investment incomec | | | 0.87 | |
Net realized and unrealized gains (losses) | | | (5.07 | ) |
| | | | |
Total from investment operations | | | (4.20 | ) |
| | | | |
Less distributions from: | | | | |
Net investment income | | | (0.86 | ) |
Net realized gains | | | (0.35 | ) |
| | | | |
Total distributions | | | (1.21 | ) |
| | | | |
Net asset value, end of period | | $ | 11.49 | |
| | | | |
| |
Total returnd | | | (26.61)% | |
Ratios to average net assetse | | | | |
Expensesf | | | 0.82% | |
Net investment income | | | 6.93% | |
| |
Supplemental data | | | | |
Net assets, end of period (000’s) | | $ | 135,360 | |
Portfolio turnover rate | | | 43.89% | |
aFor the period February 29, 2008 (effective date) to December 31, 2008.
bThe amount shown for a share outstanding throughout the period may not correlate with the Statement of Operations for the period due to the timing of sales and repurchases of the Fund shares in relation to income earned and/or fluctuating market value of the investments of the Fund.
cBased on average daily shares outstanding.
dTotal return does not include any fees, charges or expenses imposed by the variable annuity and life insurance contracts for which the Franklin Templeton Variable Insurance Products Trust serves as an underlying investment vehicle. Total return is not annualized for periods less than one year.
eRatios are annualized for periods less than one year.
fBenefit of expense reduction rounds to less than 0.01%.
The accompanying notes are an integral part of these financial statements.
FI-9
Franklin Templeton Variable Insurance Products Trust
Statement of Investments, December 31, 2008
| | | | | | | |
| Franklin Income Securities Fund | | Country | | Shares | | Value |
Common Stocks 28.2% | | | | | | | |
Consumer Discretionary 0.3% | | | | | | | |
Comcast Corp. | | United States | | 823,600 | | $ | 13,902,368 |
| | | | | | | |
Energy 1.2% | | | | | | | |
ConocoPhillips | | United States | | 762,600 | | | 39,502,680 |
Spectra Energy Corp. | | United States | | 1,750,000 | | | 27,545,000 |
| | | | | | | |
| | | | | | | 67,047,680 |
| | | | | | | |
Financials 4.7% | | | | | | | |
Bank of America Corp. | | United States | | 7,100,000 | | | 99,968,000 |
Barclays PLC | | United Kingdom | | 2,000,000 | | | 4,480,967 |
Canadian Oil Sands Trust | | Canada | | 2,028,000 | | | 35,166,667 |
Duke Realty Corp. | | United States | | 500,000 | | | 5,480,000 |
HSBC Holdings PLC | | United Kingdom | | 3,500,000 | | | 33,840,942 |
iStar Financial Inc. | | United States | | 968,800 | | | 2,160,424 |
JPMorgan Chase & Co. | | United States | | 425,711 | | | 13,422,668 |
Wells Fargo & Co. | | United States | | 2,247,400 | | | 66,253,352 |
| | | | | | | |
| | | | | | | 260,773,020 |
| | | | | | | |
Health Care 3.9% | | | | | | | |
Merck & Co. Inc. | | United States | | 2,500,000 | | | 76,000,000 |
Pfizer Inc. | | United States | | 7,700,000 | | | 136,367,000 |
| | | | | | | |
| | | | | | | 212,367,000 |
| | | | | | | |
Information Technology 1.6% | | | | | | | |
Intel Corp. | | United States | | 4,000,000 | | | 58,640,000 |
Maxim Integrated Products Inc. | | United States | | 2,500,000 | | | 28,550,000 |
| | | | | | | |
| | | | | | | 87,190,000 |
| | | | | | | |
Materials 0.1% | | | | | | | |
AngloGold Ashanti Ltd., ADR | | South Africa | | 128,177 | | | 3,551,785 |
Barrick Gold Corp. | | Canada | | 62,200 | | | 2,287,094 |
| | | | | | | |
| | | | | | | 5,838,879 |
| | | | | | | |
Telecommunication Services 1.5% | | | | | | | |
AT&T Inc. | | United States | | 2,000,000 | | | 57,000,000 |
Verizon Communications Inc. | | United States | | 400,000 | | | 13,560,000 |
Vodafone Group PLC | | United Kingdom | | 5,000,000 | | | 10,150,822 |
| | | | | | | |
| | | | | | | 80,710,822 |
| | | | | | | |
Utilities 14.9% | | | | | | | |
AGL Resources Inc. | | United States | | 550,000 | | | 17,242,500 |
Ameren Corp. | | United States | | 1,600,000 | | | 53,216,000 |
American Electric Power Co. Inc. | | United States | | 750,000 | | | 24,960,000 |
CenterPoint Energy Inc. | | United States | | 300,000 | | | 3,786,000 |
Consolidated Edison Inc. | | United States | | 1,500,000 | | | 58,395,000 |
Constellation Energy Group | | United States | | 171,200 | | | 4,295,408 |
Dominion Resources Inc. | | United States | | 1,600,000 | | | 57,344,000 |
DTE Energy Co. | | United States | | 260,500 | | | 9,292,035 |
Duke Energy Corp. | | United States | | 5,000,000 | | | 75,050,000 |
FirstEnergy Corp. | | United States | | 750,000 | | | 36,435,000 |
FPL Group Inc. | | United States | | 800,000 | | | 40,264,000 |
NiSource Inc. | | United States | | 600,000 | | | 6,582,000 |
PG&E Corp. | | United States | | 2,300,000 | | | 89,033,000 |
Pinnacle West Capital Corp. | | United States | | 300,000 | | | 9,639,000 |
Portland General Electric Co. | | United States | | 1,250,000 | | | 24,337,500 |
FI-10
Franklin Templeton Variable Insurance Products Trust
Statement of Investments, December 31, 2008 (continued)
| | | | | | | |
| Franklin Income Securities Fund | | Country | | Shares | | Value |
Common Stocks (continued) | | | | | | | |
Utilities (continued) | | | | | | | |
Progress Energy Inc. | | United States | | 550,000 | | $ | 21,917,500 |
Public Service Enterprise Group Inc. | | United States | | 2,500,000 | | | 72,925,000 |
Puget Energy Inc. | | United States | | 1,261,200 | | | 34,392,924 |
Sempra Energy | | United States | | 875,900 | | | 37,339,617 |
The Southern Co. | | United States | | 2,100,000 | | | 77,700,000 |
TECO Energy Inc. | | United States | | 1,400,000 | | | 17,290,000 |
Xcel Energy Inc. | | United States | | 2,670,464 | | | 49,537,107 |
| | | | | | | |
| | | | | | | 820,973,591 |
| | | | | | | |
Total Common Stocks (Cost $1,868,783,111) | | | | | | | 1,548,803,360 |
| | | | | | | |
Convertible Preferred Stocks 2.4% | | | | | | | |
Consumer Discretionary 0.1% | | | | | | | |
General Motors Corp., 6.25%, cvt. pfd., C | | United States | | 1,400,000 | | | 4,480,000 |
| | | | | | | |
Financials 1.9% | | | | | | | |
American International Group Inc., 8.50%, cvt. pfd. | | United States | | 500,000 | | | 4,250,000 |
Bank of America Corp., 7.25%, cvt. pfd., L | | United States | | 57,800 | | | 37,570,000 |
Citigroup Inc., 6.50%, cvt. pfd. | | United States | | 1,000,000 | | | 27,990,000 |
Fannie Mae, 5.375%, cvt. pfd. | | United States | | 600 | | | 900,000 |
Fannie Mae, 8.75%, cvt. pfd. | | United States | | 1,060,400 | | | 1,113,420 |
Felcor Lodging Trust Inc., 7.80%, cvt. pfd., A | | United States | | 400,000 | | | 2,700,000 |
Legg Mason Inc., 7.00%, cvt. pfd. | | United States | | 375,000 | | | 8,250,000 |
Wachovia Corp., 7.50%, cvt. pfd., L | | United States | | 30,000 | | | 22,500,000 |
Washington Mutual Inc., 7.75%, cvt. pfd., R | | United States | | 68,400 | | | 181,260 |
| | | | | | | |
| | | | | | | 105,454,680 |
| | | | | | | |
Health Care 0.3% | | | | | | | |
Schering-Plough Corp., 6.00%, cvt. pfd. | | United States | | 100,000 | | | 17,300,182 |
| | | | | | | |
Materials 0.1% | | | | | | | |
Freeport-McMoRan Copper & Gold Inc., 6.75%, cvt. pfd. | | United States | | 86,500 | | | 4,104,425 |
| | | | | | | |
Total Convertible Preferred Stocks (Cost $397,075,534) | | | | | | | 131,339,287 |
| | | | | | | |
Equity Linked Securities 2.3% | | | | | | | |
Consumer Discretionary 0.0%a | | | | | | | |
Retail Ventures Inc. into DSW Inc., 6.625% | | United States | | 49,330 | | | 1,188,853 |
| | | | | | | |
Energy 0.3% | | | | | | | |
bThe Goldman Sachs Group Inc. into XTO Energy Inc., 9.00%, 144A | | United States | | 525,000 | | | 17,415,095 |
| | | | | | | |
Health Care 1.3% | | | | | | | |
bMorgan Stanley into Genentech Inc., 5.26%, 144A | | United States | | 900,000 | | | 70,666,830 |
| | | | | | | |
Materials 0.7% | | | | | | | |
bThe Goldman Sachs Group Inc. into Barrick Gold Corp., 10.00%, 144A | | United States | | 1,058,800 | | | 38,452,112 |
| | | | | | | |
Total Equity Linked Securities (Cost $136,706,277) | | | | | | | 127,722,890 |
| | | | | | | |
Preferred Stocks 0.3% | | | | | | | |
Financials 0.3% | | | | | | | |
Fannie Mae, 6.75%, pfd. | | United States | | 500,000 | | | 325,000 |
Fannie Mae, 7.625%, pfd., R | | United States | | 800,000 | | | 536,000 |
Fannie Mae, 8.25%, pfd. | | United States | | 851,500 | | | 706,745 |
Freddie Mac, 8.375%, pfd., Z | | United States | | 1,549,200 | | | 604,188 |
bPreferred Blocker Inc., 9.00%, pfd., 144A | | United States | | 36,265 | | | 12,874,075 |
| | | | | | | |
Total Preferred Stocks (Cost $105,391,575) | | | | | | | 15,046,008 |
| | | | | | | |
FI-11
Franklin Templeton Variable Insurance Products Trust
Statement of Investments, December 31, 2008 (continued)
| | | | | | | |
| Franklin Income Securities Fund | | Country | | Principal
Amountc | | Value |
d,eSenior Floating Rate Interests 4.2% | | | | | | | |
Consumer Discretionary 1.2% | | | | | | | |
Clear Channel Communications Inc., Term Loan B, 4.121%, 11/13/15 | | United States | | 88,500,000 | | $ | 43,453,500 |
Idearc Inc., Term Loan A, 1.97%, 11/17/13 | | United States | | 8,000,000 | | | 2,697,144 |
Jarden Corp., Term Loan B-3, 3.959%, 1/24/12 | | United States | | 24,625,048 | | | 19,232,163 |
| | | | | | | |
| | | | | | | 65,382,807 |
| | | | | | | |
Health Care 0.3% | | | | | | | |
Bausch and Lomb Inc.,
fDelayed Draw Term Loan, 4.709%, 4/28/15 | | United States | | 1,056,000 | | | 724,114 |
Parent Term Loan B, 4.709%, 4/28/15 | | United States | | 6,969,600 | | | 4,779,152 |
HCA Inc.,
Term Loan A-1, 2.959%, 11/19/12 | | United States | | 9,889,841 | | | 8,394,002 |
Term Loan B-1, 3.709%, 11/18/13 | | United States | | 4,987,277 | | | 3,943,066 |
| | | | | | | |
| | | | | | | 17,840,334 |
| | | | | | | |
Industrials 0.8% | | | | | | | |
Allison Transmission Inc., Term Loan B, 4.19% - 5.00%, 8/07/14 | | United States | | 29,371,182 | | | 16,552,746 |
Ceva Group PLC,
Dollar Pre-Refunded L/C Commitment, 4.459%, 8/01/12 | | United States | | 2,105,263 | | | 1,147,369 |
EGL Term Loans, 5.029%, 8/01/12 | | United States | | 17,626,316 | | | 11,787,599 |
U.S. Investigations Services Inc., Term Loan B, 4.275%, 2/21/15 | | United States | | 19,749,373 | | | 14,367,669 |
| | | | | | | |
| | | | | | | 43,855,383 |
| | | | | | | |
Information Technology 0.9% | | | | | | | |
First Data Corp.,
Term Loan B-2, 3.211%, 9/24/14 | | United States | | 54,312,500 | | | 35,206,123 |
Term Loan B-3, 3.211%, 9/24/14 | | United States | | 22,744,674 | | | 14,727,176 |
| | | | | | | |
| | | | | | | 49,933,299 |
| | | | | | | |
Materials 0.1% | | | | | | | |
gBerry Plastics Holding Corp., Senior Unsecured Term Loan, PIK, 11.334%, 6/15/14 | | United States | | 31,570,966 | | | 5,682,774 |
| | | | | | | |
Utilities 0.9% | | | | | | | |
Texas Competitive Electric Holdings Co. LLC,
Term Loan B-2, 3.961% - 5.888%, 10/10/14 | | United States | | 47,549,621 | | | 33,185,689 |
Term Loan B-3, 3.961% - 5.368%, 10/10/14 | | United States | | 24,687,500 | | | 17,229,826 |
| | | | | | | |
| | | | | | | 50,415,515 |
| | | | | | | |
Total Senior Floating Rate Interests (Cost $360,625,181) | | | | | | | 233,110,112 |
| | | | | | | |
Corporate Bonds 48.1% | | | | | | | |
Consumer Discretionary 13.2% | | | | | | | |
Beazer Homes USA Inc., senior note, 8.125%, 6/15/16 | | United States | | 2,100,000 | | | 640,500 |
Cablevision Systems Corp., senior note, B, 8.00%, 4/15/12 | | United States | | 70,000,000 | | | 62,650,000 |
CCH I Holdings LLC, senior note,
13.50%, 1/15/14 | | United States | | 60,000,000 | | | 3,375,000 |
11.75%, 5/15/14 | | United States | | 63,000,000 | | | 3,543,750 |
CCH I LLC, senior secured note, 11.00%, 10/01/15 | | United States | | 113,000,000 | | | 20,340,000 |
CCH II LLC, senior note, 10.25%, 9/15/10 | | United States | | 50,000,000 | | | 23,250,000 |
CCO Holdings LLC, senior note, 8.75%, 11/15/13 | | United States | | 15,000,000 | | | 9,525,000 |
D.R. Horton Inc., 5.625%, 1/15/16 | | United States | | 900,000 | | | 580,500 |
Dex Media Inc.,
B, 8.00%, 11/15/13 | | United States | | 15,000,000 | | | 2,850,000 |
senior disc. note, 9.00%, 11/15/13 | | United States | | 29,500,000 | | | 5,605,000 |
Dex Media West Finance, senior sub. note, 9.875%, 8/15/13 | | United States | | 4,900,000 | | | 1,176,000 |
FI-12
Franklin Templeton Variable Insurance Products Trust
Statement of Investments, December 31, 2008 (continued)
| | | | | | | |
| Franklin Income Securities Fund | | Country | | Principal
Amountc | | Value |
Corporate Bonds (continued) | | | | | | | |
Consumer Discretionary (continued) | | | | | | | |
DIRECTV Holdings LLC, senior note, 7.625%, 5/15/16 | | United States | | 45,000,000 | | $ | 43,875,000 |
Dollar General Corp.,
senior note, 10.625%, 7/15/15 | | United States | | 75,000,000 | | | 72,000,000 |
gsenior sub. note, PIK, 11.875%, 7/15/17 | | United States | | 30,000,000 | | | 25,800,000 |
EchoStar DBS Corp., senior note,
6.375%, 10/01/11 | | United States | | 5,000,000 | | | 4,662,500 |
7.75%, 5/31/15 | | United States | | 25,000,000 | | | 21,375,000 |
7.125%, 2/01/16 | | United States | | 27,500,000 | | | 23,100,000 |
Ford Motor Co., 7.45%, 7/16/31 | | United States | | 50,000,000 | | | 14,000,000 |
Ford Motor Credit Co. LLC,
7.375%, 10/28/09 | | United States | | 152,000,000 | | | 133,513,456 |
7.875%, 6/15/10 | | United States | | 55,000,000 | | | 44,023,430 |
7.375%, 2/01/11 | | United States | | 50,000,000 | | | 38,039,700 |
senior note, 9.75%, 9/15/10 | | United States | | 19,500,000 | | | 15,605,421 |
senior note, 9.875%, 8/10/11 | | United States | | 22,000,000 | | | 16,238,222 |
senior note, 7.25%, 10/25/11 | | United States | | 10,000,000 | | | 7,309,310 |
General Motors Corp., senior deb., 8.25%, 7/15/23 | | United States | | 25,000,000 | | | 4,250,000 |
Host Hotels & Resorts LP, senior note,
6.875%, 11/01/14 | | United States | | 5,000,000 | | | 3,875,000 |
O, 6.375%, 3/15/15 | | United States | | 9,000,000 | | | 6,750,000 |
Q, 6.75%, 6/01/16 | | United States | | 27,000,000 | | | 19,845,000 |
K. Hovnanian Enterprises Inc., senior note, 7.50%, 5/15/16 | | United States | | 3,000,000 | | | 765,000 |
KB Home, senior note,
6.375%, 8/15/11 | | United States | | 5,000,000 | | | 3,875,000 |
5.75%, 2/01/14 | | United States | | 6,500,000 | | | 4,127,500 |
6.25%, 6/15/15 | | United States | | 9,500,000 | | | 5,842,500 |
7.25%, 6/15/18 | | United States | | 10,600,000 | | | 6,254,000 |
Liberty Media Corp., senior note, 5.70%, 5/15/13 | | United States | | 13,200,000 | | | 8,719,616 |
MGM MIRAGE,
senior note, 6.75%, 4/01/13 | | United States | | 10,000,000 | | | 6,750,000 |
bsenior secured note, 144A, 13.00%, 11/15/13 | | United States | | 15,000,000 | | | 14,362,500 |
R.H. Donnelley Corp.,
senior disc. note, A-1, 6.875%, 1/15/13 | | United States | | 30,000,000 | | | 4,200,000 |
senior disc. note, A-2, 6.875%, 1/15/13 | | United States | | 37,125,000 | | | 5,197,500 |
senior note, 6.875%, 1/15/13 | | United States | | 11,089,000 | | | 1,552,460 |
senior note, 8.875%, 10/15/17 | | United States | | 83,000,000 | | | 12,865,000 |
senior note, A-3, 8.875%, 1/15/16 | | United States | | 57,750,000 | | | 8,951,250 |
b,gUnivision Communications Inc., senior note, 144A, PIK, 9.75%, 3/15/15 | | United States | | 50,000,000 | | | 6,500,000 |
Visant Holding Corp., senior note, 8.75%, 12/01/13 | | United States | | 17,000,000 | | | 12,665,000 |
| | | | | | | |
| | | | | | | 730,425,115 |
| | | | | | | |
Consumer Staples 1.5% | | | | | | | |
Altria Group Inc., senior note,
8.50%, 11/10/13 | | United States | | 20,000,000 | | | 20,735,300 |
9.70%, 11/10/18 | | United States | | 47,000,000 | | | 50,880,696 |
Dole Food Co. Inc., senior note, 8.625%, 5/01/09 | | United States | | 14,500,000 | | | 13,195,000 |
| | | | | | | |
| | | | | | | 84,810,996 |
| | | | | | | |
Energy 4.8% | | | | | | | |
Callon Petroleum Co., senior note, 9.75%, 12/08/10 | | United States | | 17,500,000 | | | 7,087,500 |
Chesapeake Energy Corp., senior note,
7.625%, 7/15/13 | | United States | | 15,000,000 | | | 12,975,000 |
6.50%, 8/15/17 | | United States | | 21,000,000 | | | 16,170,000 |
FI-13
Franklin Templeton Variable Insurance Products Trust
Statement of Investments, December 31, 2008 (continued)
| | | | | | | |
| Franklin Income Securities Fund | | Country | | Principal
Amountc | | Value |
Corporate Bonds (continued) | | | | | | | |
Energy (continued) | | | | | | | |
Chesapeake Energy Corp., senior note (continued) | | | | | | | |
6.25%, 1/15/18 | | United States | | 20,000,000 | | $ | 14,900,000 |
7.25%, 12/15/18 | | United States | | 28,000,000 | | | 21,980,000 |
El Paso Corp., senior note,
12.00%, 12/12/13 | | United States | | 16,000,000 | | | 16,040,000 |
7.25%, 4/01/18 | | United States | | 9,000,000 | | | 7,188,048 |
MTN, 7.75%, 1/15/32 | | United States | | 22,000,000 | | | 14,390,662 |
Mariner Energy Inc., senior note, 7.50%, 4/15/13 | | United States | | 10,000,000 | | | 6,450,000 |
Newfield Exploration Co., senior sub. note, 6.625%, 4/15/16 | | United States | | 18,200,000 | | | 14,560,000 |
OPTI Canada Inc., senior note, 7.875%, 12/15/14 | | Canada | | 20,000,000 | | | 10,300,000 |
bPetrohawk Energy Corp., senior note, 144A, 7.875%, 6/01/15 | | United States | | 20,700,000 | | | 15,421,500 |
bPetroplus Finance Ltd., senior note, 144A, | | | | | | | |
6.75%, 5/01/14 | | Switzerland | | 3,000,000 | | | 1,920,000 |
7.00%, 5/01/17 | | Switzerland | | 19,000,000 | | | 11,685,000 |
Pioneer Natural Resources Co., senior bond, 6.875%, 5/01/18 | | United States | | 18,165,000 | | | 12,795,462 |
Plains Exploration & Production Co., senior note, 7.75%, 6/15/15 | | United States | | 15,000,000 | | | 11,400,000 |
Sabine Pass LNG LP, senior secured note,
7.25%, 11/30/13 | | United States | | 10,000,000 | | | 7,350,000 |
7.50%, 11/30/16 | | United States | | 40,000,000 | | | 29,000,000 |
Sesi LLC, senior note, 6.875%, 6/01/14 | | United States | | 18,500,000 | | | 14,337,500 |
bW&T Offshore Inc., senior note, 144A, 8.25%, 6/15/14 | | United States | | 37,000,000 | | | 20,165,000 |
| | | | | | | |
| | | | | | | 266,115,672 |
| | | | | | | |
Financials 8.1% | | | | | | | |
American Express Co., senior note, 7.00%, 3/19/18 | | United States | | 10,000,000 | | | 10,128,460 |
American Express Credit Corp., senior note, C, 7.30%, 8/20/13 | | United States | | 55,000,000 | | | 56,352,285 |
b,dAmerican International Group Inc., junior sub. deb., 144A, FRN, 8.175%, 5/15/58 | | United States | | 54,000,000 | | | 21,032,784 |
hBank of America Corp., pfd., sub. bond, M, 8.125%, Perpetual | | United States | | 5,000,000 | | | 3,746,250 |
GMAC LLC,
5.625%, 5/15/09 | | United States | | 15,000,000 | | | 14,415,720 |
b7.75%, 1/19/10, senior note, 144A | | United States | | 65,240,000 | | | 58,704,257 |
b7.25%, 3/02/11, senior note, 144A | | United States | | 7,915,000 | | | 6,805,317 |
b6.875%, 9/15/11, senior note, 144A | | United States | | 75,985,000 | | | 62,287,184 |
b6.875%, 8/28/12, senior note, 144A | | United States | | 11,081,000 | | | 8,511,981 |
b6.75%, 12/01/14, senior note, 144A | | United States | | 18,420,000 | | | 12,668,908 |
iStar Financial Inc.,
8.625%, 6/01/13 | | United States | | 46,500,000 | | | 14,424,160 |
senior note, 5.15%, 3/01/12 | | United States | | 20,000,000 | | | 6,303,460 |
senior note, 5.95%, 10/15/13 | | United States | | 10,000,000 | | | 3,152,440 |
hJPMorgan Chase & Co., junior sub. note, 1, 7.90%, Perpetual | | United States | | 75,568,000 | | | 63,025,677 |
iLehman Brothers Holdings Inc., senior note, | | | | | | | |
6.20%, 9/26/14 | | United States | | 55,000,000 | | | 5,500,000 |
6.875%, 5/02/18 | | United States | | 17,000,000 | | | 1,700,000 |
7.00%, 9/27/27 | | United States | | 17,000,000 | | | 1,700,000 |
b,dLiberty Mutual Group, junior sub. note, 144A, FRN, 10.75%, 6/15/88 | | United States | | 25,000,000 | | | 13,767,750 |
Merrill Lynch & Co. Inc., 6.875%, 4/25/18 | | United States | | 5,000,000 | | | 5,239,125 |
Morgan Stanley Dean Witter & Co., 5.30%, 3/01/13 | | United States | | 35,000,000 | | | 31,769,885 |
hWells Fargo Capital XIII, pfd., 7.70%, Perpetual | | United States | | 5,600,000 | | | 4,625,667 |
hWells Fargo Capital XV, pfd., 9.75%, Perpetual | | United States | | 40,000,000 | | | 40,437,680 |
| | | | | | | |
| | | | | | | 446,298,990 |
| | | | | | | |
FI-14
Franklin Templeton Variable Insurance Products Trust
Statement of Investments, December 31, 2008 (continued)
| | | | | | | |
| Franklin Income Securities Fund | | Country | | Principal
Amountc | | Value |
Corporate Bonds (continued) | | | | | | | |
Health Care 5.4% | | | | | | | |
Community Health Systems Inc., senior sub. note, 8.875%, 7/15/15 | | United States | | 55,000,000 | | $ | 50,875,000 |
DaVita Inc.,
senior note, 6.625%, 3/15/13 | | United States | | 23,825,000 | | | 22,752,875 |
senior sub. note, 7.25%, 3/15/15 | | United States | | 19,500,000 | | | 18,622,500 |
HCA Inc.,
6.375%, 1/15/15 | | United States | | 5,000,000 | | | 3,075,000 |
senior note, 6.50%, 2/15/16 | | United States | | 20,000,000 | | | 12,400,000 |
senior secured note, 9.25%, 11/15/16 | | United States | | 17,000,000 | | | 15,640,000 |
Tenet Healthcare Corp., senior note,
6.375%, 12/01/11 | | United States | | 85,000,000 | | | 66,087,500 |
6.50%, 6/01/12 | | United States | | 17,500,000 | | | 13,387,500 |
7.375%, 2/01/13 | | United States | | 45,000,000 | | | 32,287,500 |
dFRN, 9.25%, 2/01/15 | | United States | | 53,500,000 | | | 43,335,000 |
d,gU.S. Oncology Holdings Inc., senior note, PIK, FRN, 8.334%, 3/15/12 | | United States | | 21,494,215 | | | 13,756,298 |
Vanguard Health Holding Co. I LLC, senior disc. note, zero cpn. to
10/01/09, 11.25% thereafter, 10/01/15 | | United States | | 7,200,000 | | | 5,688,000 |
| | | | | | | |
| | | | | | | 297,907,173 |
| | | | | | | |
Industrials 4.8% | | | | | | | |
Allied Waste North America Inc.,
senior note, B, 7.375%, 4/15/14 | | United States | | 22,500,000 | | | 21,285,225 |
senior note, B, 7.125%, 5/15/16 | | United States | | 20,000,000 | | | 18,225,240 |
senior secured note, 6.125%, 2/15/14 | | United States | | 22,445,000 | | | 20,334,407 |
senior secured note, B, 5.75%, 2/15/11 | | United States | | 15,000,000 | | | 14,069,280 |
Browning-Ferris Industries Inc., 7.40%, 9/15/35 | | United States | | 4,500,000 | | | 3,721,896 |
bCeva Group PLC, senior note, 144A, 10.00%, 9/01/14 | | United Kingdom | | 25,000,000 | | | 18,656,250 |
Hertz Corp.,
senior note, 8.875%, 1/01/14 | | United States | | 48,000,000 | | | 29,760,000 |
senior sub. note, 10.50%, 1/01/16 | | United States | | 2,500,000 | | | 1,153,125 |
JohnsonDiversey Holdings Inc., senior disc. note, 10.67%, 5/15/13 | | United States | | 20,000,000 | | | 14,100,000 |
JohnsonDiversey Inc., senior sub. note, B, 9.625%, 5/15/12 | | United States | | 23,000,000 | | | 18,975,000 |
Nalco Finance Holdings, senior note, zero cpn. to 8/01/09, 9.00% thereafter, 2/01/14 | | United States | | 36,829,000 | | | 26,701,025 |
Nortek Inc., senior note, 10.00%, 12/01/13 | | United States | | 16,000,000 | | | 10,960,000 |
RBS Global & Rexnord Corp.,
senior note, 9.50%, 8/01/14 | | United States | | 13,000,000 | | | 9,750,000 |
senior sub. note, 11.75%, 8/01/16 | | United States | | 13,500,000 | | | 7,728,750 |
b,d,gRexnord Holdings Inc., senior note, 144A, PIK, FRN, 9.81%, 3/01/13 | | United States | | 23,792,096 | | | 9,992,680 |
Terex Corp., senior sub. note, 8.00%, 11/15/17 | | United States | | 45,000,000 | | | 38,475,000 |
| | | | | | | |
| | | | | | | 263,887,878 |
| | | | | | | |
Information Technology 3.2% | | | | | | | |
bCeridian Corp., senior note, 144A, 11.25%, 11/15/15 | | United States | | 27,000,000 | | | 14,411,250 |
First Data Corp., senior note, 9.875%, 9/24/15 | | United States | | 43,000,000 | | | 26,230,000 |
Fiserv Inc., senior note, 6.80%, 11/20/17 | | United States | | 7,000,000 | | | 6,210,169 |
Flextronics International Ltd., senior sub. note, 6.25%, 11/15/14 | | Singapore | | 17,500,000 | | | 13,125,000 |
Freescale Semiconductor Inc., senior note,
8.875%, 12/15/14 | | United States | | 72,000,000 | | | 32,040,000 |
10.125%, 12/15/16 | | United States | | 85,000,000 | | | 35,275,000 |
Lucent Technologies Inc., 6.45%, 3/15/29 | | United States | | 4,100,000 | | | 1,660,500 |
bNortel Networks Ltd., senior note, 144A, 10.75%, 7/15/16 | | Canada | | 16,800,000 | | | 3,688,188 |
NXP BV/NXP Funding LLC, senior note, 9.50%, 10/15/15 | | Netherlands | | 14,400,000 | | | 2,772,000 |
Qwest Capital Funding Inc., 7.25%, 2/15/11 | | United States | | 2,700,000 | | | 2,281,500 |
Sanmina-SCI Corp., senior sub. note,
6.75%, 3/01/13 | | United States | | 22,000,000 | | | 9,570,000 |
8.125%, 3/01/16 | | United States | | 18,100,000 | | | 7,149,500 |
FI-15
Franklin Templeton Variable Insurance Products Trust
Statement of Investments, December 31, 2008 (continued)
| | | | | | | | |
| Franklin Income Securities Fund | | Country | | Principal
Amountc | | | Value |
Corporate Bonds (continued) | | | | | | | | |
Information Technology (continued) | | | | | | | | |
SunGard Data Systems Inc.,
senior note, 9.125%, 8/15/13 | | United States | | 9,000,000 | | | $ | 7,830,000 |
bsenior note, 144A, 10.625%, 5/15/15 | | United States | | 7,500,000 | | | | 6,450,000 |
senior sub. note, 10.25%, 8/15/15 | | United States | | 14,500,000 | | | | 9,642,500 |
| | | | | | | | |
| | | | | | | | 178,335,607 |
| | | | | | | | |
Materials 1.0% | | | | | | | | |
Berry Plastics Holding Corp., senior secured note, 8.875%, 9/15/14 | | United States | | 15,000,000 | | | | 6,600,000 |
Freeport-McMoRan Copper & Gold Inc.,
senior note, 8.25%, 4/01/15 | | United States | | 5,000,000 | | | | 4,310,938 |
senior note, 8.375%, 4/01/17 | | United States | | 15,000,000 | | | | 12,317,040 |
senior secured note, 6.875%, 2/01/14 | | United States | | 4,000,000 | | | | 3,603,720 |
bIneos Group Holdings PLC, senior sub. note, 144A, 7.875%, 2/15/16 | | United Kingdom | | 25,000,000 | EUR | | | 4,544,475 |
Jefferson Smurfit Corp., senior note, 8.25%, 10/01/12 | | United States | | 10,500,000 | | | | 1,837,500 |
Novelis Inc., senior note, 7.25%, 2/15/15 | | Canada | | 33,800,000 | | | | 19,773,000 |
Stone Container Corp., senior note, 8.00%, 3/15/17 | | United States | | 9,000,000 | | | | 1,755,000 |
| | | | | | | | |
| | | | | | | | 54,741,673 |
| | | | | | | | |
Telecommunication Services 0.2% | | | | | | | | |
bDigicel Group Ltd., senior note, 144A, 8.875%, 1/15/15 | | Jamaica | | 20,000,000 | | | | 13,100,000 |
| | | | | | | | |
Utilities 5.9% | | | | | | | | |
Dominion Resources Inc., senior note, 8.875%, 1/15/19 | | United States | | 12,500,000 | | | | 13,493,550 |
Dynegy Holdings Inc., senior note,
6.875%, 4/01/11 | | United States | | 30,000,000 | | | | 26,400,000 |
8.75%, 2/15/12 | | United States | | 50,985,000 | | | | 45,121,725 |
8.375%, 5/01/16 | | United States | | 55,000,000 | | | | 39,325,000 |
7.75%, 6/01/19 | | United States | | 3,000,000 | | | | 2,085,000 |
Energy Future Holdings Corp., senior note,
b144A, 10.875%, 11/01/17 | | United States | | 37,500,000 | | | | 26,812,500 |
b,g144A, PIK, 11.25%, 11/01/17 | | United States | | 48,800,000 | | | | 23,912,000 |
P, 5.55%, 11/15/14 | | United States | | 24,000,000 | | | | 11,333,472 |
bIllinois Power Co., senior note, 144A, 9.75%, 11/15/18 | | United States | | 10,000,000 | | | | 10,943,710 |
bIntergen NV, senior secured note, 144A, 9.00%, 6/30/17 | | Netherlands | | 7,500,000 | | | | 6,187,500 |
PNM Resources Inc., senior note, 9.25%, 5/15/15 | | United States | | 6,000,000 | | | | 4,800,000 |
Public Service Co. of New Mexico, senior note, 7.95%, 5/15/18 | | United States | | 14,500,000 | | | | 11,817,558 |
Reliant Energy Inc., senior note,
7.625%, 6/15/14 | | United States | | 19,500,000 | | | | 16,282,500 |
7.875%, 6/15/17 | | United States | | 17,500,000 | | | | 14,262,500 |
Sempra Energy, senior note, 8.90%, 11/15/13 | | United States | | 10,000,000 | | | | 10,106,570 |
bTexas Competitive Electric Holdings Co. LLC, senior note, 144A, | | | | | | | | |
10.25%, 11/01/15 | | United States | | 63,900,000 | | | | 45,688,500 |
gPIK, 10.50%, 11/01/16 | | United States | | 30,000,000 | | | | 15,150,000 |
| | | | | | | | |
| | | | | | | | 323,722,085 |
| | | | | | | | |
Total Corporate Bonds (Cost $3,856,106,006) | | | | | | | | 2,659,345,189 |
| | | | | | | | |
Convertible Bonds 1.7% | | | | | | | | |
Consumer Discretionary 0.1% | | | | | | | | |
bHost Marriott LP, cvt., senior deb., 144A, 3.25%, 3/15/24 | | United States | | 8,000,000 | | | | 6,940,000 |
| | | | | | | | |
FI-16
Franklin Templeton Variable Insurance Products Trust
Statement of Investments, December 31, 2008 (continued)
| | | | | | | |
| Franklin Income Securities Fund | | Country | | Principal
Amountc | | Value |
Convertible Bonds (continued) | | | | | | | |
Financials 0.9% | | | | | | | |
bDuke Realty LP, cvt., senior note, 144A, 3.75%, 12/01/11 | | United States | | 25,000,000 | | $ | 14,375,000 |
diStar Financial Inc., cvt., senior note, FRN, 4.382%, 10/01/12 | | United States | | 40,000,000 | | | 11,399,880 |
Vornado Realty Trust, cvt., senior bond,
3.625%, 11/15/26 | | United States | | 12,000,000 | | | 9,570,000 |
2.85%, 4/01/27 | | United States | | 15,000,000 | | | 11,137,500 |
| | | | | | | |
| | | | | | | 46,482,380 |
| | | | | | | |
Health Care 0.4% | | | | | | | |
bMylan Inc., 144A, cvt., 3.75%, 9/15/15 | | United States | | 24,000,000 | | | 21,840,000 |
| | | | | | | |
Information Technology 0.3% | | | | | | | |
bAdvanced Micro Devices Inc., cvt., senior note, 144A, 5.75%, 8/15/12 | | United States | | 50,000,000 | | | 17,437,500 |
| | | | | | | |
Total Convertible Bonds (Cost $148,812,356) | | | | | | | 92,699,880 |
| | | | | | | |
Total Investments before Short Term Investments (Cost $6,873,500,040) | | | | | | | 4,808,066,726 |
| | | | | | | |
Short Term Investments (Cost $569,630,514) 10.3% | | | | | | | |
Repurchase Agreements 10.3% | | | | | | | |
jJoint Repurchase Agreement, 0.019%, 01/02/09 (Maturity Value $569,631,129) | | United States | | 569,630,514 | | | 569,630,514 |
Banc of America Securities LLC (Maturity Value $87,916,869) | | | | | | | |
Barclays Capital Inc. (Maturity Value $83,735,776) | | | | | | | |
BNP Paribas Securities Corp. (Maturity Value $111,647,701) | | | | | | | |
Credit Suisse Securities (USA) LLC (Maturity Value $111,647,701) | | | | | | | |
Deutsche Bank Securities Inc. (Maturity Value $64,430,977) | | | | | | | |
HSBC Securities (USA) Inc. (Maturity Value $83,735,776) | | | | | | | |
UBS Securities LLC (Maturity Value $26,516,329) | | | | | | | |
Collateralized by U.S. Government Agency Securities, 3.50% - 7.00%, 6/15/09 - 5/20/22; kU.S. Government Agency Discount Notes, 1/05/09 - 10/19/09; kU.S. Treasury Bills, 1/15/09; and U.S. Treasury Notes, 0.875% - 4.625%, 7/15/09 - 2/28/11 | | | | | | | |
| | | | | | | |
Total Investments (Cost $7,443,130,554) 97.5% | | | | | | | 5,377,697,240 |
Other Assets, less Liabilities 2.5% | | | | | | | 135,489,221 |
| | | | | | | |
Net Assets 100.0% | | | | | | $ | 5,513,186,461 |
| | | | | | | |
See Abbreviations on page FI-29.
aRounds to less than 0.1% of net assets.
bSecurity was purchased pursuant to Rule 144A under the Securities Act of 1933 and may be sold in transactions exempt from registration only to qualified institutional buyers or in a public offering registered under the Securities Act of 1933. These securities have been deemed liquid under guidelines approved by the Trust’s Board of Trustees. At December 31, 2008, the aggregate value of these securities was $653,369,846, representing 11.85% of net assets.
cThe principal amount is stated in U.S. dollars unless otherwise indicated.
dThe coupon rate shown represents the rate at period end.
eSee Note 1(e) regarding senior floating rate interests.
fSee Note 8 regarding unfunded loan commitments.
gIncome may be received in additional securities and/or cash.
hPerpetual security with no stated maturity date.
iSee Note 7 regarding defaulted securities.
jSee Note 1(c) regarding joint repurchase agreement.
kThe security is traded on a discount basis with no stated coupon rate.
The accompanying notes are an integral part of these financial statements.
FI-17
Franklin Templeton Variable Insurance Products Trust
Financial Statements
Statement of Assets and Liabilities
December 31, 2008
| | | | |
| | | Franklin
Income
Securities Fund | |
Assets: | | | | |
Investments in securities: | | | | |
Cost - Unaffiliated issuers | | $ | 6,873,500,040 | |
Cost - Repurchase agreements | | | 569,630,514 | |
| | | | |
Total cost of investments | | $ | 7,443,130,554 | |
| | | | |
Value - Unaffiliated issuers | | $ | 4,808,066,726 | |
Value - Repurchase agreements | | | 569,630,514 | |
| | | | |
Total value of investments | | | 5,377,697,240 | |
Cash | | | 52,988,283 | |
Receivables: | | | | |
Investment securities sold | | | 9,414,957 | |
Capital shares sold | | | 3,241,108 | |
Dividends and interest | | | 88,484,061 | |
| | | | |
Total assets | | | 5,531,825,649 | |
| | | | |
Liabilities: | | | | |
Payables: | | | | |
Investment securities purchased | | | 10,952,985 | |
Capital shares redeemed | | | 2,744,951 | |
Affiliates | | | 4,017,841 | |
Unrealized depreciation on unfunded loan commitments (Note 8) | | | 219,668 | |
Accrued expenses and other liabilities | | | 703,743 | |
| | | | |
Total liabilities | | | 18,639,188 | |
| | | | |
Net assets, at value | | $ | 5,513,186,461 | |
| | | | |
Net assets consist of: | | | | |
Paid-in capital | | $ | 7,756,754,196 | |
Undistributed net investment income | | | 497,923,282 | |
Net unrealized appreciation (depreciation) | | | (2,065,636,876 | ) |
Accumulated net realized gain (loss) | | | (675,854,141 | ) |
| | | | |
Net assets, at value | | $ | 5,513,186,461 | |
| | | | |
The accompanying notes are an integral part of these financial statements.
FI-18
Franklin Templeton Variable Insurance Products Trust
Financial Statements (continued)
Statement of Assets and Liabilities (continued)
December 31, 2008
| | | |
| | | Franklin
Income
Securities Fund |
Class 1: | | | |
Net assets, at value | | $ | 433,369,623 |
| | | |
Shares outstanding | | | 37,595,666 |
| | | |
Net asset value and maximum offering price per share | | $ | 11.53 |
| | | |
Class 2: | | | |
Net assets, at value | | $ | 4,944,457,130 |
| | | |
Shares outstanding | | | 437,755,357 |
| | | |
Net asset value and maximum offering price per share | | $ | 11.30 |
| | | |
Class 4: | | | |
Net assets, at value | | $ | 135,359,708 |
| | | |
Shares outstanding | | | 11,780,873 |
| | | |
Net asset value and maximum offering price per share | | $ | 11.49 |
| | | |
The accompanying notes are an integral part of these financial statements.
FI-19
Franklin Templeton Variable Insurance Products Trust
Financial Statements (continued)
Statement of Operations
for the year ended December 31, 2008
| | | | |
| | | Franklin
Income
Securities Fund | |
Investment income: | | | | |
Dividends | | $ | 160,384,712 | |
Interest | | | 387,334,875 | |
| | | | |
Total investment income | | | 547,719,587 | |
| | | | |
Expenses: | | | | |
Management fees (Note 3a) | | | 32,041,135 | |
Distribution fees: (Note 3c) | | | | |
Class 2 | | | 16,401,860 | |
Class 4 | | | 149,065 | |
Unaffiliated transfer agent fees | | | 3,790 | |
Custodian fees (Note 4) | | | 160,271 | |
Reports to shareholders | | | 758,012 | |
Registration and filing fees | | | 84,346 | |
Professional fees | | | 142,338 | |
Trustees’ fees and expenses | | | 35,485 | |
Other | | | 224,004 | |
| | | | |
Total expenses | | | 50,000,306 | |
Expense reductions (Note 4) | | | (56,094 | ) |
| | | | |
Net expenses | | | 49,944,212 | |
| | | | |
Net investment income | | | 497,775,375 | |
| | | | |
Realized and unrealized gains (losses): | | | | |
Net realized gain (loss) from: | | | | |
Investments | | | (632,210,794 | ) |
Foreign currency transactions | | | (86,389 | ) |
Net increase from payments by affiliates (Note 9) | | | 1,317,686 | |
| | | | |
Net realized gain (loss) | | | (630,979,497 | ) |
| | | | |
Net change in unrealized appreciation (depreciation) on: | | | | |
Investments | | | (2,290,776,232 | ) |
Translation of other assets and liabilities denominated in foreign currencies | | | 18,276 | |
| | | | |
Net change in unrealized appreciation (depreciation) | | | (2,290,757,956 | ) |
| | | | |
Net realized and unrealized gain (loss) | | | (2,921,737,453 | ) |
| | | | |
Net increase (decrease) in net assets resulting from operations | | $ | (2,423,962,078 | ) |
| | | | |
The accompanying notes are an integral part of these financial statements.
FI-20
Franklin Templeton Variable Insurance Products Trust
Financial Statements (continued)
Statements of Changes in Net Assets
| | | | | | | | |
| | | Franklin Income
Securities Fund | |
| | | Year Ended December 31, | |
| | | 2008 | | | 2007 | |
| | | | |
Increase (decrease) in net assets: | | | | | | | | |
Operations: | | | | | | | | |
Net investment income | | $ | 497,775,375 | | | $ | 386,032,224 | |
Net realized gain (loss) from investments, foreign currency transactions and net increase from payments by affiliate | | | (630,979,497 | ) | | | 122,213,920 | |
Net change in unrealized appreciation (depreciation) on investments and translation of other assets and liabilities denominated in foreign currencies | | | (2,290,757,956 | ) | | | (307,217,312 | ) |
| | | | |
Net increase (decrease) in net assets resulting from operations | | | (2,423,962,078 | ) | | | 201,028,832 | |
| | | | |
Distributions to shareholders from: | | | | | | | | |
Net investment income: | | | | | | | | |
Class 1 | | | (24,795,329 | ) | | | (15,402,825 | ) |
Class 2 | | | (360,749,953 | ) | | | (219,687,222 | ) |
Class 4 | | | (836,031 | ) | | | — | |
Net realized gains: | | | | | | | | |
Class 1 | | | (9,933,051 | ) | | | (2,738,874 | ) |
Class 2 | | | (151,054,226 | ) | | | (40,741,730 | ) |
Class 4 | | | (334,915 | ) | | | — | |
| | | | |
Total distributions to shareholders | | | (547,703,505 | ) | | | (278,570,651 | ) |
| | | | |
Capital share transactions: (Note 2) | | | | | | | | |
Class 1 | | | 177,883,831 | | | | (2,880,965 | ) |
Class 2 | | | 262,081,415 | | | | 2,397,434,200 | |
Class 4 | | | 159,890,193 | | | | — | |
| | | | |
Total capital share transactions | | | 599,855,439 | | | | 2,394,553,235 | |
| | | | |
Net increase (decrease) in net assets | | | (2,371,810,144 | ) | | | 2,317,011,416 | |
Net assets: | | | | | | | | |
Beginning of year | | | 7,884,996,605 | | | | 5,567,985,189 | |
| | | | |
End of year | | $ | 5,513,186,461 | | | $ | 7,884,996,605 | |
| | | | |
Undistributed net investment income included in net assets: | | | | | | | | |
End of year | | $ | 497,923,282 | | | $ | 384,940,522 | |
| | | | |
The accompanying notes are an integral part of these financial statements.
FI-21
Franklin Templeton Variable Insurance Products Trust
Notes to Financial Statements
Franklin Income Securities Fund
1. ORGANIZATION AND SIGNIFICANT ACCOUNTING POLICIES
Franklin Templeton Variable Insurance Products Trust (Trust) is registered under the Investment Company Act of 1940, as amended, (1940 Act) as an open-end investment company, consisting of twenty-three separate funds. The Franklin Income Securities Fund (Fund) is included in this report. The financial statements of the remaining funds in the Trust are presented separately. Shares of the Fund are sold only to insurance company separate accounts to fund the benefits of variable life insurance policies or variable annuity contracts. The Fund offers three classes of shares: Class 1, Class 2, and Class 4. Effective February 29, 2008, the Fund began offering a new class of shares, Class 4. Each class of shares differs by its distribution fees, voting rights on matters affecting a single class and its exchange privilege.
The following summarizes the Fund’s significant accounting policies.
a. Security Valuation
Securities listed on a securities exchange or on the NASDAQ National Market System are valued at the last quoted sale price or the official closing price of the day, respectively. Over-the-counter securities and listed securities for which there is no reported sale are valued within the range of the most recent quoted bid and ask prices. Securities that trade in multiple markets or on multiple exchanges are valued according to the broadest and most representative market.
Corporate debt securities generally trade in the over-the-counter market rather than on a securities exchange. The Trust may utilize independent pricing services, quotations from bond dealers, and information with respect to bond and note transactions, to assist in determining a current market value for each security. The Trust’s pricing services may use valuation models or matrix pricing which considers information with respect to comparable bond and note transactions, quotations from bond dealers, or by reference to other securities that are considered comparable in such characteristics as rating, interest rate and maturity date, option adjusted spread models, prepayment projections, interest rate spreads and yield curves, to determine current value.
Foreign securities are valued as of the close of trading on the foreign stock exchange on which the security is primarily traded, or the NYSE, whichever is earlier. If no sale is reported at that time, the foreign security will be valued within the range of the most recent quoted bid and ask prices. The value is then converted into its U.S. dollar equivalent at the foreign exchange rate in effect at the close of the NYSE on the day that the value of the foreign security is determined.
The Trust has procedures to determine the fair value of individual securities and other assets for which market prices are not readily available or which may not be reliably priced. Methods for valuing these securities may include: fundamental analysis, matrix pricing, discounts from market prices of similar securities, or discounts applied due to the nature and duration of restrictions on the disposition of the securities. Due to the inherent uncertainty of valuations of such securities, the fair values may differ significantly from the values that would have been used had a ready market for such investments existed. Occasionally, events occur between the time at which trading in a security is completed and the close of the NYSE that might call into question the availability (including the reliability) of the value of a portfolio security held by the Fund. The investment manager monitors price movements following the close of trading in foreign stock markets through a series of country specific market proxies (such as baskets of American Depository Receipts, futures contracts and exchange traded funds). These price movements are measured against established trigger thresholds for each specific market proxy to assist in determining if an event has occurred. If such an event occurs, the securities may be valued using fair value procedures, which may include the use of independent pricing services. All security valuation procedures are approved by the Trust’s Board of Trustees.
b. Foreign Currency Translation
Portfolio securities and other assets and liabilities denominated in foreign currencies are translated into U.S. dollars based on the exchange rate of such currencies against U.S. dollars on the date of valuation. Purchases and sales of securities, income and expense items denominated in foreign currencies are translated into U.S. dollars at the exchange rate in effect on the transaction
FI-22
Franklin Templeton Variable Insurance Products Trust
Notes to Financial Statements (continued)
Franklin Income Securities Fund
1. ORGANIZATION AND SIGNIFICANT ACCOUNTING POLICIES (continued)
b. Foreign Currency Translation (continued)
date. Occasionally, events may impact the availability or reliability of foreign exchange rates used to convert the U.S. dollar equivalent value. If such an event occurs, the foreign exchange rate will be valued at fair value using procedures established and approved by the Trust’s Board of Trustees.
The Fund does not separately report the effect of changes in foreign exchange rates from changes in market prices on securities held. Such changes are included in net realized and unrealized gain or loss from investments on the Statement of Operations.
Realized foreign exchange gains or losses arise from sales of foreign currencies, currency gains or losses realized between the trade and settlement dates on securities transactions and the difference between the recorded amounts of dividends, interest, and foreign withholding taxes and the U.S. dollar equivalent of the amounts actually received or paid. Net unrealized foreign exchange gains and losses arise from changes in foreign exchange rates on foreign denominated assets and liabilities other than investments in securities held at the end of the reporting period.
c. Joint Repurchase Agreement
The Fund may enter into a joint repurchase agreement whereby its uninvested cash balance is deposited into a joint cash account with other funds managed by the investment manager or an affiliate of the investment manager and is used to invest in one or more repurchase agreements. The value and face amount of the joint repurchase agreement are allocated to the funds based on their pro-rata interest. A repurchase agreement is accounted for as a loan by the fund to the seller, collateralized by securities which are delivered to the fund’s custodian. The market value, including accrued interest, of the initial collateralization is required to be at least 102% of the dollar amount invested by the funds, with the value of the underlying securities marked to market daily to maintain coverage of at least 100%. The joint repurchase agreement held by the Fund at year end had been entered into on December 31, 2008. The joint repurchase agreement is valued at cost.
d. Foreign Currency Contracts
When the Fund purchases or sells foreign securities it may enter into foreign exchange contracts to minimize foreign exchange risk from the trade date to the settlement date of the transactions. A foreign exchange contract is an agreement between two parties to exchange different currencies at an agreed upon exchange rate at a future date. Realized and unrealized gains and losses on these contracts are included in the Statement of Operations.
The risks of these contracts include movement in the values of the foreign currencies relative to the U.S. dollar and the possible inability of the counterparties to fulfill their obligations under the contracts, which may be in excess of the amount reflected in the Statement of Assets and Liabilities.
e. Senior Floating Rate Interests
Senior secured corporate loans pay interest at rates which are periodically reset by reference to a base lending rate plus a spread. These base lending rates are generally the prime rate offered by a designated U.S. bank or the London InterBank Offered Rate (LIBOR). Senior secured corporate loans often require prepayment of principal from excess cash flows or at the discretion of the borrower. As a result, actual maturity may be substantially less than the stated maturity.
Senior secured corporate loans in which the Fund invests are generally readily marketable, but may be subject to some restrictions on resale.
FI-23
Franklin Templeton Variable Insurance Products Trust
Notes to Financial Statements (continued)
Franklin Income Securities Fund
1. ORGANIZATION AND SIGNIFICANT ACCOUNTING POLICIES (continued)
f. Income Taxes
No provision has been made for U.S. income taxes because it is the Fund’s policy to qualify as a regulated investment company under the Internal Revenue Code and to distribute to shareholders substantially all of its taxable income and net realized gains.
The Fund has reviewed the tax positions, taken on federal income tax returns, for each of the three open tax years and as of December 31, 2008, and has determined that no provision for income tax is required in the Fund’s financial statements.
g. Security Transactions, Investment Income, Expenses and Distributions
Security transactions are accounted for on trade date. Realized gains and losses on security transactions are determined on a specific identification basis. Interest income and estimated expenses are accrued daily. Amortization of premium and accretion of discount on debt securities are included in interest income. Facility fees are recognized as income over the expected term of the loan. Dividend income is recorded on the ex-dividend date. Distributions to shareholders are recorded on the ex-dividend date and are determined according to income tax regulations (tax basis). Distributable earnings determined on a tax basis may differ from earnings recorded in accordance with accounting principles generally accepted in the United States of America. These differences may be permanent or temporary. Permanent differences are reclassified among capital accounts to reflect their tax character. These reclassifications have no impact on net assets or the results of operations. Temporary differences are not reclassified, as they may reverse in subsequent periods.
Common expenses incurred by the Trust are allocated among the funds based on the ratio of net assets of each fund to the combined net assets of the Trust. Fund specific expenses are charged directly to the fund that incurred the expense.
Realized and unrealized gains and losses and net investment income, not including class specific expenses, are allocated daily to each class of shares based upon the relative proportion of net assets of each class. Differences in per share distributions, by class, are generally due to differences in class specific expenses.
h. Accounting Estimates
The preparation of financial statements in accordance with accounting principles generally accepted in the United States of America requires management to make estimates and assumptions that affect the reported amounts of assets and liabilities at the date of the financial statements and the amounts of income and expenses during the reporting period. Actual results could differ from those estimates.
i. Guarantees and Indemnifications
Under the Trust’s organizational documents, its officers and trustees are indemnified by the Trust against certain liabilities arising out of the performance of their duties to the Trust. Additionally, in the normal course of business, the Trust, on behalf of the Fund, enters into contracts with service providers that contain general indemnification clauses. The Trust’s maximum exposure under these arrangements is unknown as this would involve future claims that may be made against the Trust that have not yet occurred. Currently, the Trust expects the risk of loss to be remote.
FI-24
Franklin Templeton Variable Insurance Products Trust
Notes to Financial Statements (continued)
Franklin Income Securities Fund
2. SHARES OF BENEFICIAL INTEREST
At December 31, 2008, there were an unlimited number of shares authorized (without par value). Transactions in the Fund’s shares were as follows:
| | | | | | | | | | | | | | |
| | | Year Ended December 31, | |
| | | 2008a | | | 2007 | |
| Class 1 Shares: | | Shares | | | Amount | | | Shares | | | Amount | |
Shares sold | | 17,900,721 | | | $ | 257,601,912 | | | 3,423,742 | | | $ | 60,983,057 | |
Shares issued in reinvestment of distributions | | 2,143,727 | | | | 34,728,380 | | | 1,003,968 | | | | 18,141,699 | |
Shares redeemed | | (8,303,783 | ) | | | (114,446,461 | ) | | (4,552,806 | ) | | | (82,005,721 | ) |
| | | | |
Net increase (decrease) | | 11,740,665 | | | $ | 177,883,831 | | | (125,096 | ) | | $ | (2,880,965 | ) |
| | | | |
| Class 2 Shares: | | | | | | | | | | | | |
Shares sold | | 51,438,684 | | | $ | 783,774,483 | | | 139,710,740 | | | $ | 2,474,805,910 | |
Shares issued in reinvestment of distributions | | 32,188,942 | | | | 511,804,179 | | | 14,663,792 | | | | 260,428,952 | |
Shares redeemed | | (75,101,550 | ) | | | (1,033,497,247 | ) | | (19,520,061 | ) | | | (337,800,662 | ) |
| | | | |
Net increase (decrease) | | 8,526,076 | | | $ | 262,081,415 | | | 134,854,471 | | | $ | 2,397,434,200 | |
| | | | |
| Class 4 Shares: | | | | | | | | | | | | |
Shares sold | | 11,763,342 | | | $ | 159,393,310 | | | | | | | | |
Shares issued on reinvestment of distributions | | 72,348 | | | | 1,170,589 | | | | | | | | |
Shares redeemed | | (54,817 | ) | | | (673,706 | ) | | | | | | | |
| | | | | | | | | | |
Net increase (decrease) | | 11,780,873 | | | $ | 159,890,193 | | | | | | | | |
| | | | | | | | | | |
aFor | the period February 29, 2008 (effective date) to December 31, 2008 for Class 4. |
3. TRANSACTIONS WITH AFFILIATES
Franklin Resources, Inc. is the holding company for various subsidiaries that together are referred to as Franklin Templeton Investments. Certain officers and trustees of the Trust are also officers and/or directors of the following subsidiaries:
| | |
| Subsidiary | | Affiliation |
Franklin Advisers, Inc. (Advisers) | | Investment manager |
Franklin Templeton Services, LLC (FT Services) | | Administrative manager |
Franklin Templeton Distributors, Inc. (Distributors) | | Principal underwriter |
Franklin Templeton Investor Services, LLC (Investor Services) | | Transfer agent |
a. Management Fees
The Fund pays an investment management fee to Advisers based on the average daily net assets of the Fund as follows:
| | |
| Annualized Fee Rate | | Net Assets |
| 0.625% | | Up to and including $100 million |
| 0.500% | | Over $100 million, up to and including $250 million |
| 0.450% | | Over $250 million, up to and including $7.5 billion |
| 0.440% | | Over $7.5 billion, up to and including $10 billion |
| 0.430% | | Over $10 billion, up to and including $12.5 billion |
| 0.420% | | Over $12.5 billion, up to and including $15 billion |
| 0.400% | | In excess of $15 billion |
FI-25
Franklin Templeton Variable Insurance Products Trust
Notes to Financial Statements (continued)
Franklin Income Securities Fund
3. TRANSACTIONS WITH AFFILIATES (continued)
b. Administrative Fees
Under an agreement with Advisers, FT Services provides administrative services to the Fund. The fee is paid by Advisers based on average daily net assets, and is not an additional expense of the Fund.
c. Distribution Fees
The Fund’s Board of Trustees has adopted distribution plans for Class 2 and Class 4 shares pursuant to Rule 12b-1 under the 1940 Act. Under the Fund’s compensation distribution plans, the Fund pays Distributors for costs incurred in connection with the servicing, sale and distribution of the Fund’s shares up to 0.35% per year of its average daily net assets of each class. The Board of Trustees has agreed to limit the current rate to 0.25% per year for Class 2.
d. Transfer Agent Fees
Investor Services, under terms of an agreement, performs shareholder servicing for the Fund and is not paid by the Fund for the services.
4. EXPENSE OFFSET ARRANGEMENT
The Fund has entered into an arrangement with its custodian whereby credits realized as a result of uninvested cash balances are used to reduce a portion of the Fund’s custodian expenses. During the year ended December 31, 2008, the custodian fees were reduced as noted in the Statement of Operations.
5. INCOME TAXES
For tax purposes, capital losses may be carried over to offset future capital gains, if any. At December 31, 2008, the Fund had tax basis capital losses of $526,136,287 expiring in 2016.
For tax purposes, realized capital losses and realized currency losses occurring subsequent to October 31, may be deferred and treated as occurring on the first day of the following fiscal year. At December 31, 2008, the Fund deferred realized capital losses and realized currency losses of $148,670,676 and $117,987, respectively.
The tax character of distributions paid during the years ended December 31, 2008 and 2007, was as follows:
| | | | | | |
| | | 2008 | | 2007 |
Distributions paid from: | | | | | | |
Ordinary income | | $ | 440,431,430 | | $ | 249,210,633 |
Long term capital gain | | | 107,272,075 | | | 29,360,018 |
| | | |
| | $ | 547,703,505 | | $ | 278,570,651 |
| | | |
At December 31, 2008, the cost of investments, net unrealized appreciation (depreciation), and undistributed ordinary income for income tax purposes were as follows:
| | | | |
Cost of investments | | $ | 7,447,494,727 | |
| | | | |
| |
Unrealized appreciation | | $ | 132,431,830 | |
Unrealized depreciation | | | (2,202,229,317 | ) |
| | | | |
Net unrealized appreciation (depreciation) | | $ | (2,069,797,487 | ) |
| | | | |
Distributable earnings – undistributed ordinary income | | $ | 504,680,100 | |
| | | | |
FI-26
Franklin Templeton Variable Insurance Products Trust
Notes to Financial Statements (continued)
Franklin Income Securities Fund
5. INCOME TAXES (continued)
Net investment income differs for financial statement and tax purposes primarily due to differing treatments of defaulted securities, foreign currency transactions, payments-in-kind, and bond discounts and premiums.
Net realized gains (losses) differ for financial statement and tax purposes primarily due to differing treatments of wash sales, defaulted securities, foreign currency transactions, payments-in-kind and bond discounts and premiums.
6. INVESTMENT TRANSACTIONS
Purchases and sales of investments (excluding short term securities) for the year ended December 31, 2008, aggregated $3,494,585,940 and $2,880,538,278, respectively.
7. CREDIT RISK AND DEFAULTED SECURITIES
The Fund has 46.09% of its portfolio invested in high yield, senior secured floating rate notes, or other securities rated below investment grade. These securities may be more sensitive to economic conditions causing greater price volatility and are potentially subject to a greater risk of loss due to default than higher rated securities.
The Fund held defaulted securities and/or other securities for which the income has been deemed uncollectible. At December 31, 2008, the aggregate value of these securities was $8,900,000, representing 0.16% of the Fund’s net assets. The Fund discontinues accruing income on securities for which income has been deemed uncollectible and provides an estimate for losses on interest receivable. The securities have been identified on the accompanying Statement of Investments.
8. UNFUNDED LOAN COMMITMENTS
The Fund may enter into certain credit agreements, all or a portion of which may be unfunded. The Fund is obligated to fund these loan commitments at the borrowers’ discretion. Funded portions of credit agreements are presented on the Statement of Investments.
At December 31, 2008, unfunded commitments were as follows:
| | | |
| Borrower | | Unfunded
Commitment |
Bausch & Lomb Inc., Delayed Draw Term Loan | | $ | 704,000 |
| | | |
Unfunded loan commitments and funded portions of credit agreements are marked to market daily and any unrealized appreciation or depreciation is included in the Statement of Assets and Liabilities and Statement of Operations.
9. VIOLATION OF INVESTMENT RESTRICTIONS
During the year ended December, 31, 2008, the Fund inadvertently breached one of its investment restrictions. For the year ended December 31, 2008, the Fund incurred a loss of $1,317,686 on the investments. Advisers reimbursed the Fund for such losses incurred which is reflected in the Statement of Operations.
10. FAIR VALUE MEASUREMENTS
The Fund adopted Financial Accounting Standards Board (FASB) Statement No. 157, “Fair Value Measurement” (SFAS 157), on January 1, 2008. SFAS 157 defines fair value, establishes a framework for measuring fair value, and expands disclosures about fair value measurements. The Fund has determined that the implementation of SFAS 157 did not have a material impact on the Fund’s financial statements.
FI-27
Franklin Templeton Variable Insurance Products Trust
Notes to Financial Statements (continued)
Franklin Income Securities Fund
10. FAIR VALUE MEASUREMENTS (continued)
SFAS 157 establishes a fair value hierarchy that distinguishes between market data obtained from independent sources (observable inputs) and the Fund’s own market assumptions (unobservable inputs). These inputs are used in determining the value of the Fund’s investments and are summarized in the following fair value hierarchy:
| | • | | Level 1 – quoted prices in active markets for identical securities |
| | • | | Level 2 – other significant observable inputs (including quoted prices for similar securities, interest rates, prepayment speed, credit risk, etc.) |
| | • | | Level 3 – significant unobservable inputs (including the Fund’s own assumptions in determining the fair value of investments) |
The inputs or methodology used for valuing securities are not an indication of the risk associated with investing in those securities.
The following is a summary of the inputs used as of December 31, 2008, in valuing the Fund’s assets and liabilities carried at fair value:
| | | | | | | | | | | | |
| | | Level 1 | | Level 2 | | Level 3 | | Total |
Assets: | | | | | | | | | | | | |
Investments in Securities | | $ | 1,662,819,718 | | $ | 3,702,003,447 | | $ | 12,874,075 | | $ | 5,377,697,240 |
Liabilities: | | | | | | | | | | | | |
Other Financial Instrumentsa | | | — | | | 219,668 | | | — | | | 219,668 |
a | Other financial instruments includes net unrealized appreciation (depreciation) on unfunded loan commitments. |
At December 31, 2008, the reconciliation of assets in which significant unobservable inputs (Level 3) were used in determining fair value, is as follows:
| | | |
| | | Investments In
Securities |
Beginning Balance – January 1, 2008 | | $ | — |
Net realized gain (loss) | | | — |
Net change in unrealized appreciation (depreciation) | | | — |
Net purchases (sales) | | | 12,874,075 |
Transfers in and/or out of Level 3 | | | — |
| | | |
Ending Balance | | $ | 12,874,075 |
| | | |
Net change in unrealized appreciation (depreciation)
attributable to assets still held at end of year | | $ | — |
| | | |
11. NEW ACCOUNTING PRONOUNCEMENT
In March 2008, FASB issued FASB Statement No. 161, “Disclosures about Derivative Instruments and Hedging Activities, an amendment of FASB Statement No. 133” (SFAS 161), which expands disclosures about derivative investments and hedging activities. SFAS 161 is effective for fiscal years and interim periods beginning after November 15, 2008. The Fund is currently evaluating the impact, if any, of applying the various provisions of SFAS 161.
12. SUBSEQUENT EVENT
On January 23, 2009, the Fund entered into, along with certain other funds managed by Franklin Templeton Investments (individually, “Borrower”; collectively “Borrowers”), a $725 million senior unsecured syndicated global line of credit (“Global
FI-28
Franklin Templeton Variable Insurance Products Trust
Notes to Financial Statements (continued)
Franklin Income Securities Fund
12. SUBSEQUENT EVENTS (continued)
Credit Facility”) to provide a source of funds to the Borrowers for temporary and emergency purposes and to meet future unanticipated or unusually large redemption requests.
Under the terms of the Global Credit Facility, each Borrower has agreed to pay its proportionate share of fees and expenses incurred in connection with the implementation and maintenance of the Global Credit Facility.
ABBREVIATIONS
| | |
| Currency | | Selected Portfolio |
| EUR - Euro | | ADR - American Depository Receipt FRN - Floating Rate Note L/C - Letter of Credit MTN - Medium Term Note PIK - Payment-In-Kind |
FI-29
Franklin Templeton Variable Insurance Products Trust
Franklin Income Securities Fund
Report of Independent Registered Public Accounting Firm
To the Board of Trustees and Shareholders of Franklin Templeton Variable Insurance Products Trust
In our opinion, the accompanying statement of assets and liabilities, including the statement of investments, and the related statements of operations and of changes in net assets and the financial highlights present fairly, in all material respects, the financial position of Franklin Income Securities Fund (one of the funds constituting the Franklin Templeton Variable Insurance Products Trust, hereafter referred to as the “Fund”) at December 31, 2008, the results of its operations for the year then ended, the changes in its net assets for each of the two years in the period then ended and the financial highlights for the periods presented, in conformity with accounting principles generally accepted in the United States of America. These financial statements and financial highlights (hereafter referred to as “financial statements”) are the responsibility of the Fund’s management. Our responsibility is to express an opinion on these financial statements based on our audits. We conducted our audits of these financial statements in accordance with the standards of the Public Company Accounting Oversight Board (United States). Those standards require that we plan and perform the audit to obtain reasonable assurance about whether the financial statements are free of material misstatement. An audit includes examining, on a test basis, evidence supporting the amounts and disclosures in the financial statements, assessing the accounting principles used and significant estimates made by management, and evaluating the overall financial statement presentation. We believe that our audits, which included confirmation of securities at December 31, 2008 by correspondence with the custodian and brokers, provide a reasonable basis for our opinion.
PricewaterhouseCoopers LLP
San Francisco, California
February 10, 2009
FI-30
Franklin Templeton Variable Insurance Products Trust
Tax Designation (unaudited)
Franklin Income Securities Fund
Under Section 852(b)(3)(C) of the Internal Revenue Code (Code), the Fund designates the maximum amount allowable but no less than $107,272,075 as a long term capital gain dividend for the fiscal year ended December 31, 2008.
Under Section 854(b)(2) of the Code, the Fund designates 26.23% of the ordinary income dividends as income qualifying for the dividends received deduction for the fiscal year ended December 31, 2008.
FI-31
FRANKLIN LARGE CAP GROWTH SECURITIES FUND
This annual report for Franklin Large Cap Growth Securities Fund covers the fiscal year ended December 31, 2008.
Performance Summary as of 12/31/08
Average annual total return of Class 1 shares represents the average annual change in value, assuming reinvestment of dividends and capital gains. Average returns smooth out variations in returns, which can be significant; they are not the same as year-by-year results.
Periods ended 12/31/08
| | | | | | |
| | | 1-Year | | 5-Year | | 10-Year |
Average Annual Total Return | | -34.39% | | -3.15% | | +0.31% |
Total Return Index Comparison
for a Hypothetical $10,000 Investment (1/1/99–12/31/08)
The graph below shows the change in value of a hypothetical $10,000 investment in the Fund over the indicated period and includes reinvestment of any income or distributions. The Fund’s performance is compared to the performance of the Standard & Poor’s 500 Index (S&P 500) and the Russell 1000® Growth Index. One cannot invest directly in an index, nor is an index representative of the Fund’s portfolio. Please see Important Notes to Performance Information preceding the Fund Summaries.
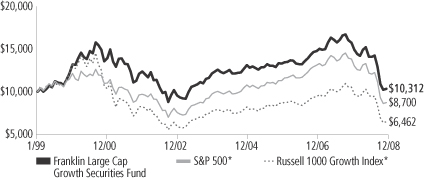
*Source: © 2009 Morningstar. Please see Index Descriptions following the Fund Summaries.
Franklin Large Cap Growth Securities Fund Class 1
Performance reflects the Fund’s Class 1 operating expenses, but does not include any contract fees, expenses or sales charges. If they had been included, performance would be lower. These charges and deductions, particularly for variable life policies, can have a significant effect on contract values and insurance benefits. See the contract prospectus for a complete description of these expenses, including sales charges.
Performance data represent past performance, which does not guarantee future results. Investment return and principal value will fluctuate, and you may have a gain or loss when you sell your shares. Current performance may differ from figures shown.
FLG-1
Fund Goal and Main Investments: Franklin Large Cap Growth Securities Fund seeks capital appreciation. The Fund normally invests at least 80% of its net assets in investments of large capitalization companies and normally invests predominantly in equity securities. For this Fund, large capitalization companies are those with market capitalization values within those of the top 50% of companies in the Russell 1000 Index at the time of purchase.1
Performance Overview
You can find the Fund’s one-year total return in the Performance Summary. The Fund performed better than its primary benchmark, the S&P 500, which had a -37.00% total return.2 The Fund also performed better than its secondary benchmark, the Russell 1000 Growth Index, which had a -38.44% total return for the same period.2
Economic and Market Overview
In 2008, economic conditions deteriorated. The Conference Board’s Consumer Confidence Index fell to an all-time low since it began in 1967 as the U.S. economy faltered and stock markets declined. The government’s abrupt conservatorship of Fannie Mae and Freddie Mac and the failure of several blue-chip banks and financial institutions roiled equity markets. Despite government interventions and massive emergency funding, the nation’s economic troubles were exacerbated as manufacturing activity weakened at its fastest pace in nearly 30 years and as home prices continued to fall. Jobless claims mounted and the unemployment rate rose to 7.2% by period-end.3 Economic growth, as measured by gross domestic product (GDP), rebounded from a 0.9% annualized rate in the first quarter of 2008 to a 2.8% annualized pace in the second quarter, largely due to strong exports and government spending. However, in the third and fourth quarters of 2008, GDP fell at annualized rates of 0.5% and an estimated 3.8%, reflecting a broad-based contraction in consumer spending, falling corporate profits and slowing export growth.
Oil prices soared to a record high in July, rising above $145 per barrel, before dramatically retreating to $45 by period-end. Many other commodities such as agricultural products and precious and base metals followed similar trends. Partially as a result of the steep price corrections, inflation declined significantly late in the review period, and
1. Please see Index Descriptions following the Fund Summaries.
2. Source: © 2009 Morningstar. One cannot invest directly in an index, nor is an index representative of the Fund’s portfolio. Please see Index Descriptions following the Fund Summaries.
3. Source: Bureau of Labor Statistics.
Fund Risks: The Fund’s investments in stocks offer the potential for long-term gains but can be subject to short-term price fluctuations. Large capitalization stocks tend to go through cycles of outperforming or lagging the stock market in general, and, in the past, these periods have lasted for several years. By having significant investments in particular sectors from time to time, such as the technology sector, which has been among the market’s most volatile sectors, as well as the communications and financial services sectors, the Fund may be at greater risk from adverse developments in a sector than a fund that invests more broadly. Foreign investing involves additional risks, including currency fluctuations, economic instability, market volatility, and political and social instability. The Fund’s prospectus also includes a description of the main investment risks.
FLG-2
December’s inflation rate was an annualized 0.1%.3 Core inflation, which excludes food and energy costs, rose at a 1.8% annual rate; this level was within the Federal Reserve Board’s (Fed’s) informal target range of 1.5%-2.0%.3
A slowing economy and decelerating inflation prompted policymakers to further lower interest rates and enact stimulus plans. During the year under review, the Fed lowered the federal funds target rate to a range of 0% to 0.25% from 4.25% at the start of the reporting period. The Fed and U.S. Treasury Department also introduced new programs such as the Primary Dealer Credit Facility (PDCF) and the Troubled Asset Relief Program (TARP), which were intended to enhance market liquidity.
Volatility remained high throughout the reporting period but intensified in the latter half of the year as stocks fluctuated wildly and Treasury prices soared. The year was among the worst in history for U.S. stock market performance. For the 12 months under review, the blue chip stocks of the Dow Jones Industrial Average had a total return of -31.93%, the broader S&P 500 a -37.00% total return, and the technology-heavy NASDAQ Composite Index a -40.03% total return.2 All sectors lost value, and the financials, materials and information technology sectors had the largest declines.
Investment Strategy
We are research-driven, fundamental investors pursuing a bottom-up strategy. As such, we focus primarily on individual securities that present, in our opinion, the best trade-off between potential return and risk. We seek out companies trading at the greatest discount to our estimates of their fair worth, with worth most often being a function of future growth potential. In making these judgments, we also take into account risks and uncertainties that are inherent to our growth and worth estimates. We rely on a team of analysts to help provide in-depth industry expertise and use both qualitative and quantitative analysis to evaluate companies for distinct, sustainable and competitive advantages likely to lead to growth in earnings and/or cash flow. Competitive advantages such as a particular product niche, proven technology, sound financial profits and records, or strong management are all factors we believe may contribute to future cash flow and earnings growth potential.
Manager’s Discussion
Looking back on the key factors impacting the Fund’s returns during the period under review, we would like to remind shareholders that our investment strategy is primarily bottom-up and driven by individual
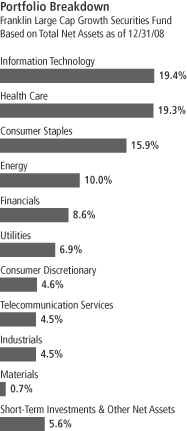
FLG-3
stock selection. However, we recognize that a sector-based discussion can be a helpful way to organize a portfolio review of key performance drivers.
From a sector perspective, the Fund’s performance relative to the S&P 500 was hurt by our underweighted allocation and stock selection in the energy sector. In particular, our holdings in offshore oil and gas services company Global Industries4 (sold by year-end) and oil and natural gas exploration and production firms Chesapeake Energy and Exxon Mobil detracted from relative Fund returns. The Fund’s underweighted exposure and stock selection in the consumer discretionary sector also hampered the Fund partly due to our investment in audio products and electronic systems manufacturer Harman International Industries. Our decision not to hold fast food restaurant operator McDonald’s, which did not meet our investment criteria, was also detrimental to our relative results. Some of the Fund’s utilities holdings such as independent power producer and energy trader Iberdrola Renovables4 (sold by year-end) were additional detractors.
Several of the Fund’s financials sector investments also detracted from relative returns, including American International Group (AIG), Merrill Lynch, iStar Financial4 and Wells Fargo, which offset the positive effect of our sector underweighting. We sold AIG and iStar by year-end.
Stock selection in the information technology sector helped Fund performance relative to the S&P 500. In particular, our QUALCOMM and Visa4 (sold by year-end) holdings boosted relative results. An overweighted allocation and stock selection in the health care sector also benefited the Fund as biotechnology firm Genentech4 performed well. Pharmaceutical companies Teva Pharmaceutical Industries, 4 Schering-Plough, Roche Holding4 and Merck also helped relative performance as their shares performed better than the index. Additionally, underweighted exposure and stock selection in the materials sector contributed to the Fund.
Other key contributors to relative Fund returns included beverage manufacturer Hansen Natural, electric energy generator and distributor NV Energy and food and staples retailer Wal-Mart Stores.
4. This holding is not an index component.
Top 10 Holdings
Franklin Large Cap Growth Securities Fund 12/31/08
| | |
Company
Sector/Industry | | % of Total
Net Assets |
| |
| Genentech Inc. | | 4.1% |
| Health Care | | |
| |
| The Boeing Co. | | 3.2% |
| Industrials | | |
| |
| Schering-Plough Corp. | | 3.0% |
| Health Care | | |
| |
| AT&T Inc. | | 2.8% |
| Telecommunication Services | | |
| |
| International Business Machines Corp. | | 2.7% |
| Information Technology | | |
| |
| CVS Caremark Corp. | | 2.4% |
| Consumer Staples | | |
| |
| QUALCOMM Inc. | | 2.3% |
| Information Technology | | |
| |
| Hewlett-Packard Co. | | 2.3% |
| Information Technology | | |
| |
| Wal-Mart Stores Inc. | | 2.2% |
| Consumer Staples | | |
| |
| WellPoint Inc. | | 2.2% |
| Health Care | | |
The dollar value, number of shares or principal amount, and names of all portfolio holdings are listed in the Fund’s Statement of Investments.
FLG-4
Thank you for your participation in Franklin Large Cap Growth Securities Fund. We look forward to serving your future investment needs.
The foregoing information reflects our analysis, opinions and portfolio holdings as of December 31, 2008, the end of the reporting period. The way we implement our main investment strategies and the resulting portfolio holdings may change depending on factors such as market and economic conditions. These opinions may not be relied upon as investment advice or an offer for a particular security. The information is not a complete analysis of every aspect of any market, country, industry, security or the Fund. Statements of fact are from sources considered reliable, but the investment manager makes no representation or warranty as to their completeness or accuracy. Although historical performance is no guarantee of future results, these insights may help you understand our investment management philosophy.
FLG-5
Fund Expenses
As an investor in a variable insurance contract (Contract) that indirectly provides for investment in an underlying mutual fund, you can incur transaction and/or ongoing expenses at both the Fund level and the Contract level.
| • | | Transaction expenses can include sales charges (loads) on purchases, redemption fees, surrender fees, transfer fees and premium taxes. |
| • | | Ongoing expenses can include management fees, distribution and service (12b-1) fees, contract fees, annual maintenance fees, mortality and expense risk fees and other fees and expenses. All mutual funds and Contracts have some types of ongoing expenses. |
The expenses shown in the table are meant to highlight ongoing expenses at the Fund level only and do not include ongoing expenses at the Contract level, or transaction expenses at either the Fund or Contract level. While the Fund does not have transaction expenses, if the transaction and ongoing expenses at the Contract level were included, the expenses shown would be higher. You should consult your Contract prospectus or disclosure document for more information.
The table shows Fund-level ongoing expenses and can help you understand these expenses and compare them with those of other mutual funds offered through the Contract. The table assumes a $1,000 investment held for the six months indicated. Please refer to the Fund prospectus for additional information on operating expenses.
Actual Fund Expenses
The first line (Actual) of the table provides actual account values and expenses. The “Ending Account Value” is derived from the Fund’s actual return, which includes the effect of ongoing Fund expenses, but does not include the effect of ongoing Contract expenses.
You can estimate the Fund-level expenses you incurred during the period by following these steps. Of course, your account value and expenses will differ from those in this illustration:
| 1. | Divide your account value by $1,000. |
If an account had an $8,600 value, then $8,600 ÷ $1,000 = 8.6.
| 2. | Multiply the result by the number under the heading “Fund-Level Expenses Incurred During Period.” |
If Fund-Level Expenses Incurred During Period were $7.50, then 8.6 x $7.50 = $64.50.
In this illustration, the estimated expenses incurred this period at the Fund level are $64.50.
Franklin Large Cap Growth Securities Fund Class 1
FLG-6
Hypothetical Example for Comparison with Other Mutual Funds
Information in the second line (Hypothetical) of the table can help you compare ongoing expenses of the Fund with those of other mutual funds offered through the Contract. This information may not be used to estimate the actual ending account balance or expenses you incurred during the period. The hypothetical “Ending Account Value” is based on the Fund’s actual expense ratio and an assumed 5% annual rate of return before expenses, which does not represent the Fund’s actual return. The figure under the heading “Fund-Level Expenses Incurred During Period” shows the hypothetical expenses your account would have incurred under this scenario. You can compare this figure with the 5% hypothetical examples that appear in shareholder reports of other funds offered through a Contract.
| | | | | | | | | |
| Class 1 | | Beginning
Account Value 7/1/08 | | Ending
Account
Value 12/31/08 | | Fund-Level
Expenses Incurred
During Period*
7/1/08–12/31/08 |
Actual | | $ | 1,000 | | $ | 732.10 | | $ | 3.35 |
Hypothetical (5% return before expenses) | | $ | 1,000 | | $ | 1,021.27 | | $ | 3.91 |
*Expenses are calculated using the most recent six-month annualized expense ratio for the Fund’s Class 1 shares (0.77%), which does not include any ongoing expenses of the Contract for which the Fund is an investment option, multiplied by the average account value over the period, multiplied by 184/366 to reflect the one-half year period.
FLG-7
Franklin Templeton Variable Insurance Products Trust
Financial Highlights
Franklin Large Cap Growth Securities Fund
| | | | | | | | | | | | | | | | | | | | |
| | | Year Ended December 31, | |
| Class 1 | | 2008 | | | 2007 | | | 2006 | | | 2005 | | | 2004 | |
| | | | |
Per share operating performance | | | | | | | | | | | | | | | | | | | | |
(for a share outstanding throughout the year) | | | | | | | | | | | | | | | | | | | | |
Net asset value, beginning of year | | $ | 17.51 | | | $ | 16.70 | | | $ | 15.17 | | | $ | 15.08 | | | $ | 14.01 | |
| | | | |
Income from investment operationsa: | | | | | | | | | | | | | | | | | | | | |
Net investment incomeb | | | 0.17 | | | | 0.21 | | | | 0.17 | | | | 0.17 | | | | 0.13 | |
Net realized and unrealized gains (losses) | | | (5.82 | ) | | | 0.89 | | | | 1.51 | | | | 0.02 | | | | 1.02 | |
| | | | |
Total from investment operations | | | (5.65 | ) | | | 1.10 | | | | 1.68 | | | | 0.19 | | | | 1.15 | |
| | | | |
Less distributions from: | | | | | | | | | | | | | | | | | | | | |
Net investment income | | | (0.24 | ) | | | (0.16 | ) | | | (0.15 | ) | | | (0.10 | ) | | | (0.08 | ) |
Net realized gains | | | (0.96 | ) | | | (0.13 | ) | | | — | | | | — | | | | — | |
| | | | |
Total distributions | | | (1.20 | ) | | | (0.29 | ) | | | (0.15 | ) | | | (0.10 | ) | | | (0.08 | ) |
| | | | |
Net asset value, end of year | | $ | 10.66 | | | $ | 17.51 | | | $ | 16.70 | | | $ | 15.17 | | | $ | 15.08 | |
| | | | |
| | | | | |
Total returnc | | | (34.39)% | | | | 6.53% | | | | 11.17% | | | | 1.31% | | | | 8.23% | |
Ratios to average net assets | | | | | | | | | | | | | | | | | | | | |
Expensesd | | | 0.77% | | | | 0.74% | | | | 0.76% | | | | 0.76% | | | | 0.79% | |
Net investment income | | | 1.19% | | | | 1.21% | | | | 1.11% | | | | 1.14% | | | | 0.99% | |
| | | | | |
Supplemental data | | | | | | | | | | | | | | | | | | | | |
Net assets, end of year (000’s) | | $ | 51,651 | | | $ | 96,920 | | | $ | 114,929 | | | $ | 136,464 | | | $ | 169,107 | |
Portfolio turnover rate | | | 66.04% | | | | 50.67% | | | | 50.97% | | | | 39.44% | | | | 38.48% | |
aThe amount shown for a share outstanding throughout the period may not correlate with the Statement of Operations for the period due to the timing of sales and repurchases of the Fund shares in relation to income earned and/or fluctuating market value of the investments of the Fund.
bBased on average daily shares outstanding.
cTotal return does not include any fees, charges or expenses imposed by the variable annuity and life insurance contracts for which the Franklin Templeton Variable Insurance Products Trust serves as an underlying investment vehicle.
dBenefit of expense reduction rounds to less than 0.01%.
The accompanying notes are an integral part of these financial statements.
FLG-8
Franklin Templeton Variable Insurance Products Trust
Financial Highlights (continued)
Franklin Large Cap Growth Securities Fund
| | | | | | | | | | | | | | | | | | | | |
| | | Year Ended December 31, | |
| Class 2 | | 2008 | | | 2007 | | | 2006 | | | 2005 | | | 2004 | |
| | | | |
Per share operating performance | | | | | | | | | | | | | | | | | | | | |
(for a share outstanding throughout the year) | | | | | | | | | | | | | | | | | | | | |
Net asset value, beginning of year | | $ | 17.25 | | | $ | 16.47 | | | $ | 14.97 | | | $ | 14.90 | | | $ | 13.87 | |
| | | | |
Income from investment operationsa: | | | | | | | | | | | | | | | | | | | | |
Net investment incomeb | | | 0.13 | | | | 0.17 | | | | 0.13 | | | | 0.13 | | | | 0.11 | |
Net realized and unrealized gains (losses) | | | (5.73 | ) | | | 0.87 | | | | 1.49 | | | | 0.03 | | | | 0.99 | |
| | | | |
Total from investment operations | | | (5.60 | ) | | | 1.04 | | | | 1.62 | | | | 0.16 | | | | 1.10 | |
| | | | |
Less distributions from: | | | | | | | | | | | | | | | | | | | | |
Net investment income | | | (0.19 | ) | | | (0.13 | ) | | | (0.12 | ) | | | (0.09 | ) | | | (0.07 | ) |
Net realized gains | | | (0.96 | ) | | | (0.13 | ) | | | — | | | | — | | | | — | |
| | | | |
Total distributions | | | (1.15 | ) | | | (0.26 | ) | | | (0.12 | ) | | | (0.09 | ) | | | (0.07 | ) |
| | | | |
Net asset value, end of year | | $ | 10.50 | | | $ | 17.25 | | | $ | 16.47 | | | $ | 14.97 | | | $ | 14.90 | |
| | | | |
| | | | | |
Total returnc | | | (34.53)% | | | | 6.23% | | | | 10.90% | | | | 1.06% | | | | 7.93% | |
Ratios to average net assets | | | | | | | | | | | | | | | | | | | | |
Expensesd | | | 1.02% | | | | 0.99% | | | | 1.01% | | | | 1.01% | | | | 1.04% | |
Net investment income | | | 0.94% | | | | 0.96% | | | | 0.86% | | | | 0.89% | | | | 0.74% | |
| | | | | |
Supplemental data | | | | | | | | | | | | | | | | | | | | |
Net assets, end of year (000’s) | | $ | 328,597 | | | $ | 642,351 | | | $ | 636,592 | | | $ | 510,395 | | | $ | 340,465 | |
Portfolio turnover rate | | | 66.04% | | | | 50.67% | | | | 50.97% | | | | 39.44% | | | | 38.48% | |
aThe amount shown for a share outstanding throughout the period may not correlate with the Statement of Operations for the period due to the timing of sales and repurchases of the Fund shares in relation to income earned and/or fluctuating market value of the investments of the Fund.
bBased on average daily shares outstanding.
cTotal return does not include any fees, charges or expenses imposed by the variable annuity and life insurance contracts for which the Franklin Templeton Variable Insurance Products Trust serves as an underlying investment vehicle.
dBenefit of expense reduction rounds to less than 0.01%.
The accompanying notes are an integral part of these financial statements.
FLG-9
Franklin Templeton Variable Insurance Products Trust
Financial Highlights (continued)
Franklin Large Cap Growth Securities Fund
| | | | |
| Class 4 | | Period Ended
December 31,
2008a | |
Per share operating performance | | | | |
(for a share outstanding throughout the period) | | | | |
Net asset value, beginning of period | | $ | 16.05 | |
| | | | |
Income from investment operationsb: | | | | |
Net investment incomec | | | 0.11 | |
Net realized and unrealized gains (losses) | | | (4.34 | ) |
| | | | |
Total from investment operations | | | (4.23 | ) |
| | | | |
Less distributions from: | | | | |
Net investment income | | | (0.24 | ) |
Net realized gains | | | (0.96 | ) |
| | | | |
Total distributions | | | (1.20 | ) |
| | | | |
Net asset value, end of period | | $ | 10.62 | |
| | | | |
| |
Total returnd | | | (28.68)% | |
Ratios to average net assetse | | | | |
Expensesf | | | 1.12% | |
Net investment income | | | 0.84% | |
| |
Supplemental data | | | | |
Net assets, end of period (000’s) | | $ | 3 | |
Portfolio turnover rate | | | 66.04% | |
aFor the period February 29, 2008 (effective date) to December 31, 2008.
bThe amount shown for a share outstanding throughout the period may not correlate with the Statement of Operations for the period due to the timing of sales and repurchases of the Fund shares in relation to income earned and/or fluctuating market value of the investments of the Fund.
cBased on average daily shares outstanding.
dTotal return does not include any fees, charges or expenses imposed by the variable annuity and life insurance contracts for which the Franklin Templeton Variable Insurance Products Trust serves as an underlying investment vehicle. Total return is not annualized for periods less than one year.
eRatios are annualized for periods less than one year.
fBenefit of expense reduction rounds to less than 0.01%.
The accompanying notes are an integral part of these financial statements.
FLG-10
Franklin Templeton Variable Insurance Products Trust
Statement of Investments, December 31, 2008
| | | | | | | |
| Franklin Large Cap Growth Securities Fund | | Country | | Shares | | Value |
Common Stocks 94.4% | | | | | | | |
Consumer Discretionary 4.6% | | | | | | | |
Abercrombie & Fitch Co., A | | United States | | 77,400 | | $ | 1,785,618 |
CBS Corp., B | | United States | | 530,600 | | | 4,345,614 |
Comcast Corp. | | United States | | 213,200 | | | 3,598,816 |
Harman International Industries Inc. | | United States | | 214,400 | | | 3,586,912 |
Target Corp. | | United States | | 42,700 | | | 1,474,431 |
The Walt Disney Co. | | United States | | 118,700 | | | 2,693,303 |
| | | | | | | |
| | | | | | | 17,484,694 |
| | | | | | | |
Consumer Staples 15.9% | | | | | | | |
Altria Group Inc. | | United States | | 130,000 | | | 1,957,800 |
The Coca-Cola Co. | | United States | | 38,400 | | | 1,738,368 |
Costco Wholesale Corp. | | United States | | 91,700 | | | 4,814,250 |
CVS Caremark Corp. | | United States | | 311,200 | | | 8,943,888 |
Diageo PLC, ADR | | United Kingdom | | 69,700 | | | 3,954,778 |
aHansen Natural Corp. | | United States | | 204,666 | | | 6,862,451 |
PepsiCo Inc. | | United States | | 86,600 | | | 4,743,082 |
Philip Morris International Inc. | | United States | | 141,600 | | | 6,161,016 |
The Procter & Gamble Co. | | United States | | 73,700 | | | 4,556,134 |
Safeway Inc. | | United States | | 98,400 | | | 2,338,968 |
Wal-Mart Stores Inc. | | United States | | 150,300 | | | 8,425,818 |
Walgreen Co. | | United States | | 246,354 | | | 6,077,553 |
| | | | | | | |
| | | | | | | 60,574,106 |
| | | | | | | |
Energy 10.0% | | | | | | | |
Chesapeake Energy Corp. | | United States | | 134,700 | | | 2,178,099 |
ConocoPhillips | | United States | | 129,400 | | | 6,702,920 |
Devon Energy Corp. | | United States | | 91,900 | | | 6,038,749 |
Exxon Mobil Corp. | | United States | | 90,500 | | | 7,224,615 |
Halliburton Co. | | United States | | 144,500 | | | 2,627,010 |
Marathon Oil Corp. | | United States | | 199,200 | | | 5,450,112 |
aNational Oilwell Varco Inc. | | United States | | 95,100 | | | 2,324,244 |
Schlumberger Ltd. | | United States | | 125,300 | | | 5,303,949 |
| | | | | | | |
| | | | | | | 37,849,698 |
| | | | | | | |
Financials 8.6% | | | | | | | |
Bank of America Corp. | | United States | | 273,058 | | | 3,844,657 |
Citigroup Inc. | | United States | | 175,300 | | | 1,176,263 |
Invesco Ltd. | | United States | | 230,700 | | | 3,331,308 |
JPMorgan Chase & Co. | | United States | | 184,840 | | | 5,828,005 |
Merrill Lynch & Co. Inc. | | United States | | 282,900 | | | 3,292,956 |
State Street Corp. | | United States | | 178,200 | | | 7,008,606 |
T. Rowe Price Group Inc. | | United States | | 66,800 | | | 2,367,392 |
Wells Fargo & Co. | | United States | | 197,600 | | | 5,825,248 |
| | | | | | | |
| | | | | | | 32,674,435 |
| | | | | | | |
Health Care 19.3% | | | | | | | |
aGenentech Inc. | | United States | | 190,100 | | | 15,761,191 |
aGenzyme Corp. | | United States | | 81,100 | | | 5,382,607 |
Johnson & Johnson | | United States | | 130,100 | | | 7,783,883 |
Medtronic Inc. | | United States | | 145,500 | | | 4,571,610 |
Merck & Co. Inc. | | United States | | 237,500 | | | 7,220,000 |
Roche Holding AG, ADR | | Switzerland | | 16,600 | | | 1,270,730 |
Schering-Plough Corp. | | United States | | 662,200 | | | 11,277,266 |
Teva Pharmaceutical Industries Ltd., ADR | | Israel | | 188,900 | | | 8,041,473 |
FLG-11
Franklin Templeton Variable Insurance Products Trust
Statement of Investments, December 31, 2008 (continued)
| | | | | | | |
| Franklin Large Cap Growth Securities Fund | | Country | | Shares | | Value |
Common Stocks (continued) | | | | | | | |
Health Care (continued) | | | | | | | |
aWaters Corp. | | United States | | 106,600 | | $ | 3,906,890 |
aWellPoint Inc. | | United States | | 195,200 | | | 8,223,776 |
| | | | | | | |
| | | | | | | 73,439,426 |
| | | | | | | |
Industrials 4.5% | | | | | | | |
The Boeing Co. | | United States | | 281,800 | | | 12,024,406 |
General Electric Co. | | United States | | 304,800 | | | 4,937,760 |
| | | | | | | |
| | | | | | | 16,962,166 |
| | | | | | | |
Information Technology 19.4% | | | | | | | |
aAgilent Technologies Inc. | | United States | | 238,000 | | | 3,719,940 |
aApple Inc. | | United States | | 37,000 | | | 3,157,950 |
aAutodesk Inc. | | United States | | 63,600 | | | 1,249,740 |
aCisco Systems Inc. | | United States | | 243,300 | | | 3,965,790 |
aDell Inc. | | United States | | 234,400 | | | 2,400,256 |
aEMC Corp. | | United States | | 234,800 | | | 2,458,356 |
aGoogle Inc., A | | United States | | 19,000 | | | 5,845,350 |
Hewlett-Packard Co. | | United States | | 242,700 | | | 8,807,583 |
Intel Corp. | | United States | | 427,400 | | | 6,265,684 |
International Business Machines Corp. | | United States | | 123,700 | | | 10,410,592 |
Microsoft Corp. | | United States | | 376,100 | | | 7,311,384 |
aNetApp Inc. | | United States | | 185,300 | | | 2,588,641 |
Nokia Corp., ADR | | Finland | | 240,500 | | | 3,751,800 |
QUALCOMM Inc. | | United States | | 247,300 | | | 8,860,759 |
Texas Instruments Inc. | | United States | | 200,500 | | | 3,111,760 |
| | | | | | | |
| | | | | | | 73,905,585 |
| | | | | | | |
Materials 0.7% | | | | | | | |
Weyerhaeuser Co. | | United States | | 81,000 | | | 2,479,410 |
| | | | | | | |
Telecommunication Services 4.5% | | | | | | | |
AT&T Inc. | | United States | | 370,400 | | | 10,556,400 |
aNII Holdings Inc. | | United States | | 101,550 | | | 1,846,179 |
Verizon Communications Inc. | | United States | | 140,000 | | | 4,746,000 |
| | | | | | | |
| | | | | | | 17,148,579 |
| | | | | | | |
Utilities 6.9% | | | | | | | |
Allegheny Energy Inc. | | United States | | 99,100 | | | 3,355,526 |
Constellation Energy Group | | United States | | 134,700 | | | 3,379,623 |
aDynegy Inc. | | United States | | 549,200 | | | 1,098,400 |
Exelon Corp. | | United States | | 92,200 | | | 5,127,242 |
NV Energy Corp. | | United States | | 602,100 | | | 5,954,769 |
Public Service Enterprise Group Inc. | | United States | | 255,600 | | | 7,455,852 |
| | | | | | | |
| | | | | | | 26,371,412 |
| | | | | | | |
Total Common Stocks (Cost $414,398,523) | | | | | | | 358,889,511 |
| | | | | | | |
FLG-12
Franklin Templeton Variable Insurance Products Trust
Statement of Investments, December 31, 2008 (continued)
| | | | | | | | | |
| Franklin Large Cap Growth Securities Fund | | Country | | Principal
Amount | | Value | |
Short Term Investments (Cost $22,902,035) 6.0% | | | | | | | | | |
bRepurchase Agreements 6.0% | | | | | | | | | |
Joint Repurchase Agreement, 0.019%, 01/02/09 (Maturity Value $22,902,060) | | United States | | $ | 22,902,035 | | $ | 22,902,035 | |
Banc of America Securities LLC (Maturity Value $3,534,703) Barclays Capital Inc. (Maturity Value $3,366,603) BNP Paribas Securities Corp. (Maturity Value $4,488,804) Credit Suisse Securities (USA) LLC (Maturity Value $4,488,804) Deutsche Bank Securities Inc. (Maturity Value $2,590,452) HSBC Securities (USA) Inc. (Maturity Value $3,366,603) UBS Securities LLC (Maturity Value $1,066,091) | | | | | | | | | |
Collateralized by U.S. Government Agency Securities, 3.50% - 7.00%, 6/15/09 - 5/20/22;
cU.S. Government Agency Discount Notes, 1/05/09 - 10/19/09; cU.S. Treasury Bills, 1/15/09; and U.S. Treasury Notes, 0.875% - 4.625%, 7/15/09 - 2/28/11 | | | | | | | | | |
| | | | | | | | | |
Total Investments (Cost $437,300,558) 100.4% | | | | | | | | 381,791,546 | |
Other Assets, less Liabilities (0.4)% | | | | | | | | (1,539,997 | ) |
| | | | | | | | | |
Net Assets 100.0% | | | | | | | $ | 380,251,549 | |
| | | | | | | | | |
See Abbreviations on page FLG-22.
aNon-income producing for the twelve months ended December 31, 2008.
bSee Note 1(c) regarding joint repurchase agreement.
cThe security is traded on a discount basis with no stated coupon rate.
The accompanying notes are an integral part of these financial statements.
FLG-13
Franklin Templeton Variable Insurance Products Trust
Financial Statements
Statement of Assets and Liabilities
December 31, 2008
| | | | |
| | | Franklin
Large Cap Growth
Securities Fund | |
Assets: | | | | |
Investments in securities: | | | | |
Cost - Unaffiliated issuers | | $ | 414,398,523 | |
Cost - Repurchase agreements | | | 22,902,035 | |
| | | | |
Total cost of investments | | $ | 437,300,558 | |
| | | | |
Value - Unaffiliated issuers | | $ | 358,889,511 | |
Value - Repurchase agreements | | | 22,902,035 | |
| | | | |
Total value of investments | | | 381,791,546 | |
Receivables: | | | | |
Capital shares sold | | | 23,066 | |
Dividends | | | 781,479 | |
Other assets | | | 4,338 | |
| | | | |
Total assets | | | 382,600,429 | |
| | | | |
Liabilities: | | | | |
Payables: | | | | |
Investment securities purchased | | | 1,738,061 | |
Capital shares redeemed | | | 109,940 | |
Affiliates | | | 369,683 | |
Accrued expenses and other liabilities | | | 131,196 | |
| | | | |
Total liabilities | | | 2,348,880 | |
| | | | |
Net assets, at value | | $ | 380,251,549 | |
| | | | |
Net assets consist of: | | | | |
Paid-in capital | | $ | 516,439,186 | |
Undistributed net investment income | | | 5,867,639 | |
Net unrealized appreciation (depreciation) | | | (55,509,012 | ) |
Accumulated net realized gain (loss) | | | (86,546,264 | ) |
| | | | |
Net assets, at value | | $ | 380,251,549 | |
| | | | |
Class 1: | | | | |
Net assets, at value | | $ | 51,650,865 | |
| | | | |
Shares outstanding | | | 4,846,787 | |
| | | | |
Net asset value and maximum offering price per share | | $ | 10.66 | |
| | | | |
Class 2: | | | | |
Net assets, at value | | $ | 328,597,372 | |
| | | | |
Shares outstanding | | | 31,304,537 | |
| | | | |
Net asset value and maximum offering price per share | | $ | 10.50 | |
| | | | |
Class 4: | | | | |
Net assets, at value | | $ | 3,312 | |
| | | | |
Shares outstanding | | | 312 | |
| | | | |
Net asset value and maximum offering price per share | | $ | 10.62 | |
| | | | |
The accompanying notes are an integral part of these financial statements.
FLG-14
Franklin Templeton Variable Insurance Products Trust
Financial Statements (continued)
Statement of Operations
for the year ended December 31, 2008
| | | | |
| | | Franklin
Large Cap Growth
Securities Fund | |
Investment income: | | | | |
Dividends | | $ | 10,552,587 | |
Interest | | | 618,199 | |
| | | | |
Total investment income | | | 11,170,786 | |
| | | | |
Expenses: | | | | |
Management fees (Note 3a) | | | 4,172,844 | |
Distribution fees: (Note 3c) | | | | |
Class 2 | | | 1,242,575 | |
Class 4 | | | 13 | |
Unaffiliated transfer agent fees | | | 817 | |
Custodian fees (Note 4) | | | 13,183 | |
Reports to shareholders | | | 137,287 | |
Professional fees | | | 28,722 | |
Trustees’ fees and expenses | | | 3,080 | |
Other | | | 22,130 | |
| | | | |
Total expenses | | | 5,620,651 | |
Expense reductions (Note 4) | | | (1,115 | ) |
| | | | |
Net expenses | | | 5,619,536 | |
| | | | |
Net investment income | | | 5,551,250 | |
| | | | |
Realized and unrealized gains (losses): | | | | |
Net realized gain (loss) from: | | | | |
Investments | | | (83,512,678 | ) |
Foreign currency transactions | | | 27,247 | |
| | | | |
Net realized gain (loss) | | | (83,485,431 | ) |
| | | | |
Net change in unrealized appreciation (depreciation) on investments | | | (151,830,475 | ) |
| | | | |
Net realized and unrealized gain (loss) | | | (235,315,906 | ) |
| | | | |
Net increase (decrease) in net assets resulting from operations | | $ | (229,764,656 | ) |
| | | | |
The accompanying notes are an integral part of these financial statements.
FLG-15
Franklin Templeton Variable Insurance Products Trust
Financial Statements (continued)
Statements of Changes in Net Assets
| | | | | | | | |
| | | Franklin Large Cap Growth
Securities Fund | |
| | | Year Ended December 31, | |
| | | 2008 | | | 2007 | |
| | | | |
Increase (decrease) in net assets: | | | | | | | | |
Operations: | | | | | | | | |
Net investment income | | $ | 5,551,250 | | | $ | 7,847,225 | |
Net realized gain (loss) from investments and foreign currency transactions | | | (83,485,431 | ) | | | 40,375,688 | |
Net change in unrealized appreciation (depreciation) on investments | | | (151,830,475 | ) | | | 615,536 | |
| | | | |
Net increase (decrease) in net assets resulting from operations | | | (229,764,656 | ) | | | 48,838,449 | |
| | | | |
Distributions to shareholders from: | | | | | | | | |
Net investment income: | | | | | | | | |
Class 1 | | | (1,183,538 | ) | | | (1,011,747 | ) |
Class 2 | | | (6,484,690 | ) | | | (5,183,286 | ) |
Class 4 | | | (73 | ) | | | — | |
Net realized gains: | | | | | | | | |
Class 1 | | | (4,817,075 | ) | | | (783,904 | ) |
Class 2 | | | (33,345,360 | ) | | | (5,103,109 | ) |
Class 4 | | | (298 | ) | | | — | |
| | | | |
Total distributions to shareholders | | | (45,831,034 | ) | | | (12,082,046 | ) |
| | | | |
Capital share transactions: (Note 2) | | | | | | | | |
Class 1 | | | (9,557,762 | ) | | | (23,683,527 | ) |
Class 2 | | | (73,871,480 | ) | | | (25,322,436 | ) |
Class 4 | | | 5,000 | | | | — | |
| | | | |
Total capital share transactions | | | (83,424,242 | ) | | | (49,005,963 | ) |
| | | | |
Net increase (decrease) in net assets | | | (359,019,932 | ) | | | (12,249,560 | ) |
Net assets: | | | | | | | | |
Beginning of year | | | 739,271,481 | | | | 751,521,041 | |
| | | | |
End of year | | $ | 380,251,549 | | | $ | 739,271,481 | |
| | | | |
Undistributed net investment income included in net assets: | | | | | | | | |
End of year | | $ | 5,867,639 | | | $ | 7,959,580 | |
| | | | |
The accompanying notes are an integral part of these financial statements.
FLG-16
Franklin Templeton Variable Insurance Products Trust
Notes to Financial Statements
Franklin Large Cap Growth Securities Fund
1. ORGANIZATION AND SIGNIFICANT ACCOUNTING POLICIES
Franklin Templeton Variable Insurance Products Trust (Trust) is registered under the Investment Company Act of 1940, as amended, (1940 Act) as an open-end investment company, consisting of twenty-three separate funds. The Franklin Large Cap Growth Securities Fund (Fund) is included in this report. The financial statements of the remaining funds in the Trust are presented separately. Shares of the Fund are sold only to insurance company separate accounts to fund the benefits of variable life insurance policies or variable annuity contracts. The Fund offers three classes of shares: Class 1, Class 2 and Class 4. Effective February 29, 2008, the Fund began offering a new class of shares, Class 4. Each class of shares differs by its distribution fees, voting rights on matters affecting a single class and its exchange privilege.
The following summarizes the Fund’s significant accounting policies.
a. Security Valuation
Securities listed on a securities exchange or on the NASDAQ National Market System are valued at the last quoted sale price or the official closing price of the day, respectively. Over-the-counter securities and listed securities for which there is no reported sale are valued within the range of the most recent quoted bid and ask prices. Securities that trade in multiple markets or on multiple exchanges are valued according to the broadest and most representative market.
The Trust has procedures to determine the fair value of individual securities and other assets for which market prices are not readily available or which may not be reliably priced. Methods for valuing these securities may include: fundamental analysis, matrix pricing, discounts from market prices of similar securities, or discounts applied due to the nature and duration of restrictions on the disposition of the securities. Due to the inherent uncertainty of valuations of such securities, the fair values may differ significantly from the values that would have been used had a ready market for such investments existed. Occasionally, events occur between the time at which trading in a security is completed and the close of the NYSE that might call into question the availability (including the reliability) of the value of a portfolio security held by the Fund. If such an event occurs, the securities may be valued using fair value procedures, which may include the use of independent pricing services. All security valuation procedures are approved by the Trust’s Board of Trustees.
b. Foreign Currency Translation
Portfolio securities and other assets and liabilities denominated in foreign currencies are translated into U.S. dollars based on the exchange rate of such currencies against U.S. dollars on the date of valuation. Purchases and sales of securities, income and expense items denominated in foreign currencies are translated into U.S. dollars at the exchange rate in effect on the transaction date. Occasionally, events may impact the availability or reliability of foreign exchange rates used to convert the U.S. dollar equivalent value. If such an event occurs, the foreign exchange rate will be valued at fair value using procedures established and approved by the Trust’s Board of Trustees.
The Fund does not separately report the effect of changes in foreign exchange rates from changes in market prices on securities held. Such changes are included in net realized and unrealized gain or loss from investments on the Statement of Operations.
Realized foreign exchange gains or losses arise from sales of foreign currencies, currency gains or losses realized between the trade and settlement dates on securities transactions and the difference between the recorded amounts of dividends, interest, and foreign withholding taxes and the U.S. dollar equivalent of the amounts actually received or paid. Net unrealized foreign exchange gains and losses arise from changes in foreign exchange rates on foreign denominated assets and liabilities other than investments in securities held at the end of the reporting period.
c. Joint Repurchase Agreement
The Fund may enter into a joint repurchase agreement whereby its uninvested cash balance is deposited into a joint cash account with other funds managed by the investment manager or an affiliate of the investment manager and is used to invest in one or
FLG-17
Franklin Templeton Variable Insurance Products Trust
Notes to Financial Statements (continued)
Franklin Large Cap Growth Securities Fund
1. ORGANIZATION AND SIGNIFICANT ACCOUNTING POLICIES (continued)
c. Joint Repurchase Agreement (continued)
more repurchase agreements. The value and face amount of the joint repurchase agreement are allocated to the funds based on their pro-rata interest. A repurchase agreement is accounted for as a loan by the fund to the seller, collateralized by securities which are delivered to the fund’s custodian. The market value, including accrued interest, of the initial collateralization is required to be at least 102% of the dollar amount invested by the funds, with the value of the underlying securities marked to market daily to maintain coverage of at least 100%. The joint repurchase agreement held by the Fund at year end had been entered into on December 31, 2008. The joint repurchase agreement is valued at cost.
d. Foreign Currency Contracts
When the Fund purchases or sells foreign securities it may enter into foreign exchange contracts to minimize foreign exchange risk from the trade date to the settlement date of the transactions. A foreign exchange contract is an agreement between two parties to exchange different currencies at an agreed upon exchange rate at a future date. Realized and unrealized gains and losses on these contracts are included in the Statement of Operations.
The risks of these contracts include movement in the values of the foreign currencies relative to the U.S. dollar and the possible inability of the counterparties to fulfill their obligations under the contracts, which may be in excess of the amount reflected in the Statement of Assets and Liabilities.
e. Income Taxes
No provision has been made for U.S. income taxes because it is the Fund’s policy to qualify as a regulated investment company under the Internal Revenue Code and to distribute to shareholders substantially all of its taxable income and net realized gains.
The Fund has reviewed the tax positions, taken on federal income tax returns, for each of the three open tax years and as of December 31, 2008, and has determined that no provision for income tax is required in the Fund’s financial statements.
f. Security Transactions, Investment Income, Expenses and Distributions
Security transactions are accounted for on trade date. Realized gains and losses on security transactions are determined on a specific identification basis. Interest income and estimated expenses are accrued daily. Dividend income is recorded on the ex-dividend date. Distributions to shareholders are recorded on the ex-dividend date and are determined according to income tax regulations (tax basis). Distributable earnings determined on a tax basis may differ from earnings recorded in accordance with accounting principles generally accepted in the United States of America. These differences may be permanent or temporary. Permanent differences are reclassified among capital accounts to reflect their tax character. These reclassifications have no impact on net assets or the results of operations. Temporary differences are not reclassified, as they may reverse in subsequent periods.
Common expenses incurred by the Trust are allocated among the funds based on the ratio of net assets of each fund to the combined net assets of the Trust. Fund specific expenses are charged directly to the fund that incurred the expense.
Realized and unrealized gains and losses and net investment income, not including class specific expenses, are allocated daily to each class of shares based upon the relative proportion of net assets of each class. Differences in per share distributions, by class, are generally due to differences in class specific expenses.
FLG-18
Franklin Templeton Variable Insurance Products Trust
Notes to Financial Statements (continued)
Franklin Large Cap Growth Securities Fund
1. ORGANIZATION AND SIGNIFICANT ACCOUNTING POLICIES (continued)
g. Accounting Estimates
The preparation of financial statements in accordance with accounting principles generally accepted in the United States of America requires management to make estimates and assumptions that affect the reported amounts of assets and liabilities at the date of the financial statements and the amounts of income and expenses during the reporting period. Actual results could differ from those estimates.
h. Guarantees and Indemnifications
Under the Trust’s organizational documents, its officers and trustees are indemnified by the Trust against certain liabilities arising out of the performance of their duties to the Trust. Additionally, in the normal course of business, the Trust, on behalf of the Fund, enters into contracts with service providers that contain general indemnification clauses. The Trust’s maximum exposure under these arrangements is unknown as this would involve future claims that may be made against the Trust that have not yet occurred. Currently, the Trust expects the risk of loss to be remote.
2. SHARES OF BENEFICIAL INTEREST
At December 31, 2008, there were an unlimited number of shares authorized (without par value). Transactions in the Fund’s shares were as follows:
| | | | | | | | | | | | | | |
| | | Year Ended December 31, | |
| | | 2008a | | | 2007 | |
| Class 1 Shares: | | Shares | | | Amount | | | Shares | | | Amount | |
Shares sold | | 42,013 | | | $ | 581,393 | | | 49,014 | | | $ | 867,822 | |
Shares issued in reinvestment of distributions | | 390,665 | | | | 6,000,613 | | | 98,500 | | | | 1,795,651 | |
Shares redeemed | | (1,122,371 | ) | | | (16,139,768 | ) | | (1,491,144 | ) | | | (26,347,000 | ) |
| | | | |
Net increase (decrease) | | (689,693 | ) | | $ | (9,557,762 | ) | | (1,343,630 | ) | | $ | (23,683,527 | ) |
| | | | |
| Class 2 Shares: | | | | | | | | | | | | |
Shares sold | | 2,042,228 | | | $ | 30,356,073 | | | 4,957,506 | | | $ | 85,672,603 | |
Shares issued in reinvestment of distributions | | 2,630,783 | | | | 39,830,049 | | | 572,102 | | | | 10,286,395 | |
Shares redeemed | | (10,607,967 | ) | | | (144,057,602 | ) | | (6,934,030 | ) | | | (121,281,434 | ) |
| | | | |
Net increase (decrease) | | (5,934,956 | ) | | $ | (73,871,480 | ) | | (1,404,422 | ) | | $ | (25,322,436 | ) |
| | | | |
| Class 4 Shares: | | | | | | | | | | | | |
Shares sold | | 312 | | | $ | 5,000 | | | | | | | | |
| | | | | | | | | | |
aFor | the period February 29, 2008 (effective date) to December 31, 2008 for Class 4. |
3. TRANSACTIONS WITH AFFILIATES
Franklin Resources, Inc. is the holding company for various subsidiaries that together are referred to as Franklin Templeton Investments. Certain officers and trustees of the Trust are also officers and/or directors of the following subsidiaries:
| | |
| Subsidiary | | Affiliation |
Franklin Advisers, Inc. (Advisers) | | Investment manager |
Franklin Templeton Services, LLC (FT Services) | | Administrative manager |
Franklin Templeton Distributors, Inc. (Distributors) | | Principal underwriter |
Franklin Templeton Investor Services, LLC (Investor Services) | | Transfer agent |
FLG-19
Franklin Templeton Variable Insurance Products Trust
Notes to Financial Statements (continued)
Franklin Large Cap Growth Securities Fund
3. TRANSACTIONS WITH AFFILIATES (continued)
a. Management Fees
The Fund pays an investment management fee to Advisers based on the average daily net assets of the Fund as follows:
| | |
| Annualized Fee Rate | | Net Assets |
| 0.750% | | Up to and including $500 million |
| 0.625% | | Over $500 million, up to and including $1 billion |
| 0.500% | | In excess of $1 billion |
b. Administrative Fees
Under an agreement with Advisers, FT Services provides administrative services to the Fund. The fee is paid by Advisers based on average daily net assets, and is not an additional expense of the Fund.
c. Distribution Fees
The Fund’s Board of Trustees has adopted distribution plans for Class 2 and Class 4 shares pursuant to Rule 12b-1 under the 1940 Act. Under the Fund’s compensation distribution plans, the Fund pays Distributors for costs incurred in connection with the servicing, sale and distribution of the Fund’s shares up to 0.35% per year of its average daily net assets of each class. The Board of Trustees has agreed to limit the current rate to 0.25% per year for Class 2.
d. Transfer Agent Fees
Investor Services, under terms of an agreement, performs shareholder servicing for the Fund and is not paid by the Fund for the services.
4. EXPENSE OFFSET ARRANGEMENT
The Fund has entered into an arrangement with its custodian whereby credits realized as a result of uninvested cash balances are used to reduce a portion of the Fund’s custodian expenses. During the year ended December 31, 2008, the custodian fees were reduced as noted in the Statement of Operations.
5. INCOME TAXES
For tax purposes, capital losses may be carried over to offset future capital gains, if any. At December 31, 2008, the Fund had tax basis capital losses of $67,794,923 expiring in 2016.
For tax purposes, realized capital losses and realized currency losses occurring subsequent to October 31, may be deferred and treated as occurring on the first day of the following fiscal year. At December 31, 2008, the Fund deferred realized capital losses and realized currency losses of $12,505,197 and $105, respectively.
The tax character of distributions paid during the years ended December 31, 2008 and 2007, was as follows:
| | | | | | |
| | | 2008 | | 2007 |
Distributions paid from: | | | | | | |
Ordinary Income | | $ | 21,652,204 | | $ | 6,195,033 |
Long term capital gain | | | 24,178,830 | | | 5,887,013 |
| | | |
| | $ | 45,831,034 | | $ | 12,082,046 |
| | | |
FLG-20
Franklin Templeton Variable Insurance Products Trust
Notes to Financial Statements (continued)
Franklin Large Cap Growth Securities Fund
5. INCOME TAXES (continued)
At December 31, 2008, the cost of investments, net unrealized appreciation (depreciation) and undistributed ordinary income for income tax purposes were as follows:
| | | | |
Cost of investments | | $ | 443,546,597 | |
| | | | |
| |
Unrealized appreciation | | $ | 23,206,804 | |
Unrealized depreciation | | | (84,961,855 | ) |
| | | | |
Net unrealized appreciation (depreciation) | | $ | (61,755,051 | ) |
| | | | |
Distributable earnings – undistributed ordinary income | | $ | 5,867,639 | |
| | | | |
Net investment income differs for financial statement and tax purposes primarily due to differing treatment of foreign currency transactions.
Net realized gains (losses) differ for financial statement and tax purposes primarily due to differing treatments of wash sales and foreign currency transactions.
6. INVESTMENT TRANSACTIONS
Purchases and sales of investments (excluding short term securities) for the year ended December 31, 2008, aggregated $363,022,784 and $474,212,654, respectively.
7. FAIR VALUE MEASUREMENTS
The Fund adopted Financial Accounting Standards Board (FASB) Statement No. 157, “Fair Value Measurement” (SFAS 157), on January 1, 2008. SFAS 157 defines fair value, establishes a framework for measuring fair value, and expands disclosures about fair value measurements. The Fund has determined that the implementation of SFAS 157 did not have a material impact on the Fund’s financial statements.
SFAS 157 establishes a fair value hierarchy that distinguishes between market data obtained from independent sources (observable inputs) and the Fund’s own market assumptions (unobservable inputs). These inputs are used in determining the value of the Fund’s investments and are summarized in the following fair value hierarchy:
| | • | | Level 1 – quoted prices in active markets for identical securities |
| | • | | Level 2 – other significant observable inputs (including quoted prices for similar securities, interest rates, prepayment speed, credit risk, etc.) |
| | • | | Level 3 – significant unobservable inputs (including the Fund’s own assumptions in determining the fair value of investments) |
The inputs or methodology used for valuing securities are not an indication of the risk associated with investing in those securities.
The following is a summary of the inputs used as of December 31, 2008, in valuing the Fund’s assets carried at fair value:
| | | | | | | | | | | | |
| | | Level 1 | | Level 2 | | Level 3 | | Total |
| Assets: | | | | | | | | |
Investments in Securities | | $ | 358,889,511 | | $ | 22,902,035 | | $ | — | | $ | 381,791,546 |
FLG-21
Franklin Templeton Variable Insurance Products Trust
Notes to Financial Statements (continued)
Franklin Large Cap Growth Securities Fund
8. NEW ACCOUNTING PRONOUNCEMENT
In March 2008, FASB issued FASB Statement No. 161, “Disclosures about Derivative Instruments and Hedging Activities, an amendment of FASB Statement No. 133” (SFAS 161), which expands disclosures about derivative investments and hedging activities. SFAS 161 is effective for fiscal years and interim periods beginning after November 15, 2008. The Fund is currently evaluating the impact, if any, of applying the various provisions of SFAS 161.
9. SUBSEQUENT EVENT
On January 23, 2009, the Fund entered into, along with other funds managed by Franklin Templeton Investments (individually, “Borrower”; collectively “Borrowers”), a $725 million senior unsecured syndicated global line of credit (“Global Credit Facility”) to provide a source of funds to the Borrowers for temporary and emergency purposes and to meet future unanticipated or unusually large redemption requests.
Under the terms of the Global Credit Facility, each Borrower has agreed to pay its proportionate share of fees and expenses incurred in connection with the implementation and maintenance of the Global Credit Facility.
ABBREVIATIONS
Selected Portfolio
ADR - American Depository Receipt
FLG-22
Franklin Templeton Variable Insurance Products Trust
Franklin Large Cap Growth Securities Fund
Report of Independent Registered Public Accounting Firm
To the Board of Trustees and Shareholders of Franklin Templeton Variable Insurance Products Trust
In our opinion, the accompanying statement of assets and liabilities, including the statement of investments, and the related statements of operations and of changes in net assets and the financial highlights present fairly, in all material respects, the financial position of Franklin Large Cap Growth Securities Fund (one of the funds constituting the Franklin Templeton Variable Insurance Products Trust, hereafter referred to as the “Fund”) at December 31, 2008, the results of its operations for the year then ended, the changes in its net assets for each of the two years in the period then ended and the financial highlights for periods presented, in conformity with accounting principles generally accepted in the United States of America. These financial statements and financial highlights (hereafter referred to as “financial statements”) are the responsibility of the Fund’s management. Our responsibility is to express an opinion on these financial statements based on our audits. We conducted our audits of these financial statements in accordance with the standards of the Public Company Accounting Oversight Board (United States). Those standards require that we plan and perform the audit to obtain reasonable assurance about whether the financial statements are free of material misstatement. An audit includes examining, on a test basis, evidence supporting the amounts and disclosures in the financial statements, assessing the accounting principles used and significant estimates made by management, and evaluating the overall financial statement presentation. We believe that our audits, which included confirmation of securities at December 31, 2008 by correspondence with the custodian and brokers, provide a reasonable basis for our opinion.
PricewaterhouseCoopers LLP
San Francisco, California
February 10, 2009
FLG-23
Franklin Templeton Variable Insurance Products Trust
Tax Designation (unaudited)
Franklin Large Cap Growth Securities Fund
Under Section 854(b)(2) of the Internal Revenue Code, the Fund designates 44.69% of the ordinary income dividends as income qualifying for the dividends received deduction for the fiscal year ended December 31, 2008.
FLG-24
FRANKLIN MONEY MARKET FUND
Fund Goal and Main Investments: Franklin Money Market Fund seeks high current income, consistent with liquidity and capital preservation. The Fund invests exclusively in U.S. dollar denominated money market debt instruments. The Fund seeks to maintain a stable share price of $1.00, but there is no guarantee that it will be able to do so.
This annual report for Franklin Money Market Fund covers the fiscal year ended December 31, 2008.
Economic and Market Overview
In 2008, economic conditions deteriorated. The Conference Board’s Consumer Confidence Index fell to an all-time low since it began in 1967 as the U.S. economy faltered and stock markets declined. The government’s abrupt conservatorship of Fannie Mae and Freddie Mac and the failure of several blue-chip banks and financial institutions roiled equity markets. Despite government interventions and massive emergency funding, the nation’s economic troubles were exacerbated as manufacturing activity weakened at its fastest pace in nearly 30 years and as home prices continued to fall. Jobless claims mounted and the unemployment rate rose to 7.2% by period-end.1 Economic growth, as measured by gross domestic product (GDP), rebounded from a 0.9% annualized rate in the first quarter of 2008 to a 2.8% annualized pace in the second quarter, largely due to strong exports and government spending. However, in the third and fourth quarters of 2008, GDP fell at annualized rates of 0.5% and an estimated 3.8%, reflecting a broad-based contraction in consumer spending, falling corporate profits and slowing export growth.
Oil prices soared to a record high in July, rising above $145 per barrel, before dramatically retreating to $45 by period-end. Many other commodities such as agricultural products and precious and base metals followed similar trends. Partially as a result of the steep price corrections, inflation declined significantly late in the review period, and December’s inflation rate was an annualized 0.1%.1 Core inflation, which excludes food and energy costs, rose at a 1.8% annual rate; this level was within the Federal Reserve Board’s (Fed’s) informal target range of 1.5%–2.0%.1 The core personal consumption expenditures price index reported a 12-month increase of 1.7%.2
1. Source: Bureau of Labor Statistics.
2. Source: Bureau of Economic Analysis.
An investment in the Fund is neither insured nor guaranteed by the U.S. government or by any other entity or institution. There is no assurance the $1.00 share price will be maintained and it is possible to lose money by investing in the Fund. The Fund’s prospectus also includes a description of the main investment risks.
FM-1
A slowing economy and decelerating inflation prompted policymakers to further lower interest rates and enact stimulus plans. During the year under review, the Fed lowered the federal funds target rate to a range of 0% to 0.25% from 4.25% at the start of the reporting period. The Fed and U.S. Treasury Department also introduced new programs such as the Primary Dealer Credit Facility (PDCF) and the Troubled Asset Relief Program (TARP), which were intended to stimulate market liquidity.
Volatility remained high throughout the reporting period but intensified in the latter half of the year as stocks fluctuated wildly, Treasury prices soared and yields across the maturity spectrum plummeted. Investors drove the yield on the three-month Treasury bill to a multi-decade low, and LIBOR (London InterBank Offered Rate) rates, which banks charge one another for loans, jumped to record highs. Fixed income spreads were generally wide relative to Treasury yields over the period due to heightened market turbulence and risk aversion. The yield curve steepened and the spread between the two-year Treasury yield and the 10-year Treasury yield increased to 149 basis points (100 basis points equal one percentage point) at the end of December from 99 basis points at the beginning of the reporting period. The two-year Treasury bill yield fell from 3.05% to 0.76% over the 12-month period. Over the same period, the 10-year U.S. Treasury note yield fell from 4.04% to 2.25%.
Investment Strategy
In selecting investments, we use a conservative investment approach, focusing on the highest-quality eligible money market securities. We assess the relative value of each security meeting our credit criteria to find the best combination of assets we believe will maximize the Fund’s yield relative to our expectations of the investment environment. We monitor short-term interest rates, economic conditions, and Federal Reserve Board monetary policy to determine the portfolio maturity we believe will provide high overall return.
Manager’s Discussion
Consistent with our strategy, we continued to invest mainly in high-quality money market securities. For example, on December 31, 2008, 100% of the portfolio was invested in securities with a short-term credit rating of A-1 or P-1, or higher, by independent credit rating agency Standard & Poor’s or Moody’s Investors Service.3
3. These do not indicate ratings of the Fund.
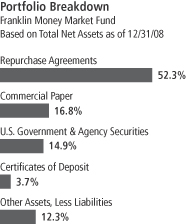
The dollar value, number of shares or principal amount, and names of all portfolio holdings are listed in the Fund’s Statement of Investments.
FM-2
Thank you for your participation in Franklin Money Market Fund. We look forward to serving your future investment needs.
The foregoing information reflects our analysis, opinions and portfolio holdings as of December 31, 2008, the end of the reporting period. The way we implement our main investment strategies and the resulting portfolio holdings may change depending on factors such as market and economic conditions. These opinions may not be relied upon as investment advice or an offer for a particular security. The information is not a complete analysis of every aspect of any market, country, industry, security or the Fund. Statements of fact are from sources considered reliable, but the investment manager makes no representation or warranty as to their completeness or accuracy. Although historical performance is no guarantee of future results, these insights may help you understand our investment management philosophy.
FM-3
Fund Expenses
As an investor in a variable insurance contract (Contract) that indirectly provides for investment in an underlying mutual fund, you can incur transaction and/or ongoing expenses at both the Fund level and the Contract level.
| • | | Transaction expenses can include sales charges (loads) on purchases, redemption fees, surrender fees, transfer fees and premium taxes. |
| • | | Ongoing expenses can include management fees, distribution and service (12b-1) fees, contract fees, annual maintenance fees, mortality and expense risk fees and other fees and expenses. All mutual funds and Contracts have some types of ongoing expenses. |
The expenses shown in the table are meant to highlight ongoing expenses at the Fund level only and do not include ongoing expenses at the Contract level, or transaction expenses at either the Fund or Contract level. While the Fund does not have transaction expenses, if the transaction and ongoing expenses at the Contract level were included, the expenses shown would be higher. You should consult your Contract prospectus or disclosure document for more information.
The table shows Fund-level ongoing expenses and can help you understand these expenses and compare them with those of other mutual funds offered through the Contract. The table assumes a $1,000 investment held for the six months indicated. Please refer to the Fund prospectus for additional information on operating expenses.
Actual Fund Expenses
The first line (Actual) of the table provides actual account values and expenses. The “Ending Account Value” is derived from the Fund’s actual return, which includes the effect of ongoing Fund expenses, but does not include the effect of ongoing Contract expenses.
You can estimate the Fund-level expenses you incurred during the period by following these steps. Of course, your account value and expenses will differ from those in this illustration:
| 1. | Divide your account value by $1,000. |
If an account had an $8,600 value, then $8,600 ÷ $1,000 = 8.6.
| 2. | Multiply the result by the number under the heading “Fund-Level Expenses Incurred During Period.” |
Fund-Level Expenses Incurred During Period were $7.50, then 8.6 x $7.50 = $64.50.
In this illustration, the estimated expenses incurred this period at the Fund level are $64.50.
Franklin Money Market Fund – Class 1
FM-4
Hypothetical Example for Comparison with Other Mutual Funds
Information in the second line (Hypothetical) of the table can help you compare ongoing expenses of the Fund with those of other mutual funds offered through the Contract. This information may not be used to estimate the actual ending account balance or expenses you incurred during the period. The hypothetical “Ending Account Value” is based on the Fund’s actual expense ratio and an assumed 5% annual rate of return before expenses, which does not represent the Fund’s actual return. The figure under the heading “Fund-Level Expenses Incurred During Period” shows the hypothetical expenses your account would have incurred under this scenario. You can compare this figure with the 5% hypothetical examples that appear in shareholder reports of other funds offered through a Contract.
| | | | | | | | | |
| Class 1 | | Beginning
Account
Value 7/1/08 | | Ending
Account
Value 12/31/08 | | Fund-Level
Expenses Incurred
During Period*
7/1/08–12/31/08 |
Actual | | $ | 1,000 | | $ | 1,004.70 | | $ | 3.23 |
Hypothetical (5% return before expenses) | | $ | 1,000 | | $ | 1,021.92 | | $ | 3.25 |
*Expenses are calculated using the most recent six-month annualized expense ratio, net of expense waiver, for the Fund’s Class 1 shares (0.64%), which does not include any ongoing expenses of the Contract for which the Fund is an investment option, multiplied by the average account value over the period, multiplied by 184/366 to reflect the one-half year period.
FM-5
SUPPLEMENT DATED OCTOBER 15, 2008
TOTHE PROSPECTUS DATED MAY 1, 2008
OF
FRANKLIN MONEY MARKET FUND
ASERIESOF FRANKLIN TEMPLETON VARIABLE INSURANCE PRODUCTS TRUST
The prospectus is amended to add the following:
On September 19, 2008, the Board of Trustees (the “Board”) of Franklin Templeton Variable Insurance Products Trust (the “Trust”) approved a proposal to liquidate the Franklin Money Market Fund (the “Fund”) on or after April 24, 2009 (the “liquidation”).
The Board approved the liquidation in the ordinary course of business after considering a number of factors including the continuing trend generally of insurance companies offering proprietary money market funds. As a result, the Fund has experienced a significant decline in assets over the last decade and has limited future opportunities for asset growth.
Contract owners should refer to documents provided by their insurance companies concerning the effect of the liquidation and any steps they may need to take. In addition, in considering new purchases or transfers, contract owners may want to refer to their contract and Trust prospectuses or consult with their investment representatives to consider other investment options.
Please keep this supplement for future reference.
FM-6
Supplement Dated December 5, 2008
to the Prospectus Dated May 1, 2008
of
Franklin Money Market Fund (the “Fund”)
A series of
Franklin Templeton Variable Insurance Products Trust (the “Trust”)
The prospectus is amended as follows:
| | I. | The Fund participates in the U.S. Department of the Treasury’s (“Treasury”) Temporary Guarantee Program for Money Market Funds (the “Program”). |
Under the Program, shares held by a shareholder in the Fund as of the close of business on September 19, 2008 (“Program Date”) are insured against loss in the event the per share value at the time of liquidation is less than $1 per share. The Program provides a guarantee to Fund shareholders based on the number of shares invested in the Fund at the close of business on the Program Date. Any increase in the number of shares held by a shareholder after the close of business on the Program Date will not be guaranteed. If the number of shares held by a shareholder fluctuates over the period, the shareholder will be covered for either the number of shares held as of the close of business on the Program Date, or the current amount, whichever is less.
The initial three-month period of the Program expires on December 18, 2008. However, on November 24, 2008, Treasury announced that the Program would be extended through April 30, 2009. On December 1, 2008, the board of trustees of the Trust approved the Fund’s continued participation in the Program through April 30, 2009, and the Fund will apply to participate in this Program extension.
Participation in the initial three months of the Program (i.e., until December 18, 2008) required payment to Treasury in the amount of 0.01% of the net asset value of each participating Fund as of the Program Date. Participation in the Program extension (i.e., the period from December 19, 2008 through April 30, 2009) requires an additional payment to Treasury in the amount of 0.015% of the net asset value of each participating Fund as of the Program Date. This expense will be borne by the Fund and therefore shared among all of the Fund’s shareholders while the Program is in effect. The Secretary of the Treasury may extend the Program beyond April 30, 2009, but no later than through the close of business on September 18, 2009. If the Program is extended further, the Fund will consider whether to continue to participate.
In the event that the Fund would have to liquidate its holdings, it will distribute the proceeds of the liquidation, including any amounts received under the Program, to
FM-7
Insurers, which shall have the sole responsibility for appropriately allocating the liquidation proceeds to Contract Owners.
As of the date of this Supplement, the Treasury has reported that assets available to support all participating money market funds will not exceed the amount available within the U.S. Treasury Department’s Exchange Stabilization Fund on the date of payment (currently, approximately $50 billion). More information about the Program is available at http://www.ustreas.gov.
| | II. | The “Annual Fund Operating Expenses” and the “Example” tables under the section “Fees and Expenses” are being revised as follows: |
ANNUAL FUND OPERATING EXPENSES (expenses deducted from Fund assets)
| | | | |
| | | Class 1 | | Class 2 |
Management fees¹ | | 0.63% | | 0.63% |
Distribution and service (12b-1 fees)² | | N/A | | 0.25% |
Other expenses³ | | 0.13% | | 0.13% |
Total annual operating expenses³ | | 0.76% | | 1.01% |
| 1. | The Fund’s administration fee is paid indirectly through the management fee. |
| 2. | While the maximum amount payable under the Fund’s Class 2 rule 12b-1 plan is 0.35% per year of the Class’s average daily net assets, the board of trustees has set the current rate at 0.25% through May 1, 2009. |
| 3. | Other expenses and total annual Fund operating expenses of the Fund have been restated to reflect fees relating to the Fund’s participation in the Treasury’s Temporary Guarantee Program for Money Market Funds through April 30, 2009. |
Example
| | | | | | | | | | | | |
| | | 1 Year | | 3 Years | | 5 Years | | 10 Years |
Class 1 | | $ | 78 | | $ | 236 | | $ | 409 | | $ | 909 |
Class 2 | | $ | 103 | | $ | 315 | | $ | 545 | | $ | 1,204 |
Please keep this supplement for future reference.
FM-8
Franklin Templeton Variable Insurance Products Trust
Financial Highlights
Franklin Money Market Fund
| | | | | | | | | | | | | | | | | | | | |
| | | Year Ended December 31, | |
| Class 1 | | 2008 | | | 2007 | | | 2006 | | | 2005 | | | 2004 | |
| | | | |
Per share operating performance | | | | | | | | | | | | | | | | | | | | |
(for a share outstanding throughout the year) | | | | | | | | | | | | | | | | | | | | |
Net asset value, beginning of year | | $ | 1.00 | | | $ | 1.00 | | | $ | 1.00 | | | $ | 1.00 | | | $ | 1.00 | |
| | | | |
Income from investment operations - net investment income | | | 0.015 | | | | 0.044 | | | | 0.043 | | | | 0.025 | | | | 0.007 | |
Less distributions from net investment income | | | (0.015 | ) | | | (0.044 | ) | | | (0.043 | ) | | | (0.025 | ) | | | (0.007 | ) |
| | | | |
Net asset value, end of year | | $ | 1.00 | | | $ | 1.00 | | | $ | 1.00 | | | $ | 1.00 | | | $ | 1.00 | |
| | | | |
| | | | | |
Total returna | | | 1.55% | | | | 4.52% | | | | 4.38% | | | | 2.55% | | | | 0.73% | |
Ratios to average net assets | | | | | | | | | | | | | | | | | | | | |
Expenses | | | 0.69% | b,c | | | 0.73% | b | | | 0.75% | b | | | 0.70% | b | | | 0.68% | |
Net investment income | | | 1.53% | | | | 4.43% | | | | 4.25% | | | | 2.48% | | | | 0.67% | |
| | | | | |
Supplemental data | | | | | | | | | | | | | | | | | | | | |
Net assets, end of year (000’s) | | $ | 39,459 | | | $ | 35,775 | | | $ | 39,198 | | | $ | 46,750 | | | $ | 59,026 | |
aTotal return does not include any fees, charges or expenses imposed by the variable annuity and life insurance contracts for which the Franklin Templeton Variable Insurance Products Trust serves as an underlying investment vehicle.
bBenefit of expense reduction rounds to less than 0.01%.
cRatio of expenses to average net assets, excluding payments/waivers by affiliate, was 0.74%.
The accompanying notes are an integral part of these financial statements.
FM-9
Franklin Templeton Variable Insurance Products Trust
Financial Highlights (continued)
Franklin Money Market Fund
| | | | | | | | | | | | | | | | | | | | |
| | | Year Ended December 31, | |
| Class 2 | | 2008 | | | 2007 | | | 2006 | | | 2005 | | | 2004 | |
| | | | |
Per share operating performance | | | | | | | | | | | | | | | | | | | | |
(for a share outstanding throughout the year) | | | | | | | | | | | | | | | | | | | | |
Net asset value, beginning of year | | $ | 1.00 | | | $ | 1.00 | | | $ | 1.00 | | | $ | 1.00 | | | $ | 1.00 | |
| | | | |
Income from investment operations - net investment income | | | 0.013 | | | | 0.042 | | | | 0.040 | | | | 0.023 | | | | 0.004 | |
Less distributions from net investment income | | | (0.013 | ) | | | (0.042 | ) | | | (0.040 | ) | | | (0.023 | ) | | | (0.004 | ) |
| | | | |
Net asset value, end of year | | $ | 1.00 | | | $ | 1.00 | | | $ | 1.00 | | | $ | 1.00 | | | $ | 1.00 | |
| | | | |
| | | | | |
Total returna | | | 1.30% | | | | 4.26% | | | | 4.12% | | | | 2.29% | | | | 0.44% | |
Ratios to average net assets | | | | | | | | | | | | | | | | | | | | |
Expenses | | | 0.94% | b,c | | | 0.98% | b | | | 1.00% | b | | | 0.95% | b | | | 0.93% | |
Net investment income | | | 1.28% | | | | 4.18% | | | | 4.00% | | | | 2.23% | | | | 0.42% | |
| | | | | |
Supplemental data | | | | | | | | | | | | | | | | | | | | |
Net assets, end of year (000’s) | | $ | 716 | | | $ | 873 | | | $ | 1,057 | | | $ | 962 | | | $ | 887 | |
aTotal return does not include any fees, charges or expenses imposed by the variable annuity and life insurance contracts for which the Franklin Templeton Variable Insurance Products Trust serves as an underlying investment vehicle.
bBenefit of expense reduction rounds to less than 0.01%.
cRatio of expenses to average net assets, excluding payments/waivers by affiliate, was 0.99%.
The accompanying notes are an integral part of these financial statements.
FM-10
Franklin Templeton Variable Insurance Products Trust
Statement of Investments, December 31, 2008
| | | | | | |
| Franklin Money Market Fund | | Principal
Amounta | | Value |
Investments 87.7% | | | | | | |
Certificates of Deposit 3.7% | | | | | | |
Australia & New Zealand Banking Group Ltd., New York Branch, 0.80%, 2/11/09 | | $ | 500,000 | | $ | 500,000 |
Bank of Nova Scotia, Houston Branch, 1.15%, 1/07/09 | | | 500,000 | | | 500,000 |
Westpac Banking Corp., New York Branch, 1.20%, 3/11/09 | | | 500,000 | | | 500,019 |
| | | | | | |
Total Certificates of Deposit (Cost $1,500,019) | | | | | | 1,500,019 |
| | | | | | |
bCommercial Paper 16.8% | | | | | | |
BP Capital Markets PLC, 2/02/09 | | | 500,000 | | | 499,000 |
Chevron Texaco Corp., 1/15/09 | | | 500,000 | | | 499,825 |
Commonwealth Bank of Australia, 2/10/09 | | | 500,000 | | | 499,455 |
Export Development Canada, 1/20/09 | | | 500,000 | | | 499,617 |
Export Development Canada, 4/02/09 | | | 500,000 | | | 498,231 |
Government of Canada, 1/12/09 (Canada) | | | 1,000,000 | | | 999,985 |
Merck & Co. Inc., 1/06/09 | | | 500,000 | | | 499,878 |
Province of British Columbia, 2/25/09 (Canada) | | | 500,000 | | | 498,587 |
Province of British Columbia, 3/05/09 (Canada) | | | 500,000 | | | 498,994 |
Province of Ontario, 2/12/09 (Canada) | | | 500,000 | | | 499,277 |
Province of Ontario, 2/13/09 (Canada) | | | 500,000 | | | 499,259 |
Toyota Motor Credit Corp., 2/09/09 | | | 500,000 | | | 498,565 |
Toyota Motor Credit Corp., 3/13/09 | | | 250,000 | | | 248,619 |
| | | | | | |
Total Commercial Paper (Cost $6,739,292) | | | | | | 6,739,292 |
| | | | | | |
U.S. Government and Agency Securities 14.9% | | | | | | |
FHLB,
b1/02/09 - 4/02/09 | | | 886,000 | | | 882,988 |
2.80%, 2/06/09 | | | 250,000 | | | 250,000 |
FHLMC,
b1/05/09 - 2/17/09 | | | 1,170,000 | | | 1,169,342 |
senior note, 5.00%, 1/16/09 | | | 150,000 | | | 150,147 |
FNMA,
b1/27/09 - 4/13/09 | | | 1,044,000 | | | 1,038,812 |
5.25%, 1/15/09 | | | 500,000 | | | 500,602 |
bU.S. Treasury Bill, 4/16/09 | | | 2,000,000 | | | 1,994,693 |
| | | | | | |
Total U.S. Government and Agency Securities (Cost $5,986,584) | | | | | | 5,986,584 |
| | | | | | |
Total Investments before Repurchase Agreements (Cost $14,225,895) | | | | | | 14,225,895 |
| | | | | | |
cRepurchase Agreements 52.3% | | | | | | |
Banc of America Securities LLC, 0.01%, 1/02/09 (Maturity Value $5,000,003)
Collateralized by U.S. Government Agency Securities, 2.875%, 4/30/10 | | | 5,000,000 | | | 5,000,000 |
Deutsche Bank Securities Inc., 0.03%, 1/02/09 (Maturity Value $5,000,008)
Collateralized by U.S. Government Agency Securities, 4.625%, 10/15/13 | | | 5,000,000 | | | 5,000,000 |
HSBC Securities (USA) Inc., 0.03%, 1/02/09 (Maturity Value $6,000,010)
Collateralized by U.S. Government Agency Securities, 3.436%, 1/28/10 | | | 6,000,000 | | | 6,000,000 |
UBS Securities LLC, 0.02%, 1/02/09 (Maturity Value $5,000,006)
Collateralized by U.S. Government Agency Securities, 4.75%, 5/07/10 | | | 5,000,000 | | | 5,000,000 |
| | | | | | |
Total Repurchase Agreements (Cost $21,000,000) | | | | | | 21,000,000 |
| | | | | | |
Total Investments (Cost $35,225,895) 87.7% | | | | | | 35,225,895 |
Other Assets, less Liabilities 12.3% | | | | | | 4,948,988 |
| | | | | | |
Net Assets 100.0% | | | | | $ | 40,174,883 |
| | | | | | |
See Abbreviations on page FM-19.
aThe principal amount is stated in U.S. dollars unless otherwise indicated.
bThe security is traded on a discount basis with no stated coupon rate.
cSee Note 1(b) regarding repurchase agreements.
The accompanying notes are an integral part of these financial statements.
FM-11
Franklin Templeton Variable Insurance Products Trust
Financial Statements
Statement of Assets and Liabilities
December 31, 2008
| | | | |
| | | Franklin
Money
Market Fund | |
Assets: | | | | |
Investments in securities, at amortized cost | | $ | 14,225,895 | |
Repurchase agreements, at value and cost | | | 21,000,000 | |
| | | | |
Total investments | | | 35,225,895 | |
Cash | | | 4,891,415 | |
Receivables: | | | | |
Capital shares sold | | | 74,100 | |
Interest | | | 19,446 | |
Prepaid expense (Note 6) | | | 4,669 | |
| | | | |
Total assets | | | 40,215,525 | |
| | | | |
Liabilities: | | | | |
Payables: | | | | |
Capital shares redeemed | | | 5,260 | |
Affiliates | | | 6,498 | |
Reports to shareholders | | | 9,130 | |
Professional fees | | | 19,154 | |
Accrued expenses and other liabilities | | | 600 | |
| | | | |
Total liabilities | | | 40,642 | |
| | | | |
Net assets, at value | | $ | 40,174,883 | |
| | | | |
Net assets consist of: | | | | |
Paid-in capital | | $ | 40,175,327 | |
Accumulated net realized gain (loss) | | | (444 | ) |
| | | | |
Net assets, at value | | $ | 40,174,883 | |
| | | | |
Class 1: | | | | |
Net assets, at value | | $ | 39,459,152 | |
| | | | |
Shares outstanding | | | 39,466,832 | |
| | | | |
Net asset value per share | | $ | 1.00 | |
| | | | |
Class 2: | | | | |
Net assets, at value | | $ | 715,731 | |
| | | | |
Shares outstanding | | | 715,909 | |
| | | | |
Net asset value per share | | $ | 1.00 | |
| | | | |
The accompanying notes are an integral part of these financial statements.
FM-12
Franklin Templeton Variable Insurance Products Trust
Financial Statements (continued)
Statement of Operations
for the year ended December 31, 2008
| | | | |
| | | Franklin
Money
Market Fund | |
Investment income: | | | | |
Interest | | $ | 821,091 | |
| | | | |
Expenses: | | | | |
Management fees (Note 3a) | | | 232,041 | |
Distribution fees - Class 2 (Note 3c) | | | 2,093 | |
Unaffiliated transfer agent fees | | | 49 | |
Custodian fees (Note 4) | | | 734 | |
Reports to shareholders | | | 12,552 | |
Professional fees | | | 19,301 | |
Trustees’ fees and expenses | | | 228 | |
Temporary Guarantee Program fee (Note 6) | | | 3,956 | |
Other | | | 7,768 | |
| | | | |
Total expenses | | | 278,722 | |
Expense reductions (Note 4) | | | (295 | ) |
Expenses waived/paid by affiliates (Note 3e) | | | (21,756 | ) |
| | | | |
Net expenses | | | 256,671 | |
| | | | |
Net investment income | | | 564,420 | |
| | | | |
Net increase (decrease) in net assets resulting from operations | | $ | 564,420 | |
| | | | |
The accompanying notes are an integral part of these financial statements.
FM-13
Franklin Templeton Variable Insurance Products Trust
Financial Statements (continued)
Statements of Changes in Net Assets
| | | | | | | | |
| | | Franklin Money Market
Fund | |
| | | Year Ended December 31, | |
| | | 2008 | | | 2007 | |
| | | | |
Increase (decrease) in net assets: | | | | | | | | |
Net investment income from operations | | $ | 564,420 | | | $ | 2,036,315 | |
| | | | |
Distributions to shareholders from net investment income: | | | | | | | | |
Class 1 | | | (553,350 | ) | | | (1,998,505 | ) |
Class 2 | | | (11,070 | ) | | | (37,810 | ) |
| | | | |
Total distributions to shareholders | | | (564,420 | ) | | | (2,036,315 | ) |
| | | | |
Capital share transactions: (Note 2) | | | | | | | | |
Class 1 | | | 3,683,838 | | | | (3,422,676 | ) |
Class 2 | | | (156,788 | ) | | | (184,270 | ) |
| | | | |
Total capital share transactions | | | 3,527,050 | | | | (3,606,946 | ) |
| | | | |
Net increase (decrease) in net assets | | | 3,527,050 | | | | (3,606,946 | ) |
Net assets (there is no undistributed net investment income at beginning or end of year): | | | | | | | | |
Beginning of year | | | 36,647,833 | | | | 40,254,779 | |
| | | | |
End of year | | $ | 40,174,883 | | | $ | 36,647,833 | |
| | | | |
The accompanying notes are an integral part of these financial statements.
FM-14
Franklin Templeton Variable Insurance Products Trust
Notes to Financial Statements
Franklin Money Market Fund
1. ORGANIZATION AND SIGNIFICANT ACCOUNTING POLICIES
Franklin Templeton Variable Insurance Products Trust (Trust) is registered under the Investment Company Act of 1940, as amended, (1940 Act) as an open-end investment company, consisting of twenty-three separate funds. The Franklin Money Market Fund (Fund) is included in this report. The financial statements of the remaining funds in the Trust are presented separately. Shares of the Fund are sold only to insurance company separate accounts to fund the benefits of variable life insurance policies or variable annuity contracts. At December 31, 2008, 74.25% of the Fund’s shares were held through one insurance company. The Fund offers two classes of shares: Class 1 and Class 2. Each class of shares differs by its distribution fees, voting rights on matters affecting a single class and its exchange privilege.
The following summarizes the Fund’s significant accounting policies.
a. Security Valuation
Securities are valued at amortized cost which approximates market value. This method involves valuing an instrument at its cost and thereafter assuming a constant amortization to maturity of any discount or premium. All security valuation procedures are approved by the Trust’s Board of Trustees.
b. Repurchase Agreements
The Fund may enter into repurchase agreements, which are accounted for as a loan by the fund to the seller, collateralized by securities which are delivered to the fund’s custodian. The market value, including accrued interest, of the initial collateralization is required to be at least 102% of the dollar amount invested by the fund, with the value of the underlying securities marked to market daily to maintain coverage of at least 100%. All repurchase agreements held by the Fund at year end had been entered into on December 31, 2008. Repurchase agreements are valued at cost.
c. Income Taxes
No provision has been made for U.S. income taxes because it is the Fund’s policy to qualify as a regulated investment company under the Internal Revenue Code and to distribute to shareholders substantially all of its taxable income and net realized gains.
The Fund has reviewed the tax positions, taken on federal income tax returns, for each of the three open tax years and as of December 31, 2008, and has determined that no provision for income tax is required in the Fund’s financial statements.
d. Security Transactions, Investment Income, Expenses and Distributions
Security transactions are accounted for on trade date. Realized gains and losses on security transactions are determined on a specific identification basis. Interest income and estimated expenses are accrued daily. Amortization of premium and accretion of discount on debt securities are included in interest income. Dividends from net investment income are normally declared daily and distributed monthly. Distributions to shareholders are determined according to income tax regulations (tax basis). Distributable earnings determined on a tax basis may differ from earnings recorded in accordance with accounting principles generally accepted in the United States of America. These differences may be permanent or temporary. Permanent differences are reclassified among capital accounts to reflect their tax character. These reclassifications have no impact on net assets or the results of operations. Temporary differences are not reclassified, as they may reverse in subsequent periods.
Common expenses incurred by the Trust are allocated among the funds based on the ratio of net assets of each fund to the combined net assets of the Trust. Fund specific expenses are charged directly to the fund that incurred the expense.
Net investment income, not including class specific expenses, is allocated daily to each class of shares based upon the relative value of the settled shares of each class. Realized and unrealized gains and losses are allocated daily to each class of shares based upon the relative proportion of net assets of each class. Differences in per share distributions, by class, are generally due to differences in class specific expenses.
FM-15
Franklin Templeton Variable Insurance Products Trust
Notes to Financial Statements (continued)
Franklin Money Market Fund
1. ORGANIZATION AND SIGNIFICANT ACCOUNTING POLICIES (continued)
e. Accounting Estimates
The preparation of financial statements in accordance with accounting principles generally accepted in the United States of America requires management to make estimates and assumptions that affect the reported amounts of assets and liabilities at the date of the financial statements and the amounts of income and expenses during the reporting period. Actual results could differ from those estimates.
f. Guarantees and Indemnifications
Under the Trust’s organizational documents, its officers and trustees are indemnified by the Trust against certain liabilities arising out of the performance of their duties to the Trust. Additionally, in the normal course of business, the Trust, on behalf of the Fund, enters into contracts with service providers that contain general indemnification clauses. The Trust’s maximum exposure under these arrangements is unknown as this would involve future claims that may be made against the Trust that have not yet occurred. Currently, the Trust expects the risk of loss to be remote.
2. SHARES OF BENEFICIAL INTEREST
At December 31, 2008, there were an unlimited number of shares authorized (without par value). Transactions in the Fund’s shares at $1.00 per share were as follows:
| | | | | | | | |
| | | Year Ended December 31, | |
| | | 2008 | | | 2007 | |
| Class 1 Shares: | | | | | | |
Shares sold | | $ | 15,129,945 | | | $ | 41,473,728 | |
Shares issued in reinvestment of distributions | | | 553,313 | | | | 1,997,072 | |
Shares redeemed | | | (11,999,420 | ) | | | (46,893,476 | ) |
| | | | |
Net increase (decrease) | | $ | 3,683,838 | | | $ | (3,422,676 | ) |
| | | | |
| Class 2 Shares: | | | | | | |
Shares sold | | $ | 39,322 | | | $ | 168,231 | |
Shares issued in reinvestment of distributions | | | 11,069 | | | | 37,754 | |
Shares redeemed | | | (207,179 | ) | | | (390,255 | ) |
| | | | |
Net increase (decrease) | | $ | (156,788 | ) | | $ | (184,270 | ) |
| | | | |
3. TRANSACTIONS WITH AFFILIATES
Franklin Resources, Inc. is the holding company for various subsidiaries that together are referred to as Franklin Templeton Investments. Certain officers and trustees of the Trust are also officers and/or directors of the following subsidiaries:
| | |
| Subsidiary | | Affiliation |
Franklin Advisers, Inc. (Advisers) | | Investment manager |
Franklin Templeton Services, LLC (FT Services) | | Administrative manager |
Franklin Templeton Distributors, Inc. (Distributors) | | Principal underwriter |
Franklin Templeton Investor Services, LLC (Investor Services) | | Transfer agent |
FM-16
Franklin Templeton Variable Insurance Products Trust
Notes to Financial Statements (continued)
Franklin Money Market Fund
3. TRANSACTIONS WITH AFFILIATES (continued)
a. Management Fees
The Fund pays an investment management fee to Advisers based on the average daily net assets of the Fund as follows:
| | |
| Annualized Fee Rate | | Net Assets |
| 0.625% | | Up to and including $100 million |
| 0.500% | | Over $100 million, up to and including $250 million |
| 0.450% | | Over $250 million, up to and including $7.5 billion |
| 0.440% | | Over $7.5 billion, up to and including $10 billion |
| 0.430% | | Over $10 billion, up to and including $12.5 billion |
| 0.420% | | Over $12.5 billion, up to and including $15 billion |
| 0.400% | | In excess of $15 billion |
b. Administrative Fees
Under an agreement with Advisers, FT Services provides administrative services to the Fund. The fee is paid by Advisers based on average daily net assets, and is not an additional expense of the Fund.
c. Distribution Fees
The Fund’s Board of Trustees has adopted a distribution plan for Class 2 shares pursuant to Rule 12b-1 under the 1940 Act. Under the Fund’s compensation distribution plan, the Fund pays Distributors for costs incurred in connection with the servicing, sale and distribution of the Fund’s shares up to 0.35% per year of its average daily net assets. The Board of Trustees has agreed to limit the current rate to 0.25% per year.
d. Transfer Agent Fees
Investor Services, under terms of an agreement, performs shareholder servicing for the Fund and is not paid by the Fund for the services.
e. Waiver and Expense Reimbursements
Advisers agreed in advance to voluntarily waive a portion of its management fees. Total expenses waived by Advisers are not subject to reimbursement by the Fund subsequent to the Fund’s fiscal year end.
4. EXPENSE OFFSET ARRANGEMENT
The Fund has entered into an arrangement with its custodian whereby credits realized as a result of uninvested cash balances are used to reduce a portion of the Fund’s custodian expenses. During the year ended December 31, 2008, the custodian fees were reduced as noted in the Statement of Operations.
5. INCOME TAXES
For tax purposes, capital losses may be carried over to offset future capital gains, if any. At December 31, 2008, the Fund had tax basis capital losses of $444 expiring in 2010.
On December 31, 2008, the Fund had expired capital loss carryforwards of $280, which were reclassified to paid-in capital.
FM-17
Franklin Templeton Variable Insurance Products Trust
Notes to Financial Statements (continued)
Franklin Money Market Fund
5. INCOME TAXES (continued)
The tax character of distributions paid during the years ended December 31, 2008 and 2007, was as follows:
| | | | | | |
| | | 2008 | | 2007 |
Distributions paid from ordinary income | | $ | 564,420 | | $ | 2,036,315 |
At December 31, 2008, the cost of investments and undistributed ordinary income for book and income tax purposes were the same.
6. TEMPORARY GUARANTEE PROGRAM FOR MONEY MARKET FUNDS
On October 6, 2008, the Fund’s Board of Trustees approved the participation by the Fund in the U.S. Department of the Treasury’s Temporary Guarantee Program for Money Market Funds (“Program”) through December 18, 2008, which has subsequently been extended through April 30, 2009. Under the Program, shares held by the Fund as of the close of business on September 19, 2008 (“Program Date”) are insured against loss in the event the Fund liquidates its holdings during the term of the Program and the per share value at the time of liquidation drops below $0.995 per share. For participation in the initial three months of the Program, the Fund paid 0.01% of its net assets as of the Program Date, and paid an additional 0.015% of its net assets as of the Program Date to participate in the extension. This expense was borne by the Fund. The fees are amortized over the term of the Program and are reflected in the Fund’s Statement of Operations. The U.S. Department of the Treasury may extend the Program at its discretion, through September 18, 2009. If the Program is extended, the Fund will consider whether to continue to participate.
7. UPCOMING LIQUIDATION
On September 19, 2008, the Board of Trustees for the Fund approved a proposal to liquidate the Fund. The Fund is scheduled to liquidate on April 24, 2009.
8. FAIR VALUE MEASUREMENTS
The Fund adopted Financial Accounting Standards Board (FASB) Statement No. 157, “Fair Value Measurement” (SFAS 157), on January 1, 2008. SFAS 157 defines fair value, establishes a framework for measuring fair value, and expands disclosures about fair value measurements. The Fund has determined that the implementation of SFAS 157 did not have a material impact on the Fund’s financial statements.
SFAS 157 establishes a fair value hierarchy that distinguishes between market data obtained from independent sources (observable inputs) and the Fund’s own market assumptions (unobservable inputs). These inputs are used in determining the value of the Fund’s investments and are summarized in the following fair value hierarchy:
| | • | | Level 1 – quoted prices in active markets for identical securities |
| | • | | Level 2 – other significant observable inputs (including quoted prices for similar securities, interest rates, prepayment speed, credit risk, etc.) |
| | • | | Level 3 – significant unobservable inputs (including the Fund’s own assumptions in determining the fair value of investments) |
The inputs or methodology used for valuing securities are not an indication of the risk associated with investing in those securities. Money market securities may be valued using amortized cost, in accordance with the 1940 Act. Generally, amortized cost reflects the current fair value of a security, but since the value is not obtained from a quoted price in an active market, such securities are reflected as a Level 2.
At December 31, 2008, all of the Fund’s investments in securities carried at fair value were in Level 2 inputs.
FM-18
Franklin Templeton Variable Insurance Products Trust
Notes to Financial Statements (continued)
Franklin Money Market Fund
ABBREVIATIONS
Selected Portfolio
FHLB - Federal Home Loan Bank
FHLMC - Federal Home Loan Mortgage Corp.
FNMA - Federal National Mortgage Association
FM-19
Franklin Templeton Variable Insurance Products Trust
Franklin Money Market Fund
Report of Independent Registered Public Accounting Firm
To the Board of Trustees and Shareholders of Franklin Templeton Variable Insurance Products Trust
In our opinion, the accompanying statement of assets and liabilities, including the statement of investments, and the related statements of operations and of changes in net assets and the financial highlights present fairly, in all material respects, the financial position of Franklin Money Market Fund (one of the funds constituting the Franklin Templeton Variable Insurance Products Trust, hereafter referred to as the “Fund”) at December 31, 2008, the results of its operations for the year then ended, the changes in its net assets for each of the two years in the period then ended and the financial highlights for each of the five years in the period then ended, in conformity with accounting principles generally accepted in the United States of America. These financial statements and financial highlights (hereafter referred to as “financial statements”) are the responsibility of the Fund’s management. Our responsibility is to express an opinion on these financial statements based on our audits. We conducted our audits of these financial statements in accordance with the standards of the Public Company Accounting Oversight Board (United States). Those standards require that we plan and perform the audit to obtain reasonable assurance about whether the financial statements are free of material misstatement. An audit includes examining, on a test basis, evidence supporting the amounts and disclosures in the financial statements, assessing the accounting principles used and significant estimates made by management, and evaluating the overall financial statement presentation. We believe that our audits, which included confirmation of securities at December 31, 2008 by correspondence with the custodian, provide a reasonable basis for our opinion.
PricewaterhouseCoopers LLP
San Francisco, California
February 10, 2009
FM-20
FRANKLIN RISING DIVIDENDS SECURITIES FUND
This annual report for Franklin Rising Dividends Securities Fund covers the fiscal year ended December 31, 2008.
Performance Summary as of 12/31/08
Average annual total return of Class 1 shares represents the average annual change in value, assuming reinvestment of dividends and capital gains. Average returns smooth out variations in returns, which can be significant; they are not the same as year-by-year results.
Periods ended 12/31/08
| | | | | | |
| | | 1-Year | | 5-Year | | 10-Year |
Average Annual Total Return | | -26.94% | | -0.70% | | +4.01% |
Total Return Index Comparison
for a Hypothetical $10,000 Investment (1/1/99–12/31/08)
The graph below shows the change in value of a hypothetical $10,000 investment in the Fund over the indicated period and includes reinvestment of any income or distributions. The Fund’s performance is compared to the performance of the Standard & Poor’s 500 Index (S&P 500). One cannot invest directly in an index, nor is an index representative of the Fund’s portfolio. Please see Important Notes to Performance Information preceding the Fund Summaries.
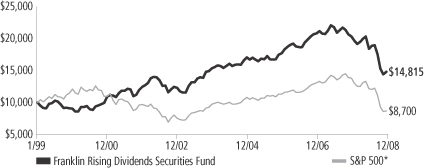
*Source: © 2009 Morningstar. Please see Index Descriptions following the Fund Summaries.
Franklin Rising Dividends Securities Fund – Class 1
Performance reflects the Fund’s Class 1 operating expenses, but does not include any contract fees, expenses or sales charges. If they had been included, performance would be lower. These charges and deductions, particularly for variable life policies, can have a significant effect on contract values and insurance benefits. See the contract prospectus for a complete description of these expenses, including sales charges.
Performance data represent past performance, which does not guarantee future results. Investment return and principal value will fluctuate, and you may have a gain or loss when you sell your shares. Current performance may differ from figures shown.
FRD-1
Fund Goal and Main Investments: Franklin Rising Dividends Securities Fund seeks long-term capital appreciation, with preservation of capital as an important consideration. The Fund normally invests at least 80% of its net assets in investments of companies that have paid rising dividends, and normally invests predominantly in equity securities.
Performance Overview
You can find the Fund’s one-year total return in the Performance Summary. The Fund performed better than its benchmark, the S&P 500, which fell 37.00% for the same period.1
Economic and Market Overview
In 2008, economic conditions deteriorated. The Conference Board’s Consumer Confidence Index fell to an all-time low since it began in 1967 as the U.S. economy faltered and stock markets declined. The government’s abrupt conservatorship of Fannie Mae and Freddie Mac and the failure of several blue-chip banks and financial institutions roiled equity markets. Despite government interventions and massive emergency funding, the nation’s economic troubles were exacerbated as manufacturing activity weakened at its fastest pace in nearly 30 years and as home prices continued to fall. Jobless claims mounted and the unemployment rate rose to 7.2% by period-end.2 Economic growth, as measured by gross domestic product (GDP), rebounded from a 0.9% annualized rate in the first quarter of 2008 to a 2.8% annualized pace in the second quarter, largely due to strong exports and government spending. However, in the third and fourth quarters of 2008, GDP fell at annualized rates of 0.5% and an estimated 3.8%, reflecting a broad-based contraction in consumer spending, falling corporate profits and slowing export growth.
Oil prices soared to a record high in July, rising above $145 per barrel, before dramatically retreating to $45 by period-end. Many other commodities such as agricultural products and precious and base metals followed similar trends. Partially as a result of the steep price corrections, inflation declined significantly late in the review period, and December’s inflation rate was an annualized 0.1%.2 Core inflation, which excludes food and energy costs, rose at a 1.8% annual rate; this level was within the Federal Reserve Board’s (Fed’s) informal target range of 1.5%–2.0%.2
1. Source: © 2009 Morningstar. One cannot invest directly in an index, nor is an index representative of the Fund’s portfolio. Please see Index Descriptions following the Fund Summaries.
2. Source: Bureau of Labor Statistics.
Fund Risks: The Fund’s investments in stocks offer the potential for long-term gains but can be subject to short-term price fluctuations. Smaller and midsize company securities can increase the risk of greater price fluctuations, particularly over the short term. By having significant investments in particular sectors from time to time, such as financial services, the Fund may be at greater risk of adverse developments in a sector than a fund that invests more broadly. The Fund’s prospectus also includes a description of the main investment risks.
FRD-2
A slowing economy and decelerating inflation prompted policymakers to further lower interest rates and enact stimulus plans. During the year under review, the Fed lowered the federal funds target rate to a range of 0% to 0.25% from 4.25% at the start of the reporting period. The Fed and U.S. Treasury Department also introduced new programs such as the Primary Dealer Credit Facility (PDCF) and the Troubled Asset Relief Program (TARP), which were intended to enhance market liquidity.
Volatility remained high throughout the reporting period but intensified in the latter half of the year as stocks fluctuated wildly and Treasury prices soared. The year was among the worst in history for U.S. stock market performance. For the 12 months under review, the blue chip stocks of the Dow Jones Industrial Average fell 31.93%, the broader S&P 500 dropped 37.00%, and the technology-heavy NASDAQ Composite Index declined 40.03%.3 All sectors lost value; however, the financials, materials and information technology sectors had the largest declines.
Investment Strategy
We are a research-driven, fundamental investment adviser, pursuing a disciplined value-oriented strategy. As bottom-up investors concentrating primarily on individual securities, we seek fundamentally sound companies that we believe meet our screening criteria, which include consistent, substantial dividend increases; reinvested earnings; and strong balance sheets. We attempt to acquire such stocks at attractive prices, often when they are out of favor with other investors. In following these criteria, we do not necessarily focus on companies whose securities pay a high dividend but rather on companies that consistently raise their dividends.
Manager’s Discussion
Significant contributors to the Fund’s return during the 12 months ended December 31, 2008, included Family Dollar Stores and Wal-Mart Stores. Discount retailer Family Dollar Stores reported higher revenues and earnings as consumers became increasingly cost conscious. The company has increased its dividend for 32 consecutive years. Wal-Mart’s efforts to reestablish its price leadership image began to pay off as the company’s recent monthly sales results exceeded those of many other retailers. Wal-Mart has 34 years of dividend increases. For the year, Family Dollar Stores was the best performing stock in the S&P 500, and Wal-Mart was the best performing stock in the Dow Jones Industrial Average.
3. Source: © 2009 Morningstar. Please see Index Descriptions following the Fund Summaries.
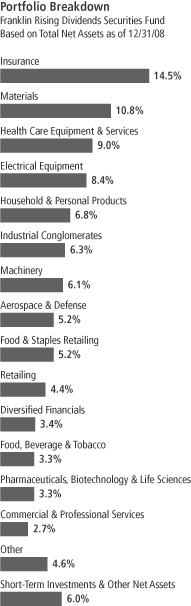
FRD-3
American International Group (AIG), General Electric (GE) and State Street each declined during the period. AIG collapsed in September as a result of sharply lower market valuations on its various credit exposures. Although operating results from GE’s finance businesses held up better than those of many other financial companies, funding concerns forced the company to begin reducing its exposure to financial services. Unrealized losses in State Street’s investment portfolio and in its asset-backed commercial paper conduits caused investors to question the adequacy of its tangible common stock.
We did not initiate any new positions during the reporting period. We increased our positions in several holdings including Becton Dickinson, Donaldson and Erie Indemnity. The Fund liquidated its positions in AIG, Fannie Mae, Freddie Mac, SunTrust Banks and Washington Mutual. We significantly reduced our holding in U.S. Bancorp due largely to concerns about the company’s fundamental asset quality. We also reduced positions in Dover, Family Dollar Stores, Procter & Gamble, and Wal-Mart after strong performance or Fund redemptions caused them to become unusually large positions. Smaller reductions were made to several other positions during the period.
Our 10 largest positions on December 31, 2008, represented 45.4% of the Fund’s total net assets. It is interesting to note how these 10 companies would, in aggregate, respond to the Fund’s screening criteria based on a simple average of statistical measures. On average, these 10 companies have raised their dividends 31 years in a row and by 409% in the past 10 years. Their most recent year-over-year dividend increases averaged 15% with a yield of 2.6% on December 31, 2008, and a dividend payout ratio of 32%, based on estimates of calendar year 2008 operating earnings. The average price/earnings ratio was 13.0 times calendar year 2008 estimates versus 16.0 for that of the unmanaged S&P 500.
Thank you for your participation in Franklin Rising Dividends Securities Fund. We look forward to serving your future investment needs.
The foregoing information reflects our analysis, opinions and portfolio holdings as of December 31, 2008, the end of the reporting period. The way we implement our main investment strategies and the resulting portfolio holdings may change depending on factors such as market and economic conditions. These opinions may not be relied upon as investment advice or an offer for a particular security. The information is not a complete analysis of every aspect of any market, country, industry, security or the Fund. Statements of fact are from sources considered reliable, but the investment manager makes no representation or warranty as to their completeness or accuracy. Although historical performance is no guarantee of future results, these insights may help you understand our investment management philosophy.
Top 10 Holdings
Franklin Rising Dividends Securities Fund
12/31/08
| | |
Company
Sector/Industry | | % of Total
Net Assets |
| |
| Wal-Mart Stores Inc. | | 5.2% |
| Food & Staples Retailing | | |
| |
| United Technologies Corp. | | 5.2% |
| Aerospace & Defense | | |
| |
| The Procter & Gamble Co. | | 5.1% |
| Household & Personal Products | | |
| |
| Roper Industries Inc. | | 4.9% |
| Electrical Equipment | | |
| |
| Praxair Inc. | | 4.9% |
| Materials | | |
| |
| Family Dollar Stores Inc. | | 4.3% |
| Retailing | | |
| |
| AFLAC Inc. | | 4.2% |
| Insurance | | |
| |
| Dover Corp. | | 4.0% |
| Machinery | | |
| |
| Erie Indemnity Co., A | | 3.8% |
| Insurance | | |
| |
| Nucor Corp. | | 3.8% |
| Materials | | |
The dollar value, number of shares or principal amount, and names of all portfolio holdings are listed in the Fund’s Statement of Investments.
FRD-4
Fund Expenses
As an investor in a variable insurance contract (Contract) that indirectly provides for investment in an underlying mutual fund, you can incur transaction and/or ongoing expenses at both the Fund level and the Contract level.
| • | | Transaction expenses can include sales charges (loads) on purchases, redemption fees, surrender fees, transfer fees and premium taxes. |
| • | | Ongoing expenses can include management fees, distribution and service (12b-1) fees, contract fees, annual maintenance fees, mortality and expense risk fees and other fees and expenses. All mutual funds and Contracts have some types of ongoing expenses. |
The expenses shown in the table are meant to highlight ongoing expenses at the Fund level only and do not include ongoing expenses at the Contract level, or transaction expenses at either the Fund or Contract level. While the Fund does not have transaction expenses, if the transaction and ongoing expenses at the Contract level were included, the expenses shown would be higher. You should consult your Contract prospectus or disclosure document for more information.
The table shows Fund-level ongoing expenses and can help you understand these expenses and compare them with those of other mutual funds offered through the Contract. The table assumes a $1,000 investment held for the six months indicated. Please refer to the Fund prospectus for additional information on operating expenses.
Actual Fund Expenses
The first line (Actual) of the table provides actual account values and expenses. The “Ending Account Value” is derived from the Fund’s actual return, which includes the effect of ongoing Fund expenses, but does not include the effect of ongoing Contract expenses.
You can estimate the Fund-level expenses you incurred during the period by following these steps. Of course, your account value and expenses will differ from those in this illustration:
| 1. | Divide your account value by $1,000. |
If an account had an $8,600 value, then $8,600 ÷ $1,000 = 8.6.
| 2. | Multiply the result by the number under the heading “Fund-Level Expenses Incurred During Period.” |
If Fund-Level Expenses Incurred During Period were $7.50, then 8.6 x $7.50 = $64.50.
In this illustration, the estimated expenses incurred this period at the Fund level are $64.50.
Franklin Rising Dividends Securities Fund – Class 1
FRD-5
Hypothetical Example for Comparison with Other Mutual Funds
Information in the second line (Hypothetical) of the table can help you compare ongoing expenses of the Fund with those of other mutual funds offered through the Contract. This information may not be used to estimate the actual ending account balance or expenses you incurred during the period. The hypothetical “Ending Account Value” is based on the Fund’s actual expense ratio and an assumed 5% annual rate of return before expenses, which does not represent the Fund’s actual return. The figure under the heading “Fund-Level Expenses Incurred During Period” shows the hypothetical expenses your account would have incurred under this scenario. You can compare this figure with the 5% hypothetical examples that appear in shareholder reports of other funds offered through a Contract.
| | | | | | | | | |
| Class 1 | | Beginning
Account Value 7/1/08 | | Ending
Account
Value 12/31/08 | | Fund-Level
Expenses Incurred
During Period*
7/1/08–12/31/08 |
Actual | | $ | 1,000 | | $ | 804.60 | | $ | 2.86 |
Hypothetical (5% return before expenses) | | $ | 1,000 | | $ | 1,021.97 | | $ | 3.20 |
*Expenses are calculated using the most recent six-month annualized expense ratio for the Fund’s Class 1 shares (0.63%), which does not include any ongoing expenses of the Contract for which the Fund is an investment option, multiplied by the average account value over the period, multiplied by 184/366 to reflect the one-half year period.
FRD-6
Franklin Templeton Variable Insurance Products Trust
Financial Highlights
Franklin Rising Dividends Securities Fund
| | | | | | | | | | | | | | | | | | | | |
| | | Year Ended December 31, | |
| Class 1 | | 2008 | | | 2007 | | | 2006 | | | 2005 | | | 2004 | |
| | | | |
Per share operating performance | | | | | | | | | | | | | | | | | | | | |
(for a share outstanding throughout the year) | | | | | | | | | | | | | | | | | | | | |
Net asset value, beginning of year | | $ | 19.61 | | | $ | 20.88 | | | $ | 18.11 | | | $ | 17.75 | | | $ | 16.28 | |
| | | | |
Income from investment operationsa: | | | | | | | | | | | | | | | | | | | | |
Net investment incomeb | | | 0.35 | | | | 0.36 | | | | 0.58 | | | | 0.28 | | | | 0.26 | |
Net realized and unrealized gains (losses) | | | (5.51 | ) | | | (0.80 | ) | | | 2.53 | | | | 0.36 | | | | 1.55 | |
| | | | |
Total from investment operations | | | (5.16 | ) | | | (0.44 | ) | | | 3.11 | | | | 0.64 | | | | 1.81 | |
| | | | |
Less distributions from: | | | | | | | | | | | | | | | | | | | | |
Net investment income | | | (0.36 | ) | | | (0.53 | ) | | | (0.24 | ) | | | (0.18 | ) | | | (0.12 | ) |
Net realized gains | | | (0.13 | ) | | | (0.30 | ) | | | (0.10 | ) | | | (0.10 | ) | | | (0.22 | ) |
| | | | |
Total distributions | | | (0.49 | ) | | | (0.83 | ) | | | (0.34 | ) | | | (0.28 | ) | | | (0.34 | ) |
| | | | |
Net asset value, end of year | | $ | 13.96 | | | $ | 19.61 | | | $ | 20.88 | | | $ | 18.11 | | | $ | 17.75 | |
| | | | |
| | | | | |
Total returnc | | | (26.94)% | | | | (2.41)% | | | | 17.43% | | | | 3.68% | | | | 11.25% | |
Ratios to average net assets | | | | | | | | | | | | | | | | | | | | |
Expensesd | | | 0.61% | | | | 0.59% | | | | 0.61% | | | | 0.62% | | | | 0.69% | |
Net investment income | | | 2.05% | | | | 1.72% | | | | 3.15% | | | | 1.65% | | | | 1.56% | |
| | | | | |
Supplemental data | | | | | | | | | | | | | | | | | | | | |
Net assets, end of year (000’s) | | $ | 142,862 | | | $ | 235,946 | | | $ | 288,303 | | | $ | 292,223 | | | $ | 326,883 | |
Portfolio turnover rate | | | 5.39% | | | | 3.29% | | | | 6.19% | | | | 2.26% | | | | 2.78% | |
aThe amount shown for a share outstanding throughout the period may not correlate with the Statement of Operations for the period due to the timing of sales and repurchases of the Fund shares in relation to income earned and/or fluctuating market value of the investments of the Fund.
bBased on average daily shares outstanding.
cTotal return does not include any fees, charges or expenses imposed by the variable annuity and life insurance contracts for which the Franklin Templeton Variable Insurance Products Trust serves as an underlying investment vehicle.
dBenefit of expense reduction rounds to less than 0.01%.
The accompanying notes are an integral part of these financial statements.
FRD-7
Franklin Templeton Variable Insurance Products Trust
Financial Highlights (continued)
Franklin Rising Dividends Securities Fund
| | | | | | | | | | | | | | | | | | | | |
| | | Year Ended December 31, | |
| Class 2 | | 2008 | | | 2007 | | | 2006 | | | 2005 | | | 2004 | |
| | | | |
Per share operating performance | | | | | | | | | | | | | | | | | | | | |
(for a share outstanding throughout the year) | | | | | | | | | | | | | | | | | | | | |
Net asset value, beginning of year | | $ | 19.27 | | | $ | 20.55 | | | $ | 17.84 | | | $ | 17.51 | | | $ | 16.09 | |
| | | | |
Income from investment operationsa: | | | | | | | | | | | | | | | | | | | | |
Net investment incomeb | | | 0.31 | | | | 0.30 | | | | 0.56 | | | | 0.24 | | | | 0.22 | |
Net realized and unrealized gains (losses) | | | (5.42 | ) | | | (0.79 | ) | | | 2.46 | | | | 0.34 | | | | 1.53 | |
| | | | |
Total from investment operations | | | (5.11 | ) | | | (0.49 | ) | | | 3.02 | | | | 0.58 | | | | 1.75 | |
| | | | |
Less distributions from: | | | | | | | | | | | | | | | | | | | | |
Net investment income | | | (0.31 | ) | | | (0.49 | ) | | | (0.21 | ) | | | (0.15 | ) | | | (0.11 | ) |
Net realized gains | | | (0.13 | ) | | | (0.30 | ) | | | (0.10 | ) | | | (0.10 | ) | | | (0.22 | ) |
| | | | |
Total distributions | | | (0.44 | ) | | | (0.79 | ) | | | (0.31 | ) | | | (0.25 | ) | | | (0.33 | ) |
| | | | |
Net asset value, end of year | | $ | 13.72 | | | $ | 19.27 | | | $ | 20.55 | | | $ | 17.84 | | | $ | 17.51 | |
| | | | |
| | | | | |
Total returnc | | | (27.10)% | | | | (2.69)% | | | | 17.12% | | | | 3.43% | | | | 11.00% | |
Ratios to average net assets | | | | | | | | | | | | | | | | | | | | |
Expensesd | | | 0.86% | | | | 0.84% | | | | 0.86% | | | | 0.87% | | | | 0.94% | |
Net investment income | | | 1.80% | | | | 1.47% | | | | 2.90% | | | | 1.40% | | | | 1.31% | |
| | | | | |
Supplemental data | | | | | | | | | | | | | | | | | | | | |
Net assets, end of year (000’s) | | $ | 1,286,878 | | | $ | 2,079,366 | | | $ | 1,981,240 | | | $ | 1,423,827 | | | $ | 997,800 | |
Portfolio turnover rate | | | 5.39% | | | | 3.29% | | | | 6.19% | | | | 2.26% | | | | 2.78% | |
aThe amount shown for a share outstanding throughout the period may not correlate with the Statement of Operations for the period due to the timing of sales and repurchases of the Fund shares in relation to income earned and/or fluctuating market value of the investments of the Fund.
bBased on average daily shares outstanding.
cTotal return does not include any fees, charges or expenses imposed by the variable annuity and life insurance contracts for which the Franklin Templeton Variable Insurance Products Trust serves as an underlying investment vehicle.
dBenefit of expense reduction rounds to less than 0.01%.
The accompanying notes are an integral part of these financial statements.
FRD-8
Franklin Templeton Variable Insurance Products Trust
Financial Highlights (continued)
Franklin Rising Dividends Securities Fund
| | | | |
| Class 4 | | Period Ended
December 31,
2008a | |
Per share operating performance | | | | |
(for a share outstanding throughout the period) | | | | |
Net asset value, beginning of period | | $ | 18.51 | |
| | | | |
Income from investment operationsb: | | | | |
Net investment incomec | | | 0.26 | |
Net realized and unrealized gains (losses) | | | (4.36 | ) |
| | | | |
Total from investment operations | | | (4.10 | ) |
| | | | |
Less distributions from: | | | | |
Net investment income | | | (0.36 | ) |
Net realized gains | | | (0.13 | ) |
| | | | |
Total distributions | | | (0.49 | ) |
| | | | |
Net asset value, end of period | | $ | 13.92 | |
| | | | |
| |
Total returnd | | | (22.82)% | |
Ratios to average net assetse | | | | |
Expensesf | | | 0.96% | |
Net investment income | | | 1.70% | |
| |
Supplemental data | | | | |
Net assets, end of period (000’s) | | $ | 4 | |
Portfolio turnover rate | | | 5.39% | |
aFor the period February 29, 2008 (effective date) to December 31, 2008.
bThe amount shown for a share outstanding throughout the period may not correlate with the Statement of Operations for the period due to the timing of sales and repurchases of the Fund shares in relation to income earned and/or fluctuating market value of the investments of the Fund.
cBased on average daily shares outstanding.
dTotal return does not include any fees, charges or expenses imposed by the variable annuity and life insurance contracts for which the Franklin Templeton Variable Insurance Products Trust serves as an underlying investment vehicle. Total return is not annualized for periods less than one year.
eRatios are annualized for periods less than one year.
fBenefit of expense reduction rounds to less than 0.01%.
The accompanying notes are an integral part of these financial statements.
FRD-9
Franklin Templeton Variable Insurance Products Trust
Statement of Investments, December 31, 2008
| | | | | |
| Franklin Rising Dividends Securities Fund | | Shares | | Value |
Common Stocks 94.0% | | | | | |
Aerospace & Defense 5.2% | | | | | |
United Technologies Corp. | | 1,390,100 | | $ | 74,509,360 |
| | | | | |
Banks 1.8% | | | | | |
Peoples Bancorp Inc. | | 159,979 | | | 3,060,398 |
PNC Financial Services Group Inc. | | 81,953 | | | 4,015,697 |
TrustCo Bank Corp. NY | | 328,588 | | | 3,124,872 |
U.S. Bancorp | | 599,449 | | | 14,992,220 |
| | | | | |
| | | | | 25,193,187 |
| | | | | |
Commercial & Professional Services 2.7% | | | | | |
ABM Industries Inc. | | 998,288 | | | 19,017,386 |
Cintas Corp. | | 752,700 | | | 17,485,221 |
Superior Uniform Group Inc. | | 237,100 | | | 1,870,719 |
| | | | | |
| | | | | 38,373,326 |
| | | | | |
Consumer Durables & Apparel 1.4% | | | | | |
Leggett & Platt Inc. | | 1,273,500 | | | 19,344,465 |
aRuss Berrie and Co. Inc. | | 306,081 | | | 909,061 |
| | | | | |
| | | | | 20,253,526 |
| | | | | |
Consumer Services 1.4% | | | | | |
Hillenbrand Inc. | | 1,228,300 | | | 20,488,044 |
| | | | | |
Diversified Financials 3.4% | | | | | |
State Street Corp. | | 1,232,000 | | | 48,454,560 |
| | | | | |
Electrical Equipment 8.4% | | | | | |
Brady Corp., A | | 2,087,879 | | | 50,004,702 |
Roper Industries Inc. | | 1,611,550 | | | 69,957,386 |
| | | | | |
| | | | | 119,962,088 |
| | | | | |
Food & Staples Retailing 5.2% | | | | | |
Wal-Mart Stores Inc. | | 1,329,300 | | | 74,520,558 |
| | | | | |
Food, Beverage & Tobacco 3.3% | | | | | |
McCormick & Co. Inc. | | 1,456,995 | | | 46,419,861 |
| | | | | |
Health Care Equipment & Services 9.0% | | | | | |
Becton Dickinson and Co. | | 681,943 | | | 46,638,082 |
Hill-Rom Holdings Inc. | | 1,211,103 | | | 19,934,755 |
Teleflex Inc. | | 352,200 | | | 17,645,220 |
West Pharmaceutical Services Inc. | | 1,165,600 | | | 44,024,712 |
| | | | | |
| | | | | 128,242,769 |
| | | | | |
Household & Personal Products 6.8% | | | | | |
Alberto-Culver Co. | | 1,024,350 | | | 25,106,818 |
The Procter & Gamble Co. | | 1,169,400 | | | 72,292,308 |
| | | | | |
| | | | | 97,399,126 |
| | | | | |
Industrial Conglomerates 6.3% | | | | | |
Carlisle Cos. Inc. | | 2,144,389 | | | 44,388,852 |
General Electric Co. | | 2,783,200 | | | 45,087,840 |
| | | | | |
| | | | | 89,476,692 |
| | | | | |
Insurance 14.5% | | | | | |
AFLAC Inc. | | 1,323,800 | | | 60,682,992 |
Arthur J. Gallagher & Co. | | 753,000 | | | 19,510,230 |
Erie Indemnity Co., A | | 1,456,733 | | | 54,816,863 |
FRD-10
Franklin Templeton Variable Insurance Products Trust
Statement of Investments, December 31, 2008 (continued)
| | | | | |
| Franklin Rising Dividends Securities Fund | | Shares | | Value |
Common Stocks (continued) | | | | | |
Insurance (continued) | | | | | |
Mercury General Corp. | | 154,200 | | $ | 7,091,658 |
Old Republic International Corp. | | 3,939,208 | | | 46,955,359 |
RLI Corp. | | 305,848 | | | 18,705,664 |
| | | | | |
| | | | | 207,762,766 |
| | | | | |
Machinery 6.1% | | | | | |
Donaldson Co. Inc. | | 310,000 | | | 10,431,500 |
Dover Corp. | | 1,752,000 | | | 57,675,840 |
Graco Inc. | | 391,112 | | | 9,281,088 |
Nordson Corp. | | 320,591 | | | 10,351,883 |
| | | | | |
| | | | | 87,740,311 |
| | | | | |
Materials 10.8% | | | | | |
Bemis Co. Inc. | | 1,292,300 | | | 30,601,664 |
Nucor Corp. | | 1,180,802 | | | 54,553,052 |
Praxair Inc. | | 1,175,000 | | | 69,748,000 |
| | | | | |
| | | | | 154,902,716 |
| | | | | |
Pharmaceuticals, Biotechnology & Life Sciences 3.3% | | | | | |
Pfizer Inc. | | 2,664,100 | | | 47,181,211 |
| | | | | |
Retailing 4.4% | | | | | |
Family Dollar Stores Inc. | | 2,338,930 | | | 60,975,905 |
aSally Beauty Holdings Inc. | | 393,150 | | | 2,237,024 |
| | | | | |
| | | | | 63,212,929 |
| | | | | |
Semiconductors & Semiconductor Equipment 0.0%b | | | | | |
Cohu Inc. | | 50,300 | | | 611,145 |
| | | | | |
Total Common Stocks (Cost $1,331,425,065) | | | | | 1,344,704,175 |
| | | | | |
Short Term Investments 5.9% | | | | | |
Money Market Funds 5.9% | | | | | |
cBank of New York Institutional Cash Reserve Fund, 0.09% | | 657,423 | | | 650,849 |
dFranklin Institutional Fiduciary Trust Money Market Portfolio, 0.55% | | 83,102,645 | | | 83,102,645 |
| | | | | |
Total Short Term Investments (Cost $83,760,068) | | | | | 83,753,494 |
| | | | | |
| | |
Total Investments (Cost $1,415,185,133) 99.9% | | | | | 1,428,457,669 |
Other Assets, less Liabilities 0.1% | | | | | 1,286,450 |
| | | | | |
Net Assets 100.0% | | | | $ | 1,429,744,119 |
| | | | | |
aNon-income producing for the twelve months ended December 31, 2008.
bRounds to less than 0.1% of net assets.
cThe rate shown is the annualized seven-day yield at period end.
dSee Note 7 regarding investments in the Franklin Institutional Fiduciary Trust Money Market Portfolio. The rate shown is the annualized seven-day yield at period end.
The accompanying notes are an integral part of these financial statements.
FRD-11
Franklin Templeton Variable Insurance Products Trust
Financial Statements
Statement of Assets and Liabilities
December 31, 2008
| | | | |
| | | Franklin Rising
Dividends
Securities Fund | |
Assets: | | | | |
Investments in securities: | | | | |
Cost - Unaffiliated issuers | | $ | 1,332,082,488 | |
Cost - Sweep Money Fund (Note 7) | | | 83,102,645 | |
| | | | |
Total cost of investments | | $ | 1,415,185,133 | |
| | | | |
Value - Unaffiliated issuers | | $ | 1,345,355,024 | |
Value - Sweep Money Fund (Note 7) | | | 83,102,645 | |
| | | | |
Total value of investments | | | 1,428,457,669 | |
Receivables: | | | | |
Capital shares sold | | | 85,828 | |
Dividends | | | 4,449,185 | |
| | | | |
Total assets | | | 1,432,992,682 | |
| | | | |
Liabilities: | | | | |
Payables: | | | | |
Investment securities purchased | | | 104,497 | |
Capital shares redeemed | | | 877,271 | |
Affiliates | | | 1,233,939 | |
Reports to shareholders | | | 201,968 | |
Funds advanced by custodian | | | 657,423 | |
Accrued expenses and other liabilities | | | 173,465 | |
| | | | |
Total liabilities | | | 3,248,563 | |
| | | | |
Net assets, at value | | $ | 1,429,744,119 | |
| | | | |
Net assets consist of: | | | | |
Paid-in capital | | $ | 1,617,159,193 | |
Undistributed net investment income | | | 35,156,485 | |
Net unrealized appreciation (depreciation) | | | 13,152,665 | |
Accumulated net realized gain (loss) | | | (235,724,224 | ) |
| | | | |
Net assets, at value | | $ | 1,429,744,119 | |
| | | | |
Class 1: | | | | |
Net assets, at value | | $ | 142,862,211 | |
| | | | |
Shares outstanding | | | 10,233,186 | |
| | | | |
Net asset value and maximum offering price per share | | $ | 13.96 | |
| | | | |
Class 2: | | | | |
Net assets, at value | | $ | 1,286,878,149 | |
| | | | |
Shares outstanding | | | 93,809,200 | |
| | | | |
Net asset value and maximum offering price per share | | $ | 13.72 | |
| | | | |
Class 4: | | | | |
Net assets, at value | | $ | 3,759 | |
| | | | |
Shares outstanding | | | 270 | |
| | | | |
Net asset value and maximum offering price per share | | $ | 13.92 | |
| | | | |
The accompanying notes are an integral part of these financial statements.
FRD-12
Franklin Templeton Variable Insurance Products Trust
Financial Statements (continued)
Statement of Operations
for the year ended December 31, 2008
| | | | |
| | | Franklin Rising
Dividends
Securities Fund | |
Investment income: | | | | |
Dividends: | | | | |
Unaffiliated issuers | | $ | 49,913,308 | |
Sweep Money Fund (Note 7) | | | 1,152,818 | |
Income from securities loaned | | | 226,452 | |
| | | | |
Total investment income | | | 51,292,578 | |
| | | | |
Expenses: | | | | |
Management fees (Note 3a) | | | 11,309,772 | |
Distribution fees: (Note 3c) | | | | |
Class 2 | | | 4,328,072 | |
Class 4 | | | 14 | |
Unaffiliated transfer agent fees | | | 1,051 | |
Custodian fees (Note 4) | | | 34,983 | |
Reports to shareholders | | | 323,532 | |
Registration and filing fees | | | 7,740 | |
Professional fees | | | 47,392 | |
Trustees’ fees and expenses | | | 9,986 | |
Other | | | 55,732 | |
| | | | |
Total expenses | | | 16,118,274 | |
Expense reductions (Note 4) | | | (60 | ) |
| | | | |
Net expenses | | | 16,118,214 | |
| | | | |
Net investment income | | | 35,174,364 | |
| | | | |
Realized and unrealized gains (losses): | | | | |
Net realized gain (loss) from investments | | | (234,658,586 | ) |
Net change in unrealized appreciation (depreciation) on investments | | | (387,942,691 | ) |
| | | | |
Net realized and unrealized gain (loss) | | | (622,601,277 | ) |
| | | | |
Net increase (decrease) in net assets resulting from operations | | $ | (587,426,913 | ) |
| | | | |
The accompanying notes are an integral part of these financial statements.
FRD-13
Franklin Templeton Variable Insurance Products Trust
Financial Statements (continued)
Statements of Changes in Net Assets
| | | | | | | | |
| | | Franklin Rising Dividends
Securities Fund | |
| | | Year Ended December 31, | |
| | | 2008 | | | 2007 | |
| | | | |
Increase (decrease) in net assets: | | | | | | | | |
Operations: | | | | | | | | |
Net investment income | | $ | 35,174,364 | | | $ | 35,979,785 | |
Net realized gain (loss) from investments | | | (234,658,586 | ) | | | 15,955,531 | |
Net change in unrealized appreciation (depreciation) on investments | | | (387,942,691 | ) | | | (118,598,969 | ) |
| | | | |
Net increase (decrease) in net assets resulting from operations | | | (587,426,913 | ) | | | (66,663,653 | ) |
| | | | |
Distributions to shareholders from: | | | | | | | | |
Net investment income: | | | | | | | | |
Class 1 | | | (3,976,477 | ) | | | (6,748,637 | ) |
Class 2 | | | (31,994,362 | ) | | | (50,470,683 | ) |
Class 4 | | | (98 | ) | | | — | |
Net realized gains: | | | | | | | | |
Class 1 | | | (1,471,627 | ) | | | (3,824,396 | ) |
Class 2 | | | (13,810,813 | ) | | | (30,955,762 | ) |
Class 4 | | | (36 | ) | | | — | |
| | | | |
Total distributions to shareholders | | | (51,253,413 | ) | | | (91,999,478 | ) |
| | | | |
Capital share transactions: (Note 2) | | | | | | | | |
Class 1 | | | (30,501,392 | ) | | | (36,683,874 | ) |
Class 2 | | | (216,391,575 | ) | | | 241,115,910 | |
Class 4 | | | 5,000 | | | | — | |
| | | | |
Total capital share transactions | | | (246,887,967 | ) | | | 204,432,036 | |
| | | | |
Net increase (decrease) in net assets | | | (885,568,293 | ) | | | 45,768,905 | |
Net assets: | | | | | | | | |
Beginning of year | | | 2,315,312,412 | | | | 2,269,543,507 | |
| | | | |
End of year | | $ | 1,429,744,119 | | | $ | 2,315,312,412 | |
| | | | |
Undistributed net investment income included in net assets: | | | | | | | | |
End of year | | $ | 35,156,485 | | | $ | 35,970,075 | |
| | | | |
The accompanying notes are an integral part of these financial statements.
FRD-14
Franklin Templeton Variable Insurance Products Trust
Notes to Financial Statements
Franklin Rising Dividends Securities Fund
1. ORGANIZATION AND SIGNIFICANT ACCOUNTING POLICIES
Franklin Templeton Variable Insurance Products Trust (Trust) is registered under the Investment Company Act of 1940, as amended, (1940 Act) as an open-end investment company, consisting of twenty-three separate funds. The Franklin Rising Dividends Securities Fund (Fund) is included in this report. The financial statements of the remaining funds in the Trust are presented separately. Shares of the Fund are sold only to insurance company separate accounts to fund the benefits of variable life insurance policies or variable annuity contracts. At December 31, 2008, 65.47% of the Fund’s shares were held through one insurance company. The Fund offers three classes of shares: Class 1, Class 2, and Class 4. Effective February 29, 2008, the Fund began offering a new class of shares, Class 4. Each class of shares differs by its distribution fees, voting rights on matters affecting a single class and its exchange privilege.
The following summarizes the Fund’s significant accounting policies.
a. Security Valuation
Securities listed on a securities exchange or on the NASDAQ National Market System are valued at the last quoted sale price or the official closing price of the day, respectively. Over-the-counter securities and listed securities for which there is no reported sale are valued within the range of the most recent quoted bid and ask prices. Securities that trade in multiple markets or on multiple exchanges are valued according to the broadest and most representative market. Investments in open-end mutual funds are valued at the closing net asset value.
The Trust has procedures to determine the fair value of individual securities and other assets for which market prices are not readily available or which may not be reliably priced. Methods for valuing these securities may include: fundamental analysis, matrix pricing, discounts from market prices of similar securities, or discounts applied due to the nature and duration of restrictions on the disposition of the securities. Due to the inherent uncertainty of valuations of such securities, the fair values may differ significantly from the values that would have been used had a ready market for such investments existed. Occasionally, events occur between the time at which trading in a security is completed and the close of the NYSE that might call into question the availability (including the reliability) of the value of a portfolio security held by the Fund. If such an event occurs, the securities may be valued using fair value procedures, which may include the use of independent pricing services. All security valuation procedures are approved by the Trust’s Board of Trustees.
b. Securities Lending
The Fund participates in a principal based security lending program. The Fund receives cash collateral against the loaned securities in an amount equal to at least 102% of the market value of the loaned securities. Collateral is maintained over the life of the loan in an amount not less than 100% of the market value of loaned securities, as determined at the close of Fund business each day; any additional collateral required due to changes in security values is delivered to the Fund on the next business day. The collateral is invested in a non-registered money market fund managed by the Fund’s custodian on the Fund’s behalf. The Fund receives income from the investment of cash collateral, in addition to lending fees and rebates paid by the borrower. The Fund bears the market risk with respect to the collateral investment, securities loaned, and the risk that the principal may default on its obligations to the Fund. At December 31, 2008, the Fund had no securities on loan.
c. Income Taxes
No provision has been made for U.S. income taxes because it is the Fund’s policy to qualify as a regulated investment company under the Internal Revenue Code and to distribute to shareholders substantially all of its taxable income and net realized gains.
The Fund has reviewed the tax positions, taken on federal income tax returns, for each of the three open tax years and as of December 31, 2008, and has determined that no provision for income tax is required in the Fund’s financial statements.
FRD-15
Franklin Templeton Variable Insurance Products Trust
Notes to Financial Statements (continued)
Franklin Rising Dividends Securities Fund
1. ORGANIZATION AND SIGNIFICANT ACCOUNTING POLICIES (continued)
d. Security Transactions, Investment Income, Expenses and Distributions
Security transactions are accounted for on trade date. Realized gains and losses on security transactions are determined on a specific identification basis. Estimated expenses are accrued daily. Dividend income is recorded on the ex-dividend date. Distributions to shareholders are recorded on the ex-dividend date and are determined according to income tax regulations (tax basis). Distributable earnings determined on a tax basis may differ from earnings recorded in accordance with accounting principles generally accepted in the United States of America. These differences may be permanent or temporary. Permanent differences are reclassified among capital accounts to reflect their tax character. These reclassifications have no impact on net assets or the results of operations. Temporary differences are not reclassified, as they may reverse in subsequent periods.
Common expenses incurred by the Trust are allocated among the funds based on the ratio of net assets of each fund to the combined net assets of the Trust. Fund specific expenses are charged directly to the fund that incurred the expense.
Realized and unrealized gains and losses and net investment income, not including class specific expenses, are allocated daily to each class of shares based upon the relative proportion of net assets of each class. Differences in per share distributions, by class, are generally due to differences in class specific expenses.
e. Accounting Estimates
The preparation of financial statements in accordance with accounting principles generally accepted in the United States of America requires management to make estimates and assumptions that affect the reported amounts of assets and liabilities at the date of the financial statements and the amounts of income and expenses during the reporting period. Actual results could differ from those estimates.
f. Guarantees and Indemnifications
Under the Trust’s organizational documents, its officers and trustees are indemnified by the Trust against certain liabilities arising out of the performance of their duties to the Trust. Additionally, in the normal course of business, the Trust, on behalf of the Fund, enters into contracts with service providers that contain general indemnification clauses. The Trust’s maximum exposure under these arrangements is unknown as this would involve future claims that may be made against the Trust that have not yet occurred. Currently, the Trust expects the risk of loss to be remote.
2. SHARES OF BENEFICIAL INTEREST
At December 31, 2008, there were an unlimited number of shares authorized (without par value). Transactions in the Fund’s shares were as follows:
| | | | | | | | | | | | | | |
| | | Year Ended December 31, | |
| | | 2008a | | | 2007 | |
| Class 1 Shares: | | Shares | | | Amount | | | Shares | | | Amount | |
| | | | |
Shares sold | | 277,877 | | | $ | 4,587,250 | | | 404,175 | | | $ | 8,421,307 | |
Shares issued in reinvestment of distributions | | 289,331 | | | | 5,448,104 | | | 493,836 | | | | 10,573,033 | |
Shares redeemed | | (2,366,622 | ) | | | (40,536,746 | ) | | (2,671,946 | ) | | | (55,678,214 | ) |
| | | | |
Net increase (decrease) | | (1,799,414 | ) | | $ | (30,501,392 | ) | | (1,773,935 | ) | | $ | (36,683,874 | ) |
| | | | |
| Class 2 Shares: | | | | | | | | | | | | |
Shares sold | | 4,881,454 | | | $ | 84,391,025 | | | 17,185,808 | | | $ | 353,479,589 | |
Shares issued in reinvestment of distributions | | 2,471,947 | | | | 45,805,175 | | | 3,864,568 | | | | 81,426,445 | |
Shares redeemed | | (21,427,912 | ) | | | (346,587,775 | ) | | (9,573,257 | ) | | | (193,790,124 | ) |
| | | | |
Net increase (decrease) | | (14,074,511 | ) | | $ | (216,391,575 | ) | | 11,477,119 | | | $ | 241,115,910 | |
| | | | |
| Class 4 Shares: | | | | | | | | | | | | |
Shares sold | | 270 | | | $ | 5,000 | | | | | | | | |
| | | | | | | | | | |
aFor | the period February 29, 2008 (effective date) to December 31, 2008 for Class 4. |
FRD-16
Franklin Templeton Variable Insurance Products Trust
Notes to Financial Statements (continued)
Franklin Rising Dividends Securities Fund
3. TRANSACTIONS WITH AFFILIATES
Franklin Resources, Inc. is the holding company for various subsidiaries that together are referred to as Franklin Templeton Investments. Certain officers and trustees of the Trust are also officers and/or directors of the following subsidiaries:
| | |
| Subsidiary | | Affiliation |
Franklin Advisory Services, LLC (Advisory Services) | | Investment manager |
Franklin Templeton Services, LLC (FT Services) | | Administrative manager |
Franklin Templeton Distributors, Inc. (Distributors) | | Principal underwriter |
Franklin Templeton Investor Services, LLC (Investor Services) | | Transfer agent |
a. Management Fees
The Fund pays an investment management fee to Advisory Services based on the average daily net assets of the Fund as follows:
| | |
| Annualized Fee Rate | | Net Assets |
0.750% | | Up to and including $500 million |
0.625% | | Over $500 million, up to and including $1 billion |
0.500% | | In excess of $1 billion |
b. Administrative Fees
Under an agreement with Advisers, FT Services provides administrative services to the Fund. The fee is paid by Advisers based on average daily net assets, and is not an additional expense of the Fund.
c. Distribution Fees
The Fund’s Board of Trustees has adopted distribution plans for Class 2 and Class 4 shares pursuant to Rule 12b-1 under the 1940 Act. Under the Fund’s compensation distribution plans, the Fund pays Distributors for costs incurred in connection with the servicing, sale and distribution of the Fund’s shares up to 0.35% per year of its average daily net assets of each class. The Board of Trustees has agreed to limit the current rate to 0.25% per year for Class 2.
d. Transfer Agent Fees
Investor Services, under terms of an agreement, performs shareholder servicing for the Fund and is not paid by the Fund for the services.
4. EXPENSE OFFSET ARRANGEMENT
The Fund has entered into an arrangement with its custodian whereby credits realized as a result of uninvested cash balances are used to reduce a portion of the Fund’s custodian expenses. During the year ended December 31, 2008, the custodian fees were reduced as noted in the Statement of Operations.
5. INCOME TAXES
For tax purposes, capital losses may be carried over to offset future capital gains, if any. At December 31, 2008, the Fund had tax basis capital losses of $209,698,671 expiring in 2016.
For tax purposes, realized capital losses occurring subsequent to October 31, may be deferred and treated as occurring on the first day of the following fiscal year. At December 31, 2008, the Fund deferred realized capital losses of $23,900,601.
FRD-17
Franklin Templeton Variable Insurance Products Trust
Notes to Financial Statements (continued)
Franklin Rising Dividends Securities Fund
5. INCOME TAXES (continued)
The tax character of distributions paid during the years ended December 31, 2008 and 2007, was as follows:
| | | | | | |
| | | 2008 | | 2007 |
| | | |
Distributions paid from: | | | | | | |
Ordinary income | | $ | 37,511,317 | | $ | 58,920,961 |
Long term capital gain | | | 13,742,096 | | | 33,078,517 |
| | | |
| | $ | 51,253,413 | | $ | 91,999,478 |
| | | |
At December 31, 2008, the cost of investments, net unrealized appreciation (depreciation), and undistributed ordinary income for income tax purposes were as follows:
| | | | |
Cost of investments | | $ | 1,417,310,084 | |
| | | | |
| |
Unrealized appreciation | | $ | 231,784,014 | |
Unrealized depreciation | | | (220,636,429 | ) |
| | | | |
Net unrealized appreciation (depreciation) | | $ | 11,147,585 | |
| | | | |
| |
Distributable earnings – undistributed ordinary income | | $ | 35,156,485 | |
| | | | |
Net realized gains (losses) differ for financial statement and tax purposes primarily due to differing treatment of wash sales.
6. INVESTMENT TRANSACTIONS
Purchases and sales of investments (excluding short term securities) for the year ended December 31, 2008, aggregated $101,607,452 and $384,002,415, respectively.
7. INVESTMENTS IN FRANKLIN INSTITUTIONAL FIDUCIARY TRUST MONEY MARKET PORTFOLIO
The Fund may invest in the Franklin Institutional Fiduciary Trust Money Market Portfolio (Sweep Money Fund), an open-end investment company managed by Franklin Advisers, Inc. (an affiliate of the investment manager). Management fees paid by the Fund are reduced on assets invested in the Sweep Money Fund, in an amount not to exceed the management and administrative fees paid by the Sweep Money Fund.
8. FAIR VALUE MEASUREMENTS
The Fund adopted Financial Accounting Standards Board (FASB) Statement No. 157, “Fair Value Measurement” (SFAS 157), on January 1, 2008. SFAS 157 defines fair value, establishes a framework for measuring fair value, and expands disclosures about fair value measurements. The Fund has determined that the implementation of SFAS 157 did not have a material impact on the Fund’s financial statements.
SFAS 157 establishes a fair value hierarchy that distinguishes between market data obtained from independent sources (observable inputs) and the Fund’s own market assumptions (unobservable inputs). These inputs are used in determining the value of the Fund’s investments and are summarized in the following fair value hierarchy:
| | • | | Level 1 – quoted prices in active markets for identical securities |
| | • | | Level 2 – other significant observable inputs (including quoted prices for similar securities, interest rates, prepayment speed, credit risk, etc.) |
| | • | | Level 3 – significant unobservable inputs (including the Fund’s own assumptions in determining the fair value of investments) |
FRD-18
Franklin Templeton Variable Insurance Products Trust
Notes to Financial Statements (continued)
Franklin Rising Dividends Securities Fund
8. FAIR VALUE MEASUREMENTS (continued)
The inputs or methodology used for valuing securities are not an indication of the risk associated with investing in those securities.
The following is a summary of the inputs used as of December 31, 2008, in valuing the Fund’s assets carried at fair value:
| | | | | | | | | | | | |
| | | Level 1 | | Level 2 | | Level 3 | | Total |
| Assets: | | | | | | | | | | | | |
Investments in Securities | | $ | 1,427,806,820 | | $ | 650,849 | | $ | — | | $ | 1,428,457,669 |
9. NEW ACCOUNTING PRONOUNCEMENT
In March 2008, FASB issued FASB Statement No. 161, “Disclosures about Derivative Instruments and Hedging Activities, an amendment of FASB Statement No. 133” (SFAS 161), which expands disclosures about derivative investments and hedging activities. SFAS 161 is effective for fiscal years and interim periods beginning after November 15, 2008. The Fund is currently evaluating the impact, if any, of applying the various provisions of SFAS 161.
10. SUBSEQUENT EVENT
On January 23, 2009, the Fund entered into, along with other funds managed by Franklin Templeton Investments (individually, “Borrower”; collectively “Borrowers”), a $725 million senior unsecured syndicated global line of credit (“Global Credit Facility”) to provide a source of funds to the Borrowers for temporary and emergency purposes and to meet future unanticipated or unusually large redemption requests.
Under the terms of the Global Credit Facility, each Borrower has agreed to pay its proportionate share of fees and expenses incurred in connection with the implementation and maintenance of the Global Credit Facility.
FRD-19
Franklin Templeton Variable Insurance Products Trust
Franklin Rising Dividends Securities Fund
Report of Independent Registered Public Accounting Firm
To the Board of Trustees and Shareholders of Franklin Templeton Variable Insurance Products Trust
In our opinion, the accompanying statement of assets and liabilities, including the statement of investments, and the related statements of operations and of changes in net assets and the financial highlights present fairly, in all material respects, the financial position of Franklin Rising Dividends Securities Fund (one of the funds constituting the Franklin Templeton Variable Insurance Products Trust, hereafter referred to as the “Fund”) at December 31, 2008, the results of its operations for the year then ended, the changes in its net assets for each of the two years in the period then ended and the financial highlights for the periods presented, in conformity with accounting principles generally accepted in the United States of America. These financial statements and financial highlights (hereafter referred to as “financial statements”) are the responsibility of the Fund’s management. Our responsibility is to express an opinion on these financial statements based on our audits. We conducted our audits of these financial statements in accordance with the standards of the Public Company Accounting Oversight Board (United States). Those standards require that we plan and perform the audit to obtain reasonable assurance about whether the financial statements are free of material misstatement. An audit includes examining, on a test basis, evidence supporting the amounts and disclosures in the financial statements, assessing the accounting principles used and significant estimates made by management, and evaluating the overall financial statement presentation. We believe that our audits, which included confirmation of securities at December 31, 2008 by correspondence with the custodian and brokers, provide a reasonable basis for our opinion.
PricewaterhouseCoopers LLP
San Francisco, California
February 10, 2009
FRD-20
Franklin Templeton Variable Insurance Products Trust
Tax Designation (unaudited)
Franklin Rising Dividends Securities Fund
Under Section 852(b)(3)(c) of the Internal Revenue Code (Code), the Fund designates the maximum amount allowable but no less than $13,742,096 as a long term capital gain dividend for the fiscal year ended December 31, 2008.
Under Section 854(b)(2) of the Code, the Fund designates 100% of the ordinary income dividends as income qualifying for the dividends received deduction for the fiscal year ended December 31, 2008.
FRD-21
FRANKLIN SMALL CAP VALUE SECURITIES FUND
This annual report for Franklin Small Cap Value Securities Fund covers the fiscal year ended December 31, 2008.
Performance Summary as of 12/31/08
Average annual total return of Class 1 shares represents the average annual change in value, assuming reinvestment of dividends and capital gains. Average returns smooth out variations in returns, which can be significant; they are not the same as year-by-year results.
Periods ended 12/31/08
| | | | | | |
| | | 1-Year | | 5-Year | | 10-Year |
Average Annual Total Return | | -32.87% | | +0.83% | | +6.20% |
Total Return Index Comparison for a Hypothetical $10,000 Investment (1/1/99–12/31/08)
The graph below shows the change in value of a hypothetical $10,000 investment in the Fund over the indicated period and includes reinvestment of any income or distributions. The Fund’s performance is compared to the performance of the Russell 2500™ Value Index. One cannot invest directly in an index, nor is an index representative of the Fund’s portfolio. Please see Important Notes to Performance Information preceding the Fund Summaries.
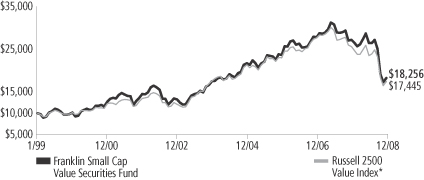
*Source: © 2009 Morningstar. Please see Index Descriptions following the Fund Summaries.
Franklin Small Cap Value Securities Fund – Class 1
Performance reflects the Fund’s Class 1 operating expenses, but does not include any contract fees, expenses or sales charges. If they had been included, performance would be lower. These charges and deductions, particularly for variable life policies, can have a significant effect on contract values and insurance benefits. See the contract prospectus for a complete description of these expenses, including sales charges.
Performance data represent past performance, which does not guarantee future results. Investment return and principal value will fluctuate, and you may have a gain or loss when you sell your shares.
Current performance may differ from figures shown.
FSV-1
Fund Goal and Main Investments: Franklin Small Cap Value Securities Fund seeks long-term total return. The Fund normally invests at least 80% of its net assets in investments of small capitalization companies and normally invests predominantly in equity securities. For this Fund, small capitalization companies are those with market capitalization values not exceeding $3.5 billion at the time of purchase. The Fund invests generally in equity securities of companies that the manager believes are currently undervalued.
Performance Overview
You can find the Fund’s one-year total return in the Performance Summary. The Fund performed comparably to its benchmark, the Russell 2500 Value Index, which fell 31.99% for the same period.1 Please note that the Fund employs a bottom-up stock selection process, and the managers invest in securities without regard to benchmark comparisons.
Economic and Market Overview
In 2008, economic conditions deteriorated. The Conference Board’s Consumer Confidence Index fell to an all-time low since it began in 1967 as the U.S. economy faltered and stock markets declined. The government’s abrupt conservatorship of Fannie Mae and Freddie Mac and the failure of several blue-chip banks and financial institutions roiled equity markets. Despite government interventions and massive emergency funding, the nation’s economic troubles were exacerbated as manufacturing activity weakened at its fastest pace in nearly 30 years and as home prices continued to fall. Jobless claims mounted and the unemployment rate rose to 7.2% by period-end.2 Economic growth, as measured by gross domestic product (GDP), rebounded from a 0.9% annualized rate in the first quarter of 2008 to a 2.8% annualized pace in the second quarter, largely due to strong exports and government spending. However, in the third and fourth quarters of 2008, GDP fell at annualized rates of 0.5% and an estimated 3.8%, reflecting a broad-based contraction in consumer spending, falling corporate profits and slowing export growth.
Oil prices soared to a record high in July, rising above $145 per barrel, before dramatically retreating to $45 by period-end. Many other commodities such as agricultural products and precious and base metals
1. Source: © 2009 Morningstar. One cannot invest directly in an index, nor is an index representative of the Fund’s portfolio. Please see Index Descriptions following the Fund Summaries.
2. Source: Bureau of Labor Statistics.
Fund Risks: The Fund’s investments in stocks offer the potential for long-term gains but can be subject to short-term price fluctuations. Smaller company securities can increase the risk of greater price volatility, particularly over the short term. Smaller or relatively new or unseasoned companies can be particularly sensitive to changing economic conditions, and their prospects for growth are less certain than those of larger, more established companies. Foreign investing involves additional risks, including currency fluctuations, economic instability, market volatility, and political and social instability. The Fund’s prospectus also includes a description of the main investment risks.
FSV-2
followed similar trends. Partially as a result of the steep price corrections, inflation declined significantly late in the review period, and December’s inflation rate was an annualized 0.1%.2 Core inflation, which excludes food and energy costs, rose at a 1.8% annual rate; this level was within the Federal Reserve Board’s (Fed’s) informal target range of 1.5%–2.0%.2
A slowing economy and decelerating inflation prompted policymakers to further lower interest rates and enact stimulus plans. During the year under review, the Fed lowered the federal funds target rate to a range of 0% to 0.25% from 4.25% at the start of the reporting period. The Fed and U.S. Treasury Department also introduced new programs such as the Primary Dealer Credit Facility (PDCF) and the Troubled Asset Relief Program (TARP), which were intended to enhance market liquidity.
Volatility remained high throughout the reporting period but intensified in the latter half of the year as stocks fluctuated wildly and Treasury prices soared. The year was among the worst in history for U.S. stock market performance. For the 12 months under review, the blue chip stocks of the Dow Jones Industrial Average fell 31.93%, the broader Standard & Poor’s 500 Index (S&P 500) dropped 37.00%, and the technology-heavy NASDAQ Composite Index declined 40.03%.3 All sectors lost value; however, the financials, materials and information technology sectors had the largest declines.
Investment Strategy
We are a research-driven, fundamental investment adviser, pursuing a disciplined, value-oriented strategy for the Fund. As a bottom-up adviser concentrating primarily on individual securities, we focus on the market price of a company’s securities relative to our evaluation of the company’s potential long-term earnings, asset value or cash flow. We seek bargains among the “unloved,” out-of-favor companies that offer, in our opinion, attractive long-term potential. These might include current growth companies that are being ignored by the market, former growth companies that have stumbled recently, dropping sharply in price but that still have significant growth potential, in our opinion, or companies that may be potential turnaround candidates or takeover targets.
Manager’s Discussion
During the 12 months under review, detractors from performance included stocks from industries hurt by the slowing economy and reduced consumer spending. Notable among the Fund’s weak performers during the fiscal year
3. Source: © 2009 Morningstar. Please see Index Descriptions following the Fund Summaries.
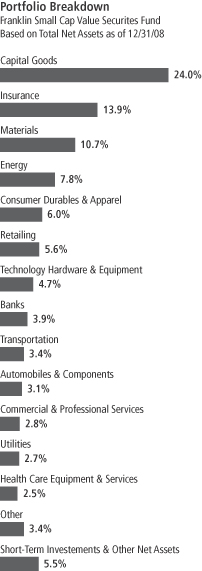
FSV-3
were specialty retailer Zale, recreational vehicle manufacturer Thor Industries, recreational products manufacturer Brunswick and home furnishings company La-Z-Boy. Other major detractors included health and safety products manufacturer Mine Safety Appliances, metals processing company Reliance Steel & Aluminum, and offshore energy company Helix Energy Solutions Group.
Contributors to Fund performance included several financials sector holdings including insurance companies IPC Holdings, RLI and Montpelier Re Holdings, and regional bank Chemical Financial.4 In the industrials sector, freight railroad operator Genesee & Wyoming, building products manufacturer Simpson Manufacturing, and road and construction equipment manufacturer Astec Industries, a new holding, helped performance. 5
In addition to Astec Industries, the Fund initiated eight positions in what we considered attractively valued securities: industrial products distributor Applied Industrial Technologies; diversified chemicals company Ashland; automotive safety systems manufacturer Autoliv; oil and natural gas equipment manufacturer Carbo Ceramics; industrial goods manufacturer Lincoln Electric Holdings; industrial lasers and supplies producer Rofin-Sinar Technologies; retailer Saks; and workers compensation insurance provider Zenith National Insurance. We also added significantly to several existing positions including Benchmark Electronics, Erie Indemnity, General Maritime, Men’s Wearhouse and NV Energy (formerly, Sierra Pacific Resources). The Fund liquidated 12 positions during the period. One holding, Genlyte Group, was acquired by Royal Dutch Electronics at a 52% premium to its share price prior to the deal’s announcement in November 2007. The other positions were sold either because we believed the shares were fully valued or the companies’ fundamentals had deteriorated.
Thank you for your participation in Franklin Small Cap Value Securities Fund. We look forward to serving your future investment needs.
4. The financials sector comprises banks and insurance in the SOI.
5. The industrials sector comprises capital goods, commercial and professional services, and transportation in the SOI.
The foregoing information reflects our analysis, opinions and portfolio holdings as of December 31, 2008, the end of the reporting period. The way we implement our main investment strategies and the resulting portfolio holdings may change depending on factors such as market and economic conditions. These opinions may not be relied upon as investment advice or an offer for a particular security. The information is not a complete analysis of every aspect of any market, country, industry, security or the Fund. Statements of fact are from sources considered reliable, but the investment manager makes no representation or warranty as to their completeness or accuracy. Although historical performance is no guarantee of future results, these insights may help you understand our investment management philosophy.
Top 10 Holdings
Franklin Small Cap Value Securities Fund 12/31/08
| | |
Company
Sector/Industry | | % of Total
Net Assets |
| |
| Old Republic International Corp. | | 2.2% |
| Insurance | | |
| |
| IPC Holdings Ltd. | | 2.2% |
| Insurance | | |
| |
| Universal Forest Products Inc. | | 2.0% |
| Capital Goods | | |
| |
| Aspen Insurance Holdings Ltd. | | 1.9% |
| Insurance | | |
| |
| Mueller Industries Inc. | | 1.9% |
| Capital Goods | | |
| |
| Montpelier Re Holdings Ltd. (Bermuda) | | 1.8% |
| Insurance | | |
| |
| TrustCo Bank Corp. NY | | 1.8% |
| Banks | | |
| |
| Benchmark Electronics Inc. | | 1.6% |
| Technology Hardware & Equipment | | |
| |
| NV Energy Corp. | | 1.6% |
| Utilities | | |
| |
| Westlake Chemical Corp. | | 1.6% |
| Materials | | |
The dollar value, number of shares or principal amount, and names of all portfolio holdings are listed in the Fund’s Statement of Investments (SOI).
FSV-4
Fund Expenses
As an investor in a variable insurance contract (Contract) that indirectly provides for investment in an underlying mutual fund, you can incur transaction and/or ongoing expenses at both the Fund level and the Contract level.
| • | | Transaction expenses can include sales charges (loads) on purchases, redemption fees, surrender fees, transfer fees and premium taxes. |
| • | | Ongoing expenses can include management fees, distribution and service (12b-1) fees, contract fees, annual maintenance fees, mortality and expense risk fees and other fees and expenses. All mutual funds and Contracts have some types of ongoing expenses. |
The expenses shown in the table are meant to highlight ongoing expenses at the Fund level only and do not include ongoing expenses at the Contract level, or transaction expenses at either the Fund or Contract level. While the Fund does not have transaction expenses, if the transaction and ongoing expenses at the Contract level were included, the expenses shown below would be higher. You should consult your Contract prospectus or disclosure document for more information.
The table shows Fund-level ongoing expenses and can help you understand these expenses and compare them with those of other mutual funds offered through the Contract. The table assumes a $1,000 investment held for the six months indicated. Please refer to the Fund prospectus for additional information on operating expenses.
Actual Fund Expenses
The first line (Actual) of the table provides actual account values and expenses. The “Ending Account Value” is derived from the Fund’s actual return, which includes the effect of ongoing Fund expenses, but does not include the effect of ongoing Contract expenses.
You can estimate the Fund-level expenses you incurred during the period by following these steps. Of course, your account value and expenses will differ from those in this illustration:
| 1. | Divide your account value by $1,000. |
If an account had an $8,600 value, then $8,600 ÷ $1,000 = 8.6.
| 2. | Multiply the result by the number under the heading “Fund-Level Expenses Incurred During Period.” |
If Fund-Level Expenses Incurred During Period were $7.50, then 8.6 x $7.50 = $64.50.
In this illustration, the estimated expenses incurred this period at the Fund level are $64.50.
Franklin Small Cap Value Securities Fund – Class 1
FSV-5
Hypothetical Example for Comparison with Other Mutual Funds
Information in the second line (Hypothetical) of the table can help you compare ongoing expenses of the Fund with those of other mutual funds offered through the Contract. This information may not be used to estimate the actual ending account balance or expenses you incurred during the period. The hypothetical “Ending Account Value” is based on the Fund’s actual expense ratio and an assumed 5% annual rate of return before expenses, which does not represent the Fund’s actual return. The figure under the heading “Fund-Level Expenses Incurred During Period” shows the hypothetical expenses your account would have incurred under this scenario. You can compare this figure with the 5% hypothetical examples that appear in shareholder reports of other funds offered through a Contract.
| | | | | | | | | |
| Class 1 | | Beginning
Account
Value 7/1/08 | | Ending
Account
Value 12/31/08 | | Fund-Level
Expenses Incurred
During Period*
7/1/08–12/31/08 |
Actual | | $ | 1,000 | | $ | 691.80 | | $ | 2.85 |
Hypothetical (5% return before expenses) | | $ | 1,000 | | $ | 1,021.77 | | $ | 3.40 |
*Expenses are calculated using the most recent six-month annualized expense ratio for the Fund’s Class 1 shares (0.67%), which does not include any ongoing expenses of the Contract for which the Fund is an investment option, multiplied by the average account value over the period, multiplied by 184/366 to reflect the one-half year period.
FSV-6
Franklin Templeton Variable Insurance Products Trust
Financial Highlights
Franklin Small Cap Value Securities Fund
| | | | | | | | | | | | | | | | | | | | |
| | | Year Ended December 31, | |
| Class 1 | | 2008 | | | 2007 | | | 2006 | | | 2005 | | | 2004 | |
| | | | |
Per share operating performance | | | | | | | | | | | | | | | | | | | | |
(for a share outstanding throughout the year) | | | | | | | | | | | | | | | | | | | | |
Net asset value, beginning of year | | $ | 17.38 | | | $ | 19.07 | | | $ | 17.02 | | | $ | 15.85 | | | $ | 12.81 | |
| | | | |
Income from investment operationsa: | | | | | | | | | | | | | | | | | | | | |
Net investment incomeb | | | 0.24 | | | | 0.22 | | | | 0.18 | | | | 0.17 | | | | 0.21 | |
Net realized and unrealized gains (losses) | | | (5.44 | ) | | | (0.44 | ) | | | 2.69 | | | | 1.24 | | | | 2.87 | |
| | | | |
Total from investment operations | | | (5.20 | ) | | | (0.22 | ) | | | 2.87 | | | | 1.41 | | | | 3.08 | |
| | | | |
Less distributions from: | | | | | | | | | | | | | | | | | | | | |
Net investment income | | | (0.23 | ) | | | (0.17 | ) | | | (0.16 | ) | | | (0.14 | ) | | | (0.04 | ) |
Net realized gains | | | (1.22 | ) | | | (1.30 | ) | | | (0.66 | ) | | | (0.10 | ) | | | — | |
| | | | |
Total distributions | | | (1.45 | ) | | | (1.47 | ) | | | (0.82 | ) | | | (0.24 | ) | | | (0.04 | ) |
| | | | |
Net asset value, end of year | | $ | 10.73 | | | $ | 17.38 | | | $ | 19.07 | | | $ | 17.02 | | | $ | 15.85 | |
| | | | |
| | | | | |
Total returnc | | | (32.87)% | | | | (2.14)% | | | | 17.30% | | | | 8.99% | | | | 24.09% | |
Ratios to average net assets | | | | | | | | | | | | | | | | | | | | |
Expensesd | | | 0.67% | | | | 0.64% | | | | 0.65% | | | | 0.64% | | | | 0.67% | |
Net investment income | | | 1.62% | | | | 1.13% | | | | 0.97% | | | | 1.05% | | | | 1.59% | |
| | | | | |
Supplemental data | | | | | | | | | | | | | | | | | | | | |
Net assets, end of year (000’s) | | $ | 34,901 | | | $ | 57,045 | | | $ | 73,154 | | | $ | 52,632 | | | $ | 50,401 | |
Portfolio turnover rate | | | 16.98% | | | | 16.27% | | | | 16.43% | e | | | 11.03% | | | | 9.50% | |
aThe amount shown for a share outstanding throughout the period may not correlate with the Statement of Operations for the period due to the timing of sales and repurchases of the Fund shares in relation to income earned and/or fluctuating market value of the investments of the Fund.
bBased on average daily shares outstanding.
cTotal return does not include any fees, charges or expenses imposed by the variable annuity and life insurance contracts for which the Franklin Templeton Variable Insurance Products Trust serves as an underlying investment vehicle.
dBenefit of expense reduction rounds to less than 0.01%.
eExcludes the value of portfolio securities delivered as a result of a redemption in-kind.
The accompanying notes are an integral part of these financial statements.
FSV-7
Franklin Templeton Variable Insurance Products Trust
Financial Highlights (continued)
Franklin Small Cap Value Securities Fund
| | | | | | | | | | | | | | | | | | | | |
| | | Year Ended December 31, | |
| Class 2 | | 2008 | | | 2007 | | | 2006 | | | 2005 | | | 2004 | |
| | | | |
Per share operating performance | | | | | | | | | | | | | | | | | | | | |
(for a share outstanding throughout the year) | | | | | | | | | | | | | | | | | | | | |
Net asset value, beginning of year | | $ | 17.10 | | | $ | 18.79 | | | $ | 16.79 | | | $ | 15.65 | | | $ | 12.67 | |
| | | | |
Income from investment operationsa: | | | | | | | | | | | | | | | | | | | | |
Net investment incomeb | | | 0.20 | | | | 0.17 | | | | 0.13 | | | | 0.13 | | | | 0.18 | |
Net realized and unrealized gains (losses) | | | (5.35 | ) | | | (0.43 | ) | | | 2.65 | | | | 1.23 | | | | 2.82 | |
| | | | |
Total from investment operations | | | (5.15 | ) | | | (0.26 | ) | | | 2.78 | | | | 1.36 | | | | 3.00 | |
| | | | |
Less distributions from: | | | | | | | | | | | | | | | | | | | | |
Net investment income | | | (0.18 | ) | | | (0.13 | ) | | | (0.12 | ) | | | (0.12 | ) | | | (0.02 | ) |
Net realized gains | | | (1.22 | ) | | | (1.30 | ) | | | (0.66 | ) | | | (0.10 | ) | | | — | |
| | | | |
Total distributions | | | (1.40 | ) | | | (1.43 | ) | | | (0.78 | ) | | | (0.22 | ) | | | (0.02 | ) |
| | | | |
Net asset value, end of year | | $ | 10.55 | | | $ | 17.10 | | | $ | 18.79 | | | $ | 16.79 | | | $ | 15.65 | |
| | | | |
| | | | | |
Total returnc | | | (33.02)% | | | | (2.38)% | | | | 16.98% | | | | 8.77% | | | | 23.75% | |
Ratios to average net assets | | | | | | | | | | | | | | | | | | | | |
Expensesd | | | 0.92% | | | | 0.89% | | | | 0.90% | | | | 0.89% | | | | 0.92% | |
Net investment income | | | 1.37% | | | | 0.88% | | | | 0.72% | | | | 0.80% | | | | 1.34% | |
| | | | | |
Supplemental data | | | | | | | | | | | | | | | | | | | | |
Net assets, end of year (000’s) | | $ | 784,773 | | | $ | 1,177,367 | | | $ | 1,240,892 | | | $ | 1,094,120 | | | $ | 748,762 | |
Portfolio turnover rate | | | 16.98% | | | | 16.27% | | | | 16.43% | e | | | 11.03% | | | | 9.50% | |
aThe amount shown for a share outstanding throughout the period may not correlate with the Statement of Operations for the period due to the timing of sales and repurchases of the Fund shares in relation to income earned and/or fluctuating market value of the investments of the Fund.
bBased on average daily shares outstanding.
cTotal return does not include any fees, charges or expenses imposed by the variable annuity and life insurance contracts for which the Franklin Templeton Variable Insurance Products Trust serves as an underlying investment vehicle.
dBenefit of expense reduction rounds to less than 0.01%.
eExcludes the value of portfolio securities delivered as a result of a redemption in-kind.
The accompanying notes are an integral part of these financial statements.
FSV-8
Franklin Templeton Variable Insurance Products Trust
Financial Highlights (continued)
Franklin Small Cap Value Securities Fund
| | | | |
| Class 4 | | Period Ended
December 31,
2008a | |
| | | | |
Per share operating performance | | | | |
(for a share outstanding throughout the period) | | | | |
Net asset value, beginning of period | | $ | 16.42 | |
| | | | |
Income from investment operationsb: | | | | |
Net investment incomec | | | 0.15 | |
Net realized and unrealized gains (losses) | | | (4.42 | ) |
| | | | |
Total from investment operations | | | (4.27 | ) |
| | | | |
Less distributions from: | | | | |
Net investment income | | | (0.23 | ) |
Net realized gains | | | (1.22 | ) |
| | | | |
Total distributions | | | (1.45 | ) |
| | | | |
Net asset value, end of period | | $ | 10.70 | |
| | | | |
| |
Total returnd | | | (29.14)% | |
Ratios to average net assetse | | | | |
Expensesf | | | 1.02% | |
Net investment income | | | 1.27% | |
| |
Supplemental data | | | | |
Net assets, end of period (000’s) | | $ | 14,850 | |
Portfolio turnover rate | | | 16.98% | |
aFor the period February 29, 2008 (effective date) to December 31, 2008.
bThe amount shown for a share outstanding throughout the period may not correlate with the Statement of Operations for the period due to the timing of sales and repurchases of the Fund shares in relation to income earned and/or fluctuating market value of the investments of the Fund.
cBased on average daily shares outstanding.
dTotal return does not include any fees, charges or expenses imposed by the variable annuity and life insurance contracts for which the Franklin Templeton Variable Insurance Products Trust serves as an underlying investment vehicle. Total return is not annualized for periods less than one year.
eRatios are annualized for periods less than one year.
fBenefit of expense reduction rounds to less than 0.01%.
The accompanying notes are an integral part of these financial statements.
FSV-9
Franklin Templeton Variable Insurance Products Trust
Statement of Investments, December 31, 2008
| | | | | |
| Franklin Small Cap Value Securities Fund | | Shares | | Value |
Common Stocks 94.3% | | | | | |
Automobiles & Components 3.1% | | | | | |
Autoliv Inc. (Sweden) | | 331,600 | | $ | 7,116,136 |
Gentex Corp. | | 714,000 | | | 6,304,620 |
Monaco Coach Corp. | | 825,800 | | | 421,158 |
aThor Industries Inc. | | 658,000 | | | 8,672,440 |
Winnebago Industries Inc. | | 600,000 | | | 3,618,000 |
| | | | | |
| | | | | 26,132,354 |
| | | | | |
Banks 3.9% | | | | | |
aChemical Financial Corp. | | 461,354 | | | 12,862,549 |
Corus Bankshares Inc. | | 682,600 | | | 757,686 |
Peoples Bancorp Inc. | | 199,400 | | | 3,814,522 |
aTrustCo Bank Corp. NY | | 1,580,000 | | | 15,025,800 |
| | | | | |
| | | | | 32,460,557 |
| | | | | |
Capital Goods 23.8% | | | | | |
A.O. Smith Corp. | | 112,500 | | | 3,321,000 |
aAmerican Woodmark Corp. | | 359,310 | | | 6,550,221 |
Apogee Enterprises Inc. | | 864,000 | | | 8,951,040 |
Applied Industrial Technologies Inc. | | 201,000 | | | 3,802,920 |
bAstec Industries Inc. | | 80,600 | | | 2,525,198 |
Brady Corp., A | | 522,600 | | | 12,516,270 |
Briggs & Stratton Corp. | | 472,600 | | | 8,313,034 |
Carlisle Cos. Inc. | | 433,000 | | | 8,963,100 |
CIRCOR International Inc. | | 135,900 | | | 3,737,250 |
CNH Global NV (Netherlands) | | 84,000 | | | 1,310,400 |
bEMCOR Group Inc. | | 264,000 | | | 5,921,520 |
Franklin Electric Co. Inc. | | 131,232 | | | 3,688,932 |
Gibraltar Industries Inc. | | 1,079,800 | | | 12,892,812 |
Graco Inc. | | 458,200 | | | 10,873,086 |
Kennametal Inc. | | 416,000 | | | 9,231,040 |
Lincoln Electric Holdings Inc. | | 200,900 | | | 10,231,837 |
Mueller Industries Inc. | | 601,700 | | | 15,090,636 |
Nordson Corp. | | 252,000 | | | 8,137,080 |
bPowell Industries Inc. | | 62,600 | | | 1,816,652 |
Roper Industries Inc. | | 202,000 | | | 8,768,820 |
Simpson Manufacturing Co. Inc. | | 385,525 | | | 10,702,174 |
Timken Co. | | 120,000 | | | 2,355,600 |
Trinity Industries Inc. | | 510,800 | | | 8,050,208 |
Universal Forest Products Inc. | | 624,000 | | | 16,791,840 |
Wabash National Corp. | | 1,259,200 | | | 5,666,400 |
aWatts Water Technologies Inc., A | | 341,300 | | | 8,522,261 |
| | | | | |
| | | | | 198,731,331 |
| | | | | |
Commercial & Professional Services 2.8% | | | | | |
ABM Industries Inc. | | 630,700 | | | 12,014,835 |
Mine Safety Appliances Co. | | 473,200 | | | 11,314,212 |
| | | | | |
| | | | | 23,329,047 |
| | | | | |
Consumer Durables & Apparel 6.0% | | | | | |
Bassett Furniture Industries Inc. | | 230,900 | | | 773,515 |
Brunswick Corp. | | 906,000 | | | 3,814,260 |
D.R. Horton Inc. | | 772,000 | | | 5,458,040 |
Ethan Allen Interiors Inc. | | 442,000 | | | 6,351,540 |
cHooker Furniture Corp. | | 555,100 | | | 4,252,066 |
FSV-10
Franklin Templeton Variable Insurance Products Trust
Statement of Investments, December 31, 2008 (continued)
| | | | | |
| Franklin Small Cap Value Securities Fund | | Shares | | Value |
Common Stocks (continued) | | | | | |
Consumer Durables & Apparel (continued) | | | | | |
La-Z-Boy Inc. | | 1,095,700 | | $ | 2,377,669 |
M/I Homes Inc. | | 593,700 | | | 6,257,598 |
M.D.C. Holdings Inc. | | 320,000 | | | 9,696,000 |
bRuss Berrie and Co. Inc. | | 593,580 | | | 1,762,933 |
bTimberland Co., A | | 250,700 | | | 2,895,585 |
bThe Warnaco Group Inc. | | 336,000 | | | 6,595,680 |
| | | | | |
| | | | | 50,234,886 |
| | | | | |
Consumer Services 1.0% | | | | | |
Regis Corp. | | 583,900 | | | 8,484,067 |
| | | | | |
Energy 7.8% | | | | | |
Arch Coal Inc. | | 111,500 | | | 1,816,335 |
bAtwood Oceanics Inc. | | 219,000 | | | 3,346,320 |
bBristow Group Inc. | | 315,500 | | | 8,452,245 |
CARBO Ceramics Inc. | | 23,000 | | | 817,190 |
CONSOL Energy Inc. | | 87,000 | | | 2,486,460 |
General Maritime Corp. | | 375,200 | | | 4,052,160 |
bGlobal Industries Ltd. | | 1,151,700 | | | 4,019,433 |
bHelix Energy Solutions Group Inc. | | 438,400 | | | 3,174,016 |
bOil States International Inc. | | 314,000 | | | 5,868,660 |
Overseas Shipholding Group Inc. | | 150,000 | | | 6,316,500 |
Peabody Energy Corp. | | 114,000 | | | 2,593,500 |
Rowan Cos. Inc. | | 394,600 | | | 6,274,140 |
Teekay Corp. (Bahamas) | | 232,500 | | | 4,568,625 |
Tidewater Inc. | | 113,000 | | | 4,550,510 |
bUnit Corp. | | 239,700 | | | 6,404,784 |
| | | | | |
| | | | | 64,740,878 |
| | | | | |
Food & Staples Retailing 1.3% | | | | | |
Casey’s General Stores Inc. | | 462,000 | | | 10,519,740 |
| | | | | |
Health Care Equipment & Services 2.5% | | | | | |
STERIS Corp. | | 213,000 | | | 5,088,570 |
Teleflex Inc. | | 150,000 | | | 7,515,000 |
West Pharmaceutical Services Inc. | | 215,800 | | | 8,150,766 |
| | | | | |
| | | | | 20,754,336 |
| | | | | |
Insurance 13.9% | | | | | |
American National Insurance Co. | | 86,000 | | | 6,340,780 |
Arthur J. Gallagher & Co. | | 229,500 | | | 5,946,345 |
Aspen Insurance Holdings Ltd. | | 645,000 | | | 15,641,250 |
Erie Indemnity Co., A | | 189,663 | | | 7,137,018 |
IPC Holdings Ltd. | | 604,600 | | | 18,077,540 |
Montpelier Re Holdings Ltd. (Bermuda) | | 897,300 | | | 15,065,667 |
Old Republic International Corp. | | 1,562,000 | | | 18,619,040 |
Protective Life Corp. | | 450,000 | | | 6,457,500 |
RLI Corp. | | 151,100 | | | 9,241,276 |
StanCorp Financial Group Inc. | | 232,000 | | | 9,690,640 |
bSyncora Holdings Ltd. | | 1,132,175 | | | 192,470 |
Zenith National Insurance Corp. | | 102,500 | | | 3,235,925 |
| | | | | |
| | | | | 115,645,451 |
| | | | | |
Materials 10.7% | | | | | |
Airgas Inc. | | 297,700 | | | 11,607,323 |
AptarGroup Inc. | | 250,700 | | | 8,834,668 |
FSV-11
Franklin Templeton Variable Insurance Products Trust
Statement of Investments, December 31, 2008 (continued)
| | | | | |
| Franklin Small Cap Value Securities Fund | | Shares | | Value |
Common Stocks (continued) | | | | | |
Materials (continued) | | | | | |
Cabot Corp. | | 319,600 | | $ | 4,889,880 |
Gerdau Ameristeel Corp. (Canada) | | 1,316,000 | | | 7,974,960 |
Glatfelter | | 752,000 | | | 6,993,600 |
bMercer International Inc. (Germany) | | 459,100 | | | 881,472 |
Reliance Steel & Aluminum Co. | | 449,600 | | | 8,965,024 |
RPM International Inc. | | 865,000 | | | 11,495,850 |
Steel Dynamics Inc. | | 1,065,000 | | | 11,906,700 |
United States Steel Corp. | | 49,000 | | | 1,822,800 |
Westlake Chemical Corp. | | 832,521 | | | 13,561,767 |
| | | | | |
| | | | | 88,934,044 |
| | | | | |
Retailing 5.6% | | | | | |
Brown Shoe Co. Inc. | | 823,000 | | | 6,970,810 |
Christopher & Banks Corp. | | 1,420,000 | | | 7,952,000 |
Fred’s Inc. | | 507,150 | | | 5,456,934 |
Group 1 Automotive Inc. | | 383,200 | | | 4,127,064 |
bGymboree Corp. | | 146,200 | | | 3,814,358 |
The Men’s Wearhouse Inc. | | 535,000 | | | 7,243,900 |
bPier 1 Imports Inc. | | 770,000 | | | 284,900 |
a,bSaks Inc. | | 766,000 | | | 3,355,080 |
bTuesday Morning Corp. | | 1,227,000 | | | 2,000,010 |
bWest Marine Inc. | | 845,600 | | | 3,585,344 |
a,bZale Corp. | | 699,200 | | | 2,328,336 |
| | | | | |
| | | | | 47,118,736 |
| | | | | |
Semiconductors & Semiconductor Equipment 1.1% | | | | | |
Cohu Inc. | | 659,500 | | | 8,012,925 |
bOmniVision Technologies Inc. | | 300,000 | | | 1,575,000 |
| | | | | |
| | | | | 9,587,925 |
| | | | | |
Technology Hardware & Equipment 4.7% | | | | | |
bAvocent Corp. | | 599,000 | | | 10,728,090 |
bBenchmark Electronics Inc. | | 1,068,000 | | | 13,638,360 |
Diebold Inc. | | 46,400 | | | 1,303,376 |
bMettler-Toledo International Inc. | | 150,000 | | | 10,110,000 |
bRofin-Sinar Technologies Inc. | | 190,000 | | | 3,910,200 |
| | | | | |
| | | | | 39,690,026 |
| | | | | |
Transportation 3.4% | | | | | |
bGenesee & Wyoming Inc. | | 441,700 | | | 13,471,850 |
bKansas City Southern | | 146,000 | | | 2,781,300 |
SkyWest Inc. | | 640,500 | | | 11,913,300 |
| | | | | |
| | | | | 28,166,450 |
| | | | | |
Utilities 2.7% | | | | | |
Atmos Energy Corp. | | 170,100 | | | 4,031,370 |
Energen Corp. | | 171,000 | | | 5,015,430 |
NV Energy Corp. | | 1,375,000 | | | 13,598,750 |
| | | | | |
| | | | | 22,645,550 |
| | | | | |
Total Common Stocks (Cost $1,095,120,400) | | | | | 787,175,378 |
| | | | | |
FSV-12
Franklin Templeton Variable Insurance Products Trust
Statement of Investments, December 31, 2008 (continued)
| | | | | | | |
| Franklin Small Cap Value Securities Fund | | Principal
Amount | | Value | |
Corporate Bonds (Cost $1,479,291) 0.2% | | | | | | | |
Capital Goods 0.2% | | | | | | | |
Mueller Industries Inc., 6.00%, 11/01/14 | | $ | 1,494,000 | | $ | 1,167,188 | |
| | | | | | | |
Total Investments before Short Term Investments (Cost $1,096,599,691) | | | | | | 788,342,566 | |
| | | | | | | |
| | |
| | | Shares | | | |
Short Term Investments 9.1% | | | | | | | |
Money Market Funds (Cost $46,274,205) 5.5% | | | | | | | |
dFranklin Institutional Fiduciary Trust Money Market Portfolio, 0.55% | | | 46,274,205 | | | 46,274,205 | |
| | | | | | | |
eInvestments from Cash Collateral Received for Loaned Securities 3.6% | | | | | | | |
Money Market Funds (Cost $30,105,660) 3.6% | | | | | | | |
fBank of New York Institutional Cash Reserve Fund, 0.09% | | | 30,105,660 | | | 29,804,603 | |
| | | | | | | |
Total Investments (Cost $1,172,979,556) 103.6% | | | | | | 864,421,374 | |
Other Assets, less Liabilities (3.6)% | | | | | | (29,897,628 | ) |
| | | | | | | |
Net Assets 100.0% | | | | | $ | 834,523,746 | |
| | | | | | | |
aA portion or all of the security is on loan as of December 31, 2008. See Note 1(b).
bNon-income producing for the twelve months ended December 31, 2008.
cSee Note 8 regarding holdings of 5% voting securities.
dSee Note 7 regarding investments in the Franklin Institutional Fiduciary Trust Money Market Portfolio. The rate shown is the annualized seven-day yield at period end.
eSee Note 1(b) regarding securities on loan.
fThe rate shown is the annualized seven-day yield at period end.
The accompanying notes are an integral part of these financial statements.
FSV-13
Franklin Templeton Variable Insurance Products Trust
Financial Statements
Statement of Assets and Liabilities
December 31, 2008
| | | | |
| | | Franklin
Small Cap Value
Securities Fund | |
Assets: | | | | |
Investments in securities: | | | | |
Cost - Unaffiliated issuers | | $ | 1,117,984,610 | |
Cost - Non-controlled affiliated issuers (Note 8) | | | 8,720,741 | |
Cost - Sweep Money Fund (Note 7) | | | 46,274,205 | |
| | | | |
Total cost of investments | | $ | 1,172,979,556 | |
| | | | |
Value - Unaffiliated issuers | | $ | 813,895,103 | |
Value - Non-controlled affiliated issuers (Note 8) | | | 4,252,066 | |
Value - Sweep Money Fund (Note 7) | | | 46,274,205 | |
| | | | |
Total value of investments (includes securities loaned in the amount of $29,534,173) | | | 864,421,374 | |
Receivables: | | | | |
Capital shares sold | | | 1,210,243 | |
Dividends and interest | | | 1,183,094 | |
| | | | |
Total assets | | | 866,814,711 | |
| | | | |
Liabilities: | | | | |
Payables: | | | | |
Investment securities purchased | | | 727,468 | |
Capital shares redeemed | | | 310,003 | |
Affiliates | | | 726,783 | |
Payable upon return of securities loaned | | | 30,105,660 | |
Accrued expenses and other liabilities | | | 421,051 | |
| | | | |
Total liabilities | | | 32,290,965 | |
| | | | |
Net assets, at value | | $ | 834,523,746 | |
| | | | |
Net assets consist of: | | | | |
Paid-in capital | | $ | 1,090,943,145 | |
Undistributed net investment income | | | 14,725,880 | |
Net unrealized appreciation (depreciation) | | | (308,764,503 | ) |
Accumulated net realized gain (loss) | | | 37,619,224 | |
| | | | |
Net assets, at value | | $ | 834,523,746 | |
| | | | |
Class 1: | | | | |
Net assets, at value | | $ | 34,900,672 | |
| | | | |
Shares outstanding | | | 3,251,994 | |
| | | | |
Net asset value and maximum offering price per share | | $ | 10.73 | |
| | | | |
Class 2: | | | | |
Net assets, at value | | $ | 784,773,469 | |
| | | | |
Shares outstanding | | | 74,398,581 | |
| | | | |
Net asset value and maximum offering price per share | | $ | 10.55 | |
| | | | |
Class 4: | | | | |
Net assets, at value | | $ | 14,849,605 | |
| | | | |
Shares outstanding | | | 1,387,293 | |
| | | | |
Net asset value and maximum offering price per share | | $ | 10.70 | |
| | | | |
The accompanying notes are an integral part of these financial statements.
FSV-14
Franklin Templeton Variable Insurance Products Trust
Financial Statements (continued)
Statement of Operations
for the year ended December 31, 2008
| | | | |
| | | Franklin
Small Cap Value
Securities Fund | |
Investment income: | | | | |
Dividends: | | | | |
Unaffiliated issuers | | $ | 18,024,966 | |
Non-controlled affiliated issuers (Note 8) | | | 222,040 | |
Sweep Money Fund (Note 7) | | | 828,587 | |
Interest | | | 91,668 | |
Income from securities loaned | | | 5,363,626 | |
| | | | |
Total investment income | | | 24,530,887 | |
| | | | |
Expenses: | | | | |
Management fees (Note 3a) | | | 5,408,895 | |
Administrative fees (Note 3b) | | | 1,345,060 | |
Distribution fees: (Note 3c) | | | | |
Class 2 | | | 2,544,012 | |
Class 4 | | | 15,390 | |
Unaffiliated transfer agent fees | | | 4,716 | |
Custodian fees (Note 4) | | | 19,087 | |
Reports to shareholders | | | 309,204 | |
Professional fees | | | 35,665 | |
Trustees’ fees and expenses | | | 5,515 | |
Other | | | 38,031 | |
| | | | |
Total expenses | | | 9,725,575 | |
Expense reductions (Note 4) | | | (817 | ) |
| | | | |
Net expenses | | | 9,724,758 | |
| | | | |
Net investment income | | | 14,806,129 | |
| | | | |
Realized and unrealized gains (losses): | | | | |
Net realized gain (loss) from: | | | | |
Investments: | | | | |
Unaffiliated issuers | | | 37,654,897 | |
Non-controlled affiliated issuers (Note 8) | | | 6,154 | |
| | | | |
Net realized gain (loss) | | | 37,661,051 | |
| | | | |
Net change in unrealized appreciation (depreciation) on investments | | | (460,075,401 | ) |
| | | | |
Net realized and unrealized gain (loss) | | | (422,414,350 | ) |
| | | | |
Net increase (decrease) in net assets resulting from operations | | $ | (407,608,221 | ) |
| | | | |
The accompanying notes are an integral part of these financial statements.
FSV-15
Franklin Templeton Variable Insurance Products Trust
Financial Statements (continued)
Statements of Changes in Net Assets
| | | | | | | | |
| | | Franklin Small Cap Value
Securities Fund | |
| | | Year Ended December 31, | |
| | | 2008 | | | 2007 | |
| | | | |
Increase (decrease) in net assets: | | | | | | | | |
Operations: | | | | | | | | |
Net investment income | | $ | 14,806,129 | | | $ | 12,202,153 | |
Net realized gain (loss) from investments | | | 37,661,051 | | | | 84,444,667 | |
Net change in unrealized appreciation (depreciation) on investments | | | (460,075,401 | ) | | | (125,870,314 | ) |
| | | | |
Net increase (decrease) in net assets resulting from operations | | | (407,608,221 | ) | | | (29,223,494 | ) |
| | | | |
Distributions to shareholders from: | | | | | | | | |
Net investment income: | | | | | | | | |
Class 1 | | | (691,359 | ) | | | (643,430 | ) |
Class 2 | | | (11,639,809 | ) | | | (8,499,152 | ) |
Class 4 | | | (17,091 | ) | | | — | |
Net realized gains: | | | | | | | | |
Class 1 | | | (3,739,945 | ) | | | (4,923,222 | ) |
Class 2 | | | (80,615,234 | ) | | | (87,395,798 | ) |
Class 4 | | | (92,454 | ) | | | — | |
| | | | |
Total distributions to shareholders | | | (96,795,892 | ) | | | (101,461,602 | ) |
| | | | |
Capital share transactions: (Note 2) | | | | | | | | |
Class 1 | | | (56,463 | ) | | | (10,544,872 | ) |
Class 2 | | | 85,951,774 | | | | 61,595,731 | |
Class 4 | | | 18,620,427 | | | | — | |
| | | | |
Total capital share transactions | | | 104,515,738 | | | | 51,050,859 | |
| | | | |
Net increase (decrease) in net assets | | | (399,888,375 | ) | | | (79,634,237 | ) |
Net assets: | | | | | | | | |
Beginning of year | | | 1,234,412,121 | | | | 1,314,046,358 | |
| | | | |
End of year | | $ | 834,523,746 | | | $ | 1,234,412,121 | |
| | | | |
Undistributed net investment income included in net assets: | | | | | | | | |
End of year | | $ | 14,725,880 | | | $ | 12,271,143 | |
| | | | |
The accompanying notes are an integral part of these financial statements.
FSV-16
Franklin Templeton Variable Insurance Products Trust
Notes to Financial Statements
Franklin Small Cap Value Securities Fund
1. ORGANIZATION AND SIGNIFICANT ACCOUNTING POLICIES
Franklin Templeton Variable Insurance Products Trust (Trust) is registered under the Investment Company Act of 1940, as amended, (1940 Act) as an open-end investment company, consisting of twenty-three separate funds. The Franklin Small Cap Value Securities Fund (Fund) is included in this report. The financial statements of the remaining funds in the Trust are presented separately. Shares of the Fund are sold only to insurance company separate accounts to fund the benefits of variable life insurance policies or variable annuity contracts. The Fund offers three classes of shares: Class 1, Class 2, and Class 4. Effective February 29, 2008, the Fund began offering a new class of shares, Class 4. Each class of shares differs by its distribution fees, voting rights on matters affecting a single class and its exchange privilege.
The following summarizes the Fund’s significant accounting policies.
a. Security Valuation
Securities listed on a securities exchange or on the NASDAQ National Market System are valued at the last quoted sale price or the official closing price of the day, respectively. Over-the-counter securities and listed securities for which there is no reported sale are valued within the range of the most recent quoted bid and ask prices. Securities that trade in multiple markets or on multiple exchanges are valued according to the broadest and most representative market. Investments in open-end mutual funds are valued at the closing net asset value.
The Trust has procedures to determine the fair value of individual securities and other assets for which market prices are not readily available or which may not be reliably priced. Methods for valuing these securities may include: fundamental analysis, matrix pricing, discounts from market prices of similar securities, or discounts applied due to the nature and duration of restrictions on the disposition of the securities. Due to the inherent uncertainty of valuations of such securities, the fair values may differ significantly from the values that would have been used had a ready market for such investments existed. Occasionally, events occur between the time at which trading in a security is completed and the close of the NYSE that might call into question the availability (including the reliability) of the value of a portfolio security held by the Fund. If such an event occurs, the securities may be valued using fair value procedures, which may include the use of independent pricing services. All security valuation procedures are approved by the Trust’s Board of Trustees.
b. Securities Lending
The Fund participates in a principal based security lending program. The Fund receives cash collateral against the loaned securities in an amount equal to at least 102% of the market value of the loaned securities. Collateral is maintained over the life of the loan in an amount not less than 100% of the market value of loaned securities, as determined at the close of Fund business each day; any additional collateral required due to changes in security values is delivered to the Fund on the next business day. The collateral is invested in a non-registered money market fund managed by the Fund’s custodian on the Fund’s behalf. The Fund receives income from the investment of cash collateral, in addition to lending fees and rebates paid by the borrower. The Fund bears the market risk with respect to the collateral investment, securities loaned, and the risk that the principal may default on its obligations to the Fund.
c. Income Taxes
No provision has been made for U.S. income taxes because it is the Fund’s policy to qualify as a regulated investment company under the Internal Revenue Code and to distribute to shareholders substantially all of its taxable income and net realized gains.
The Fund has reviewed the tax positions, taken on federal income tax returns, for each of the three open tax years and as of December 31, 2008, and has determined that no provision for income tax is required in the Fund’s financial statements.
FSV-17
Franklin Templeton Variable Insurance Products Trust
Notes to Financial Statements (continued)
Franklin Small Cap Value Securities Fund
1. ORGANIZATION AND SIGNIFICANT ACCOUNTING POLICIES (continued)
d. Security Transactions, Investment Income, Expenses and Distributions
Security transactions are accounted for on trade date. Realized gains and losses on security transactions are determined on a specific identification basis. Interest income and estimated expenses are accrued daily. Dividend income is recorded on the ex-dividend date. Distributions to shareholders are recorded on the ex-dividend date and are determined according to income tax regulations (tax basis). Distributable earnings determined on a tax basis may differ from earnings recorded in accordance with accounting principles generally accepted in the United States of America. These differences may be permanent or temporary. Permanent differences are reclassified among capital accounts to reflect their tax character. These reclassifications have no impact on net assets or the results of operations. Temporary differences are not reclassified, as they may reverse in subsequent periods.
Common expenses incurred by the Trust are allocated among the funds based on the ratio of net assets of each fund to the combined net assets of the Trust. Fund specific expenses are charged directly to the fund that incurred the expense.
Realized and unrealized gains and losses and net investment income, not including class specific expenses, are allocated daily to each class of shares based upon the relative proportion of net assets of each class. Differences in per share distributions, by class, are generally due to differences in class specific expenses.
e. Accounting Estimates
The preparation of financial statements in accordance with accounting principles generally accepted in the United States of America requires management to make estimates and assumptions that affect the reported amounts of assets and liabilities at the date of the financial statements and the amounts of income and expenses during the reporting period. Actual results could differ from those estimates.
f. Guarantees and Indemnifications
Under the Trust’s organizational documents, its officers and trustees are indemnified by the Trust against certain liabilities arising out of the performance of their duties to the Trust. Additionally, in the normal course of business, the Trust, on behalf of the Fund, enters into contracts with service providers that contain general indemnification clauses. The Trust’s maximum exposure under these arrangements is unknown as this would involve future claims that may be made against the Trust that have not yet occurred. Currently, the Trust expects the risk of loss to be remote.
2. SHARES OF BENEFICIAL INTEREST
At December 31, 2008, there were an unlimited number of shares authorized (without par value). Transactions in the Fund’s shares were as follows:
| | | | | | | | | | | | | | |
| | | Year Ended December 31, | |
| | | 2008a | | | 2007 | |
| Class 1 Shares: | | Shares | | | Amount | | | Shares | | | Amount | |
Shares sold | | 497,732 | | | $ | 7,402,544 | | | 494,875 | | | $ | 9,549,933 | |
Shares issued in reinvestment of distributions | | 267,107 | | | | 4,431,305 | | | 280,013 | | | | 5,566,652 | |
Shares redeemed | | (794,982 | ) | | | (11,890,312 | ) | | (1,329,683 | ) | | | (25,661,457 | ) |
| | | | |
Net increase (decrease) | | (30,143 | ) | | $ | (56,463 | ) | | (554,795 | ) | | $ | (10,544,872 | ) |
| | | | |
FSV-18
Franklin Templeton Variable Insurance Products Trust
Notes to Financial Statements (continued)
Franklin Small Cap Value Securities Fund
2. SHARES OF BENEFICIAL INTEREST (continued)
| | | | | | | | | | | | | | |
| | | Year Ended December 31, | |
| | | 2008a | | | 2007 | |
| Class 2 Shares: | | Shares | | | Amount | | | Shares | | | Amount | |
Shares sold | | 18,734,933 | | | $ | 264,994,545 | | | 8,994,880 | | | $ | 170,296,248 | |
Shares issued in reinvestment of distributions | | 5,649,421 | | | | 92,255,043 | | | 4,895,097 | | | | 95,894,950 | |
Shares redeemed | | (18,829,303 | ) | | | (271,297,814 | ) | | (11,093,846 | ) | | | (204,595,467 | ) |
| | | | |
Net increase (decrease) | | 5,555,051 | | | $ | 85,951,774 | | | 2,796,131 | | | $ | 61,595,731 | |
| | | | |
| Class 4 Shares: | | | | | | | | | | | | |
Shares sold | | 1,391,688 | | | $ | 18,668,696 | | | | | | | | |
Shares issued on reinvestment of distributions | | 6,580 | | | | 109,104 | | | | | | | | |
Shares redeemed | | (10,975 | ) | | | (157,373 | ) | | | | | | | |
| | | | | | | | | | |
Net increase (decrease) | | 1,387,293 | | | $ | 18,620,427 | | | | | | | | |
| | | | | | | | | | |
aFor | the period February 29, 2008 (effective date) to December 31, 2008 for Class 4. |
3. TRANSACTIONS WITH AFFILIATES
Franklin Resources, Inc. is the holding company for various subsidiaries that together are referred to as Franklin Templeton Investments. Certain officers and trustees of the Trust are also officers and/or directors of the following subsidiaries:
| | |
| Subsidiary | | Affiliation |
Franklin Advisory Services, LLC (Advisory Services) | | Investment manager |
Franklin Templeton Services, LLC (FT Services) | | Administrative manager |
Franklin Templeton Distributors, Inc. (Distributors) | | Principal underwriter |
Franklin Templeton Investor Services, LLC (Investor Services) | | Transfer agent |
a. Management Fees
The Fund pays an investment management fee to Advisory Services based on the average daily net assets of the Fund as follows:
| | |
| Annualized Fee Rate | | Net Assets |
| 0.600% | | Up to and including $200 million |
| 0.500% | | Over $200 million, up to and including $1.3 billion |
| 0.400% | | In excess of $1.3 billion |
b. Administrative Fees
The Fund pays an administrative fee to FT Services based on the Fund’s average daily net assets as follows:
| | |
| Annualized Fee Rate | | Net Assets |
| 0.150% | | Up to and including $200 million |
| 0.135% | | Over $200 million, up to and including $700 million |
| 0.100% | | Over $700 million, up to and including $1.2 billion |
| 0.075% | | In excess of $1.2 billion |
FSV-19
Franklin Templeton Variable Insurance Products Trust
Notes to Financial Statements (continued)
Franklin Small Cap Value Securities Fund
3. TRANSACTIONS WITH AFFILIATES (continued)
c. Distribution Fees
The Fund’s Board of Trustees has adopted distribution plans for Class 2 and Class 4 shares pursuant to Rule 12b-1 under the 1940 Act. Under the Fund’s compensation distribution plans, the Fund pays Distributors for costs incurred in connection with the servicing, sale and distribution of the Fund’s shares up to 0.35% per year of its average daily net assets of each class. The Board of Trustees has agreed to limit the current rate to 0.25% per year for Class 2.
d. Transfer Agent Fees
Investor Services, under terms of an agreement, performs shareholder servicing for the Fund and is not paid by the Fund for the services.
4. EXPENSE OFFSET ARRANGEMENT
The Fund has entered into an arrangement with its custodian whereby credits realized as a result of uninvested cash balances are used to reduce a portion of the Fund’s custodian expenses. During the year ended December 31, 2008, the custodian fees were reduced as noted in the Statement of Operations.
5. INCOME TAXES
For tax purposes, realized capital losses occurring subsequent to October 31, may be deferred and treated as occurring on the first day of the following fiscal year. At December 31, 2008, the Fund deferred realized capital losses of $2,551,167.
The tax character of distributions paid during the years ended December 31, 2008 and 2007, was as follows:
| | | | | | |
| | | 2008 | | 2007 |
Distributions paid from: | | | | | | |
Ordinary income | | $ | 15,883,308 | | $ | 21,577,940 |
Long term capital gain | | | 80,912,584 | | | 79,883,662 |
| | | |
| | $ | 96,795,892 | | $ | 101,461,602 |
| | | |
At December 31, 2008, the cost of investments, net unrealized appreciation (depreciation), undistributed ordinary income and undistributed long term capital gains for income tax purposes were as follows:
| | | | |
Cost of investments | | $ | 1,172,987,222 | |
| | | | |
| |
Unrealized appreciation | | $ | 70,606,275 | |
Unrealized depreciation | | | (379,172,123 | ) |
| | | | |
Net unrealized appreciation (depreciation) | | $ | (308,565,848 | ) |
| | | | |
Undistributed ordinary income | | $ | 14,718,178 | |
Undistributed long term capital gains | | | 40,185,758 | |
| | | | |
Distributable earnings | | $ | 54,903,936 | |
| | | | |
Net investment income differs for financial statement and tax purposes primarily due to differing treatment of bond discounts and premiums.
Net realized gains (losses) differ for financial statement and tax purposes primarily due to differing treatment of wash sales.
FSV-20
Franklin Templeton Variable Insurance Products Trust
Notes to Financial Statements (continued)
Franklin Small Cap Value Securities Fund
6. INVESTMENT TRANSACTIONS
Purchases and sales of investments (excluding short term securities) for the year ended December 31, 2008, aggregated $177,715,126 and $183,045,145, respectively.
7. INVESTMENTS IN FRANKLIN INSTITUTIONAL FIDUCIARY TRUST MONEY MARKET PORTFOLIO
The Fund may invest in the Franklin Institutional Fiduciary Trust Money Market Portfolio (Sweep Money Fund), an open-end investment company managed by Franklin Advisers, Inc. (an affiliate of the investment manager). Management fees paid by the Fund are reduced on assets invested in the Sweep Money Fund, in an amount not to exceed the management and administrative fees paid by the Sweep Money Fund.
8. HOLDINGS OF 5% VOTING SECURITIES OF PORTFOLIO COMPANIES
The 1940 Act defines “affiliated companies” to include investments in portfolio companies in which a fund owns 5% or more of the outstanding voting securities. Investments in “affiliated companies” for the Fund for the year ended December 31, 2008, were as shown below.
| | | | | | | | | | | | | | | | | |
| Name of Issuer | | Number of Shares
Held at Beginning
of Year | | Gross
Additions | | Gross
Reductions | | Number of Shares
Held at End
of Year | | Value at
End of
Year | | Investment
Income | | Realized
Capital
Gain
(Loss) |
| Non-Controlled Affiliates | | | | | | | | | | | | | | | | | |
| Hooker Furniture Corp. | | 569,800 | | — | | 14,700 | | 555,100 | | $ | 4,252,066 | | $ | 222,040 | | $ | 6,154 |
| | | | | | | | | | | | | | | | | |
| Total Affiliated Securities (0.51% of Net Assets) | | | | | | | | | | | | | | | |
9. FAIR VALUE MEASUREMENTS
The Fund adopted Financial Accounting Standards Board (FASB) Statement No. 157, “Fair Value Measurement” (SFAS 157), on January 1, 2008. SFAS 157 defines fair value, establishes a framework for measuring fair value, and expands disclosures about fair value measurements. The Fund has determined that the implementation of SFAS 157 did not have a material impact on the Fund’s financial statements.
SFAS 157 establishes a fair value hierarchy that distinguishes between market data obtained from independent sources (observable inputs) and the Fund’s own market assumptions (unobservable inputs). These inputs are used in determining the value of the Fund’s investments and are summarized in the following fair value hierarchy:
| | • | | Level 1 – quoted prices in active markets for identical securities |
| | • | | Level 2 – other significant observable inputs (including quoted prices for similar securities, interest rates, prepayment speed, credit risk, etc.) |
| | • | | Level 3 – significant unobservable inputs (including the Fund’s own assumptions in determining the fair value of investments) |
The inputs or methodology used for valuing securities are not an indication of the risk associated with investing in those securities.
FSV-21
Franklin Templeton Variable Insurance Products Trust
Notes to Financial Statements (continued)
Franklin Small Cap Value Securities Fund
9. FAIR VALUE MEASUREMENTS (continued)
The following is a summary of the inputs used as of December 31, 2008, in valuing the Fund’s assets at fair value:
| | | | | | | | | | | | |
| | | Level 1 | | Level 2 | | Level 3 | | Total |
Assets: | | | | | | | | | | | | |
Investments in Securities | | $ | 833,449,583 | | $ | 30,971,791 | | $ | — | | $ | 864,421,374 |
10. NEW ACCOUNTING PRONOUNCEMENT
In March 2008, FASB issued FASB Statement No. 161, “Disclosures about Derivative Instruments and Hedging Activities, an amendment of FASB Statement No. 133” (SFAS 161), which expands disclosures about derivative investments and hedging activities. SFAS 161 is effective for fiscal years and interim periods beginning after November 15, 2008. The Fund is currently evaluating the impact, if any, of applying the various provisions of SFAS 161.
11. SUBSEQUENT EVENT
On January 23, 2009, the Fund entered into, along with certain other funds managed by Franklin Templeton Investments (individually, “Borrower”; collectively “Borrowers”), a $725 million senior unsecured syndicated global line of credit (“Global Credit Facility”) to provide a source of funds to the Borrowers for temporary and emergency purposes and to meet future unanticipated or unusually large redemption requests.
Under the terms of the Global Credit Facility, each Borrower has agreed to pay its proportionate share of fees and expenses incurred in connection with the implementation and maintenance of the Global Credit Facility.
FSV-22
Franklin Templeton Variable Insurance Products Trust
Franklin Small Cap Value Securities Fund
Report of Independent Registered Public Accounting Firm
To the Board of Trustees and Shareholders of
Franklin Templeton Variable Insurance Products Trust
In our opinion, the accompanying statement of assets and liabilities, including the statement of investments, and the related statements of operations and of changes in net assets and the financial highlights present fairly, in all material respects, the financial position of Franklin Small Cap Value Securities Fund (one of the funds constituting the Franklin Templeton Variable Insurance Products Trust, hereafter referred to as the “Fund”) at December 31, 2008, the results of its operations for the year then ended, the changes in its net assets for each of the two years in the period then ended and the financial highlights for the periods presented, in conformity with accounting principles generally accepted in the United States of America. These financial statements and financial highlights (hereafter referred to as “financial statements”) are the responsibility of the Fund’s management. Our responsibility is to express an opinion on these financial statements based on our audits. We conducted our audits of these financial statements in accordance with the standards of the Public Company Accounting Oversight Board (United States). Those standards require that we plan and perform the audit to obtain reasonable assurance about whether the financial statements are free of material misstatement. An audit includes examining, on a test basis, evidence supporting the amounts and disclosures in the financial statements, assessing the accounting principles used and significant estimates made by management, and evaluating the overall financial statement presentation. We believe that our audits, which included confirmation of securities at December 31, 2008 by correspondence with the custodian and brokers, provide a reasonable basis for our opinion.
PricewaterhouseCoopers LLP
San Francisco, California
February 10, 2009
FSV-23
Franklin Templeton Variable Insurance Products Trust
Tax Designation (unaudited)
Franklin Small Cap Value Securities Fund
Under Section 852(b)(3)(C) of the Internal Revenue Code (Code), the Fund designates the maximum amount allowable but no less than $80,912,584 as a long term capital gain dividend for the fiscal year ended December 31, 2008.
Under Section 854(b)(2) of the Code, the Fund designates 74.63% of the ordinary income dividends as income qualifying for the dividends received deduction for the fiscal year ended December 31, 2008.
FSV-24
FRANKLIN SMALL-MID CAP GROWTH SECURITIES FUND
This annual report for Franklin Small-Mid Cap Growth Securities Fund covers the fiscal year ended December 31, 2008.
Performance Summary as of 12/31/08
Average annual total return of Class 1 shares represents the average annual change in value, assuming reinvestment of dividends and capital gains. Average returns smooth out variations in returns, which can be significant; they are not the same as year-by-year results.
Periods ended 12/31/08
| | | | | | |
| | | 1-Year | | 5-Year | | 10-Year |
Average Annual Total Return | | -42.34% | | -3.84% | | +1.46% |
Total Return Index Comparison for a Hypothetical $10,000 Investment (1/1/99–12/31/08)
The graph below shows the change in value of a hypothetical $10,000 investment in the Fund over the indicated period and includes reinvestment of any income or distributions. The Fund’s performance is compared to the performance of the Standard & Poor’s 500 Index (S&P 500) and the Russell Midcap® Growth Index. One cannot invest directly in an index, nor is an index representative of the Fund’s portfolio. Please see Important Notes to Performance Information preceding the Fund Summaries.
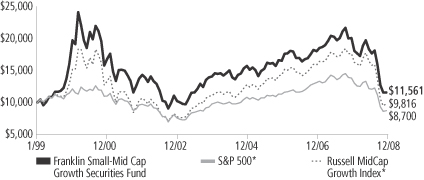
*Source: © 2009 Morningstar. Please see Index Descriptions following the Fund Summaries.
Franklin Small-Mid Cap Growth Securities Fund Class 1
Performance reflects the Fund’s Class 1 operating expenses, but does not include any contract fees, expenses or sales charges. If they had been included, performance would be lower. These charges and deductions, particularly for variable life policies, can have a significant effect on contract values and insurance benefits. See the contract prospectus for a complete description of these expenses, including sales charges.
Performance data represent past performance, which does not guarantee future results. Investment return and principal value will fluctuate, and you may have a gain or loss when you sell your shares.
Current performance may differ from figures shown.
FSC-1
Your Fund’s Goal and Main Investments: Franklin Small-Mid Cap Growth Securities Fund seeks long-term capital growth. The Fund normally invests at least 80% of its net assets in investments of small capitalization (small cap) and mid capitalization (mid cap) companies and normally invests predominantly in equity securities. For this Fund, small cap companies are those within the market capitalization range of companies in the Russell 2500™ Index at the time of purchase; and mid cap companies are companies within the market capitalization range of companies in the Russell Midcap Index at the time of purchase.1
Performance Overview
You can find the Fund’s one-year total return in the Performance Summary. The Fund performed comparably to its narrow benchmark, the Russell Midcap Growth Index, which had a -44.32% total return, but underperformed its broad benchmark, the S&P 500, which had a -37.00% total return, for the same period.2
Economic and Market Overview
In 2008, economic conditions deteriorated. The Conference Board’s Consumer Confidence Index fell to an all-time low since it began in 1967 as the U.S. economy faltered and stock markets declined. The government’s abrupt conservatorship of Fannie Mae and Freddie Mac and the failure of several blue-chip banks and financial institutions roiled equity markets. Despite government interventions and massive emergency funding, the nation’s economic troubles were exacerbated as manufacturing activity weakened at its fastest pace in nearly 30 years and as home prices continued to fall. Jobless claims mounted and the unemployment rate rose to 7.2% by period-end.3 Economic growth, as measured by gross domestic product (GDP), rebounded from a 0.9% annualized rate in the first quarter of 2008 to a 2.8% annualized pace in the second quarter, largely due to strong exports and government spending. However, in the third and fourth quarters of 2008, GDP fell at annualized rates of 0.5% and an estimated 3.8%, reflecting a broad-based contraction in consumer spending, falling corporate profits and slowing export growth.
1. Please see Index Descriptions following the Fund Summaries.
2. Source: © 2009 Morningstar. One cannot invest directly in an index, nor is an index representative of the Fund’s portfolio. Please see Index Descriptions following the Fund Summaries.
3. Source: Bureau of Labor Statistics.
Fund Risks: The Fund’s investments in stocks offer the potential for long-term gains but can be subject to short-term price fluctuations. Smaller and midsize company securities can increase the risk of greater price fluctuations, particularly over the short term. Smaller or relatively new or unseasoned companies can also be particularly sensitive to changing economic conditions, and their prospects for growth are less certain than those of larger, more established companies. The Fund may have significant investments in the technology sector, which has been among the market’s most volatile sectors and involves special risks. The Fund’s prospectus also includes a description of the main investment risks.
FSC-2
Oil prices soared to a record high in July, rising above $145 per barrel, before dramatically retreating to $45 by period-end. Many other commodities such as agricultural products and precious and base metals followed similar trends. Partially as a result of the steep price corrections, inflation declined significantly late in the review period, and December’s inflation rate was an annualized 0.1%.3 Core inflation, which excludes food and energy costs, rose at a 1.8% annual rate; this level was within the Federal Reserve Board’s (Fed’s) informal target range of 1.5%–2.0%.3
A slowing economy and decelerating inflation prompted policymakers to further lower interest rates and enact stimulus plans. During the year under review, the Fed lowered the federal funds target rate to a range of 0% to 0.25% from 4.25% at the start of the reporting period. The Fed and U.S. Treasury Department also introduced new programs such as the Primary Dealer Credit Facility (PDCF) and the Troubled Asset Relief Program (TARP), which were intended to enhance market liquidity.
Volatility remained high throughout the reporting period but intensified in the latter half of the year as stocks fluctuated wildly and Treasury prices soared. The year was among the worst in history for U.S. stock market performance. For the 12 months under review, the blue chip stocks of the Dow Jones Industrial Average had a total return of - -31.93%, the broader S&P 500 a -37.00% total return, and the technology-heavy NASDAQ Composite Index a -40.03% total return.4 All sectors lost value, and the financials, materials and information technology sectors had the largest declines.
Investment Strategy
We are research-driven, fundamental investors pursuing a growth strategy. As bottom-up investors we focus primarily on finding individual securities that meet our criteria for growth potential, quality and valuation. We search for high-quality companies that have identifiable drivers of future earnings growth. We rely on our team of analysts to help provide in-depth industry expertise and use both qualitative and quantitative analysis to evaluate companies. Our analysts identify each company’s market opportunity, competitive position, management and financial strength, business and financial risks, and valuation. We choose to invest in those companies that, in our opinion, offer the best trade-off between growth opportunity, business and financial risk, and valuation.
4. Source: © 2009 Morningstar. Please see Index Descriptions following the Fund Summaries.
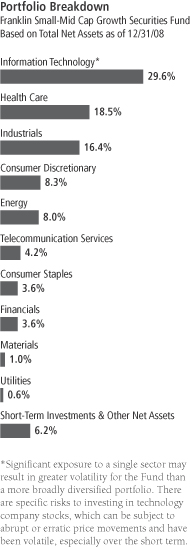
FSC-3
Manager’s Discussion
Stock selection in the consumer discretionary, financials and telecommunication services sectors hurt Fund performance relative to the Russell Midcap Growth Index during the reporting period. Our underweighted position in the consumer discretionary sector also had a negative impact on Fund results, and major detractors included apparel retailer Guess? and fast-food operator Chipotle Mexican Grill.5 Financials holdings iStar Financial,5 a real estate investment trust, and Affiliated Managers Group, an asset management company, hampered relative Fund results. In the telecommunication services sector, wireless telecommunication holdings NII Holdings and Crown Castle International detracted from relative Fund performance. Another significant detractor outside of these sectors was energy holding Smith International, a U.S.-based provider of drilling equipment and services to the oil and gas industries. We sold our positions in Chipotle Mexican Grill and Crown Castle International by period-end.
On the other hand, stock selection in the energy, information technology and industrials sectors drove the Fund’s relative performance. Oil and gas exploration and production companies Southwestern Energy and Petrohawk Energy in the energy sector and specialized imaging systems manufacturer FLIR Systems in the information technology sector were significant contributors. Industrials holdings C.H. Robinson Worldwide, a freight and logistics company, and Ryanair Holdings,5 a European discount airline, also supported relative results. Another key contributor outside of these sectors was health care holding Myriad Genetics,5 which produces drugs and diagnostic testing systems aimed at finding and treating specific cancers and AIDS.
Thank you for your participation in Franklin Small-Mid Cap Growth Securities Fund. We look forward to serving your future investment needs.
5. This holding is not an index component.
The foregoing information reflects our analysis, opinions and portfolio holdings as of December 31, 2008, the end of the reporting period. The way we implement our main investment strategies and the resulting portfolio holdings may change depending on factors such as market and economic conditions. These opinions may not be relied upon as investment advice or an offer for a particular security. The information is not a complete analysis of every aspect of any market, country, industry, security or the Fund. Statements of fact are from sources considered reliable, but the investment manager makes no representation or warranty as to their completeness or accuracy. Although historical performance is no guarantee of future results, these insights may help you understand our investment management philosophy.
Top 10 Holdings
Franklin Small-Mid Cap Growth Securities Fund 12/31/08
| | |
Company
Sector/Industry | | % of Total
Net Assets |
| |
| FLIR Systems Inc. | | 2.7% |
| Information Technology | | |
| |
| Precision Castparts Corp. | | 2.3% |
| Industrials | | |
| |
| Southwestern Energy Co. | | 2.2% |
| Energy | | |
| |
| MasterCard Inc., A | | 2.2% |
| Information Technology | | |
| |
| Harris Corp. | | 2.1% |
| Information Technology | | |
| |
| C. R. Bard Inc. | | 2.1% |
| Health Care | | |
| |
| Flowserve Corp. | | 2.0% |
| Industrials | | |
| |
| Silicon Laboratories Inc. | | 2.0% |
| Information Technology | | |
| |
| Cerner Corp. | | 1.9% |
| Health Care | | |
| |
| Express Scripts Inc. | | 1.9% |
| Health Care | | |
The dollar value, number of shares or principal amount, and names of all portfolio holdings are listed in the Fund’s Statement of Investments.
FSC-4
Fund Expenses
As an investor in a variable insurance contract (Contract) that indirectly provides for investment in an underlying mutual fund, you can incur transaction and/or ongoing expenses at both the Fund level and the Contract level.
| • | | Transaction expenses can include sales charges (loads) on purchases, redemption fees, surrender fees, transfer fees and premium taxes. |
| • | | Ongoing expenses can include management fees, distribution and service (12b-1) fees, contract fees, annual maintenance fees, mortality and expense risk fees and other fees and expenses. All mutual funds and Contracts have some types of ongoing expenses. |
The expenses shown in the table are meant to highlight ongoing expenses at the Fund level only and do not include ongoing expenses at the Contract level, or transaction expenses at either the Fund or Contract level. While the Fund does not have transaction expenses, if the transaction and ongoing expenses at the Contract level were included, the expenses shown below would be higher. You should consult your Contract prospectus or disclosure document for more information.
The table shows Fund-level ongoing expenses and can help you understand these expenses and compare them with those of other mutual funds offered through the Contract. The table assumes a $1,000 investment held for the six months indicated. Please refer to the Fund prospectus for additional information on operating expenses.
Actual Fund Expenses
The first line (Actual) of the table provides actual account values and expenses. The “Ending Account Value” is derived from the Fund’s actual return, which includes the effect of ongoing Fund expenses, but does not include the effect of ongoing Contract expenses.
You can estimate the Fund-level expenses you incurred during the period by following these steps. Of course, your account value and expenses will differ from those in this illustration:
| 1. | Divide your account value by $1,000. |
If an account had an $8,600 value, then $8,600 ÷ $1,000 = 8.6.
| 2. | Multiply the result by the number under the heading “Fund-Level Expenses Incurred During Period.” |
If Fund-Level Expenses Incurred During Period were $7.50, then 8.6 x $7.50 = $64.50.
In this illustration, the estimated expenses incurred this period at the Fund level are $64.50.
Franklin Small-Mid Cap Growth Securities Fund Class 1
FSC-5
Hypothetical Example for Comparison with Other Mutual Funds
Information in the second line (Hypothetical) of the table can help you compare ongoing expenses of the Fund with those of other mutual funds offered through the Contract. This information may not be used to estimate the actual ending account balance or expenses you incurred during the period. The hypothetical “Ending Account Value” is based on the Fund’s actual expense ratio and an assumed 5% annual rate of return before expenses, which does not represent the Fund’s actual return. The figure under the heading “Fund-Level Expenses Incurred During Period” shows the hypothetical expenses your account would have incurred under this scenario. You can compare this figure with the 5% hypothetical examples that appear in shareholder reports of other funds offered through a Contract.
| | | | | | | | | |
| Class 1 | | Beginning
Account Value 7/1/08 | | Ending Account Value 12/31/08 | | Fund-Level
Expenses Incurred
During Period*
7/1/08–12/31/08 |
Actual | | $ | 1,000 | | $ | 632.40 | | $ | 3.20 |
Hypothetical (5% return before expenses) | | $ | 1,000 | | $ | 1,021.22 | | $ | 3.96 |
*Expenses are calculated using the most recent six-month annualized expense ratio for the Fund’s Class 1 shares (0.78%), which does not include any ongoing expenses of the Contract for which the Fund is an investment option, multiplied by the average account value over the period, multiplied by 184/366 to reflect the one-half year period.
FSC-6
Franklin Templeton Variable Insurance Products Trust
Financial Highlights
Franklin Small-Mid Cap Growth Securities Fund
| | | | | | | | | | | | | | | | | | | | |
| | | Year Ended December 31, | |
| Class 1 | | 2008 | | | 2007 | | | 2006 | | | 2005 | | | 2004 | |
| | | | |
Per share operating performance | | | | | | | | | | | | | | | | | | | | |
(for a share outstanding throughout the year) | | | | | | | | | | | | | | | | | | | | |
Net asset value, beginning of year | | $ | 23.39 | | | $ | 22.51 | | | $ | 20.66 | | | $ | 19.66 | | | $ | 17.60 | |
| | | | |
Income from investment operationsa: | | | | | | | | | | | | | | | | | | | | |
Net investment income (loss)b | | | 0.01 | | | | (0.02 | ) | | | — | c | | | (0.02 | ) | | | (0.06 | ) |
Net realized and unrealized gains (losses) | | | (8.98 | ) | | | 2.65 | | | | 1.85 | | | | 1.02 | | | | 2.12 | |
| | | | |
Total from investment operations | | | (8.97 | ) | | | 2.63 | | | | 1.85 | | | | 1.00 | | | | 2.06 | |
| | | | |
Less distributions from net realized gains | | | (2.36 | ) | | | (1.75 | ) | | | — | | | | — | | | | — | |
| | | | |
Net asset value, end of year | | $ | 12.06 | | | $ | 23.39 | | | $ | 22.51 | | | $ | 20.66 | | | $ | 19.66 | |
| | | | |
| | | | | |
Total returnd | | | (42.34)% | | | | 11.51% | | | | 8.95% | | | | 5.09% | | | | 11.70% | |
Ratios to average net assets | | | | | | | | | | | | | | | | | | | | |
Expensese | | | 0.76% | | | | 0.74% | | | | 0.76% | | | | 0.74% | | | | 0.74% | |
Net investment income (loss) | | | 0.06% | | | | (0.10)% | | | | (0.02)% | | | | (0.09)% | | | | (0.33)% | |
| | | | | |
Supplemental data | | | | | | | | | | | | | | | | | | | | |
Net assets, end of year (000’s) | | $ | 63,531 | | | $ | 127,602 | | | $ | 135,402 | | | $ | 157,085 | | | $ | 184,513 | |
Portfolio turnover rate | | | 60.12% | | | | 66.94% | | | | 50.08% | | | | 74.39% | | | | 32.55% | |
aThe amount shown for a share outstanding throughout the period may not correlate with the Statement of Operations for the period due to the timing of sales and repurchases of the Fund shares in relation to income earned and/or fluctuating market value of the investments of the Fund.
bBased on average daily shares outstanding.
cAmount rounds to less than $0.01 per share.
dTotal return does not include any fees, charges or expenses imposed by the variable annuity and life insurance contracts for which the Franklin Templeton Variable Insurance Products Trust serves as an underlying investment vehicle.
eBenefit of expense reduction rounds to less than 0.01%.
The accompanying notes are an integral part of these financial statements.
FSC-7
Franklin Templeton Variable Insurance Products Trust
Financial Highlights (continued)
Franklin Small-Mid Cap Growth Securities Fund
| | | | | | | | | | | | | | | | | | | | |
| | | Year Ended December 31, | |
| Class 2 | | 2008 | | | 2007 | | | 2006 | | | 2005 | | | 2004 | |
| | | | |
Per share operating performance | | | | | | | | | | | | | | | | | | | | |
(for a share outstanding throughout the year) | | | | | | | | | | | | | | | | | | | | |
Net asset value, beginning of year | | $ | 22.91 | | | $ | 22.13 | | | $ | 20.36 | | | $ | 19.43 | | | $ | 17.43 | |
| | | | |
Income from investment operationsa: | | | | | | | | | | | | | | | | | | | | |
Net investment income (loss)b | | | (0.03 | ) | | | (0.08 | ) | | | (0.06 | ) | | | (0.07 | ) | | | (0.10 | ) |
Net realized and unrealized gains (losses) | | | (8.77 | ) | | | 2.61 | | | | 1.83 | | | | 1.00 | | | | 2.10 | |
| | | | |
Total from investment operations | | | (8.80 | ) | | | 2.53 | | | | 1.77 | | | | 0.93 | | | | 2.00 | |
| | | | |
Less distributions from net realized gains | | | (2.36 | ) | | | (1.75 | ) | | | — | | | | — | | | | — | |
| | | | |
Net asset value, end of year | | $ | 11.75 | | | $ | 22.91 | | | $ | 22.13 | | | $ | 20.36 | | | $ | 19.43 | |
| | | | |
| | | | | |
Total returnc | | | (42.49)% | | | | 11.24% | | | | 8.69% | | | | 4.79% | | | | 11.47% | |
Ratios to average net assets | | | | | | | | | | | | | | | | | | | | |
Expensesd | | | 1.01% | | | | 0.99% | | | | 1.01% | | | | 0.99% | | | | 0.99% | |
Net investment income (loss) | | | (0.19)% | | | | (0.35)% | | | | (0.27)% | | | | (0.34)% | | | | (0.58)% | |
| | | | | |
Supplemental data | | | | | | | | | | | | | | | | | | | | |
Net assets, end of year (000’s) | | $ | 614,053 | | | $ | 1,217,177 | | | $ | 1,184,521 | | | $ | 1,166,806 | | | $ | 1,142,048 | |
Portfolio turnover rate | | | 60.12% | | | | 66.94% | | | | 50.08% | | | | 74.39% | | | | 32.55% | |
aThe amount shown for a share outstanding throughout the period may not correlate with the Statement of Operations for the period due to the timing of sales and repurchases of the Fund shares in relation to income earned and/or fluctuating market value of the investments of the Fund.
bBased on average daily shares outstanding.
cTotal return does not include any fees, charges or expenses imposed by the variable annuity and life insurance contracts for which the Franklin Templeton Variable Insurance Products Trust serves as an underlying investment vehicle.
dBenefit of expense reduction rounds to less than 0.01%.
The accompanying notes are an integral part of these financial statements.
FSC-8
Franklin Templeton Variable Insurance Products Trust
Financial Highlights (continued)
Franklin Small-Mid Cap Growth Securities Fund
| | | | |
| Class 4 | | Period Ended December 31,
2008a | |
| | | | |
Per share operating performance | | | | |
(for a share outstanding throughout the period) | | | | |
Net asset value, beginning of period | | $ | 20.60 | |
| | | | |
Income from investment operationsb: | | | | |
Net investment incomec | | | 0.02 | |
Net realized and unrealized gains (losses) | | | (6.24 | ) |
| | | | |
Total from investment operations | | | (6.22 | ) |
| | | | |
Less distributions from net realized gains | | | (2.36 | ) |
| | | | |
Net asset value, end of period | | $ | 12.02 | |
| | | | |
| |
Total returnd | | | (34.74)% | |
Ratios to average net assetse | | | | |
Expensesf | | | 1.11% | |
Net investment income (loss) | | | (0.29)% | |
| |
Supplemental data | | | | |
Net assets, end of period (000’s) | | $ | 3,538 | |
Portfolio turnover rate | | | 60.12% | |
aFor the period February 29, 2008 (effective date) to December 31, 2008.
bThe amount shown for a share outstanding throughout the period may not correlate with the Statement of Operations for the period due to the timing of sales and repurchases of the Fund shares in relation to income earned and/or fluctuating market value of the investments of the Fund.
cBased on average daily shares outstanding.
dTotal return does not include any fees, charges or expenses imposed by the variable annuity and life insurance contracts for which the Franklin Templeton Variable Insurance Products Trust serves as an underlying investment vehicle. Total return is not annualized for periods less than one year.
eRatios are annualized for periods less than one year.
fBenefit of expense reduction rounds to less than 0.01%.
The accompanying notes are an integral part of these financial statements.
FSC-9
Franklin Templeton Variable Insurance Products Trust
Statement of Investments, December 31, 2008
| | | | | |
| Franklin Small-Mid Cap Growth Securities Fund | | Shares | | Value |
Common Stocks 93.7% | | | | | |
Consumer Discretionary 8.3% | | | | | |
Abercrombie & Fitch Co., A | | 245,700 | | $ | 5,668,299 |
aAmazon.com Inc. | | 32,000 | | | 1,640,960 |
BorgWarner Inc. | | 288,200 | | | 6,274,114 |
aDick’s Sporting Goods Inc. | | 396,500 | | | 5,594,615 |
Guess? Inc. | | 540,300 | | | 8,293,605 |
aITT Educational Services Inc. | | 93,800 | | | 8,909,124 |
PetSmart Inc. | | 317,400 | | | 5,856,030 |
aTractor Supply Co. | | 101,398 | | | 3,664,524 |
Wolverine World Wide Inc. | | 508,000 | | | 10,688,320 |
| | | | | |
| | | | | 56,589,591 |
| | | | | |
Consumer Staples 3.6% | | | | | |
Clorox Co. | | 109,600 | | | 6,089,376 |
aHain Celestial Group Inc. | | 324,200 | | | 6,188,978 |
aHansen Natural Corp. | | 363,900 | | | 12,201,567 |
| | | | | |
| | | | | 24,479,921 |
| | | | | |
Energy 8.0% | | | | | |
aCameron International Corp. | | 246,200 | | | 5,047,100 |
aFMC Technologies Inc. | | 264,900 | | | 6,312,567 |
aMariner Energy Inc. | | 51 | | | 520 |
aOceaneering International Inc. | | 86,100 | | | 2,508,954 |
aPetrohawk Energy Corp. | | 682,600 | | | 10,669,038 |
Range Resources Corp. | | 228,700 | | | 7,864,993 |
Smith International Inc. | | 327,600 | | | 7,498,764 |
aSouthwestern Energy Co. | | 511,900 | | | 14,829,743 |
| | | | | |
| | | | | 54,731,679 |
| | | | | |
Financials 3.6% | | | | | |
aAffiliated Managers Group Inc. | | 175,900 | | | 7,373,728 |
BlackRock Inc. | | 27,800 | | | 3,729,370 |
FelCor Lodging Trust Inc. | | 390,800 | | | 719,072 |
iStar Financial Inc. | | 824,991 | | | 1,839,730 |
T. Rowe Price Group Inc. | | 304,265 | | | 10,783,151 |
| | | | | |
| | | | | 24,445,051 |
| | | | | |
Health Care 18.5% | | | | | |
Allscripts-Misys Healthcare Solutions Inc. | | 451,500 | | | 4,478,880 |
aAmerican Medical Systems Holdings Inc. | | 89,617 | | | 805,657 |
C. R. Bard Inc. | | 171,600 | | | 14,459,016 |
aCerner Corp. | | 343,400 | | | 13,203,730 |
aCommunity Health Systems Inc. | | 373,800 | | | 5,450,004 |
aDaVita Inc. | | 131,500 | | | 6,518,455 |
aExpress Scripts Inc. | | 237,400 | | | 13,052,252 |
aHenry Schein Inc. | | 186,200 | | | 6,831,678 |
aIllumina Inc. | | 201,100 | | | 5,238,655 |
aMasimo Corp. | | 65,600 | | | 1,956,848 |
aMyriad Genetics Inc. | | 190,100 | | | 12,596,026 |
Pharmaceutical Product Development Inc. | | 298,300 | | | 8,653,683 |
aPhase Forward Inc. | | 11,400 | | | 142,728 |
aQIAGEN NV (Netherlands) | | 350,700 | | | 6,158,292 |
aSequenom Inc. | | 229,700 | | | 4,557,248 |
aVarian Medical Systems Inc. | | 276,940 | | | 9,703,977 |
aWaters Corp. | | 337,000 | | | 12,351,050 |
| | | | | |
| | | | | 126,158,179 |
| | | | | |
FSC-10
Franklin Templeton Variable Insurance Products Trust
Statement of Investments, December 31, 2008 (continued)
| | | | | |
| Franklin Small-Mid Cap Growth Securities Fund | | Shares | | Value |
Common Stocks (continued) | | | | | |
Industrials 16.4% | | | | | |
AMETEK Inc. | | 427,600 | | $ | 12,917,796 |
C.H. Robinson Worldwide Inc. | | 185,170 | | | 10,189,905 |
Expeditors International of Washington Inc. | | 269,800 | | | 8,976,246 |
Flowserve Corp. | | 263,800 | | | 13,585,700 |
aJacobs Engineering Group Inc. | | 178,800 | | | 8,600,280 |
aOrbital Sciences Corp. | | 477,600 | | | 9,327,528 |
Precision Castparts Corp. | | 268,400 | | | 15,964,432 |
Robert Half International Inc. | | 438,100 | | | 9,121,242 |
Rockwell Collins Inc. | | 140,700 | | | 5,499,963 |
aRyanair Holdings PLC, ADR (Ireland) | | 346,600 | | | 10,079,128 |
aSunPower Corp., A | | 206,000 | | | 7,622,000 |
| | | | | |
| | | | | 111,884,220 |
| | | | | |
Information Technology 29.5% | | | | | |
aActivision Blizzard Inc. | | 1,219,900 | | | 10,539,936 |
aAffiliated Computer Services Inc., A | | 167,000 | | | 7,673,650 |
aAlliance Data Systems Corp. | | 250,800 | | | 11,669,724 |
aANSYS Inc. | | 255,700 | | | 7,131,473 |
aConcur Technologies Inc. | | 126,200 | | | 4,141,884 |
FactSet Research Systems Inc. | | 185,800 | | | 8,219,792 |
aFLIR Systems Inc. | | 590,800 | | | 18,125,744 |
aFormFactor Inc. | | 617,300 | | | 9,012,580 |
Global Payments Inc. | | 54,200 | | | 1,777,218 |
Harris Corp. | | 384,600 | | | 14,634,030 |
aHittite Microwave Corp. | | 179,200 | | | 5,279,232 |
aLam Research Corp. | | 249,400 | | | 5,307,232 |
MasterCard Inc., A | | 102,600 | | | 14,664,618 |
aMettler-Toledo International Inc. | | 154,700 | | | 10,426,780 |
Microchip Technology Inc. | | 239,094 | | | 4,669,506 |
aMicrosemi Corp. | | 545,800 | | | 6,898,912 |
aNuance Communications Inc. | | 1,132,290 | | | 11,730,525 |
aRiverbed Technology Inc. | | 439,400 | | | 5,004,766 |
aSAIC Inc. | | 541,300 | | | 10,544,524 |
aSilicon Laboratories Inc. | | 544,400 | | | 13,490,232 |
aTandberg ASA (Norway) | | 516,700 | | | 5,601,728 |
aTrimble Navigation Ltd. | | 491,500 | | | 10,621,315 |
aUbiSoft Entertainment SA (France) | | 176,400 | | | 3,426,109 |
| | | | | |
| | | | | 200,591,510 |
| | | | | |
Materials 1.0% | | | | | |
Ecolab Inc. | | 186,900 | | | 6,569,535 |
| | | | | |
Telecommunication Services 4.2% | | | | | |
aAmerican Tower Corp., A | | 190,600 | | | 5,588,392 |
aMetroPCS Communications Inc. | | 640,100 | | | 9,505,485 |
aNII Holdings Inc. | | 436,600 | | | 7,937,388 |
aSBA Communications Corp. | | 317,700 | | | 5,184,864 |
a,bTeleCorp PCS Inc., Escrow Account | | 262,900 | | | — |
| | | | | |
| | | | | 28,216,129 |
| | | | | |
Utilities 0.6% | | | | | |
International Power PLC (United Kingdom) | | 1,242,600 | | | 4,360,248 |
| | | | | |
Total Common Stocks (Cost $751,622,651) | | | | | 638,026,063 |
| | | | | |
FSC-11
Franklin Templeton Variable Insurance Products Trust
Statement of Investments, December 31, 2008 (continued)
| | | | | | | |
| Franklin Small-Mid Cap Growth Securities Fund | | Principal Amount | | Value | |
Convertible Bonds (Cost $1,449,899) 0.1% | | | | | | | |
Information Technology 0.1% | | | | | | | |
Microchip Technology Inc., cvt., 2.125%, 12/15/37 | | $ | 1,835,000 | | $ | 1,169,813 | |
| | | | | | | |
Total Investments before Short Term Investments (Cost $753,072,550) | | | | | | 639,195,876 | |
| | | | | | | |
| | |
| | | Shares | | | |
Short Term Investments (Cost $42,243,056) 6.2% | | | | | | | |
Money Market Funds 6.2% | | | | | | | |
cFranklin Institutional Fiduciary Trust Money Market Portfolio, 0.55% | | | 42,243,056 | | | 42,243,056 | |
| | | | | | | |
Total Investments (Cost $795,315,606) 100.0% | | | | | | 681,438,932 | |
Other Assets, less Liabilities (0.0)%d | | | | | | (316,558 | ) |
| | | | | | | |
Net Assets 100.0% | | | | | $ | 681,122,374 | |
| | | | | | | |
See Abbreviations on page FSC-21.
aNon-income producing for the twelve months ended December 31, 2008.
bSecurity has been deemed illiquid because it may not be able to be sold within seven days. At December 31, 2008, the value of this security was $0.
cSee Note 7 regarding investments in the Franklin Institutional Fiduciary Trust Money Market Portfolio. The rate shown is the annualized seven-day yield at period end.
dRounds to less than 0.1% of net assets.
FSC-12
The accompanying notes are an integral part of these financial statements.
Franklin Templeton Variable Insurance Products Trust
Financial Statements
Statement of Assets and Liabilities
December 31, 2008
| | | | |
| | | Franklin Small-Mid
Cap Growth
Securities Fund | |
Assets: | | | | |
Investments in securities: | | | | |
Cost - Unaffiliated issuers | | $ | 753,072,550 | |
Cost - Sweep Money Fund (Note 7) | | | 42,243,056 | |
| | | | |
Total cost of investments | | $ | 795,315,606 | |
| | | | |
Value - Unaffiliated issuers | | $ | 639,195,876 | |
Value - Sweep Money Fund (Note 7) | | | 42,243,056 | |
| | | | |
Total value of investments | | | 681,438,932 | |
Receivables: | | | | |
Investment securities sold | | | 3,679,810 | |
Capital shares sold | | | 98,203 | |
Dividends and interest | | | 287,404 | |
Other assets | | | 9,620 | |
| | | | |
Total assets | | | 685,513,969 | |
| | | | |
Liabilities: | | | | |
Payables: | | | | |
Investment securities purchased | | | 2,956,583 | |
Capital shares redeemed | | | 504,895 | |
Affiliates | | | 661,044 | |
Reports to shareholders | | | 228,004 | |
Accrued expenses and other liabilities | | | 41,069 | |
| | | | |
Total liabilities | | | 4,391,595 | |
| | | | |
Net assets, at value | | $ | 681,122,374 | |
| | | | |
Net assets consist of: | | | | |
Paid-in capital | | $ | 929,070,414 | |
Undistributed net investment income (loss) | | | (20,106 | ) |
Net unrealized appreciation (depreciation) | | | (113,876,674 | ) |
Accumulated net realized gain (loss) | | | (134,051,260 | ) |
| | | | |
Net assets, at value | | $ | 681,122,374 | |
| | | | |
Class 1: | | | | |
Net assets, at value | | $ | 63,531,330 | |
| | | | |
Shares outstanding | | | 5,267,490 | |
| | | | |
Net asset value and maximum offering price per share | | $ | 12.06 | |
| | | | |
Class 2: | | | | |
Net assets, at value | | $ | 614,053,201 | |
| | | | |
Shares outstanding | | | 52,256,585 | |
| | | | |
Net asset value and maximum offering price per share | | $ | 11.75 | |
| | | | |
Class 4: | | | | |
Net assets, at value | | $ | 3,537,843 | |
| | | | |
Shares outstanding | | | 294,294 | |
| | | | |
Net asset value and maximum offering price per share | | $ | 12.02 | |
| | | | |
The accompanying notes are an integral part of these financial statements.
FSC-13
Franklin Templeton Variable Insurance Products Trust
Financial Statements (continued)
Statement of Operations
for the year ended December 31, 2008
| | | | |
| | | Franklin Small-Mid
Cap Growth
Securities Fund | |
Investment income: | | | | |
Dividends: | | | | |
Unaffiliated issuers | | $ | 7,339,268 | |
Sweep Money Fund (Note 7) | | | 1,198,025 | |
Interest | | | 7,677 | |
| | | | |
Total investment income | | | 8,544,970 | |
| | | | |
Expenses: | | | | |
Management fees (Note 3a) | | | 4,935,354 | |
Administrative fees (Note 3b) | | | 2,601,775 | |
Distribution fees: (Note 3c) | | | | |
Class 2 | | | 2,350,105 | |
Class 4 | | | 4,319 | |
Unaffiliated transfer agent fees | | | 3,057 | |
Custodian fees (Note 4) | | | 21,990 | |
Reports to shareholders | | | 305,021 | |
Professional fees | | | 35,941 | |
Trustees’ fees and expenses | | | 5,601 | |
Other | | | 33,751 | |
| | | | |
Total expenses | | | 10,296,914 | |
Expense reductions (Note 4) | | | (594 | ) |
| | | | |
Net expenses | | | 10,296,320 | |
| | | | |
Net investment income (loss) | | | (1,751,350 | ) |
| | | | |
Realized and unrealized gains (losses): | | | | |
Net realized gain (loss) from: | | | | |
Investments | | | (129,475,148 | ) |
Foreign currency transactions | | | (15,626 | ) |
| | | | |
Net realized gain (loss) | | | (129,490,774 | ) |
| | | | |
Net change in unrealized appreciation (depreciation) on investments | | | (402,574,863 | ) |
| | | | |
Net realized and unrealized gain (loss) | | | (532,065,637 | ) |
| | | | |
Net increase (decrease) in net assets resulting from operations | | $ | (533,816,987 | ) |
| | | | |
The accompanying notes are an integral part of these financial statements.
FSC-14
Franklin Templeton Variable Insurance Products Trust
Financial Statements (continued)
Statements of Changes in Net Assets
| | | | | | | | |
| | | Franklin Small-Mid
Cap Growth
Securities Fund | |
| | | Year Ended December 31, | |
| | | 2008 | | | 2007 | |
| | | | |
Increase (decrease) in net assets: | | | | | | | | |
Operations: | | | | | | | | |
Net investment income (loss) | | $ | (1,751,350 | ) | | $ | (4,423,731 | ) |
Net realized gain (loss) from investments and foreign currency transactions | | | (129,490,774 | ) | | | 130,378,262 | |
Net change in unrealized appreciation (depreciation) on investments | | | (402,574,863 | ) | | | 18,672,522 | |
| | | | |
Net increase (decrease) in net assets resulting from operations | | | (533,816,987 | ) | | | 144,627,053 | |
| | | | |
Distributions to shareholders from net realized gains: | | | | | | | | |
Class 1 | | | (12,125,691 | ) | | | (9,661,762 | ) |
Class 2 | | | (120,375,409 | ) | | | (90,011,100 | ) |
Class 4 | | | (60,013 | ) | | | — | |
| | | | |
Total distributions to shareholders | | | (132,561,113 | ) | | | (99,672,862 | ) |
| | | | |
Capital share transactions: (Note 2) | | | | | | | | |
Class 1 | | | (2,123,859 | ) | | | (13,249,140 | ) |
Class 2 | | | 111,515 | | | | (6,848,695 | ) |
Class 4 | | | 4,733,324 | | | | — | |
| | | | |
Total capital share transactions | | | 2,720,980 | | | | (20,097,835 | ) |
| | | | |
Net increase (decrease) in net assets | | | (663,657,120 | ) | | | 24,856,356 | |
Net assets: | | | | | | | | |
Beginning of year | | | 1,344,779,494 | | | | 1,319,923,138 | |
| | | | |
End of year | | $ | 681,122,374 | | | $ | 1,344,779,494 | |
| | | | |
Undistributed net investment income (loss) included in net assets: | | | | | | | | |
End of year | | $ | (20,106 | ) | | $ | — | |
| | | | |
The accompanying notes are an integral part of these financial statements.
FSC-15
Franklin Templeton Variable Insurance Products Trust
Notes to Financial Statements
Franklin Small-Mid Cap Growth Securities Fund
1. ORGANIZATION AND SIGNIFICANT ACCOUNTING POLICIES
Franklin Templeton Variable Insurance Products Trust (Trust) is registered under the Investment Company Act of 1940, as amended, (1940 Act) as an open-end investment company, consisting of twenty-three separate funds. The Franklin Small-Mid Cap Growth Securities Fund (Fund) is included in this report. The financial statements of the remaining funds in the Trust are presented separately. Shares of the Fund are sold only to insurance company separate accounts to fund the benefits of variable life insurance policies or variable annuity contracts. The Fund offers three classes of shares: Class 1, Class 2, and Class 4. Effective February 29, 2008, the Fund began offering a new class of shares, Class 4. Each class of shares differs by its distribution fees, voting rights on matters affecting a single class and its exchange privilege.
The following summarizes the Fund’s significant accounting policies.
a. Security Valuation
Securities listed on a securities exchange or on the NASDAQ National Market System are valued at the last quoted sale price or the official closing price of the day, respectively. Over-the-counter securities and listed securities for which there is no reported sale are valued within the range of the most recent quoted bid and ask prices. Securities that trade in multiple markets or on multiple exchanges are valued according to the broadest and most representative market. Investments in open-end mutual funds are valued at the closing net asset value.
The Trust has procedures to determine the fair value of individual securities and other assets for which market prices are not readily available or which may not be reliably priced. Methods for valuing these securities may include: fundamental analysis, matrix pricing, discounts from market prices of similar securities, or discounts applied due to the nature and duration of restrictions on the disposition of the securities. Due to the inherent uncertainty of valuations of such securities, the fair values may differ significantly from the values that would have been used had a ready market for such investments existed. Occasionally, events occur between the time at which trading in a security is completed and the close of the NYSE that might call into question the availability (including the reliability) of the value of a portfolio security held by the Fund. If such an event occurs, the securities may be valued using fair value procedures, which may include the use of independent pricing services. All security valuation procedures are approved by the Trust’s Board of Trustees.
b. Foreign Currency Translation
Portfolio securities and other assets and liabilities denominated in foreign currencies are translated into U.S. dollars based on the exchange rate of such currencies against U.S. dollars on the date of valuation. Purchases and sales of securities, income and expense items denominated in foreign currencies are translated into U.S. dollars at the exchange rate in effect on the transaction date. Occasionally, events may impact the availability or reliability of foreign exchange rates used to convert the U.S. dollar equivalent value. If such an event occurs, the foreign exchange rate will be valued at fair value using procedures established and approved by the Trust’s Board of Trustees.
The Fund does not separately report the effect of changes in foreign exchange rates from changes in market prices on securities held. Such changes are included in net realized and unrealized gain or loss from investments on the Statement of Operations.
Realized foreign exchange gains or losses arise from sales of foreign currencies, currency gains or losses realized between the trade and settlement dates on securities transactions and the difference between the recorded amounts of dividends, interest, and foreign withholding taxes and the U.S. dollar equivalent of the amounts actually received or paid. Net unrealized foreign exchange gains and losses arise from changes in foreign exchange rates on foreign denominated assets and liabilities other than investments in securities held at the end of the reporting period.
c. Foreign Currency Contracts
When the Fund purchases or sells foreign securities it may enter into foreign exchange contracts to minimize foreign exchange risk from the trade date to the settlement date of the transactions. A foreign exchange contract is an agreement between two
FSC-16
Franklin Templeton Variable Insurance Products Trust
Notes to Financial Statements (continued)
Franklin Small-Mid Cap Growth Securities Fund
1. ORGANIZATION AND SIGNIFICANT ACCOUNTING POLICIES (continued)
c. Foreign Currency Contracts (continued)
parties to exchange different currencies at an agreed upon exchange rate at a future date. Realized and unrealized gains and losses on these contracts are included in the Statement of Operations.
The risks of these contracts include movement in the values of the foreign currencies relative to the U.S. dollar and the possible inability of the counterparties to fulfill their obligations under the contracts, which may be in excess of the amount reflected in the Statement of Assets and Liabilities.
d. Income Taxes
No provision has been made for U.S. income taxes because it is the Fund’s policy to qualify as a regulated investment company under the Internal Revenue Code and to distribute to shareholders substantially all of its taxable income and net realized gains.
The Fund has reviewed the tax positions, taken on federal income tax returns, for each of the three open tax years and as of December 31, 2008, and has determined that no provision for income tax is required in the Fund’s financial statements.
e. Security Transactions, Investment Income, Expenses and Distributions
Security transactions are accounted for on trade date. Realized gains and losses on security transactions are determined on a specific identification basis. Interest income and estimated expenses are accrued daily. Dividend income is recorded on the ex-dividend date. Distributions to shareholders are recorded on the ex-dividend date and are determined according to income tax regulations (tax basis). Distributable earnings determined on a tax basis may differ from earnings recorded in accordance with accounting principles generally accepted in the United States of America. These differences may be permanent or temporary. Permanent differences are reclassified among capital accounts to reflect their tax character. These reclassifications have no impact on net assets or the results of operations. Temporary differences are not reclassified, as they may reverse in subsequent periods.
Common expenses incurred by the Trust are allocated among the funds based on the ratio of net assets of each fund to the combined net assets of the Trust. Fund specific expenses are charged directly to the fund that incurred the expense.
Realized and unrealized gains and losses and net investment income, not including class specific expenses, are allocated daily to each class of shares based upon the relative proportion of net assets of each class. Differences in per share distributions, by class, are generally due to differences in class specific expenses.
f. Accounting Estimates
The preparation of financial statements in accordance with accounting principles generally accepted in the United States of America requires management to make estimates and assumptions that affect the reported amounts of assets and liabilities at the date of the financial statements and the amounts of income and expenses during the reporting period. Actual results could differ from those estimates.
g. Guarantees and Indemnifications
Under the Trust’s organizational documents, its officers and trustees are indemnified by the Trust against certain liabilities arising out of the performance of their duties to the Trust. Additionally, in the normal course of business, the Trust, on behalf of the Fund, enters into contracts with service providers that contain general indemnification clauses. The Trust’s maximum exposure under these arrangements is unknown as this would involve future claims that may be made against the Trust that have not yet occurred. Currently, the Trust expects the risk of loss to be remote.
FSC-17
Franklin Templeton Variable Insurance Products Trust
Notes to Financial Statements (continued)
Franklin Small-Mid Cap Growth Securities Fund
2. SHARES OF BENEFICIAL INTEREST
At December 31, 2008, there were an unlimited number of shares authorized (without par value). Transactions in the Fund’s shares were as follows:
| | | | | | | | | | | | | | |
| | | Year Ended December 31, | |
| | | 2008a | | | 2007 | |
| Class 1 Shares: | | Shares | | | Amount | | | Shares | | | Amount | |
Shares sold | | 227,516 | | | $ | 3,688,465 | | | 285,123 | | | $ | 6,820,258 | |
Shares issued in reinvestment of distributions | | 606,588 | | | | 12,125,691 | | | 402,909 | | | | 9,661,762 | |
Shares redeemed | | (1,022,106 | ) | | | (17,938,015 | ) | | (1,248,072 | ) | | | (29,731,160 | ) |
| | | | |
Net increase (decrease) | | (188,002 | ) | | $ | (2,123,859 | ) | | (560,040 | ) | | $ | (13,249,140 | ) |
| | | | |
| Class 2 Shares: | | | | | | | | | | | | |
Shares sold | | 5,946,940 | | | $ | 107,425,372 | | | 6,795,214 | | | $ | 159,505,591 | |
Shares issued in reinvestment of distributions | | 6,173,098 | | | | 120,375,409 | | | 3,827,003 | | | | 90,011,100 | |
Shares redeemed | | (13,001,795 | ) | | | (227,689,266 | ) | | (11,015,609 | ) | | | (256,365,386 | ) |
| | | | |
Net increase (decrease) | | (881,757 | ) | | $ | 111,515 | | | (393,392 | ) | | $ | (6,848,695 | ) |
| | | | |
| Class 4 Shares: | | | | | | | | | | | | |
Shares sold | | 307,835 | | | $ | 4,910,005 | | | | | | | | |
Shares issued on reinvestment of distributions | | 2,978 | | | | 59,439 | | | | | | | | |
Shares redeemed | | (16,519 | ) | | | (236,120 | ) | | | | | | | |
| | | | | | | | | | |
Net increase (decrease) | | 294,294 | | | $ | 4,733,324 | | | | | | | | |
| | | | | | | | | | |
aFor | the period February 29, 2008 (effective date) to December 31, 2008 for Class 4. |
3. TRANSACTIONS WITH AFFILIATES
Franklin Resources, Inc. is the holding company for various subsidiaries that together are referred to as Franklin Templeton Investments. Certain officers and trustees of the Trust are also officers and/or directors of the following subsidiaries:
| | |
| Subsidiary | | Affiliation |
Franklin Advisers, Inc. (Advisers) | | Investment manager |
Franklin Templeton Services, LLC (FT Services) | | Administrative manager |
Franklin Templeton Distributors, Inc. (Distributors) | | Principal underwriter |
Franklin Templeton Investor Services, LLC (Investor Services) | | Transfer agent |
a. Management Fees
The Fund pays an investment management fee to Advisers based on the average daily net assets of the Fund as follows:
| | |
| Annualized Fee Rate | | Net Assets |
| 0.550% | | Up to and including $500 million |
| 0.450% | | Over $500 million, up to and including $1 billion |
| 0.400% | | Over $1 billion, up to and including $1.5 billion |
| 0.350% | | Over $1.5 billion, up to and including $6.5 billion |
| 0.325% | | Over $6.5 billion, up to and including $11.5 billion |
| 0.300% | | Over $11.5 billion, up to and including $16.5 billion |
| 0.290% | | Over $16.5 billion, up to and including $19 billion |
| 0.280% | | Over $19 billion, up to and including $21.5 billion |
| 0.270% | | In excess of $21.5 billion |
FSC-18
Franklin Templeton Variable Insurance Products Trust
Notes to Financial Statements (continued)
Franklin Small-Mid Cap Growth Securities Fund
3. TRANSACTIONS WITH AFFILIATES (continued)
b. Administrative Fees
The Fund pays an administrative fee to FT Services of 0.25% per year of the average daily net assets of the Fund.
c. Distribution Fees
The Fund’s Board of Trustees has adopted distribution plans for Class 2 and Class 4 shares pursuant to Rule 12b-1 under the 1940 Act. Under the Fund’s compensation distribution plans, the Fund pays Distributors for costs incurred in connection with the servicing, sale and distribution of the Fund’s shares up to 0.35% per year of its average daily net assets of each class. The Board of Trustees has agreed to limit the current rate to 0.25% per year for Class 2.
d. Transfer Agent Fees
Investor Services, under terms of an agreement, performs shareholder servicing for the Fund and is not paid by the Fund for the services.
4. EXPENSE OFFSET ARRANGEMENT
The Fund has entered into an arrangement with its custodian whereby credits realized as a result of uninvested cash balances are used to reduce a portion of the Fund’s custodian expenses. During the year ended December 31, 2008, the custodian fees were reduced as noted in the Statement of Operations.
5. INCOME TAXES
For tax purposes, capital losses may be carried over to offset future capital gains, if any. At December 31, 2008, the Fund had tax basis capital losses of $76,601,785 expiring in 2016.
For tax purposes, realized capital losses and realized currency losses occurring subsequent to October 31, may be deferred and treated as occurring on the first day of the following fiscal year. At December 31, 2008, the Fund deferred realized capital losses and realized currency losses of $57,219,137 and $25,833, respectively.
The tax character of distributions paid during the years ended December 31, 2008 and 2007, was as follows:
| | | | | | |
| | | 2008 | | 2007 |
Distributions paid from: | | | | | | |
Ordinary income | | $ | — | | $ | 6,620,243 |
Long term capital gain | | | 132,561,113 | | | 93,052,619 |
| | | |
| | $ | 132,561,113 | | $ | 99,672,862 |
| | | |
At December 31, 2008, the cost of investments and net unrealized appreciation (depreciation) for income tax purposes were as follows:
| | | | |
Cost of investments | | $ | 795,540,217 | |
| | | | |
| |
Unrealized appreciation | | $ | 84,205,677 | |
Unrealized depreciation | | | (198,306,962 | ) |
| | | | |
Net unrealized appreciation (depreciation) | | $ | (114,101,285 | ) |
| | | | |
FSC-19
Franklin Templeton Variable Insurance Products Trust
Notes to Financial Statements (continued)
Franklin Small-Mid Cap Growth Securities Fund
5. INCOME TAXES (continued)
Net investment income (loss) differs for financial statement and tax purposes primarily due to differing treatment of foreign currency transactions.
Net realized gains (losses) differ for financial statement and tax purposes primarily due to differing treatments of wash sales and foreign currency transactions.
6. INVESTMENT TRANSACTIONS
Purchases and sales of investments (excluding short term securities) for the year ended December 31, 2008, aggregated $602,868,276 and $746,869,936, respectively.
7. INVESTMENTS IN FRANKLIN INSTITUTIONAL FIDUCIARY TRUST MONEY MARKET PORTFOLIO
The Fund may invest in the Franklin Institutional Fiduciary Trust Money Market Portfolio (Sweep Money Fund), an open-end investment company managed by Advisers. Management fees paid by the Fund are reduced on assets invested in the Sweep Money Fund, in an amount not to exceed the management and administrative fees paid by the Sweep Money Fund.
8. FAIR VALUE MEASUREMENTS
The Fund adopted Financial Accounting Standards Board (FASB) Statement No. 157, “Fair Value Measurement” (SFAS 157), on January 1, 2008. SFAS 157 defines fair value, establishes a framework for measuring fair value, and expands disclosures about fair value measurements. The Fund has determined that the implementation of SFAS 157 did not have a material impact on the Fund’s financial statements.
SFAS 157 establishes a fair value hierarchy that distinguishes between market data obtained from independent sources (observable inputs) and the Fund’s own market assumptions (unobservable inputs). These inputs are used in determining the value of the Fund’s investments and are summarized in the following fair value hierarchy:
| | • | | Level 1 – quoted prices in active markets for identical securities |
| | • | | Level 2 – other significant observable inputs (including quoted prices for similar securities, interest rates, prepayment speed, credit risk, etc.) |
| | • | | Level 3 – significant unobservable inputs (including the Fund’s own assumptions in determining the fair value of investments) |
The inputs or methodology used for valuing securities are not an indication of the risk associated with investing in those securities.
The following is a summary of the inputs used as of December 31, 2008, in valuing the Fund’s assets carried at fair value:
| | | | | | | | | | | | |
| | | Level 1 | | Level 2 | | Level 3 | | Total |
Assets: | | | | | | | | | | | | |
Investments in Securities | | $ | 680,269,119 | | $ | 1,169,813 | | $ | — | | $ | 681,438,932 |
9. NEW ACCOUNTING PRONOUNCEMENT
In March 2008, FASB issued FASB Statement No. 161, “Disclosures about Derivative Instruments and Hedging Activities, an amendment of FASB Statement No. 133” (SFAS 161), which expands disclosures about derivative investments and hedging activities. SFAS 161 is effective for fiscal years and interim periods beginning after November 15, 2008. The Fund is currently evaluating the impact, if any, of applying the various provisions of SFAS 161.
FSC-20
Franklin Templeton Variable Insurance Products Trust
Notes to Financial Statements (continued)
Franklin Small-Mid Cap Growth Securities Fund
10. SUBSEQUENT EVENT
On January 23, 2009, the Fund entered into, along with other funds managed by Franklin Templeton Investments (individually, “Borrower”; collectively “Borrowers”), a $725 million senior unsecured syndicated global line of credit (“Global Credit Facility”) to provide a source of funds to the Borrowers for temporary and emergency purposes and to meet future unanticipated or unusually large redemption requests.
Under the terms of the Global Credit Facility, each Borrower has agreed to pay its proportionate share of fees and expenses incurred in connection with the implementation and maintenance of the Global Credit Facility.
ABBREVIATIONS
Selected Portfolio
ADR - American Depository Receipt
FSC-21
Franklin Templeton Variable Insurance Products Trust
Franklin Small-Mid Cap Growth Securities Fund
Report of Independent Registered Public Accounting Firm
To the Board of Trustees and Shareholders of
Franklin Templeton Variable Insurance Products Trust
In our opinion, the accompanying statement of assets and liabilities, including the statement of investments, and the related statements of operations and of changes in net assets and the financial highlights present fairly, in all material respects, the financial position of Franklin Small-Mid Cap Growth Securities Fund (one of the funds constituting the Franklin Templeton Variable Insurance Products Trust, hereafter referred to as the “Fund”) at December 31, 2008, the results of its operations for the year then ended, the changes in its net assets for each of the two years in the period then ended and the financial highlights for the periods presented, in conformity with accounting principles generally accepted in the United States of America. These financial statements and financial highlights (hereafter referred to as “financial statements”) are the responsibility of the Fund’s management. Our responsibility is to express an opinion on these financial statements based on our audits. We conducted our audits of these financial statements in accordance with the standards of the Public Company Accounting Oversight Board (United States). Those standards require that we plan and perform the audit to obtain reasonable assurance about whether the financial statements are free of material misstatement. An audit includes examining, on a test basis, evidence supporting the amounts and disclosures in the financial statements, assessing the accounting principles used and significant estimates made by management, and evaluating the overall financial statement presentation. We believe that our audits, which included confirmation of securities at December 31, 2008 by correspondence with the custodian and brokers, provide a reasonable basis for our opinion.
PricewaterhouseCoopers LLP
San Francisco, California
February 10, 2009
FSC-22
Franklin Templeton Variable Insurance Products Trust
Tax Designation (unaudited)
Franklin Small-Mid Cap Growth Securities Fund
Under Section 852(b)(3)(C) of the Internal Revenue Code, the Fund designates the maximum amount allowable but no less than $132,561,113 as a long term capital gain dividend for the fiscal year ended December 31, 2008.
FSC-23
FRANKLIN STRATEGIC INCOME SECURITIES FUND
This annual report for Franklin Strategic Income Securities Fund covers the fiscal year ended December 31, 2008.
Performance Summary as of 12/31/08
Average annual total return of Class 1 shares represents the average annual change in value, assuming reinvestment of dividends and capital gains. Average returns smooth out variations in returns, which can be significant; they are not the same as year-by-year results.
Periods ended 12/31/08
| | | | | | |
| | | 1-Year | | 5-Year | | Since
Inception
(7/1/99) |
Average Annual Total Return | | -11.03% | | +2.79% | | +5.30% |
Total Return Index Comparison
for a Hypothetical $10,000 Investment (7/1/99–12/31/08)
The graph below shows the change in value of a hypothetical $10,000 investment in the Fund over the indicated period and includes reinvestment of any income or distributions. The Fund’s performance is compared to the performance of the Barclays Capital (BC) U.S. Aggregate Index and the Lipper Multi-Sector Income Funds Classification Average. One cannot invest directly in an index, nor is an index representative of the Fund’s portfolio. Please see Important Notes to Performance Information preceding the Fund Summaries.
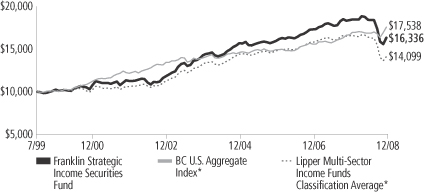
*Sources: © 2009 Morningstar; Lipper Inc. Please see Index Descriptions following the Fund Summaries.
Franklin Strategic Income Securities Fund – Class 1
Performance reflects the Fund’s Class 1 operating expenses, but does not include any contract fees, expenses or sales charges. If they had been included, performance would be lower. These charges and deductions, particularly for variable life policies, can have a significant effect on contract values and insurance benefits. See the contract prospectus for a complete description of these expenses, including sales charges.
Performance data represent past performance, which does not guarantee future results. Investment return and principal value will fluctuate, and you may have a gain or loss when you sell your shares. Current performance may differ from figures shown.
FSI-1
Fund Goals and Main Investments: Franklin Strategic Income Securities Fund seeks a high level of current income, with capital appreciation over the long term as a secondary goal. The Fund normally invests primarily to predominantly in U.S. and foreign debt securities, including those in emerging markets. Debt securities may be high yield and lower rated and include all varieties of fixed and floating rate income securities, including bonds, mortgage securities and other asset-backed and convertible securities.
Performance Overview
You can find the Fund’s one-year total return in the Performance Summary. Compared with its benchmarks for the same period, the Fund underperformed the BC U.S. Aggregate Index’s +5.24% return, and performed better than the Lipper Multi-Sector Income Funds Classification Average’s -14.31% return.1
Economic and Market Overview
In 2008, economic conditions deteriorated. The Conference Board’s Consumer Confidence Index fell to an all-time low since it began in 1967 as the U.S. economy faltered and stock markets declined. The government’s abrupt conservatorship of Fannie Mae and Freddie Mac and the failure of several blue-chip banks and financial institutions roiled equity markets. Despite government interventions and massive emergency funding, the nation’s economic troubles were exacerbated as manufacturing activity weakened at its fastest pace in nearly 30 years and as home prices continued to fall. Jobless claims mounted and the unemployment rate rose to 7.2% by period-end.2 Economic growth, as measured by gross domestic product (GDP), rebounded from a 0.9% annualized rate in the first quarter of 2008 to a 2.8% annualized pace in the second quarter, largely due to strong exports and government spending. However, in the third and fourth quarters of 2008, GDP fell at annualized rates of 0.5% and an estimated 3.8%, reflecting a broad-based contraction in consumer spending, falling corporate profits and slowing export growth.
Oil prices soared to a record high in July, rising above $145 per barrel, before dramatically retreating to $45 by period-end. Many other commodities such as agricultural products and precious and base metals followed similar trends. Partially as a result of the steep price corrections, inflation declined significantly late in the review period, and
1. Sources: © 2009 Morningstar; Lipper Inc. One cannot invest directly in an index, nor is an index representative of the Fund’s portfolio. Please see Index Descriptions following the Fund Summaries.
2. Source: Bureau of Labor Statistics.
Fund Risks: Because the Fund invests in bonds and other debt obligations, its share price and yield will be affected by interest rate movements. Bond prices generally move in the opposite direction of interest rates. Thus, as prices of bonds in the Fund adjust to a rise in interest rates, the Fund’s share price may decline. High yield, lower-rated (junk) bonds generally have greater price swings and higher default risks than investment-grade bonds. Foreign investing, especially in emerging markets, involves additional risks, including currency fluctuations, economic instability, market volatility, and political and social developments. The Fund’s prospectus also includes a description of the main investment risks.
FSI-2
December’s inflation rate was an annualized 0.1%.2 Core inflation, which excludes food and energy costs, rose at a 1.8% annual rate; this level was within the Federal Reserve Board’s (Fed’s) informal target range of 1.5%–2.0%.2 The core personal consumption expenditures price index reported a 12-month increase of 1.7%.3
A slowing economy and decelerating inflation prompted policymakers to further lower interest rates and enact stimulus plans. During the year under review, the Fed lowered the federal funds target rate to a range of 0% to 0.25% from 4.25% at the start of the reporting period. The Fed and U.S. Treasury Department also introduced new programs such as the Primary Dealer Credit Facility (PDCF) and the Troubled Asset Relief Program (TARP), which were intended to stimulate market liquidity.
Volatility remained high throughout the reporting period but intensified in the latter half of the year as stocks fluctuated wildly, Treasury prices soared and yields across the maturity spectrum plummeted. Investors drove the yield on the three-month Treasury bill to a multi-decade low, and LIBOR (London InterBank Offered Rate) rates, which banks charge one another for loans, jumped to record highs. Fixed income spreads were generally wide relative to Treasury yields over the period due to heightened market turbulence and risk aversion. The yield curve steepened and the spread between the two-year Treasury yield and the 10-year Treasury yield increased to 149 basis points (100 basis points equal one percentage point) at the end of December from 99 basis points at the beginning of the reporting period. The two-year Treasury bill yield fell from 3.05% to 0.76% over the 12-month period. Over the same period, the 10-year U.S. Treasury note yield fell from 4.04% to 2.25%.
Globally, lower interest rates from many central banks benefited long duration, developed government bonds. Additionally, a significant flight to quality favored a small group of developed country government bonds and currencies as investors indiscriminately sought to reduce risk. Several governments planned to cushion their economic slowdowns with increased government spending. In many of these countries, however, the downturn did not occur until late in the year and inflation remained elevated, which limited the extent of counter-cyclical response, particularly in Latin America. In Europe, the European Central Bank’s policy response remained two-pronged, including interest rate reductions and unprecedented and unlimited liquidity expansion to the banking system. However, the fiscal response was small and poorly coordinated across the region. Following several
3. Source: Bureau of Economic Analysis.
FSI-3
Portfolio Breakdown
Franklin Strategic Income Securities Fund
Based on Total Net Assets
| | | | |
| | | 12/31/08 | | 12/31/07 |
| | |
| Mortgages & Other Asset-Backed Bonds | | 21.9% | | 15.3% |
| | |
| High Yield Corporate Bonds | | 19.3% | | 25.7% |
| | |
| Investment-Grade Corporate Bonds & Preferred Securities | | 15.2% | | 6.2% |
| | |
| Floating Rate Bank Loans | | 11.3% | | 15.2% |
| | |
| Other International Bonds (non-$US) | | 9.1% | | 12.7% |
| | |
| U.S. Government & Agency Bonds* | | 8.0% | | 7.2% |
| | |
| Emerging Market Bonds ($US) | | 3.9% | | 1.7% |
| | |
| International Developed Country Bonds (non-$US) | | 2.2% | | 9.3% |
| | |
| Municipal Bonds | | 1.5% | | 0.0% |
| | |
| Convertible Securities | | 0.6% | | 2.9% |
| | |
| Short-Term Investments & Other Net Assets** | | 7.0% | | 3.8% |
*As of 12/31/08, includes agency preferred stock and 1.9% in Treasury Inflation Protected Securities (TIPS). As of 12/31/07, includes 0.2% denominated in non-U.S. dollars and 0.9% in TIPS.
**Includes gains/losses on forward currency contracts. Does not include short-term foreign government securities.
The dollar value, number of shares or principal amount, and names of all portfolio holdings are listed in the Fund’s Statement of Investments.
years of rapid expansion, fueled by credit extension from European banks, many non-eurozone European countries’ imbalances were revealed. Some central and eastern European economies asked the International Monetary Fund for support.
Asia’s economic growth did not fall as sharply as in the U.S. and Europe. Current accounts remained relatively stable and actually improved for some net commodity importers such as South Korea. Asian countries largely did not face balance of payment pressure during the year. Furthermore, with substantial international reserves and favorable conditions from official financing sources, most had some ability to cushion the external shock. Authorities sought to take advantage of this flexibility through monetary and fiscal easing. The Asian banking sector seemed likely to come under some stress; however, it appeared fairly stable as banks have largely deleveraged since the 1997 financial crisis.
Investment Strategy
We allocate our investments among the various types of debt available based on our assessment of changing economic, global market, industry and issuer conditions. We use a top-down analysis of macroeconomic trends, combined with a bottom-up fundamental analysis of market sectors, industries and issuers, seeking to take advantage of varying sector reactions to economic events. For example, we may evaluate
FSI-4
business cycles, yield curves, country risk, and the relative interest rates among currencies, and values between and within markets. In selecting debt securities, we generally conduct our own analysis of the security’s intrinsic value rather than simply relying on the coupon rate or rating.
Manager’s Discussion
During the year under review, Franklin Strategic Income Securities Fund underperformed the BC U.S. Aggregate Index and performed better than the Lipper Multi-Sector Income Funds Classification Average. The Fund’s lower exposure to the more U.S. interest-rate sensitive fixed income sectors, such as U.S. Treasuries and mortgage-backed securities, constrained results relative to the BC U.S. Aggregate Index. These government and agency issues outperformed other fixed income sectors amid significant financial market volatility. The Fund’s reduced exposure to high yield corporate bonds, lower relative exposure to U.S. dollar-denominated emerging market sovereign bonds, and the positive impact from certain non-U.S. dollar-denominated government bond and forward currency positions helped performance compared to the Fund’s peers. This positive effect was somewhat offset by the negative impact of investments in noninvestment-grade bank loans and certain commercial mortgage-backed and asset-backed securities.
In this past year’s turbulent environment, one of the strongest performing asset categories was U.S. Treasury securities, due largely to a combination of investors’ flight to quality and expectations that a domestic recession would temper inflationary pressures. Nearly all fixed income spread sectors, those priced at a yield above government bonds to compensate for additional credit risk, underperformed government bonds as risk aversion rose and fundamental outlooks became more cautious. (As yields rise, prices and valuations decline.) With yields exceeding, in some cases significantly, the widest levels experienced over the past several decades, we sought to take advantage of dislocations across fixed income markets, particularly in sectors and securities that appeared to be driven more by fear and supply/demand imbalances than by longer-term fundamentals or relative value assessments.
With an upward move in longer-term U.S. interest rates early in the reporting period and expectations that inflation may moderate given a weakening domestic economy, we increased exposure to U.S. government securities (although overall exposure was less than 10% of total net assets at period-end). Within the more interest-rate sensitive sectors, we increased holdings in agency mortgage-backed securities
FSI-5
and commercial mortgage- and other asset-backed securities as valuations declined significantly. In particular, following the conservatorship of Fannie Mae and Freddie Mac and the government’s perceived backing of these entities’ debt and mortgage-backed securities, we found attractive the historically wide spreads on these issues. In other asset-backed sectors, we believed deterioration in the consumer and commercial sectors may pressure fundamentals and lead to increased delinquencies for such securitized issues; however, given the seniority of the Fund’s positions, we believe our securities have a significant asset cushion that should provide downside support while also offering yield premiums well above historical norms.
The corporate credit markets were severely impacted by events in September and October. The combination of the largest bankruptcy in U.S. history (Lehman Brothers), double-digit declines in global equity markets, the virtual freezing of the commercial paper and short-term bank lending markets, and an increasingly negative outlook for global economic growth pressured prices for corporate-related debt securities. However, by period-end, many observers believed that governments across the globe not only were pumping liquidity into the financial system but also were attempting to prevent the failure of any corporate issuer that could have widespread repercussions for the financial system. Consequently, we found what we believed were attractive values among major bank and finance-related corporate issuers that we assessed could be longer-term survivors but still offered yields and spreads that were historically cheap. We also found value in certain non-financial, investment-grade issuers that came to market with new issues priced at higher yield spreads compared with their outstanding issues.
Deteriorating fundamentals and a forced unwinding of positions from certain past buyers and owners of loans (e.g., hedge funds, investors in total return swaps that funded certain loan purchases, and market value collateralized loan obligations) caused the leveraged bank loan market to drop significantly during the Fund’s fiscal year. Although default rates rose and were expected to continue increasing into 2009, we believed price levels during the period were attractive given the senior, secured structure of loans purchased. Spreads for high yield corporate bonds similarly jumped beginning in October, reaching spread levels over U.S. Treasury securities of more than 1,900 basis points in December, the highest level in the more than 20-year history of this asset class’s existence.4 We found some value in the high yield market; however,
4. Source: Barclays Capital.
FSI-6
overall exposure to this asset class fell during the reporting period given declining prices and because we favored investment-grade corporate bonds. We reduced the Fund’s already modest exposure to convertible securities because investment opportunities in traditional corporate debt markets appeared more attractive to us on a risk-adjusted basis. We initiated small positions in certain municipal bond issuers, as absolute yields relative to U.S. Treasuries reached historically high levels.
After broad U.S. dollar depreciation in five of the past six calendar years, the dollar appreciated significantly against many currencies in 2008. This was largely due to a deleveraging, repatriation and risk reduction across currency markets, as well as increasingly negative outlooks for other developed and developing markets that began to be reflected in their currencies. Consequently, the Fund’s non-U.S. dollar holdings provided mixed results. The Fund’s holdings in several Asian and Latin American currencies declined on the U.S. dollar’s strength, but holdings in Japanese yen-denominated bonds and forward currency contracts performed well given the yen’s defensive strength during the period. Elsewhere, certain of our non-eurozone European positions depreciated in value; however, the Fund was hedged and net short in the euro, which helped performance as the euro declined significantly relative to the U.S. dollar during the period. The Fund was relatively underweighted versus historical levels in U.S. dollar-denominated emerging market debt throughout the period, although widening yield spreads in the period’s second half, largely based on perceived supply and demand imbalances, improved the relative value of certain developing market issuers. In particular, the Fund initiated a position in U.S. dollar-denominated Russian sovereign bonds during the period, given what we considered a supportive creditor outlook for Russia despite the country’s challenging economic and financial market outlook.
Thank you for your participation in Franklin Strategic Income Securities Fund. We look forward to serving your future investment needs.
The foregoing information reflects our analysis, opinions and portfolio holdings as of December 31, 2008, the end of the reporting period. The way we implement our main investment strategies and the resulting portfolio holdings may change depending on factors such as market and economic conditions. These opinions may not be relied upon as investment advice or an offer for a particular security. The information is not a complete analysis of every aspect of any market, country, industry, security or the Fund. Statements of fact are from sources considered reliable, but the investment manager makes no representation or warranty as to their completeness or accuracy. Although historical performance is no guarantee of future results, these insights may help you understand our investment management philosophy.
FSI-7
Fund Expenses
As an investor in a variable insurance contract (Contract) that indirectly provides for investment in an underlying mutual fund, you can incur transaction and/or ongoing expenses at both the Fund level and the Contract level.
| • | | Transaction expenses can include sales charges (loads) on purchases, redemption fees, surrender fees, transfer fees and premium taxes. |
| • | | Ongoing expenses can include management fees, distribution and service (12b-1) fees, contract fees, annual maintenance fees, mortality and expense risk fees and other fees and expenses. All mutual funds and Contracts have some types of ongoing expenses. |
The expenses shown in the table are meant to highlight ongoing expenses at the Fund level only and do not include ongoing expenses at the Contract level, or transaction expenses at either the Fund or Contract level. While the Fund does not have transaction expenses, if the transaction and ongoing expenses at the Contract level were included, the expenses shown below would be higher. You should consult your Contract prospectus or disclosure document for more information.
The table shows Fund-level ongoing expenses and can help you understand these expenses and compare them with those of other mutual funds offered through the Contract. The table assumes a $1,000 investment held for the six months indicated. Please refer to the Fund prospectus for additional information on operating expenses.
Actual Fund Expenses
The first line (Actual) of the table provides actual account values and expenses. The “Ending Account Value” is derived from the Fund’s actual return, which includes the effect of ongoing Fund expenses, but does not include the effect of ongoing Contract expenses.
You can estimate the Fund-level expenses you incurred during the period by following these steps. Of course, your account value and expenses will differ from those in this illustration:
| 1. | Divide your account value by $1,000. |
If an account had an $8,600 value, then $8,600 ÷ $1,000 = 8.6.
| 2. | Multiply the result by the number under the heading “Fund-Level Expenses Incurred During Period.” |
If Fund-Level Expenses Incurred During Period were $7.50, then 8.6 x $7.50 = $64.50.
In this illustration, the estimated expenses incurred this period at the Fund level are $64.50.
Franklin Strategic Income Securities Fund – Class 1
FSI-8
Hypothetical Example for Comparison with Other Mutual Funds
Information in the second line (Hypothetical) of the table can help you compare ongoing expenses of the Fund with those of other mutual funds offered through the Contract. This information may not be used to estimate the actual ending account balance or expenses you incurred during the period. The hypothetical “Ending Account Value” is based on the Fund’s actual expense ratio and an assumed 5% annual rate of return before expenses, which does not represent the Fund’s actual return. The figure under the heading “Fund-Level Expenses Incurred During Period” shows the hypothetical expenses your account would have incurred under this scenario. You can compare this figure with the 5% hypothetical examples that appear in shareholder reports of other funds offered through a Contract.
| | | | | | | | | |
| Class 1 | | Beginning
Account Value 7/1/08 | | Ending
Account
Value 12/31/08 | | Fund-Level
Expenses Incurred
During Period*
7/1/08–12/31/08 |
Actual | | $ | 1,000 | | $ | 886.80 | | $ | 2.89 |
Hypothetical (5% return before expenses) | | $ | 1,000 | | $ | 1,022.07 | | $ | 3.10 |
*Expenses are calculated using the most recent six-month annualized expense ratio for the Fund’s Class 1 shares (0.61%), which does not include any ongoing expenses of the Contract for which the Fund is an investment option, multiplied by the average account value over the period, multiplied by 184/366 to reflect the one-half year period.
FSI-9
Franklin Templeton Variable Insurance Products Trust
Financial Highlights
Franklin Strategic Income Securities Fund
| | | | | | | | | | | | | | | | | | | | |
| | | Year Ended December 31, | |
| Class 1 | | 2008 | | | 2007 | | | 2006 | | | 2005 | | | 2004 | |
| | | | |
Per share operating performance | | | | | | | | | | | | | | | | | | | | |
(for a share outstanding throughout the year) | | | | | | | | | | | | | | | | | | | | |
Net asset value, beginning of year | | $ | 12.78 | | | $ | 12.73 | | | $ | 12.43 | | | $ | 12.92 | | | $ | 12.16 | |
| | | | |
Income from investment operationsa: | | | | | | | | | | | | | | | | | | | | |
Net investment incomeb | | | 0.69 | | | | 0.73 | | | | 0.69 | | | | 0.65 | | | | 0.67 | |
Net realized and unrealized gains (losses) | | | (1.99 | ) | | | 0.04 | | | | 0.32 | | | | (0.44 | ) | | | 0.51 | |
| | | | |
Total from investment operations | | | (1.30 | ) | | | 0.77 | | | | 1.01 | | | | 0.21 | | | | 1.18 | |
| | | | |
Less distributions from: | | | | | | | | | | | | | | | | | | | | |
Net investment income and net foreign currency gains | | | (0.87 | ) | | | (0.68 | ) | | | (0.63 | ) | | | (0.60 | ) | | | (0.40 | ) |
Net realized gains | | | (0.03 | ) | | | (0.04 | ) | | | (0.08 | ) | | | (0.10 | ) | | | (0.02 | ) |
| | | | |
Total distributions | | | (0.90 | ) | | | (0.72 | ) | | | (0.71 | ) | | | (0.70 | ) | | | (0.42 | ) |
| | | | |
Net asset value, end of year | | $ | 10.58 | | | $ | 12.78 | | | $ | 12.73 | | | $ | 12.43 | | | $ | 12.92 | |
| | | | |
| | | | | |
Total returnc | | | (11.03)% | | | | 6.20% | | | | 8.51% | | | | 1.73% | | | | 10.01% | |
Ratios to average net assets | | | | | | | | | | | | | | | | | | | | |
Expensesd | | | 0.61% | | | | 0.62% | | | | 0.62% | | | | 0.66% | | | | 0.66% | |
Net investment income | | | 5.83% | | | | 5.72% | | | | 5.51% | | | | 5.21% | | | | 5.45% | |
| | | | | |
Supplemental data | | | | | | | | | | | | | | | | | | | | |
Net assets, end of year (000’s) | | $ | 903,358 | | | $ | 1,086,850 | | | $ | 902,071 | | | $ | 740,352 | | | $ | 571,067 | |
Portfolio turnover rate | | | 47.68% | | | | 46.88% | | | | 47.88% | | | | 40.56% | | | | 50.21% | |
Portfolio turnover rate excluding mortgage dollar rollse | | | 47.68% | | | | 46.43% | | | | 44.58% | | | | 40.07% | | | | 38.39% | |
aThe amount shown for a share outstanding throughout the period may not correlate with the Statement of Operations for the period due to the timing of sales and repurchases of the Fund shares in relation to income earned and/or fluctuating market value of the investments of the Fund.
bBased on average daily shares outstanding.
cTotal return does not include any fees, charges or expenses imposed by the variable annuity and life insurance contracts for which the Franklin Templeton Variable Insurance Products Trust serves as an underlying investment vehicle.
dBenefit of expense reduction rounds to less than 0.01%.
eSee Note 1(e) regarding mortgage dollar rolls.
The accompanying notes are an integral part of these financial statements.
FSI-10
Franklin Templeton Variable Insurance Products Trust
Financial Highlights (continued)
Franklin Strategic Income Securities Fund
| | | | | | | | | | | | | | | | | | | | |
| | | Year Ended December 31, | |
| Class 2 | | 2008 | | | 2007 | | | 2006 | | | 2005 | | | 2004 | |
| | | | |
Per share operating performance | | | | | | | | | | | | | | | | | | | | |
(for a share outstanding throughout the year) | | | | | | | | | | | | | | | | | | | | |
Net asset value, beginning of year | | $ | 12.60 | | | $ | 12.56 | | | $ | 12.27 | | | $ | 12.78 | | | $ | 12.05 | |
| | | | |
Income from investment operationsa: | | | | | | | | | | | | | | | | | | | | |
Net investment incomeb | | | 0.65 | | | | 0.69 | | | | 0.65 | | | | 0.61 | | | | 0.63 | |
Net realized and unrealized gains (losses) | | | (1.96 | ) | | | 0.05 | | | | 0.31 | | | | (0.44 | ) | | | 0.51 | |
| | | | |
Total from investment operations | | | (1.31 | ) | | | 0.74 | | | | 0.96 | | | | 0.17 | | | | 1.14 | |
| | | | |
Less distributions from: | | | | | | | | | | | | | | | | | | | | |
Net investment income and net foreign currency gains | | | (0.85 | ) | | | (0.66 | ) | | | (0.59 | ) | | | (0.58 | ) | | | (0.39 | ) |
Net realized gains | | | (0.03 | ) | | | (0.04 | ) | | | (0.08 | ) | | | (0.10 | ) | | | (0.02 | ) |
| | | | |
Total distributions | | | (0.88 | ) | | | (0.70 | ) | | | (0.67 | ) | | | (0.68 | ) | | | (0.41 | ) |
| | | | |
Net asset value, end of year | | $ | 10.41 | | | $ | 12.60 | | | $ | 12.56 | | | $ | 12.27 | | | $ | 12.78 | |
| | | | |
| | | | | |
Total returnc | | | (11.24)% | | | | 5.91% | | | | 8.24% | | | | 1.46% | | | | 9.80% | |
Ratios to average net assets | | | | | | | | | | | | | | | | | | | | |
Expensesd | | | 0.86% | | | | 0.87% | | | | 0.87% | | | | 0.91% | | | | 0.91% | |
Net investment income | | | 5.58% | | | | 5.47% | | | | 5.26% | | | | 4.96% | | | | 5.20% | |
| | | | | |
Supplemental data | | | | | | | | | | | | | | | | | | | | |
Net assets, end of year (000’s) | | $ | 33,155 | | | $ | 24,613 | | | $ | 11,753 | | | $ | 19,514 | | | $ | 4,657 | |
Portfolio turnover rate | | | 47.68% | | | | 46.88% | | | | 47.88% | | | | 40.56% | | | | 50.21% | |
Portfolio turnover rate excluding mortgage dollar rollse | | | 47.68% | | | | 46.43% | | | | 44.58% | | | | 40.07% | | | | 38.39% | |
aThe amount shown for a share outstanding throughout the period may not correlate with the Statement of Operations for the period due to the timing of sales and repurchases of the Fund shares in relation to income earned and/or fluctuating market value of the investments of the Fund.
bBased on average daily shares outstanding.
cTotal return does not include any fees, charges or expenses imposed by the variable annuity and life insurance contracts for which the Franklin Templeton Variable Insurance Products Trust serves as an underlying investment vehicle.
dBenefit of expense reduction rounds to less than 0.01%.
eSee Note 1(e) regarding mortgage dollar rolls.
The accompanying notes are an integral part of these financial statements.
FSI-11
Franklin Templeton Variable Insurance Products Trust
Financial Highlights (continued)
Franklin Strategic Income Securities Fund
| | | | |
| | | Period Ended
December 31,
2008a | |
| Class 4 | | | |
Per share operating performance | | | | |
(for a share outstanding throughout the period) | | | | |
Net asset value, beginning of period | | $ | 12.84 | |
| | | | |
Income from investment operationsb: | | | | |
Net investment incomec | | | 0.53 | |
Net realized and unrealized gains (losses) | | | (1.93 | ) |
| | | | |
Total from investment operations | | | (1.40 | ) |
| | | | |
Less distributions from: | | | | |
Net investment income and net foreign currency gains | | | (0.87 | ) |
Net realized gains | | | (0.03 | ) |
| | | | |
Total distributions | | | (0.90 | ) |
| | | | |
Net asset value, end of period | | $ | 10.54 | |
| | | | |
| |
Total returnd | | | (11.69)% | |
Ratios to average net assetse | | | | |
Expensesf | | | 0.96% | |
Net investment income | | | 5.48% | |
| |
Supplemental data | | | | |
Net assets, end of period (000’s) | | $ | 59,766 | |
Portfolio turnover rate | | | 47.68% | |
aFor the period February 29, 2008 (effective date) to December 31, 2008.
bThe amount shown for a share outstanding throughout the period may not correlate with the Statement of Operations for the period due to the timing of sales and repurchases of the Fund shares in relation to income earned and/or fluctuating market value of the investments of the Fund.
cBased on average daily shares outstanding.
dTotal return does not include any fees, charges or expenses imposed by the variable annuity and life insurance contracts for which the Franklin Templeton Variable Insurance Products Trust serves as an underlying investment vehicle. Total return is not annualized for periods less than one year.
eRatios are annualized for periods less than one year.
fBenefit of expense reduction rounds to less than 0.01%.
The accompanying notes are an integral part of these financial statements.
FSI-12
Franklin Templeton Variable Insurance Products Trust
Statement of Investments, December 31, 2008
| | | | | | | |
| Franklin Strategic Income Securities Fund | | Country/
Organization | | Shares | | Value |
Convertible Preferred Stocks 0.4% | | | | | | | |
Banks 0.0%a | �� | | | | | | |
Fannie Mae, 8.75%, cvt. pfd. | | United States | | 44,000 | | $ | 46,200 |
| | | | | | | |
Diversified Financials 0.1% | | | | | | | |
Affiliated Managers Group Inc., 5.10%, cvt. pfd. | | United States | | 62,000 | | | 1,150,875 |
| | | | | | | |
Pharmaceuticals, Biotechnology & Life Sciences 0.3% | | | | | | | |
Schering-Plough Corp., 6.00%, cvt. pfd. | | United States | | 15,000 | | | 2,595,027 |
| | | | | | | |
Total Convertible Preferred Stocks (Cost $8,138,838) | | | | | | | 3,792,102 |
| | | | | | | |
Preferred Stocks 0.0%a | | | | | | | |
Banks 0.0%a | | | | | | | |
Freddie Mac, 8.375%, pfd., Z | | United States | | 70,000 | | | 27,300 |
| | | | | | | |
Diversified Financials 0.0%a | | | | | | | |
iPreferred Blocker Inc., 9.00%, pfd., 144A | | United States | | 804 | | | 285,420 |
| | | | | | | |
Total Preferred Stocks (Cost $2,035,420) | | | | | | | 312,720 |
| | | | | | | |
| | | |
| | | | | Principal
Amountb | | |
c,dSenior Floating Rate Interests 11.3% | | | | | | | |
Automobiles & Components 0.2% | | | | | | | |
eDayco Products LLC (Mark IV), Replacement Term Loan, 6.75%, 6/23/11 | | United States | | 910,082 | | | 310,945 |
Key Safety Systems Inc., Term Loan B, 2.721% - 6.753%, 3/10/14 | | United States | | 284,925 | | | 148,873 |
TRW Automotive Inc., Tranche B-1 Term Loan, 4.625% - 5.813%, 2/09/14 | | United States | | 2,642,525 | | | 1,773,135 |
| | | | | | | |
| | | | | | | 2,232,953 |
| | | | | | | |
Capital Goods 0.7% | | | | | | | |
eAmsted Industries Inc.,
Delayed Draw, 3.46% - 4.506%, 4/05/13 | | United States | | 1,553,770 | | | 955,568 |
Term Loan B, 3.46% - 6.82%, 4/05/13 | | United States | | 229,172 | | | 140,941 |
eBaldor Electric Co., Term Loan B, 2.25% - 5.25%, 1/31/14 | | United States | | 812,532 | | | 691,329 |
Hawker Beechcraft Inc.,
Synthetic L/C, 5.762%, 3/26/14 | | United States | | 70,951 | | | 37,285 |
Term Loan B, 2.461% - 3.459%, 3/26/14 | | United States | | 1,208,304 | | | 634,963 |
eOshkosh Truck Corp., Term Loan B, 1.97% - 3.70%, 12/06/13 | | United States | | 4,778,712 | | | 2,812,466 |
eRBS Global Inc. (Rexnord Corp.), Term Loan, 4.39% - 7.003%, 7/22/13 | | United States | | 1,480,000 | | | 1,073,000 |
TransDigm Inc., Term Loan B, 3.498%, 6/23/13 | | United States | | 780,000 | | | 629,070 |
| | | | | | | |
| | | | | | | 6,974,622 |
| | | | | | | |
Commercial & Professional Services 0.9% | | | | | | | |
ARAMARK Corp.,
Synthetic L/C, 2.427%, 1/26/14 | | United States | | 352,307 | | | 291,865 |
Term Loan B, 3.334%, 1/26/14 | | United States | | 5,545,547 | | | 4,594,142 |
fEnviroSolutions Inc., Initial Term Loan, PIK, 10.50%, 7/07/12 | | United States | | 1,601,889 | | | 1,041,228 |
Nielsen Finance LLC (VNU Inc.), Dollar Term Loan, 3.82% - 4.388%, 8/09/13 | | United States | | 3,826,432 | | | 2,604,365 |
| | | | | | | |
| | | | | | | 8,531,600 |
| | | | | | | |
Consumer Durables & Apparel 0.6% | | | | | | | |
eJarden Corp.,
Term Loan B1, 3.209%, 1/24/12 | | United States | | 1,533,552 | | | 1,153,231 |
Term Loan B2, 3.209%, 1/24/12 | | United States | | 2,759,447 | | | 2,075,104 |
Jostens IH Corp. (Visant Holding Corp.), Term Loan C, 5.171%, 12/21/11 | | United States | | 1,650,997 | | | 1,386,837 |
The William Carter Co., Term Loan B, 1.961% - 4.92%, 7/14/12 | | United States | | 1,637,560 | | | 1,350,987 |
| | | | | | | |
| | | | | | | 5,966,159 |
| | | | | | | |
FSI-13
Franklin Templeton Variable Insurance Products Trust
Statement of Investments, December 31, 2008 (continued)
| | | | | | | |
| Franklin Strategic Income Securities Fund | | Country/
Organization | | Principal
Amountb | | Value |
c,dSenior Floating Rate Interests (continued) | | | | | | | |
Consumer Services 1.3% | | | | | | | |
Affinion Group Inc., Term Loan B, 3.959% - 4.673%, 10/17/12 | | United States | | 2,239,676 | | $ | 1,562,174 |
eEducation Management LLC, Term Loan C, 3.25%, 6/01/13 | | United States | | 4,645,298 | | | 2,954,409 |
eKuilima Resort Co. (Turtle Bay), First Lien Term Loan, 10.75%, 9/30/10 | | United States | | 4,578,412 | | | 1,350,632 |
Penn National Gaming Inc., Term Loan B, 2.21% - 5.89%, 10/03/12 | | United States | | 3,684,648 | | | 2,994,801 |
eVML U.S. Finance LLC (Venetian Macau),
Delayed Draw, 2.72%, 5/25/12 | | Macau | | 2,638,530 | | | 1,281,336 |
New Project Term Loans, 2.72%, 5/25/13 | | Macau | | 1,585,917 | | | 770,161 |
Term Loan B, 2.72%, 5/25/13 | | Macau | | 4,400,111 | | | 2,136,804 |
| | | | | | | |
| | | | | | | 13,050,317 |
| | | | | | | |
Diversified Financials 0.3% | | | | | | | |
Nuveen Investments Inc., Term Loan B, 3.461% - 4.466%, 11/13/14 | | United States | | 2,819,230 | | | 1,117,120 |
TD Ameritrade Holding Corp., Term Loan B, 2.38%, 12/31/12 | | United States | | 2,618,539 | | | 2,210,212 |
| | | | | | | |
| | | | | | | 3,327,332 |
| | | | | | | |
Energy 0.2% | | | | | | | |
Citgo Petroleum Corp., Term Loan B, 1.836%, 11/15/12 | | United States | | 2,255,429 | | | 1,313,787 |
Dresser Inc., Term Loan B, 2.711% - 4.486%, 5/04/14 | | United States | | 698,051 | | | 442,390 |
| | | | | | | |
| | | | | | | 1,756,177 |
| | | | | | | |
Food, Beverage & Tobacco 0.6% | | | | | | | |
Constellation Brands Inc., Term Loan B, 2.938% - 3.688%, 6/05/13 | | United States | | 2,718,676 | | | 2,414,524 |
eDean Foods Co., Term Loan B, 1.97% - 2.96%, 4/02/14 | | United States | | 4,052,313 | | | 3,425,652 |
| | | | | | | |
| | | | | | | 5,840,176 |
| | | | | | | |
Health Care Equipment & Services 1.7% | | | | | | | |
Carestream Health Inc., Term Loan, 5.42%, 4/30/13 | | United States | | 501,055 | | | 302,512 |
Community Health Systems Inc.,
gDelayed Draw Term Loan, 3.404%, 7/25/14 | | United States | | 116,398 | | | 91,199 |
Term Loan, 4.439% - 4.446%, 7/25/14 | | United States | | 6,826,503 | | | 5,348,565 |
eDaVita Inc., Term Loan B-1, 1.97% - 6.32%, 10/05/12 | | United States | | 1,711,507 | | | 1,504,293 |
DJO Finance LLC, Term Loan B, 3.461% - 4.459%, 5/20/14 | | United States | | 1,469,419 | | | 1,043,287 |
eFresenius Medical Care Holdings Inc., Term Loan B, 2.841% - 6.125%, 3/31/13 | | United States | | 2,662,256 | | | 2,316,163 |
HCA Inc.,
Term Loan A-1, 3.459%, 11/19/12 | | United States | | 1,996,875 | | | 1,694,847 |
Term Loan B-1, 3.709%, 11/18/13 | | United States | | 3,604,996 | | | 2,850,200 |
eLifePoint Hospitals Inc., Term Loan B, 3.821%, 4/15/12 | | United States | | 1,521,180 | | | 1,280,643 |
| | | | | | | |
| | | | | | | 16,431,709 |
| | | | | | | |
Materials 1.2% | | | | | | | |
Celanese U.S. Holdings LLC, Dollar Term Loan, 5.553%, 4/02/14 | | United States | | 2,487,125 | | | 1,709,898 |
Georgia-Pacific LLC,
Additional Term Loan, 2.581% - 4.189%, 12/20/12 | | United States | | 565,292 | | | 464,482 |
Term Loan B, 2.081% - 4.189%, 12/20/12 | | United States | | 3,659,356 | | | 3,006,772 |
Hexion Specialty Chemicals BV, Term Loan C-2, 3.75%, 5/03/13 | | Netherlands | | 599,635 | | | 252,446 |
Hexion Specialty Chemicals Inc., Term Loan C-1, 6.188%, 5/03/13 | | United States | | 2,767,465 | | | 1,165,103 |
Huntsman International LLC, Term Loan B, 2.221%, 4/21/14 | | United States | | 471,429 | | | 293,464 |
Lyondell Chemical Co., Tranche B-1, 7.00%, 12/20/14 | | United States | | 897,733 | | | 404,752 |
Nalco Co., Term Loan B, 2.25% - 5.313%, 11/04/10 | | United States | | 2,156,300 | | | 1,959,538 |
Rockwood Specialties Group Inc., Term Loan E, 3.546%, 7/30/12 | | United States | | 2,725,673 | | | 2,212,663 |
| | | | | | | |
| | | | | | | 11,469,118 |
| | | | | | | |
Media 1.7% | | | | | | | |
CSC Holdings Inc. (Cablevision), Incremental Term Loan, 2.945%, 3/29/13 | | United States | | 3,219,117 | | | 2,761,735 |
eDex Media West LLC, Term Loan B, 7.00% - 7.42%, 10/24/14 | | United States | | 3,511,153 | | | 1,536,129 |
FSI-14
Franklin Templeton Variable Insurance Products Trust
Statement of Investments, December 31, 2008 (continued)
| | | | | | | |
| Franklin Strategic Income Securities Fund | | Country/
Organization | | Principal
Amountb | | Value |
c,dSenior Floating Rate Interests (continued) | | | | | | | |
Media (continued) | | | | | | | |
DIRECTV Holdings LLC, Term Loan B, 1.961%, 4/13/13 | | United States | | 1,153,574 | | $ | 1,012,982 |
Idearc Inc., Term Loan B, 2.47% - 3.46%, 11/17/14 | | United States | | 4,347,688 | | | 1,372,626 |
MCC Iowa,
Tranche D-1 Term Loan, 2.20%, 1/31/15 | | United States | | 867,272 | | | 573,267 |
Tranche D-2 Term Loan, 2.20%, 1/31/15 | | United States | | 841,428 | | | 556,184 |
Metro-Goldwyn-Mayer Inc., Term Loan B, 3.711% - 4.709%, 4/08/12 | | United States | | 1,991,300 | | | 851,281 |
Regal Cinemas Corp., Term Loan, 3.209%, 10/27/13 | | United States | | 3,812,031 | | | 2,803,963 |
e,hTribune Co., Incremental Term Loan, 5.25%, 5/14/14 | | United States | | 4,682,135 | | | 909,116 |
Univision Communications Inc., Initial Term Loan, 2.711%, 9/29/14 | | United States | | 5,130,000 | | | 2,108,999 |
eUPC Financing Partnership, Term Loan N, 3.181%, 12/31/14 | | Netherlands | | 4,285,416 | | | 2,892,656 |
| | | | | | | |
| | | | | | | 17,378,938 |
| | | | | | | |
Real Estate 0.1% | | | | | | | |
Capital Automotive REIT, Term Loan B, 3.19%, 12/15/10 | | United States | | 3,163,963 | | | 1,306,717 |
| | | | | | | |
Semiconductors & Semiconductor Equipment 0.1% | | | | | | | |
Fairchild Semiconductor Corp., Initial Term Loan, 2.959%, 6/26/13 | | United States | | 883,192 | | | 585,114 |
| | | | | | | |
Software & Services 0.7% | | | | | | | |
Affiliated Computer Services Inc.,
Additional Term Loan, 2.471% - 3.899%, 3/20/13 | | United States | | 3,137,874 | | | 2,682,882 |
Term Loan B, 2.471%, 3/20/13 | | United States | | 326,760 | | | 279,380 |
Dealer Computer Services Inc. (Reynolds & Reynolds), First Lien
Term Loan, 2.461%, 10/26/12 | | United States | | 2,931,454 | | | 1,414,427 |
eSunGard Data Systems Inc., New U.S. Term Loan, 3.575% - 4.138%, 2/28/14 | | United States | | 4,213,250 | | | 2,911,355 |
| | | | | | | |
| | | | | | | 7,288,044 |
| | | | | | | |
Technology Hardware & Equipment 0.2% | | | | | | | |
Flextronics International USA Inc.,
Term Loan A, 6.133% - 7.069%, 10/01/14 | | United States | | 1,733,203 | | | 1,115,026 |
Term Loan A-1, 7.069%, 10/01/14 | | United States | | 498,063 | | | 320,421 |
| | | | | | | |
| | | | | | | 1,435,447 |
| | | | | | | |
Telecommunication Services 0.5% | | | | | | | |
Alltel Communications Inc., Term Loan B-3, 3.939%, 5/18/15 | | United States | | 1,057,080 | | | 1,042,380 |
Hawaiian Telecom Communications Inc., Term Loan C, 4.50%, 6/01/14 | | United States | | 1,399,135 | | | 544,664 |
Windstream Corp., Tranche B-1, 6.05%, 7/17/13 | | United States | | 3,264,458 | | | 2,800,634 |
| | | | | | | |
| | | | | | | 4,387,678 |
| | | | | | | |
Transportation 0.1% | | | | | | | |
Avis Budget Car Rental LLC, Term Loan, 7.17%, 4/19/12 | | United States | | 2,606,587 | | | 1,029,602 |
| | | | | | | |
Utilities 0.2% | | | | | | | |
NRG Energy Inc.,
Credit Link, 1.359%, 2/01/13 | | United States | | 890,930 | | | 777,114 |
Term Loan, 1.961% - 2.959%, 2/01/13 | | United States | | 1,808,083 | | | 1,577,100 |
| | | | | | | |
| | | | | | | 2,354,214 |
| | | | | | | |
Total Senior Floating Rate Interests (Cost $156,394,991) | | | | | | | 111,345,917 |
| | | | | | | |
Corporate Bonds 34.6% | | | | | | | |
Automobiles & Components 0.6% | | | | | | | |
Ford Motor Credit Co. LLC, senior note,
5.80%, 1/12/09 | | United States | | 2,200,000 | | | 2,193,776 |
9.875%, 8/10/11 | | United States | | 3,500,000 | | | 2,583,354 |
FSI-15
Franklin Templeton Variable Insurance Products Trust
Statement of Investments, December 31, 2008 (continued)
| | | | | | | | |
| Franklin Strategic Income Securities Fund | | Country/
Organization | | Principal
Amountb | | | Value |
Corporate Bonds (continued) | | | | | | | | |
Automobiles & Components (continued) | | | | | | | | |
iTRW Automotive Inc., senior note, 144A, 7.25%, 3/15/17 | | United States | | 2,900,000 | | | $ | 1,493,500 |
| | | | | | | | |
| | | | | | | | 6,270,630 |
| | | | | | | | |
Banks 1.8% | | | | | | | | |
i,jBNP Paribas, 144A, 7.195%, Perpetual | | France | | 3,500,000 | | | | 2,229,868 |
Citigroup Capital XXI, pfd., junior sub. bond, 8.30%, 12/21/77 | | United States | | 4,300,000 | | | | 3,332,163 |
HSBC Holdings PLC, sub. note, 6.50%, 9/15/37 | | United Kingdom | | 3,500,000 | | | | 3,566,171 |
Svensk Exportkredit AB, senior note, 7.625%, 6/30/14 | | Sweden | | 1,335,000 | NZD | | | 840,072 |
UBS AG Stamford, senior note, 5.875%, 12/20/17 | | United States | | 3,500,000 | | | | 3,220,693 |
Wells Fargo & Co., senior note, 5.625%, 12/11/17 | | United States | | 1,500,000 | | | | 1,567,661 |
jWells Fargo Capital XIII, pfd., 7.70%, Perpetual | | United States | | 2,900,000 | | | | 2,395,435 |
jWells Fargo Capital XV, pfd., 9.75%, Perpetual | | United States | | 600,000 | | | | 606,565 |
| | | | | | | | |
| | | | | | | | 17,758,628 |
| | | | | | | | |
Capital Goods 1.3% | | | | | | | | |
iAllison Transmission Inc., senior note, 144A, 11.00%, 11/01/15 | | United States | | 2,700,000 | | | | 1,336,500 |
DRS Technologies Inc., senior sub. note, 7.625%, 2/01/18 | | United States | | 2,300,000 | | | | 2,311,500 |
L-3 Communications Corp., senior sub. note,
5.875%, 1/15/15 | | United States | | 2,000,000 | | | | 1,810,000 |
6.375%, 10/15/15 | | United States | | 400,000 | | | | 376,000 |
Nortek Inc., senior note, 10.00%, 12/01/13 | | United States | | 300,000 | | | | 205,500 |
RBS Global & Rexnord Corp., senior note, 9.50%, 8/01/14 | | United States | | 2,900,000 | | | | 2,175,000 |
RSC Equipment Rental Inc., senior note, 9.50%, 12/01/14 | | United States | | 2,900,000 | | | | 1,609,500 |
Terex Corp., senior sub. note, 8.00%, 11/15/17 | | United States | | 2,800,000 | | | | 2,394,000 |
TransDigm Inc., senior sub. note, 7.75%, 7/15/14 | | United States | | 500,000 | | | | 412,500 |
| | | | | | | | |
| | | | | | | | 12,630,500 |
| | | | | | | | |
Commercial & Professional Services 0.8% | | | | | | | | |
Allied Waste North America Inc., senior secured note, 6.875%, 6/01/17 | | United States | | 1,600,000 | | | | 1,490,306 |
ARAMARK Corp., senior note, 8.50%, 2/01/15 | | United States | | 2,900,000 | | | | 2,639,000 |
Iron Mountain Inc., senior sub. note, 8.75%, 7/15/18 | | United States | | 1,500,000 | | | | 1,301,250 |
JohnsonDiversey Holdings Inc., senior disc. note, 10.67%, 5/15/13 | | United States | | 900,000 | | | | 634,500 |
JohnsonDiversey Inc., senior sub. note, B, 9.625%, 5/15/12 | | United States | | 1,900,000 | | | | 1,567,500 |
| | | | | | | | |
| | | | | | | | 7,632,556 |
| | | | | | | | |
Consumer Durables & Apparel 0.8% | | | | | | | | |
D.R. Horton Inc., senior note, 6.50%, 4/15/16 | | United States | | 3,000,000 | | | | 1,905,000 |
Jarden Corp., senior sub. note, 7.50%, 5/01/17 | | United States | | 2,900,000 | | | | 1,993,750 |
Jostens IH Corp., senior sub. note, 7.625%, 10/01/12 | | United States | | 2,500,000 | | | | 2,062,500 |
KB Home, senior note,
6.25%, 6/15/15 | | United States | | 1,800,000 | | | | 1,107,000 |
7.25%, 6/15/18 | | United States | | 1,000,000 | | | | 590,000 |
| | | | | | | | |
| | | | | | | | 7,658,250 |
| | | | | | | | |
Consumer Services 1.2% | | | | | | | | |
iFontainebleau Las Vegas, 144A, 10.25%, 6/15/15 | | United States | | 2,500,000 | | | | 256,250 |
Host Hotels & Resorts LP, senior note, | | | | | | | | |
6.875%, 11/01/14 | | United States | | 200,000 | | | | 155,000 |
K, 7.125%, 11/01/13 | | United States | | 2,400,000 | | | | 1,944,000 |
M, 7.00%, 8/15/12 | | United States | | 1,100,000 | | | | 937,750 |
MGM MIRAGE, senior note, 6.625%, 7/15/15 | | United States | | 5,000,000 | | | | 3,075,000 |
Pinnacle Entertainment Inc., senior sub. note,
8.25%, 3/15/12 | | United States | | 200,000 | | | | 153,000 |
FSI-16
Franklin Templeton Variable Insurance Products Trust
Statement of Investments, December 31, 2008 (continued)
| | | | | | | | |
| Franklin Strategic Income Securities Fund | | Country/
Organization | | Principal
Amountb | | | Value |
Corporate Bonds (continued) | | | | | | | | |
Consumer Services (continued) | | | | | | | | |
Pinnacle Entertainment Inc., senior sub. note (continued)
8.75%, 10/01/13 | | United States | | 2,200,000 | | | $ | 1,749,000 |
Royal Caribbean Cruises Ltd., senior deb., 7.25%, 3/15/18 | | United States | | 3,500,000 | | | | 1,802,500 |
Starwood Hotels & Resorts Worldwide Inc., 6.75%, 5/15/18 | | United States | | 3,200,000 | | | | 1,776,737 |
Station Casinos Inc.,
senior note, 6.00%, 4/01/12 | | United States | | 700,000 | | | | 143,500 |
senior note, 7.75%, 8/15/16 | | United States | | 700,000 | | | | 136,500 |
senior sub. note, 6.50%, 2/01/14 | | United States | | 300,000 | | | | 18,750 |
senior sub. note, 6.875%, 3/01/16 | | United States | | 1,000,000 | | | | 62,500 |
| | | | | | | | |
| | | | | | | | 12,210,487 |
| | | | | | | | |
Diversified Financials 4.0% | | | | | | | | |
American Express Co., senior note, 7.00%, 3/19/18 | | United States | | 3,000,000 | | | | 3,038,538 |
American Express Credit Corp., senior note, C, 7.30%, 8/20/13 | | United States | | 1,200,000 | | | | 1,229,504 |
Bank of America Corp.,
jpfd., sub. bond, M, 8.125%, Perpetual | | United States | | 5,000,000 | | | | 3,746,250 |
senior note, 5.65%, 5/01/18 | | United States | | 1,500,000 | | | | 1,511,613 |
iBAT International Finance PLC, senior note, 144A, 9.50%, 11/15/18 | | United Kingdom | | 1,800,000 | | | | 1,997,041 |
Capmark Financial Group Inc., senior note, 6.30%, 5/10/17 | | United States | | 1,800,000 | | | | 495,625 |
Citigroup Inc., senior note, 6.125%, 11/21/17 | | United States | | 1,800,000 | | | | 1,822,061 |
General Electric Capital Corp., senior note, A, 8.50%, 4/06/18 | | United States | | 64,000,000 | MXN | | | 3,833,327 |
iGMAC LLC,
7.25%, 3/02/11, senior note, 144A | | United States | | 1,583,000 | | | | 1,361,064 |
6.875%, 9/15/11, senior note, 144A | | United States | | 1,076,000 | | | | 882,030 |
6.875%, 8/28/12, senior note, 144A | | United States | | 1,139,000 | | | | 874,934 |
The Goldman Sachs Group Inc., sub. note, 6.75%, 10/01/37 | | United States | | 4,500,000 | | | | 3,663,544 |
JPMorgan Chase & Co.,
6.00%, 1/15/18 | | United States | | 1,500,000 | | | | 1,586,051 |
jjunior sub. note, 1, 7.90%, Perpetual | | United States | | 1,800,000 | | | | 1,501,247 |
JPMorgan Chase Capital XXII, sub. bond, 6.45%, 2/02/37 | | United States | | 5,000,000 | | | | 4,109,220 |
hLehman Brothers Holdings Inc., senior note, 6.20%, 9/26/14 | | United States | | 5,500,000 | | | | 550,000 |
Merrill Lynch & Co. Inc., senior note, 6.40%, 8/28/17 | | United States | | 3,500,000 | | | | 3,512,299 |
Morgan Stanley, senior note, 6.00%, 4/28/15 | | United States | | 4,500,000 | | | | 3,961,909 |
| | | | | | | | |
| | | | | | | | 39,676,257 |
| | | | | | | | |
Energy 3.6% | | | | | | | | |
Baker Hughes Inc., senior note, 7.50%, 11/15/18 | | United States | | 2,800,000 | | | | 3,109,747 |
Canadian Natural Resources Ltd., 5.90%, 2/01/18 | | Canada | | 3,500,000 | | | | 3,029,012 |
Chesapeake Energy Corp., senior note,
7.625%, 7/15/13 | | United States | | 700,000 | | | | 605,500 |
6.625%, 1/15/16 | | United States | | 100,000 | | | | 79,500 |
6.25%, 1/15/18 | | United States | | 3,300,000 | | | | 2,458,500 |
7.25%, 12/15/18 | | United States | | 300,000 | | | | 235,500 |
Compagnie Generale de Geophysique-Veritas, senior note,
7.50%, 5/15/15 | | France | | 2,000,000 | | | | 1,250,000 |
7.75%, 5/15/17 | | France | | 900,000 | | | | 526,500 |
Copano Energy LLC, senior note, 8.125%, 3/01/16 | | United States | | 2,900,000 | | | | 2,117,000 |
El Paso Corp., senior note, 12.00%, 12/12/13 | | United States | | 2,600,000 | | | | 2,606,500 |
iKazmunaigaz Finance SUB BV, 144A, 9.125%, 7/02/18 | | Kazakhstan | | 2,400,000 | | | | 1,572,000 |
Mariner Energy Inc., senior note, 7.50%, 4/15/13 | | United States | | 2,900,000 | | | | 1,870,500 |
MarkWest Energy Partners LP, senior note, 6.875%, 11/01/14 | | United States | | 3,200,000 | | | | 2,032,000 |
iPetroplus Finance Ltd., senior note, 144A, 6.75%, 5/01/14 | | Switzerland | | 3,200,000 | | | | 2,048,000 |
FSI-17
Franklin Templeton Variable Insurance Products Trust
Statement of Investments, December 31, 2008 (continued)
| | | | | | | |
| Franklin Strategic Income Securities Fund | | Country/
Organization | | Principal
Amountb | | Value |
Corporate Bonds (continued) | | | | | | | |
Energy (continued) | | | | | | | |
Plains Exploration & Production Co., senior note, 7.625%, 6/01/18 | | United States | | 3,200,000 | | $ | 2,208,000 |
Quicksilver Resources Inc., senior note, 8.25%, 8/01/15 | | United States | | 2,800,000 | | | 1,792,000 |
iSandRidge Energy Inc., senior note, 144A, 8.00%, 6/01/18 | | United States | | 2,900,000 | | | 1,624,000 |
Tesoro Corp., senior note, 6.50%, 6/01/17 | | United States | | 3,800,000 | | | 2,104,250 |
Weatherford International Ltd., senior note, 6.00%, 3/15/18 | | United States | | 3,000,000 | | | 2,523,501 |
The Williams Cos. Inc., senior note,
7.625%, 7/15/19 | | United States | | 1,000,000 | | | 782,540 |
7.875%, 9/01/21 | | United States | | 1,600,000 | | | 1,226,190 |
8.75%, 3/15/32 | | United States | | 600,000 | | | 447,908 |
| | | | | | | |
| | | | | | | 36,248,648 |
| | | | | | | |
Food & Staples Retailing 0.4% | | | | | | | |
The Kroger Co.,
6.15%, 1/15/20 | | United States | | 2,000,000 | | | 1,977,148 |
senior note, 7.50%, 1/15/14 | | United States | | 1,600,000 | | | 1,683,672 |
| | | | | | | |
| | | | | | | 3,660,820 |
| | | | | | | |
Food, Beverage & Tobacco 1.9% | | | | | | | |
Altria Group Inc., senior note, 9.70%, 11/10/18 | | United States | | 2,900,000 | | | 3,139,447 |
Bottling Group LLC, senior note, 6.95%, 3/15/14 | | United States | | 2,800,000 | | | 3,043,578 |
iCargill Inc., 144A,
5.20%, 1/22/13 | | United States | | 500,000 | | | 458,454 |
6.00%, 11/27/17 | | United States | | 2,000,000 | | | 1,796,272 |
Dean Foods Inc., senior note, 7.00%, 6/01/16 | | United States | | 2,000,000 | | | 1,710,000 |
Diageo Capital PLC, senior note, 7.375%, 1/15/14 | | United Kingdom | | 1,200,000 | | | 1,310,280 |
Philip Morris International Inc., 5.65%, 5/16/18 | | United States | | 2,900,000 | | | 2,880,033 |
Reynolds American Inc., senior secured note, 7.625%, 6/01/16 | | United States | | 2,900,000 | | | 2,418,374 |
Smithfield Foods Inc., senior note, 7.75%,
5/15/13 | | United States | | 1,500,000 | | | 971,250 |
7/01/17 | | United States | | 1,200,000 | | | 690,000 |
| | | | | | | |
| | | | | | | 18,417,688 |
| | | | | | | |
Health Care Equipment & Services 2.4% | | | | | | | |
Coventry Health Care Inc., senior note,
6.30%, 8/15/14 | | United States | | 1,500,000 | | | 918,819 |
5.95%, 3/15/17 | | United States | | 1,300,000 | | | 678,662 |
DaVita Inc., senior sub. note, 7.25%, 3/15/15 | | United States | | 3,200,000 | | | 3,056,000 |
FMC Finance III SA, senior note, 6.875%, 7/15/17 | | Germany | | 2,500,000 | | | 2,350,000 |
HCA Inc.,
senior note, 6.50%, 2/15/16 | | United States | | 800,000 | | | 496,000 |
senior secured note, 9.125%, 11/15/14 | | United States | | 4,000,000 | | | 3,720,000 |
Medco Health Solutions Inc., 7.125%, 3/15/18 | | United States | | 2,500,000 | | | 2,314,008 |
Quest Diagnostics Inc., 6.40%, 7/01/17 | | United States | | 2,800,000 | | | 2,577,019 |
Tenet Healthcare Corp., senior note,
6.375%, 12/01/11 | | United States | | 2,300,000 | | | 1,788,250 |
9.875%, 7/01/14 | | United States | | 600,000 | | | 486,000 |
c,fU.S. Oncology Holdings Inc., senior note, PIK, FRN, 8.334%, 3/15/12 | | United States | | 3,116,212 | | | 1,994,376 |
fUnited Surgical Partners International Inc., senior sub. note, PIK, 9.25%, 5/01/17 | | United States | | 2,600,000 | | | 1,612,000 |
Vanguard Health Holding Co. II LLC, senior sub. note, 9.00%, 10/01/14 | | United States | | 2,700,000 | | | 2,268,000 |
| | | | | | | |
| | | | | | | 24,259,134 |
| | | | | | | |
Household & Personal Products 0.4% | | | | | | | |
The Procter and Gamble Co., 4.60% 1/15/14 | | United States | | 3,600,000 | | | 3,776,677 |
| | | | | | | |
FSI-18
Franklin Templeton Variable Insurance Products Trust
Statement of Investments, December 31, 2008 (continued)
| | | | | | | |
| Franklin Strategic Income Securities Fund | | Country/
Organization | | Principal
Amountb | | Value |
Corporate Bonds (continued) | | | | | | | |
Insurance 0.3% | | | | | | | |
c,iMetLife Capital Trust X, secured bond, 144A, FRN, 9.25%, 4/08/68 | | United States | | 800,000 | | $ | 559,107 |
MetLife Inc.,
cjunior sub. note, FRN, 6.40%, 12/15/66 | | United States | | 2,000,000 | | | 1,213,733 |
senior note, A, 6.817%, 8/15/18 | | United States | | 1,000,000 | | | 954,042 |
| | | | | | | |
| | | | | | | 2,726,882 |
| | | | | | | |
Materials 2.4% | | | | | | | |
Crown Americas Inc., senior note, 7.75%, 11/15/15 | | United States | | 3,200,000 | | | 3,200,000 |
Freeport-McMoRan Copper & Gold Inc., senior note, | | | | | | | |
8.25%, 4/01/15 | | United States | | 800,000 | | | 689,750 |
8.375%, 4/01/17 | | United States | | 2,900,000 | | | 2,381,294 |
Huntsman International LLC, senior sub. note, 7.875%, 11/15/14 | | United States | | 2,300,000 | | | 1,242,000 |
iIneos Group Holdings PLC, senior secured note, 144A, 8.50%, 2/15/16 | | United Kingdom | | 3,200,000 | | | 304,000 |
iMacDermid Inc., senior sub. note, 144A, 9.50%, 4/15/17 | | United States | | 2,700,000 | | | 1,417,500 |
Nalco Co., senior sub. note, 8.875%, 11/15/13 | | United States | | 2,900,000 | | | 2,465,000 |
NewPage Corp., senior secured note, 10.00%, 5/01/12 | | United States | | 2,900,000 | | | 1,290,500 |
Novelis Inc., senior note, 7.25%, 2/15/15 | | Canada | | 3,500,000 | | | 2,047,500 |
Owens-Brockway Glass Container Inc., senior note, 6.75%, 12/01/14 | | United States | | 2,800,000 | | | 2,590,000 |
Rio Tinto Finance USA Ltd., 5.875%, 7/15/13 | | Australia | | 4,300,000 | | | 3,428,214 |
RPM International Inc., 6.50%, 2/15/18 | | United States | | 2,800,000 | | | 2,540,905 |
Smurfit Kappa Funding PLC, senior sub. note, 7.75%, 4/01/15 | | Ireland | | 900,000 | | | 495,000 |
| | | | | | | |
| | | | | | | 24,091,663 |
| | | | | | | |
Media 3.8% | | | | | | | |
iBritish Sky Broadcasting Group PLC, senior note, 144A, 6.10%, 2/15/18 | | United Kingdom | | 3,500,000 | | | 2,878,582 |
CanWest Media Inc., senior sub. note, 8.00%, 9/15/12 | | Canada | | 2,700,000 | | | 1,201,500 |
CCH I LLC, senior secured note, 11.00%, 10/01/15 | | United States | | 1,400,000 | | | 252,000 |
CCH II LLC, senior note, 10.25%, 9/15/10 | | United States | | 3,700,000 | | | 1,720,500 |
Comcast Corp., senior note, 6.30%, 11/15/17 | | United States | | 3,600,000 | | | 3,510,428 |
CSC Holdings Inc.,
senior deb., 7.625%, 7/15/18 | | United States | | 2,100,000 | | | 1,648,500 |
senior note, 6.75%, 4/15/12 | | United States | | 300,000 | | | 276,000 |
Dex Media Inc., B, 8.00%, 11/15/13 | | United States | | 400,000 | | | 76,000 |
Dex Media West Finance, senior sub. note, 9.875%, 8/15/13 | | United States | | 2,200,000 | | | 528,000 |
DIRECTV Holdings LLC, senior note, 7.625%, 5/15/16 | | United States | | 2,700,000 | | | 2,632,500 |
EchoStar DBS Corp., senior note, | | | | | | | |
6.375%, 10/01/11 | | United States | | 2,900,000 | | | 2,704,250 |
7.125%, 2/01/16 | | United States | | 1,400,000 | | | 1,176,000 |
Idearc Inc., senior note, 8.00%, 11/15/16 | | United States | | 3,400,000 | | | 272,000 |
Lamar Media Corp., senior sub. note, | | | | | | | |
7.25%, 1/01/13 | | United States | | 2,800,000 | | | 2,247,000 |
B, 6.625%, 8/15/15 | | United States | | 400,000 | | | 291,000 |
Liberty Media Corp., senior note, 5.70%, 5/15/13 | | United States | | 3,000,000 | | | 1,981,731 |
LIN Television Corp., senior sub. note, 6.50%, 5/15/13 | | United States | | 2,700,000 | | | 1,302,750 |
Quebecor Media Inc., senior note, 7.75%, 3/15/16 | | Canada | | 2,900,000 | | | 1,972,000 |
R.H. Donnelley Corp., senior disc. note, A-1, 6.875%, 1/15/13 | | United States | | 300,000 | | | 42,000 |
senior disc. note, A-2, 6.875%, 1/15/13 | | United States | | 800,000 | | | 112,000 |
senior note, A-3, 8.875%, 1/15/16 | | United States | | 900,000 | | | 139,500 |
Radio One Inc., senior sub. note, 6.375%, 2/15/13 | | United States | | 2,800,000 | | | 959,000 |
Time Warner Cable Inc., senior note, | | | | | | | |
8.25%, 2/14/14 | | United States | | 1,100,000 | | | 1,117,061 |
6.75%, 7/01/18 | | United States | | 3,200,000 | | | 3,086,262 |
Time Warner Inc., 5.875%, 11/15/16 | | United States | | 3,500,000 | | | 3,142,475 |
FSI-19
Franklin Templeton Variable Insurance Products Trust
Statement of Investments, December 31, 2008 (continued)
| | | | | | | |
| Franklin Strategic Income Securities Fund | | Country/
Organization | | Principal
Amountb | | Value |
Corporate Bonds (continued) | | | | | | | |
Media (continued) | | | | | | | |
f,iUnivision Communications Inc., senior note, 144A, PIK, 9.75%, 3/15/15 | | United States | | 3,300,000 | | $ | 429,000 |
Viacom Inc., senior note, 6.875%, 4/30/36 | | United States | | 3,300,000 | | | 2,614,838 |
| | | | | | | |
| | | | | | | 38,312,877 |
| | | | | | | |
Real Estate 0.1% | | | | | | | |
Forest City Enterprises Inc., senior note, 7.625%, 6/01/15 | | United States | | 2,600,000 | | | 923,000 |
| | | | | | | |
Retailing 0.4% | | | | | | | |
Dollar General Corp., senior note, 10.625%, 7/15/15 | | United States | | 2,700,000 | | | 2,592,000 |
Michaels Stores Inc., senior note, 10.00%, 11/01/14 | | United States | | 3,300,000 | | | 1,518,000 |
| | | | | | | |
| | | | | | | 4,110,000 |
| | | | | | | |
Semiconductors & Semiconductor Equipment 0.1% | | | | | | | |
Freescale Semiconductor Inc., senior note, 8.875%, 12/15/14 | | United States | | 1,800,000 | | | 801,000 |
| | | | | | | |
Software & Services 0.3% | | | | | | | |
SunGard Data Systems Inc.,
senior note, 9.125%, 8/15/13 | | United States | | 1,600,000 | | | 1,392,000 |
senior sub. note, 10.25%, 8/15/15 | | United States | | 1,900,000 | | | 1,263,500 |
| | | | | | | |
| | | | | | | 2,655,500 |
| | | | | | | |
Technology Hardware & Equipment 0.4% | | | | | | | |
Celestica Inc., senior sub. note,
7.875%, 7/01/11 | | Canada | | 1,500,000 | | | 1,372,500 |
7.625%, 7/01/13 | | Canada | | 1,400,000 | | | 1,155,000 |
iNortel Networks Ltd., senior note, 144A, 10.75%, 7/15/16 | | Canada | | 2,700,000 | | | 592,745 |
Sanmina-SCI Corp.,
c,isenior note, 144A, FRN, 4.746%, 6/15/14 | | United States | | 500,000 | | | 272,500 |
senior sub. note, 6.75%, 3/01/13 | | United States | | 2,300,000 | | | 1,000,500 |
| | | | | | | |
| | | | | | | 4,393,245 |
| | | | | | | |
Telecommunication Services 3.6% | | | | | | | |
iAmerican Tower Corp., senior note, 144A, 7.00%, 10/15/17 | | United States | | 2,700,000 | | | 2,416,500 |
AT&T Corp., senior note, 6.70%, 11/15/13 | | United States | | 3,600,000 | | | 3,851,285 |
iDigicel Group Ltd., senior note, 144A, 8.875%, 1/15/15 | | Jamaica | | 2,900,000 | | | 1,899,500 |
Embarq Corp., senior note, 7.082%, 6/01/16 | | United States | | 2,500,000 | | | 1,927,567 |
Inmarsat Finance PLC, senior note, 10.375%, 11/15/12 | | United Kingdom | | 2,800,000 | | | 2,495,500 |
Intelsat Bermuda Ltd., senior note, 11.25%, 6/15/16 | | Bermuda | | 700,000 | | | 640,500 |
iIntelsat Subsidiary Holding Co. Ltd., senior note, 144A, 8.50%, 1/15/13 | | Bermuda | | 3,200,000 | | | 2,976,000 |
MetroPCS Wireless Inc., senior note, 9.25%, 11/01/14 | | United States | | 3,200,000 | | | 2,880,000 |
Millicom International Cellular SA, senior note, 10.00%, 12/01/13 | | Luxembourg | | 3,000,000 | | | 2,715,000 |
Qwest Communications International Inc., senior note, 7.50%, 2/15/14 | | United States | | 2,700,000 | | | 1,944,000 |
Telecom Italia Capital, senior note,
4.95%, 9/30/14 | | Italy | | 3,500,000 | | | 2,658,530 |
6.999%, 6/04/18 | | Italy | | 500,000 | | | 406,278 |
Verizon Communications Inc., 6.10%, 4/15/18 | | United States | | 800,000 | | | 798,510 |
Verizon New York Inc., senior deb.,
A, 6.875%, 4/01/12 | | United States | | 2,700,000 | | | 2,688,287 |
B, 7.375%, 4/01/32 | | United States | | 400,000 | | | 334,951 |
iVerizon Wireless Capital LLC, 144A, 7.375%, 11/15/13 | | United States | | 1,800,000 | | | 1,901,077 |
iWind Acquisition Finance SA, senior note, 144A, 10.75%, 12/01/15 | | Italy | | 2,800,000 | | | 2,422,000 |
Windstream Corp., senior note, 8.625%, 8/01/16 | | United States | | 1,000,000 | | | 890,000 |
| | | | | | | |
| | | | | | | 35,845,485 |
| | | | | | | |
FSI-20
Franklin Templeton Variable Insurance Products Trust
Statement of Investments, December 31, 2008 (continued)
| | | | | | | |
| Franklin Strategic Income Securities Fund | | Country/
Organization | | Principal
Amountb | | Value |
Corporate Bonds (continued) | | | | | | | |
Transportation 0.1% | | | | | | | |
iCeva Group PLC, senior note, 144A, 10.00%, 9/01/14 | | United Kingdom | | 2,000,000 | | $ | 1,492,500 |
| | | | | | | |
Utilities 3.9% | | | | | | | |
The AES Corp., senior note,
8.00%, 10/15/17 | | United States | | 2,900,000 | | | 2,392,500 |
i144A, 8.00%, 6/01/20 | | United States | | 600,000 | | | 468,000 |
CenterPoint Energy Inc., senior note,
6.125%, 11/01/17 | | United States | | 1,800,000 | | | 1,515,906 |
6.50%, 5/01/18 | | United States | | 1,000,000 | | | 818,345 |
Dominion Resources Inc., 6.40%, 6/15/18 | | United States | | 2,900,000 | | | 2,844,642 |
Dynegy Holdings Inc., senior note, 8.375%, 5/01/16 | | United States | | 3,300,000 | | | 2,359,500 |
iE.ON International Finance BV, 144A, 5.80%, 4/30/18 | | Germany | | 3,000,000 | | | 2,809,839 |
Edison Mission Energy, senior note, 7.00%, 5/15/17 | | United States | | 3,200,000 | | | 2,800,000 |
iIntergen NV, senior secured note, 144A, 9.00%, 6/30/17 | | Netherlands | | 3,200,000 | | | 2,640,000 |
Mirant North America LLC, senior note, 7.375%, 12/31/13 | | United States | | 3,200,000 | | | 3,088,000 |
NRG Energy Inc., senior note,
7.25%, 2/01/14 | | United States | | 700,000 | | | 656,250 |
7.375%, 2/01/16 | | United States | | 3,200,000 | | | 2,984,000 |
Pacific Gas & Electric Co., senior note, 8.25%, 10/15/18 | | United States | | 3,600,000 | | | 4,332,823 |
PNM Resources Inc., senior note, 9.25%, 5/15/15 | | United States | | 500,000 | | | 400,000 |
Sempra Energy, senior note, 9.80%, 2/15/19 | | United States | | 3,400,000 | | | 3,799,466 |
iTexas Competitive Electric Holdings Co. LLC, senior note, 144A, 10.25%, 11/01/15 | | United States | | 4,000,000 | | | 2,860,000 |
Virginia Electric and Power Co., senior note, 8.875%, 11/15/38 | | United States | | 1,400,000 | | | 1,777,203 |
| | | | | | | |
| | | | | | | 38,546,474 |
| | | | | | | |
Total Corporate Bonds (Cost $439,367,136) | | | | | | | 344,098,901 |
| | | | | | | |
Convertible Bonds (Cost $2,147,673) 0.2% | | | | | | | |
Pharmaceuticals, Biotechnology & Life Sciences 0.2% | | | | | | | |
Mylan Inc., cvt., senior note, 1.25%, 3/15/12 | | United States | | 2,500,000 | | | 1,850,000 |
| | | | | | | |
Asset-Backed Securities and Commercial Mortgage-Backed Securities 6.4% | | | | | | | |
Banks 3.2% | | | | | | | |
cBanc of America Commercial Mortgage Inc., 2005-6, A4, FRN, 5.403%, 9/10/47 | | United States | | 2,000,000 | | | 1,644,999 |
cCitibank Credit Card Issuance Trust, 2005-A3, A3, FRN, 0.531%, 4/24/14 | | United States | | 1,000,000 | | | 826,752 |
Citigroup/Deutsche Bank Commercial Mortgage Trust,
c2005-CD1, A4, FRN, 5.40%, 7/15/44 | | United States | | 1,600,000 | | | 1,331,800 |
2006-CD3, A5, 5.617%, 10/15/48 | | United States | | 9,800,000 | | | 7,835,275 |
Countrywide Asset-Backed Certificates,
2004-7, AF4, 4.774%, 8/25/32 | | United States | | 136,719 | | | 135,556 |
2005-11, AF4, 5.21%, 3/25/34 | | United States | | 1,275,000 | | | 667,190 |
GE Capital Commercial Mortgage Corp., 2003-C1, A4, 4.819%, 1/10/38 | | United States | | 934,225 | | | 834,298 |
Greenwich Capital Commercial Funding Corp.,
2004-GG1, A7, 5.317%, 6/10/36 | | United States | | 1,605,000 | | | 1,339,921 |
2005-GG5, A5, 5.224%, 4/10/37 | | United States | | 1,395,000 | | | 1,150,461 |
c2006-GG7, A4, FRN, 5.913%, 7/10/38 | | United States | | 4,000,000 | | | 3,134,706 |
GS Mortgage Securities Corp. II,
2003-C1, A3, 4.608%, 1/10/40 | | United States | | 1,100,000 | | | 971,594 |
c2006-GG6, A4, FRN, 5.553%, 4/10/38 | | United States | | 4,000,000 | | | 3,251,806 |
LB-UBS Commercial Mortgage Trust,
c2002-C2, A4, FRN, 5.594%, 6/15/31 | | United States | | 1,000,000 | | | 936,325 |
2006-C1, A4, 5.156%, 2/15/31 | | United States | | 5,700,000 | | | 4,542,125 |
FSI-21
Franklin Templeton Variable Insurance Products Trust
Statement of Investments, December 31, 2008 (continued)
| | | | | | | |
| Franklin Strategic Income Securities Fund | | Country/
Organization | | Principal
Amountb | | Value |
Asset-Backed Securities and Commercial Mortgage-Backed Securities (continued) | | | | | | | |
Banks (continued) | | | | | | | |
cMorgan Stanley Capital I Trust, 2004-IQ7, A4, FRN, 5.431%, 6/15/38 | | United States | | 4,000,000 | | $ | 3,485,381 |
| | | | | | | |
| | | | | | | 32,088,189 |
| | | | | | | |
Diversified Financials 3.2% | | | | | | | |
cAmerican Express Credit Account Master Trust, 2008-1, A, FRN, 1.645%, 8/15/13 | | United States | | 2,800,000 | | | 2,489,615 |
cChase Issuance Trust,
2005-A9, A9, FRN, 1.215%, 11/15/11 | | United States | | 1,000,000 | | | 964,306 |
2007-A9, A9, FRN, 1.225%, 6/16/14 | | United States | | 5,000,000 | | | 4,095,158 |
sub. note, 2006-A7, A, FRN, 1.205%, 2/15/13 | | United States | | 800,000 | | | 715,712 |
Citigroup Commercial Mortgage Trust, 2008-C7, A4, 6.095%, 12/10/49 | | United States | | 8,700,000 | | | 6,744,833 |
JPMorgan Chase Commercial Mortgage Securities Corp.,
c2004-CB9, A4, FRN, 5.377%, 6/12/41 | | United States | | 5,096,445 | | | 4,322,887 |
2004-LN2, A2, 5.115%, 7/15/41 | | United States | | 412,616 | | | 348,325 |
c2005-LDP5, A4, FRN, 5.179%, 12/15/44 | | United States | | 3,400,000 | | | 2,735,001 |
iKeystone Owner Trust, 1997-P3, M2, 144A, 7.98%, 12/25/24 | | United States | | 2,573 | | | 2,561 |
cMBNA Credit Card Master Note Trust, 2005-A4, A4, FRN, 1.235%, 11/15/12 | | United States | | 1,000,000 | | | 922,593 |
cMBNA Master Credit Card Trust II, 1997-B, A, FRN, 1.355%, 8/15/14 | | United States | | 10,000,000 | | | 8,349,268 |
Residential Asset Securities Corp., 2004-KS1, AI4, 4.213%, 4/25/32 | | United States | | 173,298 | | | 140,103 |
| | | | | | | |
| | | | | | | 31,830,362 |
| | | | | | | |
Total Asset-Backed Securities and Commercial Mortgage-Backed Securities (Cost $76,974,716) | | | | | | | 63,918,551 |
| | | | | | | |
Mortgage-Backed Securities 15.5% | | | | | | | |
cFederal Home Loan Mortgage Corp. (FHLMC) Adjustable Rate 0.0%a | | | | | | | |
FHLMC, 6.073%, 1/01/33 | | United States | | 148,263 | | | 148,499 |
| | | | | | | |
Federal Home Loan Mortgage Corp. (FHLMC) Fixed Rate 7.4% | | | | | | | |
FHLMC Gold 15 Year, 4.50%, 10/01/18 - 9/01/19 | | United States | | 3,308,791 | | | 3,401,169 |
FHLMC Gold 15 Year, 5.00%, 12/01/17 - 9/01/19 | | United States | | 3,579,352 | | | 3,689,483 |
FHLMC Gold 15 Year, 5.50%, 7/01/17 - 7/01/19 | | United States | | 845,102 | | | 873,578 |
FHLMC Gold 15 Year, 6.00%, 5/01/17 | | United States | | 30,190 | | | 31,311 |
FHLMC Gold 15 Year, 6.50%, 5/01/16 | | United States | | 12,543 | | | 13,034 |
eFHLMC Gold 30 Year, 5.00%, 1/01/34 - 6/01/38 | | United States | | 17,781,397 | | | 18,188,505 |
FHLMC Gold 30 Year, 5.50%, 3/01/33 - 7/01/38 | | United States | | 19,513,569 | | | 20,002,372 |
FHLMC Gold 30 Year, 6.00%, 4/01/33 - 6/01/38 | | United States | | 15,855,727 | | | 16,358,402 |
FHLMC Gold 30 Year, 6.50%, 12/01/23 - 8/01/38 | | United States | | 10,487,511 | | | 10,908,238 |
FHLMC Gold 30 Year, 7.00%, 9/01/21 - 1/01/32 | | United States | | 134,494 | | | 141,503 |
FHLMC Gold 30 Year, 7.50%, 3/01/30 - 7/01/31 | | United States | | 2,798 | | | 2,969 |
| | | | | | | |
| | | | | | | 73,610,564 |
| | | | | | | |
cFederal National Mortgage Association (FNMA) Adjustable Rate 0.1% | | | | | | | |
FNMA, 4.547%, 4/01/20 | | United States | | 149,457 | | | 149,390 |
FNMA, 4.614%, 12/01/34 | | United States | | 832,766 | | | 834,568 |
| | | | | | | |
| | | | | | | 983,958 |
| | | | | | | |
Federal National Mortgage Association (FNMA) Fixed Rate 7.4% | | | | | | | |
FNMA 15 Year, 4.50%, 6/01/19 - 3/01/20 | | United States | | 645,065 | | | 661,879 |
FNMA 15 Year, 5.00%, 10/01/17 - 6/01/18 | | United States | | 690,776 | | | 713,482 |
FNMA 15 Year, 5.50%, 10/01/16 - 4/01/21 | | United States | | 1,952,210 | | | 2,014,987 |
FNMA 15 Year, 6.00%, 4/01/16 - 7/01/16 | | United States | | 23,795 | | | 24,796 |
FNMA 15 Year, 7.00%, 5/01/12 | | United States | | 2,202 | | | 2,280 |
FSI-22
Franklin Templeton Variable Insurance Products Trust
Statement of Investments, December 31, 2008 (continued)
| | | | | | | | |
| Franklin Strategic Income Securities Fund | | Country/
Organization | | Principal
Amountb | | | Value |
Mortgage-Backed Securities (continued) | | | | | | | | |
Federal National Mortgage Association (FNMA) Fixed Rate (continued) | | | | | | | | |
FNMA 30 Year, 5.00%, 4/01/34 - 6/01/38 | | United States | | 16,098,700 | | | $ | 16,458,986 |
FNMA 30 Year, 5.50%, 8/01/33 - 5/01/36 | | United States | | 16,868,824 | | | | 17,318,344 |
eFNMA 30 Year, 6.00%, 1/01/29 - 5/01/38 | | United States | | 27,003,227 | | | | 27,836,851 |
FNMA 30 Year, 6.50%, 6/01/28 - 10/01/37 | | United States | | 8,480,072 | | | | 8,822,200 |
FNMA 30 Year, 7.50%, 9/01/31 | | United States | | 26,587 | | | | 28,176 |
| | | | | | | | |
| | | | | | | | 73,881,981 |
| | | | | | | | |
Government National Mortgage Association (GNMA) Fixed Rate 0.6% | | | | | | | | |
GNMA I SF 30 Year, 5.00%, 11/15/33 - 7/15/34 | | United States | | 1,785,753 | | | | 1,838,083 |
GNMA I SF 30 Year, 5.50%, 12/15/32 - 6/15/36 | | United States | | 2,504,694 | | | | 2,587,955 |
GNMA I SF 30 Year, 6.50%, 11/15/31 - 2/15/32 | | United States | | 15,438 | | | | 16,229 |
GNMA I SF 30 Year, 7.00%, 10/15/28 - 6/15/32 | | United States | | 112,731 | | | | 119,296 |
GNMA I SF 30 Year, 7.50%, 9/15/30 | | United States | | 2,915 | | | | 3,090 |
GNMA II SF 30 Year, 5.00%, 9/20/33 - 11/20/33 | | United States | | 485,615 | | | | 498,651 |
GNMA II SF 30 Year, 6.00%, 11/20/34 | | United States | | 609,817 | | | | 629,167 |
GNMA II SF 30 Year, 6.50%, 4/20/31 - 2/20/34 | | United States | | 223,135 | | | | 234,438 |
GNMA II SF 30 Year, 7.50%, 1/20/28 - 4/20/32 | | United States | | 60,415 | | | | 63,865 |
| | | | | | | | |
| | | | | | | | 5,990,774 |
| | | | | | | | |
Total Mortgage-Backed Securities (Cost $149,886,198) | | | | | | | | 154,615,776 |
| | | | | | | | |
U.S. Government and Agency Securities 8.0% | | | | | | | | |
FHLMC,
3.75%, 6/28/13 | | United States | | 3,000,000 | | | | 3,198,012 |
5.00%, 2/16/17 | | United States | | 3,000,000 | | | | 3,407,268 |
5.625%, 3/15/11 | | United States | | 500,000 | | | | 545,231 |
senior note, 4.75%, 3/5/12 | | United States | | 6,000,000 | | | | 6,515,466 |
FNMA, 4.125%, 4/15/14 | | United States | | 700,000 | | | | 756,868 |
U.S. Treasury Bond,
4.50%, 2/15/16 | | United States | | 5,600,000 | | | | 6,594,006 |
7.125%, 2/15/23 | | United States | | 4,980,000 | | | | 7,226,448 |
7.875%, 2/15/21 | | United States | | 3,600,000 | | | | 5,351,627 |
U.S. Treasury Note,
3.50%, 12/15/09 | | United States | | 2,500,000 | | | | 2,575,393 |
4.00%, 8/31/09 | | United States | | 2,900,000 | | | | 2,970,122 |
4.125%, 5/15/15 | | United States | | 7,700,000 | | | | 8,833,348 |
4.25%, 8/15/14 | | United States | | 1,800,000 | | | | 2,069,438 |
4.625%, 2/15/17 | | United States | | 6,000,000 | | | | 7,097,814 |
4.75%, 8/15/17 | | United States | | 2,900,000 | | | | 3,468,220 |
kIndex Linked, 1.625%, 1/15/15 | | United States | | 3,403,767 | | | | 3,157,528 |
kIndex Linked, 1.625%, 1/15/15 | | United States | | 7,972,873 | | | | 7,556,793 |
kIndex Linked, 2.00%, 7/15/14 | | United States | | 4,597,305 | | | | 4,349,124 |
kIndex Linked, 2.00%, 1/15/16 | | United States | | 4,475,278 | | | | 4,287,177 |
| | | | | | | | |
Total U.S. Government and Agency Securities
(Cost $75,195,353) | | | | | | | | 79,959,883 |
| | | | | | | | |
Foreign Government and Agency Securities 13.8% | | | | | | | | |
European Investment Bank, senior note, 1612/37, 6.50%, 9/10/14 | | Supranationall | | 4,555,000 | NZD | | | 2,889,002 |
c,mGovernment of Argentina, senior bond, FRN, 3.127%, 8/03/12 | | Argentina | | 33,037,000 | | | | 8,771,670 |
Government of Indonesia,
11.00%, 10/15/14 | | Indonesia | | 1,800,000,000 | IDR | | | 159,358 |
FR17, 13.15%, 1/15/12 | | Indonesia | | 2,300,000,000 | IDR | | | 218,922 |
FSI-23
Franklin Templeton Variable Insurance Products Trust
Statement of Investments, December 31, 2008 (continued)
| | | | | | | | |
| Franklin Strategic Income Securities Fund | | Country/
Organization | | Principal
Amountb | | | Value |
Foreign Government and Agency Securities (continued) | | | | | | | | |
Government of Indonesia, (continued) | | | | | | | | |
FR19, 14.25%, 6/15/13 | | Indonesia | | 35,480,000,000 | IDR | | $ | 3,531,725 |
FR20, 14.275%, 12/15/13 | | Indonesia | | 23,637,000,000 | IDR | | | 2,363,700 |
FR34, 12.80%, 6/15/21 | | Indonesia | | 39,455,000,000 | IDR | | | 3,764,512 |
FR42, 10.25%, 7/15/27 | | Indonesia | | 28,000,000,000 | IDR | | | 2,209,175 |
nReg S, 6.625%, 2/17/37 | | Indonesia | | 330,000 | | | | 249,062 |
nReg S, 6.875%, 1/17/18 | | Indonesia | | 2,040,000 | | | | 1,664,567 |
nsenior bond, Reg S, 7.75%, 1/17/38 | | Indonesia | | 4,000,000 | | | | 3,375,000 |
nsenior bond, Reg S, 8.50%, 10/12/35 | | Indonesia | | 360,000 | | | | 302,787 |
nGovernment of Iraq, Reg S, 5.80%, 1/15/28 | | Iraq | | 1,190,000 | | | | 507,237 |
Government of Malaysia,
3.461%, 7/31/13 | | Malaysia | | 6,400,000 | MYR | | | 1,886,820 |
3.756%, 4/28/11 | | Malaysia | | 18,465,000 | MYR | | | 5,440,059 |
3.814%, 2/15/17 | | Malaysia | | 11,400,000 | MYR | | | 3,413,185 |
4.24%, 2/07/18 | | Malaysia | | 6,600,000 | MYR | | | 2,057,070 |
4.305%, 2/27/09 | | Malaysia | | 17,925,000 | MYR | | | 5,201,747 |
Government of Mexico,
8.00%, 12/17/15 | | Mexico | | 350,000 | o MXN | | | 2,563,307 |
10.00%, 12/05/24 | | Mexico | | 1,174,000 | o MXN | | | 9,854,238 |
Government of Poland, 5.75%, 9/23/22 | | Poland | | 19,100,000 | PLN | | | 6,670,896 |
Government of Russia,
i144A, 7.50%, 3/31/30 | | Russia | | 4,700,080 | | | | 4,159,571 |
nsenior bond, Reg S, 7.50%, 3/31/30 | | Russia | | 18,032,000 | | | | 15,890,700 |
Government of South Africa, 5.875%, 5/30/22 | | South Africa | | 100,000 | | | | 82,750 |
Government of Sweden,
4.00%, 12/01/09 | | Sweden | | 42,420,000 | SEK | | | 5,561,121 |
5.50%, 10/08/12 | | Sweden | | 13,990,000 | SEK | | | 2,028,475 |
Government of Venezuela,
10.75%, 9/19/13 | | Venezuela | | 2,105,000 | | | | 1,389,300 |
nsenior bond, Reg S, 5.375%, 8/07/10 | | Venezuela | | 2,965,000 | | | | 2,327,673 |
KfW Bankengruppe, senior note, 6.50%, 11/15/11 | | Germany | | 3,588,000 | NZD | | | 2,219,721 |
Korea Treasury Bond,
0525-1209, 5.25%, 9/10/12 | | South Korea | | 1,700,000,000 | KRW | | | 1,404,852 |
0525-2703, 5.25%, 3/10/27 | | South Korea | | 5,861,000,000 | KRW | | | 4,962,592 |
0550-1709, 5.50%, 9/10/17 | | South Korea | | 10,510,000,000 | KRW | | | 8,987,684 |
New South Wales Treasury Corp., senior note, 5.50%, 3/01/17 | | Australia | | 3,540,000 | AUD | | | 2,617,342 |
Nota Do Tesouro Nacional,
9.762%, 1/01/12 | | Brazil | | 900 | p BRL | | | 365,839 |
9.762%, 1/01/14 | | Brazil | | 2,700 | p BRL | | | 1,047,580 |
9.762%, 1/01/17 | | Brazil | | 23,200 | p BRL | | | 8,642,348 |
qIndex Linked, 6.00%, 5/15/15 | | Brazil | | 2,500 | p BRL | | | 1,734,657 |
qIndex Linked, 6.00%, 5/15/45 | | Brazil | | 1,725 | p BRL | | | 1,130,139 |
Province of Ontario, 6.25%, 6/16/15 | | Canada | | 997,000 | NZD | | | 605,893 |
Queensland Treasury Corp.,
13, 6.00%, 8/14/13 | | Australia | | 600,000 | AUD | | | 446,615 |
17, 6.00%, 9/14/17 | | Australia | | 1,200,000 | AUD | | | 918,705 |
i144A, 7.125%, 9/18/17 | | Australia | | 5,640,000 | NZD | | | 3,880,253 |
| | | | | | | | |
Total Foreign Government and Agency Securities
(Cost $157,311,235) | | | | | | | | 137,497,849 |
| | | | | | | | |
Municipal Bonds 1.5% | | | | | | | | |
California State GO, Refunding, 5.00%, 4/01/38 | | United States | | 12,000,000 | | | | 10,183,800 |
FSI-24
Franklin Templeton Variable Insurance Products Trust
Statement of Investments, December 31, 2008 (continued)
| | | | | | | |
| Franklin Strategic Income Securities Fund | | Country/
Organization | | Principal
Amountb | | Value |
Municipal Bonds (continued) | | | | | | | |
eMatanuska-Susitna Borough Lease Revenue, Goose Greek Correctional Center, Assured Guaranty, | | | | | | | |
5.50%, 9/01/23 | | United States | | 835,000 | | $ | 842,306 |
6.00%, 9/01/28 | | United States | | 1,045,000 | | | 1,060,508 |
ePhiladelphia GO, Series B, Assured Guaranty, 7.125%, 7/15/38 | | United States | | 465,000 | | | 487,134 |
Placentia-Yorba Linda USD, GO, 2008 Election, Series A, 5.25%, 8/01/32 | | United States | | 1,250,000 | | | 1,213,762 |
San Bernardino Community College District GO,
Election 2002, Series A, 6.25%, 8/01/33 | | United States | | 315,000 | | | 327,861 |
Election 2002, Series A, 6.375%, 8/01/26 | | United States | | 210,000 | | | 225,622 |
Election 2002, Series A, 6.50%, 8/01/27 | | United States | | 305,000 | | | 328,857 |
Election 2002, Series A, 6.50%, 8/01/28 | | United States | | 125,000 | | | 133,623 |
San Mateo County Community College District GO, Election of 2001, Series C, MBIA Insured, zero cpn., | | | | | | | |
9/01/30 | | United States | | 895,000 | | | 224,797 |
3/01/31 | | United States | | 245,000 | | | 59,141 |
| | | | | | | |
Total Municipal Bonds (Cost $16,667,295) | | | | | | | 15,087,411 |
| | | | | | | |
Total Investments before Short Term Investments
(Cost $1,084,118,855) | | | | | | | 912,479,110 |
| | | | | | | |
Short Term Investments | | | | | | | |
Foreign Government and Agency Securities (Cost $13,701,266) 1.3% | | | | | | | |
rEgypt Treasury Bills, 1/13/09 - 9/22/09 | | Egypt | | 76,675,000 EGP | | | 13,372,959 |
| | | | | | | |
Total Investments before Money Markets Funds
(Cost $1,097,820,121) | | | | | | | 925,852,069 |
| | | | | | | |
Money Market Funds (Cost $44,875,873) 4.5% | | | | | | | |
sFranklin Institutional Fiduciary Trust Money Market Portfolio, 0.55% | | United States | | 44,875,873 | | | 44,875,873 |
| | | | | | | |
Total Investments (Cost $1,142,695,994) 97.5% | | | | | | | 970,727,942 |
Unrealized Appreciation on Forward Exchange Contracts 2.0% | | | | | | | 20,048,269 |
Other Assets, less Liabilities 0.5% | | | | | | | 5,503,242 |
| | | | | | | |
Net Assets 100.0% | | | | | | $ | 996,279,453 |
| | | | | | | |
See Abbreviations on page FSI-40.
FSI-25
Franklin Templeton Variable Insurance Products Trust
Statement of Investments, December 31, 2008 (continued)
|
| Franklin Strategic Income Securities Fund |
aRounds to less than 0.1% of net assets.
bThe principal amount is stated in U.S. dollars unless otherwise indicated.
cThe coupon rate shown represents the rate at period end.
dSee Note 1(f) regarding senior floating rate interests.
eA portion or all of the security purchased on a when-issued, delayed delivery, or TBA basis. See Note 1(c).
fIncome may be received in additional securities and/or cash.
gSee Note 10 regarding unfunded loan commitments.
hSee Note 9 regarding defaulted securities.
iSecurity was purchased pursuant to Rule 144A under the Securities Act of 1933 and may be sold in transactions exempt from registration only to qualified institutional buyers or in a public offering registered under the Securities Act of 1933. These securities have been deemed liquid under guidelines approved by the Trust’s Board of Trustees. At December 31, 2008, the aggregate value of these securities was $54,596,568, representing 5.48% of net assets.
jPerpetual security with no stated maturity date.
kPrincipal amount of security is adjusted for inflation. See Note 1(h).
lA supranational organization is an entity formed by two or more central governments through international treaties.
mThe principal amount is stated in original face, and scheduled paydowns are reflected in the market price on ex-date.
nSecurity was purchased pursuant to Regulation S under the Securities Act of 1933, which exempts from registration securities offered and sold outside of the United States. Such a security cannot be sold in the United States without either an effective registration statement filed pursuant to the Securities Act of 1933, or pursuant to an exemption from registration. This security has been deemed liquid under guidelines approved by the Trust’s Board of Trustees. At December 31, 2008, the aggregate value of these securities was $24,317,026, representing 2.44% of net assets.
oPrincipal amount is stated in 100 Mexican Peso Units.
pPrincipal amount is stated in 1,000 Brazilian Real Units.
qRedemption price at maturity is adjusted for inflation. See Note 1(h).
rThe security is traded on a discount basis with no stated coupon rate.
sSee Note 7 regarding investments in the Franklin Institutional Fiduciary Trust Money Market Portfolio. The rate shown is the annualized seven-day yield at period end.
The accompanying notes are an integral part of these financial statements.
FSI-26
Franklin Templeton Variable Insurance Products Trust
Financial Statements
Statement of Assets and Liabilities
December 31, 2008
| | | | |
| | | Franklin
Strategic Income
Securities Fund | |
Assets: | | | | |
Investments in securities: | | | | |
Cost - Unaffiliated issuers | | $ | 1,097,820,121 | |
Cost - Sweep Money Fund (Note 7) | | | 44,875,873 | |
| | | | |
Total cost of investments | | $ | 1,142,695,994 | |
| | | | |
Value - Unaffiliated issuers | | $ | 925,852,069 | |
Value - Sweep Money Fund (Note 7) | | | 44,875,873 | |
| | | | |
Total value of investments | | | 970,727,942 | |
Cash | | | 3,033,132 | |
Receivables: | | | | |
Investment securities sold | | | 7,008,553 | |
Capital shares sold | | | 521,490 | |
Dividends and interest | | | 12,272,027 | |
Unrealized appreciation on forward exchange contracts (Note 8) | | | 23,504,406 | |
| | | | |
Total assets | | | 1,017,067,550 | |
| | | | |
Liabilities: | | | | |
Payables: | | | | |
Investment securities purchased | | | 15,387,066 | |
Capital shares redeemed | | | 1,140,385 | |
Affiliates | | | 503,452 | |
Unrealized depreciation on forward exchange contracts (Note 8) | | | 3,456,137 | |
Unrealized depreciation on unfunded loan commitments (Note 10) | | | 41,742 | |
Accrued expenses and other liabilities | | | 259,315 | |
| | | | |
Total liabilities | | | 20,788,097 | |
| | | | |
Net assets, at value | | $ | 996,279,453 | |
| | | | |
Net assets consist of: | | | | |
Paid-in capital | | $ | 1,132,821,271 | |
Undistributed net investment income | | | 73,893,369 | |
Net unrealized appreciation (depreciation) | | | (152,110,911 | ) |
Accumulated net realized gain (loss) | | | (58,324,276 | ) |
| | | | |
Net assets, at value | | $ | 996,279,453 | |
| | | | |
The accompanying notes are an integral part of these financial statements.
FSI-27
Franklin Templeton Variable Insurance Products Trust
Financial Statements (continued)
Statement of Assets and Liabilities (continued)
December 31, 2008
| | | |
| | | Franklin
Strategic Income
Securities Fund |
Class 1: | | | |
Net assets, at value | | $ | 903,358,306 |
| | | |
Shares outstanding | | | 85,391,276 |
| | | |
Net asset value and maximum offering price per share | | $ | 10.58 |
| | | |
Class 2: | | | |
Net assets, at value | | $ | 33,154,998 |
| | | |
Shares outstanding | | | 3,185,430 |
| | | |
Net asset value and maximum offering price per share | | $ | 10.41 |
| | | |
Class 4: | | | |
Net assets, at value | | $ | 59,766,149 |
| | | |
Shares outstanding | | | 5,669,016 |
| | | |
Net asset value and maximum offering price per share | | $ | 10.54 |
| | | |
The accompanying notes are an integral part of these financial statements.
FSI-28
Franklin Templeton Variable Insurance Products Trust
Financial Statements (continued)
Statement of Operations
for the year ended December 31, 2008
| | | | |
| | | Franklin Strategic
Income
Securities Fund | |
Investment income: | | | | |
Dividends: | | | | |
Unaffiliated issuers | | $ | 1,722,252 | |
Sweep Money Fund (Note 7) | | | 413,583 | |
Interest | | | 69,273,145 | |
| | | | |
Total investment income | | | 71,408,980 | |
| | | | |
Expenses: | | | | |
Management fees (Note 3a) | | | 3,983,302 | |
Administrative fees (Note 3b) | | | 2,220,954 | |
Distribution fees: (Note 3c) | | | | |
Class 2 | | | 77,707 | |
Class 4 | | | 64,312 | |
Unaffiliated transfer agent fees | | | 1,249 | |
Custodian fees (Note 4) | | | 267,144 | |
Reports to shareholders | | | 125,825 | |
Registration and filing fees | | | 6,880 | |
Professional fees | | | 75,793 | |
Trustees’ fees and expenses | | | 5,269 | |
Other | | | 62,989 | |
| | | | |
Total expenses | | | 6,891,424 | |
Expense reductions (Note 4) | | | (10,364 | ) |
| | | | |
Net expenses | | | 6,881,060 | |
| | | | |
Net investment income | | | 64,527,920 | |
| | | | |
Realized and unrealized gains (losses): | | | | |
Net realized gain (loss) from: | | | | |
Investments | | | (48,425,370 | ) |
Foreign currency transactions | | | 2,493,369 | |
| | | | |
Net realized gain (loss) | | | (45,932,001 | ) |
| | | | |
Net change in unrealized appreciation (depreciation) on: | | | | |
Investments | | | (167,425,394 | ) |
Translation of other assets and liabilities denominated in foreign currencies | | | 18,182,757 | |
| | | | |
Net change in unrealized appreciation (depreciation) | | | (149,242,637 | ) |
| | | | |
Net realized and unrealized gain (loss) | | | (195,174,638 | ) |
| | | | |
Net increase (decrease) in net assets resulting from operations | | $ | (130,646,718 | ) |
| | | | |
The accompanying notes are an integral part of these financial statements.
FSI-29
Franklin Templeton Variable Insurance Products Trust
Financial Statements (continued)
Statements of Changes in Net Assets
| | | | | | | | |
| | | Franklin Strategic Income
Securities Fund | |
| | | Year Ended December 31, | |
| | | 2008 | | | 2007 | |
| | | | |
Increase (decrease) in net assets: | | | | | | | | |
Operations: | | | | | | | | |
Net investment income | | $ | 64,527,920 | | | $ | 58,545,747 | |
Net realized gain (loss) from investments and foreign currency transactions | | | (45,932,001 | ) | | | 22,587,818 | |
Net change in unrealized appreciation (depreciation) on investments and translation of other assets and liabilities denominated in foreign currencies | | | (149,242,637 | ) | | | (20,398,758 | ) |
| | | | |
Net increase (decrease) in net assets resulting from operations | | | (130,646,718 | ) | | | 60,734,807 | |
| | | | |
Distributions to shareholders from: | | | | | | | | |
Net investment income and net foreign currency gains: | | | | | | | | |
Class 1 | | | (75,447,333 | ) | | | (52,500,471 | ) |
Class 2 | | | (2,134,730 | ) | | | (878,649 | ) |
Class 4 | | | (378,318 | ) | | | — | |
Net realized gains: | | | | | | | | |
Class 1 | | | (2,612,141 | ) | | | (2,882,439 | ) |
Class 2 | | | (75,424 | ) | | | (50,064 | ) |
Class 4 | | | (13,098 | ) | | | — | |
| | | | |
Total distributions to shareholders | | | (80,661,044 | ) | | | (56,311,623 | ) |
| | | | |
Capital share transactions: (Note 2) | | | | | | | | |
Class 1 | | | 17,384,945 | | | | 180,376,622 | |
Class 2 | | | 14,711,199 | | | | 12,839,267 | |
Class 4 | | | 64,028,404 | | | | — | |
| | | | |
Total capital share transactions | | | 96,124,548 | | | | 193,215,889 | |
| | | | |
Net increase (decrease) in net assets | | | (115,183,214 | ) | | | 197,639,073 | |
Net assets: | | | | | | | | |
Beginning of year | | | 1,111,462,667 | | | | 913,823,594 | |
| | | | |
End of year | | $ | 996,279,453 | | | $ | 1,111,462,667 | |
| | | | |
Undistributed net investment income included in net assets: | | | | | | | | |
End of year | | $ | 73,893,369 | | | $ | 74,316,140 | |
| | | | |
The accompanying notes are an integral part of these financial statements.
FSI-30
Franklin Templeton Variable Insurance Products Trust
Notes to Financial Statements
Franklin Strategic Income Securities Fund
1. ORGANIZATION AND SIGNIFICANT ACCOUNTING POLICIES
Franklin Templeton Variable Insurance Products Trust (Trust) is registered under the Investment Company Act of 1940, as amended, (1940 Act) as an open-end investment company, consisting of twenty-three separate funds. The Franklin Strategic Income Securities Fund (Fund) is included in this report. The financial statements of the remaining funds in the Trust are presented separately. Shares of the Fund are sold only to insurance company separate accounts to fund the benefits of variable life insurance policies or variable annuity contracts. At December 31, 2008, 97.08% of the Fund’s shares were held through one insurance company. The Fund offers three classes of shares: Class 1, Class 2, and Class 4. Effective February 29, 2008, the Fund began offering a new class of shares, Class 4. Each class of shares differs by its distribution fees, voting rights on matters affecting a single class and its exchange privilege.
The following summarizes the Fund’s significant accounting policies.
a. Security Valuation
Securities listed on a securities exchange or on the NASDAQ National Market System are valued at the last quoted sale price or the official closing price of the day, respectively. Over-the-counter securities and listed securities for which there is no reported sale are valued within the range of the most recent quoted bid and ask prices. Securities that trade in multiple markets or on multiple exchanges are valued according to the broadest and most representative market. Investments in open-end mutual funds are valued at the closing net asset value.
Corporate debt securities, government securities, mortgage pass-through securities, other mortgage-backed securities, collateralized mortgage obligations and asset-backed securities generally trade in the over-the-counter market rather than on a securities exchange. The Trust may utilize independent pricing services, quotations from bond dealers, and information with respect to bond and note transactions, to assist in determining a current market value for each security. The Trust’s pricing services may use valuation models or matrix pricing which considers information with respect to comparable bond and note transactions, quotations from bond dealers, or by reference to other securities that are considered comparable in such characteristics as rating, interest rate and maturity date, option adjusted spread models, prepayment projections, interest rate spreads and yield curves, to determine current value.
Senior secured corporate loans with floating or variable interest rates generally trade in the over-the-counter market rather than on a securities exchange. The Trust may utilize independent pricing services, quotations from loan dealers and other financial institutions, and information with respect to bond and note transactions, to assist in determining a current market value for each security. The Trust’s pricing services use independent market quotations from loan dealers or financial institutions and may incorporate valuation methodologies that consider multiple bond characteristics such as dealer quotes, issuer type, coupon, maturity, weighted average maturity, interest rate spreads and yield curves, cash flow and credit risk/quality analysis, to determine current value.
Foreign securities are valued as of the close of trading on the foreign stock exchange on which the security is primarily traded, or the NYSE, whichever is earlier. If no sale is reported at that time, the foreign security will be valued within the range of the most recent quoted bid and ask prices. The value is then converted into its U.S. dollar equivalent at the foreign exchange rate in effect at the close of the NYSE on the day that the value of the foreign security is determined.
The Trust has procedures to determine the fair value of individual securities and other assets for which market prices are not readily available or which may not be reliably priced. Methods for valuing these securities may include: fundamental analysis, matrix pricing, discounts from market prices of similar securities, or discounts applied due to the nature and duration of restrictions on the disposition of the securities. Due to the inherent uncertainty of valuations of such securities, the fair values may differ significantly from the values that would have been used had a ready market for such investments existed. Occasionally, events occur between the time at which trading in a security is completed and the close of the NYSE that might call into question the availability (including the reliability) of the value of a portfolio security held by the Fund. The investment
FSI-31
Franklin Templeton Variable Insurance Products Trust
Notes to Financial Statements (continued)
Franklin Strategic Income Securities Fund
1. ORGANIZATION AND SIGNIFICANT ACCOUNTING POLICIES (continued)
a. Security Valuation (continued)
manager monitors price movements following the close of trading in foreign stock markets through a series of country specific market proxies (such as baskets of American Depository Receipts, futures contracts and exchange traded funds). These price movements are measured against established trigger thresholds for each specific market proxy to assist in determining if an event has occurred. If such an event occurs, the securities may be valued using fair value procedures, which may include the use of independent pricing services. All security valuation procedures are approved by the Trust’s Board of Trustees.
b. Foreign Currency Translation
Portfolio securities and other assets and liabilities denominated in foreign currencies are translated into U.S. dollars based on the exchange rate of such currencies against U.S. dollars on the date of valuation. Purchases and sales of securities, income and expense items denominated in foreign currencies are translated into U.S. dollars at the exchange rate in effect on the transaction date. Occasionally, events may impact the availability or reliability of foreign exchange rates used to convert the U.S. dollar equivalent value. If such an event occurs, the foreign exchange rate will be valued at fair value using procedures established and approved by the Trust’s Board of Trustees.
The Fund does not separately report the effect of changes in foreign exchange rates from changes in market prices on securities held. Such changes are included in net realized and unrealized gain or loss from investments on the Statement of Operations.
Realized foreign exchange gains or losses arise from sales of foreign currencies, currency gains or losses realized between the trade and settlement dates on securities transactions and the difference between the recorded amounts of dividends, interest, and foreign withholding taxes and the U.S. dollar equivalent of the amounts actually received or paid. Net unrealized foreign exchange gains and losses arise from changes in foreign exchange rates on foreign denominated assets and liabilities other than investments in securities held at the end of the reporting period.
c. Securities Purchased on a When-Issued, Delayed Delivery and TBA Basis
The Fund may purchase securities on a when-issued, delayed delivery and to-be-announced (TBA) basis, with payment and delivery scheduled for a future date. These transactions are subject to market fluctuations and are subject to the risk that the value at delivery may be more or less than the trade date purchase price. Although the Fund will generally purchase these securities with the intention of holding the securities, it may sell the securities before the settlement date. Sufficient assets have been segregated for these securities.
d. Foreign Currency Contracts
When the Fund purchases or sells foreign securities it may enter into foreign exchange contracts to minimize foreign exchange risk from the trade date to the settlement date of the transactions. A foreign exchange contract is an agreement between two parties to exchange different currencies at an agreed upon exchange rate at a future date. Realized and unrealized gains and losses on these contracts are included in the Statement of Operations.
The Fund may also enter into forward exchange contracts to hedge against fluctuations in foreign exchange rates or to gain exposure to certain foreign currencies. These contracts are valued daily by the Fund and the unrealized appreciation or depreciation on the contracts, as measured by the difference between the contractual forward foreign exchange rates and the forward rates at the reporting date, are included in the Statement of Assets and Liabilities. Realized and unrealized gains and losses on these contracts are included in the Statement of Operations.
FSI-32
Franklin Templeton Variable Insurance Products Trust
Notes to Financial Statements (continued)
Franklin Strategic Income Securities Fund
1. ORGANIZATION AND SIGNIFICANT ACCOUNTING POLICIES (continued)
d. Foreign Currency Contracts (continued)
The risks of these contracts include movement in the values of the foreign currencies relative to the U.S. dollar and the possible inability of the counterparties to fulfill their obligations under the contracts, which may be in excess of the amount reflected in the Statement of Assets and Liabilities.
e. Mortgage Dollar Rolls
The Fund may enter into mortgage dollar rolls, typically on a TBA basis. Mortgage dollar rolls are agreements between the Fund and a financial institution to simultaneously sell and repurchase mortgage-backed securities at a future date. Gains or losses are realized on the initial sale, and the difference between the repurchase price and the sale price is recorded as an unrealized gain or loss to the fund upon entering into the mortgage dollar roll. In addition, the Fund may invest the cash proceeds that are received from the initial sale. During the period between the sale and repurchase, the Fund is not entitled to principal and interest paid on the mortgage backed securities. The risks of mortgage dollar roll transactions include the potential inability of the counterparty to fulfill its obligations.
f. Senior Floating Rate Interests
Senior secured corporate loans pay interest at rates which are periodically reset by reference to a base lending rate plus a spread. These base lending rates are generally the prime rate offered by a designated U.S. bank or the London InterBank Offered Rate (LIBOR). Senior secured corporate loans often require prepayment of principal from excess cash flows or at the discretion of the borrower. As a result, actual maturity may be substantially less than the stated maturity.
Senior secured corporate loans in which the Fund invests are generally readily marketable, but may be subject to some restrictions on resale.
g. Income Taxes
No provision has been made for U.S. income taxes because it is the Fund’s policy to qualify as a regulated investment company under the Internal Revenue Code and to distribute to shareholders substantially all of its taxable income and net realized gains.
The Fund has reviewed the tax positions, taken on federal income tax returns, for each of the three open tax years and as of December 31, 2008, and has determined that no provision for income tax is required in the Fund’s financial statements.
h. Security Transactions, Investment Income, Expenses and Distributions
Security transactions are accounted for on trade date. Realized gains and losses on security transactions are determined on a specific identification basis. Interest income and estimated expenses are accrued daily. Amortization of premium and accretion of discount on debt securities are included in interest income. Facility fees are recognized as income over the expected term of the loan. Dividend income is recorded on the ex-dividend date. Distributions to shareholders are recorded on the ex-dividend date and are determined according to income tax regulations (tax basis). Distributable earnings determined on a tax basis may differ from earnings recorded in accordance with accounting principles generally accepted in the United States of America. These differences may be permanent or temporary. Permanent differences are reclassified among capital accounts to reflect their tax character. These reclassifications have no impact on net assets or the results of operations. Temporary differences are not reclassified, as they may reverse in subsequent periods.
FSI-33
Franklin Templeton Variable Insurance Products Trust
Notes to Financial Statements (continued)
Franklin Strategic Income Securities Fund
1. ORGANIZATION AND SIGNIFICANT ACCOUNTING POLICIES (continued)
h. Security Transactions, Investment Income, Expenses and Distributions (continued)
Common expenses incurred by the Trust are allocated among the funds based on the ratio of net assets of each fund to the combined net assets of the Trust. Fund specific expenses are charged directly to the fund that incurred the expense.
Realized and unrealized gains and losses and net investment income, not including class specific expenses, are allocated daily to each class of shares based upon the relative proportion of net assets of each class. Differences in per share distributions, by class, are generally due to differences in class specific expenses.
Inflation-indexed bonds provide an inflation hedge through periodic increases or decreases in the security’s interest accruals and principal redemption value, by amounts corresponding to the current rate of inflation. Any such adjustments, including adjustments to principal redemption value, are recorded as interest income.
i. Accounting Estimates
The preparation of financial statements in accordance with accounting principles generally accepted in the United States of America requires management to make estimates and assumptions that affect the reported amounts of assets and liabilities at the date of the financial statements and the amounts of income and expenses during the reporting period. Actual results could differ from those estimates.
j. Guarantees and Indemnifications
Under the Trust’s organizational documents, its officers and trustees are indemnified by the Trust against certain liabilities arising out of the performance of their duties to the Trust. Additionally, in the normal course of business, the Trust, on behalf of the Fund, enters into contracts with service providers that contain general indemnification clauses. The Trust’s maximum exposure under these arrangements is unknown as this would involve future claims that may be made against the Trust that have not yet occurred. Currently, the Trust expects the risk of loss to be remote.
2. SHARES OF BENEFICIAL INTEREST
At December 31, 2008, there were an unlimited number of shares authorized (without par value). Transactions in the Fund’s shares were as follows:
| | | | | | | | | | | | | | |
| | | Year Ended December 31, | |
| | | 2008a | | | 2007 | |
| Class 1 Shares: | | Shares | | | Amount | | | Shares | | | Amount | |
Shares sold | | 6,009,961 | | | $ | 75,187,150 | | | 11,675,973 | | | $ | 149,677,141 | |
Shares issued in reinvestment of distributions | | 6,504,956 | | | | 78,059,474 | | | 4,459,172 | | | | 55,382,910 | |
Shares redeemed | | (12,154,687 | ) | | | (135,861,679 | ) | | (1,960,490 | ) | | | (24,683,429 | ) |
| | | | |
Net increase (decrease) | | 360,230 | | | $ | 17,384,945 | | | 14,174,655 | | | $ | 180,376,622 | |
| | | | |
| Class 2 Shares: | | | | | | | | | | | | |
Shares sold | | 1,884,648 | | | $ | 21,711,802 | | | 1,114,032 | | | $ | 14,054,418 | |
Shares issued in reinvestment of distributions | | 186,984 | | | | 2,210,154 | | | 75,751 | | | | 928,713 | |
Shares redeemed | | (839,920 | ) | | | (9,210,757 | ) | | (171,480 | ) | | | (2,143,864 | ) |
| | | | |
Net increase (decrease) | | 1,231,712 | | | $ | 14,711,199 | | | 1,018,303 | | | $ | 12,839,267 | |
| | | | |
FSI-34
Franklin Templeton Variable Insurance Products Trust
Notes to Financial Statements (continued)
Franklin Strategic Income Securities Fund
2. SHARES OF BENEFICIAL INTEREST (continued)
| | | | | | | |
| | | Year Ended
December 31, | |
| | | 2008a | |
| Class 4 Shares: | | Shares | | | Amount | |
Shares sold | | 5,781,965 | | | $ | 65,263,343 | |
Shares issued on reinvestment of distributions | | 32,643 | | | | 391,067 | |
Shares redeemed | | (145,592 | ) | | | (1,626,006 | ) |
| | | | |
Net increase (decrease) | | 5,669,016 | | | $ | 64,028,404 | |
| | | | |
aFor | the period February 29, 2008 (effective date) to December 31, 2008 for Class 4. |
3. TRANSACTIONS WITH AFFILIATES
Franklin Resources, Inc. is the holding company for various subsidiaries that together are referred to as Franklin Templeton Investments. Certain officers and trustees of the Trust are also officers and/or directors of the following subsidiaries:
| | |
| Subsidiary | | Affiliation |
Franklin Advisers, Inc. (Advisers) | | Investment manager |
Franklin Templeton Services, LLC (FT Services) | | Administrative manager |
Franklin Templeton Distributors, Inc. (Distributors) | | Principal underwriter |
Franklin Templeton Investor Services, LLC (Investor Services) | | Transfer agent |
a. Management Fees
The Fund pays an investment management fee to Advisers based on the average daily net assets of the Fund as follows:
| | |
| Annualized Fee Rate | | Net Assets |
| 0.425% | | Up to and including $500 million |
| 0.325% | | Over $500 million, up to and including $1 billion |
| 0.280% | | Over $1 billion, up to and including $1.5 billion |
| 0.235% | | Over $1.5 billion, up to and including $6.5 billion |
| 0.215% | | Over $6.5 billion, up to and including $11.5 billion |
| 0.200% | | Over $11.5 billion, up to and including $16.5 billion |
| 0.190% | | Over $16.5 billion, up to and including $19 billion |
| 0.180% | | Over $19 billion, up to and including $21.5 billion |
| 0.170% | | In excess of $21.5 billion |
b. Administrative Fees
The Fund pays an administrative fee to FT Services of 0.20% per year of the average daily net assets of the Fund.
c. Distribution Fees
The Fund’s Board of Trustees has adopted distribution plans for Class 2 and Class 4 shares pursuant to Rule 12b-1 under the 1940 Act. Under the Fund’s compensation distribution plans, the Fund pays Distributors for costs incurred in connection with the servicing, sale and distribution of the Fund’s shares up to 0.25% and 0.35% per year of its average daily net assets of Class 2 and Class 4, respectively.
FSI-35
Franklin Templeton Variable Insurance Products Trust
Notes to Financial Statements (continued)
Franklin Strategic Income Securities Fund
3. TRANSACTIONS WITH AFFILIATES (continued)
d. Transfer Agent Fees
Investor Services, under terms of an agreement, performs shareholder servicing for the Fund and is not paid by the Fund for the services.
4. EXPENSE OFFSET ARRANGEMENT
The Fund has entered into an arrangement with its custodian whereby credits realized as a result of uninvested cash balances are used to reduce a portion of the Fund’s custodian expenses. During the year ended December 31, 2008, the custodian fees were reduced as noted in the Statement of Operations.
5. INCOME TAXES
For tax purposes, capital losses may be carried over to offset future capital gains, if any. At December 31, 2008, the Fund had tax basis capital losses of $40,554,464 expiring in 2016.
For tax purposes, realized capital losses and realized currency losses occurring subsequent to October 31, may be deferred and treated as occurring on the first day of the following fiscal year. At December 31, 2008, the Fund deferred realized capital losses and realized currency losses of $16,922,957 and $694,309, respectively.
The tax character of distributions paid during the years ended December 31, 2008 and 2007, was as follows:
| | | | | | |
| | | 2008 | | 2007 |
Distributions paid from: | | | | | | |
Ordinary income | | $ | 79,728,267 | | $ | 54,516,053 |
Long term capital gain | | | 932,777 | | | 1,795,570 |
| | | |
| | $ | 80,661,044 | | $ | 56,311,623 |
| | | |
At December 31, 2008, the cost of investments, net unrealized appreciation (depreciation), and undistributed ordinary income for income tax purposes were as follows:
| | | | |
Cost of investments | | $ | 1,144,972,541 | |
| | | | |
| |
Unrealized appreciation | | $ | 19,478,564 | |
Unrealized depreciation | | | (193,723,163 | ) |
| | | | |
Net unrealized appreciation (depreciation) | | $ | (174,244,599 | ) |
| | | | |
Distributable earnings – undistributed ordinary income | | $ | 94,192,828 | |
| | | | |
Net investment income differs for financial statement and tax purposes primarily due to differing treatments of defaulted securities, foreign currency transactions, mortgage dollar rolls, paydown losses, payments-in-kind, bond discounts and premiums, and inflation related adjustments on foreign securities.
Net realized gains (losses) differ for financial statement and tax purposes primarily due to differing treatments of wash sales, foreign currency transactions, mortgage dollar rolls, paydown losses, payments-in-kind, and bond discounts and premiums.
FSI-36
Franklin Templeton Variable Insurance Products Trust
Notes to Financial Statements (continued)
Franklin Strategic Income Securities Fund
6. INVESTMENT TRANSACTIONS
Purchases and sales of investments (excluding short term securities) for the year ended December 31, 2008, aggregated $592,821,293 and $504,252,493, respectively.
7. INVESTMENTS IN FRANKLIN INSTITUTIONAL FIDUCIARY TRUST MONEY MARKET PORTFOLIO
The Fund may invest in the Franklin Institutional Fiduciary Trust Money Market Portfolio (Sweep Money Fund), an open-end investment company managed by Advisers. Management fees paid by the Fund are reduced on assets invested in the Sweep Money Fund, in an amount not to exceed the management and administrative fees paid by the Sweep Money Fund.
8. FORWARD EXCHANGE CONTRACTS
At December 31, 2008, the Fund had the following forward exchange contracts outstanding:
| | | | | | | | | | | | | | |
| | | Contract
Amounta | | | Settlement
Date | | Unrealized
Appreciation | | Unrealized
Depreciation | |
| Contracts to Buy | | | | | | | | | | |
| 4,800,000,000 | | South Korean Won | | 4,455,315 | CHF | | 2/13/09 | | $ | — | | $ | (361,794 | ) |
| 16,200,000 | | Euro | | 20,982,970 | | | 3/04/09 | | | 1,619,205 | | | — | |
| 4,459,000 | | Euro | | 6,926,165 | | | 3/04/09 | | | — | | | (704,986 | ) |
| 7,800,000 | | Euro | | 10,030,410 | | | 3/16/09 | | | 849,061 | | | — | |
| 3,700,000 | | Euro | | 4,990,560 | | | 4/23/09 | | | 165,967 | | | — | |
| 3,380,000 | | Euro | | 4,901,169 | | | 5/29/09 | | | — | | | (194,090 | ) |
| 350,000,000 | | South Korean Won | | 321,251 | CHF | | 6/02/09 | | | — | | | (22,904 | ) |
| 4,300,000 | | Euro | | 6,039,350 | | | 6/03/09 | | | — | | | (51,669 | ) |
| 80,526,837 | | Russian Ruble | | 36,540,189 | MXN | | 7/01/09 | | | — | | | (271,018 | ) |
| 2,500,000 | | U.S. Dollar | | 1,625,678 | EUR | | 7/10/09 | | | 237,756 | | | — | |
| 3,000,000 | | U.S. Dollar | | 2,153,888 | EUR | | 9/17/09 | | | 5,041 | | | — | |
| 38,481,000 | | Chinese Yuan | | 5,609,475 | | | 9/23/09 | | | — | | | (111,544 | ) |
| 25,213,795 | | Russian Ruble | | 1,199,478 | AUD | | 9/24/09 | | | — | | | (151,614 | ) |
| 38,830,178 | | Russian Ruble | | 1,866,434 | AUD | | 9/28/09 | | | — | | | (248,397 | ) |
| 9,689,431,018 | | Viet Nam Dong | | 786,825 | AUD | | 10/07/09 | | | — | | | (18,304 | ) |
| 3,198,979 | | Chinese Yuan | | 691,178 | AUD | | 10/13/09 | | | — | | | (24,255 | ) |
| 3,285,166 | | Chinese Yuan | | 697,590 | AUD | | 10/19/09 | | | — | | | (16,225 | ) |
| 4,344,052 | | Chinese Yuan | | 628,025 | | | 10/23/09 | | | — | | | (7,208 | ) |
| 7,365,718 | | Chinese Yuan | | 1,059,186 | | | 10/26/09 | | | — | | | (6,467 | ) |
| 4,405,928 | | Chinese Yuan | | 628,969 | | | 10/27/09 | | | 746 | | | — | |
| 8,080,000 | | Swiss Franc | | 5,454,852 | EUR | | 10/27/09 | | | 46,942 | | | — | |
| | | | |
| Contracts to Sell | | | | | | | | | | |
| 35,467,487 | | Mexican Peso | | 123,540,352 | INR | | 1/27/09 | | | — | | | (27,838 | ) |
| 10,477,500,000 | | South Korean Won | | 12,073,913 | CHF | | 2/13/09 | | | 2,990,399 | | | — | |
| 26,512,592 | | Mexican Peso | | 2,356,256 | | | 2/27/09 | | | 457,530 | | | — | |
| 22,400,000 | | Euro | | 33,537,952 | | | 3/04/09 | | | 2,285,561 | | | — | |
| 3,620,000 | | Euro | | 550,909,700 | JPY | | 3/05/09 | | | 1,029,742 | | | — | |
| 3,620,000 | | Euro | | 556,748,760 | JPY | | 3/09/09 | | | 1,095,272 | | | — | |
| 11,000,000 | | Euro | | 16,782,150 | | | 3/16/09 | | | 1,439,307 | | | — | |
| 3,150,000 | | Euro | | 487,588,500 | JPY | | 4/06/09 | | | 994,134 | | | — | |
| 63,646,720 | | Mexican Peso | | 5,765,101 | | | 4/07/09 | | | 1,252,163 | | | — | |
| 1,072,248 | | U.S. Dollar | | 134,851,270 | KZT | | 4/17/09 | | | — | | | (42,242 | ) |
| 5,655,000 | | Euro | | 8,844,872 | | | 4/23/09 | | | 963,748 | | | — | |
FSI-37
Franklin Templeton Variable Insurance Products Trust
Notes to Financial Statements (continued)
Franklin Strategic Income Securities Fund
8. FORWARD EXCHANGE CONTRACTS (continued)
| | | | | | | | | | | | | | |
| | | Contract
Amounta | | | Settlement
Date | | Unrealized
Appreciation | | Unrealized
Depreciation | |
| Contracts to Sell | | | | | | | | | | | | |
| 2,505,000 | | Euro | | 396,729,375 | JPY | | 4/23/09 | | $ | 892,870 | | $ | — | |
| 8,000,000 | | Euro | | 12,306,560 | | | 5/29/09 | | | 1,165,545 | | | — | |
| 3,111,000,000 | | South Korean Won | | 3,136,405 | CHF | | 6/02/09 | | | 467,546 | | | — | |
| 3,050,000 | | British Pound Sterling | | 18,867,910 | MYR | | 6/03/09 | | | 1,010,269 | | | — | |
| 8,000,000 | | Euro | | 12,189,200 | | | 6/03/09 | | | 1,049,328 | | | — | |
| 783,874 | | Euro | | 3,911,766 | MYR | | 6/12/09 | | | 40,228 | | | — | |
| 47,681,503 | | Mexican Peso | | 2,156,825,128 | CLP | | 6/12/09 | | | — | | | (30,301 | ) |
| 3,868,000 | | Euro | | 5,914,365 | | | 6/15/09 | | | 529,562 | | | — | |
| 1,028,088 | | Euro | | 5,105,998 | MYR | | 6/15/09 | | | 45,806 | | | — | |
| 2,038,072 | | Euro | | 10,088,456 | MYR | | 6/16/09 | | | 81,160 | | | — | |
| 2,568,000,000 | | South Korean Won | | 2,603,934 | CHF | | 7/09/09 | | | 399,311 | | | — | |
| 507,000,000 | | South Korean Won | | 510,625 | CHF | | 7/24/09 | | | 75,563 | | | — | |
| 10,695,649 | | New Zealand Dollar | | 72,038,406,663 | IDR | | 8/04/09 | | | 13,789 | | | — | |
| 2,062,207 | | New Zealand Dollar | | 34,603,842 | RUB | | 8/12/09 | | | — | | | (222,851 | ) |
| 2,048,716 | | New Zealand Dollar | | 34,287,311 | RUB | | 8/14/09 | | | — | | | (224,592 | ) |
| 1,935,551 | | New Zealand Dollar | | 23,455,969,704 | VND | | 8/14/09 | | | 179,458 | | | — | |
| 2,166,048,000 | | South Korean Won | | 2,154,178 | CHF | | 8/28/09 | | | 296,945 | | | — | |
| 2,030,000 | | Euro | | 9,947,406 | MYR | | 9/03/09 | | | 61,478 | | | — | |
| 17,883,017 | | Mexican Peso | | 42,761,871 | RUB | | 9/17/09 | | | — | | | (64,778 | ) |
| Unrealized appreciation (depreciation) on offsetting forward exchange contracts | | | | | | | | 1,762,974 | | | (653,060 | ) |
| | | | | | | | | | | |
| Unrealized appreciation (depreciation) on forward exchange contracts | | | | | | | | 23,504,406 | | | (3,456,137 | ) |
| | | | | | | | | | | |
| Net unrealized appreciation (depreciation) on forward exchange contracts | | | | | | | $ | 20,048,269 | | | | |
| | | | | | | | | | | | | | |
aIn U.S. dollars unless otherwise indicated.
See Abbreviations on page FSI-40.
9. CREDIT RISK AND DEFAULTED SECURITIES
The Fund has 36.55% of its portfolio invested in high yield, senior secured floating rate notes, or other securities rated below investment grade. These securities may be more sensitive to economic conditions causing greater price volatility and are potentially subject to a greater risk of loss due to default than higher rated securities.
The Fund held defaulted securities and/or other securities for which the income has been deemed uncollectible. At December 31, 2008, the aggregate value of these securities was $1,459,116, representing 0.15% of the Fund’s net assets. The Fund discontinues accruing income on securities for which income has been deemed uncollectible and provides an estimate for losses on interest receivable. The securities have been identified on the accompanying Statement of Investments.
10. UNFUNDED LOAN COMMITMENTS
The Fund may enter into certain credit agreements, all or a portion of which may be unfunded. The Fund is obligated to fund these loan commitments at the borrowers’ discretion. Funded portions of credit agreements are presented on the Statement of Investments.
FSI-38
Franklin Templeton Variable Insurance Products Trust
Notes to Financial Statements (continued)
Franklin Strategic Income Securities Fund
10. UNFUNDED LOAN COMMITMENTS (continued)
At December 31, 2008, unfunded commitments were as follows:
| | | |
| Borrower | | Unfunded
Commitment |
Community Health Systems Inc., Delayed Draw Term Loan | | $ | 232,796 |
| | | |
Unfunded loan commitments and funded portions of credit agreements are marked to market daily and any unrealized appreciation or depreciation is included in the Statement of Assets and Liabilities and Statement of Operations.
11. FAIR VALUE MEASUREMENTS
The Fund adopted Financial Accounting Standards Board (FASB) Statement No. 157, “Fair Value Measurement” (SFAS 157), on January 1, 2008. SFAS 157 defines fair value, establishes a framework for measuring fair value, and expands disclosures about fair value measurements. The Fund has determined that the implementation of SFAS 157 did not have a material impact on the Fund’s financial statements.
SFAS 157 establishes a fair value hierarchy that distinguishes between market data obtained from independent sources (observable inputs) and the Fund’s own market assumptions (unobservable inputs). These inputs are used in determining the value of the Fund’s investments and are summarized in the following fair value hierarchy:
| | • | | Level 1 – quoted prices in active markets for identical securities |
| | • | | Level 2 – other significant observable inputs (including quoted prices for similar securities, interest rates, prepayment speed, credit risk, etc.) |
| | • | | Level 3 – significant unobservable inputs (including the Fund’s own assumptions in determining the fair value of investments) |
The inputs or methodology used for valuing securities are not an indication of the risk associated with investing in those securities.
The following is a summary of the inputs used as of December 31, 2008, in valuing the Fund’s assets and liabilities carried at fair value:
| | | | | | | | | | | | |
| | | Level 1 | | Level 2 | | Level 3 | | Total |
| | | |
Assets: | | | | | | | | | | | | |
Investments in Securities | | $ | 58,276,132 | | $ | 912,166,390 | | $ | 285,420 | | $ | 970,727,942 |
Other Financial Instrumentsa | | | — | | | 23,504,406 | | | — | | | 23,504,406 |
Liabilities: | | | | | | | | | | | | |
Other Financial Instrumentsa | | | — | | | 3,497,879 | | | — | | | 3,497,879 |
aOther financial instruments include net unrealized appreciation (depreciation) on forward exchange contracts and unfunded loan commitments.
FSI-39
Franklin Templeton Variable Insurance Products Trust
Notes to Financial Statements (continued)
Franklin Strategic Income Securities Fund
11. FAIR VALUE MEASUREMENTS (continued)
At December 31, 2008, the reconciliation of assets in which significant unobservable inputs (Level 3) were used in determining fair value, is as follows:
| | | |
| | | Investments In
Securities |
Beginning Balance – January 1, 2008 | | $ | — |
Net realized gain (loss) | | | — |
Net change in unrealized appreciation (depreciation) | | | — |
Net purchases (sales) | | | 285,420 |
Transfers in and/or out of Level 3 | | | — |
| | | |
Ending Balance | | $ | 285,420 |
| | | |
Net change in unrealized appreciation (depreciation)
attributable to assets still held at end of year | | $ | — |
| | | |
12. NEW ACCOUNTING PRONOUNCEMENT
In March 2008, FASB issued FASB Statement No. 161, “Disclosures about Derivative Instruments and Hedging Activities, an amendment of FASB Statement No. 133” (SFAS 161), which expands disclosures about derivative investments and hedging activities. SFAS 161 is effective for fiscal years and interim periods beginning after November 15, 2008. The Fund is currently evaluating the impact, if any, of applying the various provisions of SFAS 161.
13. SUBSEQUENT EVENT
On January 23, 2009, the Fund entered into, along with certain other funds managed by Franklin Templeton Investments (individually, “Borrower”; collectively “Borrowers”), a $725 million senior unsecured syndicated global line of credit (“Global Credit Facility”) to provide a source of funds to the Borrowers for temporary and emergency purposes and to meet future unanticipated or unusually large redemption requests.
Under the terms of the Global Credit Facility, each Borrower has agreed to pay its proportionate share of fees and expenses incurred in connection with the implementation and maintenance of the Global Credit Facility.
ABBREVIATIONS
Currency
AUD - Australian Dollar
BRL - Brazilian Real
CHF - Swiss Franc
CLP - Chilean Peso
EGP - Egyptian Pound
EUR - Euro
IDR - Indonesian Rupiah
INR - Indian Rupee
JPY - Japanese Yen
KRW - South Korean Won
KZT - Kazakhstan Tenge
MXN - Mexican Peso
MYR - Malaysian Ringgit
NZD - New Zealand Dollar
PLN - Polish Zloty
RUB - Russian Ruble
SEK - Swedish Krona
VND - Viet Nam Dong
Selected Portfolio
FHLMC - Federal Home Loan Mortgage Corp.
FNMA - Federal National Mortgage Association
FRN - Floating Rate Note
GNMA - Government National Mortgage Association
GO - General Obligation
L/C - Letter of Credit
MBIA - - Municipal Bond Investors Assurance Corp.
PIK - Payment-In-Kind
REIT - Real Estate Investment Trust
SF - Single Family
USD - Unified/Union School District
FSI-40
Franklin Templeton Variable Insurance Products Trust
Franklin Strategic Income Securities Fund
Report of Independent Registered Public Accounting Firm
To the Board of Trustees and Shareholders of
Franklin Templeton Variable Insurance Products Trust
In our opinion, the accompanying statement of assets and liabilities, including the statement of investments, and the related statements of operations and of changes in net assets and the financial highlights present fairly, in all material respects, the financial position of Franklin Strategic Income Securities Fund (one of the funds constituting the Franklin Templeton Variable Insurance Products Trust, hereafter referred to as the “Fund”) at December 31, 2008, the results of its operations for the year then ended, the changes in its net assets for each of the two years in the period then ended and the financial highlights for the periods presented, in conformity with accounting principles generally accepted in the United States of America. These financial statements and financial highlights (hereafter referred to as “financial statements”) are the responsibility of the Fund’s management. Our responsibility is to express an opinion on these financial statements based on our audits. We conducted our audits of these financial statements in accordance with the standards of the Public Company Accounting Oversight Board (United States). Those standards require that we plan and perform the audit to obtain reasonable assurance about whether the financial statements are free of material misstatement. An audit includes examining, on a test basis, evidence supporting the amounts and disclosures in the financial statements, assessing the accounting principles used and significant estimates made by management, and evaluating the overall financial statement presentation. We believe that our audits, which included confirmation of securities at December 31, 2008 by correspondence with the custodian and brokers, provide a reasonable basis for our opinion.
PricewaterhouseCoopers LLP
San Francisco, California
February 10, 2009
FSI-41
Franklin Templeton Variable Insurance Products Trust
Tax Designation (unaudited)
Franklin Strategic Income Securities Fund
Under Section 852(b)(3)(C) of the Internal Revenue Code, the Fund designates the maximum amount allowable but no less than $932,777 as a long term capital gain dividend for the fiscal year ended December 31, 2008.
FSI-42
FRANKLIN TEMPLETON VIP FOUNDING FUNDS ALLOCATION FUND
This annual report for Franklin Templeton VIP Founding Funds Allocation Fund covers the fiscal year ended December 31, 2008.
Performance Summary as of 12/31/08
Average annual total return of Class 1 shares* represents the average annual change in value, assuming reinvestment of dividends and capital gains. Average returns smooth out variations in returns, which can be significant; they are not the same as year-by-year results.
Periods ended 12/31/08
| | | | |
| | | 1-Year | | Since
Inception
(7/2/07) |
Average Annual Total Return | | -35.75% | | -28.93% |
*Effective 12/1/07, the administrator has contractually agreed to waive or limit its fee and to assume as its own expense certain expenses, otherwise payable by the Fund, excluding acquired funds’ fees and expenses, so that direct operating expenses of the Fund do not exceed 0.13% (other than certain non-routine expenses or costs, including those relating to litigation, indemnification, reorganizations and liquidations) until 4/30/09. If the administrator had not waived fees, the Fund’s total returns would have been lower.
Total Return Index Comparison for a Hypothetical $10,000 Investment (7/2/07–12/31/08)
The graph below shows the change in value of a hypothetical $10,000 investment in the Fund over the indicated period and includes reinvestment of any income or distributions. The Fund’s performance* is compared to the performance of the Standard & Poor’s 500 Index (S&P 500) and the Morgan Stanley Capital International (MSCI) World Index. One cannot invest directly in an index, nor is an index representative of the Fund’s portfolio. Please see Important Notes to Performance Information preceding the Fund Summaries.
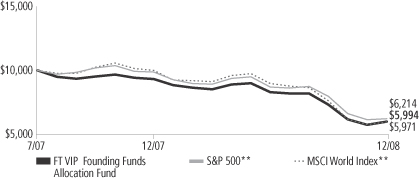
**Source: © 2009 Morningstar. Please see Index Descriptions following the Fund Summaries.
Franklin Templeton VIP Founding Funds Allocation Fund – Class 1
Performance reflects the Fund’s Class 1 operating expenses, but does not include any contract fees, expenses or sales charges. If they had been included, performance would be lower. These charges and deductions, particularly for variable life policies, can have a significant effect on contract values and insurance benefits. See the contract prospectus for a complete description of these expenses, including sales charges.
Performance data represent past performance, which does not guarantee future results. Investment return and principal value will fluctuate, and you may have a gain or loss when you sell your shares.
Current performance may differ from figures shown.
FFA-1
Fund Goals and Main Investments: Franklin Templeton VIP Founding Funds Allocation Fund seeks capital appreciation, with income as a secondary goal. The Fund normally invests equal portions in Class 1 shares of Franklin Income Securities Fund, Mutual Shares Securities Fund and Templeton Growth Securities Fund.
Performance Overview
You can find the Fund’s one-year total return in the Performance Summary. In comparison, the Fund’s benchmarks, the S&P 500 and the MSCI World Index, had total returns of -37.00% and -40.33% for the same period.1
Economic and Market Overview
In 2008, the U.S. economy faltered and The Conference Board’s Consumer Confidence Index fell to an all-time low since it began in 1967. The government’s abrupt conservatorship of Fannie Mae and Freddie Mac and the failure of several blue-chip banks and financial institutions roiled the equity markets. Despite government interventions and massive emergency funding, rapidly weakening manufacturing activity and falling home prices exacerbated the nation’s economic troubles. Jobless claims mounted and the unemployment rate rose to 7.2% by period-end.2 In early December, the National Bureau of Economic Research officially declared the U.S. economy has been in recession since December 2007.
The weakening U.S. economy negatively impacted growth prospects around the world. Although growth in the first half of the year was robust in developing economies, particularly in Asia, signs of a global slowdown surfaced in the latter half. In an environment of extremely high commodity prices that increased inflationary pressure, the world’s monetary authorities faced the choice of lowering short-term interest rates to stimulate growth or raising them to fight rising inflation. Stimulus provided through fiscal and monetary policies implemented around the globe sought to restore financial market stability and reignite economic growth.
1. Source: © 2009 Morningstar. One cannot invest directly in an index, nor is an index representative of the Fund’s portfolio. Please see Index Descriptions following the Fund Summaries.
2. Source: Bureau of Labor Statistics.
Fund Risks: Because the Fund invests in underlying funds that may engage in a variety of investment strategies involving certain risks, this Fund may be subject to those same risks. Investments in stocks offer the potential for long-term gains but can be subject to short-term price fluctuations. Because the underlying funds invest in bonds and other debt obligations, the Fund’s share price and yield will be affected by interest rate movements. Bond prices generally move in the opposite direction from interest rates. Thus, as prices of bonds in the Fund adjust to a rise in interest rates, the Fund’s share price may decline. High yield, lower-rated (junk) bonds generally have greater price swings and higher default risks than investment grade bonds. Foreign investing, especially in emerging markets, involves additional risks, including currency fluctuations, economic instability, market volatility, and political and social instability. The Fund’s prospectus also includes a description of the main investment risks.
FFA-2
The U.S. Treasury and the Federal Reserve Board took unprecedented steps, including lowering short-term rates to near 0% from 4.25%. The European Central Bank and many of the world’s other central banks had raised rates due to inflationary pressures. Later in the year, the potential for global recession trumped inflationary concerns, and the world’s monetary authorities cut interest rates aggressively. The U.S. dollar, which had declined earlier in the period versus many of the world’s currencies, regained ground quickly toward period-end as a flight to the relative safety of U.S. Treasuries prevailed.
In this challenging economic time, volatility came to define global equity markets. Virtually all local indexes ended the 12-month period with marked losses. Despite negative economic data and an outlook for decelerating corporate earnings and profit margins globally, many companies outside the financials sector retained relatively strong balance sheets.
Investment Strategy
The Fund invests its assets in an equally weighted combination of Franklin Income Securities Fund, Mutual Shares Securities Fund and Templeton Growth Securities Fund. These underlying funds, in turn, invest in a variety of U.S. and foreign equity securities and, to a lesser extent, fixed income and money market securities. As market conditions affect the underlying funds, we rebalance the Fund’s allocations seeking to maintain equal weightings of approximately 33 1/ 3% of total net assets in each underlying fund whenever the actual allocations exceed plus or minus 3% of the fixed allocation percentages.
Manager’s Discussion
The Fund’s performance can be attributed largely to its allocation among the underlying funds and their investments in domestic and foreign equities, fixed income securities, and short-term investments and other net assets.
During the fiscal year under review, Fund performance was hindered by Templeton Growth Securities Fund – Class 1, which underperformed the MSCI World Index. Mutual Shares Securities Fund – Class 1 performed comparably to the S&P 500, while Franklin Income Securities Fund – Class 1 performed better than the S&P 500.
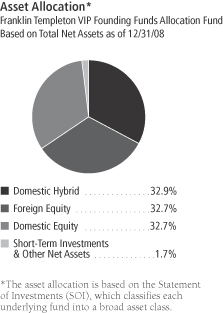
The dollar value, number of shares or principal amount, and names of all portfolio holdings are listed in the Fund’s SOI.
FFA-3
Thank you for your participation in Franklin Templeton VIP Founding Funds Allocation Fund. We look forward to serving your future investment needs.
The foregoing information reflects our analysis, opinions and portfolio holdings as of December 31, 2008, the end of the reporting period. The way we implement our main investment strategies and the resulting portfolio holdings may change depending on factors such as market and economic conditions. These opinions may not be relied upon as investment advice or an offer for a particular security. The information is not a complete analysis of every aspect of any market, country, industry, security or the Fund. Statements of fact are from sources considered reliable, but the investment manager makes no representation or warranty as to their completeness or accuracy. Although historical performance is no guarantee of future results, these insights may help you understand our investment management philosophy.
FFA-4
Fund Expenses
As an investor in a variable insurance contract (Contract) that indirectly provides for investment in an underlying mutual fund, you can incur transaction and/or ongoing expenses at both the Fund level and the Contract level.
| • | | Transaction expenses can include sales charges (loads) on purchases, redemption fees, surrender fees, transfer fees and premium taxes. |
| • | | Ongoing expenses can include management fees, distribution and service (12b-1) fees, contract fees, annual maintenance fees, mortality and expense risk fees and other fees and expenses. All mutual funds and Contracts have some types of ongoing expenses. |
The expenses shown in the table are meant to highlight ongoing expenses at the Fund level only and do not include ongoing expenses at the Contract level, or transaction expenses at either the Fund or Contract level. While the Fund does not have transaction expenses, if the transaction and ongoing expenses at the Contract level were included, the expenses shown would be higher. You should consult your Contract prospectus or disclosure document for more information.
The table shows Fund-level ongoing expenses and can help you understand these expenses and compare them with those of other mutual funds offered through the Contract. The table assumes a $1,000 investment held for the six months indicated. Please refer to the Fund prospectus for additional information on operating expenses.
Actual Fund Expenses
The first line (Actual) of the table provides actual account values and expenses. The “Ending Account Value” is derived from the Fund’s actual return, which includes the effect of ongoing Fund expenses, but does not include the effect of ongoing Contract expenses.
You can estimate the Fund-level expenses you incurred during the period by following these steps. Of course, your account value and expenses will differ from those in this illustration:
| 1. | Divide your account value by $1,000. |
If an account had an $8,600 value, then $8,600 ÷ $1,000 = 8.6.
| 2. | Multiply the result by the number under the heading “Fund-Level Expenses Incurred During Period.” |
If Fund-Level Expenses Incurred During Period were $7.50, then 8.6 x $7.50 = $64.50.
In this illustration, the estimated expenses incurred this period at the Fund level are $64.50.
Franklin Templeton VIP Founding Funds Allocation Fund – Class 1
FFA-5
Hypothetical Example for Comparison with Other Mutual Funds
Information in the second line (Hypothetical) of the table can help you compare ongoing expenses of the Fund with those of other mutual funds offered through the Contract. This information may not be used to estimate the actual ending account balance or expenses you incurred during the period. The hypothetical “Ending Account Value” is based on the Fund’s actual expense ratio and an assumed 5% annual rate of return before expenses, which does not represent the Fund’s actual return. The figure under the heading “Fund-Level Expenses Incurred During Period” shows the hypothetical expenses your account would have incurred under this scenario. You can compare this figure with the 5% hypothetical examples that appear in shareholder reports of other funds offered through a Contract.
| | | | | | | | | | | | |
| Class 1 | | Beginning
Account Value 7/1/08 | | Ending
Account
Value 12/31/08* | | Fund-Level
Expenses Incurred
During Period
7/1/08–12/31/08* | | Fund-Level
Expenses Incurred
During Period
7/1/08–12/31/08** |
Actual | | $ | 1,000 | | $ | 723.10 | | $ | 0.56 | | $ | 3.38 |
Hypothetical (5% return before expenses) | | $ | 1,000 | | $ | 1,024.48 | | $ | 0.66 | | $ | 3.96 |
*Expenses are calculated using the most recent six-month annualized expense ratio excluding expenses of the underlying funds, net of expense waiver, for the Fund’s Class 1 shares (0.13%), which does not include any ongoing expenses of the Contract for which the Fund is an investment option, multiplied by the average account value over the period, multiplied by 184/366 to reflect the one-half year period.
**Expenses are calculated using the most recent six-month annualized expense ratio including expenses of the underlying funds, net of expense waiver, for the Fund’s Class 1 shares (0.78%), which does not include any ongoing expenses of the Contract for which the Fund is an investment option, multiplied by the average account value over the period, multiplied by 184/366 to reflect the one-half year period.
FFA-6
THIS PAGE HAS BEEN INTENTIONALLY LEFT BLANK
Franklin Templeton Variable Insurance Products Trust
Financial Highlights
Franklin Templeton VIP Founding Funds Allocation Fund
| | | | | | | | |
| | | Year Ended
December 31, | |
| Class 1 | | 2008 | | | 2007a | |
| | | | |
Per share operating performance | | | | | | | | |
(for a share outstanding throughout the year) | | | | | | | | |
Net asset value, beginning of year | | $ | 9.33 | | | $ | 10.00 | |
| | | | |
Income from investment operationsb: | | | | | | | | |
Net investment income (loss)c,d | | | 0.28 | | | | (0.19 | ) |
Net realized and unrealized gains (losses) | | | (3.64 | ) | | | (0.48 | ) |
| | | | |
Total from investment operations | | | (3.36 | ) | | | (0.67 | ) |
| | | | |
Less distributions from: | | | | | | | | |
Net investment income | | | (0.19 | ) | | | — | |
Net realized gains | | | (0.17 | ) | | | — | |
| | | | |
Total distributions | | | (0.36 | ) | | | — | |
| | | | |
Net asset value, end of year | | $ | 5.61 | | | $ | 9.33 | |
| | | | |
| | |
Total returne | | | (35.75)% | | | | (6.70)% | |
Ratios to average net assetsf | | | | | | | | |
Expensesg | | | 0.13% | h | | | 0.41% | |
Net investment income (loss) | | | 3.81% | | | | (0.41)% | |
| | |
Supplemental data | | | | | | | | |
Net assets, end of year (000’s) | | $ | 339 | | | $ | 466 | |
Portfolio turnover rate | | | 22.09% | | | | 0.04% | |
aFor the period July 2, 2007 (commencement of operations) to December 31, 2007.
bThe amount shown for a share outstanding throughout the period may not correlate with the Statement of Operations for the period due to the timing of sales and repurchases of the Fund shares in relation to income earned and/or fluctuating market value of the investments of the Fund.
cBased on average daily shares outstanding.
dRecognition of net investment income by the Fund is affected by the timing of declaration of dividends by the Underlying Funds in which the Fund invests.
eTotal return does not include any fees, charges or expenses imposed by the variable annuity and life insurance contracts for which the Franklin Templeton Variable Insurance Products Trust serves as an underlying investment vehicle. Total return is not annualized for periods less than one year.
fRatios are annualized for periods less than one year.
gDoes not include expenses of the Underlying Funds in which the Fund invests. The annualized weighted average expense ratio of the Underlying Funds was 0.65% for the year ended December 31, 2008.
hBenefit of waiver and payment by affiliate rounds to less than 0.01%.
The accompanying notes are an integral part of these financial statements.
FFA-8
Franklin Templeton Variable Insurance Products Trust
Financial Highlights (continued)
Franklin Templeton VIP Founding Funds Allocation Fund
| | | | | | | | |
| | | Year Ended
December 31, | |
| Class 2 | | 2008 | | | 2007a | |
| | | | |
Per share operating performance | | | | | | | | |
(for a share outstanding throughout the year) | | | | | | | | |
Net asset value, beginning of year | | $ | 9.31 | | | $ | 10.00 | |
| | | | |
Income from investment operationsb: | | | | | | | | |
Net investment income (loss)c,d | | | 0.27 | | | | (0.03 | ) |
Net realized and unrealized gains (losses) | | | (3.63 | ) | | | (0.66 | ) |
| | | | |
Total from investment operations | | | (3.36 | ) | | | (0.69 | ) |
| | | | |
Less distributions from: | | | | | | | | |
Net investment income | | | (0.17 | ) | | | — | |
Net realized gains | | | (0.17 | ) | | | — | |
| | | | |
Total distributions | | | (0.34 | ) | | | — | |
| | | | |
Net asset value, end of year | | $ | 5.61 | | | $ | 9.31 | |
| | | | |
| | |
Total returne | | | (35.87)% | | | | (6.90)% | |
Ratios to average net assetsf | | | | | | | | |
Expensesg | | | 0.38% | h | | | 0.66% | |
Net investment income (loss) | | | 3.56% | | | | (0.66)% | |
| | |
Supplemental data | | | | | | | | |
Net assets, end of year (000’s) | | $ | 338,320 | | | $ | 131,710 | |
Portfolio turnover rate | | | 22.09% | | | | 0.04% | |
aFor the period July 2, 2007 (commencement of operations) to December 31, 2007.
bThe amount shown for a share outstanding throughout the period may not correlate with the Statement of Operations for the period due to the timing of sales and repurchases of the Fund shares in relation to income earned and/or fluctuating market value of the investments of the Fund.
cBased on average daily shares outstanding.
dRecognition of net investment income by the Fund is affected by the timing of declaration of dividends by the Underlying Funds in which the Fund invests.
eTotal return does not include any fees, charges or expenses imposed by the variable annuity and life insurance contracts for which the Franklin Templeton Variable Insurance Products Trust serves as an underlying investment vehicle. Total return is not annualized for periods less than one year.
fRatios are annualized for periods less than one year.
gDoes not include expenses of the Underlying Funds in which the Fund invests. The annualized weighted average expense ratio of the Underlying Funds was 0.65% for the year ended December 31, 2008.
hBenefit of waiver and payment by affiliate rounds to less than 0.01%.
The accompanying notes are an integral part of these financial statements.
FFA-9
Franklin Templeton Variable Insurance Products Trust
Financial Highlights (continued)
Franklin Templeton VIP Founding Funds Allocation Fund
| | | | |
| Class 4 | | Period Ended
December 31,
2008a | |
Per share operating performance | | | | |
(for a share outstanding throughout the period) | | | | |
Net asset value, beginning of period | | $ | 8.65 | |
| | | | |
Income from investment operationsb: | | | | |
Net investment incomec,d | | | 0.19 | |
Net realized and unrealized gains (losses) | | | (2.87 | ) |
| | | | |
Total from investment operations | | | (2.68 | ) |
| | | | |
Less distributions from: | | | | |
Net investment income | | | (0.18 | ) |
Net realized gains | | | (0.17 | ) |
| | | | |
Total distributions | | | (0.35 | ) |
| | | | |
Net asset value, end of period | | $ | 5.62 | |
| | | | |
| |
Total returne | | | (30.81)% | |
Ratios to average net assetsf | | | | |
Expensesg,h | | | 0.48% | |
Net investment income | | | 3.46% | |
| |
Supplemental data | | | | |
Net assets, end of period (000’s) | | $ | 263,001 | |
Portfolio turnover rate | | | 22.09% | |
aFor the period February 29, 2008 (effective date) to December 31, 2008.
bThe amount shown for a share outstanding throughout the period may not correlate with the Statement of Operations for the period due to the timing of sales and repurchases of the Fund shares in relation to income earned and/or fluctuating market value of the investments of the Fund.
cBased on average daily shares outstanding.
dRecognition of net investment income by the Fund is affected by the timing of declaration of dividends by the Underlying Funds in which the Fund invests.
eTotal return does not include any fees, charges or expenses imposed by the variable annuity and life insurance contracts for which the Franklin Templeton Variable Insurance Products Trust serves as an underlying investment vehicle. Total return is not annualized for periods less than one year.
fRatios are annualized for periods less than one year.
gDoes not include expenses of the Underlying Funds in which the Fund invests. The annualized weighted average expense ratio of the Underlying Funds was 0.65% for the period ended December 31, 2008.
hBenefit of waiver and payment by affiliate rounds to less than 0.01%.
The accompanying notes are an integral part of these financial statements.
FFA-10
Franklin Templeton Variable Insurance Products Trust
Statement of Investments, December 31, 2008
| | | | | |
| Franklin Templeton VIP Founding Funds Allocation Fund | | Shares | | Value |
Investments in Underlying Funds 98.3%a | | | | | |
Domestic Equity 32.7% | | | | | |
Mutual Shares Securities Fund, Class 1 | | 16,488,990 | | $ | 196,548,762 |
| | | | | |
Domestic Hybrid 32.9% | | | | | |
Franklin Income Securities Fund, Class 1 | | 17,164,578 | | | 197,907,583 |
| | | | | |
Foreign Equity 32.7% | | | | | |
Templeton Growth Securities Fund, Class 1 | | 23,615,076 | | | 196,949,736 |
| | | | | |
Total Investments in Underlying Funds (Cost $780,105,439) 98.3% | | | | | 591,406,081 |
Other Assets, less Liabilities 1.7% | | | | | 10,254,246 |
| | | | | |
Net Assets 100.0% | | | | $ | 601,660,327 |
| | | | | |
aSee Note 6 regarding investments in Underlying Funds.
The accompanying notes are an integral part of these financial statements.
FFA-11
Franklin Templeton Variable Insurance Products Trust
Financial Statements
Statement of Assets and Liabilities
December 31, 2008
| | | | |
| | | Franklin Templeton
VIP Founding
Funds Allocation
Fund | |
Assets: | | | | |
Investments in Underlying Funds (Note 6): | | | | |
Cost | | $ | 780,105,439 | |
| | | | |
Value | | $ | 591,406,081 | |
Cash | | | 8,235,628 | |
Receivables from capital shares sold | | | 2,384,618 | |
| | | | |
Total assets | | | 602,026,327 | |
| | | | |
Liabilities: | | | | |
Payables: | | | | |
Capital shares redeemed | | | 3,086 | |
Affiliates | | | 308,329 | |
Reports to shareholders | | | 31,658 | |
Professional fees | | | 21,179 | |
Accrued expenses and other liabilities | | | 1,748 | |
| | | | |
Total liabilities | | | 366,000 | |
| | | | |
Net assets, at value | | $ | 601,660,327 | |
| | | | |
Net assets consist of: | | | | |
Paid-in capital | | $ | 834,303,884 | |
Undistributed net investment income | | | 298,781 | |
Net unrealized appreciation (depreciation) | | | (188,699,358 | ) |
Accumulated net realized gain (loss) | | | (44,242,980 | ) |
| | | | |
Net assets, at value | | $ | 601,660,327 | |
| | | | |
Class 1: | | | | |
Net assets, at value | | $ | 339,237 | |
| | | | |
Shares outstanding | | | 60,420 | |
| | | | |
Net asset value and maximum offering price per share | | $ | 5.61 | |
| | | | |
Class 2: | | | | |
Net assets, at value | | $ | 338,320,164 | |
| | | | |
Shares outstanding | | | 60,345,825 | |
| | | | |
Net asset value and maximum offering price per share | | $ | 5.61 | |
| | | | |
Class 4: | | | | |
Net assets, at value | | $ | 263,000,926 | |
| | | | |
Shares outstanding | | | 46,831,744 | |
| | | | |
Net asset value and maximum offering price per share | | $ | 5.62 | |
| | | | |
The accompanying notes are an integral part of these financial statements.
FFA-12
Franklin Templeton Variable Insurance Products Trust
Financial Statements (continued)
Statement of Operations
for the year ended December 31, 2008
| | | | |
| | | Franklin
Templeton VIP
Founding Funds
Allocation Fund | |
Investment income: | | | | |
Dividends from Underlying Funds (Note 6) | | $ | 14,821,741 | |
| | | | |
Expenses: | | | | |
Administrative fees (Note 3a) | | | 374,990 | |
Distribution fees: (Note 3b) | | | | |
Class 2 | | | 711,406 | |
Class 4 | | | 320,786 | |
Unaffiliated transfer agent fees | | | 882 | |
Reports to shareholders | | | 56,273 | |
Registration and filing fees | | | 4,721 | |
Professional fees | | | 24,065 | |
Trustees’ fees and expenses | | | 1,368 | |
Amortization of offering costs | | | 12,615 | |
Other | | | 8,355 | |
| | | | |
Total expenses | | | 1,515,461 | |
Expenses waived/paid by affiliates (Note 3d) | | | (16,530 | ) |
| | | | |
Net expenses | | | 1,498,931 | |
| | | | |
Net investment income | | | 13,322,810 | |
| | | | |
Realized and unrealized gains (losses): | | | | |
Net realized gain (loss) from: | | | | |
Sale of investments in Underlying Funds | | | (44,217,326 | ) |
Realized gain distributions by Underlying Funds | | | 18,279,959 | |
| | | | |
Net realized gain (loss) from Underlying Funds | | | (25,937,367 | ) |
| | | | |
Net change in unrealized appreciation (depreciation) on investments in Underlying Funds | | | (187,235,978 | ) |
| | | | |
Net realized and unrealized gain (loss) | | | (213,173,345 | ) |
| | | | |
Net increase (decrease) in net assets resulting from operations | | $ | (199,850,535 | ) |
| | | | |
The accompanying notes are an integral part of these financial statements.
FFA-13
Franklin Templeton Variable Insurance Products Trust
Financial Statements (continued)
Statements of Changes in Net Assets
| | | | | | | | |
| | | Franklin Templeton VIP Founding
Funds Allocation Fund | |
| | | Year Ended December 31, | |
| | | 2008 | | | 2007a | |
| | | | |
Increase (decrease) in net assets: | | | | | | | | |
Operations: | | | | | | | | |
Net investment income (loss) | | $ | 13,322,810 | | | $ | (132,435 | ) |
Net realized gain (loss) from Underlying Funds | | | (25,937,367 | ) | | | (950 | ) |
Net change in unrealized appreciation (depreciation) on investments in Underlying Funds | | | (187,235,978 | ) | | | (1,463,380 | ) |
| | | | |
Net increase (decrease) in net assets resulting from operations | | | (199,850,535 | ) | | | (1,596,765 | ) |
| | | | |
Distributions to shareholders from: | | | | | | | | |
Net investment income: | | | | | | | | |
Class 1 | | | (10,512 | ) | | | — | |
Class 2 | | | (9,341,768 | ) | | | — | |
Class 4 | | | (6,456,197 | ) | | | — | |
Net realized gains: | | | | | | | | |
Class 1 | | | (9,690 | ) | | | — | |
Class 2 | | | (9,265,863 | ) | | | — | |
Class 4 | | | (6,240,747 | ) | | | — | |
| | | | |
Total distributions to shareholders | | | (31,324,777 | ) | | | — | |
| | | | |
Capital share transactions: (Note 2) | | | | | | | | |
Class 1 | | | 90,126 | | | | 500,000 | |
Class 2 | | | 361,467,772 | | | | 133,273,194 | |
Class 4 | | | 339,101,312 | | | | — | |
| | | | |
Total capital share transactions | | | 700,659,210 | | | | 133,773,194 | |
| | | | |
Net increase (decrease) in net assets | | | 469,483,898 | | | | 132,176,429 | |
Net assets: | | | | | | | | |
Beginning of year | | | 132,176,429 | | | | — | |
| | | | |
End of year | | $ | 601,660,327 | | | $ | 132,176,429 | |
| | | | |
Undistributed net investment income included in net assets: | | | | | | | | |
End of year | | $ | 298,781 | | | $ | — | |
| | | | |
aFor the period July 2, 2007 (commencement of operations) to December 31, 2007.
The accompanying notes are an integral part of these financial statements.
FFA-14
Franklin Templeton Variable Insurance Products Trust
Notes to Financial Statements
Franklin Templeton VIP Founding Funds Allocation Fund
1. ORGANIZATION AND SIGNIFICANT ACCOUNTING POLICIES
Franklin Templeton Variable Insurance Products Trust (Trust) is registered under the Investment Company Act of 1940, as amended, (1940 Act) as an open-end investment company, consisting of twenty-three separate funds. The Franklin Templeton VIP Founding Funds Allocation Fund (Fund) is included in this report. The financial statements of the remaining funds in the Trust are presented separately. Shares of the Fund are sold only to insurance company separate accounts to fund the benefits of variable life insurance policies or variable annuity contracts. The Fund offers three classes of shares: Class 1, Class 2, and Class 4. Effective February 29, 2008, the Fund began offering a new class of shares, Class 4. Each class of shares differs by its distribution fees, voting rights on matters affecting a single class and its exchange privilege.
The following summarizes the Fund’s significant accounting policies.
a. Security Valuation
Net asset value per share is calculated as of the close of trading of the NYSE. Investments in the Underlying Funds are valued at their closing net asset value each trading day.
b. Income Taxes
No provision has been made for U.S. income taxes because it is the Fund’s policy to qualify as a regulated investment company under the Internal Revenue Code and to distribute to shareholders substantially all of its taxable income and net realized gains.
The Fund has reviewed the tax positions, taken on federal income tax returns, for the open tax year and as of December 31, 2008, and has determined that no provision for income tax is required in the Fund’s financial statements.
c. Security Transactions, Investment Income, Expenses and Distributions
Security transactions are accounted for on trade date. Realized gains and losses on security transactions are determined on a specific identification basis. Estimated expenses are accrued daily. Dividend income and realized gain distributions by Underlying Funds are recorded on the ex-dividend date. Distributions to shareholders are recorded on the ex-dividend date and are determined according to income tax regulations (tax basis). Distributable earnings determined on a tax basis may differ from earnings recorded in accordance with accounting principles generally accepted in the United States of America. These differences may be permanent or temporary. Permanent differences are reclassified among capital accounts to reflect their tax character. These reclassifications have no impact on net assets or the results of operations. Temporary differences are not reclassified, as they may reverse in subsequent periods.
Common expenses incurred by the Trust are allocated among the funds based on the ratio of net assets of each fund to the combined net assets of the Trust. Fund specific expenses are charged directly to the fund that incurred the expense.
The Fund indirectly bears its proportionate share of expenses from the Underlying Funds. Since the Underlying Funds have varied expense levels and the Fund may own different proportions of the Underlying Funds at different times, the amount of expenses incurred indirectly by the Fund will vary.
Realized and unrealized gains and losses and net investment income, not including class specific expenses, are allocated daily to each class of shares based upon the relative proportion of net assets of each class. Differences in per share distributions, by class, are generally due to differences in class specific expenses.
d. Offering Costs
Offering costs are amortized on a straight line basis over twelve months.
FFA-15
Franklin Templeton Variable Insurance Products Trust
Notes to Financial Statements (continued)
Franklin Templeton VIP Founding Funds Allocation Fund
1. ORGANIZATION AND SIGNIFICANT ACCOUNTING POLICIES (continued)
e. Accounting Estimates
The preparation of financial statements in accordance with accounting principles generally accepted in the United States of America requires management to make estimates and assumptions that affect the reported amounts of assets and liabilities at the date of the financial statements and the amounts of income and expenses during the reporting period. Actual results could differ from those estimates.
f. Guarantees and Indemnifications
Under the Trust’s organizational documents, its officers and trustees are indemnified by the Trust against certain liabilities arising out of the performance of their duties to the Trust. Additionally, in the normal course of business, the Trust on behalf of the Fund, enters into contracts with service providers that contain general indemnification clauses. The Trust’s maximum exposure under these arrangements is unknown as this would involve future claims that may be made against the Trust that have not yet occurred. Currently, the Trust expects the risk of loss to be remote.
2. SHARES OF BENEFICIAL INTEREST
At December 31, 2008, there were an unlimited number of shares authorized (without par value). Transactions in the Fund’s shares were as follows:
| | | | | | | | | | | | | | |
| | | Year Ended December 31, | |
| | | 2008a | | | 2007b | |
| Class 1 Shares: | | Shares | | | Amount | | | Shares | | | Amount | |
Shares sold | | 13,307 | | | $ | 107,831 | | | 50,000 | | | $ | 500,000 | |
Shares issued in reinvestment of distributions | | 3,776 | | | | 20,201 | | | — | | | | — | |
Shares redeemed | | (6,663 | ) | | | (37,906 | ) | | — | | | | — | |
| | | | |
Net increase (decrease) | | 10,420 | | | $ | 90,126 | | | 50,000 | | | $ | 500,000 | |
| | | | |
| Class 2 Shares: | | | | | | | | | | | | |
Shares sold | | 47,997,548 | | | $ | 380,425,736 | | | 14,284,933 | | | $ | 134,614,945 | |
Shares issued in reinvestment of distributions | | 3,484,575 | | | | 18,607,631 | | | — | | | | — | |
Shares redeemed | | (5,276,048 | ) | | | (37,565,595 | ) | | (145,183 | ) | | | (1,341,751 | ) |
| | | | |
Net increase (decrease) | | 46,206,075 | | | $ | 361,467,772 | | | 14,139,750 | | | $ | 133,273,194 | |
| | | | |
| Class 4 Shares: | | | | | | | | | | | | |
Shares sold | | 62,420,570 | | | $ | 442,309,673 | | | | | | | | |
Shares issued on reinvestment of distributions | | 2,373,260 | | | | 12,696,943 | | | | | | | | |
Shares redeemed | | (17,962,086 | ) | | | (115,905,304 | ) | | | | | | | |
| | | | | | | | | | |
Net increase (decrease) | | 46,831,744 | | | $ | 339,101,312 | | | | | | | | |
| | | | | | | | | | |
aFor | the period February 29, 2008 (effective date) to December 31, 2008 for Class 4. |
bFor | the period July 2, 2007 (commencement of operations) to December 31, 2007. |
FFA-16
Franklin Templeton Variable Insurance Products Trust
Notes to Financial Statements (continued)
Franklin Templeton VIP Founding Funds Allocation Fund
3. TRANSACTIONS WITH AFFILIATES
Franklin Resources, Inc. is the holding company for various subsidiaries that together are referred to as Franklin Templeton Investments. Certain officers and trustees of the Trust are also officers and/or directors of certain of the Underlying Funds and of the following subsidiaries:
| | |
| Subsidiary | | Affiliation |
Franklin Templeton Services, LLC (FT Services) | | Administrative manager |
Franklin Templeton Distributors, Inc. (Distributors) | | Principal underwriter |
Franklin Templeton Investor Services, LLC (Investor Services) | | Transfer agent |
a. Administrative Fees
The Fund pays an administrative fee to FT Services of 0.10% per year of the average daily net assets of the Fund for administrative services including monitoring and rebalancing the percentage of the Fund’s investment in the Underlying Funds.
b. Distribution Fees
The Fund’s Board of Trustees has adopted distribution plans for Class 2 and Class 4 shares pursuant to Rule 12b-1 under the 1940 Act. Under the Fund’s compensation distribution plans, the Fund pays Distributors for costs incurred in connection with the servicing, sale and distribution of the Fund’s shares up to 0.35% per year of its average daily net assets of each class. The Board of Trustees has agreed to limit the current rate to 0.25% per year for Class 2.
c. Transfer Agent Fees
Investor Services, under terms of an agreement, performs shareholder servicing for the Fund and is not paid by the Fund for the services.
d. Waiver and Expense Reimbursements
FT Services agreed in advance to waive all or a portion of its fees and to assume payment of other expenses through April 30, 2009. Total expenses waived or paid are not subject to reimbursement by the Fund subsequent to the Fund’s fiscal year end. After April 30, 2009, FT Services may discontinue this waiver at any time upon notice to the Fund’s Board of Trustees.
4. INCOME TAXES
For tax purposes, realized capital losses occurring subsequent to October 31, may be deferred and treated as occurring on the first day of the following fiscal year. At December 31, 2008, the Fund deferred realized capital losses of $24,704.
The tax character of distributions paid during the years ended December 31, 2008 and 2007, was as follows:
| | | | | | |
| | | 2008 | | 2007 |
Distributions paid from: | | | | | | |
Ordinary Income | | $ | 15,846,479 | | $ | — |
Long term capital gain | | | 15,478,298 | | | — |
| | | |
| | $ | 31,324,777 | | $ | — |
| | | |
FFA-17
Franklin Templeton Variable Insurance Products Trust
Notes to Financial Statements (continued)
Franklin Templeton VIP Founding Funds Allocation Fund
4. INCOME TAXES (continued)
At December 31, 2008, the cost of investments, net unrealized appreciation (depreciation) and undistributed ordinary income for income tax purposes were as follows:
| | | | |
Cost of investments | | $ | 824,323,716 | |
| | | | |
| |
Unrealized appreciation | | $ | — | |
Unrealized depreciation | | | (232,917,635 | ) |
| | | | |
Net unrealized appreciation (depreciation) | | $ | (232,917,635 | ) |
| | | | |
Distributable earnings – undistributed ordinary income | | $ | 298,781 | |
| | | | |
Net investment income (loss) differs for financial statement and tax purposes primarily due to differing treatments of offering costs and short term capital gains distributions from Underlying Funds.
Net realized gains (losses) differ for financial statement and tax purposes primarily due to differing treatments of wash sales and short term capital gains distributions from Underlying Funds.
5. INVESTMENT TRANSACTIONS
Purchases and sales of Underlying Funds (excluding short term securities) for the year ended December 31, 2008, aggregated $776,316,891 and $83,383,774, respectively.
6. INVESTMENTS IN UNDERLYING FUNDS
The Fund invests primarily in the Underlying Funds which are managed by Franklin Advisers, Inc. (Advisers), an affiliate of FT Services, or an affiliate of Advisers. The Fund does not invest in the Underlying Funds for the purpose of exercising management or control. At December 31, 2008, the Fund held the following positions which exceed 5% of the Underlying Funds’ shares outstanding:
| | | |
Name of Issuer | | % of Shares Held | |
Templeton Growth Securities Fund, Class 1 | | 10.17 | % |
Mutual Shares Securities Fund, Class 1 | | 5.28 | % |
The Fund may invest in the Franklin Institutional Fiduciary Trust Money Market Portfolio (Sweep Money Fund), an open-end investment company managed by Advisers. Pursuant to a SEC exemptive order specific to the Fund’s investment in the Sweep Money Fund, administrative fees are reduced on assets invested in the Sweep Money Fund, in an amount not to exceed the management and administrative fees paid by the Sweep Money Fund.
7. FAIR VALUE MEASUREMENTS
The Fund adopted Financial Accounting Standards Board (FASB) Statement No. 157, “Fair Value Measurement” (SFAS 157), on January 1, 2008. SFAS 157 defines fair value, establishes a framework for measuring fair value, and expands disclosures about fair value measurements. The Fund has determined that the implementation of SFAS 157 did not have a material impact on the Fund’s financial statements.
FFA-18
Franklin Templeton Variable Insurance Products Trust
Notes to Financial Statements (continued)
Franklin Templeton VIP Founding Funds Allocation Fund
7. FAIR VALUE MEASUREMENTS (continued)
SFAS 157 establishes a fair value hierarchy that distinguishes between market data obtained from independent sources (observable inputs) and the Trust’s own market assumptions (unobservable inputs). These inputs are used in determining the value of the Fund’s investments and are summarized in the following fair value hierarchy:
| | • | | Level 1 – quoted prices in active markets for identical securities |
| | • | | Level 2 – other significant observable inputs (including quoted prices for similar securities, interest rates, prepayment speed, credit risk, etc.) |
| | • | | Level 3 – significant unobservable inputs (including the Fund’s own assumptions in determining the fair value of investments) |
The inputs or methodology used for valuing securities are not an indication of the risk associated with investing in those securities.
At December 31, 2008, all of the Fund’s investments in securities carried at fair value were in Level 1 inputs.
8. SUBSEQUENT EVENT
On January 23, 2009, the Fund entered into, along with other funds managed by Franklin Templeton Investments (individually, “Borrower”; collectively “Borrowers”), a $725 million senior unsecured syndicated global line of credit (“Global Credit Facility”) to provide a source of funds to the Borrowers for temporary and emergency purposes and to meet future unanticipated or unusually large redemption requests.
Under the terms of the Global Credit Facility, each Borrower has agreed to pay its proportionate share of fees and expenses incurred in connection with the implementation and maintenance of the Global Credit Facility.
FFA-19
Franklin Templeton Variable Insurance Products Trust
Franklin Templeton VIP Founding Funds Allocation Fund
Report of Independent Registered Public Accounting Firm
To the Board of Trustees and Shareholders of Franklin Templeton Variable Insurance Products Trust
In our opinion, the accompanying statement of assets and liabilities, including the statement of investments, and the related statements of operations and of changes in net assets and the financial highlights present fairly, in all material respects, the financial position of Franklin Templeton VIP Founding Funds Allocation Fund (one of the funds constituting the Franklin Templeton Variable Insurance Products Trust, hereafter referred to as the “Fund”) at December 31, 2008, the results of its operations for the year then ended, and the changes in its net assets and the financial highlights for the year then ended and for the period July 2, 2007 (commencement of operations) through December 31, 2008, in conformity with accounting principles generally accepted in the United States of America. These financial statements and financial highlights (hereafter referred to as “financial statements”) are the responsibility of the Fund’s management. Our responsibility is to express an opinion on these financial statements based on our audits. We conducted our audits of these financial statements in accordance with the standards of the Public Company Accounting Oversight Board (United States). Those standards require that we plan and perform the audit to obtain reasonable assurance about whether the financial statements are free of material misstatement. An audit includes examining, on a test basis, evidence supporting the amounts and disclosures in the financial statements, assessing the accounting principles used and significant estimates made by management, and evaluating the overall financial statement presentation. We believe that our audits, which included confirmation of investments in the Underlying Funds at December 31, 2008 by correspondence with the transfer agent of the Underlying Funds, provide a reasonable basis for our opinion.
PricewaterhouseCoopers LLP
San Francisco, California
February 10, 2009
FFA-20
Franklin Templeton Variable Insurance Products Trust
Tax Designation (unaudited)
Franklin Templeton VIP Founding Funds Allocation Fund
Under Section 852(b)(3)(C) of the Internal Revenue Code (Code), the Fund designates the maximum amount allowable but no less than $15,478,298 as a long term capital gain dividend for the fiscal year ended December 31, 2008.
Under Section 854(b)(2) of the Code, the Fund designates 24.68% of the ordinary income dividends as income qualifying for the dividends received deduction for the fiscal year ended December 31, 2008.
FFA-21
FRANKLIN U.S. GOVERNMENT FUND
This annual report for Franklin U.S. Government Fund covers the fiscal year ended December 31, 2008.
Performance Summary as of 12/31/08
Average annual total return of Class 1 shares represents the average annual change in value, assuming reinvestment of dividends and capital gains. Average returns smooth out variations in returns, which can be significant; they are not the same as year-by-year results.
Periods ended 12/31/08
| | | | | | |
| | | 1-Year | | 5-Year | | 10-Year |
Average Annual Total Return | | +7.91% | �� | +5.07% | | +5.58% |
Total Return Index Comparison
for a Hypothetical $10,000 Investment (1/1/99–12/31/08)
The graph below shows the change in value of a hypothetical $10,000 investment in the Fund over the indicated period and includes reinvestment of any income or distributions. The Fund’s performance is compared to the performance of the Barclays Capital (BC) U.S. Government: Intermediate Index and the Lipper VIP General U.S. Government Funds Classification Average, as well as the Consumer Price Index (CPI). One cannot invest directly in an index, nor is an index representative of the Fund’s portfolio. Please see Important Notes to Performance Information preceding the Fund Summaries.
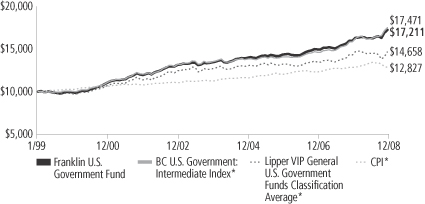
*Sources: © 2009 Morningstar; Lipper Inc. Please see Index Descriptions following the Fund Summaries.
Franklin U.S. Government Fund – Class 1
Performance reflects the Fund’s Class 1 operating expenses, but does not include any contract fees, expenses or sales charges. If they had been included, performance would be lower. These charges and deductions, particularly for variable life policies, can have a significant effect on contract values and insurance benefits. See the contract prospectus for a complete description of these expenses, including sales charges.
Performance data represent past performance, which does not guarantee future results. Investment return and principal value will fluctuate, and you may have a gain or loss when you sell your shares. Current performance may differ from figures shown.
FUS-1
Fund Goal and Main Investments: Franklin U.S. Government Fund seeks income. The Fund normally invests at least 80% of its net assets in U.S. government securities and normally invests primarily in fixed and variable rate mortgage-backed securities, a significant to substantial portion of which is Ginnie Maes.
Performance Overview
You can find the Fund’s one-year total return in the Performance Summary. Compared with its benchmarks for the same period, the Fund underperformed the BC U.S. Government: Intermediate Index’s +10.43% return and outperformed the Lipper VIP General U.S. Government Funds Classification Average’s +3.86% return.1
Economic and Market Overview
In 2008, economic conditions deteriorated. The Conference Board’s Consumer Confidence Index fell to an all-time low since it began in 1967 as the U.S. economy faltered and stock markets declined. The government’s abrupt conservatorship of Fannie Mae and Freddie Mac and the failure of several blue-chip banks and financial institutions roiled equity markets. Despite government interventions and massive emergency funding, the nation’s economic troubles were exacerbated as manufacturing activity weakened at its fastest pace in nearly 30 years and as home prices continued to fall. Jobless claims mounted and the unemployment rate rose to 7.2% by period-end.2 Economic growth, as measured by gross domestic product (GDP) rebounded from a 0.9% annualized rate in the first quarter of 2008 to a 2.8% annualized pace in the second quarter, largely due to strong exports and government spending. However, in the third and fourth quarters of 2008, GDP fell at annualized rates of 0.5% and an estimated 3.8%, reflecting a broad-based contraction in consumer spending, falling corporate profits and slowing export growth.
Oil prices soared to a record high in July, rising above $145 per barrel, before dramatically retreating to $45 by period-end. Many other commodities such as agricultural products and precious and base metals followed similar trends. Partially as a result of the steep price corrections, inflation declined significantly late in the review period, and December’s inflation rate was an annualized 0.1%.2 Core inflation,
1. Sources: © 2009 Morningstar; Lipper, Inc. One cannot invest directly in an index, nor is an index representative of the Fund’s portfolio. Please see Index Descriptions following the Fund Summaries.
2. Source: Bureau of Labor Statistics.
Fund Risks: Interest rate movements and mortgage prepayment rates may impact the Fund’s share price and yield. Bond prices generally move in the opposite direction of interest rates. Thus, as prices of bonds in the Fund’s portfolio adjust to a rise in interest rates, the Fund’s share price may decline. U.S. government securities owned by the Fund, but not shares of the Fund, may be guaranteed by the U.S. government, its agencies or instrumentalities as to the timely payment of principal and interest. The Fund’s yield and share price are not guaranteed and will fluctuate with market conditions. The Fund’s prospectus also includes a description of the main investment risks.
FUS-2
which excludes food and energy costs, rose at a 1.8% annual rate; this level was within the Federal Reserve Board’s (Fed’s) informal target range of 1.5%–2.0%.2 The core personal consumption expenditures price index reported a 12-month increase of 1.7%.3
A slowing economy and decelerating inflation prompted policymakers to further lower interest rates and enact stimulus plans. During the year under review, the Fed lowered the federal funds target rate to a range of 0% to 0.25% from 4.25% at the start of the reporting period. The Fed and U.S. Treasury Department also introduced new programs such as the Primary Dealer Credit Facility (PDCF) and the Troubled Asset Relief Program (TARP), which were intended to stimulate market liquidity.
Volatility remained high throughout the reporting period but intensified in the latter half of the year as stocks fluctuated wildly, Treasury prices soared and yields across the maturity spectrum plummeted. Investors drove the yield on the three-month Treasury bill to a multi-decade low, and LIBOR (London InterBank Offered Rate) rates, which banks charge one another for loans, jumped to record highs. Fixed income spreads were generally wide relative to Treasury yields over the period due to heightened market turbulence and risk aversion. The yield curve steepened and the spread between the two-year Treasury yield and the 10-year Treasury yield increased to 149 basis points (100 basis points equal one percentage point) at the end of December from 99 basis points at the beginning of the reporting period. The two-year Treasury bill yield fell from 3.05% to 0.76% over the 12-month period. Over the same period, the 10-year U.S. Treasury note yield fell from 4.04% to 2.25%.
Investment Strategy
Using our straightforward investment approach, we seek to produce current income with a high degree of credit safety from a conservatively managed portfolio of U.S. government securities. Analyzing securities using proprietary and nonproprietary research, we seek to identify attractive investment opportunities.
Manager’s Discussion
During the 12-month period ended December 31, 2008, the fixed income market experienced extraordinary volatility and uncertainty. At times, positive developments in the financials sector, together with substantial fiscal and monetary stimulus, set a more constructive tone for
3. Source: Bureau of Economic Analysis.
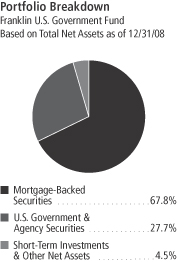
The dollar value, number of shares or principal amount, and names of all portfolio holdings are listed in the Fund’s Statement of Investments.
FUS-3
fixed income markets, but overall conditions remained challenging as concerns lingered over financial market and economic stability. Ginnie Mae (GNMA) securities were somewhat protected from recent market turbulence due to their premium status as a result of their explicit government guarantee.
During the review period, consistent with our investment strategy, we continued to dedicate a portion of our investments primarily to Ginnie Mae (GNMA) mortgage-backed securities, which are guaranteed by the full faith and credit of the U.S. government. However, over the period, GNMA MBS slightly lagged their conventional Fannie Mae (FNMA) and Freddie Mac (FHLMC) MBS counterparts, and underperformed comparable high credit-quality U.S. Treasuries.
A fundamental part of our strategy is to uncover dislocations across GNMA markets and risk repricing that we think offer value. As the primary risk for GNMA investors is prepayment risk — the risk of uncertain cash flows caused by prepayments in the underlying mortgages — we actively sought to uncover those areas of the market where we believed repriced risk may have offered value. While housing market volatility did not affect GNMA credit quality, it impacted prepayment characteristics.
Throughout the year we strategically adjusted our allocations as mortgage rates and credit availability fluctuated. For most of the reporting period, as tightening credit standards and a pullback in housing and refinancing activity led to a decline in prepayments across all coupons and program types, we maintained a bias toward premium coupons versus discounts, as we continued to believe the income we earned from these securities should continue as the rate of prepayments waned.
During the review period, we were committed to evaluating opportunities across the GNMA sector and coupon spectrum to isolate those securities that we felt offered the best total return potential. As our research led us to believe that income should continue to drive GNMA performance, we generally looked for opportunities in 30-year collateral bonds as opposed to their 15-year counterparts. At period-end, the Fund’s GNMA assets were allocated between the two tiers of the GNMA market, the GNMA I (comprising single-issuer pools) and GNMA II (comprising multiple-issuer pools) programs, as they have been in the past. However, throughout the reporting period we made incremental adjustments to the portfolio, and by period-end we had slightly reduced
FUS-4
our weighting in GNMA I securities relative to the GNMA IIs, because in our view, valuations between the two sectors were misaligned.
Thank you for your participation in Franklin U.S. Government Fund. We look forward to serving your future investment needs.
The foregoing information reflects our analysis, opinions and portfolio holdings as of December 31, 2008, the end of the reporting period. The way we implement our main investment strategies and the resulting portfolio holdings may change depending on factors such as market and economic conditions. These opinions may not be relied upon as investment advice or an offer for a particular security. The information is not a complete analysis of every aspect of any market, country, industry, security or the Fund. Statements of fact are from sources considered reliable, but the investment manager makes no representation or warranty as to their completeness or accuracy. Although historical performance is no guarantee of future results, these insights may help you understand our investment management philosophy.
FUS-5
Fund Expenses
As an investor in a variable insurance contract (Contract) that indirectly provides for investment in an underlying mutual fund, you can incur transaction and/or ongoing expenses at both the Fund level and the Contract level.
| • | | Transaction expenses can include sales charges (loads) on purchases, redemption fees, surrender fees, transfer fees and premium taxes. |
| • | | Ongoing expenses can include management fees, distribution and service (12b-1) fees, contract fees, annual maintenance fees, mortality and expense risk fees and other fees and expenses. All mutual funds and Contracts have some types of ongoing expenses. |
The expenses shown in the table are meant to highlight ongoing expenses at the Fund level only and do not include ongoing expenses at the Contract level, or transaction expenses at either the Fund or Contract level. While the Fund does not have transaction expenses, if the transaction and ongoing expenses at the Contract level were included, the expenses shown below would be higher. You should consult your Contract prospectus or disclosure document for more information.
The table shows Fund-level ongoing expenses and can help you understand these expenses and compare them with those of other mutual funds offered through the Contract. The table assumes a $1,000 investment held for the six months indicated. Please refer to the Fund prospectus for additional information on operating expenses.
Actual Fund Expenses
The first line (Actual) of the table provides actual account values and expenses. The “Ending Account Value” is derived from the Fund’s actual return, which includes the effect of ongoing Fund expenses, but does not include the effect of ongoing Contract expenses.
You can estimate the Fund-level expenses you incurred during the period by following these steps. Of course, your account value and expenses will differ from those in this illustration:
| 1. | Divide your account value by $1,000. |
If an account had an $8,600 value, then $8,600 ÷ $1,000 = 8.6.
| 2. | Multiply the result by the number under the heading “Fund-Level Expenses Incurred During Period.” |
If Fund-Level Expenses Incurred During Period were $7.50, then 8.6 x $7.50 = $64.50.
In this illustration, the estimated expenses incurred this period at the Fund level are $64.50.
Franklin U.S. Government Fund – Class 1
FUS-6
Hypothetical Example for Comparison with Other Mutual Funds
Information in the second line (Hypothetical) of the table can help you compare ongoing expenses of the Fund with those of other mutual funds offered through the Contract. This information may not be used to estimate the actual ending account balance or expenses you incurred during the period. The hypothetical “Ending Account Value” is based on the Fund’s actual expense ratio and an assumed 5% annual rate of return before expenses, which does not represent the Fund’s actual return. The figure under the heading “Fund-Level Expenses Incurred During Period” shows the hypothetical expenses your account would have incurred under this scenario. You can compare this figure with the 5% hypothetical examples that appear in shareholder reports of other funds offered through a Contract.
| | | | | | | | | |
| Class 1 | | Beginning
Account Value 7/1/08 | | Ending Account Value 12/31/08 | | Fund-Level
Expenses Incurred
During Period*
7/1/08–12/31/08 |
Actual | | $ | 1,000 | | $ | 1,061.10 | | $ | 2.75 |
Hypothetical (5% return before expenses) | | $ | 1,000 | | $ | 1,022.47 | | $ | 2.69 |
*Expenses are calculated using the most recent six-month annualized expense ratio for the Fund’s Class 1 shares (0.53%), which does not include any ongoing expenses of the Contract for which the Fund is an investment option, multiplied by the average account value over the period, multiplied by 184/366 to reflect the one-half year period.
FUS-7
Franklin Templeton Variable Insurance Products Trust
Financial Highlights
Franklin U.S. Government Fund
| | | | | | | | | | | | | | | | | | | | |
| | | Year Ended December 31, | |
| Class 1 | | 2008 | | | 2007 | | | 2006 | | | 2005 | | | 2004 | |
| | | | |
Per share operating performance | | | | | | | | | | | | | | | | | | | | |
(for a share outstanding throughout the year) | | | | | | | | | | | | | | | | | | | | |
Net asset value, beginning of year | | $ | 12.89 | | | $ | 12.69 | | | $ | 12.75 | | | $ | 12.99 | | | $ | 13.22 | |
| | | | |
Income from investment operationsa: | | | | | | | | | | | | | | | | | | | | |
Net investment incomeb | | | 0.58 | | | | 0.61 | | | | 0.59 | | | | 0.54 | | | | 0.51 | |
Net realized and unrealized gains (losses) | | | 0.39 | | | | 0.22 | | | | (0.07 | ) | | | (0.20 | ) | | | (0.05 | ) |
| | | | |
Total from investment operations | | | 0.97 | | | | 0.83 | | | | 0.52 | | | | 0.34 | | | | 0.46 | |
| | | | |
Less distributions from net investment income | | | (0.67 | ) | | | (0.63 | ) | | | (0.58 | ) | | | (0.58 | ) | | | (0.69 | ) |
| | | | |
Net asset value, end of year | | $ | 13.19 | | | $ | 12.89 | | | $ | 12.69 | | | $ | 12.75 | | | $ | 12.99 | |
| | | | |
| | | | | |
Total returnc | | | 7.91% | | | | 6.85% | | | | 4.31% | | | | 2.65% | | | | 3.71% | |
Ratios to average net assets | | | | | | | | | | | | | | | | | | | | |
Expensesd | | | 0.53% | | | | 0.53% | | | | 0.54% | | | | 0.52% | | | | 0.54% | |
Net investment income | | | 4.54% | | | | 4.83% | | | | 4.67% | | | | 4.18% | | | | 3.90% | |
| | | | | |
Supplemental data | | | | | | | | | | | | | | | | | | | | |
Net assets, end of year (000’s) | | $ | 173,018 | | | $ | 167,700 | | | $ | 187,867 | | | $ | 217,165 | | | $ | 259,833 | |
Portfolio turnover rate | | | 17.06% | | | | 27.50% | | | | 23.46% | | | | 21.46% | | | | 75.93% | |
Portfolio turnover rate excluding mortgage dollar rollse | | | 17.06% | | | | 27.50% | | | | 23.46% | | | | 15.62% | | | | 33.63% | |
aThe amount shown for a share outstanding throughout the period may not correlate with the Statement of Operations for the period due to the timing of sales and repurchases of the Fund shares in relation to income earned and/or fluctuating market value of the investments of the Fund.
bBased on average daily shares outstanding.
cTotal return does not include any fees, charges or expenses imposed by the variable annuity and life insurance contracts for which the Franklin Templeton Variable Insurance Products Trust serves as an underlying investment vehicle.
dBenefit of expense reduction rounds to less than 0.01%.
eSee Note 1(d) regarding mortgage dollar rolls.
The accompanying notes are an integral part of these financial statements.
FUS-8
Franklin Templeton Variable Insurance Products Trust
Financial Highlights (continued)
Franklin U.S. Government Fund
| | | | | | | | | | | | | | | | | | | | |
| | | Year Ended December 31, | |
| Class 2 | | 2008 | | | 2007 | | | 2006 | | | 2005 | | | 2004 | |
| | | | |
Per share operating performance | | | | | | | | | | | | | | | | | | | | |
(for a share outstanding throughout the year) | | | | | | | | | | | | | | | | | | | | |
Net asset value, beginning of year | | $ | 12.71 | | | $ | 12.52 | | | $ | 12.59 | | | $ | 12.84 | | | $ | 13.08 | |
| | | | |
Income from investment operationsa: | | | | | | | | | | | | | | | | | | | | |
Net investment incomeb | | | 0.54 | | | | 0.57 | | | | 0.55 | | | | 0.50 | | | | 0.47 | |
Net realized and unrealized gains (losses) | | | 0.38 | | | | 0.22 | | | | (0.07 | ) | | | (0.20 | ) | | | (0.04 | ) |
| | | | |
Total from investment operations | | | 0.92 | | | | 0.79 | | | | 0.48 | | | | 0.30 | | | | 0.43 | |
| | | | |
Less distributions from net investment income | | | (0.64 | ) | | | (0.60 | ) | | | (0.55 | ) | | | (0.55 | ) | | | (0.67 | ) |
| | | | |
Net asset value, end of year | | $ | 12.99 | | | $ | 12.71 | | | $ | 12.52 | | | $ | 12.59 | | | $ | 12.84 | |
| | | | |
| | | | | |
Total returnc | | | 7.59% | | | | 6.61% | | | | 4.02% | | | | 2.40% | | | | 3.48% | |
Ratios to average net assets | | | | | | | | | | | | | | | | | | | | |
Expensesd | | | 0.78% | | | | 0.78% | | | | 0.79% | | | | 0.77% | | | | 0.79% | |
Net investment income | | | 4.29% | | | | 4.58% | | | | 4.42% | | | | 3.93% | | | | 3.65% | |
| | | | | |
Supplemental data | | | | | | | | | | | | | | | | | | | | |
Net assets, end of year (000’s) | | $ | 450,603 | | | $ | 379,386 | | | $ | 374,323 | | | $ | 379,662 | | | $ | 332,373 | |
Portfolio turnover rate | | | 17.06% | | | | 27.50% | | | | 23.46% | | | | 21.46% | | | | 75.93% | |
Portfolio turnover rate excluding mortgage dollar rollse | | | 17.06% | | | | 27.50% | | | | 23.46% | | | | 15.62% | | | | 33.63% | |
aThe amount shown for a share outstanding throughout the period may not correlate with the Statement of Operations for the period due to the timing of sales and repurchases of the Fund shares in relation to income earned and/or fluctuating market value of the investments of the Fund.
bBased on average daily shares outstanding.
c Total return does not include any fees, charges or expenses imposed by the variable annuity and life insurance contracts for which the Franklin Templeton Variable Insurance Products Trust serves as an underlying investment vehicle.
dBenefit of expense reduction rounds to less than 0.01%.
eSee Note 1(d) regarding mortgage dollar rolls.
The accompanying notes are an integral part of these financial statements.
FUS-9
Franklin Templeton Variable Insurance Products Trust
Financial Highlights (continued)
Franklin U.S. Government Fund
| | | | |
| Class 4 | | Period Ended
December 31,
2008a | |
| | | | |
Per share operating performance | | | | |
(for a share outstanding throughout the period) | | | | |
Net asset value, beginning of period | | $ | 13.19 | |
| | | | |
Income from investment operationsb: | | | | |
Net investment incomec | | | 0.45 | |
Net realized and unrealized gains (losses) | | | 0.18 | |
| | | | |
Total from investment operations | | | 0.63 | |
| | | | |
Less distributions from net investment income | | | (0.67 | ) |
| | | | |
Net asset value, end of period | | $ | 13.15 | |
| | | | |
| |
Total returnd | | | 5.14% | |
Ratios to average net assetse | | | | |
Expenses | | | 0.88% | |
Net investment income | | | 4.19% | |
| |
Supplemental data | | | | |
Net assets, end of period (000’s) | | $ | 5 | |
Portfolio turnover rate | | | 17.06% | |
aFor the period February 29, 2008 (effective date) to December 31, 2008.
bThe amount shown for a share outstanding throughout the period may not correlate with the Statement of Operations for the period due to the timing of sales and repurchases of the Fund shares in relation to income earned and/or fluctuating market value of the investments of the Fund.
cBased on average daily shares outstanding.
dTotal return does not include any fees, charges or expenses imposed by the variable annuity and life insurance contracts for which the Franklin Templeton Variable Insurance Products Trust serves as an underlying investment vehicle. Total return is not annualized for periods less than one year.
eRatios are annualized for periods less than one year.
The accompanying notes are an integral part of these financial statements.
FUS-10
Franklin Templeton Variable Insurance Products Trust
Statement of Investments, December 31, 2008
| | | | | | |
| Franklin U.S. Government Fund | | Principal
Amount | | Value |
Mortgage-Backed Securities 67.8% | | | | | | |
aFederal Home Loan Mortgage Corp. (FHLMC) Adjustable Rate 0.1% | | | | | | |
FHLMC, 5.296%, 6/01/22 | | $ | 217,173 | | $ | 216,408 |
FHLMC, 5.956%, 2/01/19 | | | 152,939 | | | 154,421 |
| | | | | | |
| | | | | | 370,829 |
| | | | | | |
Federal Home Loan Mortgage Corp. (FHLMC) Fixed Rate 7.4% | | | | | | |
FHLMC Gold 30 Year, 5.00%, 9/01/33 - 4/01/34 | | | 8,701,379 | | | 8,912,850 |
FHLMC Gold 30 Year, 5.00%, 6/01/37 | | | 6,367,056 | | | 6,515,202 |
FHLMC Gold 30 Year, 5.50%, 7/01/33 - 1/01/35 | | | 4,187,321 | | | 4,295,707 |
FHLMC Gold 30 Year, 5.50%, 11/01/34 | | | 9,152,664 | | | 9,387,591 |
FHLMC Gold 30 Year, 6.00%, 1/01/24 - 8/01/35 | | | 9,467,213 | | | 9,786,524 |
FHLMC Gold 30 Year, 6.50%, 11/01/23 - 5/01/35 | | | 3,604,786 | | | 3,767,312 |
FHLMC Gold 30 Year, 7.00%, 4/01/24 - 10/01/32 | | | 1,242,674 | | | 1,303,418 |
FHLMC Gold 30 Year, 7.50%, 12/01/22 - 5/01/24 | | | 71,389 | | | 75,488 |
FHLMC Gold 30 Year, 8.00%, 7/01/21 - 5/01/22 | | | 50,844 | | | 53,842 |
FHLMC Gold 30 Year, 8.50%, 7/01/21 - 7/01/31 | | | 1,809,247 | | | 1,956,051 |
FHLMC PC 30 Year, 8.00%, 1/01/17 - 9/01/17 | | | 10,837 | | | 11,437 |
FHLMC PC 30 Year, 8.50%, 9/01/20 | | | 2,559 | | | 2,747 |
| | | | | | |
| | | | | | 46,068,169 |
| | | | | | |
aFederal National Mortgage Association (FNMA) Adjustable Rate 0.4% | | | | | | |
FNMA, 4.927%, 9/01/18 | | | 434,357 | | | 433,318 |
FNMA, 5.01%, 1/01/18 | | | 1,331,890 | | | 1,324,319 |
FNMA, 5.072%, 2/01/19 | | | 198,822 | | | 199,301 |
FNMA, 6.329%, 7/01/19 | | | 172,004 | | | 175,438 |
FNMA, 6.476%, 3/01/20 | | | 121,923 | | | 127,379 |
| | | | | | |
| | | | | | 2,259,755 |
| | | | | | |
Federal National Mortgage Association (FNMA) Fixed Rate 13.5% | | | | | | |
FNMA 15 Year, 5.50%, 6/01/16 - 11/01/17 | | | 1,513,926 | | | 1,567,995 |
FNMA 15 Year, 6.00%, 8/01/17 - 9/01/17 | | | 1,621,969 | | | 1,689,200 |
FNMA 30 Year, 5.00%, 3/01/34 - 7/01/35 | | | 8,986,632 | | | 9,192,071 |
FNMA 30 Year, 5.50%, 12/01/32 - 8/01/35 | | | 16,245,456 | | | 16,690,739 |
FNMA 30 Year, 6.00%, 1/01/24 - 12/01/34 | | | 2,989,981 | | | 3,086,009 |
FNMA 30 Year, 6.00%, 2/01/36 | | | 7,002,249 | | | 7,218,085 |
FNMA 30 Year, 6.00%, 2/01/36 | | | 7,401,770 | | | 7,629,921 |
FNMA 30 Year, 6.00%, 3/01/36 | | | 12,461,194 | | | 12,845,296 |
FNMA 30 Year, 6.00%, 2/01/37 | | | 6,687,065 | | | 6,892,810 |
FNMA 30 Year, 6.50%, 1/01/24 - 8/01/32 | | | 3,157,828 | | | 3,306,740 |
FNMA 30 Year, 6.50%, 9/01/36 | | | 7,121,715 | | | 7,406,583 |
FNMA 30 Year, 7.50%, 4/01/23 - 8/01/25 | | | 132,199 | | | 140,409 |
FNMA 30 Year, 8.00%, 7/01/16 - 2/01/25 | | | 292,822 | | | 310,420 |
FNMA 30 Year, 8.50%, 10/01/19 - 8/01/21 | | | 5,395 | | | 5,804 |
FNMA 30 Year, 9.00%, 10/01/26 | | | 639,903 | | | 700,941 |
FNMA GL 30 Year, 8.00%, 8/01/19 - 6/01/20 | | | 69,028 | | | 73,959 |
FNMA PL 30 Year, 5.50%, 4/01/34 | | | 5,310,744 | | | 5,441,208 |
| | | | | | |
| | | | | | 84,198,190 |
| | | | | | |
Government National Mortgage Association (GNMA) Fixed Rate 46.4% | | | | | | |
bGNMA I SF 30 Year, 4.50%, 1/01/39 | | | 3,900,000 | | | 3,970,687 |
GNMA I SF 30 Year, 5.00%, 6/15/30 - 9/15/36 | | | 31,067,025 | | | 31,970,820 |
GNMA I SF 30 Year, 5.50%, 11/15/28 - 8/15/38 | | | 41,810,656 | | | 43,200,781 |
GNMA I SF 30 Year, 5.50%, 4/15/37 | | | 8,576,968 | | | 8,855,010 |
bGNMA I SF 30 Year, 6.00%, 11/15/23 - 9/15/38 | | | 39,658,735 | | | 41,026,240 |
FUS-11
Franklin Templeton Variable Insurance Products Trust
Statement of Investments, December 31, 2008 (continued)
| | | | | | |
| Franklin U.S. Government Fund | | Principal
Amount | | Value |
Mortgage-Backed Securities (continued) | | | | | | |
Government National Mortgage Association (GNMA) Fixed Rate (continued) | | | | | | |
GNMA I SF 30 Year, 6.00%, 2/15/37 | | $ | 6,092,236 | | $ | 6,297,793 |
GNMA I SF 30 Year, 6.50%, 5/15/23 - 9/15/38 | | | 11,203,618 | | | 11,755,339 |
GNMA I SF 30 Year, 7.00%, 3/15/22 - 1/15/32 | | | 2,773,738 | | | 2,941,689 |
GNMA I SF 30 Year, 7.50%, 2/15/17 - 8/15/33 | | | 2,515,386 | | | 2,670,813 |
GNMA I SF 30 Year, 8.00%, 2/15/17 - 6/15/24 | | | 750,368 | | | 799,348 |
GNMA I SF 30 Year, 8.25%, 4/15/25 | | | 20,917 | | | 22,325 |
GNMA I SF 30 Year, 8.50%, 6/15/22 - 12/15/24 | | | 215,749 | | | 230,808 |
GNMA I SF 30 Year, 9.00%, 6/15/16 - 5/15/20 | | | 85,179 | | | 91,169 |
GNMA I SF 30 Year, 9.50%, 7/15/16 - 6/15/21 | | | 276,240 | | | 300,532 |
GNMA I SF 30 Year, 10.00%, 10/15/17 - 8/15/21 | | | 184,422 | | | 204,975 |
GNMA II SF 30 Year, 5.00%, 9/20/33 | | | 8,591,646 | | | 8,816,612 |
GNMA II SF 30 Year, 5.00%, 10/20/33 - 6/20/38 | | | 7,830,038 | | | 8,041,490 |
GNMA II SF 30 Year, 5.00%, 8/20/35 | | | 7,823,547 | | | 8,033,710 |
GNMA II SF 30 Year, 5.50%, 5/20/34 - 7/20/38 | | | 41,835,368 | | | 43,083,966 |
GNMA II SF 30 Year, 5.50%, 2/20/36 | | | 22,036,818 | | | 22,691,658 |
GNMA II SF 30 Year, 6.00%, 11/20/23 - 12/20/38 | | | 14,588,223 | | | 15,062,311 |
bGNMA II SF 30 Year, 6.00%, 1/01/30 | | | 7,900,000 | | | 8,129,613 |
GNMA II SF 30 Year, 6.00%, 9/20/34 | | | 6,966,758 | | | 7,189,516 |
GNMA II SF 30 Year, 6.00%, 1/20/36 | | | 10,223,592 | | | 10,546,154 |
GNMA II SF 30 Year, 6.50%, 12/20/27 - 4/20/34 | | | 2,969,696 | | | 3,124,699 |
GNMA II SF 30 Year, 7.00%, 5/20/32 | | | 49,039 | | | 51,334 |
GNMA II SF 30 Year, 7.50%, 5/20/17 - 5/20/33 | | | 538,576 | | | 569,205 |
GNMA II SF 30 Year, 8.00%, 7/20/16 - 8/20/26 | | | 46,811 | | | 49,785 |
GNMA II SF 30 Year, 9.50%, 4/20/25 | | | 3,285 | | | 3,605 |
| | | | | | |
| | | | | | 289,731,987 |
| | | | | | |
Total Mortgage-Backed Securities (Cost $411,971,713) | | | | | | 422,628,930 |
| | | | | | |
U.S. Government and Agency Securities 27.7% | | | | | | |
FFCB, 4.45%, 8/27/10 | | | 15,000,000 | | | 15,848,880 |
FHLB,
2.75%, 6/18/10 | | | 6,000,000 | | | 6,164,316 |
3.625%, 5/29/13 | | | 4,500,000 | | | 4,721,729 |
4.875%, 5/14/10 | | | 10,000,000 | | | 10,549,660 |
5.125%, 8/14/13 | | | 11,000,000 | | | 12,281,258 |
5.375%, 8/19/11 | | | 12,000,000 | | | 13,194,276 |
FHLMC, 5.125%, 11/17/17 | | | 10,000,000 | | | 11,607,630 |
cFICO,
15, Strip, 3/07/16 | | | 15,000,000 | | | 11,808,270 |
16, Strip, 10/05/10 | | | 4,745,000 | | | 4,653,384 |
FNMA, 2.875%, 10/12/10 | | | 29,500,000 | | | 30,441,257 |
HUD, 96-A,
7.63%, 8/01/14 | | | 2,080,000 | | | 2,085,593 |
7.66%, 8/01/15 | | | 2,350,000 | | | 2,356,340 |
SBA,
1995-20L, 1, PC, 6.45%, 12/01/15 | | | 668,378 | | | 696,754 |
1996-20L, 1, PC, 6.70%, 12/01/16 | | | 740,516 | | | 775,169 |
1997-20G, 1, PC, 6.85%, 7/01/17 | | | 837,069 | | | 862,290 |
1998-20I, 1, PC, 6.00%, 9/01/18 | | | 2,366,984 | | | 2,439,502 |
aFRN, 4.60%, 6/25/19 | | | 448,885 | | | 437,592 |
aFRN, 4.875%, 3/25/18 | | | 727,621 | | | 733,928 |
TVA,
5.88%, 4/01/36 | | | 10,000,000 | | | 12,924,900 |
zero cpn. to 4/15/12, 8.25% thereafter, 4/15/42 | | | 6,000,000 | | | 5,818,678 |
FUS-12
Franklin Templeton Variable Insurance Products Trust
Statement of Investments, December 31, 2008 (continued)
| | | | | | | |
| Franklin U.S. Government Fund | | Principal
Amount | | Value | |
U.S. Government and Agency Securities (continued) | | | | | | | |
U.S. Treasury Note,
3.125%, 8/31/13 | | $ | 12,000,000 | | $ | 12,942,192 | |
4.75%, 5/15/14 | | | 8,000,000 | | | 9,416,880 | |
| | | | | | | |
Total U.S. Government and Agency Securities (Cost $156,059,153) | | | | | | 172,760,478 | |
| | | | | | | |
Total Investments before Short Term Investments (Cost $568,030,866) | | | | | | 595,389,408 | |
| | | | | | | |
Short Term Investments (Cost $31,426,297) 5.0% | | | | | | | |
Repurchase Agreements 5.0% | | | | | | | |
dJoint Repurchase Agreement, 0.019%, 1/02/09 (Maturity Value $31,426,331) | | | 31,426,297 | | | 31,426,297 | |
Banc of America Securities LLC (Maturity Value $4,850,339) | | | | | | | |
Barclays Capital Inc. (Maturity Value $4,619,671) | | | | | | | |
BNP Paribas Securities Corp. (Maturity Value $6,159,561) | | | | | | | |
Credit Suisse Securities (USA) LLC (Maturity Value $6,159,561) | | | | | | | |
Deutsche Bank Securities Inc. (Maturity Value $3,554,632) | | | | | | | |
HSBC Securities (USA) Inc. (Maturity Value $4,619,671) | | | | | | | |
UBS Securities LLC (Maturity Value $1,462,896) | | | | | | | |
Collateralized by U.S. Government Agency Securities, 3.50% - 7.00%, 6/15/09 - 5/20/22; cU.S. Government Agency Discount Notes,1/05/09 - 10/19/09; cU.S. Treasury Bills, 1/15/09; and U.S. Treasury Notes, 0.875% - 4.625%, 7/15/09 - 2/28/11 | | | | | | | |
| | | | | | | |
Total Investments (Cost $599,457,163) 100.5% | | | | | | 626,815,705 | |
Other Assets, less Liabilities (0.5)% | | | | | | (3,189,845 | ) |
| | | | | | | |
Net Assets 100.0% | | | | | $ | 623,625,860 | |
| | | | | | | |
See Abbreviations on page FUS-22.
aThe coupon rate shown represents the rate at period end.
bA portion or all of the security purchased on a TBA basis. See Note 1(c).
cThe security is traded on a discount basis with no stated coupon rate.
dSee Note 1(b) regarding joint repurchase agreement.
The accompanying notes are an integral part of these financial statements.
FUS-13
Franklin Templeton Variable Insurance Products Trust
Financial Statements
Statement of Assets and Liabilities
December 31, 2008
| | | | |
| | | Franklin U.S.
Government Fund | |
Assets: | | | | |
Investments in securities: | | | | |
Cost - Unaffiliated issuers | | $ | 568,030,866 | |
Cost - Repurchase agreements | | | 31,426,297 | |
| | | | |
Total cost of investments | | $ | 599,457,163 | |
| | | | |
Value - Unaffiliated issuers | | $ | 595,389,408 | |
Value - Repurchase agreements | | | 31,426,297 | |
| | | | |
Total value of investments | | | 626,815,705 | |
Receivables: | | | | |
Investment securities sold | | | 8,148,650 | |
Capital shares sold | | | 1,102,226 | |
Interest | | | 3,405,377 | |
| | | | |
Total assets | | | 639,471,958 | |
| | | | |
Liabilities: | | | | |
Payables: | | | | |
Investment securities purchased | | | 15,055,797 | |
Capital shares redeemed | | | 217,945 | |
Affiliates | | | 440,786 | |
Accrued expenses and other liabilities | | | 131,570 | |
| | | | |
Total liabilities | | | 15,846,098 | |
| | | | |
Net assets, at value | | $ | 623,625,860 | |
| | | | |
Net assets consist of: | | | | |
Paid-in capital | | $ | 586,060,901 | |
Undistributed net investment income | | | 25,082,928 | |
Net unrealized appreciation (depreciation) | | | 27,358,542 | |
Accumulated net realized gain (loss) | | | (14,876,511 | ) |
| | | | |
Net assets, at value | | $ | 623,625,860 | |
| | | | |
Class 1: | | | | |
Net assets, at value | | $ | 173,017,543 | |
| | | | |
Shares outstanding | | | 13,118,397 | |
| | | | |
Net asset value and maximum offering price per share | | $ | 13.19 | |
| | | | |
Class 2: | | | | |
Net assets, at value | | $ | 450,603,332 | |
| | | | |
Shares outstanding | | | 34,686,689 | |
| | | | |
Net asset value and maximum offering price per share | | $ | 12.99 | |
| | | | |
Class 4: | | | | |
Net assets, at value | | $ | 4,985 | |
| | | | |
Shares outstanding | | | 379 | |
| | | | |
Net asset value and maximum offering price per share | | $ | 13.15 | |
| | | | |
The accompanying notes are an integral part of these financial statements.
FUS-14
Franklin Templeton Variable Insurance Products Trust
Financial Statements (continued)
Statement of Operations
for the year ended December 31, 2008
| | | | |
| | | Franklin U.S.
Government Fund | |
Investment income: | | | | |
Interest | | $ | 28,913,005 | |
| | | | |
Expenses: | | | | |
Management fees (Note 3a) | | | 2,814,257 | |
Distribution fees: (Note 3c) | | | | |
Class 2 | | | 1,017,652 | |
Class 4 | | | 14 | |
Unaffiliated transfer agent fees | | | 881 | |
Custodian fees (Note 4) | | | 9,614 | |
Reports to shareholders | | | 145,134 | |
Professional fees | | | 31,482 | |
Trustees’ fees and expenses | | | 2,598 | |
Other | | | 28,586 | |
| | | | |
Total expenses | | | 4,050,218 | |
Expense reductions (Note 4) | | | (2 | ) |
| | | | |
Net expenses | | | 4,050,216 | |
| | | | |
Net investment income | | | 24,862,789 | |
| | | | |
Realized and unrealized gains (losses): | | | | |
Net realized gain (loss) from investments | | | (160,442 | ) |
Net change in unrealized appreciation (depreciation) on investments | | | 18,507,270 | |
| | | | |
Net realized and unrealized gain (loss) | | | 18,346,828 | |
| | | | |
Net increase (decrease) in net assets resulting from operations | | $ | 43,209,617 | |
| | | | |
The accompanying notes are an integral part of these financial statements.
FUS-15
Franklin Templeton Variable Insurance Products Trust
Financial Statements (continued)
Statements of Changes in Net Assets
| | | | | | | | |
| | | Franklin U.S.
Government Fund | |
| | | Year Ended December 31, | |
| | | 2008 | | | 2007 | |
| | | | |
Increase (decrease) in net assets: | | | | | | | | |
Operations: | | | | | | | | |
Net investment income | | $ | 24,862,789 | | | $ | 26,302,871 | |
Net realized gain (loss) from investments | | | (160,442 | ) | | | (209,663 | ) |
Net change in unrealized appreciation (depreciation) on investments | | | 18,507,270 | | | | 10,101,095 | |
| | | | |
Net increase (decrease) in net assets resulting from operations | | | 43,209,617 | | | | 36,194,303 | |
| | | | |
Distributions to shareholders from net investment income: | | | | | | | | |
Class 1 | | | (8,197,357 | ) | | | (8,563,032 | ) |
Class 2 | | | (19,267,295 | ) | | | (18,820,597 | ) |
Class 4 | | | (253 | ) | | | — | |
| | | | |
Total distributions to shareholders | | | (27,464,905 | ) | | | (27,383,629 | ) |
| | | | |
Capital share transactions: (Note 2) | | | | | | | | |
Class 1 | | | 1,035,597 | | | | (23,075,720 | ) |
Class 2 | | | 59,754,476 | | | | (839,107 | ) |
Class 4 | | | 5,000 | | | | — | |
| | | | |
Total capital share transactions | | | 60,795,073 | | | | (23,914,827 | ) |
| | | | |
Net increase (decrease) in net assets | | | 76,539,785 | | | | (15,104,153 | ) |
Net assets: | | | | | | | | |
Beginning of year | | | 547,086,075 | | | | 562,190,228 | |
| | | | |
End of year | | $ | 623,625,860 | | | $ | 547,086,075 | |
| | | | |
Undistributed net investment income included in net assets: | | | | | | | | |
End of year | | $ | 25,082,928 | | | $ | 26,976,620 | |
| | | | |
The accompanying notes are an integral part of these financial statements.
FUS-16
Franklin Templeton Variable Insurance Products Trust
Notes to Financial Statements
Franklin U.S. Government Fund
1. ORGANIZATION AND SIGNIFICANT ACCOUNTING POLICIES
Franklin Templeton Variable Insurance Products Trust (Trust) is registered under the Investment Company Act of 1940, as amended, (1940 Act) as an open-end investment company, consisting of twenty-three separate funds. The Franklin U.S. Government Fund (Fund) is included in this report. The financial statements of the remaining funds in the Trust are presented separately. Shares of the Fund are sold only to insurance company separate accounts to fund the benefits of variable life insurance policies or variable annuity contracts. At December 31, 2008, 74.38% of the Fund’s shares were held through one insurance company. The Fund offers three classes of shares: Class 1, Class 2, and Class 4. Effective February 29, 2008, the Fund began offering a new class of shares, Class 4. Each class of shares differs by its distribution fees, voting rights on matters affecting a single class and its exchange privilege.
The following summarizes the Fund’s significant accounting policies.
a. Security Valuation
Securities listed on a securities exchange or on the NASDAQ National Market System are valued at the last quoted sale price or the official closing price of the day, respectively. Over-the-counter securities and listed securities for which there is no reported sale are valued within the range of the most recent quoted bid and ask prices. Securities that trade in multiple markets or on multiple exchanges are valued according to the broadest and most representative market.
Government securities, mortgage pass-through securities, other mortgage-backed securities, collateralized mortgage obligations and asset-backed securities generally trade in the over-the-counter market rather than on a securities exchange. The Trust may utilize independent pricing services, quotations from bond dealers, and information with respect to bond and note transactions, to assist in determining a current market value for each security. The Trust’s pricing services may use valuation models or matrix pricing which considers information with respect to comparable bond and note transactions, quotations from bond dealers, or by reference to other securities that are considered comparable in such characteristics as rating, interest rate and maturity date, option adjusted spread models, prepayment projections, interest rate spreads and yield curves, to determine current value.
The Trust has procedures to determine the fair value of individual securities and other assets for which market prices are not readily available or which may not be reliably priced. Methods for valuing these securities may include: fundamental analysis, matrix pricing, discounts from market prices of similar securities, or discounts applied due to the nature and duration of restrictions on the disposition of the securities. Due to the inherent uncertainty of valuations of such securities, the fair values may differ significantly from the values that would have been used had a ready market for such investments existed. Occasionally, events occur between the time at which trading in a security is completed and the close of the NYSE that might call into question the availability (including the reliability) of the value of a portfolio security held by the Fund. If such an event occurs, the securities may be valued using fair value procedures, which may include the use of independent pricing services. All security valuation procedures are approved by the Trust’s Board of Trustees.
b. Joint Repurchase Agreement
The Fund may enter into a joint repurchase agreement whereby its uninvested cash balance is deposited into a joint cash account with other funds managed by the investment manager or an affiliate of the investment manager and is used to invest in one or more repurchase agreements. The value and face amount of the joint repurchase agreement are allocated to the funds based on their pro-rata interest. A repurchase agreement is accounted for as a loan by the fund to the seller, collateralized by securities which are delivered to the fund’s custodian. The market value, including accrued interest, of the initial collateralization is required to be at least 102% of the dollar amount invested by the funds, with the value of the underlying securities marked to market daily to maintain coverage of at least 100%. The joint repurchase agreement held by the Fund at year end had been entered into on December 31, 2008. The joint repurchase agreement is valued at cost.
FUS-17
Franklin Templeton Variable Insurance Products Trust
Notes to Financial Statements (continued)
Franklin U.S. Government Fund
1. ORGANIZATION AND SIGNIFICANT ACCOUNTING POLICIES (continued)
c. Securities Purchased on a TBA Basis
The Fund may purchase securities on a to-be-announced (TBA) basis, with payment and delivery scheduled for a future date. These transactions are subject to market fluctuations and are subject to the risk that the value at delivery may be more or less than the trade date purchase price. Although the Fund will generally purchase these securities with the intention of holding the securities, it may sell the securities before the settlement date. Sufficient assets have been segregated for these securities.
d. Mortgage Dollar Rolls
The Fund may enter into mortgage dollar rolls, typically on a TBA basis. Mortgage dollar rolls are agreements between the Fund and a financial institution to simultaneously sell and repurchase mortgage-backed securities at a future date. Gains or losses are realized on the initial sale, and the difference between the repurchase price and the sale price is recorded as an unrealized gain or loss to the fund upon entering into the mortgage dollar roll. In addition, the Fund may invest the cash proceeds that are received from the initial sale. During the period between the sale and repurchase, the Fund is not entitled to principal and interest paid on the mortgage backed securities. The risks of mortgage dollar roll transactions include the potential inability of the counterparty to fulfill its obligations.
e. Income Taxes
No provision has been made for U.S. income taxes because it is the Fund’s policy to qualify as a regulated investment company under the Internal Revenue Code and to distribute to shareholders substantially all of its taxable income and net realized gains.
The Fund has reviewed the tax positions, taken on federal income tax returns, for each of the three open tax years and as of December 31, 2008, and has determined that no provision for income tax is required in the Fund’s financial statements.
f. Security Transactions, Investment Income, Expenses and Distributions
Security transactions are accounted for on trade date. Realized gains and losses on security transactions are determined on a specific identification basis. Interest income and estimated expenses are accrued daily. Amortization of premium and accretion of discount on debt securities are included in interest income. Distributions to shareholders are recorded on the ex-dividend date and are determined according to income tax regulations (tax basis). Distributable earnings determined on a tax basis may differ from earnings recorded in accordance with accounting principles generally accepted in the United States of America. These differences may be permanent or temporary. Permanent differences are reclassified among capital accounts to reflect their tax character. These reclassifications have no impact on net assets or the results of operations. Temporary differences are not reclassified, as they may reverse in subsequent periods.
Common expenses incurred by the Trust are allocated among the funds based on the ratio of net assets of each fund to the combined net assets of the Trust. Fund specific expenses are charged directly to the fund that incurred the expense.
Realized and unrealized gains and losses and net investment income, not including class specific expenses, are allocated daily to each class of shares based upon the relative proportion of net assets of each class. Differences in per share distributions, by class, are generally due to differences in class specific expenses.
g. Accounting Estimates
The preparation of financial statements in accordance with accounting principles generally accepted in the United States of America requires management to make estimates and assumptions that affect the reported amounts of assets and liabilities at the date of the financial statements and the amounts of income and expenses during the reporting period. Actual results could differ from those estimates.
FUS-18
Franklin Templeton Variable Insurance Products Trust
Notes to Financial Statements (continued)
Franklin U.S. Government Fund
1. ORGANIZATION AND SIGNIFICANT ACCOUNTING POLICIES (continued)
h. Guarantees and Indemnifications
Under the Trust’s organizational documents, its officers and trustees are indemnified by the Trust against certain liabilities arising out of the performance of their duties to the Trust. Additionally, in the normal course of business, the Trust, on behalf of the Fund, enters into contracts with service providers that contain general indemnification clauses. The Trust’s maximum exposure under these arrangements is unknown as this would involve future claims that may be made against the Trust that have not yet occurred. Currently, the Trust expects the risk of loss to be remote.
2. SHARES OF BENEFICIAL INTEREST
At December 31, 2008, there were an unlimited number of shares authorized (without par value). Transactions in the Fund’s shares were as follows:
| | | | | | | | | | | | | | |
| | | Year Ended December 31, | |
| | | 2008a | | | 2007 | |
| Class 1 Shares: | | Shares | | | Amount | | | Shares | | | Amount | |
Shares sold | | 1,508,316 | | | $ | 19,454,640 | | | 191,572 | | | $ | 2,420,954 | |
Shares issued in reinvestment of distributions | | 670,267 | | | | 8,197,357 | | | 707,689 | | | | 8,563,032 | |
Shares redeemed | | (2,067,820 | ) | | | (26,616,400 | ) | | (2,694,671 | ) | | | (34,059,706 | ) |
| | | | |
Net increase (decrease) | | 110,763 | | | $ | 1,035,597 | | | (1,795,410 | ) | | $ | (23,075,720 | ) |
| | | | |
| Class 2 Shares: | | | | | | | | | | | | |
Shares sold | | 13,882,490 | | | $ | 175,369,056 | | | 6,944,293 | | | $ | 86,774,866 | |
Shares issued in reinvestment of distributions | | 1,597,620 | | | | 19,267,295 | | | 1,576,264 | | | | 18,820,597 | |
Shares redeemed | | (10,646,552 | ) | | | (134,881,875 | ) | | (8,564,549 | ) | | | (106,434,570 | ) |
| | | | |
Net increase (decrease) | | 4,833,558 | | | $ | 59,754,476 | | | (43,992 | ) | | $ | (839,107 | ) |
| | | | |
| Class 4 Shares: | | | | | | | | | | | | |
Shares sold | | 379 | | | $ | 5,000 | | | | | | | | |
| | | | | | | | | | |
aFor | the period February 29, 2008 (effective date) to December 31, 2008 for Class 4. |
3. TRANSACTIONS WITH AFFILIATES
Franklin Resources, Inc. is the holding company for various subsidiaries that together are referred to as Franklin Templeton Investments. Certain officers and trustees of the Trust are also officers and/or directors of the following subsidiaries:
| | |
| Subsidiary | | Affiliation |
Franklin Advisers, Inc. (Advisers) | | Investment manager |
Franklin Templeton Services, LLC (FT Services) | | Administrative manager |
Franklin Templeton Distributors, Inc. (Distributors) | | Principal underwriter |
Franklin Templeton Investor Services, LLC (Investor Services) | | Transfer agent |
FUS-19
Franklin Templeton Variable Insurance Products Trust
Notes to Financial Statements (continued)
Franklin U.S. Government Fund
3. TRANSACTIONS WITH AFFILIATES (continued)
a. Management Fees
The Fund pays an investment management fee to Advisers based on the average daily net assets of the Fund as follows:
| | |
| Annualized Fee Rate | | Net Assets |
| 0.625% | | Up to and including $100 million |
| 0.500% | | Over $100 million, up to and including $250 million |
| 0.450% | | Over $250 million, up to and including $7.5 billion |
| 0.440% | | Over $7.5 billion, up to and including $10 billion |
| 0.430% | | Over $10 billion, up to and including $12.5 billion |
| 0.420% | | Over $12.5 billion, up to and including $15 billion |
| 0.400% | | In excess of $15 billion |
b. Administrative Fees
Under an agreement with Advisers, FT Services provides administrative services to the Fund. The fee is paid by Advisers based on average daily net assets, and is not an additional expense of the Fund.
c. Distribution Fees
The Fund’s Board of Trustees has adopted distribution plans for Class 2 and Class 4 shares pursuant to Rule 12b-1 under the 1940 Act. Under the Fund’s compensation distribution plans, the Fund pays Distributors for costs incurred in connection with the servicing, sale and distribution of the Fund’s shares up to 0.35% per year of its average daily net assets of each class. The Board of Trustees has agreed to limit the current rate to 0.25% per year for Class 2.
d. Transfer Agent Fees
Investor Services, under terms of an agreement, performs shareholder servicing for the Fund and is not paid by the Fund for the services.
4. EXPENSE OFFSET ARRANGEMENT
The Fund has entered into an arrangement with its custodian whereby credits realized as a result of uninvested cash balances are used to reduce a portion of the Fund’s custodian expenses. During the year ended December 31, 2008, the custodian fees were reduced as noted in the Statement of Operations.
5. INCOME TAXES
For tax purposes, capital losses may be carried over to offset future capital gains, if any. At December 31, 2008, the capital loss carryforwards were as follows:
| | | |
Capital loss carryforwards expiring in: | | | |
2011 | | $ | 4,558,723 |
2012 | | | 3,331,578 |
2013 | | | 2,102,640 |
2014 | | | 1,618,397 |
2015 | | | 2,329,071 |
2016 | | | 841,479 |
| | | |
| | $ | 14,781,888 |
| | | |
FUS-20
Franklin Templeton Variable Insurance Products Trust
Notes to Financial Statements (continued)
Franklin U.S. Government Fund
5. INCOME TAXES (continued)
On December 31, 2008, the Fund had expired capital loss carryforwards of $5,752,213, which were reclassified to paid-in capital.
For tax purposes, realized capital losses, occurring subsequent to October 31, may be deferred and treated as occurring on the first day of the following fiscal year. At December 31, 2008, the Fund deferred realized capital losses of $93,640.
The tax character of distributions paid during the years ended December 31, 2008 and 2007, was as follows:
| | | | | | |
| | | 2008 | | 2007 |
Distributions paid from – ordinary income: | | $ | 27,464,905 | | $ | 27,383,629 |
| | | |
At December 31, 2008, the cost of investments, net unrealized appreciation (depreciation), and undistributed ordinary income for income tax purposes were as follows:
| | | | |
Cost of investments | | $ | 600,065,360 | |
| | | | |
| |
Unrealized appreciation | | $ | 27,119,730 | |
Unrealized depreciation | | | (369,385 | ) |
| | | | |
Net unrealized appreciation (depreciation) | | $ | 26,750,345 | |
| | | | |
Distributable earnings – undistributed ordinary income | | $ | 25,690,142 | |
| | | | |
Net investment income differs for financial statement and tax purposes primarily due to differing treatments of mortgage dollar rolls, paydown losses and bond discounts and premiums.
Net realized gains (losses) differ for financial statement and tax purposes primarily due to differing treatments of wash sales, mortgage dollar rolls, paydown losses and bond discounts and premiums.
6. INVESTMENT TRANSACTIONS
Purchases and sales of investments (excluding short term securities) for the year ended December 31, 2008, aggregated $138,082,157 and $91,983,224, respectively.
7. FAIR VALUE MEASUREMENTS
The Fund adopted Financial Accounting Standards Board (FASB) Statement No. 157, “Fair Value Measurement” (SFAS 157), on January 1, 2008. SFAS 157 defines fair value, establishes a framework for measuring fair value, and expands disclosures about fair value measurements. The Fund has determined that the implementation of SFAS 157 did not have a material impact on the Fund’s financial statements.
SFAS 157 establishes a fair value hierarchy that distinguishes between market data obtained from independent sources (observable inputs) and the Fund’s own market assumptions (unobservable inputs). These inputs are used in determining the value of the Fund’s investments and are summarized in the following fair value hierarchy:
| | • | | Level 1 – quoted prices in active markets for identical securities |
| | • | | Level 2 – other significant observable inputs (including quoted prices for similar securities, interest rates, prepayment speed, credit risk, etc.) |
| | • | | Level 3 – significant unobservable inputs (including the Fund’s own assumptions in determining the fair value of investments) |
FUS-21
Franklin Templeton Variable Insurance Products Trust
Notes to Financial Statements (continued)
Franklin U.S. Government Fund
7. FAIR VALUE MEASUREMENTS (continued)
The inputs or methodology used for valuing securities are not an indication of the risk associated with investing in those securities.
At December 31, 2008, all of the Fund’s investments in securities carried at fair value were in Level 2 inputs.
8. SUBSEQUENT EVENT
On January 23, 2009, the Fund entered into, along with certain other funds managed by Franklin Templeton Investments (individually, “Borrower”; collectively “Borrowers”), a $725 million senior unsecured syndicated global line of credit (“Global Credit Facility”) to provide a source of funds to the Borrowers for temporary and emergency purposes and to meet future unanticipated or unusually large redemption requests.
Under the terms of the Global Credit Facility, each Borrower has agreed to pay its proportionate share of fees and expenses incurred in connection with the implementation and maintenance of the Global Credit Facility.
ABBREVIATIONS
Selected Portfolio
FFCB - Federal Farm Credit Bank
FHLB - Federal Home Loan Bank
FICO - Financing Corp.
FRN - Floating Rate Note
GL - Government Loan
HUD - Housing and Urban Development
PC - Participation Certificate
PL - Project Loan
SBA - Small Business Administration
SF - Single Family
TVA - Tennessee Valley Authority
FUS-22
Franklin Templeton Variable Insurance Products Trust
Franklin U.S. Government Fund
Report of Independent Registered Public Accounting Firm
To the Board of Trustees and Shareholders of
Franklin Templeton Variable Insurance Products Trust
In our opinion, the accompanying statement of assets and liabilities, including the statement of investments, and the related statements of operations and of changes in net assets and the financial highlights present fairly, in all material respects, the financial position of Franklin U.S. Government Fund (one of the funds constituting the Franklin Templeton Variable Insurance Products Trust, hereafter referred to as the “Fund”) at December 31, 2008, the results of its operations for the year then ended, the changes in its net assets for each of the two years in the period then ended and the financial highlights for the periods presented, in conformity with accounting principles generally accepted in the United States of America. These financial statements and financial highlights (hereafter referred to as “financial statements”) are the responsibility of the Fund’s management. Our responsibility is to express an opinion on these financial statements based on our audits. We conducted our audits of these financial statements in accordance with the standards of the Public Company Accounting Oversight Board (United States). Those standards require that we plan and perform the audit to obtain reasonable assurance about whether the financial statements are free of material misstatement. An audit includes examining, on a test basis, evidence supporting the amounts and disclosures in the financial statements, assessing the accounting principles used and significant estimates made by management, and evaluating the overall financial statement presentation. We believe that our audits, which included confirmation of securities at December 31, 2008 by correspondence with the custodian, provide a reasonable basis for our opinion.
PricewaterhouseCoopers LLP
San Francisco, California
February 10, 2009
FUS-23
FRANKLIN ZERO COUPON FUND 2010
This annual report for Franklin Zero Coupon Fund 2010 covers the fiscal year ended December 31, 2008.
Performance Summary as of 12/31/08
Average annual total return of Class 1 shares represents the average annual change in value, assuming reinvestment of dividends and capital gains. Average returns smooth out variations in returns, which can be significant; they are not the same as year-by-year results.
Periods ended 12/31/08
| | | | | | |
| | | 1-Year | | 5-Year | | 10-Year |
Average Annual Total Return | | +7.50% | | +4.98% | | +5.73% |
Total Return Index Comparison for a Hypothetical $10,000 Investment (1/1/99–12/31/08)
The graph below shows the change in value of a hypothetical $10,000 investment in the Fund over the indicated period and includes reinvestment of any income or distributions. The Fund’s performance is compared to the performance of the Merrill Lynch (ML) 2-Year and 5-Year Zero Coupon Bond Indexes, the Lipper VIP General Bond Funds Classification Average, as well as the Consumer Price Index (CPI). One cannot invest directly in an index, nor is an index representative of the Fund’s portfolio. Please see Important Notes to Performance Information preceding the Fund Summaries.
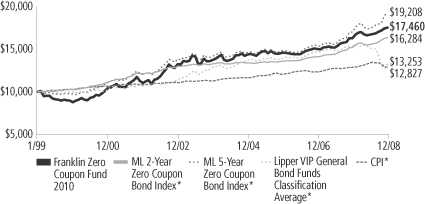
*Sources: © 2009 Morningstar; Lipper Inc. Please see Index Descriptions following the Fund Summaries.
Franklin Zero Coupon Fund 2010 – Class 1
Performance reflects the Fund’s Class 1 operating expenses, but does not include any contract fees, expenses or sales charges. If they had been included, performance would be lower. These charges and deductions, particularly for variable life policies, can have a significant effect on contract values and insurance benefits. See the contract prospectus for a complete description of these expenses, including sales charges.
Performance data represent past performance, which does not guarantee future results. Investment return and principal value will fluctuate, and you may have a gain or loss when you sell your shares. Current performance may differ from figures shown.
FZ10-1
Fund Goal and Main Investments: Franklin Zero Coupon Fund 2010 seeks as high an investment return as is consistent with capital preservation. The Fund normally invests at least 80% of its net assets in zero coupon debt securities and may invest some or all of its assets in U.S. Treasury issued stripped securities and stripped securities issued by the U.S. government, or its agencies and authorities.
Performance Overview
You can find the Fund’s one-year total return in the Performance Summary. For comparison, the Fund’s benchmarks, the ML 2-Year Zero Coupon Bond Index returned +7.42% and the ML 5-Year Zero Coupon Bond Index returned +13.42% for the same period.1 We will discontinue the use of the ML 5-Year Zero Coupon Bond Index as a benchmark for the Fund. The ML 2-Year Zero Coupon Bond Index better reflects the Fund’s holdings as it nears its 2010 target date. The Fund outperformed its peers in the Lipper VIP General Bond Funds Classification Average, which had a -9.18% total return.2
Economic and Market Overview
In 2008, economic conditions deteriorated. The Conference Board’s Consumer Confidence Index fell to an all-time low since it began in 1967 as the U.S. economy faltered and stock markets declined. The government’s abrupt conservatorship of Fannie Mae and Freddie Mac and the failure of several blue-chip banks and financial institutions roiled equity markets. Despite government interventions and massive emergency funding, the nation’s economic troubles were exacerbated as manufacturing activity weakened at its fastest pace in nearly 30 years and as home prices continued to fall. Jobless claims mounted and the unemployment rate rose to 7.2% by period-end.3 Economic growth, as measured by gross domestic product (GDP), rebounded from a 0.9% annualized rate in the first quarter of 2008 to a 2.8% annualized pace in the second quarter, largely due to strong exports and government spending. However, in the third and fourth quarters of 2008, GDP fell at annualized rates of 0.5% and an estimated 3.8%, reflecting a broad-based contraction in consumer spending, falling corporate profits and slowing export growth.
1. Source: © 2009 Morningstar.
2. Source: Lipper Inc.
One cannot invest directly in an index, nor is an index representative of the Fund’s portfolio. Please see Index Descriptions following the Fund Summaries.
3. Source: Bureau of Labor Statistics.
Fund Risks: Changes in interest rates affect the prices of the Fund’s debt securities. If interest rates rise, the value of the Fund’s debt securities will fall and so will the Fund’s share price. Because zero coupon securities do not pay interest, their market value can fall more dramatically when interest rates rise than interest-paying securities of similar maturities. The Fund’s prospectus also includes a description of the main investment risks.
FZ10-2
Oil prices soared to a record high in July, rising above $145 per barrel, before dramatically retreating to $45 by period-end. Many other commodities such as agricultural products and precious and base metals followed similar trends. Partially as a result of the steep price corrections, inflation declined significantly late in the review period, and December’s inflation rate was an annualized 0.1%.3 Core inflation, which excludes food and energy costs, rose at a 1.8% annual rate; this level was within the Federal Reserve Board’s (Fed’s) informal target range of 1.5%–2.0%.3 The core personal consumption expenditures price index reported a 12-month increase of 1.7%.4
A slowing economy and decelerating inflation prompted policymakers to further lower interest rates and enact stimulus plans. During the year under review, the Fed lowered the federal funds target rate to a range of 0% to 0.25% from 4.25% at the start of the reporting period. The Fed and U.S. Treasury Department also introduced new programs such as the Primary Dealer Credit Facility (PDCF) and the Troubled Asset Relief Program (TARP), which were intended to stimulate market liquidity.
Volatility remained high throughout the reporting period but intensified in the latter half of the year as stocks fluctuated wildly, Treasury prices soared and yields across the maturity spectrum plummeted. Investors drove the yield on the three-month Treasury bill to a multi-decade low, and LIBOR (London InterBank Offered Rate) rates, which banks charge one another for loans, jumped to record highs. Fixed income spreads were generally wide relative to Treasury yields over the period due to heightened market turbulence and risk aversion. The yield curve steepened and the spread between the two-year Treasury yield and the 10-year Treasury yield increased to 149 basis points (100 basis points equal one percentage point) at the end of December from 99 basis points at the beginning of the reporting period. The two-year Treasury bill yield fell from 3.05% to 0.76% over the 12-month period. Over the same period, the 10-year U.S. Treasury note yield fell from 4.04% to 2.25%.
Investment Strategy
In selecting investments for the Fund, we seek to keep the Fund’s average duration to within 12 months of its maturity Target Date. Duration is a measure of the length of an investment, taking into account the timing and amount of any interest payments and the
principal repayment. Duration is also a measure of a bond’s price
4. Source: Bureau of Economic Analysis.
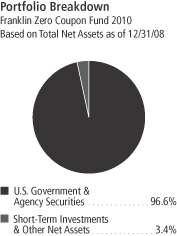
The dollar value, number of shares or principal amount, and names of all portfolio holdings are listed in the Fund’s Statement of Investments.
FZ10-3
sensitivity to interest rates. We analyze securities using both proprietary and nonproprietary research seeking to identify attractive investment opportunities.
Manager’s Discussion
During the 12-month period ended December 31, 2008, the fixed income market experienced extraordinary volatility and uncertainty. At times positive developments in the financials sector, together with substantial fiscal and monetary stimulus, set a more constructive tone for fixed income markets, but overall conditions remained challenging as concerns lingered over financial market and economic stability. The credit crunch was also felt in real-time economic indicators, which continued to weaken as the period progressed. As fear and volatility dominated market sentiment, investors became increasingly risk averse, which led to a substantial rally in U.S. Treasuries.
During the review period, the Fund was primarily invested in zero coupon and stripped securities issued by government-related entities and other high-quality issuers, which outperformed lower-quality sectors such as corporate high yield bonds. In many cases stripped securities outperformed coupon bearing counterparts due to stripped securities’ somewhat greater interest rate sensitivity.
During the review period, we remained committed to our investment process as we sought high-quality investments with what we believed were attractive valuations. Consistent with our investment strategy, we also continued to emphasize zero coupon and stripped securities with maturities near the Fund’s target date.
Thank you for your participation in Franklin Zero Coupon Fund 2010. We look forward to serving your future investment needs.
The foregoing information reflects our analysis, opinions and portfolio holdings as of December 31, 2008, the end of the reporting period. The way we implement our main investment strategies and the resulting portfolio holdings may change depending on factors such as market and economic conditions. These opinions may not be relied upon as investment advice or an offer for a particular security. The information is not a complete analysis of every aspect of any market, country, industry, security or the Fund. Statements of fact are from sources considered reliable, but the investment manager makes no representation or warranty as to their completeness or accuracy. Although historical performance is no guarantee of future results, these insights may help you understand our investment management philosophy.
FZ10-4
Fund Expenses
As an investor in a variable insurance contract (Contract) that indirectly provides for investment in an underlying mutual fund, you can incur transaction and/or ongoing expenses at both the Fund level and the Contract level.
| • | | Transaction expenses can include sales charges (loads) on purchases, redemption fees, surrender fees, transfer fees and premium taxes. |
| • | | Ongoing expenses can include management fees, distribution and service (12b-1) fees, contract fees, annual maintenance fees, mortality and expense risk fees and other fees and expenses. All mutual funds and Contracts have some types of ongoing expenses. |
The expenses shown in the table are meant to highlight ongoing expenses at the Fund level only and do not include ongoing expenses at the Contract level, or transaction expenses at either the Fund or Contract level. While the Fund does not have transaction expenses, if the transaction and ongoing expenses at the Contract level were included, the expenses shown below would be higher. You should consult your Contract prospectus or disclosure document for more information.
The table shows Fund-level ongoing expenses and can help you understand these expenses and compare them with those of other mutual funds offered through the Contract. The table assumes a $1,000 investment held for the six months indicated. Please refer to the Fund prospectus for additional information on operating expenses.
Actual Fund Expenses
The first line (Actual) of the table provides actual account values and expenses. The “Ending Account Value” is derived from the Fund’s actual return, which includes the effect of ongoing Fund expenses, but does not include the effect of ongoing Contract expenses.
You can estimate the Fund-level expenses you incurred during the period by following these steps. Of course, your account value and expenses will differ from those in this illustration:
| 1. | Divide your account value by $1,000. |
If an account had an $8,600 value, then $8,600 ÷ $1,000 = 8.6.
| 2. | Multiply the result by the number under the heading “Fund-Level Expenses Incurred During Period.” |
If Fund-Level Expenses Incurred During Period were $7.50, then 8.6 x $7.50 = $64.50.
In this illustration, the estimated expenses incurred this period at the Fund level are $64.50.
Franklin Zero Coupon Fund 2010 – Class 1
FZ10-5
Hypothetical Example for Comparison with Other Mutual Funds
Information in the second line (Hypothetical) of the table can help you compare ongoing expenses of the Fund with those of other mutual funds offered through the Contract. This information may not be used to estimate the actual ending account balance or expenses you incurred during the period. The hypothetical “Ending Account Value” is based on the Fund’s actual expense ratio and an assumed 5% annual rate of return before expenses, which does not represent the Fund’s actual return. The figure under the heading “Fund-Level Expenses Incurred During Period” shows the hypothetical expenses your account would have incurred under this scenario. You can compare this figure with the 5% hypothetical examples that appear in shareholder reports of other funds offered through a Contract.
| | | | | | | | | |
| Class 1 | | Beginning
Account Value 7/1/08 | | Ending Account Value 12/31/08 | | Fund-Level
Expenses Incurred
During Period*
7/1/08–12/31/08 |
Actual | | $ | 1,000 | | $ | 1,049.70 | | $ | 3.56 |
Hypothetical (5% return before expenses) | | $ | 1,000 | | $ | 1,021.67 | | $ | 3.51 |
*Expenses are calculated using the most recent six-month annualized expense ratio for the Fund’s Class 1 shares (0.69%), which does not include any ongoing expenses of the Contract for which the Fund is an investment option, multiplied by the average account value over the period, multiplied by 184/366 to reflect the one-half year period.
FZ10-6
Franklin Templeton Variable Insurance Products Trust
Financial Highlights
Franklin Zero Coupon Fund – 2010
| | | | | | | | | | | | | | | | | | | | |
| | | Year Ended December 31, | |
| Class 1 | | 2008 | | | 2007 | | | 2006 | | | 2005 | | | 2004 | |
| | | | |
Per share operating performance | | | | | | | | | | | | | | | | | | | | |
(for a share outstanding throughout the year) | | | | | | | | | | | | | | | | | | | | |
Net asset value, beginning of year | | $ | 16.30 | | | $ | 15.80 | | | $ | 16.02 | | | $ | 16.49 | | | $ | 16.55 | |
| | | | |
Income from investment operationsa: | | | | | | | | | | | | | | | | | | | | |
Net investment incomeb | | | 0.78 | | | | 0.78 | | | | 0.77 | | | | 0.80 | | | | 0.81 | |
Net realized and unrealized gains (losses) | | | 0.39 | | | | 0.52 | | | | (0.36 | ) | | | (0.54 | ) | | | (0.08 | ) |
| | | | |
Total from investment operations | | | 1.17 | | | | 1.30 | | | | 0.41 | | | | 0.26 | | | | 0.73 | |
| | | | |
Less distributions from: | | | | | | | | | | | | | | | | | | | | |
Net investment income | | | (0.79 | ) | | | (0.80 | ) | | | (0.63 | ) | | | (0.72 | ) | | | (0.79 | ) |
Net realized gains | | | — | | | | — | | | | — | | | | (0.01 | ) | | | — | |
| | | | |
Total distributions | | | (0.79 | ) | | | (0.80 | ) | | | (0.63 | ) | | | (0.73 | ) | | | (0.79 | ) |
| | | | |
Net asset value, end of year | | $ | 16.68 | | | $ | 16.30 | | | $ | 15.80 | | | $ | 16.02 | | | $ | 16.49 | |
| | | | |
| | | | | |
Total returnc | | | 7.50% | | | | 8.62% | | | | 2.71% | | | | 1.54% | | | | 4.72% | |
Ratios to average net assets | | | | | | | | | | | | | | | | | | | | |
Expenses | | | 0.68% | | | | 0.66% | d | | | 0.67% | d | | | 0.69% | | | | 0.68% | |
Net investment income | | | 4.74% | | | | 4.94% | | | | 4.89% | | | | 4.93% | | | | 4.91% | |
| | | | | |
Supplemental data | | | | | | | | | | | | | | | | | | | | |
Net assets, end of year (000’s) | | $ | 122,058 | | | $ | 95,583 | | | $ | 93,184 | | | $ | 101,555 | | | $ | 78,978 | |
Portfolio turnover rate | | | 10.39% | | | | 4.49% | | | | 2.00% | | | | —% | | | | 11.74% | |
aThe amount shown for a share outstanding throughout the period may not correlate with the Statement of Operations for the period due to the timing of sales and repurchases of the Fund shares in relation to income earned and/or fluctuating market value of the investments of the Fund.
bBased on average daily shares outstanding.
cTotal return does not include any fees, charges or expenses imposed by the variable annuity and life insurance contracts for which the Franklin Templeton Variable Insurance Products Trust serves as an underlying investment vehicle.
dBenefit of expense reduction rounds to less than 0.01%.
The accompanying notes are an integral part of these financial statements.
FZ10-7
Franklin Templeton Variable Insurance Products Trust
Financial Highlights (continued)
Franklin Zero Coupon Fund – 2010
| | | | | | | | | | | | | | | | | | | | |
| | | Year Ended December 31, | |
| Class 2 | | 2008 | | | 2007 | | | 2006 | | | 2005 | | | 2004 | |
| | | | |
Per share operating performance | | | | | | | | | | | | | | | | | | | | |
(for a share outstanding throughout the year) | | | | | | | | | | | | | | | | | | | | |
Net asset value, beginning of year | | $ | 16.22 | | | $ | 15.72 | | | $ | 15.96 | | | $ | 16.43 | | | $ | 16.52 | |
| | | | |
Income from investment operationsa: | | | | | | | | | | | | | | | | | | | | |
Net investment incomeb | | | 0.74 | | | | 0.73 | | | | 0.73 | | | | 0.76 | | | | 0.77 | |
Net realized and unrealized gains (losses) | | | 0.39 | | | | 0.53 | | | | (0.37 | ) | | | (0.54 | ) | | | (0.08 | ) |
| | | | |
Total from investment operations | | | 1.13 | | | | 1.26 | | | | 0.36 | | | | 0.22 | | | | 0.69 | |
| | | | |
Less distributions from: | | | | | | | | | | | | | | | | | | | | |
Net investment income | | | (0.74 | ) | | | (0.76 | ) | | | (0.60 | ) | | | (0.68 | ) | | | (0.78 | ) |
Net realized gains | | | — | | | | — | | | | — | | | | (0.01 | ) | | | — | |
| | | | |
Total distributions | | | (0.74 | ) | | | (0.76 | ) | | | (0.60 | ) | | | (0.69 | ) | | | (0.78 | ) |
| | | | |
Net asset value, end of year | | $ | 16.61 | | | $ | 16.22 | | | $ | 15.72 | | | $ | 15.96 | | | $ | 16.43 | |
| | | | |
| | | | | |
Total returnc | | | 7.23% | | | | 8.41% | | | | 2.39% | | | | 1.32% | | | | 4.45% | |
Ratios to average net assets | | | | | | | | | | | | | | | | | | | | |
Expenses | | | 0.93% | | | | 0.91% | d | | | 0.92% | d | | | 0.94% | | | | 0.93% | |
Net investment income | | | 4.49% | | | | 4.69% | | | | 4.64% | | | | 4.68% | | | | 4.66% | |
| | | | | |
Supplemental data | | | | | | | | | | | | | | | | | | | | |
Net assets, end of year (000’s) | | $ | 17,392 | | | $ | 17,424 | | | $ | 25,982 | | | $ | 24,040 | | | $ | 14,251 | |
Portfolio turnover rate | | | 10.39% | | | | 4.49% | | | | 2.00% | | | | —% | | | | 11.74% | |
aThe amount shown for a share outstanding throughout the period may not correlate with the Statement of Operations for the period due to the timing of sales and repurchases of the Fund shares in relation to income earned and/or fluctuating market value of the investments of the Fund.
bBased on average daily shares outstanding.
cTotal return does not include any fees, charges or expenses imposed by the variable annuity and life insurance contracts for which the Franklin Templeton Variable Insurance Products Trust serves as an underlying investment vehicle.
dBenefit of expense reduction rounds to less than 0.01%.
The accompanying notes are an integral part of these financial statements.
FZ10-8
Franklin Templeton Variable Insurance Products Trust
Statement of Investments, December 31, 2008
| | | | | | |
| Franklin Zero Coupon Fund – 2010 | | Principal
Amount | | Value |
U.S. Government and Agency Securities 96.6% | | | | | | |
FHLMC, Strip,
7/15/10 | | $ | 11,150,000 | | $ | 10,962,893 |
1/15/11 | | | 10,629,000 | | | 10,345,078 |
FICO, Strip,
19, 6/06/10 | | | 9,800,000 | | | 9,651,579 |
A, 8/08/10 | | | 7,000,000 | | | 6,875,470 |
FNMA, Strip,
8/12/09 | | | 1,975,000 | | | 1,964,167 |
8/01/10 | | | 8,250,000 | | | 8,059,978 |
8/12/10 | | | 1,230,000 | | | 1,209,843 |
International Bank for Reconstruction & Development (Supranationala),
2, zero cpn., 2/15/11 | | | 500,000 | | | 486,817 |
zero cpn., 2/15/11 | | | 1,392,000 | | | 1,355,298 |
zero cpn., 2/15/12 | | | 2,800,000 | | | 2,652,896 |
zero cpn., 2/15/13 | | | 3,287,000 | | | 3,019,356 |
zero cpn., 8/15/13 | | | 4,100,000 | | | 3,730,799 |
Resolution Funding, Strip, 10/15/10 | | | 10,000,000 | | | 9,841,270 |
TVA, Strip,
1/01/10 | | | 412,000 | | | 407,384 |
4/15/10 | | | 12,000,000 | | | 11,882,964 |
10/15/10 | | | 1,320,000 | | | 1,300,667 |
1/15/11 | | | 10,669,000 | | | 10,443,105 |
10/15/11 | | | 7,295,000 | | | 7,024,020 |
U.S. Treasury, Strip,
2/15/11 | | | 33,000,000 | | | 32,477,808 |
2/15/11 | | | 1,000,000 | | | 988,286 |
| | | | | | |
Total U.S. Government and Agency Securities (Cost $123,661,952) | | | | | | 134,679,678 |
| | | | | | |
Short Term Investments (Cost $4,651,821) 3.3% | | | | | | |
Repurchase Agreements 3.3% | | | | | | |
bJoint Repurchase Agreement, 0.019%, 1/02/09 (Maturity Value $4,651,826) | | | 4,651,821 | | | 4,651,821 |
Banc of America Securities LLC (Maturity Value $717,964) | | | | | | |
Barclays Capital Inc. (Maturity Value $683,818) | | | | | | |
BNP Paribas Securities Corp. (Maturity Value $911,758) | | | | | | |
Credit Suisse Securities (USA) LLC (Maturity Value $911,758) | | | | | | |
Deutsche Bank Securities Inc. (Maturity Value $526,168) | | | | | | |
HSBC Securities (USA) Inc. (Maturity Value $683,818) | | | | | | |
UBS Securities LLC (Maturity Value $216,542) | | | | | | |
Collateralized by U.S. Government Agency Securities, 3.50% - 7.00%, 6/15/09 - 5/20/22; cU.S. Government Agency Discount Notes, 1/05/09 - 10/19/09; cU.S. Treasury Bills, 1/15/09; and U.S. Treasury Notes, 0.875% - 4.625%, 7/15/09 - 2/28/11 | | | | | | |
| | | | | | |
Total Investments (Cost $128,313,773) 99.9% | | | | | | 139,331,499 |
Other Assets, less Liabilities 0.1% | | | | | | 118,625 |
| | | | | | |
Net Assets 100.0% | | | | | $ | 139,450,124 |
| | | | | | |
See Abbreviations on page FZ10-17.
aA supranational organization is an entity formed by two or more central governments through international treaties.
bSee Note 1(b) regarding joint repurchase agreement.
cThe security is traded on a discount basis with no stated coupon rate.
The accompanying notes are an integral part of these financial statements.
FZ10-9
Franklin Templeton Variable Insurance Products Trust
Financial Statements
Statement of Assets and Liabilities
December 31, 2008
| | | | |
| | | Franklin
Zero Coupon
Fund – 2010 | |
Assets: | | | | |
Investments in securities: | | | | |
Cost - Unaffiliated issuers | | $ | 123,661,952 | |
Cost - Repurchase agreements | | | 4,651,821 | |
| | | | |
Total cost of investments | | $ | 128,313,773 | |
| | | | |
Value - Unaffiliated issuers | | $ | 134,679,678 | |
Value - Repurchase agreements | | | 4,651,821 | |
| | | | |
Total value of investments | | | 139,331,499 | |
Receivables from capital shares sold | | | 259,232 | |
| | | | |
Total assets | | | 139,590,731 | |
| | | | |
Liabilities: | | | | |
Payables: | | | | |
Capital shares redeemed | | | 3,404 | |
Affiliates | | | 75,943 | |
Reports to shareholders | | | 36,585 | |
Professional fees | | | 23,651 | |
Accrued expenses and other liabilities | | | 1,024 | |
| | | | |
Total liabilities | | | 140,607 | |
| | | | |
Net assets, at value | | $ | 139,450,124 | |
| | | | |
Net assets consist of: | | | | |
Paid-in capital | | $ | 123,109,917 | |
Undistributed net investment income | | | 5,854,954 | |
Net unrealized appreciation (depreciation) | | | 11,017,726 | |
Accumulated net realized gain (loss) | | | (532,473 | ) |
| | | | |
Net assets, at value | | $ | 139,450,124 | |
| | | | |
Class 1: | | | | |
Net assets, at value | | $ | 122,058,368 | |
| | | | |
Shares outstanding | | | 7,315,761 | |
| | | | |
Net asset value and maximum offering price per share | | $ | 16.68 | |
| | | | |
Class 2: | | | | |
Net assets, at value | | $ | 17,391,756 | |
| | | | |
Shares outstanding | | | 1,046,895 | |
| | | | |
Net asset value and maximum offering price per share | | $ | 16.61 | |
| | | | |
The accompanying notes are an integral part of these financial statements.
FZ10-10
Franklin Templeton Variable Insurance Products Trust
Financial Statements (continued)
Statement of Operations
for the year ended December 31, 2008
| | | |
| | | Franklin
Zero Coupon
Fund – 2010 |
Investment income: | | | |
Interest | | $ | 6,742,051 |
| | | |
Expenses: | | | |
Management fees (Note 3a) | | | 746,456 |
Distribution fees - Class 2 (Note 3c) | | | 43,248 |
Unaffiliated transfer agent fees | | | 272 |
Custodian fees (Note 4) | | | 2,093 |
Reports to shareholders | | | 58,583 |
Professional fees | | | 26,363 |
Trustees’ fees and expenses | | | 552 |
Other | | | 9,620 |
| | | |
Total expenses | | | 887,187 |
| | | |
Net investment income | | | 5,854,864 |
| | | |
Realized and unrealized gains (losses): | | | |
Net realized gain (loss) from investments | | | 86,934 |
Net change in unrealized appreciation (depreciation) on investments | | | 2,912,702 |
| | | |
Net realized and unrealized gain (loss) | | | 2,999,636 |
| | �� | |
Net increase (decrease) in net assets resulting from operations | | $ | 8,854,500 |
| | | |
The accompanying notes are an integral part of these financial statements.
FZ10-11
Franklin Templeton Variable Insurance Products Trust
Financial Statements (continued)
Statements of Changes in Net Assets
| | | | | | | | |
| | | Franklin Zero
Coupon Fund – 2010 | |
| | | Year Ended December 31, | |
| | | 2008 | | | 2007 | |
| | | | |
Increase (decrease) in net assets: | | | | | | | | |
Operations: | | | | | | | | |
Net investment income | | $ | 5,854,864 | | | $ | 5,713,301 | |
Net realized gain (loss) from investments | | | 86,934 | | | | (155,461 | ) |
Net change in unrealized appreciation (depreciation) on investments | | | 2,912,702 | | | | 3,846,601 | |
| | | | |
Net increase (decrease) in net assets resulting from operations | | | 8,854,500 | | | | 9,404,441 | |
| | | | |
Distributions to shareholders from net investment income: | | | | | | | | |
Class 1 | | | (4,956,480 | ) | | | (4,640,419 | ) |
Class 2 | | | (757,070 | ) | | | (1,293,395 | ) |
| | | | |
Total distributions to shareholders | | | (5,713,550 | ) | | | (5,933,814 | ) |
| | | | |
Capital share transactions: (Note 2) | | | | | | | | |
Class 1 | | | 23,777,343 | | | | (767,210 | ) |
Class 2 | | | (475,241 | ) | | | (8,861,810 | ) |
| | | | |
Total capital share transactions | | | 23,302,102 | | | | (9,629,020 | ) |
| | | | |
Net increase (decrease) in net assets | | | 26,443,052 | | | | (6,158,393 | ) |
Net assets: | | | | | | | | |
Beginning of year | | | 113,007,072 | | | | 119,165,465 | |
| | | | |
End of year | | $ | 139,450,124 | | | $ | 113,007,072 | |
| | | | |
Undistributed net investment income included in net assets: | | | | | | | | |
End of year | | $ | 5,854,954 | | | $ | 5,713,683 | |
| | | | |
The accompanying notes are an integral part of these financial statements.
FZ10-12
Franklin Templeton Variable Insurance Products Trust
Notes to Financial Statements
Franklin Zero Coupon Fund – 2010
1. ORGANIZATION AND SIGNIFICANT ACCOUNTING POLICIES
Franklin Templeton Variable Insurance Products Trust (Trust) is registered under the Investment Company Act of 1940, as amended, (1940 Act) as an open-end investment company, consisting of twenty-three separate funds. The Franklin Zero Coupon Fund – 2010 (Fund) is included in this report. The financial statements of the remaining funds in the Trust are presented separately. Shares of the Fund are sold only to insurance company separate accounts to fund the benefits of variable life insurance policies or variable annuity contracts. At December 31, 2008, 87.47% of the Fund’s shares were held through one insurance company. The Fund offers two classes of shares: Class 1 and Class 2. Each class of shares differs by its distribution fees, voting rights on matters affecting a single class and its exchange privilege.
The following summarizes the Fund’s significant accounting policies.
a. Security Valuation
Securities listed on a securities exchange or on the NASDAQ National Market System are valued at the last quoted sale price or the official closing price of the day, respectively. Over-the-counter securities and listed securities for which there is no reported sale are valued within the range of the most recent quoted bid and ask prices. Securities that trade in multiple markets or on multiple exchanges are valued according to the broadest and most representative market.
Government securities generally trade in the over-the-counter market rather than on a securities exchange. The Trust may utilize independent pricing services, quotations from bond dealers, and information with respect to bond and note transactions, to assist in determining a current market value for each security. The Trust’s pricing services may use valuation models or matrix pricing which considers information with respect to comparable bond and note transactions, quotations from bond dealers, or by reference to other securities that are considered comparable in such characteristics as rating, interest rate and maturity date, option adjusted spread models, prepayment projections, interest rate spreads and yield curves, to determine current value.
The Trust has procedures to determine the fair value of individual securities and other assets for which market prices are not readily available or which may not be reliably priced. Methods for valuing these securities may include: fundamental analysis, matrix pricing, discounts from market prices of similar securities, or discounts applied due to the nature and duration of restrictions on the disposition of the securities. Due to the inherent uncertainty of valuations of such securities, the fair values may differ significantly from the values that would have been used had a ready market for such investments existed. Occasionally, events occur between the time at which trading in a security is completed and the close of the NYSE that might call into question the availability (including the reliability) of the value of a portfolio security held by the Fund. If such an event occurs, the securities may be valued using fair value procedures, which may include the use of independent pricing services. All security valuation procedures are approved by the Trust’s Board of Trustees.
b. Joint Repurchase Agreement
The Fund may enter into a joint repurchase agreement whereby its uninvested cash balance is deposited into a joint cash account with other funds managed by the investment manager or an affiliate of the investment manager and is used to invest in one or more repurchase agreements. The value and face amount of the joint repurchase agreement are allocated to the funds based on their pro-rata interest. A repurchase agreement is accounted for as a loan by the fund to the seller, collateralized by securities which are delivered to the fund’s custodian. The market value, including accrued interest, of the initial collateralization is required to be at least 102% of the dollar amount invested by the funds, with the value of the underlying securities marked to market daily to maintain coverage of at least 100%. The joint repurchase agreement held by the Fund at year end had been entered into on December 31, 2008. The joint repurchase agreement is valued at cost.
c. Income Taxes
No provision has been made for U.S. income taxes because it is the Fund’s policy to qualify as a regulated investment company under the Internal Revenue Code and to distribute to shareholders substantially all of its taxable income and net realized gains.
FZ10-13
Franklin Templeton Variable Insurance Products Trust
Notes to Financial Statements (continued)
Franklin Zero Coupon Fund – 2010
1. ORGANIZATION AND SIGNIFICANT ACCOUNTING POLICIES (continued)
c. Income Taxes (continued)
The Fund has reviewed the tax positions, taken on federal income tax returns, for each of the three open tax years and as of December 31, 2008, and has determined that no provision for income tax is required in the Fund’s financial statements.
d. Security Transactions, Investment Income, Expenses and Distributions
Security transactions are accounted for on trade date. Realized gains and losses on security transactions are determined on a specific identification basis. Interest income and estimated expenses are accrued daily. Amortization of premium and accretion of discount on debt securities are included in interest income. Distributions to shareholders are recorded on the ex-dividend date and are determined according to income tax regulations (tax basis). Distributable earnings determined on a tax basis may differ from earnings recorded in accordance with accounting principles generally accepted in the United States of America. These differences may be permanent or temporary. Permanent differences are reclassified among capital accounts to reflect their tax character. These reclassifications have no impact on net assets or the results of operations. Temporary differences are not reclassified, as they may reverse in subsequent periods.
Common expenses incurred by the Trust are allocated among the funds based on the ratio of net assets of each fund to the combined net assets of the Trust. Fund specific expenses are charged directly to the fund that incurred the expense.
Realized and unrealized gains and losses and net investment income, not including class specific expenses, are allocated daily to each class of shares based upon the relative proportion of net assets of each class. Differences in per share distributions, by class, are generally due to differences in class specific expenses.
e. Accounting Estimates
The preparation of financial statements in accordance with accounting principles generally accepted in the United States of America requires management to make estimates and assumptions that affect the reported amounts of assets and liabilities at the date of the financial statements and the amounts of income and expenses during the reporting period. Actual results could differ from those estimates.
f. Guarantees and Indemnifications
Under the Trust’s organizational documents, its officers and trustees are indemnified by the Trust against certain liabilities arising out of the performance of their duties to the Trust. Additionally, in the normal course of business, the Trust, on behalf of the Fund, enters into contracts with service providers that contain general indemnification clauses. The Trust’s maximum exposure under these arrangements is unknown as this would involve future claims that may be made against the Trust that have not yet occurred. Currently, the Trust expects the risk of loss to be remote.
FZ10-14
Franklin Templeton Variable Insurance Products Trust
Notes to Financial Statements (continued)
Franklin Zero Coupon Fund – 2010
2. SHARES OF BENEFICIAL INTEREST
At December 31, 2008, there were an unlimited number of shares authorized (without par value). Transactions in the Fund’s shares were as follows:
| | | | | | | | | | | | | | |
| | | Year Ended December 31, | |
| | | 2008 | | | 2007 | |
| Class 1 Shares: | | Shares | | | Amount | | | Shares | | | Amount | |
Shares sold | | 3,323,480 | | | $ | 54,740,507 | | | 1,055,550 | | | $ | 16,696,122 | |
Shares issued in reinvestment of distributions | | 315,699 | | | | 4,956,480 | | | 307,110 | | | | 4,640,419 | |
Shares redeemed | | (2,186,691 | ) | | | (35,919,644 | ) | | (1,397,779 | ) | | | (22,103,751 | ) |
| | | | |
Net increase (decrease) | | 1,452,488 | | | $ | 23,777,343 | | | (35,119 | ) | | $ | (767,210 | ) |
| | | | |
| Class 2 Shares: | | | | | | | | | | | | |
Shares sold | | 352,198 | | | $ | 5,796,144 | | | 246,915 | | | $ | 3,891,533 | |
Shares issued in reinvestment of distributions | | 48,375 | | | | 757,070 | | | 85,940 | | | | 1,293,395 | |
Shares redeemed | | (427,878 | ) | | | (7,028,455 | ) | | (911,051 | ) | | | (14,046,738 | ) |
| | | | |
Net increase (decrease) | | (27,305 | ) | | $ | (475,241 | ) | | (578,196 | ) | | $ | (8,861,810 | ) |
| | | | |
3. TRANSACTIONS WITH AFFILIATES
Franklin Resources, Inc. is the holding company for various subsidiaries that together are referred to as Franklin Templeton Investments. Certain officers and trustees of the Trust are also officers and/or directors of the following subsidiaries:
| | |
| Subsidiary | | Affiliation |
Franklin Advisers, Inc. (Advisers) | | Investment manager |
Franklin Templeton Services, LLC (FT Services) | | Administrative manager |
Franklin Templeton Distributors, Inc. (Distributors) | | Principal underwriter |
Franklin Templeton Investor Services, LLC (Investor Services) | | Transfer agent |
a. Management Fees
The Fund pays an investment management fee to Advisers based on the average daily net assets of the Fund as follows:
| | |
| Annualized Fee Rate | | Net Assets |
| 0.625% | | Up to and including $100 million |
| 0.500% | | Over $100 million, up to and including $250 million |
| 0.450% | | Over $250 million, up to and including $7.5 billion |
| 0.440% | | Over $7.5 billion, up to and including $10 billion |
| 0.430% | | Over $10 billion, up to and including $12.5 billion |
| 0.420% | | Over $12.5 billion, up to and including $15 billion |
| 0.400% | | In excess of $15 billion |
b. Administrative Fees
Under an agreement with Advisers, FT Services provides administrative services to the Fund. The fee is paid by Advisers based on average daily net assets, and is not an additional expense of the Fund.
c. Distribution Fees
The Fund’s Board of Trustees has adopted a distribution plan for Class 2 shares pursuant to Rule 12b-1 under the 1940 Act. Under the Fund’s compensation distribution plan, the Fund pays Distributors for costs incurred in connection with the
FZ10-15
Franklin Templeton Variable Insurance Products Trust
Notes to Financial Statements (continued)
Franklin Zero Coupon Fund – 2010
3. TRANSACTIONS WITH AFFILIATES (continued)
c. Distribution Fees (continued)
servicing, sale and distribution of the Fund’s shares up to 0.35% per year of its average daily net assets. The Board of Trustees has agreed to limit the current rate to 0.25% per year for Class 2.
d. Transfer Agent Fees
Investor Services, under terms of an agreement, performs shareholder servicing for the Fund and is not paid by the Fund for the services.
4. EXPENSE OFFSET ARRANGEMENT
The Fund has entered into an arrangement with its custodian whereby credits realized as a result of uninvested cash balances are used to reduce a portion of the Fund’s custodian expenses. During the year ended December 31, 2008, there were no credits earned.
5. INCOME TAXES
For tax purposes, capital losses may be carried over to offset future capital gains, if any. At December 31, 2008, the capital loss carryforwards were as follows:
| | | |
Capital loss carryforwards expiring in: | | | |
2014 | | $ | 241,922 |
2015 | | | 222,565 |
| | | |
| | $ | 464,487 |
| | | |
During the year ended December 31, 2008, the Fund utilized $89,449 of capital loss carryforwards.
The tax character of distributions paid during the years ended December 31, 2008 and 2007, was as follows:
| | | | | | |
| | | 2008 | | 2007 |
Distributions paid from – ordinary income: | | $ | 5,713,550 | | $ | 5,933,814 |
| | | |
At December 31, 2008, the cost of investments, net unrealized appreciation (depreciation), and undistributed ordinary income for income tax purposes were as follows:
| | | |
Cost of investments | | $ | 128,380,224 |
| | | |
| |
Unrealized appreciation | | $ | 10,951,275 |
Unrealized depreciation | | | — |
| | | |
Net unrealized appreciation (depreciation) | | $ | 10,951,275 |
| | | |
Distributable earnings – undistributed ordinary income | | $ | 5,853,419 |
| | | |
Net investment income differs for financial statement and tax purposes primarily due to differing treatment of bond discounts.
Net realized gains (losses) differ for financial statement and tax purposes primarily due to differing treatment of wash sales.
FZ10-16
Franklin Templeton Variable Insurance Products Trust
Notes to Financial Statements (continued)
Franklin Zero Coupon Fund – 2010
6. INVESTMENT TRANSACTIONS
Purchases and sales of investments (excluding short term securities) for the year ended December 31, 2008, aggregated $25,126,770 and $12,715,170, respectively.
7. FAIR VALUE MEASUREMENTS
The Fund adopted Financial Accounting Standards Board (FASB) Statement No. 157, “Fair Value Measurement” (SFAS 157), on January 1, 2008. SFAS 157 defines fair value, establishes a framework for measuring fair value, and expands disclosures about fair value measurements. The Fund has determined that the implementation of SFAS 157 did not have a material impact on the Fund’s financial statements.
SFAS 157 establishes a fair value hierarchy that distinguishes between market data obtained from independent sources (observable inputs) and the Fund’s own market assumptions (unobservable inputs). These inputs are used in determining the value of the Fund’s investments and are summarized in the following fair value hierarchy:
| | • | | Level 1 – quoted prices in active markets for identical securities |
| | • | | Level 2 – other significant observable inputs (including quoted prices for similar securities, interest rates, prepayment speed, credit risk, etc.) |
| | • | | Level 3 – significant unobservable inputs (including the Fund’s own assumptions in determining the fair value of investments) |
The inputs or methodology used for valuing securities are not an indication of the risk associated with investing in those securities.
At December 31, 2008, all of the Fund’s investments in securities carried at fair value were in Level 2 inputs.
8. SUBSEQUENT EVENT
On January 23, 2009, the Fund entered into, along with certain other funds managed by Franklin Templeton Investments (individually, “Borrower”; collectively “Borrowers”), a $725 million senior unsecured syndicated global line of credit (“Global Credit Facility”) to provide a source of funds to the Borrowers for temporary and emergency purposes and to meet future unanticipated or unusually large redemption requests.
Under the terms of the Global Credit Facility, each Borrower has agreed to pay its proportionate share of fees and expenses incurred in connection with the implementation and maintenance of the Global Credit Facility.
ABBREVIATIONS
Selected Portfolio
FHLMC - Federal Home Loan Mortgage Corp.
FICO - Financing Corp.
FNMA - Federal National Mortgage Association
TVA - Tennessee Valley Authority
FZ10-17
Franklin Templeton Variable Insurance Products Trust
Franklin Zero Coupon Fund – 2010
Report of Independent Registered Public Accounting Firm
To the Board of Trustees and Shareholders of
Franklin Templeton Variable Insurance Products Trust
In our opinion, the accompanying statement of assets and liabilities, including the statement of investments, and the related statements of operations and of changes in net assets and the financial highlights present fairly, in all material respects, the financial position of Franklin Zero Coupon – 2010 (one of the funds constituting the Franklin Templeton Variable Insurance Products Trust, hereafter referred to as the “Fund”) at December 31, 2008, the results of its operations for the year then ended, the changes in its net assets for each of the two years in the period then ended and the financial highlights for the periods presented, in conformity with accounting principles generally accepted in the United States of America. These financial statements and financial highlights (hereafter referred to as “financial statements”) are the responsibility of the Fund’s management. Our responsibility is to express an opinion on these financial statements based on our audits. We conducted our audits of these financial statements in accordance with the standards of the Public Company Accounting Oversight Board (United States). Those standards require that we plan and perform the audit to obtain reasonable assurance about whether the financial statements are free of material misstatement. An audit includes examining, on a test basis, evidence supporting the amounts and disclosures in the financial statements, assessing the accounting principles used and significant estimates made by management, and evaluating the overall financial statement presentation. We believe that our audits, which included confirmation of securities at December 31, 2008 by correspondence with the custodian, provide a reasonable basis for our opinion.
PricewaterhouseCoopers LLP
San Francisco, California
February 10, 2009
FZ10-18
MUTUAL DISCOVERY SECURITIES FUND
This annual report for Mutual Discovery Securities Fund covers the fiscal year ended December 31, 2008.
Performance Summary as of 12/31/08
Average annual total return of Class 1 shares represents the average annual change in value, assuming reinvestment of dividends and capital gains. Average returns smooth out variations in returns, which can be significant; they are not the same as year-by-year results.
Periods ended 12/31/08
| | | | | | |
| | | 1-Year | | 5-Year | | 10-Year |
Average Annual Total Return | | -28.29% | | +6.46% | | +8.23% |
Total Return Index Comparison
for a Hypothetical $10,000 Investment (1/1/99–12/31/08)
The graph below shows the change in value of a hypothetical $10,000 investment in the Fund over the indicated period and includes reinvestment of any income or distributions. The Fund’s performance is compared to the performance of the Standard & Poor’s 500 Index (S&P 500) and the Morgan Stanley Capital International (MSCI) World Index. One cannot invest directly in an index, nor is an index representative of the Fund’s portfolio. Please see Important Notes to Performance Information preceding the Fund Summaries.
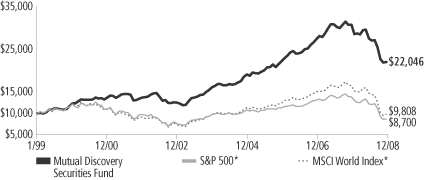
*Source: © 2009 Morningstar. Please see Index Descriptions following the Fund Summaries.
Mutual Discovery Securities Fund – Class 1
Performance reflects the Fund’s Class 1 operating expenses, but does not include any contract fees, expenses or sales charges. If they had been included, performance would be lower. These charges and deductions, particularly for variable life policies, can have a significant effect on contract values and insurance benefits. See the contract prospectus for a complete description of these expenses, including sales charges.
Performance data represent past performance, which does not guarantee future results. Investment return and principal value will fluctuate, and you may have a gain or loss when you sell your shares. Current performance may differ from figures shown.
MD-1
Fund Goal and Main Investments: Mutual Discovery Securities Fund seeks capital appreciation. The Fund normally invests primarily in U.S. and foreign equity securities that the manager believes are undervalued. The Fund also invests, to a lesser extent, in risk arbitrage securities and distressed companies.
Performance Overview
You can find the Fund’s one-year total return in the Performance Summary. Compared with its benchmarks, the Fund performed better than the S&P 500, which had -37.00% total return, and the MSCI World Index, which had a -40.33% total return for the same period.1
Economic and Market Overview
The U.S. experienced a marked slowdown in gross domestic product (GDP) growth as housing prices declined, consumer demand softened, and a credit crisis originally related to U.S. subprime loan losses intensified and spread globally. Although GDP growth rebounded in the second quarter of 2008, largely due to fiscal stimulus, the domestic economy contracted in the third and fourth quarters. Fear of recession spanned the entire period, and in the summer most economists agreed that a recession had already begun. By then, the faltering U.S. economy — which is the world’s largest and accounts for roughly 25% of global GDP — had negatively impacted growth prospects around the world. Although signs of a global slowdown surfaced in the latter half of the reporting period, in the first half growth remained robust in developing economies, particularly in Asia.
The China-led demand for oil, natural gas, and industrial and agricultural commodities propelled commodity prices and those of related equities to higher levels. The steep rise in the price of oil, which peaked at $145 per barrel in early July, was one of the most extreme market trends during the year. As a result, oil was a major focus of attention due to its impact on everything from inflation to corporate earnings to consumer spending. The price boom for commodities in general was broadly based and included natural gas, precious metals and most agricultural and industrial commodities, all of which added to global inflationary pressures. In this environment, the world’s monetary authorities faced the choice of lowering short-term interest rates to stimulate growth or raising them to fight rising inflation. Stimulus provided
1. Source: © 2009 Morningstar. One cannot invest directly in an index, nor is an index representative of the Fund’s portfolio. Please see Index Descriptions following the Fund Summaries.
Fund Risks: The Fund’s investments in stocks offer the potential for long-term gains but can be subject to short-term price fluctuations. Investments in companies involved in mergers, liquidations, reorganizations and distressed bankruptcy, which may include defaulted debt, involve higher credit and other risks. Foreign investing, especially in emerging markets, involves additional risks, including currency fluctuations, economic instability, market volatility, and political and social instability. Smaller and midsize company securities involve special risks, such as relatively small revenues, limited product lines and small market share. The Fund’s prospectus also includes a description of the main investment risks.
MD-2
through fiscal and monetary policies implemented around the globe sought to restore financial market stability and reignite economic growth.
The U.S. Treasury and the Federal Reserve Board took unprecedented steps, including lowering short-term rates to near 0% from 4.25%. The eurozone had made controlling inflation its main goal and kept rates steady at 4.00% until July, when the European Central Bank (ECB) joined many of the world’s other central banks whose concerns about inflation had led them to raise rates. The potential for global recession, however, exacerbated by the virtual freeze in the global financial system in September and October, trumped inflationary concerns, and the world’s monetary authorities, including the ECB and the Bank of England, cut interest rates aggressively. The U.S. dollar, which had declined earlier in the period versus many of the world’s currencies, regained ground quickly toward period-end as a flight to the relative safety of U.S. Treasuries prevailed. The greenback appreciated 8.6% relative to most currencies during the year under review.2
In this challenging economic time, volatility came to define global equity markets. Virtually all local indexes ended the 12-month period with marked losses. Despite negative economic data and an outlook for decelerating corporate earnings and profit margins globally, many companies outside the financials sector retained relatively strong balance sheets.
Investment Strategy
At Mutual Series, we are committed to our distinctive value approach to investing. Our major investment strategy is investing in undervalued stocks. When selecting undervalued equities, we are attracted to fundamentally strong companies with healthy balance sheets, high-quality assets, substantial free cash flow and shareholder-oriented management teams and whose stocks are trading at discounts to our assessment of the companies’ intrinsic or business value. We also look for asset rich companies whose shares may be trading at depressed levels due to concerns over short-term earnings disappointments, litigation, management strategy or other perceived negatives. While the vast majority of our undervalued equity investments are made in publicly traded companies globally, we may invest occasionally in privately held companies as well.
2. Source: Federal Reserve H10 report.
Top 10 Sectors/Industries
Mutual Discovery Securities Fund Based on Equity Securities 12/31/08
| | |
| | | % of Total
Net Assets |
| |
| Tobacco | | 16.9% |
| |
| Food Products | | 5.8% |
| |
| Insurance | | 4.1% |
| |
| Industrial Conglomerates | | 3.8% |
| |
| Beverages | | 3.7% |
| |
| Energy Equipment & Services | | 2.5% |
| |
| Media | | 1.9% |
| |
| Real Estate Investment Trusts | | 1.4% |
| |
| Food & Staples Retailing | | 1.2% |
| |
| Machinery | | 1.1% |
MD-3
We complement this more traditional investment strategy with two others. One is distressed investing, which is complex and can take many forms. The most common distressed investment the Fund undertakes is the purchase of financially troubled or bankrupt companies’ debt at a substantial discount to face value. After the financially distressed company is reorganized, often in bankruptcy court, the old debt is typically replaced with new securities issued by the financially stronger company.
The other piece of our investment strategy is participating in arbitrage situations, another highly specialized field. When companies announce proposed mergers or takeovers, commonly referred to as “deals,” the target company may trade at a discount to the bid it ultimately accepts. One form of arbitrage involves purchasing the target company’s stock when it is trading below the value it would receive in a deal. In keeping with our commitment to a relatively conservative investment approach, we typically focus our arbitrage efforts on announced deals, and eschew rumored deals or other situations we consider relatively risky.
In addition, we will generally seek to hedge the Fund’s currency exposure when we deem it advantageous for our shareholders.
Manager’s Discussion
The economic deceleration in the first half of 2008 gained momentum in the second half as the credit crisis spread and exacerbated the weakening demand outlook. Adherence to our investment philosophy was insufficient to overcome such headwinds. At year-end, however, we remained confident in the soundness of our approach over the long term.
Among the Fund’s largest detractors were Orkla, a Norwegian conglomerate; Carlsberg, a Denmark-based beer company; and Fortis, a Belgian bank.
Orkla’s assets lie predominantly in food and brands, solar energy and aluminum. During 2008, Orkla reported strong results from its food and brands division in which it managed to offset higher raw material costs through price increases, restoring profit margins to 2007 levels. Orkla continued to refocus on its core businesses by divesting some media and eastern European operations. However, Orkla’s more cyclical businesses had a difficult year. Aluminum profiles felt the effects of rapidly declining European demand, resulting in lower volumes and greater profit margin pressure. Furthermore, the share price of Renewable Energy Corp. (REC), in which Orkla has a 39.7% ownership
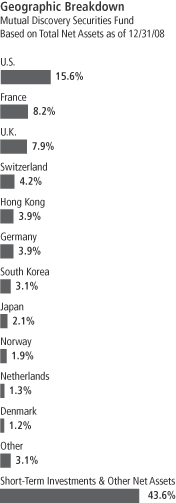
MD-4
stake, declined on concerns that its long-term (five- to six-year) polysilicon contracts could be renegotiated. In 2008, Orkla’s share price fell nearly 55% in local currency.
Denmark-based brewer Carlsberg became the fourth-largest beer company after the acquisition of some of U.K. beer and cider maker Scottish & Newcastle’s assets. Carlsberg’s share price, which fell by more than 64% in local currency during 2008, was penalized by the equity issue to finance that acquisition and by its leveraged balance sheet, despite the fact that the company produced resilient cash flows. Investors were also concerned about ruble devaluation and a weakening Russian beer market following cooler weather in the summer of 2008 when compared to 2007, making for difficult year-over-year comparisons. We believe Carlsberg continues to have attractive characteristics: a focus on cost reduction as its margins still lagged those of its peers at year-end, and a leading position in Russia, the third-largest profit pool in the beer industry with some structural growth drivers. Russia is a market where per-capita beer consumption has increased because of the country’s growing preference for beer rather than vodka. Carlsberg expanded its market share at the expense of the industry’s number-two player, InBev, which in our opinion was more focused on its 2008 acquisition of U.S. brewer Anheuser-Busch.
Fortis was also one of the larger detractors from performance this year despite our having sold this position prior to interventions by the governments of Benelux (Belgium/Netherlands/Luxembourg). For the time we held it during the period, the stock declined approximately 58% in local currency. Capital issues plagued the company since its ill-timed acquisition of ABN AMRO’s Dutch banking business amid the crash of the U.S. and European housing markets, which only complicated matters for Belgium’s largest bank. Although capital was raised and management replaced over the course of 2008, Fortis’ inability to defend its share price led to a loss of confidence and rapid deposit withdrawals in September. Ultimately, this forced a government rescue of the bank, setting off a marked decline in the company’s equity value.
The bulk of our invested capital has been directed outside the U.S. as most major European economies have weathered the macroeconomic headwinds better than the U.S. Deflation, currency swings and credit issues around the world continued to affect our investments; however, the growing number of companies in our research pipeline, across all classes of securities, indicated we were beginning to uncover value in some of the poorer-performing sectors.
MD-5
During the year under review, the best performing positions in the Fund included defensive consumer staples and merger arbitrage opportunities. Among the Fund’s top-performing stock investments for the year were KT&G, a South Korean tobacco and ginseng producer; Wm. Wrigley Jr. Company, the U.S. chewing gum giant that was the subject of a takeover bid; and the merger arbitrage opportunity afforded by our participation in the combination of Toronto Dominion Bank and Commerce Bancorp.
KT&G, South Korea’s largest tobacco company with over 65% in national market share, has been a consistently profitable investment for the Fund. During 2008, the Fund’s investment rose almost 49% in local currency. The company continued to report earnings-per-share above expectations, largely due to higher selling prices for its cigarettes, share buybacks and internal cost savings. Cost savings were driven by the purchase of tobacco leaves on the international market, where prices were 20% to 30% less than for tobacco farmed in South Korea. KT&G attracted more attention from the investment community in 2008 due to its historically defensive characteristics: cigarette consumption increased during the last economic downturn, in 1998; limited impact from a weakening South Korean currency, the won; and stable cash flows in a market dominated by cyclical industries. As KT&G’s share price rose, we took profits on part of the Fund’s investment during 2008.
Privately held candy firm Mars successfully completed its acquisition of Wrigley, transforming the publicly traded chewing gum giant into a Mars subsidiary. Several arbitrage transactions attempted during 2008 failed for lack of financing or material adverse changes in the underlying business. We believed neither problem would affect this deal because of the companies’ solid operating performance and fully committed and well-documented financing. In fact, prior deal failures and extremely tight credit markets created an opportunity for us to take advantage of an exceptionally wide spread (the difference between the Fund’s purchase price for the target company and the price at which the target was eventually taken over) on this acquisition. Financing for the transaction was provided by well-regarded institutions such as Berkshire Hathaway, Goldman Sachs and JPMorgan Chase. Berkshire Hathaway will continue to hold a minority equity investment in the Wrigley subsidiary. Our investment in Wrigley rose almost 4% for the period we held it.
Top 10 Holdings
Mutual Discovery Securities Fund
12/31/08
| | |
Company
Sector/Industry,
Country | | % of Total
Net Assets |
| |
| UST Inc. | | 4.3% |
| Tobacco, U.S. | | |
| |
| British American Tobacco PLC | | 3.5% |
| Tobacco, U.K. | | |
| |
| Imperial Tobacco Group PLC | | 3.0% |
| Tobacco, U.K. | | |
| |
| Berkshire Hathaway Inc., A & B | | 2.8% |
| Insurance, U.S. | | |
| |
| Japan Tobacco Inc. | | 2.1% |
| Tobacco, Japan | | |
| |
| Groupe Danone | | 1.6% |
| Food Products, France | | |
| |
| Nestle SA | | 1.6% |
| Food Products, Switzerland | | |
| |
| Eutelsat Communications | | 1.5% |
| Media, France | | |
| |
| Pernod Ricard SA | | 1.5% |
| Beverages, France | | |
| |
| Link REIT | | 1.3% |
| Real Estate Investment Trusts, Hong Kong | | |
The dollar value, number of shares or principal amount, and names of all portfolio holdings are listed in the Fund’s Statement of Investments.
MD-6
Our focus on merger arbitrage produced another top contributor when Toronto Dominion Bank (TD) and Commerce Bancorp combined forces. TD launched its bid on Commerce to capitalize on its strong deposit franchise and branch network, and to add to TD’s growing U.S. presence in attractive locations. As a Canadian bank, TD has been reaching outside its home market into the U.S. for some time, and we believe is proving to be an adept acquirer. In our analysis, financing of the deal was quite manageable and without substantial risk. A further analysis of the acquisition convinced us that TD adequately contained operating risks and could overcome any regulatory hurdles. The deal ultimately closed in March 2008, providing shareholders an attractive spread with relatively low risk. Our investment gained 3% in 2008.
Finally, investors should note that we maintained our currency hedging posture of being generally hedged to the U.S. dollar for most of our non-U.S. holdings. Since the dollar was stronger compared with most foreign currencies during 2008, the Fund benefited to the extent it was hedged. Also, our sizable cash position provided a cushion against declining markets.
Thank you for your participation in Mutual Discovery Securities Fund. We look forward to serving your future investment needs.
The foregoing information reflects our analysis, opinions and portfolio holdings as of December 31, 2008, the end of the reporting period. The way we implement our main investment strategies and the resulting portfolio holdings may change depending on factors such as market and economic conditions. These opinions may not be relied upon as investment advice or an offer for a particular security. The information is not a complete analysis of every aspect of any market, country, industry, security or the Fund. Statements of fact are from sources considered reliable, but the investment manager makes no representation or warranty as to their completeness or accuracy. Although historical performance is no guarantee of future results, these insights may help you understand our investment management philosophy.
MD-7
Fund Expenses
As an investor in a variable insurance contract (Contract) that indirectly provides for investment in an underlying mutual fund, you can incur transaction and/or ongoing expenses at both the Fund level and the Contract level.
| • | | Transaction expenses can include sales charges (loads) on purchases, redemption fees, surrender fees, transfer fees and premium taxes. |
| • | | Ongoing expenses can include management fees, distribution and service (12b-1) fees, contract fees, annual maintenance fees, mortality and expense risk fees and other fees and expenses. All mutual funds and Contracts have some types of ongoing expenses. |
The expenses shown in the table are meant to highlight ongoing expenses at the Fund level only and do not include ongoing expenses at the Contract level, or transaction expenses at either the Fund or Contract level. While the Fund does not have transaction expenses, if the transaction and ongoing expenses at the Contract level were included, the expenses shown below would be higher. You should consult your Contract prospectus or disclosure document for more information.
The table shows Fund-level ongoing expenses and can help you understand these expenses and compare them with those of other mutual funds offered through the Contract. The table assumes a $1,000 investment held for the six months indicated. Please refer to the Fund prospectus for additional information on operating expenses.
Actual Fund Expenses
The first line (Actual) of the table provides actual account values and expenses. The “Ending Account Value” is derived from the Fund’s actual return, which includes the effect of ongoing Fund expenses, but does not include the effect of ongoing Contract expenses.
You can estimate the Fund-level expenses you incurred during the period by following these steps. Of course, your account value and expenses will differ from those in this illustration:
| 1. | Divide your account value by $1,000. |
If an account had an $8,600 value, then $8,600 ÷ $1,000 = 8.6.
| 2. | Multiply the result by the number under the heading “Fund-Level Expenses Incurred During Period.” |
If Fund-Level Expenses Incurred During Period were $7.50, then 8.6 x $7.50 = $64.50.
In this illustration, the estimated expenses incurred this period at the Fund level are $64.50.
Mutual Discovery Securities Fund – Class 1
MD-8
Hypothetical Example for Comparison with Other Mutual Funds
Information in the second line (Hypothetical) of the table can help you compare ongoing expenses of the Fund with those of other mutual funds offered through the Contract. This information may not be used to estimate the actual ending account balance or expenses you incurred during the period. The hypothetical “Ending Account Value” is based on the Fund’s actual expense ratio and an assumed 5% annual rate of return before expenses, which does not represent the Fund’s actual return. The figure under the heading “Fund-Level Expenses Incurred During Period” shows the hypothetical expenses your account would have incurred under this scenario. You can compare this figure with the 5% hypothetical examples that appear in shareholder reports of other funds offered through a Contract.
| | | | | | | | | |
| Class 1 | | Beginning
Account Value 7/1/08 | | Ending Account Value 12/31/08 | | Fund-Level
Expenses Incurred
During Period* 7/1/08–12/31/08 |
Actual | | $ | 1,000 | | $ | 801.30 | | $ | 4.48 |
Hypothetical (5% return before expenses) | | $ | 1,000 | | $ | 1,020.16 | | $ | 5.03 |
*Expenses are calculated using the most recent six-month annualized expense ratio for the Fund’s Class 1 shares (0.99%), which does not include any ongoing expenses of the Contract for which the Fund is an investment option, multiplied by the average account value over the period, multiplied by 184/366 to reflect the one-half year period.
MD-9
Franklin Templeton Variable Insurance Products Trust
Financial Highlights
Mutual Discovery Securities Fund
| | | | | | | | | | | | | | | | | | | | |
| | | Year Ended December 31, | |
| Class 1 | | 2008 | | | 2007 | | | 2006 | | | 2005 | | | 2004 | |
| | | | |
Per share operating performance | | | | | | | | | | | | | | | | | | | | |
(for a share outstanding throughout the year) | | | | | | | | | | | | | | | | | | | | |
Net asset value, beginning of year | | $ | 24.08 | | | $ | 22.05 | | | $ | 18.85 | | | $ | 16.44 | | | $ | 14.04 | |
| | | | |
Income from investment operationsa: | | | | | | | | | | | | | | | | | | | | |
Net investment incomeb | | | 0.37 | | | | 0.47 | | | | 0.52 | | | | 0.25 | | | | 0.26 | |
Net realized and unrealized gains (losses) | | | (6.95 | ) | | | 2.22 | | | | 3.69 | | | | 2.40 | | | | 2.31 | |
| | | | |
Total from investment operations | | | (6.58 | ) | | | 2.69 | | | | 4.21 | | | | 2.65 | | | | 2.57 | |
| | | | |
Less distributions from: | | | | | | | | | | | | | | | | | | | | |
Net investment income | | | (0.52 | ) | | | (0.38 | ) | | | (0.25 | ) | | | (0.24 | ) | | | (0.17 | ) |
Net realized gains | | | (0.86 | ) | | | (0.28 | ) | | | (0.76 | ) | | | — | | | | — | |
| | | | |
Total distributions | | | (1.38 | ) | | | (0.66 | ) | | | (1.01 | ) | | | (0.24 | ) | | | (0.17 | ) |
| | | | |
Net asset value, end of year | | $ | 16.12 | | | $ | 24.08 | | | $ | 22.05 | | | $ | 18.85 | | | $ | 16.44 | |
| | | | |
| | | | | |
Total returnc | | | (28.29)% | | | | 12.17% | | | | 23.32% | | | | 16.28% | | | | 18.55% | |
Ratios to average net assets | | | | | | | | | | | | | | | | | | | | |
Expensesd,e | | | 0.98% | | | | 0.97% | | | | 1.03% | | | | 1.02% | | | | 1.01% | |
Expenses - excluding dividend expense on securities sold shorte | | | 0.97% | | | | 0.97% | | | | 1.00% | | | | 1.00% | | | | 1.00% | |
Net investment income | | | 1.82% | | | | 1.96% | | | | 2.44% | | | | 1.37% | | | | 1.71% | |
| | | | | |
Supplemental data | | | | | | | | | | | | | | | | | | | | |
Net assets, end of year (000’s) | | $ | 81,320 | | | $ | 142,751 | | | $ | 146,229 | | | $ | 136,508 | | | $ | 137,703 | |
Portfolio turnover rate | | | 22.76% | | | | 28.20% | | | | 19.83% | | | | 22.94% | | | | 29.81% | |
aThe amount shown for a share outstanding throughout the period may not correlate with the Statement of Operations for the period due to the timing of sales and repurchases of the Fund shares in relation to income earned and/or fluctuating market value of the investments of the Fund.
bBased on average daily shares outstanding.
cTotal return does not include any fees, charges or expenses imposed by the variable annuity and life insurance contracts for which the Franklin Templeton Variable Insurance Products Trust serves as an underlying investment vehicle.
dIncludes dividend expenses on securities sold short which varies from period to period. See below for expense ratios that reflect only operating expenses.
eBenefit of expense reduction rounds to less than 0.01%.
The accompanying notes are an integral part of these financial statements.
MD-10
Franklin Templeton Variable Insurance Products Trust
Financial Highlights (continued)
Mutual Discovery Securities Fund
| | | | | | | | | | | | | | | | | | | | |
| | | Year Ended December 31, | |
| Class 2 | | 2008 | | | 2007 | | | 2006 | | | 2005 | | | 2004 | |
| | | | |
Per share operating performance | | | | | | | | | | | | | | | | | | | | |
(for a share outstanding throughout the year) | | | | | | | | | | | | | | | | | | | | |
Net asset value, beginning of year | | $ | 23.69 | | | $ | 21.73 | | | $ | 18.60 | | | $ | 16.25 | | | $ | 13.90 | |
| | | | |
Income from investment operationsa: | | | | | | | | | | | | | | | | | | | | |
Net investment incomeb | | | 0.32 | | | | 0.40 | | | | 0.43 | | | | 0.19 | | | | 0.21 | |
Net realized and unrealized gains (losses) | | | (6.84 | ) | | | 2.18 | | | | 3.68 | | | | 2.38 | | | | 2.30 | |
| | | | |
Total from investment operations | | | (6.52 | ) | | | 2.58 | | | | 4.11 | | | | 2.57 | | | | 2.51 | |
| | | | |
Less distributions from: | | | | | | | | | | | | | | | | | | | | |
Net investment income | | | (0.46 | ) | | | (0.34 | ) | | | (0.22 | ) | | | (0.22 | ) | | | (0.16 | ) |
Net realized gains | | | (0.86 | ) | | | (0.28 | ) | | | (0.76 | ) | | | — | | | | — | |
| | | | |
Total distributions | | | (1.32 | ) | | | (0.62 | ) | | | (0.98 | ) | | | (0.22 | ) | | | (0.16 | ) |
| | | | |
Net asset value, end of year | | $ | 15.85 | | | $ | 23.69 | | | $ | 21.73 | | | $ | 18.60 | | | $ | 16.25 | |
| | | | |
| | | | | |
Total returnc | | | (28.45)% | | | | 11.85% | | | | 23.06% | | | | 15.97% | | | | 18.19% | |
Ratios to average net assets | | | | | | | | | | | | | | | | | | | | |
Expensesd,e | | | 1.23% | | | | 1.22% | | | | 1.28% | | | | 1.28% | | | | 1.26% | |
Expenses - excluding dividend expense on securities sold shorte | | | 1.22% | | | | 1.22% | | | | 1.25% | | | | 1.25% | | | | 1.25% | |
Net investment income | | | 1.57% | | | | 1.71% | | | | 2.19% | | | | 1.12% | | | | 1.46% | |
| | | | | |
Supplemental data | | | | | | | | | | | | | | | | | | | | |
Net assets, end of year (000’s) | | $ | 1,113,720 | | | $ | 1,867,484 | | | $ | 1,365,575 | | | $ | 811,975 | | | $ | 403,560 | |
Portfolio turnover rate | | | 22.76% | | | | 28.20% | | | | 19.83% | | | | 22.94% | | | | 29.81% | |
aThe amount shown for a share outstanding throughout the period may not correlate with the Statement of Operations for the period due to the timing of sales and repurchases of the Fund shares in relation to income earned and/or fluctuating market value of the investments of the Fund.
bBased on average daily shares outstanding.
cTotal return does not include any fees, charges or expenses imposed by the variable annuity and life insurance contracts for which the Franklin Templeton Variable Insurance Products Trust serves as an underlying investment vehicle.
dIncludes dividend expenses on securities sold short which varies from period to period. See below for expense ratios that reflect only operating expenses.
eBenefit of expense reduction rounds to less than 0.01%.
The accompanying notes are an integral part of these financial statements.
MD-11
Franklin Templeton Variable Insurance Products Trust
Financial Highlights (continued)
Mutual Discovery Securities Fund
| | | | |
| | | Period Ended
December 31,
2008a | |
| Class 4 | |
| | | | |
Per share operating performance | | | | |
(for a share outstanding throughout the period) | | | | |
Net asset value, beginning of period | | $ | 22.50 | |
| | | | |
Income from investment operationsb: | | | | |
Net investment incomec | | | 0.09 | |
Net realized and unrealized gains (losses) | | | (5.14 | ) |
| | | | |
Total from investment operations | | | (5.05 | ) |
| | | | |
Less distributions from: | | | | |
Net investment income | | | (0.52 | ) |
Net realized gains | | | (0.86 | ) |
| | | | |
Total distributions | | | (1.38 | ) |
| | | | |
Net asset value, end of period | | $ | 16.07 | |
| | | | |
| |
Total returnd | | | (23.48)% | |
Ratios to average net assetse | | | | |
Expensesf,g | | | 1.33% | |
Expenses - excluding dividend expense on securities sold shortg | | | 1.32% | |
Net investment income | | | 1.47% | |
| |
Supplemental data | | | | |
Net assets, end of period (000’s) | | $ | 23,981 | |
Portfolio turnover rate | | | 22.76% | |
aFor the period February 29, 2008 (effective date) to December 31, 2008.
bThe amount shown for a share outstanding throughout the period may not correlate with the Statement of Operations for the period due to the timing of sales and repurchases of the Fund shares in relation to income earned and/or fluctuating market value of the investments of the Fund.
cBased on average daily shares outstanding.
dTotal return does not include any fees, charges or expenses imposed by the variable annuity and life insurance contracts for which the Franklin Templeton Variable Insurance Products Trust serves as an underlying investment vehicle. Total return is not annualized for periods less than one year.
eRatios are annualized for periods less than one year.
fIncludes dividend expenses on securities sold short which varies from period to period. See below for expense ratios that reflect only operating expenses.
gBenefit of expense reduction rounds to less than 0.01%.
The accompanying notes are an integral part of these financial statements.
MD-12
Franklin Templeton Variable Insurance Products Trust
Statement of Investments, December 31, 2008
| | | | | | | |
| Mutual Discovery Securities Fund | | Country | | Shares/
Warrants/
Contracts | | Value |
Common Stocks and Other Equity Interests 55.2% | | | | | | | |
Airlines 0.1% | | | | | | | |
aACE Aviation Holdings Inc., A | | Canada | | 111,545 | | $ | 618,778 |
a,bNorthwest Airlines Corp., Contingent Distribution | | United States | | 8,167,000 | | | 5,145 |
| | | | | | | |
| | | | | | | 623,923 |
| | | | | | | |
Auto Components 0.0%c | | | | | | | |
a,b,dCollins & Aikman Products Co., Contingent Distribution | | United States | | 218,708 | | | 2,187 |
aDana Holding Corp. | | United States | | 113,292 | | | 83,836 |
a,bDana Holding Corp., Contingent Distribution | | United States | | 2,673,000 | | | 835 |
| | | | | | | |
| | | | | | | 86,858 |
| | | | | | | |
Automobiles 0.1% | | | | | | | |
a,fIACNA Investor LLC | | United States | | 47,271 | | | 473 |
a,e,fInternational Automotive Components Group Brazil LLC | | Brazil | | 424,073 | | | 337,401 |
a,e,fInternational Automotive Components Group Japan LLC | | Japan | | 74,174 | | | 80,163 |
a,e,fInternational Automotive Components Group LLC | | Luxembourg | | 1,512,200 | | | 257,225 |
a,e,fInternational Automotive Components Group NA LLC, A | | United States | | 1,353,608 | | | 220,367 |
| | | | | | | |
| | | | | | | 895,629 |
| | | | | | | |
Beverages 3.7% | | | | | | | |
Brown-Forman Corp., A | | United States | | 7,400 | | | 374,588 |
Brown-Forman Corp., B | | United States | | 1,850 | | | 95,256 |
Carlsberg AS, A | | Denmark | | 7,100 | | | 256,101 |
Carlsberg AS, B | | Denmark | | 408,342 | | | 13,137,306 |
aDr. Pepper Snapple Group Inc. | | United States | | 305,027 | | | 4,956,689 |
Fomento Economico Mexicano SAB de CV, ADR | | Mexico | | 180,900 | | | 5,450,517 |
Lotte Chilsung Beverage Co. Ltd. | | South Korea | | 3,179 | | | 2,408,791 |
gPernod Ricard SA | | France | | 247,436 | | | 18,327,078 |
| | | | | | | |
| | | | | | | 45,006,326 |
| | | | | | | |
Building Products 0.4% | | | | | | | |
KCC Corp. | | South Korea | | 18,824 | | | 4,284,956 |
| | | | | | | |
Capital Markets 0.4% | | | | | | | |
The Goldman Sachs Group Inc. | | United States | | 34,040 | | | 2,872,636 |
aMarfin Investment Group Holdings SA | | Greece | | 542,119 | | | 2,198,330 |
| | | | | | | |
| | | | | | | 5,070,966 |
| | | | | | | |
Chemicals 0.9% | | | | | | | |
a,b,dDow Corning Corp., Contingent Distribution | | United States | | 300,000 | | | — |
Sika AG | | Switzerland | | 12,390 | | | 10,441,989 |
| | | | | | | |
| | | | | | | 10,441,989 |
| | | | | | | |
Commercial Banks 0.9% | | | | | | | |
BNP Paribas SA | | France | | 138,283 | | | 5,849,174 |
Danske Bank AS | | Denmark | | 67,491 | | | 659,327 |
a,eElephant Capital Holdings Ltd. | | Japan | | 1,903 | | | — |
Intesa Sanpaolo SpA | | Italy | | 1,242,919 | | | 4,410,108 |
a,eNCB Warrant Holdings Ltd., A | | Japan | | 9,306 | | | — |
| | | | | | | |
| | | | | | | 10,918,609 |
| | | | | | | |
Commercial Services & Supplies 0.0%c | | | | | | | |
aComdisco Holding Co. Inc. | | United States | | 44 | | | 343 |
a,bComdisco Holding Co. Inc., Contingent Distribution | | United States | | 1,863,000 | | | — |
| | | | | | | |
| | | | | | | 343 |
| | | | | | | |
MD-13
Franklin Templeton Variable Insurance Products Trust
Statement of Investments, December 31, 2008 (continued)
| | | | | | | |
| Mutual Discovery Securities Fund | | Country | | Shares/
Warrants/
Contracts | | Value |
Common Stocks and Other Equity Interests (continued) | | | | | | | |
Computers & Peripherals 0.0% | | | | | | | |
a,eDecisionOne Corp. | | United States | | 21,716 | | $ | — |
a,eDecisionOne Corp., wts., 6/08/17 | | United States | | 11,923 | | | — |
| | | | | | | |
| | | | | | | — |
| | | | | | | |
Construction Materials 0.3% | | | | | | | |
Ciments Francais SA | | France | | 22,650 | | | 1,914,542 |
Hanil Cement Co. Ltd. | | South Korea | | 32,560 | | | 1,688,583 |
| | | | | | | |
| | | | | | | 3,603,125 |
| | | | | | | |
Consumer Finance 0.1% | | | | | | | |
a,eCerberus CG Investor I LLC | | United States | | 2,161,828 | | | 432,366 |
a,eCerberus CG Investor II LLC | | United States | | 2,161,828 | | | 432,366 |
a,eCerberus CG Investor III LLC | | United States | | 1,080,914 | | | 216,183 |
a,eCerberus FIM Investors Holdco LLC | | United States | | 2,049,750 | | | 434,132 |
| | | | | | | |
| | | | | | | 1,515,047 |
| | | | | | | |
Diversified Banks 0.4% | | | | | | | |
a,e,hThe Bankshares Inc. | | United States | | 800,000 | | | 5,163,550 |
| | | | | | | |
Diversified Financial Services 1.0% | | | | | | | |
gDeutsche Boerse AG | | Germany | | 145,506 | | | 10,335,821 |
Guinness Peat Group PLC | | United Kingdom | | 2,555,610 | | | 1,493,243 |
a,bMarconi Corp., Contingent Distribution | | United Kingdom | | 1,739,100 | | | — |
| | | | | | | |
| | | | | | | 11,829,064 |
| | | | | | | |
Diversified Telecommunication Services 0.7% | | | | | | | |
a,e,fAboveNet Inc. | | United States | | 18,411 | | | 920,550 |
a,e,fAboveNet Inc., stock grant, grant price $20.95, expiration date 9/09/13 | | United States | | 23 | | | 52 |
a,e,fAboveNet Inc., wts., 9/08/10 | | United States | | 739 | | | 2,956 |
a,b,dGlobal Crossing Holdings Ltd., Contingent Distribution | | United States | | 2,236,777 | | | — |
gKoninklijke (Royal) KPN NV | | Netherlands | | 561,200 | | | 8,145,455 |
| | | | | | | |
| | | | | | | 9,069,013 |
| | | | | | | |
Electric Utilities 1.1% | | | | | | | |
E.ON AG | | Germany | | 296,500 | | | 11,616,979 |
Union Electrica Fenosa SA | | Spain | | 87,760 | | | 2,175,733 |
| | | | | | | |
| | | | | | | 13,792,712 |
| | | | | | | |
Energy Equipment & Services 2.5% | | | | | | | |
iBourbon SA | | France | | 120,569 | | | 3,041,393 |
aBW Offshore Ltd. | | Norway | | 3,825,934 | | | 2,365,474 |
aCompagnie Generale de Geophysique SA | | France | | 345,440 | | | 5,120,105 |
aDockwise Ltd. | | Norway | | 1,450,420 | | | 823,764 |
a,eMPF Corp. Ltd. | | Norway | | 1,460,000 | | | — |
aPetroleum Geo-Services ASA | | Norway | | 204,624 | | | 813,512 |
aPride International Inc. | | United States | | 319,600 | | | 5,107,208 |
Seadrill Ltd. | | Bermuda | | 941,356 | | | 7,457,920 |
aTransocean Ltd. | | United States | | 117,343 | | | 5,544,457 |
| | | | | | | |
| | | | | | | 30,273,833 |
| | | | | | | |
Food & Staples Retailing 1.2% | | | | | | | |
Carrefour SA | | France | | 379,168 | | | 14,590,846 |
| | | | | | | |
MD-14
Franklin Templeton Variable Insurance Products Trust
Statement of Investments, December 31, 2008 (continued)
| | | | | | | |
| Mutual Discovery Securities Fund | | Country | | Shares/
Warrants/
Contracts | | Value |
Common Stocks and Other Equity Interests (continued) | | | | | | | |
Food Products 5.8% | | | | | | | |
gCadbury PLC | | United Kingdom | | 736,002 | | $ | 6,508,929 |
Cermaq ASA | | Norway | | 113,664 | | | 431,459 |
CSM NV | | Netherlands | | 441,585 | | | 7,100,886 |
Farmer Brothers Co. | | United States | | 61,700 | | | 1,538,798 |
gGroupe Danone | | France | | 319,916 | | | 19,316,079 |
a,dLighthouse Caledonia ASA | | Norway | | 161,457 | | | 3,714 |
Lotte Confectionary Co. Ltd. | | South Korea | | 5,166 | | | 5,337,791 |
a,iMarine Harvest | | Norway | | 20,520,644 | | | 3,098,079 |
gNestle SA | | Switzerland | | 495,450 | | | 19,300,234 |
Nong Shim Co. Ltd. | | South Korea | | 24,215 | | | 4,687,702 |
Premier Foods PLC | | United Kingdom | | 2,683,654 | | | 1,205,280 |
Rieber & Son ASA | | Norway | | 400,605 | | | 2,044,829 |
| | | | | | | |
| | | | | | | 70,573,780 |
| | | | | | | |
Health Care Providers & Services 1.0% | | | | | | | |
a,eKindred Healthcare Inc. | | United States | | 69,953 | | | 865,249 |
Rhoen-Klinikum AG | | Germany | | 456,430 | | | 10,894,519 |
| | | | | | | |
| | | | | | | 11,759,768 |
| | | | | | | |
Hotels, Restaurants & Leisure 0.0%c | | | | | | | |
aTrump Entertainment Resorts Inc. | | United States | | 45,779 | | | 7,801 |
| | | | | | | |
Independent Power Producers & Energy Traders 0.7% | | | | | | | |
Constellation Energy Group | | United States | | 315,250 | | | 7,909,623 |
| | | | | | | |
Industrial Conglomerates 3.8% | | | | | | | |
Jardine Matheson Holdings Ltd. | | Hong Kong | | 388,692 | | | 7,190,802 |
Jardine Strategic Holdings Ltd. | | Hong Kong | | 1,143,838 | | | 11,895,915 |
Keppel Corp. Ltd. | | Singapore | | 1,865,494 | | | 5,638,806 |
fOrkla ASA | | Norway | | 2,009,757 | | | 13,133,778 |
Siemens AG | | Germany | | 114,265 | | | 8,434,615 |
| | | | | | | |
| | | | | | | 46,293,916 |
| | | | | | | |
Insurance 4.1% | | | | | | | |
ACE Ltd. | | United States | | 59,180 | | | 3,131,806 |
aAlleghany Corp. | | United States | | 3,988 | | | 1,124,616 |
aBerkshire Hathaway Inc., A | | United States | | 45 | | | 4,347,000 |
aBerkshire Hathaway Inc., B | | United States | | 9,427 | | | 30,298,378 |
E-L Financial Corp. Ltd. | | Canada | | 8,478 | | | 3,135,355 |
a,eImagine Group Holdings Ltd. | | Bermuda | | 451,787 | | | 3,700,135 |
Old Republic International Corp. | | United States | | 132,325 | | | 1,577,314 |
a,eOlympus Re Holdings Ltd. | | United States | | 2,140 | | | 5,024 |
White Mountains Insurance Group Ltd. | | United States | | 9,496 | | | 2,536,477 |
| | | | | | | |
| | | | | | | 49,856,105 |
| | | | | | | |
Machinery 1.1% | | | | | | | |
Schindler Holding AG | | Switzerland | | 266,386 | | | 11,998,470 |
Schindler Holding AG, Registered | | Switzerland | | 42,060 | | | 1,853,098 |
| | | | | | | |
| | | | | | | 13,851,568 |
| | | | | | | |
Media 1.9% | | | | | | | |
aAdelphia Recovery Trust | | United States | | 5,379,562 | | | 53,796 |
a,bAdelphia Recovery Trust, Arahova Contingent Value Vehicle, Contingent Distribution | | United States | | 386,774 | | | 58,016 |
MD-15
Franklin Templeton Variable Insurance Products Trust
Statement of Investments, December 31, 2008 (continued)
| | | | | | | |
| Mutual Discovery Securities Fund | | Country | | Shares/
Warrants/
Contracts | | Value |
Common Stocks and Other Equity Interests (continued) | | | | | | | |
Media (continued) | | | | | | | |
a,bCentury Communications Corp., Contingent Distribution | | United States | | 1,074,000 | | $ | — |
CJ CGV Co. Ltd. | | South Korea | | 92,310 | | | 1,110,936 |
Daekyo Co. Ltd. | | South Korea | | 374,300 | | | 1,455,117 |
aEutelsat Communications | | France | | 785,069 | | | 18,579,622 |
a,dTVMAX Holdings Inc. | | United States | | 8,935 | | | — |
Virgin Media Inc. | | United Kingdom | | 420,638 | | | 2,098,983 |
| | | | | | | |
| | | | | | | 23,356,470 |
| | | | | | | |
Metals & Mining 0.0%c | | | | | | | |
ArcelorMittal | | Netherlands | | 22,220 | | | 528,194 |
| | | | | | | |
Multi-Utilities 0.3% | | | | | | | |
gGDF Suez | | France | | 60,963 | | | 3,011,264 |
a,bNorthWestern Corp., Contingent Distribution | | United States | | 550,000 | | | — |
aSuez Environnement SA | | France | | 11,316 | | | 190,669 |
| | | | | | | |
| | | | | | | 3,201,933 |
| | | | | | | |
Multiline Retail 0.3% | | | | | | | |
Jelmoli Holding AG | | Switzerland | | 2,285 | | | 4,215,236 |
| | | | | | | |
Oil, Gas & Consumable Fuels 0.7% | | | | | | | |
BP PLC | | United Kingdom | | 623,423 | | | 4,789,443 |
BP PLC, ADR | | United Kingdom | | 9,000 | | | 420,660 |
Total SA, B | | France | | 49,296 | | | 2,682,089 |
Total SA, B, ADR | | France | | 19,340 | | | 1,069,502 |
| | | | | | | |
| | | | | | | 8,961,694 |
| | | | | | | |
Paper & Forest Products 0.3% | | | | | | | |
Weyerhaeuser Co. | | United States | | 121,910 | | | 3,731,665 |
| | | | | | | |
Personal Products 0.3% | | | | | | | |
Amorepacific Corp. | | South Korea | | 6,873 | | | 3,558,941 |
| | | | | | | |
Pharmaceuticals 0.3% | | | | | | | |
Novartis AG | | Switzerland | | 74,005 | | | 3,652,087 |
| | | | | | | |
Professional Services 0.4% | | | | | | | |
Teleperformance | | France | | 177,196 | | | 4,920,775 |
| | | | | | | |
Real Estate Investment Trusts (REITs) 1.4% | | | | | | | |
Link REIT | | Hong Kong | | 9,963,438 | | | 16,455,318 |
Ventas Inc. | | United States | | 33,500 | | | 1,124,595 |
| | | | | | | |
| | | | | | | 17,579,913 |
| | | | | | | |
Real Estate Management & Development 1.0% | | | | | | | |
dCanary Wharf Group PLC | | United Kingdom | | 185,900 | | | 716,584 |
Great Eagle Holdings Ltd. | | Hong Kong | | 1,613,524 | | | 1,792,527 |
Swire Pacific Ltd., A | | Hong Kong | | 950,615 | | | 6,543,742 |
Swire Pacific Ltd., B | | Hong Kong | | 2,440,700 | | | 3,237,387 |
| | | | | | | |
| | | | | | | 12,290,240 |
| | | | | | | |
Software 0.6% | | | | | | | |
gMicrosoft Corp. | | United States | | 400,960 | | | 7,794,662 |
| | | | | | | |
Tobacco 16.9% | | | | | | | |
Altria Group Inc. | | United States | | 285,261 | | | 4,296,031 |
gBritish American Tobacco PLC | | United Kingdom | | 1,610,201 | | | 42,332,022 |
MD-16
Franklin Templeton Variable Insurance Products Trust
Statement of Investments, December 31, 2008 (continued)
| | | | | | | | |
| Mutual Discovery Securities Fund | | Country | | Shares/
Contracts/
Warrants | | | Value |
Common Stocks and Other Equity Interests (continued) | | | | | | | | |
Tobacco (continued) | | | | | | | | |
gImperial Tobacco Group PLC | | United Kingdom | | 1,340,635 | | | $ | 36,224,191 |
ITC Ltd. | | India | | 1,453,259 | | | | 5,124,666 |
Japan Tobacco Inc. | | Japan | | 7,606 | | | | 25,172,836 |
KT&G Corp. | | South Korea | | 202,515 | | | | 12,683,243 |
gLorillard Inc. | | United States | | 185,200 | | | | 10,436,020 |
Philip Morris International Inc. | | United States | | 122,821 | | | | 5,343,942 |
gReynolds American Inc. | | United States | | 304,560 | | | | 12,276,814 |
UST Inc. | | United States | | 750,390 | | | | 52,062,058 |
| | | | | | | | |
| | | | | | | | 205,951,823 |
| | | | | | | | |
Trading Companies & Distributors 0.5% | | | | | | | | |
Kloeckner & Co. SE | | Germany | | 327,096 | | | | 5,712,656 |
| | | | | | | | |
Transportation Infrastructure 0.0%c | | | | | | | | |
aGroupe Eurotunnel SA | | France | | 390 | | | | 2,100 |
aGroupe Eurotunnel SA, wts., 12/30/11 | | France | | 11,181 | | | | 1,282 |
| | | | | | | | |
| | | | | | | | 3,382 |
| | | | | | | | |
Total Common Stocks and Other Equity Interests (Cost $787,933,106) | | | | | | | | 672,879,021 |
| | | | | | | | |
Preferred Stocks 0.0%c | | | | | | | | |
Auto Components 0.0%c | | | | | | | | |
eDana Holding Corp., 4.00%, cvt. pfd., B | | United States | | 9,611 | | | | 86,499 |
| | | | | | | | |
Diversified Telecommunication Services 0.0%c | | | | | | | | |
a,ePTV Inc., 10.00%, pfd., A | | United Kingdom | | 4,289 | | | | 3,860 |
| | | | | | | | |
Total Preferred Stocks (Cost $967,105) | | | | | | | | 90,359 |
| | | | | | | | |
| | | |
| | | | | Principal
Amountj | | | |
Corporate Bonds & Notes 1.1% | | | | | | | | |
kACE Aviation Holdings Inc., cvt., 144A, 4.25%, 6/01/35 | | Canada | | 234,000 | CAD | | | 170,500 |
lCalpine Corp., Exit Term Loan, FRN, 6.645%, 3/29/14 | | United States | | 4,487,387 | | | | 3,328,662 |
eCerberus CG Investor I LLC, 12.00%, 7/31/14 | | United States | | 1,897,400 | | | | 379,480 |
eCerberus CG Investor II LLC, 12.00%, 7/31/14 | | United States | | 1,897,400 | | | | 379,480 |
eCerberus CG Investor III LLC, 12.00%, 7/31/14 | | United States | | 948,700 | | | | 189,740 |
eCerberus FIM Investors Holdco LLC, 12.00%, 11/22/13 | | United States | | 6,148,028 | | | | 1,302,152 |
DecisionOne Corp., | | | | | | | | |
e12.00%, 4/15/10 | | United States | | 27,953 | | | | 27,953 |
d,lFRN, 5.50%, 5/12/09 | | United States | | 5,008 | | | | 5,008 |
Groupe Eurotunnel SA, cvt., sub. bond, NRS I,
T2, 3.00%, 7/28/09 | | France | | 500 | EUR | | | 594 |
T2, 3.00%, 7/28/09 | | France | | 682 | GBP | | | 996 |
T3, 3.00%, 7/28/10 | | France | | 394,500 | EUR | | | 468,885 |
T3, 3.00%, 7/28/10 | | France | | 267,617 | GBP | | | 390,868 |
e,fInternational Automotive Components Group NA LLC, 9.00%, 4/01/17 | | United States | | 407,500 | | | | 196,448 |
MD-17
Franklin Templeton Variable Insurance Products Trust
Statement of Investments, December 31, 2008 (continued)
| | | | | | | |
| Mutual Discovery Securities Fund | | Country | | Principal
Amountj | | Value |
Corporate Bonds & Notes (continued) | | | | | | | |
e,f,mPontus I LLC, junior note, 144A, FRN, 5.689%, 7/24/09 | | United States | | 5,513,169 | | $ | 6,221,085 |
e,f,mPontus II Trust, junior profit-participating note, 144A, FRN, 7.516%, 6/25/09 | | United States | | 872,120 | | | 203,483 |
d,nTVMAX Holdings Inc., PIK,
11.50%, 3/31/09 | | United States | | 26,866 | | | 18,806 |
14.00%, 3/31/09 | | United States | | 59,662 | | | 41,763 |
| | | | | | | |
Total Corporate Bonds & Notes (Cost $28,578,971) | | | | | | | 13,325,903 |
| | | | | | | |
Corporate Bonds & Notes in Reorganization 0.1% | | | | | | | |
lMotor Coach Industries International Inc., FRN, | | | | | | | |
pFirst Lien DIP Revolver, 7.75%, 9/19/09 | | United States | | 166,677 | | | 162,775 |
qSecond Lien DIP Trust A Term Loan, 12.75%, 9/19/09 | | United States | | 244,435 | | | 200,455 |
Second Lien DIP Trust B Term Loan, 15.25%, 9/19/09 | | United States | | 149,074 | | | 126,713 |
i,oSecond Lien, Senior Secured Term Loan, 11.00%,12/01/08 | | United States | | 201,431 | | | 160,138 |
d,oThird Lien, Senior Secured Term Loan, 15.649%, 12/01/08 | | United States | | 2,322,452 | | | 63,403 |
d,oSafety Kleen Services, senior sub. note, 9.25%, 6/01/08 | | United States | | 3,000 | | | 15 |
oTrump Entertainment Resorts Inc., 8.50%, 5/20/15 | | United States | | 1,460,337 | | | 200,796 |
| | | | | | | |
Total Corporate Bonds & Notes in Reorganization
(Cost $4,467,455) | | | | | | | 914,295 |
| | | | | | | |
Total Investments before Short Term Investments
(Cost $821,946,637) | | | | | | | 687,209,578 |
| | | | | | | |
Short Term Investments 37.8% | | | | | | | |
U.S. Government and Agency Securities 37.7% | | | | | | | |
rFHLB, | | | | | | | |
1/02/09 | | United States | | 24,999,990 | | | 24,999,990 |
1/05/09 | | United States | | 20,000,000 | | | 20,000,030 |
1/07/09 - 12/08/09 | | United States | | 266,492,000 | | | 265,900,999 |
1/12/09 | | United States | | 15,000,000 | | | 15,000,095 |
1/14/09 | | United States | | 20,000,000 | | | 20,000,150 |
7/02/09 | | United States | | 15,000,000 | | | 14,971,715 |
11/20/09 | | United States | | 15,000,000 | | | 14,916,140 |
12/04/09 | | United States | | 25,000,000 | | | 24,842,490 |
rU.S. Treasury Bills, | | | | | | | |
4/02/09 | | United States | | 25,000,000 | | | 24,993,490 |
5/21/09 | | United States | | 15,000,000 | | | 14,996,225 |
6/18/09 - 11/19/09 | | United States | | 20,000,000 | | | 19,964,020 |
| | | | | | | |
Total U.S. Government and Agency Securities (Cost $457,998,641) | | | | | | | 460,585,344 |
| | | | | | | |
Total Investments before Cash Collateral Received for Loaned Securities (Cost $1,279,945,278) | | | | | | | 1,147,794,922 |
| | | | | | | |
MD-18
Franklin Templeton Variable Insurance Products Trust
Statement of Investments, December 31, 2008 (continued)
| | | | | | | | |
| Mutual Discovery Securities Fund | | Country | | Shares/
Contracts | | Value | |
rInvestments from Cash Collateral Received for Loaned Securities 0.1% | | | | | | | | |
Money Market Fund (Cost $701,033) 0.1% | | | | | | | | |
tBank of New York Institutional Cash Reserve Fund, 0.09% | | United States | | 701,033 | | $ | 694,023 | |
| | | | | | | | |
Total Investments (Cost $1,280,646,311) 94.2% | | | | | | | 1,148,488,945 | |
Options Written (0.3)% | | | | | | | (3,271,438 | ) |
Net Unrealized Appreciation on Forward Exchange
Contracts 1.5% | | | | | | | 17,700,102 | |
Other Assets, less Liabilities 4.6% | | | | | | | 56,104,333 | |
| | | | | | | | |
Net Assets 100.0% | | | | | | $ | 1,219,021,942 | |
| | | | | | | | |
uOptions Written 0.3% | | | | | | | | |
Call Options 0.3% | | | | | | | | |
Beverages 0.1% | | | | | | | | |
Pernod Ricard SA, Jun, 52 Calls, 6/19/09 | | France | | 705 | | $ | 775,831 | |
Pernod Ricard SA, Mar. 52 Calls, 3/20/09 | | France | | 356 | | | 281,295 | |
| | | | | | | | |
| | | | | | | 1,057,126 | |
| | | | | | | | |
Diversified Financial Services 0.0%c | | | | | | | | |
Deutsche Boerse AG, Jun. 64 Calls, 6/19/09 | | Germany | | 134 | | | 54,150 | |
Deutsche Boerse AG, Mar. 64 Calls, 3/20/09 | | Germany | | 287 | | | 47,355 | |
| | | | | | | | |
| | | | | | | 101,505 | |
| | | | | | | | |
Diversified Telecommunication Services 0.0%c | | | | | | | | |
Koninklijke (Royal) KPN NV, Mar. 11 Calls, 3/20/09 | | Netherlands | | 2,890 | | | 161,644 | |
| | | | | | | | |
Food Products 0.1% | | | | | | | | |
Cadbury PLC, Jun. 6.4 Calls, 6/19/09 | | United Kingdom | | 158 | | | 99,230 | |
Cadbury PLC, Mar. 6 Calls, 3/20/09 | | United Kingdom | | 80 | | | 52,580 | |
Groupe Danone, Mar. 48 Calls, 3/20/09 | | France | | 772 | | | 164,082 | |
Nestle SA, Mar. 48 Calls, 3/20/09 | | Switzerland | | 477 | | | 12,953 | |
| | | | | | | | |
| | | | | | | 328,845 | |
| | | | | | | | |
Multi-Utilities 0.0%c | | | | | | | | |
GDF Suez, Mar. 36 Calls, 3/20/09 | | France | | 514 | | | 198,369 | |
| | | | | | | | |
Software 0.0%c | | | | | | | | |
Microsoft Corp., Apr. 26 Calls, 4/18/09 | | United States | | 476 | | | 11,424 | |
| | | | | | | | |
Tobacco 0.1% | | | | | | | | |
British American Tobacco PLC, Jun. 18 Calls, 6/19/09 | | United Kingdom | | 36 | | | 90,437 | |
British American Tobacco PLC, Mar. 18 Calls, 3/20/09 | | United Kingdom | | 141 | | | 252,273 | |
Imperial Tobacco Group PLC, Jun. 18 Calls, 6/19/09 | | United Kingdom | | 181 | | | 522,110 | |
Imperial Tobacco Group PLC, Mar. 18 Calls, 3/20/09 | | United Kingdom | | 274 | | | 538,257 | |
Lorillard Inc., Mar. 70 Calls, 3/21/09 | | United States | | 49 | | | 2,450 | |
Reynolds American Inc., Feb. 45 Calls, 2/21/09 | | United States | | 82 | | | 4,838 | |
Reynolds American Inc., May. 45 Calls, 5/16/09 | | United States | | 16 | | | 2,160 | |
| | | | | | | | |
| | | | | | | 1,412,525 | |
| | | | | | | | |
Total Options Written (Premiums Received $3,243,889) | | | | | | | 3,271,438 | |
| | | | | | | | |
MD-19
Franklin Templeton Variable Insurance Products Trust
Statement of Investments, December 31, 2008 (continued)
Mutual Discovery Securities Fund
See Abbreviations on page MD-37.
aNon-income producing for the twelve months ended December 31, 2008.
bContingent distributions represent the right to receive additional distributions, if any, during the reorganization of the underlying company. Shares represent total underlying principal of debt securities.
cRounds to less than 0.1% of net assets.
dSecurity has been deemed illiquid because it may not be able to be sold within seven days. At December 31, 2008, the aggregate value of these securities was $851,480, representing 0.07% of net assets.
eSee Note 10 regarding restricted and illiquid securities.
fSee Note 14 regarding other considerations.
gA portion or all of the security is held in connection with written option contracts open at year end.
hSee Note 13 regarding holdings of 5% voting securities.
iA portion or all of the security is on loan at December 31, 2008. See Note 1(i).
jThe principal amount is stated in U.S. dollars unless otherwise indicated.
kSecurity was purchased pursuant to Rule 144A under the Securities Act of 1933 and may be sold in transactions exempt from registration only to qualified institutional buyers or in a public offering registered under the Securities Act of 1933. These securities have been deemed liquid under guidelines approved by the Trust’s Board of Trustees. At December 31, 2008, the value of this security was $170,500, representing 0.01% of net assets.
lThe coupon rate shown represents the rate at period end.
mSee Note 1(h) regarding investments in special purpose entities.
nIncome may be received in additional securities and/or cash.
oSee Note 8 regarding defaulted securities.
pSee Note 11 regarding unfunded loan commitments.
qA portion or all of the security purchased on a delayed delivery basis. See Note 1(c).
rThe security is traded on a discount basis with no stated coupon rate.
sSee Note 1(i) regarding securities on loan.
tThe rate shown is the annualized seven-day yield at period end.
uSee Note 1(f) regarding written options.
The accompanying notes are an integral part of these financial statements.
MD-20
Franklin Templeton Variable Insurance Products Trust
Financial Statements
Statement of Assets and Liabilities
December 31, 2008
| | | | |
| | | Mutual
Discovery
Securities Fund | |
Assets: | | | | |
Investments in securities: | | | | |
Cost - Unaffiliated issuers | | $ | 1,272,646,311 | |
Cost - Non-controlled affiliated issuers (Note 13) | | | 8,000,000 | |
| | | | |
Total cost of investments | | $ | 1,280,646,311 | |
| | | | |
Value - Unaffiliated issuers | | $ | 1,143,325,395 | |
Value - Non-controlled affiliated issuers (Note 13) | | | 5,163,550 | |
| | | | |
Total value of investments (includes securities loaned in the amount of $750,547) | | | 1,148,488,945 | |
Cash | | | 55,409,894 | |
Cash on deposit with brokers | | | 3,935,373 | |
Foreign currency, at value (cost $21,897,438) | | | 21,805,418 | |
Receivables: | | | | |
Investment securities sold | | | 1,521,746 | |
Capital shares sold | | | 415,559 | |
Dividends and interest | | | 4,746,627 | |
Unrealized appreciation on forward exchange contracts (Note 7) | | | 31,617,644 | |
| | | | |
Total assets | | | 1,267,941,206 | |
| | | | |
Liabilities: | | | | |
Payables: | | | | |
Investment securities purchased | | | 28,599,049 | |
Capital shares redeemed | | | 549,176 | |
Affiliates | | | 1,419,617 | |
Options written, at value (premiums received $3,243,889) | | | 3,271,438 | |
Payable upon return of securities loaned | | | 701,033 | |
Unrealized depreciation on forward exchange contracts (Note 7) | | | 13,917,542 | |
Accrued expenses and other liabilities | | | 461,409 | |
| | | | |
Total liabilities | | | 48,919,264 | |
| | | | |
Net assets, at value | | $ | 1,219,021,942 | |
| | | | |
Net assets consist of: | | | | |
Paid-in capital | | $ | 1,311,929,929 | |
Undistributed net investment income | | | 15,630,756 | |
Net unrealized appreciation (depreciation) | | | (114,567,848 | ) |
Accumulated net realized gain (loss) | | | 6,280,556 | |
| | | | |
Net assets, at value | | $ | 1,219,021,942 | |
| | | | |
The accompanying notes are an integral part of these financial statements.
MD-21
Franklin Templeton Variable Insurance Products Trust
Financial Statements (continued)
Statement of Assets and Liabilities (continued)
December 31, 2008
| | | |
| | | Mutual
Discovery
Securities Fund |
Class 1: | | | |
Net assets, at value | | $ | 81,320,322 |
| | | |
Shares outstanding | | | 5,044,805 |
| | | |
Net asset value and maximum offering price per share | | $ | 16.12 |
| | | |
Class 2: | | | |
Net assets, at value | | $ | 1,113,720,479 |
| | | |
Shares outstanding | | | 70,270,634 |
| | | |
Net asset value and maximum offering price per share | | $ | 15.85 |
| | | |
Class 4: | | | |
Net assets, at value | | $ | 23,981,141 |
| | | |
Shares outstanding | | | 1,491,997 |
| | | |
Net asset value and maximum offering price per share | | $ | 16.07 |
| | | |
The accompanying notes are an integral part of these financial statements.
MD-22
Franklin Templeton Variable Insurance Products Trust
Financial Statements (continued)
Statement of Operations
for the year ended December 31, 2008
| | | | |
| | | Mutual
Discovery
Securities Fund | |
Investment income: | | | | |
Dividends (net of foreign taxes of $3,054,116) | | $ | 33,857,988 | |
Interest | | | 11,918,133 | |
Income from securities loaned | | | 201,540 | |
| | | | |
Total investment income | | | 45,977,661 | |
| | | | |
Expenses: | | | | |
Management fees (Note 3a) | | | 13,122,318 | |
Administrative fees (Note 3b) | | | 1,805,108 | |
Distribution fees: (Note 3c) | | | | |
Class 2 | | | 3,797,568 | |
Class 4 | | | 29,493 | |
Unaffiliated transfer agent fees | | | 562 | |
Custodian fees (Note 4) | | | 360,564 | |
Reports to shareholders | | | 383,249 | |
Registration and filing fees | | | 12,969 | |
Professional fees | | | 223,590 | |
Trustees’ fees and expenses | | | 8,599 | |
Dividends on securities sold short | | | 136,104 | |
Other | | | 63,943 | |
| | | | |
Total expenses | | | 19,944,067 | |
Expense reductions (Note 4) | | | (5,077 | ) |
| | | | |
Net expenses | | | 19,938,990 | |
| | | | |
Net investment income | | | 26,038,671 | |
| | | | |
Realized and unrealized gains (losses): | | | | |
Net realized gain (loss) from: | | | | |
Investments | | | (35,822,182 | ) |
Foreign currency transactions | | | 32,667,052 | |
Securities sold short | | | 3,142,166 | |
| | | | |
Net realized gain (loss) | | | (12,964 | ) |
| | | | |
Net change in unrealized appreciation (depreciation) on: | | | | |
Investments | | | (587,670,997 | ) |
Translation of other assets and liabilities denominated in foreign currencies | | | 19,060,120 | |
| | | | |
Net change in unrealized appreciation (depreciation) | | | (568,610,877 | ) |
| | | | |
Net realized and unrealized gain (loss) | | | (568,623,841 | ) |
| | | | |
Net increase (decrease) in net assets resulting from operations | | $ | (542,585,170 | ) |
| | | | |
The accompanying notes are an integral part of these financial statements.
MD-23
Franklin Templeton Variable Insurance Products Trust
Financial Statements (continued)
Statements of Changes in Net Assets
| | | | | | | | |
| | | Mutual Discovery
Securities Fund | |
| | | Year Ended December 31, | |
| | | 2008 | | | 2007 | |
| | | | |
Increase (decrease) in net assets: | | | | | | | | |
Operations: | | | | | | | | |
Net investment income | | $ | 26,038,671 | | | $ | 31,700,617 | |
Net realized gain (loss) from investments, securities sold short, synthetic equity swaps and foreign currency transactions | | | (12,964 | ) | | | 75,274,478 | |
Net change in unrealized appreciation (depreciation) on investments and translation of other assets and liabilities denominated in foreign currencies | | | (568,610,877 | ) | | | 80,877,932 | |
| | | | |
Net increase (decrease) in net assets resulting from operations | | | (542,585,170 | ) | | | 187,853,027 | |
| | | | |
Distributions to shareholders from: | | | | | | | | |
Net investment income: | | | | | | | | |
Class 1 | | | (2,657,059 | ) | | | (2,332,175 | ) |
Class 2 | | | (34,278,128 | ) | | | (24,421,554 | ) |
Class 4 | | | (368,895 | ) | | | — | |
Net realized gains: | | | | | | | | |
Class 1 | | | (4,424,672 | ) | | | (1,723,058 | ) |
Class 2 | | | (64,218,477 | ) | | | (20,089,859 | ) |
Class 4 | | | (614,304 | ) | | | — | |
| | | | |
Total distributions to shareholders | | | (106,561,535 | ) | | | (48,566,646 | ) |
| | | | |
Capital share transactions: (Note 2) | | | | | | | | |
Class 1 | | | (18,342,463 | ) | | | (16,311,111 | ) |
Class 2 | | | (152,581,891 | ) | | | 375,475,744 | |
Class 4 | | | 28,857,728 | | | | — | |
| | | | |
Total capital share transactions | | | (142,066,626 | ) | | | 359,164,633 | |
| | | | |
Net increase (decrease) in net assets | | | (791,213,331 | ) | | | 498,451,014 | |
Net assets: | | | | | | | | |
Beginning of year | | | 2,010,235,273 | | | | 1,511,784,259 | |
| | | | |
End of year | | $ | 1,219,021,942 | | | $ | 2,010,235,273 | |
| | | | |
Undistributed net investment income included in net assets: | | | | | | | | |
End of year | | $ | 15,630,756 | | | $ | 33,940,612 | |
| | | | |
The accompanying notes are an integral part of these financial statements.
MD-24
Franklin Templeton Variable Insurance Products Trust
Notes to Financial Statements
Mutual Discovery Securities Fund
1. ORGANIZATION AND SIGNIFICANT ACCOUNTING POLICIES
Franklin Templeton Variable Insurance Products Trust (Trust) is registered under the Investment Company Act of 1940, as amended, (1940 Act) as an open-end investment company, consisting of twenty-three separate funds. The Mutual Discovery Securities Fund (Fund) is included in this report. The financial statements of the remaining funds in the Trust are presented separately. Shares of the Fund are sold only to insurance company separate accounts to fund the benefits of variable life insurance policies or variable annuity contracts. At December 31, 2008, 53.97% of the Fund’s shares were held through one insurance company. The Fund offers three classes of shares: Class 1, Class 2, and Class 4. Effective February 29, 2008, the Fund began offering a new class of shares, Class 4. Each class of shares differs by its distribution fees, voting rights on matters affecting a single class and its exchange privilege.
The following summarizes the Fund’s significant accounting policies.
a. Security Valuation
Securities listed on a securities exchange or on the NASDAQ National Market System are valued at the last quoted sale price or the official closing price of the day, respectively. Over-the-counter securities and listed securities for which there is no reported sale are valued within the range of the most recent quoted bid and ask prices. Securities that trade in multiple markets or on multiple exchanges are valued according to the broadest and most representative market. Investments in open-end mutual funds are valued at the closing net asset value.
Corporate debt securities and government securities generally trade in the over-the-counter market rather than on a securities exchange. The Trust may utilize independent pricing services, quotations from bond dealers, and information with respect to bond and note transactions, to assist in determining a current market value for each security. The Trust’s pricing services may use valuation models or matrix pricing which considers information with respect to comparable bond and note transactions, quotations from bond dealers, or by reference to other securities that are considered comparable in such characteristics as rating, interest rate and maturity date, option adjusted spread models, prepayment projections, interest rate spreads and yield curves, to determine current value.
Foreign securities are valued as of the close of trading on the foreign stock exchange on which the security is primarily traded, or the NYSE, whichever is earlier. If no sale is reported at that time, the foreign security will be valued within the range of the most recent quoted bid and ask prices. The value is then converted into its U.S. dollar equivalent at the foreign exchange rate in effect at the close of the NYSE on the day that the value of the foreign security is determined.
The Trust has procedures to determine the fair value of individual securities and other assets for which market prices are not readily available or which may not be reliably priced. Methods for valuing these securities may include: fundamental analysis, matrix pricing, discounts from market prices of similar securities, or discounts applied due to the nature and duration of restrictions on the disposition of the securities. Due to the inherent uncertainty of valuations of such securities, the fair values may differ significantly from the values that would have been used had a ready market for such investments existed. Occasionally, events occur between the time at which trading in a security is completed and the close of the NYSE that might call into question the availability (including the reliability) of the value of a portfolio security held by the Fund. The investment manager monitors price movements following the close of trading in foreign stock markets through a series of country specific market proxies (such as baskets of American Depository Receipts, futures contracts and exchange traded funds). These price movements are measured against established trigger thresholds for each specific market proxy to assist in determining if an event has occurred. If such an event occurs, the securities may be valued using fair value procedures, which may include the use of independent pricing services. At December 31, 2008, a portion of the securities held by the Fund were fair valued. All security valuation procedures are approved by the Trust’s Board of Trustees.
MD-25
Franklin Templeton Variable Insurance Products Trust
Notes to Financial Statements (continued)
Mutual Discovery Securities Fund
1. ORGANIZATION AND SIGNIFICANT ACCOUNTING POLICIES (continued)
b. Foreign Currency Translation
Portfolio securities and other assets and liabilities denominated in foreign currencies are translated into U.S. dollars based on the exchange rate of such currencies against U.S. dollars on the date of valuation. Purchases and sales of securities, income and expense items denominated in foreign currencies are translated into U.S. dollars at the exchange rate in effect on the transaction date. Occasionally, events may impact the availability or reliability of foreign exchange rates used to convert the U.S. dollar equivalent value. If such an event occurs, the foreign exchange rate will be valued at fair value using procedures established and approved by the Trust’s Board of Trustees.
The Fund does not separately report the effect of changes in foreign exchange rates from changes in market prices on securities held. Such changes are included in net realized and unrealized gain or loss from investments on the Statement of Operations.
Realized foreign exchange gains or losses arise from sales of foreign currencies, currency gains or losses realized between the trade and settlement dates on securities transactions and the difference between the recorded amounts of dividends, interest, and foreign withholding taxes and the U.S. dollar equivalent of the amounts actually received or paid. Net unrealized foreign exchange gains and losses arise from changes in foreign exchange rates on foreign denominated assets and liabilities other than investments in securities held at the end of the reporting period.
c. Securities Purchased on a Delayed Delivery Basis
The Fund may purchase securities on a delayed delivery basis, with payment and delivery scheduled for a future date. These transactions are subject to market fluctuations and are subject to the risk that the value at delivery may be more or less than the trade date purchase price. Although the Fund will generally purchase these securities with the intention of holding the securities, it may sell the securities before the settlement date. Sufficient assets have been segregated for these securities.
d. Foreign Currency Contracts
When the Fund purchases or sells foreign securities it may enter into foreign exchange contracts to minimize foreign exchange risk from the trade date to the settlement date of the transactions. A foreign exchange contract is an agreement between two parties to exchange different currencies at an agreed upon exchange rate at a future date. Realized and unrealized gains and losses on these contracts are included in the Statement of Operations.
The Fund may also enter into forward exchange contracts to hedge against fluctuations in foreign exchange. These contracts are valued daily by the Fund and the unrealized appreciation or depreciation on the contracts, as measured by the difference between the contractual forward foreign exchange rates and the forward rates at the reporting date, are included in the Statement of Assets and Liabilities. Realized and unrealized gains and losses on these contracts are included in the Statement of Operations.
The risks of these contracts include movement in the values of the foreign currencies relative to the U.S. dollar and the possible inability of the counterparties to fulfill their obligations under the contracts, which may be in excess of the amount reflected in the Statement of Assets and Liabilities.
e. Synthetic Equity Swaps
The Fund may engage in synthetic equity swaps. Synthetic equity swaps are contracts entered into between a broker and the fund under which the parties agree to make payments to each other so as to replicate the economic consequences that would apply had a purchase or short sale of the underlying security taken place. Upon entering into synthetic equity swaps, the fund is required to pledge to the broker an amount of cash and/or other assets equal to a certain percentage of the contract amount (margin account). Periodically, payments are made to recognize changes in value of the contract resulting from interest on the notional value of the contract, market value changes in the underlying security, and/or dividends paid by the issuer of the
MD-26
Franklin Templeton Variable Insurance Products Trust
Notes to Financial Statements (continued)
Mutual Discovery Securities Fund
1. ORGANIZATION AND SIGNIFICANT ACCOUNTING POLICIES (continued)
e. Synthetic Equity Swaps (continued)
underlying security. The Fund recognizes a realized gain or loss when cash is received from, or paid to, the broker. Synthetic equity swaps are valued daily by the Fund and the unrealized appreciation or depreciation on the contracts (as measured by the difference between the contract amount plus or minus cash received or paid and the market value of the underlying securities) are recorded in the Statement of Operations. The margin account and any net unrealized appreciation or depreciation on open synthetic equity swaps are included in the Statement of Assets and Liabilities. The risks of entering into synthetic equity swaps include unfavorable price movements in the underlying securities or the inability of the counterparties to fulfill their obligations under the contract.
f. Options
The Fund may purchase or write options. Options are contracts entitling the holder to purchase or sell securities, currencies, or other financial instruments at a specified price or exchange rate, or, in the case of index options, to receive or pay the difference between the index value and the strike price of the index option. Options purchased are recorded as investments; options written (sold) are recorded as liabilities. Upon closing of an option which results in a cash settlement, the difference between the premium (original option value) and the settlement proceeds is realized as a gain or loss. When securities are acquired or delivered upon exercise of an option, the acquisition cost or sale proceeds are adjusted by the amount of the premium. When an option expires, the premium is realized as a gain for options written or as a loss for options purchased. The risks include the possibility there may be an illiquid options market or the inability of the counterparties to fulfill their obligations under the contract. Writing options involves, to varying degrees, elements of market risk in excess of the amount recognized in the Statement of Assets and Liabilities.
g. Securities Sold Short
The Fund is engaged in selling securities short, which obligates the Fund to replace a borrowed security with the same security at current market value. The Fund incurs a loss if the price of the security increases between the date of the short sale and the date on which the Fund replaces the borrowed security. The Fund realizes a gain if the price of the security declines between those dates. Gains are limited to the price at which the Fund sold the security short, while losses are potentially unlimited in size.
The Fund is required to establish a margin account with the broker lending the security sold short. While the short sale is outstanding, the broker retains the proceeds of the short sale and the Fund must maintain a deposit with broker consisting of cash and securities having a value equal to a specified percentage of the value of the securities sold short. The Fund is obligated to pay the counterparty any dividends or interest due on securities sold short. Such dividends and interest are recorded as an expense to the Fund.
h. Investments in Special Purpose Entities
At December 31, 2008, the Fund had contributed an additional $4,756,750 as a subordinated note holder of certain special purpose entities (“SPEs”). Such contributions, while made at the discretion of the Fund, represent additional capital contributions to the SPE in support of its underlying investments and are subject first to the claims of the senior note holders of the SPE. These contributions are recorded as an addition to the Fund’s cost basis in the SPE and are subject to the risk of loss in the event of continued unfavorable market conditions related to the SPE’s underlying investments.
i. Securities Lending
The Fund participates in an agency based security lending program. The Fund receives cash collateral against the loaned securities in an amount equal to at least 102% of the market value of the loaned securities. Collateral is maintained over the life of the loan in an amount not less than 100% of the market value of loaned securities, as determined at the close of Fund business each day; any
MD-27
Franklin Templeton Variable Insurance Products Trust
Notes to Financial Statements (continued)
Mutual Discovery Securities Fund
1. ORGANIZATION AND SIGNIFICANT ACCOUNTING POLICIES (continued)
i. Securities Lending (continued)
additional collateral required due to changes in security values is delivered to the fund on the next business day. The collateral is invested in a non-registered money market fund managed by the Fund’s custodian on the Fund’s behalf. The Fund receives income from the investment of cash collateral, in addition to lending fees and rebates paid by the borrower. The Fund bears the market risk with respect to the collateral investment, securities loaned, and the risk that the agent may default on its obligations to the Fund. The securities lending agent has agreed to indemnify the Fund in the event of default by a third party borrower.
j. Income Taxes
No provision has been made for U.S. income taxes because it is the Fund’s policy to qualify as a regulated investment company under the Internal Revenue Code and to distribute to shareholders substantially all of its taxable income and net realized gains.
Foreign securities held by the Fund may be subject to foreign taxation on dividend and interest income received. Foreign taxes, if any, are recorded based on the tax regulations and rates that exist in the foreign markets in which the Fund invests.
The Fund has reviewed the tax positions, taken on federal income tax returns, for each of the three open tax years and as of December 31, 2008, and has determined that no provision for income tax is required in the Fund’s financial statements.
k. Security Transactions, Investment Income, Expenses and Distributions
Security transactions are accounted for on trade date. Realized gains and losses on security transactions are determined on a specific identification basis. Interest income and estimated expenses are accrued daily. Amortization of premium and accretion of discount on debt securities are included in interest income. Dividend income, and dividends declared on securities sold short, are recorded on the ex-dividend date except that certain dividends from foreign securities are recognized as soon as the Fund is notified of the ex-dividend date. Distributions to shareholders are recorded on the ex-dividend date and are determined according to income tax regulations (tax basis). Distributable earnings determined on a tax basis may differ from earnings recorded in accordance with accounting principles generally accepted in the United States of America. These differences may be permanent or temporary. Permanent differences are reclassified among capital accounts to reflect their tax character. These reclassifications have no impact on net assets or the results of operations. Temporary differences are not reclassified, as they may reverse in subsequent periods.
Common expenses incurred by the Trust are allocated among the funds based on the ratio of net assets of each fund to the combined net assets of the Trust. Fund specific expenses are charged directly to the fund that incurred the expense.
Realized and unrealized gains and losses and net investment income, not including class specific expenses, are allocated daily to each class of shares based upon the relative proportion of net assets of each class. Differences in per share distributions, by class, are generally due to differences in class specific expenses.
l. Accounting Estimates
The preparation of financial statements in accordance with accounting principles generally accepted in the United States of America requires management to make estimates and assumptions that affect the reported amounts of assets and liabilities at the date of the financial statements and the amounts of income and expenses during the reporting period. Actual results could differ from those estimates.
m. Guarantees and Indemnifications
Under the Trust’s organizational documents, its officers and trustees are indemnified by the Trust against certain liabilities arising out of the performance of their duties to the Trust. Additionally, in the normal course of business, the Trust, on behalf of the Fund, enters into contracts with service providers that contain general indemnification clauses. The Trust’s maximum exposure under these arrangements is unknown as this would involve future claims that may be made against the Trust that have not yet occurred. Currently, the Trust expects the risk of loss to be remote.
MD-28
Franklin Templeton Variable Insurance Products Trust
Notes to Financial Statements (continued)
Mutual Discovery Securities Fund
2. SHARES OF BENEFICIAL INTEREST
At December 31, 2008, there were an unlimited number of shares authorized (without par value). Transactions in the Fund’s shares were as follows:
Shares of Beneficial Interest
| | | | | | | | | | | | | | |
| | | Year Ended December 31, | |
| | | 2008a | | | 2007 | |
| Class 1 Shares: | | Shares | | | Amount | | | Shares | | | Amount | |
Shares sold | | 91,837 | | | $ | 2,015,607 | | | 259,646 | | | $ | 6,152,126 | |
Shares issued in reinvestment of distributions | | 365,038 | | | | 7,081,731 | | | 167,641 | | | | 4,055,233 | |
Shares redeemed | | (1,340,440 | ) | | | (27,439,801 | ) | | (1,129,651 | ) | | | (26,518,470 | ) |
| | | | |
Net increase (decrease) | | (883,565 | ) | | $ | (18,342,463 | ) | | (702,364 | ) | | $ | (16,311,111 | ) |
| | | | |
| Class 2 Shares: | | | | | | | | | | | | |
Shares sold | | 7,042,696 | | | $ | 147,206,623 | | | 22,660,989 | | | $ | 527,810,165 | |
Shares issued in reinvestment of distributions | | 5,159,592 | | | | 98,496,605 | | | 1,867,089 | | | | 44,511,413 | |
Shares redeemed | | (20,749,426 | ) | | | (398,285,119 | ) | | (8,565,570 | ) | | | (196,845,834 | ) |
| | | | |
Net increase (decrease) | | (8,547,138 | ) | | $ | (152,581,891 | ) | | 15,962,508 | | | $ | 375,475,744 | |
| | | | |
| Class 4 Shares: | | | | | | | | | | | | |
Shares sold | | 1,455,745 | | | $ | 28,125,030 | | | | | | | | |
Shares issued on reinvestment of distributions | | 50,743 | | | | 982,892 | | | | | | | | |
Shares redeemed | | (14,491 | ) | | | (250,194 | ) | | | | | | | |
| | | | | | | | | | |
Net increase (decrease) | | 1,491,997 | | | $ | 28,857,728 | | | | | | | | |
| | | | | | | | | | |
aFor | the period February 29, 2008 (effective date) to December 31, 2008 for Class 4. |
3. TRANSACTIONS WITH AFFILIATES
Franklin Resources, Inc. is the holding company for various subsidiaries that together are referred to as Franklin Templeton Investments. Certain officers and trustees of the Trust are also officers and/or directors of the following subsidiaries:
| | |
| Subsidiary | | Affiliation |
Franklin Mutual Advisers, LLC (Franklin Mutual) | | Investment manager |
Franklin Templeton Investment Management Limited (Investment Management) | | Investment manager |
Franklin Templeton Services, LLC (FT Services) | | Administrative manager |
Franklin Templeton Distributors, Inc. (Distributors) | | Principal underwriter |
Franklin Templeton Investor Services, LLC (Investor Services) | | Transfer agent |
a. Management Fees
The Fund pays an investment management fee to Franklin Mutual based on the average daily net assets of the Fund as follows:
| | |
| Annualized Fee Rate | | Net Assets |
| 0.800% | | Up to and including $4 billion |
| 0.770% | | Over $4 billion, up to and including $7 billion |
| 0.750% | | Over $7 billion, up to and including $10 billion |
| 0.730% | | In excess of $10 billion |
Under a subadvisory agreement, Investment Management, an affiliate of Franklin Mutual, provides subadvisory services to the Fund and receives from Franklin Mutual fees based on the average daily net assets of the Fund.
MD-29
Franklin Templeton Variable Insurance Products Trust
Notes to Financial Statements (continued)
Mutual Discovery Securities Fund
3. TRANSACTIONS WITH AFFILIATES (continued)
b. Administrative Fees
The Fund pays an administrative fee to FT Services based on the Fund’s average daily net assets as follows:
| | |
| Annualized Fee Rate | | Net Assets |
| 0.150% | | Up to and including $200 million |
| 0.135% | | Over $200 million, up to and including $700 million |
| 0.100% | | Over $700 million, up to and including $1.2 billion |
| 0.075% | | In excess of $1.2 billion |
c. Distribution Fees
The Fund’s Board of Trustees has adopted distribution plans for Class 2 and Class 4 shares pursuant to Rule 12b-1 under the 1940 Act. Under the Fund’s compensation distribution plans, the Fund pays Distributors for costs incurred in connection with the servicing, sale and distribution of the Fund’s shares up to 0.35% per year of its average daily net assets. The Board of Trustees has agreed to limit the current rate to 0.25% per year for Class 2.
d. Transfer Agent Fees
Investor Services, under terms of an agreement, performs shareholder servicing for the Fund and is not paid by the Fund for the services.
4. EXPENSE OFFSET ARRANGEMENT
The Fund has entered into an arrangement with its custodian whereby credits realized as a result of uninvested cash balances are used to reduce a portion of the Fund’s custodian expenses. During the year ended December 31, 2008, the custodian fees were reduced as noted in the Statement of Operations.
5. INCOME TAXES
For tax purposes, realized capital losses and realized currency losses occurring subsequent to October 31, may be deferred and treated as occurring on the first day of the following fiscal year. At December 31, 2008, the Fund deferred realized capital losses and realized currency losses of $16,144,610 and $515,519, respectively.
The tax character of distributions paid during the years ended December 31, 2008 and 2007, was as follows:
| | | | | | |
| | | 2008 | | 2007 |
Distributions paid from: | | | | | | |
Ordinary Income | | $ | 41,019,318 | | $ | 27,339,679 |
Long term capital gain | | | 65,542,217 | | | 21,226,967 |
| | | |
| | $ | 106,561,535 | | $ | 48,566,646 |
| | | |
MD-30
Franklin Templeton Variable Insurance Products Trust
Notes to Financial Statements (continued)
Mutual Discovery Securities Fund
5. INCOME TAXES (continued)
At December 31, 2008, the cost of investments, net unrealized appreciation (depreciation) and undistributed ordinary income for income tax purposes were as follows:
| | | | |
Cost of investments | | $ | 1,282,038,230 | |
| | | | |
| |
Unrealized appreciation | | $ | 87,875,210 | |
Unrealized depreciation | | | (221,424,495 | ) |
| | | | |
Net unrealized appreciation (depreciation) | | $ | (133,549,285 | ) |
| | | | |
Distributable earnings – undistributed ordinary income | | $ | 52,290,230 | |
| | | | |
Net investment income differs for financial statement and tax purposes primarily due to differing treatments of defaulted securities, foreign currency transactions, passive foreign investment company shares, pass-through entity income, bond discounts and premiums, and certain dividends on securities sold short.
Net realized gains (losses) differ for financial statement and tax purposes primarily due to differing treatments of wash sales, tax straddles, foreign currency transactions, pass-through entity income, and bond discounts and premiums.
6. INVESTMENT TRANSACTIONS
Purchases and sales of investments (excluding short term securities and securities sold short) for the year ended December 31, 2008, aggregated $283,933,909 and $641,991,100, respectively.
Transactions in options written during the year ended December 31, 2008, were as follows:
| | | | | |
| | | Number of
Contracts | | Premiums
Received |
Options outstanding at December 31, 2007 | | — | | $ | — |
Options written | | 7,628 | | | 3,243,889 |
Options expired | | — | | | — |
Options exercised | | — | | | — |
Options closed | | — | | | — |
| | |
Options outstanding at December 31, 2008 | | 7,628 | | $ | 3,243,889 |
| | |
7. FORWARD EXCHANGE CONTRACTS
At December 31, 2008, the Fund had the following forward exchange contracts outstanding:
| | | | | | | | | | | | | | |
| | | Contract
Amount | | Settlement
Date | | Unrealized
Appreciation | | Unrealized
Depreciation | |
| Contracts to Buy | | | | | | | | | |
| 5,613,413 | | British Pound Sterling | | $ | 9,377,312 | | 1/12/09 | | $ | — | | $ | (1,181,365 | ) |
| 4,912,830 | | Norwegian Krone | | | 780,000 | | 1/12/09 | | | — | | | (74,276 | ) |
| 13,782,720 | | Norwegian Krone | | | 1,960,000 | | 1/12/09 | | | 19,878 | | | — | |
| 107,958,388 | | Danish Krone | | | 18,438,823 | | 1/23/09 | | | 1,807,911 | | | — | |
| 5,372,554 | | Danish Krone | | | 1,027,444 | | 1/23/09 | | | — | | | (20,968 | ) |
| 37,990,930 | | Swiss Franc | | | 33,200,068 | | 2/09/09 | | | 2,393,372 | | | — | |
MD-31
Franklin Templeton Variable Insurance Products Trust
Notes to Financial Statements (continued)
Mutual Discovery Securities Fund
7. FORWARD EXCHANGE CONTRACTS (continued)
| | | | | | | | | | | | | | |
| | | Contract
Amount | | Settlement
Date | | Unrealized
Appreciation | | Unrealized
Depreciation | |
| Contracts to Buy (continued) | | | | | | | | | |
| 18,293,533 | | Euro | | $ | 23,516,142 | | 2/13/09 | | $ | 2,019,230 | | $ | — | |
| 818,163 | | Canadian Dollar | | | 649,679 | | 2/27/09 | | | 22,356 | | | — | |
| 5,425,637 | | British Pound Sterling | | | 9,257,764 | | 3/10/09 | | | — | | | (1,344,833 | ) |
| 7,558,270 | | Singapore Dollar | | | 5,097,916 | | 3/24/09 | | | 164,312 | | | — | |
| 97,532 | | Euro | | | 123,344 | | 5/13/09 | | | 12,526 | | | — | |
| 8,829,341 | | Norwegian Krone | | | 1,225,000 | | 5/19/09 | | | 36,803 | | | — | |
| | | | |
| Contracts to Sell | | | | | | | | | |
| 9,291,385 | | British Pound Sterling | | | 16,031,601 | | 1/12/09 | | | 2,465,575 | | | — | |
| 1,065,060 | | Norwegian Krone | | | 150,000 | | 1/12/09 | | | — | | | (2,995 | ) |
| 5,180,064 | | Euro | | | 7,098,242 | | 1/14/09 | | | — | | | (140,378 | ) |
| 174,298,800 | | Danish Krone | | | 35,659,299 | | 1/23/09 | | | 2,970,950 | | | — | |
| 12,480,592 | | Danish Krone | | | 2,160,000 | | 1/23/09 | | | — | | | (180,635 | ) |
| 6,000,000 | | Euro | | | 8,777,100 | | 1/26/09 | | | 397,327 | | | — | |
| 31,086,813 | | Swiss Franc | | | 29,564,254 | | 2/09/09 | | | 439,234 | | | — | |
| 1,546,071 | | Swiss Franc | | | 1,340,000 | | 2/09/09 | | | — | | | (108,503 | ) |
| 34,000,000 | | Euro | | | 50,534,200 | | 2/13/09 | | | 3,074,661 | | | — | |
| 485,045,975 | | Japanese Yen | | | 5,049,102 | | 2/19/09 | | | — | | | (302,610 | ) |
| 4,465,538 | | Canadian Dollar | | | 3,532,792 | | 2/27/09 | | | — | | | (135,181 | ) |
| 14,760,000 | | Euro | | | 19,229,036 | | 2/27/09 | | | — | | | (1,366,564 | ) |
| 45,000,000 | | Swiss Franc | | | 40,637,391 | | 3/09/09 | | | — | | | (1,537,343 | ) |
| 50,000,000 | | British Pound Sterling | | | 86,707,650 | | 3/10/09 | | | 13,785,975 | | | — | |
| 39,192,841 | | Euro | | | 51,809,017 | | 3/13/09 | | | — | | | (2,861,153 | ) |
| 13,326,539 | | Singapore Dollar | | | 9,498,602 | | 3/24/09 | | | 220,383 | | | — | |
| 764,694 | | Singapore Dollar | | | 510,000 | | 3/24/09 | | | — | | | (22,396 | ) |
| 11,546,075,000 | | South Korean Won | | | 9,675,000 | | 4/06/09 | | | 501,255 | | | | |
| 19,992,657,500 | | South Korean Won | | | 14,770,000 | | 4/06/09 | | | — | | | (1,114,838 | ) |
| 1,342,000,000 | | Japanese Yen | | | 15,284,738 | | 4/20/09 | | | 456,363 | | | — | |
| 18,111,387 | | Euro | | | 23,573,697 | | 4/30/09 | | | — | | | (1,663,718 | ) |
| 1,857,314 | | Euro | | | 2,327,214 | | 5/13/09 | | | — | | | (260,180 | ) |
| 1,206,248 | | Euro | | | 1,695,586 | | 5/13/09 | | | 15,182 | | | — | |
| 131,354,325 | | Norwegian Krone | | | 18,618,622 | | 5/19/09 | | | — | | | (153,253 | ) |
| 14,000,000 | | Euro | | | 18,230,800 | | 5/29/09 | | | — | | | (1,265,976 | ) |
| 2,347,445 | | New Zealand Dollar | | | 1,251,188 | | 9/10/09 | | | — | | | (89,993 | ) |
| 3,185,451 | | British Pound Sterling | | | 4,726,143 | | 9/14/09 | | | 80,965 | | | | |
| Unrealized appreciation (depreciation) on offsetting forward exchange contracts | | | | | | | | 733,386 | | | (90,384 | ) |
| | | | | | | | | | | |
| Unrealized appreciation (depreciation) on forward exchange contracts | | | | | | | | 31,617,644 | | | (13,917,542 | ) |
| | | | | | | | | | | |
| Net unrealized appreciation (depreciation) on forward exchange contracts | | | | | | | $ | 17,700,102 | | | | |
| | | | | | | | | | | | | | |
8. CREDIT RISK AND DEFAULTED SECURITIES
The Fund may purchase the pre-default or defaulted debt of distressed companies. Distressed companies are financially troubled and are about to be/or are already involved in financial restructuring or bankruptcy. The Fund does not accrue income on these securities, if it becomes probable that the income will not be collected. Risks associated with purchasing these securities include the possibility that the bankruptcy or other restructuring process takes longer than expected, or that distributions in
MD-32
Franklin Templeton Variable Insurance Products Trust
Notes to Financial Statements (continued)
Mutual Discovery Securities Fund
8. CREDIT RISK AND DEFAULTED SECURITIES (continued)
restructuring are less than anticipated, either or both of which may result in unfavorable consequences to the Fund. At December 31, 2008, the aggregate value of these securities was $424,352, representing less than 0.03% of the Fund’s net assets. For information as to specific securities, see the accompanying Statement of Investments.
9. CONCENTRATION OF RISK
Investing in foreign securities may include certain risks and considerations not typically associated with investing in U.S. securities, such as fluctuating currency values and changing local and regional economic, political and social conditions, which may result in greater market volatility. In addition, certain foreign securities may not be as liquid as U.S. securities.
10. RESTRICTED SECURITIES
The Fund may invest in securities that are restricted under the Securities Act of 1933 (1933 Act) or which are subject to legal, contractual, or other agreed upon restrictions on resale. Restricted securities are often purchased in private placement transactions, and cannot be sold without prior registration unless the sale is pursuant to an exemption under the 1933 Act. Disposal of these securities may require greater effort and expense, and prompt sale at an acceptable price may be difficult. The Fund may have registration rights for restricted securities. The issuer generally incurs all registration costs.
At December 31, 2008, the Fund held investments in restricted securities, excluding 144A securities deemed to be liquid, valued in accordance with procedures approved by the Fund’s Board of Trustees as reflecting fair value, as follows:
| | | | | | | | | | |
Principal
Amount/
Shares/
Warrants/ Contracts | | Issuer | | Acquisition
Dates | | Cost | | Value |
| 18,411 | | AboveNet Inc. | | 10/02/01 - 8/08/08 | | $ | 910,432 | | $ | 920,550 |
| 23 | | AboveNet Inc., stock grant, grant price $20.95, expiration date 9/09/13 | | 4/17/06 - 9/08/06 | | | — | | | 52 |
| 739 | | AboveNet Inc., wts., 9/08/10 | | 10/02/01 - 9/07/07 | | | 76,963 | | | 2,956 |
| 800,000 | | The Bankshares Inc. | | 3/22/07 | | | 8,000,000 | | | 5,163,550 |
| 2,161,828 | | Cerberus CG Investor I LLC | | 7/26/07 - 6/17/08 | | | 2,161,828 | | | 432,366 |
| 1,897,400 | | Cerberus CG Investor I LLC, 12.00%, 7/31/14 | | 7/26/07 | | | 1,897,400 | | | 379,480 |
| 2,161,828 | | Cerberus CG Investor II LLC | | 7/26/07 - 6/17/08 | | | 2,161,828 | | | 432,366 |
| 1,897,400 | | Cerberus CG Investor II LLC, 12.00%, 7/31/14 | | 7/26/07 | | | 1,897,400 | | | 379,480 |
| 1,080,914 | | Cerberus CG Investor III LLC | | 7/26/07 - 6/17/08 | | | 1,080,914 | | | 216,183 |
| 948,700 | | Cerberus CG Investor III LLC, 12.00%, 7/31/14 | | 7/26/07 | | | 948,700 | | | 189,740 |
| 2,049,750 | | Cerberus FIM Investors Holdco LLC | | 11/20/06 | | | 2,049,750 | | | 434,132 |
| 6,148,028 | | Cerberus FIM Investors Holdco LLC, 12.00%, 11/22/13 | | 11/21/06 | | | 6,148,028 | | | 1,302,152 |
| 9,611 | | aDana Holding Corp., 4.00%, cvt. pfd., B | | 12/27/07 | | | 961,100 | | | 86,499 |
| 21,716 | | bDecisionOne Corp. | | 3/12/99 - 7/18/00 | | | 16,482 | | | — |
| 27,953 | | bDecisionOne Corp., 12.00%, 4/15/10 | | 3/12/99 - 10/16/08 | | | 40,303 | | | 27,953 |
| 11,923 | | bDecisionOne Corp., wts., 6/08/17 | | 7/09/07 | | | — | | | — |
| 1,903 | | Elephant Capital Holdings Ltd. | | 8/23/04 - 3/10/08 | | | 221,298 | | | — |
| 47,271 | | IACNA Investor LLC | | 7/24/08 | | | 48,411 | | | 473 |
| 451,787 | | Imagine Group Holdings Ltd. | | 8/31/04 | | | 4,626,977 | | | 3,700,135 |
| 424,073 | | International Automotive Components Group Brazil LLC | | 4/13/06 - 12/26/08 | | | 284,478 | | | 337,401 |
| 74,174 | | International Automotive Components Group Japan LLC | | 9/26/06 - 3/27/07 | | | 643,935 | | | 80,163 |
| 1,512,200 | | International Automotive Components Group LLC | | 1/12/06 - 10/16/06 | | | 1,512,594 | | | 257,225 |
| 407,500 | | International Automotive Components Group NA LLC, 9.00%, 4/01/17 | | 3/30/07 | | | 413,613 | | | 196,448 |
| 1,353,608 | | International Automotive Components Group NA LLC, A | | 3/30/07 - 10/10/07 | | | 1,268,161 | | | 220,367 |
MD-33
Franklin Templeton Variable Insurance Products Trust
Notes to Financial Statements (continued)
Mutual Discovery Securities Fund
10. RESTRICTED SECURITIES (continued)
| | | | | | | | | | |
Principal
Amount/
Shares/
Warrants/ Contracts | | Issuer | | Acquisition
Dates | | Cost | | Value |
| 69,953 | | Kindred Healthcare Inc. | | 5/20/99 - 7/08/08 | | $ | 657,546 | | $ | 865,249 |
| 1,460,000 | | MPF Corp. Ltd. | | 5/08/06 | | | 7,500,856 | | | — |
| 9,306 | | NCB Warrant Holdings Ltd., A | | 12/16/05 - 3/10/08 | | | 97,943 | | | — |
| 2,140 | | Olympus Re Holdings Ltd. | | 12/19/01 | | | 206,942 | | | 5,024 |
| 5,513,169 | | Pontus I LLC, junior note, 144A, FRN, 5.689%, 7/24/09 | | 1/22/08 - 2/25/08 | | | 10,141,345 | | | 6,221,085 |
| 872,120 | | Pontus II Trust, junior profit-participating note, 144A, FRN, 7.516%, 6/25/09 | | 2/29/08 | | | 1,000,694 | | | 203,483 |
| 4,289 | | PTV Inc., 10.00%, pfd., A | | 12/07/01 - 3/06/02 | | | 6,005 | | | 3,860 |
| | | | | | | | | | |
| | Total Restricted Securities (1.81% of Net Assets) | | | | | | | $ | 22,058,372 |
| | | | | | | | | | |
aThe | Fund also invests in unrestricted securities of the issuer, valued at $84,671 as of December 31, 2008. |
bThe | Fund also invests in unrestricted securities of the issuer, valued at $5,008 as of December 31, 2008. |
11. UNFUNDED LOAN COMMITMENTS
The Fund may enter into certain credit agreements, all or a portion of which may be unfunded. The Fund is obligated to fund these loan commitments at the borrowers’ discretion. Funded portions of credit agreements are presented on the Statement of Investments.
At December 31, 2008, unfunded commitments were as follows:
| | | |
| Borrower | | Unfunded
Commitment |
Motor Coach Industries International Inc., First Lien DIP Revolver, FRN 7.75%, 9/19/09 | | $ | 94,703 |
| | | |
Unfunded loan commitments and funded portions of credit agreements are marked to market daily and any unrealized appreciation or depreciation is included in the Statement of Assets and Liabilities and Statement of Operations.
12. UNFUNDED CAPITAL COMMITMENTS
At December 31, 2008, the Fund had aggregate unfunded capital commitments to investments of $3,036,399.
MD-34
Franklin Templeton Variable Insurance Products Trust
Notes to Financial Statements (continued)
Mutual Discovery Securities Fund
13. HOLDINGS OF 5% VOTING SECURITIES OF PORTFOLIO COMPANIES
The 1940 Act defines “affiliated companies” to include investments in portfolio companies in which a fund owns 5% or more of the outstanding voting securities. Investments in “affiliated companies” for the Fund for the year ended December 31, 2008, were as shown below.
| | | | | | | | | | | | | | | | | |
| Name of Issuer | | Number
of Shares
Held at
Beginning
of Year | | Gross
Additions | | Gross
Reductions | | Number
of Shares
Held at
End of
Year | | Value at
End of
Year | | Investment
Income | | Realized
Capital
Gain (Loss) |
Non-Controlled Affiliates | | | | | | | | | | | | | | | | | |
The Bankshares Inc. (0.42% of Net Assets) | | 800,000 | | — | | — | | 800,000 | | $ | 5,163,550 | | $ | — | | $ | — |
| | | | | | | | | | | |
14. OTHER CONSIDERATIONS
Officers, directors or employees of the Fund’s Investment Manager, may serve from time to time as members of bondholders’ steering committees, official creditors’ committees, or boards of directors of companies in which the Fund invests. Such participation may result in the possession by the Investment Manager of material non-public information which, pursuant to the Fund’s policies and the requirements of applicable securities laws, could prevent the Fund from trading in the securities of such companies for limited or extended periods of time.
Franklin Mutual serves as investment manager to certain special purpose entities that issued securities held by the Fund. Franklin Mutual is not compensated for such services and does not invest in or exercise control over such entities. As investment manager, Franklin Mutual is primarily responsible for recommending investments in unaffiliated issuers to be held by the special purpose entities. Securities issued by these special purpose entities are restricted under the Securities Act of 1933 and are deemed to be illiquid.
15. FAIR VALUE MEASUREMENTS
The Fund adopted Financial Accounting Standards Board (FASB) Statement No. 157, “Fair Value Measurement” (SFAS 157), on January 1, 2008. SFAS 157 defines fair value, establishes a framework for measuring fair value, and expands disclosures about fair value measurements. The Fund has determined that the implementation of SFAS 157 did not have a material impact on the Fund’s financial statements.
SFAS 157 establishes a fair value hierarchy that distinguishes between market data obtained from independent sources (observable inputs) and the Fund’s own market assumptions (unobservable inputs). These inputs are used in determining the value of the Fund’s investments and are summarized in the following fair value hierarchy:
| | • | | Level 1 – quoted prices in active markets for identical securities |
| | • | | Level 2 – other significant observable inputs (including quoted prices for similar securities, interest rates, prepayment speed, credit risk, etc.) |
| | • | | Level 3 – significant unobservable inputs (including the Fund’s own assumptions in determining the fair value of investments) |
MD-35
Franklin Templeton Variable Insurance Products Trust
Notes to Financial Statements (continued)
Mutual Discovery Securities Fund
15. FAIR VALUE MEASUREMENTS (continued)
The inputs or methodology used for valuing securities are not an indication of the risk associated with investing in those securities.
The following is a summary of the inputs used as of December 31, 2008, in valuing the Fund’s assets and liabilities carried at fair value:
| | | | | | | | | | | | |
| | | Level 1 | | Level 2 | | Level 3 | | Total |
Assets: | | | | | | | | | | | | |
Investments in Securities | | $ | 683,784,401 | | $ | 441,885,052 | | $ | 22,819,492 | | $ | 1,148,488,945 |
Other Financial Instrumentsa | | | — | | | 31,617,644 | | | — | | | 31,617,644 |
Liabilities: | | | | | | | | | | | | |
Options Written | | | — | | | 3,271,438 | | | — | | | 3,271,438 |
Other Financial Instrumentsa | | | — | | | 13,918,055 | | | — | | | 13,918,055 |
a | Other financial instruments include net unrealized appreciation (depreciation) on forward exchange contracts and unfunded loan commitments. |
At December 31, 2008, the reconciliation of assets in which significant unobservable inputs (Level 3) were used in determining the Fund’s fair value, is as follows:
| | | | |
| | | Investments
in Securities | |
Beginning Balance – January 1, 2008 | | $ | 45,162,739 | |
Net realized gain (loss) | | | 247,018 | |
Net change in unrealized appreciation (depreciation) | | | (27,542,924 | ) |
Net purchases (sales) | | | 5,883,077 | |
Transfers in and/or out of Level 3 | | | (930,418 | ) |
| | | | |
Ending Balance | | $ | 22,819,492 | |
| | | | |
Net change in unrealized appreciation (depreciation) attributable to assets still held at end of year | | $ | (29,450,870 | ) |
| | | | |
16. NEW ACCOUNTING PRONOUNCEMENT
In March 2008, FASB issued FASB Statement No. 161, “Disclosures about Derivative Instruments and Hedging Activities, an amendment of FASB Statement No. 133” (SFAS 161), which expands disclosures about derivative investments and hedging activities. SFAS 161 is effective for fiscal years and interim periods beginning after November 15, 2008. The Fund is currently evaluating the impact, if any, of applying the various provisions of SFAS 161.
MD-36
Franklin Templeton Variable Insurance Products Trust
Notes to Financial Statements (continued)
Mutual Discovery Securities Fund
17. SUBSEQUENT EVENT
On January 23, 2009, the Fund entered into, along with other funds managed by Franklin Templeton Investments (individually, “Borrower”; collectively “Borrowers”), a $725 million senior unsecured syndicated global line of credit (“Global Credit Facility”) to provide a source of funds to the Borrowers for temporary and emergency purposes and to meet future unanticipated or unusually large redemption requests.
Under the terms of the Global Credit Facility, each Borrower has agreed to pay its proportionate share of fees and expenses incurred in connection with the implementation and maintenance of the Global Credit Facility.
Currency Abbreviations
CAD - Canadian Dollar
EUR - Euro
GBP - British Pound Sterling
Selected Portfolio Abbreviations
ADR - American Depository Receipt
DIP - Debtor-In-Possession
FHLB - Federal Home Loan Bank
FRN - Floating Rate Note
PIK - Payment-In-Kind
REIT - Real Estate Investment Trust
MD-37
Franklin Templeton Variable Insurance Products Trust
Mutual Discovery Securities Fund
Report of Independent Registered Public Accounting Firm
To the Board of Trustees and Shareholders of
Franklin Templeton Variable Insurance Products Trust
In our opinion, the accompanying statement of assets and liabilities, including the statement of investments, and the related statements of operations and of changes in net assets and the financial highlights present fairly, in all material respects, the financial position of Mutual Discovery Securities Fund (one of the funds constituting the Franklin Templeton Variable Insurance Products Trust, hereafter referred to as the “Fund”) at December 31, 2008, the results of its operations for the year then ended, the changes in its net assets and the financial highlights for the periods presented, in conformity with accounting principles generally accepted in the United States of America. These financial statements and financial highlights (hereafter referred to as “financial statements”) are the responsibility of the Fund’s management. Our responsibility is to express an opinion on these financial statements based on our audits. We conducted our audits of these financial statements in accordance with the standards of the Public Company Accounting Oversight Board (United States). Those standards require that we plan and perform the audit to obtain reasonable assurance about whether the financial statements are free of material misstatement. An audit includes examining, on a test basis, evidence supporting the amounts and disclosures in the financial statements, assessing the accounting principles used and significant estimates made by management, and evaluating the overall financial statement presentation. We believe that our audits, which included confirmation of securities at December 31, 2008 by correspondence with the custodian and brokers, provide a reasonable basis for our opinion.
PricewaterhouseCoopers LLP
San Francisco, California
February 10, 2009
MD-38
Franklin Templeton Variable Insurance Products Trust
Tax Designation (unaudited)
Mutual Discovery Securities Fund
Under Section 852(b)(3)(C) of the Internal Revenue Code (Code), the Fund designates the maximum amount allowable but no less than $65,542,217 as a long term capital gain dividend for the fiscal year ended December 31, 2008.
Under Section 854(b)(2) of the Code, the Fund designates 12.36% of the ordinary income dividends as income qualifying for the dividends received deduction for the fiscal year ended December 31, 2008.
At December 31, 2007, more than 50% of the Fund’s total assets were invested in securities of foreign issuers. In most instances, foreign taxes were withheld from income paid to the Fund on these investments. As shown in the table below, the Fund designates to shareholders the foreign source income and foreign taxes paid, pursuant to Section 853 of the Code. This designation will allow shareholders of record on September 4, 2008, to treat their proportionate share of foreign taxes paid by the Fund as having been paid directly by them. The shareholder shall consider these amounts as foreign taxes paid in the tax year in which they receive the Fund distribution.
The following table provides a detailed analysis of foreign tax paid, and foreign source income, and foreign qualified dividends as designated by the Fund, to Class 1, Class 2, and Class 4 shareholders of record.
| | | | | | | | | |
| Class | | Foreign Tax
Paid
Per Share | | Foreign
Source Income
Per Share | | Foreign
Qualified Dividends
Per Share |
Class 1 | | $ | 0.0351 | | $ | 0.3483 | | $ | 0.2644 |
Class 2 | | $ | 0.0351 | | $ | 0.3147 | | $ | 0.2390 |
Class 4 | | $ | 0.0351 | | $ | 0.3483 | | $ | 0.2644 |
Foreign Tax Paid Per Share (Column 1) is the amount per share available to you, as a tax credit (assuming you held your shares in the Fund for a minimum of 16 days during the 31-day period beginning 15 days before the ex-dividend date of the Fund’s distribution to which the foreign taxes relate), or, as a tax deduction.
Foreign Source Income Per Share (Column 2) is the amount per share of income dividends paid to you that is attributable to foreign securities held by the Fund, plus any foreign taxes withheld on these dividends.
Foreign Qualified Dividends Per Share (Column 3) is the amount per share of foreign source qualified dividends the Fund paid to you, plus any foreign taxes withheld on these dividends. These amounts represent the portion of the Foreign Source Income reported to you in column 2 that were derived from qualified foreign securities held by the Fund.
MD-39
MUTUAL SHARES SECURITIES FUND
This annual report for Mutual Shares Securities Fund covers the fiscal year ended December 31, 2008.
Performance Summary as of 12/31/08
Average annual total return of Class 1 shares represents the average annual change in value, assuming reinvestment of dividends and capital gains. Average returns smooth out variations in returns, which can be significant; they are not the same as year-by-year results.
Periods ended 12/31/08
| | | | | | |
| | | 1-Year | | 5-Year | | 10-Year |
Average Annual Total Return | | -36.93% | | -0.59% | | +4.07% |
Total Return Index Comparison
for a Hypothetical $10,000 Investment (1/1/99–12/31/08)
The graph below shows the change in value of a hypothetical $10,000 investment in the Fund over the indicated period and includes reinvestment of any income or distributions. The Fund’s performance is compared to the performance of the Standard & Poor’s 500 Index (S&P 500). One cannot invest directly in an index, nor is an index representative of the Fund’s portfolio. Please see Important Notes to Performance Information preceding the Fund Summaries.
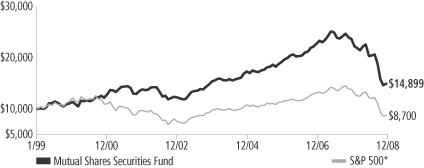
*Source: © 2009 Morningstar. Please see Index Descriptions following the Fund Summaries.
Mutual Shares Securities Fund – Class 1
Performance reflects the Fund’s Class 1 operating expenses, but does not include any contract fees, expenses or sales charges. If they had been included, performance would be lower. These charges and deductions, particularly for variable life policies, can have a significant effect on contract values and insurance benefits. See the contract prospectus for a complete description of these expenses, including sales charges.
Performance data represent past performance, which does not guarantee future results. Investment return and principal value will fluctuate, and you may have a gain or loss when you sell your shares. Current performance may differ from figures shown.
MS-1
Fund Goals and Main Investments: Mutual Shares Securities Fund seeks capital appreciation, with income as a secondary goal. The Fund normally invests primarily in U.S. and foreign equity securities that the manager believes are undervalued. The Fund also invests, to a lesser extent, in risk arbitrage securities and distressed companies.
Performance Overview
You can find the Fund’s one-year total return in the Performance Summary. The Fund performed comparably to its benchmark, the S&P 500, which had a -37.00% total return for the period under review.1
Economic and Market Overview
In 2008, the U.S. economy faltered and The Conference Board’s Consumer Confidence Index fell to an all-time low since it began in 1967. The government’s abrupt conservatorship of Fannie Mae and Freddie Mac and the failure of several blue-chip banks and financial institutions roiled the equity markets. Despite government interventions and massive emergency funding, rapidly weakening manufacturing activity and falling home prices exacerbated the nation’s economic troubles. Jobless claims mounted and the unemployment rate rose to 7.2% by period-end.2 In early December, the National Bureau of Economic Research officially declared the U.S. economy has been in recession since December 2007.
The weakening U.S. economy negatively impacted growth prospects around the world. Although growth in the first half of the year was robust in developing economies, particularly in Asia, signs of a global
slowdown surfaced in the latter half. In an environment of extremely high commodity prices that increased inflationary pressure, the world’s monetary authorities faced the choice of lowering short-term interest rates to stimulate growth or raising them to fight rising inflation. Stimulus provided through fiscal and monetary policies implemented around the globe sought to restore financial market stability and reignite economic growth.
The U.S. Treasury and the Federal Reserve Board took unprecedented steps, including lowering short-term rates to near 0% from 4.25%. The European Central Bank (ECB) and many of the world’s other central banks had raised rates due to inflationary pressures. Later in the year, the
1. Source: © 2009 Morningstar. One cannot invest directly in an index, nor is an index representative of the Fund��s portfolio. Please see Index Descriptions following the Fund Summaries.
2. Source: Bureau of Labor Statistics.
Fund Risks: The Fund’s investments in stocks offer the potential for long-term gains but can be subject to short-term price fluctuations. Investments in companies involved in mergers, liquidations, reorganizations and distressed bankruptcy, which may include defaulted debt, involve higher credit and other risks. Foreign investing, especially in emerging markets, involves additional risks, including currency fluctuations, economic instability, market volatility, and political and social instability. Smaller and midsize company securities involve special risks, such as relatively small revenues, limited product lines and small market share. The Fund’s prospectus also includes a description of the main investment risks.
MS-2
potential for global recession trumped inflationary concerns, and the world’s monetary authorities cut interest rates aggressively. The U.S. dollar, which had declined earlier in the period versus many of the world’s currencies, regained ground quickly toward period-end as a flight to the relative safety of U.S. Treasuries prevailed.
In this challenging economic time, volatility came to define global equity markets. Virtually all local indexes ended the 12-month period with marked losses. Despite negative economic data and an outlook for decelerating corporate earnings and profit margins globally, many companies outside the financials sector retained relatively strong balance sheets.
Investment Strategy
At Mutual Series, we are committed to our distinctive value approach to investing. Our major investment strategy is investing in undervalued stocks. When selecting undervalued equities, we are attracted to fundamentally strong companies with healthy balance sheets, high-quality assets, substantial free cash flow and shareholder-oriented management teams and whose stocks are trading at discounts to our assessment of the companies’ intrinsic or business value. We also look for asset rich companies whose shares may be trading at depressed levels due to concerns over short-term earnings disappointments, litigation, management strategy or other perceived negatives. While the vast majority of our undervalued equity investments are made in publicly traded companies globally, we may invest occasionally in privately held companies as well.
We complement this more traditional investment strategy with two others. One is distressed investing, which is complex and can take many forms. The most common distressed investment the Fund undertakes is the purchase of financially troubled or bankrupt companies’ debt at a substantial discount to face value. After the financially distressed company is reorganized, often in bankruptcy court, the old debt is typically replaced with new securities issued by the financially stronger company.
The other piece of our investment strategy is participating in arbitrage situations, another highly specialized field. When companies announce proposed mergers or takeovers, commonly referred to as “deals,” the target company may trade at a discount to the bid it ultimately accepts. One form of arbitrage involves purchasing the target company’s stock when it is trading below the value it would receive in a deal. In keeping with our commitment to a relatively conservative investment approach,
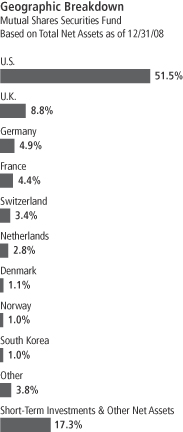
MS-3
we typically focus our arbitrage efforts on announced deals, and eschew rumored deals or other situations we consider relatively risky.
In addition, we will generally seek to hedge the Fund’s currency exposure when we deem it advantageous for our shareholders.
Manager’s Discussion
During the period under review, three investments that declined in value were Constellation Energy, a power generation and distribution company; News Corp., an international media company; and International Paper, a paper and forest products company.
In the second half of 2008, Constellation Energy’s management disclosed that collateral requirements for certain business operations had increased substantially. This development triggered concerns about the company’s capital position, and its share price weakened materially. In September, MidAmerican Energy Holdings, a utility controlled by Berkshire Hathaway, agreed to inject capital into Constellation and also offered to purchase all of Constellation’s outstanding shares for $4.7 billion. Initially, Constellation’s board supported MidAmerican’s offer, but by mid-December Electricite de France (EDF), a Constellation joint venture partner, offered to purchase half of the company’s nuclear assets for $4.5 billion. The EDF proposal enabled existing investors to retain a stake in half of Constellation’s nuclear generation assets and complete ownership of its remaining assets. Constellation’s board ultimately endorsed EDF’s offer and terminated the MidAmerican deal. During the course of 2008, Constellation’s shares fell almost 75% in value. Although MidAmerican’s capital injection was dilutive to shareholders and the shares declined in value, we believed the share price at year-end materially undervalued Constellation’s combined assets.
News Corp. shares declined 55% as early signs of recession curbed advertising spending. The company has a diversified portfolio of media properties including television networks and stations, cable networks, newspapers and a film studio. While some of these platforms posted strong growth, the television stations and newspaper operations proved particularly vulnerable as consumers’ multi-year migration away from those media formats was exacerbated by a slowing advertising market. Although perhaps somewhat counterintuitive, the company’s significant cash balance also weighed on the stock price. Investors were concerned about the company’s suggestions that it would prefer strategic acquisitions over stock repurchases despite the weak business environment. We believed that the longer-term strategic value of News Corp.’s assets remained intact.
Top 10 Sectors/Industries
Mutual Shares Securities Fund
Based on Equity Securities 12/31/08
| | |
| | | % of Total
Net Assets |
| |
| Tobacco | | 11.1% |
| |
| Insurance | | 7.3% |
| |
| Media | | 6.2% |
| |
| Food Products | | 4.6% |
| |
| Food & Staples Retailing | | 4.1% |
| |
| Oil, Gas & Consumable Fuels | | 3.9% |
| |
| Industrial Conglomerates | | 3.7% |
| |
| Diversified Telecommunication Services | | 3.2% |
| |
| Electric Utilities | | 3.0% |
| |
| Paper & Forest Products | | 2.7% |
MS-4
Shares of International Paper, North America’s largest producer of cardboard boxes and the second-largest producer of copy paper in North America, declined 62% in value during the year under review. The stock came under pressure as rising raw materials prices drove input costs higher, demand declined due to overall economic weakness, and lower capacity utilization negatively affected the company’s financial performance. Despite these headwinds, pricing for International Paper’s products remained fairly firm as the company (and most of its competitors) aggressively reduced production to better match supply with demand. The company completed its purchase of Weyerhaeuser’s box business in August, which provided significant cost-saving opportunities. We believed this holding’s intrinsic value was significantly higher than year-end market values and continued to hold the position into 2009.
In contrast to these disappointments, three of the Fund’s best performing investments were Valeant Pharmaceuticals International, a specialty pharmaceuticals company; brewer Anheuser-Busch; and H&R Block, a financial services company specializing in tax return preparation.
Valeant is a multinational company that develops and markets products primarily in the neurology and therapeutic dermatology areas. Valeant’s stock rose 91% during the year, supported by a number of positive developments. In February 2008, Michael Pearson was named CEO, and his focus on the company’s core geographies was well received by investors. Pearson quickly began to deliver on his strategy by selling the company’s western European operations and announcing his intention to exit much of the central European business. Over the course of 2008, Valeant also announced a cost reduction program, a partnership with GlaxoSmithKline to develop the epilepsy drug Retigabine, and acquisitions to bolster existing product lines.
Anheuser-Busch received an unsolicited $65-per-share cash takeover offer from Belgian brewing giant InBev in the spring of 2008. In our analysis, the company had been a long-time underperformer and suffered from a complacent management team. After the initial announcement, we began to buy shares at a discount to the offer as we believed the acquirer had the financial strength and management aggressiveness to increase its price and complete the deal. In July, the board of Anheuser-Busch accepted InBev’s enhanced $70-per-share cash offer. As the global credit crunch accelerated in September and October, Anheuser-Busch shares traded lower over concerns that the
Top 10 Holdings
Mutual Shares Securities Fund 12/31/08
| | |
Company
Sector/Industry,
Country | | % of Total
Net Assets |
| |
| British American Tobacco PLC, ord. & ADR | | 3.1% |
| Tobacco, U.K. | | |
| |
| Berkshire Hathaway Inc., A & B | | 2.7% |
| Insurance, U.S. | | |
| |
| Comcast Corp., A | | 2.4% |
| Media, U.S. | | |
| |
| Imperial Tobacco Group PLC | | 2.3% |
| Tobacco, U.K. | | |
| |
| CVS Caremark Corp. | | 2.0% |
| Food & Staples Retailing, U.S. | | |
| |
| Microsoft Corp. | | 1.9% |
| Software, U.S. | | |
| |
| Nestle SA | | 1.8% |
| Food Products, Switzerland | | |
| |
| E.ON AG | | 1.5% |
| Electric Utilities, Germany | | |
| |
| Mattel Inc. | | 1.5% |
| Leisure Equipment & Products, U.S. | | |
| |
| News Corp., A | | 1.5% |
| Media, U.S. | | |
The dollar value, number of shares or principal amount, and names of all portfolio holdings are listed in the Fund’s Statement of Investments.
MS-5
deal might not close, and we used this opportunity to add to the Fund’s position. InBev completed the acquisition in November, and the new company, Anheuser-Busch InBev, became the largest global brewer. Overall, the Fund’s investment appreciated nearly 15% during 2008.
H&R Block (sold by period-end) is the largest U.S. tax preparer, serving clients through both retail offices and the Internet. In recent years, the company expanded its business portfolio by entering the subprime mortgage market and suffered the consequences in 2007 and thereafter. In 2008, shareholders voted in new board members who exited the mortgage business and improved operating margins in H&R Block’s remaining businesses. During the time we held it in 2008, the Fund’s shares rose 25% in value as a result of this management turnaround.
Finally, investors should note that we maintained our currency hedging posture of being generally hedged to the U.S. dollar for most of our non-U.S. holdings. Since the dollar was stronger compared with most foreign currencies during 2008, the Fund benefited to the extent it was hedged. Also, our sizable cash position provided a cushion against declining markets.
Thank you for your participation in Mutual Shares Securities Fund. We look forward to serving your future investment needs.
The foregoing information reflects our analysis, opinions and portfolio holdings as of December 31, 2008, the end of the reporting period. The way we implement our main investment strategies and the resulting portfolio holdings may change depending on factors such as market and economic conditions. These opinions may not be relied upon as investment advice or an offer for a particular security. The information is not a complete analysis of every aspect of any market, country, industry, security or the Fund. Statements of fact are from sources considered reliable, but the investment manager makes no representation or warranty as to their completeness or accuracy. Although historical performance is no guarantee of future results, these insights may help you understand our investment management philosophy.
MS-6
Fund Expenses
As an investor in a variable insurance contract (Contract) that indirectly provides for investment in an underlying mutual fund, you can incur transaction and/or ongoing expenses at both the Fund level and the Contract level.
| • | | Transaction expenses can include sales charges (loads) on purchases, redemption fees, surrender fees, transfer fees and premium taxes. |
| • | | Ongoing expenses can include management fees, distribution and service (12b-1) fees, contract fees, annual maintenance fees, mortality and expense risk fees and other fees and expenses. All mutual funds and Contracts have some types of ongoing expenses. |
The expenses shown in the table are meant to highlight ongoing expenses at the Fund level only and do not include ongoing expenses at the Contract level, or transaction expenses at either the Fund or Contract level. While the Fund does not have transaction expenses, if the transaction and ongoing expenses at the Contract level were included, the expenses shown below would be higher. You should consult your Contract prospectus or disclosure document for more information.
The table shows Fund-level ongoing expenses and can help you understand these expenses and compare them with those of other mutual funds offered through the Contract. The table assumes a $1,000 investment held for the six months indicated. Please refer to the Fund prospectus for additional information on operating expenses.
Actual Fund Expenses
The first line (Actual) of the table provides actual account values and expenses. The “Ending Account Value” is derived from the Fund’s actual return, which includes the effect of ongoing Fund expenses, but does not include the effect of ongoing Contract expenses.
You can estimate the Fund-level expenses you incurred during the period by following these steps. Of course, your account value and expenses will differ from those in this illustration:
| 1. | Divide your account value by $1,000. |
If an account had an $8,600 value, then $8,600 ÷ $1,000 = 8.6.
| 2. | Multiply the result by the number under the heading “Fund-Level Expenses Incurred During Period.” |
If Fund-Level Expenses Incurred During Period were $7.50, then 8.6 x $7.50 = $64.50.
In this illustration, the estimated expenses incurred this period at the Fund level are $64.50.
Mutual Shares Securities Fund – Class 1
MS-7
Hypothetical Example for Comparison with Other Mutual Funds
Information in the second line (Hypothetical) of the table can help you compare ongoing expenses of the Fund with those of other mutual funds offered through the Contract. This information may not be used to estimate the actual ending account balance or expenses you incurred during the period. The hypothetical “Ending Account Value” is based on the Fund’s actual expense ratio and an assumed 5% annual rate of return before expenses, which does not represent the Fund’s actual return. The figure under the heading “Fund-Level Expenses Incurred During Period” shows the hypothetical expenses your account would have incurred under this scenario. You can compare this figure with the 5% hypothetical examples that appear in shareholder reports of other funds offered through a Contract.
| | | | | | | | | |
| Class 1 | | Beginning
Account Value 7/1/08 | | Ending Account Value 12/31/08 | | Fund-Level
Expenses Incurred
During Period*
7/1/08–12/31/08 |
Actual | | $ | 1,000 | | $ | 733.80 | | $ | 3.23 |
Hypothetical (5% return before expenses) | | $ | 1,000 | | $ | 1,021.42 | | $ | 3.76 |
*Expenses are calculated using the most recent six-month annualized expense ratio for the Fund’s Class 1 shares (0.74%), which does not include any ongoing expenses of the Contract for which the Fund is an investment option, multiplied by the average account value over the period, multiplied by 184/366 to reflect the one-half year period.
MS-8
Franklin Templeton Variable Insurance Products Trust
Financial Highlights
Mutual Shares Securities Fund
| | | | | | | | | | | | | | | | | | | | |
| | | Year Ended December 31, | |
| Class 1 | | 2008 | | | 2007 | | | 2006 | | | 2005 | | | 2004 | |
| | | | |
Per share operating performance | | | | | | | | | | | | | | | | | | | | |
(for a share outstanding throughout the year) | | | | | | | | | | | | | | | | | | | | |
Net asset value, beginning of year | | $ | 20.42 | | | $ | 20.67 | | | $ | 18.35 | | | $ | 16.78 | | | $ | 15.00 | |
| | | | |
Income from investment operationsa: | | | | | | | | | | | | | | | | | | | | |
Net investment incomeb | | | 0.34 | | | | 0.54 | | | | 0.40 | | | | 0.34 | | | | 0.21 | |
Net realized and unrealized gains (losses) | | | (7.54 | ) | | | 0.31 | | | | 2.86 | | | | 1.47 | | | | 1.71 | |
| | | | |
Total from investment operations | | | (7.20 | ) | | | 0.85 | | | | 3.26 | | | | 1.81 | | | | 1.92 | |
| | | | |
Less distributions from: | | | | | | | | | | | | | | | | | | | | |
Net investment income | | | (0.57 | ) | | | (0.35 | ) | | | (0.29 | ) | | | (0.18 | ) | | | (0.14 | ) |
Net realized gains | | | (0.73 | ) | | | (0.75 | ) | | | (0.65 | ) | | | (0.06 | ) | | | — | |
| | | | |
Total distributions | | | (1.30 | ) | | | (1.10 | ) | | | (0.94 | ) | | | (0.24 | ) | | | (0.14 | ) |
| | | | |
Net asset value, end of year | | $ | 11.92 | | | $ | 20.42 | | | $ | 20.67 | | | $ | 18.35 | | | $ | 16.78 | |
| | | | |
| | | | | |
Total returnc | | | (36.93)% | | | | 3.72% | | | | 18.66% | | | | 10.83% | | | | 12.88% | |
Ratios to average net assets | | | | | | | | | | | | | | | | | | | | |
Expensesd,e | | | 0.73% | | | | 0.72% | | | | 0.81% | | | | 0.78% | | | | 0.75% | |
Expenses - excluding dividend expense on securities sold shorte | | | 0.73% | | | | 0.72% | | | | 0.74% | | | | 0.74% | | | | 0.73% | |
Net investment income | | | 2.16% | | | | 2.58% | | | | 2.02% | | | | 1.97% | | | | 1.40% | |
| | | | | |
Supplemental data | | | | | | | | | | | | | | | | | | | | |
Net assets, end of year (000’s) | | $ | 319,703 | | | $ | 272,509 | | | $ | 259,943 | | | $ | 260,317 | | | $ | 287,324 | |
Portfolio turnover rate | | | 44.11% | | | | 41.73% | f | | | 19.75% | | | | 19.59% | | | | 31.49% | |
aThe amount shown for a share outstanding throughout the period may not correlate with the Statement of Operations for the period due to the timing of sales and repurchases of the Fund shares in relation to income earned and/or fluctuating market value of the investments of the Fund.
bBased on average daily shares outstanding.
cTotal return does not include any fees, charges or expenses imposed by the variable annuity and life insurance contracts for which the Franklin Templeton Variable Insurance Products Trust serves as an underlying investment vehicle.
dIncludes dividend expense on securities sold short which varies from period to period. See below for expense ratios that reflect only operating expenses.
eBenefit of expense reduction rounds to less than 0.01%.
fExcludes the value of portfolio securities delivered as a result of redemption in-kind. See Note 15.
The accompanying notes are an integral part of these financial statements.
MS-9
Franklin Templeton Variable Insurance Products Trust
Financial Highlights (continued)
Mutual Shares Securities Fund
| | | | | | | | | | | | | | | | | | | | |
| | | Year Ended December 31, | |
| Class 2 | | 2008 | | | 2007 | | | 2006 | | | 2005 | | | 2004 | |
| | | | |
Per share operating performance | | | | | | | | | | | | | | | | | | | | |
(for a share outstanding throughout the year) | | | | | | | | | | | | | | | | | | | | |
Net asset value, beginning of year | | $ | 20.19 | | | $ | 20.46 | | | $ | 18.18 | | | $ | 16.64 | | | $ | 14.90 | |
| | | | |
Income from investment operationsa: | | | | | | | | | | | | | | | | | | | | |
Net investment incomeb | | | 0.32 | | | | 0.48 | | | | 0.34 | | | | 0.29 | | | | 0.18 | |
Net realized and unrealized gains (losses) | | | (7.49 | ) | | | 0.31 | | | | 2.84 | | | | 1.46 | | | | 1.68 | |
| | | | |
Total from investment operations | | | (7.17 | ) | | | 0.79 | | | | 3.18 | | | | 1.75 | | | | 1.86 | |
| | | | |
Less distributions from: | | | | | | | | | | | | | | | | | | | | |
Net investment income | | | (0.51 | ) | | | (0.31 | ) | | | (0.25 | ) | | | (0.15 | ) | | | (0.12 | ) |
Net realized gains | | | (0.73 | ) | | | (0.75 | ) | | | (0.65 | ) | | | (0.06 | ) | | | — | |
| | | | |
Total distributions | | | (1.24 | ) | | | (1.06 | ) | | | (0.90 | ) | | | (0.21 | ) | | | (0.12 | ) |
| | | | |
Net asset value, end of year | | $ | 11.78 | | | $ | 20.19 | | | $ | 20.46 | | | $ | 18.18 | | | $ | 16.64 | |
| | | | |
| | | | | |
Total returnc | | | (37.11)% | | | | 3.48% | | | | 18.38% | | | | 10.55% | | | | 12.63% | |
Ratios to average net assets | | | | | | | | | | | | | | | | | | | | |
Expensesd,e | | | 0.98% | | | | 0.97% | | | | 1.06% | | | | 1.03% | | | | 1.00% | |
Expenses - excluding dividend expense on securities sold shorte | | | 0.98% | | | | 0.97% | | | | 0.99% | | | | 0.99% | | | | 0.98% | |
Net investment income | | | 1.91% | | | | 2.33% | | | | 1.77% | | | | 1.72% | | | | 1.15% | |
| | | | | |
Supplemental data | | | | | | | | | | | | | | | | | | | | |
Net assets, end of year (000’s) | | $ | 3,303,761 | | | $ | 5,925,551 | | | $ | 5,140,878 | | | $ | 3,596,889 | | | $ | 2,464,374 | |
Portfolio turnover rate | | | 44.11% | | | | 41.73% | f | | | 19.75% | | | | 19.59% | | | | 31.49% | |
aThe amount shown for a share outstanding throughout the period may not correlate with the Statement of Operations for the period due to the timing of sales and repurchases of the Fund shares in relation to income earned and/or fluctuating market value of the investments of the Fund.
bBased on average daily shares outstanding.
cTotal return does not include any fees, charges or expenses imposed by the variable annuity and life insurance contracts for which the Franklin Templeton Variable Insurance Products Trust serves as an underlying investment vehicle.
dIncludes dividend expense on securities sold short which varies from period to period. See below for expense ratios that reflect only operating expenses.
eBenefit of expense reduction rounds to less than 0.01%.
fExcludes the value of portfolio securities delivered as a result of redemption in-kind. See Note 15.
The accompanying notes are an integral part of these financial statements.
MS-10
Franklin Templeton Variable Insurance Products Trust
Financial Highlights (continued)
Mutual Shares Securities Fund
| | | | |
| Class 4 | | period Ended
December 31,
2008a | |
| | | | |
Per share operating performance | | | | |
(for a share outstanding throughout the period) | | | | |
Net asset value, beginning of period | | $ | 18.91 | |
| | | | |
Income from investment operationsb: | | | | |
Net investment incomec | | | 0.17 | |
Net realized and unrealized gains (losses) | | | (5.90 | ) |
| | | | |
Total from investment operations | | | (5.73 | ) |
| | | | |
Less distributions from: | | | | |
Net investment income | | | (0.57 | ) |
Net realized gains | | | (0.73 | ) |
| | | | |
Total distributions | | | (1.30 | ) |
| | | | |
Net asset value, end of period | | $ | 11.88 | |
| | | | |
| |
Total returnd | | | (32.12)% | |
Ratios to average net assetse | | | | |
Expensesf,g | | | 1.08% | |
Expenses - excluding dividend expense on securities sold shortg | | | 1.08% | |
Net investment income | | | 1.81% | |
| |
Supplemental data | | | | |
Net assets, end of period (000’s) | | $ | 57,266 | |
Portfolio turnover rate | | | 44.11% | |
aFor the period February 29, 2008 (effective date) to December 31, 2008.
bThe amount shown for a share outstanding throughout the period may not correlate with the Statement of Operations for the period due to the timing of sales and repurchases of the Fund shares in relation to income earned and/or fluctuating market value of the investments of the Fund.
cBased on average daily shares outstanding.
dTotal return does not include any fees, charges or expenses imposed by the variable annuity and life insurance contracts for which the Franklin Templeton Variable Insurance Products Trust serves as an underlying investment vehicle. Total return is not annualized for periods less than one year.
eRatios are annualized for periods less than one year.
fIncludes dividend expense on securities sold short which varies from period to period. See below for expense ratios that reflect only operating expenses.
gBenefit of expense reduction rounds to less than 0.01%.
The accompanying notes are an integral part of these financial statements.
MS-11
Franklin Templeton Variable Insurance Product Trust
Statement of Investments, December 31, 2008
| | | | | | | |
| Mutual Shares Securities Fund | | Country | | Shares/
Warrants/
Contracts | | Value |
Common Stocks and Other Equity Interests 80.5% | | | | | | | |
Aerospace & Defense 1.2% | | | | | | | |
aGenCorp Inc. | | United States | | 494,180 | | $ | 1,818,582 |
United Technologies Corp. | | United States | | 770,303 | | | 41,288,240 |
| | | | | | | |
| | | | | | | 43,106,822 |
| | | | | | | |
Air Freight & Logistics 1.2% | | | | | | | |
Deutsche Post AG | | Germany | | 1,781,688 | | | 29,410,203 |
TNT NV | | Netherlands | | 847,498 | | | 16,306,377 |
| | | | | | | |
| | | | | | | 45,716,580 |
| | | | | | | |
Airlines 0.3% | | | | | | | |
aACE Aviation Holdings Inc., A | | Canada | | 594,087 | | | 3,295,601 |
aDelta Air Lines Inc. | | United States | | 800,435 | | | 9,172,985 |
a,bNorthwest Airlines Corp., Contingent Distribution | | United States | | 27,670,000 | | | 17,432 |
| | | | | | | |
| | | | | | | 12,486,018 |
| | | | | | | |
Auto Components 0.2% | | | | | | | |
a,b,cCollins & Aikman Products Co., Contingent Distribution | | United States | | 929,505 | | | 9,295 |
aDana Holding Corp. | | United States | | 437,959 | | | 324,090 |
a,bDana Holding Corp., Contingent Distribution | | United States | | 10,339,000 | | | 3,231 |
aGoodyear Tire & Rubber Co. | | United States | | 1,068,854 | | | 6,381,058 |
aLear Corp. | | United States | | 633,092 | | | 892,660 |
| | | | | | | |
| | | | | | | 7,610,334 |
| | | | | | | |
Automobiles 0.6% | | | | | | | |
Daimler AG | | Germany | | 350,712 | | | 12,946,576 |
Harley-Davidson Inc. | | United States | | 333,270 | | | 5,655,592 |
a,dIACNA Investor LLC | | United States | | 168,957 | | | 1,690 |
a,d,eInternational Automotive Components Group Brazil LLC | | Brazil | | 1,730,515 | | | 1,376,833 |
a,d,eInternational Automotive Components Group Japan LLC | | Japan | | 269,643 | | | 291,413 |
a,d,eInternational Automotive Components Group LLC | | Luxembourg | | 6,170,474 | | | 1,049,598 |
a,d,eInternational Automotive Components Group NA LLC, A | | United States | �� | 4,838,053 | | | 787,635 |
| | | | | | | |
| | | | | | | 22,109,337 |
| | | | | | | |
Beverages 2.7% | | | | | | | |
Brown-Forman Corp., A | | United States | | 7,455 | | | 377,372 |
Brown-Forman Corp., B | | United States | | 107,219 | | | 5,520,707 |
Carlsberg AS, B | | Denmark | | 296,066 | | | 9,525,128 |
Coca-Cola Enterprises Inc. | | United States | | 730,903 | | | 8,792,763 |
aDr. Pepper Snapple Group Inc. | | United States | | 1,919,017 | | | 31,184,026 |
Pernod Ricard SA | | France | | 581,644 | | | 43,081,180 |
| | | | | | | |
| | | | | | | 98,481,176 |
| | | | | | | |
Biotechnology 0.7% | | | | | | | |
aGenentech Inc. | | United States | | 319,254 | | | 26,469,349 |
| | | | | | | |
Building Products 0.4% | | | | | | | |
Armstrong World Industries Inc. | | United States | | 87,790 | | | 1,898,020 |
aOwens Corning Inc. | | United States | | 820,981 | | | 14,202,971 |
| | | | | | | |
| | | | | | | 16,100,991 |
| | | | | | | |
Capital Markets 0.4% | | | | | | | |
The Goldman Sachs Group Inc. | | United States | | 159,570 | | | 13,466,112 |
| | | | | | | |
MS-12
Franklin Templeton Variable Insurance Product Trust
Statement of Investments, December 31, 2008 (continued)
| | | | | | | |
| Mutual Shares Securities Fund | | Country | | Shares/
Warrants/
Contracts | | Value |
Common Stocks and Other Equity Interests (continued) | | | | | | | |
Chemicals 1.5% | | | | | | | |
a,b,cDow Corning Corp., Contingent Distribution | | United States | | 650,000 | | $ | 25,000 |
Koninklijke DSM NV | | Netherlands | | 670,345 | | | 17,176,818 |
Linde AG | | Germany | | 469,701 | | | 39,308,458 |
| | | | | | | |
| | | | | | | 56,510,276 |
| | | | | | | |
Commercial Banks 1.7% | | | | | | | |
Danske Bank AS | | Denmark | | 623,814 | | | 6,094,108 |
a,dElephant Capital Holdings Ltd. | | Japan | | 11,728 | | | — |
Fifth Third Bancorp | | United States | | 1,262,440 | | | 10,427,754 |
aGuaranty Bancorp | | United States | | 1,288,316 | | | 2,576,632 |
Intesa Sanpaolo SpA | | Italy | | 4,568,690 | | | 16,210,564 |
a,dNCB Warrant Holdings Ltd., A | | Japan | | 57,295 | | | — |
U.S. Bancorp | | United States | | 1,039,890 | | | 26,007,649 |
| | | | | | | |
| | | | | | | 61,316,707 |
| | | | | | | |
Commercial Services & Supplies 0.0%f | | | | | | | |
aComdisco Holding Co. Inc. | | United States | | 180 | | | 1,404 |
a,bComdisco Holding Co. Inc., Contingent Distribution | | United States | | 7,473,000 | | | — |
| | | | | | | |
| | | | | | | 1,404 |
| | | | | | | |
Communications Equipment 0.9% | | | | | | | |
Motorola Inc. | | United States | | 4,535,313 | | | 20,091,437 |
Telefonaktiebolaget LM Ericsson, B | | Sweden | | 1,760,509 | | | 13,239,280 |
Telefonaktiebolaget LM Ericsson, B, ADR | | Sweden | | 80,000 | | | 624,800 |
| | | | | | | |
| | | | | | | 33,955,517 |
| | | | | | | |
Computers & Peripherals 1.3% | | | | | | | |
a,dDecisionOne Corp | | United States | | 108,227 | | | — |
a,dDecisionOne Corp., wts., 6/08/17 | | United States | | 59,425 | | | — |
aDell Inc. | | United States | | 3,772,456 | | | 38,629,950 |
Diebold Inc. | | United States | | 301,904 | | | 8,480,483 |
| | | | | | | |
| | | | | | | 47,110,433 |
| | | | | | | |
Consumer Finance 0.2% | | | | | | | |
a,dCerberus CG Investor I LLC | | United States | | 8,172,654 | | | 1,634,531 |
a,dCerberus CG Investor II LLC | | United States | | 8,172,654 | | | 1,634,531 |
a,dCerberus CG Investor III LLC | | United States | | 4,086,327 | | | 817,265 |
a,dCerberus FIM Investors Holdco LLC | | United States | | 7,900,500 | | | 1,673,305 |
| | | | | | | |
| | | | | | | 5,759,632 |
| | | | | | | |
Containers & Packaging 0.1% | | | | | | | |
Temple-Inland Inc. | | United States | | 842,989 | | | 4,046,347 |
| | | | | | | |
Diversified Consumer Services 0.2% | | | | | | | |
Hillenbrand Inc. | | United States | | 342,585 | | | 5,714,318 |
| | | | | | | |
Diversified Financial Services 1.2% | | | | | | | |
CIT Group Inc. | | United States | | 2,746,700 | | | 12,470,018 |
a,d,gGLCP Harrah’s Investment LP | | United States | | 5,565,600 | | | 1,669,680 |
JPMorgan Chase & Co. | | United States | | 949,017 | | | 29,922,506 |
a,bMarconi Corp., Contingent Distribution | | United Kingdom | | 9,945,700 | | | — |
| | | | | | | |
| | | | | | | 44,062,204 |
| | | | | | | |
MS-13
Franklin Templeton Variable Insurance Product Trust
Statement of Investments, December 31, 2008 (continued)
| | | | | | | |
| Mutual Shares Securities Fund | | Country | | Shares/
Warrants/
Contracts | | Value |
Common Stocks and Other Equity Interests (continued) | | | | | | | |
Diversified Telecommunication Services 3.2% | | | | | | | |
a,d,eAboveNet Inc. | | United States | | 62,453 | | $ | 3,122,650 |
a,d,eAboveNet Inc., stock grant, grant price $20.95, expiration date 9/09/13 | | United States | | 78 | | | 175 |
a,d,eAboveNet Inc., wts., 9/08/10 | | United States | | 2,995 | | | 11,980 |
a,b,cGlobal Crossing Holdings Ltd., Contingent Distribution | | United States | | 9,005,048 | | | — |
Koninklijke (Royal) KPN NV | | Netherlands | | 1,924,766 | | | 27,936,736 |
Qwest Communications International Inc. | | United States | | 14,890,274 | | | 54,200,597 |
Telefonica SA | | Spain | | 1,502,812 | | | 33,306,906 |
| | | | | | | |
| | | | | | | 118,579,044 |
| | | | | | | |
Electric Utilities 3.0% | | | | | | | |
E.ON AG | | Germany | | 1,423,873 | | | 55,787,866 |
Entergy Corp. | | United States | | 260,290 | | | 21,637,908 |
Exelon Corp. | | United States | | 571,467 | | | 31,779,280 |
| | | | | | | |
| | | | | | | 109,205,054 |
| | | | | | | |
Electronic Equipment, Instruments & Component 0.6% | | | | | | | |
Tyco Electronics Ltd. | | United States | | 1,456,842 | | | 23,615,409 |
| | | | | | | |
Energy Equipment & Services 1.5% | | | | | | | |
Baker Hughes Inc. | | United States | | 442,458 | | | 14,189,628 |
aExterran Holding Inc. | | United States | | 613,890 | | | 13,075,857 |
aPride International Inc. | | United States | | 453,060 | | | 7,239,899 |
aTransocean Ltd. | | United States | | 460,927 | | | 21,778,801 |
| | | | | | | |
| | | | | | | 56,284,185 |
| | | | | | | |
Food & Staples Retailing 4.1% | | | | | | | |
Carrefour SA | | France | | 844,026 | | | 32,479,148 |
CVS Caremark Corp. | | United States | | 2,591,865 | | | 74,490,200 |
Kroger Co. | | United States | | 1,689,186 | | | 44,611,402 |
| | | | | | | |
| | | | | | | 151,580,750 |
| | | | | | | |
Food Products 4.6% | | | | | | | |
Cadbury PLC | | United Kingdom | | 3,689,234 | | | 32,626,220 |
Groupe Danone | | France | | 373,591 | | | 22,556,900 |
Kraft Foods Inc., A | | United States | | 1,773,448 | | | 47,617,079 |
Nestle SA | | Switzerland | | 1,720,203 | | | 67,010,436 |
| | | | | | | |
| | | | | | | 169,810,635 |
| | | | | | | |
Health Care Providers & Services 1.0% | | | | | | | |
aCommunity Health Systems Inc. | | United States | | 1,204,704 | | | 17,564,584 |
a,dKindred Healthcare Inc. | | United States | | 167,311 | | | 2,069,470 |
Quest Diagnostics Inc. | | United States | | 212,827 | | | 11,047,850 |
aTenet Healthcare Corp. | | United States | | 6,379,987 | | | 7,336,985 |
| | | | | | | |
| | | | | | | 38,018,889 |
| | | | | | | |
Hotels, Restaurants & Leisure 0.0%f | | | | | | | |
aTrump Entertainment Resorts Inc. | | United States | | 252,793 | | | 43,076 |
| | | | | | | |
Independent Power Producers & Energy Traders 0.7% | | | | | | | |
Constellation Energy Group | | United States | | 1,036,736 | | | 26,011,706 |
| | | | | | | |
Industrial Conglomerates 3.7% | | | | | | | |
Keppel Corp. Ltd. | | Singapore | | 3,905,323 | | | 11,804,571 |
Koninklijke Philips Electronics NV | | Netherlands | | 1,315,064 | | | 25,431,351 |
MS-14
Franklin Templeton Variable Insurance Product Trust
Statement of Investments, December 31, 2008 (continued)
| | | | | | | |
| Mutual Shares Securities Fund | | Country | | Shares/
Warrants/
Contracts | | Value |
Common Stocks and Other Equity Interests (continued) | | | | | | | |
Industrial Conglomerates (continued) | | | | | | | |
eOrkla ASA | | Norway | | 5,362,549 | | $ | 35,044,300 |
Siemens AG | | Germany | | 590,321 | | | 43,575,288 |
Tyco International Ltd. | | United States | | 1,019,893 | | | 22,029,689 |
| | | | | | | |
| | | | | | | 137,885,199 |
| | | | | | | |
Insurance 7.3% | | | | | | | |
ACE Ltd. | | United States | | 704,320 | | | 37,272,614 |
aAlleghany Corp. | | United States | | 23,351 | | | 6,584,982 |
aBerkshire Hathaway Inc., A | | United States | | 149 | | | 14,393,400 |
aBerkshire Hathaway Inc., B | | United States | | 26,810 | | | 86,167,340 |
aConseco Inc. | | United States | | 1,091,457 | | | 5,653,747 |
Old Republic International Corp. | | United States | | 2,329,142 | | | 27,763,373 |
a,dOlympus Re Holdings Ltd. | | United States | | 16,280 | | | 38,219 |
Prudential Financial Inc. | | United States | | 513,795 | | | 15,547,437 |
The Travelers Cos. Inc. | | United States | | 320,496 | | | 14,486,419 |
White Mountains Insurance Group Ltd. | | United States | | 140,935 | | | 37,645,148 |
Zurich Financial Services AG | | Switzerland | | 118,066 | | | 25,096,902 |
| | | | | | | |
| | | | | | | 270,649,581 |
| | | | | | | |
Internet Software & Services 0.2% | | | | | | | |
a,hYahoo! Inc. | | United States | | 625,670 | | | 7,633,174 |
| | | | | | | |
IT Services 0.7% | | | | | | | |
aAlliance Data Systems Corp. | | United States | | 557,448 | | | 25,938,056 |
| | | | | | | |
Leisure Equipment & Products 1.9% | | | | | | | |
Eastman Kodak Co. | | United States | | 2,112,040 | | | 13,897,223 |
Mattel Inc. | | United States | | 3,399,259 | | | 54,388,144 |
| | | | | | | |
| | | | | | | 68,285,367 |
| | | | | | | |
Life Sciences Tools & Services 0.1% | | | | | | | |
aMDS Inc. | | Canada | | 825,217 | | | 5,120,306 |
| | | | | | | |
Machinery 0.5% | | | | | | | |
AB SKF, B | | Sweden | | 1,095,590 | | | 10,824,188 |
Federal Signal Corp. | | United States | | 930,921 | | | 7,642,862 |
a,dMotor Coach Industries International Inc., wts., 5/27/09 | | United States | | 2 | | | — |
| | | | | | | |
| | | | | | | 18,467,050 |
| | | | | | | |
Marine 0.6% | | | | | | | |
A.P. Moller - Maersk AS | | Denmark | | 4,478 | | | 23,639,708 |
| | | | | | | |
Media 6.2% | | | | | | | |
aAdelphia Recovery Trust | | United States | | 29,283,354 | | | 292,833 |
a,bAdelphia Recovery Trust, Arahova Contingent Value Vehicle, Contingent Distribution | | United States | | 1,955,453 | | | 293,318 |
a,bCentury Communications Corp., Contingent Distribution | | United States | | 5,487,000 | | | — |
Comcast Corp., A | | United States | | 5,447,444 | | | 87,976,221 |
News Corp., A | | United States | | 5,966,390 | | | 54,234,485 |
Time Warner Inc. | | United States | | 3,765,929 | | | 37,885,246 |
a,cTVMAX Holdings Inc. | | United States | | 35,609 | | | — |
aViacom Inc., B | | United States | | 1,499,203 | | | 28,574,809 |
Virgin Media Inc. | | United Kingdom | | 3,623,690 | | | 18,082,213 |
| | | | | | | |
| | | | | | | 227,339,125 |
| | | | | | | |
MS-15
Franklin Templeton Variable Insurance Product Trust
Statement of Investments, December 31, 2008 (continued)
| | | | | | | |
| Mutual Shares Securities Fund | | Country | | Shares/
Warrants/
Contracts | | Value |
Common Stocks and Other Equity Interests (continued) | | | | | | | |
Metals & Mining 1.0% | | | | | | | |
AK Steel Holding Corp. | | United States | | 725,540 | | $ | 6,762,033 |
ArcelorMittal, N.Y. shs., A | | Netherlands | | 687,340 | | | 16,901,690 |
Cliffs Natural Resources Inc. | | United States | | 474,700 | | | 12,157,067 |
| | | | | | | |
| | | | | | | 35,820,790 |
| | | | | | | |
Multi-Utilities 1.0% | | | | | | | |
GDF Suez | | France | | 719,094 | | | 35,519,611 |
a,bNorthWestern Corp., Contingent Distribution | | United States | | 3,348,000 | | | — |
| | | | | | | |
| | | | | | | 35,519,611 |
| | | | | | | |
Oil, Gas & Consumable Fuels 3.9% | | | | | | | |
BP PLC | | United Kingdom | | 2,800,254 | | | 21,512,931 |
BP PLC, ADR | | United Kingdom | | 5,003 | | | 233,840 |
Marathon Oil Corp. | | United States | | 1,319,820 | | | 36,110,275 |
Noble Energy Inc. | | United States | | 303,140 | | | 14,920,551 |
Royal Dutch Shell PLC, A | | United Kingdom | | 1,813,808 | | | 47,554,646 |
Total SA, B | | France | | 406,819 | | | 22,134,149 |
| | | | | | | |
| | | | | | | 142,466,392 |
| | | | | �� | | |
Paper & Forest Products 2.7% | | | | | | | |
aDomtar Corp. | | United States | | 3,649,675 | | | 6,094,957 |
International Paper Co. | | United States | | 2,706,902 | | | 31,941,444 |
MeadWestvaco Corp. | | United States | | 1,553,006 | | | 17,378,137 |
Mondi Ltd. | | United Kingdom | | 55,042 | | | 200,979 |
Weyerhaeuser Co. | | United States | | 1,407,287 | | | 43,077,055 |
| | | | | | | |
| | | | | | | 98,692,572 |
| | | | | | | |
Pharmaceuticals 1.8% | | | | | | | |
Novartis AG | | Switzerland | | 681,230 | | | 33,618,148 |
Schering-Plough Corp. | | United States | | 343,900 | | | 5,856,617 |
aValeant Pharmaceuticals International | | United States | | 649,761 | | | 14,879,527 |
aWatson Pharmaceuticals Inc. | | United States | | 406,933 | | | 10,812,210 |
| | | | | | | |
| | | | | | | 65,166,502 |
| | | | | | | |
Real Estate Investment Trusts (REITs) 0.8% | | | | | | | |
Alexander’s Inc. | | United States | | 39,751 | | | 10,132,530 |
Link REIT | | Hong Kong | | 8,626,736 | | | 14,247,661 |
Ventas Inc. | | United States | | 119,989 | | | 4,028,030 |
| | | | | | | |
| | | | | | | 28,408,221 |
| | | | | | | |
Real Estate Management & Development 0.5% | | | | | | | |
cCanary Wharf Group PLC | | United Kingdom | | 1,535,898 | | | 5,920,384 |
aForestar Real Estate Group | | United States | | 330,463 | | | 3,146,008 |
aThe St. Joe Co. | | United States | | 314,282 | | | 7,643,338 |
| | | | | | | |
| | | | | | | 16,709,730 |
| | | | | | | |
Semiconductors & Semiconductor Equipment 1.1% | | | | | | | |
aLSI Corp. | | United States | | 6,515,393 | | | 21,435,643 |
Maxim Integrated Products Inc. | | United States | | 1,542,747 | | | 17,618,171 |
| | | | | | | |
| | | | | | | 39,053,814 |
| | | | | | | |
Software 1.9% | | | | | | | |
Microsoft Corp. | | United States | | 3,655,003 | | | 71,053,258 |
| | | | | | | |
MS-16
Franklin Templeton Variable Insurance Product Trust
Statement of Investments, December 31, 2008 (continued)
| | | | | | | | |
| Mutual Shares Securities Fund | | Country | | Shares/
Warrants/
Contracts | | | Value |
Common Stocks and Other Equity Interests (continued) | | | | | | | | |
Tobacco 11.1% | | | | | | | | |
Altria Group Inc. | | United States | | 2,246,727 | | | $ | 33,835,709 |
British American Tobacco PLC | | United Kingdom | | 4,320,987 | | | | 113,598,313 |
British American Tobacco PLC, ADR | | United Kingdom | | 4,218 | | | | 223,301 |
Imperial Tobacco Group PLC | | United Kingdom | | 3,149,559 | | | | 85,101,633 |
Japan Tobacco Inc. | | Japan | | 8,266 | | | | 27,357,174 |
KT&G Corp. | | South Korea | | 558,019 | | | | 34,947,983 |
Lorillard Inc. | | United States | | 170,740 | | | | 9,621,199 |
Philip Morris International Inc. | | United States | | 455,680 | | | | 19,826,637 |
Reynolds American Inc. | | United States | | 1,234,051 | | | | 49,744,596 |
UST Inc. | | United States | | 495,724 | | | | 34,393,331 |
| | | | | | | | |
| | | | | | | | 408,649,876 |
| | | | | | | | |
Transportation Infrastructure 0.0%f | | | | | | | | |
aGroupe Eurotunnel SA | | France | | 3,017 | | | | 16,242 |
aGroupe Eurotunnel SA, wts., 12/30/11 | | France | | 160,159 | | | | 18,364 |
| | | | | | | | |
| | | | | | | | 34,606 |
| | | | | | | | |
Total Common Stocks and Other Equity Interests (Cost $4,086,398,042) | | | | | | | | 2,963,705,243 |
| | | | | | | | |
Preferred Stocks 0.0%f | | | | | | | | |
Auto Components 0.0%f | | | | | | | | |
dDana Holding Corp., 4.00%, cvt. pfd., B | | United States | | 37,154 | | | | 334,386 |
| | | | | | | | |
Diversified Telecommunication Services 0.0%f | | | | | | | | |
a,dPTV Inc., 10.00%, pfd., A | | United Kingdom | | 17,300 | | | | 15,570 |
| | | | | | | | |
Total Preferred Stocks (Cost $3,739,620) | | | | | | | | 349,956 |
| | | | | | | | |
| | | |
| | | | | Principal
Amountj | | | |
Corporate Bonds & Notes 2.4% | | | | | | | | |
kACE Aviation Holdings Inc., cvt., 144A, 4.25%, 6/01/35 | | Canada | | 1,242,000 | CAD | | | 904,961 |
lBoston Generating LLC, FRN,
Revolver, 1.334%, 12/21/13 | | United States | | 194,500 | | | | 116,700 |
Synthetic Letter of Credit, 1.334%, 12/21/13 | | United States | | 694,600 | | | | 416,760 |
Term Loan B, 2.711%, 12/21/13 | | United States | | 3,076,651 | | | | 1,845,994 |
lCalpine Corp., Exit Term Loan, FRN, 6.645%, 3/29/14 | | United States | | 26,950,161 | | | | 19,991,252 |
dCerberus CG Investor I LLC, 12.00%, 7/31/14 | | United States | | 7,173,000 | | | | 1,434,600 |
dCerberus CG Investor II LLC, 12.00%, 7/31/14 | | United States | | 7,173,000 | | | | 1,434,600 |
dCerberus CG Investor III LLC, 12.00%, 7/31/14 | | United States | | 3,586,500 | | | | 717,300 |
dCerberus FIM Investors Holdco LLC, 12.00%, 11/22/13 | | United States | | 23,696,793 | | | | 5,018,981 |
i,lCharter Communications Operating LLC, Term Loan B, FRN, 3.63%, 3/06/14 | | United States | | 5,329,900 | | | | 3,600,614 |
DecisionOne Corp.,
d12.00%, 4/15/10 | | United States | | 139,306 | | | | 139,306 |
c,lFRN, 5.50%, 5/12/09 | | United States | | 24,958 | | | | 24,958 |
lFirst Data Corp., Term Loan, FRN, 3.211%, 9/24/14
B-1 | | United States | | 5,998,713 | | | | 3,665,394 |
B-2 | | United States | | 1,505,688 | | | | 920,021 |
B-3 | | United States | | 1,481,649 | | | | 906,739 |
Groupe Eurotunnel SA, cvt., sub. bond, NRS I,
T2, 3.00%, 7/28/09 | | France | | 4,300 | EUR | | | 5,111 |
MS-17
Franklin Templeton Variable Insurance Product Trust
Statement of Investments, December 31, 2008 (continued)
| | | | | | | | |
| Mutual Shares Securities Fund | | Country | | Principal
Amountj | | | Value |
Corporate Bonds & Notes (continued) | | | | | | | | |
Groupe Eurotunnel SA, cvt., sub. bond, NRS I (continued) | | | | | | | | |
T2, 3.00%, 7/28/09 | | France | | 4,979 | GBP | | $ | 7,271 |
T3, 3.00%, 7/28/10 | | France | | 2,425,100 | EUR | | | 2,882,365 |
T3, 3.00%, 7/28/10 | | France | | 1,688,564 | GBP | | | 2,466,232 |
d,eInternational Automotive Components Group NA LLC, 9.00%, 4/01/17 | | United States | | 1,456,500 | | | | 702,150 |
d,e,l,mPontus I LLC, 144A, FRN, 5.689%, 7/24/09 | | United States | | 17,760,635 | | | | 20,041,178 |
d,e,l,mPontus II Trust, junior profit-participating note, 144A, FRN, 7.516%, 6/25/09 | | United States | | 2,809,825 | | | | 655,588 |
lRealogy Corp., FRN, | | | | | | | | |
n4.596%, 4/10/13 | | United States | | 7,608,610 | | | | 4,346,419 |
Delayed Draw Term B Loan, 5.706%, 10/10/13 | | United States | | 692,091 | | | | 436,594 |
Initial Term Loan B, 5.706%, 10/10/13 | | United States | | 3,816,880 | | | | 2,407,814 |
Synthetic Letter of Credit, 1.52%, 10/10/13 | | United States | | 1,027,637 | | | | 648,267 |
lTexas Competitive Electric Holdings Co. LLC, FRN, | | | | | | | | |
5.368%, 10/10/14 | | United States | | 15,919,615 | | | | 11,110,570 |
Term Loan B3, 5.368%, 10/10/14 | �� | United States | | 1,487,534 | | | | 1,038,175 |
c,oTVMAX Holdings Inc., PIK, | | | | | | | | |
11.50%, 3/31/09 | | United States | | 56,676 | | | | 39,673 |
14.00%, 3/31/09 | | United States | | 206,218 | | | | 144,352 |
| | | | | | | | |
Total Corporate Bonds & Notes (Cost $151,842,612) | | | | | | | | 88,069,939 |
| | | | | | | | |
Corporate Bonds & Notes in Reorganization 0.1% | | | | | | | | |
lMotor Coach Industries International Inc., FRN, | | | | | | | | |
nFirst lien DIP Revolver, 7.75%, 9/19/09 | | United States | | 967,018 | | | | 944,380 |
iSecond Lien DIP Trust A Term Loan, 12.75%, 9/19/09 | | United States | | 1,418,139 | | | | 1,162,874 |
Second Lien DIP Trust B Term Loan, 15.25%, 9/19/09 | | United States | | 864,882 | | | | 735,150 |
i,pSecond Lien Senior Secured Term Loan, 11.00%, 12/01/08 | | United States | | 1,168,647 | | | | 929,074 |
c,pThird Lien Senior Secured Term Loan, 15.649%, 12/01/08 | | United States | | 13,474,193 | | | | 367,846 |
c,pSafety Kleen Services, senior sub. note, 9.25%, 6/01/08 | | United States | | 5,000 | | | | 25 |
pTrump Entertainment Resorts Inc., 8.50%, 5/20/15 | | United States | | 7,582,630 | | | | 1,042,612 |
e,pWimar OPCO LLC/Finance Corp., senior sub. note, 9.625%, 12/15/14 | | United States | | 18,305,000 | | | | 274,575 |
| | | | | | | | |
Total Corporate Bonds & Notes in Reorganization
(Cost $37,134,055) | | | | | | | | 5,456,536 |
| | | | | | | | |
Companies in Liquidation 0.0% | | | | | | | | |
cPeregrine Investments Holdings Ltd., 6.70%, 1/15/98 | | Hong Kong | | 5,000,000 | JPY | | | — |
cPIV Investment Finance (Cayman) Ltd., 4.50%, 12/01/00 | | Hong Kong | | 12,200,000 | | | | — |
| | | | | | | | |
Total Companies in Liquidation (Cost $—) | | | | | | | | — |
| | | | | | | | |
Total Investments before Short Term Investments (Cost $4,279,114,329) | | | | | | | | 3,057,581,674 |
| | | | | | | | |
MS-18
Franklin Templeton Variable Insurance Product Trust
Statement of Investments, December 31, 2008 (continued)
| | | | | | | | |
| Mutual Shares Securities Fund | | Country | | Principal
Amountj | | Value | |
Short Term Investments 13.7% | | | | | | | | |
U.S. Government and Agency Securities 13.7% | | | | | | | | |
qFHLB, 1/02/09 - 12/08/09 | | United States | | 493,988,000 | | $ | 493,143,789 | |
qU.S. Treasury Bill, 11/19/09 | | United States | | 10,000,000 | | | 9,970,930 | |
| | | | | | | | |
Total U.S. Government and Agency Securities (Cost $499,472,412) | | | | | | | 503,114,719 | |
| | | | | | | | |
Total Investments (Cost $4,778,586,741) 96.7% | | | | | | | 3,560,696,393 | |
Options Written 0.0%f | | | | | | | (88,535 | ) |
Net Unrealized Appreciation on Forward Exchange
Contracts 0.7% | | | | | | | 23,622,985 | |
Other Assets, less Liabilities 2.6% | | | | | | | 96,499,223 | |
| | | | | | | | |
Net Assets 100.0% | | | | | | $ | 3,680,730,066 | |
| | | | | | | | |
| | | |
| | | | | Contracts | | | |
rOptions Written 0.0% f | | | | | | | | |
Call Options 0.0%f | | | | | | | | |
Internet Software & Services 0.0%f | | | | | | | | |
Yahoo! Inc., Jan. 12.5 Calls, 1/17/09 | | United States | | 619 | | $ | 47,663 | |
Yahoo! Inc., Jan. 14 Calls, 1/17/09 | | United States | | 1,290 | | | 39,990 | |
Yahoo! Inc., Jan. 15 Calls, 1/17/09 | | United States | | 49 | | | 882 | |
| | | | | | | | |
Total Options Written (Premiums received $315,789) | | | | | | | 88,535 | |
| | | | | | | | |
See abbreviations on page MS-36.
aNon-income producing for the twelve months ended December 31, 2008.
bContingent distributions represent the right to receive additional distributions, if any, during the reorganization of the underlying company. Shares represent total underlying principal of debt securities.
cSecurity has been deemed illiquid because it may not be able to be sold within seven days. At December 31, 2008, the aggregate value of these securities was $6,531,533, representing 0.18%, of net assets.
dSee Note 10 regarding restricted and illiquid securities.
eSee Note 14 regarding other considerations.
fRounds to less than 0.1% of net assets.
gSee Note 13 regarding holdings of 5% voting securities.
hA portion or all of the security is held in connection with written option contracts open at year end.
iA portion or all of the security purchased on a delayed delivery basis. See Note 1(c).
jThe principal amount is stated in U.S. dollars unless otherwise indicated.
kSecurity was purchased pursuant to Rule 144A under the Securities Act of 1933 and may be sold in transactions exempt from registration only to qualified institutional buyers or in a public offering registered under the Securities Act of 1933. These securities have been deemed liquid under guidelines approved by the Trust’s Board of Trustees. At December 31, 2008, the value of this security was $904,961, representing 0.02% of net assets.
lThe coupon rate shown represents the rate at period end.
mSee Note 1(h) regarding investments in special purpose entities.
nSee Note 11 regarding unfunded loan commitments.
oIncome may be received in additional securities and/or cash.
pSee Note 8 regarding defaulted securities.
qThe security is traded on a discount basis with no stated coupon rate.
rSee Note 1(f) regarding written options.
The accompanying notes are an integral part of these financial statements.
MS-19
Franklin Templeton Variable Insurance Products Trust
Financial Statements
Statement of Assets and Liabilities
December 31, 2008
| | | | |
| | | Mutual Shares
Securities Fund | |
Assets: | | | | |
Investments in securities: | | | | |
Cost - Unaffiliated issuers | | $ | 4,773,021,141 | |
Cost - Non-controlled affiliated issuers (Note 13) | | | 5,565,600 | |
| | | | |
Total cost of investments | | $ | 4,778,586,741 | |
| | | | |
Value - Unaffiliated issuers | | $ | 3,559,026,713 | |
Value - Non-controlled affiliated issuers (Note 13) | | | 1,669,680 | |
| | | | |
Total value of investments | | | 3,560,696,393 | |
Cash | | | 80,662,830 | |
Cash on deposit with brokers | | | 22,304 | |
Foreign currency, at value (cost $8,839,460) | | | 8,801,851 | |
Receivables: | | | | |
Investment securities sold | | | 19,216,849 | |
Capital shares sold | | | 1,686,775 | |
Dividends and interest | | | 16,243,472 | |
Unrealized appreciation on forward exchange contracts (Note 7) | | | 54,865,179 | |
| | | | |
Total assets | | | 3,742,195,653 | |
| | | | |
Liabilities: | | | | |
Payables: | | | | |
Investment securities purchased | | | 22,168,654 | |
Capital shares redeemed | | | 2,229,359 | |
Affiliates | | | 3,457,431 | |
Options written, at value (premiums received $315,789) | | | 88,535 | |
Unrealized depreciation on forward exchange contracts (Note 7) | | | 31,242,194 | |
Unrealized depreciation on unfunded loan commitments (Note 11) | | | 698,407 | |
Accrued expenses and other liabilities | | | 1,581,007 | |
| | | | |
Total liabilities | | | 61,465,587 | |
| | | | |
Net assets, at value | | $ | 3,680,730,066 | |
| | | | |
Net assets consist of: | | | | |
Paid-in capital | | $ | 5,029,401,957 | |
Undistributed net investment income | | | 82,483,212 | |
Net unrealized appreciation (depreciation) | | | (1,194,780,364 | ) |
Accumulated net realized gain (loss) | | | (236,374,739 | ) |
| | | | |
Net assets, at value | | $ | 3,680,730,066 | |
| | | | |
The accompanying notes are an integral part of these financial statements.
MS-20
Franklin Templeton Variable Insurance Products Trust
Financial Statements (continued)
Statement of Assets and Liabilities (continued)
December 31, 2008
| | | |
| | | Mutual Shares
Securities Fund |
Class 1: | | | |
Net assets, at value | | $ | 319,702,890 |
| | | |
Shares outstanding | | | 26,828,365 |
| | | |
Net asset value and maximum offering price per share | | $ | 11.92 |
| | | |
Class 2: | | | |
Net assets, at value | | $ | 3,303,761,261 |
| | | |
Shares outstanding | | | 280,534,595 |
| | | |
Net asset value and maximum offering price per share | | $ | 11.78 |
| | | |
Class 4: | | | |
Net assets, at value | | $ | 57,265,915 |
| | | |
Shares outstanding | | | 4,820,245 |
| | | |
Net asset value and maximum offering price per share | | $ | 11.88 |
| | | |
The accompanying notes are an integral part of these financial statements.
MS-21
Franklin Templeton Variable Insurance Products Trust
Financial Statements (continued)
Statement of Operations
for the year ended December 31, 2008
| | | | |
| | | Mutual Shares
Securities Fund | |
Investment income: | | | | |
Dividends (net of foreign taxes of $6,764,520) | | $ | 114,266,492 | |
Interest | | | 28,688,251 | |
Income from securities loaned | | | 1,487,339 | |
| | | | |
Total investment income | | | 144,442,082 | |
| | | | |
Expenses: | | | | |
Management fees (Note 3a) | | | 29,948,054 | |
Administrative fees (Note 3b) | | | 4,331,431 | |
Distribution fees: (Note 3c) | | | | |
Class 2 | | | 11,704,775 | |
Class 4 | | | 66,163 | |
Custodian fees (Note 4) | | | 552,223 | |
Reports to shareholders | | | 722,185 | |
Registration and filing fees | | | 34,952 | |
Professional fees | | | 662,022 | |
Trustees’ fees and expenses | | | 27,275 | |
Dividends on securities sold short | | | 239,821 | |
Other | | | 123,851 | |
| | | | |
Total expenses | | | 48,412,752 | |
Expense reductions (Note 4) | | | (25,816 | ) |
| | | | |
Net expenses | | | 48,386,936 | |
| | | | |
Net investment income | | | 96,055,146 | |
| | | | |
Realized and unrealized gains (losses): | | | | |
Net realized gain (loss) from: | | | | |
Investments | | | (319,352,786 | ) |
Written options (Note 6) | | | 1,318,764 | |
Foreign currency transactions | | | 62,791,007 | |
Securities sold short | | | 8,831,704 | |
| | | | |
Net realized gain (loss) | | | (246,411,311 | ) |
| | | | |
Net change in unrealized appreciation (depreciation) on: | | | | |
Investments | | | (2,105,950,130 | ) |
Translation of other assets and liabilities denominated in foreign currencies | | | 37,080,237 | |
| | | | |
Net change in unrealized appreciation (depreciation) | | | (2,068,869,893 | ) |
| | | | |
Net realized and unrealized gain (loss) | | | (2,315,281,204 | ) |
| | | | |
Net increase (decrease) in net assets resulting from operations | | $ | (2,219,226,058 | ) |
| | | | |
The accompanying notes are an integral part of these financial statements.
MS-22
Franklin Templeton Variable Insurance Products Trust
Financial Statements (continued)
Statements of Changes in Net Assets
| | | | | | | | |
| | | Mutual Shares
Securities Fund | |
| | | Year Ended December 31, | |
| | | 2008 | | | 2007 | |
| | | | |
Increase (decrease) in net assets: | | | | | | | | |
Operations: | | | | | | | | |
Net investment income | | $ | 96,055,146 | | | $ | 143,582,793 | |
Net realized gain (loss) from investments, written options, foreign currency transactions, and securities sold short | | | (246,411,311 | ) | | | 258,914,403 | |
Net change in unrealized appreciation (depreciation) on investments and translation of other assets and liabilities denominated in foreign currencies | | | (2,068,869,893 | ) | | | (228,498,434 | ) |
| | | | |
Net increase (decrease) in net assets resulting from operations | | | (2,219,226,058 | ) | | | 173,998,762 | |
| | | | |
Distributions to shareholders from: | | | | | | | | |
Net investment income: | | | | | | | | |
Class 1 | | | (11,945,567 | ) | | | (3,972,937 | ) |
Class 2 | | | (141,276,754 | ) | | | (85,861,035 | ) |
Class 4 | | | (1,103,934 | ) | | | — | |
Net realized gains: | | | | | | | | |
Class 1 | | | (15,383,580 | ) | | | (8,639,670 | ) |
Class 2 | | | (200,942,848 | ) | | | (210,215,361 | ) |
Class 4 | | | (1,421,653 | ) | | | — | |
| | | | |
Total distributions to shareholders | | | (372,074,336 | ) | | | (308,689,003 | ) |
| | | | |
Capital share transactions: (Note 2) | | | | | | | | |
Class 1 | | | 217,189,228 | | | | 15,525,183 | |
Class 2 | | | (215,728,827 | ) | | | 916,403,514 | |
Class 4 | | | 72,510,540 | | | | — | |
| | | | |
Total capital share transactions | | | 73,970,941 | | | | 931,928,697 | |
| | | | |
Net increase (decrease) in net assets | | | (2,517,329,453 | ) | | | 797,238,456 | |
Net assets: | | | | | | | | |
Beginning of year | | | 6,198,059,519 | | | | 5,400,821,063 | |
| | | | |
End of year | | $ | 3,680,730,066 | | | $ | 6,198,059,519 | |
| | | | |
Undistributed net investment income included in net assets: | | | | | | | | |
End of year | | $ | 82,483,212 | | | $ | 149,427,434 | |
| | | | |
The accompanying notes are an integral part of these financial statements.
MS-23
Franklin Templeton Variable Insurance Products Trust
Notes to Financial Statements
Mutual Shares Securities Fund
1. ORGANIZATION AND SIGNIFICANT ACCOUNTING POLICIES
Franklin Templeton Variable Insurance Products Trust (Trust) is registered under the Investment Company Act of 1940, as amended, (1940 Act) as an open-end investment company, consisting of twenty-three separate funds. The Mutual Shares Securities Fund (Fund) is included in this report. The financial statements of the remaining funds in the Trust are presented separately. Shares of the Fund are sold only to insurance company separate accounts to fund the benefits of variable life insurance policies or variable annuity contracts. The Fund offers three classes of shares: Class 1, Class 2, and Class 4. Effective February 29, 2008, the Fund began offering a new class of shares, Class 4. Each class of shares differs by its distribution fees, voting rights on matters affecting a single class and its exchange privilege.
The following summarizes the Fund’s significant accounting policies.
a. Security Valuation
Securities listed on a securities exchange or on the NASDAQ National Market System are valued at the last quoted sale price or the official closing price of the day, respectively. Over-the-counter securities and listed securities for which there is no reported sale are valued within the range of the most recent quoted bid and ask prices. Securities that trade in multiple markets or on multiple exchanges are valued according to the broadest and most representative market.
Corporate debt securities and government securities generally trade in the over-the-counter market rather than on a securities exchange. The Trust may utilize independent pricing services, quotations from bond dealers, and information with respect to bond and note transactions, to assist in determining a current market value for each security. The Trust’s pricing services may use valuation models or matrix pricing which considers information with respect to comparable bond and note transactions, quotations from bond dealers, or by reference to other securities that are considered comparable in such characteristics as rating, interest rate and maturity date, option adjusted spread models, prepayment projections, interest rate spreads and yield curves, to determine current value.
Foreign securities are valued as of the close of trading on the foreign stock exchange on which the security is primarily traded, or the NYSE, whichever is earlier. If no sale is reported at that time, the foreign security will be valued within the range of the most recent quoted bid and ask prices. The value is then converted into its U.S. dollar equivalent at the foreign exchange rate in effect at the close of the NYSE on the day that the value of the foreign security is determined.
The Trust has procedures to determine the fair value of individual securities and other assets for which market prices are not readily available or which may not be reliably priced. Methods for valuing these securities may include: fundamental analysis, matrix pricing, discounts from market prices of similar securities, or discounts applied due to the nature and duration of restrictions on the disposition of the securities. Due to the inherent uncertainty of valuations of such securities, the fair values may differ significantly from the values that would have been used had a ready market for such investments existed. Occasionally, events occur between the time at which trading in a security is completed and the close of the NYSE that might call into question the availability (including the reliability) of the value of a portfolio security held by the Fund. The investment manager monitors price movements following the close of trading in foreign stock markets through a series of country specific market proxies (such as baskets of American Depository Receipts, futures contracts and exchange traded funds). These price movements are measured against established trigger thresholds for each specific market proxy to assist in determining if an event has occurred. If such an event occurs, the securities may be valued using fair value procedures, which may include the use of independent pricing services. At December 31, 2008, a portion of the securities held by the Fund were fair valued. All security valuation procedures are approved by the Trust’s Board of Trustees.
b. Foreign Currency Translation
Portfolio securities and other assets and liabilities denominated in foreign currencies are translated into U.S. dollars based on the exchange rate of such currencies against U.S. dollars on the date of valuation. Purchases and sales of securities, income and expense items denominated in foreign currencies are translated into U.S. dollars at the exchange rate in effect on the transaction
MS-24
Franklin Templeton Variable Insurance Products Trust
Notes to Financial Statements (continued)
Mutual Shares Securities Fund
1. ORGANIZATION AND SIGNIFICANT ACCOUNTING POLICIES (continued)
b. Foreign Currency Translation (continued)
date. Occasionally, events may impact the availability or reliability of foreign exchange rates used to convert the U.S. dollar equivalent value. If such an event occurs, the foreign exchange rate will be valued at fair value using procedures established and approved by the Trust’s Board of Trustees.
The Fund does not separately report the effect of changes in foreign exchange rates from changes in market prices on securities held. Such changes are included in net realized and unrealized gain or loss from investments on the Statement of Operations.
Realized foreign exchange gains or losses arise from sales of foreign currencies, currency gains or losses realized between the trade and settlement dates on securities transactions and the difference between the recorded amounts of dividends, interest, and foreign withholding taxes and the U.S. dollar equivalent of the amounts actually received or paid. Net unrealized foreign exchange gains and losses arise from changes in foreign exchange rates on foreign denominated assets and liabilities other than investments in securities held at the end of the reporting period.
c. Securities Purchased on a Delayed Delivery Basis
The Fund may purchase securities on a delayed delivery basis, with payment and delivery scheduled for a future date. These transactions are subject to market fluctuations and are subject to the risk that the value at delivery may be more or less than the trade date purchase price. Although the Fund will generally purchase these securities with the intention of holding the securities, it may sell the securities before the settlement date. Sufficient assets have been segregated for these securities.
d. Foreign Currency Contracts
When the Fund purchases or sells foreign securities it may enter into foreign exchange contracts to minimize foreign exchange risk from the trade date to the settlement date of the transactions. A foreign exchange contract is an agreement between two parties to exchange different currencies at an agreed upon exchange rate at a future date. Realized and unrealized gains and losses on these contracts are included in the Statement of Operations.
The Fund may also enter into forward exchange contracts to hedge against fluctuations in foreign exchange rates or to gain exposure to certain foreign currencies. These contracts are valued daily by the Fund and the unrealized appreciation or depreciation on the contracts, as measured by the difference between the contractual forward foreign exchange rates and the forward rates at the reporting date, are included in the Statement of Assets and Liabilities. Realized and unrealized gains and losses on these contracts are included in the Statement of Operations.
The risks of these contracts include movement in the values of the foreign currencies relative to the U.S. dollar and the possible inability of the counterparties to fulfill their obligations under the contracts, which may be in excess of the amount reflected in the Statement of Assets and Liabilities.
e. Synthetic Equity Swaps
The Fund may engage in synthetic equity swaps. Synthetic equity swaps are contracts entered into between a broker and the fund under which the parties agree to make payments to each other so as to replicate the economic consequences that would apply had a purchase or short sale of the underlying security taken place. Upon entering into synthetic equity swaps, the fund is required to pledge to the broker an amount of cash and/or other assets equal to a certain percentage of the contract amount (margin account). Periodically, payments are made to recognize changes in value of the contract resulting from interest on the notional value of the contract, market value changes in the underlying security, and/or dividends paid by the issuer of the underlying security. The Fund recognizes a realized gain or loss when cash is received from, or paid to, the broker. Synthetic
MS-25
Franklin Templeton Variable Insurance Products Trust
Notes to Financial Statements (continued)
Mutual Shares Securities Fund
1. ORGANIZATION AND SIGNIFICANT ACCOUNTING POLICIES (continued)
e. Synthetic Equity Swaps (continued)
equity swaps are valued daily by the Fund and the unrealized appreciation or depreciation on the contracts (as measured by the difference between the contract amount plus or minus cash received or paid and the market value of the underlying securities) are recorded in the Statement of Operations. The margin account and any net unrealized appreciation or depreciation on open synthetic equity swaps are included in the Statement of Assets and Liabilities. The risks of entering into synthetic equity swaps include unfavorable price movements in the underlying securities or the inability of the counterparties to fulfill their obligations under the contract.
f. Options
The Fund may purchase or write options. Options are contracts entitling the holder to purchase or sell securities, currencies, or other financial instruments at a specified price or exchange rate, or, in the case of index options, to receive or pay the difference between the index value and the strike price of the index option. Options purchased are recorded as investments; options written (sold) are recorded as liabilities. Upon closing of an option which results in a cash settlement, the difference between the premium (original option value) and the settlement proceeds is realized as a gain or loss. When securities are acquired or delivered upon exercise of an option, the acquisition cost or sale proceeds are adjusted by the amount of the premium. When an option expires, the premium is realized as a gain for options written or as a loss for options purchased. The risks include the possibility there may be an illiquid options market or the inability of the counterparties to fulfill their obligations under the contract. Writing options involves, to varying degrees, elements of market risk in excess of the amount recognized in the Statement of Assets and Liabilities.
g. Securities Sold Short
The Fund is engaged in selling securities short, which obligates the fund to replace a borrowed security with the same security at current market value. The fund incurs a loss if the price of the security increases between the date of the short sale and the date on which the fund replaces the borrowed security. The fund realizes a gain if the price of the security declines between those dates. Gains are limited to the price at which the fund sold the security short, while losses are potentially unlimited in size.
The fund is required to establish a margin account with the broker lending the security sold short. While the short sale is outstanding, the broker retains the proceeds of the short sale and the fund must maintain a deposit with broker consisting of cash and securities having a value equal to a specified percentage of the value of the securities sold short. The fund is obligated to pay the counterparty any dividends or interest due on securities sold short. Such dividends and interest are recorded as an expense to the fund.
h. Investments in Special Purpose Entities
At December 31, 2008, the Fund had contributed an additional $15,323,878 as a subordinated note holder of certain special purpose entities (“SPEs”). Such contributions, while made at the discretion of the Fund, represent additional capital contributions to the SPE in support of its underlying investments and are subject first to the claims of the senior note holders of the SPE. These contributions are recorded as an addition to the Fund’s cost basis in the SPE and are subject to the risk of loss in the event of continued unfavorable market conditions related to the SPE’s underlying investments.
i. Securities Lending
The Fund participates in an agency based security lending program. The fund receives cash collateral against the loaned securities in an amount equal to at least 102% of the market value of the loaned securities. Collateral is maintained over the life of the loan in an amount not less than 100% of the market value of loaned securities, as determined at the close of fund business
MS-26
Franklin Templeton Variable Insurance Products Trust
Notes to Financial Statements (continued)
Mutual Shares Securities Fund
1. ORGANIZATION AND SIGNIFICANT ACCOUNTING POLICIES (continued)
i. Securities Lending (continued)
each day; any additional collateral required due to changes in security values is delivered to the fund on the next business day. The collateral is invested in a non-registered money market fund managed by the Fund’s custodian on the Fund’s behalf. The Fund receives income from the investment of cash collateral, in addition to lending fees and rebates paid by the borrower. The Fund bears the market risk with respect to the collateral investment, securities loaned, and the risk that the agent may default on its obligations to the Fund. The securities lending agent has agreed to indemnify the Fund in the event of default by a third party borrower. At December 31, 2008, the Fund had no securities on loan.
j. Income Taxes
No provision has been made for U.S. income taxes because it is the Fund’s policy to qualify as a regulated investment company under the Internal Revenue Code and to distribute to shareholders substantially all of its taxable income and net realized gains.
Foreign securities held by the Fund may be subject to foreign taxation on dividend and interest income received. Foreign taxes, if any, are recorded based on the tax regulations and rates that exist in the foreign markets in which the Fund invests.
The Fund has reviewed the tax positions, taken on federal income tax returns, for each of the three open tax years and as of December 31, 2008, and has determined that no provision for income tax is required in the Fund’s financial statements.
k. Security Transactions, Investment Income, Expenses and Distributions
Security transactions are accounted for on trade date. Realized gains and losses on security transactions are determined on a specific identification basis. Interest income and estimated expenses are accrued daily. Amortization of premium and accretion of discount on debt securities are included in interest income. Dividend income, and dividends declared on securities sold short, are recorded on the ex-dividend date except that certain dividends from foreign securities are recognized as soon as the Fund is notified of the ex-dividend date. Distributions to shareholders are recorded on the ex-dividend date and are determined according to income tax regulations (tax basis). Distributable earnings determined on a tax basis may differ from earnings recorded in accordance with accounting principles generally accepted in the United States of America. These differences may be permanent or temporary. Permanent differences are reclassified among capital accounts to reflect their tax character. These reclassifications have no impact on net assets or the results of operations. Temporary differences are not reclassified, as they may reverse in subsequent periods.
Common expenses incurred by the Trust are allocated among the funds based on the ratio of net assets of each fund to the combined net assets of the Trust. Fund specific expenses are charged directly to the fund that incurred the expense.
Realized and unrealized gains and losses and net investment income, not including class specific expenses, are allocated daily to each class of shares based upon the relative proportion of net assets of each class. Differences in per share distributions, by class, are generally due to differences in class specific expenses.
l. Accounting Estimates
The preparation of financial statements in accordance with accounting principles generally accepted in the United States of America requires management to make estimates and assumptions that affect the reported amounts of assets and liabilities at the date of the financial statements and the amounts of income and expenses during the reporting period. Actual results could differ from those estimates.
m. Guarantees and Indemnifications
Under the Trust’s organizational documents, its officers and trustees are indemnified by the Trust against certain liabilities arising out of the performance of their duties to the Trust. Additionally, in the normal course of business, the Trust, on behalf of the
MS-27
Franklin Templeton Variable Insurance Products Trust
Notes to Financial Statements (continued)
Mutual Shares Securities Fund
1. ORGANIZATION AND SIGNIFICANT ACCOUNTING POLICIES (continued)
m. Guarantees and Indemnifications (continued)
Fund, enters into contracts with service providers that contain general indemnification clauses. The Trust’s maximum exposure under these arrangements is unknown as this would involve future claims that may be made against the Trust that have not yet occurred. Currently, the Trust expects the risk of loss to be remote.
2. SHARES OF BENEFICIAL INTEREST
At December 31, 2008, there were an unlimited number of shares authorized (without par value). Transactions in the Fund’s shares were as follows:
Shares of Beneficial Interest
| | | | | | | | | | | | | | |
| | | Year Ended December 31, | |
| | | 2008a | | | 2007 | |
| Class 1 Shares: | | Shares | | | Amount | | | Shares | | | Amount | |
Shares sold | | 15,807,156 | | | $ | 251,864,457 | | | 2,778,546 | | | $ | 57,615,881 | |
Shares issued in reinvestment of distributions | | 1,694,305 | | | | 27,329,147 | | | 580,157 | | | | 12,612,607 | |
Shares redeemed | | (4,017,273 | ) | | | (62,004,376 | ) | | (2,589,646 | ) | | | (54,703,305 | ) |
| | | | |
Net increase (decrease) | | 13,484,188 | | | $ | 217,189,228 | | | 769,057 | | | $ | 15,525,183 | |
| | | | |
| Class 2 Shares: | | | | | | | | | | | | |
Shares sold | | 29,551,202 | | | $ | 460,631,440 | | | 60,311,785 | | | $ | 1,269,429,065 | |
Shares issued in reinvestment of distributions | | 21,455,774 | | | | 342,219,602 | | | 13,758,197 | | | | 296,076,396 | |
Shares redeemed in-kind (Note 15) | | — | | | | — | | | (5,519,424 | ) | | | (109,229,391 | ) |
Shares redeemed | | (64,008,262 | ) | | | (1,018,579,869 | ) | | (26,278,440 | ) | | | (539,872,556 | ) |
| | | | |
Net increase (decrease) | | (13,001,286 | ) | | $ | (215,728,827 | ) | | 42,272,118 | | | $ | 916,403,514 | |
| | | | |
| Class 4 Shares: | | | | | | | | | | | | |
Shares sold | | 4,692,500 | | | $ | 70,463,022 | | | | | | | | |
Shares issued on reinvestment of distributions | | 156,848 | | | | 2,525,245 | | | | | | | | |
Shares redeemed | | (29,103 | ) | | | (477,727 | ) | | | | | | | |
| | | | | | | | | | |
Net increase (decrease) | | 4,820,245 | | | $ | 72,510,540 | | | | | | | | |
| | | | | | | | | | |
aFor | the period February 29, 2008 (effective date) to December 31, 2008 for Class 4. |
3. TRANSACTIONS WITH AFFILIATES
Franklin Resources, Inc. is the holding company for various subsidiaries that together are referred to as Franklin Templeton Investments. Certain officers and trustees of the Trust are also officers and/or directors of the following subsidiaries:
| | |
| Subsidiary | | Affiliation |
Franklin Mutual Advisers, LLC (Franklin Mutual) | | Investment manager |
Franklin Templeton Services, LLC (FT Services) | | Administrative manager |
Franklin Templeton Distributors, Inc. (Distributors) | | Principal underwriter |
Franklin Templeton Investor Services, LLC (Investor Services) | | Transfer agent |
MS-28
Franklin Templeton Variable Insurance Products Trust
Notes to Financial Statements (continued)
Mutual Shares Securities Fund
3. TRANSACTIONS WITH AFFILIATES (continued)
a. Management Fees
The Fund pays an investment management fee to Franklin Mutual based on the average daily net assets of the Fund as follows:
| | |
| Annualized Fee Rate | | Net Assets |
| 0.600% | | Up to and including $5 billion |
| 0.570% | | Over $5 billion, up to and including $10 billion |
| 0.550% | | Over $10 billion, up to and including $15 billion |
| 0.530% | | Over $15 billion, up to and including $20 billion |
| 0.510% | | In excess of $20 billion |
b. Administrative Fees
The Fund pays an administrative fee to FT Services based on the Fund’s average daily net assets as follows:
| | |
| Annualized Fee Rate | | Net Assets |
| 0.150% | | Up to and including $200 million |
| 0.135% | | Over $200 million, up to and including $700 million |
| 0.100% | | Over $700 million, up to and including $1.2 billion |
| 0.075% | | In excess of $1.2 billion |
c. Distribution Fees
The Fund’s Board of Trustees has adopted distribution plans for Class 2 and Class 4 shares pursuant to Rule 12b-1 under the 1940 Act. Under the Fund’s compensation distribution plans, the Fund pays Distributors for costs incurred in connection with the servicing, sale and distribution of the Fund’s shares up to 0.35% per year of its average daily net assets. The Board of Trustees has agreed to limit the current rate to 0.25% per year for Class 2.
d. Transfer Agent Fees
Investor Services, under terms of an agreement, performs shareholder servicing for the Fund and is not paid by the Fund for the services.
4. EXPENSE OFFSET ARRANGEMENT
The Fund has entered into an arrangement with its custodian whereby credits realized as a result of uninvested cash balances are used to reduce a portion of the Fund’s custodian expenses. During the year ended December 31, 2008, the custodian fees were reduced as noted in the Statement of Operations.
5. INCOME TAXES
For tax purposes, capital losses may be carried over to offset future capital gains, if any. At December 31, 2008, the Fund had tax basis capital losses of $49,737,496 expiring in 2016.
For tax purposes, realized capital losses, occurring subsequent to October 31, may be deferred and treated as occurring on the first day of the following fiscal year. At December 31, 2008, the Fund deferred realized capital losses of $141,606,007.
MS-29
Franklin Templeton Variable Insurance Products Trust
Notes to Financial Statements (continued)
Mutual Shares Securities Fund
5. INCOME TAXES (continued)
The tax character of distributions paid during the years ended December 31, 2008 and 2007, was as follows:
| | | | | | |
| | | 2008 | | 2007 |
Distributions paid from: | | | | | | |
Ordinary Income | | $ | 198,602,801 | | $ | 129,617,847 |
Long term capital gain | | | 173,471,517 | | | 179,071,156 |
| | | |
| | $ | 372,074,338 | | $ | 308,689,003 |
| | | |
At December 31, 2008, the cost of investments, net unrealized appreciation (depreciation) and undistributed ordinary income for income tax purposes were as follows:
| | | | |
Cost of investments | | $ | 4,803,802,935 | |
| | | | |
| |
Unrealized appreciation | | $ | 251,740,973 | |
Unrealized depreciation | | | (1,494,847,515 | ) |
| | | | |
Net unrealized appreciation (depreciation) | | $ | (1,243,106,542 | ) |
| | | | |
Distributable earnings - undistributed ordinary income | | $ | 81,839,194 | |
| | | | |
Net investment income differs for financial statement and tax purposes primarily due to differing treatments of defaulted securities, foreign currency transactions, passive foreign investment company shares, pass-through entity income, bond discounts and premiums, and certain dividends on securities sold short.
Net realized gains (losses) differ for financial statement and tax purposes primarily due to differing treatments of wash sales, tax straddles, foreign currency transactions, index stock options, pass-through entity income and bond discounts and premiums.
6. INVESTMENT TRANSACTIONS
Purchases and sales of investments (excluding short term securities and securities sold short) for the year ended December 31, 2008, aggregated $2,007,649,998 and $2,118,637,664, respectively.
Transactions in options written during the year ended December 31, 2008, were as follows:
| | | | | | | |
| | | Number of
Contracts | | | Premiums
Received | |
Options outstanding at December 31, 2007 | | 51,422 | | | $ | 1,337,174 | |
Options written | | 2,488 | | | | 654,221 | |
Options expired | | (50,096 | ) | | | (427,908 | ) |
Options exercised | | (1,856 | ) | | | (1,247,698 | ) |
Options closed | | — | | | | — | |
| | | |
Options outstanding at December 31, 2008 | | 1,958 | | | $ | 315,789 | |
| | | |
MS-30
Franklin Templeton Variable Insurance Products Trust
Notes to Financial Statements (continued)
Mutual Shares Securities Fund
7. FORWARD EXCHANGE CONTRACTS
At December 31, 2008, the Fund had the following forward exchange contracts outstanding:
| | | | | | | | | | | | | | |
| | | Contract
Amount | | Settlement
Date | | Unrealized
Appreciation | | Unrealized
Depreciation | |
| Contracts to Buy | | | | | | | | | |
| 8,880,000 | | British Pound Sterling | | $ | 15,607,438 | | 1/12/09 | | $ | — | | $ | (2,642,061 | ) |
| 13,328,589 | | Norwegian Krone | | | 1,858,684 | | 1/12/09 | | | 55,958 | | | — | |
| 87,601,418 | | Danish Krone | | | 15,203,108 | | 1/23/09 | | | 1,225,839 | | | — | |
| 21,126,290 | | Danish Krone | | | 3,994,342 | | 1/23/09 | | | — | | | (42,471 | ) |
| 10,566,752 | | Swiss Franc | | | 8,940,000 | | 2/09/09 | | | 959,917 | | | — | |
| 10,180,000 | | Euro | | | 13,051,340 | | 2/13/09 | | | 1,158,604 | | | — | |
| 6,119,681 | | Canadian Dollar | | | 4,854,698 | | 2/27/09 | | | 171,980 | | | — | |
| 13,090,000 | | British Pound Sterling | | | 22,323,977 | | 3/10/09 | | | — | | | (3,233,082 | ) |
| 51,639,918 | | Swedish Krona | | | 7,220,000 | | 3/16/09 | | | — | | | (621,651 | ) |
| 14,433,556 | | Swedish Krona | | | 1,755,000 | | 3/16/09 | | | 89,264 | | | — | |
| 9,939,795 | | Singapore Dollar | | | 6,670,000 | | 3/24/09 | | | 250,297 | | | — | |
| 22,623,614 | | Norwegian Krone | | | 3,135,000 | | 5/19/09 | | | 98,145 | | | — | |
| | | | |
| Contracts to Sell | | | | | | | | | |
| 19,929,364 | | British Pound Sterling | | | 34,198,437 | | 1/12/09 | | | 5,100,271 | | | — | |
| 214,518,134 | | Norwegian Krone | | | 34,590,306 | | 1/12/09 | | | 3,774,933 | | | — | |
| 13,954,032 | | Norwegian Krone | | | 1,976,000 | | 1/12/09 | | | — | | | (28,486 | ) |
| 8,597,033 | | Euro | | | 11,780,514 | | 1/14/09 | | | — | | | (232,977 | ) |
| 125,700,000 | | Danish Krone | | | 26,246,557 | | 1/23/09 | | | 2,672,524 | | | — | |
| 61,386,091 | | Danish Krone | | | 10,820,994 | | 1/23/09 | | | — | | | (691,478 | ) |
| 80,000,000 | | Euro | | | 117,028,000 | | 1/26/09 | | | 5,297,693 | | | — | |
| 35,705,002 | | Swiss Franc | | | 33,956,255 | | 2/09/09 | | | 504,486 | | | — | |
| 5,445,436 | | Swiss Franc | | | 4,580,000 | | 2/09/09 | | | — | | | (521,791 | ) |
| 74,000,000 | | Euro | | | 109,986,200 | | 2/13/09 | | | 6,691,909 | | | — | |
| 1,241,474 | | Euro | | | 1,599,391 | | 2/13/09 | | | — | | | (133,544 | ) |
| 911,037,902 | | Japanese Yen | | | 9,471,908 | | 2/19/09 | | | — | | | (579,948 | ) |
| 10,428,903 | | Canadian Dollar | | | 8,215,993 | | 2/27/09 | | | — | | | (350,261 | ) |
| 13,080,000 | | Euro | | | 17,039,476 | | 2/27/09 | | | — | | | (1,211,910 | ) |
| 47,000,000 | | Swiss Franc | | | 42,443,619 | | 3/09/09 | | | — | | | (1,605,548 | ) |
| 64,000,000 | | British Pound Sterling | | | 110,985,840 | | 3/10/09 | | | 17,646,097 | | | — | |
| 76,336,978 | | Euro | | | 97,484,751 | | 3/13/09 | | | — | | | (8,997,846 | ) |
| 205,405,471 | | Swedish Krona | | | 30,178,650 | | 3/16/09 | | | 3,932,733 | | | — | |
| 28,482,132 | | Swedish Krona | | | 3,529,353 | | 3/16/09 | | | — | | | (109,983 | ) |
| 17,528,217 | | Singapore Dollar | | | 12,493,383 | | 3/24/09 | | | 289,866 | | | — | |
| 884,646 | | Singapore Dollar | | | 590,000 | | 3/24/09 | | | — | | | (25,909 | ) |
| 7,876,825,000 | | South Korean Won | | | 6,600,000 | | 4/06/09 | | | 341,598 | | | — | |
| 12,478,547,500 | | South Korean Won | | | 9,230,000 | | 4/06/09 | | | — | | | (684,625 | ) |
| 848,000,000 | | Japanese Yen | | | 9,658,314 | | 4/20/09 | | | 288,372 | | | — | |
| 14,985,000 | | Euro | | | 19,505,584 | | 4/30/09 | | | — | | | (1,375,349 | ) |
| 31,875,178 | | British Pound Sterling | | | 49,575,465 | | 5/12/09 | | | 3,096,192 | | | — | |
| 48,916,446 | | Euro | | | 61,047,725 | | 5/13/09 | | | — | | | (7,096,994 | ) |
| 7,881,666 | | Norwegian Krone | | | 1,110,000 | | 5/19/09 | | | — | | | (16,371 | ) |
| 11,500,000 | | Euro | | | 14,975,300 | | 5/29/09 | | | — | | | (1,039,909 | ) |
| 49,115,000 | | British Pound Sterling | | | 72,840,360 | | 9/14/09 | | | 1,218,501 | | | — | |
| | | | | | | | | | | |
| Unrealized appreciation (depreciation) on forward exchange contracts | | | | | | | | 54,865,179 | | | (31,242,194 | ) |
| | | | | | | | | | | |
| Net unrealized appreciation on forward exchange contracts | | | | | | | $ | 23,622,985 | | | | |
| | | | | | | | | | | | | | |
MS-31
Franklin Templeton Variable Insurance Products Trust
Notes to Financial Statements (continued)
Mutual Shares Securities Fund
8. CREDIT RISK AND DEFAULTED SECURITIES
The Fund may purchase the pre-default or defaulted debt of distressed companies. Distressed companies are financially troubled and are about to be/or are already involved in financial restructuring or bankruptcy. The Fund does not accrue income on these securities, if it becomes probable that the income will not be collected. Risks associated with purchasing these securities include the possibility that the bankruptcy or other restructuring process takes longer than expected, or that distributions in restructuring are less than anticipated, either or both of which may result in unfavorable consequences to the Fund. At December 31, 2008, the aggregate value of these securities was $2,614,132, representing 0.07% of the Fund’s net assets. For information as to specific securities, see the accompanying Statement of Investments.
9. CONCENTRATION OF RISK
Investing in foreign securities may include certain risks and considerations not typically associated with investing in U.S. securities, such as fluctuating currency values and changing local and regional economic, political and social conditions, which may result in greater market volatility. In addition, certain foreign securities may not be as liquid as U.S. securities.
10. RESTRICTED SECURITIES
The Fund may invest in securities that are restricted under the Securities Act of 1933 (1933 Act) or which are subject to legal, contractual, or other agreed upon restrictions on resale. Restricted securities are often purchased in private placement transactions, and cannot be sold without prior registration unless the sale is pursuant to an exemption under the 1933 Act. Disposal of these securities may require greater effort and expense, and prompt sale at an acceptable price may be difficult. The Fund may have registration rights for restricted securities. The issuer generally incurs all registration costs.
At December 31, 2008, the Fund held investments in restricted securities, excluding 144A securities deemed to be liquid, valued in accordance with procedures approved by the Fund’s Board of Trustees as reflecting fair value, as follows:
| | | | | | | | | | | |
Principal
Amount/
Shares/
Warrants/
Contracts | | | Issuer | | Acquisition
Dates | | Cost | | Value |
| 62,453 | | | AboveNet Inc. | | 10/02/01 - 8/08/08 | | $ | 3,452,922 | | $ | 3,122,650 |
| 78 | | | AboveNet Inc., stock grant, grant price $20.95, expiration date 9/09/13 | | 4/17/06 - 9/08/06 | | | — | | | 175 |
| 2,995 | | | AboveNet Inc., wts., 9/08/10 | | 10/02/01 - 9/07/07 | | | 315,092 | | | 11,980 |
| 8,172,654 | | | Cerberus CG Investor I LLC | | 7/26/07 - 6/17/08 | | | 8,172,654 | | | 1,634,531 |
| 7,173,000 | | | Cerberus CG Investor I LLC, 12.00%, 7/31/14 | | 7/26/07 | | | 7,173,000 | | | 1,434,600 |
| 8,172,654 | | | Cerberus CG Investor II LLC | | 7/26/07 - 6/17/08 | | | 8,172,654 | | | 1,634,531 |
| 7,173,000 | | | Cerberus CG Investor II LLC, 12.00%, 7/31/14 | | 7/26/07 | | | 7,173,000 | | | 1,434,600 |
| 4,086,327 | | | Cerberus CG Investor III LLC | | 7/26/07 - 6/17/08 | | | 4,086,327 | | | 817,265 |
| 3,586,500 | | | Cerberus CG Investor III LLC, 12.00%, 7/31/14 | | 7/26/07 | | | 3,586,500 | | | 717,300 |
| 7,900,500 | | | Cerberus FIM Investors Holdco LLC | | 11/20/06 | | | 7,900,500 | | | 1,673,305 |
| 23,696,793 | | | Cerberus FIM Investors Holdco LLC, 12.00%, 11/22/13 | | 11/21/06 | | | 23,696,793 | | | 5,018,981 |
| 37,154 | | | aDana Holding Corp., 4.00%, cvt. pfd., B | | 12/27/07 | | | 3,715,400 | | | 334,386 |
| 108,227 | | | bDecisionOne Corp. | | 3/12/99 - 7/18/00 | | | 76,619 | | | — |
| 139,306 | | | bDecisionOne Corp., 12.00%, 4/15/10 | | 3/12/99 - 10/16/08 | | | 196,278 | | | 139,306 |
| 59,425 | | | bDecisionOne Corp., wts., 6/08/17 | | 7/09/07 | | | — | | | — |
| 11,728 | | | Elephant Capital Holdings Ltd. | | 8/29/03 - 3/10/08 | | | 1,364,048 | | | — |
| 5,565,600 | | | GLCP Harrah’s Investment LP | | 1/15/08 | | | 5,565,600 | | | 1,669,680 |
| 168,957 | | �� | IACNA Investor LLC | | 7/24/08 | | | 173,030 | | | 1,690 |
MS-32
Franklin Templeton Variable Insurance Products Trust
Notes to Financial Statements (continued)
Mutual Shares Securities Fund
10. RESTRICTED SECURITIES (continued)
| | | | | | | | | | | |
Principal
Amount/
Shares/
Warrants/
Contracts | | | Issuer | | Acquisition
Dates | | Cost | | Value |
| 1,730,515 | | | International Automotive Components Group Brazil LLC | | 4/13/06 - 12/26/08 | | $ | 1,160,868 | | $ | 1,376,833 |
| 269,643 | | | International Automotive Components Group Japan LLC | | 9/26/06 - 3/27/07 | | | 2,340,891 | | | 291,413 |
| 6,170,474 | | | International Automotive Components Group LLC | | 1/12/06 - 10/16/06 | | | 6,172,073 | | | 1,049,598 |
| 1,456,500 | | | International Automotive Components Group NA LLC, 9.00%, 4/01/17 | | 3/30/07 | | | 1,478,348 | | | 702,150 |
| 4,838,053 | | | International Automotive Components Group NA LLC, A | | 3/30/07 - 10/10/07 | | | 4,789,127 | | | 787,635 |
| 167,311 | | | Kindred Healthcare Inc. | | 4/02/99 - 7/8/08 | | | 1,563,248 | | | 2,069,470 |
| 2 | | | cMotor Coach Industries International Inc., wts., 5/27/09 | | 3/30/07 | | | — | | | — |
| 57,295 | | | NCB Warrant Holdings Ltd., A | | 12/16/05 - 3/10/08 | | | 603,247 | | | — |
| 16,280 | | | Olympus Re Holdings Ltd. | | 12/19/01 | | | 1,574,304 | | | 38,219 |
| 17,760,635 | | | Pontus I LLC, junior note, 144A, FRN, 5.689%, 7/24/09 | | 1/22/08 - 2/25/08 | | | 32,670,267 | | | 20,041,178 |
| 2,809,825 | | | Pontus II Trust, junior profit-participating note, 144A, FRN, 7.516%, 6/25/09 | | 2/29/08 | | | 3,224,069 | | | 655,588 |
| 17,300 | | | PTV Inc., 10.00%, pfd., A | | 12/07/01 - 3/6/02 | | | 24,220 | | | 15,570 |
| | | | | | | | | | | |
| | | Total Restricted Securities (1.27% of Net Assets) | | | | | | | $ | 46,672,634 |
| | | | | | | | | | | |
a | The Fund also invests in unrestricted securities of the issuer, valued at $327,321 as of December 31, 2008. |
b | The Fund also invests in unrestricted securities of the issuer, valued at $24,958 as of December 31, 2008. |
c | The Fund also invests in unrestricted securities of the issuer, valued at $4,139,324 as of December 31, 2008. |
11. UNFUNDED LOAN COMMITMENTS
The Fund may enter into certain credit agreements, all or a portion of which may be unfunded. The Fund is obligated to fund these loan commitments at the borrowers’ discretion. Funded portions of credit agreements are presented on the Statement of Investments.
At December 31, 2008, unfunded commitments were as follows:
| | | |
| Borrower | | Unfunded
Commitment |
Realogy Corp. FRN, 4.596%, 4/10/13 | | $ | 3,471,890 |
Motor Coach Industries International Inc., First Lien DIP Revolver, FRN, 7.75%, 9/19/09 | | | 549,442 |
| | | |
| | $ | 4,021,332 |
| | | |
Unfunded loan commitments and funded portions of credit agreements are marked to market daily and any unrealized appreciation or depreciation is included in the Statement of Assets and Liabilities and Statement of Operations.
12. UNFUNDED CAPITAL COMMITMENTS
At December 31, 2008, the Fund had aggregate unfunded capital commitments to investments of $15,667,656.
MS-33
Franklin Templeton Variable Insurance Products Trust
Notes to Financial Statements (continued)
Mutual Shares Securities Fund
13. HOLDINGS OF 5% VOTING SECURITIES OF PORTFOLIO COMPANIES
The 1940 Act defines “affiliated companies” to include investments in portfolio companies in which a fund owns 5% or more of the outstanding voting securities. Investments in “affiliated companies” for the Fund for the year ended December 31, 2008, were as shown below.
| | | | | | | | | | | | | | | | | |
| Name of Issuer | | Number
of Shares
Held at
Beginning
of Year | | Gross
Additions | | Gross
Reductions | | Number
of
Shares
Held at
End of
Year | | Value at
End of
Year | | Investment
Income | | Realized
Capital
Gain
(Loss) |
Non-Controlled Affiliates | | | | | | | | | | | | | | | | | |
GLCP Harrah’s Investment LP
(0.05% of Net Assets) | | — | | 5,565,600 | | — | | 5,565,600 | | $ | 1,669,680 | | $ | — | | $ | — |
| | | | | | | | | | | | | | | | | |
14. OTHER CONSIDERATIONS
Officers, directors or employees of the Fund’s Investment Manager, may serve from time to time as members of bondholders’ steering committees, official creditors’ committees, or boards of directors of companies in which the Fund invests. Such participation may result in the possession by the Investment Manager of material non-public information which, pursuant to the Fund’s policies and the requirements of applicable securities laws, could prevent the Fund from trading in the securities of such companies for limited or extended periods of time.
Franklin Mutual serves as investment manager to certain special purpose entities that issued securities held by the Fund. Franklin Mutual is not compensated for such services and does not invest in or exercise control over such entities. As investment manager, Franklin Mutual is primarily responsible for recommending investments in unaffiliated issuers to be held by the special purpose entities. Securities issued by these special purpose entities are restricted under the Securities Act of 1933 and are deemed to be illiquid.
15. REDEMPTION IN-KIND
During the year ended December 31, 2007, the Fund realized $14,084,559 of net gains resulting from a redemption in-kind in which a shareholder redeemed fund shares for securities held by the Fund rather than for cash. Because such gains are not taxable to the Fund, and are not distributed to shareholders, they have been reclassified from accumulated net realized gains to paid-in capital.
16. FAIR VALUE MEASUREMENTS
The Fund adopted Financial Accounting Standards Board (FASB) Statement No. 157, “Fair Value Measurement” (SFAS 157), on January 1, 2008. SFAS 157 defines fair value, establishes a framework for measuring fair value, and expands disclosures about fair value measurements. The Fund has determined that the implementation of SFAS 157 did not have a material impact on the Fund’s financial statements.
MS-34
Franklin Templeton Variable Insurance Products Trust
Notes to Financial Statements (continued)
Mutual Shares Securities Fund
16. FAIR VALUE MEASUREMENTS (continued)
SFAS 157 establishes a fair value hierarchy that distinguishes between market data obtained from independent sources (observable inputs) and the Fund’s own market assumptions (unobservable inputs). These inputs are used in determining the value of the Fund’s investments and are summarized in the following fair value hierarchy:
| | • | | Level 1 – quoted prices in active markets for identical securities |
| | • | | Level 2 – other significant observable inputs (including quoted prices for similar securities, interest rates, prepayment speed, credit risk, etc.) |
| | • | | Level 3 – significant unobservable inputs (including the Fund’s own assumptions in determining the fair value of investments) |
The inputs or methodology used for valuing securities are not an indication of the risk associated with investing in those securities.
The following is a summary of the inputs used as of December 31, 2008, in valuing the Fund’s assets and liabilities carried at fair value:
| | | | | | | | | | | | |
| | | Level 1 | | Level 2 | | Level 3 | | Total |
Assets: | | | | | | | | | | | | |
Investments in Securities | | $ | 2,913,623,171 | | $ | 594,219,011 | | $ | 52,854,211 | | $ | 3,560,696,393 |
Other Financial Instrumentsa | | | — | | | 54,865,179 | | | — | | | 54,865,179 |
Liabilities: | | | | | | | | | | | | |
Options Written | | | 88,535 | | | | | | — | | | 88,535 |
Other Financial Instrumentsa | | | — | | | 31,940,601 | | | — | | | 31,940,601 |
aOther | financial instruments include net unrealized appreciation (depreciation) on forward exchange contracts, and unfunded loan commitments. |
At December 31, 2008, the reconciliation of assets in which significant unobservable inputs (Level 3) were used in determining the fair value, is as follows:
| | | | |
| | | Investments in
Securities | |
Beginning Balance – January 1, 2008 | | $ | 141,064,446 | |
Net realized gain (loss) | | | 1,363,122 | |
Net change in unrealized appreciation (depreciation) | | | (98,129,019 | ) |
Net purchases (sales) | | | 12,137,605 | |
Transfers in and/or out of Level 3 | | | (3,581,943 | ) |
| | | | |
Ending Balance | | $ | 52,854,211 | |
| | | | |
Net change in unrealized appreciation (depreciation) attributable to assets still held at end of year | | $ | (108,587,306 | ) |
| | | | |
17. NEW ACCOUNTING PRONOUNCEMENT
In March 2008, FASB issued FASB Statement No. 161, “Disclosures about Derivative Instruments and Hedging Activities, an amendment of FASB Statement No. 133” (SFAS 161), which expands disclosures about derivative investments and hedging activities. SFAS 161 is effective for fiscal years and interim periods beginning after November 15, 2008. The Fund is currently evaluating the impact, if any, of applying the various provisions of SFAS 161.
MS-35
Franklin Templeton Variable Insurance Products Trust
Notes to Financial Statements (continued)
Mutual Shares Securities Fund
18. SUBSEQUENT EVENT
On January 23, 2009, the Fund entered into, along with certain other funds managed by Franklin Templeton Investments (individually, “Borrower”; collectively “Borrowers”), a $725 million senior unsecured syndicated global line of credit (“Global Credit Facility”) to provide a source of funds to the Borrowers for temporary and emergency purposes and to meet future unanticipated or unusually large redemption requests.
Under the terms of the Global Credit Facility, each Borrower has agreed to pay its proportionate share of fees and expenses incurred in connection with the implementation and maintenance of the Global Credit Facility.
Currency Abbreviations
CAD - Canadian Dollar
EUR - Euro
GBP - British Pound Sterling
JPY - Japanese Yen
Selected Portfolio Abbreviations
ADR - American Depository Receipt
DIP - Debtor-In-Possession
FHLB - Federal Home Loan Bank
FRN - Floating Rate Note
PIK - Payment-In-Kind
REIT - - Real Estate Investment Trust
MS-36
Franklin Templeton Variable Insurance Products Trust
Mutual Shares Securities Fund
Report of Independent Registered Public Accounting Firm
To the Board of Trustees and Shareholders of Franklin Templeton Variable Insurance Products Trust
In our opinion, the accompanying statement of assets and liabilities, including the statement of investments, and the related statements of operations and of changes in net assets and the financial highlights present fairly, in all material respects, the financial position of Mutual Shares Securities Fund (one of the funds constituting the Franklin Templeton Variable Insurance Products Trust, hereafter referred to as the “Fund”) at December 31, 2008, the results of its operations for the year then ended, the changes in its net assets and the financial highlights for the periods presented, in conformity with accounting principles generally accepted in the United States of America. These financial statements and financial highlights (hereafter referred to as “financial statements”) are the responsibility of the Fund’s management. Our responsibility is to express an opinion on these financial statements based on our audits. We conducted our audits of these financial statements in accordance with the standards of the Public Company Accounting Oversight Board (United States). Those standards require that we plan and perform the audit to obtain reasonable assurance about whether the financial statements are free of material misstatement. An audit includes examining, on a test basis, evidence supporting the amounts and disclosures in the financial statements, assessing the accounting principles used and significant estimates made by management, and evaluating the overall financial statement presentation. We believe that our audits, which included confirmation of securities at December 31, 2008 by correspondence with the custodian and brokers, provide a reasonable basis for our opinion.
PricewaterhouseCoopers LLP
San Francisco, California
February 10, 2009
MS-37
Franklin Templeton Variable Insurance Products Trust
Tax Designation (unaudited)
Mutual Shares Securities Fund
Under Section 852(b)(3)(C) of the Internal Revenue Code (Code), the Fund designates the maximum amount allowable but no less than $173,471,517 as a long term capital gain dividend for the fiscal year ended December 31, 2008.
Under Section 854(b)(2) of the Code, the Fund designates 25.50% of the ordinary income dividends as income qualifying for the dividends received deduction for the fiscal year ended December 31, 2008.
MS-38
TEMPLETON DEVELOPING MARKETS SECURITIES FUND
This annual report for Templeton Developing Markets Securities Fund covers the fiscal year ended December 31, 2008.
Performance Summary as of 12/31/08
Average annual total return of Class 1 shares* represents the average annual change in value, assuming reinvestment of dividends and capital gains. Average returns smooth out variations in returns, which can be significant; they are not the same as year-by-year results.
Periods ended 12/31/08
| | | | | | |
| | | 1-Year | | 5-Year | | 10-Year |
Average Annual Total Return | | -52.62% | | +4.61% | | +6.40% |
*Performance prior to the 5/1/00 merger reflects historical performance of Templeton Developing Markets Fund.
Total Return Index Comparison
for a Hypothetical $10,000 Investment (1/1/99–12/31/08)
The graph below shows the change in value of a hypothetical $10,000 investment in the Fund over the indicated period and includes reinvestment of any income or distributions. The Fund’s performance* is compared to the performance of the Morgan Stanley Capital International (MSCI) Emerging Markets (EM) Index and the Standard & Poor’s/International Finance Corporation Investable (S&P/IFCI) Composite Index. One cannot invest directly in an index, nor is an index representative of the Fund’s portfolio. Please see Important Notes to Performance Information preceding the Fund Summaries.
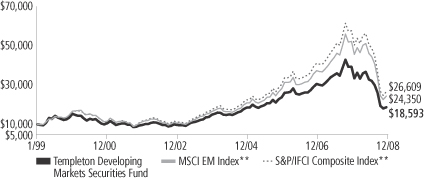
**Source: © 2009 Morningstar. Please see Index Descriptions following the Fund Summaries.
Templeton Developing Markets Securities Fund Class 1
Performance reflects the Fund’s Class 1 operating expenses, but does not include any contract fees, expenses or sales charges. If they had been included, performance would be lower. These charges and deductions, particularly for variable life policies, can have a significant effect on contract values and insurance benefits. See the contract prospectus for a complete description of these expenses, including sales charges.
Performance data represent past performance, which does not guarantee future results. Investment return and principal value will fluctuate, and you may have a gain or loss when you sell your shares. Current performance may differ from figures shown.
TD-1
Fund Goal and Main Investments: Templeton Developing Markets Securities Fund seeks long-term capital appreciation. The Fund normally invests at least 80% of its net assets in emerging market investments and normally invests predominantly in equity securities.
Performance Overview
You can find the Fund’s one-year total return in the Performance Summary. The Fund performed comparably to the MSCI EM Index’s -53.18% total return and the S&P/IFCI Composite Index’s -53.74% total return for the same period.1 Please note that index performance numbers are purely for reference and that we do not attempt to track an index, but rather undertake investments on the basis of fundamental research.
Economic and Market Overview
Global financial markets this past year experienced some of the worst volatility since the 1930s. The current crisis began in the U.S. with the unraveling of the highly leveraged derivative structure of subprime mortgages. Extreme risk aversion and the resulting lack of liquidity were detrimental to companies that relied on borrowing and eventually led to a series of major financial firm collapses in the U.S. and Europe. Investor anxiety surged and market volatility in developed and emerging markets reached historic levels.
Recognizing the severity of the credit crunch, governments around the world implemented fiscal stimuli and loosened monetary policies to support their domestic economies and ease liquidity conditions. Thus far, more than US$1 trillion in total has been pledged globally by countries including China, the U.S., Germany, the U.K., Taiwan, Spain, Japan, South Korea, Russia, France, Australia, Hong Kong, Singapore and Malaysia. Government measures, coupled with stocks trading at distress-level valuations, brought bargain hunters back to the market. As a result, the MSCI EM Index rebounded and ended the year 25% above its 2008 low in October.1
Investment Strategy
Our investment philosophy is bottom up, value oriented and long term. In choosing investments, we may make on-site visits to companies to assess critical factors such as management strength and local conditions.
1. Source: © 2009 Morningstar. One cannot invest directly in an index, nor is an index representative of the Fund’s portfolio. Please see Index Descriptions following the Fund Summaries.
Fund Risks: The Fund’s investments in stocks offer the potential for long-term gains but can be subject to short-term price fluctuations. Investing in emerging markets is subject to all the risks of foreign investing generally as well as additional, heightened risks, including currency fluctuations, economic instability, market volatility, political and social instability, the relatively smaller size and lesser liquidity of these markets, and less effective or irregular government supervision and regulation of business and industry practices. By having significant investments in one or more countries or in particular sectors from time to time, the Fund may carry greater risk of adverse developments in a country or sector than a fund that invests more broadly. The Fund’s prospectus also includes a description of the main investment risks.
TD-2
In addition, we focus on the market price of a company’s securities relative to our evaluation of the company’s potential long-term (typically five years) earnings, asset value and cash flow potential. Among factors we consider are a company’s historical value measures, including price/earnings ratio, profit margins and liquidation value. We perform in-depth research to construct an action list from which we make our investment decisions.
Manager’s Discussion
During the year under review, the most significant detractors from the Fund’s absolute performance included Turkey’s Akbank, one of the country’s largest commercial banks, Russia’s Gazprom, the world’s largest natural gas producer, and South Korea’s SK Energy, a major oil refiner. All three stocks significantly declined in value and underperformed many of their emerging markets peers in 2008. Investor risk aversion rose toward emerging markets such as Turkey amid the global financial crisis, and shares of Akbank suffered. Commodity price corrections drove investors to reduce exposure to energy stocks. We divested the Fund’s investments in SK Energy due to weak refining margins, slower demand and availability of what we considered more attractively valued stocks in our investment universe. Although we trimmed the Fund’s holdings in Gazprom and Akbank to meet funding requirements, we believed that these companies were well positioned to benefit from continued demand for their products and services over the longer term.
On the other hand, the most significant contributors to Fund performance included Zijin Mining Group, a Chinese mining conglomerate primarily engaged in gold production, and China Coal Energy and China Shenhua Energy, the country’s largest coal producers. We added shares of Zijin Mining Group to the portfolio in December after price corrections brought the shares down to attractive levels in our view. As one of China’s largest gold miners, Zijin Mining Group has proven reserves and benefits from economies of scale and cost advantages. We believe expectations for gold prices to remain relatively high could lead to higher revenues.
We initiated a position in China Coal Energy and added to our existing position in China Shenhua Energy as price corrections brought valuations down to what we considered attractive levels. China Coal Energy is the country’s largest thermal coal exporter, and also engages in the coking business and mining equipment manufacturing. As an
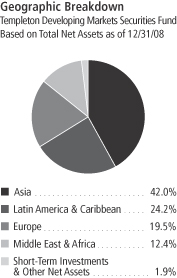
TD-3
integrated coal-based energy company, China Shenhua Energy owns one of the two dedicated coal freight rail lines in the country. Based on our analysis, we believe these companies could benefit from proven reserves, resilient coal prices in the medium term and long-term demand from industries such as power generation and steel.
It is also important to recognize the effect of currency movements on the Fund’s performance. In general, if the value of the U.S. dollar goes up compared with a foreign currency, an investment traded in that foreign currency will go down in value because it will be worth fewer U.S. dollars. This can have a negative effect on Fund performance. Conversely, when the U.S. dollar weakens in relation to a foreign currency, an investment traded in that foreign currency will increase in value, which can contribute to Fund performance. For the 12 months ended December 31, 2008, the U.S. dollar increased in value relative to most non-U.S. currencies. As a result, the Fund’s performance was negatively affected by the portfolio’s predominant investment in securities with non-U.S. currency exposure.
During the reporting period, we increased the Fund’s holdings in South Africa, Taiwan and Chile as we continued to search for attractive investment opportunities. We also increased the Fund’s exposure to select frontier markets, which we believe have the potential to grow at a relatively fast pace and offer investors the opportunity to invest in a younger generation of emerging markets. We made select purchases in Qatar, United Arab Emirates, Kuwait and Oman.
In addition, we made significant purchases in banks. In our view, the continued liberalization of the financial sector in emerging markets could unlock hidden value and allow banks to benefit from the growing financial needs of consumers in these markets. Major additions in this sector included ICBC (Industrial and Commercial Bank of China) and China Construction Bank, two leading Chinese commercial banks, HSBC Holdings, one of the world’s premier banking and financial services organizations, and Banco Itau Holding Financeira, a major financial conglomerate in Brazil.
We also made key purchases in consumer-related sectors that included broadcasting and cable television, life and health insurance, and brewing companies. Some key investments were China Life Insurance, the country’s leading life insurance company, Brazil’s Ambev (Companhia de Bebidas das Americas), one of the world’s largest beer and soft drink producers, and Grupo Televisa, a premier Mexican media company. We
Top 10 Holdings
Templeton Developing Markets Securities Fund 12/31/08
| | |
Company
Sector/Industry,
Country | | % of Total
Net Assets |
| |
| China Mobile Ltd. | | 5.6% |
| Wireless Telecommunication Services, China | | |
| |
| ICBC (Industrial and Commercial Bank of China Ltd.), H | | 2.4% |
| Commercial Banks, China | | |
| |
| America Movil SAB de CV, L, ADR | | 2.3% |
| Wireless Telecommunication Services, Mexico | | |
| |
| China Construction Bank Corp., H | | 2.3% |
| Commercial Banks, China | | |
| |
| PetroChina Co. Ltd., H | | 2.1% |
| Oil, Gas & Consumable Fuels, China | | |
| |
| TSMC (Taiwan Semiconductor Manufacturing Co. Ltd.) | | 2.0% |
| Semiconductors & Semiconductor Equipment, Taiwan | | |
| |
| Vale (Companhia Vale do Rio Doce), ADR, pfd., A | | 1.9% |
| Metals & Mining, Brazil | | |
| |
| President Chain Store Corp. | | 1.9% |
| Food & Staples Retailing, Taiwan | | |
| |
| Petrobras (Petroleo Brasileiro SA), ADR, pfd. | | 1.9% |
| Oil, Gas & Consumable Fuels, Brazil | | |
| |
| Gazprom, ADR | | 1.8% |
| Oil, Gas & Consumable Fuels, Russia | | |
The dollar value, number of shares or principal amount, and names of all portfolio holdings are listed in the Fund’s Statement of Investments.
TD-4
believe the long-term outlook for consumerism remains attractive due to relatively higher per-capita income growth and continued demand for consumer goods and services in emerging markets.
To raise funds for redemptions during the reporting period, we sold a number of holdings. We sold some other stocks as they reached sale price targets. As a result, the Fund’s exposure to diversified metals and mining, oil and gas, and electric utilities companies fell. Major sales included all or part of Vale (Companhia Vale do Rio Doce), one of the world’s largest iron ore producers, Petrobras (Petroleo Brasileiro), Brazil’s national oil and gas company, and UES (Unified Energy Systems), a Russian electricity production group that was split into individual companies due to restructuring in the country’s power sector. Geographically, the Fund’s investments fell in Brazil, Russia and South Korea.
Thank you for your participation in Templeton Developing Markets Securities Fund. We look forward to serving your future investment needs.
The foregoing information reflects our analysis, opinions and portfolio holdings as of December 31, 2008, the end of the reporting period. The way we implement our main investment strategies and the resulting portfolio holdings may change depending on factors such as market and economic conditions. These opinions may not be relied upon as investment advice or an offer for a particular security. The information is not a complete analysis of every aspect of any market, country, industry, security or the Fund. Statements of fact are from sources considered reliable, but the investment manager makes no representation or warranty as to their completeness or accuracy. Although historical performance is no guarantee of future results, these insights may help you understand our investment management philosophy.
Top 10 Countries
Templeton Developing Markets Securities Fund 12/31/08
| | |
| | | % of Total
Net Assets |
| |
| China | | 23.2% |
| |
| Brazil | | 12.8% |
| |
| South Africa | | 10.2% |
| |
| Mexico | | 8.7% |
| |
| Russia | | 6.5% |
| |
| Taiwan | | 5.7% |
| |
| Turkey | | 5.2% |
| |
| U.K. | | 4.2% |
| |
| India | | 4.2% |
| |
| Chile | | 2.1% |
TD-5
Fund Expenses
As an investor in a variable insurance contract (Contract) that indirectly provides for investment in an underlying mutual fund, you can incur transaction and/or ongoing expenses at both the Fund level and the Contract level.
| • | | Transaction expenses can include sales charges (loads) on purchases, redemption fees, surrender fees, transfer fees and premium taxes. |
| • | | Ongoing expenses can include management fees, distribution and service (12b-1) fees, contract fees, annual maintenance fees, mortality and expense risk fees and other fees and expenses. All mutual funds and Contracts have some types of ongoing expenses. |
The expenses shown in the table are meant to highlight ongoing expenses at the Fund level only and do not include ongoing expenses at the Contract level, or transaction expenses at either the Fund or Contract level. While the Fund does not have transaction expenses, if the transaction and ongoing expenses at the Contract level were included, the expenses shown below would be higher. You should consult your Contract prospectus or disclosure document for more information.
The table shows Fund-level ongoing expenses and can help you understand these expenses and compare them with those of other mutual funds offered through the Contract. The table assumes a $1,000 investment held for the six months indicated. Please refer to the Fund prospectus for additional information on operating expenses.
Actual Fund Expenses
The first line (Actual) of the table provides actual account values and expenses. The “Ending Account Value” is derived from the Fund’s actual return, which includes the effect of ongoing Fund expenses, but does not include the effect of ongoing Contract expenses.
You can estimate the Fund-level expenses you incurred during the period by following these steps. Of course, your account value and expenses will differ from those in this illustration:
| 1. | Divide your account value by $1,000. |
If an account had an $8,600 value, then $8,600 ÷ $1,000 = 8.6.
| 2. | Multiply the result by the number under the heading “Fund-Level Expenses Incurred During Period.” |
If Fund-Level Expenses Incurred During Period were $7.50, then 8.6 x $7.50 = $64.50.
In this illustration, the estimated expenses incurred this period at the Fund level are $64.50.
Templeton Developing Markets Securities Fund Class 1
TD-6
Hypothetical Example for Comparison with Other Mutual Funds
Information in the second line (Hypothetical) of the table can help you compare ongoing expenses of the Fund with those of other mutual funds offered through the Contract. This information may not be used to estimate the actual ending account balance or expenses you incurred during the period. The hypothetical “Ending Account Value” is based on the Fund’s actual expense ratio and an assumed 5% annual rate of return before expenses, which does not represent the Fund’s actual return. The figure under the heading “Fund-Level Expenses Incurred During Period” shows the hypothetical expenses your account would have incurred under this scenario. You can compare this figure with the 5% hypothetical examples that appear in shareholder reports of other funds offered through a Contract.
| | | | | | | | | |
| Class 1 | | Beginning
Account Value 7/1/08 | | Ending Account Value 12/31/08 | | Fund-Level
Expenses Incurred
During Period*
7/1/08–12/31/08 |
Actual | | $ | 1,000 | | $ | 569.40 | | $ | 6.04 |
Hypothetical (5% return before expenses) | | $ | 1,000 | | $ | 1,017.44 | | $ | 7.76 |
*Expenses are calculated using the most recent six-month annualized expense ratio for the Fund’s Class 1 shares (1.53%), which does not include any ongoing expenses of the Contract for which the Fund is an investment option, multiplied by the average account value over the period, multiplied by 184/366 to reflect the one-half year period.
TD-7
Franklin Templeton Variable Insurance Products Trust
Financial Highlights
Templeton Developing Markets Securities Fund
| | | | | | | | | | | | | | | | | | | | |
| | | Year Ended December 31, | |
| Class 1 | | 2008 | | | 2007 | | | 2006 | | | 2005 | | | 2004 | |
| | | | |
Per share operating performance | | | | | | | | | | | | | | | | | | | | |
(for a share outstanding throughout the year) | | | | | | | | | | | | | | | | | | | | |
Net asset value, beginning of year | | $ | 16.16 | | | $ | 13.92 | | | $ | 10.99 | | | $ | 8.73 | | | $ | 7.14 | |
| | | | |
Income from investment operationsa: | | | | | | | | | | | | | | | | | | | | |
Net investment incomeb | | | 0.16 | | | | 0.32 | | | | 0.24 | | | | 0.17 | | | | 0.11 | |
Net realized and unrealized gains (losses) | | | (7.40 | ) | | | 3.51 | | | | 2.84 | | | | 2.23 | | | | 1.62 | |
| | | | |
Total from investment operations | | | (7.24 | ) | | | 3.83 | | | | 3.08 | | | | 2.40 | | | | 1.73 | |
| | | | |
Less distributions from: | | | | | | | | | | | | | | | | | | | | |
Net investment income | | | (0.37 | ) | | | (0.38 | ) | | | (0.15 | ) | | | (0.14 | ) | | | (0.14 | ) |
Net realized gains | | | (2.44 | ) | | | (1.21 | ) | | | — | | | | — | | | | — | |
| | | | |
Total distributions | | | (2.81 | ) | | | (1.59 | ) | | | (0.15 | ) | | | (0.14 | ) | | | (0.14 | ) |
| | | | |
Redemption fees | | | — | c | | | — | c | | | — | c | | | — | c | | | — | |
| | | | |
Net asset value, end of year | | $ | 6.11 | | | $ | 16.16 | | | $ | 13.92 | | | $ | 10.99 | | | $ | 8.73 | |
| | | | |
| | | | | |
Total returnd | | | (52.62)% | | | | 29.09% | | | | 28.43% | | | | 27.76% | | | | 24.83% | |
Ratios to average net assets | | | | | | | | | | | | | | | | | | | | |
Expensese | | | 1.52% | | | | 1.48% | | | | 1.47% | | | | 1.53% | | | | 1.54% | |
Net investment income | | | 1.52% | | | | 2.07% | | | | 1.93% | | | | 1.77% | | | | 1.52% | |
| | | | | |
Supplemental data | | | | | | | | | | | | | | | | | | | | |
Net assets, end of year (000’s) | | $ | 234,213 | | | $ | 753,843 | | | $ | 749,120 | | | $ | 651,826 | | | $ | 477,290 | |
Portfolio turnover rate | | | 75.11% | f | | | 98.32% | | | | 53.65% | | | | 31.24% | | | | 55.67% | |
aThe amount shown for a share outstanding throughout the period may not correlate with the Statement of Operations for the period due to the timing of sales and repurchases of the Fund shares in relation to income earned and/or fluctuating market value of the investments of the Fund.
bBased on average daily shares outstanding.
cAmount rounds to less than $0.01 per share.
dTotal return does not include any fees, charges or expenses imposed by the variable annuity and life insurance contracts for which the Franklin Templeton Variable Insurance Products Trust serves as an underlying investment vehicle.
eBenefit of expense reduction rounds to less than 0.01%.
fExcludes the value of portfolio securities delivered as a result of redemptions in-kind. See Note 10.
The accompanying notes are an integral part of these financial statements.
TD-8
Franklin Templeton Variable Insurance Products Trust
Financial Highlights (continued)
Templeton Developing Markets Securities Fund
| | | | | | | | | | | | | | | | | | | | |
| | | Year Ended December 31, | |
| Class 2 | | 2008 | | | 2007 | | | 2006 | | | 2005 | | | 2004 | |
| | | | |
Per share operating performance | | | | | | | | | | | | | | | | | | | | |
(for a share outstanding throughout the year) | | | | | | | | | | | | | | | | | | | | |
Net asset value, beginning of year | | $ | 15.99 | | | $ | 13.79 | | | $ | 10.90 | | | $ | 8.67 | | | $ | 7.09 | |
| | | | |
Income from investment operationsa: | | | | | | | | | | | | | | | | | | | | |
Net investment incomeb | | | 0.15 | | | | 0.27 | | | | 0.20 | | | | 0.14 | | | | 0.09 | |
Net realized and unrealized gains (losses) | | | (7.33 | ) | | | 3.49 | | | | 2.82 | | | | 2.21 | | | | 1.63 | |
| | | | |
Total from investment operations | | | (7.18 | ) | | | 3.76 | | | | 3.02 | | | | 2.35 | | | | 1.72 | |
| | | | |
Less distributions from: | | | | | | | | | | | | | | | | | | | | |
Net investment income | | | (0.33 | ) | | | (0.35 | ) | | | (0.13 | ) | | | (0.12 | ) | | | (0.14 | ) |
Net realized gains | | | (2.44 | ) | | | (1.21 | ) | | | — | | | | — | | | | — | |
| | | | |
Total distributions | | | (2.77 | ) | | | (1.56 | ) | | | (0.13 | ) | | | (0.12 | ) | | | (0.14 | ) |
| | | | |
Redemption fees | | | — | c | | | — | c | | | — | c | | | — | c | | | — | |
| | | | |
Net asset value, end of year | | $ | 6.04 | | | $ | 15.99 | | | $ | 13.79 | | | $ | 10.90 | | | $ | 8.67 | |
| | | | |
| | | | | |
Total returnd | | | (52.70)% | | | | 28.78% | | | | 28.09% | | | | 27.43% | | | | 24.71% | |
Ratios to average net assets | | | | | | | | | | | | | | | | | | | | |
Expensese | | | 1.77% | | | | 1.73% | | | | 1.72% | | | | 1.78% | | | | 1.79% | |
Net investment income | | | 1.27% | | | | 1.82% | | | | 1.68% | | | | 1.52% | | | | 1.27% | |
| | | | | |
Supplemental data | | | | | | | | | | | | | | | | | | | | |
Net assets, end of year (000’s) | | $ | 264,186 | | | $ | 1,090,549 | | | $ | 857,514 | | | $ | 650,646 | | | $ | 327,569 | |
Portfolio turnover rate | | | 75.11% | f | | | 98.32% | | | | 53.65% | | | | 31.24% | | | | 55.67% | |
aThe amount shown for a share outstanding throughout the period may not correlate with the Statement of Operations for the period due to the timing of sales and repurchases of the Fund shares in relation to income earned and/or fluctuating market value of the investments of the Fund.
bBased on average daily shares outstanding.
cAmount rounds to less than $0.01 per share.
dTotal return does not include any fees, charges or expenses imposed by the variable annuity and life insurance contracts for which the Franklin Templeton Variable Insurance Products Trust serves as an underlying investment vehicle.
eBenefit of expense reduction rounds to less than 0.01%.
fExcludes the value of portfolio securities delivered as a result of redemptions in-kind. See Note 10.
The accompanying notes are an integral part of these financial statements.
TD-9
Franklin Templeton Variable Insurance Products Trust
Financial Highlights (continued)
Templeton Developing Markets Securities Fund
| | | | | | | | | | | | | | | | | | | | |
| | | Year Ended December 31, | |
| Class 3 | | 2008 | | | 2007 | | | 2006 | | | 2005 | | | 2004a | |
| | | | |
Per share operating performance | | | | | | | | | | | | | | | | | | | | |
(for a share outstanding throughout the year) | | | | | | | | | | | | | | | | | | | | |
Net asset value, beginning of year | | $ | 15.96 | | | $ | 13.78 | | | $ | 10.90 | | | $ | 8.68 | | | $ | 7.13 | |
| | | | |
Income from investment operationsb: | | | | | | | | | | | | | | | | | | | | |
Net investment incomec | | | 0.11 | | | | 0.24 | | | | 0.20 | | | | 0.04 | | | | 0.08 | |
Net realized and unrealized gains (losses) | | | (7.27 | ) | | | 3.52 | | | | 2.83 | | | | 2.32 | | | | 1.61 | |
| | | | |
Total from investment operations | | | (7.16 | ) | | | 3.76 | | | | 3.03 | | | | 2.36 | | | | 1.69 | |
| | | | |
Less distributions from: | | | | | | | | | | | | | | | | | | | | |
Net investment income | | | (0.34 | ) | | | (0.37 | ) | | | (0.15 | ) | | | (0.14 | ) | | | (0.14 | ) |
Net realized gains | | | (2.44 | ) | | | (1.21 | ) | | | — | | | | — | | | | — | |
| | | | |
Total distributions | | | (2.78 | ) | | | (1.58 | ) | | | (0.15 | ) | | | (0.14 | ) | | | (0.14 | ) |
| | | | |
Redemption fees | | | — | d | | | — | d | | | — | d | | | — | d | | | — | |
| | | | |
Net asset value, end of year | | $ | 6.02 | | | $ | 15.96 | | | $ | 13.78 | | | $ | 10.90 | | | $ | 8.68 | |
| | | | |
| | | | | |
Total returne | | | (52.67)% | | | | 28.70% | | | | 28.17% | | | | 27.45% | | | | 24.15% | |
Ratios to average net assetsf | | | | | | | | | | | | | | | | | | | | |
Expensesg | | | 1.77% | | | | 1.73% | | | | 1.72% | | | | 1.78% | | | | 1.54% | |
Net investment income | | | 1.27% | | | | 1.82% | | | | 1.68% | | | | 1.52% | | | | 1.52% | |
| | | | | |
Supplemental data | | | | | | | | | | | | | | | | | | | | |
Net assets, end of year (000’s) | | $ | 32,953 | | | $ | 100,961 | | | $ | 43,372 | | | $ | 11,521 | | | $ | 12 | |
Portfolio turnover rate | | | 75.11% | h | | | 98.32% | | | | 53.65% | | | | 31.24% | | | | 55.67% | |
aFor the period May 1, 2004 (effective date) to December 31, 2004.
bThe amount shown for a share outstanding throughout the period may not correlate with the Statement of Operations for the period due to the timing of sales and repurchases of the Fund shares in relation to income earned and/or fluctuating market value of the investments of the Fund.
cBased on average daily shares outstanding.
dAmount rounds to less than $0.01 per share.
eTotal return does not include any fees, charges or expenses imposed by the variable annuity and life insurance contracts for which the Franklin Templeton Variable Insurance Products Trust serves as an underlying investment vehicle. Total return is not annualized for periods less than one year.
fRatios are annualized for periods less than one year.
gBenefit of expense reduction rounds to less than 0.01%.
hExcludes the value of portfolio securities delivered as a result of redemptions in-kind. See Note 10.
The accompanying notes are an integral part of these financial statements.
TD-10
Franklin Templeton Variable Insurance Products Trust
Financial Highlights (continued)
Templeton Developing Markets Securities Fund
| | | | |
| Class 4 | | Period Ended
December 31,
2008a | |
Per share operating performance | | | | |
(for a share outstanding throughout the period) | | | | |
Net asset value, beginning of period | | $ | 14.88 | |
| | | | |
Income from investment operationsb: | | | | |
Net investment incomec | | | (0.33 | ) |
Net realized and unrealized gains (losses) | | | (5.65 | ) |
| | | | |
Total from investment operations | | | (5.98 | ) |
| | | | |
Less distributions from: | | | | |
Net investment income | | | (0.37 | ) |
Net realized gains | | | (2.44 | ) |
| | | | |
Total distributions | | | (2.81 | ) |
| | | | |
Redemption feesd | | | — | |
| | | | |
Net asset value, end of period | | $ | 6.09 | |
| | | | |
| |
Total returne | | | (48.66)% | |
Ratios to average net assetsf | | | | |
Expensesg | | | 1.87% | |
Net investment income | | | 1.17% | |
| |
Supplemental data | | | | |
Net assets, end of period (000’s) | | $ | 7,208 | |
Portfolio turnover rate | | | 75.11% | h |
aFor the period February 29, 2008 (effective date) to December 31, 2008.
bThe amount shown for a share outstanding throughout the period may not correlate with the Statement of Operations for the period due to the timing of sales and repurchases of the Fund shares in relation to income earned and/or fluctuating market value of the investments of the Fund.
cBased on average daily shares outstanding.
dAmount rounds to less than $0.01 per share.
eTotal return does not include any fees, charges or expenses imposed by the variable annuity and life insurance contracts for which the Franklin Templeton Variable Insurance Products Trust serves as an underlying investment vehicle. Total return is not annualized for periods less than one year.
fRatios are annualized for periods less than one year.
gBenefit of expense reduction rounds to less than 0.01%.
hExcludes the value of portfolio securities delivered as a result of redemptions in-kind. See Note 10.
The accompanying notes are an integral part of these financial statements.
TD-11
Franklin Templeton Variable Insurance Products Trust
Statement of Investments, December 31, 2008
| | | | | | | |
| Templeton Developing Markets Securities Fund | | Industry | | Shares | | Value |
Common Stocks 90.5% | | | | | | | |
Argentina 0.3% | | | | | | | |
Tenaris SA, ADR | | Energy Equipment & Services | | 76,900 | | $ | 1,613,362 |
| | | | | | | |
Austria 0.4% | | | | | | | |
OMV AG | | Oil, Gas & Consumable Fuels | | 71,698 | | | 1,876,780 |
| | | | | | | |
Brazil 6.0% | | | | | | | |
AES Tiete SA | | Independent Power
Producers & Energy Traders | | 751,894 | | | 4,154,990 |
American Banknote SA | | Commercial Services &
Supplies | | 88,161 | | | 409,475 |
Banco Itau Holding Financeira SA, ADR | | Commercial Banks | | 462,733 | | | 5,367,703 |
Companhia de Bebidas das Americas (AmBev) | | Beverages | | 191,625 | | | 7,020,041 |
Companhia Energetica de Minas Gerais | | Electric Utilities | | 91,255 | | | 987,659 |
Natura Cosmeticos SA | | Personal Products | | 770,848 | | | 6,324,650 |
Souza Cruz SA | | Tobacco | | 433,221 | | | 8,254,503 |
| | | | | | | |
| | | | | | | 32,519,021 |
| | | | | | | |
Chile 1.2% | | | | | | | |
Banco Santander Chile SA, ADR | | Commercial Banks | | 42,400 | | | 1,485,272 |
Cia Cervecerias Unidas SA, ADR | | Beverages | | 102,600 | | | 2,682,990 |
Empresa Nacional de Telecomunicaciones SA | | Diversified Telecommunication
Services | | 93,607 | | | 1,018,013 |
Lan Airlines SA, ADR | | Airlines | | 153,400 | | | 1,234,870 |
| | | | | | | |
| | | | | | | 6,421,145 |
| | | | | | | |
China 23.2% | | | | | | | |
Aluminum Corp. of China Ltd., H | | Metals & Mining | | 6,751,000 | | | 3,553,983 |
Anta Sports Products Ltd. | | Textiles, Apparel & Luxury
Goods | | 1,582,000 | | | 720,557 |
Bank of China Ltd., H | | Commercial Banks | | 19,706,000 | | | 5,390,406 |
China Coal Energy Co., H | | Oil, Gas & Consumable Fuels | | 6,561,000 | | | 5,223,268 |
China Construction Bank Corp., H | | Commercial Banks | | 22,125,000 | | | 12,132,752 |
China Life Insurance Co. Ltd., H | | Insurance | | 2,418,000 | | | 7,347,410 |
China Mobile Ltd. | | Wireless Telecommunication
Services | | 3,010,000 | | | 30,215,736 |
China Molybdenum Co. Ltd., H | | Metals & Mining | | 5,085,000 | | | 2,309,515 |
China Petroleum and Chemical Corp., H | | Oil, Gas & Consumable Fuels | | 3,696,000 | | | 2,236,618 |
China Shenhua Energy Co. Ltd., H | | Oil, Gas & Consumable Fuels | | 2,732,500 | | | 5,782,173 |
China Shipping Development Co. Ltd., H | | Marine | | 2,188,000 | | | 2,173,828 |
CNOOC Ltd. | | Oil, Gas & Consumable Fuels | | 8,192,000 | | | 7,652,716 |
Denway Motors Ltd. | | Automobiles | | 13,725,959 | | | 4,268,220 |
Hidili Industry International Development Ltd. | | Metals & Mining | | 7,413,000 | | | 2,333,839 |
Industrial and Commercial Bank of China Ltd., H | | Commercial Banks | | 24,255,000 | | | 12,768,754 |
Lonking Holdings Ltd. | | Machinery | | 1,508,000 | | | 772,465 |
PetroChina Co. Ltd., H | | Oil, Gas & Consumable Fuels | | 13,162,000 | | | 11,531,313 |
aShanda Interactive Entertainment Ltd., ADR | | Software | | 49,200 | | | 1,592,112 |
Shanghai Industrial Holdings Ltd. | | Industrial Conglomerates | | 299,000 | | | 682,860 |
Tencent Holdings Ltd. | | Internet Software & Services | | 235,400 | | | 1,518,671 |
Yantai Changyu Pioneer Wine Co. Ltd., B | | Beverages | | 158,800 | | | 557,322 |
Zijin Mining Group Co. Ltd., H | | Metals & Mining | | 6,628,000 | | | 4,019,458 |
| | | | | | | |
| | | | | | | 124,783,976 |
| | | | | | | |
TD-12
Franklin Templeton Variable Insurance Products Trust
Statement of Investments, December 31, 2008 (continued)
| | | | | | | |
| Templeton Developing Markets Securities Fund | | Industry | | Shares | | Value |
Common Stocks (continued) | | | | | | | |
Egypt 0.3% | | | | | | | |
Egyptian Financial Group-Hermes Holding | | Capital Markets | | 150,537 | | $ | 470,082 |
El Ezz Aldekhela Steel Alexa Co. | | Metals & Mining | | 943 | | | 136,884 |
Telecom Egypt | | Diversified Telecommunication
Services | | 316,652 | | | 919,289 |
| | | | | | | |
| | | | | | | 1,526,255 |
| | | | | | | |
Hong Kong 1.3% | | | | | | | |
Dairy Farm International Holdings Ltd. | | Food & Staples Retailing | | 1,143,433 | | | 4,882,459 |
VTech Holdings Ltd. | | Communications Equipment | | 520,000 | | | 2,200,717 |
| | | | | | | |
| | | | | | | 7,083,176 |
| | | | | | | |
Hungary 1.8% | | | | | | | |
Magyar Telekom PLC | | Diversified Telecommunication
Services | | 697,762 | | | 1,972,251 |
MOL Hungarian Oil and Gas Nyrt. | | Oil, Gas & Consumable Fuels | | 90,571 | | | 4,705,297 |
aOTP Bank Ltd. | | Commercial Banks | | 185,709 | | | 2,810,292 |
| | | | | | | |
| | | | | | | 9,487,840 |
| | | | | | | |
India 4.2% | | | | | | | |
aBharti Airtel Ltd. | | Wireless Telecommunication
Services | | 31,293 | | | 460,256 |
GAIL India Ltd. | | Gas Utilities | | 1,094,895 | | | 4,639,004 |
Grasim Industries Ltd. | | Construction Materials | | 17,700 | | | 443,392 |
Great Eastern Shipping Co. Ltd. | | Oil, Gas & Consumable Fuels | | 53,200 | | | 222,013 |
Infosys Technologies Ltd. | | IT Services | | 111,690 | | | 2,567,928 |
National Aluminium Co. Ltd. | | Metals & Mining | | 207,878 | | | 811,716 |
Oil & Natural Gas Corp. Ltd. | | Oil, Gas & Consumable Fuels | | 501,303 | | | 6,883,894 |
Shipping Corp. of India Ltd. | | Marine | | 39,046 | | | 63,845 |
Steel Authority of India Ltd. | | Metals & Mining | | 1,112,892 | | | 1,772,799 |
Tata Consultancy Services Ltd. | | IT Services | | 451,250 | | | 4,437,323 |
Union Bank of India Ltd. | | Commercial Banks | | 31,588 | | | 105,900 |
| | | | | | | |
| | | | | | | 22,408,070 |
| | | | | | | |
Indonesia 1.6% | | | | | | | |
PT Astra International Tbk | | Automobiles | | 2,113,500 | | | 2,045,635 |
bPT Bank Central Asia Tbk | | Commercial Banks | | 9,287,000 | | | 2,769,060 |
PT Telekomunikasi Indonesia, B | | Diversified Telecommunication
Services | | 6,119,000 | | | 3,873,495 |
| | | | | | | |
| | | | | | | 8,688,190 |
| | | | | | | |
Israel 0.6% | | | | | | | |
aTaro Pharmaceutical Industries Ltd. | | Pharmaceuticals | | 408,179 | | | 3,142,978 |
| | | | | | | |
Kenya 0.0%c | | | | | | | |
East African Breweries Ltd. | | Beverages | | 87,600 | | | 161,309 |
| | | | | | | |
Kuwait 0.3% | | | | | | | |
Kuwait Projects Co. (Holding) KSC (KIPCO) | | Diversified Financial Services | | 455,000 | | | 807,088 |
National Mobile Telecommunications Co. | | Wireless Telecommunication
Services | | 145,000 | | | 986,823 |
| | | | | | | |
| | | | | | | 1,793,911 |
| | | | | | | |
Luxembourg 0.1% | | | | | | | |
aReinet Investments SCA, GDR | | Textiles, Apparel & Luxury
Goods | | 339,039 | | | 349,859 |
| | | | | | | |
TD-13
Franklin Templeton Variable Insurance Products Trust
Statement of Investments, December 31, 2008 (continued)
| | | | | | | |
| Templeton Developing Markets Securities Fund | | Industry | | Shares | | Value |
Common Stocks (continued) | | | | | | | |
Malaysia 0.1% | | | | | | | |
British American Tobacco Malaysia Bhd. | | Tobacco | | 52,100 | | $ | 671,528 |
| | | | | | | |
Mexico 8.7% | | | | | | | |
Alfa SAB de CV | | Industrial Conglomerates | | 134,375 | | | 289,031 |
America Movil SAB de CV, L, ADR | | Wireless Telecommunication
Services | | 399,258 | | | 12,373,005 |
Fomento Economico Mexicano SAB de CV, ADR | | Beverages | | 59,100 | | | 1,780,683 |
Grupo Televisa SA | | Media | | 3,106,206 | | | 9,263,130 |
Kimberly Clark de Mexico SAB de CV, A | | Household Products | | 2,622,105 | | | 8,794,519 |
Telefonos de Mexico SAB de CV, L, ADR | | Diversified Telecommunication
Services | | 436,464 | | | 9,139,556 |
Wal-Mart de Mexico SAB de CV, V | | Food & Staples Retailing | | 1,846,643 | | | 4,981,830 |
| | | | | | | |
| | | | | | | 46,621,754 |
| | | | | | | |
Oman 0.0%c | | | | | | | |
Oman International Bank | | Commercial Banks | | 200,511 | | | 114,575 |
| | | | | | | |
Pakistan 1.4% | | | | | | | |
Fauji Fertilizer Co. Ltd. | | Chemicals | | 682,143 | | | 512,092 |
MCB Bank Ltd. | | Commercial Banks | | 1,697,858 | | | 2,699,621 |
Oil & Gas Development Co. Ltd. | | Oil, Gas & Consumable Fuels | | 3,030,600 | | | 1,914,688 |
aPakistan Telecommunications Corp., A | | Diversified Telecommunication
Services | | 10,622,908 | | | 2,267,563 |
| | | | | | | |
| | | | | | | 7,393,964 |
| | | | | | | |
Peru 0.3% | | | | | | | |
Credicorp Ltd. | | Commercial Banks | | 33,900 | | | 1,693,644 |
| | | | | | | |
Philippines 0.8% | | | | | | | |
Bank of the Philippine Islands | | Commercial Banks | | 406,200 | | | 339,916 |
Globe Telecom Inc. | | Wireless Telecommunication
Services | | 19,616 | | | 320,378 |
Philippine Long Distance Telephone Co., ADR | | Wireless Telecommunication
Services | | 79,590 | | | 3,736,750 |
| | | | | | | |
| | | | | | | 4,397,044 |
| | | | | | | |
Poland 0.5% | | | | | | | |
Polski Koncern Naftowy Orlen SA | | Oil, Gas & Consumable Fuels | | 315,244 | | | 2,734,414 |
| | | | | | | |
Qatar 0.7% | | | | | | | |
Industries Qatar | | Industrial Conglomerates | | 44,190 | | | 1,221,838 |
Qatar National Bank | | Commercial Banks | | 53,447 | | | 2,496,248 |
| | | | | | | |
| | | | | | | 3,718,086 |
| | | | | | | |
Russia 6.5% | | | | | | | |
a,dCentenergoholding | | Electric Utilities | | 83,988 | | | — |
aFederal Grid Co. | | Electric Utilities | | 122,482,474 | | | 520,551 |
Gazprom, ADR | | Oil, Gas & Consumable Fuels | | 411,200 | | | 5,859,600 |
Gazprom, ADR | | Oil, Gas & Consumable Fuels | | 268,500 | | | 3,807,330 |
aHolding MRSK OAO | | Electric Utilities | | 12,883,188 | | | 399,379 |
aInter Rao Ues OAO | | Electric Utilities | | 539,343,253 | | | 121,352 |
a,dIntergenerasiya Holding Co. | | Electric Utilities | | 233,480 | | | — |
aKuzbassenergo | | Electric Utilities | | 3,317,242 | | | 8,293 |
LUKOIL, ADR | | Oil, Gas & Consumable Fuels | | 75,108 | | | 2,486,075 |
LUKOIL, ADR (London Exchange) | | Oil, Gas & Consumable Fuels | | 137,918 | | | 4,389,930 |
Mechel OAO, ADR | | Metals & Mining | | 106,980 | | | 427,920 |
TD-14
Franklin Templeton Variable Insurance Products Trust
Statement of Investments, December 31, 2008 (continued)
| | | | | | | |
| Templeton Developing Markets Securities Fund | | Industry | | Shares | | Value |
Common Stocks (continued) | | | | | | | |
Russia (continued) | | | | | | | |
Mining and Metallurgical Co. Norilsk Nickel | | Metals & Mining | | 82,587 | | $ | 5,409,448 |
Mobile TeleSystems | | Wireless Telecommunication
Services | | 616,572 | | | 2,361,471 |
Mobile TeleSystems, ADR | | Wireless Telecommunication
Services | | 89,100 | | | 2,377,188 |
aRAO Energy System of East OAO | | Electric Utilities | | 11,225,088 | | | 24,134 |
aRusHydro | | Electric Utilities | | 12,217,338 | | | 255,342 |
Sberbank RF | | Commercial Banks | | 3,331,227 | | | 2,465,108 |
a,dSibenergyholding JSC | | Electric Utilities | | 64,163 | | | — |
aTGK-2 | | Electric Utilities | | 201,053,124 | | | 55,290 |
aTGK-4 | | Electric Utilities | | 245,693,130 | | | 110,562 |
TGK-9 | | Electric Utilities | | 455,076,747 | | | 20,478 |
TNK-BP | | Oil, Gas & Consumable Fuels | | 5,158,522 | | | 3,353,039 |
aWimm-Bill-Dann Foods | | Food Products | | 49,950 | | | 649,350 |
| | | | | | | |
| | | | | | | 35,101,840 |
| | | | | | | |
Singapore 0.9% | | | | | | | |
ComfortDelGro Corp. Ltd. | | Road & Rail | | 802,981 | | | 812,791 |
Fraser and Neave Ltd. | | Industrial Conglomerates | | 1,520,041 | | | 3,130,276 |
Keppel Corp. Ltd. | | Industrial Conglomerates | | 346,895 | | | 1,048,555 |
| | | | | | | |
| | | | | | | 4,991,622 |
| | | | | | | |
South Africa 10.2% | | | | | | | |
ABSA Group Ltd. | | Commercial Banks | | 257,258 | | | 2,959,835 |
Foschini Ltd. | | Specialty Retail | | 1,320,023 | | | 6,740,543 |
Impala Platinum Holdings Ltd. | | Metals & Mining | | 142,412 | | | 2,045,279 |
Kersaf Investments Ltd. | | Hotels, Restaurants & Leisure | | 11,780 | | | 116,985 |
Lewis Group Ltd. | | Specialty Retail | | 886,610 | | | 4,527,370 |
Massmart Holdings Ltd. | | Food & Staples Retailing | | 205,002 | | | 1,844,146 |
MTN Group Ltd. | | Wireless Telecommunication
Services | | 745,408 | | | 8,603,911 |
Naspers Ltd., N | | Media | | 270,666 | | | 4,787,045 |
Pretoria Portland Cement Co. Ltd. | | Construction Materials | | 226,166 | | | 754,288 |
Remgro Ltd. | | Diversified Financial Services | | 532,262 | | | 4,328,309 |
Sasol | | Oil, Gas & Consumable Fuels | | 105,551 | | | 3,144,297 |
The Spar Group Ltd. | | Food & Staples Retailing | | 189,258 | | | 1,147,628 |
Standard Bank Group Ltd. | | Commercial Banks | | 791,294 | | | 6,986,958 |
Telkom South Africa Ltd. | | Diversified Telecommunication
Services | | 273,560 | | | 3,332,194 |
Tiger Brands Ltd. | | Food Products | | 179,985 | | | 2,746,495 |
Truworths International Ltd. | | Specialty Retail | | 290,259 | | | 1,052,961 |
| | | | | | | |
| | | | | | | 55,118,244 |
| | | | | | | |
South Korea 1.8% | | | | | | | |
aKangwon Land Inc. | | Hotels, Restaurants & Leisure | | 512,665 | | | 5,540,679 |
aS1 Corp. | | Commercial Services &
Supplies | | 28,199 | | | 1,205,658 |
SK Telecom Co. Ltd. | | Wireless Telecommunication
Services | | 17,423 | | | 2,883,141 |
| | | | | | | |
| | | | | | | 9,629,478 |
| | | | | | | |
Sweden 0.9% | | | | | | | |
Oriflame Cosmetics SA, SDR | | Personal Products | | 171,074 | | | 4,933,775 |
| | | | | | | |
TD-15
Franklin Templeton Variable Insurance Products Trust
Statement of Investments, December 31, 2008 (continued)
| | | | | | | |
| Templeton Developing Markets Securities Fund | | Industry | | Shares | | Value |
Common Stocks (continued) | | | | | | | |
Taiwan 5.7% | | | | | | | |
MediaTek Inc. | | Semiconductors & Semiconductor
Equipment | | 930,300 | | $ | 6,258,769 |
President Chain Store Corp. | | Food & Staples Retailing | | 4,277,144 | | | 10,231,216 |
Taiwan Mobile Co. Ltd. | | Wireless Telecommunication
Services | | 2,224,000 | | | 3,304,616 |
Taiwan Semiconductor Manufacturing Co. Ltd. | | Semiconductors & Semiconductor
Equipment | | 7,815,857 | | | 10,588,072 |
| | | | | | | |
| | | | | | | 30,382,673 |
| | | | | | | |
Thailand 1.0% | | | | | | | |
Siam Cement Public Co. Ltd., fgn. | | Construction Materials | | 369,579 | | | 1,158,088 |
Thai Beverages Co. Ltd., fgn. | | Beverages | | 31,380,000 | | | 4,271,623 |
| | | | | | | |
| | | | | | | 5,429,711 |
| | | | | | | |
Turkey 5.2% | | | | | | | |
Akbank TAS | | Commercial Banks | | 2,323,684 | | | 7,210,133 |
Anadolu Efes Biracilik Ve Malt Sanayii AS | | Beverages | | 471,649 | | | 3,153,511 |
Tekfen Holding AS | | Diversified Financial Services | | 54,340 | | | 103,001 |
Tupras-Turkiye Petrol Rafinerileri AS | | Oil, Gas & Consumable Fuels | | 842,903 | | | 8,864,024 |
Turkcell Iletisim Hizmetleri AS | | Wireless Telecommunication
Services | | 1,565,495 | | | 8,891,971 |
| | | | | | | |
| | | | | | | 28,222,640 |
| | | | | | | |
United Arab Emirates 0.3% | | | | | | | |
Abu Dhabi Commercial Bank | | Commercial Banks | | 505,027 | | | 244,735 |
First Gulf Bank | | Commercial Banks | | 294,381 | | | 722,899 |
National Bank of Abu Dhabi | | Commercial Banks | | 64,381 | | | 156,871 |
Union National Bank | | Commercial Banks | | 1,114,966 | | | 673,869 |
| | | | | | | |
| | | | | | | 1,798,374 |
| | | | | | | |
United Kingdom 4.2% | | | | | | | |
Anglo American PLC | | Metals & Mining | | 366,240 | | | 8,220,530 |
aBritish American Tobacco PLC | | Tobacco | | 216,127 | | | 5,639,075 |
HSBC Holdings PLC | | Commercial Banks | | 911,548 | | | 8,668,304 |
| | | | | | | |
| | | | | | | 22,527,909 |
| | | | | | | |
Total Common Stocks (Cost $598,883,808) | | | | | | | 487,337,147 |
| | | | | | | |
Preferred Stocks 7.6% | | | | | | | |
Brazil 6.8% | | | | | | | |
Banco Bradesco SA, ADR, pfd. | | Commercial Banks | | 538,013 | | | 5,310,189 |
Companhia Energetica de Minas Gerais, ADR, pfd. | | Electric Utilities | | 222,050 | | | 3,050,967 |
Companhia Vale do Rio Doce, ADR, pfd., A | | Metals & Mining | | 962,575 | | | 10,251,424 |
Itausa - Investimentos Itau SA, pfd. | | Commercial Banks | | 1,032,126 | | | 3,571,972 |
Petroleo Brasileiro SA, ADR, pfd. | | Oil, Gas & Consumable Fuels | | 493,888 | | | 10,080,254 |
Unibanco - Uniao de Bancos Brasileiros SA, GDR, pfd. | | Commercial Banks | | 43,600 | | | 2,817,432 |
Usinas Siderurgicas de Minas Gerais SA, pfd., A | | Metals & Mining | | 125,313 | | | 1,435,861 |
| | | | | | | |
| | | | | | | 36,518,099 |
| | | | | | | |
Chile 0.8% | | | | | | | |
Embotelladora Andina SA, pfd., A | | Beverages | | 1,640,148 | | | 3,020,649 |
Sociedad Quimica y Minera de Chile SA, B, ADR, pfd. | | Chemicals | | 65,793 | | | 1,604,691 |
| | | | | | | |
| | | | | | | 4,625,340 |
| | | | | | | |
Total Preferred Stocks (Cost $29,066,264) | | | | | | | 41,143,439 |
| | | | | | | |
Total Investments before Short Term Investments
(Cost $627,950,072) | | | | | | | 528,480,586 |
| | | | | | | |
TD-16
Franklin Templeton Variable Insurance Products Trust
Statement of Investments, December 31, 2008 (continued)
| | | | | | | |
| Templeton Developing Markets Securities Fund | | | | Shares | | Value |
Short Term Investments (Cost $9,114,367) 1.7% | | | | | | | |
Money Market Funds 1.7% | | | | | | | |
eFranklin Institutional Fiduciary Trust Money Market Portfolio, 0.55% | | | | 9,114,367 | | $ | 9,114,367 |
| | | | | | | |
Total Investments (Cost $637,064,439) 99.8% | | | | | | | 537,594,953 |
Other Assets, less Liabilities 0.2% | | | | | | | 964,624 |
| | | | | | | |
Net Assets 100.0% | | | | | | $ | 538,559,577 |
| | | | | | | |
See Abbreviations on page TD-29
aNon-income producing for the twelve months ended December 31, 2008.
bA portion or all of the security purchased on a delayed delivery basis. See Note 1(c).
cRounds to less than 0.1% of net assets.
dSee Note 9 regarding restricted and illiquid securities.
eSee Note 7 regarding investments in the Franklin Institutional Fiduciary Trust Money Market Portfolio. The rate shown is the annualized seven-day yield at period end.
The accompanying notes are an integral part of these financial statements.
TD-17
Franklin Templeton Variable Insurance Products Trust
Financial Statements
Statement of Assets and Liabilities
December 31, 2008
| | | | |
| | | Templeton
Developing Markets
Securities Fund | |
Assets: | | | | |
Investments in securities: | | | | |
Cost - Unaffiliated issuers | | $ | 627,950,072 | |
Cost - Sweep Money Fund (Note 7) | | | 9,114,367 | |
| | | | |
Total cost of investments | | $ | 637,064,439 | |
| | | | |
Value - Unaffiliated issuers | | $ | 528,480,586 | |
Value - Sweep Money Fund (Note 7) | | | 9,114,367 | |
| | | | |
Total value of investments | | | 537,594,953 | |
Cash | | | 54,198 | |
Receivables: | | | | |
Investment securities sold | | | 637,301 | |
Capital shares sold | | | 864,777 | |
Dividends | | | 2,461,248 | |
Foreign tax | | | 244,317 | |
Other assets | | | 1,819 | |
| | | | |
Total assets | | | 541,858,613 | |
| | | | |
Liabilities: | | | | |
Payables: | | | | |
Investment securities purchased | | | 1,078,612 | |
Capital shares redeemed | | | 632,277 | |
Affiliates | | | 753,692 | |
Custodian fees | | | 560,000 | |
Reports to shareholders | | | 195,010 | |
Foreign currency advanced by custodian | | | 15,832 | |
Accrued expenses and other liabilities | | | 63,613 | |
| | | | |
Total liabilities | | | 3,299,036 | |
| | | | |
Net assets, at value | | $ | 538,559,577 | |
| | | | |
Net assets consist of: | | | | |
Paid-in capital | | $ | 781,602,355 | |
Undistributed net investment income | | | 20,812,671 | |
Net unrealized appreciation (depreciation) | | | (99,483,906 | ) |
Accumulated net realized gain (loss) | | | (164,371,543 | ) |
| | | | |
Net assets, at value | | $ | 538,559,577 | |
| | | | |
The accompanying notes are an integral part of these financial statements.
TD-18
Franklin Templeton Variable Insurance Products Trust
Financial Statements (continued)
Statement of Assets and Liabilities (continued)
December 31, 2008
| | | |
| | | Templeton
Developing Markets
Securities Fund |
Class 1: | | | |
Net assets, at value | | $ | 234,213,364 |
| | | |
Shares outstanding | | | 38,313,582 |
| | | |
Net asset value and maximum offering price per share | | $ | 6.11 |
| | | |
Class 2: | | | |
Net assets, at value | | $ | 264,185,500 |
| | | |
Shares outstanding | | | 43,743,378 |
| | | |
Net asset value and maximum offering price per share | | $ | 6.04 |
| | | |
Class 3: | | | |
Net assets, at value | | $ | 32,953,194 |
| | | |
Shares outstanding | | | 5,475,906 |
| | | |
Net asset value and maximum offering price per sharea | | $ | 6.02 |
| | | |
Class 4: | | | |
Net assets, at value | | $ | 7,207,519 |
| | | |
Shares outstanding | | | 1,183,840 |
| | | |
Net asset value and maximum offering price per share | | $ | 6.09 |
| | | |
aRedemption price is equal to net asset value less any redemption fees retained by the Fund.
The accompanying notes are an integral part of these financial statements.
TD-19
Franklin Templeton Variable Insurance Products Trust
Financial Statements (continued)
Statement of Operations
for the year ended December 31, 2008
| | | | |
| | | Templeton
Developing Markets
Securities Fund | |
Investment income: | | | | |
Dividends (net of foreign taxes of $3,598,866) | | | | |
Unaffiliated issuers | | $ | 36,808,539 | |
Sweep Money Fund (Note 7) | | | 772,771 | |
Interest (net of foreign taxes of $2,706) | | | 695,218 | |
| | | | |
Total investment income | | | 38,276,528 | |
| | | | |
Expenses: | | | | |
Management fees (Note 3a) | | | 15,498,233 | |
Administrative fees (Note 3b) | | | 1,479,249 | |
Interest expense | | | 762 | |
Distribution fees: (Note 3c) | | | | |
Class 2 | | | 1,730,817 | |
Class 3 | | | 162,351 | |
Class 4 | | | 10,328 | |
Unaffiliated transfer agent fees | | | 3,690 | |
Custodian fees (Note 4) | | | 1,617,225 | |
Reports to shareholders | | | 373,274 | |
Professional fees | | | 127,494 | |
Trustees’ fees and expenses | | | 7,415 | |
Other | | | 50,752 | |
| | | | |
Total expenses | | | 21,061,590 | |
Expense reductions (Note 4) | | | (15,711 | ) |
| | | | |
Net expenses | | | 21,045,879 | |
| | | | |
Net investment income | | | 17,230,649 | |
| | | | |
Realized and unrealized gains (losses): | | | | |
Net realized gain (loss) from: | | | | |
Investments (includes gains from redemptions in-kind of $8,268,018) (Note 10) | | | (129,701,865 | ) |
Foreign currency transactions | | | (1,478,076 | ) |
| | | | |
Net realized gain (loss) | | | (131,179,941 | ) |
| | | | |
Net change in unrealized appreciation (depreciation) on: | | | | |
Investments | | | (762,056,370 | ) |
Translation of other assets and liabilities denominated in foreign currencies | | | (85,682 | ) |
Change in deferred taxes on unrealized appreciation (depreciation) | | | 714,983 | |
| | | | |
Net change in unrealized appreciation (depreciation) | | | (761,427,069 | ) |
| | | | |
Net realized and unrealized gain (loss) | | | (892,607,010 | ) |
| | | | |
Net increase (decrease) in net assets resulting from operations | | $ | (875,376,361 | ) |
| | | | |
The accompanying notes are an integral part of these financial statements.
TD-20
Franklin Templeton Variable Insurance Products Trust
Financial Statements (continued)
Statements of Changes in Net Assets
| | | | | | | | |
| | | Templeton Developing
Markets Securities Fund | |
| | | Year Ended December 31, | |
| | | 2008 | | | 2007 | |
| | | | |
Increase (decrease) in net assets: | | | | | | | | |
Operations: | | | | | | | | |
Net investment income | | $ | 17,230,649 | | | $ | 34,222,790 | |
Net realized gain (loss) from investments and foreign currency transactions | | | (131,179,941 | ) | | | 258,984,939 | |
Net change in unrealized appreciation (depreciation) on investments, translation of assets and liabilities denominated in foreign currencies, and deferred taxes | | | (761,427,069 | ) | | | 150,591,207 | |
| | | | |
Net increase (decrease) in net assets resulting from operations | | | (875,376,361 | ) | | | 443,798,936 | |
| | | | |
Distributions to shareholders from: | | | | | | | | |
Net investment income: | | | | | | | | |
Class 1 | | | (15,246,189 | ) | | | (18,593,912 | ) |
Class 2 | | | (18,272,202 | ) | | | (20,981,252 | ) |
Class 3 | | | (1,805,309 | ) | | | (1,312,631 | ) |
Class 4 | | | (58,997 | ) | | | — | |
Net realized gains: | | | | | | | | |
Class 1 | | | (101,141,199 | ) | | | (58,468,438 | ) |
Class 2 | | | (136,962,950 | ) | | | (72,094,329 | ) |
Class 3 | | | (13,097,616 | ) | | | (4,338,794 | ) |
Class 4 | | | (391,385 | ) | | | — | |
| | | | |
Total distributions to shareholders | | | (286,975,847 | ) | | | (175,789,356 | ) |
| | | | |
Capital share transactions: (Note 2) | | | | | | | | |
Class 1 | | | (54,850,288 | ) | | | (114,240,767 | ) |
Class 2 | | | (192,193,242 | ) | | | 94,364,085 | |
Class 3 | | | (8,380,444 | ) | | | 47,175,082 | |
Class 4 | | | 10,948,393 | | | | — | |
| | | | |
Total capital share transactions | | | (244,475,581 | ) | | | 27,298,400 | |
| | | | |
Redemption fees | | | 34,017 | | | | 39,617 | |
| | | | |
Net increase (decrease) in net assets | | | (1,406,793,772 | ) | | | 295,347,597 | |
Net assets: | | | | | | | | |
Beginning of year | | | 1,945,353,349 | | | | 1,650,005,752 | |
| | | | |
End of year | | $ | 538,559,577 | | | $ | 1,945,353,349 | |
| | | | |
Undistributed net investment income included in net assets: | | | | | | | | |
End of year | | $ | 20,812,671 | | | $ | 18,501,125 | |
| | | | |
The accompanying notes are an integral part of these financial statements.
TD-21
Franklin Templeton Variable Insurance Products Trust
Notes to Financial Statements
Templeton Developing Markets Securities Fund
1. ORGANIZATION AND SIGNIFICANT ACCOUNTING POLICIES
Franklin Templeton Variable Insurance Products Trust (Trust) is registered under the Investment Company Act of 1940, as amended, (1940 Act) as an open-end investment company, consisting of twenty-three separate funds. The Templeton Developing Markets Securities Fund (Fund) is included in this report. The financial statements of the remaining funds in the Trust are presented separately. Shares of the Fund are sold only to insurance company separate accounts to fund the benefits of variable life insurance policies or variable annuity contracts. The Fund offers four classes of shares: Class 1, Class 2, Class 3, and Class 4. Effective February 29, 2008, the Fund began offering a new class of shares, Class 4. Each class of shares differs by its distribution fees, voting rights on matters affecting a single class and its exchange privilege.
The following summarizes the Fund’s significant accounting policies.
a. Security Valuation
Securities listed on a securities exchange or on the NASDAQ National Market System are valued at the last quoted sale price or the official closing price of the day, respectively. Over-the-counter securities and listed securities for which there is no reported sale are valued within the range of the most recent quoted bid and ask prices. Securities that trade in multiple markets or on multiple exchanges are valued according to the broadest and most representative market. Investments in open-end mutual funds are valued at the closing net asset value.
Foreign securities are valued as of the close of trading on the foreign stock exchange on which the security is primarily traded, or the NYSE, whichever is earlier. If no sale is reported at that time, the foreign security will be valued within the range of the most recent quoted bid and ask prices. The value is then converted into its U.S. dollar equivalent at the foreign exchange rate in effect at the close of the NYSE on the day that the value of the foreign security is determined.
The Trust has procedures to determine the fair value of individual securities and other assets for which market prices are not readily available or which may not be reliably priced. Methods for valuing these securities may include: fundamental analysis, matrix pricing, discounts from market prices of similar securities, or discounts applied due to the nature and duration of restrictions on the disposition of the securities. Due to the inherent uncertainty of valuations of such securities, the fair values may differ significantly from the values that would have been used had a ready market for such investments existed. Occasionally, events occur between the time at which trading in a security is completed and the close of the NYSE that might call into question the availability (including the reliability) of the value of a portfolio security held by the Fund. The investment manager monitors price movements following the close of trading in foreign stock markets through a series of country specific market proxies (such as baskets of American Depository Receipts, futures contracts and exchange traded funds). These price movements are measured against established trigger thresholds for each specific market proxy to assist in determining if an event has occurred. If such an event occurs, the securities may be valued using fair value procedures, which may include the use of independent pricing services. At December 31, 2008, a portion of the securities held by the Fund were fair valued. All security valuation procedures are approved by the Trust’s Board of Trustees.
b. Foreign Currency Translation
Portfolio securities and other assets and liabilities denominated in foreign currencies are translated into U.S. dollars based on the exchange rate of such currencies against U.S. dollars on the date of valuation. Purchases and sales of securities, income and expense items denominated in foreign currencies are translated into U.S. dollars at the exchange rate in effect on the transaction date. Occasionally, events may impact the availability or reliability of foreign exchange rates used to convert the U.S. dollar equivalent value. If such an event occurs, the foreign exchange rate will be valued at fair value using procedures established and approved by the Trust’s Board of Trustees.
The Fund does not separately report the effect of changes in foreign exchange rates from changes in market prices on securities held. Such changes are included in net realized and unrealized gain or loss from investments on the Statement of Operations.
TD-22
Franklin Templeton Variable Insurance Products Trust
Notes to Financial Statements (continued)
Templeton Developing Markets Securities Fund
1. ORGANIZATION AND SIGNIFICANT ACCOUNTING POLICIES (continued)
b. Foreign Currency Translation (continued)
Realized foreign exchange gains or losses arise from sales of foreign currencies, currency gains or losses realized between the trade and settlement dates on securities transactions and the difference between the recorded amounts of dividends, interest, and foreign withholding taxes and the U.S. dollar equivalent of the amounts actually received or paid. Net unrealized foreign exchange gains and losses arise from changes in foreign exchange rates on foreign denominated assets and liabilities other than investments in securities held at the end of the reporting period.
c. Securities Purchased on a Delayed Delivery Basis
The Fund may purchase securities on a delayed delivery basis, with payment and delivery scheduled for a future date. These transactions are subject to market fluctuations and are subject to the risk that the value at delivery may be more or less than the trade date purchase price. Although the Fund will generally purchase these securities with the intention of holding the securities, it may sell the securities before the settlement date. Sufficient assets have been segregated for these securities.
d. Foreign Currency Contracts
When the Fund purchases or sells foreign securities it may enter into foreign exchange contracts to minimize foreign exchange risk from the trade date to the settlement date of the transactions. A foreign exchange contract is an agreement between two parties to exchange different currencies at an agreed upon exchange rate at a future date. Realized and unrealized gains and losses on these contracts are included in the Statement of Operations.
The risks of these contracts include movement in the values of the foreign currencies relative to the U.S. dollar and the possible inability of the counterparties to fulfill their obligations under the contracts, which may be in excess of the amount reflected in the Statement of Assets and Liabilities.
e. Income and Deferred Taxes
No provision has been made for U.S. income taxes because it is the Fund’s policy to qualify as a regulated investment company under the Internal Revenue Code and to distribute to shareholders substantially all of its taxable income and net realized gains.
Foreign securities held by the Fund may be subject to foreign taxation on dividend and interest income received. Foreign taxes, if any, are recorded based on the tax regulations and rates that exist in the foreign markets in which the Fund invests.
The Fund may be subject to a tax imposed on net realized gains on securities of certain foreign countries. The Fund records an estimated deferred tax liability for net unrealized gains on these securities in an amount that would be payable if the securities were disposed of on the valuation date.
The Fund has reviewed the tax positions, taken on federal income tax returns, for each of the three open tax years and as of December 31, 2008, and has determined that no provision for income tax is required in the Fund’s financial statements.
f. Security Transactions, Investment Income, Expenses and Distributions
Security transactions are accounted for on trade date. Realized gains and losses on security transactions are determined on a specific identification basis. Estimated expenses are accrued daily. Dividend income is recorded on the ex-dividend date except that certain dividends from foreign securities are recognized as soon as the Fund is notified of the ex-dividend date. Distributions to shareholders are recorded on the ex-dividend date and are determined according to income tax regulations (tax basis). Distributable earnings determined on a tax basis may differ from earnings recorded in accordance with accounting principles
TD-23
Franklin Templeton Variable Insurance Products Trust
Notes to Financial Statements (continued)
Templeton Developing Markets Securities Fund
1. ORGANIZATION AND SIGNIFICANT ACCOUNTING POLICIES (continued)
f. Security Transactions, Investment Income, Expenses and Distributions (continued)
generally accepted in the United States of America. These differences may be permanent or temporary. Permanent differences are reclassified among capital accounts to reflect their tax character. These reclassifications have no impact on net assets or the results of operations. Temporary differences are not reclassified, as they may reverse in subsequent periods.
Common expenses incurred by the Trust are allocated among the funds based on the ratio of net assets of each fund to the combined net assets of the Trust. Fund specific expenses are charged directly to the fund that incurred the expense.
Realized and unrealized gains and losses and net investment income, not including class specific expenses, are allocated daily to each class of shares based upon the relative proportion of net assets of each class. Differences in per share distributions, by class, are generally due to differences in class specific expenses.
g. Accounting Estimates
The preparation of financial statements in accordance with accounting principles generally accepted in the United States of America requires management to make estimates and assumptions that affect the reported amounts of assets and liabilities at the date of the financial statements and the amounts of income and expenses during the reporting period. Actual results could differ from those estimates.
h. Redemption Fees
Redemptions and exchanges of Class 3 shares held 60 days or less may be subject to the Fund’s redemption fee, which is 1% of the amount redeemed. Such fees are retained by the Fund and accounted for as an addition to paid-in capital.
i. Guarantees and Indemnifications
Under the Trust’s organizational documents, its officers and trustees are indemnified by the Trust against certain liabilities arising out of the performance of their duties to the Trust. Additionally, in the normal course of business, the Trust, on behalf of the Fund, enters into contracts with service providers that contain general indemnification clauses. The Trust’s maximum exposure under these arrangements is unknown as this would involve future claims that may be made against the Trust that have not yet occurred. Currently, the Trust expects the risk of loss to be remote.
2. SHARES OF BENEFICIAL INTEREST
At December 31, 2008, there were an unlimited number of shares authorized (without par value). Transactions in the Fund’s shares were as follows:
| | | | | | | | | | | | | | |
| | | Year Ended December 31, | |
| | | 2008a | | | 2007 | |
| Class 1 Shares: | | Shares | | | Amount | | | Shares | | | Amount | |
Shares sold | | 2,353,700 | | | $ | 25,940,524 | | | 4,490,443 | | | $ | 69,191,583 | |
Shares issued in reinvestment of distributions | | 10,523,272 | | | | 116,387,388 | | | 5,385,210 | | | | 77,062,349 | |
Shares redeemed in-kind (Note 10) | | (4,035,054 | ) | | | (26,002,704 | ) | | — | | | | — | |
Shares redeemed | | (17,164,161 | ) | | | (171,175,496 | ) | | (17,058,565 | ) | | | (260,494,699 | ) |
| | | | |
Net increase (decrease) | | (8,322,243 | ) | | $ | (54,850,288 | ) | | (7,182,912 | ) | | $ | (114,240,767 | ) |
| | | | |
TD-24
Franklin Templeton Variable Insurance Products Trust
Notes to Financial Statements (continued)
Templeton Developing Markets Securities Fund
2. SHARES OF BENEFICIAL INTEREST (continued)
| | | | | | | | | | | | | | |
| | | Year Ended December 31, | |
| | | 2008a | | | 2007 | |
| Class 2 Shares: | | Shares | | | Amount | | | Shares | | | Amount | |
Shares sold | | 11,623,915 | | | $ | 125,237,066 | | | 16,188,250 | | | $ | 242,521,079 | |
Shares issued in reinvestment of distributions | | 14,189,685 | | | | 155,235,152 | | | 6,563,863 | | | | 93,075,581 | |
Shares redeemed in-kind (Note 10) | | (16,334,498 | ) | | | (160,666,736 | ) | | — | | | | — | |
Shares redeemed | | (33,921,710 | ) | | | (311,998,724 | ) | | (16,746,979 | ) | | | (241,232,575 | ) |
| | | | |
Net increase (decrease) | | (24,442,608 | ) | | $ | (192,193,242 | ) | | 6,005,134 | | | $ | 94,364,085 | |
| | | | |
| Class 3 Shares: | | | | | | | | | | | | |
Shares sold | | 1,019,532 | | | $ | 12,310,616 | | | 4,138,936 | | | $ | 61,021,476 | |
Shares issued in reinvestment of distributions | | 1,367,241 | | | | 14,902,925 | | | 399,394 | | | | 5,651,425 | |
Shares redeemed | | (3,236,638 | ) | | | (35,593,985 | ) | | (1,360,665 | ) | | | (19,497,819 | ) |
| | | | |
Net increase (decrease) | | (849,865 | ) | | $ | (8,380,444 | ) | | 3,177,665 | | | $ | 47,175,082 | |
| | | | |
| Class 4 Shares: | | | | | | | | | | | | |
Shares sold | | 1,437,741 | | | $ | 12,416,230 | | | | | | | | |
Shares issued on reinvestment of distributions | | 40,710 | | | | 449,439 | | | | | | | | |
Shares redeemed | | (294,611 | ) | | | (1,917,276 | ) | | | | | | | |
| | | | | | | | | | |
Net increase (decrease) | | 1,183,840 | | | $ | 10,948,393 | | | | | | | | |
| | | | | | | | | | |
aFor | the period February 29, 2008 (effective date) to December 31, 2008 for Class 4. |
3. TRANSACTIONS WITH AFFILIATES
Franklin Resources, Inc. is the holding company for various subsidiaries that together are referred to as Franklin Templeton Investments. Certain officers and trustees of the Trust are also officers and/or directors of the following subsidiaries:
| | |
| Subsidiary | | Affiliation |
Templeton Asset Management Ltd. (TAML) | | Investment manager |
Franklin Templeton Services, LLC (FT Services) | | Administrative manager |
Franklin Templeton Distributors, Inc. (Distributors) | | Principal underwriter |
Franklin Templeton Investor Services, LLC (Investor Services) | | Transfer agent |
a. Management Fees
The Fund pays an investment management fee to TAML based on the average daily net assets of the Fund as follows:
| | |
| Annualized Fee Rate | | Net Assets |
| 1.250% | | Up to and including $1 billion |
| 1.200% | | Over $1 billion, up to and including $5 billion |
| 1.150% | | Over $5 billion, up to and including $10 billion |
| 1.100% | | Over $10 billion, up to and including $15 billion |
| 1.050% | | Over $15 billion, up to and including $20 billion |
| 1.000% | | In excess of $20 billion |
TD-25
Franklin Templeton Variable Insurance Products Trust
Notes to Financial Statements (continued)
Templeton Developing Markets Securities Fund
3. TRANSACTIONS WITH AFFILIATES (continued)
b. Administrative Fees
The Fund pays an administrative fee to FT Services based on the Fund’s average daily net assets as follows:
| | |
| Annualized Fee Rate | | Net Assets |
| 0.150% | | Up to and including $200 million |
| 0.135% | | Over $200 million, up to and including $700 million |
| 0.100% | | Over $700 million, up to and including $1.2 billion |
| 0.075% | | In excess of $1.2 billion |
c. Distribution Fees
The Fund’s Board of Trustees has adopted distribution plans for Class 2, Class 3, and Class 4 shares pursuant to Rule 12b-1 under the 1940 Act. Under the Fund’s compensation distribution plans, the Fund pays Distributors for costs incurred in connection with the servicing, sale and distribution of the Fund’s shares up to 0.25%, 0.35%, and 0.35% per year of its average daily net assets of Class 2, Class 3, and Class 4, respectively. The Board of Trustees has agreed to limit the current rate to 0.25% per year for Class 3.
d. Transfer Agent Fees
Investor Services, under terms of an agreement, performs shareholder servicing for the Fund and is not paid by the Fund for the services.
4. EXPENSE OFFSET ARRANGEMENT
The Fund has entered into an arrangement with its custodian whereby credits realized as a result of uninvested cash balances are used to reduce a portion of the Fund’s custodian expenses. During the year ended December 31, 2008, the custodian fees were reduced as noted in the Statement of Operations.
5. INCOME TAXES
For tax purposes, realized capital losses and realized currency losses occurring subsequent to October 31, may be deferred and treated as occurring on the first day of the following fiscal year. At December 31, 2008, the Fund deferred realized capital losses and realized currency losses of $152,508,979, and 229,868, respectively.
The tax character of distributions paid during the years ended December 31, 2008 and 2007, was as follows:
| | | | | | |
| | | 2008 | | 2007 |
Distributions paid from: | | | | | | |
Ordinary Income | | $ | 55,303,760 | | $ | 46,036,795 |
Long term capital gain | | | 231,672,087 | | | 129,752,561 |
| | | |
| | $ | 286,975,847 | | $ | 175,789,356 |
| | | |
TD-26
Franklin Templeton Variable Insurance Products Trust
Notes to Financial Statements (continued)
Templeton Developing Markets Securities Fund
5. INCOME TAXES (continued)
At December 31, 2008, the cost of investments, net unrealized appreciation (depreciation),[ undistributed ordinary income and undistributed long term capital gains] for income tax purposes were as follows:
| | | | |
Cost of investments | | $ | 658,896,959 | |
| | | | |
| |
Unrealized appreciation | | $ | 55,489,682 | |
Unrealized depreciation | | | (176,791,688 | ) |
| | | | |
Net unrealized appreciation (depreciation) | | $ | (121,302,006 | ) |
| | | | |
Undistributed ordinary income | | $ | 28,293,176 | |
Undistributed long term capital gains | | | 2,719,265 | |
| | | | |
Distributable earnings | | $ | 31,012,441 | |
| | | | |
Net investment income differs for financial statement and tax purposes primarily due to differing treatments of foreign currency transactions, passive foreign investment company shares, and foreign capital gains tax.
Net realized gains (losses) differ for financial statement and tax purposes primarily due to differing treatments of wash sales, foreign currency transactions, passive foreign investment company shares, foreign capital gains tax, and gains realized on in-kind shareholder redemptions.
6. INVESTMENT TRANSACTIONS
Purchases and sales of investments (excluding short term securities) for the year ended December 31, 2008, aggregated $902,227,649 and $1,187,010,215, respectively. Sales of investments excludes redemptions in-kind of $186,669,440.
7. INVESTMENTS IN FRANKLIN INSTITUTIONAL FIDUCIARY TRUST MONEY MARKET PORTFOLIO
The Fund may invest in the Franklin Institutional Fiduciary Trust Money Market Portfolio (Sweep Money Fund), an open-end investment company managed by Franklin Advisers, Inc. (an affiliate of the investment manager). Management fees paid by the Fund are reduced on assets invested in the Sweep Money Fund, in an amount not to exceed the management and administrative fees paid by the Sweep Money Fund.
8. CONCENTRATION OF RISK
Investing in foreign securities may include certain risks and considerations not typically associated with investing in U.S. securities, such as fluctuating currency values and changing local and regional economic, political and social conditions, which may result in greater market volatility. In addition, certain foreign securities may not be as liquid as U.S. securities.
9. RESTRICTED SECURITIES
The Fund may invest in securities that are restricted under the Securities Act of 1933 (1933 Act) or which are subject to legal, contractual, or other agreed upon restrictions on resale. Restricted securities are often purchased in private placement transactions, and cannot be sold without prior registration unless the sale is pursuant to an exemption under the 1933 Act. Disposal of these securities may require greater effort and expense, and prompt sale at an acceptable price may be difficult. The Fund may have registration rights for restricted securities. The issuer generally incurs all registration costs.
TD-27
Franklin Templeton Variable Insurance Products Trust
Notes to Financial Statements (continued)
Templeton Developing Markets Securities Fund
9. RESTRICTED SECURITIES (continued)
At December 31, 2008, the Fund held investments in restricted securities, excluding 144A securities deemed to be liquid, valued in accordance with procedures approved by the Fund’s Board of Trustees as reflecting fair value, as follows:
| | | | | | | | | | |
| Shares | | Issuer | | Acquisition
Date | | Cost | | Value |
| 83,988 | | Centenergoholding | | 7/1/08 | | $ | — | | $ | — |
| 233,480 | | Intergenerasiya Holding Co. | | 7/1/08 | | | — | | | — |
| 64,163 | | Sibenergoholding JSC | | 7/1/08 | | | — | | | — |
| | | | | | | | | | |
| | Total Restricted Securities (0.00% of Net Assets) | | | | | | | $ | — |
| | | | | | | | | | |
10. REDEMPTION IN-KIND
During the year ended December 31, 2008, the Fund realized $8,268,018 of net gains resulting from redemptions in-kind in which a shareholder redeemed fund shares for securities held by the Fund rather than for cash. Because such gains are not taxable to the Fund, and are not distributed to remaining shareholders, they have been reclassified from accumulated net realized gains to paid-in capital.
11. FAIR VALUE MEASUREMENTS
The Fund adopted Financial Accounting Standards Board (FASB) Statement No. 157, “Fair Value Measurement” (SFAS 157), on January 1, 2008. SFAS 157 defines fair value, establishes a framework for measuring fair value, and expands disclosures about fair value measurements. The Fund has determined that the implementation of SFAS 157 did not have a material impact on the Fund’s financial statements.
SFAS 157 establishes a fair value hierarchy that distinguishes between market data obtained from independent sources (observable inputs) and the Fund’s own market assumptions (unobservable inputs). These inputs are used in determining the value of the Fund’s investments and are summarized in the following fair value hierarchy:
| | • | | Level 1 – quoted prices in active markets for identical securities |
| | • | | Level 2 – other significant observable inputs (including quoted prices for similar securities, interest rates, prepayment speed, credit risk, etc.) |
| | • | | Level 3 – significant unobservable inputs (including the Fund’s own assumptions in determining the fair value of investments) |
The inputs or methodology used for valuing securities are not an indication of the risk associated with investing in those securities.
The following is a summary of the inputs used as of December 31, 2008, in valuing the Fund’s assets carried at fair value:
| | | | | | | | | | | | |
| | | Level 1 | | Level 2 | | Level 3 | | Total |
Assets: | | | | | | | | | | | | |
Investments in Securities | | $ | 536,934,659 | | $ | 660,294 | | $ | — | | $ | 537,594,953 |
TD-28
Franklin Templeton Variable Insurance Products Trust
Notes to Financial Statements (continued)
Templeton Developing Markets Securities Fund
12. NEW ACCOUNTING PRONOUNCEMENT
In March 2008, FASB issued FASB Statement No. 161, “Disclosures about Derivative Instruments and Hedging Activities, an amendment of FASB Statement No. 133” (SFAS 161), which expands disclosures about derivative investments and hedging activities. SFAS 161 is effective for fiscal years and interim periods beginning after November 15, 2008. The Fund is currently evaluating the impact, if any, of applying the various provisions of SFAS 161.
13. SUBSEQUENT EVENT
On January 23, 2009, the Fund entered into, along with certain other funds managed by Franklin Templeton Investments (individually, “Borrower”; collectively “Borrowers”), a $725 million senior unsecured syndicated global line of credit (“Global Credit Facility”) to provide a source of funds to the Borrowers for temporary and emergency purposes and to meet future unanticipated or unusually large redemption requests.
Under the terms of the Global Credit Facility, each Borrower has agreed to pay its proportionate share of fees and expenses incurred in connection with the implementation and maintenance of the Global Credit Facility.
ABBREVIATIONS
Selected Portfolio
ADR - American Depository Receipt
GDR - Global Depository Receipt
TD-29
Franklin Templeton Variable Insurance Products Trust
Templeton Developing Markets Securities Fund
Report of Independent Registered Public Accounting Firm
To the Board of Trustees and Shareholders of Franklin Templeton Variable Insurance Products Trust
In our opinion, the accompanying statement of assets and liabilities, including the statement of investments, and the related statements of operations and of changes in net assets and the financial highlights present fairly, in all material respects, the financial position of Templeton Developing Markets Securities Fund (one of the funds constituting the Franklin Templeton Variable Insurance Products Trust, hereafter referred to as the “Fund”) at December 31, 2008, the results of its operations for the year then ended, the changes in its net assets for each of the two years in the period then ended and the financial highlights for the periods presented, in conformity with accounting principles generally accepted in the United States of America. These financial statements and financial highlights (hereafter referred to as “financial statements”) are the responsibility of the Fund’s management. Our responsibility is to express an opinion on these financial statements based on our audits. We conducted our audits of these financial statements in accordance with the standards of the Public Company Accounting Oversight Board (United States). Those standards require that we plan and perform the audit to obtain reasonable assurance about whether the financial statements are free of material misstatement. An audit includes examining, on a test basis, evidence supporting the amounts and disclosures in the financial statements, assessing the accounting principles used and significant estimates made by management, and evaluating the overall financial statement presentation. We believe that our audits, which included confirmation of securities at December 31, 2008 by correspondence with the custodian and brokers, provide a reasonable basis for our opinion.
PricewaterhouseCoopers LLP
San Francisco, California
February 10, 2009
TD-30
Franklin Templeton Variable Insurance Products Trust
Tax Designation (unaudited)
Templeton Developing Markets Securities Fund
Under Section 852(b)(3)(C) of the Internal Revenue Code (Code), the Fund designates the maximum amount allowable but no less than $231,672,087 as a long term capital gain dividend for the fiscal year ended December 31, 2008.
At December 31, 2008, more than 50% of the Fund’s total assets were invested in securities of foreign issuers. In most instances, foreign taxes were withheld from income paid to the Fund on these investments. The Fund elects to treat foreign taxes paid as allowed under Section 853 of the Code. This election will allow shareholders of record as of the 2009 distribution date, to treat their proportionate share of foreign taxes paid by the Fund as having been paid directly by them. The shareholder shall consider these amounts as foreign taxes paid in the tax year in which they receive the Fund distribution.
TD-31
TEMPLETON FOREIGN SECURITIES FUND
This annual report for Templeton Foreign Securities Fund covers the fiscal year ended December 31, 2008.
Performance Summary as of 12/31/08
Average annual total return of Class 1 shares* represents the average annual change in value, assuming reinvestment of dividends and capital gains. Average returns smooth out variations in returns, which can be significant; they are not the same as year-by-year results.
Periods ended 12/31/08
| | | | | | |
| | | 1-Year | | 5-Year | | 10-Year |
Average Annual Total Return | | -40.23% | | +2.03% | | +2.00% |
*Performance prior to the 5/1/00 merger reflects historical performance of Templeton International Fund.
Total Return Index Comparison
for a Hypothetical $10,000 Investment (1/1/99–12/31/08)
The graph below shows the change in value of a hypothetical $10,000 investment in the Fund over the indicated period and includes reinvestment of any income or distributions. The Fund’s performance* is compared to the performance of the Morgan Stanley Capital International (MSCI) Europe, Australasia, Far East (EAFE) Index. One cannot invest directly in an index, nor is an index representative of the Fund’s portfolio. Please see Important Notes to Performance Information preceding the Fund Summaries.
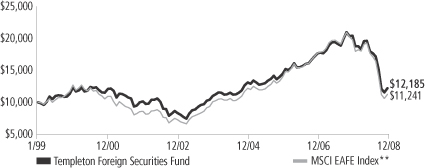
**Source: © 2009 Morningstar. Please see Index Descriptions following the Fund Summaries.
Templeton Foreign Securities Fund – Class 1
Performance reflects the Fund’s Class 1 operating expenses, but does not include any contract fees, expenses or sales charges. If they had been included, performance would be lower. These charges and deductions, particularly for variable life policies, can have a significant effect on contract values and insurance benefits. See the contract prospectus for a complete description of these expenses, including sales charges.
Performance data represent past performance, which does not guarantee future results. Investment return and principal value will fluctuate, and you may have a gain or loss when you sell your shares. Current performance may differ from figures shown.
TF-1
Fund Goal and Main Investments: Templeton Foreign Securities Fund seeks long-term capital growth. The Fund normally invests at least 80% of its net assets in investments of issuers located outside the U.S., including those in emerging markets, and normally invests predominantly in equity securities.
Performance Overview
You can find the Fund’s one-year total return in the Performance Summary. The Fund performed better than its benchmark, the MSCI EAFE Index, which had a -43.06% total return for the same period.1 Please note that index performance information is provided for reference and that we do not attempt to track the index but rather undertake investments on the basis of fundamental research.
Economic and Market Overview
During 2008, the global economy felt the effects of decelerating growth in the U.S. where housing prices declined, consumer demand softened, and a credit crisis originally related to U.S. subprime loan losses intensified. Fear of recession spanned the entire period, and in the summer most economists agreed that a recession had already begun. By then, the faltering U.S. economy had negatively impacted growth prospects around the world. Although growth in the first half of the year was robust in developing economies, particularly in Asia, signs of a global slowdown surfaced in the latter half.
In an environment of extremely high commodity prices that increased inflationary pressure, the world’s monetary authorities faced the choice of lowering short-term interest rates to stimulate growth or raising them to fight rising inflation. Stimulus provided through fiscal and monetary policies implemented around the globe sought to restore financial market stability and reignite economic growth. The U.S. Treasury and the Federal Reserve Board took unprecedented steps, including lowering short-term rates to near 0% from 4.25%. The European Central Bank and many of the world’s central banks had raised rates due to inflationary pressures. Later in the year, the potential for global recession trumped inflationary concerns, and the world’s monetary authorities cut interest rates aggressively. The U.S. dollar, which had declined earlier in the period versus many of the world’s currencies, regained ground quickly toward period-end as a flight to the relative safety of U.S. Treasuries prevailed.
1. Source: © 2009 Morningstar. One cannot invest directly in an index, nor is an index representative of the Fund’s portfolio. Please see Index Descriptions following the Fund Summaries.
Fund Risks: The Fund’s investments in stocks offer the potential for long-term gains but can be subject to short-term price fluctuations. Foreign investing, especially in emerging markets, involves additional risks, including currency fluctuations, economic instability, market volatility, and political and social instability. By having significant investments in one or more countries or in particular sectors from time to time, the Fund may carry greater risk of adverse developments in a country or sector than a fund that invests more broadly. The Fund’s prospectus also includes a description of the main investment risks.
TF-2
In this challenging economic time, volatility came to define global equity markets. Virtually all local indexes ended the 12-month period with marked losses. Despite negative economic data and an outlook for decelerating corporate earnings and profit margins globally, many companies outside the financials sector retained relatively strong balance sheets.
Investment Strategy
Our investment philosophy is bottom up, value oriented and long term. In choosing investments, we generally focus on the market price of a company’s securities relative to our evaluation of the company’s potential long-term earnings, asset value and cash flow. Among factors we consider are a company’s historical value measures, including price/earnings ratio, profit margins and liquidation value. We do in-depth research to construct a bargain list from which we buy.
Manager’s Discussion
During the year under review, stock selection and underweighting in the materials sector helped the Fund’s performance relative to the benchmark index.2 Notable among these stocks were Canadian mine operator Barrick Gold,3 Finnish paper products manufacturer UPM-Kymmene and Australian packaging products company Amcor.
An underweighting in the troubled financials sector also boosted relative Fund performance for the year.4 Contributors included Swiss insurers ACE3 and Swiss Reinsurance.
Stock selection and an underweighted allocation in the consumer discretionary sector also positively impacted relative returns.5 Several U.K.-based companies, including food services provider Compass Group, home improvement retail chain Kingfisher and publisher Pearson, aided relative Fund results.
It is important to recognize the effect of currency movements on the Fund’s performance. In general, if the value of the U.S. dollar goes up compared with a foreign currency, an investment traded in that foreign currency will go down in value because it will be worth fewer U.S. dollars. This can have a negative effect on Fund performance.
2. The materials sector comprises containers and packaging, metals and mining, and paper and forest products in the SOI.
3. This holding is not an index component.
4. The financials sector comprises capital markets, commercial banks, diversified financial services, insurance, and real estate management and development in the SOI.
5. The consumer discretionary sector comprises auto components; automobiles; hotels, restaurants and leisure; media; specialty retail; and textiles, apparel and luxury goods in the SOI.
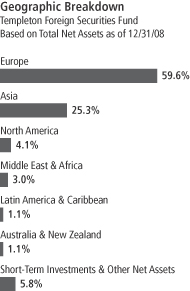
TF-3
Conversely, when the U.S. dollar weakens in relation to a foreign currency, an investment traded in that foreign currency will increase in value, which can contribute to Fund performance. For the 12 months ended December 31, 2008, the U.S. dollar appreciated in value relative to most non-U.S. currencies. As a result, the Fund’s performance was negatively affected by the portfolio’s investment predominantly in securities with non-U.S. currency exposure.
Although the fund performed better than the benchmark index, some factors negatively affected relative performance. For example, the Fund’s underweighted exposure to the consumer staples sector, which performed better than the overall index, detracted from relative results.6
Stock selection in the volatile energy sector, which saw prices sharply rise and fall during the review period, also hurt relative results.7 Holdings in the oil, gas and consumable fuels industry, such as Indian petrochemical product manufacturer Reliance Industries3 and Russian natural gas extractor Gazprom,3 had steep price declines. The Fund’s holdings in Aker Solutions, a Norwegian mining services company, also detracted from relative performance.
Additionally, the Fund’s relative returns suffered from the Fund’s stock selection in the information technology sector.8 Stocks that lost value in this sector included semiconductor manufacturer Infineon Technologies (Germany), and electronic component manufacturers Flextronics (Singapore)3 and Lite-On Technology (Taiwan).3
Thank you for your participation in Templeton Foreign Securities Fund. We look forward to serving your future investment needs.
6. The consumer staples sector comprises food products in the SOI.
7. The energy sector comprises energy equipment and services; and oil, gas and consumable fuels in the SOI.
8. The information technology sector comprises communications equipment; computers and peripherals; electronic equipment, instruments and components; semiconductors and semiconductor equipment; and software in the SOI.
The foregoing information reflects our analysis, opinions and portfolio holdings as of December 31, 2008, the end of the reporting period. The way we implement our main investment strategies and the resulting portfolio holdings may change depending on factors such as market and economic conditions. These opinions may not be relied upon as investment advice or an offer for a particular security. The information is not a complete analysis of every aspect of any market, country, industry, security or the Fund. Statements of fact are from sources considered reliable, but the investment manager makes no representation or warranty as to their completeness or accuracy. Although historical performance is no guarantee of future results, these insights may help you understand our investment management philosophy.
Top 10 Holdings
Templeton Foreign Securities Fund 12/31/08
| | |
Company
Sector/Industry,
Country | | % of Total
Net Assets |
| Sanofi-Aventis | | 3.0% |
| Pharmaceuticals, France | | |
| British Energy Group PLC | | 2.9% |
| Electric Utilities, U.K. | | |
| GlaxoSmithKline PLC | | 2.5% |
| Pharmaceuticals, U.K. | | |
| Telefonica SA, ADR | | 2.5% |
| Diversified Telecommunication Services, Spain | | |
| Taiwan Semiconductor Manufacturing Co. Ltd. | | 2.3% |
| Semiconductors & Semiconductor Equipment, Taiwan | | |
| BP PLC | | 2.3% |
| Oil, Gas & Consumable Fuels, U.K. | | |
| France Telecom SA | | 2.3% |
| Diversified Telecommunication Services, France | | |
| Total SA, B | | 2.0% |
| Oil, Gas & Consumable Fuels, France | | |
| Siemens AG | | 2.0% |
| Industrial Conglomerates, Germany | | |
| Vodafone Group PLC, ADR | | 2.0% |
| Wireless Telecommunication Services, U.K. | | |
The dollar value, number of shares or principal amount, and names of all portfolio holdings are listed in the Fund’s Statement of Investments (SOI).
TF-4
Fund Expenses
As an investor in a variable insurance contract (Contract) that indirectly provides for investment in an underlying mutual fund, you can incur transaction and/or ongoing expenses at both the Fund level and the Contract level.
| • | | Transaction expenses can include sales charges (loads) on purchases, redemption fees, surrender fees, transfer fees and premium taxes. |
| • | | Ongoing expenses can include management fees, distribution and service (12b-1) fees, contract fees, annual maintenance fees, mortality and expense risk fees and other fees and expenses. All mutual funds and Contracts have some types of ongoing expenses. |
The expenses shown in the table are meant to highlight ongoing expenses at the Fund level only and do not include ongoing expenses at the Contract level, or transaction expenses at either the Fund or Contract level. While the Fund does not have transaction expenses, if the transaction and ongoing expenses at the Contract level were included, the expenses shown below would be higher. You should consult your Contract prospectus or disclosure document for more information.
The table shows Fund-level ongoing expenses and can help you understand these expenses and compare them with those of other mutual funds offered through the Contract. The table assumes a $1,000 investment held for the six months indicated. Please refer to the Fund prospectus for additional information on operating expenses.
Actual Fund Expenses
The first line (Actual) of the table provides actual account values and expenses. The “Ending Account Value” is derived from the Fund’s actual return, which includes the effect of ongoing Fund expenses, but does not include the effect of ongoing Contract expenses.
You can estimate the Fund-level expenses you incurred during the period by following these steps. Of course, your account value and expenses will differ from those in this illustration:
| 1. | Divide your account value by $1,000. |
If an account had an $8,600 value, then $8,600 ÷ $1,000 = 8.6.
| 2. | Multiply the result by the number under the heading “Fund-Level Expenses Incurred During Period.” |
If Fund-Level Expenses Incurred During Period were $7.50, then 8.6 x $7.50 = $64.50.
In this illustration, the estimated expenses incurred this period at the Fund level are $64.50.
Templeton Foreign Securities Fund – Class 1
TF-5
Hypothetical Example for Comparison with Other Mutual Funds
Information in the second line (Hypothetical) of the table can help you compare ongoing expenses of the Fund with those of other mutual funds offered through the Contract. This information may not be used to estimate the actual ending account balance or expenses you incurred during the period. The hypothetical “Ending Account Value” is based on the Fund’s actual expense ratio and an assumed 5% annual rate of return before expenses, which does not represent the Fund’s actual return. The figure under the heading “Fund-Level Expenses Incurred During Period” shows the hypothetical expenses your account would have incurred under this scenario. You can compare this figure with the 5% hypothetical examples that appear in shareholder reports of other funds offered through a Contract.
| | | | | | | | | |
| Class 1 | | Beginning
Account Value 7/1/08 | | Ending Account Value 12/31/08 | | Fund-Level
Expenses Incurred
During Period*
7/1/08–12/31/08 |
Actual | | $ | 1,000 | | $ | 678.90 | | $ | 3.29 |
Hypothetical (5% return before expenses) | | $ | 1,000 | | $ | 1,021.22 | | $ | 3.96 |
*Expenses are calculated using the most recent six-month annualized expense ratio for the Fund’s Class 1 shares (0.78%), which does not include any ongoing expenses of the Contract for which the Fund is an investment option, multiplied by the average account value over the period, multiplied by 184/366 to reflect the one-half year period.
TF-6
Franklin Templeton Variable Insurance Products Trust
Financial Highlights
Templeton Foreign Securities Fund
| | | | | | | | | | | | | | | | | | | | |
| | | Year Ended December 31, | |
| Class 1 | | 2008 | | | 2007 | | | 2006 | | | 2005 | | | 2004 | |
| | | | |
Per share operating performance | | | | | | | | | | | | | | | | | | | | |
(for a share outstanding throughout the year) | | | | | | | | | | | | | | | | | | | | |
Net asset value, beginning of year | | $ | 20.57 | | | $ | 19.00 | | | $ | 15.84 | | | $ | 14.53 | | | $ | 12.37 | |
| | | | |
Income from investment operationsa: | | | | | | | | | | | | | | | | | | | | |
Net investment incomeb | | | 0.45 | | | | 0.45 | | | | 0.46 | | | | 0.30 | | | | 0.26 | |
Net realized and unrealized gains (losses) | | | (8.01 | ) | | | 2.46 | | | | 2.94 | | | | 1.20 | | | | 2.05 | |
| | | | |
Total from investment operations | | | (7.56 | ) | | | 2.91 | | | | 3.40 | | | | 1.50 | | | | 2.31 | |
| | | | |
Less distributions from: | | | | | | | | | | | | | | | | | | | | |
Net investment income | | | (0.45 | ) | | | (0.44 | ) | | | (0.24 | ) | | | (0.19 | ) | | | (0.15 | ) |
Net realized gains | | | (1.61 | ) | | | (0.90 | ) | | | — | | | | — | | | | — | |
| | | | |
Total distributions | | | (2.06 | ) | | | (1.34 | ) | | | (0.24 | ) | | | (0.19 | ) | | | (0.15 | ) |
| | | | |
Redemption feesc | | | — | | | | — | | | | — | | | | — | | | | — | |
| | | | |
Net asset value, end of year | | $ | 10.95 | | | $ | 20.57 | | | $ | 19.00 | | | $ | 15.84 | | | $ | 14.53 | |
| | | | |
| | | | | |
Total returnd | | | (40.23)% | | | | 15.79% | | | | 21.70% | | | | 10.48% | | | | 18.87% | |
Ratios to average net assets | | | | | | | | | | | | | | | | | | | | |
Expensese | | | 0.77% | | | | 0.75% | | | | 0.75% | | | | 0.77% | | | | 0.82% | |
Net investment income | | | 2.82% | | | | 2.22% | | | | 2.63% | | | | 2.03% | | | | 1.95% | |
| | | | | |
Supplemental data | | | | | | | | | | | | | | | | | | | | |
Net assets, end of year (000’s) | | $ | 262,725 | | | $ | 531,377 | | | $ | 594,991 | | | $ | 531,775 | | | $ | 506,456 | |
Portfolio turnover rate | | | 18.27% | | | | 26.74% | | | | 18.97% | f | | | 14.61% | | | | 10.91% | |
aThe amount shown for a share outstanding throughout the period may not correlate with the Statement of Operations for the period due to the timing of sales and repurchases of the Fund shares in relation to income earned and/or fluctuating market value of the investments of the Fund.
bBased on average daily shares outstanding.
cAmount rounds to less than $0.01 per share.
dTotal return does not include any fees, charges or expenses imposed by the variable annuity and life insurance contracts for which the Franklin Templeton Variable Insurance Products Trust serves as an underlying investment vehicle.
eBenefit of expense reduction rounds to less than 0.01%.
fExcludes the value of portfolio securities delivered as a result of redemption in-kind.
The accompanying notes are an integral part of these financial statements.
TF-7
Franklin Templeton Variable Insurance Products Trust
Financial Highlights (continued)
Templeton Foreign Securities Fund
| | | | | | | | | | | | | | | | | | | | |
| | | Year Ended December 31, | |
| Class 2 | | 2008 | | | 2007 | | | 2006 | | | 2005 | | | 2004 | |
| | | | |
Per share operating performance | | | | | | | | | | | | | | | | | | | | |
(for a share outstanding throughout the year) | | | | | | | | | | | | | | | | | | | | |
Net asset value, beginning of year | | $ | 20.25 | | | $ | 18.73 | | | $ | 15.63 | | | $ | 14.35 | | | $ | 12.24 | |
| | | | |
Income from investment operationsa: | | | | | | | | | | | | | | | | | | | | |
Net investment incomeb | | | 0.40 | | | | 0.38 | | | | 0.40 | | | | 0.26 | | | | 0.22 | |
Net realized and unrealized gains (losses) | | | (7.89 | ) | | | 2.44 | | | | 2.91 | | | | 1.19 | | | | 2.03 | |
| | | | |
Total from investment operations | | | (7.49 | ) | | | 2.82 | | | | 3.31 | | | | 1.45 | | | | 2.25 | |
| | | | |
Less distributions from: | | | | | | | | | | | | | | | | | | | | |
Net investment income | | | (0.39 | ) | | | (0.40 | ) | | | (0.21 | ) | | | (0.17 | ) | | | (0.14 | ) |
Net realized gains | | | (1.61 | ) | | | (0.90 | ) | | | — | | | | — | | | | — | |
| | | | |
Total distributions | | | (2.00 | ) | | | (1.30 | ) | | | (0.21 | ) | | | (0.17 | ) | | | (0.14 | ) |
| | | | |
Redemption feesc | | | — | | | | — | | | | — | | | | — | | | | — | |
| | | | |
Net asset value, end of year | | $ | 10.76 | | | $ | 20.25 | | | $ | 18.73 | | | $ | 15.63 | | | $ | 14.35 | |
| | | | |
| | | | | |
Total returnd | | | (40.38)% | | | | 15.46% | | | | 21.44% | | | | 10.17% | | | | 18.53% | |
Ratios to average net assets | | | | | | | | | | | | | | | | | | | | |
Expensese | | | 1.02% | | | | 1.00% | | | | 1.00% | | | | 1.02% | | | | 1.07% | |
Net investment income | | | 2.57% | | | | 1.97% | | | | 2.38% | | | | 1.78% | | | | 1.70% | |
| | | | | |
Supplemental data | | | | | | | | | | | | | | | | | | | | |
Net assets, end of year (000’s) | | $ | 1,702,038 | | | $ | 3,255,154 | | | $ | 2,941,374 | | | $ | 2,232,990 | | | $ | 1,445,928 | |
Portfolio turnover rate | | | 18.27% | | | | 26.74% | | | | 18.97% | f | | | 14.61% | | | | 10.91% | |
aThe amount shown for a share outstanding throughout the period may not correlate with the Statement of Operations for the period due to the timing of sales and repurchases of the Fund shares in relation to income earned and/or fluctuating market value of the investments of the Fund.
bBased on average daily shares outstanding.
cAmount rounds to less than $0.01 per share.
dTotal return does not include any fees, charges or expenses imposed by the variable annuity and life insurance contracts for which the Franklin Templeton Variable Insurance Products Trust serves as an underlying investment vehicle.
eBenefit of expense reduction rounds to less than 0.01%.
fExcludes the value of portfolio securities delivered as a result of redemption in-kind.
The accompanying notes are an integral part of these financial statements.
TF-8
Franklin Templeton Variable Insurance Products Trust
Financial Highlights (continued)
Templeton Foreign Securities Fund
| | | | | | | | | | | | | | | | | | | | |
| | | Year Ended December 31, | |
| Class 3 | | 2008 | | | 2007 | | | 2006 | | | 2005 | | | 2004a | |
| | | | |
Per share operating performance | | | | | | | | | | | | | | | | | | | | |
(for a share outstanding throughout the year) | | | | | | | | | | | | | | | | | | | | |
Net asset value, beginning of year | | $ | 20.18 | | | $ | 18.68 | | | $ | 15.60 | | | $ | 14.35 | | | $ | 12.48 | |
| | | | |
Income from investment operationsb: | | | | | | | | | | | | | | | | | | | | |
Net investment incomec | | | 0.39 | | | | 0.37 | | | | 0.37 | | | | 0.25 | | | | 0.09 | |
Net realized and unrealized gains (losses) | | | (7.84 | ) | | | 2.45 | | | | 2.94 | | | | 1.18 | | | | 1.92 | |
| | | | |
Total from investment operations | | | (7.45 | ) | | | 2.82 | | | | 3.31 | | | | 1.43 | | | | 2.01 | |
| | | | |
Less distributions from: | | | | | | | | | | | | | | | | | | | | |
Net investment income | | | (0.42 | ) | | | (0.42 | ) | | | (0.23 | ) | | | (0.18 | ) | | | (0.14 | ) |
Net realized gains | | | (1.61 | ) | | | (0.90 | ) | | | — | | | | — | | | | — | |
| | | | |
Total distributions | | | (2.03 | ) | | | (1.32 | ) | | | (0.23 | ) | | | (0.18 | ) | | | (0.14 | ) |
| | | | |
Redemption feesd | | | — | | | | — | | | | — | | | | — | | | | — | |
| | | | |
Net asset value, end of year | | $ | 10.70 | | | $ | 20.18 | | | $ | 18.68 | | | $ | 15.60 | | | $ | 14.35 | |
| | | | |
| | | | | |
Total returne | | | (40.39)% | | | | 15.45% | | | | 21.46% | | | | 10.13% | | | | 16.25% | |
Ratios to average net assetsf | | | | | | | | | | | | | | | | | | | | |
Expensesg | | | 1.02% | | | | 1.00% | | | | 1.00% | | | | 1.02% | | | | 1.07% | |
Net investment income | | | 2.57% | | | | 1.97% | | | | 2.38% | | | | 1.78% | | | | 1.70% | |
| | | | | |
Supplemental data | | | | | | | | | | | | | | | | | | | | |
Net assets, end of year (000’s) | | $ | 271,061 | | | $ | 313,505 | | | $ | 150,417 | | | $ | 47,462 | | | $ | 16,559 | |
Portfolio turnover rate | | | 18.27% | | | | 26.74% | | | | 18.97% | h | | | 14.61% | | | | 10.91% | |
aFor the period May 1, 2004 (effective date) to December 31, 2004.
bThe amount shown for a share outstanding throughout the period may not correlate with the Statement of Operations for the period due to the timing of sales and repurchases of the Fund shares in relation to income earned and/or fluctuating market value of the investments of the Fund.
cBased on average daily shares outstanding.
dAmount rounds to less than $0.01 per share.
eTotal return does not include any fees, charges or expenses imposed by the variable annuity and life insurance contracts for which the Franklin Templeton Variable Insurance Products Trust serves as an underlying investment vehicle. Total return is not annualized for periods less than one year.
fRatios are annualized for periods less than one year.
gBenefit of expense reduction rounds to less than 0.01%.
hExcludes the value of portfolio securities delivered as a result of redemption in-kind.
The accompanying notes are an integral part of these financial statements.
TF-9
Franklin Templeton Variable Insurance Products Trust
Financial Highlights (continued)
Templeton Foreign Securities Fund
| | | | |
| Class 4 | | Period Ended
December 31,
2008a | |
| | | | |
Per share operating performance | | | | |
(for a share outstanding throughout the period ) | | | | |
Net asset value, beginning of period | | $ | 18.90 | |
| | | | |
Income from investment operationsb: | | | | |
Net investment incomec | | | 0.15 | |
Net realized and unrealized gains (losses) | | | (6.08 | ) |
| | | | |
Total from investment operations | | | (5.93 | ) |
| | | | |
Less distributions from: | | | | |
Net investment income | | | (0.45 | ) |
Net realized gains | | | (1.61 | ) |
| | | | |
Total distributions | | | (2.06 | ) |
| | | | |
Redemption feesd | | | — | |
| | | | |
Net asset value, end of period | | $ | 10.91 | |
| | | | |
| |
Total returne | | | (35.15)% | |
Ratios to average net assetsf | | | | |
Expensesg | | | 1.12% | |
Net investment income | | | 2.47% | |
| |
Supplemental data | | | | |
Net assets, end of period (000’s) | | $ | 14,287 | |
Portfolio turnover rate | | | 18.27% | |
aFor the period February 29, 2008 (effective date) to December 31, 2008.
bThe amount shown for a share outstanding throughout the period may not correlate with the Statement of Operations for the period due to the timing of sales and repurchases of the Fund shares in relation to income earned and/or fluctuating market value of the investments of the Fund.
cBased on average daily shares outstanding.
dAmount rounds to less than $0.01 per share.
eTotal return does not include any fees, charges or expenses imposed by the variable annuity and life insurance contracts for which the Franklin Templeton Variable Insurance Products Trust serves as an underlying investment vehicle. Total return is not annualized for periods less than one year.
fRatios are annualized for periods less than one year.
gBenefit of expense reduction rounds to less than 0.01%.
The accompanying notes are an integral part of these financial statements.
TF-10
Franklin Templeton Variable Insurance Products Trust
Statement of Investments, December 31, 2008
| | | | | | | |
| Templeton Foreign Securities Fund | | Country | | Shares/
Units/
Rights | | Value |
Common Stocks and Other Equity Interests 93.6% | | | | | | | |
Aerospace & Defense 1.6% | | | | | | | |
BAE Systems PLC | | United Kingdom | | 4,494,870 | | $ | 24,733,571 |
Embraer-Empresa Brasileira de Aeronautica SA, ADR | | Brazil | | 700,030 | | | 11,347,486 |
| | | | | | | |
| | | | | | | 36,081,057 |
| | | | | | | |
Air Freight & Logistics 0.8% | | | | | | | |
Deutsche Post AG | | Germany | | 1,087,912 | | | 17,958,089 |
| | | | | | | |
Auto Components 0.7% | | | | | | | |
NOK Corp. | | Japan | | 2,198,155 | | | 15,465,355 |
| | | | | | | |
Automobiles 1.6% | | | | | | | |
Bayerische Motoren Werke AG | | Germany | | 354,040 | | | 10,876,340 |
Toyota Motor Corp., ADR | | Japan | | 380,380 | | | 24,892,067 |
| | | | | | | |
| | | | | | | 35,768,407 |
| | | | | | | |
Capital Markets 1.3% | | | | | | | |
Invesco Ltd. | | United States | | 1,744,177 | | | 25,185,916 |
aKKR Private Equity Investors LP | | United States | | 1,155,000 | | | 4,042,500 |
| | | | | | | |
| | | | | | | 29,228,416 |
| | | | | | | |
Commercial Banks 5.8% | | | | | | | |
DBS Group Holdings Ltd. | | Singapore | | 1,240,347 | | | 7,290,556 |
aDBS Group Holdings Ltd., rts., 1/20/09 | | Singapore | | 620,173 | | | 1,298,792 |
Hana Financial Group Inc. | | South Korea | | 672,040 | | | 10,375,915 |
aKB Financial Group Inc., ADR | | South Korea | | 530,407 | | | 13,896,663 |
Mega Financial Holding Co. Ltd. | | Taiwan | | 34,084,000 | | | 11,907,301 |
Mitsubishi UFJ Financial Group Inc. | | Japan | | 3,429,500 | | | 21,537,084 |
Royal Bank of Scotland Group PLC | | United Kingdom | | 7,120,299 | | | 5,137,379 |
Shinsei Bank Ltd. | | Japan | | 8,731,478 | | | 13,808,061 |
Sumitomo Mitsui Financial Group Inc. | | Japan | | 563,700 | | | 24,397,949 |
UniCredit SpA | | Italy | | 8,344,507 | | | 20,360,877 |
| | | | | | | |
| | | | | | | 130,010,577 |
| | | | | | | |
Communications Equipment 1.0% | | | | | | | |
Telefonaktiebolaget LM Ericsson, B, ADR | | Sweden | | 2,929,600 | | | 22,880,176 |
| | | | | | | |
Computers & Peripherals 1.0% | | | | | | | |
Compal Electronics Inc. | | Taiwan | | 12,917,247 | | | 6,798,551 |
Lite-On Technology Corp. | | Taiwan | | 22,816,681 | | | 14,932,656 |
| | | | | | | |
| | | | | | | 21,731,207 |
| | | | | | | |
Containers & Packaging 1.1% | | | | | | | |
Amcor Ltd. | | Australia | | 5,968,788 | | | 24,520,618 |
| | | | | | | |
Diversified Financial Services 0.9% | | | | | | | |
ING Groep NV | | Netherlands | | 2,046,888 | | | 20,979,659 |
| | | | | | | |
Diversified Telecommunication Services 11.1% | | | | | | | |
China Telecom Corp. Ltd., H | | China | | 73,292,357 | | | 27,330,251 |
Chunghwa Telecom Co. Ltd., ADR | | Taiwan | | 2,312,608 | | | 36,076,685 |
France Telecom SA | | France | | 1,868,953 | | | 52,162,606 |
Singapore Telecommunications Ltd. | | Singapore | | 20,278,000 | | | 36,096,963 |
Telefonica SA, ADR | | Spain | | 829,094 | | | 55,872,645 |
Telekom Austria AG | | Austria | | 727,240 | | | 10,474,067 |
Telenor ASA | | Norway | | 4,844,334 | | | 32,249,821 |
| | | | | | | |
| | | | | | | 250,263,038 |
| | | | | | | |
TF-11
Franklin Templeton Variable Insurance Products Trust
Statement of Investments, December 31, 2008 (continued)
| | | | | | | |
| Templeton Foreign Securities Fund | | Country | | Shares/
Units/
Rights | | Value |
Common Stocks and Other Equity Interests (continued) | | | | | | | |
Electric Utilities 3.7% | | | | | | | |
British Energy Group PLC | | United Kingdom | | 5,766,390 | | $ | 65,102,838 |
Hong Kong Electric Holdings Ltd. | | Hong Kong | | 3,453,969 | | | 19,386,294 |
| | | | | | | |
| | | | | | | 84,489,132 |
| | | | | | | |
Electrical Equipment 0.5% | | | | | | | |
aVestas Wind Systems AS | | Denmark | | 191,258 | | | 10,905,109 |
| | | | | | | |
Electronic Equipment, Instruments & Components 1.6% | | | | | | | |
aFlextronics International Ltd. | | Singapore | | 4,132,960 | | | 10,580,378 |
FUJIFILM Holdings Corp. | | Japan | | 921,374 | | | 20,551,833 |
Venture Corp. Ltd. | | Singapore | | 1,339,613 | | | 4,095,989 |
| | | | | | | |
| | | | | | | 35,228,200 |
| | | | | | | |
Energy Equipment & Services 0.4% | | | | | | | |
Aker Solutions ASA | | Norway | | 1,386,290 | | | 8,969,719 |
| | | | | | | |
Food Products 3.0% | | | | | | | |
Nestle SA | | Switzerland | | 1,035,090 | | | 40,321,888 |
Unilever PLC | | United Kingdom | | 1,170,483 | | | 26,993,777 |
| | | | | | | |
| | | | | | | 67,315,665 |
| | | | | | | |
Health Care Equipment & Supplies 1.4% | | | | | | | |
Olympus Corp. | | Japan | | 1,551,000 | | | 31,023,143 |
| | | | | | | |
Health Care Providers & Services 0.5% | | | | | | | |
Celesio AG | | Germany | | 440,310 | | | 11,882,730 |
| | | | | | | |
Hotels, Restaurants & Leisure 1.3% | | | | | | | |
Autogrill SpA | | Italy | | 1,429,290 | | | 10,732,354 |
Compass Group PLC | | United Kingdom | | 3,611,978 | | | 18,147,632 |
| | | | | | | |
| | | | | | | 28,879,986 |
| | | | | | | |
Industrial Conglomerates 2.7% | | | | | | | |
Hutchison Whampoa Ltd. | | Hong Kong | | 3,276,709 | | | 16,425,401 |
Siemens AG | | Germany | | 598,694 | | | 44,193,351 |
| | | | | | | |
| | | | | | | 60,618,752 |
| | | | | | | |
Insurance 5.7% | | | | | | | |
ACE Ltd. | | United States | | 729,799 | | | 38,620,963 |
Aviva PLC | | United Kingdom | | 2,897,247 | | | 16,503,139 |
AXA SA | | France | | 831,259 | | | 18,417,428 |
bAXA SA, 144A | | France | | 38,270 | | | 847,912 |
Old Mutual PLC | | United Kingdom | | 19,529,314 | | | 15,687,946 |
Swiss Reinsurance Co. | | Switzerland | | 792,220 | | | 37,314,979 |
| | | | | | | |
| | | | | | | 127,392,367 |
| | | | | | | |
Life Sciences Tools & Services 0.7% | | | | | | | |
Lonza Group AG | | Switzerland | | 175,440 | | | 16,026,006 |
| | | | | | | |
Media 4.6% | | | | | | | |
British Sky Broadcasting Group PLC | | United Kingdom | | 2,941,216 | | | 20,619,806 |
Pearson PLC | | United Kingdom | | 3,409,246 | | | 31,917,788 |
Reed Elsevier NV | | Netherlands | | 1,742,483 | | | 20,515,448 |
Vivendi SA | | France | | 905,850 | | | 29,468,614 |
| | | | | | | |
| | | | | | | 102,521,656 |
| | | | | | | |
TF-12
Franklin Templeton Variable Insurance Products Trust
Statement of Investments, December 31, 2008 (continued)
| | | | | | | |
| Templeton Foreign Securities Fund | | Country | | Shares/
Units/
Rights | | Value |
Common Stocks and Other Equity Interests (continued) | | | | | | | |
Metals & Mining 1.5% | | | | | | | |
Barrick Gold Corp. | | Canada | | 663,561 | | $ | 24,381,831 |
POSCO, ADR | | South Korea | | 141,230 | | | 10,627,558 |
| | | | | | | |
| | | | | | | 35,009,389 |
| | | | | | | |
Multi-Utilities 1.4% | | | | | | | |
GDF Suez | | France | | 602,301 | | | 29,750,627 |
aSuez Environnement SA | | France | | 157,749 | | | 2,657,994 |
| | | | | | | |
| | | | | | | 32,408,621 |
| | | | | | | |
Oil, Gas & Consumable Fuels 11.7% | | | | | | | |
BP PLC | | United Kingdom | | 6,827,077 | | | 52,448,970 |
Eni SpA | | Italy | | 1,275,111 | | | 29,847,215 |
Gazprom, ADR | | Russia | | 643,700 | | | 9,172,725 |
Hindustan Petroleum Corp. Ltd. | | India | | 2,415,168 | | | 13,546,201 |
Indian Oil Corp. Ltd. | | India | | 1,194,026 | | | 10,467,988 |
Reliance Industries Ltd. | | India | | 1,122,471 | | | 28,402,303 |
Royal Dutch Shell PLC, B | | United Kingdom | | 1,736,593 | | | 43,752,570 |
Sasol, ADR | | South Africa | | 971,480 | | | 29,464,988 |
Total SA, B | | France | | 846,266 | | | 46,043,517 |
| | | | | | | |
| | | | | | | 263,146,477 |
| | | | | | | |
Paper & Forest Products 0.8% | | | | | | | |
UPM-Kymmene OYJ | | Finland | | 1,477,599 | | | 18,595,141 |
| | | | | | | |
Pharmaceuticals 9.9% | | | | | | | |
GlaxoSmithKline PLC | | United Kingdom | | 3,007,885 | | | 56,430,221 |
Merck KGaA | | Germany | | 276,540 | | | 24,948,974 |
Novartis AG | | Switzerland | | 825,010 | | | 40,713,575 |
Roche Holding AG | | Switzerland | | 71,870 | | | 10,936,300 |
Sanofi-Aventis | | France | | 1,066,665 | | | 67,714,904 |
Takeda Pharmaceutical Co. Ltd. | | Japan | | 421,454 | | | 21,948,981 |
| | | | | | | |
| | | | | | | 222,692,955 |
| | | | | | | |
Professional Services 2.0% | | | | | | | |
Adecco SA | | Switzerland | | 956,590 | | | 32,050,557 |
Randstad Holding NV | | Netherlands | | 633,100 | | | 12,880,588 |
| | | | | | | |
| | | | | | | 44,931,145 |
| | | | | | | |
Real Estate Management & Development 1.0% | | | | | | | |
Cheung Kong (Holdings) Ltd. | | Hong Kong | | 2,483,922 | | | 23,492,488 |
| | | | | | | |
Semiconductors & Semiconductor Equipment 4.4% | | | | | | | |
aInfineon Technologies AG | | Germany | | 3,757,123 | | | 4,996,159 |
Samsung Electronics Co. Ltd. | | South Korea | | 113,407 | | | 40,496,086 |
Taiwan Semiconductor Manufacturing Co. Ltd. | | Taiwan | | 38,910,907 | | | 52,712,259 |
| | | | | | | |
| | | | | | | 98,204,504 |
| | | | | | | |
Software 3.1% | | | | | | | |
aCheck Point Software Technologies Ltd. | | Israel | | 1,990,881 | | | 37,806,830 |
SAP AG, ADR | | Germany | | 895,140 | | | 32,421,971 |
| | | | | | | |
| | | | | | | 70,228,801 |
| | | | | | | |
Specialty Retail 1.4% | | | | | | | |
Kingfisher PLC | | United Kingdom | | 15,543,496 | | | 30,647,771 |
| | | | | | | |
TF-13
Franklin Templeton Variable Insurance Products Trust
Statement of Investments, December 31, 2008 (continued)
| | | | | | | |
| Templeton Foreign Securities Fund | | Country | | Shares/
Units/
Rights | | Value |
Common Stocks and Other Equity Interests (continued) | | | | | | | |
Textiles, Apparel & Luxury Goods 0.2% | | | | | | | |
Burberry Group PLC | | United Kingdom | | 1,541,479 | | $ | 4,992,495 |
| | | | | | | |
Wireless Telecommunication Services 3.2% | | | | | | | |
Mobile TeleSystems, ADR | | Russia | | 316,030 | | | 8,431,681 |
Turkcell Iletisim Hizmetleri AS, ADR | | Turkey | | 1,368,000 | | | 19,945,440 |
Vodafone Group PLC, ADR | | United Kingdom | | 2,157,030 | | | 44,089,693 |
| | | | | | | |
| | | | | | | 72,466,814 |
| | | | | | | |
Total Common Stocks and Other Equity Interests
(Cost $2,874,142,965) | | | | | | | 2,106,955,665 |
| | | | | | | |
Preferred Stocks (Cost $2,340,943) 0.6% | | | | | | | |
Metals & Mining 0.6% | | | | | | | |
Companhia Vale do Rio Doce, ADR, pfd., A | | Brazil | | 1,296,112 | | | 13,803,593 |
| | | | | | | |
Total Investments before Short Term Investments
(Cost $2,876,483,908) | | | | | | | 2,120,759,258 |
| | | | | | | |
Short Term Investments (Cost $125,511,833) 5.6% | | | | | | | |
Money Market Funds 5.6% | | | | | | | |
cFranklin Institutional Fiduciary Trust Money Market Portfolio, 0.55% | | United States | | 125,511,833 | | | 125,511,833 |
| | | | | | | |
Total Investments (Cost $3,001,995,741) 99.8% | | | | | | | 2,246,271,091 |
Other Assets, less Liabilities 0.2% | | | | | | | 3,839,699 |
| | | | | | | |
Net Assets 100.0% | | | | | | $ | 2,250,110,790 |
| | | | | | | |
See Abbreviations on page TF-24.
aNon-income producing for the twelve months ended December 31, 2008.
bSecurity was purchased pursuant to Rule 144A under the Securities Act of 1933 and may be sold in transactions exempt from registration only to qualified institutional buyers or in a public offering registered under the Securities Act of 1933. This security has been deemed liquid under guidelines approved by the Trust’s Board of Trustees. At December 31, 2008, the value of this security was $847,912, representing 0.04% of net assets.
cSee Note 7 regarding investments in the Franklin Institutional Fiduciary Trust Money Market Portfolio. The rate shown is the annualized seven-day yield at period end.
TF-14
The accompanying notes are an integral part of these financial statements.
Franklin Templeton Variable Insurance Products Trust
Financial Statements
Statement of Assets and Liabilities
December 31, 2008
| | | | |
| | | Templeton
Foreign
Securities Fund | |
Assets: | | | | |
Investments in securities: | | | | |
Cost - Unaffiliated issuers | | $ | 2,876,483,908 | |
Cost - Sweep Money Fund (Note 7) | | | 125,511,833 | |
| | | | |
Total cost of investments | | $ | 3,001,995,741 | |
| | | | |
Value - Unaffiliated issuers | | $ | 2,120,759,258 | |
Value - Sweep Money Fund (Note 7) | | | 125,511,833 | |
| | | | |
Total value of investments | | | 2,246,271,091 | |
Receivables: | | | | |
Investment securities sold | | | 2,044,184 | |
Capital shares sold | | | 870,573 | |
Dividends | | | 5,400,824 | |
| | | | |
Total assets | | | 2,254,586,672 | |
| | | | |
Liabilities: | | | | |
Payables: | | | | |
Capital shares redeemed | | | 1,368,109 | |
Affiliates | | | 2,126,526 | |
Custodian fees | | | 411,918 | |
Reports to shareholders | | | 509,370 | |
Accrued expenses and other liabilities | | | 59,959 | |
| | | | |
Total liabilities | | | 4,475,882 | |
| | | | |
Net assets, at value | | $ | 2,250,110,790 | |
| | | | |
Net assets consist of: | | | | |
Paid-in capital | | $ | 2,857,847,041 | |
Undistributed net investment income | | | 80,222,837 | |
Net unrealized appreciation (depreciation) | | | (755,830,115 | ) |
Accumulated net realized gain (loss) | | | 67,871,027 | |
| | | | |
Net assets, at value | | $ | 2,250,110,790 | |
| | | | |
The accompanying notes are an integral part of these financial statements.
TF-15
Franklin Templeton Variable Insurance Products Trust
Financial Statements (continued)
Statement of Assets and Liabilities (continued)
December 31, 2008
| | | |
| | | Templeton
Foreign
Securities Fund |
Class 1: | | | |
Net assets, at value | | $ | 262,724,991 |
| | | |
Shares outstanding | | | 23,995,816 |
| | | |
Net asset value and maximum offering price per share | | $ | 10.95 |
| | | |
Class 2: | | | |
Net assets, at value | | $ | 1,702,038,041 |
| | | |
Shares outstanding | | | 158,154,731 |
| | | |
Net asset value and maximum offering price per share | | $ | 10.76 |
| | | |
Class 3: | | | |
Net assets, at value | | $ | 271,060,629 |
| | | |
Shares outstanding | | | 25,325,977 |
| | | |
Net asset value and maximum offering price per sharea | | $ | 10.70 |
| | | |
Class 4: | | | |
Net assets, at value | | $ | 14,287,129 |
| | | |
Shares outstanding | | | 1,309,369 |
| | | |
Net asset value and maximum offering price per share | | $ | 10.91 |
| | | |
aRedemption price is equal to net asset value less any redemption fees retained by the Fund.
The accompanying notes are an integral part of these financial statements.
TF-16
Franklin Templeton Variable Insurance Products Trust
Financial Statements (continued)
Statement of Operations
for the year ended December 31, 2008
| | | | |
| | | Templeton
Foreign
Securities Fund | |
Investment income: | | | | |
Dividends (net of foreign taxes of $12,000,492) | | | | |
Unaffiliated issuers | | $ | 112,689,347 | |
Sweep Money Fund (Note 7) | | | 4,121,046 | |
Interest (net of foreign taxes of $108) | | | 617 | |
| | | | |
Total investment income | | | 116,811,010 | |
| | | | |
Expenses: | | | | |
Management fees (Note 3a) | | | 20,049,698 | |
Administrative fees (Note 3b) | | | 3,017,103 | |
Distribution fees: (Note 3c) | | | | |
Class 2 | | | 6,250,018 | |
Class 3 | | | 853,532 | |
Class 4 | | | 15,609 | |
Unaffiliated transfer agent fees | | | 5,627 | |
Custodian fees (Note 4) | | | 911,729 | |
Reports to shareholders | | | 857,674 | |
Registration and filing fees | | | 3,586 | |
Professional fees | | | 86,521 | |
Trustees’ fees and expenses | | | 17,266 | |
Other | | | 93,999 | |
| | | | |
Total expenses | | | 32,162,362 | |
Expense reductions (Note 4) | | | (10,171 | ) |
| | | | |
Net expenses | | | 32,152,191 | |
| | | | |
Net investment income | | | 84,658,819 | |
| | | | |
Realized and unrealized gains (losses): | | | | |
Net realized gain (loss) from: | | | | |
Investments | | | 67,937,705 | |
Foreign currency transactions | | | (3,987,907 | ) |
| | | | |
Net realized gain (loss) | | | 63,949,798 | |
| | | | |
Net change in unrealized appreciation (depreciation) on: | | | | |
Investments | | | (1,759,715,281 | ) |
Translation of other assets and liabilities denominated in foreign currencies | | | (161,735 | ) |
Change in deferred taxes on unrealized appreciation (depreciation) | | | 997,091 | |
| | | | |
Net change in unrealized appreciation (depreciation) | | | (1,758,879,925 | ) |
| | | | |
Net realized and unrealized gain (loss) | | | (1,694,930,127 | ) |
| | | | |
Net increase (decrease) in net assets resulting from operations | | $ | (1,610,271,308 | ) |
| | | | |
The accompanying notes are an integral part of these financial statements.
TF-17
Franklin Templeton Variable Insurance Products Trust
Financial Statements (continued)
Statements of Changes in Net Assets
| | | | | | | | |
| | | Templeton Foreign
Securities Fund | |
| | | Year Ended December 31, | |
| | | 2008 | | | 2007 | |
| | | | |
Increase (decrease) in net assets: | | | | | | | | |
Operations: | | | | | | | | |
Net investment income | | $ | 84,658,819 | | | $ | 79,679,233 | |
Net realized gain (loss) from investments and foreign currency transactions | | | 63,949,798 | | | | 319,667,578 | |
Net change in unrealized appreciation (depreciation) on investments, translation of other assets and liabilities denominated in foreign currencies, and deferred taxes | | | (1,758,879,925 | ) | | | 172,022,908 | |
| | | | |
Net increase (decrease) in net assets resulting from operations | | | (1,610,271,308 | ) | | | 571,369,719 | |
| | | | |
Distributions to shareholders from: | | | | | | | | |
Net investment income: | | | | | | | | |
Class 1 | | | (10,823,949 | ) | | | (13,007,672 | ) |
Class 2 | | | (60,137,896 | ) | | | (62,378,038 | ) |
Class 3 | | | (8,627,614 | ) | | | (4,668,468 | ) |
Class 4 | | | (47,077 | ) | | | — | |
Net realized gains: | | | | | | | | |
Class 1 | | | (39,165,092 | ) | | | (26,934,025 | ) |
Class 2 | | | (246,128,397 | ) | | | (142,276,757 | ) |
Class 3 | | | (33,305,113 | ) | | | (10,123,984 | ) |
Class 4 | | | (170,343 | ) | | | — | |
| | | | |
Total distributions to shareholders | | | (398,405,481 | ) | | | (259,388,944 | ) |
| | | | |
Capital share transactions: (Note 2) | | | | | | | | |
Class 1 | | | (20,239,535 | ) | | | (110,488,366 | ) |
Class 2 | | | (11,580,062 | ) | | | 66,307,351 | |
Class 3 | | | 173,017,254 | | | | 145,429,492 | |
Class 4 | | | 17,522,726 | | | | — | |
| | | | |
Total capital share transactions | | | 158,720,383 | | | | 101,248,477 | |
| | | | |
Redemption fees | | | 31,545 | | | | 24,688 | |
| | | | |
Net increase (decrease) in net assets | | | (1,849,924,861 | ) | | | 413,253,940 | |
Net assets: | | | | | | | | |
Beginning of year | | | 4,100,035,651 | | | | 3,686,781,711 | |
| | | | |
End of year | | $ | 2,250,110,790 | | | $ | 4,100,035,651 | |
| | | | |
Undistributed net investment income included in net assets: | | | | | | | | |
End of year | | $ | 80,222,837 | | | $ | 79,657,780 | |
| | | | |
The accompanying notes are an integral part of these financial statements.
TF-18
Franklin Templeton Variable Insurance Products Trust
Notes to Financial Statements
Templeton Foreign Securities Fund
1. ORGANIZATION AND SIGNIFICANT ACCOUNTING POLICIES
Franklin Templeton Variable Insurance Products Trust (Trust) is registered under the Investment Company Act of 1940, as amended, (1940 Act) as an open-end investment company, consisting of twenty-three separate funds. The Templeton Foreign Securities Fund (Fund) is included in this report. The financial statements of the remaining funds in the Trust are presented separately. Shares of the Fund are sold only to insurance company separate accounts to fund the benefits of variable life insurance policies or variable annuity contracts. The Fund offers four classes of shares: Class 1, Class 2, Class 3 and Class 4. Effective February 29, 2008, the Fund began offering a new class of shares, Class 4. Each class of shares differs by its distribution fees, voting rights on matters affecting a single class and its exchange privilege.
The following summarizes the Fund’s significant accounting policies.
a. Security Valuation
Securities listed on a securities exchange or on the NASDAQ National Market System are valued at the last quoted sale price or the official closing price of the day, respectively. Over-the-counter securities and listed securities for which there is no reported sale are valued within the range of the most recent quoted bid and ask prices. Securities that trade in multiple markets or on multiple exchanges are valued according to the broadest and most representative market. Investments in open-end mutual funds are valued at the closing net asset value.
Foreign securities are valued as of the close of trading on the foreign stock exchange on which the security is primarily traded, or the NYSE, whichever is earlier. If no sale is reported at that time, the foreign security will be valued within the range of the most recent quoted bid and ask prices. The value is then converted into its U.S. dollar equivalent at the foreign exchange rate in effect at the close of the NYSE on the day that the value of the foreign security is determined.
The Trust has procedures to determine the fair value of individual securities and other assets for which market prices are not readily available or which may not be reliably priced. Methods for valuing these securities may include: fundamental analysis, matrix pricing, discounts from market prices of similar securities, or discounts applied due to the nature and duration of restrictions on the disposition of the securities. Due to the inherent uncertainty of valuations of such securities, the fair values may differ significantly from the values that would have been used had a ready market for such investments existed. Occasionally, events occur between the time at which trading in a security is completed and the close of the NYSE that might call into question the availability (including the reliability) of the value of a portfolio security held by the Fund. The investment manager monitors price movements following the close of trading in foreign stock markets through a series of country specific market proxies (such as baskets of American Depository Receipts, futures contracts and exchange traded funds). These price movements are measured against established trigger thresholds for each specific market proxy to assist in determining if an event has occurred. If such an event occurs, the securities may be valued using fair value procedures, which may include the use of independent pricing services. At December 31, 2008, a portion of the securities held by the Fund were fair valued. All security valuation procedures are approved by the Trust’s Board of Trustees.
b. Foreign Currency Translation
Portfolio securities and other assets and liabilities denominated in foreign currencies are translated into U.S. dollars based on the exchange rate of such currencies against U.S. dollars on the date of valuation. Purchases and sales of securities, income and expense items denominated in foreign currencies are translated into U.S. dollars at the exchange rate in effect on the transaction date. Occasionally, events may impact the availability or reliability of foreign exchange rates used to convert the U.S. dollar equivalent value. If such an event occurs, the foreign exchange rate will be valued at fair value using procedures established and approved by the Trust’s Board of Trustees.
The Fund does not separately report the effect of changes in foreign exchange rates from changes in market prices on securities held. Such changes are included in net realized and unrealized gain or loss from investments on the Statement of Operations.
TF-19
Franklin Templeton Variable Insurance Products Trust
Notes to Financial Statements (continued)
Templeton Foreign Securities Fund
1. ORGANIZATION AND SIGNIFICANT ACCOUNTING POLICIES (continued)
b. Foreign Currency Translation (continued)
Realized foreign exchange gains or losses arise from sales of foreign currencies, currency gains or losses realized between the trade and settlement dates on securities transactions and the difference between the recorded amounts of dividends, interest, and foreign withholding taxes and the U.S. dollar equivalent of the amounts actually received or paid. Net unrealized foreign exchange gains and losses arise from changes in foreign exchange rates on foreign denominated assets and liabilities other than investments in securities held at the end of the reporting period.
c. Foreign Currency Contracts
When the Fund purchases or sells foreign securities it may enter into foreign exchange contracts to minimize foreign exchange risk from the trade date to the settlement date of the transactions. A foreign exchange contract is an agreement between two parties to exchange different currencies at an agreed upon exchange rate at a future date. Realized and unrealized gains and losses on these contracts are included in the Statement of Operations.
The risks of these contracts include movement in the values of the foreign currencies relative to the U.S. dollar and the possible inability of the counterparties to fulfill their obligations under the contracts, which may be in excess of the amount reflected in the Statement of Assets and Liabilities.
d. Income and Deferred Taxes
No provision has been made for U.S. income taxes because it is the Fund’s policy to qualify as a regulated investment company under the Internal Revenue Code and to distribute to shareholders substantially all of its taxable income and net realized gains.
Foreign securities held by the Fund may be subject to foreign taxation on dividend and interest income received. Foreign taxes, if any, are recorded based on the tax regulations and rates that exist in the foreign markets in which the Fund invests.
The Fund may be subject to a tax imposed on net realized gains on securities of certain foreign countries. The Fund records an estimated deferred tax liability for net unrealized gains on these securities in an amount that would be payable if the securities were disposed of on the valuation date.
The Fund has reviewed the tax positions, taken on federal income tax returns, for each of the three open tax years and as of December 31, 2008, and has determined that no provision for income tax is required in the Fund’s financial statements.
e. Security Transactions, Investment Income, Expenses and Distributions
Security transactions are accounted for on trade date. Realized gains and losses on security transactions are determined on a specific identification basis. Interest income and estimated expenses are accrued daily. Dividend income is recorded on the ex-dividend date except that certain dividends from foreign securities are recognized as soon as the Fund is notified of the ex-dividend date. Distributions to shareholders are recorded on the ex-dividend date and are determined according to income tax regulations (tax basis). Distributable earnings determined on a tax basis may differ from earnings recorded in accordance with accounting principles generally accepted in the United States of America. These differences may be permanent or temporary. Permanent differences are reclassified among capital accounts to reflect their tax character. These reclassifications have no impact on net assets or the results of operations. Temporary differences are not reclassified, as they may reverse in subsequent periods.
Common expenses incurred by the Trust are allocated among the funds based on the ratio of net assets of each fund to the combined net assets of the Trust. Fund specific expenses are charged directly to the fund that incurred the expense.
Realized and unrealized gains and losses and net investment income, not including class specific expenses, are allocated daily to each class of shares based upon the relative proportion of net assets of each class. Differences in per share distributions, by class, are generally due to differences in class specific expenses.
TF-20
Franklin Templeton Variable Insurance Products Trust
Notes to Financial Statements (continued)
Templeton Foreign Securities Fund
1. ORGANIZATION AND SIGNIFICANT ACCOUNTING POLICIES (continued)
f. Accounting Estimates
The preparation of financial statements in accordance with accounting principles generally accepted in the United States of America requires management to make estimates and assumptions that affect the reported amounts of assets and liabilities at the date of the financial statements and the amounts of income and expenses during the reporting period. Actual results could differ from those estimates.
g. Redemption Fees
Redemptions and exchanges of Class 3 shares held 60 days or less may be subject to the Fund’s redemption fee, which is 1% of the amount redeemed. Such fees are retained by the Fund and accounted for as an addition to paid-in capital.
h. Guarantees and Indemnifications
Under the Trust’s organizational documents, its officers and trustees are indemnified by the Trust against certain liabilities arising out of the performance of their duties to the Trust. Additionally, in the normal course of business, the Trust, on behalf of the Fund, enters into contracts with service providers that contain general indemnification clauses. The Trust’s maximum exposure under these arrangements is unknown as this would involve future claims that may be made against the Trust that have not yet occurred. Currently, the Trust expects the risk of loss to be remote.
2. SHARES OF BENEFICIAL INTEREST
At December 31, 2008, there were an unlimited number of shares authorized (without par value). Transactions in the Fund’s shares were as follows:
| | | | | | | | | | | | | | |
| | | Year Ended December 31, | |
| | | 2008a | | | 2007 | |
| Class 1 Shares: | | Shares | | | Amount | | | Shares | | | Amount | |
Shares sold | | 1,086,211 | | | $ | 16,606,956 | | | 1,232,157 | | | $ | 24,254,763 | |
Shares issued in reinvestment of distributions | | 2,996,945 | | | | 49,989,041 | | | 2,040,966 | | | | 39,941,697 | |
Shares redeemed | | (5,914,630 | ) | | | (86,835,532 | ) | | (8,769,318 | ) | | | (174,684,826 | ) |
| | | | |
Net increase (decrease) | | (1,831,474 | ) | | $ | (20,239,535 | ) | | (5,496,195 | ) | | $ | (110,488,366 | ) |
| | | | |
| Class 2 Shares: | | | | | | | | | | | | |
Shares sold | | 18,662,528 | | | $ | 282,933,070 | | | 20,015,006 | | | $ | 388,403,751 | |
Shares issued in reinvestment of distributions | | 18,582,156 | | | | 305,119,000 | | | 10,576,152 | | | | 204,013,968 | |
Shares redeemed | | (39,817,365 | ) | | | (599,632,132 | ) | | (26,940,536 | ) | | | (526,110,368 | ) |
| | | | |
Net increase (decrease) | | (2,572,681 | ) | | $ | (11,580,062 | ) | | 3,650,622 | | | $ | 66,307,351 | |
| | | | |
| Class 3 Shares: | | | | | | | | | | | | |
Shares sold | | 8,547,568 | | | $ | 149,148,052 | | | 7,292,215 | | | $ | 141,648,697 | |
Shares issued in reinvestment of distributions | | 2,567,834 | | | | 41,932,727 | | | 769,639 | | | | 14,792,452 | |
Shares redeemed | | (1,325,100 | ) | | | (18,063,525 | ) | | (578,013 | ) | | | (11,011,657 | ) |
| | | | |
Net increase (decrease) | | 9,790,302 | | | $ | 173,017,254 | | | 7,483,841 | | | $ | 145,429,492 | |
| | | | |
| Class 4 Shares: | | | | | | | | | | | | |
Shares sold | | 1,321,338 | | | $ | 17,596,379 | | | | | | | | |
Shares issued on reinvestment of distributions | | 13,018 | | | | 216,877 | | | | | | | | |
Shares redeemed | | (24,987 | ) | | | (290,530 | ) | | | | | | | |
| | | | | | | | | | |
Net increase (decrease) | | 1,309,369 | | | $ | 17,522,726 | | | | | | | | |
| | | | | | | | | | |
aFor | the period February 29, 2008 (effective date) to December 31, 2008, for Class 4. |
TF-21
Franklin Templeton Variable Insurance Products Trust
Notes to Financial Statements (continued)
Templeton Foreign Securities Fund
3. TRANSACTIONS WITH AFFILIATES
Franklin Resources, Inc. is the holding company for various subsidiaries that together are referred to as Franklin Templeton Investments. Certain officers and trustees of the Trust are also officers and/or directors of the following subsidiaries:
| | |
| Subsidiary | | Affiliation |
Templeton Investment Counsel, LLC (TIC) | | Investment manager |
Franklin Templeton Services, LLC (FT Services) | | Administrative manager |
Franklin Templeton Distributors, Inc. (Distributors) | | Principal underwriter |
Franklin Templeton Investor Services, LLC (Investor Services) | | Transfer agent |
a. Management Fees
The Fund pays an investment management fee to TIC based on the average daily net assets of the Fund as follows:
| | |
| Annualized Fee Rate | | Net Assets |
0.750% | | Up to and including $200 million |
0.675% | | Over $200 million, up to and including $1.3 billion |
0.600% | | Over $1.3 billion, up to and including $10 billion |
0.580% | | Over $10 billion, up to and including $15 billion |
0.560% | | Over $15 billion, up to and including $20 billion |
0.540% | | In excess of $20 billion |
b. Administrative Fees
The Fund pays an administrative fee to FT Services based on the Fund’s average daily net assets as follows:
| | |
| Annualized Fee Rate | | Net Assets |
0.150% | | Up to and including $200 million |
0.135% | | Over $200 million, up to and including $700 million |
0.100% | | Over $700 million, up to and including $1.2 billion |
0.075% | | In excess of $1.2 billion |
c. Distribution Fees
The Fund’s Board of Trustees has adopted distribution plans for Class 2, Class 3 and Class 4 shares pursuant to Rule 12b-1 under the 1940 Act. Under the Fund’s compensation distribution plans, the Fund pays Distributors for costs incurred in connection with the servicing, sale and distribution of the Fund’s shares up to 0.25%, 0.35% and 0.35% per year of its average daily net assets of Class 2, Class 3 and Class 4, respectively. The Board of Trustees has agreed to limit the current rate to 0.25% per year for Class 3.
d. Transfer Agent Fees
Investor Services, under terms of an agreement, performs shareholder servicing for the Fund and is not paid by the Fund for the services.
4. EXPENSE OFFSET ARRANGEMENT
The Fund has entered into an arrangement with its custodian whereby credits realized as a result of uninvested cash balances are used to reduce a portion of the Fund’s custodian expenses. During the year ended December 31, 2008, the custodian fees were reduced as noted in the Statement of Operations.
TF-22
Franklin Templeton Variable Insurance Products Trust
Notes to Financial Statements (continued)
Templeton Foreign Securities Fund
5. INCOME TAXES
For tax purposes, realized capital losses and realized currency losses occurring subsequent to October 31, may be deferred and treated as occurring on the first day of the following fiscal year. At December 31, 2008, the Fund deferred realized capital losses and realized currency losses of $31,132,573 and $533,772, respectively.
The tax character of distributions paid during the years ended December 31, 2008 and 2007, was as follows:
| | | | | | |
| | | 2008 | | 2007 |
Distributions paid from: | | | | | | |
Ordinary Income | | $ | 109,101,243 | | $ | 89,150,006 |
Long term capital gain | | | 289,304,238 | | | 170,238,938 |
| | | |
| | $ | 398,405,481 | | $ | 259,388,944 |
| | | |
At December 31, 2008, the cost of investments, net unrealized appreciation (depreciation), undistributed ordinary income and undistributed long term capital gains for income tax purposes were as follows:
| | | | |
Cost of investments | | $ | 3,003,340,158 | |
| | | | |
| |
Unrealized appreciation | | $ | 141,682,942 | |
Unrealized depreciation | | | (898,752,009 | ) |
| | | | |
Net unrealized appreciation (depreciation) | | $ | (757,069,067 | ) |
| | | | |
| | | | |
Undistributed ordinary income | | $ | 81,183,999 | |
Undistributed long term capital gains | | | 99,920,625 | |
| | | | |
Distributable earnings | | $ | 181,104,624 | |
| | | | |
Net investment income differs for financial statement and tax purposes primarily due to differing treatments of foreign currency transactions and pass-through entity income.
Net realized gains (losses) differ for financial statement and tax purposes primarily due to differing treatments of wash sales, foreign currency transactions and pass-through entity income.
6. INVESTMENT TRANSACTIONS
Purchases and sales of investments (excluding short term securities) for the year ended December 31, 2008, aggregated $568,494,976 and $680,577,471, respectively.
7. INVESTMENTS IN FRANKLIN INSTITUTIONAL FIDUCIARY TRUST MONEY MARKET PORTFOLIO
The Fund may invest in the Franklin Institutional Fiduciary Trust Money Market Portfolio (Sweep Money Fund), an open-end investment company managed by Franklin Advisers, Inc. (an affiliate of the investment manager). Management fees paid by the Fund are reduced on assets invested in the Sweep Money Fund, in an amount not to exceed the management and administrative fees paid by the Sweep Money Fund.
8. CONCENTRATION OF RISK
Investing in foreign securities may include certain risks and considerations not typically associated with investing in U.S. securities, such as fluctuating currency values and changing local and regional economic, political and social conditions, which may result in greater market volatility. In addition, certain foreign securities may not be as liquid as U.S. securities.
TF-23
Franklin Templeton Variable Insurance Products Trust
Notes to Financial Statements (continued)
Templeton Foreign Securities Fund
9. FAIR VALUE MEASUREMENTS
The Fund adopted Financial Accounting Standards Board (FASB) Statement No. 157, “Fair Value Measurement” (SFAS 157), on January 1, 2008. SFAS 157 defines fair value, establishes a framework for measuring fair value, and expands disclosures about fair value measurements. The Fund has determined that the implementation of SFAS 157 did not have a material impact on the Fund’s financial statements.
SFAS 157 establishes a fair value hierarchy that distinguishes between market data obtained from independent sources (observable inputs) and the Fund’s own market assumptions (unobservable inputs). These inputs are used in determining the value of the Fund’s investments and are summarized in the following fair value hierarchy:
| | • | | Level 1 – quoted prices in active markets for identical securities |
| | • | | Level 2 – other significant observable inputs (including quoted prices for similar securities, interest rates, prepayment speed, credit risk, etc.) |
| | • | | Level 3 – significant unobservable inputs (including the fund’s own assumptions in determining the fair value of investments) |
The inputs or methodology used for valuing securities are not an indication of the risk associated with investing in those securities.
The following is a summary of the inputs used as of December 31, 2008, in valuing the Fund’s assets carried at fair value:
| | | | | | | | | | | | |
| | | Level 1 | | Level 2 | | Level 3 | | Total |
Assets: | | | | | | | | | | | | |
Investments in Securities | | $ | 2,096,690,773 | | $ | 149,580,318 | | $ | — | | $ | 2,246,271,091 |
10. NEW ACCOUNTING PRONOUNCEMENT
In March 2008, FASB issued FASB Statement No. 161, “Disclosures about Derivative Instruments and Hedging Activities, an amendment of FASB Statement No. 133” (SFAS 161), which expands disclosures about derivative investments and hedging activities. SFAS 161 is effective for fiscal years and interim periods beginning after November 15, 2008. The Fund is currently evaluating the impact, if any, of applying the various provisions of SFAS 161.
11. SUBSEQUENT EVENT
On January 23, 2009, the Fund entered into, along with other funds managed by Franklin Templeton Investments (individually, “Borrower”; collectively “Borrowers”), a $725 million senior unsecured syndicated global line of credit (“Global Credit Facility”) to provide a source of funds to the Borrowers for temporary and emergency purposes and to meet future unanticipated or unusually large redemption requests.
Under the terms of the Global Credit Facility, each Borrower has agreed to pay its proportionate share of fees and expenses incurred in connection with the implementation and maintenance of the Global Credit Facility.
ABBREVIATIONS
Selected Portfolio
ADR - American Depository Receipt
TF-24
Franklin Templeton Variable Insurance Products Trust
Templeton Foreign Securities Fund
Report of Independent Registered Public Accounting Firm
To the Board of Trustees and Shareholders of Franklin Templeton Variable Insurance Products Trust
In our opinion, the accompanying statement of assets and liabilities, including the statement of investments, and the related statements of operations and of changes in net assets and the financial highlights present fairly, in all material respects, the financial position of Templeton Foreign Securities Fund (one of the funds constituting the Franklin Templeton Variable Insurance Products Trust, hereafter referred to as the “Fund”) at December 31, 2008, the results of its operations for the year then ended, the changes in its net assets for each of the two years in the period then ended and the financial highlights for the periods presented, in conformity with accounting principles generally accepted in the United States of America. These financial statements and financial highlights (hereafter referred to as “financial statements”) are the responsibility of the Fund’s management. Our responsibility is to express an opinion on these financial statements based on our audits. We conducted our audits of these financial statements in accordance with the standards of the Public Company Accounting Oversight Board (United States). Those standards require that we plan and perform the audit to obtain reasonable assurance about whether the financial statements are free of material misstatement. An audit includes examining, on a test basis, evidence supporting the amounts and disclosures in the financial statements, assessing the accounting principles used and significant estimates made by management, and evaluating the overall financial statement presentation. We believe that our audits, which included confirmation of securities at December 31, 2008 by correspondence with the custodian, provide a reasonable basis for our opinion.
PricewaterhouseCoopers LLP
San Francisco, California
February 10, 2009
TF-25
Franklin Templeton Variable Insurance Products Trust
Tax Designation (unaudited)
Templeton Foreign Securities Fund
Under Section 852(b)(3)(C) of the Internal Revenue Code (Code), the Fund designates the maximum amount allowable but no less than $289,304,240 as a long term capital gain dividend for the fiscal year ended December 31, 2008.
At December 31, 2008, more than 50% of the Fund’s total assets were invested in securities of foreign issuers. In most instances, foreign taxes were withheld from income paid to the Fund on these investments. The Fund elects to treat foreign taxes paid as allowed under Section 853 of the Code. This election will allow shareholders of record as of the 2009 distribution date, to treat their proportionate share of foreign taxes paid by the Fund as having been paid directly by them. The shareholder shall consider these amounts as foreign taxes paid in the tax year in which they receive the Fund distribution.
TF-26
TEMPLETON GLOBAL ASSET ALLOCATION FUND
This annual report for Templeton Global Asset Allocation Fund covers the fiscal year ended December 31, 2008.
Performance Summary as of 12/31/08
Average annual total return of Class 1 shares* represents the average annual change in value, assuming reinvestment of dividends and capital gains. Average returns smooth out variations in returns, which can be significant; they are not the same as year-by-year results.
Periods ended 12/31/08
| | | | | | |
| | | 1-Year | | 5-Year | | 10-Year |
Average Annual Total Return | | -24.97% | | +3.88% | | +5.49% |
*Performance prior to the 5/1/00 merger reflects historical performance of Templeton Asset Allocation Fund. Effective 8/1/07, the investment manager and administrator have contractually agreed to waive or limit their respective fees and to assume as their own expense certain expenses otherwise payable by the Fund, exclusive of acquired fund fees and expenses, so that net annual Fund operating expenses do not exceed 0.83% (other than certain non-routine expenses or costs, including those relating to litigation, indemnification, reorganizations and liquidations) until 4/30/09.
Total Return Index Comparison for a Hypothetical $10,000 Investment (1/1/99–12/31/08)
The graph below shows the change in value of a hypothetical $10,000 investment in the Fund over the indicated period and includes reinvestment of any income or distributions. The Fund’s performance* is compared to the performance of the Morgan Stanley Capital International (MSCI) All Country (AC) World Index and the J.P. Morgan (JPM) Government Bond Index (GBI) Global. One cannot invest directly in an index, nor is an index representative of the Fund’s portfolio. Please see Important Notes to Performance Information preceding the Fund Summaries.

**Source: © 2009 Morningstar. Please see Index Descriptions following the Fund Summaries.
Templeton Global Asset Allocation Fund – Class 1
Performance reflects the Fund’s Class 1 operating expenses, but does not include any contract fees, expenses or sales charges. If they had been included, performance would be lower. These charges and deductions, particularly for variable life policies, can have a significant effect on contract values and insurance benefits. See the contract prospectus for a complete description of these expenses, including sales charges.
Performance data represent past performance, which does not guarantee future results. Investment return and principal value will fluctuate, and you may have a gain or loss when you sell your shares. Current performance may differ from figures shown.
TGA-1
Fund Goal and Main Investments: Templeton Global Asset Allocation Fund seeks high total return. The Fund normally invests in equity securities of companies of any country, debt securities of companies and governments of any country, and in money market securities. The Fund normally invests substantially to primarily in equity securities.
Performance Overview
You can find the Fund’s one-year total return in the Performance Summary. The Fund performed better than its broad equity benchmark, the MSCI AC World Index, which had a -41.85% total return for the year under review, and underperformed its fixed income benchmark, the JPM GBI Global, which returned +12.00% for the same period.1
Economic and Market Overview
During 2008, the global economy felt the effects of decelerating growth in the U.S. where housing prices declined, consumer demand softened, and a credit crisis originally related to U.S. subprime loan losses intensified. Fear of recession spanned the entire period, and in the summer most economists agreed that a recession had already begun. By then, the faltering U.S. economy had negatively impacted growth prospects around the world. Although growth in the first half of the year was robust in developing economies, particularly in Asia, signs of a global slowdown surfaced in the latter half.
In an environment of extremely high commodity prices that increased inflationary pressure, the world’s monetary authorities faced the choice of lowering short-term interest rates to stimulate growth or raising them to fight rising inflation. Stimulus provided through fiscal and monetary policies implemented around the globe sought to restore financial market stability and reignite economic growth. The U.S. Treasury and the Federal Reserve Board took unprecedented steps, including lowering short-term rates to near 0% from 4.25%. The European Central Bank (ECB) and many of the world’s other central banks had raised rates due to inflationary pressures. Later in the year, the potential for global recession trumped inflationary concerns, and the world’s monetary authorities cut interest rates aggressively. The U.S. dollar, which had declined earlier in the period versus many of the world’s currencies, regained ground quickly toward period-end as a flight to the relative safety of U.S. Treasuries prevailed.
1. Source: © 2009 Morningstar. One cannot invest directly in an index, nor is an index representative of the Fund’s portfolio. Please see Index Descriptions following the Fund Summaries.
Fund Risks: The Fund’s investments in stocks offer the potential for long-term gains but can be subject to short-term price fluctuations. Foreign investing, especially in emerging markets, involves additional risks, including currency fluctuations, economic instability, market volatility, and political and social instability. Because the Fund invests in bonds and other debt obligations, its share price and yield will be affected by interest rate movements. Bond prices generally move in the opposite direction of interest rates. Thus, as prices of bonds in the Fund adjust to a rise in interest rates, the Fund’s share price may decline. The Fund’s prospectus also includes a description of the main investment risks.
TGA-2
In this challenging economic time, volatility came to define global equity markets. Virtually all local indexes ended the 12-month period with marked losses. Despite negative economic data and an outlook for decelerating corporate earnings and profit margins globally, many companies outside the financials sector retained relatively strong balance sheets.
Lower interest rates from many central banks benefited long duration, developed government bonds. Additionally, a significant flight to quality favored a small group of developed country government bonds and currencies as investors indiscriminately sought to reduce risk. Several governments planned to cushion their economic slowdowns with increased government spending. In many of these countries, however, the downturn did not occur until late in the year and inflation remained elevated, which limited the extent of counter-cyclical response, particularly in Latin America. In Europe, the ECB’s policy response remained two-pronged, including interest rate reductions and unprecedented and unlimited liquidity expansion to the banking system. However, the fiscal response was small and poorly coordinated across the region. Following several years of rapid expansion, fueled by credit extension from European banks, many non-eurozone European countries’ imbalances were revealed. Some central and eastern European economies asked the International Monetary Fund for support.
Asia’s economic growth did not fall as sharply as in the U.S. and Europe. Current accounts remained relatively stable and actually improved for some net commodity importers such as South Korea. Asian countries largely did not face balance of payment pressure during the year. Furthermore, with substantial international reserves and favorable conditions from official financing sources, most had some ability to cushion the external shock. Authorities sought to take advantage of this flexibility through monetary and fiscal easing. The Asian banking sector seemed likely to come under some stress; however, it appeared fairly stable as banks have largely deleveraged since the 1997 financial crisis.
Investment Strategy
Our investment philosophy is bottom up, value oriented and long term. In choosing equity investments, we will focus on the market price of a company’s securities relative to our evaluation of the company’s potential long-term earnings, asset value and cash flow. Among factors we may consider are a company’s historical value measures, including price/earnings ratio, profit margins and liquidation value.
What is duration?
Duration is a measure of a bond’s price sensitivity to interest rate changes. In general, a portfolio of securities with a lower duration can be expected to be less sensitive to interest rate changes than a portfolio with a higher duration.
What is a current account?
A current account is that part of the balance of payments where all of one country’s international transactions in goods and services are recorded.
What is balance of payments?
Balance of payments is a record of all of a country’s exports and imports of goods and services, borrowing and lending with the rest of the world during a particular time period. It helps a country evaluate its competitive strengths and weaknesses and forecast the strength of its currency.
TGA-3
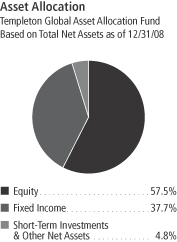
In choosing debt investments, we allocate our assets among issuers, geographic regions and currencies based upon our assessment of relative interest rates among currencies, our outlook for changes in interest rates among currencies, and credit risks. With respect to debt securities, we may utilize forward currency exchange contracts.
Manager’s Discussion
Equity
During the year under review, stock selection and underweighting in the materials sector helped the Fund’s performance relative to the benchmark index.2 Notable among these stocks were Finnish paper products manufacturer UPM-Kymmene and Australian packaging products company Amcor.
An underweighting in the troubled financials sector also boosted relative Fund performance for the year.3 Contributors included Swiss insurers ACE4 and Swiss Reinsurance.
Stock selection and an underweighted allocation in the consumer discretionary sector also positively impacted relative returns.5 Several U.K.-based companies, including food services provider Compass Group and publisher Pearson, aided relative Fund results.
Although the Fund performed better than its equity benchmark, some factors negatively affected relative performance. For example, the Fund’s underweighted exposure to the consumer staples sector, which performed better than the overall index, detracted from relative results.6 An overweighted allocation and stock selection in the telecommunications services sector, and an underweighting and stock selection in the industrials sector, also hindered relative results.7
Additionally, the Fund’s relative returns suffered from the Fund’s stock selection in the information technology sector.8 Stocks that lost value in this sector included semiconductor manufacturer Infineon Technologies (Germany), and electronic component manufacturers Flextronics (Singapore)4 and Lite-On Technology (Taiwan).4
2. The materials sector comprises paper and forest products in the SOI.
3. The financials sector comprises capital markets, commercial banks, diversified financial services, insurance, and real estate management and development in the SOI.
4. This holding is not an index component.
5. The consumer discretionary sector comprises auto components; automobiles; hotels, restaurants and leisure; media; and specialty retail in the SOI.
6. The consumer staples sector comprises food products and beverages in the SOI.
7. The telecommunication services sector comprises diversified telecommunication services and wireless telecommunication services in the SOI. The industrials sector comprises aerospace and defense, air freight and logistics, electrical equipment, industrial conglomerates, and trading companies and distributors in the SOI.
8. The information technology sector comprises communications equipment; computers and peripherals; electronic equipment, instruments and components; semiconductors and semiconductor equipment; and software in the SOI.
TGA-4
It is important to recognize the effect of currency movements on the Fund’s performance. In general, if the value of the U.S. dollar goes up compared with a foreign currency, an investment traded in that foreign currency will go down in value because it will be worth fewer U.S. dollars. This can have a negative effect on Fund performance. Conversely, when the U.S. dollar weakens in relation to a foreign currency, an investment traded in that foreign currency will increase in value, which can contribute to Fund performance. For the 12 months ended December 31, 2008, the U.S. dollar appreciated in value relative to most non-U.S. currencies. As a result, the Fund’s performance (equity portion) was negatively affected by the portfolio’s substantial investment in securities with non-U.S. currency exposure.
Fixed Income
In 2008, the global economy and financial system were hit by multiple shocks, which resulted in significant market turbulence. Given this backdrop, the Fund provided positive results largely due to diversification and our actively managed fundamental investment strategy. The Fund’s total return was influenced by various factors, including interest rate developments, currency movements and exposure to sovereign debt markets.
Interest Rate Strategy
For much of the year, a disconnect existed between interest rates charged by the market and many countries’ underlying fundamentals. The flight to quality into developed market government bonds and developing economies’ commodity-driven inflationary pressures led markets to price in decoupling of global growth we believed was unrealistic where interest rates would stay high outside the largest developed economies. However, toward year-end, interest rate cuts began to be priced in around the globe, leading to strong returns for the Fund’s New Zealand, Australian, South Korean and Mexican duration exposures. Duration exposure contributed significantly to absolute performance due to these select positions. However, on a relative basis, the Fund’s diversified exposures underperformed the more concentrated benchmark due to the strong rally in U.S., British and Japanese Treasury bonds. The Fund continued to see value in bonds outside of these three core economies due to higher relative yields.
Currency Strategy
The Fund’s diverse currency exposure produced mixed results despite its ongoing commitment to holding only currencies of economies with
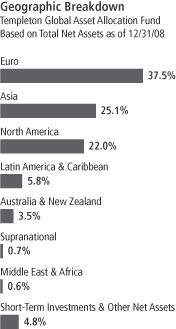
TGA-5
Top Five Countries
Templeton Global Asset Allocation Fund 12/31/08
| | |
| | | % of Total
Net Assets |
| |
| U.S. | | 21.9% |
| |
| U.K. | | 9.8% |
| |
| Malaysia | | 8.8% |
| |
| South Korea | | 7.2% |
| |
| Poland | | 5.5% |
Top Five Sectors/Industries
Templeton Global Asset Allocation Fund
Based on Equity Securities
12/31/08
| | |
| | | % of Total
Net Assets |
| |
| Pharmaceuticals | | 8.6% |
| |
| Media | | 5.8% |
| |
| Diversified Telecommunication Services | | 5.1% |
| |
| Oil, Gas & Consumable Fuels | | 4.3% |
| |
| Software | | 4.1% |
The dollar value, number of shares or principal amount, and names of all portfolio holdings are listed in the Fund’s Statement of Investments (SOI).
strong underlying fundamentals. For example, the Fund attempted to capitalize on accelerating worldwide deleveraging by investing in the Japanese yen and Swiss franc, which were low-yielding currencies from countries with external surpluses. These currencies benefited from local investors’ repatriation of international investments as risk aversion rose. The currencies of these countries, who are net creditors, became safe havens within the turmoil. Additionally, the Fund’s underweighted exposure to the euro benefited relative performance as the credit crunch became a significant global problem leading to difficulties for the leveraged European economy and lower interest rates from the ECB. Although the Fund correctly identified the euro as overvalued at close to its all-time high, several other currency exposures hurt relative performance as extreme risk aversion led to some currencies trading out of line with their relative fundamentals. The Brazilian real, Indonesian rupiah and Malaysian ringgit depreciated against the U.S. dollar during the year despite those countries’ strong relative economic growth and trade surpluses.
Global Sovereign Debt Strategy
The Fund maintained limited exposure to U.S.-dollar denominated sovereign credit during the year because of what we considered unattractive valuations. However, the sell-off in some bond markets due to forced selling by hedge funds and deleveraging by the sell-side broker community pushed down valuations past levels we viewed as consistent with medium-term valuations. This indiscriminate risk reduction allowed us an opportunity to add to our sovereign bond positions at what were to us attractive, depressed levels. It is worth highlighting the substantial improvement in sovereign credit fundamentals compared with prior episodes of volatility. Importantly, many governments’ external debt burdens during the period were lower than in the 1990s. Although some countries may likely experience crises, we believed the indiscriminate sell-off of risky assets created select opportunities where markets may have overpriced sovereign default risk.
Thank you for your participation in Templeton Global Asset Allocation Fund. We look forward to serving your future investment needs.
The foregoing information reflects our analysis, opinions and portfolio holdings as of December 31, 2008, the end of the reporting period. The way we implement our main investment strategies and the resulting portfolio holdings may change depending on factors such as market and economic conditions. These opinions may not be relied upon as investment advice or an offer for a particular security. The information is not a complete analysis of every aspect of any market, country, industry, security or the Fund. Statements of fact are from sources considered reliable, but the investment manager makes no representation or warranty as to their completeness or accuracy. Although historical performance is no guarantee of future results, these insights may help you understand our investment management philosophy.
TGA-6
Fund Expenses
As an investor in a variable insurance contract (Contract) that indirectly provides for investment in an underlying mutual fund, you can incur transaction and/or ongoing expenses at both the Fund level and the Contract level.
| • | | Transaction expenses can include sales charges (loads) on purchases, redemption fees, surrender fees, transfer fees and premium taxes. |
| • | | Ongoing expenses can include management fees, distribution and service (12b-1) fees, contract fees, annual maintenance fees, mortality and expense risk fees and other fees and expenses. All mutual funds and Contracts have some types of ongoing expenses. |
The expenses shown in the table are meant to highlight ongoing expenses at the Fund level only and do not include ongoing expenses at the Contract level, or transaction expenses at either the Fund or Contract level. While the Fund does not have transaction expenses, if the transaction and ongoing expenses at the Contract level were included, the expenses shown below would be higher. You should consult your Contract prospectus or disclosure document for more information.
The table shows Fund-level ongoing expenses and can help you understand these expenses and compare them with those of other mutual funds offered through the Contract. The table assumes a $1,000 investment held for the six months indicated. Please refer to the Fund prospectus for additional information on operating expenses.
Actual Fund Expenses
The first line (Actual) of the table provides actual account values and expenses. The “Ending Account Value” is derived from the Fund’s actual return, which includes the effect of ongoing Fund expenses, but does not include the effect of ongoing Contract expenses.
You can estimate the Fund-level expenses you incurred during the period by following these steps. Of course, your account value and expenses will differ from those in this illustration:
| 1. | Divide your account value by $1,000. |
If an account had an $8,600 value, then $8,600 ÷ $1,000 = 8.6.
| 2. | Multiply the result by the number under the heading “Fund-Level Expenses Incurred During Period.” |
If Fund-Level Expenses Incurred During Period were $7.50, then 8.6 x $7.50 = $64.50.
In this illustration, the estimated expenses incurred this period at the Fund level are $64.50.
Templeton Global Asset Allocation Fund – Class 1
TGA-7
Hypothetical Example for Comparison with Other Mutual Funds
Information in the second line (Hypothetical) of the table can help you compare ongoing expenses of the Fund with those of other mutual funds offered through the Contract. This information may not be used to estimate the actual ending account balance or expenses you incurred during the period. The hypothetical “Ending Account Value” is based on the Fund’s actual expense ratio and an assumed 5% annual rate of return before expenses, which does not represent the Fund’s actual return. The figure under the heading “Fund-Level Expenses Incurred During Period” shows the hypothetical expenses your account would have incurred under this scenario. You can compare this figure with the 5% hypothetical examples that appear in shareholder reports of other funds offered through a Contract.
| | | | | | | | | |
| Class 1 | | Beginning
Account Value 7/1/08 | | Ending Account Value 12/31/08 | | Fund-Level
Expenses Incurred
During Period*
7/1/08–12/31/08 |
Actual | | $ | 1,000 | | $ | 801.30 | | $ | 3.76 |
Hypothetical (5% return before expenses) | | $ | 1,000 | | $ | 1,020.96 | | $ | 4.22 |
*Expenses are calculated using the most recent six-month annualized expense ratio, net of expense waiver, for the Fund’s Class 1 shares (0.83%), which does not include any ongoing expenses of the Contract for which the Fund is an investment option, multiplied by the average account value over the period, multiplied by 184/366 to reflect the one-half year period.
TGA-8
Franklin Templeton Variable Insurance Products Trust
Financial Highlights
Templeton Global Asset Allocation Fund
| | | | | | | | | | | | | | | | | | | | |
| | | Year Ended December 31, | |
| Class 1 | | 2008 | | | 2007 | | | 2006 | | | 2005 | | | 2004 | |
| | | | |
Per share operating performance | | | | | | | | | | | | | | | | | | | | |
(for a share outstanding throughout the year) | | | | | | | | | | | | | | | | | | | | |
Net asset value, beginning of year | | $ | 14.75 | | | $ | 21.96 | | | $ | 21.06 | | | $ | 21.11 | | | $ | 18.78 | |
| | | | |
Income from investment operationsa: | | | | | | | | | | | | | | | | | | | | |
Net investment incomeb | | | 0.39 | | | | 0.53 | | | | 0.64 | | | | 0.49 | | | | 0.48 | |
Net realized and unrealized gains (losses) | | | (3.40 | ) | | | 1.58 | | | | 3.36 | | | | 0.28 | | | | 2.42 | |
| | | | |
Total from investment operations | | | (3.01 | ) | | | 2.11 | | | | 4.00 | | | | 0.77 | | | | 2.90 | |
| | | | |
Less distributions from: | | | | | | | | | | | | | | | | | | | | |
Net investment income and net foreign currency gains | | | (1.40 | ) | | | (4.06 | ) | | | (1.66 | ) | | | (0.82 | ) | | | (0.57 | ) |
Net realized gains | | | (1.71 | ) | | | (5.26 | ) | | | (1.44 | ) | | | — | | | | — | |
| | | | |
Total distributions | | | (3.11 | ) | | | (9.32 | ) | | | (3.10 | ) | | | (0.82 | ) | | | (0.57 | ) |
| | | | |
Net asset value, end of year | | $ | 8.63 | | | $ | 14.75 | | | $ | 21.96 | | | $ | 21.06 | | | $ | 21.11 | |
| | | | |
| | | | | |
Total returnc | | | (24.97)% | | | | 10.32% | | | | 21.39% | | | | 3.85% | | | | 15.94% | |
Ratios to average net assets | | | | | | | | | | | | | | | | | | | | |
Expenses before waiver and payments by affiliates | | | 0.94% | | | | 0.88% | | | | 0.84% | | | | 0.85% | | | | 0.84% | |
Expenses net of waiver and payments by affiliatesd | | | 0.83% | | | | 0.85% | | | | 0.84% | | | | 0.85% | | | | 0.84% | |
Net investment income | | | 3.34% | | | | 2.77% | | | | 2.91% | | | | 2.36% | | | | 2.52% | |
| | | | | |
Supplemental data | | | | | | | | | | | | | | | | | | | | |
Net assets, end of year (000’s) | | $ | 37,619 | | | $ | 63,316 | | | $ | 276,790 | | | $ | 638,006 | | | $ | 625,728 | |
Portfolio turnover rate | | | 20.11% | | | | 30.08% | e | | | 23.74% | e | | | 26.23% | | | | 27.43% | |
aThe amount shown for a share outstanding throughout the period may not correlate with the Statement of Operations for the period due to the timing of sales and repurchases of the Fund shares in relation to income earned and/or fluctuating market value of the investments of the Fund.
bBased on average daily shares outstanding.
cTotal return does not include any fees, charges or expenses imposed by the variable annuity and life insurance contracts for which the Franklin Templeton Variable Insurance Products Trust serves as an underlying investment vehicle.
dBenefit of expense reduction rounds to less than 0.01%.
eExcludes the value of portfolio securities delivered as a result of a redemption in-kind.
The accompanying notes are an integral part of these financial statements.
TGA-9
Franklin Templeton Variable Insurance Products Trust
Financial Highlights (continued)
Templeton Global Asset Allocation Fund
| | | | | | | | | | | | | | | | | | | | |
| | | Year Ended December 31, | |
| Class 2 | | 2008 | | | 2007 | | | 2006 | | | 2005 | | | 2004 | |
| | | | |
Per share operating performance | | | | | | | | | | | | | | | | | | | | |
(for a share outstanding throughout the year) | | | | | | | | | | | | | | | | | | | | |
Net asset value, beginning of year | | $ | 14.52 | | | $ | 21.75 | | | $ | 20.88 | | | $ | 20.94 | | | $ | 18.64 | |
| | | | |
Income from investment operationsa: | | | | | | | | | | | | | | | | | | | | |
Net investment incomeb | | | 0.35 | | | | 0.46 | | | | 0.52 | | | | 0.43 | | | | 0.43 | |
Net realized and unrealized gains (losses) | | | (3.34 | ) | | | 1.58 | | | | 3.40 | | | | 0.29 | | | | 2.41 | |
| | | | |
Total from investment operations | | | (2.99 | ) | | | 2.04 | | | | 3.92 | | | | 0.72 | | | | 2.84 | |
| | | | |
Less distributions from: | | | | | | | | | | | | | | | | | | | | |
Net investment income and net foreign currency gains | | | (1.36 | ) | | | (4.01 | ) | | | (1.61 | ) | | | (0.78 | ) | | | (0.54 | ) |
Net realized gains | | | (1.71 | ) | | | (5.26 | ) | | | (1.44 | ) | | | — | | | | — | |
| | | | |
Total distributions | | | (3.07 | ) | | | (9.27 | ) | | | (3.05 | ) | | | (0.78 | ) | | | (0.54 | ) |
| | | | |
Net asset value, end of year | | $ | 8.46 | | | $ | 14.52 | | | $ | 21.75 | | | $ | 20.88 | | | $ | 20.94 | |
| | | | |
| | | | | |
Total returnc | | | (25.10)% | | | | 10.01% | | | | 21.11% | | | | 3.55% | | | | 15.72% | |
Ratios to average net assets | | | | | | | | | | | | | | | | | | | | |
Expenses before waiver and payments by affiliates | | | 1.19% | | | | 1.13% | | | | 1.09% | | | | 1.10% | | | | 1.09% | |
Expenses net of waiver and payments by affiliatesd | | | 1.08% | | | | 1.10% | | | | 1.09% | | | | 1.10% | | | | 1.09% | |
Net investment income | | | 3.09% | | | | 2.52% | | | | 2.66% | | | | 2.11% | | | | 2.27% | |
| | | | | |
Supplemental data | | | | | | | | | | | | | | | | | | | | |
Net assets, end of year (000’s) | | $ | 48,351 | | | $ | 78,613 | | | $ | 78,021 | | | $ | 68,385 | | | $ | 65,806 | |
Portfolio turnover rate | | | 20.11% | | | | 30.08% | e | | | 23.74% | e | | | 26.23% | | | | 27.43% | |
aThe amount shown for a share outstanding throughout the period may not correlate with the Statement of Operations for the period due to the timing of sales and repurchases of the Fund shares in relation to income earned and/or fluctuating market value of the investments of the Fund.
bBased on average daily shares outstanding.
cTotal return does not include any fees, charges or expenses imposed by the variable annuity and life insurance contracts for which the Franklin Templeton Variable Insurance Products Trust serves as an underlying investment vehicle.
dBenefit of expense reduction rounds to less than 0.01%.
eExcludes the value of portfolio securities delivered as a result of a redemption in-kind.
The accompanying notes are an integral part of these financial statements.
TGA-10
Franklin Templeton Variable Insurance Products Trust
Financial Highlights (continued)
Templeton Global Asset Allocation Fund
| | | | |
| Class 4 | | Period Ended December 31,
2008a | |
| | | | |
Per share operating performance | | | | |
(for a share outstanding throughout the period) | | | | |
Net asset value, beginning of period | | $ | 14.23 | |
| | | | |
Income from investment operationsb: | | | | |
Net investment incomec | | | 0.31 | |
Net realized and unrealized gains (losses) | | | (2.82 | ) |
| | | | |
Total from investment operations | | | (2.51 | ) |
| | | | |
Less distributions from: | | | | |
Net investment income and net foreign currency gains | | | (1.40 | ) |
Net realized gains | | | (1.71 | ) |
| | | | |
Total distributions | | | (3.11 | ) |
| | | | |
Net asset value, end of period | | $ | 8.61 | |
| | | | |
| |
Total returnd | | | (22.39)% | |
Ratios to average net assetse | | | | |
Expenses before waiver and payments by affiliates | | | 1.29% | |
Expenses net of waiver and payments by affiliatesf | | | 1.18% | |
Net investment income | | | 2.99% | |
| |
Supplemental data | | | | |
Net assets, end of period (000’s) | | $ | 3 | |
Portfolio turnover rate | | | 20.11% | |
aFor the period February 29, 2008 (effective date) to December 31, 2008.
bThe amount shown for a share outstanding throughout the period may not correlate with the Statement of Operations for the period due to the timing of sales and repurchases of the Fund shares in relation to income earned and/or fluctuating market value of the investments of the Fund.
cBased on average daily shares outstanding.
dTotal return does not include any fees, charges or expenses imposed by the variable annuity and life insurance contracts for which the Franklin Templeton Variable Insurance Products Trust serves as an underlying investment vehicle. Total return is not annualized for periods less than one year.
eRatios are annualized for periods less than one year.
fBenefit of expense reduction rounds to less than 0.01%.
The accompanying notes are an integral part of these financial statements.
TGA-11
Franklin Templeton Variable Insurance Products Trust
Statement of Investments, December 31, 2008
| | | | | | | |
| Templeton Global Asset Allocation Fund | | Country | | Shares/
Rights/
Warrants | | Value |
Common Stocks, Rights and Warrants 56.9% | | | | | | | |
Aerospace & Defense 1.2% | | | | | | | |
BAE Systems PLC | | United Kingdom | | 117,072 | | $ | 644,203 |
aRaytheon Co., wts., 6/16/11 | | United States | | 63 | | | 1,002 |
aRolls-Royce Group PLC | | United Kingdom | | 83,152 | | | 407,457 |
| | | | | | | |
| | | | | | | 1,052,662 |
| | | | | | | |
Air Freight & Logistics 1.5% | | | | | | | |
Deutsche Post AG | | Germany | | 44,767 | | | 738,966 |
United Parcel Service Inc., B | | United States | | 9,570 | | | 527,881 |
| | | | | | | |
| | | | | | | 1,266,847 |
| | | | | | | |
Automobiles 0.9% | | | | | | | |
Bayerische Motoren Werke AG | | Germany | | 17,098 | | | 525,262 |
Toyota Motor Corp., ADR | | Japan | | 3,590 | | | 234,929 |
| | | | | | | |
| | | | | | | 760,191 |
| | | | | | | |
Beverages 0.7% | | | | | | | |
aDr. Pepper Snapple Group Inc. | | United States | | 38,290 | | | 622,212 |
| | | | | | | |
Biotechnology 1.1% | | | | | | | |
aAmgen Inc. | | United States | | 16,290 | | | 940,747 |
| | | | | | | |
Capital Markets 0.5% | | | | | | | |
The Bank of New York Mellon Corp. | | United States | | 15,410 | | | 436,565 |
Nomura Holdings Inc. | | Japan | | 6 | | | 50 |
| | | | | | | |
| | | | | | | 436,615 |
| | | | | | | |
Commercial Banks 2.0% | | | | | | | |
DBS Group Holdings Ltd. | | Singapore | | 59,486 | | | 349,649 |
aDBS Group Holdings Ltd., rts., 1/20/09 | | Singapore | | 29,743 | | | 62,289 |
HSBC Holdings PLC | | United Kingdom | | 22,723 | | | 216,083 |
Intesa Sanpaolo SpA | | Italy | | 111,770 | | | 396,581 |
aKB Financial Group Inc., ADR | | South Korea | | 10,329 | | | 270,620 |
Mitsubishi UFJ Financial Group Inc. | | Japan | | 36,000 | | | 226,078 |
Sumitomo Mitsui Financial Group Inc. | | Japan | | 4,800 | | | 207,752 |
| | | | | | | |
| | | | | | | 1,729,052 |
| | | | | | | |
Commercial Services & Supplies 0.9% | | | | | | | |
G4S PLC | | United Kingdom | | 264,658 | | | 792,420 |
| | | | | | | |
Communications Equipment 0.7% | | | | | | | |
aCisco Systems Inc. | | United States | | 35,880 | | | 584,844 |
| | | | | | | |
Computers & Peripherals 0.6% | | | | | | | |
Lite-On Technology Corp. | | Taiwan | | 423,931 | | | 277,447 |
Seagate Technology | | United States | | 50,128 | | | 222,067 |
| | | | | | | |
| | | | | | | 499,514 |
| | | | | | | |
Construction Materials 0.2% | | | | | | | |
CRH PLC | | Ireland | | 6,020 | | | 151,520 |
| | | | | | | |
Consumer Finance 0.4% | | | | | | | |
Aiful Corp. | | Japan | | 49 | | | 141 |
Promise Co. Ltd. | | Japan | | 14,250 | | | 361,152 |
| | | | | | | |
| | | | | | | 361,293 |
| | | | | | | |
TGA-12
Franklin Templeton Variable Insurance Products Trust
Statement of Investments, December 31, 2008 (continued)
| | | | | | | |
| Templeton Global Asset Allocation Fund | | Country | | Shares/
Rights/
Warrants | | Value |
Common Stocks, Rights and Warrants (continued) | | | | | | | |
Diversified Financial Services 0.4% | | | | | | | |
ING Groep NV | | Netherlands | | 36,961 | | $ | 378,833 |
| | | | | | | |
Diversified Telecommunication Services 5.1% | | | | | | | |
Chunghwa Telecom Co. Ltd., ADR | | Taiwan | | 15,683 | | | 244,655 |
France Telecom SA, ADR | | France | | 47,413 | | | 1,330,883 |
Singapore Telecommunications Ltd. | | Singapore | | 403,525 | | | 718,317 |
Telefonica SA, ADR | | Spain | | 17,573 | | | 1,184,244 |
Telekom Austria AG, ADR | | Austria | | 12,980 | | | 376,420 |
Telenor ASA | | Norway | | 74,594 | | | 496,589 |
| | | | | | | |
| | | | | | | 4,351,108 |
| | | | | | | |
Electric Utilities 0.8% | | | | | | | |
E.ON AG | | Germany | | 17,130 | | | 671,160 |
| | | | | | | |
Electrical Equipment 0.3% | | | | | | | |
aVestas Wind Systems AS | | Denmark | | 4,342 | | | 247,571 |
| | | | | | | |
Electronic Equipment, Instruments & Components 0.8% | | | | | | | |
FUJIFILM Holdings Corp. | | Japan | | 15,011 | | | 334,830 |
Tyco Electronics Ltd. | | United States | | 8,326 | | | 134,964 |
Venture Corp. Ltd. | | Singapore | | 60,159 | | | 183,942 |
| | | | | | | |
| | | | | | | 653,736 |
| | | | | | | |
Food Products 0.8% | | | | | | | |
Unilever PLC | | United Kingdom | | 30,710 | | | 708,237 |
| | | | | | | |
Health Care Equipment & Supplies 1.2% | | | | | | | |
aBoston Scientific Corp. | | United States | | 56,897 | | | 440,383 |
Covidien Ltd. | | United States | | 8,326 | | | 301,734 |
Olympus Corp. | | Japan | | 16,000 | | | 320,032 |
| | | | | | | |
| | | | | | | 1,062,149 |
| | | | | | | |
Health Care Providers & Services 1.1% | | | | | | | |
Quest Diagnostics Inc. | | United States | | 17,660 | | | 916,731 |
| | | | | | | |
Hotels, Restaurants & Leisure 0.6% | | | | | | | |
Compass Group PLC | | United Kingdom | | 103,908 | | | 522,064 |
| | | | | | | |
Industrial Conglomerates 2.2% | | | | | | | |
General Electric Co. | | United States | | 23,450 | | | 379,890 |
Koninklijke Philips Electronics NV | | Netherlands | | 21,170 | | | 409,396 |
Siemens AG, ADR | | Germany | | 12,220 | | | 925,665 |
Tyco International Ltd. | | United States | | 8,326 | | | 179,841 |
| | | | | | | |
| | | | | | | 1,894,792 |
| | | | | | | |
Insurance 3.9% | | | | | | | |
ACE Ltd. | | United States | | 17,838 | | | 943,987 |
Aviva PLC | | United Kingdom | | 57,769 | | | 329,061 |
AXA SA | | France | | 36,961 | | | 818,910 |
Progressive Corp. | | United States | | 34,660 | | | 513,315 |
Swiss Reinsurance Co. | | Switzerland | | 5,310 | | | 250,110 |
Torchmark Corp. | | United States | | 10,120 | | | 452,364 |
| | | | | | | |
| | | | | | | 3,307,747 |
| | | | | | | |
IT Services 0.8% | | | | | | | |
Accenture Ltd., A | | United States | | 22,100 | | | 724,659 |
| | | | | | | |
TGA-13
Franklin Templeton Variable Insurance Products Trust
Statement of Investments, December 31, 2008 (continued)
| | | | | | | |
| Templeton Global Asset Allocation Fund | | Country | | Shares/
Rights/
Warrants | | Value |
Common Stocks, Rights and Warrants (continued) | | | | | | | |
Media 5.8% | | | | | | | |
British Sky Broadcasting Group PLC | | United Kingdom | | 68,871 | | $ | 482,830 |
Comcast Corp., A | | United States | | 53,133 | | | 858,098 |
aThe DIRECTV Group Inc. | | United States | | 15,337 | | | 351,371 |
News Corp., A | | United States | | 64,570 | | | 586,941 |
Pearson PLC | | United Kingdom | | 63,912 | | | 598,352 |
Reed Elsevier NV | | Netherlands | | 37,947 | | | 446,776 |
Time Warner Inc. | | United States | | 60,448 | | | 608,107 |
aViacom Inc., B | | United States | | 28,204 | | | 537,568 |
Vivendi SA | | France | | 14,980 | | | 487,321 |
| | | | | | | |
| | | | | | | 4,957,364 |
| | | | | | | |
Multi-Utilities 0.7% | | | | | | | |
PG&E Corp. | | United States | | 15,830 | | | 612,779 |
| | | | | | | |
Multiline Retail 0.8% | | | | | | | |
Target Corp. | | United States | | 18,767 | | | 648,025 |
| | | | | | | |
Oil, Gas & Consumable Fuels 4.1% | | | | | | | |
BP PLC | | United Kingdom | | 125,463 | | | 963,869 |
El Paso Corp. | | United States | | 49,332 | | | 386,270 |
Eni SpA | | Italy | | 24,592 | | | 575,638 |
Royal Dutch Shell PLC, B | | United Kingdom | | 38,652 | | | 973,817 |
Total SA, B | | France | | 12,240 | | | 665,952 |
| | | | | | | |
| | | | | | | 3,565,546 |
| | | | | | | |
Paper & Forest Products 0.8% | | | | | | | |
UPM-Kymmene OYJ | | Finland | | 52,175 | | | 656,607 |
| | | | | | | |
Pharmaceuticals 8.6% | | | | | | | |
Abbott Laboratories | | United States | | 9,627 | | | 513,793 |
Bristol-Myers Squibb Co. | | United States | | 23,584 | | | 548,328 |
GlaxoSmithKline PLC | | United Kingdom | | 30,757 | | | 577,025 |
Merck & Co. Inc. | | United States | | 24,820 | | | 754,528 |
Merck KGaA | | Germany | | 4,760 | | | 429,439 |
Novartis AG | | Switzerland | | 11,760 | | | 580,347 |
Pfizer Inc. | | United States | | 60,304 | | | 1,067,984 |
Roche Holding AG | | Switzerland | | 1,610 | | | 244,990 |
Sanofi-Aventis | | France | | 13,311 | | | 845,020 |
Takeda Pharmaceutical Co. Ltd. | | Japan | | 14,786 | | | 770,043 |
aWatson Pharmaceuticals Inc. | | United States | | 40,492 | | | 1,075,872 |
| | | | | | | |
| | | | | | | 7,407,369 |
| | | | | | | |
Professional Services 0.3% | | | | | | | |
Adecco SA | | Switzerland | | 6,810 | | | 228,169 |
| | | | | | | |
Real Estate Management & Development 0.4% | | | | | | | |
Cheung Kong (Holdings) Ltd. | | Hong Kong | | 37,748 | | | 357,014 |
| | | | | | | |
Semiconductors & Semiconductor Equipment 1.1% | | | | | | | |
aInfineon Technologies AG, ADR | | Germany | | 51,804 | | | 72,526 |
Samsung Electronics Co. Ltd. | | South Korea | | 2,200 | | | 785,590 |
Taiwan Semiconductor Manufacturing Co. Ltd. | | Taiwan | | 90,000 | | | 121,922 |
| | | | | | | |
| | | | | | | 980,038 |
| | | | | | | |
TGA-14
Franklin Templeton Variable Insurance Products Trust
Statement of Investments, December 31, 2008 (continued)
| | | | | | | | |
| Templeton Global Asset Allocation Fund | | Country | | Shares/
Rights/
Warrants | | | Value |
Common Stocks, Rights and Warrants (continued) | | | | | | | | |
Software 4.1% | | | | | | | | |
aCheck Point Software Technologies Ltd. | | Israel | | 27,306 | | | $ | 518,541 |
Microsoft Corp. | | United States | | 39,012 | | | | 758,393 |
Nintendo Co. Ltd. | | Japan | | 2,341 | | | | 893,878 |
aOracle Corp. | | United States | | 61,267 | | | | 1,086,264 |
SAP AG, ADR | | Germany | | 7,470 | | | | 270,563 |
| | | | | | | | |
| | | | | | | | 3,527,639 |
| | | | | | | | |
Specialty Retail 0.1% | | | | | | | | |
The Home Depot Inc. | | United States | | 5,020 | | | | 115,560 |
| | | | | | | | |
Trading Companies & Distributors 0.2% | | | | | | | | |
Wolseley PLC | | United Kingdom | | 36,280 | | | | 203,477 |
| | | | | | | | |
Wireless Telecommunication Services 1.2% | | | | | | | | |
Vodafone Group PLC, ADR | | United Kingdom | | 50,593 | | | | 1,034,121 |
| | | | | | | | |
Total Common Stocks, Rights and Warrants (Cost $56,483,978) | | | | | | | | 48,930,412 |
| | | | | | | | |
Preferred Stocks 0.6% | | | | | | | | |
Metals & Mining 0.4% | | | | | | | | |
Companhia Vale do Rio Doce, ADR, pfd., A | | Brazil | | 33,728 | | | | 359,203 |
| | | | | | | | |
Oil, Gas & Consumable Fuels 0.2% | | | | | | | | |
Petroleo Brasileiro SA, ADR, pfd. | | Brazil | | 6,070 | | | | 123,889 |
| | | | | | | | |
Total Preferred Stocks (Cost $194,930) | | | | | | | | 483,092 |
| | | | | | | | |
| | | |
| | | | | Principal
Amountb | | | |
Foreign Government and Agency Securities 37.7% | | | | | | | | |
European Investment Bank, senior note,
4.50%, 5/15/13 | | Supranationalc | | 2,550,000 | NOK | | | 382,172 |
1612/37, 6.50%, 9/10/14 | | Supranationalc | | 291,000 | NZD | | | 184,566 |
d,eGovernment of Argentina, senior bond, FRN, 3.127%, 8/03/12 | | Argentina | | 1,334,000 | | | | 354,191 |
Government of Indonesia,
FR31, 11.00%, 11/15/20 | | Indonesia | | 12,000,000,000 | IDR | | | 1,023,852 |
FR37, 12.00%, 9/15/26 | | Indonesia | | 3,140,000,000 | IDR | | | 283,032 |
FR40, 11.00%, 9/15/25 | | Indonesia | | 9,900,000,000 | IDR | | | 831,056 |
Government of Malaysia,
3.756%, 4/28/11 | | Malaysia | | 13,480,000 | MYR | | | 3,971,405 |
3.833%, 9/28/11 | | Malaysia | | 35,000 | MYR | | | 10,353 |
3.461%, 7/31/13 | | Malaysia | | 1,340,000 | MYR | | | 395,053 |
3.814%, 2/15/17 | | Malaysia | | 6,640,000 | MYR | | | 1,988,030 |
4.24%, 2/07/18 | | Malaysia | | 3,895,000 | MYR | | | 1,213,983 |
Government of Mexico, 10.00%, 12/05/24 | | Mexico | | 133,000 | f MXN | | | 1,116,366 |
Government of New Zealand, 7.00%, 7/15/09 | | New Zealand | | 3,204,000 | NZD | | | 1,902,503 |
Government of Poland,
6.00%, 5/24/09 | | Poland | | 9,900,000 | PLN | | | 3,339,771 |
5.75%, 9/23/22 | | Poland | | 4,075,000 | PLN | | | 1,423,241 |
Government of Sweden,
5.00%, 1/28/09 | | Sweden | | 15,660,000 | SEK | | | 2,006,739 |
4.00%, 12/01/09 | | Sweden | | 8,510,000 | SEK | | | 1,115,633 |
5.50%, 10/08/12 | | Sweden | | 8,620,000 | SEK | | | 1,249,854 |
TGA-15
Franklin Templeton Variable Insurance Products Trust
Statement of Investments, December 31, 2008 (continued)
| | | | | | | | |
| Templeton Global Asset Allocation Fund | | Country | | Principal
Amountb | | | Value |
Foreign Government and Agency Securities (continued) | | | | | | | | |
KfW Bankengruppe, senior note, 6.50%, 11/15/11 | | Germany | | 250,000 | NZD | | $ | 154,663 |
Korea Treasury Bond,
0525-1209, 5.25%, 9/10/12 | | South Korea | | 1,840,000,000 | KRW | | | 1,520,546 |
0525-2703, 5.25%, 3/10/27 | | South Korea | | 1,895,000,000 | KRW | | | 1,604,523 |
0550-1709, 5.50%, 9/10/17 | | South Korea | | 2,395,000,000 | KRW | | | 2,048,097 |
New South Wales Treasury Corp., 6.00%, 5/01/12 | | Australia | | 1,025,000 | AUD | | | 757,116 |
Nota Do Tesouro Nacional,
9.762%, 1/01/12 | | Brazil | | 3,450 | g BRL | | | 1,402,384 |
hIndex Linked, 10.577%, 5/15/15 | | Brazil | | 1,000 | g BRL | | | 693,863 |
hIndex Linked, 10.577%, 5/15/45 | | Brazil | | 1,430 | g BRL | | | 936,869 |
Province of Ontario, 6.25%, 6/16/15 | | Canada | | 64,000 | NZD | | | 38,894 |
Queensland Treasury Corp., 09G, 6.00%, 7/14/09 | | Australia | | 540,000 | AUD | | | 387,412 |
Svensk Exportkredit AB, senior note, 7.625%, 6/30/14 | | Sweden | | 85,000 | NZD | | | 53,488 |
| | | | | | | | |
Total Foreign Government and Agency Securities
(Cost $35,406,648) | | | | | | | | 32,389,655 |
| | | | | | | | |
Total Investments before Short Term Investments
(Cost $92,085,556) | | | | | | | | 81,803,159 |
| | | | | | | | |
Short Term Investments 1.6% | | | | | | | | |
Foreign Government and Agency Securities (Cost $1,432,953) 1.6% | | | | | | | | |
iEgypt Treasury Bills, 7/07/09 - 9/22/09 | | Egypt | | 8,275,000 | EGP | | | 1,398,529 |
| | | | | | | | |
Total Investments before Money Market Fund (Cost $93,518,509) | | | | | | | | 83,201,688 |
| | | | | | | | |
| | | |
| | | | | Shares | | | |
Money Market Funds (Cost $208) 0.0%j | | | | | | | | |
kFranklin Institutional Fiduciary Trust Money Market Portfolio, 0.55% | | United States | | 208 | | | | 208 |
| | | | | | | | |
Total Investments (Cost $93,518,717) 96.8% | | | | | | | | 83,201,896 |
Net Unrealized Appreciation on Forward Exchange Contracts 2.2% | | | | | | | | 1,880,623 |
Other Assets, less Liabilities 1.0% | | | | | | | | 890,241 |
| | | | | | | | |
Net Assets 100.0% | | | | | | | $ | 85,972,760 |
| | | | | | | | |
See Abbreviations on page TGA-29.
aNon-income producing for the twelve months ended December 31, 2008.
bThe principal amount is stated in U.S. dollars unless otherwise indicated.
cA supranational organization is an entity formed by two or more central governments through international treaties.
dThe coupon rate shown represents the rate at period end.
eThe principal amount is stated in original face, and scheduled paydowns are reflected in the market price on ex-date.
fPrincipal amount is stated in 100 Mexican Peso Units.
gPrincipal amount is stated in 1,000 Brazilian Real Units.
hRedemption price at maturity is adjusted for inflation. See Note 1(e).
iThe security is traded on a discount basis with no stated coupon rate.
jRounds to less than 0.1% of net assets.
kSee Note 7 regarding investments in the Franklin Institutional Fiduciary Trust Money Market Portfolio. The rate shown is the annualized seven-day yield at period end.
The accompanying notes are an integral part of these financial statements.
TGA-16
Franklin Templeton Variable Insurance Products Trust
Financial Statements
Statement of Assets and Liabilities
December 31, 2008
| | | | |
| | | Templeton
Global Asset
Allocation Fund | |
Assets: | | | | |
Investments in securities: | | | | |
Cost - Unaffiliated issuers | | $ | 93,518,509 | |
Cost - Sweep Money Fund (Note 7) | | | 208 | |
| | | | |
Total cost of investments | | $ | 93,518,717 | |
| | | | |
Value - Unaffiliated issuers | | $ | 83,201,688 | |
Value - Sweep Money Fund (Note 7) | | | 208 | |
| | | | |
Total value of investments | | | 83,201,896 | |
Foreign currency, at value (cost $902,366) | | | 960,884 | |
Receivables: | | | | |
Investment securities sold | | | 6,947 | |
Capital shares sold | | | 5,164 | |
Dividends and interest | | | 831,383 | |
Unrealized appreciation on forward exchange contracts (Note 8) | | | 2,228,419 | |
Other assets | | | 19,845 | |
| | | | |
Total assets | | | 87,254,538 | |
| | | | |
Liabilities: | | | | |
Payables: | | | | |
Capital shares redeemed | | | 312,297 | |
Affiliates | | | 47,212 | |
Funds advanced by custodian | | | 496,688 | |
Unrealized depreciation on forward exchange contracts (Note 8) | | | 347,796 | |
Accrued expenses and other liabilities | | | 77,785 | |
| | | | |
Total liabilities | | | 1,281,778 | |
| | | | |
Net assets, at value | | $ | 85,972,760 | |
| | | | |
Net assets consist of: | | | | |
Paid-in capital | | $ | 87,628,270 | |
Undistributed net investment income | | | 6,406,237 | |
Net unrealized appreciation (depreciation) | | | (8,417,584 | ) |
Accumulated net realized gain (loss) | | | 355,837 | |
| | | | |
Net assets, at value | | $ | 85,972,760 | |
| | | | |
The accompanying notes are an integral part of these financial statements.
TGA-17
Franklin Templeton Variable Insurance Products Trust
Financial Statements (continued)
Statement of Assets and Liabilities (continued)
December 31, 2008
| | | |
| | | Templeton
Global Asset
Allocation Fund |
Class 1: | | | |
Net assets, at value | | $ | 37,618,558 |
| | | |
Shares outstanding | | | 4,359,617 |
| | | |
Net asset value and maximum offering price per share | | $ | 8.63 |
| | | |
Class 2: | | | |
Net assets, at value | | $ | 48,351,179 |
| | | |
Shares outstanding | | | 5,712,098 |
| | | |
Net asset value and maximum offering price per share | | $ | 8.46 |
| | | |
Class 4: | | | |
Net assets, at value | | $ | 3,023 |
| | | |
Shares outstanding | | | 351 |
| | | |
Net asset value and maximum offering price per share | | $ | 8.61 |
| | | |
The accompanying notes are an integral part of these financial statements.
TGA-18
Franklin Templeton Variable Insurance Products Trust
Financial Statements (continued)
Statement of Operations
for the year ended December 31, 2008
| | | | |
| | | Templeton
Global Asset
Allocation Fund | |
Investment income: | | | | |
Dividends: (net of foreign taxes of $198,320) | | | | |
Unaffiliated issuers | | $ | 2,487,794 | |
Sweep Money Fund (Note 7) | | | 41,491 | |
Interest (net of foreign taxes of $71,703) | | | 2,352,658 | |
| | | | |
Total investment income | | | 4,881,943 | |
| | | | |
Expenses: | | | | |
Management fees (Note 3a) | | | 757,084 | |
Administrative fees (Note 3b) | | | 175,998 | |
Distribution fees: (Note 3c) | | | | |
Class 2 | | | 165,097 | |
Class 4 | | | 12 | |
Unaffiliated transfer agent fees | | | 1,327 | |
Custodian fees (Note 4) | | | 49,181 | |
Reports to shareholders | | | 64,289 | |
Professional fees | | | 35,374 | |
Trustees’ fees and expenses | | | 611 | |
Other | | | 17,887 | |
| | | | |
Total expenses | | | 1,266,860 | |
Expense reductions (Note 4) | | | (834 | ) |
Expenses waived/paid by affiliates (Note 3e) | | | (130,554 | ) |
| | | | |
Net expenses | | | 1,135,472 | |
| | | | |
Net investment income | | | 3,746,471 | |
| | | | |
Realized and unrealized gains (losses): | | | | |
Net realized gain (loss) from: | | | | |
Investments | | | 2,242,530 | |
Foreign currency transactions | | | 1,128,804 | |
| | | | |
Net realized gain (loss) | | | 3,371,334 | |
| | | | |
Net change in unrealized appreciation (depreciation) on: | | | | |
Investments | | | (41,674,952 | ) |
Translation of other assets and liabilities denominated in foreign currencies | | | 1,711,260 | |
| | | | |
Net change in unrealized appreciation (depreciation) | | | (39,963,692 | ) |
| | | | |
Net realized and unrealized gain (loss) | | | (36,592,358 | ) |
| | | | |
Net increase (decrease) in net assets resulting from operations | | $ | (32,845,887 | ) |
| | | | |
The accompanying notes are an integral part of these financial statements.
TGA-19
Franklin Templeton Variable Insurance Products Trust
Financial Statements (continued)
Statements of Changes in Net Assets
| | | | | | | | |
| | | Templeton Global Asset
Allocation Fund | |
| | | Year Ended December 31, | |
| | | 2008 | | | 2007 | |
| | | | |
Increase (decrease) in net assets: | | | | | | | | |
Operations: | | | | | | | | |
Net investment income | | $ | 3,746,471 | | | $ | 5,763,683 | |
Net realized gain (loss) from investments, foreign currency transactions, and redemption in-kind (Note 10) | | | 3,371,334 | | | | 74,984,268 | |
Net change in unrealized appreciation (depreciation) on investments and translation of other assets and liabilities denominated in foreign currencies | | | (39,963,692 | ) | | | (53,184,712 | ) |
| | | | |
Net increase (decrease) in net assets resulting from operations | | | (32,845,887 | ) | | | 27,563,239 | |
| | | | |
Distributions to shareholders from: | | | | | | | | |
Net investment income and net foreign currency gains: | | | | | | | | |
Class 1 | | | (5,575,011 | ) | | | (11,357,897 | ) |
Class 2 | | | (7,025,343 | ) | | | (14,016,851 | ) |
Class 4 | | | (492 | ) | | | — | |
Net realized gains: | | | | | | | | |
Class 1 | | | (6,781,816 | ) | | | (14,706,218 | ) |
Class 2 | | | (8,788,767 | ) | | | (18,379,776 | ) |
Class 4 | | | (599 | ) | | | — | |
| | | | |
Total distributions to shareholders | | | (28,172,028 | ) | | | (58,460,742 | ) |
| | | | |
Capital share transactions: (Note 2) | | | | | | | | |
Class 1 | | | 756,427 | | | | (207,311,609 | ) |
Class 2 | | | 4,300,548 | | | | 25,326,890 | |
Class 4 | | | 5,000 | | | | — | |
| | | | |
Total capital share transactions | | | 5,061,975 | | | | (181,984,719 | ) |
| | | | |
Net increase (decrease) in net assets | | | (55,955,940 | ) | | | (212,882,222 | ) |
Net assets: | | | | | | | | |
Beginning of year | | | 141,928,700 | | | | 354,810,922 | |
| | | | |
End of year | | $ | 85,972,760 | | | $ | 141,928,700 | |
| | | | |
Undistributed net investment income included in net assets: | | | | | | | | |
End of year | | $ | 6,406,237 | | | $ | 12,217,627 | |
| | | | |
The accompanying notes are an integral part of these financial statements.
TGA-20
Franklin Templeton Variable Insurance Products Trust
Notes to Financial Statements
Templeton Global Asset Allocation Fund
1. ORGANIZATION AND SIGNIFICANT ACCOUNTING POLICIES
Franklin Templeton Variable Insurance Products Trust (Trust) is registered under the Investment Company Act of 1940, as amended, (1940 Act) as an open-end investment company, consisting of twenty-three separate funds. The Templeton Global Asset Allocation (Fund) is included in this report. The financial statements of the remaining funds in the Trust are presented separately. Shares of the Fund are sold only to insurance company separate accounts to fund the benefits of variable life insurance policies or variable annuity contracts. The Fund offers three classes of shares: Class 1, Class 2, and Class 4. Effective February 29, 2008, the Fund began offering a new class of shares, Class 4. Each class of shares differs by its distribution fees, voting rights on matters affecting a single class and its exchange privilege.
The following summarizes the Fund’s significant accounting policies.
a. Security Valuation
Securities listed on a securities exchange or on the NASDAQ National Market System are valued at the last quoted sale price or the official closing price of the day, respectively. Over-the-counter securities and listed securities for which there is no reported sale are valued within the range of the most recent quoted bid and ask prices. Securities that trade in multiple markets or on multiple exchanges are valued according to the broadest and most representative market. Investments in open-end mutual funds are valued at the closing net asset value.
Government securities generally trade in the over-the-counter market rather than on a securities exchange. The Trust may utilize independent pricing services, quotations from bond dealers, and information with respect to bond and note transactions, to assist in determining a current market value for each security. The Trust’s pricing services may use valuation models or matrix pricing which considers information with respect to comparable bond and note transactions, quotations from bond dealers, or by reference to other securities that are considered comparable in such characteristics as rating, interest rate and maturity date, option adjusted spread models, prepayment projections, interest rate spreads and yield curves, to determine current value.
Foreign securities are valued as of the close of trading on the foreign stock exchange on which the security is primarily traded, or the NYSE, whichever is earlier. If no sale is reported at that time, the foreign security will be valued within the range of the most recent quoted bid and ask prices. The value is then converted into its U.S. dollar equivalent at the foreign exchange rate in effect at the close of the NYSE on the day that the value of the foreign security is determined.
The Trust has procedures to determine the fair value of individual securities and other assets for which market prices are not readily available or which may not be reliably priced. Methods for valuing these securities may include: fundamental analysis, matrix pricing, discounts from market prices of similar securities, or discounts applied due to the nature and duration of restrictions on the disposition of the securities. Due to the inherent uncertainty of valuations of such securities, the fair values may differ significantly from the values that would have been used had a ready market for such investments existed. Occasionally, events occur between the time at which trading in a security is completed and the close of the NYSE that might call into question the availability (including the reliability) of the value of a portfolio security held by the Fund. The investment manager monitors price movements following the close of trading in foreign stock markets through a series of country specific market proxies (such as baskets of American Depository Receipts, futures contracts and exchange traded funds). These price movements are measured against established trigger thresholds for each specific market proxy to assist in determining if an event has occurred. If such an event occurs, the securities may be valued using fair value procedures, which may include the use of independent pricing services. At December 31, 2008, a portion of the securities held by the Fund were fair valued. All security valuation procedures are approved by the Trust’s Board of Trustees.
b. Foreign Currency Translation
Portfolio securities and other assets and liabilities denominated in foreign currencies are translated into U.S. dollars based on the exchange rate of such currencies against U.S. dollars on the date of valuation. Purchases and sales of securities, income and
TGA-21
Franklin Templeton Variable Insurance Products Trust
Notes to Financial Statements (continued)
Templeton Global Asset Allocation Fund
1. ORGANIZATION AND SIGNIFICANT ACCOUNTING POLICIES (continued)
b. Foreign Currency Translation (continued)
expense items denominated in foreign currencies are translated into U.S. dollars at the exchange rate in effect on the transaction date. Occasionally, events may impact the availability or reliability of foreign exchange rates used to convert the U.S. dollar equivalent value. If such an event occurs, the foreign exchange rate will be valued at fair value using procedures established and approved by the Trust’s Board of Trustees.
The Fund does not separately report the effect of changes in foreign exchange rates from changes in market prices on securities held. Such changes are included in net realized and unrealized gain or loss from investments on the Statement of Operations.
Realized foreign exchange gains or losses arise from sales of foreign currencies, currency gains or losses realized between the trade and settlement dates on securities transactions and the difference between the recorded amounts of dividends, interest, and foreign withholding taxes and the U.S. dollar equivalent of the amounts actually received or paid. Net unrealized foreign exchange gains and losses arise from changes in foreign exchange rates on foreign denominated assets and liabilities other than investments in securities held at the end of the reporting period.
c. Foreign Currency Contracts
When the Fund purchases or sells foreign securities it may enter into foreign exchange contracts to minimize foreign exchange risk from the trade date to the settlement date of the transactions. A foreign exchange contract is an agreement between two parties to exchange different currencies at an agreed upon exchange rate at a future date. Realized and unrealized gains and losses on these contracts are included in the Statement of Operations.
The Fund may also enter into forward exchange contracts to hedge against fluctuations in foreign exchange rates or to gain exposure to certain foreign currencies. These contracts are valued daily by the Fund and the unrealized appreciation or depreciation on the contracts, as measured by the difference between the contractual forward foreign exchange rates and the forward rates at the reporting date, are included in the Statement of Assets and Liabilities. Realized and unrealized gains and losses on these contracts are included in the Statement of Operations.
The risks of these contracts include movement in the values of the foreign currencies relative to the U.S. dollar and the possible inability of the counterparties to fulfill their obligations under the contracts, which may be in excess of the amount reflected in the Statement of Assets and Liabilities.
d. Income Taxes
No provision has been made for U.S. income taxes because it is the Fund’s policy to qualify as a regulated investment company under the Internal Revenue Code and to distribute to shareholders substantially all of its taxable income and net realized gains.
Foreign securities held by the Fund may be subject to foreign taxation on dividend and interest income received. Foreign taxes, if any, are recorded based on the tax regulations and rates that exist in the foreign markets in which the Fund invests.
The Fund has reviewed the tax positions, taken on federal income tax returns, for each of the three open tax years and as of December 31, 2008, and has determined that no provision for income tax is required in the Fund’s financial statements.
e. Security Transactions, Investment Income, Expenses and Distributions
Security transactions are accounted for on trade date. Realized gains and losses on security transactions are determined on a specific identification basis. Interest income and estimated expenses are accrued daily. Amortization of premium and accretion of discount on debt securities are included in interest income. Dividend income is recorded on the ex-dividend date except that
TGA-22
Franklin Templeton Variable Insurance Products Trust
Notes to Financial Statements (continued)
Templeton Global Asset Allocation Fund
1. ORGANIZATION AND SIGNIFICANT ACCOUNTING POLICIES (continued)
e. Security Transactions, Investment Income, Expenses and Distributions (continued)
certain dividends from foreign securities are recognized as soon as the Fund is notified of the ex-dividend date. Distributions to shareholders are recorded on the ex-dividend date and are determined according to income tax regulations (tax basis). Distributable earnings determined on a tax basis may differ from earnings recorded in accordance with accounting principles generally accepted in the United States of America. These differences may be permanent or temporary. Permanent differences are reclassified among capital accounts to reflect their tax character. These reclassifications have no impact on net assets or the results of operations. Temporary differences are not reclassified, as they may reverse in subsequent periods.
Common expenses incurred by the Trust are allocated among the funds based on the ratio of net assets of each fund to the combined net assets of the Trust. Fund specific expenses are charged directly to the fund that incurred the expense.
Realized and unrealized gains and losses and net investment income, not including class specific expenses, are allocated daily to each class of shares based upon the relative proportion of net assets of each class. Differences in per share distributions, by class, are generally due to differences in class specific expenses.
Inflation-indexed bonds provide an inflation hedge through periodic increases or decreases in the security’s interest accruals and principal redemption value, by amounts corresponding to the current rate of inflation. Any such adjustments, including adjustments to principal redemption value, are recorded as interest income.
f. Accounting Estimates
The preparation of financial statements in accordance with accounting principles generally accepted in the United States of America requires management to make estimates and assumptions that affect the reported amounts of assets and liabilities at the date of the financial statements and the amounts of income and expenses during the reporting period. Actual results could differ from those estimates.
g. Guarantees and Indemnifications
Under the Trust’s organizational documents, its officers and trustees are indemnified by the Trust against certain liabilities arising out of the performance of their duties to the Trust. Additionally, in the normal course of business, the Trust, on behalf of the Fund, enters into contracts with service providers that contain general indemnification clauses. The Trust’s maximum exposure under these arrangements is unknown as this would involve future claims that may be made against the Trust that have not yet occurred. Currently, the Trust expects the risk of loss to be remote.
2. SHARES OF BENEFICIAL INTEREST
At December 31, 2008, there were an unlimited number of shares authorized (without par value). Transactions in the Fund’s shares were as follows:
| | | | | | | | | | | | | | |
| | | Year Ended December 31, | |
| | | 2008 | | | 2007 | |
| Class 1 Shares: | | Shares | | | Amount | | | Shares | | | Amount | |
Shares sold | | 55,105 | | | $ | 667,145 | | | 345,235 | | | $ | 6,915,166 | |
Shares issued in reinvestment of distributions | | 1,123,348 | | | | 12,356,827 | | | 1,796,286 | | | | 26,064,115 | |
Shares redeemed in-kind (Note 10) | | — | | | | — | | | (7,596,834 | ) | | | (177,462,049 | ) |
Shares redeemed | | (1,111,660 | ) | | | (12,267,545 | ) | | (2,857,358 | ) | | | (62,828,841 | ) |
| | | | |
Net increase (decrease) | | 66,793 | | | $ | 756,427 | | | (8,312,671 | ) | | $ | (207,311,609 | ) |
| | | | |
TGA-23
Franklin Templeton Variable Insurance Products Trust
Notes to Financial Statements (continued)
Templeton Global Asset Allocation Fund
2. SHARES OF BENEFICIAL INTEREST (continued)
| | | | | | | | | | | | | | |
| | | Year Ended December 31, | |
| | | 2008a | | | 2007 | |
| Class 2 Shares: | | Shares | | | Amount | | | Shares | | | Amount | |
Shares sold | | 806,174 | | | $ | 9,220,122 | | | 547,052 | | | $ | 9,586,666 | |
Shares issued in reinvestment of distributions | | 1,464,269 | | | | 15,814,110 | | | 2,263,915 | | | | 32,396,627 | |
Shares redeemed | | (1,971,137 | ) | | | (20,733,684 | ) | | (985,730 | ) | | | (16,656,403 | ) |
| | | | |
Net increase (decrease) | | 299,306 | | | $ | 4,300,548 | | | 1,825,237 | | | $ | 25,326,890 | |
| | | | |
| Class 4 Shares: | | | | | | | | | | | | |
Shares sold | | 351 | | | $ | 5,000 | | | | | | | | |
| | | | | | | | | | |
Net increase (decrease) | | 351 | | | $ | 5,000 | | | | | | | | |
| | | | | | | | | | |
aFor | the period February 29, 2008 (effective date) to December 31, 2008 for Class 4. |
3. TRANSACTIONS WITH AFFILIATES
Franklin Resources, Inc. is the holding company for various subsidiaries that together are referred to as Franklin Templeton Investments. Certain officers and trustees of the Trust are also officers and/or directors of the following subsidiaries:
| | |
| Subsidiary | | Affiliation |
Templeton Investment Counsel, LLC (Investment Counsel) | | Investment manager |
Franklin Advisers, Inc. (Advisers) | | Investment manager |
Franklin Templeton Services, LLC (FT Services) | | Administrative manager |
Franklin Templeton Distributors, Inc. (Distributors) | | Principal underwriter |
Franklin Templeton Investor Services, LLC (Investor Services) | | Transfer agent |
a. Management Fees
The Fund pays an investment management fee to Investment Counsel based on the average daily net assets of the Fund as follows:
| | |
| Annualized Fee Rate | | Net Assets |
| 0.650% | | Up to and including $200 million |
| 0.585% | | Over $200 million, up to and including $1.3 billion |
| 0.520% | | In excess of $1.3 billion |
Under a subadvisory agreement, Advisers, an affiliate of Investment Counsel, provides subadvisory services to the Fund and receives from Investment Counsel fees based on the average daily net assets of the Fund.
b. Administrative Fees
The Fund pays an administrative fee to FT Services based on the Fund’s average daily net assets as follows:
| | |
| Annualized Fee Rate | | Net Assets |
| 0.150% | | Up to and including $200 million |
| 0.135% | | Over $200 million, up to and including $700 million |
| 0.100% | | Over $700 million, up to and including $1.2 billion |
| 0.075% | | In excess of $1.2 billion |
TGA-24
Franklin Templeton Variable Insurance Products Trust
Notes to Financial Statements (continued)
Templeton Global Asset Allocation Fund
3. TRANSACTIONS WITH AFFILIATES (continued)
c. Distribution Fees
The Fund’s Board of Trustees has adopted distribution plans for Class 2 and Class 4 shares pursuant to Rule 12b-1 under the 1940 Act. Under the Fund’s compensation distribution plans, the Fund pays Distributors for costs incurred in connection with the servicing, sale and distribution of the Fund’s shares up to 0.25% and 0.35% per year of its average daily net assets of Class 2 and Class 4, respectively.
d. Transfer Agent Fees
Investor Services, under terms of an agreement, performs shareholder servicing for the Fund and is not paid by the Fund for the services.
e. Waiver and Expense Reimbursements
FT Services and Investment Counsel have agreed in advance to waive all or a portion of their respective fees and to assume payment of other expenses through April 30, 2009. Total expenses waived or paid are not subject to reimbursement by the Fund subsequent to the Fund’s fiscal year end. After April 30, 2009, FT Services and Investment Counsel may discontinue this waiver at any time upon notice to the Fund’s Board of Trustees.
4. EXPENSE OFFSET ARRANGEMENT
The Fund has entered into an arrangement with its custodian whereby credits realized as a result of uninvested cash balances are used to reduce a portion of the Fund’s custodian expenses. During the year ended December 31, 2008, the custodian fees were reduced as noted in the Statement of Operations.
5. INCOME TAXES
For tax purposes, realized capital losses and realized currency losses occurring subsequent to October 31, may be deferred and treated as occurring on the first day of the following fiscal year. At December 31, 2008, the Fund deferred realized capital losses and realized currency losses of $659,910 and $254,710, respectively.
The tax character of distributions paid during the years ended December 31, 2008 and 2007, was as follows:
| | | | | | |
| | | 2008 | | 2007 |
Distributions paid from: | | | | | | |
Ordinary income | | $ | 13,669,367 | | $ | 26,602,578 |
Long term capital gain | | | 14,502,661 | | | 31,858,164 |
| | | |
| | $ | 28,172,028 | | $ | 58,460,742 |
| | | |
TGA-25
Franklin Templeton Variable Insurance Products Trust
Notes to Financial Statements (continued)
Templeton Global Asset Allocation Fund
5. INCOME TAXES (continued)
At December 31, 2008, the cost of investments, net unrealized appreciation (depreciation), undistributed ordinary income and undistributed long term capital gains for income tax purposes were as follows:
| | | | |
Cost of investments | | $ | 93,639,650 | |
| | | | |
| |
Unrealized appreciation | | $ | 6,656,547 | |
Unrealized depreciation | | | (17,094,301 | ) |
| | | | |
Net unrealized appreciation (depreciation) | | $ | (10,437,754 | ) |
| | | | |
Undistributed ordinary income | | $ | 8,022,465 | |
Undistributed long term capital gains | | | 1,270,458 | |
| | | | |
Distributable earnings | | $ | 9,292,923 | |
| | | | |
Net investment income (loss) differs for financial statement and tax purposes primarily due to differing treatments of foreign currency transactions, bond discounts and premiums, and inflation related adjustments on foreign securities.
Net realized gains (losses) differ for financial statement and tax purposes primarily due to differing treatments of foreign currency transactions and bond discounts and premiums.
6. INVESTMENT TRANSACTIONS
Purchases and sales of investments (excluding short term securities) for the year ended December 31, 2008, aggregated $22,303,500 and $29,060,749, respectively.
7. INVESTMENTS IN FRANKLIN INSTITUTIONAL FIDUCIARY TRUST MONEY MARKET PORTFOLIO
The Fund may invest in the Franklin Institutional Fiduciary Trust Money Market Portfolio (Sweep Money Fund), an open-end investment company managed by Advisers. Management fees paid by the Fund are reduced on assets invested in the Sweep Money Fund, in an amount not to exceed the management and administrative fees paid by the Sweep Money Fund.
8. FORWARD EXCHANGE CONTRACTS
At December 31, 2008, the Fund had the following forward exchange contracts outstanding:
| | | | | | | | | | | | | | |
| | | Contract
Amounta | | | Settlement
Date | | Unrealized
Appreciation | | Unrealized
Depreciation | |
| Contracts to Buy | | | | | | | | | | | | |
| 127,176,500 | | Kazakhstani Tenge | | 991,630 | | | 1/16/09 | | $ | 45,427 | | $ | — | |
| 243,250,000 | | Kazakhstani Tenge | | 1,900,391 | | | 1/20/09 | | | 76,101 | | | — | |
| 145,000,000 | | South Korean Won | | 121,441 | CHF | | 1/30/09 | | | 1,407 | | | — | |
| 81,000,000 | | Indian Rupee | | 2,625,063 | NZD | | 2/27/09 | | | 134,373 | | | — | |
| 250,565,000 | | Japanese Yen | | 2,104,881 | EUR | | 6/10/09 | | | — | | | (158,407 | ) |
| 1,685,000 | | Malaysian Ringgit | | 333,465 | EUR | | 7/07/09 | | | 23,569 | | | — | |
| 44,640,800 | | Japanese Yen | | 286,496 | EUR | | 8/21/09 | | | 96,368 | | | — | |
| 22,139,600 | | Japanese Yen | | 141,957 | EUR | | 8/26/09 | | | 48,020 | | | — | |
| 3,000,000 | | Swedish Krona | | 311,912 | EUR | | 9/23/09 | | | — | | | (48,940 | ) |
| 156,783,181 | | Japanese Yen | | 1,201,956 | EUR | | 10/15/09 | | | 69,821 | | | — | |
| 205,268 | | Chinese Yuan | | 29,676 | | | 10/23/09 | | | — | | | (341 | ) |
| 351,200 | | Chinese Yuan | | 50,502 | | | 10/26/09 | | | — | | | (308 | ) |
| 213,420 | | Chinese Yuan | | 30,467 | | | 10/27/09 | | | 36 | | | — | |
| 220,000 | | Chinese Yuan | | 30,096 | | | 12/04/09 | | | 1,374 | | | — | |
TGA-26
Franklin Templeton Variable Insurance Products Trust
Notes to Financial Statements (continued)
Templeton Global Asset Allocation Fund
8. FORWARD EXCHANGE CONTRACTS (continued)
| | | | | | | | | | | | | | |
| | | Contract
Amounta | | | Settlement
Date | | Unrealized
Appreciation | | Unrealized
Depreciation | |
| Contracts to Buy (continued) | | | | | | | | | | |
| 277,000 | | Chinese Yuan | | 30,076 | EUR | | 12/04/09 | | $ | — | | $ | (2,174 | ) |
| 15,131,805 | | Mexican Peso | | 1,068,819 | | | 12/22/09 | | | — | | | (40,469 | ) |
| 6,284,207 | | Mexican Peso | | 445,341 | | | 12/23/09 | | | — | | | (18,317 | ) |
| 10,076,041 | | Mexican Peso | | 712,546 | | | 12/24/09 | | | — | | | (27,936 | ) |
| | | | |
| Contracts to Sell | | | | | | | | | | |
| 8,900,000 | | Mexican Peso | | 2,252,768 | PEN | | 1/20/09 | | | 71,886 | | | — | |
| 5,650,000,000 | | South Korean Won | | 6,432,369 | CHF | | 1/30/09 | | | 1,538,068 | | | — | |
| 642,600 | | Euro | | 76,495,104 | JPY | | 6/10/09 | | | — | | | (48,360 | ) |
| 4,002,526 | | Mexican Peso | | 181,050,238 | CLP | | 6/12/09 | | | — | | | (2,544 | ) |
| 3,500,000 | | Mexican Peso | | 328,022 | | | 7/29/09 | | | 85,454 | | | — | |
| 704,603 | | New Zealand Dollar | | 4,745,710,835 | IDR | | 8/04/09 | | | 908 | | | — | |
| Unrealized appreciation (depreciation) on offsetting forward exchange contracts | | | 35,607 | | | — | |
| | | | | | | | | | | |
| Unrealized appreciation (depreciation) on forward exchange contracts | | | 2,228,419 | | | (347,796 | ) |
| | | | | | | | | | | |
| Net unrealized appreciation (depreciation) on forward exchange contracts | | $ | 1,880,623 | | | | |
| | | | | | | | | | | | | | |
aIn | U.S. dollars unless otherwise indicated. |
See Abbreviations on page TGA-29.
9. CONCENTRATION OF RISK
Investing in foreign securities may include certain risks and considerations not typically associated with investing in U.S. securities, such as fluctuating currency values and changing local and regional economic, political and social conditions, which may result in greater market volatility. In addition, certain foreign securities may not be as liquid as U.S. securities.
10. REDEMPTION IN-KIND
During the year ended December 31, 2007, the Fund realized $51,446,118 of net gains resulting from a redemption in-kind in which a shareholder redeemed fund shares for securities held by the Fund rather than for cash. Because such gains are not taxable to the Fund, and are not distributed to remaining shareholders, they have been reclassified from accumulated net realized gains to paid-in capital.
11. FAIR VALUE MEASUREMENTS
The Fund adopted Financial Accounting Standards Board (FASB) Statement No. 157, “Fair Value Measurement” (SFAS 157), on January 1, 2008. SFAS 157 defines fair value, establishes a framework for measuring fair value, and expands disclosures about fair value measurements. The Fund has determined that the implementation of SFAS 157 did not have a material impact on the Fund’s financial statements.
SFAS 157 establishes a fair value hierarchy that distinguishes between market data obtained from independent sources (observable inputs) and the Fund’s own market assumptions (unobservable inputs). These inputs are used in determining the value of the Fund’s investments and are summarized in the following fair value hierarchy:
| | • | | Level 1 – quoted prices in active markets for identical securities |
TGA-27
Franklin Templeton Variable Insurance Products Trust
Notes to Financial Statements (continued)
Templeton Global Asset Allocation Fund
| | • | | Level 2 – other significant observable inputs (including quoted prices for similar securities, interest rates, prepayment speed, credit risk, etc.) |
| | • | | Level 3 – significant unobservable inputs (including the Fund’s own assumptions in determining the fair value of investments) |
The inputs or methodology used for valuing securities are not an indication of the risk associated with investing in those securities.
The following is a summary of the inputs used as of December 31, 2008, in valuing the Fund’s assets and liabilities carried at fair value:
| | | | | | | | | | | | |
| | | Level 1 | | Level 2 | | Level 3 | | Total |
Assets: | | | | | | | | | | | | |
Investments in Securities | | $ | 47,698,285 | | $ | 35,503,611 | | $ | — | | $ | 83,201,896 |
Other Financial Instrumentsa | | | — | | | 2,228,419 | | | — | | | 2,228,419 |
Liabilities: | | | | | | | | | | | | |
Other Financial Instrumentsa | | | — | | | 347,796 | | | — | | | 347,796 |
a | Other financial instruments includes net unrealized appreciation (depreciation) of forward exchange contracts. |
12. NEW ACCOUNTING PRONOUNCEMENT
In March 2008, FASB issued FASB Statement No. 161, “Disclosures about Derivative Instruments and Hedging Activities, an amendment of FASB Statement No. 133” (SFAS 161), which expands disclosures about derivative investments and hedging activities. SFAS 161 is effective for fiscal years and interim periods beginning after November 15, 2008. The Fund is currently evaluating the impact, if any, of applying the various provisions of SFAS 161.
13. SUBSEQUENT EVENT
On January 23, 2009, the Fund entered into, along with other funds managed by Franklin Templeton Investments (individually, “Borrower”; collectively “Borrowers”), a $725 million senior unsecured syndicated global line of credit (“Global Credit Facility”) to provide a source of funds to the Borrowers for temporary and emergency purposes and to meet future unanticipated or unusually large redemption requests.
Under the terms of the Global Credit Facility, each Borrower has agreed to pay its proportionate share of fees and expenses incurred in connection with the implementation and maintenance of the Global Credit Facility.
TGA-28
Franklin Templeton Variable Insurance Products Trust
Notes to Financial Statements (continued)
Templeton Global Asset Allocation Fund
ABBREVIATIONS
| | |
| Currency | | Selected Portfolio |
AUD - Australian Dollar BRL - Brazilian Real CHF - Swiss Franc CLP - Chilean Peso EGP - Egyptian Pound EUR - Euro IDR - Indonesian Rupiah JPY - Japanese Yen KRW - South Korean Won MXN - Mexican Peso MYR - Malaysian Ringgit NOK - Norwegian Krone NZD - New Zealand Dollar PEN - Peruvian Neuvo Sol PLN - Polish Zloty SEK - Swedish Krona | | ADR - American Depository Receipt FRN - Floating Rate Note |
TGA-29
Franklin Templeton Variable Insurance Products Trust
Templeton Global Asset Allocation Fund
Report of Independent Registered Public Accounting Firm
To the Board of Trustees and Shareholders of Franklin Templeton Variable Insurance Products Trust
In our opinion, the accompanying statement of assets and liabilities, including the statement of investments, and the related statements of operations and of changes in net assets and the financial highlights present fairly, in all material respects, the financial position of Templeton Global Asset Allocation Fund (one of the funds constituting the Franklin Templeton Variable Insurance Products Trust, hereafter referred to as the “Fund”) at December 31, 2008, the results of its operations for the year then ended, the changes in its net assets for each of the two years in the period then ended and the financial highlights for the periods presented, in conformity with accounting principles generally accepted in the United States of America. These financial statements and financial highlights (hereafter referred to as “financial statements”) are the responsibility of the Fund’s management. Our responsibility is to express an opinion on these financial statements based on our audits. We conducted our audits of these financial statements in accordance with the standards of the Public Company Accounting Oversight Board (United States). Those standards require that we plan and perform the audit to obtain reasonable assurance about whether the financial statements are free of material misstatement. An audit includes examining, on a test basis, evidence supporting the amounts and disclosures in the financial statements, assessing the accounting principles used and significant estimates made by management, and evaluating the overall financial statement presentation. We believe that our audits, which included confirmation of securities at December 31, 2008 by correspondence with the custodian, provide a reasonable basis for our opinion.
PricewaterhouseCoopers LLP
San Francisco, California
February 10, 2009
TGA-30
Franklin Templeton Variable Insurance Products Trust
Tax Designation (unaudited)
Templeton Global Asset Allocation Fund
Under Section 852(b)(3)(C) of the Internal Revenue Code (Code), the Fund designates the maximum amount allowable but no less than $14,502,660 as a long term capital gain dividend for the fiscal year ended December 31, 2008.
Under Section 854(b)(2) of the Code, the Fund designates 2.67% of the ordinary income dividends as income qualifying for the dividends received deduction for the fiscal year ended December 31, 2008.
At December 31, 2008, more than 50% of the Fund’s total assets were invested in securities of foreign issuers. In most instances, foreign taxes were withheld from income paid to the Fund on these investments. The Fund elects to treat foreign taxes paid as allowed under Section 853 of the Code. This election will allow shareholders of record as of the 2009 distribution date, to treat their proportionate share of foreign taxes paid by the Fund as having been paid directly by them. The shareholder shall consider these amounts as foreign taxes paid in the tax year in which they receive the Fund distribution.
TGA-31
TEMPLETON GLOBAL INCOME SECURITIES FUND
This annual report for Templeton Global Income Securities Fund covers the fiscal year ended December 31, 2008.
Performance Summary as of 12/31/08
Average annual total return of Class 1 shares represents the average annual change in value, assuming reinvestment of dividends and capital gains. Average returns smooth out variations in returns, which can be significant; they are not the same as year-by-year results.
Periods ended 12/31/08
| | | | | | |
| | | 1-Year | | 5-Year | | 10-Year |
Average Annual Total Return | | +6.46% | | +8.41% | | +8.44% |
Total Return Index Comparison for a Hypothetical $10,000 Investment (1/1/99–12/31/08)
The graph below shows the change in value of a hypothetical $10,000 investment in the Fund over the indicated period and includes reinvestment of any income or distributions. The Fund’s performance is compared to the performance of the J.P. Morgan (JPM) Government Bond Index (GBI) Global and the Consumer Price Index (CPI). One cannot invest directly in an index, nor is an index representative of the Fund’s portfolio. Please see Important Notes to Performance Information preceding the Fund Summaries.
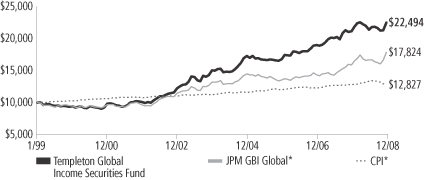
*Source: © 2009 Morningstar. Please see Index Descriptions following the Fund Summaries.
Templeton Global Income Securities Fund – Class 1
Performance reflects the Fund’s Class 1 operating expenses, but does not include any contract fees, expenses or sales charges. If they had been included, performance would be lower. These charges and deductions, particularly for variable life policies, can have a significant effect on contract values and insurance benefits. See the contract prospectus for a complete description of these expenses, including sales charges.
Performance data represent past performance, which does not guarantee future results. Investment return and principal value will fluctuate, and you may have a gain or loss when you sell your shares.
Current performance may differ from figures shown.
TGI-1
Fund Goal and Main Investments: Templeton Global Income Securities Fund seeks high current income, consistent with preservation of capital, with capital appreciation as a secondary consideration. The Fund normally invests mainly in debt securities of governments and their political subdivisions and agencies, supranational organizations and companies located anywhere in the world, including emerging markets.
Performance Overview
You can find the Fund’s one-year total return in the Performance Summary. The Fund underperformed its benchmark, the JPM GBI Global, which had a +12.00% total return in U.S. dollar terms for the year under review.1
Economic and Market Overview
The year was tumultuous for global economies and financial markets. High commodity prices and inflationary pressures during the first half of 2008 gave way to a worldwide recession with declining economic activity, inflation and interest rates. A multifaceted, international response to the financial crisis tried to limit the damage to the global economy. For example, Japan cut interest rates 40 basis points (bps; 100 bps equal one percentage point), Europe 150 bps and the U.S. 400 bps during the period. This situation benefited long duration, developed government bonds. Additionally, a flight to quality favored a small group of developed country government bonds and currencies as investors indiscriminately sought to reduce risk.
In the U.S., the economy was already contracting in the third quarter before the global economic slump in the fourth quarter. Nearly all economic data indicated weakness with employment, housing prices, expectations and eventually inflation pointing toward a severe recession. Futhermore, consumer spending dropped sharply and exports decelerated. In response, the Federal Reserve Board adopted a range for the federal funds target rate of 0% to 0.25% and stood ready to “employ all available tools” to promote economic growth and preserve price stability. Additionally, a large fiscal stimulus plan was in process. In Latin America, several governments also planned to cushion their economic slowdowns with increased government spending. In many of these countries, however, the downturn did not occur until late in the year and inflation remained elevated. Thus, other counter-cyclical policies,
1. Source: © 2009 Morningstar. One cannot invest directly in an index, nor is an index representative of the Fund’s portfolio. Please see Index Descriptions following the Fund Summaries.
Fund Risks: Because the Fund invests in bonds and other debt obligations, its share price and yield will be affected by interest rate movements. Bond prices generally move in the opposite direction of interest rates. Thus, as prices of bonds in the Fund adjust to a rise in interest rates, the Fund’s share price may decline. High yield, lower-rated (junk) bonds generally have greater price swings and higher default risks than investment-grade bonds. Foreign investing, especially in emerging markets, involves additional risks, including currency fluctuations, economic instability, market volatility, and political and social instability. The Fund’s prospectus also includes a description of the main investment risks.
What is duration?
Duration is a measure of a bond’s price sensitivity to interest rate changes. In general, a portfolio of securities with a lower duration can be expected to be less sensitive to interest rate changes than a portfolio with a higher duration.
TGI-2
including monetary easing, had not been enacted at year-end. Further complicating the counter-cyclical effort, several commodity exporting countries’ government revenues seemed likely to fall due to significantly lower commodity prices.
Within much of developed Europe, the situation was similar to that of the U.S. The eurozone economy entered into a recession in the third quarter. Fourth quarter economic indicators suggested a significant deepening of the recession. After inflation rose above 4.0% in the summer, twice the level the European Central Bank (ECB) defines as consistent with price stability, lower energy prices reduced inflation to 1.6% in December.2 The ECB’s policy response remained two-pronged, including an unprecedented and unlimited liquidity expansion to the banking system, and the beginning of interest rate reductions. However, the fiscal response was small and poorly coordinated. Central and eastern European economies were some of the most severely affected. Following several years of rapid expansion, fueled by credit extension from European banks, many countries’ imbalances were revealed. Countries such as Hungary, Ukraine and Latvia had to ask the International Monetary Fund for support.
Asia’s economic growth slowed primarily due to weaker exports. However, Asian economic growth did not fall as sharply as in the U.S. or Europe. Additionally, Asia’s current accounts remained relatively stable and actually improved for some net commodity importers such as South Korea. Asian countries largely did not face balance of payment pressure during the year. Furthermore, with substantial international reserves and favorable conditions from official financing sources, most had some ability to cushion the external shock. Authorities sought to take advantage of this flexibility through monetary and fiscal easing. Notably, China’s State Council announced a four trillion yuan fiscal stimulus package, which amounted to about 12.0% of projected 2009 GDP.3 The Asian banking sector seemed likely to come under some stress as economies slow. However, the banking system remained fairly stable as banks have deleveraged since the 1997 crisis and authorities appeared willing and capable of stabilizing the banking sector given their previous experience.
Investment Strategy
We allocate the Fund’s assets among issuers, geographic regions, and currencies based upon our assessment of relative interest rates among
2. Source: European Central Bank.
3. Source: International Monetary Fund.
What is a current account?
A current account is that part of the balance of payments where all of one country’s international transactions in goods and services are recorded.
What is balance of payments?
Balance of payments is a record of all of a country’s exports and imports of goods and services, borrowing and lending with the rest of the world during a particular time period. It helps a country evaluate its competitive strengths and weaknesses and forecast the strength of its currency.
TGI-3
currencies, our outlook for changes in interest rates and currencies, and credit risks. In considering these factors, we may evaluate a country’s changing market, economic and political conditions, such as inflation rate, growth prospects, global trade patterns and government policies. We seek to manage the Fund’s exposure to various currencies and may utilize forward currency exchange contracts.
Manager’s Discussion
In 2008, the global economy and financial system were hit by multiple shocks, which resulted in significant market turbulence. Given this backdrop, the Fund provided positive results largely due to diversification and our actively managed fundamental investment strategy. The Fund’s total return was influenced by various factors, including interest rate developments, currency movements and exposure to sovereign debt markets.
Interest Rate Strategy
For much of the year, a disconnect existed between interest rates charged by the market and many countries’ underlying fundamentals. The flight to quality into developed market government bonds and developing economies’ commodity-driven inflationary pressures led markets to price in decoupling of global growth we believed was unrealistic where interest rates would stay high outside the largest developed economies. However, toward year-end, interest rate cuts began to be priced in around the globe, leading to strong returns for the Fund’s New Zealand, Australian, South Korean and Mexican duration exposures. Duration exposure contributed significantly to absolute performance due to these select positions. However, on a relative basis, the Fund’s diversified exposures underperformed the more concentrated benchmark due to the strong rally in U.S., British and Japanese Treasury bonds. The Fund continued to see value in bonds outside of these three core economies due to higher relative yields.
Currency Strategy
The Fund’s diverse currency exposure produced mixed results despite its ongoing commitment to holding only currencies of economies with strong underlying fundamentals. For example, the Fund attempted to capitalize on accelerating worldwide deleveraging by investing in the Japanese yen and Swiss franc, which were low-yielding currencies from countries with external surpluses. These currencies benefited from local investors’ repatriation of international investments as risk aversion rose. The currencies of these countries, who are net creditors, became safe
Currency Breakdown
Templeton Global Income Securities Fund 12/31/08
| | |
| | | % of Total
Net Assets |
Asia Pacific | | 75.2% |
Japanese Yen | | 24.8% |
Malaysian Ringgit | | 16.0% |
Indonesian Rupiah | | 10.0% |
Chinese Yuan | | 8.7% |
Vietnamese Dong | | 4.8% |
South Korean Won | | 3.6% |
Taiwanese Dollar | | 3.1% |
Kazakhstani Tenge | | 1.5% |
Indian Rupee | | 1.2% |
Australian Dollar | | 0.9% |
Singapore Dollar | | 0.5% |
New Zealand Dollar | | 0.1% |
| |
Americas | | 37.6% |
U.S. Dollar | | 30.3% |
Brazilian Real | | 2.3% |
Peruvian Nuevo Sol | | 2.2% |
Mexican Peso | | 2.1% |
Chilean Peso | | 0.7% |
| |
Middle East & Africa | | 5.4% |
Egyptian Pound | | 5.4% |
| |
Europe | | -18.2% |
Swedish Krona | | 8.8% |
Swiss Franc | | 7.9% |
Russian Ruble | | 5.7% |
Polish Zloty | | 2.6% |
Norwegian Krone | | 2.4% |
Czech Koruna | | 0.8% |
Romania Leu* | | -0.8% |
British Pound Sterling* | | -2.6% |
Euro* | | -43.0% |
*Romania leu = -0.8%, British pound sterling = -2.6%, and euro = -43.0% due to forward exchange contracts.
The dollar value, number of shares or principal amount, and names of all portfolio holdings are listed in the Fund’s Statement of Investments.
TGI-4
havens within the turmoil. Additionally, the Fund’s underweighted exposure to the euro benefited relative performance as the credit crunch became a significant global problem leading to difficulties for the leveraged European economy and lower interest rates from the ECB. Although the Fund correctly identified the euro as overvalued at close to its all-time high, several other currency exposures hurt relative performance as extreme risk aversion led to some currencies trading out of line with their relative fundamentals. The Brazilian real, Indonesian rupiah and Malaysian ringgit depreciated against the U.S. dollar during the year despite those countries’ strong relative economic growth and trade surpluses.
Global Sovereign Debt Strategy
The Fund maintained limited exposure to U.S.-dollar denominated sovereign credit during the year because of what we considered unattractive valuations. However, the sell-off in some bond markets due to forced selling by hedge funds and deleveraging by the sell-side broker community pushed down valuations past levels we viewed as consistent with medium-term valuations. This indiscriminate risk reduction allowed us an opportunity to add to our sovereign bond positions at what were to us attractive, depressed levels. It is worth highlighting the substantial improvement in sovereign credit fundamentals compared with prior episodes of volatility. Importantly, many governments’ external debt burdens during the period were lower than in the 1990s. Although some countries may likely experience crises, we believed the indiscriminate sell-off of risky assets created select opportunities where markets may have overpriced sovereign default risk.
Thank you for your participation in Templeton Global Income Securities Fund. We look forward to serving your future investment needs.
The foregoing information reflects our analysis, opinions and portfolio holdings as of December 31, 2008, the end of the reporting period. The way we implement our main investment strategies and the resulting portfolio holdings may change depending on factors such as market and economic conditions. These opinions may not be relied upon as investment advice or an offer for a particular security. The information is not a complete analysis of every aspect of any market, country, industry, security or the Fund. Statements of fact are from sources considered reliable, but the investment manager makes no representation or warranty as to their completeness or accuracy. Although historical performance is no guarantee of future results, these insights may help you understand our investment management philosophy.
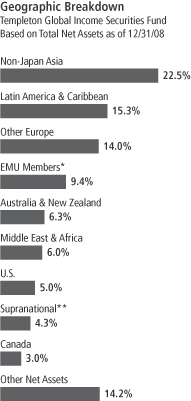
*The Fund’s EMU investments were in Austria, France, Germany and the Netherlands.
**The Fund’s supranational investments were denominated in the Japanese yen, Mexican peso, New Zealand dollar, Norwegian krone and Polish zloty.
TGI-5
Fund Expenses
As an investor in a variable insurance contract (Contract) that indirectly provides for investment in an underlying mutual fund, you can incur transaction and/or ongoing expenses at both the Fund level and the Contract level.
| • | | Transaction expenses can include sales charges (loads) on purchases, redemption fees, surrender fees, transfer fees and premium taxes. |
| • | | Ongoing expenses can include management fees, distribution and service (12b-1) fees, contract fees, annual maintenance fees, mortality and expense risk fees and other fees and expenses. All mutual funds and Contracts have some types of ongoing expenses. |
The expenses shown in the table are meant to highlight ongoing expenses at the Fund level only and do not include ongoing expenses at the Contract level, or transaction expenses at either the Fund or Contract level. While the Fund does not have transaction expenses, if the transaction and ongoing expenses at the Contract level were included, the expenses shown below would be higher. You should consult your Contract prospectus or disclosure document for more information.
The table shows Fund-level ongoing expenses and can help you understand these expenses and compare them with those of other mutual funds offered through the Contract. The table assumes a $1,000 investment held for the six months indicated. Please refer to the Fund prospectus for additional information on operating expenses.
Actual Fund Expenses
The first line (Actual) of the table provides actual account values and expenses. The “Ending Account Value” is derived from the Fund’s actual return, which includes the effect of ongoing Fund expenses, but does not include the effect of ongoing Contract expenses.
You can estimate the Fund-level expenses you incurred during the period by following these steps. Of course, your account value and expenses will differ from those in this illustration:
| 1. | Divide your account value by $1,000. |
If an account had an $8,600 value, then $8,600 ÷ $1,000 = 8.6.
| 2. | Multiply the result by the number under the heading “Fund-Level Expenses Incurred During Period.” |
If Fund-Level Expenses Incurred During Period were $7.50, then 8.6 x $7.50 = $64.50.
In this illustration, the estimated expenses incurred this period at the Fund level are $64.50.
Templeton Global Income Securities Fund – Class 1
TGI-6
Hypothetical Example for Comparison with Other Mutual Funds
Information in the second line (Hypothetical) of the table can help you compare ongoing expenses of the Fund with those of other mutual funds offered through the Contract. This information may not be used to estimate the actual ending account balance or expenses you incurred during the period. The hypothetical “Ending Account Value” is based on the Fund’s actual expense ratio for each class and an assumed 5% annual rate of return before expenses, which does not represent the Fund’s actual return. The figure under the heading “Fund-Level Expenses Incurred During Period” shows the hypothetical expenses your account would have incurred under this scenario. You can compare this figure with the 5% hypothetical examples that appear in shareholder reports of other funds offered through a Contract.
| | | | | | | | | |
| Class 1 | | Beginning
Account
Value 7/1/08 | | Ending
Account
Value 12/31/08 | | Fund-Level
Expenses Incurred
During Period*
7/1/08–12/31/08 |
Actual | | $ | 1,000 | | $ | 1,051.30 | | $ | 3.04 |
Hypothetical (5% return before expenses) | | $ | 1,000 | | $ | 1,022.17 | | $ | 3.00 |
*Expenses are calculated using the most recent six-month annualized expense ratio for the Fund’s Class 1 shares (0.59%), which does not include any ongoing expenses of the Contract for which the Fund is an investment option, multiplied by the average account value over the period, multiplied by 184/366 to reflect the one-half year period.
TGI-7
SUPPLEMENT DATED OCTOBER 8, 2008
TOTHE PROSPECTUS DATED MAY 1, 2008
TEMPLETON GLOBAL INCOME SECURITIES FUND
ASERIESOF FRANKLIN TEMPLETON VARIABLE INSURANCE PRODUCTS TRUST
Effective May 1, 2009, Templeton Global Income Securities Fund will change its name to “Templeton Global Bond Securities Fund” and adopt a fund policy that, under normal market conditions, the Fund will invest at least 80% of its net assets in bonds and give shareholders at least 60 days’ advance notice of any change to the policy. “Bonds” will include debt securities of any maturity, such as bonds, notes, bills and debentures.
Please keep this supplement for future reference.
TGI-8
Franklin Templeton Variable Insurance Products Trust
Financial Highlights
Templeton Global Income Securities Fund
| | | | | | | | | | | | | | | | | | | | |
| | | Year Ended December 31, | |
| Class 1 | | 2008 | | | 2007 | | | 2006 | | | 2005 | | | 2004 | |
| | | | |
Per share operating performance | | | | | | | | | | | | | | | | | | | | |
(for a share outstanding throughout the year) | | | | | | | | | | | | | | | | | | | | |
Net asset value, beginning of year | | $ | 17.00 | | | $ | 15.73 | | | $ | 14.36 | | | $ | 15.80 | | | $ | 15.54 | |
| | | | |
Income from investment operationsa: | | | | | | | | | | | | | | | | | | | | |
Net investment incomeb | | | 0.80 | | | | 0.77 | | | | 0.61 | | | | 0.57 | | | | 0.66 | |
Net realized and unrealized gains (losses) | | | 0.27 | | | | 0.97 | | | | 1.24 | | | | (1.03 | ) | | | 1.37 | |
| | | | |
Total from investment operations | | | 1.07 | | | | 1.74 | | | | 1.85 | | | | (0.46 | ) | | | 2.03 | |
| | | | |
Less distributions from net investment income and net foreign currency gains | | | (0.65 | ) | | | (0.47 | ) | | | (0.48 | ) | | | (0.98 | ) | | | (1.77 | ) |
| | | | |
Redemption fees | | | — | c | | | — | c | | | — | c | | | — | c | | | — | |
| | | | |
Net asset value, end of year | | $ | 17.42 | | | $ | 17.00 | | | $ | 15.73 | | | $ | 14.36 | | | $ | 15.80 | |
| | | | |
| | | | | |
Total returnd | | | 6.46% | | | | 11.27% | | | | 13.14% | | | | (2.91)% | | | | 15.09% | |
Ratios to average net assets | | | | | | | | | | | | | | | | | | | | |
Expenses before expense reduction | | | 0.58% | | | | 0.64% | | | | 0.80% | | | | 0.78% | | | | 0.79% | |
Expenses net of expense reduction | | | 0.58% | | | | 0.64% | | | | 0.72% | | | | 0.74% | | | | 0.78% | |
Net investment income | | | 4.66% | | | | 4.70% | | | | 4.09% | | | | 3.81% | | | | 4.40% | |
| | | | | |
Supplemental data | | | | | | | | | | | | | | | | | | | | |
Net assets, end of year (000’s) | | $ | 220,588 | | | $ | 137,700 | | | $ | 75,843 | | | $ | 53,115 | | | $ | 49,845 | |
Portfolio turnover rate | | | 28.46% | | | | 47.33% | | | | 30.65% | | | | 30.28% | | | | 37.39% | |
aThe amount shown for a share outstanding throughout the period may not correlate with the Statement of Operations for the period due to the timing of sales and repurchases of the Fund shares in relation to income earned and/or fluctuating market value of the investments of the Fund.
bBased on average daily shares outstanding.
cAmount rounds to less than $0.01 per share.
dTotal return does not include any fees, charges or expenses imposed by the variable annuity and life insurance contracts for which the Franklin Templeton Variable Insurance Products Trust serves as an underlying investment vehicle.
The accompanying notes are an integral part of these financial statements.
TGI-9
Franklin Templeton Variable Insurance Products Trust
Financial Highlights (continued)
Templeton Global Income Securities Fund
| | | | | | | | | | | | | | | | | | | | |
| | | Year Ended December 31, | |
| Class 2 | | 2008 | | | 2007 | | | 2006 | | | 2005 | | | 2004 | |
| | | | |
Per share operating performance | | | | | | | | | | | | | | | | | | | | |
(for a share outstanding throughout the year) | | | | | | | | | | | | | | | | | | | | |
Net asset value, beginning of year | | $ | 16.72 | | | $ | 15.50 | | | $ | 14.19 | | | $ | 15.64 | | | $ | 15.42 | |
| | | | |
Income from investment operationsa: | | | | | | | | | | | | | | | | | | | | |
Net investment incomeb | | | 0.74 | | | | 0.72 | | | | 0.57 | | | | 0.52 | | | | 0.60 | |
Net realized and unrealized gains (losses) | | | 0.27 | | | | 0.96 | | | | 1.21 | | | | (1.00 | ) | | | 1.36 | |
| | | | |
Total from investment operations | | | 1.01 | | | | 1.68 | | | | 1.78 | | | | (0.48 | ) | | | 1.96 | |
| | | | |
Less distributions from net investment income and net foreign currency gains | | | (0.63 | ) | | | (0.46 | ) | | | (0.47 | ) | | | (0.97 | ) | | | (1.74 | ) |
| | | | |
Redemption fees | | | — | c | | | — | c | | | — | c | | | — | c | | | — | |
| | | | |
Net asset value, end of year | | $ | 17.10 | | | $ | 16.72 | | | $ | 15.50 | | | $ | 14.19 | | | $ | 15.64 | |
| | | | |
| | | | | |
Total returnd | | | 6.21% | | | | 11.00% | | | | 12.77% | | | | (3.08)% | | | | 14.74% | |
Ratios to average net assets | | | | | | | | | | | | | | | | | | | | |
Expenses before expense reduction | | | 0.83% | | | | 0.89% | | | | 1.05% | | | | 1.03% | | | | 1.04% | |
Expenses net of expense reduction | | | 0.83% | | | | 0.89% | | | | 0.97% | | | | 0.99% | | | | 1.03% | |
Net investment income | | | 4.41% | | | | 4.45% | | | | 3.84% | | | | 3.56% | | | | 4.15% | |
| | | | | |
Supplemental data | | | | | | | | | | | | | | | | | | | | |
Net assets, end of year (000’s) | | $ | 793,881 | | | $ | 480,649 | | | $ | 205,768 | | | $ | 61,255 | | | $ | 19,779 | |
Portfolio turnover rate | | | 28.46% | | | | 47.33% | | | | 30.65% | | | | 30.28% | | | | 37.39% | |
aThe amount shown for a share outstanding throughout the period may not correlate with the Statement of Operations for the period due to the timing of sales and repurchases of the Fund shares in relation to income earned and/or fluctuating market value of the investments of the Fund.
bBased on average daily shares outstanding.
cAmount rounds to less than $0.01 per share.
dTotal return does not include any fees, charges or expenses imposed by the variable annuity and life insurance contracts for which the Franklin Templeton Variable Insurance Products Trust serves as an underlying investment vehicle.
The accompanying notes are an integral part of these financial statements.
TGI-10
Franklin Templeton Variable Insurance Products Trust
Financial Highlights (continued)
Templeton Global Income Securities Fund
| | | | | | | | | | | | | | | | |
| | | Year Ended December 31, | |
| Class 3 | | 2008 | | | 2007 | | | 2006 | | | 2005a | |
| | | | |
Per share operating performance | | | | | | | | | | | | | | | | |
(for a share outstanding throughout the year) | | | | | | | | | | | | | | | | |
Net asset value, beginning of year | | $ | 16.70 | | | $ | 15.49 | | | $ | 14.18 | | | $ | 15.27 | |
| | | | |
Income from investment operationsb: | | | | | | | | | | | | | | | | |
Net investment incomec | | | 0.74 | | | | 0.72 | | | | 0.58 | | | | 0.38 | |
Net realized and unrealized gains (losses) | | | 0.27 | | | | 0.95 | | | | 1.21 | | | | (0.50 | ) |
| | | | |
Total from investment operations | | | 1.01 | | | | 1.67 | | | | 1.79 | | | | (0.12 | ) |
| | | | |
Less distributions from net investment income and net foreign currency gains | | | (0.63 | ) | | | (0.46 | ) | | | (0.48 | ) | | | (0.97 | ) |
| | | | |
Redemption feesd | | | — | | | | — | | | | — | | | | — | |
| | | | |
Net asset value, end of year | | $ | 17.08 | | | $ | 16.70 | | | $ | 15.49 | | | $ | 14.18 | |
| | | | |
| | | | |
Total returne | | | 6.21% | | | | 11.03% | | | | 12.84% | | | | (0.80)% | |
Ratios to average net assetsf | | | | | | | | | | | | | | | | |
Expenses before expense reduction | | | 0.83% | | | | 0.89% | | | | 1.05% | | | | 1.03% | |
Expenses net of expense reduction | | | 0.83% | | | | 0.89% | | | | 0.97% | | | | 0.99% | |
Net investment income | | | 4.41% | | | | 4.45% | | | | 3.84% | | | | 3.56% | |
| | | | |
Supplemental data | | | | | | | | | | | | | | | | |
Net assets, end of year (000’s) | | $ | 128,155 | | | $ | 91,162 | | | $ | 35,572 | | | $ | 5,769 | |
Portfolio turnover rate | | | 28.46% | | | | 47.33% | | | | 30.65% | | | | 30.28% | |
aFor the period April 1, 2005 (effective date) to December 31, 2005.
bThe amount shown for a share outstanding throughout the period may not correlate with the Statement of Operations for the period due to the timing of sales and repurchases of the Fund shares in relation to income earned and/or fluctuating market value of the investments of the Fund.
cBased on average daily shares outstanding.
dAmount rounds to less than $0.01 per share.
eTotal return does not include any fees, charges or expenses imposed by the variable annuity and life insurance contracts for which the Franklin Templeton Variable Insurance Products Trust serves as an underlying investment vehicle. Total return is not annualized for periods less than one year.
fRatios are annualized for periods less than one year.
The accompanying notes are an integral part of these financial statements.
TGI-11
Franklin Templeton Variable Insurance Products Trust
Financial Highlights (continued)
Templeton Global Income Securities Fund
| | | | |
| Class 4 | | Period Ended
December 31,
2008a | |
Per share operating performance | | | | |
(for a share outstanding throughout the period) | | | | |
Net asset value, beginning of period | | $ | 18.00 | |
| | | | |
Income from investment operationsb: | | | | |
Net investment incomec | | | 0.66 | |
Net realized and unrealized gains (losses) | | | (0.64 | ) |
| | | | |
Total from investment operations | | | 0.02 | |
| | | | |
Less distributions from net investment income and net foreign currency gains | | | (0.65 | ) |
| | | | |
Redemption feesd | | | — | |
| | | | |
Net asset value, end of period | | $ | 17.37 | |
| | | | |
| |
Total returne | | | 0.26% | |
Ratios to average net assetsf | | | | |
Expensesg | | | 0.93% | |
Net investment income | | | 4.31% | |
| |
Supplemental data | | | | |
Net assets, end of period (000’s) | | $ | 43,069 | |
Portfolio turnover rate | | | 28.46% | |
aFor the period February 29, 2008 (effective date) to December 31, 2008.
bThe amount shown for a share outstanding throughout the period may not correlate with the Statement of Operations for the period due to the timing of sales and repurchases of the Fund shares in relation to income earned and/or fluctuating market value of the investments of the Fund.
cBased on average daily shares outstanding.
dAmount rounds to less than $0.01 per share.
eTotal return does not include any fees, charges or expenses imposed by the variable annuity and life insurance contracts for which the Franklin Templeton Variable Insurance Products Trust serves as an underlying investment vehicle. Total return is not annualized for periods less than one year.
fRatios are annualized for periods less than one year.
gBenefit of expense reduction rounds to less than 0.01%.
The accompanying notes are an integral part of these financial statements.
TGI-12
Franklin Templeton Variable Insurance Products Trust
Statement of Investments, December 31, 2008
| | | | | | |
| Templeton Global Income Securities Fund | | Principal
Amounta | | | Value |
Government and Agency Securities 78.5% | | | | | | |
Argentina 2.4% | | | | | | |
b,cGovernment of Argentina, senior bond, FRN, 3.127%, 8/03/12 | | 107,485,000 | | | $ | 28,538,394 |
| | | | | | |
Australia 6.2% | | | | | | |
New South Wales Treasury Corp.,
6.00%, 5/01/12 | | 13,180,000 | AUD | | | 9,735,403 |
senior note, 5.50%, 3/01/17 | | 32,225,000 | AUD | | | 23,825,946 |
Queensland Treasury Corp.,
09G, 6.00%, 7/14/09 | | 3,195,000 | AUD | | | 2,292,190 |
13, 6.00%, 8/14/13 | | 6,580,000 | AUD | | | 4,897,876 |
17, 6.00%, 9/14/17 | | 13,160,000 | AUD | | | 10,075,134 |
d144A, 7.125%, 9/18/17 | | 33,340,000 | NZD | | | 22,937,524 |
| | | | | | |
| | | | | | 73,764,073 |
| | | | | | |
Austria 3.3% | | | | | | |
dGovernment of Austria, senior bond, 144A, 5.00%, 7/15/12 | | 400,000 | EUR | | | 595,828 |
Oesterreichische Kontrollbank AG, senior bond, 2.75%, 6/14/11 | | 40,000,000 | CHF | | | 38,993,127 |
| | | | | | |
| | | | | | 39,588,955 |
| | | | | | |
Brazil 2.4% | | | | | | |
Nota Do Tesouro Nacional,
9.762%, 1/01/12 | | 20,470 | e BRL | | | 8,320,814 |
9.762%, 1/01/14 | | 7,100 | e BRL | | | 2,754,746 |
9.762%, 1/01/17 | | 22,490 | e BRL | | | 8,377,863 |
fIndex Linked, 6.00%, 5/15/15 | | 2,750 | e BRL | | | 1,908,123 |
fIndex Linked, 6.00%, 5/15/45 | | 10,825 | e BRL | | | 7,092,029 |
| | | | | | |
| | | | | | 28,453,575 |
| | | | | | |
Canada 3.0% | | | | | | |
Province of Manitoba, 6.375%, 9/01/15 | | 37,805,000 | NZD | | | 23,416,895 |
Province of Ontario, 6.25%, 6/16/15 | | 19,125,000 | NZD | | | 11,622,565 |
| | | | | | |
| | | | | | 35,039,460 |
| | | | | | |
France 3.7% | | | | | | |
Government of France,
4.00%, 10/25/09 | | 195,000 | EUR | | | 277,462 |
4.25%, 10/25/17 | | 27,650,000 | EUR | | | 41,357,034 |
4.25%, 4/25/19 | | 1,520,000 | EUR | | | 2,270,809 |
| | | | | | |
| | | | | | 43,905,305 |
| | | | | | |
Germany 0.8% | | | | | | |
Landwirtschaftliche Rentenbank, senior note, 8.50%, 2/22/16 | | 137,707,000 | MXN | | | 9,870,424 |
| | | | | | |
Hungary 0.7% | | | | | | |
Government of Hungary,
4.375%, 7/04/17 | | 1,225,000 | EUR | | | 1,391,232 |
5.75%, 6/11/18 | | 5,365,000 | EUR | | | 6,642,314 |
| | | | | | |
| | | | | | 8,033,546 |
| | | | | | |
Indonesia 9.6% | | | | | | |
Government of Indonesia, | | | | | | |
FR20, 14.275%, 12/15/13 | | 14,267,000,000 | IDR | | | 1,426,700 |
FR31, 11.00%, 11/15/20 | | 167,351,000,000 | IDR | | | 14,278,571 |
FR34, 12.80%, 6/15/21 | | 207,810,000,000 | IDR | | | 19,827,734 |
FR35, 12.90%, 6/15/22 | | 66,582,000,000 | IDR | | | 6,398,590 |
FR36, 11.50%, 9/15/19 | | 30,075,000,000 | IDR | | | 2,655,707 |
TGI-13
Franklin Templeton Variable Insurance Products Trust
Statement of Investments, December 31, 2008 (continued)
| | | | | | |
| Templeton Global Income Securities Fund | | Principal
Amounta | | | Value |
Government and Agency Securities (continued) | | | | | | |
Indonesia (continued) | | | | | | |
Government of Indonesia, (continued) | | | | | | |
FR37, 12.00%, 9/15/26 | | 8,230,000,000 | IDR | | $ | 741,832 |
FR39, 11.75%, 8/15/23 | | 5,491,000,000 | IDR | | | 488,648 |
FR40, 11.00%, 9/15/25 | | 61,856,000,000 | IDR | | | 5,192,502 |
FR42, 10.25%, 7/15/27 | | 88,574,000,000 | IDR | | | 6,988,409 |
FR43, 10.25%, 7/15/22 | | 68,340,000,000 | IDR | | | 5,486,007 |
FR44, 10.00%, 9/15/24 | | 4,454,000,000 | IDR | | | 346,309 |
FR46, 9.50%, 7/15/23 | | 226,780,000,000 | IDR | | | 17,008,500 |
FR47, 10.00%, 2/15/28 | | 61,737,000,000 | IDR | | | 4,757,713 |
FR48, 9.00%, 9/15/18 | | 16,920,000,000 | IDR | | | 1,280,643 |
FR49, 9.00%, 9/15/13 | | 53,560,000,000 | IDR | | | 4,434,672 |
dsenior bond,144A, 6.875%, 1/17/18 | | 1,690,000 | | | | 1,378,979 |
dsenior bond, 144A, 8.50%, 10/12/35 | | 2,924,000 | | | | 2,459,300 |
dsenior bond, 144A, 6.625%, 2/17/37 | | 1,710,000 | | | | 1,290,594 |
dsenior bond, 144A, 7.75%, 1/17/38 | | 3,630,000 | | | | 3,062,813 |
gsenior bond, Reg S, 6.875%, 1/17/18 | | 3,395,000 | | | | 2,770,198 |
gsenior bond, Reg S, 8.50%, 10/12/35 | | 6,195,000 | | | | 5,210,453 |
gsenior bond, Reg S, 6.625%, 2/17/37 | | 530,000 | | | | 400,009 |
gsenior bond, Reg S, 7.75%, 1/17/38 | | 7,350,000 | | | | 6,201,562 |
| | | | | | |
| | | | | | 114,086,445 |
| | | | | | |
Iraq 0.1% | | | | | | |
gGovernment of Iraq, Reg S, 5.80%, 1/15/28 | | 2,415,000 | | | | 1,029,394 |
| | | | | | |
Malaysia 4.7% | | | | | | |
Government of Malaysia,
3.869%, 4/13/10 | | 1,690,000 | MYR | | | 495,003 |
3.756%, 4/28/11 | | 106,560,000 | MYR | | | 31,394,135 |
3.833%, 9/28/11 | | 3,660,000 | MYR | | | 1,082,653 |
3.461%, 7/31/13 | | 12,600,000 | MYR | | | 3,714,677 |
3.814%, 2/15/17 | | 18,885,000 | MYR | | | 5,654,210 |
4.24%, 2/07/18 | | 44,360,000 | MYR | | | 13,826,007 |
| | | | | | |
| | | | | | 56,166,685 |
| | | | | | |
Mexico 9.3% | | | | | | |
Government of Mexico,
9.00%, 12/20/12 | | 265,000 | h MXN | | | 2,024,497 |
8.00%, 12/19/13 | | 794,500 | h MXN | | | 5,841,588 |
8.00%, 12/17/15 | | 726,000 | h MXN | | | 5,317,030 |
7.25%, 12/15/16 | | 250,000 | h MXN | | | 1,750,456 |
10.00%, 12/05/24 | | 7,082,800 | h MXN | | | 59,451,107 |
10.00%, 11/20/36 | | 365,000 | h MXN | | | 3,146,575 |
d144A, 7.50%, 3/08/10 | | 450,000 | EUR | | | 646,539 |
M 10, 7.75%, 12/14/17 | | 4,473,000 | h MXN | | | 32,206,772 |
| | | | | | |
| | | | | | 110,384,564 |
| | | | | | |
Netherlands 1.6% | | | | | | |
Government of the Netherlands, 4.50%, 7/15/17 | | 12,280,000 | EUR | | | 18,445,737 |
| | | | | | |
New Zealand 0.1% | | | | | | |
Government of New Zealand, 7.00%, 7/15/09 | | 2,435,000 | NZD | | | 1,445,878 |
| | | | | | |
Norway 2.0% | | | | | | |
Government of Norway,
5.50%, 5/15/09 | | 76,360,000 | NOK | | | 11,086,437 |
TGI-14
Franklin Templeton Variable Insurance Products Trust
Statement of Investments, December 31, 2008 (continued)
| | | | | | |
| Templeton Global Income Securities Fund | | Principal
Amounta | | | Value |
Government and Agency Securities (continued) | | | | | | |
Norway (continued) | | | | | | |
Government of Norway, (continued)
6.00%, 5/16/11 | | 29,300,000 | NOK | | $ | 4,547,454 |
6.50%, 5/15/13 | | 49,400,000 | NOK | | | 8,067,894 |
| | | | | | |
| | | | | | 23,701,785 |
| | | | | | |
Peru 0.3% | | | | | | |
Government of Peru,
7.84%, 8/12/20 | | 4,945,000 | PEN | | | 1,615,439 |
7, 8.60%, 8/12/17 | | 6,185,000 | PEN | | | 2,112,041 |
| | | | | | |
| | | | | | 3,727,480 |
| | | | | | |
Philippines 0.0%i | | | | | | |
gGovernment of the Philippines, Reg S, 9.125%, 2/22/10 | | 330,000 | EUR | | | 466,630 |
| | | | | | |
Poland 1.6% | | | | | | |
Government of Poland,
6.00%, 5/24/09 | | 4,045,000 | PLN | | | 1,364,583 |
5.75%, 9/23/22 | | 48,750,000 | PLN | | | 17,026,501 |
| | | | | | |
| | | | | | 18,391,084 |
| | | | | | |
Russia 5.2% | | | | | | |
Government of Russia,
d144A, 7.50%, 3/31/30 | | 40,172,160 | | | | 35,552,362 |
gsenior bond, Reg S, 7.50%, 3/31/30 | | 29,248,100 | | | | 25,774,888 |
| | | | | | |
| | | | | | 61,327,250 |
| | | | | | |
South Africa 0.6% | | | | | | |
Government of South Africa,
5.25%, 5/16/13 | | 3,590,000 | EUR | | | 4,426,997 |
4.50%, 4/05/16 | | 1,874,000 | EUR | | | 2,024,526 |
senior note, 6.50%, 6/02/14 | | 805,000 | | | | 768,725 |
senior note, 5.875%, 5/30/22 | | 100,000 | | | | 82,750 |
| | | | | | |
| | | | | | 7,302,998 |
| | | | | | |
South Korea 8.2% | | | | | | |
Korea Deposit Insurance Corp.,
07-1, 5.57%, 9/14/12 | | 6,600,000,000 | KRW | | | 5,403,500 |
08-1, 5.28%, 2/15/13 | | 880,000,000 | KRW | | | 702,964 |
Korea Treasury Bond,
0500-1609, 5.00%, 9/10/16 | | 2,806,000,000 | KRW | | | 2,314,910 |
0525-1209, 5.25%, 9/10/12 | | 28,539,000,000 | KRW | | | 23,584,159 |
0525-2703, 5.25%, 3/10/27 | | 16,857,900,000 | KRW | | | 14,273,823 |
0550-1709, 5.50%, 9/10/17 | | 59,230,600,000 | KRW | | | 50,651,373 |
| | | | | | |
| | | | | | 96,930,729 |
| | | | | | |
jSupranational 4.3% | | | | | | |
European Bank For Reconstruction & Development, senior note, 5.10%, 6/12/09 | | 40,000,000 | PLN | | | 13,565,763 |
European Investment Bank, senior note,
4.50%, 5/15/13 | | 33,700,000 | NOK | | | 5,050,662 |
1612/37, 6.50%, 9/10/14 | | 7,850,000 | NZD | | | 4,978,851 |
bFRN, 0.723%, 9/21/11 | | 1,170,000,000 | JPY | | | 12,673,354 |
Inter-American Development Bank,
1.90%, 7/08/09 | | 175,000,000 | JPY | | | 1,939,089 |
6.00%, 12/15/17 | | 575,000 | NZD | | | 357,375 |
senior note, 7.50%, 12/05/24 | | 200,000,000 | MXN | | | 12,468,100 |
| | | | | | |
| | | | | | 51,033,194 |
| | | | | | |
TGI-15
Franklin Templeton Variable Insurance Products Trust
Statement of Investments, December 31, 2008 (continued)
| | | | | | |
| Templeton Global Income Securities Fund | | Principal
Amounta | | | Value |
Government and Agency Securities (continued) | | | | | | |
Sweden 4.5% | | | | | | |
Government of Sweden,
5.00%, 1/28/09 | | 247,720,000 | SEK | | $ | 31,743,897 |
4.00%, 12/01/09 | | 163,000,000 | SEK | | | 21,368,760 |
| | | | | | |
| | | | | | 53,112,657 |
| | | | | | |
United States and U.S. Territories 3.0% | | | | | | |
Alabama Public Housing Authorities Capital Program Revenue, Series B, FSA Insured, 4.45%, 1/01/24 | | 680,000 | | | | 614,074 |
Bay Area Toll Authority Toll Bridge Revenue, San Francisco Bay Area, Refunding, Series F1, 5.50%, 4/01/43 | | 2,810,000 | | | | 2,754,531 |
Bexar County Hospital District GO, Certificates of Obligation, 5.00%, 2/15/32 | | 1,615,000 | | | | 1,494,586 |
Bexar County Revenue, Venue Project, Refunding, Series A, BHAC Insured, 5.25%, 8/15/47 | | 1,450,000 | | | | 1,307,088 |
California State GO, Refunding,
5.125%, 4/01/33 | | 4,725,000 | | | | 4,187,673 |
5.00%, 4/01/38 | | 1,985,000 | | | | 1,684,570 |
Florida State Hurricane Catastrophe Fund Finance Corp. Revenue, Series A, 4.25%, 7/01/14 | | 4,545,000 | | | | 4,391,742 |
Hamilton County Sales Tax Revenue, Refunding, Sub Series A, FSA Insured, 5.00%, 12/01/32 | | 3,650,000 | | | | 3,261,421 |
Illinois Municipal Electricity Agency Power Supply Revenue, Series A, BHAC Insured, 5.00%, 2/01/35 | | 2,155,000 | | | | 2,026,476 |
Metropolitan Atlanta Rapid Transit Authority Sales Tax Revenue, Refunding, Third Indenture Series A, FGIC Insured, 5.00%, 7/01/19 | | 1,500,000 | | | | 1,638,195 |
Minneapolis Health Care System Revenue, Fairview Health Services, Series B, Assured Guaranty, 6.50%, 11/15/38 | | 1,790,000 | | | | 1,789,803 |
New Jersey State Transportation Trust Fund Authority Revenue, Transportation System, Series A, Assured Guaranty, 5.50%, 12/15/38 | | 3,015,000 | | | | 2,975,654 |
New York City GO, Series L, Sub Series L-1, 5.00%, 4/01/26 | | 700,000 | | | | 642,537 |
North Carolina Eastern Municipal Power Agency Power System Revenue, Refunding, Series A, Assured Guaranty, 5.25%, 1/01/19 | | 2,400,000 | | | | 2,339,064 |
Puerto Rico Commonwealth GO, Public Improvement, Refunding, Series A, MBIA Insured, 5.50%, 7/01/21 | | 875,000 | | | | 769,562 |
Seattle Water System Revenue, BHAC Insured, 5.00%, 9/01/34 | | 1,860,000 | | | | 1,787,144 |
Tarrant County Cultural Education Facilities Finance Corp. Revenue, Christus Health, Refunding, Series A, Assured Guaranty, 6.25%, 7/01/28 | | 1,500,000 | | | | 1,480,050 |
Wisconsin State GO, Series A, FGIC Insured, 5.00%, 5/01/21 | | 500,000 | | | | 515,725 |
| | | | | | |
| | | | | | 35,659,895 |
| | | | | | |
Venezuela 0.9% | | | | | | |
Government of Venezuela,
10.75%, 9/19/13 | | 5,365,000 | | | | 3,540,900 |
gsenior bond, Reg S, 5.375%, 8/07/10 | | 9,235,000 | | | | 7,249,937 |
| | | | | | |
| | | | | | 10,790,837 |
| | | | | | |
Total Government and Agency Securities (Cost $1,045,347,114) | | | | | | 931,196,974 |
| | | | | | |
Short Term Investments 7.3% | | | | | | |
Government and Agency Securities (Cost $64,302,771) 5.3% | | | | | | |
Egypt 5.3% | | | | | | |
kEgypt Treasury Bills, 1/13/09 - 9/22/09 | | 361,700,000 | EGP | | | 62,687,173 |
| | | | | | |
Total Investments before Repurchase Agreements (Cost $1,109,649,885) | | | | | | 993,884,147 |
| | | | | | |
TGI-16
Franklin Templeton Variable Insurance Products Trust
Statement of Investments, December 31, 2008 (continued)
| | | | | |
| Templeton Global Income Securities Fund | | Principal
Amounta | | Value |
Short Term Investments (continued) | | | | | |
United States 2.0% | | | | | |
Repurchase Agreements (Cost $23,833,671) 2.0% | | | | | |
lJoint Repurchase Agreement, 0.019%, 1/02/09 (Maturity Value $23,833,697) | | 23,833,671 | | $ | 23,833,671 |
Banc of America Securities LLC (Maturity Value $3,678,493) | | | | | |
Barclays Capital Inc. (Maturity Value $3,503,553) | | | | | |
BNP Paribas Securities Corp. (Maturity Value $4,671,405) | | | | | |
Credit Suisse Securities (USA) LLC (Maturity Value $4,671,405) | | | | | |
Deutsche Bank Securities Inc. (Maturity Value $2,695,829) | | | | | |
HSBC Securities (USA) Inc. (Maturity Value $3,503,553) | | | | | |
UBS Securities LLC (Maturity Value $1,109,459) | | | | | |
Collateralized by U.S. Government Agency Securities, 3.50% - 7.00%, 6/15/09 - 5/20/22;
kU.S. Government Agency Discount Notes, 1/05/09 - 10/19/09;
kU.S. Treasury Bills, 1/15/09; and U.S. Treasury Notes, 0.875% - 4.625%, 7/15/09 - 2/28/11 | | | | | |
| | | | | |
Total Investments (Cost $1,133,483,556) 85.8% | | | | | 1,017,717,818 |
Net Unrealized Appreciation on Forward Exchange Contracts 8.9% | | | | | 105,221,728 |
Other Assets, less Liabilities 5.3% | | | | | 62,753,151 |
| | | | | |
Net Assets 100.0% | | | | $ | 1,185,692,697 |
| | | | | |
See Abbreviations on page TGI-35.
aThe principal amount is stated in U.S. dollars unless otherwise indicated.
bThe coupon rate shown represents the rate at period end.
cThe principal amount is stated in original face, and scheduled paydowns are reflected in the market price on ex-date.
dSecurity was purchased pursuant to Rule 144A under the Securities Act of 1933 and may be sold in transactions exempt from registration only to qualified institutional buyers or in a public offering registered under the Securities Act of 1933. These securities have been deemed liquid under guidelines approved by the Trust’s Board of Trustees. At December 31, 2008, the aggregate value of these securities was $67,923,939, representing 5.73% of net assets.
ePrincipal amount is stated in 1,000 Brazilian Real Units.
fRedemption price at maturity is adjusted for inflation. See Note 1(g).
gSecurity was purchased pursuant to Regulation S under the Securities Act of 1933, which exempts from registration securities offered and sold outside of the United States. Such a security cannot be sold in the United States without either an effective registration statement filed pursuant to the Securities Act of 1933, or pursuant to an exemption from registration. These securities have been deemed liquid under guidelines approved by the Trust’s Board of Trustees. At December 31, 2008, the aggregate value of these securities was $49,103,071, representing 4.14% of net assets.
hPrincipal amount is stated in 100 Mexican Peso Units.
iRounds to less than 0.1% of net assets.
jA supranational organization is an entity formed by two or more central governments through international treaties.
kThe security is traded on a discount basis with no stated coupon rate.
lSee Note 1(c) regarding joint repurchase agreement.
The accompanying notes are an integral part of these financial statements.
TGI-17
Franklin Templeton Variable Insurance Products Trust
Financial Statements
Statement of Assets and Liabilities
December 31, 2008
| | | | |
| | | Templeton
Global Income
Securities Fund | |
Assets: | | | | |
Investments in securities: | | | | |
Cost - Unaffiliated issuers | | $ | 1,109,649,885 | |
Cost - Repurchase agreements | | | 23,833,671 | |
| | | | |
Total cost of investments | | $ | 1,133,483,556 | |
| | | | |
Value - Unaffiliated issuers | | $ | 993,884,147 | |
Value - Repurchase agreements | | | 23,833,671 | |
| | | | |
Total value of investments | | | 1,017,717,818 | |
Foreign currency, at value (cost $24,750,521) | | | 25,218,604 | |
Receivables: | | | | |
Investment securities sold | | | 17,410,699 | |
Capital shares sold | | | 2,505,087 | |
Interest | | | 20,114,639 | |
Swaps | | | 460,452 | |
Unrealized appreciation on forward exchange contracts (Note 7) | | | 130,835,741 | |
Unrealized appreciation on swap contracts (Note 8) | | | 3,973,278 | |
| | | | |
Total assets | | | 1,218,236,318 | |
| | | | |
Liabilities: | | | | |
Payables: | | | | |
Capital shares redeemed | | | 734,186 | |
Affiliates | | | 860,328 | |
Swaps | | | 507,848 | |
Collateral due to brokers for swaps | | | 4,310,000 | |
Unrealized depreciation on forward exchange contracts (Note 7) | | | 25,614,013 | |
Accrued expenses and other liabilities | | | 517,246 | |
| | | | |
Total liabilities | | | 32,543,621 | |
| | | | |
Net assets, at value | | $ | 1,185,692,697 | |
| | | | |
Net assets consist of: | | | | |
Paid-in capital | | $ | 1,116,037,376 | |
Undistributed net investment income | | | 109,190,320 | |
Net unrealized appreciation (depreciation) | | | (8,323,499 | ) |
Accumulated net realized gain (loss) | | | (31,211,500 | ) |
| | | | |
Net assets, at value | | $ | 1,185,692,697 | |
| | | | |
The accompanying notes are an integral part of these financial statements.
TGI-18
Franklin Templeton Variable Insurance Products Trust
Financial Statements (continued)
Statement of Assets and Liabilities (continued)
December 31, 2008
| | | |
| | | Templeton
Global Income
Securities Fund |
Class 1: | | | |
Net assets, at value | | $ | 220,588,370 |
| | | |
Shares outstanding | | | 12,666,043 |
| | | |
Net asset value and maximum offering price per share | | $ | 17.42 |
| | | |
Class 2: | | | |
Net assets, at value | | $ | 793,880,705 |
| | | |
Shares outstanding | | | 46,427,481 |
| | | |
Net asset value and maximum offering price per share | | $ | 17.10 |
| | | |
Class 3: | | | |
Net assets, at value | | $ | 128,155,031 |
| | | |
Shares outstanding | | | 7,501,544 |
| | | |
Net asset value and maximum offering price per sharea | | $ | 17.08 |
| | | |
Class 4: | | | |
Net assets, at value | | $ | 43,068,591 |
| | | |
Shares outstanding | | | 2,479,755 |
| | | |
Net asset value and maximum offering price per share | | $ | 17.37 |
| | | |
aRedemption | price is equal to net asset value less any redemption fees retained by the Fund. |
The accompanying notes are an integral part of these financial statements.
TGI-19
Franklin Templeton Variable Insurance Products Trust
Financial Statements (continued)
Statement of Operations
for the year ended December 31, 2008
| | | | |
| | | Templeton
Global Income
Securities Fund | |
Investment income: | | | | |
Interest (net of foreign taxes of $1,123,962) | | $ | 55,470,996 | |
| | | | |
Expenses: | | | | |
Management fees (Note 3a) | | | 5,007,769 | |
Distribution fees: (Note 3c) | | | | |
Class 2 | | | 1,780,030 | |
Class 3 | | | 318,414 | |
Class 4 | | | 43,874 | |
Unaffiliated transfer agent fees | | | 3,310 | |
Custodian fees (Note 4) | | | 835,597 | |
Reports to shareholders | | | 211,537 | |
Registration and filing fees | | | 12,641 | |
Professional fees | | | 47,994 | |
Trustees’ fees and expenses | | | 4,372 | |
Other | | | 33,344 | |
| | | | |
Total expenses | | | 8,298,882 | |
Expense reductions (Note 4) | | | (1,036 | ) |
| | | | |
Net expenses | | | 8,297,846 | |
| | | | |
Net investment income | | | 47,173,150 | |
| | | | |
Realized and unrealized gains (losses): | | | | |
Net realized gain (loss) from: | | | | |
Investments | | | 12,671,523 | |
Foreign currency transactions | | | 23,284,320 | |
Swap contracts | | | 58,370 | |
| | | | |
Net realized gain (loss) | | | 36,014,213 | |
| | | | |
Net change in unrealized appreciation (depreciation) on: | | | | |
Investments | | | (134,945,794 | ) |
Translation of other assets and liabilities denominated in foreign currencies | | | 102,205,982 | |
| | | | |
Net change in unrealized appreciation (depreciation) | | | (32,739,812 | ) |
| | | | |
Net realized and unrealized gain (loss) | | | 3,274,401 | |
| | | | |
Net increase (decrease) in net assets resulting from operations | | $ | 50,447,551 | |
| | | | |
The accompanying notes are an integral part of these financial statements.
TGI-20
Franklin Templeton Variable Insurance Products Trust
Financial Statements (continued)
Statements of Changes in Net Assets
| | | | | | | | |
| | | Templeton Global Income
Securities Fund | |
| | | Year Ended December 31, | |
| | | 2008 | | | 2007 | |
| | | | |
Increase (decrease) in net assets: | | | | | | | | |
Operations: | | | | | | | | |
Net investment income | | $ | 47,173,150 | | | $ | 21,282,117 | |
Net realized gain (loss) from investments, foreign currency transactions, and swap contracts | | | 36,014,213 | | | | 17,882,637 | |
Net change in unrealized appreciation (depreciation) on investments and translation of other assets and liabilities denominated in foreign currencies | | | (32,739,812 | ) | | | 8,914,827 | |
| | | | |
Net increase (decrease) in net assets resulting from operations | | | 50,447,551 | | | | 48,079,581 | |
| | | | |
Distributions to shareholders from net investment income and net foreign currency gains: | | | | | | | | |
Class 1 | | | (8,184,833 | ) | | | (2,456,235 | ) |
Class 2 | | | (26,397,120 | ) | | | (8,266,690 | ) |
Class 3 | | | (4,932,732 | ) | | | (1,628,484 | ) |
Class 4 | | | (162,330 | ) | | | — | |
| | | | |
Total distributions to shareholders | | | (39,677,015 | ) | | | (12,351,409 | ) |
| | | | |
Capital share transactions: (Note 2) | | | | | | | | |
Class 1 | | | 81,904,183 | | | | 55,559,172 | |
Class 2 | | | 305,411,151 | | | | 250,108,969 | |
Class 3 | | | 36,362,798 | | | | 50,922,791 | |
Class 4 | | | 41,657,210 | | | | — | |
| | | | |
Total capital share transactions | | | 465,335,342 | | | | 356,590,932 | |
| | | | |
Redemption fees | | | 75,291 | | | | 9,428 | |
| | | | |
Net increase (decrease) in net assets | | | 476,181,169 | | | | 392,328,532 | |
Net assets: | | | | | | | | |
Beginning of year | | | 709,511,528 | | | | 317,182,996 | |
| | | | |
End of year | | $ | 1,185,692,697 | | | $ | 709,511,528 | |
| | | | |
Undistributed net investment income included in net assets: | | | | | | | | |
End of year | | $ | 109,190,320 | | | $ | 35,686,615 | |
| | | | |
The accompanying notes are an integral part of these financial statements.
TGI-21
Franklin Templeton Variable Insurance Products Trust
Notes to Financial Statements
Templeton Global Income Securities Fund
1. ORGANIZATION AND SIGNIFICANT ACCOUNTING POLICIES
Franklin Templeton Variable Insurance Products Trust (Trust) is registered under the Investment Company Act of 1940, as amended, (1940 Act) as an open-end investment company, consisting of twenty-three separate funds. The Templeton Global Income Securities Fund (Fund) is included in this report. The financial statements of the remaining funds in the Trust are presented separately. Shares of the Fund are sold only to insurance company separate accounts to fund the benefits of variable life insurance policies or variable annuity contracts. The Fund offers four classes of shares: Class 1, Class 2, Class 3, and Class 4. Effective February 29, 2008, the Fund began offering a new class of shares, Class 4. Each class of shares differs by its distribution fees, voting rights on matters affecting a single class and its exchange privilege.
On September 19, 2008, the Trust’s Board of Trustees approved a proposal to change the name of the Fund to Templeton Global Bond Securities Fund, effective May 1, 2009.
The following summarizes the Fund’s significant accounting policies.
a. Security Valuation
Securities listed on a securities exchange or on the NASDAQ National Market System are valued at the last quoted sale price or the official closing price of the day, respectively. Over-the-counter securities and listed securities for which there is no reported sale are valued within the range of the most recent quoted bid and ask prices. Securities that trade in multiple markets or on multiple exchanges are valued according to the broadest and most representative market.
Corporate debt securities and government securities generally trade in the over-the-counter market rather than on a securities exchange. The Trust may utilize independent pricing services, quotations from bond dealers, and information with respect to bond and note transactions, to assist in determining a current market value for each security. The Trust’s pricing services may use valuation models or matrix pricing which considers information with respect to comparable bond and note transactions, quotations from bond dealers, or by reference to other securities that are considered comparable in such characteristics as rating, interest rate and maturity date, option adjusted spread models, prepayment projections, interest rate spreads and yield curves, to determine current value.
Foreign securities are valued as of the close of trading on the foreign stock exchange on which the security is primarily traded, or the NYSE, whichever is earlier. If no sale is reported at that time, the foreign security will be valued within the range of the most recent quoted bid and ask prices. The value is then converted into its U.S. dollar equivalent at the foreign exchange rate in effect at the close of the NYSE on the day that the value of the foreign security is determined.
The Trust has procedures to determine the fair value of individual securities and other assets for which market prices are not readily available or which may not be reliably priced. Methods for valuing these securities may include: fundamental analysis, matrix pricing, discounts from market prices of similar securities, or discounts applied due to the nature and duration of restrictions on the disposition of the securities. Due to the inherent uncertainty of valuations of such securities, the fair values may differ significantly from the values that would have been used had a ready market for such investments existed. Occasionally, events occur between the time at which trading in a security is completed and the close of the NYSE that might call into question the availability (including the reliability) of the value of a portfolio security held by the Fund. If such an event occurs, the securities may be valued using fair value procedures, which may include the use of independent pricing services. All security valuation procedures are approved by the Trust’s Board of Trustees.
b. Foreign Currency Translation
Portfolio securities and other assets and liabilities denominated in foreign currencies are translated into U.S. dollars based on the exchange rate of such currencies against U.S. dollars on the date of valuation. Purchases and sales of securities, income and expense items denominated in foreign currencies are translated into U.S. dollars at the exchange rate in effect on the transaction
TGI-22
Franklin Templeton Variable Insurance Products Trust
Notes to Financial Statements (continued)
Templeton Global Income Securities Fund
1. ORGANIZATION AND SIGNIFICANT ACCOUNTING POLICIES (continued)
b. Foreign Currency Translation (continued)
date. Occasionally, events may impact the availability or reliability of foreign exchange rates used to convert the U.S. dollar equivalent value. If such an event occurs, the foreign exchange rate will be valued at fair value using procedures established and approved by the Trust’s Board of Trustees.
The Fund does not separately report the effect of changes in foreign exchange rates from changes in market prices on securities held. Such changes are included in net realized and unrealized gain or loss from investments on the Statement of Operations.
Realized foreign exchange gains or losses arise from sales of foreign currencies, currency gains or losses realized between the trade and settlement dates on securities transactions and the difference between the recorded amounts of dividends, interest, and foreign withholding taxes and the U.S. dollar equivalent of the amounts actually received or paid. Net unrealized foreign exchange gains and losses arise from changes in foreign exchange rates on foreign denominated assets and liabilities other than investments in securities held at the end of the reporting period.
c. Joint Repurchase Agreement
The Fund may enter into a joint repurchase agreement whereby its uninvested cash balance is deposited into a joint cash account with other funds managed by the investment manager or an affiliate of the investment manager and is used to invest in one or more repurchase agreements. The value and face amount of the joint repurchase agreement are allocated to the funds based on their pro-rata interest. A repurchase agreement is accounted for as a loan by the fund to the seller, collateralized by securities which are delivered to the fund’s custodian. The market value, including accrued interest, of the initial collateralization is required to be at least 102% of the dollar amount invested by the funds, with the value of the underlying securities marked to market daily to maintain coverage of at least 100%. The joint repurchase agreement held by the Fund at year end had been entered into on December 31, 2008. The joint repurchase agreement is valued at cost.
d. Foreign Currency Contracts
When the Fund purchases or sells foreign securities it may enter into foreign exchange contracts to minimize foreign exchange risk from the trade date to the settlement date of the transactions. A foreign exchange contract is an agreement between two parties to exchange different currencies at an agreed upon exchange rate at a future date. Realized and unrealized gains and losses on these contracts are included in the Statement of Operations.
The Fund may also enter into forward exchange contracts to hedge against fluctuations in foreign exchange rates or to gain exposure to certain foreign currencies. These contracts are valued daily by the Fund and the unrealized appreciation or depreciation on the contracts, as measured by the difference between the contractual forward foreign exchange rates and the forward rates at the reporting date, are included in the Statement of Assets and Liabilities. Realized and unrealized gains and losses on these contracts are included in the Statement of Operations.
The risks of these contracts include movement in the values of the foreign currencies relative to the U.S. dollar and the possible inability of the counterparties to fulfill their obligations under the contracts, which may be in excess of the amount reflected in the Statement of Assets and Liabilities.
e. Interest Rate Swaps
The Fund may enter into interest rate swap contracts to hedge the risk of changes in interest rates. Interest rate swaps are agreements between two parties to exchange cash flows based on a notional principal amount. The interest receivable or payable is recorded as unrealized appreciation or depreciation in the Statement of Assets and Liabilities. Payments received or made are
TGI-23
Franklin Templeton Variable Insurance Products Trust
Notes to Financial Statements (continued)
Templeton Global Income Securities Fund
1. ORGANIZATION AND SIGNIFICANT ACCOUNTING POLICIES (continued)
e. Interest Rate Swaps (continued)
recorded as realized gains or losses in the Statement of Operations. Interest rate swaps are marked to market daily based upon quotations from the market makers and the change, if any, is recorded as unrealized appreciation or depreciation in the Statement of Operations. When the swap contract is terminated early, the fund records a realized gain or loss equal to the difference between the current realized value and the expected cash flows. The risks of interest rate swaps include changes in the market conditions and the possible inability of the counterparty to fulfill its obligations under the agreement.
f. Income Taxes
No provision has been made for U.S. income taxes because it is the Fund’s policy to qualify as a regulated investment company under the Internal Revenue Code and to distribute to shareholders substantially all of its taxable income and net realized gains.
Foreign securities held by the Fund may be subject to foreign taxation on interest income received. Foreign taxes, if any, are recorded based on the tax regulations and rates that exist in the foreign markets in which the Fund invests.
The Fund has reviewed the tax positions, taken on federal income tax returns, for each of the three open tax years and as of December 31, 2008, and has determined that no provision for income tax is required in the Fund’s financial statements.
g. Security Transactions, Investment Income, Expenses and Distributions
Security transactions are accounted for on trade date. Realized gains and losses on security transactions are determined on a specific identification basis. Interest income and estimated expenses are accrued daily. Amortization of premium and accretion of discount on debt securities are included in interest income. Distributions to shareholders are recorded on the ex-dividend date and are determined according to income tax regulations (tax basis). Distributable earnings determined on a tax basis may differ from earnings recorded in accordance with accounting principles generally accepted in the United States of America. These differences may be permanent or temporary. Permanent differences are reclassified among capital accounts to reflect their tax character. These reclassifications have no impact on net assets or the results of operations. Temporary differences are not reclassified, as they may reverse in subsequent periods.
Common expenses incurred by the Trust are allocated among the funds based on the ratio of net assets of each fund to the combined net assets of the Trust. Fund specific expenses are charged directly to the fund that incurred the expense.
Realized and unrealized gains and losses and net investment income, not including class specific expenses, are allocated daily to each class of shares based upon the relative proportion of net assets of each class. Differences in per share distributions, by class, are generally due to differences in class specific expenses.
Inflation-indexed bonds provide an inflation hedge through periodic increases or decreases in the security’s interest accruals and principal redemption value, by amounts corresponding to the current rate of inflation. Any such adjustments, including adjustments to principal redemption value, are recorded as interest income.
h. Accounting Estimates
The preparation of financial statements in accordance with accounting principles generally accepted in the United States of America requires management to make estimates and assumptions that affect the reported amounts of assets and liabilities at the date of the financial statements and the amounts of income and expenses during the reporting period. Actual results could differ from those estimates.
TGI-24
Franklin Templeton Variable Insurance Products Trust
Notes to Financial Statements (continued)
Templeton Global Income Securities Fund
1. ORGANIZATION AND SIGNIFICANT ACCOUNTING POLICIES (continued)
i. Redemption Fees
Redemptions and exchanges of Class 3 shares held 60 days or less may be subject to the fund’s redemption fee, which is 1% of the amount redeemed. Such fees are retained by the fund and accounted for as an addition to paid-in capital.
j. Guarantees and Indemnifications
Under the Trust’s organizational documents, its officers and trustees are indemnified by the Trust against certain liabilities arising out of the performance of their duties to the Trust. Additionally, in the normal course of business, the Trust, on behalf of the Fund, enters into contracts with service providers that contain general indemnification clauses. The Trust’s maximum exposure under these arrangements is unknown as this would involve future claims that may be made against the Trust that have not yet occurred. Currently, the Trust expects the risk of loss to be remote.
2. SHARES OF BENEFICIAL INTEREST
At December 31, 2008, there were an unlimited number of shares authorized (without par value). Transactions in the Fund’s shares were as follows:
| | | | | | | | | | | | | | |
| | | Year Ended December 31, | |
| | | 2008a | | | 2007 | |
| Class 1 Shares: | | Shares | | | Amount | | | Shares | | | Amount | |
Shares sold | | 8,101,454 | | | $ | 141,208,761 | | | 5,103,718 | | | $ | 85,032,506 | |
Shares issued in reinvestment of distributions | | 492,765 | | | | 8,184,833 | | | 153,227 | | | | 2,456,235 | |
Shares redeemed | | (4,030,383 | ) | | | (67,489,411 | ) | | (1,977,376 | ) | | | (31,929,569 | ) |
| | | | |
Net increase (decrease) | | 4,563,836 | | | $ | 81,904,183 | | | 3,279,569 | | | $ | 55,559,172 | |
| | | | |
| Class 2 Shares: | | | | | | | | | | | | |
Shares sold | | 26,653,241 | | | $ | 454,110,268 | | | 16,336,797 | | | $ | 264,154,676 | |
Shares issued in reinvestment of distributions | | 1,616,480 | | | | 26,397,120 | | | 523,540 | | | | 8,266,690 | |
Shares redeemed | | (10,588,115 | ) | | | (175,096,237 | ) | | (1,388,223 | ) | | | (22,312,397 | ) |
| | | | |
Net increase (decrease) | | 17,681,606 | | | $ | 305,411,151 | | | 15,472,114 | | | $ | 250,108,969 | |
| | | | |
| Class 3 Shares: | | | | | | | | | | | | |
Shares sold | | 4,221,478 | | | $ | 72,520,138 | | | 3,533,597 | | | $ | 56,987,401 | |
Shares issued in reinvestment of distributions | | 302,251 | | | | 4,932,732 | | | 103,199 | | | | 1,628,484 | |
Shares redeemed | | (2,479,464 | ) | | | (41,090,072 | ) | | (475,906 | ) | | | (7,693,094 | ) |
| | | | |
Net increase (decrease) | | 2,044,265 | | | $ | 36,362,798 | | | 3,160,890 | | | $ | 50,922,791 | |
| | | | |
| Class 4 Shares: | | | | | | | | | | | | |
Shares sold | | 2,552,445 | | | $ | 42,834,654 | | | | | | | | |
Shares issued on reinvestment of distributions | | 9,768 | | | | 162,150 | | | | | | | | |
Shares redeemed | | (82,458 | ) | | | (1,339,594 | ) | | | | | | | |
| | | | | | | | | | |
Net increase (decrease) | | 2,479,755 | | | $ | 41,657,210 | | | | | | | | |
| | | | | | | | | | |
aFor | the period February 29, 2008 (effective date) to December 31, 2008 for Class 4. |
TGI-25
Franklin Templeton Variable Insurance Products Trust
Notes to Financial Statements (continued)
Templeton Global Income Securities Fund
3. TRANSACTIONS WITH AFFILIATES
Franklin Resources, Inc. is the holding company for various subsidiaries that together are referred to as Franklin Templeton Investments. Certain officers and trustees of the Trust are also officers and/or directors of the following subsidiaries:
| | |
| Subsidiary | | Affiliation |
Franklin Advisers, Inc. (Advisers) | | Investment manager |
Franklin Templeton Services, LLC (FT Services) | | Administrative manager |
Franklin Templeton Distributors, Inc. (Distributors) | | Principal underwriter |
Franklin Templeton Investor Services, LLC (Investor Services) | | Transfer agent |
a. Management Fees
The Fund pays an investment management fee to Advisers based on the average daily net assets of the Fund as follows:
| | |
| Annualized Fee Rate | | Net Assets |
| 0.625% | | Up to and including $100 million |
| 0.500% | | Over $100 million, up to and including $250 million |
| 0.450% | | Over $250 million, up to and including $7.5 billion |
| 0.440% | | Over $7.5 billion, up to and including $10 billion |
| 0.430% | | Over $10 billion, up to and including $12.5 billion |
| 0.420% | | Over $12.5 billion, up to and including $15 billion |
| 0.400% | | In excess of $15 billion |
b. Administrative Fees
Under an agreement with Advisers, FT Services provides administrative services to the Fund. The fee is paid by Advisers based on average daily net assets, and is not an additional expense of the Fund.
c. Distribution Fees
The Fund’s Board of Trustees has adopted distribution plans for Class 2, Class 3, and Class 4 shares pursuant to Rule 12b-1 under the 1940 Act. Under the Fund’s compensation distribution plans, the Fund pays Distributors for costs incurred in connection with the servicing, sale and distribution of the Fund’s shares up to 0.25%, 0.35% and 0.35% per year of its average daily net assets of Class 2, Class 3, and Class 4, respectively. The Board of Trustees has agreed to limit the current rate to 0.25% per year for Class 3.
d. Transfer Agent Fees
Investor Services, under terms of an agreement, performs shareholder servicing for the Fund and is not paid by the Fund for the services.
4. EXPENSE OFFSET ARRANGEMENT
The Fund has entered into an arrangement with its custodian whereby credits realized as a result of uninvested cash balances are used to reduce a portion of the Fund’s custodian expenses. During the year ended December 31, 2008, the custodian fees were reduced as noted in the Statement of Operations.
TGI-26
Franklin Templeton Variable Insurance Products Trust
Notes to Financial Statements (continued)
Templeton Global Income Securities Fund
5. INCOME TAXES
For tax purposes, capital losses may be carried over to offset future capital gains, if any. At December 31, 2008, the capital loss carryforwards were as follows:
| | | |
Capital loss carryforwards expiring in: | | | |
2009 | | $ | 1,649,033 |
2010 | | | 177,731 |
| | | |
| | $ | 1,826,764 |
| | | |
During the year ended December 31, 2008, the Fund utilized $159,858 of capital loss carryforwards.
On December 31, 2008, the Fund had expired capital loss carryforwards of $2,210,660, which were reclassified to paid-in capital.
For tax purposes, realized capital losses and realized currency losses occurring subsequent to October 31, may be deferred and treated as occurring on the first day of the following fiscal year. At December 31, 2008, the Fund deferred realized capital losses and realized currency losses of $1,732,457 and $28,031,402, respectively.
The tax character of distributions paid during the years ended December 31, 2008 and 2007, was as follows:
| | | | | | |
| | | 2008 | | 2007 |
Distributions paid from – ordinary income | | $ | 39,677,015 | | $ | 12,351,409 |
| | | |
At December 31, 2008, the cost of investments, net unrealized appreciation (depreciation), and undistributed ordinary income for income tax purposes were as follows:
| | | | |
Cost of investments | | $ | 1,135,672,962 | |
| | | | |
| |
Unrealized appreciation | | $ | 16,301,395 | |
Unrealized depreciation | | | (134,256,539 | ) |
| | | | |
Net unrealized appreciation (depreciation) | | $ | (117,955,144 | ) |
| | | | |
Distributable earnings – undistributed ordinary income | | $ | 191,893,740 | |
| | | | |
Net investment income differs for financial statement and tax purposes primarily due to differing treatments of foreign currency transactions, bond discounts and premiums, inflation related adjustments on foreign securities, interest rate swaps, and tax straddles.
Net realized gains (losses) differ for financial statement and tax purposes primarily due to differing treatments of wash sales, foreign currency transactions, bond discounts and premiums, interest rate swaps, and tax straddles.
6. INVESTMENT TRANSACTIONS
Purchases and sales of investments (excluding short term securities) for the year ended December 31, 2008, aggregated $799,585,432 and $233,195,853, respectively.
TGI-27
Franklin Templeton Variable Insurance Products Trust
Notes to Financial Statements (continued)
Templeton Global Income Securities Fund
7. FORWARD EXCHANGE CONTRACTS
At December 31, 2008, the Fund had the following forward exchange contracts outstanding:
| | | | | | | | | | | | | | |
| | | Contract
Amounta | | | Settlement
Date | | Unrealized
Appreciation | | Unrealized
Depreciation | |
| Contracts to Buy | | | | | | | | | | |
| 1,410,703 | | Peruvian Nuevo Sol | | 5,494,676 | MXN | | 1/22/09 | | $ | 50,830 | | $ | — | |
| 149,124,962,753 | | Viet Nam Dong | | 12,970,535 | NZD | | 1/22/09 | | | 939,306 | | | — | |
| 514,600,000 | | Kazakhstani Tenge | | 4,000,000 | | | 1/29/09 | | | 147,987 | | | — | |
| 34,696,800 | | Japanese Yen | | 226,895 | EUR | | 1/30/09 | | | 65,841 | | | — | |
| 139,956,750 | | Kazakhstani Tenge | | 1,085,020 | | | 2/06/09 | | | 37,162 | | | — | |
| 440,854,500 | | Japanese Yen | | 4,150,000 | | | 2/17/09 | | | 713,935 | | | — | |
| 16,706,255 | | Euro | | 22,239,729 | | | 2/23/09 | | | 1,074,009 | | | — | |
| 56,848,000 | | Kazakhstani Tenge | | 440,000 | | | 2/26/09 | | | 10,156 | | | — | |
| 6,682,502 | | Euro | | 8,920,706 | | | 2/27/09 | | | 403,829 | | | — | |
| 88,025,000 | | Indian Rupee | | 2,852,731 | NZD | | 2/27/09 | | | 146,027 | | | — | |
| 325,942,003 | | Kazakhstani Tenge | | 2,529,758 | | | 2/27/09 | | | 49,645 | | | — | |
| 870,000,000 | | South Korean Won | | 606,356 | | | 3/04/09 | | | 84,668 | | | — | |
| 126,735,095,854 | | Viet Nam Dong | | 11,084,376 | NZD | | 3/12/09 | | | 715,479 | | | — | |
| 126,735,095,875 | | Viet Nam Dong | | 11,089,511 | NZD | | 3/16/09 | | | 707,584 | | | — | |
| 27,904,000 | | Russian Ruble | | 653,336 | EUR | | 3/20/09 | | | — | | | (81,636 | ) |
| 60,658,992,000 | | Viet Nam Dong | | 4,356,973 | AUD | | 3/23/09 | | | 344,714 | | | — | |
| 9,415,305 | | Euro | | 18,159,864 | SGD | | 4/14/09 | | | 484,772 | | | — | |
| 329,402,395 | | Kazakhstani Tenge | | 2,632,271 | | | 4/30/09 | | | — | | | (140,322 | ) |
| 122,773,200 | | Swedish Krona | | 13,100,000 | EUR | | 4/30/09 | | | — | | | (2,554,840 | ) |
| 1,342,374,000 | | Japanese Yen | | 13,665,622 | | | 5/07/09 | | | 1,173,268 | | | — | |
| 1,998,991 | | Peruvian Nuevo Sol | | 8,108,839 | MXN | | 5/07/09 | | | 56,046 | | | — | |
| 5,296,692 | | Peruvian Nuevo Sol | | 1,930,000 | | | 5/08/09 | | | — | | | (268,054 | ) |
| 8,062,720 | | Peruvian Nuevo Sol | | 2,982,878 | | | 5/15/09 | | | — | | | (455,231 | ) |
| 28,853,000,000 | | Indonesian Rupiah | | 2,092,313 | | | 5/18/09 | | | 425,401 | | | — | |
| 144,407,250 | | Japanese Yen | | 1,526,988 | | | 5/18/09 | | | 69,765 | | | — | |
| 10,085,857 | | Peruvian Nuevo Sol | | 3,728,598 | | | 5/19/09 | | | — | | | (568,270 | ) |
| 7,566,000,000 | | Indonesian Rupiah | | 522,694 | | | 5/22/09 | | | 136,748 | | | — | |
| 507,359,240 | | Kazakhstani Tenge | | 44,462,684 | MXN | | 5/27/09 | | | 644,543 | | | — | |
| 16,998,965,000 | | Viet Nam Dong | | 1,193,564 | AUD | | 5/29/09 | | | 103,652 | | | — | |
| 1,578,866,058 | | Japanese Yen | | 16,719,431 | | | 6/02/09 | | | 745,183 | | | — | |
| 14,790,681,000 | | Viet Nam Dong | | 1,038,951 | AUD | | 6/02/09 | | | 89,248 | | | — | |
| 345,000,000 | | Japanese Yen | | 3,732,756 | | | 6/05/09 | | | 83,749 | | | — | |
| 62,619,618,000 | | Viet Nam Dong | | 4,394,304 | AUD | | 6/22/09 | | | 367,592 | | | — | |
| 14,772,000 | | Malaysian Ringgit | | 2,923,412 | EUR | | 7/07/09 | | | 206,628 | | | — | |
| 7,600,000 | | Malaysian Ringgit | | 1,529,390 | EUR | | 7/09/09 | | | 71,256 | | | — | |
| 10,550,000 | | Malaysian Ringgit | | 2,115,415 | EUR | | 7/17/09 | | | 110,648 | | | — | |
| 6,015,055 | | Malaysian Ringgit | | 1,213,740 | EUR | | 8/05/09 | | | 53,985 | | | — | |
| 1,100,000 | | Malaysian Ringgit | | 221,828 | EUR | | 8/07/09 | | | 10,089 | | | — | |
| 279,885,550 | | Japanese Yen | | 1,726,090 | EUR | | 8/10/09 | | | 700,541 | | | — | |
| 154,325,250 | | Japanese Yen | | 972,679 | EUR | | 8/11/09 | | | 357,209 | | | — | |
| 290,165,200 | | Japanese Yen | | 1,862,222 | EUR | | 8/21/09 | | | 626,392 | | | — | |
| 143,907,400 | | Japanese Yen | | 922,720 | EUR | | 8/26/09 | | | 312,133 | | | — | |
| 27,917,500 | | Japanese Yen | | 184,077 | EUR | | 9/04/09 | | | 53,600 | | | — | |
| 11,099,031 | | U.S. Dollar | | 7,821,727 | EUR | | 9/08/09 | | | 221,900 | | | — | |
| 243,055,778,970 | | Viet Nam Dong | | 144,871,783 | MXN | | 9/08/09 | | | 3,368,764 | | | — | |
| 101,991,966 | | Russian Ruble | | 42,848,809 | MXN | | 9/15/09 | | | — | | | (166,405 | ) |
| 295,496,613 | | Russian Ruble | | 17,768,247 | NZD | | 9/15/09 | | | — | | | (2,094,757 | ) |
TGI-28
Franklin Templeton Variable Insurance Products Trust
Notes to Financial Statements (continued)
Templeton Global Income Securities Fund
7. FORWARD EXCHANGE CONTRACTS (continued)
| | | | | | | | | | | | | | |
| | | Contract
Amounta | | | Settlement
Date | | Unrealized
Appreciation | | Unrealized
Depreciation | |
| Contracts to Buy (continued) | | | | | | | | | | |
| 15,520,594 | | U.S. Dollar | | 11,369,815 | EUR | | 9/15/09 | | $ | — | | $ | (289,371 | ) |
| 24,005,420 | | U.S. Dollar | | 17,083,450 | EUR | | 9/17/09 | | | 251,062 | | | — | |
| 14,296,000 | | Chinese Yuan | | 1,489,167 | EUR | | 9/18/09 | | | — | | | (27,347 | ) |
| 89,074,900 | | Chinese Yuan | | 9,307,428 | EUR | | 9/23/09 | | | — | | | (214,528 | ) |
| 30,000,000 | | Swedish Krona | | 3,119,119 | EUR | | 9/23/09 | | | — | | | (489,400 | ) |
| 39,743,000 | | Chinese Yuan | | 4,095,317 | EUR | | 9/24/09 | | | — | | | (16,239 | ) |
| 468,694,201 | | Russian Ruble | | 22,297,983 | AUD | | 9/24/09 | | | — | | | (2,819,099 | ) |
| 25,000,000 | | Indian Rupee | | 818,331 | NZD | | 9/25/09 | | | 39,749 | | | — | |
| 837,000,000 | | Japanese Yen | | 5,602,258 | EUR | | 9/28/09 | | | 1,499,289 | | | — | |
| 258,201,997 | | Russian Ruble | | 12,410,890 | AUD | | 9/28/09 | | | — | | | (1,651,718 | ) |
| 8,340,000 | | Malaysian Ringgit | | 1,704,998 | EUR | | 9/30/09 | | | 50,266 | | | — | |
| 53,312,773 | | Russian Ruble | | 23,225,918 | MXN | | 10/06/09 | | | — | | | (151,063 | ) |
| 44,923,725,686 | | Viet Nam Dong | | 3,648,005 | AUD | | 10/07/09 | | | — | | | (84,862 | ) |
| 14,831,631 | | Chinese Yuan | | 3,204,553 | AUD | | 10/13/09 | | | — | | | (112,453 | ) |
| 361,308,750 | | Kazakhstani Tenge | | 2,795,426 | | | 10/13/09 | | | — | | | (312,735 | ) |
| 35,001,331 | | Chinese Yuan | | 3,714,063 | EUR | | 10/15/09 | | | — | | | (161,952 | ) |
| 35,172,030 | | Chinese Yuan | | 3,761,574 | EUR | | 10/16/09 | | | — | | | (203,465 | ) |
| 25,132,672 | | Chinese Yuan | | 5,336,806 | AUD | | 10/19/09 | | | — | | | (124,130 | ) |
| 47,143,455 | | Chinese Yuan | | 5,062,450 | EUR | | 10/19/09 | | | — | | | (300,717 | ) |
| 29,130,000 | | Chinese Yuan | | 4,208,017 | | | 10/21/09 | | | — | | | (45,174 | ) |
| 92,110,000 | | Russian Ruble | | 3,050,000 | | | 10/22/09 | | | — | | | (572,600 | ) |
| 36,599,833 | | Chinese Yuan | | 5,291,287 | | | 10/23/09 | | | — | | | (60,732 | ) |
| 921,291,798 | | Chilean Peso | | 1,395,897 | | | 10/26/09 | | | 13,761 | | | — | |
| 62,115,025 | | Chinese Yuan | | 8,932,101 | | | 10/26/09 | | | — | | | (54,535 | ) |
| 37,116,032 | | Chinese Yuan | | 5,298,506 | | | 10/27/09 | | | 6,285 | | | — | |
| 89,097,000 | | Russian Ruble | | 2,663,587 | | | 10/27/09 | | | — | | | (270,908 | ) |
| 597,827,644 | | Chilean Peso | | 872,435 | | | 10/28/09 | | | 41,987 | | | — | |
| 3,423,000 | | Swiss Franc | | 2,343,397 | EUR | | 11/05/09 | | | — | | | (24,337 | ) |
| 3,465,000,000 | | Indonesian Rupiah | | 275,000 | | | 11/09/09 | | | 11,831 | | | — | |
| 25,294,025,000 | | Viet Nam Dong | | 1,315,000 | | | 11/09/09 | | | 50,661 | | | — | |
| 34,531,000,000 | | Indonesian Rupiah | | 2,746,004 | | | 11/10/09 | | | 111,603 | | | — | |
| 92,000,000 | | Russian Ruble | | 2,870,694 | | | 11/10/09 | | | — | | | (410,640 | ) |
| 6,870,000,000 | | Indonesian Rupiah | | 549,161 | | | 11/12/09 | | | 19,025 | | | — | |
| 1,250,000,000 | | Japanese Yen | | 12,938,619 | | | 11/12/09 | | | 951,995 | | | — | |
| 1,250,000,000 | | Japanese Yen | | 10,198,254 | EUR | | 11/12/09 | | | — | | | (284,145 | ) |
| 36,430,000,000 | | Indonesian Rupiah | | 2,746,325 | | | 11/16/09 | | | 263,037 | | | — | |
| 7,386,000,000 | | Indonesian Rupiah | | 523,088 | | | 11/17/09 | | | 86,863 | | | — | |
| 35,999,000,000 | | Indonesian Rupiah | | 2,613,358 | | | 11/18/09 | | | 358,628 | | | — | |
| 29,201,000 | | Russian Ruble | | 653,339 | EUR | | 11/20/09 | | | — | | | (129,598 | ) |
| 40,074,000,000 | | Indonesian Rupiah | | 2,613,408 | | | 11/23/09 | | | 690,075 | | | — | |
| 14,977,000 | | Chinese Yuan | | 2,048,837 | | | 12/04/09 | | | 93,528 | | | — | |
| 18,870,000 | | Chinese Yuan | | 2,048,829 | EUR | | 12/04/09 | | | — | | | (148,071 | ) |
| 33,777,284 | | Chinese Yuan | | 4,782,060 | | | 12/14/09 | | | 50,626 | | | — | |
| 45,175,542 | | Chinese Yuan | | 6,396,854 | | | 12/15/09 | | | 66,780 | | | — | |
| 26,468,158 | | Chinese Yuan | | 3,761,017 | | | 12/16/09 | | | 26,082 | | | — | |
| 13,361,013 | | Malaysian Ringgit | | 3,761,017 | | | 12/16/09 | | | 124,818 | | | — | |
| 24,500,148 | | Chinese Yuan | | 3,465,367 | | | 12/17/09 | | | 40,223 | | | — | |
| 12,406,016 | | Malaysian Ringgit | | 3,465,368 | | | 12/17/09 | | | 142,816 | | | — | |
| 73,686,535 | | Chinese Yuan | | 10,396,103 | | | 12/18/09 | | | 147,526 | | | — | |
TGI-29
Franklin Templeton Variable Insurance Products Trust
Notes to Financial Statements (continued)
Templeton Global Income Securities Fund
7. FORWARD EXCHANGE CONTRACTS (continued)
| | | | | | | | | | | | | | |
| | | Contract
Amounta | | | Settlement
Date | | Unrealized
Appreciation | | Unrealized
Depreciation | |
| Contracts to Buy (continued) | | | | | | | | | | |
| 20,029,614 | | Chinese Yuan | | 2,857,292 | | | 12/21/09 | | $ | 8,886 | | $ | — | |
| 22,461,038 | | Malaysian Ringgit | | 6,301,410 | | | 12/21/09 | | | 231,866 | | | — | |
| 23,558,279 | | Chinese Yuan | | 3,384,810 | | | 12/22/09 | | | — | | | (13,617 | ) |
| 12,127,039 | | Malaysian Ringgit | | 3,466,651 | | | 12/22/09 | | | 60,850 | | | — | |
| 160,558,056 | | Mexican Peso | | 11,340,848 | | | 12/22/09 | | | — | | | (429,405 | ) |
| 9,639,266 | | Malaysian Ringgit | | 2,772,294 | | | 12/23/09 | | | 31,639 | | | — | |
| 66,679,470 | | Mexican Peso | | 4,725,354 | | | 12/23/09 | | | — | | | (194,356 | ) |
| 106,913,202 | | Mexican Peso | | 7,560,566 | | | 12/24/09 | | | — | | | (296,416 | ) |
| 10,905,927 | | Malaysian Ringgit | | 3,118,831 | | | 12/28/09 | | | 53,967 | | | — | |
| 56,089,316 | | Malaysian Ringgit | | 16,085,264 | | | 1/04/10 | | | 235,426 | | | — | |
| 136,332,733 | | Swedish Krona | | 12,649,755 | EUR | | 1/05/10 | | | — | | | (193,540 | ) |
| | | | |
| Contracts to Sell | | | | | | | | | | | | |
| 35,134,048 | | Mexican Peso | | 8,893,130 | PEN | | 1/20/09 | | | 283,780 | | | — | |
| 19,086,450,000 | | South Korean Won | | 21,977,351 | CHF | | 1/20/09 | | | 5,441,411 | | | — | |
| 14,735,520,000 | | South Korean Won | | 16,768,537 | CHF | | 1/21/09 | | | 4,013,681 | | | — | |
| 25,863,307 | | Mexican Peso | | 2,264,837 | | | 1/22/09 | | | 394,054 | | | — | |
| 35,571,270 | | Mexican Peso | | 123,684,863 | INR | | 1/22/09 | | | — | | | (35,544 | ) |
| 7,467,604,560 | | South Korean Won | | 7,837,536 | | | 1/23/09 | | | 1,910,552 | | | — | |
| 30,321,722 | | Mexican Peso | | 105,249,728 | INR | | 1/27/09 | | | — | | | (31,322 | ) |
| 6,905,529 | | Euro | | 10,067,915 | | | 1/28/09 | | | 424,342 | | | — | |
| 9,671,012 | | Euro | | 14,093,398 | | | 1/29/09 | | | 588,446 | | | — | |
| 2,754,660 | | Euro | | 4,039,984 | | | 2/04/09 | | | 193,949 | | | — | |
| 109,729,627 | | Mexican Peso | | 9,687,440 | | | 2/06/09 | | | 1,787,220 | | | — | |
| 24,730,081 | | Mexican Peso | | 2,185,505 | | | 2/09/09 | | | 406,362 | | | — | |
| 2,945,715 | | New Zealand Dollar | | 34,838,652,128 | VND | | 2/12/09 | | | 263,907 | | | — | |
| 17,294,895 | | Romanian Leu | | 113,908,408 | CZK | | 2/12/09 | | | 23,429 | | | — | |
| 6,322,150 | | Romanian Leu | | 41,840,621 | CZK | | 2/17/09 | | | 24,479 | | | — | |
| 4,372,314 | | Euro | | 6,316,026 | | | 2/19/09 | | | 213,792 | | | — | |
| 3,931,416 | | New Zealand Dollar | | 46,557,288,113 | VND | | 2/20/09 | | | 352,671 | | | — | |
| 20,047,506 | | Euro | | 29,139,835 | | | 2/23/09 | | | 1,163,349 | | | — | |
| 10,023,753 | | Euro | | 1,544,810,693 | JPY | | 2/23/09 | | | 3,057,651 | | | — | |
| 10,023,753 | | Euro | | 1,543,460,828 | JPY | | 2/25/09 | | | 3,044,156 | | | — | |
| 3,682,120,000 | | South Korean Won | | 3,880,000 | | | 2/25/09 | | | 955,361 | | | — | |
| 12,452,389 | | Euro | | 18,215,167 | | | 2/26/09 | | | 839,081 | | | — | |
| 6,682,502 | | Euro | | 1,024,875,284 | JPY | | 2/26/09 | | | 1,984,676 | | | — | |
| 39,172,654 | | Euro | | 57,903,586 | | | 2/27/09 | | | 3,243,401 | | | — | |
| 30,071,259 | | Euro | | 4,675,686,507 | JPY | | 2/27/09 | | | 9,636,607 | | | — | |
| 58,914,810 | | Mexican Peso | | 5,232,001 | | | 2/27/09 | | | 1,012,758 | | | — | |
| 4,517,459 | | Romanian Leu | | 29,268,617 | CZK | | 2/27/09 | | | — | | | (7,421 | ) |
| 3,675,562,800 | | South Korean Won | | 3,880,000 | | | 2/27/09 | | | 960,570 | | | — | |
| 6,682,502 | | Euro | | 10,016,803 | | | 3/03/09 | | | 693,185 | | | — | |
| 10,166,171 | | Mexican Peso | | 905,309 | | | 3/03/09 | | | 178,002 | | | — | |
| 10,023,753 | | Euro | | 14,994,799 | | | 3/04/09 | | | 1,009,699 | | | — | |
| 3,655,736,000 | | South Korean Won | | 3,880,000 | | | 3/04/09 | | | 976,318 | | | — | |
| 3,341,251 | | Euro | | 5,032,258 | | | 3/09/09 | | | 371,104 | | | — | |
| 3,341,251 | | Euro | | 513,877,721 | JPY | | 3/09/09 | | | 1,010,934 | | | — | |
| 3,341,251 | | Euro | | 5,048,463 | | | 3/10/09 | | | 387,418 | | | — | |
| 2,505,938 | | Euro | | 384,147,766 | JPY | | 3/10/09 | | | 744,475 | | | — | |
TGI-30
Franklin Templeton Variable Insurance Products Trust
Notes to Financial Statements (continued)
Templeton Global Income Securities Fund
7. FORWARD EXCHANGE CONTRACTS (continued)
| | | | | | | | | | | | | | |
| | | Contract
Amounta | | | Settlement
Date | | Unrealized
Appreciation | | Unrealized
Depreciation | |
| Contracts to Sell (continued) | | | | | | | | | | | | |
| 3,341,251 | | Euro | | 5,105,816 | | | 3/17/09 | | $ | 445,535 | | $ | — | |
| 7,760,000,000 | | South Korean Won | | 8,012,071 | CHF | | 3/27/09 | | | 1,347,411 | | | — | |
| 6,027,094 | | Euro | | 918,887,847 | JPY | | 3/31/09 | | | 1,744,418 | | | — | |
| 3,036,391,000 | | South Korean Won | | 3,140,768 | CHF | | 4/01/09 | | | 532,757 | | | — | |
| 14,200,317 | | Euro | | 2,199,046,055 | JPY | | 4/06/09 | | | 4,492,405 | | | — | |
| 3,880,000,000 | | South Korean Won | | 4,025,495 | CHF | | 4/06/09 | | | 691,969 | | | — | |
| 4,840,000 | | British Pound Sterling | | 9,405,185 | | | 4/07/09 | | | 2,347,318 | | | — | |
| 12,661,962 | | Euro | | 19,589,279 | | | 4/14/09 | | | 1,939,601 | | | — | |
| 6,168,648 | | Euro | | 959,610,305 | JPY | | 4/14/09 | | | 2,003,005 | | | — | |
| 9,415,305 | | Euro | | 19,874,611 | SGD | | 4/14/09 | | | 708,700 | | | — | |
| 1,574,014 | | Euro | | 246,141,160 | JPY | | 4/20/09 | | | 525,958 | | | — | |
| 3,237,710 | | Euro | | 15,778,980 | MYR | | 4/21/09 | | | 50,048 | | | — | |
| 2,425,242 | | British Pound Sterling | | 14,573,376 | MYR | | 4/27/09 | | | 677,612 | | | — | |
| 2,329,569 | | New Zealand Dollar | | 71,377,981 | INR | | 4/28/09 | | | 109,940 | | | — | |
| 13,708,414 | | British Pound Sterling | | 82,870,104 | MYR | | 4/30/09 | | | 3,974,126 | | | — | |
| 129,187,726 | | Mexican Peso | | 32,777,510 | PEN | | 4/30/09 | | | 1,180,025 | | | — | |
| 218,306,058 | | Mexican Peso | | 19,760,042 | | | 5/04/09 | | | 4,370,743 | | | — | |
| 45,766,762 | | Mexican Peso | | 169,465,166 | INR | | 5/04/09 | | | 227,356 | | | — | |
| 266,049,641 | | Mexican Peso | | 24,240,542 | | | 5/06/09 | | | 5,493,667 | | | — | |
| 808,414 | | British Pound Sterling | | 4,872,069 | MYR | | 5/07/09 | | | 230,129 | | | — | |
| 9,640,135 | | Mexican Peso | | 420,791,871 | CLP | | 5/15/09 | | | — | | | (30,484 | ) |
| 90,027,727 | | Mexican Peso | | 250,057,232 | TWD | | 5/18/09 | | | 1,302,148 | | | — | |
| 14,559,327 | | Mexican Peso | | 633,651,050 | CLP | | 5/20/09 | | | — | | | (48,640 | ) |
| 30,000,000 | | Mexican Peso | | 117,663,000 | INR | | 5/20/09 | | | 288,704 | | | — | |
| 53,095,853 | | Mexican Peso | | 144,700,004 | TWD | | 6/02/09 | | | 695,217 | | | — | |
| 57,848,619 | | Mexican Peso | | 129,543,727 | RUB | | 6/04/09 | | | — | | | (346,938 | ) |
| 5,514,624 | | Euro | | 27,146,472 | MYR | | 6/09/09 | | | 174,402 | | | — | |
| 6,880,600 | | Euro | | 10,606,617 | | | 6/10/09 | | | 1,026,866 | | | — | |
| 357,000 | | Euro | | 42,497,280 | JPY | | 6/10/09 | | | — | | | (26,867 | ) |
| 4,595,521 | | Euro | | 22,869,610 | MYR | | 6/10/09 | | | 217,126 | | | — | |
| 778,772 | | Euro | | 3,886,306 | MYR | | 6/12/09 | | | 39,966 | | | — | |
| 5,422,023 | | Mexican Peso | | 245,259,783 | CLP | | 6/12/09 | | | — | | | (3,446 | ) |
| 1,021,396 | | Euro | | 5,072,765 | MYR | | 6/15/09 | | | 45,508 | | | — | |
| 2,024,807 | | Euro | | 10,022,795 | MYR | | 6/16/09 | | | 80,632 | | | — | |
| 26,552,505 | | Mexican Peso | | 59,389,235 | RUB | | 6/19/09 | | | — | | | (167,355 | ) |
| 14,481,704 | | Mexican Peso | | 166,257,207 | KZT | | 6/29/09 | | | 195,867 | | | — | |
| 14,481,704 | | Mexican Peso | | 32,179,795 | RUB | | 6/29/09 | | | — | | | (99,405 | ) |
| 23,073,608 | | Mexican Peso | | 6,327,476 | PEN | | 6/30/09 | | | 365,491 | | | — | |
| 61,955,606 | | Mexican Peso | | 136,619,484 | RUB | | 7/10/09 | | | — | | | (466,995 | ) |
| 4,718,952 | | Euro | | 7,295,146 | | | 7/13/09 | | | 728,617 | | | — | |
| 30,888,068 | | Mexican Peso | | 68,008,329 | RUB | | 7/13/09 | | | — | | | (237,343 | ) |
| 4,718,951 | | Euro | | 7,303,266 | | | 7/14/09 | | | 736,813 | | | — | |
| 1,814,981 | | Euro | | 9,040,420 | MYR | | 7/14/09 | | | 91,313 | | | — | |
| 2,722,472 | | Euro | | 124,766,772 | TWD | | 7/14/09 | | | 18,431 | | | — | |
| 4,718,951 | | Euro | | 7,378,552 | | | 7/15/09 | | | 812,173 | | | — | |
| 4,464,854 | | Euro | | 22,337,396 | MYR | | 7/15/09 | | | 253,285 | | | — | |
| 3,738,862 | | Euro | | 172,524,578 | TWD | | 7/15/09 | | | 61,318 | | | — | |
| 1,161,588 | | Euro | | 5,809,102 | MYR | | 7/16/09 | | | 65,321 | | | — | |
| 508,195 | | Euro | | 23,529,429 | TWD | | 7/16/09 | | | 10,767 | | | — | |
TGI-31
Franklin Templeton Variable Insurance Products Trust
Notes to Financial Statements (continued)
Templeton Global Income Securities Fund
7. FORWARD EXCHANGE CONTRACTS (continued)
| | | | | | | | | | | | | | |
| | | Contract
Amounta | | | Settlement
Date | | Unrealized
Appreciation | | Unrealized
Depreciation | |
| Contracts to Sell (continued) | | | | | | | | | | | | |
| 2,359,476 | | Euro | | 3,703,905 | | | 7/17/09 | | $ | 420,791 | | $ | — | |
| 1,179,738 | | Euro | | 5,902,465 | MYR | | 7/17/09 | | | 67,172 | | | — | |
| 1,179,738 | | Euro | | 54,702,681 | TWD | | 7/17/09 | | | 27,480 | | | — | |
| 1,814,982 | | Euro | | 2,826,381 | | | 7/22/09 | | | 301,048 | | | — | |
| 4,174,457 | | Euro | | 6,530,103 | | | 7/24/09 | | | 721,971 | | | — | |
| 816,742 | | Euro | | 4,109,111 | MYR | | 7/24/09 | | | 53,484 | | | — | |
| 1,288,637 | | Euro | | 59,430,005 | TWD | | 7/24/09 | | | 20,331 | | | — | |
| 14,610,919 | | Mexican Peso | | 32,786,902 | RUB | | 7/24/09 | | | — | | | (97,806 | ) |
| 14,610,919 | | Mexican Peso | | 40,787,841 | TWD | | 7/24/09 | | | 231,021 | | | — | |
| 1,533,000 | | Euro | | 56,491,050 | RUB | | 7/28/09 | | | — | | | (558,135 | ) |
| 598,906 | | Euro | | 3,004,709 | MYR | | 7/31/09 | | | 37,055 | | | — | |
| 53,331,307 | | Mexican Peso | | 5,036,244 | | | 7/31/09 | | | 1,341,344 | | | — | |
| 31,280,607 | | Mexican Peso | | 2,951,279 | | | 8/04/09 | | | 785,545 | | | — | |
| 8,135,006 | | New Zealand Dollar | | 53,990,411,006 | IDR | | 8/05/09 | | | — | | | (58,895 | ) |
| 18,285,638 | | New Zealand Dollar | | 306,833,000 | RUB | | 8/12/09 | | | — | | | (1,976,023 | ) |
| 8,925,643 | | New Zealand Dollar | | 149,379,561 | RUB | | 8/14/09 | | | — | | | (978,480 | ) |
| 8,432,616 | | New Zealand Dollar | | 102,190,660,510 | VND | | 8/14/09 | | | 781,845 | | | — | |
| 8,323,000 | | Euro | | 115,797,066,700 | IDR | | 9/08/09 | | | — | | | (1,807,577 | ) |
| 8,340,000 | | Euro | | 372,881,400 | TWD | | 9/08/09 | | | — | | | (220,837 | ) |
| 7,998,680 | | Euro | | 11,079,425 | | | 9/11/09 | | | — | | | (43,406 | ) |
| 2,800,000 | | Euro | | 408,189,600 | JPY | | 9/14/09 | | | 634,430 | | | — | |
| 2,017,928 | | Mexican Peso | | 4,825,270 | RUB | | 9/17/09 | | | — | | | (7,310 | ) |
| 22,711,151 | | Mexican Peso | | 52,371,914 | RUB | | 10/02/09 | | | — | | | (140,155 | ) |
| 6,223,000 | | Euro | | 753,263,035 | JPY | | 11/18/09 | | | — | | | (276,958 | ) |
| 7,050,000 | | U.S. Dollar | | 670,455,000 | JPY | | 11/18/09 | | | 401,807 | | | — | |
| 265,338 | | Euro | | 335,865 | | | 11/19/09 | | | — | | | (32,917 | ) |
| 2,876,071 | | Euro | | 3,620,686 | | | 11/20/09 | | | — | | | (376,617 | ) |
| 1,918,356 | | Euro | | 2,390,367 | | | 11/24/09 | | | — | | | (275,788 | ) |
| 668,538 | | Euro | | 836,676 | | | 11/25/09 | | | — | | | (92,460 | ) |
| 1,300,570 | | Euro | | 1,697,244 | | | 11/30/09 | | | — | | | (110,235 | ) |
| 1,343,551 | | Euro | | 1,698,853 | | | 12/08/09 | | | — | | | (168,262 | ) |
| Unrealized appreciation (depreciation) on offsetting forward exchange contracts | | | | | | | | 15,391,475 | | | (473,724 | ) |
| | | | | | | | | | | | | | |
| Unrealized appreciation (depreciation) on forward exchange contracts | | | | | | | | 130,835,741 | | | (25,614,013 | ) |
| | | | | | | | | | | | | | |
| Net unrealized appreciation (depreciation) on forward exchange contracts | | | | | | | $ | 105,221,728 | | | | |
| | | | | | | | | | | | | | |
aIn | U.S. dollars unless otherwise indicated. |
See Abbreviations on page TGI-35.
TGI-32
Franklin Templeton Variable Insurance Products Trust
Notes to Financial Statements (continued)
Templeton Global Income Securities Fund
8. INTEREST RATE SWAPS
At December 31, 2008, the Fund had the following interest rate swap contracts outstanding:
| | | | | | | | | | | | | | | |
Counter Party | | Fixed Rate
Received by
the Fund | | Floating Rate Paid by the Fund | | Notional
Principal
Amount | | | Expiration
Date | | Unrealized
Appreciation | | Unrealized
Depreciation |
JPMorgan | | 7.06% | | Sinacofi Chile Interbank Rate | | 2,425,500,000 | CLP | | 6/13/18 | | $ | 305,180 | | $ | — |
JPMorgan | | 7.15% | | Sinacofi Chile Interbank Rate | | 2,475,000,000 | CLP | | 6/18/18 | | | 334,353 | | | — |
JPMorgan | | 7.50% | | Sinacofi Chile Interbank Rate | | 1,590,300,000 | CLP | | 8/07/18 | | | 292,640 | | | — |
JPMorgan | | 7.50% | | Sinacofi Chile Interbank Rate | | 1,587,200,000 | CLP | | 8/13/18 | | | 290,371 | | | — |
JPMorgan | | 7.67% | | Sinacofi Chile Interbank Rate | | 570,900,000 | CLP | | 8/29/18 | | | 114,791 | | | — |
JPMorgan | | 7.85% | | Sinacofi Chile Interbank Rate | | 702,800,000 | CLP | | 7/11/18 | | | 155,998 | | | — |
JPMorgan | | 7.855% | | Sinacofi Chile Interbank Rate | | 705,600,000 | CLP | | 7/17/18 | | | 156,180 | | | — |
Merrill Lynch & Co. Inc. | | 7.053% | | Sinacofi Chile Interbank Rate | | 7,200,000,000 | CLP | | 6/13/18 | | | 900,244 | | | — |
Merrill Lynch & Co. Inc. | | 7.094% | | Sinacofi Chile Interbank Rate | | 7,950,000,000 | CLP | | 6/16/18 | | | 1,019,516 | | | — |
Merrill Lynch & Co. Inc. | | 7.40% | | Sinacofi Chile Interbank Rate | | 765,000,000 | CLP | | 7/30/18 | | | 130,719 | | | — |
Merrill Lynch & Co. Inc. | | 7.40% | | Sinacofi Chile Interbank Rate | | 765,000,000 | CLP | | 8/06/18 | | | 131,644 | | | — |
Merrill Lynch & Co. Inc. | | 7.51% | | Sinacofi Chile Interbank Rate | | 765,000,000 | CLP | | 8/07/18 | | | 141,642 | | | — |
| | | | | | | | | | | | |
Unrealized appreciation (depreciation) on interest rate swaps | | | | | $ | 3,973,278 | | | — |
| | | | | | | | | | | | |
Net unrealized appreciation (depreciation) on interest rate swaps | | | | | $ | 3,973,278 | | | |
| | | | | | | | | | | | | | |
See Abbreviations on page TGI-35.
9. CREDIT RISK
The Fund has 15.22% of its portfolio invested in high yield or other securities rated below investment grade. These securities may be more sensitive to economic conditions causing greater price volatility and are potentially subject to a greater risk of loss due to default than higher rated securities.
10. CONCENTRATION OF RISK
Investing in foreign securities may include certain risks and considerations not typically associated with investing in U.S. securities, such as fluctuating currency values and changing local and regional economic, political and social conditions, which may result in greater market volatility. In addition, certain foreign securities may not be as liquid as U.S. securities.
11. FAIR VALUE MEASUREMENTS
The Fund adopted Financial Accounting Standards Board (FASB) Statement No. 157, “Fair Value Measurement” (SFAS 157), on January 1, 2008. SFAS 157 defines fair value, establishes a framework for measuring fair value, and expands disclosures about fair value measurements. The Fund has determined that the implementation of SFAS 157 did not have a material impact on the Fund’s financial statements.
TGI-33
Franklin Templeton Variable Insurance Products Trust
Notes to Financial Statements (continued)
Templeton Global Income Securities Fund
11. FAIR VALUE MEASUREMENTS (continued)
SFAS 157 establishes a fair value hierarchy that distinguishes between market data obtained from independent sources (observable inputs) and the Fund’s own market assumptions (unobservable inputs). These inputs are used in determining the value of the Fund’s investments and are summarized in the following fair value hierarchy:
| | • | | Level 1 – quoted prices in active markets for identical securities |
| | • | | Level 2 – other significant observable inputs (including quoted prices for similar securities, interest rates, prepayment speed, credit risk, etc.) |
| | • | | Level 3 – significant unobservable inputs (including the Fund’s own assumptions in determining the fair value of investments) |
The inputs or methodology used for valuing securities are not an indication of the risk associated with investing in those securities.
The following is a summary of the inputs used as of December 31, 2008, in valuing the Fund’s assets and liabilities carried at fair value:
| | | | | | | | | | | | |
| | | Level 1 | | Level 2 | | Level 3 | | Total |
Assets: | | | | | | | | | | | | |
Investments in Securities | | $ | 62,687,173 | | $ | 955,030,645 | | $ | — | | $ | 1,017,717,818 |
Other Financial Instrumentsa | | | — | | | 134,809,019 | | | — | | | 134,809,019 |
Liabilities: | | | | | | | | | | | | |
Other Financial Instrumentsa | | | — | | | 25,614,013 | | | — | | | 25,614,013 |
aOther | financial instruments include net unrealized appreciation (depreciation) on forward exchange contracts and swaps. |
12. NEW ACCOUNTING PRONOUNCEMENT
In March 2008, FASB issued FASB Statement No. 161, “Disclosures about Derivative Instruments and Hedging Activities, an amendment of FASB Statement No. 133” (SFAS 161), which expands disclosures about derivative investments and hedging activities. SFAS 161 is effective for fiscal years and interim periods beginning after November 15, 2008. The Fund is currently evaluating the impact, if any, of applying the various provisions of SFAS 161.
13. SUBSEQUENT EVENT
On January 23, 2009, the Fund entered into, along with certain other funds managed by Franklin Templeton Investments (individually, “Borrower”; collectively “Borrowers”), a $725 million senior unsecured syndicated global line of credit (“Global Credit Facility”) to provide a source of funds to the Borrowers for temporary and emergency purposes and to meet future unanticipated or unusually large redemption requests.
Under the terms of the Global Credit Facility, each Borrower has agreed to pay its proportionate share of fees and expenses incurred in connection with the implementation and maintenance of the Global Credit Facility.
TGI-34
Franklin Templeton Variable Insurance Products Trust
Notes to Financial Statements (continued)
Templeton Global Income Securities Fund
ABBREVIATIONS
| | |
| Currency | | Selected Portfolio |
AUD - Australian Dollar BRL - Brazilian Real CHF - Swiss Franc CLP - Chilean Peso CZK - Czech Koruna EGP - Egyptian Pound EUR - Euro IDR - Indonesian Rupiah INR - Indian Rupee JPY - Japanese Yen KRW - South Korean Won KZT - Kazakhstani Tenge MXN - Mexican Peso MYR - Malaysian Ringgit NOK - Norwegian Krone NZD - New Zealand Dollar PEN - Peruvian Nuevo Sol PLN - Polish Zloty RUB - Russian Ruble SEK - Swedish Krona SGD - Singapore Dollar TWD - Taiwanese Dollar VND - Viet Nam Dong | | BHAC - Berkshire Hathaway Assurance Corp. FGIC - Financial Guaranty Insurance Co. FRN - Floating Rate Note FSA - Financial Security Assurance Inc. GO - General Obligation MBIA - Municipal Bond Investors Assurance Corp. |
TGI-35
Franklin Templeton Variable Insurance Products Trust
Templeton Global Income Securities Fund
Report of Independent Registered Public Accounting Firm
To the Board of Trustees and Shareholders of
Franklin Templeton Variable Insurance Products Trust
In our opinion, the accompanying statement of assets and liabilities, including the statement of investments, and the related statements of operations and of changes in net assets and the financial highlights present fairly, in all material respects, the financial position of Templeton Global Income Securities Fund (one of the funds constituting the Franklin Templeton Variable Insurance Products Trust, hereafter referred to as the “Fund”) at December 31, 2008, the results of its operations for the year then ended, the changes in its net assets for each of the two years in the period then ended and the financial highlights for the periods presented, in conformity with accounting principles generally accepted in the United States of America. These financial statements and financial highlights (hereafter referred to as “financial statements”) are the responsibility of the Fund’s management. Our responsibility is to express an opinion on these financial statements based on our audits. We conducted our audits of these financial statements in accordance with the standards of the Public Company Accounting Oversight Board (United States). Those standards require that we plan and perform the audit to obtain reasonable assurance about whether the financial statements are free of material misstatement. An audit includes examining, on a test basis, evidence supporting the amounts and disclosures in the financial statements, assessing the accounting principles used and significant estimates made by management, and evaluating the overall financial statement presentation. We believe that our audits, which included confirmation of securities at December 31, 2008 by correspondence with the custodian, provide a reasonable basis for our opinion.
PricewaterhouseCoopers LLP
San Francisco, California
February 10, 2009
TGI-36
Franklin Templeton Variable Insurance Products Trust
Tax Designation (unaudited)
Templeton Global Income Securities Fund
At December 31, 2008, more than 50% of the Fund’s total assets were invested in securities of foreign issuers. In most instances, foreign taxes were withheld from income paid to the Fund on these investments. The Fund elects to treat foreign taxes paid as allowed under Section 853 of the Internal Revenue Code. This election will allow shareholders of record as of the 2009 distribution date, to treat their proportionate share of foreign taxes paid by the Fund as having been paid directly by them. The shareholder shall consider these amounts as foreign taxes paid in the tax year in which they receive the Fund distribution.
TGI-37
TEMPLETON GROWTH SECURITIES FUND
This annual report for Templeton Growth Securities Fund covers the fiscal year ended December 31, 2008.
Performance Summary as of 12/31/08
Average annual total return of Class 1 shares represents the average annual change in value, assuming reinvestment of dividends and capital gains. Average returns smooth out variations in returns, which can be significant; they are not the same as year-by-year results.
Periods ended 12/31/08
| | | | | | |
| | | 1-Year | | 5-Year | | 10-Year |
Average Annual Total Return | | -42.13% | | -1.67% | | +1.96% |
Total Return Index Comparison
for a Hypothetical $10,000 Investment (1/1/99–12/31/08)
The graph below shows the change in value of a hypothetical $10,000 investment in the Fund over the indicated period and includes reinvestment of any income or distributions. The Fund’s performance is compared to the performance of the Morgan Stanley Capital International (MSCI) World Index. One cannot invest directly in an index, nor is an index representative of the Fund’s portfolio. Please see Important Notes to Performance Information preceding the Fund Summaries.
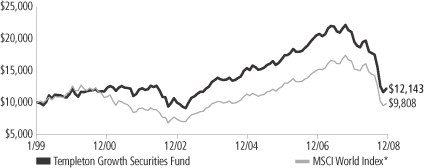
*Source: © 2009 Morningstar. Please see Index Descriptions following the Fund Summaries.
Templeton Growth Securities Fund – Class 1
Performance reflects the Fund’s Class 1 operating expenses, but does not include any contract fees, expenses or sales charges. If they had been included, performance would be lower. These charges and deductions, particularly for variable life policies, can have a significant effect on contract values and insurance benefits. See the contract prospectus for a complete description of these expenses, including sales charges.
Performance data represent past performance, which does not guarantee future results. Investment return and principal value will fluctuate, and you may have a gain or loss when you sell your shares. Current performance may differ from figures shown.
TG-1
Fund Goal and Main Investments: Templeton Growth Securities Fund seeks long-term capital growth. The Fund normally invests primarily in equity securities of companies located anywhere in the world, including those in the U.S. and in emerging markets.
Performance Overview
You can find the Fund’s one-year total return in the Performance Summary. The Fund performed comparably to the - -40.33% total return of the MSCI World Index for the period under review.1
Economic and Market Overview
The U.S. experienced a marked slowdown in gross domestic product (GDP) growth as housing prices declined, consumer demand softened, and a credit crisis originally related to U.S. subprime loan losses intensified and spread globally. Although GDP growth rebounded in the second quarter of 2008, largely due to fiscal stimulus, the domestic economy contracted in the third and fourth quarters. Fear of recession spanned the entire period, and in the summer most economists agreed that a recession had already begun. By then, the faltering U.S. economy — which is the world’s largest and accounts for roughly 25% of global GDP — had negatively impacted growth prospects around the world. Although signs of a global slowdown surfaced in the latter half of the reporting period, in the first half growth remained robust in developing economies, particularly in Asia.
The China-led demand for oil, natural gas, and industrial and agricultural commodities propelled commodity prices and those of related equities to higher levels. The steep rise in the price of oil, which peaked at $145 per barrel in early July, was one of the most extreme market trends during the year. As a result, oil was a major focus of attention due to its impact on everything from inflation to corporate earnings to consumer spending. The price boom for commodities in general was broadly based and included natural gas, precious metals and most agricultural and industrial commodities, all of which added to global inflationary pressures. In this environment, the world’s monetary authorities faced the choice of lowering short-term interest rates to stimulate growth or raising them to fight rising inflation. Stimulus provided through fiscal and monetary policies implemented around the globe sought to restore financial market stability and reignite economic growth.
1. Source: © 2009 Morningstar. One cannot invest directly in an index, nor is an index representative of the Fund’s portfolio. Please see Index Descriptions following the Fund Summaries.
Fund Risks: The Fund’s investments in stocks offer the potential for long-term gains but can be subject to short-term price fluctuations. Foreign investing, especially in emerging markets, involves additional risks, including currency fluctuations, economic instability, market volatility, and political and social instability. By having significant investments in one or more countries or in particular sectors from time to time, the Fund may be at greater risk of adverse developments in a country or sector than a fund that invests more broadly. The Fund’s prospectus also includes a description of the main investment risks.
TG-2
The U.S. Treasury and the Federal Reserve Board took unprecedented steps, including lowering short-term rates to near 0% from 4.25%. The eurozone had made controlling inflation its main goal and kept rates steady at 4.00% until July, when the European Central Bank (ECB) joined many of the world’s central banks whose concerns about inflation had led them to raise rates. The potential for global recession, however, exacerbated by the virtual freeze in the global financial system in September and October, trumped inflationary concerns, and the world’s monetary authorities, including the ECB and the Bank of England, cut interest rates aggressively. The U.S. dollar, which had declined earlier in the period versus many of the world’s currencies, regained ground quickly toward period-end as a flight to the relative safety of U.S. Treasuries prevailed. The greenback appreciated 8.6% relative to most currencies during the year under review.2
In this challenging economic time, volatility came to define global equity markets. Virtually all local indexes ended the 12-month period with marked losses. Despite negative economic data and an outlook for decelerating corporate earnings and profit margins globally, many companies outside the financials sector retained relatively strong balance sheets.
Investment Strategy
Our investment philosophy is bottom up, value oriented and long term. In choosing investments, we will focus on the market price of a company’s securities relative to our evaluation of the company’s potential long-term earnings, asset value and cash flow. Among factors we may consider are a company’s historical value measures, including price/earnings ratio, profit margins and liquidation value. We do in-depth research to construct a bargain list from which we buy.
Manager’s Discussion
In 2008, the Fund had some major detractors from performance relative to the MSCI World Index, such as leading independent maker of hard drives and digital storage solutions Seagate Technology, and what was previously the world’s largest insurer, American International Group. Other key detractors during the review period were banking and insurance holding company Royal Bank of Scotland Group (sold by period-end), and major wireless telecommunications company Sprint Nextel.
2. Source: Federal Reserve H10 report.
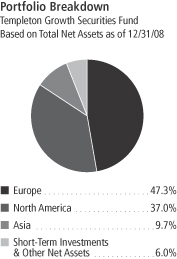
TG-3
U.S. independent biotechnology company Amgen was among the Fund’s top performers during the reporting period as the company’s results beat analysts’ estimates and as the outlook improved for several of its pipeline drugs. Other holdings that helped the Fund’s relative performance included global consulting firm Accenture, the world’s largest enterprise software company, Oracle, and research-based pharmaceutical company Pfizer. During a time of significant declines within most global stock markets, the Fund’s cash position generally served to cushion the Fund and contributed to its relative performance.
On a sector basis, the Fund’s financials holdings were among the most significant detractors from Fund performance despite an underweighted allocation.3 This was largely due to stock selection in commercial banks and insurance companies. An underweighted allocation to the traditionally defensive consumer staples sector also hurt the Fund’s relative results as did stock selection in the consumer discretionary sector, particularly in the automobiles industry.4
Conversely, relative Fund performance benefited from stock selection and an overweighted position in the health care sector.5 The Fund’s underweighted exposure to materials stocks also helped the Fund’s relative returns.6
By country, the Fund’s underweighting and stock selection in Japan and the U.S. were major detractors from relative Fund performance while stock selection in Europe helped the Fund’s relative results despite absolute losses.
3. The financials sector comprises capital markets, commercial banks, consumer finance, diversified financial services, insurance, and real estate management and development in the SOI.
4. The consumer staples sector comprises beverages, food and staples retailing, and food products in the SOI. The consumer discretionary sector comprises auto components; automobiles; hotels, restaurants and leisure; Internet and catalog retail; media; multiline retail; and specialty retail in the SOI.
5. The health care sector comprises biotechnology, health care equipment and supplies, and pharmaceuticals in the SOI.
6. The materials sector comprises construction materials and paper and forest products in the SOI.
Top 10 Holdings
Templeton Growth Securities Fund 12/31/08
| | |
Company
Sector/Industry,
Country | | % of Total
Net Assets |
| |
| Oracle Corp. | | 3.2% |
| Software, U.S. | | |
| |
| Microsoft Corp. | | 3.2% |
| Software, U.S. | | |
| |
| Amgen Inc. | | 3.1% |
| Biotechnology, U.S. | | |
| |
| Pfizer Inc. | | 3.0% |
| Pharmaceuticals, U.S. | | |
| |
| Accenture Ltd., A | | 2.6% |
| IT Services, U.S. | | |
| |
| BP PLC | | 2.5% |
| Oil, Gas & Consumable Fuels, U.K. | | |
| |
| Siemens AG | | 2.3% |
| Industrial Conglomerates, Germany | | |
| |
| Total SA, B | | 2.2% |
| Oil, Gas & Consumable Fuels, France | | |
| |
| GlaxoSmithKline PLC | | 2.2% |
| Pharmaceuticals, U.K. | | |
| |
| Vivendi SA | | 2.2% |
| Media, France | | |
The dollar value, number of shares or principal amount, and names of all portfolio holdings are listed in the Fund’s Statement of Investments (SOI).
TG-4
Thank you for your participation in Templeton Growth Securities Fund. We look forward to serving your future investment needs.
The foregoing information reflects our analysis, opinions and portfolio holdings as of December 31, 2008, the end of the reporting period. The way we implement our main investment strategies and the resulting portfolio holdings may change depending on factors such as market and economic conditions. These opinions may not be relied upon as investment advice or an offer for a particular security. The information is not a complete analysis of every aspect of any market, country, industry, security or the Fund. Statements of fact are from sources considered reliable, but the investment manager makes no representation or warranty as to their completeness or accuracy. Although historical performance is no guarantee of future results, these insights may help you understand our investment management philosophy.
TG-5
Fund Expenses
As an investor in a variable insurance contract (Contract) that indirectly provides for investment in an underlying mutual fund, you can incur transaction and/or ongoing expenses at both the Fund level and the Contract level.
| • | | Transaction expenses can include sales charges (loads) on purchases, redemption fees, surrender fees, transfer fees and premium taxes. |
| • | | Ongoing expenses can include management fees, distribution and service (12b-1) fees, contract fees, annual maintenance fees, mortality and expense risk fees and other fees and expenses. All mutual funds and Contracts have some types of ongoing expenses. |
The expenses shown in the table are meant to highlight ongoing expenses at the Fund level only and do not include ongoing expenses at the Contract level, or transaction expenses at either the Fund or Contract level. While the Fund does not have transaction expenses, if the transaction and ongoing expenses at the Contract level were included, the expenses shown below would be higher. You should consult your Contract prospectus or disclosure document for more information.
The table shows Fund-level ongoing expenses and can help you understand these expenses and compare them with those of other mutual funds offered through the Contract. The table assumes a $1,000 investment held for the six months indicated. Please refer to the Fund prospectus for additional information on operating expenses.
Actual Fund Expenses
The first line (Actual) of the table provides actual account values and expenses. The “Ending Account Value” is derived from the Fund’s actual return, which includes the effect of ongoing Fund expenses, but does not include the effect of ongoing Contract expenses.
You can estimate the Fund-level expenses you incurred during the period by following these steps. Of course, your account value and expenses will differ from those in this illustration:
| 1. | Divide your account value by $1,000. |
If an account had an $8,600 value, then $8,600 ÷ $1,000 = 8.6.
| 2. | Multiply the result by the number under the heading “Fund-Level Expenses Incurred During Period.” |
If Fund-Level Expenses Incurred During Period were $7.50, then 8.6 x $7.50 = $64.50.
In this illustration, the estimated expenses incurred this period at the Fund level are $64.50.
Templeton Growth Securities Fund – Class 1
TG-6
Hypothetical Example for Comparison with Other Mutual Funds
Information in the second line (Hypothetical) of the table can help you compare ongoing expenses of the Fund with those of other mutual funds offered through the Contract. This information may not be used to estimate the actual ending account balance or expenses you incurred during the period. The hypothetical “Ending Account Value” is based on the Fund’s actual expense ratio and an assumed 5% annual rate of return before expenses, which does not represent the Fund’s actual return. The figure under the heading “Fund-Level Expenses Incurred During Period” shows the hypothetical expenses your account would have incurred under this scenario. You can compare this figure with the 5% hypothetical examples that appear in shareholder reports of other funds offered through a Contract.
| | | | | | | | | |
| Class 1 | | Beginning
Account Value 7/1/08 | | Ending Account Value 12/31/08 | | Fund-Level
Expenses Incurred
During Period*
7/1/08–12/31/08 |
Actual | | $ | 1,000 | | $ | 677.50 | | $ | 3.29 |
Hypothetical (5% return before expenses) | | $ | 1,000 | | $ | 1,021.22 | | $ | 3.96 |
*Expenses are calculated using the most recent six-month annualized expense ratio for the Fund’s Class 1 shares (0.78%), which does not include any ongoing expenses of the Contract for which the Fund is an investment option, multiplied by the average account value over the period, multiplied by 184/366 to reflect the one-half year period.
TG-7
Franklin Templeton Variable Insurance Products Trust
Financial Highlights
Templeton Growth Securities Fund
| | | | | | | | | | | | | | | | | | | | |
| | | Year Ended December 31, | |
| Class 1 | | 2008 | | | 2007 | | | 2006 | | | 2005 | | | 2004 | |
| | | | |
Per share operating performance | | | | | | | | | | | | | | | | | | | | |
(for a share outstanding throughout the year) | | | | | | | | | | | | | | | | | | | | |
Net asset value, beginning of year | | $ | 15.68 | | | $ | 16.16 | | | $ | 13.98 | | | $ | 12.98 | | | $ | 11.31 | |
| | | | |
Income from investment operationsa: | | | | | | | | | | | | | | | | | | | | |
Net investment incomeb | | | 0.29 | | | | 0.27 | | | | 0.29 | | | | 0.24 | | | | 0.21 | |
Net realized and unrealized gains (losses) | | | (6.50 | ) | | | 0.19 | | | | 2.67 | | | | 0.92 | | | | 1.61 | |
| | | | |
Total from investment operations | | | (6.21 | ) | | | 0.46 | | | | 2.96 | | | | 1.16 | | | | 1.82 | |
| | | | |
Less distributions from: | | | | | | | | | | | | | | | | | | | | |
Net investment income | | | (0.26 | ) | | | (0.25 | ) | | | (0.23 | ) | | | (0.16 | ) | | | (0.15 | ) |
Net realized gains | | | (0.87 | ) | | | (0.69 | ) | | | (0.55 | ) | | | — | | | | — | |
| | | | |
Total distributions | | | (1.13 | ) | | | (0.94 | ) | | | (0.78 | ) | | | (0.16 | ) | | | (0.15 | ) |
| | | | |
Net asset value, end of year | | $ | 8.34 | | | $ | 15.68 | | | $ | 16.16 | | | $ | 13.98 | | | $ | 12.98 | |
| | | | |
| | | | | |
Total returnc | | | (42.13)% | | | | 2.55% | | | | 22.20% | | | | 9.06% | | | | 16.25% | |
Ratios to average net assets | | | | | | | | | | | | | | | | | | | | |
Expenses before expense reduction | | | 0.78% | | | | 0.77% | | | | 0.78% | | | | 0.82% | | | | 0.86% | |
Expenses net of expense reduction | | | 0.78% | d | | | 0.76% | | | | 0.78% | d | | | 0.82% | d | | | 0.86% | d |
Net investment income | | | 2.64% | | | | 1.64% | | | | 1.93% | | | | 1.81% | | | | 1.75% | |
| | | | | |
Supplemental data | | | | | | | | | | | | | | | | | | | | |
Net assets, end of year (000’s) | | $ | 371,700 | | | $ | 406,538 | | | $ | 413,871 | | | $ | 779,347 | | | $ | 800,118 | |
Portfolio turnover rate | | | 18.37% | | | | 20.45% | | | | 20.29% | e | | | 22.16% | | | | 19.13% | |
aThe amount shown for a share outstanding throughout the period may not correlate with the Statement of Operations for the period due to the timing of sales and repurchases of the Fund shares in relation to income earned and/or fluctuating market value of the investments of the Fund.
bBased on average daily shares outstanding.
cTotal return does not include any fees, charges or expenses imposed by the variable annuity and life insurance contracts for which the Franklin Templeton Variable Insurance Products Trust serves as an underlying investment vehicle.
dBenefit of expense reduction rounds to less than 0.01%.
eExcludes the value of portfolio securities delivered as a result of a redemption in-kind.
The accompanying notes are an integral part of these financial statements.
TG-8
Franklin Templeton Variable Insurance Products Trust
Financial Highlights (continued)
Templeton Growth Securities Fund
| | | | | | | | | | | | | | | | | | | | |
| | | Year Ended December 31, | |
| Class 2 | | 2008 | | | 2007 | | | 2006 | | | 2005 | | | 2004 | |
| | | | |
Per share operating performance | | | | | | | | | | | | | | | | | | | | |
(for a share outstanding throughout the year) | | | | | | | | | | | | | | | | | | | | |
Net asset value, beginning of year | | $ | 15.44 | | | $ | 15.93 | | | $ | 13.81 | | | $ | 12.83 | | | $ | 11.19 | |
| | | | |
Income from investment operationsa: | | | | | | | | | | | | | | | | | | | | |
Net investment incomeb | | | 0.29 | | | | 0.22 | | | | 0.24 | | | | 0.20 | | | | 0.17 | |
Net realized and unrealized gains (losses) | | | (6.44 | ) | | | 0.20 | | | | 2.63 | | | | 0.93 | | | | 1.61 | |
| | | | |
Total from investment operations | | | (6.15 | ) | | | 0.42 | | | | 2.87 | | | | 1.13 | | | | 1.78 | |
| | | | |
Less distributions from: | | | | | | | | | | | | | | | | | | | | |
Net investment income | | | (0.22 | ) | | | (0.22 | ) | | | (0.20 | ) | | | (0.15 | ) | | | (0.14 | ) |
Net realized gains | | | (0.87 | ) | | | (0.69 | ) | | | (0.55 | ) | | | — | | | | — | |
| | | | |
Total distributions | | | (1.09 | ) | | | (0.91 | ) | | | (0.75 | ) | | | (0.15 | ) | | | (0.14 | ) |
| | | | |
Net asset value, end of year | | $ | 8.20 | | | $ | 15.44 | | | $ | 15.93 | | | $ | 13.81 | | | $ | 12.83 | |
| | | | |
| | | | | |
Total returnc | | | (42.32)% | | | | 2.35% | | | | 21.81% | | | | 8.86% | | | | 16.03% | |
Ratios to average net assets | | | | | | | | | | | | | | | | | | | | |
Expenses before expense reduction | | | 1.03% | | | | 1.02% | | | | 1.03% | | | | 1.07% | | | | 1.11% | |
Expenses net of expense reduction | | | 1.03% | d | | | 1.01% | | | | 1.03% | d | | | 1.07% | d | | | 1.11% | d |
Net investment income | | | 2.39% | | | | 1.39% | | | | 1.68% | | | | 1.56% | | | | 1.50% | |
| | | | | |
Supplemental data | | | | | | | | | | | | | | | | | | | | |
Net assets, end of year (000’s) | | $ | 1,513,557 | | | $ | 3,182,203 | | | $ | 2,821,818 | | | $ | 1,912,825 | | | $ | 1,189,112 | |
Portfolio turnover rate | | | 18.37% | | | | 20.45% | | | | 20.29% | e | | | 22.16% | | | | 19.13% | |
aThe amount shown for a share outstanding throughout the period may not correlate with the Statement of Operations for the period due to the timing of sales and repurchases of the Fund shares in relation to income earned and/or fluctuating market value of the investments of the Fund.
bBased on average daily shares outstanding.
cTotal return does not include any fees, charges or expenses imposed by the variable annuity and life insurance contracts for which the Franklin Templeton Variable Insurance Products Trust serves as an underlying investment vehicle.
dBenefit of expense reduction rounds to less than 0.01%.
eExcludes the value of portfolio securities delivered as a result of a redemption in-kind.
The accompanying notes are an integral part of these financial statements.
TG-9
Franklin Templeton Variable Insurance Products Trust
Financial Highlights (continued)
Templeton Growth Securities Fund
| | | | |
| | | Period Ended
December 31, | |
| Class 4 | | 2008a | |
| | | | |
Per share operating performance | | | | |
(for a share outstanding throughout the period) | | | | |
Net asset value, beginning of period | | $ | 14.08 | |
| | | | |
Income from investment operationsb: | | | | |
Net investment incomec | | | 0.09 | |
Net realized and unrealized gains (losses) | | | (4.73 | ) |
| | | | |
Total from investment operations | | | (4.64 | ) |
| | | | |
Less distributions from: | | | | |
Net investment income | | | (0.26 | ) |
Net realized gains | | | (0.87 | ) |
| | | | |
Total distributions | | | (1.13 | ) |
| | | | |
Net asset value, end of period | | $ | 8.31 | |
| | | | |
| |
Total returnd | | | (35.79)% | |
Ratios to average net assetse | | | | |
Expensesf | | | 1.13% | |
Net investment income | | | 2.29% | |
| |
Supplemental data | | | | |
Net assets, end of period (000’s) | | $ | 24,877 | |
Portfolio turnover rate | | | 18.37% | |
aFor the period February 29, 2008 (effective date) to December 31, 2008.
bThe amount shown for a share outstanding throughout the period may not correlate with the Statement of Operations for the period due to the timing of sales and repurchases of the Fund shares in relation to income earned and/or fluctuating market value of the investments of the Fund.
cBased on average daily shares outstanding.
dTotal return does not include any fees, charges or expenses imposed by the variable annuity and life insurance contracts for which the Franklin Templeton Variable Insurance Products Trust serves as an underlying investment vehicle. Total return is not annualized for periods less than one year.
eRatios are annualized for periods less than one year.
fBenefit of expense reduction rounds to less than 0.01%.
The accompanying notes are an integral part of these financial statements.
TG-10
Franklin Templeton Variable Insurance Products Trust
Statement of Investments, December 31, 2008
| | | | | | | |
| Templeton Growth Securities Fund | | Country | | Shares | | Value |
Common Stocks 94.0% | | | | | | | |
Aerospace & Defense 0.2% | | | | | | | |
BAE Systems PLC | | United Kingdom | | 855,110 | | $ | 4,705,349 |
aBAE Systems PLC, 144A | | United Kingdom | | 369 | | | 2,030 |
| | | | | | | |
| | | | | | | 4,707,379 |
| | | | | | | |
Air Freight & Logistics 3.7% | | | | | | | |
Deutsche Post AG | | Germany | | 1,087,062 | | | 17,944,058 |
FedEx Corp. | | United States | | 243,460 | | | 15,617,959 |
United Parcel Service Inc., B | | United States | | 657,270 | | | 36,255,013 |
| | | | | | | |
| | | | | | | 69,817,030 |
| | | | | | | |
Auto Components 0.2% | | | | | | | |
Valeo SA | | France | | 202,767 | | | 2,994,776 |
| | | | | | | |
Automobiles 1.9% | | | | | | | |
Bayerische Motoren Werke AG | | Germany | �� | 384,737 | | | 11,819,371 |
Harley-Davidson Inc. | | United States | | 299,480 | | | 5,082,176 |
Hyundai Motor Co. Ltd. | | South Korea | | 268,950 | | | 8,411,342 |
Toyota Motor Corp. | | Japan | | 314,300 | | | 10,381,642 |
| | | | | | | |
| | | | | | | 35,694,531 |
| | | | | | | |
Beverages 0.5% | | | | | | | |
bDr. Pepper Snapple Group Inc. | | United States | | 634,020 | | | 10,302,825 |
| | | | | | | |
Biotechnology 3.1% | | | | | | | |
bAmgen Inc. | | United States | | 1,032,850 | | | 59,647,087 |
| | | | | | | |
Building Products 0.1% | | | | | | | |
bUSG Corp. | | United States | | 272,940 | | | 2,194,438 |
| | | | | | | |
Capital Markets 0.5% | | | | | | | |
bUBS AG | | Switzerland | | 725,948 | | | 10,088,087 |
| | | | | | | |
Commercial Banks 5.1% | | | | | | | |
HSBC Holdings PLC | | United Kingdom | | 2,724,013 | | | 25,903,816 |
ICICI Bank Ltd., ADR | | India | | 23,067 | | | 444,040 |
Intesa Sanpaolo SpA | | Italy | | 5,720,440 | | | 20,297,187 |
bKB Financial Group Inc. | | South Korea | | 426,140 | | | 11,370,481 |
Mitsubishi UFJ Financial Group Inc. | | Japan | | 1,535,570 | | | 9,643,301 |
Shinsei Bank Ltd. | | Japan | | 4,530,000 | | | 7,163,795 |
Sumitomo Mitsui Financial Group Inc. | | Japan | | 201,400 | | | 8,716,954 |
UniCredit SpA | | Italy | | 6,063,647 | | | 14,795,502 |
| | | | | | | |
| | | | | | | 98,335,076 |
| | | | | | | |
Commercial Services & Supplies 0.1% | | | | | | | |
Pitney Bowes Inc. | | United States | | 95,140 | | | 2,424,167 |
| | | | | | | |
Communications Equipment 1.1% | | | | | | | |
bCisco Systems Inc. | | United States | | 815,590 | | | 13,294,117 |
Telefonaktiebolaget LM Ericsson, B | | Sweden | | 952,704 | | | 7,164,470 |
| | | | | | | |
| | | | | | | 20,458,587 |
| | | | | | | |
Computers & Peripherals 0.4% | | | | | | | |
Seagate Technology | | United States | | 1,916,898 | | | 8,491,858 |
| | | | | | | |
Construction Materials 0.3% | | | | | | | |
CRH PLC | | Ireland | | 216,030 | | | 5,437,346 |
| | | | | | | |
Consumer Finance 0.3% | | | | | | | |
American Express Co. | | United States | | 359,270 | | | 6,664,458 |
| | | | | | | |
TG-11
Franklin Templeton Variable Insurance Products Trust
Statement of Investments, December 31, 2008 (continued)
| | | | | | | |
| Templeton Growth Securities Fund | | Country | | Shares | | Value |
Common Stocks (continued) | | | | | | | |
Diversified Financial Services 0.7% | | | | | | | |
ING Groep NV | | Netherlands | | 1,279,530 | | $ | 13,114,593 |
| | | | | | | |
Diversified Telecommunication Services 6.4% | | | | | | | |
Belgacom | | Belgium | | 233,162 | | | 8,910,412 |
France Telecom SA | | France | | 1,428,670 | | | 39,874,278 |
KT Corp., ADR | | South Korea | | 862,201 | | | 12,648,489 |
Singapore Telecommunications Ltd. | | Singapore | | 12,064,000 | | | 21,475,183 |
Telefonica SA | | Spain | | 806,850 | | | 17,882,261 |
Telekom Austria AG | | Austria | | 793,940 | | | 11,434,713 |
Telenor ASA | | Norway | | 1,478,027 | | | 9,839,558 |
| | | | | | | |
| | | | | | | 122,064,894 |
| | | | | | | |
Electronic Equipment, Instruments & Components 1.4% | | | | | | | |
bFlextronics International Ltd. | | Singapore | | 641,110 | | | 1,641,242 |
FUJIFILM Holdings Corp. | | Japan | | 512,810 | | | 11,438,553 |
Tyco Electronics Ltd. | | United States | | 847,788 | | | 13,742,643 |
| | | | | | | |
| | | | | | | 26,822,438 |
| | | | | | | |
Energy Equipment & Services 0.4% | | | | | | | |
Aker Solutions ASA | | Norway | | 559,800 | | | 3,622,077 |
SBM Offshore NV | | Netherlands | | 243,430 | | | 3,182,289 |
| | | | | | | |
| | | | | | | 6,804,366 |
| | | | | | | |
Food & Staples Retailing 0.2% | | | | | | | |
Tesco PLC | | United Kingdom | | 636,580 | | | 3,347,125 |
| | | | | | | |
Food Products 2.3% | | | | | | | |
Nestle SA | | Switzerland | | 860,340 | | | 33,514,509 |
Unilever NV | | Netherlands | | 462,727 | | | 11,219,520 |
| | | | | | | |
| | | | | | | 44,734,029 |
| | | | | | | |
Health Care Equipment & Supplies 2.4% | | | | | | | |
bBoston Scientific Corp. | | United States | | 3,115,270 | | | 24,112,190 |
Covidien Ltd. | | United States | | 594,418 | | | 21,541,708 |
Olympus Corp. | | Japan | | 800 | | | 16,002 |
| | | | | | | |
| | | | | | | 45,669,900 |
| | | | | | | |
Hotels, Restaurants & Leisure 1.4% | | | | | | | |
Accor SA | | France | | 163,390 | | | 8,021,520 |
Compass Group PLC | | United Kingdom | | 3,665,779 | | | 18,417,944 |
| | | | | | | |
| | | | | | | 26,439,464 |
| | | | | | | |
Industrial Conglomerates 5.6% | | | | | | | |
General Electric Co. | | United States | | 2,123,410 | | | 34,399,242 |
Koninklijke Philips Electronics NV | | Netherlands | | 749,828 | | | 14,500,541 |
Siemens AG | | Germany | | 602,004 | | | 44,437,683 |
Tyco International Ltd. | | United States | | 594,418 | | | 12,839,429 |
| | | | | | | |
| | | | | | | 106,176,895 |
| | | | | | | |
Insurance 4.3% | | | | | | | |
ACE Ltd. | | United States | | 92,930 | | | 4,917,856 |
American International Group Inc. | | United States | | 1,023,745 | | | 1,607,280 |
Aviva PLC | | United Kingdom | | 3,808,161 | | | 21,691,837 |
Muenchener Rueckversicherungs-Gesellschaft AG | | Germany | | 95,260 | | | 14,592,286 |
Old Mutual PLC | | United Kingdom | | 7,445,420 | | | 5,980,924 |
Progressive Corp. | | United States | | 952,720 | | | 14,109,783 |
TG-12
Franklin Templeton Variable Insurance Products Trust
Statement of Investments, December 31, 2008 (continued)
| | | | | | | |
| Templeton Growth Securities Fund | | Country | | Shares | | Value |
Common Stocks (continued) | | | | | | | |
Insurance (continued) | | | | | | | |
Standard Life PLC | | United Kingdom | | 2,544,192 | | $ | 7,506,157 |
Torchmark Corp. | | United States | | 253,277 | | | 11,321,482 |
| | | | | | | |
| | | | | | | 81,727,605 |
| | | | | | | |
Internet & Catalog Retail 0.3% | | | | | | | |
bExpedia Inc. | | United States | | 694,780 | | | 5,724,987 |
| | | | | | | |
IT Services 2.6% | | | | | | | |
Accenture Ltd., A | | United States | | 1,524,537 | | | 49,989,568 |
| | | | | | | |
Media 10.3% | | | | | | | |
Comcast Corp., A | | United States | | 2,085,382 | | | 33,678,919 |
News Corp., A | | United States | | 3,701,922 | | | 33,650,471 |
Pearson PLC | | United Kingdom | | 1,618,498 | | | 15,152,581 |
Reed Elsevier NV | | Netherlands | | 1,161,545 | | | 13,675,667 |
Time Warner Inc. | | United States | | 3,275,372 | | | 32,950,242 |
bViacom Inc., B | | United States | | 1,325,938 | | | 25,272,378 |
Vivendi SA | | France | | 1,274,080 | | | 41,447,670 |
| | | | | | | |
| | | | | | | 195,827,928 |
| | | | | | | |
Multiline Retail 0.2% | | | | | | | |
Target Corp. | | United States | | 101,560 | | | 3,506,867 |
| | | | | | | |
Office Electronics 0.7% | | | | | | | |
Konica Minolta Holdings Ltd. | | Japan | | 1,733,800 | | | 13,479,244 |
| | | | | | | |
Oil, Gas & Consumable Fuels 8.9% | | | | | | | |
BP PLC | | United Kingdom | | 6,136,895 | | | 47,146,652 |
El Paso Corp. | | United States | | 2,309,384 | | | 18,082,477 |
Eni SpA | | Italy | | 863,977 | | | 20,223,578 |
Gazprom, ADR | | Russia | | 475,980 | | | 6,782,715 |
Royal Dutch Shell PLC, B | | United Kingdom | | 1,421,805 | | | 35,821,647 |
Total SA, B | | France | | 785,470 | | | 42,735,737 |
| | | | | | | |
| | | | | | | 170,792,806 |
| | | | | | | |
Paper & Forest Products 1.3% | | | | | | | |
International Paper Co. | | United States | | 176,843 | | | 2,086,747 |
Svenska Cellulosa AB, B | | Sweden | | 999,463 | | | 8,532,313 |
UPM-Kymmene OYJ | | Finland | | 1,087,262 | | | 13,682,867 |
| | | | | | | |
| | | | | | | 24,301,927 |
| | | | | | | |
Pharmaceuticals 11.7% | | | | | | | |
GlaxoSmithKline PLC | | United Kingdom | | 2,260,033 | | | 42,399,946 |
Merck & Co. Inc. | | United States | | 647,601 | | | 19,687,070 |
Merck KGaA | | Germany | | 234,690 | | | 21,173,337 |
Novartis AG | | Switzerland | | 762,074 | | | 37,607,735 |
Pfizer Inc. | | United States | | 3,182,513 | | | 56,362,305 |
Roche Holding AG | | Switzerland | | 38,100 | | | 5,797,594 |
Sanofi-Aventis | | France | | 640,537 | | | 40,663,096 |
| | | | | | | |
| | | | | | | 223,691,083 |
| | | | | | | |
Professional Services 0.8% | | | | | | | |
Adecco SA | | Switzerland | | 261,060 | | | 8,746,818 |
Randstad Holding NV | | Netherlands | | 339,150 | | | 6,900,097 |
| | | | | | | |
| | | | | | | 15,646,915 |
| | | | | | | |
TG-13
Franklin Templeton Variable Insurance Products Trust
Statement of Investments, December 31, 2008 (continued)
| | | | | | | | |
| Templeton Growth Securities Fund | | Country | | Shares | | Value |
Common Stocks (continued) | | | | | | | | |
Real Estate Management & Development 0.9% | | | | | | | | |
Cheung Kong (Holdings) Ltd. | | Hong Kong | | | 1,199,833 | | $ | 11,347,805 |
Swire Pacific Ltd., A | | Hong Kong | | | 857,546 | | | 5,903,084 |
| | | | | | | | |
| | | | | | | | 17,250,889 |
| | | | | | | | |
Semiconductors & Semiconductor Equipment 2.1% | | | | | | | | |
Samsung Electronics Co. Ltd. | | South Korea | | | 80,600 | | | 28,781,156 |
Taiwan Semiconductor Manufacturing Co. Ltd. | | Taiwan | | | 8,673,261 | | | 11,749,589 |
| | | | | | | | |
| | | | | | | | 40,530,745 |
| | | | | | | | |
Software 7.3% | | | | | | | | |
Microsoft Corp. | | United States | | | 3,141,819 | | | 61,076,961 |
bOracle Corp. | | United States | | | 3,491,900 | | | 61,911,387 |
SAP AG | | Germany | | | 448,750 | | | 15,715,416 |
| | | | | | | | |
| | | | | | | | 138,703,764 |
| | | | | | | | |
Specialty Retail 0.9% | | | | | | | | |
Kingfisher PLC | | United Kingdom | | | 8,525,765 | | | 16,810,613 |
| | | | | | | | |
Trading Companies & Distributors 0.2% | | | | | | | | |
Wolseley PLC | | United Kingdom | | | 641,644 | | | 3,598,668 |
| | | | | | | | |
Wireless Telecommunication Services 3.2% | | | | | | | | |
SK Telecom Co. Ltd. | | South Korea | | | 51,673 | | | 8,550,797 |
SK Telecom Co. Ltd., ADR | | South Korea | | | 108,491 | | | 1,972,366 |
bSprint Nextel Corp. | | United States | | | 2,792,710 | | | 5,110,659 |
Turkcell Iletisim Hizmetleri AS | | Turkey | | | 465,865 | | | 2,646,101 |
Turkcell Iletisim Hizmetleri AS, ADR | | Turkey | | | 246,000 | | | 3,586,680 |
Vodafone Group PLC | | United Kingdom | | | 19,128,624 | | | 38,834,254 |
| | | | | | | | |
| | | | | | | | 60,700,857 |
| | | | | | | | |
Total Common Stocks (Cost $2,652,365,043) | | | | | | | | 1,794,715,815 |
| | | | | | | | |
| | | |
| | | | | Principal
Amount | | |
Short Term Investments 3.1% | | | | | | | | |
U.S. Government and Agency Securities 3.1% | | | | | | | | |
cFHLB, 1/02/09 - 1/23/09 | | United States | | $ | 40,000,000 | | | 40,000,185 |
cFHLMC, 1/05/09 - 2/17/09 | | United States | | | 19,500,000 | | | 19,500,294 |
| | | | | | | | |
Total U.S. Government and Agency Securities (Cost $59,483,258) | | | | | | | | 59,500,479 |
| | | | | | | | |
Total Investments (Cost $2,711,848,301) 97.1% | | | | | | | | 1,854,216,294 |
Other Assets, less Liabilities 2.9% | | | | | | | | 55,917,932 |
| | | | | | | | |
Net Assets 100.0% | | | | | | | $ | 1,910,134,226 |
| | | | | | | | |
See Abbreviations on page TG-23.
aSecurity was purchased pursuant to Rule 144A under the Securities Act of 1933 and may be sold in transactions exempt from registration only to qualified institutional buyers or in a public offering registered under the Securities Act of 1933. This security has been deemed liquid under guidelines approved by the Trust’s Board of Trustees. At December 31, 2008, the value of this security was $2,030, representing less than 0.01% of net assets.
bNon-income producing for the twelve months ended December 31, 2008.
cThe security is traded on a discount basis with no stated coupon rate.
The accompanying notes are an integral part of these financial statements.
TG-14
Franklin Templeton Variable Insurance Products Trust
Financial Statements
Statement of Assets and Liabilities
December 31, 2008
| | | | |
| | | Templeton
Growth
Securities Fund | |
Assets: | | | | |
Investments in securities: | | | | |
Cost - Unaffiliated issuers | | $ | 2,711,848,301 | |
| | | | |
Value - Unaffiliated issuers | | $ | 1,854,216,294 | |
Cash | | | 47,849,554 | |
Receivables: | | | | |
Investment securities sold | | | 5,821,980 | |
Capital shares sold | | | 529,801 | |
Dividends | | | 4,395,918 | |
| | | | |
Total assets | | | 1,912,813,547 | |
| | | | |
Liabilities: | | | | |
Payables: | | | | |
Capital shares redeemed | | | 394,065 | |
Affiliates | | | 1,795,596 | |
Custodian fees | | | 134,424 | |
Reports to shareholders | | | 280,253 | |
Accrued expenses and other liabilities | | | 74,983 | |
| | | | |
Total liabilities | | | 2,679,321 | |
| | | | |
Net assets, at value | | $ | 1,910,134,226 | |
| | | | |
Net assets consist of: | | | | |
Paid-in capital | | $ | 2,867,586,636 | |
Undistributed net investment income | | | 66,917,204 | |
Net unrealized appreciation (depreciation) | | | (857,689,536 | ) |
Accumulated net realized gain (loss) | | | (166,680,078 | ) |
| | | | |
Net assets, at value | | $ | 1,910,134,226 | |
| | | | |
Class 1: | | | | |
Net assets, at value | | $ | 371,699,674 | |
| | | | |
Shares outstanding | | | 44,589,618 | |
| | | | |
Net asset value and maximum offering price per share | | $ | 8.34 | |
| | | | |
Class 2: | | | | |
Net assets, at value | | $ | 1,513,557,240 | |
| | | | |
Shares outstanding | | | 184,544,831 | |
| | | | |
Net asset value and maximum offering price per share | | $ | 8.20 | |
| | | | |
Class 4: | | | | |
Net assets, at value | | $ | 24,877,312 | |
| | | | |
Shares outstanding | | | 2,993,116 | |
| | | | |
Net asset value and maximum offering price per share | | $ | 8.31 | |
| | | | |
The accompanying notes are an integral part of these financial statements.
TG-15
Franklin Templeton Variable Insurance Products Trust
Financial Statements (continued)
Statement of Operations
for the year ended December 31, 2008
| | | | |
| | | Templeton
Growth
Securities Fund | |
Investment income: | | | | |
Dividends (net of foreign taxes of $8,231,165) | | $ | 91,626,287 | |
Interest (net of foreign taxes of $52) | | | 2,308,509 | |
| | | | |
Total investment income | | | 93,934,796 | |
| | | | |
Expenses: | | | | |
Management fees (Note 3a) | | | 20,380,903 | |
Distribution fees: (Note 3c) | | | | |
Class 2 | | | 5,869,971 | |
Class 4 | | | 29,380 | |
Unaffiliated transfer agent fees | | | 2,736 | |
Custodian fees (Note 4) | | | 380,599 | |
Reports to shareholders | | | 378,034 | |
Professional fees | | | 70,874 | |
Trustees’ fees and expenses | | | 14,779 | |
Other | | | 94,086 | |
| | | | |
Total expenses | | | 27,221,362 | |
Expense reductions (Note 4) | | | (3,452 | ) |
| | | | |
Net expenses | | | 27,217,910 | |
| | | | |
Net investment income | | | 66,716,886 | |
| | | | |
Realized and unrealized gains (losses): | | | | |
Net realized gain (loss) from: | | | | |
Investments | | | (164,798,982 | ) |
Foreign currency transactions | | | 16,654 | |
| | | | |
Net realized gain (loss) | | | (164,782,328 | ) |
| | | | |
Net change in unrealized appreciation (depreciation) on: | | | | |
Investments | | | (1,357,934,332 | ) |
Translation of other assets and liabilities denominated in foreign currencies | | | (70,178 | ) |
| | | | |
Net change in unrealized appreciation (depreciation) | | | (1,358,004,510 | ) |
| | | | |
Net realized and unrealized gain (loss) | | | (1,522,786,838 | ) |
| | | | |
Net increase (decrease) in net assets resulting from operations | | $ | (1,456,069,952 | ) |
| | | | |
The accompanying notes are an integral part of these financial statements.
TG-16
Franklin Templeton Variable Insurance Products Trust
Financial Statements (continued)
Statements of Changes in Net Assets
| | | | | | | | |
| | | Templeton Growth
Securities Fund | |
| | | Year Ended December 31, | |
| | | 2008 | | | 2007 | |
| | | | |
Increase (decrease) in net assets: | | | | | | | | |
Operations: | | | | | | | | |
Net investment income | | $ | 66,716,886 | | | $ | 50,480,325 | |
Net realized gain (loss) from investments and foreign currency transactions | | | (164,782,328 | ) | | | 193,275,854 | |
Net change in unrealized appreciation (depreciation) on investments and translation of other assets and liabilities denominated in foreign currencies | | | (1,358,004,510 | ) | | | (172,736,594 | ) |
| | | | |
Net increase (decrease) in net assets resulting from operations | | | (1,456,069,952 | ) | | | 71,019,585 | |
| | | | |
Distributions to shareholders from: | | | | | | | | |
Net investment income: | | | | | | | | |
Class 1 | | | (7,929,338 | ) | | | (5,889,701 | ) |
Class 2 | | | (42,575,426 | ) | | | (42,446,708 | ) |
Class 4 | | | (69,174 | ) | | | — | |
Net realized gains: | | | | | | | | |
Class 1 | | | (26,359,362 | ) | | | (16,577,798 | ) |
Class 2 | | | (167,773,428 | ) | | | (135,434,521 | ) |
Class 4 | | | (229,952 | ) | | | — | |
| | | | |
Total distributions to shareholders | | | (244,936,680 | ) | | | (200,348,728 | ) |
| | | | |
Capital share transactions: (Note 2) | | | | | | | | |
Class 1 | | | 216,063,635 | | | | 4,489,795 | |
Class 2 | | | (225,196,478 | ) | | | 477,890,822 | |
Class 4 | | | 31,532,804 | | | | — | |
| | | | |
Total capital share transactions | | | 22,399,961 | | | | 482,380,617 | |
| | | | |
Net increase (decrease) in net assets | | | (1,678,606,671 | ) | | | 353,051,474 | |
Net assets: | | | | | | | | |
Beginning of year | | | 3,588,740,897 | | | | 3,235,689,423 | |
| | | | |
End of year | | $ | 1,910,134,226 | | | $ | 3,588,740,897 | |
| | | | |
Undistributed net investment income included in net assets: | | | | | | | | |
End of year | | $ | 66,917,204 | | | $ | 50,572,388 | |
| | | | |
The accompanying notes are an integral part of these financial statements.
TG-17
Franklin Templeton Variable Insurance Products Trust
Notes to Financial Statements
Templeton Growth Securities Fund
1. ORGANIZATION AND SIGNIFICANT ACCOUNTING POLICIES
Franklin Templeton Variable Insurance Products Trust (Trust) is registered under the Investment Company Act of 1940, as amended, (1940 Act) as an open-end investment company, consisting of twenty-three separate funds. The Templeton Growth Securities Fund (Fund) is included in this report. The financial statements of the remaining funds in the Trust are presented separately. Shares of the Fund are sold only to insurance company separate accounts to fund the benefits of variable life insurance policies or variable annuity contracts. The Fund offers three classes of shares: Class 1, Class 2 and Class 4. Effective February 29, 2008, the Fund began offering a new class of shares, Class 4. Each class of shares differs by its distribution fees, voting rights on matters affecting a single class and its exchange privilege.
The following summarizes the Fund’s significant accounting policies.
a. Security Valuation
Securities listed on a securities exchange or on the NASDAQ National Market System are valued at the last quoted sale price or the official closing price of the day, respectively. Over-the-counter securities and listed securities for which there is no reported sale are valued within the range of the most recent quoted bid and ask prices. Securities that trade in multiple markets or on multiple exchanges are valued according to the broadest and most representative market.
Government securities generally trade in the over-the-counter market rather than on a securities exchange. The Trust may utilize independent pricing services, quotations from bond dealers, and information with respect to bond and note transactions, to assist in determining a current market value for each security. The Trust’s pricing services may use valuation models or matrix pricing which considers information with respect to comparable bond and note transactions, quotations from bond dealers, or by reference to other securities that are considered comparable in such characteristics as rating, interest rate and maturity date, option adjusted spread models, prepayment projections, interest rate spreads and yield curves, to determine current value.
Foreign securities are valued as of the close of trading on the foreign stock exchange on which the security is primarily traded, or the NYSE, whichever is earlier. If no sale is reported at that time, the foreign security will be valued within the range of the most recent quoted bid and ask prices. The value is then converted into its U.S. dollar equivalent at the foreign exchange rate in effect at the close of the NYSE on the day that the value of the foreign security is determined.
The Trust has procedures to determine the fair value of individual securities and other assets for which market prices are not readily available or which may not be reliably priced. Methods for valuing these securities may include: fundamental analysis, matrix pricing, discounts from market prices of similar securities, or discounts applied due to the nature and duration of restrictions on the disposition of the securities. Due to the inherent uncertainty of valuations of such securities, the fair values may differ significantly from the values that would have been used had a ready market for such investments existed. Occasionally, events occur between the time at which trading in a security is completed and the close of the NYSE that might call into question the availability (including the reliability) of the value of a portfolio security held by the Fund. The investment manager monitors price movements following the close of trading in foreign stock markets through a series of country specific market proxies (such as baskets of American Depository Receipts, futures contracts and exchange traded funds). These price movements are measured against established trigger thresholds for each specific market proxy to assist in determining if an event has occurred. If such an event occurs, the securities may be valued using fair value procedures, which may include the use of independent pricing services. At December 31, 2008, a portion of the securities held by the Fund were fair valued. All security valuation procedures are approved by the Trust’s Board of Trustees.
b. Foreign Currency Translation
Portfolio securities and other assets and liabilities denominated in foreign currencies are translated into U.S. dollars based on the exchange rate of such currencies against U.S. dollars on the date of valuation. Purchases and sales of securities, income and expense items denominated in foreign currencies are translated into U.S. dollars at the exchange rate in effect on the transaction date. Occasionally, events may impact the availability or reliability of foreign exchange rates used to convert the U.S. dollar
TG-18
Franklin Templeton Variable Insurance Products Trust
Notes to Financial Statements (continued)
Templeton Growth Securities Fund
1. ORGANIZATION AND SIGNIFICANT ACCOUNTING POLICIES (continued)
b. Foreign Currency Translation (continued)
equivalent value. If such an event occurs, the foreign exchange rate will be valued at fair value using procedures established and approved by the Trust’s Board of Trustees.
The Fund does not separately report the effect of changes in foreign exchange rates from changes in market prices on securities held. Such changes are included in net realized and unrealized gain or loss from investments on the Statement of Operations.
Realized foreign exchange gains or losses arise from sales of foreign currencies, currency gains or losses realized between the trade and settlement dates on securities transactions and the difference between the recorded amounts of dividends, interest, and foreign withholding taxes and the U.S. dollar equivalent of the amounts actually received or paid. Net unrealized foreign exchange gains and losses arise from changes in foreign exchange rates on foreign denominated assets and liabilities other than investments in securities held at the end of the reporting period.
c. Foreign Currency Contracts
When the Fund purchases or sells foreign securities it may enter into foreign exchange contracts to minimize foreign exchange risk from the trade date to the settlement date of the transactions. A foreign exchange contract is an agreement between two parties to exchange different currencies at an agreed upon exchange rate at a future date. Realized and unrealized gains and losses on these contracts are included in the Statement of Operations.
The risks of these contracts include movement in the values of the foreign currencies relative to the U.S. dollar and the possible inability of the counterparties to fulfill their obligations under the contracts, which may be in excess of the amount reflected in the Statement of Assets and Liabilities.
d. Income Taxes
No provision has been made for U.S. income taxes because it is the Fund’s policy to qualify as a regulated investment company under the Internal Revenue Code and to distribute to shareholders substantially all of its taxable income and net realized gains.
Foreign securities held by the Fund may be subject to foreign taxation on dividend and interest income received. Foreign taxes, if any, are recorded based on the tax regulations and rates that exist in the foreign markets in which the Fund invests.
The Fund has reviewed the tax positions, taken on federal income tax returns, for each of the three open tax years and as of December 31, 2008, and has determined that no provision for income tax is required in the Fund’s financial statements.
e. Security Transactions, Investment Income, Expenses and Distributions
Security transactions are accounted for on trade date. Realized gains and losses on security transactions are determined on a specific identification basis. Interest income and estimated expenses are accrued daily. Amortization of premium and accretion of discount on debt securities are included in interest income. Dividend income is recorded on the ex-dividend date except that certain dividends from foreign securities are recognized as soon as the Fund is notified of the ex-dividend date. Distributions to shareholders are recorded on the ex-dividend date and are determined according to income tax regulations (tax basis). Distributable earnings determined on a tax basis may differ from earnings recorded in accordance with accounting principles generally accepted in the United States of America. These differences may be permanent or temporary. Permanent differences are reclassified among capital accounts to reflect their tax character. These reclassifications have no impact on net assets or the results of operations. Temporary differences are not reclassified, as they may reverse in subsequent periods.
TG-19
Franklin Templeton Variable Insurance Products Trust
Notes to Financial Statements (continued)
Templeton Growth Securities Fund
1. ORGANIZATION AND SIGNIFICANT ACCOUNTING POLICIES (continued)
e. Security Transactions, Investment Income, Expenses and Distributions (continued)
Common expenses incurred by the Trust are allocated among the funds based on the ratio of net assets of each fund to the combined net assets of the Trust. Fund specific expenses are charged directly to the fund that incurred the expense.
Realized and unrealized gains and losses and net investment income, not including class specific expenses, are allocated daily to each class of shares based upon the relative proportion of net assets of each class. Differences in per share distributions, by class, are generally due to differences in class specific expenses.
f. Accounting Estimates
The preparation of financial statements in accordance with accounting principles generally accepted in the United States of America requires management to make estimates and assumptions that affect the reported amounts of assets and liabilities at the date of the financial statements and the amounts of income and expenses during the reporting period. Actual results could differ from those estimates.
g. Guarantees and Indemnifications
Under the Trust’s organizational documents, its officers and trustees are indemnified by the Trust against certain liabilities arising out of the performance of their duties to the Trust. Additionally, in the normal course of business, the Trust, on behalf of the Fund, enters into contracts with service providers that contain general indemnification clauses. The Trust’s maximum exposure under these arrangements is unknown as this would involve future claims that may be made against the Trust that have not yet occurred. Currently, the Trust expects the risk of loss to be remote.
2. SHARES OF BENEFICIAL INTEREST
At December 31, 2008, there were an unlimited number of shares authorized (without par value). Transactions in the Fund’s shares were as follows:
| | | | | | | | | | | | | | |
| | | Year Ended December 31, | |
| | | 2008a | | | 2007 | |
| Class 1 Shares: | | Shares | | | Amount | | | Shares | | | Amount | |
Shares sold | | 22,693,927 | | | $ | 256,698,452 | | | 3,270,092 | | | $ | 52,030,675 | |
Shares issued in reinvestment of distributions | | 2,666,306 | | | | 34,288,699 | | | 1,362,492 | | | | 22,467,499 | |
Shares redeemed | | (6,697,989 | ) | | | (74,923,516 | ) | | (4,322,603 | ) | | | (70,008,379 | ) |
| | | | |
Net increase (decrease) | | 18,662,244 | | | $ | 216,063,635 | | | 309,981 | | | $ | 4,489,795 | |
| | | | |
| Class 2 Shares: | | | | | | | | | | | | |
Shares sold | | 11,250,052 | | | $ | 134,476,026 | | | 40,286,926 | | | $ | 647,823,344 | |
Shares issued in reinvestment of distributions | | 16,568,591 | | | | 209,924,044 | | | 10,921,155 | | | | 177,577,983 | |
Shares redeemed | | (49,397,331 | ) | | | (569,596,548 | ) | | (22,199,545 | ) | | | (347,510,505 | ) |
| | | | |
Net increase (decrease) | | (21,578,688 | ) | | $ | (225,196,478 | ) | | 29,008,536 | | | $ | 477,890,822 | |
| | | | |
| Class 4 Shares: | | | | | | | | | | | | |
Shares sold | | 2,983,902 | | | $ | 31,388,775 | | | | | | | | |
Shares issued on reinvestment of distributions | | 23,247 | | | | 298,725 | | | | | | | | |
Shares redeemed | | (14,033 | ) | | | (154,696 | ) | | | | | | | |
| | | | | | | | | | |
Net increase (decrease) | | 2,993,116 | | | $ | 31,532,804 | | | | | | | | |
| | | | | | | | | | |
aFor | the period February 29, 2008 (effective date) to December 31, 2008 for Class 4. |
TG-20
Franklin Templeton Variable Insurance Products Trust
Notes to Financial Statements (continued)
Templeton Growth Securities Fund
3. TRANSACTIONS WITH AFFILIATES
Franklin Resources, Inc. is the holding company for various subsidiaries that together are referred to as Franklin Templeton Investments. Certain officers and trustees of the Trust are also officers and/or directors of the following subsidiaries:
| | |
| Subsidiary | | Affiliation |
Templeton Global Advisors Limited (TGAL) | | Investment manager |
Templeton Asset Management Ltd. (TAML) | | Investment manager |
Franklin Templeton Services, LLC (FT Services) | | Administrative manager |
Franklin Templeton Distributors, Inc. (Distributors) | | Principal underwriter |
Franklin Templeton Investor Services, LLC (Investor Services) | | Transfer agent |
a. Management Fees
The Fund pays an investment management fee to TGAL based on the average daily net assets of the Fund as follows:
| | |
| Annualized Fee Rate | | Net Assets |
| 1.000% | | Up to and including $100 million |
| 0.900% | | Over $100 million, up to and including $250 million |
| 0.800% | | Over $250 million, up to and including $500 million |
| 0.750% | | Over $500 million, up to and including $1 billion |
| 0.700% | | Over $1 billion, up to and including $5 billion |
| 0.675% | | Over $5 billion, up to and including $10 billion |
| 0.655% | | Over $10 billion, up to and including $15 billion |
| 0.635% | | Over $15 billion, up to and including $20 billion |
| 0.615% | | In excess of $20 billion |
Under a subadvisory agreement, TAML, an affiliate of TGAL, provides subadvisory services to the Fund and receives from TGAL fees based on the average daily net assets of the Fund.
b. Administrative Fees
Under an agreement with TGAL, FT Services provides administrative services to the Fund. The fee is paid by TGAL based on average daily net assets, and is not an additional expense of the Fund.
c. Distribution Fees
The Fund’s Board of Trustees has adopted distribution plans for Class 2 and Class 4 shares pursuant to Rule 12b-1 under the 1940 Act. Under the Fund’s compensation distribution plans, the Fund pays Distributors for costs incurred in connection with the servicing, sale and distribution of the Fund’s shares up to 0.35% per year of its average daily net assets of each class. The Board of Trustees has agreed to limit the current rate to 0.25% per year for Class 2.
d. Transfer Agent Fees
Investor Services, under terms of an agreement, performs shareholder servicing for the Fund and is not paid by the Fund for the services.
4. EXPENSE OFFSET ARRANGEMENT
The Fund has entered into an arrangement with its custodian whereby credits realized as a result of uninvested cash balances are used to reduce a portion of the Fund’s custodian expenses. During the year ended December 31, 2008, the custodian fees were reduced as noted in the Statement of Operations.
TG-21
Franklin Templeton Variable Insurance Products Trust
Notes to Financial Statements (continued)
Templeton Growth Securities Fund
5. INCOME TAXES
For tax purposes, capital losses may be carried over to offset future capital gains, if any. At December 31, 2008, the Fund had tax basis capital losses of $103,405,910 expiring in 2016.
For tax purposes, realized capital losses and realized currency losses occurring subsequent to October 31, may be deferred and treated as occurring on the first day of the following fiscal year. At December 31, 2008, the Fund deferred realized capital losses and realized currency losses of $63,077,397 and $196,772, respectively.
The tax character of distributions paid during the years ended December 31, 2008 and 2007, was as follows:
| | | | | | |
| | | 2008 | | 2007 |
Distributions paid from: | | | | | | |
Ordinary Income | | $ | 58,650,253 | | $ | 60,581,663 |
Long term capital gain | | | 186,286,427 | | | 139,767,065 |
| | | |
| | $ | 244,936,680 | | $ | 200,348,728 |
| | | |
At December 31, 2008, the cost of investments, net unrealized appreciation (depreciation) and undistributed ordinary income for income tax purposes were as follows:
| | | | |
Cost of investments | | $ | 2,711,848,301 | |
| | | | |
| |
Unrealized appreciation | | $ | 60,366,692 | |
Unrealized depreciation | | | (917,998,699 | ) |
| | | | |
Net unrealized appreciation (depreciation) | | $ | (857,632,007 | ) |
| | | | |
Distributable earnings – undistributed ordinary income | | $ | 66,906,227 | |
| | | | |
Net investment income and net realized gains (losses) differs for financial statement and tax purposes primarily due to differing treatments of foreign currency transactions.
6. INVESTMENT TRANSACTIONS
Purchases and sales of investments (excluding short term securities) for the year ended December 31, 2008, aggregated $490,709,864 and $545,996,936, respectively.
7. CONCENTRATION OF RISK
Investing in foreign securities may include certain risks and considerations not typically associated with investing in U.S. securities, such as fluctuating currency values and changing local and regional economic, political and social conditions, which may result in greater market volatility. In addition, certain foreign securities may not be as liquid as U.S. securities.
8. FAIR VALUE MEASUREMENTS
The Fund adopted Financial Accounting Standards Board (FASB) Statement No. 157, “Fair Value Measurement” (SFAS 157), on January 1, 2008. SFAS 157 defines fair value, establishes a framework for measuring fair value, and expands disclosures about fair value measurements. The Fund has determined that the implementation of SFAS 157 did not have a material impact on the Fund’s financial statements.
TG-22
Franklin Templeton Variable Insurance Products Trust
Notes to Financial Statements (continued)
Templeton Growth Securities Fund
8. FAIR VALUE MEASUREMENTS (continued)
SFAS 157 establishes a fair value hierarchy that distinguishes between market data obtained from independent sources (observable inputs) and the Fund’s own market assumptions (unobservable inputs). These inputs are used in determining the value of the Fund’s investments and are summarized in the following fair value hierarchy:
| | • | | Level 1 – quoted prices in active markets for identical securities |
| | • | | Level 2 – other significant observable inputs (including quoted prices for similar securities, interest rates, prepayment speed, credit risk, etc.) |
| | • | | Level 3 – significant unobservable inputs (including the Fund’s own assumptions in determining the fair value of investments) |
The inputs or methodology used for valuing securities are not an indication of the risk associated with investing in those securities.
The following is a summary of the inputs used as of December 31, 2008, in valuing the Fund’s assets carried at fair value:
| | | | | | | | | | | | |
| | | Level 1 | | Level 2 | | Level 3 | | Total |
Assets: | | | | | | | | | | | | |
Investments in Securities | | $ | 1,733,876,324 | | $ | 120,339,970 | | $ | — | | $ | 1,854,216,294 |
9. NEW ACCOUNTING PRONOUNCEMENT
In March 2008, the FASB issued FASB Statement No. 161, “Disclosures about Derivative Instruments and Hedging Activities, an amendment of FASB Statement No. 133” (SFAS 161), which expands disclosures about derivative investments and hedging activities. SFAS 161 is effective for fiscal years and interim periods beginning after November 15, 2008. The Fund is currently evaluating the impact, if any, of applying the various provisions of SFAS 161.
10. SUBSEQUENT EVENT
On January 23, 2009, the Fund entered into, along with other funds managed by Franklin Templeton Investments (individually, “Borrower”; collectively “Borrowers”), a $725 million senior unsecured syndicated global line of credit (“Global Credit Facility”) to provide a source of funds to the Borrowers for temporary and emergency purposes and to meet future unanticipated or unusually large redemption requests.
Under the terms of the Global Credit Facility, each Borrower has agreed to pay its proportionate share of fees and expenses incurred in connection with the implementation and maintenance of the Global Credit Facility.
ABBREVIATIONS
Selected Portfolio
ADR - American Depository Receipt
FHLB - Federal Home Loan Bank
FHLMC - Federal Home Loan Mortgage Corp.
TG-23
Franklin Templeton Variable Insurance Products Trust
Templeton Growth Securities Fund
Report of Independent Registered Public Accounting Firm
To the Board of Trustees and Shareholders of
Franklin Templeton Variable Insurance Products Trust
In our opinion, the accompanying statement of assets and liabilities, including the statement of investments, and the related statements of operations and of changes in net assets and the financial highlights present fairly, in all material respects, the financial position of Templeton Growth Securities Fund (one of the funds constituting the Franklin Templeton Variable Insurance Products Trust, hereafter referred to as the “Fund”) at December 31, 2008, the results of its operations for the year then ended, the changes in its net assets for each of the two years in the period then ended and the financial highlights for the periods presented, in conformity with accounting principles generally accepted in the United States of America. These financial statements and financial highlights (hereafter referred to as “financial statements”) are the responsibility of the Fund’s management. Our responsibility is to express an opinion on these financial statements based on our audits. We conducted our audits of these financial statements in accordance with the standards of the Public Company Accounting Oversight Board (United States). Those standards require that we plan and perform the audit to obtain reasonable assurance about whether the financial statements are free of material misstatement. An audit includes examining, on a test basis, evidence supporting the amounts and disclosures in the financial statements, assessing the accounting principles used and significant estimates made by management, and evaluating the overall financial statement presentation. We believe that our audits, which included confirmation of securities at December 31, 2008 by correspondence with the custodian and brokers, provide a reasonable basis for our opinion.
PricewaterhouseCoopers LLP
San Francisco, California
February 10, 2009
TG-24
Franklin Templeton Variable Insurance Products Trust
Tax Designation (unaudited)
Templeton Growth Securities Fund
Under Section 852(b)(3)(C) of the Internal Revenue Code (Code), the Fund designates the maximum amount allowable but no less than $186,286,427 as a long term capital gain dividend for the fiscal year ended December 31, 2008.
Under Section 854(b)(2) of the Code, the Fund designates 28.81% of the ordinary income dividends as income qualifying for the dividends received deduction for the fiscal year ended December 31, 2008.
At December 31, 2008, more than 50% of the Fund’s total assets were invested in securities of foreign issuers. In most instances, foreign taxes were withheld from income paid to the Fund on these investments. The Fund elects to treat foreign taxes paid as allowed under Section 853 of the Code. This election will allow shareholders of record as of the 2009 distribution date, to treat their proportionate share of foreign taxes paid by the Fund as having been paid directly by them. The shareholder shall consider these amounts as foreign taxes paid in the tax year in which they receive the Fund distribution.
TG-25
INDEX DESCRIPTIONS
The indexes are unmanaged and include reinvested distributions.
Barclays Capital (BC) U.S. Aggregate Index represents securities that are SEC-registered, taxable and dollar denominated. The index covers the U.S. investment grade fixed-rate bond market, with index components for government and corporate securities, mortgage pass-through securities and asset-backed securities. All issues included must have at least one year to final maturity and must be rated investment grade (Baa3 or better) by Moody’s Investors Service. They must also be dollar denominated and nonconvertible. Total return includes price appreciation/depreciation and income as a percentage of the original investment. The index is rebalanced monthly by market capitalization.
Barclays Capital (BC) U.S. Government: Intermediate Index is the intermediate component of the BC U.S. Government Index. The index includes securities issued by the U.S. government or agency. These include obligations of the U.S. Treasury with remaining maturity of one year or more and publicly issued debt of U.S. governmental agencies, quasi-federal corporations, and corporate or foreign debt guaranteed by the U.S. government.
Bloomberg World Communications Index is a market capitalization-weighted index designed to measure equity performance of the communications sector of the Bloomberg World Index.
Consumer Price Index (CPI), calculated by the U.S. Bureau of Labor Statistics, is a commonly used measure of the inflation rate.
Credit Suisse (CS) High Yield Index is designed to mirror the investible universe of the U.S. dollar-denominated high yield debt market.
Dow Jones Industrial Average (the Dow) is price weighted based on the average market price of 30 blue chip stocks of companies that are generally industry leaders.
J.P. Morgan (JPM) Government Bond Index (GBI) Global tracks total returns for liquid, fixed-rate, domestic government bonds with maturities greater than one year issued by developed countries globally.
Lipper Multi-Sector Income Funds Classification Average is an equally weighted average calculation of performance figures for all funds within the Lipper Multi-Sector Income Funds classification in the Lipper Open-End underlying funds universe. Lipper Multi-Sector Income Funds are defined as funds that seek current income by allocating assets among different fixed income securities sectors (not primarily in one sector except for defensive purposes), including U.S. and foreign governments, with a significant portion rated below investment grade. For the 12-month period ended 12/31/08, there were 151 funds in this category. Lipper calculations do not include contract fees, expenses or sales charges, and may have been different if such charges had been considered.
Lipper VIP Equity Income Funds Classification Average is an equally weighted average calculation of performance figures for all funds within the Lipper Equity Income Funds classification in the Lipper VIP underlying funds universe. Lipper Equity Income Funds seek relatively high current income and growth of income through investing 65% or more of their portfolios in equities. For the 12-month period ended 12/31/08, there were 69 funds in this category. Lipper calculations do not include contract fees, expenses or sales charges, and may have been different if such charges had been considered.
Lipper VIP General Bond Funds Classification Average is an equally weighted average calculation of performance figures for all funds within the Lipper General Bond Funds classification in the Lipper VIP underlying funds universe. Lipper General Bond Funds do not have any quality or maturity restrictions, and tend to keep a bulk of assets in corporate and government debt issues. For the 12-month period ended 12/31/08, there were 59 funds in this category. Lipper calculations do not include contract fees, expenses or sales charges, and may have been different if such charges had been considered.
Lipper VIP General U.S. Government Funds Classification Average is an equally weighted average calculation of performance figures for all funds within the Lipper U.S. Government Funds classification in the Lipper VIP underlying funds universe. Lipper U.S. Government Funds invest primarily in U.S. government and agency issues. For the 12-month period ended 12/31/08, there were 68 funds in this category. Lipper calculations do not include contract fees, expenses or sales charges, and may have been different if such charges had been considered.
Lipper VIP High Current Yield Funds Classification Average is an equally weighted average calculation of performance figures for all funds within the Lipper High Current Yield Funds in the Lipper VIP underlying funds universe. Lipper High Current Yield Funds aim at high (relative) current yield from fixed income securities, have no quality or maturity restrictions, and tend to invest in lower grade debt issues. For the 12-month period ended 12/31/08, there were 103 funds in this category. Lipper calculations do not include contract fees, expenses or sales charges, and may have been different if such charges had been considered.
I-1
Merrill Lynch (ML) 2- and 5-Year Zero Coupon Bond Indexes include zero coupon bonds that pay no interest and are issued at a discount from redemption price.
Morgan Stanley Capital International (MSCI) All Country (AC) World Index is a free float-adjusted, market capitalization-weighted index designed to measure equity market performance in global developed and emerging markets.
Morgan Stanley Capital International (MSCI) Emerging Markets (EM) Index is a free float-adjusted, market capitalization-weighted index designed to measure equity market performance in global emerging markets.
Morgan Stanley Capital International (MSCI) Europe, Australasia, Far East (EAFE) Index is a free float-adjusted, market capitalization-weighted index designed to measure equity market performance in global developed markets excluding the U.S. and Canada.
Morgan Stanley Capital International (MSCI) World Index is a free float-adjusted, market capitalization-weighted index designed to measure equity market performance in global developed markets.
NASDAQ Composite Index measures all NASDAQ domestic and international based common type stocks listed on The NASDAQ Stock Market. The index is market value weighted and includes more than 3,000 companies.
Russell 1000® Growth Index is market capitalization weighted and measures performance of those Russell 1000 Index companies with higher price-to-book ratios and higher forecasted growth values.
Russell 1000 Index is market capitalization weighted and measures performance of the 1,000 largest companies in the Russell 3000 Index, which represent approximately 92% of total market capitalization of the Russell 3000 Index.
Russell 1000 Value Index is market capitalization weighted and measures performance of those Russell 1000 Index companies with lower price-to-book ratios and lower forecasted growth values.
Russell 2500™ Index is market capitalization weighted and measures performance of the 2,500 smallest companies in the Russell 3000 Index, which represent approximately 17% of total market capitalization of the Russell 3000 Index.
Russell 2500 Value Index is market capitalization weighted and measures performance of those Russell 2500 Index companies with lower price-to-book ratios and lower forecasted growth values.
Russell 3000® Growth Index is market capitalization weighted and measures performance of those Russell 3000 Index companies with higher price-to-book ratios and higher forecasted growth values.
Russell 3000 Index is market capitalization weighted and measures performance of the 3,000 largest U.S. companies based on total market capitalization, which represent approximately 98% of the investible U.S. equity market.
Russell Midcap® Growth Index is market capitalization weighted and measures performance of those Russell Midcap Index companies with higher price-to-book ratios and higher forecasted growth values.
Russell Midcap Index is market capitalization weighted and measures performance of the 800 smallest companies in the Russell 1000 Index, which represent approximately 26% of total market capitalization of the Russell 1000 Index.
Standard & Poor’s 500 Index (S&P 500) consists of 500 stocks chosen for market size, liquidity and industry group representation. Each stock’s weight in the index is proportionate to its market value. The S&P 500 is one of the most widely used benchmarks of U.S. equity performance.
Standard & Poor’s/Citigroup BMI Global REIT Index is designed to measure performance of the investible universe of publicly traded real estate investment trusts. Index constituents generally derive more than 60% of revenue from real estate development, management, rental, and/or direct investment in physical property and with local REIT or property trust tax status.
Standard & Poor’s/International Finance Corporation Investable (S&P/IFCI) Composite Index is a free float-adjusted, market capitalization-weighted index designed to measure equity performance in global emerging markets.
I-2
Board Members and Officers
The name, year of birth and address of the officers and board members, as well as their affiliations, positions held with the Trust, principal occupation during the past five years and number of portfolios overseen in the Franklin Templeton Investments fund complex are shown below. Generally, each board member serves until that person’s successor is elected and qualified.
Independent Board Members
| | | | | | | | |
| Name, Year of Birth and Address | | Position | | Length of
Time Served | | Number of
Portfolios in Fund
Complex Overseen
by Board Member* | | Other Directorships Held |
HARRIS J. ASHTON (1932) One Franklin Parkway San Mateo, CA 94403-1906 | | Trustee | | Since 1988 | | 138 | | Bar-S Foods (meat packing company). |
|
Principal Occupation During Past 5 Years: Director of various companies; and formerly, Director, RBC Holdings, Inc. (bank holding company) (until 2002); and President, Chief Executive Officer and Chairman of the Board, General Host Corporation (nursery and craft centers) (until 1998). |
ROBERT F. CARLSON (1928) One Franklin Parkway San Mateo, CA 94403-1906 | | Trustee | | Since 1998 | | 115 | | None |
|
Principal Occupation During Past 5 Years: Retired; and formerly, Vice President, senior member and President, Board of Administration, California Public Employees Retirement Systems (CALPERS) (1971-2008); member and Chairman of the Board, Sutter Community Hospitals; member, Corporate Board, Blue Shield of California; and Chief Counsel, California Department of Transportation. |
SAM GINN (1937) One Franklin Parkway San Mateo, CA 94403-1906 | | Trustee | | Since 2007 | | 115 | | Chevron Corporation (global energy company) and ICO Global Communications (Holdings) Limited (satellite company). |
|
Principal Occupation During Past 5 Years: Private investor; and formerly, Chairman of the Board, Vodafone AirTouch, PLC (wireless company); Chairman of the Board and Chief Executive Officer, AirTouch Communications (cellular communications) (1993-1998) and Pacific Telesis Groups (telephone holding company) (1988-1994). |
EDITH E. HOLIDAY (1952) One Franklin Parkway San Mateo, CA 94403-1906 | | Trustee | | Since 2005 | | 138 | | Hess Corporation (exploration and refining of oil and gas), H.J. Heinz Company (processed foods and allied products), RTI International Metals, Inc. (manufacture and distribution of titanium), Canadian National Railway (railroad) and White Mountains Insurance Group, Ltd. (holding company). |
|
Principal Occupation During Past 5 Years: Director or Trustee of various companies and trusts; and formerly, Assistant to the President of the United States and Secretary of the Cabinet (1990-1993); General Counsel to the United States Treasury Department (1989-1990); and Counselor to the Secretary and Assistant Secretary for Public Affairs and Public Liaison-United States Treasury Department (1988-1989). |
FRANK W.T. LAHAYE (1929) One Franklin Parkway San Mateo, CA 94403-1906 | | Trustee | | Since 1988 | | 115 | | Center for Creative Land Recycling (brownfield redevelopment). |
|
Principal Occupation During Past 5 Years: General Partner, Las Olas L.P. (Asset Management); and formerly, Chairman, Peregrine Venture Management Company (venture capital). |
BOD-1
| | | | | | | | |
| Name, Year of Birth and Address | | Position | | Length of
Time Served | | Number of
Portfolios in Fund
Complex Overseen
by Board Member* | | Other Directorships Held |
FRANK A. OLSON (1932) One Franklin Parkway
San Mateo, CA 94403-1906 | | Trustee | | Since 2005 | | 138 | | Hess Corporation (exploration and refining of oil and gas) and Sentient Jet (private jet service). |
|
Principal Occupation During Past 5 Years: Chairman Emeritus, The Hertz Corporation (car rental) (since 2000) (Chairman of the Board (1980-2000) and Chief Executive Officer (1977-1999)); and formerly, Chairman of the Board, President and Chief Executive Officer, UAL Corporation (airlines). |
LARRY D. THOMPSON (1945) One Franklin Parkway San Mateo, CA 94403-1906 | | Trustee | | Since 2007 | | 145 | | None |
|
Principal Occupation During Past 5 Years: Senior Vice President—Government Affairs, General Counsel and Secretary, PepsiCo, Inc. (consumer products); and formerly, Director, Delta Airlines (aviation) (2003-2005) and Providian Financial Corp. (credit card provider) (1997-2001); Senior Fellow of The Brookings Institution (2003-2004); Visiting Professor, University of Georgia School of Law (2004); and Deputy Attorney General, U.S. Department of Justice (2001-2003). |
JOHN B. WILSON (1959) One Franklin Parkway San Mateo, CA 94403-1906 | | Lead Independent Trustee | | Trustee since 2007 and Lead Independent Trustee since 2008 | | 115 | | None |
|
Principal Occupation During Past 5 Years: President and Founder, Hyannis Port Capital, Inc. (real estate and private equity investing); serves on private and non-profit boards; and formerly, Chief Operating Officer and Executive Vice President, Gap, Inc. (retail) (1996-2000); Chief Financial Officer and Executive Vice President—Finance and Strategy, Staples, Inc. (office supplies) (1992-1996); Senior Vice President—Corporate Planning, Northwest Airlines, Inc. (airlines) (1990-1992); and Vice President and Partner, Bain & Company (consulting firm) (1986-1990). |
Interested Board Members and Officers
| | | | | | | | |
| Name, Year of Birth and Address | | Position | | Length of
Time Served | | Number of
Portfolios in Fund
Complex Overseen
by Board Member* | | Other Directorships Held |
**CHARLES B. JOHNSON (1933) One Franklin Parkway San Mateo, CA 94403-1906 | | Trustee and Chairman of the Board | | Since 1988 | | 138 | | None |
|
Principal Occupation During Past 5 Years: Chairman of the Board, Member—Office of the Chairman and Director, Franklin Resources, Inc.; Director, Templeton Worldwide, Inc.; and officer and/or director or trustee, as the case may be, of some of the other subsidiaries of Franklin Resources, Inc. and of 42 of the investment companies in Franklin Templeton Investments. |
**RUPERT H. JOHNSON, JR. (1940) One Franklin Parkway San Mateo, CA 94403-1906 | | Trustee, President and
Chief
Executive
Officer—
Investment Management | | Trustee since 1988 and President and Chief Executive Officer—Investment Management since 2002 | | 53 | | None |
|
Principal Occupation During Past 5 Years: Vice Chairman, Member—Office of the Chairman and Director, Franklin Resources, Inc.; Director, Franklin Advisers, Inc. and Templeton Worldwide, Inc.; Senior Vice President, Franklin Advisory Services, LLC; and officer and/or director or trustee, as the case may be, of some of the other subsidiaries of Franklin Resources, Inc. and of 44 of the investment companies in Franklin Templeton Investments. |
BOD-2
| | | | | | | | |
| Name, Year of Birth and Address | | Position | | Length of
Time Served | | Number of
Portfolios in Fund
Complex Overseen
by Board Member* | | Other Directorships Held |
JENNIFER J. BOLT (1964) One Franklin Parkway San Mateo, CA 94403-1906 | | Chief Executive Officer—Finance and Administration | | Since
December 2008 | | Not
Applicable | | Not Applicable |
|
Principal Occupation During Past 5 Years: Executive Vice President—Operations and Technology, Franklin Resources, Inc.; Director, Templeton Global Advisors Limited; officer and/or director, as the case may be, of some of the other subsidiaries of Franklin Resources, Inc. and of 46 of the investment companies in Franklin Templeton Investments. |
JAMES M. DAVIS (1952) One Franklin Parkway San Mateo, CA 94403-1906 | | Chief Compliance Officer and Vice President—AML Compliance | | Chief Compliance Officer since 2004 and Vice President—AML Compliance since 2006 | | Not
Applicable | | Not Applicable |
|
Principal Occupation During Past 5 Years: Director, Global Compliance, Franklin Resources, Inc.; officer of some of the other subsidiaries of Franklin Resources, Inc. and of 46 of the investment companies in Franklin Templeton Investments; and formerly, Director of Compliance, Franklin Resources, Inc. (1994-2001). |
LAURA F. FERGERSON (1962) One Franklin Parkway San Mateo, CA 94403-1906 | | Treasurer, Chief Financial Officer and Chief Accounting Officer | | Treasurer since 2004, Chief Financial Officer and Chief Accounting Officer since February 2008 | | Not
Applicable | | Not Applicable |
|
Principal Occupation During Past 5 Years: Vice President, Franklin Templeton Services, LLC; officer of 46 of the investment companies in Franklin Templeton Investments; and formerly, Director and member of Audit and Valuation Committees, Runkel Funds, Inc. (2003-2004); Assistant Treasurer of most of the investment companies in Franklin Templeton Investments (1997-2003); and Vice President, Franklin Templeton Services, LLC (1997-2003). |
JIMMY D. GAMBILL (1947) 500 East Broward Blvd. Suite 2100 Fort Lauderdale, FL 33394-3091 | | Vice President | | Since
February 2008 | | Not
Applicable | | Not Applicable |
|
Principal Occupation During Past 5 Years: President, Franklin Templeton Services, LLC; Senior Vice President, Templeton Worldwide, Inc.; and officer of some of the other subsidiaries of Franklin Resources, Inc. and of 46 of the investment companies in Franklin Templeton Investments. |
DAVID P. GOSS (1947) One Franklin Parkway San Mateo, CA 94403-1906 | | Vice President | | Since 2000 | | Not
Applicable | | Not Applicable |
|
Principal Occupation During Past 5 Years: Senior Associate General Counsel, Franklin Templeton Investments; officer and/or director, as the case maybe, of some of the other subsidiaries of Franklin Resources, Inc. and of 46 of the investment companies in Franklin Templeton Investments. |
KAREN L. SKIDMORE (1952) One Franklin Parkway San Mateo, CA 94403-1906 | | Vice President and Secretary | | Since 2006 | | Not
Applicable | | Not Applicable |
|
Principal Occupation During Past 5 Years: Senior Associate General Counsel, Franklin Templeton Investments; and officer of 30 of the investment companies in Franklin Templeton Investments. |
BOD-3
| | | | | | | | |
| Name, Year of Birth and Address | | Position | | Length of
Time Served | | Number of
Portfolios in Fund
Complex Overseen
by Board Member* | | Other Directorships Held |
CRAIG S. TYLE (1960) One Franklin Parkway San Mateo, CA 94403-1906 | | Vice President | | Since 2005 | | Not
Applicable | | Not Applicable |
|
Principal Occupation During Past 5 Years: General Counsel and Executive Vice President, Franklin Resources, Inc.; officer of some of the other subsidiaries of Franklin Resources, Inc. and of 46 of the investment companies in Franklin Templeton Investments; and formerly, Partner, Shearman & Sterling, LLP (2004-2005); and General Counsel, Investment Company Institute (ICI) (1997-2004). |
| *We | base the number of portfolios on each separate series of the U.S. registered investment companies within the Franklin Templeton Investments fund complex. These portfolios have a common investment manager or affiliated investment managers. |
| **Charles | B. Johnson and Rupert H. Johnson, Jr. are considered to be interested persons of the Trust under the federal securities laws due to their positions as officers and directors and major shareholders of Franklin Resources, Inc., which is the parent company of the Trust’s investment manager and distributor. |
Note 1: Charles B. Johnson and Rupert H. Johnson, Jr. are brothers and the father and uncle, respectively, of Jennifer J. Bolt.
Note 2: Officer information is current as of the date of this report. It is possible that after this date, information about officers may change.
The Sarbanes-Oxley Act of 2002 and Rules adopted by the Securities and Exchange Commission require the Fund to disclose whether the Fund’s Audit Committee includes at least one member who is an audit committee financial expert within the meaning of such Act and Rules. The Fund’s Board has determined that there is at least one such financial expert on the Audit Committee and has designated John B. Wilson as its audit committee financial expert. The Board believes that Mr. Wilson qualifies as such an expert in view of his extensive business background and experience, including service as chief financial officer of Staples, Inc. from 1992 to 1996. Mr. Wilson has been a Member and Chairman of the Fund’s Audit Committee since 2006. As a result of such background and experience, the Board believes that Mr. Wilson has acquired an understanding of generally accepted accounting principles and financial statements, the general application of such principles in connection with the accounting estimates, accruals and reserves, and analyzing and evaluating financial statements that present a breadth and level of complexity of accounting issues generally comparable to those of the Fund, as well as an understanding of internal controls and procedures for financial reporting and an understanding of audit committee functions. Mr. Wilson is an independent Board member as that term is defined under the relevant Securities and Exchange Commission Rules and Releases.
The Statement of Additional Information (SAI) includes additional information about the board members and is available, without charge, upon request. Shareholders may call (800) 321-8563 or their insurance companies to request the SAI.
BOD-4
Franklin Templeton Variable Insurance Products Trust
Shareholder Information
Proxy Voting Policies and Procedures
The Trust’s investment manager has established Proxy Voting Policies and Procedures (Policies) that the Trust uses to determine how to vote proxies relating to portfolio securities. Shareholders may view the Trust’s complete Policies online at franklintempleton.com. Alternatively, shareholders may request copies of the Policies free of charge by calling the Proxy Group collect at (954) 527-7678 or by sending a written request to: Franklin Templeton Companies, LLC, 500 East Broward Boulevard, Suite 1500, Fort Lauderdale, FL 33394, Attention: Proxy Group. Copies of the Trust’s proxy voting records are also made available online at franklintempleton.com and posted on the U.S. Securities and Exchange Commission’s website at sec.gov and reflect the most recent 12-month period ended June 30.
Quarterly Statement of Investments
The Trust files a complete statement of investments with the U.S. Securities and Exchange Commission for the first and third quarters for each fiscal year on Form N-Q. Shareholders may view the filed Form N-Q by visiting the Commission’s website at sec.gov. The filed form may also be viewed and copied at the Commission’s Public Reference Room in Washington, DC. Information regarding the operations of the Public Reference Room may be obtained by calling (800) SEC-0330.
SI-1
| | |
 | | One Franklin Parkway San Mateo, CA 94403-1906 |
Annual Report
FRANKLIN TEMPLETON
VARIABLE INSURANCE PRODUCTS TRUST
Investment Managers
Franklin Advisers, Inc.
Franklin Advisory Services, LLC
Franklin Mutual Advisers, LLC
Franklin Templeton Institutional, LLC
Templeton Asset Management Ltd.
Templeton Global Advisors Limited
Templeton Investment Counsel, LLC
Fund Administrator
Franklin Templeton Services, LLC
Distributor
Franklin Templeton Distributors, Inc.
Franklin Templeton Variable Insurance Products Trust (FTVIP) shares are generally sold only to insurance company separate accounts (Separate Account) to serve as the investment vehicles for both variable annuity and variable life insurance contracts.
Authorized for distribution to investors in Separate Accounts only when accompanied or preceded by the current prospectus for the applicable contract, which includes the Separate Account and the FTVIP prospectuses. Investors should carefully consider a fund’s investment goals, risks, charges and expenses before investing. The prospectus contains this and other information; please read it carefully before investing.
To ensure the highest quality of service, telephone calls to or from our service departments may be monitored, recorded and accessed. These calls can be identified by the presence of a regular beeping tone.
FTVIP A2008 02/09
| (a) | The Registrant has adopted a code of ethics that applies to its principal executive officers and principal financial and accounting officer. |
| (f) | Pursuant to Item 12(a)(1), the Registrant is attaching as an exhibit a copy of its code of ethics that applies to its principal executive officers and principal financial and accounting officer. |
| Item 3. | Audit Committee Financial Expert. |
| | | | |
| (a) | | (1) | | The Registrant has an audit committee financial expert serving on its audit committee. |
| | |
| | (2) | | The audit committee financial expert is John B. Wilson and he is “independent” as defined under the relevant Securities and Exchange Commission Rules and Releases. |
| Item 4. | Principal Accountant Fees and Services. |
(a) Audit Fees
The aggregate fees paid to the principal accountant for professional services rendered by the principal accountant for the audit of the registrant’s annual financial statements or for services that are normally provided by the principal accountant in connection with statutory and regulatory filings or engagements were $848,307 for the fiscal year ended December 31, 2008 and $851,956 for the fiscal year ended December 31, 2007.
(b) Audit-Related Fees
There were no fees paid to the principal accountant for assurance and related services rendered by the principal accountant to the registrant that are reasonably related to the performance of the audit of the registrant’s financial statements and are not reported under paragraph (a) of Item 4.
There were no fees paid to the principal accountant for assurance and related services rendered by the principal accountant to the registrant’s investment adviser and any entity controlling, controlled by or under common control with the investment adviser that provides ongoing services to the registrant that are reasonably related to the performance of the audit of their financial statements.
(c) Tax Fees
The aggregate fees paid to the principal accountant for professional services rendered by the principal accountant to the registrant for tax compliance, tax advice and tax planning were $1,290 for the fiscal year ended December 31, 2008 and $0 for the fiscal year ended December 31, 2007. The services for which these fees were paid included tax compliance and advice.
The aggregate fees paid to the principal accountant for professional services rendered by the principal accountant to the registrant’s investment adviser and any entity controlling, controlled by or under common control with the investment adviser that provides ongoing services to the registrant for tax compliance, tax advice and tax planning were $4,000 for the fiscal year ended December 31, 2008 and $46,000 for the fiscal year ended December 31, 2007. The services for which these fees were paid included tax compliance and advice.
(d) All Other Fees
The aggregate fees paid to the principal accountant for products and services rendered by the principal accountant to the registrant not reported in paragraphs (a)-(c) of Item 4 were $25,925 for the fiscal year ended December 31, 2008 and $0 for the fiscal year ended December 31, 2007. The services for which these fees were paid included review of materials provided to the fund Board in connection with the investment management contract renewal process.
The aggregate fees paid to the principal accountant for products and services rendered by the principal accountant to the registrant’s investment adviser and any entity controlling, controlled by or under common control with the investment adviser that provides ongoing services to the registrant other than services reported in paragraphs (a)-(c) of Item 4 were $258,152 for the fiscal year ended December 31, 2008
and $0 for the fiscal year ended December 31, 2007. The services for which these fees were paid included review of materials provided to the fund Board in connect with the investment management contract renewal process.
(e) (1) The registrant’s audit committee is directly responsible for approving the services to be provided by the auditors, including:
(i) pre-approval of all audit and audit related services;
(ii) pre-approval of all non-audit related services to be provided to the Fund by the auditors;
(iii) pre-approval of all non-audit related services to be provided to the registrant by the auditors to the registrant’s investment adviser or to any entity that controls, is controlled by or is under common control with the registrant’s investment adviser and that provides ongoing services to the registrant where the non-audit services relate directly to the operations or financial reporting of the registrant; and
(iv) establishment by the audit committee, if deemed necessary or appropriate, as an alternative to committee pre-approval of services to be provided by the auditors, as required by paragraphs (ii) and (iii) above, of policies and procedures to permit such services to be pre-approved by other means, such as through establishment of guidelines or by action of a designated member or members of the committee; provided the policies and procedures are detailed as to the particular service and the committee is informed of each service and such policies and procedures do not include delegation of audit committee responsibilities, as contemplated under the Securities Exchange Act of 1934, to management; subject, in the case of (ii) through (iv), to any waivers, exceptions or exemptions that may be available under applicable law or rules.
(e) (2) None of the services provided to the registrant described in paragraphs (b)-(d) of Item 4 were approved by the audit committee pursuant to paragraph (c)(7)(i)(C) of Rule 2-01 of regulation S-X.
(f) No disclosures are required by this Item 4(f).
(g) The aggregate non-audit fees paid to the principal accountant for services rendered by the principal accountant to the registrant and the registrant’s investment adviser and any entity controlling, controlled by or under common control with the investment adviser that provides ongoing services to the registrant were $289,367 for the fiscal year ended December 31, 2008 and $46,000 for the fiscal year ended December 31, 2007.
(h) The registrant’s audit committee of the board has considered whether the provision of non-audit services that were rendered to the registrant’s investment adviser (not including any sub-adviser whose role is primarily portfolio management and is subcontracted with or overseen by another investment adviser), and any entity controlling, controlled by, or under common control with the investment adviser that provides ongoing services to the registrant that were not pre-approved pursuant to paragraph (c)(7)(ii) of Rule 2-01 of Regulation S-X is compatible with maintaining the principal accountant’s independence.
| Item 5. | Audit Committee of Listed Registrants. N/A |
| Item 6. | Schedule of Investments. N/A |
| Item 7. | Disclosure of Proxy Voting Policies and Procedures for Closed-End Management Investment Companies. N/A |
| Item 8. | Portfolio Managers of Closed-End Management Investment Companies. N/A |
| Item 9. | Purchases of Equity Securities by Closed-End Management Investment Companies and Affiliated Purchases. N/A |
| Item 10. | Submission of Matters to a vote of Security Holders. |
There have been no changes to the procedures by which shareholders may recommend nominees to the Registrant’s Board of Trustees that would require disclosure herein.
| Item 11. | Controls and Procedures. |
(a) Evaluation of Disclosure Controls and Procedures. The Registrant maintains disclosure controls and procedures that are designed to ensure that information required to be disclosed in the Registrant’s filings under the Securities Exchange Act of 1934 and the Investment Company Act of 1940 is recorded, processed, summarized and reported within the periods specified in the rules and forms of the Securities and Exchange Commission. Such information is accumulated and communicated to the Registrant’s management, including its principal executive officer and principal financial officer, as appropriate, to allow timely decisions regarding required disclosure. The Registrant’s management, including the principal executive officer and the principal financial officer, recognizes that any set of controls and procedures, no matter how well designed and operated, can provide only reasonable assurance of achieving the desired control objectives.
Within 90 days prior to the filing date of this Shareholder Report on Form N-CSR, the Registrant had carried out an evaluation, under the supervision and with the participation of the Registrant’s management, including the Registrant’s principal executive officer and the Registrant’s principal financial officer, of the effectiveness of the design and operation of the Registrant’s disclosure controls and procedures. Based on such evaluation, the Registrant’s principal executive officer and principal financial officer concluded that the Registrant’s disclosure controls and procedures are effective.
(b) Changes in Internal Controls. There have been no significant changes in the Registrant’s internal controls or in other factors that
could significantly affect the internal controls subsequent to the date of their evaluation in connection with the preparation of this Shareholder Report on Form N-CSR.
(a) (1) Code of Ethics
(a) (2) Certifications pursuant to Section 302 of the Sarbanes-Oxley Act of 2002 of Jennifer J. Bolt, Chief Executive Officer – Finance and Administration, and Laura F. Fergerson, Chief Financial Officer and Chief Accounting Officer
(b) Certifications pursuant to Section 906 of the Sarbanes-Oxley Act of 2002 of Jennifer J. Bolt, Chief Executive Officer – Finance and Administration, and Laura F. Fergerson, Chief Financial Officer and Chief Accounting Officer
SIGNATURES
Pursuant to the requirements of the Securities Exchange Act of 1934 and the Investment Company Act of 1940, the registrant has duly caused this report to be signed on its behalf by the undersigned, thereunto duly authorized.
FRANKLIN TEMPLETON VARIABLE INSURANCE PRODUCTS TRUST
| | |
| |
| By: | | /s/ JENNIFER J. BOLT |
| | Jennifer J. Bolt |
| | Chief Executive Officer – Finance and Administration |
| Date February 25, 2009 |
Pursuant to the requirements of the Securities Exchange Act of 1934 and the Investment Company Act of 1940, this report has been signed below by the following persons on behalf of the registrant and in the capacities and on the dates indicated.
| | |
| By: | | /s/ JENNIFER J. BOLT |
| | Jennifer J. Bolt |
| | Chief Executive Officer – Finance and Administration |
| Date February 25, 2009 |
| |
| By: | | /s/ LAURA F. FERGERSON |
| | Laura F. Fergerson |
| | Chief Financial Officer and Chief Accounting Officer |
| Date February 25, 2009 |