UNITED STATES
SECURITIES AND EXCHANGE COMMISSION
Washington, D.C. 20549
FORM N-CSR
CERTIFIED SHAREHOLDER REPORT OF REGISTERED
MANAGEMENT INVESTMENT COMPANIES
| | |
Investment Company Act file number | | 811-05583 |
Franklin Templeton Variable Insurance Products Trust
|
| (Exact name of registrant as specified in charter) |
| | |
| One Franklin Parkway, San Mateo, CA | | 94403-1906 |
| (Address of principal executive offices) | | (Zip code) |
Craig S. Tyle, One Franklin Parkway, San Mateo, CA 94403-1906
|
| (Name and address of agent for service) |
Registrant’s telephone number, including area code: (650) 312-2000
Date of fiscal year end: 12/31
Date of reporting period: 12/31/07
| Item 1. | Reports to Stockholders. |

DECEMBER 31, 2007
FRANKLIN TEMPLETON
VARIABLE INSURANCE PRODUCTS TRUST
ANNUAL REPORT

FRANKLIN TEMPLETON VARIABLE INSURANCE PRODUCTS TRUST ANNUAL REPORT
TABLEOF CONTENTS
NOT FDIC INSURED | MAY LOSE VALUE | NO BANK GUARANTEE
MASTER CLASS – 3
IMPORTANT NOTESTOPERFORMANCE INFORMATION
Performance data is historical and cannot predict or guarantee future results. Principal value and investment return will fluctuate with market conditions, and you may have a gain or loss when you withdraw your money. Inception dates of the funds may have preceded the effective dates of the subaccounts, contracts, or their availability in all states.
When reviewing the index comparisons, please keep in mind that indexes have a number of inherent performance differentials over the funds. First, unlike the funds, which must hold a minimum amount of cash to maintain liquidity, indexes do not have a cash component. Second, the funds are actively managed and, thus, are subject to management fees to cover salaries of securities analysts or portfolio managers in addition to other expenses. Indexes are unmanaged and do not include any commissions or other expenses typically associated with investing in securities. Third, indexes often contain a different mix of securities than the fund to which they are compared. Additionally, please remember that indexes are simply a measure of performance and cannot be invested in directly.
i
TEMPLETON DEVELOPING MARKETS SECURITIES FUND
This annual report for Templeton Developing Markets Securities Fund covers the fiscal year ended December 31, 2007.
Performance Summary as of 12/31/07
Average annual total return of Class 3 shares* represents the average annual change in value, assuming reinvestment of dividends and capital gains. Average returns smooth out variations in returns, which can be significant; they are not the same as year-by-year results.
Periods ended 12/31/07
| | | | | | |
| | | 1-Year | | 5-Year | | 10-Year |
Average Annual Total Return | | +28.70% | | +32.05% | | +11.73% |
*Performance prior to the 5/1/00 merger reflects historical performance of Templeton Developing Markets Fund. Since Class 3 shares were not offered until 5/1/04, performance prior to that date represents historical Class 2 performance. Since 5/1/04 (effective date), the average annual total return of Class 3 shares was +29.94%.
Total Return Index Comparison
for Hypothetical $10,000 Investment (1/1/98–12/31/07)
The graph below shows the change in value of a hypothetical $10,000 investment in the Fund over the indicated period and includes reinvestment of any income or distributions. The Fund’s performance* is compared to the performance of the Morgan Stanley Capital International (MSCI) Emerging Markets (EM) Index and the Standard & Poor’s/International Finance Corporation Investable (S&P/IFCI) Composite Index. One cannot invest directly in an index, nor is an index representative of the Fund’s portfolio. Please see Important Notes to Performance Information preceding the Fund Summaries.
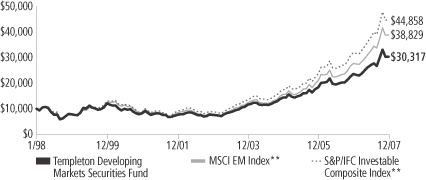
**Source: Standard & Poor’s Micropal. Please see Index Descriptions following the Fund Summaries.
Templeton Developing Markets Securities Fund Class 3
Performance reflects the Fund’s Class 3 operating expenses, but does not include any contract fees, expenses or sales charges. If they had been included, performance would be lower. These charges and deductions, particularly for variable life policies, can have a significant effect on contract values and insurance benefits. See the contract prospectus for a complete description of these expenses, including sales charges.
Performance data represent past performance, which does not guarantee future results. Investment return and principal value will fluctuate, and you may have a gain or loss when you sell your shares.
Current performance may differ from figures shown.
TD-1
Fund Goal and Main Investments: Templeton Developing Markets Securities Fund seeks long-term capital appreciation. The Fund normally invests at least 80% of its net assets in emerging market investments and normally invests primarily to predominantly in equity securities.
Performance Overview
You can find the Fund’s one-year total return in the Performance Summary. The Fund underperformed the MSCI EM Index’s +39.78% return, and the S&P/IFCI Composite Index’s +40.28% return for the same period.1 Please note that index performance numbers are purely for reference and that we do not attempt to track an index, but rather undertake investments on the basis of fundamental research.
Economic and Market Overview
In 2007, emerging markets equities had another positive year. Despite problems brought on by the U.S. subprime lending crisis, emerging markets registered a +39.78% gain for the year, bringing cumulative return for the past five years to +390.79% in U.S. dollar terms, as measured by the MSCI EM Index.2 Most stock markets were supported by a robust macroeconomic environment, surging money supply, rising commodity prices, stronger emerging market currencies, improved corporate earnings and significant investment inflows. Periods of increased volatility, however, occurred during the year as nervous investors reacted to subprime concerns and their impact on the global economy as well as overheating concerns in China.
In Asia, India and China were among the top performing markets as both economies continued to benefit from strong economic growth, a large consumer base and vast foreign reserves. Moreover, Chinese stocks listed in Hong Kong were key beneficiaries of the expansion of China’s Qualified Domestic Institutional Investor (QDII) program, which allowed domestic fund managers and brokerages to invest in foreign securities. Neighboring markets in Indonesia, Thailand and South Korea also recorded respectable gains.
Market returns in Latin America benefited from high commodity prices and stronger regional currencies. Accelerating economic growth, high
1. Source: Standard & Poor’s Micropal. One cannot invest directly in an index, nor is an index representative of the Fund’s portfolio. Please see Index Descriptions following the Fund Summaries.
2. Source: Standard & Poor’s Micropal. Please see Index Descriptions following the Fund Summaries.
Fund Risks: The Fund’s investments in stocks offer the potential for long-term gains but can be subject to short-term price fluctuations. Investing in emerging markets is subject to all the risks of foreign investing generally as well as additional, heightened risks, including currency fluctuations, economic instability, market volatility, political and social instability, the relatively smaller size and lesser liquidity of these markets, and less effective or irregular government supervision and regulation of business and industry practices. The Fund’s prospectus also includes a description of the main investment risks.
TD-2
foreign investment flows and lower interest rates pushed the Brazilian stock market to end the year at record high levels. However, Mexico underperformed its regional peers as concerns of slowing growth in the U.S. led investors to stay on the sidelines.
Despite recording double-digit returns, European and African markets underperformed their emerging market counterparts during the year. Turkey, however, significantly outperformed global markets as investors responded favorably to the central bank’s adoption of a loosening monetary policy, improvement in the country’s public finances, as well as the completion of parliamentary and presidential elections. A stronger lira also boosted stock returns in U.S. dollar terms.
Investment Strategy
Our investment philosophy is bottom-up, value-oriented and long-term. In choosing investments, we may make onsite visits to companies to assess critical factors such as management strength and local conditions. In addition, we focus on the market price of a company’s securities relative to our evaluation of the company’s potential long-term (typically five years) earnings, asset value and cash flow potential. Among factors we consider are a company’s historical value measures, including price/earnings ratio, profit margins and liquidation value. We perform in-depth research to construct an action list from which we make our investment decisions.
Manager’s Discussion
For the 12 months under review, the Fund’s exposure to the materials, energy, telecommunication services and bank sectors contributed significantly to absolute performance.3 Within the materials and energy sectors, holdings in Chalco (Aluminum Corp. of China), CVRD (Companhia Vale do Rio Doce), Petrobras (Petroleo Brasileiro) and Tupras (Tupras-Turkiye Petrol Rafinerileri) were among the largest contributors to performance. Rising oil and commodity prices coupled with growing demand for oil, coal and metals in China as well as other emerging markets benefited these companies.
Additional key contributors included Turkcell (Turkcell Iletisim Hizmetleri) and America Movil in the telecommunication services
3. The materials sector comprises chemicals, construction materials, metals and mining, and paper and forest products and in the SOI. The energy sector comprises energy equipment and services; and oil, gas and consumable fuels in the SOI. The telecommunication services sector comprises diversified telecommunication services and wireless telecommunication services in the SOI. The bank sector comprises commercial banks in the SOI.
TD-3
sector. Turkish and Brazilian banks, Akbank, Vakifbank (Turkiye Vakiflar Bankasi), Unibanco (Unibanco-Uniao de Bancos Brasileiros) and Banco Bradesco, also boosted Fund performance during the period.
Sectors that detracted from Fund performance included retail and real estate.4 South African stocks Foschini and JD Group declined in value and were the largest detractors in the retail sector during the period. In the real estate sector, Emaar Properties was a major detractor, and we sold it during the period.
Geographically, investments in Brazil, Turkey and China made noteworthy contributions to Fund performance. In addition to stocks discussed earlier, THY (Turk Hava Yollari Anonim Ortakligi), Turkey’s national airline; Souza Cruz, Brazil’s leading major tobacco company; Sinopec (China Petroleum and Chemical), the largest integrated energy company in China; and PetroChina, a dominant player in the upstream oil and gas sector, also supported performance.
It is important to recognize the effect of currency movements on the Fund’s performance. In general, if the value of the U.S. dollar goes up compared with a foreign currency, an investment traded in that foreign currency will go down in value because it will be worth fewer U.S. dollars. This can have a negative effect on Fund performance. Conversely, when the U.S. dollar weakens in relation to a foreign currency, an investment traded in that foreign currency will increase in value, which can contribute to Fund performance. For the 12 months ended December 31, 2007, the U.S. dollar declined in value relative to most non-U.S. currencies. As a result, the Fund’s performance was positively affected by the portfolio’s investments predominantly in securities with non-U.S. currency exposure. However, one cannot expect the same result in future periods.
During the reporting period, we made significant purchases in Russia, India, Mexico and China (via Hong Kong-listed China H shares).5 Major investments included shares of America Movil, UES (Unified Energy Systems), China Telecom and Sberbank (Savings Bank of Russia).
4. The retail sector comprises specialty retail in the SOI. The real estate sector comprises real estate management and development in the SOI.
5. “China H” denotes shares of China-incorporated, Hong Kong-listed companies with most businesses in China.
Top 10 Holdings
Templeton Developing Markets Securities Fund
12/31/07
| | |
Company
Sector/Industry,
Country | | % of Total
Net Assets |
| |
CVRD (Companhia Vale do Rio Doce), ADR,
pfd., A | | 5.4% |
| Metals & Mining, Brazil | | |
| |
| Petrobras (Petroleo Brasileiro SA), ADR, pfd. | | 4.9% |
| Oil, Gas & Consumable Fuels, Brazil | | |
| |
| Chalco (Aluminum Corp. of China Ltd.), H & 144A | | 3.8% |
| Metals & Mining, China | | |
| |
| Akbank TAS | | 3.5% |
| Commercial Banks, Turkey | | |
| |
| UES (Unified Energy Systems) | | 3.4% |
| Electric Utilities, Russia | | |
| |
| Gazprom OAO, ord. & ADR | | 3.3% |
| Oil, Gas & Consumable Fuels, Russia | | |
| |
| SK Energy Co. Ltd. | | 3.1% |
| Oil, Gas & Consumable Fuels, South Korea | | |
| |
| Norilsk Nickel (Mining and Metallurgical Co. Norilsk Nickel) | | 3.1% |
| Metals & Mining, Russia | | |
| |
| PetroChina Co. Ltd., H | | 2.7% |
| Oil, Gas & Consumable Fuels, China | | |
| |
| America Movil SAB de CV, L, ADR | | 2.5% |
| Wireless Telecommunication Services, Mexico | | |
The dollar value, number of shares or principal amount, and names of all portfolio holdings are listed in the Fund’s Statement of Investments (SOI).
TD-4
We also made select additions in Pakistan, Peru and Chile as we continued to search for undervalued stocks trading at attractive valuations.
From a sector perspective, we increased the Fund’s allocations to several sectors based on what we considered favorable market trends. We expected commodity prices to stay at relatively high levels amid growing global energy demand, so we increased our investments in coal and diversified metals and mining companies.6 Greater global demand for consumer products and services also led us to increase our allocation to integrated telecommunication services, home furnishings and automobile manufacturing companies.7 We also increased the Fund’s exposure to the information technology (IT) consulting industry because of strong demand for outsourcing services.8 We initiated a position in Tata Consultancy Services, India’s leading IT consulting and outsourcing services provider.
To raise funds for redemptions during the reporting period, we sold a number of holdings. These sales also allowed the Fund to focus on stocks we considered relatively more attractively valued within our investment universe. We sold select positions as stocks reached sale price targets. As a result, the Fund’s exposure to the tobacco, semiconductors, diversified banking, and life and health insurance industries fell.9 Major sales included all or part of Remgro, Old Mutual, Samsung Electronics and Hana Financial Group.
Thank you for your participation in Templeton Developing Markets Securities Fund. We look forward to serving your future investment needs.
6. The coal industry is part of oil, gas and consumable fuels in the SOI. The diversified metals and mining industry is part of metals and mining in the SOI.
7. The integrated telecommunication services industry is part of diversified telecommunication services in the SOI. The home furnishings industry is part of household durables in the SOI. The automobile manufacturing industry is part of automobiles in the SOI.
8. The IT consulting industry is part of IT services in the SOI.
9. The semiconductors industry is part of semiconductors and semiconductor equipment in the SOI. The diversified banking industry is part of commercial banks in the SOI. The life and health insurance industry is part of insurance in the SOI.
The foregoing information reflects our analysis, opinions and portfolio holdings as of December 31, 2007, the end of the reporting period. The way we implement our main investment strategies and the resulting portfolio holdings may change depending on factors such as market and economic conditions. These opinions may not be relied upon as investment advice or an offer for a particular security. The information is not a complete analysis of every aspect of any market, country, industry, security or the Fund. Statements of fact are from sources considered reliable, but the investment manager makes no representation or warranty as to their completeness or accuracy. Although historical performance is no guarantee of future results, these insights may help you understand our investment management philosophy.
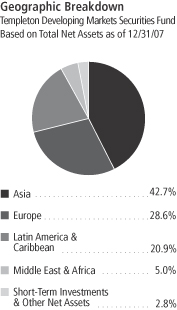
Top 10 Countries
Templeton Developing Markets Securities Fund 12/31/07
| | |
| | | % of Total
Net Assets |
| |
| China | | 19.7% |
| |
| Brazil | | 15.9% |
| |
| Russia | | 13.0% |
| |
| Turkey | | 9.4% |
| |
| South Korea | | 8.0% |
| |
| India | | 5.5% |
| |
| South Africa | | 4.6% |
| |
| Mexico | | 4.5% |
| |
| Taiwan | | 2.9% |
| |
| Thailand | | 2.5% |
TD-5
Fund Expenses
As an investor in a variable insurance contract (Contract) that indirectly provides for investment in an underlying mutual fund, you can incur transaction and/or ongoing expenses at both the Fund level and the Contract level.
| • | | Transaction expenses can include sales charges (loads) on purchases, redemption fees, surrender fees, transfer fees and premium taxes. |
| • | | Ongoing expenses can include management fees, distribution and service (12b-1) fees, contract fees, annual maintenance fees, mortality and expense risk fees and other fees and expenses. All mutual funds and Contracts have some types of ongoing expenses. |
The expenses shown in the table are meant to highlight ongoing expenses at the Fund level only and do not include ongoing expenses at the Contract level, or transaction expenses at either the Fund or Contract level. While the Fund does not have transaction expenses, if the transaction and ongoing expenses at the Contract level were included, the expenses shown below would be higher. You should consult your Contract prospectus or disclosure document for more information.
The table shows Fund-level ongoing expenses and can help you understand these expenses and compare them with those of other mutual funds offered through the Contract. The table assumes a $1,000 investment held for the six months indicated. Please refer to the Fund prospectus for additional information on operating expenses.
Actual Fund Expenses
The first line (Actual) of the table provides actual account values and expenses. The “Ending Account Value” is derived from the Fund’s actual return, which includes the effect of ongoing Fund expenses, but does not include the effect of ongoing Contract expenses.
You can estimate the Fund-level expenses you incurred during the period by following these steps. Of course, your account value and expenses will differ from those in this illustration:
| 1. | Divide your account value by $1,000. |
If an account had an $8,600 value, then $8,600 ÷ $1,000 = 8.6.
| 2. | Multiply the result by the number under the heading “Fund-Level Expenses Incurred During Period.” |
If Fund-Level Expenses Incurred During Period were $7.50, then
8.6 x $7.50 = $64.50.
In this illustration, the estimated expenses incurred this period at the Fund level are $64.50.
Templeton Developing
Markets Securities Fund
Class 3
TD-6
Hypothetical Example for Comparison with Other Mutual Funds
Information in the second line (Hypothetical) of the table can help you compare ongoing expenses of the Fund with those of other mutual funds offered through the Contract. This information may not be used to estimate the actual ending account balance or expenses you incurred during the period. The hypothetical “Ending Account Value” is based on the Fund’s actual expense ratio and an assumed 5% annual rate of return before expenses, which does not represent the Fund’s actual return. The figure under the heading “Fund-Level Expenses Incurred During Period” shows the hypothetical expenses your account would have incurred under this scenario. You can compare this figure with the 5% hypothetical examples that appear in shareholder reports of other funds offered through a Contract.
| | | | | | | | | |
| Class 3 | | Beginning
Account Value 7/1/07 | | Ending Account Value 12/31/07 | | Fund-Level
Expenses Incurred
During Period*
7/1/07–12/31/07 |
Actual | | $ | 1,000 | | $ | 1,119.20 | | $ | 9.29 |
Hypothetical (5% return before expenses) | | $ | 1,000 | | $ | 1,016.43 | | $ | 8.84 |
*Expenses are calculated using the most recent six-month annualized expense ratio for the Fund’s Class 3 shares (1.74%), which does not include any ongoing expenses of the Contract for which the Fund is an investment option, multiplied by the average account value over the period, multiplied by 184/365 to reflect the one-half year period.
TD-7
Franklin Templeton Variable Insurance Products Trust
Financial Highlights
Templeton Developing Markets Securities Fund
| | | | | | | | | | | | | | | | | | | | |
| | | Year Ended December 31, | |
| Class 1 | | 2007 | | | 2006 | | | 2005 | | | 2004 | | | 2003 | |
| | | | |
Per share operating performance | | | | | | | | | | | | | | | | | | | | |
(for a share outstanding throughout the year) | | | | | | | | | | | | | | | | | | | | |
Net asset value, beginning of year | | $ | 13.92 | | | $ | 10.99 | | | $ | 8.73 | | | $ | 7.14 | | | $ | 4.71 | |
| | | | |
Income from investment operationsa: | | | | | | | | | | | | | | | | | | | | |
Net investment incomeb | | | 0.32 | | | | 0.24 | | | | 0.17 | | | | 0.11 | | | | 0.13 | |
Net realized and unrealized gains (losses) | | | 3.51 | | | | 2.84 | | | | 2.23 | | | | 1.62 | | | | 2.38 | |
| | | | |
Total from investment operations | | | 3.83 | | | | 3.08 | | | | 2.40 | | | | 1.73 | | | | 2.51 | |
| | | | |
Less distributions from: | | | | | | | | | | | | | | | | | | | | |
Net investment income | | | (0.38 | ) | | | (0.15 | ) | | | (0.14 | ) | | | (0.14 | ) | | | (0.08 | ) |
Net realized gains | | | (1.21 | ) | | | — | | | | — | | | | — | | | | — | |
| | | | |
Total distributions | | | (1.59 | ) | | | (0.15 | ) | | | (0.14 | ) | | | (0.14 | ) | | | (0.08 | ) |
| | | | |
Redemption fees | | | — | d | | | — | d | | | — | d | | | — | | | | — | |
| | | | |
Net asset value, end of year | | $ | 16.16 | | | $ | 13.92 | | | $ | 10.99 | | | $ | 8.73 | | | $ | 7.14 | |
| | | | |
| | | | | |
Total returnc | | | 29.09% | | | | 28.43% | | | | 27.76% | | | | 24.83% | | | | 53.74% | |
Ratios to average net assets | | | | | | | | | | | | | | | | | | | | |
Expenses | | | 1.48% | e | | | 1.47% | e | | | 1.53% | e | | | 1.54% | e | | | 1.55% | |
Net investment income | | | 2.07% | | | | 1.93% | | | | 1.77% | | | | 1.52% | | | | 2.35% | |
| | | | | |
Supplemental data | | | | | | | | | | | | | | | | | | | | |
Net assets, end of year (000’s) | | $ | 753,843 | | | $ | 749,120 | | | $ | 651,826 | | | $ | 477,290 | | | $ | 359,299 | |
Portfolio turnover rate | | | 98.32% | | | | 53.65% | | | | 31.24% | | | | 55.67% | | | | 46.20% | |
a The amount shown for a share outstanding throughout the period may not correlate with the Statement of Operations for the period due to the timing of sales and repurchases of the Fund shares in relation to income earned and/or fluctuating market value of the investments of the Fund.
b Based on average daily shares outstanding.
c Total return does not include any fees, charges or expenses imposed by the variable annuity and life insurance contracts for which the Franklin Templeton Variable Insurance Products Trust serves as an underlying investment vehicle.
d Amount rounds to less than $0.01 per share.
e Benefit of expense reduction rounds to less than 0.01%.
The accompanying notes are an integral part of these financial statements.
TD-8
Franklin Templeton Variable Insurance Products Trust
Financial Highlights (continued)
Templeton Developing Markets Securities Fund
| | | | | | | | | | | | | | | | | | | | |
| | | Year Ended December 31, | |
| Class 2 | | 2007 | | | 2006 | | | 2005 | | | 2004 | | | 2003 | |
| | | | |
Per share operating performance | | | | | | | | | | | | | | | | | | | | |
(for a share outstanding throughout the year) | | | | | | | | | | | | | | | | | | | | |
Net asset value, beginning of year | | $ | 13.79 | | | $ | 10.90 | | | $ | 8.67 | | | $ | 7.09 | | | $ | 4.69 | |
| | | | |
Income from investment operationsa: | | | | | | | | | | | | | | | | | | | | |
Net investment incomeb | | | 0.27 | | | | 0.20 | | | | 0.14 | | | | 0.09 | | | | 0.11 | |
Net realized and unrealized gains (losses) | | | 3.49 | | | | 2.82 | | | | 2.21 | | | | 1.63 | | | | 2.35 | |
| | | | |
Total from investment operations | | | 3.76 | | | | 3.02 | | | | 2.35 | | | | 1.72 | | | | 2.46 | |
| | | | |
Less distributions from: | | | | | | | | | | | | | | | | | | | | |
Net investment income | | | (0.35 | ) | | | (0.13 | ) | | | (0.12 | ) | | | (0.14 | ) | | | (0.06 | ) |
Net realized gains | | | (1.21 | ) | | | — | | | | — | | | | — | | | | — | |
| | | | |
Total distributions | | | (1.56 | ) | | | (0.13 | ) | | | (0.12 | ) | | | (0.14 | ) | | | (0.06 | ) |
| | | | |
Redemption fees | | | — | d | | | — | d | | | — | d | | | — | | | | — | |
| | | | |
Net asset value, end of year | | $ | 15.99 | | | $ | 13.79 | | | $ | 10.90 | | | $ | 8.67 | | | $ | 7.09 | |
| | | | |
| | | | | |
Total returnc | | | 28.78% | | | | 28.09% | | | | 27.43% | | | | 24.71% | | | | 52.99% | |
Ratios to average net assets | | | | | | | | | | | | | | | | | | | | |
Expenses | | | 1.73% | e | | | 1.72% | e | | | 1.78% | e | | | 1.79% | e | | | 1.80% | |
Net investment income | | | 1.82% | | | | 1.68% | | | | 1.52% | | | | 1.27% | | | | 2.10% | |
| | | | | |
Supplemental data | | | | | | | | | | | | | | | | | | | | |
Net assets, end of year (000’s) | | $ | 1,090,549 | | | $ | 857,514 | | | $ | 650,646 | | | $ | 327,569 | | | $ | 170,953 | |
Portfolio turnover rate | | | 98.32% | | | | 53.65% | | | | 31.24% | | | | 55.67% | | | | 46.20% | |
a The amount shown for a share outstanding throughout the period may not correlate with the Statement of Operations for the period due to the timing of sales and repurchases of the Fund shares in relation to income earned and/or fluctuating market value of the investments of the Fund.
b Based on average daily shares outstanding.
c Total return does not include any fees, charges or expenses imposed by the variable annuity and life insurance contracts for which the Franklin Templeton Variable Insurance Products Trust serves as an underlying investment vehicle.
d Amount rounds to less than $0.01 per share.
e Benefit of expense reduction rounds to less than 0.01%.
The accompanying notes are an integral part of these financial statements.
TD-9
Franklin Templeton Variable Insurance Products Trust
Financial Highlights (continued)
Templeton Developing Markets Securities Fund
| | | | | | | | | | | | | | | | |
| | | Year Ended December 31, | |
| Class 3 | | 2007 | | | 2006 | | | 2005 | | | 2004g | |
| | | | |
Per share operating performance | | | | | | | | | | | | | | | | |
(for a share outstanding throughout the year) | | | | | | | | | | | | | | | | |
Net asset value, beginning of year | | $ | 13.78 | | | $ | 10.90 | | | $ | 8.68 | | | $ | 7.13 | |
| | | | |
Income from investment operationsa: | | | | | | | | | | | | | | | | |
Net investment incomeb | | | 0.24 | | | | 0.20 | | | | 0.04 | | | | 0.08 | |
Net realized and unrealized gains (losses) | | | 3.52 | | | | 2.83 | | | | 2.32 | | | | 1.61 | |
| | | | |
Total from investment operations | | | 3.76 | | | | 3.03 | | | | 2.36 | | | | 1.69 | |
| | | | |
Less distributions from: | | | | | | | | | | | | | | | | |
Net investment income | | | (0.37 | ) | | | (0.15 | ) | | | (0.14 | ) | | | (0.14 | ) |
Net realized gains | | | (1.21 | ) | | | — | | | | — | | | | — | |
| | | | |
Total distributions | | | (1.58 | ) | | | (0.15 | ) | | | (0.14 | ) | | | (0.14 | ) |
| | | | |
Redemption fees | | | — | e | | | — | e | | | — | e | | | — | |
| | | | |
Net asset value, end of year | | $ | 15.96 | | | $ | 13.78 | | | $ | 10.90 | | | $ | 8.68 | |
| | | | |
| | | | |
Total returnc | | | 28.70% | | | | 28.17% | | | | 27.45% | | | | 24.15% | |
Ratios to average net assetsd | | | | | | | | | | | | | | | | |
Expenses | | | 1.73% | f | | | 1.72% | f | | | 1.78% | f | | | 1.54% | f |
Net investment income | | | 1.82% | | | | 1.68% | | | | 1.52% | | | | 1.52% | |
| | | | |
Supplemental data | | | | | | | | | | | | | | | | |
Net assets, end of year (000’s) | | $ | 100,961 | | | $ | 43,372 | | | $ | 11,521 | | | $ | 12 | |
Portfolio turnover rate | | | 98.32% | | | | 53.65% | | | | 31.24% | | | | 55.67% | |
aThe amount shown for a share outstanding throughout the period may not correlate with the Statement of Operations for the period due to the timing of sales and repurchases of the Fund shares in relation to income earned and/or fluctuating market value of the investments of the Fund.
bBased on average daily shares outstanding.
cTotal return does not include any fees, charges or expenses imposed by the variable annuity and life insurance contracts for which the Franklin Templeton Variable Insurance Products Trust serves as an underlying investment vehicle. Total return is not annualized for periods less than one year.
dRatios are annualized for periods less than one year.
eAmount rounds to less than $0.01 per share.
fBenefit of expense reduction rounds to less than 0.01%.
gFor the period May 1, 2004 (effective date) to December 31, 2004.
The accompanying notes are an integral part of these financial statements.
TD-10
Franklin Templeton Variable Insurance Products Trust
Statement of Investments, December 31, 2007
| | | | | | | |
| Templeton Developing Markets Securities Fund | | Industry | | Shares/
Rights | | Value |
Long Term Investments 97.2% | | | |
Common Stocks and Rights 82.9% | | | |
Austria 1.0% | | | | | | | |
Erste Bank der oesterreichischen Sparkassen AG | | Commercial Banks | | 41,280 | | $ | 2,921,736 |
aIMMOEAST AG | | Real Estate Management &
Development | | 93,380 | | | 1,004,340 |
aMeinl European Land Ltd. | | Real Estate Management &
Development | | 91,625 | | | 1,260,913 |
OMV AG | | Oil, Gas & Consumable Fuels | | 136,419 | | | 11,033,183 |
Wienerberger AG | | Building Products | | 65,200 | | | 3,609,025 |
| | | | | | | |
| | | | | | | 19,829,197 |
| | | | | | | |
Brazil 1.8% | | | | | | | |
AES Tiete SA | | Independent Power Producers &
Energy Traders | | 155,680,382 | | | 6,909,410 |
Companhia de Bebidas das Americas (AmBev) | | Beverages | | 29,645 | | | 2,081,812 |
bCompanhia Energetica de Minas Gerais | | Electric Utilities | | 36,432 | | | 691,594 |
Energias do Brasil SA | | Electrical Equipment | | 133,775 | | | 2,171,965 |
cMarfrig Frigorificos e Comercio De Alimentos SA, 144A | | Food Products | | 396,359 | | | 3,395,772 |
Natura Cosmeticos SA | | Personal Products | | 252,304 | | | 2,409,645 |
Porto Seguro SA | | Insurance | | 83,300 | | | 3,088,652 |
Souza Cruz SA | | Tobacco | | 506,617 | | | 13,718,505 |
| | | | | | | |
| | | | | | | 34,467,355 |
| | | | | | | |
China 19.7% | | | | | | | |
Air China Ltd., H | | Airlines | | 5,102,000 | | | 7,602,524 |
Aluminum Corp. of China Ltd., H | | Metals & Mining | | 33,453,000 | | | 69,067,247 |
cAluminum Corp. of China Ltd., H, 144A | | Metals & Mining | | 1,954,000 | | | 4,034,239 |
Beijing Capital Land Ltd., H | | Real Estate Management &
Development | | 3,840,000 | | | 2,334,107 |
China Construction Bank Corp., H | | Commercial Banks | | 7,486,000 | | | 6,345,451 |
China International Marine Containers (Group) Co. Ltd., B | | Machinery | | 1,778,449 | | | 3,300,055 |
China Mobile Ltd. | | Wireless Telecommunication Services | | 2,230,500 | | | 39,443,704 |
China Netcom Group Corp. (Hong Kong) Ltd. | | Diversified Telecommunication Services | | 3,791,000 | | | 11,400,078 |
China Petroleum and Chemical Corp., H | | Oil, Gas & Consumable Fuels | | 30,418,000 | | | 45,950,172 |
China Shenhua Energy Co. Ltd., H | | Oil, Gas & Consumable Fuels | | 1,298,000 | | | 7,756,607 |
China Telecom Corp. Ltd., H | | Diversified Telecommunication Services | | 47,082,000 | | | 37,433,272 |
CNOOC Ltd. | | Oil, Gas & Consumable Fuels | | 17,006,000 | | | 28,960,860 |
Denway Motors Ltd. | | Automobiles | | 27,738,234 | | | 17,820,822 |
Dongfeng Motor Corp., H | | Automobiles | | 13,846,000 | | | 9,765,584 |
aHidili Industry International Development | | Metals & Mining | | 5,172,000 | | | 7,945,597 |
a,cHidili Industry International Development, 144A | | Metals & Mining | | 940,000 | | | 1,444,095 |
Huaneng Power International Inc., H | | Independent Power Producers &
Energy Traders | | 2,286,000 | | | 2,406,748 |
Industrial and Commercial Bank of China, H | | Commercial Banks | | 1,363,000 | | | 978,803 |
Jiangxi Copper Co. Ltd., H | | Metals & Mining | | 3,230,000 | | | 7,927,854 |
Nine Dragons Paper Holdings Ltd. | | Paper & Forest Products | | 894,000 | | | 2,260,766 |
PetroChina Co. Ltd., H | | Oil, Gas & Consumable Fuels | | 29,290,000 | | | 52,209,000 |
Shanghai Industrial Holdings Ltd. | | Industrial Conglomerates | | 2,797,000 | | | 12,195,022 |
aSoho China Ltd. | | Real Estate Management &
Development | | 3,231,500 | | | 3,335,886 |
a,cSoho China Ltd., 144A | | Real Estate Management &
Development | | 1,094,000 | | | 1,129,339 |
Travelsky Technology Ltd., H | | IT Services | | 788,000 | | | 837,707 |
| | | | | | | |
| | | | | | | 383,885,539 |
| | | | | | | |
TD-11
Franklin Templeton Variable Insurance Products Trust
Statement of Investments, December 31, 2007 (continued)
| | | | | | | |
| Templeton Developing Markets Securities Fund | | Industry | | Shares/
Rights | | Value |
Long Term Investments (continued) | | | |
Common Stocks and Rights (continued) | | | |
Egypt 0.2% | | | | | | | |
Orascom Construction Industries | | Construction & Engineering | | 28,719 | | $ | 2,988,338 |
Telecom Egypt | | Diversified Telecommunication
Services | | 344,639 | | | 1,307,644 |
| | | | | | | |
| | | | | | | 4,295,982 |
| | | | | | | |
Hong Kong 1.4% | | | | | | | |
Citic Pacific Ltd. | | Industrial Conglomerates | | 1,012,000 | | | 5,651,710 |
Dairy Farm International Holdings Ltd. | | Food & Staples Retailing | | 958,033 | | | 4,177,024 |
GOME Electrical Appliances Holdings Ltd. | | Specialty Retail | | 3,925,000 | | | 9,965,889 |
Hopson Development Holdings Ltd. | | Real Estate Management &
Development | | 814,000 | | | 2,249,484 |
Hutchison Whampoa Ltd. | | Industrial Conglomerates | | 381,000 | | | 4,321,495 |
VTech Holdings Ltd. | | Communications Equipment | | 220,000 | | | 1,579,872 |
| | | | | | | |
| | | | | | | 27,945,474 |
| | | | | | | |
Hungary 1.3% | | | | | | | |
Magyar Telekom PLC | | Diversified Telecommunication
Services | | 260,980 | | | 1,354,880 |
MOL Hungarian Oil and Gas Nyrt. | | Oil, Gas & Consumable Fuels | | 155,903 | | | 22,028,403 |
OTP Bank Ltd. | | Commercial Banks | | 48,284 | | | 2,448,179 |
| | | | | | | |
| | | | | | | 25,831,462 |
| | | | | | | |
India 5.5% | | | | | | | |
Ashok Leyland Ltd. | | Machinery | | 2,441,613 | | | 3,222,024 |
aBharti Airtel Ltd. | | Wireless Telecommunication Services | | 174,350 | | | 4,400,452 |
Dr. Reddy’s Laboratories Ltd. | | Pharmaceuticals | | 102,515 | | | 1,913,067 |
Gail India Ltd. | | Gas Utilities | | 741,937 | | | 10,205,988 |
Grasim Industries Ltd. | | Construction Materials | | 975 | | | 90,352 |
Hindalco Industries Ltd. | | Metals & Mining | | 1,474,292 | | | 8,038,362 |
Hindustan Unilever Ltd. | | Household Products | | 890,042 | | | 4,831,366 |
Maruti Suzuki India Ltd. | | Automobiles | | 69,329 | | | 1,741,890 |
National Aluminium Co. Ltd. | | Metals & Mining | | 531,656 | | | 6,640,134 |
Oil & Natural Gas Corp. Ltd. | | Oil, Gas & Consumable Fuels | | 880,633 | | | 27,633,618 |
Reliance Industries Ltd. | | Oil, Gas & Consumable Fuels | | 105,798 | | | 7,735,296 |
Satyam Computer Services Ltd. | | IT Services | | 180,985 | | | 2,062,921 |
Tata Chemicals Ltd. | | Chemicals | | 288,562 | | | 3,021,461 |
Tata Consultancy Services Ltd. | | IT Services | | 585,450 | | | 16,095,604 |
Tata Motors Ltd. | | Machinery | | 74,900 | | | 1,410,564 |
Tata Steel Ltd. | | Metals & Mining | | 326,300 | | | 7,740,775 |
| | | | | | | |
| | | | | | | 106,783,874 |
| | | | | | | |
Indonesia 0.4% | | | | | | | |
PT Bank Central Asia Tbk | | Commercial Banks | | 3,686,500 | | | 2,865,206 |
PT Telekomunikasi Indonesia, B | | Diversified Telecommunication
Services | | 5,136,000 | | | 5,550,216 |
| | | | | | | |
| | | | | | | 8,415,422 |
| | | | | | | |
Israel 0.2% | | | | | | | |
aTaro Pharmaceutical Industries Ltd. | | Pharmaceuticals | | 421,589 | | | 3,246,235 |
| | | | | | | |
Mexico 4.5% | | | | | | | |
Alfa SAB de CV | | Industrial Conglomerates | | 314,900 | | | 2,033,567 |
America Movil SAB de CV, L, ADR | | Wireless Telecommunication Services | | 785,958 | | | 48,249,961 |
Cemex SAB de CV, CPO, ADR | | Construction Materials | | 72,810 | | | 1,882,138 |
TD-12
Franklin Templeton Variable Insurance Products Trust
Statement of Investments, December 31, 2007 (continued)
| | | | | | | |
| Templeton Developing Markets Securities Fund | | Industry | | Shares/
Rights | | Value |
Long Term Investments (continued) | | | | | | | |
Common Stocks and Rights (continued) | | | | | | | |
Mexico (continued) | | | | | | | |
Consorcio ARA SAB de CV | | Household Durables | | 608,239 | | $ | 679,721 |
Fomento Economico Mexicano SAB de CV, ADR | | Beverages | | 59,900 | | | 2,286,383 |
Grupo Televisa SA | | Media | | 1,758,426 | | | 8,390,255 |
Kimberly Clark de Mexico SAB de CV, A | | Household Products | | 3,444,116 | | | 15,035,868 |
Telefonos de Mexico SAB de CV, L, ADR | | Diversified Telecommunication
Services | | 217,164 | | | 8,000,322 |
| | | | | | | |
| | | | | | | 86,558,215 |
| | | | | | | |
Pakistan 1.0% | | | | | | | |
MCB Bank Ltd. | | Commercial Banks | | 1,347,758 | | | 8,743,484 |
Oil & Gas Development Co. Ltd. | | Oil, Gas & Consumable Fuels | | 1,471,000 | | | 2,850,137 |
Pakistan Telecommunications Corp., A | | Diversified Telecommunication
Services | | 10,629,808 | | | 7,250,340 |
| | | | | | | |
| | | | | | | 18,843,961 |
| | | | | | | |
Peru 0.4% | | | | | | | |
Compania de Minas Buenaventura SA, ADR | | Metals & Mining | | 130,510 | | | 7,386,866 |
| | | | | | | |
Philippines 0.4% | | | | | | | |
San Miguel Corp., B | | Beverages | | 5,635,093 | | | 8,132,138 |
| | | | | | | |
Poland 0.6% | | | | | | | |
aPolski Koncern Naftowy Orlen SA | | Oil, Gas & Consumable Fuels | | 572,544 | | | 12,035,738 |
| | | | | | | |
Russia 13.0% | | | | | | | |
Bank Of Moscow | | Commercial Banks | | 24,838 | | | 1,297,786 |
Fifth Power Generation Co. | | Electric Utilities | | 1,192,148 | | | 208,864 |
Gazprom, ADR | | Oil, Gas & Consumable Fuels | | 564,100 | | | 31,674,215 |
Gazprom OAO | | Oil, Gas & Consumable Fuels | | 872,000 | | | 12,286,480 |
Gazprom OAO, ADR | | Oil, Gas & Consumable Fuels | | 358,500 | | | 20,326,950 |
LUKOIL, ADR | | Oil, Gas & Consumable Fuels | | 195,908 | | | 16,857,883 |
LUKOIL, ADR | | Oil, Gas & Consumable Fuels | | 93,368 | | | 8,066,995 |
Mining and Metallurgical Co. Norilsk Nickel | | Metals & Mining | | 226,087 | | | 59,913,055 |
OAO TMK, GDR | | Energy Equipment & Services | | 46,000 | | | 2,047,000 |
Sberbank RF | | Commercial Banks | | 4,750,220 | | | 20,045,928 |
TGC-5 JSC | | Independent Power Producers
& Energy Traders | | 39,352,044 | | | 35,614 |
TNK-BP | | Oil, Gas & Consumable Fuels | | 6,726,760 | | | 15,000,675 |
aUnified Energy Systems | | Electric Utilities | | 49,702,100 | | | 65,308,560 |
| | | | | | | |
| | | | | | | 253,070,005 |
| | | | | | | |
Singapore 0.8% | | | | | | | |
ComfortDelGro Corp. Ltd. | | Road & Rail | | 3,250,654 | | | 4,126,884 |
Fraser and Neave Ltd. | | Industrial Conglomerates | | 2,473,005 | | | 10,122,258 |
Keppel Corp. Ltd. | | Industrial Conglomerates | | 143,000 | | | 1,289,674 |
| | | | | | | |
| | | | | | | 15,538,816 |
| | | | | | | |
South Africa 4.6% | | | | | | | |
Barloworld Ltd. | | Industrial Conglomerates | | 160,000 | | | 2,510,124 |
Foschini Ltd. | | Specialty Retail | | 1,324,826 | | | 9,321,063 |
aFreeworld Coatings Ltd. | | Specialty Retail | | 160,000 | | | 245,885 |
Imperial Holdings Ltd. | | Air Freight & Logistics | | 387,779 | | | 5,896,048 |
JD Group Ltd. | | Specialty Retail | | 858,339 | | | 6,376,590 |
Lewis Group Ltd. | | Specialty Retail | | 1,182,661 | | | 7,915,990 |
TD-13
Franklin Templeton Variable Insurance Products Trust
Statement of Investments, December 31, 2007 (continued)
| | | | | | | |
| Templeton Developing Markets Securities Fund | | Industry | | Shares/
Rights | | Value |
Long Term Investments (continued) | | | |
Common Stocks and Rights (continued) | | | |
South Africa (continued) | | | | | | | |
MTN Group Ltd. | | Wireless Telecommunication
Services | | 1,228,460 | | $ | 22,915,745 |
Remgro Ltd. | | Diversified Financial Services | | 715,439 | | | 20,694,060 |
Standard Bank Group Ltd. | | Commercial Banks | | 434,688 | | | 6,337,010 |
Tiger Brands Ltd. | | Food Products | | 294,700 | | | 7,211,886 |
| | | | | | | |
| | | | | | | 89,424,401 |
| | | | | | | |
South Korea 8.0% | | | | | | | |
aDaewoo Shipbuilding & Marine Engineering Co. Ltd. | | Machinery | | 97,330 | | | 5,365,342 |
aGS Holdings Corp. | | Oil, Gas & Consumable Fuels | | 179,110 | | | 11,117,238 |
aKangwon Land Inc. | | Hotels Restaurants & Leisure | | 471,405 | | | 12,388,829 |
bPOSCO | | Metals & Mining | | 15,750 | | | 9,674,964 |
Samsung Electronics Co. Ltd. | | Semiconductors & Semiconductor
Equipment | | 21,974 | | | 13,052,234 |
a,bSamsung Heavy Industries Co. Ltd. | | Machinery | | 194,290 | | | 8,344,061 |
a,bSK Energy Co. Ltd. | | Oil, Gas & Consumable Fuels | | 313,791 | | | 60,676,429 |
aSK Holdings Co. Ltd. | | Industrial Conglomerates | | 120,935 | | | 25,581,037 |
aSKC Co. Ltd. | | Household Durables | | 29,380 | | | 878,842 |
a,bWoori Finance Holdings Co. Ltd. | | Commercial Banks | | 426,000 | | | 8,578,708 |
| | | | | | | |
| | | | | | | 155,657,684 |
| | | | | | | |
Sweden 1.2% | | | | | | | |
Oriflame Cosmetics SA, SDR | | Personal Products | | 349,538 | | | 22,326,924 |
| | | | | | | |
Taiwan 2.9% | | | | | | | |
Compal Communications Inc. | | Communications Equipment | | 1,207,000 | | | 2,996,099 |
MediaTek Inc. | | Semiconductors & Semiconductor
Equipment | | 348,000 | | | 4,517,669 |
Novatek Microelectronics Corp. Ltd. | | Semiconductors & Semiconductor
Equipment | | 2,219,574 | | | 8,486,808 |
President Chain Store Corp. | | Food & Staples Retailing | | 6,552,144 | | | 17,213,773 |
Siliconware Precision Industries Co. | | Semiconductors & Semiconductor
Equipment | | 6,282,666 | | | 11,294,463 |
Sunplus Technology Co. Ltd. | | Semiconductors & Semiconductor
Equipment | | 3,226,485 | | | 4,835,251 |
Taiwan Semiconductor Manufacturing Co. Ltd. | | Semiconductors & Semiconductor
Equipment | | 3,855,414 | | | 7,370,819 |
| | | | | | | |
| | | | | | | 56,714,882 |
| | | | | | | |
Thailand 2.5% | | | | | | | |
Kasikornbank Public Co. Ltd., fgn. | | Commercial Banks | | 4,150,367 | | | 10,780,974 |
aPTT Aromatics & Refining Public Co. Ltd., fgn. | | Oil, Gas & Consumable Fuels | | 1,675,803 | | | 2,139,217 |
PTT Public Co. Ltd., fgn. | | Oil, Gas & Consumable Fuels | | 1,088,000 | | | 12,144,515 |
Siam Cement Public Co. Ltd., fgn. | | Construction Materials | | 2,082,014 | | | 14,463,152 |
Siam Commercial Bank Public Co. Ltd., fgn. | | Commercial Banks | | 1,165,957 | | | 3,011,378 |
Thai Beverages Co. Ltd.,fgn. | | Beverages | | 36,319,000 | | | 6,425,020 |
aTrue Corp. Public Co. Ltd., fgn., rts., 3/28/08 | | Diversified Telecommunication
Services | | 344,616 | | | — |
| | | | | | | |
| | | | | | | 48,964,256 |
| | | | | | | |
Turkey 9.4% | | | | | | | |
Akbank TAS | | Commercial Banks | | 9,133,220 | | | 68,044,542 |
Anadolu Efes Biracilik Ve Malt Sanayii AS | | Beverages | | 615,365 | | | 7,324,833 |
TD-14
Franklin Templeton Variable Insurance Products Trust
Statement of Investments, December 31, 2007 (continued)
| | | | | | | | |
| Templeton Developing Markets Securities Fund | | Industry | | Shares/
Rights | | Value | |
Long Term Investments (continued) | | | | |
Common Stocks and Rights (continued) | | | | |
Turkey (continued) | | | | | | | | |
Arcelik AS, Br. | | Household Durables | | 2,505,906 | | $ | 17,489,303 | |
Tupras-Turkiye Petrol Rafineleri AS | | Oil, Gas & Consumable Fuels | | 1,072,929 | | | 31,468,909 | |
aTurk Hava Yollari Anonim Ortakligi | | Airlines | | 307,000 | | | 2,260,929 | |
a,cTurk Hava Yollari Anonim Ortakligi, 144A | | Airlines | | 1,467,000 | | | 10,803,854 | |
Turkcell Iletisim Hizmetleri AS | | Wireless Telecommunication Services | | 2,388,856 | | | 26,184,848 | |
Turkiye Vakiflar Bankasi T.A.O., D | | Commercial Banks | | 5,243,624 | | | 18,590,112 | |
| | | | | | | | |
| | | | | | | 182,167,330 | |
| | | | | | | | |
United Kingdom 2.1% | | | | | | | | |
Anglo American PLC | | Metals & Mining | | 619,738 | | | 37,465,938 | |
HSBC Holdings PLC | | Commercial Banks | | 224,400 | | | 3,789,831 | |
| | | | | | | | |
| | | | | | | 41,255,769 | |
| | | | | | | | |
Total Common Stocks and Rights
(Cost $1,110,779,407) | | | | | | | 1,612,777,525 | |
| | | | | | | | |
Preferred Stocks 14.3% | | | | | | | | |
Brazil 14.1% | | | | | | | | |
Banco Bradesco SA, ADR, pfd. | | Commercial Banks | | 957,944 | | | 30,654,208 | |
Companhia Vale do Rio Doce, ADR, pfd., A | | Metals & Mining | | 3,725,875 | | | 104,249,982 | |
Itausa - Investimentos Itau SA, pfd. | | Commercial Banks | | 333,100 | | | 2,198,834 | |
Metalurgica Gerdau SA, pfd. | | Metals & Mining | | 167,002 | | | 6,661,316 | |
Petroleo Brasileiro SA, ADR, pfd. | | Oil, Gas & Consumable Fuels | | 1,000,344 | | | 96,253,100 | |
Unibanco - Uniao de Bancos Brasileiros SA, GDR, pfd. | | Commercial Banks | | 159,100 | | | 22,216,724 | |
Usinas Siderurgicas de Minas Gerais SA, pfd., A | | Metals & Mining | | 254,879 | | | 11,669,999 | |
| | | | | | | | |
| | | | | | | 273,904,163 | |
| | | | | | | | |
Chile 0.2% | | | | | | | | |
Embotelladora Andina SA, pfd., A | | Beverages | | 1,409,151 | | | 3,792,072 | |
| | | | | | | | |
Total Preferred Stocks (Cost $117,139,210) | | | | | | | 277,696,235 | |
| | | | | | | | |
Total Long Term Investments (Cost $1,227,918,617) | | | | | | | 1,890,473,760 | |
| | | | | | | | |
| | | |
| | | | | Principal
Amount | | | |
Short Term Investments 3.1% | | | | | | | | |
U.S. Government and Agency Securities 3.1% | | | | | | | | |
dFHLB, 1/02/08 - 4/16/08 | | | | $48,994,000 | | | 48,646,881 | |
dFNMA, 3/28/08 | | | | 11,411,000 | | | 11,299,640 | |
| | | | | | | | |
Total U.S. Government and Agency Securities
(Cost$ 59,914,779) | | | | | | | 59,946,521 | |
| | | | | | | | |
Total Investments (Cost $1,287,833,396) 100.3% | | | | | | | 1,950,420,281 | |
Other Assets, less Liabilities (0.3)% | | | | | | | (5,066,932 | ) |
| | | | | | | | |
Net Assets 100.0% | | | | | | $ | 1,945,353,349 | |
| | | | | | | | |
TD-15
Franklin Templeton Variable Insurance Products Trust
Statement of Investments, December 31, 2007 (continued)
Selected Portfolio Abbreviations
ADR - American Depository Receipt
CPO - Certificates of Ordinary Participation [(usually Mexico)]
FHLB - Federal Home Loan Bank
FNMA - Federal National Mortgage Association
GDR - Global Depository Receipt
SDR - Swedish Depository Receipt
a Non-income producing for the twelve months ended December 31, 2007.
b A portion or all of the securities purchased on a when-issued or delayed delivery basis. See Note 1(c).
c Security was purchased pursuant to Rule 144A under the Securities Act of 1933 and may be sold in transactions exempt from registration only to qualified institutional buyers or in a public offering registered under the Securities Act of 1933. These securities have been deemed liquid under guidelines approved by the Trust’s Board of Trustees. At December 31, 2007, the aggregate value of these securities was $20,807,299, representing 1.07% of net assets.
d The security is traded on a discount basis with no stated coupon rate.
The accompanying notes are an integral part of these financial statements.
TD-16
Franklin Templeton Variable Insurance Products Trust
Financial Statements
Statement of Assets and Liabilities
December 31, 2007
| | | |
| | | Templeton
Developing Markets
Securities Fund |
Assets: | | | |
Investments in securities: | | | |
Cost | | $ | 1,287,833,396 |
| | | |
Value | | $ | 1,950,420,281 |
Foreign currency, at value (cost $4,254,193) | | | 4,308,609 |
Receivables: | | | |
Investment securities sold | | | 9,467,571 |
Capital shares sold | | | 958,184 |
Dividends | | | 3,611,026 |
Other assets | | | 292,069 |
| | | |
Total assets | | | 1,969,057,740 |
| | | |
Liabilities: | | | |
Payables: | | | |
Investment securities purchased | | | 17,008,973 |
Capital shares redeemed | | | 1,798,240 |
Affiliates | | | 2,695,654 |
Funds advanced by custodian | | | 626,251 |
Deferred taxes | | | 714,983 |
Accrued expenses and other liabilities | | | 860,290 |
| | | |
Total liabilities | | | 23,704,391 |
| | | |
Net assets, at value | | $ | 1,945,353,349 |
| | | |
Net assets consist of: | | | |
Paid-in capital | | $ | 1,020,585,189 |
Undistributed net investment income | | | 18,501,125 |
Net unrealized appreciation (depreciation) | | | 661,943,163 |
Accumulated net realized gain (loss) | | | 244,323,872 |
| | | |
Net assets, at value | | $ | 1,945,353,349 |
| | | |
Class 1: | | | |
Net assets, at value | | $ | 753,843,041 |
| | | |
Shares outstanding | | | 46,635,825 |
| | | |
Net asset value and maximum offering price per share | | $ | 16.16 |
| | | |
Class 2: | | | |
Net assets, at value | | $ | 1,090,549,048 |
| | | |
Shares outstanding | | | 68,185,986 |
| | | |
Net asset value and maximum offering price per share | | $ | 15.99 |
| | | |
Class 3: | | | |
Net assets, at value | | $ | 100,961,260 |
| | | |
Shares outstanding | | | 6,325,771 |
| | | |
Net asset value and maximum offering price per sharea | | $ | 15.96 |
| | | |
a | Redemption price is equal to net asset value less any redemption fees retained by the Fund. |
The accompanying notes are an integral part of these financial statements.
TD-17
Franklin Templeton Variable Insurance Products Trust
Financial Statements (continued)
Statement of Operations
for the year ended December 31, 2007
| | | | |
| | | Templeton
Developing Markets
Securities Fund | |
Investment income: | | | | |
Dividends (net of foreign taxes of $3,899,118) | | $ | 58,535,649 | |
Interest | | | 4,409,555 | |
| | | | |
Total investment income | | | 62,945,204 | |
| | | | |
Expenses: | | | | |
Management fees (Note 3a) | | | 21,755,769 | |
Administrative fees (Note 3b) | | | 1,903,487 | |
Distribution fees: (Note 3c) | | | | |
Class 2 | | | 2,373,558 | |
Class 3 | | | 169,148 | |
Unaffiliated transfer agent fees | | | 30,176 | |
Custodian fees (Note 4) | | | 1,835,113 | |
Reports to shareholders | | | 456,417 | |
Professional fees | | | 170,780 | |
Trustees’ fees and expenses | | | 7,219 | |
Other | | | 48,472 | |
| | | | |
Total expenses | | | 28,750,139 | |
Expense reductions (Note 4) | | | (27,725 | ) |
| | | | |
Net expenses | | | 28,722,414 | |
| | | | |
Net investment income | | | 34,222,790 | |
| | | | |
Realized and unrealized gains (losses): | | | | |
Net realized gain (loss) from: | | | | |
Investments | | | 259,937,730 | |
Foreign currency transactions | | | (953,749 | ) |
Swap agreements | | | 958 | |
| | | | |
Net realized gain (loss) | | | 258,984,939 | |
| | | | |
Net change in unrealized appreciation (depreciation) on: | | | | |
Investments | | | 151,070,273 | |
Translation of assets and liabilities denominated in foreign currencies | | | 16,448 | |
Change in deferred taxes on unrealized appreciation (depreciation) | | | (495,514 | ) |
| | | | |
Net change in unrealized appreciation (depreciation) | | | 150,591,207 | |
| | | | |
Net realized and unrealized gain (loss) | | | 409,576,146 | |
| | | | |
Net increase (decrease) in net assets resulting from operations | | $ | 443,798,936 | |
| | | | |
The accompanying notes are an integral part of these financial statements.
TD-18
Franklin Templeton Variable Insurance Products Trust
Financial Statements (continued)
Statements of Changes in Net Assets
| | | | | | | | |
| | | Templeton Developing
Markets Securities Fund | |
| | | Year Ended December 31, | |
| | | 2007 | | | 2006 | |
| | | | |
Increase (decrease) in net assets: | | | | | | | | |
Operations: | | | | | | | | |
Net investment income | | $ | 34,222,790 | | | $ | 27,347,665 | |
Net realized gain (loss) from investments and foreign currency transactions | | | 258,984,939 | | | | 178,863,896 | |
Net change in unrealized appreciation (depreciation) on investments, translation of assets and liabilities denominated in foreign currencies, and deferred taxes | | | 150,591,207 | | | | 155,105,624 | |
| | | | |
Net increase (decrease) in net assets resulting from operations | | | 443,798,936 | | | | 361,317,185 | |
| | | | |
Distributions to shareholders from: | | | | | | | | |
Net investment income: | | | | | | | | |
Class 1 | | | (18,593,912 | ) | | | (8,939,497 | ) |
Class 2 | | | (20,981,252 | ) | | | (8,560,133 | ) |
Class 3 | | | (1,312,631 | ) | | | (315,203 | ) |
Net realized gains: | | | | | | | | |
Class 1 | | | (58,468,438 | ) | | | — | |
Class 2 | | | (72,094,329 | ) | | | — | |
Class 3 | | | (4,338,794 | ) | | | — | |
| | | | |
Total distributions to shareholders | | | (175,789,356 | ) | | | (17,814,833 | ) |
| | | | |
Capital share transactions: (Note 2) | | | | | | | | |
Class 1 | | | (114,240,767 | ) | | | (65,550,558 | ) |
Class 2 | | | 94,364,085 | | | | 32,574,378 | |
Class 3 | | | 47,175,082 | | | | 25,467,947 | |
| | | | |
Total capital share transactions | | | 27,298,400 | | | | (7,508,233 | ) |
| | | | |
Redemption fees | | | 39,617 | | | | 19,233 | |
| | | | |
Net increase (decrease) in net assets | | | 295,347,597 | | | | 336,013,352 | |
Net assets: | | | | | | | | |
Beginning of year | | | 1,650,005,752 | | | | 1,313,992,400 | |
| | | | |
End of year | | $ | 1,945,353,349 | | | $ | 1,650,005,752 | |
| | | | |
Undistributed net investment income included in net assets: | | | | | | | | |
End of year | | $ | 18,501,125 | | | $ | 14,021,116 | |
| | | | |
The accompanying notes are an integral part of these financial statements.
TD-19
Franklin Templeton Variable Insurance Products Trust
Notes to Financial Statements
Templeton Developing Markets Securities Fund
1. ORGANIZATION AND SIGNIFICANT ACCOUNTING POLICIES
Franklin Templeton Variable Insurance Products Trust (Trust) is registered under the Investment Company Act of 1940, as amended, (1940 Act) as an open-end investment company, consisting of twenty-three separate funds. The Templeton Developing Markets Securities Fund (Fund) included in this report is diversified. The financial statements of the remaining funds in the Trust are presented separately. Shares of the Fund are sold only to insurance company separate accounts to fund the benefits of variable life insurance policies or variable annuity contracts. The Fund offers three classes of shares: Class 1, Class 2, and Class 3. Each class of shares differs by its distribution fees, voting rights on matters affecting a single class and its exchange privilege.
The following summarizes the Fund’s significant accounting policies.
a. Security Valuation
Securities listed on a securities exchange or on the NASDAQ National Market System are valued at the last quoted sale price or the official closing price of the day, respectively. Over-the-counter securities and listed securities for which there is no reported sale are valued within the range of the most recent quoted bid and ask prices. Securities that trade in multiple markets or on multiple exchanges are valued according to the broadest and most representative market.
Government securities generally trade in the over-the-counter market rather than on a securities exchange. The Trust may utilize independent pricing services, quotations from bond dealers, and information with respect to bond and note transactions, to assist in determining a current market value for each security. The Trust’s pricing services may use valuation models or matrix pricing which considers information with respect to comparable bond and note transactions, quotations from bond dealers, or by reference to other securities that are considered comparable in such characteristics as rating, interest rate and maturity date, option adjusted spread models, prepayment projections, interest rate spreads and yield curves, to determine current value.
Foreign securities are valued as of the close of trading on the foreign stock exchange on which the security is primarily traded, or the NYSE, whichever is earlier. If no sale is reported at that time, the foreign security will be valued within the range of the most recent quoted bid and ask prices. The value is then converted into its U.S. dollar equivalent at the foreign exchange rate in effect at the close of the NYSE on the day that the value of the foreign security is determined.
The Trust has procedures to determine the fair value of individual securities and other assets for which market prices are not readily available or which may not be reliably priced. Methods for valuing these securities may include: fundamental analysis, matrix pricing, discounts from market prices of similar securities, or discounts applied due to the nature and duration of restrictions on the disposition of the securities. Due to the inherent uncertainty of valuations of such securities, the fair values may differ significantly from the values that would have been used had a ready market for such investments existed. Occasionally, events occur between the time at which trading in a security is completed and the close of the NYSE that might call into question the availability (including the reliability) of the value of a portfolio security held by the Fund. The investment manager monitors price movements following the close of trading in foreign stock markets through a series of country specific market proxies (such as baskets of American Depository Receipts, futures contracts and exchange traded funds). These price movements are measured against established trigger thresholds for each specific market proxy to assist in determining if an event has occurred. If such an event occurs, the securities may be valued using fair value procedures, which may include the use of independent pricing services. All security valuation procedures are approved by the Trust’s Board of Trustees.
b. Foreign Currency Translation
Portfolio securities and other assets and liabilities denominated in foreign currencies are translated into U.S. dollars based on the exchange rate of such currencies against U.S. dollars on the date of valuation. Purchases and sales of securities, income and expense items denominated in foreign currencies are translated into U.S. dollars at the exchange rate in effect on the transaction date. Occasionally, events may impact the availability or reliability of foreign exchange rates used to convert the U.S. dollar equivalent value. If such an event occurs, the foreign exchange rate will be valued at fair value using procedures established and approved by the Trust’s Board of Trustees.
TD-20
Franklin Templeton Variable Insurance Products Trust
Notes to Financial Statements (continued)
Templeton Developing Markets Securities Fund
1. ORGANIZATION AND SIGNIFICANT ACCOUNTING POLICIES (continued)
b. Foreign Currency Translation (continued)
The Fund does not separately report the effect of changes in foreign exchange rates from changes in market prices on securities held. Such changes are included in net realized and unrealized gain or loss from investments on the Statement of Operations.
Realized foreign exchange gains or losses arise from sales of foreign currencies, currency gains or losses realized between the trade and settlement dates on securities transactions and the difference between the recorded amounts of dividends, interest, and foreign withholding taxes and the U.S. dollar equivalent of the amounts actually received or paid. Net unrealized foreign exchange gains and losses arise from changes in foreign exchange rates on foreign denominated assets and liabilities other than investments in securities held at the end of the reporting period.
c. Securities Purchased on a When-Issued or Delayed Delivery Basis
The Fund may purchase securities on a when-issued or delayed delivery basis, with payment and delivery scheduled for a future date. These transactions are subject to market fluctuations and are subject to the risk that the value at delivery may be more or less than the trade date purchase price. Although the Fund will generally purchase these securities with the intention of holding the securities, it may sell the securities before the settlement date. Sufficient assets have been segregated for these securities.
d. Foreign Currency Contracts
When the Fund purchases or sells foreign securities it may enter into foreign exchange contracts to minimize foreign exchange risk from the trade date to the settlement date of the transactions. A foreign exchange contract is an agreement between two parties to exchange different currencies at an agreed upon exchange rate at a future date. Realized and unrealized gains and losses on these contracts are included in the Statement of Operations.
The risks of these contracts include movement in the values of the foreign currencies relative to the U.S. dollar and the possible inability of the counterparties to fulfill their obligations under the contracts, which may be in excess of the amount reflected in the Statement of Assets and Liabilities.
e. Total Return Swaps
The Fund may enter into total return swaps. A total return swap is an agreement between the Fund and a counterparty to exchange a market linked return for a floating rate payment, both based on a notional principal amount. Total return swaps are marked to market daily based upon quotations from the market makers and the change in value, if any, is recorded as an unrealized gain or loss in the Statement of Operations. Payments received or paid are recorded as a realized gain or loss. The risks of entering into a total return swap include the unfavorable fluctuation of interest rates or the price of the underlying security or index, as well as the potential inability of the counterparty to fulfill their obligations under the swap agreement.
f. Income and Deferred Taxes
No provision has been made for U.S. income taxes because it is the Fund’s policy to qualify as a regulated investment company under the Internal Revenue Code and to distribute to shareholders substantially all of its taxable income and net realized gains.
Foreign securities held by the Fund may be subject to foreign taxation on dividend income received. Foreign taxes, if any, are recorded based on the tax regulations and rates that exist in the foreign markets in which the Fund invests.
The Fund may be subject to a tax imposed on net realized gains on securities of certain foreign countries. The Fund records an estimated deferred tax liability for net unrealized gains on these securities in an amount that would be payable if the securities were disposed of on the valuation date.
TD-21
Franklin Templeton Variable Insurance Products Trust
Notes to Financial Statements (continued)
Templeton Developing Markets Securities Fund
1. ORGANIZATION AND SIGNIFICANT ACCOUNTING POLICIES (continued)
g. Security Transactions, Investment Income, Expenses and Distributions
Security transactions are accounted for on trade date. Realized gains and losses on security transactions are determined on a specific identification basis. Interest income and estimated expenses are accrued daily. Dividend income is recorded on the ex-dividend date except that certain dividends from foreign securities are recognized as soon as the Fund is notified of the ex-dividend date. Distributions to shareholders are recorded on the ex-dividend date and are determined according to income tax regulations (tax basis). Distributable earnings determined on a tax basis may differ from earnings recorded in accordance with accounting principles generally accepted in the United States of America. These differences may be permanent or temporary. Permanent differences are reclassified among capital accounts to reflect their tax character. These reclassifications have no impact on net assets or the results of operations. Temporary differences are not reclassified, as they may reverse in subsequent periods.
Common expenses incurred by the Trust are allocated among the funds based on the ratio of net assets of each fund to the combined net assets of the Trust. Fund specific expenses are charged directly to the fund that incurred the expense.
Realized and unrealized gains and losses and net investment income, other than class specific expenses, are allocated daily to each class of shares based upon the relative proportion of net assets of each class. Differences in per share distributions, by class, are generally due to differences in class specific expenses.
h. Accounting Estimates
The preparation of financial statements in accordance with accounting principles generally accepted in the United States of America requires management to make estimates and assumptions that affect the reported amounts of assets and liabilities at the date of the financial statements and the amounts of income and expenses during the reporting period. Actual results could differ from those estimates.
i. Redemption Fees
Redemptions and exchanges of Class 3 shares held 60 days or less may be subject to the Fund’s redemption fee, which is 1% of the amount redeemed. Such fees are retained by the Fund and accounted for as an addition to paid-in capital.
j. Guarantees and Indemnifications
Under the Trust’s organizational documents, its officers and trustees are indemnified by the Trust against certain liabilities arising out of the performance of their duties to the Trust. Additionally, in the normal course of business, the Trust, on behalf of the Fund, enters into contracts with service providers that contain general indemnification clauses. The Trust’s maximum exposure under these arrangements is unknown as this would involve future claims that may be made against the Trust that have not yet occurred. Currently, the Trust expects the risk of loss to be remote.
TD-22
Franklin Templeton Variable Insurance Products Trust
Notes to Financial Statements (continued)
Templeton Developing Markets Securities Fund
2. SHARES OF BENEFICIAL INTEREST
At December 31, 2007, there were an unlimited number of shares authorized (without par value). Transactions in the Fund’s shares were as follows:
| | | | | | | | | | | | | | |
| | | Year Ended December 31, | |
| | | 2007 | | | 2006 | |
| Class 1 Shares: | | Shares | | | Amount | | | Shares | | | Amount | |
Shares sold | | 4,490,443 | | | $ | 69,191,583 | | | 8,227,856 | | | $ | 99,913,441 | |
Shares issued in reinvestment of distributions | | 5,385,210 | | | | 77,062,349 | | | 823,158 | | | | 8,939,497 | |
Shares redeemed | | (17,058,565 | ) | | | (260,494,699 | ) | | (14,545,716 | ) | | | (174,403,496 | ) |
| | | | |
Net increase (decrease) | | (7,182,912 | ) | | $ | (114,240,767 | ) | | (5,494,702 | ) | | $ | (65,550,558 | ) |
| | | | |
| Class 2 Shares: | | | | | | | | | | | | |
Shares sold | | 16,188,250 | | | $ | 242,521,079 | | | 18,145,883 | | | $ | 219,369,554 | |
Shares issued in reinvestment of distributions | | 6,563,863 | | | | 93,075,581 | | | 794,812 | | | | 8,560,133 | |
Shares redeemed | | (16,746,979 | ) | | | (241,232,575 | ) | | (16,460,489 | ) | | | (195,355,309 | ) |
| | | | |
Net increase (decrease) | | 6,005,134 | | | $ | 94,364,085 | | | 2,480,206 | | | $ | 32,574,378 | |
| | | | |
| Class 3 Shares: | | | | | | | | | | | | |
Shares sold | | 4,138,936 | | | $ | 61,021,476 | | | 2,626,549 | | | $ | 31,906,146 | |
Shares issued in reinvestment of distributions | | 399,394 | | | | 5,651,425 | | | 29,294 | | | | 315,203 | |
Shares redeemed | | (1,360,665 | ) | | | (19,497,819 | ) | | (564,285 | ) | | | (6,753,402 | ) |
| | | | |
Net increase (decrease) | | 3,177,665 | | | $ | 47,175,082 | | | 2,091,558 | | | $ | 25,467,947 | |
| | | | |
3. TRANSACTIONS WITH AFFILIATES
Franklin Resources, Inc. is the holding company for various subsidiaries that together are referred to as Franklin Templeton Investments. Certain officers and trustees of the Trust are also officers and/or directors of the following subsidiaries:
| | |
| Subsidiary | | Affiliation |
Templeton Asset Management Ltd. (TAML) | | Investment manager |
Franklin Templeton Services, LLC (FT Services) | | Administrative manager |
Franklin Templeton Distributors, Inc. (Distributors) | | Principal underwriter |
Franklin Templeton Investor Services, LLC (Investor Services) | | Transfer agent |
a. Management Fees
The Fund pays an investment management fee to TAML based on the average daily net assets of the Fund as follows:
| | |
| Annualized Fee Rate | | Net Assets |
| 1.250% | | Up to and including $1 billion |
| 1.200% | | Over $1 billion, up to and including $5 billion |
| 1.150% | | Over $5 billion, up to and including $10 billion |
| 1.100% | | Over $10 billion, up to and including $15 billion |
| 1.050% | | Over $15 billion, up to and including $20 billion |
| 1.000% | | In excess of $20 billion |
TD-23
Franklin Templeton Variable Insurance Products Trust
Notes to Financial Statements (continued)
Templeton Developing Markets Securities Fund
3. TRANSACTIONS WITH AFFILIATES (continued)
b. Administrative Fees
The Fund pays an administrative fee to FT Services based on the Fund’s average daily net assets as follows:
| | |
| Annualized Fee Rate | | Net Assets |
| 0.150% | | Up to and including $200 million |
| 0.135% | | Over $200 million, up to and including $700 million |
| 0.100% | | Over $700 million, up to and including $1.2 billion |
| 0.075% | | In excess of $1.2 billion |
c. Distribution Fees
The Fund’s Board of Trustees has adopted distribution plans for Class 2 and Class 3 shares pursuant to Rule 12b-1 under the 1940 Act. Under the Fund’s compensation distribution plans, the Fund pays Distributors for costs incurred in connection with the servicing, sale and distribution of the Fund’s shares up to 0.25% and 0.35% per year of its average daily net assets of Class 2 and Class 3, respectively. The Board of Trustees has agreed to limit the current rate to 0.25% per year for Class 3.
d. Transfer Agent Fees
Investor Services, under terms of an agreement, performs shareholder servicing for the Fund and is not paid by the Fund for the services.
4. EXPENSE OFFSET ARRANGEMENT
The Fund has entered into an arrangement with its custodian whereby credits realized as a result of uninvested cash balances are used to reduce a portion of the Fund’s custodian expenses. During the year ended December 31, 2007, the custodian fees were reduced as noted in the Statement of Operations.
5. INCOME TAXES
The Fund has reviewed the tax positions taken on federal income tax returns, for each of the three open tax years and as of December 31, 2007 and has determined that no provision for income tax is required in the Fund’s financial statements.
For tax purposes, realized currency losses occurring subsequent to October 31, may be deferred and treated as occurring on the first day of the following fiscal year. At December 31, 2007, the Fund deferred realized currency losses of $1,080,193.
The tax character of distributions paid during the years ended December 31, 2007 and 2006, was as follows:
| | | | | | |
| | | 2007 | | 2006 |
Distributions paid from: | | | | | | |
Ordinary income | | $ | 46,036,795 | | $ | 17,814,833 |
Long term capital gain | | | 129,752,561 | | | — |
| | | |
| | | 175,789,356 | | | 17,814,833 |
| | | |
TD-24
Franklin Templeton Variable Insurance Products Trust
Notes to Financial Statements (continued)
Templeton Developing Markets Securities Fund
5. INCOME TAXES (continued)
At December 31, 2007, the cost of investments, net unrealized appreciation (depreciation), undistributed ordinary income and undistributed long term capital gains for income tax purposes were as follows:
| | | | |
Cost of investments | | $ | 1,310,370,388 | |
| | | | |
| |
Unrealized appreciation | | $ | 676,242,874 | |
Unrealized depreciation | | | (36,192,981 | ) |
| | | | |
Net unrealized appreciation (depreciation) | | $ | 640,049,893 | |
| | | | |
Undistributed ordinary income | | $ | 54,789,462 | |
Undistributed long term capital gains | | | 231,690,488 | |
| | | | |
Distributable earnings | | $ | 286,479,950 | |
| | | | |
Net investment income differs for financial statement and tax purposes primarily due to differing treatments of foreign currency transactions, passive foreign investment company shares, and foreign capital gain taxes.
Net realized gains (losses) differ for financial statement and tax purposes primarily due to differing treatments of wash sales, foreign currency transactions, passive foreign investment company shares, and foreign capital gain taxes.
6. INVESTMENT TRANSACTIONS
Purchases and sales of investments (excluding short term securities) for the year ended December 31, 2007, aggregated $1,671,935,243 and $1,811,445,079, respectively.
7. CONCENTRATION OF RISK
Investing in foreign securities may include certain risks and considerations not typically associated with investing in U.S. securities, such as fluctuating currency values and changing local and regional economic, political and social conditions, which may result in greater market volatility. In addition, certain foreign securities may not be as liquid as U.S. securities.
8. REGULATORY AND LITIGATION MATTERS
As part of various investigations by a number of federal, state, and foreign regulators and governmental entities, including the Securities and Exchange Commission (“SEC”), relating to certain practices in the mutual fund industry, including late trading, market timing and marketing support payments to securities dealers who sell fund shares (“marketing support”), Franklin Resources, Inc. and certain of its subsidiaries (collectively, the “Company”), entered into settlements with certain of those regulators and governmental entities. Specifically, the Company entered into settlements with the SEC, among others, concerning market timing and marketing support.
On June 6, 2007, the SEC posted for public comment the proposed plan of distribution for the market timing settlement. Once the SEC approves the final plan of distribution, disbursements of settlement monies will be made promptly to individuals who were shareholders of the designated funds during the relevant period, in accordance with the terms and conditions of the settlement and plan.
TD-25
Franklin Templeton Variable Insurance Products Trust
Notes to Financial Statements (continued)
Templeton Developing Markets Securities Fund
8. REGULATORY AND LITIGATION MATTERS (continued)
In addition, the Company, as well as most of the mutual funds within Franklin Templeton Investments and certain current or former officers, Company directors, fund directors, and employees, have been named in private lawsuits (styled as shareholder class actions, or as derivative actions on behalf of either the named funds or Franklin Resources, Inc.). The lawsuits relate to the industry practices referenced above.
The Company and fund management believe that the claims made in each of the private lawsuits referenced above are without merit and intend to defend against them vigorously. The Company cannot predict with certainty the eventual outcome of these lawsuits, nor whether they will have a material negative impact on the Company. If it is determined that the Company bears responsibility for any unlawful or inappropriate conduct that caused losses to the Fund, it is committed to making the Fund or its shareholders whole, as appropriate.
9. NEW ACCOUNTING PRONOUNCEMENT
In September 2006, the Financial Accounting Standards Board (FASB) issued FASB Statement No. 157, “Fair Value Measurement” (SFAS 157), which defines fair value, establishes a framework for measuring fair value, and expands disclosures about fair value measurements. SFAS 157 is effective for fiscal years beginning after November 15, 2007, and interim periods within those fiscal years. The Trust believes the adoption of SFAS 157 will have no material impact on its financial statements.
TD-26
Franklin Templeton Variable Insurance Products Trust
Templeton Developing Markets Securities Fund
Report of Independent Registered Public Accounting Firm
To the Board of Trustees and Shareholders of
Franklin Templeton Variable Insurance Products Trust
In our opinion, the accompanying statement of assets and liabilities, including the statement of investments, and the related statements of operations and of changes in net assets and the financial highlights present fairly, in all material respects, the financial position of Templeton Developing Markets Securities Fund (one of the funds constituting Franklin Templeton Variable Insurance Products Trust, hereafter referred to as the “Fund”) at December 31, 2007, the results of its operations for the year then ended, the changes in its net assets for each of the two years in the period then ended and the financial highlights for each of the periods presented, in conformity with accounting principles generally accepted in the United States of America. These financial statements and financial highlights (hereafter referred to as “financial statements”) are the responsibility of the Fund’s management. Our responsibility is to express an opinion on these financial statements based on our audits. We conducted our audits of these financial statements in accordance with the standards of the Public Company Accounting Oversight Board (United States). Those standards require that we plan and perform the audit to obtain reasonable assurance about whether the financial statements are free of material misstatement. An audit includes examining, on a test basis, evidence supporting the amounts and disclosures in the financial statements, assessing the accounting principles used and significant estimates made by management, and evaluating the overall financial statement presentation. We believe that our audits, which included confirmation of securities at December 31, 2007 by correspondence with the custodian and brokers, provide a reasonable basis for our opinion.
PricewaterhouseCoopers LLP
San Francisco, California
February 14, 2008
TD-27
Franklin Templeton Variable Insurance Products Trust
Tax Designation (unaudited)
Templeton Developing Markets Securities Fund
Under Section 852(b)(3)(C) of the Internal Revenue Code (Code), the Fund designates the maximum amount allowable but no less than $231,696,782 as a long term capital gain dividend for the fiscal year ended December 31, 2007.
At December 31, 2007, more than 50% of the Fund’s total assets were invested in securities of foreign issuers. In most instances, foreign taxes were withheld from income paid to the Fund on these investments. The Fund elects to treat foreign taxes paid as allowed under Section 853 of the Code. This election will allow shareholders of record as of the 2008 distribution date, to treat their proportionate share of foreign taxes paid by the Fund as having been paid directly by them. The shareholder shall consider these amounts as foreign taxes paid in the tax year in which they receive the Fund distribution.
TD-28
TEMPLETON FOREIGN SECURITIES FUND
We are pleased to bring you Templeton Foreign Securities Fund’s annual report for the fiscal year ended December 31, 2007.
Performance Summary as of 12/31/07
Average annual total return of Class 3 shares* represents the average annual change in value, assuming reinvestment of dividends and capital gains. Average returns smooth out variations in returns, which can be significant; they are not the same as year-by-year results.
Periods ended 12/31/07
| | | | | | |
| | | 1-Year | | 5-Year | | 10-Year |
Average Annual Total Return | | +15.45% | | +19.33% | | +8.07% |
*Performance prior to the 5/1/00 merger reflects historical performance of Templeton International Fund. Since Class 3 shares were not offered until 5/1/04, performance prior to that date represents historical Class 2 performance. Since 5/1/04 (effective date), the average annual total return of Class 3 shares was +17.32%.
Total Return Index Comparison for Hypothetical $10,000 Investment (1/1/98–12/31/07)
The graph below shows the change in value of a hypothetical $10,000 investment in the Fund over the indicated period and includes reinvestment of any income or distributions. The Fund’s performance* is compared to the performance of the Morgan Stanley Capital International (MSCI) Europe, Australasia, Far East (EAFE) Index. One cannot invest directly in an index, nor is an index representative of the Fund’s portfolio. Please see Important Notes to Performance Information preceding the Fund Summaries.
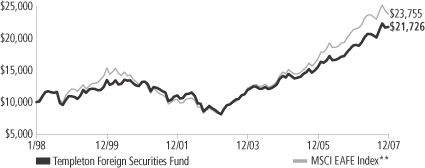
**Source: Standard & Poor’s Micropal. Please see Index Descriptions following the Fund Summaries.
Templeton Foreign Securities Fund – Class 3
Performance reflects the Fund’s Class 3 operating expenses, but does not include any contract fees, expenses or sales charges. If they had been included, performance would be lower. These charges and deductions, particularly for variable life policies, can have a significant effect on contract values and insurance benefits. See the contract prospectus for a complete description of these expenses, including sales charges.
Performance data represent past performance, which does not guarantee future results. Investment return and principal value will fluctuate, and you may have a gain or loss when you sell your shares. Current performance may differ from figures shown.
TF-1
Fund Goal and Main Investments: Templeton Foreign Securities Fund seeks long-term capital growth. The Fund normally invests at least 80% of its net assets in investments of issuers located outside the U.S., including those in emerging markets, and normally invests predominantly in equity securities.
Performance Overview
You can find the Fund’s one-year total return in the Performance Summary. The Fund outperformed its benchmark, the MSCI EAFE Index, which returned +11.63% for the same period.1 Please note that index performance information is provided for reference and that we do not attempt to track the index but rather undertake investments on the basis of fundamental research.
Economic and Market Overview
In spite of elevated energy prices and widespread fears of contagion from the deteriorating U.S. housing situation, the global economy remained resilient in 2007. Consumer and corporate demand strength, particularly in China and other developing economies, generally favorable employment and accommodative monetary policies continued to underpin the current expansionary period that began in 2002.
These factors also contributed to the strength of global equity markets during 2007. However, concerns about slower growth and declining asset quality surfaced in the first quarter. These were initially centered on the U.S. subprime mortgage market but spread in August to global capital markets. Difficulties in assessing risk and the value of collateral in the structured finance industry contributed to declining risk appetite among lenders and investors. The private equity industry, which relies on the availability of cheap credit, played a pivotal role in several large and high-profile acquisitions and helped boost merger and acquisition activity in the first half of the year. This was an important driver of equity performance, but as liquidity dried up in the second half of the year, significantly slower money flows from private equity weighed on market performance. However, global merger and acquisition activity still reached record levels. The staggering $4.5 trillion of deals announced in 2007 eclipsed the previous record from 2006 by 24%.2
1. Source: Standard & Poor’s Micropal. One cannot invest directly in an index, nor is an index representative of the Fund’s portfolio. Please see Index Descriptions following the Fund Summaries.
2. Source: “For Deal Makers, Tale of Two Halves,” The Wall Street Journal, 1/2/08.
Fund Risks: The Fund’s investments in stocks offer the potential for long-term gains but can be subject to short-term price fluctuations. Foreign investing, especially in emerging markets, involves additional risks, including currency fluctuations, economic instability, market volatility, and political and social instability. By having significant investments in one or more countries or in particular sectors from time to time, the Fund may carry greater risk of adverse developments in a country or sector than a fund that invests more broadly. The Fund’s prospectus also includes a description of the main investment risks.
TF-2
To alleviate the credit crunch and restore investor confidence, the world’s major central banks infused capital into the system, and the U.S. Federal Reserve Board reduced its target interest rate by a full percentage point. However, credit and equity markets continued to face headwinds as write-downs and losses from subprime mortgage financing affected many large financial institutions toward the end of the year, and equity prices remained volatile.
For the year, however, global and non-U.S. equity markets registered the fifth consecutive year of double-digit total returns, making this an exceptionally strong period for investors in global equities. Broad-based stock performance by European and Asian shares at least doubled that of U.S. stocks, while emerging market equity returns more than tripled those in developed markets. Led by the BRIC countries, Brazil, Russia, India and China, emerging market economies continued to grow at accelerated rates, supporting elevated prices for oil and other commodities. At the same time, investment inflows from developed economies continued to underpin equity prices in emerging markets. In addition, U.S. dollar weakness versus the currencies of many major trading partners enhanced equity returns for U.S.-based investors holding stocks denominated in these currencies.
Investment Strategy
Our investment philosophy is bottom-up, value-oriented and long-term. In choosing investments, we generally focus on the market price of a company’s securities relative to our evaluation of the company’s potential long-term earnings, asset value and cash flow. Among factors we consider are a company’s historical value measures, including price/earnings ratio, profit margins and liquidation value. We do in-depth research to construct a bargain list from which we buy.
Manager’s Discussion
The Fund’s performance relative to the benchmark index was positively affected by its overweighted exposure to the consumer discretionary sector.3 The best performing stocks in the sector included French satellite operator Eutelsat Communications, U.K.-based British Sky Broadcasting Group, Dutch publisher Reed Elsevier and Japanese consumer electronics firm Sony (sold by period-end).
3. The consumer discretionary sector comprises auto components; hotels, restaurants and leisure; household durables; media; specialty retail; and textiles, apparel and luxury goods in the SOI.

TF-3
The Fund’s overweighting in the energy sector also boosted relative performance for the year.4 Top performers included Indian energy companies Reliance Industries, Hindustan Petroleum and Indian Oil. In the industrials sector, German conglomerate Siemens as well as wind turbine manufacturers Vestas Wind Systems (Denmark) and Gamesa (Spain) also benefited the Fund.5
Additionally, our overweighted telecommunications services sector exposure also aided relative returns.6 Standout performers included European wireless operators Vodafone Group (U.K.), Turkcell Iletism Hizmetleri (Turkey) and Mobile Telesystems (Russia), European fixed-line operators Telefonica (Spain), Telenor (Norway) and France Telecom, and Asian operators Singapore Telecommunications and China Telecom.
It is important to recognize the effect of currency movements on the Fund’s performance. In general, if the value of the U.S. dollar goes up compared with a foreign currency, an investment traded in that foreign currency will go down in value because it will be worth fewer U.S. dollars. This can have a negative effect on Fund performance. Conversely, when the U.S. dollar weakens in relation to a foreign currency, an investment traded in that foreign currency will increase in value, which can contribute to Fund performance. For the 12 months ended December 31, 2007, the U.S. dollar fell in value relative to most non-U.S. currencies. As a result, the Fund’s performance was positively affected by the portfolio’s investment predominantly in securities with non-U.S. currency exposure. However, one cannot expect the same result in future periods.
In contrast, returns relative to the benchmark suffered from the Fund’s overweighted position in the information technology sector, which underperformed the index.7 Stocks that lost value in this sector included German semiconductor companies Qimonda and Infineon
4. The energy sector comprises oil, gas and consumable fuels in the SOI.
5. The industrials sector comprises aerospace and defense, air freight and logistics, commercial services and supplies, electrical equipment, and industrial conglomerates in the SOI.
6. The telecommunication services sector comprises diversified telecommunication services and wireless telecommunication services in the SOI.
7. The information technology sector comprises computers and peripherals, electronic equipment and instruments, semiconductors and semiconductor equipment, and software in the SOI.
Top 10 Holdings
Templeton Foreign Securities Fund
12/31/07
| | |
Company
Sector/Industry,
Country | | % of Total
Net Assets |
| |
| Siemens AG | | 2.6% |
| Industrial Conglomerates, Germany | | |
| |
Cheung Kong
(Holdings) Ltd. | | 2.5% |
| Real Estate Management & Development, Hong Kong | | |
| |
| Reliance Industries Ltd. | | 2.5% |
| Oil, Gas & Consumable Fuels, India | | |
| |
| Sanofi-Aventis | | 2.4% |
| Pharmaceuticals, France | | |
| |
| Royal Dutch Shell PLC, B | | 2.4% |
| Oil, Gas & Consumable Fuels, U.K. | | |
| |
| GlaxoSmithKline PLC | | 2.2% |
| Pharmaceuticals, U.K. | �� | |
| |
| France Telecom SA | | 2.1% |
| Diversified Telecommunication Services, France | | |
| |
| BP PLC | | 2.0% |
| Oil, Gas & Consumable Fuels, U.K. | | |
| |
| Telefonica SA, ADR | | 2.0% |
| Diversified Telecommunication Services, Spain | | |
| |
| ING Groep NV | | 2.0% |
| Diversified Financial Services, Netherlands | | |
The dollar value, number of shares or principal amount, and names of all portfolio holdings are listed in the Fund’s Statement of Investments (SOI).
TF-4
Technologies, Asian semiconductor manufacturers Samsung Electronics and Taiwan Semiconductor Manufacturing, and Japanese companies NEC (sold by period-end) and FUJIFILM Holdings.
The Fund’s relative performance was also negatively impacted by its underweighting in the materials sector, which outperformed the index.8 Specifically, limited exposure to the outperforming metals and mining industry and holdings in European paper companies Stora Enso (Finland), Norske Skogindustrier (Norway) and UPM-Kymmene (Finland) hampered the Fund.
Although the Fund was slightly underweighted in the underperforming financials sector, a number of individual financial holdings declined sharply in value and hurt Fund performance.9 These included U.K.-based Royal Bank of Scotland Group as well as Japan’s Shinsei Bank and Sumitomo Mitsui Financial Group.
Thank you for your participation in Templeton Foreign Securities Fund. We look forward to serving your future investment needs.
8. The materials sector comprises chemicals, containers and packaging, metals and mining, and paper and forest products in the SOI.
9. The financials sector comprises capital markets, commercial banks, diversified financial services, insurance, and real estate management and development in the SOI.
The foregoing information reflects our analysis, opinions and portfolio holdings as of December 31, 2007, the end of the reporting period. The way we implement our main investment strategies and the resulting portfolio holdings may change depending on factors such as market and economic conditions. These opinions may not be relied upon as investment advice or an offer for a particular security. The information is not a complete analysis of every aspect of any market, country, industry, security or the Fund. Statements of fact are from sources considered reliable, but the investment manager makes no representation or warranty as to their completeness or accuracy. Although historical performance is no guarantee of future results, these insights may help you understand our investment management philosophy.
TF-5
Fund Expenses
As an investor in a variable insurance contract (Contract) that indirectly provides for investment in an underlying mutual fund, you can incur transaction and/or ongoing expenses at both the Fund level and the Contract level.
| • | | Transaction expenses can include sales charges (loads) on purchases, redemption fees, surrender fees, transfer fees and premium taxes. |
| • | | Ongoing expenses can include management fees, distribution and service (12b-1) fees, contract fees, annual maintenance fees, mortality and expense risk fees and other fees and expenses. All mutual funds and Contracts have some types of ongoing expenses. |
The expenses shown in the table are meant to highlight ongoing expenses at the Fund level only and do not include ongoing expenses at the Contract level, or transaction expenses at either the Fund or Contract level. While the Fund does not have transaction expenses, if the transaction and ongoing expenses at the Contract level were included, the expenses shown below would be higher. You should consult your Contract prospectus or disclosure document for more information.
The table shows Fund-level ongoing expenses and can help you understand these expenses and compare them with those of other mutual funds offered through the Contract. The table assumes a $1,000 investment held for the six months indicated. Please refer to the Fund prospectus for additional information on operating expenses.
Actual Fund Expenses
The first line (Actual) of the table provides actual account values and expenses. The “Ending Account Value” is derived from the Fund’s actual return, which includes the effect of ongoing Fund expenses, but does not include the effect of ongoing Contract expenses.
You can estimate the Fund-level expenses you incurred during the period by following these steps. Of course, your account value and expenses will differ from those in this illustration:
| 1. | Divide your account value by $1,000. |
If an account had an $8,600 value, then $8,600 ÷ $1,000 = 8.6.
| 2. | Multiply the result by the number under the heading “Fund-Level Expenses Incurred During Period.” |
If Fund-Level Expenses Incurred During Period were $7.50, then 8.6 x $7.50 = $64.50.
In this illustration, the estimated expenses incurred this period at the Fund level are $64.50.
Templeton Foreign Securities Fund – Class 3
TF-6
Hypothetical Example for Comparison with Other Mutual Funds
Information in the second line (Hypothetical) of the table can help you compare ongoing expenses of the Fund with those of other mutual funds offered through the Contract. This information may not be used to estimate the actual ending account balance or expenses you incurred during the period. The hypothetical “Ending Account Value” is based on the Fund’s actual expense ratio and an assumed 5% annual rate of return before expenses, which does not represent the Fund’s actual return. The figure under the heading “Fund-Level Expenses Incurred During Period” shows the hypothetical expenses your account would have incurred under this scenario. You can compare this figure with the 5% hypothetical examples that appear in shareholder reports of other funds offered through a Contract.
| | | | | | | | | |
| Class 3 | | Beginning
Account
Value 7/1/07 | | Ending
Account
Value 12/31/07 | | Fund-Level
Expenses Incurred
During Period* 7/1/07–12/31/07 |
Actual | | $ | 1,000 | | $ | 1,154.50 | | $ | 5.48 |
Hypothetical (5% return before expenses) | | $ | 1,000 | | $ | 1,020.11 | | $ | 5.14 |
*Expenses are calculated using the most recent six-month annualized expense ratio for the Fund’s Class 3 shares (1.01%), which does not include any ongoing expenses of the Contract for which the Fund is an investment option, multiplied by the average account value over the period, multiplied by 184/365 to reflect the one-half year period.
TF-7
Franklin Templeton Variable Insurance Products Trust
Financial Highlights
Templeton Foreign Securities Fund
| | | | | | | | | | | | | | | | | | | | |
| | | Year Ended December 31, | |
| Class 1 | | 2007 | | | 2006 | | | 2005 | | | 2004 | | | 2003 | |
| | | | |
Per share operating performance | | | | | | | | | | | | | | | | | | | | |
(for a share outstanding throughout the year) | | | | | | | | | | | | | | | | | | | | |
Net asset value, beginning of year | | $ | 19.00 | | | $ | 15.84 | | | $ | 14.53 | | | $ | 12.37 | | | $ | 9.51 | |
| | | | |
Income from investment operationsa: | | | | | | | | | | | | | | | | | | | | |
Net investment incomeb | | | 0.45 | | | | 0.46 | | | | 0.30 | | | | 0.26 | | | | 0.19 | |
Net realized and unrealized gains (losses) | | | 2.46 | | | | 2.94 | | | | 1.20 | | | | 2.05 | | | | 2.87 | |
| | | | |
Total from investment operations | | | 2.91 | | | | 3.40 | | | | 1.50 | | | | 2.31 | | | | 3.06 | |
| | | | |
Less distributions from: | | | | | | | | | | | | | | | | | | | | |
Net investment income | | | (0.44 | ) | | | (0.24 | ) | | | (0.19 | ) | | | (0.15 | ) | | | (0.20 | ) |
Net realized gains | | | (0.90 | ) | | | — | | | | — | | | | — | | | | — | |
| | | | |
Total distributions | | | (1.34 | ) | | | (0.24 | ) | | | (0.19 | ) | | | (0.15 | ) | | | (0.20 | ) |
| | | | |
Redemption fees | | | — | d | | | — | d | | | — | d | | | — | d | | | — | |
| | | | |
Net asset value, end of year | | $ | 20.57 | | | $ | 19.00 | | | $ | 15.84 | | | $ | 14.53 | | | $ | 12.37 | |
| | | | |
| | | | | |
Total returnc | | | 15.79% | | | | 21.70% | | | | 10.48% | | | | 18.87% | | | | 32.55% | |
Ratios to average net assets | | | | | | | | | | | | | | | | | | | | |
Expenses | | | 0.75% | e | | | 0.75% | e | | | 0.77% | e | | | 0.82% | e | | | 0.87% | |
Net investment income | | | 2.22% | | | | 2.63% | | | | 2.03% | | | | 1.95% | | | | 1.81% | |
| | | | | |
Supplemental data | | | | | | | | | | | | | | | | | | | | |
Net assets, end of year (000’s) | | $ | 531,377 | | | $ | 594,991 | | | $ | 531,775 | | | $ | 506,456 | | | $ | 472,665 | |
Portfolio turnover rate | | | 26.74% | | | | 18.97% | f | | | 14.61% | | | | 10.91% | | | | 18.01% | |
a The amount shown for a share outstanding throughout the period may not correlate with the Statement of Operations for the period due to the timing of sales and repurchases of the Fund shares in relation to income earned and/or fluctuating market value of the investments of the Fund.
b Based on average daily shares outstanding.
c Total return does not include any fees, charges or expenses imposed by the variable annuity and life insurance contracts for which the Franklin Templeton Variable Insurance Products Trust serves as an underlying investment vehicle.
d Amount rounds to less than $0.01 per share.
e Benefit of expense reduction rounds to less than 0.01%.
f Excludes the value of portfolio securities delivered as a result of a redemption in-kind. See Note 9.
The accompanying notes are an integral part of these financial statements.
TF-8
Franklin Templeton Variable Insurance Products Trust
Financial Highlights (continued)
Templeton Foreign Securities Fund
| | | | | | | | | | | | | | | | | | | | |
| | | Year Ended December 31, | |
| Class 2 | | 2007 | | | 2006 | | | 2005 | | | 2004 | | | 2003 | |
| | | | |
Per share operating performance | | | | | | | | | | | | | | | | | | | | |
(for a share outstanding throughout the year) | | | | | | | | | | | | | | | | | | | | |
Net asset value, beginning of year | | $ | 18.73 | | | $ | 15.63 | | | $ | 14.35 | | | $ | 12.24 | | | $ | 9.42 | |
| | | | |
Income from investment operationsa: | | | | | | | | | | | | | | | | | | | | |
Net investment incomeb | | | 0.38 | | | | 0.40 | | | | 0.26 | | | | 0.22 | | | | 0.15 | |
Net realized and unrealized gains (losses) | | | 2.44 | | | | 2.91 | | | | 1.19 | | | | 2.03 | | | | 2.85 | |
| | | | |
Total from investment operations | | | 2.82 | | | | 3.31 | | | | 1.45 | | | | 2.25 | | | | 3.00 | |
| | | | |
Less distributions from: | | | | | | | | | | | | | | | | | | | | |
Net investment income | | | (0.40 | ) | | | (0.21 | ) | | | (0.17 | ) | | | (0.14 | ) | | | (0.18 | ) |
Net realized gains | | | (0.90 | ) | | | — | | | | — | | | | — | | | | — | |
| | | | |
Total distributions | | | (1.30 | ) | | | (0.21 | ) | | | (0.17 | ) | | | (0.14 | ) | | | (0.18 | ) |
| | | | |
Redemption fees | | | — | d | | | — | d | | | — | d | | | — | d | | | — | |
| | | | |
Net asset value, end of year | | $ | 20.25 | | | $ | 18.73 | | | $ | 15.63 | | | $ | 14.35 | | | $ | 12.24 | |
| | | | |
| | | | | |
Total returnc | | | 15.46% | | | | 21.44% | | | | 10.17% | | | | 18.53% | | | | 32.21% | |
Ratios to average net assets | | | | | | | | | | | | | | | | | | | | |
Expenses | | | 1.00% | e | | | 1.00% | e | | | 1.02% | e | | | 1.07% | e | | | 1.12% | |
Net investment income | | | 1.97% | | | | 2.38% | | | | 1.78% | | | | 1.70% | | | | 1.56% | |
| | | | | |
Supplemental data | | | | | | | | | | | | | | | | | | | | |
Net assets, end of year (000’s) | | $ | 3,255,154 | | | $ | 2,941,374 | | | $ | 2,232,990 | | | $ | 1,445,928 | | | $ | 653,594 | |
Portfolio turnover rate | | | 26.74% | | | | 18.97% | f | | | 14.61% | | | | 10.91% | | | | 18.01% | |
a The amount shown for a share outstanding throughout the period may not correlate with the Statement of Operations for the period due to the timing of sales and repurchases of the Fund shares in relation to income earned and/or fluctuating market value of the investments of the Fund.
b Based on average daily shares outstanding.
c Total return does not include any fees, charges or expenses imposed by the variable annuity and life insurance contracts for which the Franklin Templeton Variable Insurance Products Trust serves as an underlying investment vehicle.
d Amount rounds to less than $0.01 per share.
e Benefit of expense reduction rounds to less than 0.01%.
f Excludes the value of portfolio securities delivered as a result of a redemption in-kind. See Note 9.
The accompanying notes are an integral part of these financial statements.
TF-9
Franklin Templeton Variable Insurance Products Trust
Financial Highlights (continued)
Templeton Foreign Securities Fund
| | | | | | | | | | | | | | | | |
| | | Year Ended December 31, | |
| Class 3 | | 2007 | | | 2006 | | | 2005 | | | 2004h | |
| | | | |
Per share operating performance | | | | | | | | | | | | | | | | |
(for a share outstanding throughout the year) | | | | | | | | | | | | | | | | |
Net asset value, beginning of year | | $ | 18.68 | | | $ | 15.60 | | | $ | 14.35 | | | $ | 12.48 | |
| | | | |
Income from investment operationsa: | | | | | | | | | | | | | | | | |
Net investment incomeb | | | 0.37 | | | | 0.37 | | | | 0.25 | | | | 0.09 | |
Net realized and unrealized gains (losses) | | | 2.45 | | | | 2.94 | | | | 1.18 | | | | 1.92 | |
| | | | |
Total from investment operations | | | 2.82 | | | | 3.31 | | | | 1.43 | | | | 2.01 | |
| | | | |
Less distributions from: | | | | | | | | | | | | | | | | |
Net investment income | | | (0.42 | ) | | | (0.23 | ) | | | (0.18 | ) | | | (0.14 | ) |
Net realized gains | | | (0.90 | ) | | | — | | | | — | | | | — | |
| | | | |
Total distributions | | | (1.32 | ) | | | (0.23 | ) | | | (0.18 | ) | | | (0.14 | ) |
| | | | |
Redemption fees | | | — | e | | | — | e | | | — | e | | | — | e |
| | | | |
Net asset value, end of year | | $ | 20.18 | | | $ | 18.68 | | | $ | 15.60 | | | $ | 14.35 | |
| | | | |
| | | | |
Total returnc | | | 15.45% | | | | 21.46% | | | | 10.13% | | | | 16.25% | |
Ratios to average net assetsd | | | | | | | | | | | | | | | | |
Expenses | | | 1.00% | f | | | 1.00% | f | | | 1.02% | f | | | 1.07% | f |
Net investment income | | | 1.97% | | | | 2.38% | | | | 1.78% | | | | 1.70% | |
| | | | |
Supplemental data | | | | | | | | | | | | | | | | |
Net assets, end of year (000’s) | | $ | 313,505 | | | $ | 150,417 | | | $ | 47,462 | | | $ | 16,559 | |
Portfolio turnover rate | | | 26.74% | | | | 18.97%g | | | | 14.61% | | | | 10.91% | |
aThe amount shown for a share outstanding throughout the period may not correlate with the Statement of Operations for the period due to the timing of sales and repurchases of the Fund shares in relation to income earned and/or fluctuating market value of the investments of the Fund.
bBased on average daily shares outstanding.
cTotal return does not include any fees, charges or expenses imposed by the variable annuity and life insurance contracts for which the Franklin Templeton Variable Insurance Products Trust serves as an underlying investment vehicle. Total return is not annualized for periods less than one year.
dRatios are annualized for periods less than one year.
eAmount rounds to less than $0.01 per share.
fBenefit of expense reduction rounds to less than 0.01%.
gExcludes the value of portfolio securities delivered as a result of a redemption in-kind. See Note 9.
hFor the period May 1, 2004 (effective date) to December 31, 2004.
The accompanying notes are an integral part of these financial statements.
TF-10
Franklin Templeton Variable Insurance Products Trust
Statement of Investments, December 31, 2007
| | | | | | | |
| Templeton Foreign Securities Fund | | Country | | Shares | | Value |
Long Term Investments 95.9% | | | | | | | |
Common Stocks 95.0% | | | | | | | |
Aerospace & Defense 1.9% | | | | | | | |
BAE Systems PLC | | United Kingdom | | 4,494,870 | | $ | 44,476,790 |
Embraer-Empresa Brasileira de Aeronautica SA, ADR | | Brazil | | 700,030 | | | 31,914,368 |
| | | | | | | |
| | | | | | | 76,391,158 |
| | | | | | | |
Air Freight & Logistics 0.9% | | | | | | | |
Deutsche Post AG | | Germany | | 1,087,912 | | | 37,007,990 |
| | | | | | | |
Auto Components 1.1% | | | | | | | |
NOK Corp. | | Japan | | 2,198,155 | | | 46,815,389 |
| | | | | | | |
Capital Markets 2.4% | | | | | | | |
Invesco Ltd. | | Bermuda | | 2,403,147 | | | 75,410,753 |
aKKR Private Equity Investors LP, 144A | | United States | | 1,155,000 | | | 20,974,800 |
| | | | | | | |
| | | | | | | 96,385,553 |
| | | | | | | |
Chemicals 0.6% | | | | | | | |
Ciba Specialty Chemicals AG | | Switzerland | | 550,500 | | | 25,504,103 |
| | | | | | | |
Commercial Banks 10.2% | | | | | | | |
DBS Group Holdings Ltd. | | Singapore | | 1,240,347 | | | 17,812,052 |
Hana Financial Group Inc. | | South Korea | | 672,040 | | | 36,184,836 |
Kookmin Bank, ADR | | South Korea | | 295,869 | | | 21,693,115 |
Mega Financial Holding Co. Ltd. | | Taiwan | | 34,084,000 | | | 20,967,493 |
Mitsubishi UFJ Financial Group Inc. | | Japan | | 7,454,000 | | | 69,984,648 |
Royal Bank of Scotland Group PLC | | United Kingdom | | 4,311,704 | | | 38,038,105 |
Shinhan Financial Group Co. Ltd. | | South Korea | | 762,930 | | | 43,605,315 |
Shinsei Bank Ltd. | | Japan | | 8,731,478 | | | 31,945,864 |
Sumitomo Mitsui Financial Group Inc. | | Japan | | 9,191 | | | 68,985,042 |
UniCredito Italiano SpA | | Italy | | 8,344,507 | | | 69,168,518 |
| | | | | | | |
| | | | | | | 418,384,988 |
| | | | | | | |
Commercial Services & Supplies 1.2% | | | | | | | |
Adecco SA | | Switzerland | | 527,850 | | | 28,530,544 |
Securitas AB, B | | Sweden | | 1,278,238 | | | 17,792,570 |
Securitas Systems AB, B | | Sweden | | 1,103,738 | | | 3,926,253 |
| | | | | | | |
| | | | | | | 50,249,367 |
| | | | | | | |
Computers & Peripherals 1.3% | | | | | | | |
Compal Electronics Inc. | | Taiwan | | 12,852,983 | | | 14,069,716 |
Lite-On Technology Corp. | | Taiwan | | 22,703,166 | | | 39,623,780 |
| | | | | | | |
| | | | | | | 53,693,496 |
| | | | | | | |
Containers & Packaging 0.9% | | | | | | | |
Amcor Ltd. | | Australia | | 5,968,788 | | | 36,136,215 |
| | | | | | | |
Diversified Financial Services 2.0% | | | | | | | |
ING Groep NV | | Netherlands | | 2,046,888 | | | 79,905,618 |
| | | | | | | |
Diversified Telecommunication Services 10.3% | | | | | | | |
China Telecom Corp. Ltd., H | | China | | 76,952,357 | | | 61,182,161 |
Chunghwa Telecom Co. Ltd., ADR | | Taiwan | | 2,589,183 | | | 54,657,647 |
France Telecom SA | | France | | 2,431,453 | | | 87,360,151 |
KT Corp., ADR | | South Korea | | 397,895 | | | 10,265,691 |
Singapore Telecommunications Ltd. | | Singapore | | 20,278,000 | | | 56,271,116 |
Telefonica SA, ADR | | Spain | | 829,094 | | | 80,911,283 |
TF-11
Franklin Templeton Variable Insurance Products Trust
Statement of Investments, December 31, 2007 (continued)
| | | | | | | |
| Templeton Foreign Securities Fund | | Country | | Shares | | Value |
Long Term Investments (continued) | | | | | | | |
Common Stocks (continued) | | | | | | | |
Diversified Telecommunication Services (continued) | | | | | | | |
Telekom Austria AG | | Austria | | 727,240 | | $ | 20,196,495 |
Telenor ASA | | Norway | | 2,169,354 | | | 51,793,851 |
| | | | | | | |
| | | | | | | 422,638,395 |
| | | | | | | |
Electric Utilities 2.0% | | | | | | | |
British Energy Group PLC | | United Kingdom | | 5,766,390 | | | 62,729,972 |
Hong Kong Electric Holdings Ltd. | | Hong Kong | | 3,453,969 | | | 19,865,161 |
| | | | | | | |
| | | | | | | 82,595,133 |
| | | | | | | |
Electrical Equipment 1.5% | | | | | | | |
Gamesa Corp. Tecnologica SA | | Spain | | 606,877 | | | 28,322,957 |
bVestas Wind Systems AS | | Denmark | | 298,648 | | | 32,264,154 |
| | | | | | | |
| | | | | | | 60,587,111 |
| | | | | | | |
Electronic Equipment & Instruments 2.5% | | | | | | | |
bFlextronics International Ltd. | | Singapore | | 2,282,540 | | | 27,527,432 |
FUJIFILM Holdings Corp. | | Japan | | 921,374 | | | 39,080,832 |
Hitachi Ltd. | | Japan | | 3,178,263 | | | 23,741,139 |
Venture Corp. Ltd. | | Singapore | | 1,339,613 | | | 11,895,693 |
| | | | | | | |
| | | | | | | 102,245,096 |
| | | | | | | |
Food Products 2.2% | | | | | | | |
Nestle SA | | Switzerland | | 103,509 | | | 47,497,953 |
Unilever PLC | | United Kingdom | | 1,170,483 | | | 43,955,566 |
| | | | | | | |
| | | | | | | 91,453,519 |
| | | | | | | |
Health Care Providers & Services 0.7% | | | | | | | |
Celesio AG | | Germany | | 440,310 | | | 27,283,368 |
| | | | | | | |
Hotels Restaurants & Leisure 2.0% | | | | | | | |
Compass Group PLC | | United Kingdom | | 9,792,178 | | | 60,023,516 |
bTUI AG | | Germany | | 792,560 | | | 22,172,451 |
| | | | | | | |
| | | | | | | 82,195,967 |
| | | | | | | |
Household Durables 0.3% | | | | | | | |
Husqvarna AB, A | | Sweden | | 235,727 | | | 2,798,157 |
Husqvarna AB, B | | Sweden | | 785,757 | | | 9,327,196 |
| | | | | | | |
| | | | | | | 12,125,353 |
| | | | | | | |
Industrial Conglomerates 4.4% | | | | | | | |
Hutchison Whampoa Ltd. | | Hong Kong | | 3,276,709 | | | 37,166,093 |
Koninklijke Philips Electronics NV | | Netherlands | | 899,289 | | | 38,741,380 |
Siemens AG | | Germany | | 661,824 | | | 104,715,595 |
| | | | | | | |
| | | | | | | 180,623,068 |
| | | | | | | |
Insurance 4.1% | | | | | | | |
ACE Ltd. | | Bermuda | | 729,799 | | | 45,086,982 |
Aviva PLC | | United Kingdom | | 2,795,400 | | | 37,380,576 |
AXA SA | | France | | 453,589 | | | 18,130,676 |
aAXA SA, 144A | | France | | 38,270 | | | 1,529,713 |
Old Mutual PLC | | United Kingdom | | 19,529,314 | | | 65,035,123 |
| | | | | | | |
| | | | | | | 167,163,070 |
| | | | | | | |
TF-12
Franklin Templeton Variable Insurance Products Trust
Statement of Investments, December 31, 2007 (continued)
| | | | | | | |
| Templeton Foreign Securities Fund | | Country | | Shares | | Value |
Long Term Investments (continued) | | | | | | | |
Common Stocks (continued) | | | | | | | |
Life Sciences Tools & Services 1.1% | | | | | | | |
Lonza Group AG | | Switzerland | | 367,800 | | $ | 44,595,588 |
| | | | | | | |
Media 5.1% | | | | | | | |
British Sky Broadcasting Group PLC | | United Kingdom | | 2,941,216 | | | 36,174,666 |
Eutelsat Communications | | France | | 2,081,860 | | | 61,826,603 |
Pearson PLC | | United Kingdom | | 3,409,246 | | | 49,585,692 |
Reed Elsevier NV | | Netherlands | | 2,012,869 | | | 40,096,606 |
Vivendi SA | | France | | 444,350 | | | 20,348,742 |
| | | | | | | |
| | | | | | | 208,032,309 |
| | | | | | | |
Metals & Mining 1.6% | | | | | | | |
Barrick Gold Corp. | | Canada | | 663,561 | | | 27,897,941 |
POSCO, ADR | | South Korea | | 255,230 | | | 38,389,144 |
| | | | | | | |
| | | | | | | 66,287,085 |
| | | | | | | |
Multi-Utilities 1.5% | | | | | | | |
Centrica PLC | | United Kingdom | | 2,772,071 | | | 19,759,831 |
Suez SA | | France | | 630,996 | | | 42,883,704 |
| | | | | | | |
| | | | | | | 62,643,535 |
| | | | | | | |
Oil, Gas & Consumable Fuels 12.8% | | | | | | | |
BP PLC | | United Kingdom | | 6,622,666 | | | 80,927,278 |
Eni SpA | | Italy | | 1,275,111 | | | 46,613,871 |
Gazprom, ADR | | Russia | | 643,700 | | | 36,143,755 |
Hindustan Petroleum Corp. Ltd. | | India | | 2,415,168 | | | 22,628,601 |
Indian Oil Corp. Ltd. | | India | | 1,194,026 | | | 24,066,874 |
Reliance Industries Ltd. | | India | | 1,374,378 | | | 100,486,023 |
Royal Dutch Shell PLC, B | | United Kingdom | | 2,327,407 | | | 96,650,829 |
Sasol, ADR | | South Africa | | 971,480 | | | 48,059,116 |
Total SA, B | | France | | 846,266 | | | 70,184,950 |
| | | | | | | |
| | | | | | | 525,761,297 |
| | | | | | | |
Paper & Forest Products 2.3% | | | | | | | |
Norske Skogindustrier ASA | | Norway | | 1,362,151 | | | 11,329,327 |
Stora Enso OYJ, R | | Finland | | 2,665,971 | | | 40,098,625 |
UPM-Kymmene OYJ | | Finland | | 2,066,829 | | | 41,684,254 |
| | | | | | | |
| | | | | | | 93,112,206 |
| | | | | | | |
Pharmaceuticals 6.7% | | | | | | | |
GlaxoSmithKline PLC | | United Kingdom | | 3,611,345 | | | 91,775,442 |
Novartis AG | | Switzerland | | 1,093,760 | | | 59,938,666 |
Sanofi-Aventis | | France | | 1,066,665 | | | 98,037,031 |
Takeda Pharmaceutical Co. Ltd. | | Japan | | 421,454 | | | 24,830,317 |
| | | | | | | |
| | | | | | | 274,581,456 |
| | | | | | | |
Real Estate Management & Development 2.5% | | | | | | | |
Cheung Kong (Holdings) Ltd. | | Hong Kong | | 5,503,922 | | | 101,776,786 |
| | | | | | | |
Semiconductors & Semiconductor Equipment 4.1% | | | | | | | |
bInfineon Technologies AG | | Germany | | 3,757,123 | | | 44,521,613 |
bQimonda AG, ADR | | Germany | | 1,849,390 | | | 13,223,139 |
Samsung Electronics Co. Ltd. | | South Korea | | 98,969 | | | 58,786,137 |
Taiwan Semiconductor Manufacturing Co. Ltd. | | Taiwan | | 26,887,711 | | | 51,404,196 |
| | | | | | | |
| | | | | | | 167,935,085 |
| | | | | | | |
TF-13
Franklin Templeton Variable Insurance Products Trust
Statement of Investments, December 31, 2007 (continued)
| | | | | | | | |
| Templeton Foreign Securities Fund | | Country | | Shares | | Value | |
Long Term Investments (continued) | | | | | | | | |
Common Stocks (continued) | | | | | | | | |
Software 0.8% | | | | | | | | |
bCheck Point Software Technologies Ltd. | | Israel | | 1,448,281 | | $ | 31,804,251 | |
| | | | | | | | |
Specialty Retail 0.4% | | | | | | | | |
Kingfisher PLC | | United Kingdom | | 5,676,856 | | | 16,423,141 | |
| | | | | | | | |
Textiles, Apparel & Luxury Goods 0.4% | | | | | | | | |
Burberry Group PLC | | United Kingdom | | 1,512,618 | | | 17,116,303 | |
| | | | | | | | |
Wireless Telecommunication Services 3.2% | | | | | | | | |
Mobile TeleSystems, ADR | | Russia | | 434,900 | | | 44,268,471 | |
Turkcell Iletisim Hizmetleri AS, ADR | | Turkey | | 823,650 | | | 22,708,031 | |
Vodafone Group PLC, ADR | | United Kingdom | | 1,773,520 | | | 66,187,765 | |
| | | | | | | | |
| | | | | | | 133,164,267 | |
| | | | | | | | |
Total Common Stocks (Cost $2,922,550,906) | | | | | | | 3,892,617,266 | |
| | | | | | | | |
Preferred Stock (Cost $2,340,943) 0.9% | | | | | | | | |
Metals & Mining 0.9% | | | | | | | | |
Companhia Vale do Rio Doce, ADR, pfd., A | | Brazil | | 1,296,112 | | | 36,265,214 | |
| | | | | | | | |
Total Long Term Investments (Cost $2,924,891,849) | | | | | | | 3,928,882,480 | |
| | | | | | | | |
Short Term Investment (Cost $177,468,579) 4.3% | | | | | | | | |
Money Market Fund 4.3% | | | | | | | | |
cFranklin Institutional Fiduciary Trust Money Market Portfolio, 4.58% | | United States | | 177,468,579 | | | 177,468,579 | |
| | | | | | | | |
Total Investments (Cost $3,102,360,428) 100.2% | | | | | | | 4,106,351,059 | |
Other Assets, less Liabilities (0.2)% | | | | | | | (6,315,408 | ) |
| | | | | | | | |
Net Assets 100.0% | | | | | | $ | 4,100,035,651 | |
| | | | | | | | |
Selected Portfolio Abbreviation
ADR - American Depository Receipt
aSecurity was purchased pursuant to Rule 144A under the Securities Act of 1933 and may be sold in transactions exempt from registration only to qualified institutional buyers or in a public offering registered under the Securities Act of 1933. These securities have been deemed liquid under guidelines approved by the Trust’s Board of Trustees. At December 31, 2007, the aggregate value of these securities was $22,504,513, representing 0.55% of net assets.
bNon-income producing for the twelve months ended December 31, 2007.
cSee Note 7 regarding investments in the Franklin Institutional Fiduciary Trust Money Market Portfolio. The rate shown is the annualized seven-day yield at period end.
The accompanying notes are an integral part of these financial statements.
TF-14
Franklin Templeton Variable Insurance Products Trust
Financial Statements
Statement of Assets and Liabilities
December 31, 2007
| | | |
| | | Templeton
Foreign
Securities Fund |
Assets: | | | |
Investments in securities: | | | |
Cost - Unaffiliated issuers | | $ | 2,924,891,849 |
Cost - Sweep Money Fund (Note 7) | | | 177,468,579 |
| | | |
Total cost of investments | | $ | 3,102,360,428 |
| | | |
Value - Unaffiliated issuers | | $ | 3,928,882,480 |
Value - Sweep Money Fund (Note 7) | | | 177,468,579 |
| | | |
Total value of investments | | | 4,106,351,059 |
Foreign currency, at value (cost $61,607) | | | 61,451 |
Receivables: | | | |
Capital shares sold | | | 2,021,896 |
Dividends | | | 4,658,756 |
| | | |
Total assets | | | 4,113,093,162 |
| | | |
Liabilities: | | | |
Payables: | | | |
Capital shares redeemed | | | 7,263,709 |
Affiliates | | | 3,927,375 |
Deferred taxes | | | 997,091 |
Accrued expenses and other liabilities | | | 869,336 |
| | | |
Total liabilities | | | 13,057,511 |
| | | |
Net assets, at value | | $ | 4,100,035,651 |
| | | |
Net assets consist of: | | | |
Paid-in capital | | $ | 2,699,600,752 |
Undistributed net investment income | | | 79,657,780 |
Net unrealized appreciation (depreciation) | | | 1,003,049,810 |
Accumulated net realized gain (loss) | | | 317,727,309 |
| | | |
Net assets, at value | | $ | 4,100,035,651 |
| | | |
Class 1: | | | |
Net assets, at value | | $ | 531,376,696 |
| | | |
Shares outstanding | | | 25,827,290 |
| | | |
Net asset value and maximum offering price per share | | $ | 20.57 |
| | | |
Class 2: | | | |
Net assets, at value | | $ | 3,255,154,238 |
| | | |
Shares outstanding | | | 160,727,412 |
| | | |
Net asset value and maximum offering price per share | | $ | 20.25 |
| | | |
Class 3: | | | |
Net assets, at value | | $ | 313,504,717 |
| | | |
Shares outstanding | | | 15,535,675 |
| | | |
Net asset value and maximum offering price per sharea | | $ | 20.18 |
| | | |
a | Redemption price is equal to net asset value less any redemption fees retained by the Fund. |
The accompanying notes are an integral part of these financial statements.
TF-15
Franklin Templeton Variable Insurance Products Trust
Financial Statements (continued)
Statement of Operations
for the year ended December 31, 2007
| | | | |
| | | Templeton
Foreign
Securities Fund | |
Investment income: | | | | |
Dividends (net of foreign taxes of $8,216,242) | | | | |
Unaffiliated issuers | | $ | 105,905,206 | |
Sweep Money Fund (Note 7) | | | 12,133,090 | |
Interest (net of foreign taxes of $199) | | | 929 | |
| | | | |
Total investment income | | | 118,039,225 | |
| | | | |
Expenses: | | | | |
Management fees (Note 3a) | | | 24,092,917 | |
Administrative fees (Note 3b) | | | 3,553,533 | |
Distribution fees: (Note 3c) | | | | |
Class 2 | | | 7,886,342 | |
Class 3 | | | 576,111 | |
Unaffiliated transfer agent fees | | | 65,714 | |
Custodian fees (Note 4) | | | 1,034,043 | |
Reports to shareholders | | | 891,521 | |
Professional fees | | | 167,113 | |
Trustees’ fees and expenses | | | 16,559 | |
Other | | | 88,114 | |
| | | | |
Total expenses | | | 38,371,967 | |
Expense reductions (Note 4) | | | (11,975 | ) |
| | | | |
Net expenses | | | 38,359,992 | |
| | | | |
Net investment income | | | 79,679,233 | |
| | | | |
Realized and unrealized gains (losses): | | | | |
Net realized gain (loss) from: | | | | |
Investments | | | 318,979,414 | |
Foreign currency transactions | | | 688,164 | |
| | | | |
Net realized gain (loss) | | | 319,667,578 | |
| | | | |
Net change in unrealized appreciation (depreciation) on: | | | | |
Investments | | | 172,139,703 | |
Translation of assets and liabilities denominated in foreign currencies | | | (19,932 | ) |
Change in deferred taxes on unrealized appreciation (depreciation) | | | (96,863 | ) |
| | | | |
Net change in unrealized appreciation (depreciation) | | | 172,022,908 | |
| | | | |
Net realized and unrealized gain (loss) | | | 491,690,486 | |
| | | | |
Net increase (decrease) in net assets resulting from operations | | $ | 571,369,719 | |
| | | | |
The accompanying notes are an integral part of these financial statements.
TF-16
Franklin Templeton Variable Insurance Products Trust
Financial Statements (continued)
Statements of Changes in Net Assets
| | | | | | | | |
| | | Templeton Foreign
Securities Fund | |
| | | Year Ended December 31, | |
| | | 2007 | | | 2006 | |
| | | | |
Increase (decrease) in net assets: | | | | | | | | |
Operations: | | | | | | | | |
Net investment income | | $ | 79,679,233 | | | $ | 77,320,581 | |
Net realized gain (loss) from investments, foreign currency transactions and redemption in-kind (Note 9) | | | 319,667,578 | | | | 216,717,127 | |
Net change in unrealized appreciation (depreciation) on investments and translation of assets and liabilities denominated in foreign currencies, and deferred taxes | | | 172,022,908 | | | | 342,405,989 | |
| | | | |
Net increase (decrease) in net assets resulting from operations | | | 571,369,719 | | | | 636,443,697 | |
| | | | |
Distributions to shareholders from: | | | | | | | | |
Net investment income: | | | | | | | | |
Class 1 | | | (13,007,672 | ) | | | (7,899,286 | ) |
Class 2 | | | (62,378,038 | ) | | | (30,532,245 | ) |
Class 3 | | | (4,668,468 | ) | | | (1,067,001 | ) |
Net realized gains: | | | | | | | | |
Class 1 | | | (26,934,025 | ) | | | — | |
Class 2 | | | (142,276,757 | ) | | | — | |
Class 3 | | | (10,123,984 | ) | | | — | |
| | | | |
Total distributions to shareholders | | | (259,388,944 | ) | | | (39,498,532 | ) |
| | | | |
Capital share transactions: (Note 2) | | | | | | | | |
Class 1 | | | (110,488,366 | ) | | | (39,662,208 | ) |
Class 2 | | | 66,307,351 | | | | 232,018,498 | |
Class 3 | | | 145,429,492 | | | | 85,243,717 | |
| | | | |
Total capital share transactions | | | 101,248,477 | | | | 277,600,007 | |
| | | | |
Redemption fees | | | 24,688 | | | | 9,162 | |
| | | | |
Net increase (decrease) in net assets | | | 413,253,940 | | | | 874,554,334 | |
Net assets: | | | | | | | | |
Beginning of year | | | 3,686,781,711 | | | | 2,812,227,377 | |
| | | | |
End of year | | $ | 4,100,035,651 | | | $ | 3,686,781,711 | |
| | | | |
Undistributed net investment income included in net assets: | | | | | | | | |
End of year | | $ | 79,657,780 | | | $ | 79,126,854 | |
| | | | |
The accompanying notes are an integral part of these financial statements.
TF-17
Franklin Templeton Variable Insurance Products Trust
Notes to Financial Statements
Templeton Foreign Securities Fund
1. ORGANIZATION AND SIGNIFICANT ACCOUNTING POLICIES
Franklin Templeton Variable Insurance Products Trust (Trust) is registered under the Investment Company Act of 1940, as amended, (1940 Act) as an open-end investment company, consisting of twenty-three separate funds. The Templeton Foreign Securities Fund (Fund) included in this report is diversified. The financial statements of the remaining funds in the Trust are presented separately. Shares of the Fund are sold only to insurance company separate accounts to fund the benefits of variable life insurance policies or variable annuity contracts. The Fund offers three classes of shares: Class 1, Class 2, and Class 3. Each class of shares differs by its distribution fees, voting rights on matters affecting a single class and its exchange privilege.
The following summarizes the Fund’s significant accounting policies.
a. Security Valuation
Securities listed on a securities exchange or on the NASDAQ National Market System are valued at the last quoted sale price or the official closing price of the day, respectively. Over-the-counter securities and listed securities for which there is no reported sale are valued within the range of the most recent quoted bid and ask prices. Securities that trade in multiple markets or on multiple exchanges are valued according to the broadest and most representative market. Investments in open-end mutual funds are valued at the closing net asset value.
Foreign securities are valued as of the close of trading on the foreign stock exchange on which the security is primarily traded, or the NYSE, whichever is earlier. If no sale is reported at that time, the foreign security will be valued within the range of the most recent quoted bid and ask prices. The value is then converted into its U.S. dollar equivalent at the foreign exchange rate in effect at the close of the NYSE on the day that the value of the foreign security is determined.
The Trust has procedures to determine the fair value of individual securities and other assets for which market prices are not readily available or which may not be reliably priced. Methods for valuing these securities may include: fundamental analysis, matrix pricing, discounts from market prices of similar securities, or discounts applied due to the nature and duration of restrictions on the disposition of the securities. Due to the inherent uncertainty of valuations of such securities, the fair values may differ significantly from the values that would have been used had a ready market for such investments existed. Occasionally, events occur between the time at which trading in a security is completed and the close of the NYSE that might call into question the availability (including the reliability) of the value of a portfolio security held by the Fund. The investment manager monitors price movements following the close of trading in foreign stock markets through a series of country specific market proxies (such as baskets of American Depository Receipts, futures contracts and exchange traded funds). These price movements are measured against established trigger thresholds for each specific market proxy to assist in determining if an event has occurred. If such an event occurs, the securities may be valued using fair value procedures, which may include the use of independent pricing services. All security valuation procedures are approved by the Trust’s Board of Trustees.
b. Foreign Currency Translation
Portfolio securities and other assets and liabilities denominated in foreign currencies are translated into U.S. dollars based on the exchange rate of such currencies against U.S. dollars on the date of valuation. Purchases and sales of securities, income and expense items denominated in foreign currencies are translated into U.S. dollars at the exchange rate in effect on the transaction date. Occasionally, events may impact the availability or reliability of foreign exchange rates used to convert the U.S. dollar equivalent value. If such an event occurs, the foreign exchange rate will be valued at fair value using procedures established and approved by the Trust’s Board of Trustees.
The Fund does not separately report the effect of changes in foreign exchange rates from changes in market prices on securities held. Such changes are included in net realized and unrealized gain or loss from investments on the Statement of Operations.
TF-18
Franklin Templeton Variable Insurance Products Trust
Notes to Financial Statements (continued)
Templeton Foreign Securities Fund
1. ORGANIZATION AND SIGNIFICANT ACCOUNTING POLICIES (continued)
b. Foreign Currency Translation (continued)
Realized foreign exchange gains or losses arise from sales of foreign currencies, currency gains or losses realized between the trade and settlement dates on securities transactions and the difference between the recorded amounts of dividends, interest, and foreign withholding taxes and the U.S. dollar equivalent of the amounts actually received or paid. Net unrealized foreign exchange gains and losses arise from changes in foreign exchange rates on foreign denominated assets and liabilities other than investments in securities held at the end of the reporting period.
c. Foreign Currency Contracts
When the Fund purchases or sells foreign securities it may enter into foreign exchange contracts to minimize foreign exchange risk from the trade date to the settlement date of the transactions. A foreign exchange contract is an agreement between two parties to exchange different currencies at an agreed upon exchange rate at a future date. Realized and unrealized gains and losses on these contracts are included in the Statement of Operations.
The risks of these contracts include movement in the values of the foreign currencies relative to the U.S. dollar and the possible inability of the counterparties to fulfill their obligations under the contracts, which may be in excess of the amount reflected in the Statement of Assets and Liabilities.
d. Income and Deferred Taxes
No provision has been made for U.S. income taxes because it is the Fund’s policy to qualify as a regulated investment company under the Internal Revenue Code and to distribute to shareholders substantially all of its taxable income and net realized gains.
Foreign securities held by the Fund may be subject to foreign taxation on dividend income received. Foreign taxes, if any, are recorded based on the tax regulations and rates that exist in the foreign markets in which the Fund invests.
The Fund may be subject to a tax imposed on net realized gains on securities of certain foreign countries. The Fund records an estimated deferred tax liability for net unrealized gains on these securities in an amount that would be payable if the securities were disposed of on the valuation date.
e. Security Transactions, Investment Income, Expenses and Distributions
Security transactions are accounted for on trade date. Realized gains and losses on security transactions are determined on a specific identification basis. Interest income and estimated expenses are accrued daily. Dividend income is recorded on the ex-dividend date except that certain dividends from foreign securities are recognized as soon as the Fund is notified of the ex-dividend date. Distributions to shareholders are recorded on the ex-dividend date and are determined according to income tax regulations (tax basis). Distributable earnings determined on a tax basis may differ from earnings recorded in accordance with accounting principles generally accepted in the United States of America. These differences may be permanent or temporary. Permanent differences are reclassified among capital accounts to reflect their tax character. These reclassifications have no impact on net assets or the results of operations. Temporary differences are not reclassified, as they may reverse in subsequent periods.
Common expenses incurred by the Trust are allocated among the funds based on the ratio of net assets of each fund to the combined net assets of the Trust. Fund specific expenses are charged directly to the fund that incurred the expense.
Realized and unrealized gains and losses and net investment income, other than class specific expenses, are allocated daily to each class of shares based upon the relative proportion of net assets of each class. Differences in per share distributions, by class, are generally due to differences in class specific expenses.
TF-19
Franklin Templeton Variable Insurance Products Trust
Notes to Financial Statements (continued)
Templeton Foreign Securities Fund
1. ORGANIZATION AND SIGNIFICANT ACCOUNTING POLICIES (continued)
f. Accounting Estimates
The preparation of financial statements in accordance with accounting principles generally accepted in the United States of America requires management to make estimates and assumptions that affect the reported amounts of assets and liabilities at the date of the financial statements and the amounts of income and expenses during the reporting period. Actual results could differ from those estimates.
g. Redemption Fees
Redemptions and exchanges of Class 3 shares held 60 days or less may be subject to the fund’s redemption fee, which is 1% of the amount redeemed. Such fees are retained by the fund and accounted for as an addition to paid-in capital.
h. Guarantees and Indemnifications
Under the Trust’s organizational documents, its officers and trustees are indemnified by the Trust against certain liabilities arising out of the performance of their duties to the Trust. Additionally, in the normal course of business, the Trust, on behalf of the Fund, enters into contracts with service providers that contain general indemnification clauses. The Trust’s maximum exposure under these arrangements is unknown as this would involve future claims that may be made against the Trust that have not yet occurred. Currently, the Trust expects the risk of loss to be remote.
2. SHARES OF BENEFICIAL INTEREST
At December 31, 2007, there were an unlimited number of shares authorized (without par value). Transactions in the Fund’s shares were as follows:
| | | | | | | | | | | | | | |
| | | Year Ended December 31, | |
| | | 2007 | | | 2006 | |
| Class 1 Shares: | | Shares | | | Amount | | | Shares | | | Amount | |
Shares sold | | 1,232,157 | | | $ | 24,254,763 | | | 2,328,810 | | | $ | 39,073,549 | |
Shares issued in reinvestment of distributions | | 2,040,966 | | | | 39,941,697 | | | 492,781 | | | | 7,899,286 | |
Shares redeemed | | (8,769,318 | ) | | | (174,684,826 | ) | | (5,075,580 | ) | | | (86,635,043 | ) |
| | | | |
Net increase (decrease) | | (5,496,195 | ) | | $ | (110,488,366 | ) | | (2,253,989 | ) | | $ | (39,662,208 | ) |
| | | | |
| Class 2 Shares: | | | | | | | | | | | | |
Shares sold | | 20,015,006 | | | $ | 388,403,751 | | | 43,227,824 | | | $ | 728,731,224 | |
Shares issued in reinvestment of distributions | | 10,576,152 | | | | 204,013,968 | | | 1,925,158 | | | | 30,455,999 | |
Shares redeemed in-kind (Note 10) | | — | | | | — | | | (8,720,489 | ) | | | (151,213,281 | ) |
Shares redeemed | | (26,940,536 | ) | | | (526,110,368 | ) | | (22,264,085 | ) | | | (375,955,444 | ) |
| | | | |
Net increase (decrease) | | 3,650,622 | | | $ | 66,307,351 | | | 14,168,408 | | | $ | 232,018,498 | |
| | | | |
| Class 3 Shares: | | | | | | | | | | | | |
Shares sold | | 7,292,215 | | | $ | 141,648,697 | | | 5,176,865 | | | $ | 88,136,330 | |
Shares issued in reinvestment of distributions | | 769,639 | | | | 14,792,452 | | | 67,617 | | | | 1,067,001 | |
Shares redeemed | | (578,013 | ) | | | (11,011,657 | ) | | (234,367 | ) | | | (3,959,614 | ) |
| | | | |
Net increase (decrease) | | 7,483,841 | | | $ | 145,429,492 | | | 5,010,115 | | | $ | 85,243,717 | |
| | | | |
TF-20
Franklin Templeton Variable Insurance Products Trust
Notes to Financial Statements (continued)
Templeton Foreign Securities Fund
3. TRANSACTIONS WITH AFFILIATES
Franklin Resources, Inc. is the holding company for various subsidiaries that together are referred to as Franklin Templeton Investments. Certain officers and trustees of the Trust are also officers and/or directors of the following subsidiaries:
| | |
| Subsidiary | | Affiliation |
Templeton Investment Counsel, LLC (TIC) | | Investment manager |
Franklin Templeton Services, LLC (FT Services) | | Administrative manager |
Franklin Templeton Distributors, Inc. (Distributors) | | Principal underwriter |
Franklin Templeton Investor Services, LLC (Investor Services) | | Transfer agent |
a. Management Fees
The Fund pays an investment management fee to TIC based on the average daily net assets of the Fund as follows:
| | |
| Annualized Fee Rate | | Net Assets |
| 0.750% | | Up to and including $200 million |
| 0.675% | | Over $200 million, up to and including $1.3 billion |
| 0.600% | | Over $1.3 billion, up to and including $10 billion |
| 0.580% | | Over $10 billion, up to and including $ 15 billion |
| 0.560% | | Over $15 billion, up to and including $ 20 billion |
| 0.540% | | In excess of $20 billion |
b. Administrative Fees
The Fund pays an administrative fee to FT Services based on the average daily net assets as follows:
| | |
| Annualized Fee Rate | | Net Assets |
| 0.150% | | Up to and including $200 million |
| 0.135% | | Over $200 million, up to and including $700 million |
| 0.100% | | Over $700 million, up to and including $1.2 billion |
| 0.075% | | In excess of $1.2 billion |
c. Distribution Fees
The Fund’s Board of Trustees has adopted distribution plans for Class 2 and Class 3 shares pursuant to Rule 12b-1 under the 1940 Act. Under the Fund’s compensation distribution plans, the Fund pays Distributors for costs incurred in connection with the servicing, sale and distribution of the Fund’s shares up to 0.25% and 0.35% per year of its average daily net assets of Class 2 and Class 3, respectively. The Board of Trustees has agreed to limit the current rate to 0.25% per year for Class 3.
d. Transfer Agent Fees
Investor Services, under terms of an agreement, performs shareholder servicing for the Fund and is not paid by the Fund for the services.
4. EXPENSE OFFSET ARRANGEMENT
The Fund has entered into an arrangement with its custodian whereby credits realized as a result of uninvested cash balances are used to reduce a portion of the Fund’s custodian expenses. During the year ended December 31, 2007, the custodian fees were reduced as noted in the Statement of Operations.
TF-21
Franklin Templeton Variable Insurance Products Trust
Notes to Financial Statements (continued)
Templeton Foreign Securities Fund
5. INCOME TAXES
The Fund has reviewed the tax positions taken on federal income tax returns, for each of the three open tax years and as of December 31, 2007 and has determined that no provision for income tax is required in the Fund’s financial statements.
The tax character of distributions paid during the years ended December 31, 2007 and 2006, was as follows:
| | | | | | |
| | | 2007 | | 2006 |
Distributions paid from: | | | | | | |
Ordinary income | | $ | 89,150,006 | | $ | 39,498,532 |
Long term capital gain | | | 170,238,938 | | | — |
| | | |
| | $ | 259,388,944 | | $ | 39,498,532 |
| | | |
At December 31, 2007, the cost of investments, net unrealized appreciation (depreciation), undistributed ordinary income and undistributed long term capital gains for income tax purposes were as follows:
| | | | |
Cost of investments | | $ | 3,102,347,243 | |
| | | | |
| |
Unrealized appreciation | | $ | 1,125,280,198 | |
Unrealized depreciation | | | (121,276,382 | ) |
| | | | |
Net unrealized appreciation (depreciation) | | $ | 1,004,003,816 | |
| | | | |
Undistributed ordinary income | | $ | 108,967,521 | |
Undistributed long term capital gains | | | 288,404,384 | |
| | | | |
Distributable earnings | | $ | 397,371,905 | |
| | | | |
Net investment income differs for financial statement and tax purposes primarily due to differing treatments of foreign currency transactions and pass-through entity income.
Net realized gains (losses) differ for financial statement and tax purposes primarily due to differing treatments of wash sales, foreign currency transactions and pass-through entity income.
6. INVESTMENT TRANSACTIONS
Purchases and sales of investments (excluding short term securities) for the year ended December 31, 2007, aggregated $997,801,739 and $1,004,038,466, respectively.
7. INVESTMENTS IN FRANKLIN INSTITUTIONAL FIDUCIARY TRUST MONEY MARKET PORTFOLIO
The Fund may invest in the Franklin Institutional Fiduciary Trust Money Market Portfolio (Sweep Money Fund), an open-end investment company managed by Franklin Advisers, Inc. (an affiliate of the investment manager. Management fees paid by the Fund are reduced on assets invested in the Sweep Money Fund, in an amount not to exceed the management and administrative fees paid by the Sweep Money Fund.
8. CONCENTRATION OF RISK
Investing in foreign securities may include certain risks and considerations not typically associated with investing in U.S. securities, such as fluctuating currency values and changing local and regional economic, political and social conditions, which may result in greater market volatility. In addition, certain foreign securities may not be as liquid as U.S. securities.
TF-22
Franklin Templeton Variable Insurance Products Trust
Notes to Financial Statements (continued)
Templeton Foreign Securities Fund
9. REDEMPTION IN-KIND
During the year ended December 31, 2006, the Fund realized $34,808,242 of net gains resulting from a redemption in-kind in which a shareholder redeemed fund shares for securities held by the Fund rather than for cash. Because such gains are not taxable to the Fund, and are not distributed to shareholders, they have been reclassified from accumulated net realized gains to paid-in capital.
10. REGULATORY AND LITIGATION MATTERS
As part of various investigations by a number of federal, state, and foreign regulators and governmental entities, including the Securities and Exchange Commission (“SEC”), relating to certain practices in the mutual fund industry, including late trading, market timing and marketing support payments to securities dealers who sell fund shares (“marketing support”), Franklin Resources, Inc. and certain of its subsidiaries (collectively, the “Company”), entered into settlements with certain of those regulators and governmental entities. Specifically, the Company entered into settlements with the SEC, among others, concerning market timing and marketing support.
On June 6, 2007, the SEC posted for public comment the proposed plan of distribution for the market timing settlement. Once the SEC approves the final plan of distribution, disbursements of settlement monies will be made promptly to individuals who were shareholders of the designated funds during the relevant period, in accordance with the terms and conditions of the settlement and plan.
In addition, the Company, as well as most of the mutual funds within Franklin Templeton Investments and certain current or former officers, Company directors, fund directors, and employees, have been named in private lawsuits (styled as shareholder class actions, or as derivative actions on behalf of either the named funds or Franklin Resources, Inc.). The lawsuits relate to the industry practices referenced above.
The Company and fund management believe that the claims made in each of the private lawsuits referenced above are without merit and intend to defend against them vigorously. The Company cannot predict with certainty the eventual outcome of these lawsuits, nor whether they will have a material negative impact on the Company. If it is determined that the Company bears responsibility for any unlawful or inappropriate conduct that caused losses to the Fund, it is committed to making the Trust or its shareholders whole, as appropriate.
11. NEW ACCOUNTING PRONOUNCEMENT
In September 2006, the Financial Accounting Standards Board (FASB) issued FASB Statement No. 157, “Fair Value Measurement” (SFAS 157), which defines fair value, establishes a framework for measuring fair value, and expands disclosures about fair value measurements. SFAS 157 is effective for fiscal years beginning after November 15, 2007, and interim periods within those fiscal years. The Trust believes the adoption of SFAS 157 will have no material impact on its financial statements.
TF-23
Franklin Templeton Variable Insurance Products Trust
Templeton Foreign Securities Fund
Report of Independent Registered Public Accounting Firm
To the Board of Trustees and Shareholders of
Franklin Templeton Variable Insurance Products Trust
In our opinion, the accompanying statement of assets and liabilities, including the statement of investments, and the related statements of operations and of changes in net assets and the financial highlights present fairly, in all material respects, the financial position of Templeton Foreign Securities Fund (one of the funds constituting Franklin Templeton Variable Insurance Products Trust, hereafter referred to as the “Fund”) at December 31, 2007, the results of its operations for the year then ended, the changes in its net assets for each of the two years in the period then ended and the financial highlights for each of the periods presented, in conformity with accounting principles generally accepted in the United States of America. These financial statements and financial highlights (hereafter referred to as “financial statements”) are the responsibility of the Fund’s management. Our responsibility is to express an opinion on these financial statements based on our audits. We conducted our audits of these financial statements in accordance with the standards of the Public Company Accounting Oversight Board (United States). Those standards require that we plan and perform the audit to obtain reasonable assurance about whether the financial statements are free of material misstatement. An audit includes examining, on a test basis, evidence supporting the amounts and disclosures in the financial statements, assessing the accounting principles used and significant estimates made by management, and evaluating the overall financial statement presentation. We believe that our audits, which included confirmation of securities at December 31, 2007 by correspondence with the custodian, provide a reasonable basis for our opinion.
PricewaterhouseCoopers LLP
San Francisco, California
February 14, 2008
TF-24
Franklin Templeton Variable Insurance Products Trust
Tax Designation (unaudited)
Templeton Foreign Securities Fund
Under Section 852(b)(3)(C) of the Internal Revenue Code (Code), the Fund designates the maximum amount allowable but no less than $288,404,747 as a long term capital gain dividend for the fiscal year ended December 31, 2007.
At December 31, 2007, more than 50% of the Fund’s total assets were invested in securities of foreign issuers. In most instances, foreign taxes were withheld from income paid to the Fund on these investments. The Fund elects to treat foreign taxes paid as allowed under Section 853 of the Code. This election will allow shareholders of record as of the 2008 distribution date, to treat their proportionate share of foreign taxes paid by the Fund as having been paid directly by them. The shareholder shall consider these amounts as foreign taxes paid in the tax year in which they receive the Fund distribution.
TF-25
TEMPLETON GLOBAL INCOME SECURITIES FUND
We are pleased to bring you Templeton Global Income Securities Fund’s annual report for the fiscal year ended December 31, 2007.
Performance Summary as of 12/31/07
Average annual total return of Class 3 shares* represents the average annual change in value, assuming reinvestment of dividends and capital gains. Average returns smooth out variations in returns, which can be significant; they are not the same as year-by-year results.
Periods ended 12/31/07
| | | | | | |
| | | 1-Year | | 5-Year | | 10-Year |
Average Annual Total Return | | +11.03% | | +11.26% | | +8.26% |
*Class 3 shares were not offered until 4/1/05. As a result, Class 3 Fund performance for periods prior to 1/6/99 represents historical results of Class 1 shares, and for periods between 1/6/99 and 3/31/05 reflects historical results of Class 2 shares. Both Class 2 and Class 3 performance reflects an additional 12b-1 fee expense, which also affects future performance. Since 4/1/05 (effective date), the average annual total return of Class 3 shares was +8.23%.
Total Return Index Comparison
for Hypothetical $10,000 Investment (1/1/98–12/31/07)
The graph below shows the change in value of a hypothetical $10,000 investment in the Fund over the indicated period and includes reinvestment of any income or distributions. The Fund’s performance* is compared to the performance of the J.P. Morgan (JPM) Government Bond Index (GBI) Global, as well as the Consumer Price Index (CPI). One cannot invest directly in an index, nor is an index representative of the Fund’s portfolio. Please see Important Notes to Performance Information preceding the Fund Summaries.
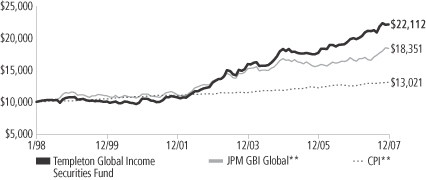
**Sources: J.P. Morgan; Standard & Poor’s Micropal. Please see Index Descriptions following the Fund Summaries.
Templeton Global Income Securities Fund – Class 3
Performance reflects the Fund’s Class 3 operating expenses, but does not include any contract fees, expenses or sales charges. If they had been included, performance would be lower. These charges and deductions, particularly for variable life policies, can have a significant effect on contract values and insurance benefits. See the contract prospectus for a complete description of these expenses, including sales charges.
Performance data represent past performance, which does not guarantee future results. Investment return and principal value will fluctuate, and you may have a gain or loss when you sell your shares.
Current performance may differ from figures shown.
TGI-1
Fund Goal and Main Investments: Templeton Global Income Securities Fund seeks high current income, consistent with preservation of capital, with capital appreciation as a secondary consideration. The Fund normally invests mainly in debt securities of governments and their political subdivisions and agencies, supranational organizations and companies located anywhere in the world, including emerging markets.
Performance Overview
You can find the Fund’s one-year total return in the Performance Summary. The Fund performed comparably to its benchmark, the JPM GBI Global, which had a +10.81% total return in U.S. dollar terms for the year under review.1
Economic and Market Overview
Global economic growth remained strong during the reporting period despite a credit crunch in the second half of the year prompted by the deteriorating U.S. housing sector. Robust economic growth in many emerging markets contrasted with more moderate growth in developed markets where lack of financial liquidity had a larger impact. The rapid rise among developing economies resulted in increased demand from local consumers. Increased food and energy consumption led to high commodity prices throughout the year, benefiting countries exporting these goods. High prices also contributed to inflationary pressures already present in several economies after years of continued above-trend growth. Strong economic growth and rising interest rates in many economies contrasted with the U.S.’s weak growth and falling interest rates, which caused significant U.S. dollar depreciation during the year.
China continued to lead the Asian region’s economic expansion, posting greater than 11% increases in gross domestic product (GDP) in the first three quarters of 2007 compared with the same period in 2006 (year-over-year).2 China’s surging domestic demand became an increasingly important growth source for other Asian economies through trade. For example, Chinese imports from Asia increased 18% in the first 11 months of 2007 year-over-year.2 Continued rapid expansion led to fears China’s economy was overheating as inflation picked up. The potential repercussions of allowing the expansion to continue unchecked were compounded by the local equity markets’ solid performance. Thus, monetary authorities increased interest rates and even allowed the yuan
1. Source: J.P. Morgan. One cannot invest directly in an index, nor is an index representative of the Fund’s portfolio. Please see Index Descriptions following the Fund Summaries.
2. Source: EcoWin.
Fund Risks: Because the Fund invests in bonds and other debt obligations, its share price and yield will be affected by interest rate movements. Bond prices generally move in the opposite direction of interest rates. Thus, as prices of bonds in the Fund adjust to a rise in interest rates, the Fund’s share price may decline. High yield, lower-rated (junk) bonds generally have greater price swings and higher default risks than investment-grade bonds. Foreign investing, especially in emerging markets, involves additional risks including currency fluctuations, economic instability, market volatility, and political and social instability. The Fund’s prospectus also includes a description of the main investment risks.
TGI-2
to appreciate slightly. India encountered similar conditions as it posted around 9% GDP growth in the first three quarters of 2007 year-over-year.2 Indian monetary authorities responded by raising the target interest rate 50 basis points (half a percentage point) during the year. However, this had little effect on private investment growth. Japan continued to fall behind as the country registered GDP growth below 2% in the second and third quarters of 2007 year-over-year.3 Consequently, the Japanese central bank kept rates on hold for the second half of the year after raising them 25 basis points earlier. Low growth levels and interest rates by international standards led to continued yen weakness until risk aversion rose at the end of the year, prompting carry trades to unwind.
European economic growth remained quite strong in 2007, although fears regarding the U.K.’s and eurozone’s future growth paths emerged following the credit crunch. Labor markets strengthened across the region and monetary conditions tightened. The European Central Bank raised rates 50 basis points during the period as growth was strong in the first half of the year, particularly in Germany. Non-euro Europe enjoyed even stronger growth. Norway grew 6.6% in the third quarter year-over-year, prompting the central bank to raise interest rates 25 basis points in December despite financial market volatility.2 The labor market underpinned the nation’s growth as the unemployment rate fell to 1.6% in December from 2.1% a year earlier.4 Some European economies expanded more modestly, particularly where the housing market slowed, such as in Spain and the U.K. These residential markets, after recently showing some of the strongest growth, were hurt as negative sentiment spread from the U.S. housing market across the Atlantic. In the U.K., housing market weakness combined with financial market troubles caused enough worries for the Bank of England to cut interest rates 25 basis points in December after just raising them in July.
3. Source: Economic & Social Research Institute.
4. Source: Norway Ministry of Labour.
What is a carry trade?
Carry trade is a strategy in which an investor sells a certain currency with a relatively low interest rate and uses the funds to purchase a different currency yielding a higher interest rate. A trader using this strategy attempts to capture the difference between the rates, which can often be substantial, depending on the amount of leverage the investor chooses to use.
TGI-3
Investment Strategy
We allocate the Fund’s assets among issuers, geographic regions, and currencies based upon our assessment of relative interest rates among currencies, our outlook for changes in interest rates and currencies, and credit risks. In considering these factors, we may evaluate a country’s changing market, economic and political conditions, such as inflation rate, growth prospects, global trade patterns and government policies. We seek to manage the Fund’s exposure to various currencies, and may from time to time seek to hedge (protect) against currency risk by using forward currency exchange contracts.
Manager’s Discussion
The Fund’s total return was influenced by various factors, including interest rate developments, currency movements, and exposure to sovereign debt markets.
Interest Rate Strategy
For most of the 12-month reporting period, the Fund maintained its overall short duration positioning seeking to take advantage of global interest rate tightening resulting from strong economic growth in most economies. However, we found some opportunities to take advantage of local interest rate reductions. For example, the Indonesian central bank reduced interest rates 175 basis points over the period, continuing its interest rate normalization process as inflation remained under control. Indonesia returned +11.07% in local currency terms over the period, as measured by the JPM GBI–Emerging Markets.5 Another positive local market was Brazil, where its central bank reduced interest rates 200 basis points during the period to 11.25%, which supported local bond market returns of +9.81% in local currency terms.5 The central bank held interest rates constant throughout the fourth quarter as the economy accelerated, inflation picked up, and the large monetary action’s impact began to be felt. As global growth concerns surfaced later in the year, the Fund selectively increased its interest rate exposure, which lengthened the portfolio’s duration.
Currency Strategy
Our currency strategy remained relatively unchanged over the period, predicated on our medium-term view on the gradual unwinding of global imbalances, which began during the period. These imbalances centered on strong U.S. consumption growth and, consequently, a large
5. Source: J.P. Morgan. Please see Index Descriptions following the Fund Summaries.
Currency Breakdown
Templeton Global Income Securities Fund 12/31/07
| | |
| | | % of Total
Net Assets |
| |
| Asia Pacific | | 49.4% |
| Japanese Yen | | 16.2% |
| Malaysian Ringgit | | 11.2% |
| Indonesian Rupiah | | 5.2% |
| South Korean Won | | 4.3% |
| Kazakhstan Tenge | | 4.3% |
| Singapore Dollar | | 4.1% |
| Indian Rupee | | 3.0% |
| Australian Dollar | | 1.2% |
| New Zealand Dollar* | | -0.1% |
| |
| Europe | | 33.5% |
| Swedish Krona | | 13.8% |
| Swiss Franc | | 9.6% |
| Norwegian Krone | | 6.1% |
| Polish Zloty | | 5.4% |
| Euro | | 1.0% |
| Iceland Krona | | 0.1% |
| Romanian Lei* | | -2.5% |
| |
| Americas | | 13.0% |
| Brazilian Real | | 5.7% |
| Canadian Dollar | | 2.9% |
| Chilean Peso | | 1.8% |
| U.S. Dollar | | 1.1% |
| Colombian Peso | | 0.9% |
| Peruvian Nuevo Sol | | 0.9% |
| Mexican Peso* | | -0.3% |
| |
| Middle East & Africa | | 4.1% |
| Egyptian Pound | | 4.1% |
*The Mexican peso = -0.3%, New Zealand dollar = -0.1%, and the Romanian lei = -2.5% due to forward currency exchange contracts.
The dollar value, number of shares or principal amount, and names of all portfolio holdings are listed in the Fund’s Statement of Investments.
TGI-4
U.S. current account deficit, versus low domestic demand in most Asian countries and corresponding Asian current account surpluses. As a result, the Fund benefited from its significantly underweighted U.S. dollar exposure relative to the JPM GBI Global, as the dollar depreciated 10.00% against the U.S.’s major trading partners.6 The imbalance began unwinding as the U.S. trade deficit contracted toward year-end because of U.S. exports’ improved competitiveness due to a weaker dollar. However, the deficit was still quite large on a historical basis. The U.S. dollar weakened further when the Federal Reserve Board cut interest rates during the period, well ahead of other central banks, as the credit crunch affected the U.S. economy more than other countries. One currency that appreciated strongly against the U.S. dollar was the Canadian dollar, which rose 17.91% against the U.S. dollar during the period and contributed to relative performance because of the Fund’s overweighted exposure.7 The Canadian dollar benefited from high prices for many of the country’s natural resource exports and a strong domestic economy. Toward period-end, the weak U.S. economy began to negatively impact Canada’s growth prospects and led us to reduce the Fund’s Canadian dollar allocation prior to the Canadian dollar’s poor performance during the last quarter of 2007. The Fund’s overweighted exposure to the Brazilian real boosted the Fund’s relative performance even more as the currency appreciated 19.94% against the U.S. dollar during the year.7, 8 The real benefited from very strong inflows from trade and investment.
European currencies also appreciated against the U.S. dollar over the period. The Fund had limited direct exposure to the euro, and was instead positioned to capture the benefit of euro appreciation through exposure to non-euro European currencies that are closely linked to the euro region. The euro appreciated 10.87% versus the U.S. dollar during the period as growth remained strong and the interest rate differential with the U.S. shrank significantly.7 Although our limited exposure to the euro’s strong return hurt relative performance, the Fund benefited from its overweighted exposures to the Polish zloty and Norwegian krone.8 Similar to the Scandinavian economies, the Polish economy also exhibited tightening labor market conditions given strong GDP growth
6. Source: Federal Reserve H10 Report.
7. Source: Exshare (via Compustat via FactSet).
8. These countries are not components of the JPM GBI Global.
What is a current account?
A current account is that part of the balance of payments where all of one country’s international transactions in goods and services are recorded.
What is balance of payments?
Balance of payments is a record of all of a country’s exports and imports of goods and services, borrowing and lending with the rest of the world during a particular time period. It helps a country evaluate its competitive strengths and weaknesses and forecast the strength of its currency.
What is duration?
Duration is a measure of a bond’s price sensitivity to interest rate changes. In general, a portfolio of securities with a lower duration can be expected to be less sensitive to interest rate changes than a portfolio with a higher duration.
TGI-5
of more than 6% year-over-year in the third quarter of 2007.9 Strong economic growth created jobs at the same time that there was significant emigration from Poland. Prospects for wage pressures prompted the central bank to raise interest rates during the period, supporting currency performance. The Swedish krona detracted from relative performance as it appreciated only 5.88% against the U.S. dollar over the period.7 The Fund’s biggest allocation change during the period was the addition of the Swiss franc, which appreciated 3.18% during the fourth quarter benefiting from increased risk aversion.7
Asian currency performance was mixed during the year. The currency that comprised the largest portion of the Fund was the Japanese yen, though our exposure was still substantially below the benchmark’s. The yen, which appreciated 6.66% against the U.S. dollar over the period, lagged other major currencies until risk aversion increased in the second half of the year leading to the unwinding of carry trades.7 Among other Asian currencies, the Malaysian ringgit appreciated 6.68% against the U.S. dollar, the South Korean won depreciated 0.65%, and the Indonesian rupiah depreciated 4.25%.7 Our overweighted allocations in these currencies hurt the Fund’s relative performance.8
Global Sovereign Debt Strategy
The Fund purchased investment-grade and subinvestment-grade sovereign debt that typically compensates for greater credit risk by offering higher yields relative to U.S. and European benchmark Treasury securities. Tighter credit conditions resulted in wider sovereign credit spreads despite improving fundamentals in most economies. Sovereign interest rate credit spreads increased from 171 basis points at the beginning of the reporting period to 255 basis points by period-end. However, declining U.S. interest rates benefited the performance of these dollar-denominated bonds. Largely as a result, U.S. dollar-denominated emerging market debt returned +6.28% over the period, as measured by the JPM Emerging Markets Bond Index (EMBI) Global.5 Regionally, Latin American sovereign debt returned +5.15%, Asian +6.14%, and central and eastern European +7.91%.5
9. Source: National Bank of Poland.
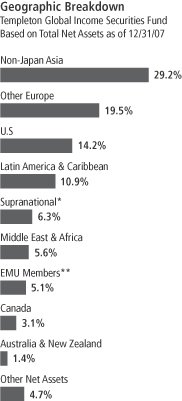
*The Fund’s supranational investments were denominated in the Japanese yen, Mexican peso, New Zealand dollar and Polish zloty.
**The Fund’s EMU investments were in Austria, Belgium, Finland, France, Germany and Spain.
TGI-6
Euro-denominated markets underperformed the index, returning 1.22% in euro terms, as measured by the JPM Euro EMBI Global.5 The Fund maintained limited exposure to sovereign debt during the period.
Thank you for your participation in Templeton Global Income Securities Fund. We look forward to serving your future investment needs.
The foregoing information reflects our analysis, opinions and portfolio holdings as of December 31, 2007, the end of the reporting period. The way we implement our main investment strategies and the resulting portfolio holdings may change depending on factors such as market and economic conditions. These opinions may not be relied upon as investment advice or an offer for a particular security. The information is not a complete analysis of every aspect of any market, country, industry, security or the Fund. Statements of fact are from sources considered reliable, but the investment manager makes no representation or warranty as to their completeness or accuracy. Although historical performance is no guarantee of future results, these insights may help you understand our investment management philosophy.
TGI-7
Fund Expenses
As an investor in a variable insurance contract (Contract) that indirectly provides for investment in an underlying mutual fund, you can incur transaction and/or ongoing expenses at both the Fund level and the Contract level.
| • | | Transaction expenses can include sales charges (loads) on purchases, redemption fees, surrender fees, transfer fees and premium taxes. |
| • | | Ongoing expenses can include management fees, distribution and service (12b-1) fees, contract fees, annual maintenance fees, mortality and expense risk fees and other fees and expenses. All mutual funds and Contracts have some types of ongoing expenses. |
The expenses shown in the table are meant to highlight ongoing expenses at the Fund level only and do not include ongoing expenses at the Contract level, or transaction expenses at either the Fund or Contract level. While the Fund does not have transaction expenses, if the transaction and ongoing expenses at the Contract level were included, the expenses shown would be higher. You should consult your Contract prospectus or disclosure document for more information.
The table shows Fund-level ongoing expenses and can help you understand these expenses and compare them with those of other mutual funds offered through the Contract. The table assumes a $1,000 investment held for the six months indicated. Please refer to the Fund prospectus for additional information on operating expenses.
Actual Fund Expenses
The first line (Actual) of the table provides actual account values and expenses. The “Ending Account Value” is derived from the Fund’s actual return, which includes the effect of ongoing Fund expenses, but does not include the effect of ongoing Contract expenses.
You can estimate the Fund-level expenses you incurred during the period by following these steps. Of course, your account value and expenses will differ from those in this illustration:
| 1. | Divide your account value by $1,000. |
If an account had an $8,600 value, then $8,600 ÷ $1,000 = 8.6.
| 2. | Multiply the result by the number under the heading “Fund-Level Expenses Incurred During Period.” |
If Fund-Level Expenses Incurred During Period were $7.50, then 8.6 x $7.50 = $64.50.
In this illustration, the estimated expenses incurred this period at the Fund level are $64.50.
Templeton Global Income Securities Fund – Class 3
TGI-8
Hypothetical Example for Comparison with Other Mutual Funds
Information in the second line (Hypothetical) of the table can help you compare ongoing expenses of the Fund with those of other mutual funds offered through the Contract. This information may not be used to estimate the actual ending account balance or expenses you incurred during the period. The hypothetical “Ending Account Value” is based on the Fund’s actual expense ratio for each class and an assumed 5% annual rate of return before expenses, which does not represent the Fund’s actual return. The figure under the heading “Fund-Level Expenses Incurred During Period” shows the hypothetical expenses your account would have incurred under this scenario. You can compare this figure with the 5% hypothetical examples that appear in shareholder reports of other funds offered through a Contract.
| | | | | | | | | |
| Class 3 | | Beginning
Account
Value 7/1/07 | | Ending
Account
Value 12/31/07 | | Fund-Level
Expenses Incurred
During Period*
7/1/07–12/31/07 |
Actual | | $ | 1,000 | | $ | 1,051.60 | | $ | 4.50 |
Hypothetical (5% return before expenses) | | $ | 1,000 | | $ | 1,020.82 | | $ | 4.43 |
*Expenses are calculated using the most recent six-month annualized expense ratio for the Fund’s Class 3 shares (0.87%), which does not include any ongoing expenses of the Contract for which the Fund is an investment option, multiplied by the average account value over the period, multiplied by 184/365 to reflect the one-half year period.
TGI-9
Franklin Templeton Variable Insurance Products Trust
Financial Highlights
Templeton Global Income Securities Fund
| | | | | | | | | | | | | | | | | | | | |
| | | Year Ended December 31, | |
| Class 1 | | 2007 | | | 2006 | | | 2005 | | | 2004 | | | 2003 | |
| | | | |
Per share operating performance | | | | | | | | | | | | | | | | | | | | |
(for a share outstanding throughout the year) | | | | | | | | | | | | | | | | | | | | |
Net asset value, beginning of year | | $ | 15.73 | | | $ | 14.36 | | | $ | 15.80 | | | $ | 15.54 | | | $ | 13.67 | |
| | | | |
Income from investment operationsa: | | | | | | | | | | | | | | | | | | | | |
Net investment incomeb | | | 0.77 | | | | 0.61 | | | | 0.57 | | | | 0.66 | | | | 0.69 | |
Net realized and unrealized gains (losses) | | | 0.97 | | | | 1.24 | | | | (1.03 | ) | | | 1.37 | | | | 2.35 | |
| | | | |
Total from investment operations | | | 1.74 | | | | 1.85 | | | | (0.46 | ) | | | 2.03 | | | | 3.04 | |
| | | | |
Less distributions from net investment income | | | (0.47 | ) | | | (0.48 | ) | | | (0.98 | ) | | | (1.77 | ) | | | (1.17 | ) |
| | | | |
Redemption fees | | | — | d | | | — | d | | | — | d | | | — | | | | — | |
| | | | |
Net asset value, end of year | | $ | 17.00 | | | $ | 15.73 | | | $ | 14.36 | | | $ | 15.80 | | | $ | 15.54 | |
| | | | |
| | | | | |
Total returnc | | | 11.27% | | | | 13.14% | | | | (2.91)% | | | | 15.09% | | | | 22.72% | |
Ratios to average net assets | | | | | | | | | | | | | | | | | | | | |
Expenses before expense reduction | | | 0.64% | | | | 0.80% | | | | 0.78% | | | | 0.79% | | | | 0.76% | |
Expenses net of expense reduction | | | 0.64% | | | | 0.72% | | | | 0.74% | | | | 0.78% | | | | 0.76% | |
Net investment income | | | 4.70% | | | | 4.09% | | | | 3.81% | | | | 4.40% | | | | 4.72% | |
| | | | | |
Supplemental data | | | | | | | | | | | | | | | | | | | | |
Net assets, end of year (000’s) | | $ | 137,700 | | | $ | 75,843 | | | $ | 53,115 | | | $ | 49,845 | | | $ | 52,842 | |
Portfolio turnover rate | | | 47.33% | | | | 30.65% | | | | 30.28% | | | | 37.39% | | | | 53.01% | |
aThe amount shown for a share outstanding throughout the period may not correlate with the Statement of Operations for the period due to the timing of sales and repurchases of the Fund shares in relation to income earned and/or fluctuating market value of the investments of the Fund.
bBased on average daily shares outstanding.
cTotal return does not include any fees, charges or expenses imposed by the variable annuity and life insurance contracts for which the Franklin Templeton Variable Insurance Products Trust serves as an underlying investment vehicle.
dAmount rounds to less than $0.01 per share.
The accompanying notes are an integral part of these financial statements.
TGI-10
Franklin Templeton Variable Insurance Products Trust
Financial Highlights (continued)
Templeton Global Income Securities Fund
| | | | | | | | | | | | | | | | | | | | |
| | | Year Ended December 31, | |
| Class 2 | | 2007 | | | 2006 | | | 2005 | | | 2004 | | | 2003 | |
| | | | |
Per share operating performance | | | | | | | | | | | | | | | | | | | | |
(for a share outstanding throughout the year) | | | | | | | | | | | | | | | | | | | | |
Net asset value, beginning of year | | $ | 15.50 | | | $ | 14.19 | | | $ | 15.64 | | | $ | 15.42 | | | $ | 13.59 | |
| | | | |
Income from investment operationsa: | | | | | | | | | | | | | | | | | | | | |
Net investment incomeb | | | 0.72 | | | | 0.57 | | | | 0.52 | | | | 0.60 | | | | 0.65 | |
Net realized and unrealized gains (losses) | | | 0.96 | | | | 1.21 | | | | (1.00 | ) | | | 1.36 | | | | 2.33 | |
| | | | |
Total from investment operations | | | 1.68 | | | | 1.78 | | | | (0.48 | ) | | | 1.96 | | | | 2.98 | |
| | | | |
Less distributions from net investment income | | | (0.46 | ) | | | (0.47 | ) | | | (0.97 | ) | | | (1.74 | ) | | | (1.15 | ) |
| | | | |
Redemption fees | | | — | d | | | — | d | | | — | d | | | — | | | | — | |
| | | | |
Net asset value, end of year | | $ | 16.72 | | | $ | 15.50 | | | $ | 14.19 | | | $ | 15.64 | | | $ | 15.42 | |
| | | | |
| | | | | |
Total returnc | | | 11.00% | | | | 12.77% | | | | (3.08)% | | | | 14.74% | | | | 22.44% | |
Ratios to average net assets | | | | | | | | | | | | | | | | | | | | |
Expenses before expense reduction | | | 0.89% | | | | 1.05% | | | | 1.03% | | | | 1.04% | | | | 1.01% | |
Expenses net of expense reduction | | | 0.89% | | | | 0.97% | | | | 0.99% | | | | 1.03% | | | | 1.01% | |
Net investment income | | | 4.45% | | | | 3.84% | | | | 3.56% | | | | 4.15% | | | | 4.47% | |
| | | | | |
Supplemental data | | | | | | | | | | | | | | | | | | | | |
Net assets, end of year (000’s) | | $ | 480,649 | | | $ | 205,768 | | | $ | 61,255 | | | $ | 19,779 | | | $ | 5,181 | |
Portfolio turnover rate | | | 47.33% | | | | 30.65% | | | | 30.28% | | | | 37.39% | | | | 53.01% | |
aThe amount shown for a share outstanding throughout the period may not correlate with the Statement of Operations for the period due to the timing of sales and repurchases of the Fund shares in relation to income earned and/or fluctuating market value of the investments of the Fund.
bBased on average daily shares outstanding.
cTotal return does not include any fees, charges or expenses imposed by the variable annuity and life insurance contracts for which the Franklin Templeton Variable Insurance Products Trust serves as an underlying investment vehicle.
dAmount rounds to less than $0.01 per share.
The accompanying notes are an integral part of these financial statements.
TGI-11
Franklin Templeton Variable Insurance Products Trust
Financial Highlights (continued)
Templeton Global Income Securities Fund
| | | | | | | | | | | | |
| | | Year Ended December 31, | |
| Class 3 | | 2007 | | | 2006 | | | 2005f | |
| | | | |
Per share operating performance | | | | | | | | | | | | |
(for a share outstanding throughout the year) | | | | | | | | | | | | |
Net asset value, beginning of year | | $ | 15.49 | | | $ | 14.18 | | | $ | 15.27 | |
| | | | |
Income from investment operationsa: | | | | | | | | | | | | |
Net investment incomeb | | | 0.72 | | | | 0.58 | | | | 0.38 | |
Net realized and unrealized gains (losses) | | | 0.95 | | | | 1.21 | | | | (0.50 | ) |
| | | | |
Total from investment operations | | | 1.67 | | | | 1.79 | | | | (0.12 | ) |
| | | | |
Less distributions from net investment income | | | (0.46 | ) | | | (0.48 | ) | | | (0.97 | ) |
| | | | |
Redemption fees | | | — | e | | | — | e | | | — | e |
| | | | |
Net asset value, end of year | | $ | 16.70 | | | $ | 15.49 | | | $ | 14.18 | |
| | | | |
| | | |
Total returnc | | | 11.03% | | | | 12.84% | | | | (0.80)% | |
Ratios to average net assetsd | | | | | | | | | | | | |
Expenses before expense reduction | | | 0.89% | | | | 1.05% | | | | 1.03% | |
Expenses net of expense reduction | | | 0.89% | | | | 0.97% | | | | 0.99% | |
Net investment income | | | 4.45% | | | | 3.84% | | | | 3.56% | |
Supplemental data | | | | | | | | | | | | |
Net assets, end of year (000’s) | | $ | 91,162 | | | $ | 35,572 | | | $ | 5,769 | |
Portfolio turnover rate | | | 47.33% | | | | 30.65% | | | | 30.28% | |
aThe amount shown for a share outstanding throughout the period may not correlate with the Statement of Operations for the period due to the timing of sales and repurchases of the Fund shares in relation to income earned and/or fluctuating market value of the investments of the Fund.
bBased on average daily shares outstanding.
cTotal return does not include any fees, charges or expenses imposed by the variable annuity and life insurance contracts for which the Franklin Templeton Variable Insurance Products Trust serves as an underlying investment vehicle. Total return is not annualized for periods less than one year.
dRatios are annualized for periods less than one year.
eAmount rounds to less than $0.01 per share.
fFor the period April 1, 2005 (effective date) to December 31, 2005.
The accompanying notes are an integral part of these financial statements.
TGI-12
Franklin Templeton Variable Insurance Products Trust
Statement of Investments, December 31, 2007
| | | | | | |
| Templeton Global Income Securities Fund | | Principal
Amounta | | | Value |
Government and Agency Securities 68.6% | | | | | | |
Argentina 1.7% | | | | | | |
b,cGovernment of Argentina, FRN, 5.389%, 8/03/12 | | 21,792,000 | | | $ | 11,849,340 |
| | | | | | |
Australia 1.1% | | | | | | |
New South Wales Treasury Corp., 8.00%, 3/01/08 | | 5,990,000 | AUD | | | 5,255,486 |
Queensland Treasury Corp., 6.00%, 7/14/09 | | 3,195,000 | AUD | | | 2,756,996 |
| | | | | | |
| | | | | | 8,012,482 |
| | | | | | |
Austria 0.1% | | | | | | |
Government of Austria, 5.00%, 7/15/12 | | 400,000 | EUR | | | 602,618 |
| | | | | | |
Belgium 0.2% | | | | | | |
Government of Belgium, 7.50%, 7/29/08 | | 686,000 | EUR | | | 1,019,949 |
| | | | | | |
Brazil 5.1% | | | | | | |
Nota Do Tesouro Nacional, | | | | | | |
9.762%, 1/01/12 | | 20,470 | d BRL | | | 10,511,467 |
9.762%, 1/01/14 | | 7,100 | d BRL | | | 3,506,031 |
9.762%, 1/01/17 | | 22,490 | d BRL | | | 10,654,128 |
eIndex Linked, 6.00%, 5/15/15 | | 2,750 | d BRL | | | 2,391,221 |
eIndex Linked, 6.00%, 5/15/45 | | 10,825 | d BRL | | | 9,407,813 |
| | | | | | |
| | | | | | 36,470,660 |
| | | | | | |
Canada 3.1% | | | | | | |
Government of Canada, 4.25%, 12/01/08 | | 14,500,000 | CAD | | | 14,638,527 |
Province of Alberta, 5.00%, 12/16/08 | | 1,405,000 | CAD | | | 1,426,435 |
Province of Manitoba, 6.375%, 9/01/15 | | 1,638,000 | NZD | | | 1,154,776 |
Province of Ontario, | | | | | | |
3.875%, 3/08/08 | | 1,925,000 | CAD | | | 1,936,312 |
5.70%, 12/01/08 | | 2,200,000 | CAD | | | 2,246,422 |
6.25%, 6/16/15 | | 925,000 | NZD | | | 645,202 |
| | | | | | |
| | | | | | 22,047,674 |
| | | | | | |
France 0.0%f | | | | | | |
Government of France, 4.00%, 10/25/09 | | 195,000 | EUR | | | 284,124 |
| | | | | | |
Germany 4.7% | | | | | | |
bKfW Bankengruppe, FRN, 0.658%, 8/08/11 | | 3,725,000,000 | JPY | | | 33,421,349 |
| | | | | | |
Indonesia 5.1% | | | | | | |
Government of Indonesia, | | | | | | |
14.275%, 12/15/13 | | 14,267,000,000 | IDR | | | 1,834,165 |
11.50%, 9/15/19 | | 30,075,000,000 | IDR | | | 3,484,105 |
11.00%, 11/15/20 | | 31,230,000,000 | IDR | | | 3,459,725 |
12.80%, 6/15/21 | | 74,215,000,000 | IDR | | | 9,201,435 |
12.90%, 6/15/22 | | 10,710,000,000 | IDR | | | 1,331,812 |
10.25%, 7/15/22 | | 52,500,000,000 | IDR | | | 5,519,698 |
11.75%, 8/15/23 | | 5,491,000,000 | IDR | | | 629,893 |
10.00%, 9/15/24 | | 5,000,000,000 | IDR | | | 502,416 |
11.00%, 9/15/25 | | 39,400,000,000 | IDR | | | 4,292,267 |
12.00%, 9/15/26 | | 8,230,000,000 | IDR | | | 985,760 |
10.25%, 7/15/27 | | 48,220,000,000 | IDR | | | 5,005,535 |
| | | | | | |
| | | | | | 36,246,811 |
| | | | | | |
Iraq 0.9% | | | | | | |
gGovernment of Iraq, Reg S, 5.80%, 1/15/28 | | 9,300,000 | | | | 6,184,500 |
| | | | | | |
TGI-13
Franklin Templeton Variable Insurance Products Trust
Statement of Investments, December 31, 2007 (continued)
| | | | | | |
| Templeton Global Income Securities Fund | | Principal
Amounta | | | Value |
Government and Agency Securities (continued) | | | | | | |
Malaysia 4.0% | | | | | | |
Government of Malaysia, | | | | | | |
6.45%, 7/01/08 | | 14,772,000 | MYR | | $ | 4,531,864 |
3.917%, 9/30/08 | | 400,000 | MYR | | | 121,211 |
4.305%, 2/27/09 | | 4,210,000 | MYR | | | 1,284,705 |
7.00%, 3/15/09 | | 12,234,000 | MYR | | | 3,851,174 |
6.844%, 10/01/09 | | 2,800,000 | MYR | | | 894,663 |
3.756%, 4/28/11 | | 57,160,000 | MYR | | | 17,380,607 |
| | | | | | |
| | | | | | 28,064,224 |
| | | | | | |
Mexico 3.5% | | | | | | |
Government of Mexico, | | | | | | |
h144A, 7.50%, 3/08/10 | | 450,000 | EUR | | | 695,322 |
8.00%, 12/17/15 | | 726,000i | MXN | | | 6,586,004 |
10.00%, 12/05/24 | | 1,655,000i | MXN | | | 17,649,089 |
| | | | | | |
| | | | | | 24,930,415 |
| | | | | | |
New Zealand 0.3% | | | | | | |
Government of New Zealand, 7.00%, 7/15/09 | | 2,435,000 | NZD | | | 1,856,583 |
| | | | | | |
Norway 2.0% | | | | | | |
Government of Norway, 5.50%, 5/15/09 | | 76,360,000 | NOK | | | 14,204,154 |
| | | | | | |
Peru 0.6% | | | | | | |
Government of Peru, | | | | | | |
7, 8.60%, 8/12/17 | | 6,185,000 | PEN | | | 2,397,085 |
7.84%, 8/12/20 | | 4,945,000 | PEN | | | 1,856,671 |
| | | | | | |
| | | | | | 4,253,756 |
| | | | | | |
Philippines 0.1% | | | | | | |
gGovernment of the Philippines, Reg S, 9.125%, 2/22/10 | | 330,000 | EUR | | | 513,635 |
| | | | | | |
Poland 3.0% | | | | | | |
Government of Poland, | | | | | | |
6.00%, 5/24/09 | | 4,045,000 | PLN | | | 1,633,414 |
5.75%, 9/23/22 | | 48,750,000 | PLN | | | 19,621,238 |
| | | | | | |
| | | | | | 21,254,652 |
| | | | | | |
Singapore 3.6% | | | | | | |
Government of Singapore, | | | | | | |
1.50%, 4/01/08 | | 350,000 | SGD | | | 242,605 |
5.625%, 7/01/08 | | 8,370,000 | SGD | | | 5,912,529 |
4.375%, 1/15/09 | | 27,640,000 | SGD | | | 19,664,495 |
| | | | | | |
| | | | | | 25,819,629 |
| | | | | | |
South Africa 0.1% | | | | | | |
Government of South Africa, 5.25%, 5/16/13 | | 200,000 | EUR | | | 288,951 |
| | | | | | |
South Korea 10.9% | | | | | | |
Korea Treasury Bond, | | | | | | |
4.75%, 3/10/12 | | 2,184,000,000 | KRW | | | 2,247,021 |
5.25%, 9/10/12 | | 14,139,000,000 | KRW | | | 14,788,929 |
5.00%, 9/10/16 | | 2,806,000,000 | KRW | | | 2,853,143 |
5.50%, 9/10/17 | | 39,555,600,000 | KRW | | | 41,647,581 |
5.25%, 3/10/27 | | 9,463,500,000 | KRW | | | 9,647,831 |
Korea Treasury Note, 4.75%, 6/10/09 | | 5,925,000,000 | KRW | | | 6,240,303 |
| | | | | | |
| | | | | | 77,424,808 |
| | | | | | |
TGI-14
Franklin Templeton Variable Insurance Products Trust
Statement of Investments, December 31, 2007 (continued)
| | | | | | |
| Templeton Global Income Securities Fund | | Principal
Amounta | | | Value |
Government and Agency Securities (continued) | | | | | | |
Spain 0.1% | | | | | | |
Government of Spain, 6.00%, 1/31/08 | | 390,000 | EUR | | $ | 569,976 |
| | | | | | |
jSupranational 6.3% | | | | | | |
European Bank For Reconstruction & Development, senior note, 5.10%, 6/12/09 | | 40,000,000 | PLN | | | 16,111,143 |
bEuropean Investment Bank, senior note, FRN, 0.75%, 9/21/11 | | 1,340,000,000 | JPY | | | 12,019,673 |
Inter-American Development Bank,
6.00%, 12/15/17 | | 575,000 | NZD | | | 395,615 |
senior note, 7.50%, 12/05/24 | | 200,000,000 | MXN | | | 16,268,205 |
| | | | | | |
| | | | | | 44,794,636 |
| | | | | | |
Sweden 11.9% | | | | | | |
Government of Sweden,
6.50%, 5/05/08 | | 151,000,000 | SEK | | | 23,520,801 |
5.00%, 1/28/09 | | 363,050,000 | SEK | | | 56,623,604 |
kStrip, 9/17/08 | | 30,000,000 | SEK | | | 4,506,658 |
| | | | | | |
| | | | | | 84,651,063 |
| | | | | | |
United States 0.2% | | | | | | |
FNMA, 1.75%, 3/26/08 | | 180,000,000 | JPY | | | 1,617,241 |
| | | | | | |
Total Government and Agency Securities (Cost $470,307,729) | | | | | | 486,383,230 |
| | | | | | |
Short Term Investments 26.7% | | | | | | |
Government and Agency Securities 12.7% | | | | | | |
Egypt 4.6% | | | | | | |
k,lEgypt Treasury Bills, 1/01/08 – 12/30/08 | | 185,275,000 | EGP | | | 32,231,090 |
| | | | | | |
Malaysia 5.5% | | | | | | |
Government of Malaysia,
3.546%, 1/11/08 | | 8,890,000 | MYR | | | 2,688,345 |
3.569%, 2/14/08 | | 17,280,000 | MYR | | | 5,225,280 |
7.60%, 3/15/08 | | 5,000,000 | MYR | | | 1,524,493 |
3.17%, 5/15/08 | | 16,610,000 | MYR | | | 5,016,521 |
3.541%, 7/08/08 | | 6,100,000 | MYR | | | 1,844,572 |
3.562%, 7/15/08 | | 10,550,000 | MYR | | | 3,190,439 |
kMalaysia Treasury Bills, 1/04/08 – 9/23/08 | | 66,235,000 | MYR | | | 19,796,132 |
| | | | | | |
| | | | | | 39,285,782 |
| | | | | | |
Norway 2.0% | | | | | | |
kNorway Treasury Bills, 3/19/08 – 6/18/08 | | 77,955,000 | NOK | | | 14,113,514 |
| | | | | | |
Sweden 0.6% | | | | | | |
kGovernment of Sweden, Strip, 6/18/08 | | 30,000,000 | SEK | | | 4,552,732 |
| | | | | | |
Total Government and Agency Securities (Cost $86,747,759) | | | | | | 90,183,118 |
| | | | | | |
Total Investment before Repurchase Agreement (Cost $557,055,488) | | | | | | 576,566,348 |
| | | | | | |
United States 14.0% | | | | | | |
Repurchase Agreement (Cost $99,770,604) 14.0% | | | | | | |
mJoint Repurchase Agreement, 3.773%, 1/02/08 (Maturity Value $99,791,515) | | 99,770,604 | | | | 99,770,604 |
ABN AMRO Bank NV, New York Branch (Maturity Value $9,819,485) | | | | | | |
Banc of America Securities LLC (Maturity Value $9,819,485) | | | | | | |
TGI-15
Franklin Templeton Variable Insurance Products Trust
Statement of Investments, December 31, 2007 (continued)
| | | |
| Templeton Global Income Securities Fund | | Value |
United States (continued) | | | |
Repurchase Agreement (continued) | | | |
Barclays Capital Inc. (Maturity Value $4,522,551) | | | |
BNP Paribas Securities Corp. (Maturity Value $9,819,485) | | | |
Credit Suisse Securities (USA) LLC (Maturity Value $2,583,602) | | | |
Deutsche Bank Securities Inc. (Maturity Value $9,819,485) | | | |
Dresdner Kleinwort Wasserstein Securities LLC (Maturity Value $9,819,485) | | | |
Goldman, Sachs & Co. (Maturity Value $11,886,167) | | | |
Greenwich Capital Markets Inc. (Maturity Value $9,819,485) | | | |
Lehman Brothers Inc. (Maturity Value $12,062,800) | | | |
Merrill Lynch Government Securities Inc. (Maturity Value $9,819,485) | | | |
Collateralized by U.S. Government Agency Securities, 3.00% - 6.25%, 1/15/08 - 11/14/12;
kU.S. Government Agency Discount Notes, 1/02/08 - 8/01/12; kU.S. Treasury Bill, 6/12/08;
and U.S. Treasury Notes, 3.25% - 4.625%, 3/31/08 - 8/15/10 | | | |
| | | |
Total Investments (Cost $656,826,092) 95.3% | | | 676,336,952 |
Net Unrealized Gain on Forward Exchange Contracts 0.5% | | | 3,595,078 |
Other Assets, less Liabilities 4.2% | | | 29,579,498 |
| | | |
Net Assets 100.0% | | $ | 709,511,528 |
| | | |
Currency Abbreviations
AUD - Australian Dollar
BRL - Brazilian Real
CAD - Canadian Dollar
EGP - Egyptian Pound
EUR - Euro
IDR - Indonesian Rupiah
JPY - Japanese Yen
KRW - South Korean Won
MXN - Mexican Peso
MYR - Malaysian Ringgit
NOK - Norwegian Krone
NZD - New Zealand Dollar
PEN - Peruvian Nuevo Sol
PLN - Polish Zloty
SEK - Swedish Krona
SGD - Singapore Dollar
Selected Portfolio Abbreviations
FNMA - Federal National Mortgage Association
FRN - Floating Rate Note
aThe principal amount is stated in U.S. dollars unless otherwise indicated.
bThe coupon rate shown represents the rate at period end.
cThe principal amount is stated in original face, and scheduled paydowns are reflected in the market price on ex-date.
dPrincipal amount is stated in 1,000 Brazilian Real units.
ePrincipal amount of security is adjusted for inflation. See Note 1(g).
fRounds to less than 0.1% of net assets.
gSecurity was purchased pursuant to Regulation S under the Securities Act of 1933, which exempts from registration securities offered and sold outside of the United States. Such a security cannot be sold in the United States without either an effective registration statement filed pursuant to the Securities Act of 1933, or pursuant to an exemption from registration. These securities have been deemed liquid under guidelines approved by the Trust’s Board of Trustees. At December 31, 2007, the aggregate value of these securities was $6,698,135, representing 0.94% of net assets.
hSecurity was purchased pursuant to Rule 144A under the Securities Act of 1933 and may be sold in transactions exempt from registration only to qualified institutional buyers or in a public offering registered under the Securities Act of 1933. This security has been deemed liquid under guidelines approved by the Trust’s Board of Trustees. At December 31, 2007, the value of this security was $695,322, representing 0.10% of net assets.
iPrincipal amount is stated in 100 Mexican Peso units.
jA supranational organization is an entity formed by two or more central governments through international treaties.
kThe security is traded on a discount basis with no stated coupon rate.
lA portion or all of the securities purchased on a when-issued or delayed delivery basis. See Note 1(d).
mSee Note 1(c) regarding joint repurchase agreement.
The accompanying notes are an integral part of these financial statements.
TGI-16
Franklin Templeton Variable Insurance Products Trust
Financial Statements
Statement of Assets and Liabilities
December 31, 2007
| | | | |
| | | Templeton
Global Income
Securities Fund | |
Assets: | | | | |
Investments in securities: | | | | |
Cost - Unaffiliated issuers | | $ | 557,055,488 | |
Cost - Repurchase agreement | | | 99,770,604 | |
| | | | |
Total cost of investments | | $ | 656,826,092 | |
| | | | |
Value - Unaffiliated issuers | | $ | 576,566,348 | |
Value - Repurchase agreement | | | 99,770,604 | |
| | | | |
Total value of investments | | | 676,336,952 | |
Foreign currency, at value (cost $21,899,060) | | | 23,012,645 | |
Receivables: | | | | |
Capital shares sold | | | 1,309,564 | |
Interest | | | 11,108,000 | |
Unrealized gain on forward exchange contracts (Note 7) | | | 5,049,276 | |
| | | | |
Total assets | | | 716,816,437 | |
| | | | |
Liabilities: | | | | |
Payables: | | | | |
Investment securities purchased | | | 4,969,036 | |
Capital shares redeemed | | | 92,398 | |
Affiliates | | | 515,344 | |
Unrealized loss on forward exchange contracts (Note 7) | | | 1,454,198 | |
Accrued expenses and other liabilities | | | 273,933 | |
| | | | |
Total liabilities | | | 7,304,909 | |
| | | | |
Net assets, at value | | $ | 709,511,528 | |
| | | | |
Net assets consist of: | | | | |
Paid-in capital | | $ | 653,607,990 | |
Undistributed net investment income | | | 35,686,615 | |
Net unrealized appreciation (depreciation) | | | 24,416,313 | |
Accumulated net realized gain (loss) | | | (4,199,390 | ) |
| | | | |
Net assets, at value | | $ | 709,511,528 | |
| | | | |
Class 1: | | | | |
Net assets, at value | | $ | 137,700,254 | |
| | | | |
Shares outstanding | | | 8,102,207 | |
| | | | |
Net asset value and maximum offering price per share | | $ | 17.00 | |
| | | | |
Class 2: | | | | |
Net assets, at value | | $ | 480,648,788 | |
| | | | |
Shares outstanding | | | 28,745,875 | |
| | | | |
Net asset value and maximum offering price per share | | $ | 16.72 | |
| | | | |
Class 3: | | | | |
Net assets, at value | | $ | 91,162,486 | |
| | | | |
Shares outstanding | | | 5,457,279 | |
| | | | |
Net asset value and maximum offering price per sharea | | $ | 16.70 | |
| | | | |
aRedemption | price is equal to net asset value less any redemption fees retained by the Fund. |
The accompanying notes are an integral part of these financial statements.
TGI-17
Franklin Templeton Variable Insurance Products Trust
Financial Statements (continued)
Statement of Operations
for the year ended December 31, 2007
| | | | |
| | | Templeton
Global Income
Securities Fund | |
Investment income: | | | | |
Interest (net of foreign taxes of $688,223) | | $ | 25,268,490 | |
| | | | |
Expenses: | | | | |
Management fees (Note 3a) | | | 2,376,316 | |
Distribution fees: (Note 3c) | | | | |
Class 2 | | | 802,153 | |
Class 3 | | | 154,518 | |
Unaffiliated transfer agent fees | | | 6,765 | |
Custodian fees (Note 4) | | | 459,998 | |
Reports to shareholders | | | 132,349 | |
Professional fees | | | 36,546 | |
Trustees’ fees and expenses | | | 1,697 | |
Other | | | 21,230 | |
| | | | |
Total expenses | | | 3,991,572 | |
Expense reductions (Note 4) | | | (5,199 | ) |
| | | | |
Net expenses | | | 3,986,373 | |
| | | | |
Net investment income | | | 21,282,117 | |
| | | | |
Realized and unrealized gains (losses): | | | | |
Net realized gain (loss) from: | | | | |
Investments | | | 18,145,387 | |
Foreign currency transactions | | | (262,750 | ) |
| | | | |
Net realized gain (loss) | | | 17,882,637 | |
| | | | |
Net change in unrealized appreciation (depreciation) on:
Investments | | | 7,705,155 | |
Translation of assets and liabilities denominated in foreign currencies | | | 1,209,672 | |
| | | | |
Net change in unrealized appreciation (depreciation) | | | 8,914,827 | |
| | | | |
Net realized and unrealized gain (loss) | | | 26,797,464 | |
| | | | |
Net increase (decrease) in net assets resulting from operations | | $ | 48,079,581 | |
| | | | |
The accompanying notes are an integral part of these financial statements.
TGI-18
Franklin Templeton Variable Insurance Products Trust
Financial Statements (continued)
Statements of Changes in Net Assets
| | | | | | | | |
| | | Templeton Global Income
Securities Fund | |
| | Year Ended December 31, | |
| | 2007 | | | 2006 | |
| | | | |
Increase (decrease) in net assets: | | | | | | | | |
Operations: | | | | | | | | |
Net investment income | | $ | 21,282,117 | | | $ | 7,811,021 | |
Net realized gain (loss) from investments and foreign currency transactions | | | 17,882,637 | | | | 4,248,556 | |
Net change in unrealized appreciation (depreciation) on investments and translation of assets and
liabilities denominated in foreign currencies | | | 8,914,827 | | | | 12,273,367 | |
| | | | |
Net increase (decrease) in net assets resulting from operations | | | 48,079,581 | | | | 24,332,944 | |
| | | | |
Distributions to shareholders from net investment income: | | | | | | | | |
Class 1 | | | (2,456,235 | ) | | | (2,013,759 | ) |
Class 2 | | | (8,266,690 | ) | | | (3,259,404 | ) |
Class 3 | | | (1,628,484 | ) | | | (431,514 | ) |
| | | | |
Total distributions to shareholders | | | (12,351,409 | ) | | | (5,704,677 | ) |
| | | | |
Capital share transactions: (Note 2) | | | | | | | | |
Class 1 | | | 55,559,172 | | | | 16,986,934 | |
Class 2 | | | 250,108,969 | | | | 133,487,737 | |
Class 3 | | | 50,922,791 | | | | 27,934,695 | |
| | | | |
Total capital share transactions | �� | | 356,590,932 | | | | 178,409,366 | |
| | | | |
Redemption fees | | | 9,428 | | | | 6,342 | |
| | | | |
Net increase (decrease) in net assets | | | 392,328,532 | | | | 197,043,975 | |
Net assets: | | | | | | | | |
Beginning of year | | | 317,182,996 | | | | 120,139,021 | |
| | | | |
End of year | | $ | 709,511,528 | | | $ | 317,182,996 | |
| | | | |
Undistributed net investment income included in net assets: | | | | | | | | |
End of year | | $ | 35,686,615 | | | $ | 9,842,829 | |
| | | | |
The accompanying notes are an integral part of these financial statements.
TGI-19
Franklin Templeton Variable Insurance Products Trust
Notes to Financial Statements
Templeton Global Income Securities Fund
1. ORGANIZATION AND SIGNIFICANT ACCOUNTING POLICIES
Franklin Templeton Variable Insurance Products Trust (Trust) is registered under the Investment Company Act of 1940, as amended, (1940 Act) as an open-end investment company, consisting of twenty-three separate funds. The Templeton Global Income Securities Fund (Fund) included in this report is non-diversified. The financial statements of the remaining funds in the Trust are presented separately. Shares of the Fund are sold only to insurance company separate accounts to fund the benefits of variable life insurance policies or variable annuity contracts. The Fund offers three classes of shares: Class 1, Class 2, and Class 3. Each class of shares differs by its distribution fees, voting rights on matters affecting a single class and its exchange privilege.
The following summarizes the Fund’s significant accounting policies.
a. Security Valuation
Securities listed on a securities exchange or on the NASDAQ National Market System are valued at the last quoted sale price or the official closing price of the day, respectively. Over-the-counter securities and listed securities for which there is no reported sale are valued within the range of the most recent quoted bid and ask prices. Securities that trade in multiple markets or on multiple exchanges are valued according to the broadest and most representative market.
Corporate debt securities and government securities generally trade in the over-the-counter market rather than on a securities exchange. The Trust may utilize independent pricing services, quotations from bond dealers, and information with respect to bond and note transactions, to assist in determining a current market value for each security. The Trust’s pricing services may use valuation models or matrix pricing which considers information with respect to comparable bond and note transactions, quotations from bond dealers, or by reference to other securities that are considered comparable in such characteristics as rating, interest rate and maturity date, option adjusted spread models, prepayment projections, interest rate spreads and yield curves, to determine current value.
Foreign securities are valued as of the close of trading on the foreign stock exchange on which the security is primarily traded, or the NYSE, whichever is earlier. If no sale is reported at that time, the foreign security will be valued within the range of the most recent quoted bid and ask prices. The value is then converted into its U.S. dollar equivalent at the foreign exchange rate in effect at the close of the NYSE on the day that the value of the foreign security is determined.
The Trust has procedures to determine the fair value of individual securities and other assets for which market prices are not readily available or which may not be reliably priced. Methods for valuing these securities may include: fundamental analysis, matrix pricing, discounts from market prices of similar securities, or discounts applied due to the nature and duration of restrictions on the disposition of the securities. Due to the inherent uncertainty of valuations of such securities, the fair values may differ significantly from the values that would have been used had a ready market for such investments existed. Occasionally, events occur between the time at which trading in a security is completed and the close of the NYSE that might call into question the availability (including the reliability) of the value of a portfolio security held by the Fund. The investment manager monitors price movements following the close of trading in foreign stock markets through a series of country specific market proxies (such as baskets of American Depository Receipts, futures contracts and exchange traded funds). These price movements are measured against established trigger thresholds for each specific market proxy to assist in determining if an event has occurred. If such an event occurs, the securities may be valued using fair value procedures, which may include the use of independent pricing services. All security valuation procedures are approved by the Trust’s Board of Trustees.
b. Foreign Currency Translation
Portfolio securities and other assets and liabilities denominated in foreign currencies are translated into U.S. dollars based on the exchange rate of such currencies against U.S. dollars on the date of valuation. Purchases and sales of securities, income and expense items denominated in foreign currencies are translated into U.S. dollars at the exchange rate in effect on the transaction
TGI-20
Franklin Templeton Variable Insurance Products Trust
Notes to Financial Statements (continued)
Templeton Global Income Securities Fund
1. ORGANIZATION AND SIGNIFICANT ACCOUNTING POLICIES (continued)
b. Foreign Currency Translation (continued)
date. Occasionally, events may impact the availability or reliability of foreign exchange rates used to convert the U.S. dollar equivalent value. If such an event occurs, the foreign exchange rate will be valued at fair value using procedures established and approved by the Trust’s Board of Trustees.
The Fund does not separately report the effect of changes in foreign exchange rates from changes in market prices on securities held. Such changes are included in net realized and unrealized gain or loss from investments on the Statement of Operations.
Realized foreign exchange gains or losses arise from sales of foreign currencies, currency gains or losses realized between the trade and settlement dates on securities transactions and the difference between the recorded amounts of dividends, interest, and foreign withholding taxes and the U.S. dollar equivalent of the amounts actually received or paid. Net unrealized foreign exchange gains and losses arise from changes in foreign exchange rates on foreign denominated assets and liabilities other than investments in securities held at the end of the reporting period.
c. Joint Repurchase Agreement
The Fund may enter into a joint repurchase agreement whereby its uninvested cash balance is deposited into a joint cash account with other funds managed by the investment manager or an affiliate of the investment manager and is used to invest in one or more repurchase agreements. The value and face amount of the joint repurchase agreement are allocated to the funds based on their pro-rata interest. A repurchase agreement is accounted for as a loan by the fund to the seller, collateralized by securities which are delivered to the fund’s custodian. The market value, including accrued interest, of the initial collateralization is required to be at least 102% of the dollar amount invested by the funds, with the value of the underlying securities marked to market daily to maintain coverage of at least 100%. The joint repurchase agreement held by the Fund at year end had been entered into on December 31, 2007. The joint repurchase agreement is valued at cost.
d. Securities Purchased on a When-Issued or Delayed Delivery Basis
The Fund may purchase securities on a when-issued or delayed delivery basis, with payment and delivery scheduled for a future date. These transactions are subject to market fluctuations and are subject to the risk that the value at delivery may be more or less than the trade date purchase price. Although the Fund will generally purchase these securities with the intention of holding the securities, it may sell the securities before the settlement date. Sufficient assets have been segregated for these securities.
e. Foreign Currency Contracts
When the Fund purchases or sells foreign securities it may enter into foreign exchange contracts to minimize foreign exchange risk from the trade date to the settlement date of the transactions. A foreign exchange contract is an agreement between two parties to exchange different currencies at an agreed upon exchange rate at a future date. Realized and unrealized gains and losses on these contracts are included in the Statement of Operations.
The Fund may also enter into forward exchange contracts to hedge against fluctuations in foreign exchange rates. These contracts are valued daily by the Fund and the unrealized gains or losses on the contracts, as measured by the difference between the contractual forward foreign exchange rates and the forward rates at the reporting date, are included in the Statement of Assets and Liabilities. Realized and unrealized gains and losses on these contracts are included in the Statement of Operations.
The risks of these contracts include movement in the values of the foreign currencies relative to the U.S. dollar and the possible inability of the counterparties to fulfill their obligations under the contracts, which may be in excess of the amount reflected in the Statement of Assets and Liabilities.
TGI-21
Franklin Templeton Variable Insurance Products Trust
Notes to Financial Statements (continued)
Templeton Global Income Securities Fund
1. ORGANIZATION AND SIGNIFICANT ACCOUNTING POLICIES (continued)
f. Income Taxes
No provision has been made for U.S. income taxes because it is the Fund’s policy to qualify as a regulated investment company under the Internal Revenue Code and to distribute to shareholders substantially all of its taxable income and net realized gains.
Foreign securities held by the Fund may be subject to foreign taxation on dividend and interest income received. Foreign taxes, if any, are recorded based on the tax regulations and rates that exist in the foreign markets in which the Fund invests.
g. Security Transactions, Investment Income, Expenses and Distributions
Security transactions are accounted for on trade date. Realized gains and losses on security transactions are determined on a specific identification basis. Interest income and estimated expenses are accrued daily. Amortization of premium and accretion of discount on debt securities are included in interest income. Distributions to shareholders are recorded on the ex-dividend date and are determined according to income tax regulations (tax basis). Distributable earnings determined on a tax basis may differ from earnings recorded in accordance with accounting principles generally accepted in the United States of America. These differences may be permanent or temporary. Permanent differences are reclassified among capital accounts to reflect their tax character. These reclassifications have no impact on net assets or the results of operations. Temporary differences are not reclassified, as they may reverse in subsequent periods.
Common expenses incurred by the Trust are allocated among the funds based on the ratio of net assets of each fund to the combined net assets of the Trust. Fund specific expenses are charged directly to the fund that incurred the expense.
Realized and unrealized gains and losses and net investment income, other than class specific expenses, are allocated daily to each class of shares based upon the relative proportion of net assets of each class. Differences in per share distributions, by class, are generally due to differences in class specific expenses.
Inflation-indexed bonds provide an inflation hedge through periodic increases in the security’s interest accruals and principal redemption value, by amounts corresponding to the current rate of inflation. Any such adjustments, including adjustments to principal redemption value, are recorded as interest income.
h. Accounting Estimates
The preparation of financial statements in accordance with accounting principles generally accepted in the United States of America requires management to make estimates and assumptions that affect the reported amounts of assets and liabilities at the date of the financial statements and the amounts of income and expenses during the reporting period. Actual results could differ from those estimates.
i. Redemption Fees
Redemptions and exchanges of Class 3 shares held 60 days or less may be subject to the fund’s redemption fee, which is 1% of the amount redeemed. Such fees are retained by the fund and accounted for as an addition to paid-in capital.
j. Guarantees and Indemnifications
Under the Trust’s organizational documents, its officers and trustees are indemnified by the Trust against certain liabilities arising out of the performance of their duties to the Trust. Additionally, in the normal course of business, the Trust, on behalf of the Fund, enters into contracts with service providers that contain general indemnification clauses. The Trust’s maximum exposure under these arrangements is unknown as this would involve future claims that may be made against the Trust that have not yet occurred. Currently, the Trust expects the risk of loss to be remote.
TGI-22
Franklin Templeton Variable Insurance Products Trust
Notes to Financial Statements (continued)
Templeton Global Income Securities Fund
2. SHARES OF BENEFICIAL INTEREST
At December 31, 2007, there were an unlimited number of shares authorized (without par value). Transactions in the Fund’s shares were as follows:
| | | | | | | | | | | | | | |
| | | Year Ended December 31, | |
| | | 2007 | | | 2006 | |
| Class 1 Shares: | | Shares | | | Amount | | | Shares | | | Amount | |
Shares sold | | 5,103,718 | | | $ | 85,032,506 | | | 2,027,528 | | | $ | 30,612,502 | |
Shares issued in reinvestment of distributions | | 153,227 | | | | 2,456,235 | | | 137,929 | | | | 2,013,759 | |
Shares redeemed | | (1,977,376 | ) | | | (31,929,569 | ) | | (1,040,680 | ) | | | (15,639,327 | ) |
| | | | |
Net increase (decrease) | | 3,279,569 | | | $ | 55,559,172 | | | 1,124,777 | | | $ | 16,986,934 | |
| | | | |
Class 2 Shares: | | | | | | | | | | | | | | |
Shares sold | | 16,336,797 | | | $ | 264,154,676 | | | 8,960,584 | | | $ | 133,647,009 | |
Shares issued in reinvestment of distributions | | 523,540 | | | | 8,266,690 | | | 226,190 | | | | 3,259,404 | |
Shares redeemed | | (1,388,223 | ) | | | (22,312,397 | ) | | (230,816 | ) | | | (3,418,676 | ) |
| | | | |
Net increase (decrease) | | 15,472,114 | | | $ | 250,108,969 | | | 8,955,958 | | | $ | 133,487,737 | |
| | | | |
Class 3 Shares: | | | | | | | | | | | | | | |
Shares sold | | 3,533,597 | | | $ | 56,987,401 | | | 2,255,932 | | | $ | 33,481,415 | |
Shares issued in reinvestment of distributions | | 103,199 | | | | 1,628,484 | | | 29,966 | | | | 431,514 | |
Shares redeemed | | (475,906 | ) | | | (7,693,094 | ) | | (396,229 | ) | | | (5,978,234 | ) |
| | | | |
Net increase (decrease) | | 3,160,890 | | | $ | 50,922,791 | | | 1,889,669 | | | $ | 27,934,695 | |
| | | | |
3. TRANSACTIONS WITH AFFILIATES
Franklin Resources, Inc. is the holding company for various subsidiaries that together are referred to as Franklin Templeton Investments. Certain officers and trustees of the Trust are also officers and/or directors of the following subsidiaries:
| | |
| Subsidiary | | Affiliation |
Franklin Advisers, Inc. (Advisers) | | Investment manager |
Franklin Templeton Services, LLC (FT Services) | | Administrative manager |
Franklin Templeton Distributors, Inc. (Distributors) | | Principal underwriter |
Franklin Templeton Investor Services, LLC (Investor Services) | | Transfer agent |
a. Management Fees
The Fund pays an investment management fee to Advisers based on the average daily net assets of the Fund as follows:
| | |
| Annualized Fee Rate | | Net Assets |
| 0.625% | | Up to and including $100 million |
| 0.500% | | Over $100 million, up to and including $250 million |
| 0.450% | | Over $250 million, up to and including $10 billion |
| 0.440% | | Over $10 billion, up to and including $12.5 billion |
| 0.420% | | Over $12.5 billion, up to and including $15 billion |
| 0.400% | | In excess of $15 billion |
TGI-23
Franklin Templeton Variable Insurance Products Trust
Notes to Financial Statements (continued)
Templeton Global Income Securities Fund
3. TRANSACTIONS WITH AFFILIATES (continued)
Effective January 1, 2008, the Fund will pay fees based on the average daily net assets of the Fund as follows:
| | |
| Annualized Fee Rate | | Net Assets |
| 0.625% | | Up to and including $100 million |
| 0.500% | | Over $100 million, up to and including $250 million |
| 0.450% | | Over $250 million, up to and including $7.5 billion |
| 0.440% | | Over $7.5 billion, up to and including $10 billion |
| 0.430% | | Over $10 billion, up to and including $12.5 billion |
| 0.420% | | Over $12.5 billion, up to and including $15 billion |
| 0.400% | | In excess of $15 billion |
b. Administrative Fees
Under an agreement with Advisers, FT Services provides administrative services to the Fund. The fee is paid by Advisers based on average daily net assets, and is not an additional expense of the Fund.
c. Distribution Fees
The Fund’s Board of Trustees has adopted distribution plans for Class 2 and Class 3 shares pursuant to Rule 12b-1 under the 1940 Act. Under the Fund’s compensation distribution plans, the Fund pays Distributors for costs incurred in connection with the servicing, sale and distribution of the Fund’s shares up to 0.25% and 0.35% per year of its average daily net assets of Class 2 and Class 3, respectively. The Board of Trustees has agreed to limit the current rate to 0.25% per year for Class 3.
d. Transfer Agent Fees
Investor Services, under terms of an agreement, performs shareholder servicing for the Fund and is not paid by the Fund for the services.
4. EXPENSE OFFSET ARRANGEMENT
The Fund has entered into an arrangement with its custodian whereby credits realized as a result of uninvested cash balances are used to reduce a portion of the Fund’s custodian expenses. During the year ended December 31, 2007, the custodian fees were reduced as noted in the Statement of Operations.
5. INCOME TAXES
The Fund has reviewed the tax positions taken on federal income tax returns, for each of the three open tax years and as of December 31, 2007 and has determined that no provision for income tax is required in the Fund’s financial statements.
For tax purposes, capital losses may be carried over to offset future capital gains, if any. At December 31, 2007, the capital loss carryforwards were as follows:
| | | |
| Capital loss carryforwards expiring in: | | |
2008 | | $ | 2,370,518 |
2009 | | | 1,649,033 |
2010 | | | 177,731 |
| | | |
| | $ | 4,197,282 |
| | | |
During the year ended December 31, 2007, the Fund utilized $969,560 of capital loss carryforwards.
On December 31, 2007, the Fund had expired capital loss carryforwards of $1,600,297, which were reclassified to paid-in capital.
TGI-24
Franklin Templeton Variable Insurance Products Trust
Notes to Financial Statements (continued)
Templeton Global Income Securities Fund
5. INCOME TAXES (continued)
The tax character of distributions paid during the years ended December 31, 2007 and 2006, was as follows:
| | | | | | |
| | | 2007 | | 2006 |
Distributions paid from ordinary income | | $ | 12,351,409 | | $ | 5,704,677 |
| | | | | | |
At December 31, 2007, the cost of investments, net unrealized appreciation (depreciation) and undistributed ordinary income for income tax purposes were as follows:
| | | | |
Cost of investments | | $ | 658,663,346 | |
| | | | |
| |
Unrealized appreciation | | $ | 24,152,942 | |
Unrealized depreciation | | | (6,479,336 | ) |
| | | | |
Net unrealized appreciation (depreciation) | | $ | 17,673,606 | |
| | | | |
Distributable earnings – undistributed ordinary income | | $ | 39,667,569 | |
| | | | |
Net investment income differs for financial statement and tax purposes primarily due to differing treatments of foreign currency transactions, bond discounts and premiums and inflation related adjustments on foreign securities.
Net realized gains (losses) differ for financial statement and tax purposes primarily due to differing treatments of wash sales, foreign currency transactions, bond discounts and premiums and inflation related adjustments on foreign securities.
6. INVESTMENT TRANSACTIONS
Purchases and sales of investments (excluding short term securities) for the year ended December 31, 2007, aggregated $401,340,329 and $163,318,439, respectively.
7. FORWARD EXCHANGE CONTRACTS
At December 31, 2007, the Fund had the following forward exchange contracts outstanding:
| | | | | | | | | | | | | | |
| | | Contract
Amounta | | | Settlement
Date | | Unrealized
Gain | | Unrealized
(Loss) | |
| Contracts to Buy | | | | | | | | | | | | |
| 33,600,000 | | Japanese Yen | | 292,601 | | | 1/22/08 | | | 9,461 | | | — | |
| 64,500,000 | | Iceland Krona | | 1,000,698 | | | 1/28/08 | | $ | 18,959 | | $ | — | |
| 45,000,000 | | Norwegian Krone | | 8,047,498 | | | 1/28/08 | | | 226,339 | | | — | |
| 34,696,800 | | Japanese Yen | | 220,102 | EUR | | 1/31/08 | | | — | | | (9,148 | ) |
| 57,427,500 | | Kazakhstan Tenge | | 465,000 | | | 2/06/08 | | | 7,320 | | | — | |
| 49,956,750 | | Kazakhstan Tenge | | 405,000 | | | 2/06/08 | | | 5,876 | | | — | |
| 28,395,800 | | Kazakhstan Tenge | | 230,000 | | | 2/07/08 | | | 3,510 | | | — | |
| 88,025,000 | | Indian Rupee | | 2,945,260 | NZD | | 2/29/08 | | | — | | | (14,535 | ) |
| 773,199,000 | | Kazakhstan Tenge | | 6,300,000 | | | 3/25/08 | | | 4,752 | | | — | |
| 101,142,000 | | Japanese Yen | | 869,956 | | | 5/27/08 | | | 50,956 | | | — | |
| 531,699,750 | | Japanese Yen | | 4,500,000 | | | 6/30/08 | | | 356,576 | | | — | |
| 426,288,750 | | Japanese Yen | | 3,640,631 | | | 7/07/08 | | | 255,310 | | | — | |
| 433,331,250 | | Japanese Yen | | 3,698,786 | | | 7/17/08 | | | 264,709 | | | — | |
| 175,000,000 | | Japanese Yen | | 1,502,339 | | | 7/18/08 | | | 98,440 | | | — | |
| 293,932,800 | | Kazakhstan Tenge | | 2,400,000 | | | 7/25/08 | | | — | | | (66,153 | ) |
| 125,841,100 | | Japanese Yen | | 1,100,000 | | | 8/07/08 | | | 52,966 | | | — | |
TGI-25
Franklin Templeton Variable Insurance Products Trust
Notes to Financial Statements (continued)
Templeton Global Income Securities Fund
7. FORWARD EXCHANGE CONTRACTS (continued)
| | | | | | | | | | | | | | |
| | | Contract
Amounta | | | Settlement
Date | | Unrealized
Gain | | Unrealized
(Loss) | |
| Contracts to Buy | | | | | | | | | | |
| 154,044,450 | | Japanese Yen | | 1,350,000 | | | 8/08/08 | | $ | 61,481 | | $ | — | |
| 154,325,250 | | Japanese Yen | | 1,350,000 | | | 8/11/08 | | | 64,397 | | | — | |
| 144,838,200 | | Japanese Yen | | 1,300,000 | | | 8/20/08 | | | 28,413 | | | — | |
| 145,327,000 | | Japanese Yen | | 1,300,000 | | | 8/20/08 | | | 32,896 | | | — | |
| 143,907,400 | | Japanese Yen | | 1,300,000 | | | 8/25/08 | | | 20,409 | | | — | |
| 27,917,500 | | Japanese Yen | | 251,283 | | | 9/04/08 | | | 5,079 | | | — | |
| 422,114,000 | | Japanese Yen | | 2,800,000 | EUR | | 9/12/08 | | | — | | | (202,974 | ) |
| 25,000,000 | | Indian Rupee | | 868,538 | NZD | | 9/24/08 | | | — | | | (15,860 | ) |
| 167,701,600 | | Japanese Yen | | 1,520,000 | | | 9/25/08 | | | 22,597 | | | — | |
| 167,587,600 | | Japanese Yen | | 1,520,000 | | | 9/25/08 | | | 21,548 | | | — | |
| 334,510,300 | | Japanese Yen | | 3,020,000 | | | 9/26/08 | | | 57,230 | | | — | |
| 167,957,300 | | Japanese Yen | | 1,510,000 | | | 9/26/08 | | | 35,074 | | | — | |
| 361,308,750 | | Kazakhstan Tenge | | 2,850,000 | | | 10/10/08 | | | — | | | (21,766 | ) |
| 724,140,625 | | Chilean Peso | | 1,437,500 | | | 10/20/08 | | | 5,634 | | | — | |
| 724,284,375 | | Chilean Peso | | 1,437,500 | | | 10/20/08 | | | 5,921 | | | — | |
| 6,050,000 | | Swiss Franc | | 5,221,729 | | | 10/20/08 | | | 179,349 | | | — | |
| 646,280,000 | | Chilean Peso | | 1,280,000 | | | 10/22/08 | | | 7,895 | | | — | |
| 882,350,000 | | Chilean Peso | | 1,750,000 | | | 10/23/08 | | | 8,282 | | | — | |
| 6,729,255 | | Swiss Franc | | 5,850,000 | | | 10/23/08 | | | 157,794 | | | — | |
| 1,703,596 | | Swiss Franc | | 1,475,000 | | | 10/24/08 | | | 45,975 | | | — | |
| 1,699,532 | | Swiss Franc | | 1,475,000 | | | 10/27/08 | | | 42,428 | | | — | |
| 192,000,000 | | Kazakhstan Tenge | | 1,500,000 | | | 11/03/08 | | | — | | | (4,611 | ) |
| 3,423,150 | | Swiss Franc | | 3,000,000 | | | 11/03/08 | | | 56,737 | | | — | |
| 1,342,374,000 | | Japanese Yen | | 12,100,000 | | | 11/04/08 | | | 284,720 | | | — | |
| 5,200,000 | | Swiss Franc | | 4,705,137 | | | 11/06/08 | | | — | | | (61,498 | ) |
| 144,407,250 | | Japanese Yen | | 1,362,076 | | | 11/14/08 | | | — | | | (28,782 | ) |
| 2,670,000 | | Euro | | 9,865,650 | RON | | 12/03/08 | | | — | | | (47,260 | ) |
| 2,225,000 | | Euro | | 8,068,963 | RON | | 12/04/08 | | | 21,531 | | | — | |
| 345,000,000 | | Japanese Yen | | 3,124,123 | | | 12/04/08 | | | 65,984 | | | — | |
| 38,027,500 | | Japanese Yen | | 355,790 | | | 12/05/08 | | | — | | | (4,135 | ) |
| 186,512,000 | | Japanese Yen | | 1,745,027 | | | 12/05/08 | | | — | | | (20,281 | ) |
| 673,264,800 | | Kazakhstan Tenge | | 5,200,000 | | | 12/12/08 | | | 1,319 | | | — | |
| 280,943,000 | | Japanese Yen | | 2,600,000 | | | 12/15/08 | | | — | | | (69 | ) |
| 281,190,000 | | Japanese Yen | | 2,600,000 | | | 12/17/08 | | | 2,606 | | | — | |
| 142,890,000 | | Kazakhstan Tenge | | 1,100,000 | | | 12/22/08 | | | 1,616 | | | — | |
| | | | |
| Contracts to Sell | | | | | | | | | | |
| 35,571,270 | | Mexican Peso | | 143,000,063 | INR | | 1/22/08 | | | 370,549 | | | — | |
| 30,321,722 | | Mexican Peso | | 121,514,299 | INR | | 1/25/08 | | | 306,174 | | | — | |
| 19,609,025 | | Mexican Peso | | 78,255,696 | INR | | 2/27/08 | | | 191,227 | | | — | |
| 39,305,785 | | Mexican Peso | | 155,595,882 | INR | | 2/28/08 | | | 351,393 | | | — | |
| 10,166,171 | | Mexican Peso | | 40,344,448 | INR | | 3/03/08 | | | 93,598 | | | — | |
| 10,703,553 | | Mexican Peso | | 2,035,283 | BRL | | 4/22/08 | | | 153,032 | | | — | |
| 22,656,216 | | Mexican Peso | | 4,426,571,459 | COP | | 4/22/08 | | | 100,071 | | | — | |
| 2,329,569 | | New Zealand Dollar | | 74,243,350 | INR | | 4/28/08 | | | 114,116 | | | — | |
| 12,477,832 | | Mexican Peso | | 2,353,693,412 | COP | | 5/06/08 | | | 13,222 | | | — | |
| 12,494,827 | | Mexican Peso | | 2,368,373 | BRL | | 5/07/08 | | | 173,027 | | | — | |
| 9,640,135 | | Mexican Peso | | 447,379,362 | CLP | | 5/16/08 | | | 22,095 | | | — | |
| 6,597,015 | | Mexican Peso | | 302,613,010 | CLP | | 5/20/08 | | | 8,202 | | | — | |
TGI-26
Franklin Templeton Variable Insurance Products Trust
Notes to Financial Statements (continued)
Templeton Global Income Securities Fund
7. FORWARD EXCHANGE CONTRACTS (continued)
| | | | | | | | | | | | | | |
| | | Contract
Amounta | | | Settlement
Date | | Unrealized
Gain | | Unrealized
(Loss) | |
| Contracts to Sell | | | | | | | | | | |
| 7,962,312 | | Mexican Peso | | 365,240,813 | CLP | | 5/20/08 | | $ | 9,900 | | $ | — | |
| 30,000,000 | | Mexican Peso | | 113,235,000 | INR | | 5/21/08 | | | 139,020 | | | — | |
| 46,737,959 | | Mexican Peso | | 507,359,240 | KZT | | 5/27/08 | | | — | | | (152,042 | ) |
| 40,184,041 | | Mexican Peso | | 435,289,606 | KZT | | 5/29/08 | | | — | | | (139,067 | ) |
| 5,422,023 | | Mexican Peso | | 248,735,300 | CLP | | 6/12/08 | | | 7,585 | | | — | |
| 11,184,356 | | Mexican Peso | | 123,232,028 | KZT | | 6/25/08 | | | — | | | (25,521 | ) |
| 6,853,159 | | Mexican Peso | | 75,609,535 | KZT | | 6/25/08 | | | — | | | (14,842 | ) |
| 10,925,894 | | Mexican Peso | | 120,542,108 | KZT | | 6/25/08 | | | — | | | (23,671 | ) |
| 31,357,983 | | Mexican Peso | | 5,629,698,616 | COP | | 6/27/08 | | | — | | | (112,277 | ) |
| 23,073,608 | | Mexican Peso | | 6,530,985 | PEN | | 6/30/08 | | | 111,579 | | | — | |
| 2,017,928 | | Mexican Peso | | 91,755,188 | CLP | | 9/15/08 | | | 2,580 | | | — | |
| 22,711,151 | | Mexican Peso | | 1,037,699,748 | CLP | | 10/01/08 | | | 41,848 | | | — | |
| 23,225,918 | | Mexican Peso | | 1,057,613,091 | CLP | | 10/02/08 | | | 35,800 | | | — | |
| 2,888,971,900 | | South Korean Won | | 3,505,821 | CHF | | 11/13/08 | | | 17,945 | | | — | |
| 14,750,000 | | Romanian Lei | | 32,712,353 | NOK | | 11/17/08 | | | 53,822 | | | — | |
| 2,722,612,000 | | South Korean Won | | 3,359,632 | CHF | | 11/17/08 | | | 66,822 | | | — | |
| 5,797,680,000 | | South Korean Won | | 6,831,892 | CHF | | 11/25/08 | | | — | | | (144,886 | ) |
| 6,526,957,500 | | South Korean Won | | 7,700,789 | CHF | | 11/25/08 | | | — | | | (154,599 | ) |
| 2,307,240,000 | | South Korean Won | | 2,746,093 | CHF | | 11/26/08 | | | — | | | (33,255 | ) |
| 4,575,729,600 | | South Korean Won | | 5,432,165 | CHF | | 11/28/08 | | | — | | | (78,234 | ) |
| 1,819,958,400 | | South Korean Won | | 2,184,404 | CHF | | 11/28/08 | | | — | | | (9,849 | ) |
| 2,435,035,200 | | South Korean Won | | 2,944,527 | CHF | | 12/02/08 | | | 6,514 | | | — | |
| 7,728,240,000 | | South Korean Won | | 9,251,942 | CHF | | 12/03/08 | | | — | | | (62,570 | ) |
| 357,000 | | Euro | | 56,026,866 | JPY | | 12/08/08 | | | — | | | (1,305 | ) |
| 3,734,309,600 | | South Korean Won | | 4,513,743 | CHF | | 12/09/08 | | | 8,683 | | | — | |
| 2,671,578,000 | | South Korean Won | | 4,119,944 | SGD | | 12/10/08 | | | 27,503 | | | — | |
| 12,319,825 | | Romanian Lei | | 31,800,179 | SEK | | 12/15/08 | | | — | | | (5,008 | ) |
| 2,136,044,750 | | South Korean Won | | 2,610,663 | CHF | | 12/15/08 | | | 30,880 | | | — | |
| | | | | | | | | | | | | | |
| Unrealized gain (loss) on forward exchange contracts | | | | | | | | 5,049,276 | | | (1,454,198 | ) |
| | | | | | | | | | | | | | |
| Net unrealized gain (loss) on forward exchange contracts | | | | | | | $ | 3,595,078 | | | | |
| | | | | | | | | | | | | | |
aIn | U.S. dollars unless otherwise indicated. |
Currency Abbreviations
BRL - Brazilian Real
CHF - Swiss Franc
CLP - Chiliean Peso
COP - Colombian Peso
EUR - Euro
INR - Indian Rupee
JPY - Japanese Yen
KZT - Kazakhstan Tenge
MXN - Mexican Peso
NOK - Norwegian Krone
NZD - New Zealand Dollar
PEN - Peruvian Nuevo Sol
RON - Romanian Lei
SEK - Swedish Krona
SGD - Singapore Dollar
TGI-27
Franklin Templeton Variable Insurance Products Trust
Notes to Financial Statements (continued)
Templeton Global Income Securities Fund
8. CREDIT RISK
The Fund has 13.98% of its portfolio invested in below investment grade and comparable quality unrated high yield securities, which tend to be more sensitive to economic conditions than higher rated securities. The risk of loss due to default by the issuer may be significantly greater for the holders of high yielding securities because such securities are generally unsecured and are often subordinated to other creditors of the issuer.
9. CONCENTRATION OF RISK
Investing in foreign securities may include certain risks and considerations not typically associated with investing in U.S. securities, such as fluctuating currency values and changing local and regional economic, political and social conditions, which may result in greater market volatility. In addition, certain foreign securities may not be as liquid as U.S. securities.
10. REGULATORY AND LITIGATION MATTERS
As part of various investigations by a number of federal, state, and foreign regulators and governmental entities, including the Securities and Exchange Commission (“SEC”), relating to certain practices in the mutual fund industry, including late trading, market timing and marketing support payments to securities dealers who sell fund shares (“marketing support”), Franklin Resources, Inc. and certain of its subsidiaries (collectively, the “Company”), entered into settlements with certain of those regulators and governmental entities. Specifically, the Company entered into settlements with the SEC, among others, concerning market timing and marketing support.
On June 6, 2007, the SEC posted for public comment the proposed plan of distribution for the market timing settlement. Once the SEC approves the final plan of distribution, disbursements of settlement monies will be made promptly to individuals who were shareholders of the designated funds during the relevant period, in accordance with the terms and conditions of the settlement and plan.
In addition, the Company, as well as most of the mutual funds within Franklin Templeton Investments and certain current or former officers, Company directors, fund directors, and employees, have been named in private lawsuits (styled as shareholder class actions, or as derivative actions on behalf of either the named funds or Franklin Resources, Inc.). The lawsuits relate to the industry practices referenced above.
The Company and fund management believe that the claims made in each of the private lawsuits referenced above are without merit and intend to defend against them vigorously. The Company cannot predict with certainty the eventual outcome of these lawsuits, nor whether they will have a material negative impact on the Company. If it is determined that the Company bears responsibility for any unlawful or inappropriate conduct that caused losses to the Fund, it is committed to making the Trust or its shareholders whole, as appropriate.
11. NEW ACCOUNTING PRONOUNCEMENT
In September 2006, the Financial Accounting Standards Board (FASB) issued FASB Statement No. 157, “Fair Value Measurement” (SFAS 157), which defines fair value, establishes a framework for measuring fair value, and expands disclosures about fair value measurements. SFAS 157 is effective for fiscal years beginning after November 15, 2007, and interim periods within those fiscal years. The Trust believes the adoption of SFAS 157 will have no material impact on its financial statements.
TGI-28
Franklin Templeton Variable Insurance Products Trust
Templeton Global Income Securities Fund
Report of Independent Registered Public Accounting Firm
To the Board of Trustees and Shareholders of
Franklin Templeton Variable Insurance Products Trust
In our opinion, the accompanying statement of assets and liabilities, including the statement of investments, and the related statements of operations and of changes in net assets and the financial highlights present fairly, in all material respects, the financial position of Templeton Global Income Securities Fund (one of the funds constituting Franklin Templeton Variable Insurance Products Trust, hereafter referred to as the “Fund”) at December 31, 2007, the results of its operations for the year then ended, the changes in its net assets for each of the two years in the period then ended and the financial highlights for each of the periods presented, in conformity with accounting principles generally accepted in the United States of America. These financial statements and financial highlights (hereafter referred to as “financial statements”) are the responsibility of the Fund’s management. Our responsibility is to express an opinion on these financial statements based on our audits. We conducted our audits of these financial statements in accordance with the standards of the Public Company Accounting Oversight Board (United States). Those standards require that we plan and perform the audit to obtain reasonable assurance about whether the financial statements are free of material misstatement. An audit includes examining, on a test basis, evidence supporting the amounts and disclosures in the financial statements, assessing the accounting principles used and significant estimates made by management, and evaluating the overall financial statement presentation. We believe that our audits, which included confirmation of securities at December 31, 2007 by correspondence with the custodian and brokers, provide a reasonable basis for our opinion.
PricewaterhouseCoopers LLP
San Francisco, California
February 14, 2008
TGI-29
Franklin Templeton Variable Insurance Products Trust
Tax Designation (unaudited)
Templeton Global Income Securities Fund
At December 31, 2007, more than 50% of the Fund’s total assets were invested in securities of foreign issuers. In most instances, foreign taxes were withheld from income paid to the Fund on these investments. The Fund elects to treat foreign taxes paid as allowed under Section 853 of the Internal Revenue Code. This election will allow shareholders of record as of the 2008 distribution date, to treat their proportionate share of foreign taxes paid by the Fund as having been paid directly by them. The shareholder shall consider these amounts as foreign taxes paid in the tax year in which they receive the Fund distribution.
TGI-30
INDEX DESCRIPTIONS
The indexes are unmanaged and include reinvested distributions.
Bloomberg World Communications Index is a market capitalization-weighted index designed to measure equity performance of the communications sector of the Bloomberg World Index.
Consumer Price Index (CPI), calculated by the U.S. Bureau of Labor Statistics, is a commonly used measure of the inflation rate.
CS High Yield Index is designed to mirror the investible universe of the U.S. dollar-denominated high yield debt market.
Dow Jones Industrial Average (the Dow) is price weighted based on the average market price of 30 blue chip stocks of companies that are generally industry leaders.
Dow Jones Wilshire Real Estate Securities Index is a broad measure of the performance of publicly traded real estate securities, such as real estate investment trusts and real estate operating companies. The index is float adjusted, capitalization weighted and rebalanced monthly, and returns are calculated on a buy-and-hold basis.
J.P. Morgan (JPM) Emerging Markets Bond Index (EMBI) Global tracks total returns for U.S. dollar-denominated debt instruments issued by emerging market sovereign and quasi-sovereign entities: Brady bonds, loans and Eurobonds. Regional market returns are from subindexes of the JPM EMBI Global.
J.P. Morgan (JPM) Euro Emerging Markets Bond Index (EMBI) Global tracks total returns for euro-denominated, straight fixed coupon instruments issued by emerging market sovereign and quasi-sovereign entities.
J.P. Morgan (JPM) Government Bond Index (GBI)-Emerging Markets (EM) tracks total returns for liquid, fixed-rate, local currency emerging market government bonds. Local bond market returns are from country subindexes of the JPM GBI-EM.
J.P. Morgan (JPM) Government Bond Index (GBI) Global tracks total returns for liquid, fixed-rate, domestic government bonds with maturities greater than one year issued by developed countries globally.
Lehman Brothers (LB) U.S. Aggregate Index represents securities that are SEC-registered, taxable and dollar denominated. The index covers the U.S. investment grade fixed-rate bond market, with index components for government and corporate securities, mortgage pass-through securities and asset-backed securities. All issues included must have at least one year to final maturity and must be rated investment grade (Baa3 or better) by Moody’s Investors Service. They must also be dollar denominated and nonconvertible. Total return includes price appreciation/depreciation and income as a percentage of the original investment. The index is rebalanced monthly by market capitalization.
Lehman Brothers (LB) U.S. Government: Intermediate Index is the intermediate component of the LB U.S. Government Index. The index includes securities issued by the U.S. government or agency. These include obligations of the U.S. Treasury with remaining maturity of one year or more and publicly issued debt of U.S. governmental agencies, quasi-federal corporations, and corporate or foreign debt guaranteed by the U.S. government.
Lipper High Current Yield Funds Classification Average is an equally weighted average calculation of performance figures for all funds within the Lipper High Current Yield Funds classification in the Lipper Open-End underlying funds universe. Lipper High Current Yield Funds aim at high (relative) current yield from fixed income securities, have no quality or maturity restrictions, and tend to invest in lower grade debt issues. For the 12-month period ended 12/31/07, there were 455 funds in this category. Lipper calculations do not include contract fees, expenses or sales charges, and may have been different if such charges had been considered.
Lipper Multi-Sector Income Funds Classification Average is an equally weighted average calculation of performance figures for all funds within the Lipper Multi-Sector Income Funds classification in the Lipper Open-End underlying funds universe. Lipper Multi-Sector Income Funds are defined as funds that seek current income by allocating assets among different fixed income securities sectors (not primarily in one sector except for defensive purposes), including U.S. and foreign governments, with a significant portion rated below investment grade. For the 12-month period ended 12/31/07, there were 124 funds in this category. Lipper calculations do not include contract fees, expenses or sales charges, and may have been different if such charges had been considered.
Lipper VIP Equity Income Funds Classification Average is an equally weighted average calculation of performance figures for all funds within the Lipper Equity Income Funds classification in the Lipper VIP underlying funds universe. Lipper Equity Income Funds seek relatively high current income and growth of income through investing 65% or more of their portfolios in equities. For the 12-month period ended 12/31/07, there were 58 funds in this category. Lipper calculations do not include contract fees, expenses or sales charges, and may have been different if such charges had been considered.
I-1
Lipper VIP General U.S. Government Funds Classification Average is an equally weighted average calculation of performance figures for all funds within the Lipper U.S. Government Funds classification in the Lipper VIP underlying funds universe. Lipper U.S. Government Funds invest primarily in U.S. government and agency issues. For the 12-month period ended 12/31/07, there were 69 funds in this category. Lipper calculations do not include contract fees, expenses or sales charges, and may have been different if such charges had been considered.
Lipper VIP High Current Yield Funds Classification Average is an equally weighted average calculation of performance figures for all funds within the Lipper High Current Yield Funds in the Lipper VIP underlying funds universe. Lipper High Current Yield Funds aim at high (relative) current yield from fixed income securities, have no quality or maturity restrictions, and tend to invest in lower grade debt issues. For the 12-month period ended 12/31/07, there were 108 funds in this category. Lipper calculations do not include contract fees, expenses or sales charges, and may have been different if such charges had been considered.
Merrill Lynch 2- and 5-Year Zero Coupon Bond Indexes include zero coupon bonds that pay no interest and are issued at a discount from redemption price.
Morgan Stanley Capital International (MSCI) All Country (AC) World Index is a free float-adjusted, market capitalization-weighted index designed to measure equity market performance in global developed and emerging markets.
Morgan Stanley Capital International (MSCI) Emerging Markets (EM) Index is a free float-adjusted, market capitalization-weighted index designed to measure equity market performance in global emerging markets.
Morgan Stanley Capital International (MSCI) Europe, Australasia, Far East (EAFE) Index is a free float-adjusted, market capitalization-weighted index designed to measure equity market performance in global developed markets excluding the U.S. and Canada.
Morgan Stanley Capital International (MSCI) World Index is a free float-adjusted, market capitalization-weighted index designed to measure equity market performance in global developed markets.
NASDAQ Composite Index measures all NASDAQ domestic and international based common type stocks listed on The NASDAQ Stock Market. The index is market value weighted and includes more than 3,000 companies.
Russell 1000® Growth Index is market capitalization weighted and measures performance of those Russell 1000 Index companies with higher price-to-book ratios and higher forecasted growth values.
Russell 1000 Index is market capitalization weighted and measures performance of the 1,000 largest companies in the Russell 3000 Index, which represent approximately 92% of total market capitalization of the Russell 3000 Index.
Russell 1000 Value Index is market capitalization weighted and measures performance of those Russell 1000 Index companies with lower price-to-book ratios and lower forecasted growth values.
Russell 2500™ Index is market capitalization weighted and measures performance of the 2,500 smallest companies in the Russell 3000 Index, which represent approximately 17% of total market capitalization of the Russell 3000 Index.
Russell 2500 Value Index is market capitalization weighted and measures performance of those Russell 2500 Index companies with lower price-to-book ratios and lower forecasted growth values.
Russell 3000® Growth Index is market capitalization weighted and measures performance of those Russell 3000 Index companies with higher price-to-book ratios and higher forecasted growth values.
Russell 3000 Index is market capitalization weighted and measures performance of the 3,000 largest U.S. companies based on total market capitalization, which represent approximately 98% of the investible U.S. equity market.
Russell Midcap® Growth Index is market capitalization weighted and measures performance of those Russell Midcap Index companies with higher price-to-book ratios and higher forecasted growth values.
Russell Midcap Index is market capitalization weighted and measures performance of the 800 smallest companies in the Russell 1000 Index, which represent approximately 26% of total market capitalization of the Russell 1000 Index.
Standard & Poor’s 500 Index (S&P 500) consists of 500 stocks chosen for market size, liquidity and industry group representation. Each stock’s weight in the index is proportionate to its market value. The S&P 500 is one of the most widely used benchmarks of U.S. equity performance.
I-2
Standard & Poor’s/Citigroup BMI Global REIT Index is designed to measure performance of the investible universe of publicly traded real estate investment trusts. Index constituents generally derive more than 60% of revenue from real estate development, management, rental, and/or direct investment in physical property and with local REIT or property trust tax status.
Standard & Poor’s/International Finance Corporation Investable (S&P/IFCI) Composite Index is a free float-adjusted, market capitalization-weighted index designed to measure equity performance in global emerging markets.
I-3
Board Members and Officers
The name, year of birth and address of the officers and board members, as well as their affiliations, positions held with the Trust, principal occupation during the past five years and number of portfolios overseen in the Franklin Templeton Investments fund complex are shown below. Generally, each board member serves until that person’s successor is elected and qualified.
Independent Board Members
| | | | | | | | |
| Name, Year of Birth and Address | | Position | | Length of
Time Served | | Number of
Portfolios in Fund
Complex Overseen
by Board Member* | | Other Directorships Held |
HARRIS J. ASHTON (1932) One Franklin Parkway San Mateo, CA 94403-1906 | | Trustee | | Since 1988 | | 141 | | Bar-S Foods (meat packing company). |
|
Principal Occupation During Past 5 Years: Director of various companies; and formerly, Director, RBC Holdings, Inc. (bank holding company) (until 2002); and President, Chief Executive Officer and Chairman of the Board, General Host Corporation (nursery and craft centers) (until 1998). |
ROBERT F. CARLSON (1928) One Franklin Parkway San Mateo, CA 94403-1906 | | Trustee | | Since 1998 | | 121 | | None |
|
Principal Occupation During Past 5 Years: Vice President, senior member and past President, Board of Administration, California Public Employees Retirement Systems (CALPERS); and formerly, member and Chairman of the Board, Sutter Community Hospitals; member, Corporate Board, Blue Shield of California; and Chief Counsel, California Department of Transportation. |
SAM GINN (1937) One Franklin Parkway San Mateo, CA 94403-1906 | | Trustee | | Since March 2007 | | 121 | | Chevron Corporation (global energy company) and ICO Global Communications (Holdings) Limited (satellite company). |
|
Principal Occupation During Past 5 Years: Private investor; and formerly, Chairman of the Board, Vodafone AirTouch, PLC (wireless company); Chairman of the Board and Chief Executive Officer, AirTouch Communications (cellular communications) (1993-1998) and Pacific Telesis Groups (telephone holding company) (1988-1994). |
EDITH E. HOLIDAY (1952) One Franklin Parkway San Mateo, CA 94403-1906 | | Trustee | | Since 2005 | | 141 | | Hess Corporation (exploration and refining of oil and gas), H.J. Heinz Company (processed foods and allied products), RTI International Metals, Inc. (manufacture and distribution of titanium), Canadian National Railway (railroad) and White Mountains Insurance Group, Ltd. (holding company). |
|
Principal Occupation During Past 5 Years: Director or Trustee of various companies and trusts; and formerly, Assistant to the President of the United States and Secretary of the Cabinet (1990-1993); General Counsel to the United States Treasury Department (1989-1990); and Counselor to the Secretary and Assistant Secretary for Public Affairs and Public Liaison-United States Treasury Department (1988-1989). |
FRANK W.T. LAHAYE (1929) One Franklin Parkway San Mateo, CA 94403-1906 | | Trustee | | Since 1988 | | 121 | | Center for Creative Land Recycling (brownfield redevelopment). |
|
Principal Occupation During Past 5 Years: General Partner, Las Olas L.P. (Asset Management); and formerly, Chairman, Peregrine Venture Management Company (venture capital). |
BOD-1
| | | | | | | | |
| Name, Year of Birth and Address | | Position | | Length of
Time Served | | Number of
Portfolios in Fund
Complex Overseen
by Board Member* | | Other Directorships Held |
FRANK A. OLSON (1932) One Franklin Parkway San Mateo, CA 94403-1906 | | Trustee | | Since 2005 | | 141 | | Hess Corporation (exploration and refining of oil and gas) and Sentient Jet (private jet service). |
|
Principal Occupation During Past 5 Years: Chairman Emeritus, The Hertz Corporation (car rental) (since 2000) (Chairman of the Board (1980-2000) and Chief Executive Officer (1977-1999)); and formerly, Chairman of the Board, President and Chief Executive Officer, UAL Corporation (airlines). |
LARRY D. THOMPSON (1945) One Franklin Parkway San Mateo, CA 94403-1906 | | Trustee | | Since March 2007 | | 141 | | None |
Principal Occupation During Past 5 Years: Senior Vice President—Government Affairs, General Counsel and Secretary, PepsiCo, Inc. (consumer products); and formerly, Director, Delta Airlines (aviation) (2003-2005) and Providian Financial Corp. (credit card provider) (1997-2001); Senior Fellow of The Brookings Institution (2003-2004); Visiting Professor, University of Georgia School of Law (2004); and Deputy Attorney General, U.S. Department of Justice (2001-2003). |
JOHN B. WILSON (1959) One Franklin Parkway San Mateo, CA 94403-1906 | | Lead Independent Trustee | | Trustee since March 2007 and Lead Independent Trustee since January 2008 | | 121 | | None |
Principal Occupation During Past 5 Years: President and Founder, Hyannis Port Capital, Inc. (real estate and private equity investing); serves on private and non-profit boards; and formerly, Chief Operating Officer and Executive Vice President, Gap, Inc. (retail) (1996-2000); Chief Financial Officer and Executive Vice President—Finance and Strategy, Staples, Inc. (office supplies) (1992-1996); Executive vice President—Corporate Planning, Northwest Airlines, Inc. (airlines) (1990-1992); and Vice President and Partner, Bain & Company (consulting firm) (1986-1990). |
Interested Board Members and Officers
| | | | | | | | |
| Name, Year of Birth and Address | | Position | | Length of
Time Served | | Number of
Portfolios in Fund
Complex Overseen
by Board Member* | | Other Directorships Held |
**CHARLES B. JOHNSON (1933) One Franklin Parkway San Mateo, CA 94403-1906 | | Trustee and Chairman of the Board | | Since 1988 | | 142 | | None |
Principal Occupation During Past 5 Years: Chairman of the Board, Member—Office of the Chairman and Director, Franklin Resources, Inc.; Director, Templeton Worldwide, Inc.; and officer and/or director or trustee, as the case may be, of some of the other subsidiaries of Franklin Resources, Inc. and of 42 of the investment companies in Franklin Templeton Investments. |
**RUPERT H. JOHNSON, JR. (1940) One Franklin Parkway San Mateo, CA 94403-1906 | | Trustee, President and Chief Executive Officer—Investment Management | | Trustee since 1988 and President and Chief Executive Officer—Investment Management since 2002 | | 126 | | None |
Principal Occupation During Past 5 Years: Vice Chairman, Member—Office of the Chairman and Director, Franklin Resources, Inc.; Director, Franklin Advisers, Inc. and Templeton Worldwide, Inc.; Senior Vice President, Franklin Advisory Services, LLC; and officer and/or director or trustee, as the case may be, of some of the other subsidiaries of Franklin Resources, Inc. and of 44 of the investment companies in Franklin Templeton Investments. |
BOD-2
| | | | | | | | |
| Name, Year of Birth and Address | | Position | | Length of
Time Served | | Number of
Portfolios in Fund
Complex Overseen
by Board Member* | | Other Directorships Held |
JAMES M. DAVIS (1952) One Franklin Parkway San Mateo, CA 94403-1906 | | Chief Compliance Officer and Vice President—AML Compliance | | Chief Compliance Officer since 2004 and Vice President—AML Compliance since 2006 | | Not
Applicable | | Not Applicable |
Principal Occupation During Past 5 Years: Director, Global Compliance, Franklin Resources, Inc.; officer of some of the other subsidiaries of Franklin Resources, Inc. and of 46 of the investment companies in Franklin Templeton Investments; and formerly, Director of Compliance, Franklin Resources, Inc. (1994-2001). |
LAURA FERGERSON (1962) One Franklin Parkway San Mateo, CA 94403-1906 | | Treasurer | | Since 2004 | | Not
Applicable | | Not Applicable |
|
Principal Occupation During Past 5 Years: Vice President, Franklin Templeton Services, LLC; officer of 28 of the investment companies in Franklin Templeton Investments; and formerly, Director and member of Audit and Valuation Committees, Runkel Funds, Inc. (2003-2004); Assistant Treasurer of most of the investment companies in Franklin Templeton Investments (1997-2003); and Vice President, Franklin Templeton Services, LLC (1997-2003). |
JIMMY D. GAMBILL (1947) 500 East Broward Blvd. Suite 2100 Fort Lauderdale, FL 33394-3091 | | Senior Vice President and Chief Executive Officer—Finance and Administration | | Since 2002 | | Not
Applicable | | Not Applicable |
|
Principal Occupation During Past 5 Years: President, Franklin Templeton Services, LLC; Senior Vice President, Templeton Worldwide, Inc.; and officer of some of the other subsidiaries of Franklin Resources, Inc. and of 46 of the investment companies in Franklin Templeton Investments. |
DAVID P. GOSS (1947) One Franklin Parkway San Mateo, CA 94403-1906 | | Vice President | | Since 2000 | | Not
Applicable | | Not Applicable |
|
Principal Occupation During Past 5 Years: Senior Associate General Counsel, Franklin Templeton Investments; officer and director of one of the subsidiaries of Franklin Resources, Inc.; and officer of 46 of the investment companies in Franklin Templeton Investments. |
KAREN L. SKIDMORE (1952) One Franklin Parkway San Mateo, CA 94403-1906 | | Vice President
and Secretary | | Since 2006 | | Not
Applicable | | Not Applicable |
|
Principal Occupation During Past 5 Years: Senior Associate General Counsel, Franklin Templeton Investments; and officer of 30 of the investment companies in Franklin Templeton Investments. |
BOD-3
| | | | | | | | |
| Name, Year of Birth and Address | | Position | | Length of
Time Served | | Number of
Portfolios in Fund
Complex Overseen
by Board Member* | | Other Directorships Held |
CRAIG S. TYLE (1960) One Franklin Parkway San Mateo, CA 94403-1906 | | Vice President | | Since 2005 | | Not
Applicable | | Not Applicable |
|
Principal Occupation During Past 5 Years: General Counsel and Executive Vice President, Franklin Resources, Inc.; officer of some of the other subsidiaries of Franklin Resources, Inc. and of 46 of the investment companies in Franklin Templeton Investments; and formerly, Partner, Shearman & Sterling, LLP (2004-2005); and General Counsel, Investment Company Institute (ICI) (1997-2004). |
GALEN G. VETTER (1951) 500 East Broward Blvd. Suite 2100 Fort Lauderdale, FL 33394-3091 | | Chief Financial Officer and Chief Accounting Officer | | Since 2004 | | Not
Applicable | | Not Applicable |
|
Principal Occupation During Past 5 Years: Senior Vice President, Franklin Templeton Services, LLC; officer of some of the other subsidiaries of Franklin Resources, Inc. and of 46 of the investment companies in Franklin Templeton Investments; and formerly, Managing Director, RSM McGladrey, Inc. (1999-2004); and Partner, McGladrey & Pullen, LLP (1979-1987 and 1991-2004). |
| *We | base the number of portfolios on each separate series of the U.S. registered investment companies within the Franklin Templeton Investments fund complex. These portfolios have a common investment manager or affiliated investment managers. |
| **Charles | B. Johnson and Rupert H. Johnson, Jr. are considered to be interested persons of the Fund under the federal securities laws due to their positions as officers and directors and major shareholders of Franklin Resources, Inc., which is the parent company of the Trust’s manager and distributor. |
Note 1: Charles B. Johnson and Rupert H. Johnson, Jr. are brothers.
Note 2: Officer information is current as of the date of this report. It is possible that after this date, information about officers may change.
The Sarbanes-Oxley Act of 2002 and Rules adopted by the Securities and Exchange Commission require the Fund to disclose whether the Fund’s Audit Committee includes at least one member who is an audit committee financial expert within the meaning of such Act and Rules. The Fund’s Board has determined that there is at least one such financial expert on the Audit Committee and has designated John B. Wilson as its audit committee financial expert. The Board believes that Mr. Wilson qualifies as such an expert in view of his extensive business background and experience, including service as chief financial officer of Staples, Inc. from 1992 to 1996. Mr. Wilson has been a Member and Chairman of the Fund’s Audit Committee since 2006. As a result of such background and experience, the Board believes that Mr. Wilson has acquired an understanding of generally accepted accounting principles and financial statements, the general application of such principles in connection with the accounting estimates, accruals and reserves, and analyzing and evaluating financial statements that present a breadth and level of complexity of accounting issues generally comparable to those of the Fund, as well as an understanding of internal controls and procedures for financial reporting and an understanding of audit committee functions. Mr. Wilson is an independent Board member as that term is defined under the relevant Securities and Exchange Commission Rules and Releases.
The Statement of Additional Information (SAI) includes additional information about the board members and is available, without charge, upon request. Shareholders may call 1-800/321-8563 or their insurance companies to request the SAI.
BOD-4
Franklin Templeton Variable Insurance Products Trust
Shareholder Information
Proxy Voting Policies and Procedures
The Trust has established Proxy Voting Policies and Procedures (Policies) that the Trust uses to determine how to vote proxies relating to portfolio securities. Shareholders may view the Trust’s complete Policies online at franklintempleton.com. Alternatively, shareholders may request copies of the Policies free of charge by calling the Proxy Group collect at 1-954/527-7678 or by sending a written request to: Franklin Templeton Companies, LLC, 500 East Broward Boulevard, Suite 1500, Fort Lauderdale, FL 33394, Attention: Proxy Group. Copies of the Trust’s proxy voting records are also made available online at franklintempleton.com and posted on the U.S. Securities and Exchange Commission’s website at sec.gov and reflect the most recent 12-month period ended June 30.
Quarterly Statement of Investments
The Trust files a complete statement of investments with the U.S. Securities and Exchange Commission for the first and third quarters for each fiscal year on Form N-Q. Shareholders may view the filed Form N-Q by visiting the Commission’s website at sec.gov. The filed form may also be viewed and copied at the Commission’s Public Reference Room in Washington, DC. Information regarding the operations of the Public Reference Room may be obtained by calling 1-800/SEC-0330.
SI-1
| | |
 | | One Franklin Parkway San Mateo, CA 94403-1906 |
Annual Report
FRANKLIN TEMPLETON
VARIABLE INSURANCE PRODUCTS TRUST
Investment Managers
Franklin Advisers, Inc.
Franklin Advisory Services, LLC
Franklin Mutual Advisers, LLC
Franklin Templeton Institutional, LLC
Templeton Asset Management, Ltd., Singapore
Templeton Global Advisors Limited
Templeton Investment Counsel, LLC
Distributor
Franklin Templeton Distributors, Inc.
Franklin Templeton Variable Insurance Products Trust (FTVIP) shares are sold only to insurance company separate accounts (Separate Account) to serve as the investment vehicles for both variable annuity and variable life insurance contracts.
Authorized for distribution to investors in Separate Accounts only when accompanied or preceded by the current prospectus for the applicable contract, which includes the Separate Account and the FTVIP prospectuses. Investors should carefully consider a fund’s investment goals, risks, charges and expenses before investing. The prospectus contains this and other information; please read it carefully before investing.
To ensure the highest quality of service, telephone calls to or from our service departments may be monitored, recorded and accessed. These calls can be identified by the presence of a regular beeping tone.
FTVIP A2007 02/08
| (a) | The Registrant has adopted a code of ethics that applies to its principal executive officers and principal financial and accounting officer. |
| (f) | Pursuant to Item 12(a)(1), the Registrant is attaching as an exhibit a copy of its code of ethics that applies to its principal executive officers and principal financial and accounting officer. |
| Item 3. | Audit Committee Financial Expert. |
| (a) | (1) The Registrant has an audit committee financial expert serving on its audit committee. |
| | |
| (2) | | The audit committee financial expert is John B. Wilson and he is “independent” as defined under the relevant Securities and Exchange Commission Rules and Releases. |
| Item 4. | Principal Accountant Fees and Services. |
(a) Audit Fees
The aggregate fees paid to the principal accountant for professional services rendered by the principal accountant for the audit of the registrant’s annual financial statements or for services that are normally provided by the principal accountant in connection with statutory and regulatory filings or engagements were $851,956 for the fiscal year ended December 31, 2007 and $771,869 for the fiscal year ended December 31, 2006.
(b) Audit-Related Fees
There were no fees paid to the principal accountant for assurance and related services rendered by the principal accountant to the registrant that are reasonably related to the performance of the audit of the registrant’s financial statements and are not reported under paragraph (a) of Item 4.
There were no fees paid to the principal accountant for assurance and related services rendered by the principal accountant to the registrant’s investment adviser and any entity controlling, controlled by or under common control with the investment adviser that provides ongoing services to the registrant that are reasonably related to the performance of the audit of their financial statements.
(c) Tax Fees
There were no fees paid to the principal accountant for professional services rendered by the principal accountant to the registrant for tax compliance, tax advice and tax planning.
The aggregate fees paid to the principal accountant for professional services rendered by the principal accountant to the registrant’s investment adviser and any entity controlling, controlled by or under common control with the investment adviser that provides ongoing services to the registrant for tax compliance, tax advice and tax planning were $46,000 for the fiscal year ended December 31, 2007 and $3,961 for the fiscal year ended December 31, 2006. The services for which these fees were paid included tax compliance and advice.
(d) All Other Fees
The aggregate fees paid to the principal accountant for products and services rendered by the principal accountant to the registrant not reported in paragraphs (a)-(c) of Item 4 were $0 for the fiscal year ended December 31, 2007 and $14,799 for the fiscal year ended December 31, 2006. The services for which these fees were paid included review of materials provided to the fund Board in connection with the investment management contract renewal process.
The aggregate fees paid to the principal accountant for products and services rendered by the principal accountant to the registrant’s investment adviser and any entity controlling, controlled by or under common control with the investment adviser that provides ongoing
services to the registrant other than services reported in paragraphs (a)-(c) of Item 4 were $0 for the fiscal year ended December 31, 2007 and $161,062 for the fiscal year ended December 31, 2006. The services for which these fees were paid included review of materials provided to the fund Board in connect with the investment management contract renewal process.
(e) (1) The registrant’s audit committee is directly responsible for approving the services to be provided by the auditors, including:
(i) pre-approval of all audit and audit related services;
(ii) pre-approval of all non-audit related services to be provided to the Fund by the auditors;
(iii) pre-approval of all non-audit related services to be provided to the registrant by the auditors to the registrant’s investment adviser or to any entity that controls, is controlled by or is under common control with the registrant’s investment adviser and that provides ongoing services to the registrant where the non-audit services relate directly to the operations or financial reporting of the registrant; and
(iv) establishment by the audit committee, if deemed necessary or appropriate, as an alternative to committee pre-approval of services to be provided by the auditors, as required by paragraphs (ii) and (iii) above, of policies and procedures to permit such services to be pre-approved by other means, such as through establishment of guidelines or by action of a designated member or members of the committee; provided the policies and procedures are detailed as to the particular service and the committee is informed of each service and such policies and procedures do not include delegation of audit committee responsibilities, as contemplated under the Securities Exchange Act of 1934, to management; subject, in the case of (ii) through (iv), to any waivers, exceptions or exemptions that may be available under applicable law or rules.
(e) (2) None of the services provided to the registrant described in paragraphs (b)-(d) of Item 4 were approved by the audit committee pursuant to paragraph (c)(7)(i)(C) of Rule 2-01 of regulation S-X.
(f) No disclosures are required by this Item 4(f).
(g) The aggregate non-audit fees paid to the principal accountant for services rendered by the principal accountant to the registrant and the registrant’s investment adviser and any entity controlling, controlled by or under common control with the investment adviser that provides ongoing services to the registrant were $46,000 for the fiscal year ended December 31, 2007 and $179,822 for the fiscal year ended December 31, 2006.
(h) The registrant’s audit committee of the board has considered whether the provision of non-audit services that were rendered to the registrant’s investment adviser (not including any sub-adviser whose role is primarily portfolio management and is subcontracted with or overseen by another investment adviser), and any entity controlling, controlled by, or under common control with the investment adviser that
provides ongoing services to the registrant that were not pre-approved pursuant to paragraph (c)(7)(ii) of Rule 2-01 of Regulation S-X is compatible with maintaining the principal accountant’s independence.
| Item 5. | Audit Committee of Listed Registrants. |
N/A
| Item 6. | Schedule of Investments. |
N/A
| Item 7. | Disclosure of Proxy Voting Policies and Procedures for Closed-End Management Investment Companies. |
N/A
| Item 8. | Portfolio Managers of Closed-End Management Investment Companies. |
N/A
| Item 9. | Purchases of Equity Securities by Closed-End Management Investment Companies and Affiliated Purchases. |
N/A
| Item 10. | Submission of Matters to a vote of Security Holders. |
There have been no changes to the procedures by which shareholders may recommend nominees to the Registrant’s Board of Trustees that would require disclosure herein.
| Item 11. | Controls and Procedures. |
(a) Evaluation of Disclosure Controls and Procedures. The Registrant maintains disclosure controls and procedures that are designed to ensure that information required to be disclosed in the Registrant’s filings under the Securities Exchange Act of 1934 and the Investment Company Act of 1940 is recorded, processed, summarized and reported within the periods specified in the rules and forms of the Securities and Exchange Commission. Such information is accumulated and communicated to the Registrant’s management, including its principal executive officer and principal financial officer, as appropriate, to allow timely decisions regarding required disclosure. The Registrant’s management, including the principal executive officer and the principal financial officer, recognizes that any set of controls and procedures, no matter how well designed and operated, can provide only reasonable assurance of achieving the desired control objectives.
Within 90 days prior to the filing date of this Shareholder Report on Form N-CSR, the Registrant had carried out an evaluation, under the supervision and with the participation of the Registrant’s management, including the Registrant’s principal executive officer and the Registrant’s principal financial officer, of the effectiveness of the design and operation of the Registrant’s disclosure controls and procedures. Based on such evaluation, the Registrant’s principal executive officer and principal financial officer concluded that the Registrant’s disclosure controls and procedures are effective.
(b) Changes in Internal Controls. There have been no significant changes in the Registrant’s internal controls or in other factors that
could significantly affect the internal controls subsequent to the date of their evaluation in connection with the preparation of this Shareholder Report on Form N-CSR.
(a) (1) Code of Ethics
(a) (2) Certifications pursuant to Section 302 of the Sarbanes-Oxley Act of 2002 of Galen G. Vetter, Chief Executive Officer—Finance and Administration, and Laura Fergerson, Chief Financial Officer and Chief Accounting Officer
(b) Certifications pursuant to Section 906 of the Sarbanes-Oxley Act of 2002 of Galen G. Vetter, Chief Executive Officer—Finance and Administration, and Laura Fergerson, Chief Financial Officer and Chief Accounting Officer
SIGNATURES
Pursuant to the requirements of the Securities Exchange Act of 1934 and the Investment Company Act of 1940, the registrant has duly caused this report to be signed on its behalf by the undersigned, thereunto duly authorized.
FRANKLIN TEMPLETON VARIABLE INSURANCE PRODUCTS TRUST
| | |
| By: | | /s/ GALEN G. VETTER |
| | Galen G. Vetter |
| | Chief Executive Officer – Finance and Administration |
| | Date February 27, 2008 |
Pursuant to the requirements of the Securities Exchange Act of 1934 and the Investment Company Act of 1940, this report has been signed below by the following persons on behalf of the registrant and in the capacities and on the dates indicated.
| | |
| By: | | /s/ GALEN G. VETTER |
| | Galen G. Vetter |
| | Chief Executive Officer – Finance and Administration |
| | Date February 27, 2008 |
| |
| By: | | /s/ LAURA FERGERSON |
| | Laura Fergerson |
| | Chief Financial Officer and Chief Accounting Officer |
| | Date February 27, 2008 |