UNITED STATES
SECURITIES AND EXCHANGE COMMISSION
Washington, D.C. 20549
FORM N-CSR
CERTIFIED SHAREHOLDER REPORT OF REGISTERED MANAGEMENT INVESTMENT COMPANIES
Investment Company Act file number 811-05583
Franklin Templeton Variable Insurance Products Trust
(Exact name of registrant as specified in charter)
One Franklin Parkway, San Mateo, CA 94403-1906
(Address of principal executive offices) (Zip code)
Craig S. Tyle, One Franklin Parkway, San Mateo, CA 94403-1906
(Name and address of agent for service)
Registrant’s telephone number, including area code: (650) 312-2000
Date of fiscal year end: 12/31
Date of reporting period: 12/31/06
| Item 1. | Reports to Stockholders. |

December 31, 2006
TEMPLETON INVESTMENT PLUS
ANNUAL REPORT
THE PHOENIX EDGE SERIES FUND
· PHOENIX MONEY MARKET SERIES
FRANKLIN TEMPLETON VARIABLE INSURANCE PRODUCTS TRUST
· TEMPLETON DEVELOPING MARKETS SECURITIES FUND - CLASS 1
· TEMPLETON FOREIGN SECURITIES FUND - CLASS 1
· TEMPLETON GLOBAL ASSET ALLOCATION FUND - CLASS 1
· TEMPLETON GLOBAL INCOME SECURITIES FUND - CLASS 1
· TEMPLETON GROWTH SECURITIES FUND - CLASS 1


ANNUAL REPORT
THE PHOENIX EDGE
SERIES FUND
Variable Products Fund
December 31, 2006
A MESSAGE FROM THE PRESIDENT
Dear Phoenix Edge Series Fund Shareholder:

We are pleased to provide this report for the fiscal year ended December 31, 2006. It includes valuable information about your Phoenix variable insurance product’s investment options, such as performance-and fee-related data and information about portfolio holdings and transactions for the reporting period.
At Phoenix, we strive to provide investors with choice. Regardless of your level of investment expertise, we seek to provide you with access to a wide selection of quality investment options from today’s leading money managers. For that reason, we expanded our asset allocation program twice in 2006. Most recently, we added an asset allocation portfolio from Franklin Advisors, Inc. – the Franklin Templeton Founding Investment Strategy. Comprised of three underlying funds, this portfolio seeks to offer diversification, low relative volatility and consistent performance.
Earlier this year, we also added four active asset allocation portfolios sub-advised by Standard & Poor’s Investment Advisory Services, LLC, which provide built-in diversification according to four risk tolerance levels and active asset allocation using exchange-traded funds. Finally, we continue to offer five preset asset allocation portfolio models from Ibbotson Associates, each of which is comprised of eight or more individual investment options that are also available outside of our asset allocation program to eligible policyholders.
With so many new asset allocation portfolios available to you, this may be an excellent time to meet with your financial professional to make sure that your investment allocation remains consistent with your current goals. Or you may prefer to explore your options and select your own investments. For more information on the asset allocation portfolios and individual investment options currently available to you, be sure to visit our Web site, at PhoenixWealthManagement.com.
Thank you for choosing a Phoenix variable product as part of your financial strategy. It’s our privilege to serve you.
Sincerely yours,

Philip K. Polkinghorn
President, The Phoenix Edge Series Fund
January 2007
Asset Allocation does not guarantee against a loss, and there is no guarantee that a diversified portfolio will outperform a non-diversified portfolio.
“Standard & Poor’s” and “S&P” are trademarks of The McGraw-Hill Companies, Inc. Standard & Poor’s Investment Advisory Services LLC (“SPIAS”) is a registered investment advisor and a wholly owned subsidiary of The McGraw-Hill Companies, Inc. SPIAS is not affiliated with The Phoenix Companies, Inc. and its affiliates.
Ibbotson Associates and Franklin Advisers, Inc. are not affiliated with The Phoenix Companies.
More complete information about the Standard & Poor’s, Ibbotson Associates and Franklin Advisers, Inc. asset allocation models may be obtained through your financial representative or in the prospectus.
1
THIS PAGE INTENTIONALLY BLANK.
Table of Contents
Proxy Voting Procedures and Voting Record (Form N-PX)
The advisors and subadvisors vote proxies relating to portfolio securities in accordance with procedures that have been approved by the Fund’s Board of Trustees. You may obtain a description of these procedures, along with information regarding how the series voted proxies during the most recent 12-month period ended June 30, 2006, free of charge, by calling toll-free 800-541-0171. This information is also available through the Securities and Exchange Commission’s website at http://www.sec.gov.
Form N-Q Information
The Fund files a complete schedule of portfolio holdings with the Securities and Exchange Commission (the “SEC”) for the first and third quarters of each fiscal year on Form N-Q. Form N-Q is available on the SEC’s website at http://www.sec.gov. Form N-Q may be reviewed and copied at the SEC’s Public Reference Room. Information on the operation of the SEC’s Public Reference Room can be obtained by calling toll-free 1-800-SEC-0330.
| | | | |
| Not FDIC Insured | | No Bank Guarantee | | May Lose Value |
3
GLOSSARY
ADR (American Depositary Receipt)
Represents shares of foreign companies traded in U.S. dollars on U.S. exchanges that are held by a bank or a trust. Foreign companies use ADRs in order to make it easier for Americans to buy their shares.
AMBAC
American Municipal Bond Assurance Corporation.
Citigroup 90-Day Treasury Bill Index
The Citigroup 90-Day Treasury Bill Index measures monthly return equivalents of yield averages that are not marked to market. The 90-Day Treasury Bill Index is an average of the last three three-month Treasury bill issues.
Composite Index for Strategic Allocation Series
A composite index made up of 60% of the S&P 500 Index, which measures stock market total return performance, and 40% of the Lehman Brothers Aggregate Bond Index, which measures bond market total return performance.
Composite Index for S&P Dynamic Asset Allocation Series: Aggressive Growth
A composite index made up of 75% of the S&P 500 Index, which measures stock market total return performance, 8% of the Lehman Brothers Aggregate Bond Index, which measures bond market total return performance, and 17% of the MSCI EAFE Index, which measures foreign market equity performance.
Composite Index for S&P Dynamic Asset Allocation Series: Growth
A composite index made up of 60% of the S&P 500 Index, which measures stock market total return performance, 27% of the Lehman Brothers Aggregate Bond Index, which measures bond market total return performance, and 13% of the MSCI EAFE Index, which measures foreign market equity performance.
Composite Index for S&P Dynamic Asset Allocation Series: Moderate Growth
A composite index made up of 50% of the S&P 500 Index, which measures stock market total return performance, 40% of the Lehman Brothers Aggregate Bond Index, which measures bond market total return performance, and 10% of the MSCI EAFE Index, which measures foreign market equity performance.
Composite Index for S&P Dynamic Asset Allocation Series: Moderate
A composite index made up of 30% of the S&P 500 Index, which measures stock market total return performance, 65% of the Lehman Brothers Aggregate Bond Index, which measures bond market total return performance, and 5% of the MSCI EAFE Index, which measures foreign market equity performance.
ETF (Exchange Traded Fund)
A Fund that tracks an index, but can be traded like a stock.
Federal Reserve (the “Fed”)
The central bank of the United States, responsible for controlling the money supply, interest rates and credit with the goal of keeping the U.S. economy and currency stable. Governed by a seven-member board, the system includes 12 regional Federal Reserve Banks, 25 branches and all national and state banks that are part of the system.
FGIC
Financial Guaranty Insurance Company.
FHLB
Federal Home Loan Bank.
FHLMC
Federal Home Loan Mortgage Corporation.
FNMA or “Fannie Mae”
Federal National Mortgage Association.
FSA
Financial Security Assurance, Inc.
4
GLOSSARY (Continued)
FTSE NAREIT Equity REITs Index
The FTSE NAREIT Equity REITs Index is a free-float market capitalization-weighted index measuring equity tax-qualified real estate investment trusts, which meet minimum size and liquidity criteria, that are listed on the New York Stock Exchange, the American Stock Exchange and the NASDAQ National Market System. The index is calculated on a total return basis with dividends reinvested.
GDR (Global Depositary Receipt)
A negotiable certificate held in the bank of one country representing a specific number of shares of a stock traded on an exchange of another country.
Lehman Brothers Aggregate Bond Index
The Lehman Brothers Aggregate Bond Index measures the U.S. investment grade fixed rate bond market. The index is calculated on a total return basis.
MBIA
Municipal Bond Insurance Association.
Merrill Lynch 1-2.99 Year Medium Quality Corporate Bonds Index
The Merrill Lynch 1-2.99 Year Medium Quality Corporate Bonds Index measures performance of U.S. investment grade corporate bond issues rated “BBB” and “A” by Standard & Poor’s/Moody’s with maturities between one and three years. The index is calculated on a total return basis.
MSCI EAFE® Index
The MSCI EAFE® Index is a free float-adjusted market capitalization index that measures developed foreign market equity performance, excluding the U.S. and Canada. The index is calculated on a total return basis with gross dividends reinvested.
MSCI Information Technology Index
Morgan Stanley Capital International World Information Technology Index is a capitalization weighted index that measures the performance of information technology companies from around the world.
MSCI Japan Index
The MSCI Japan IndexSM is an equity index of securities listed on Japanese stock exchanges. The index is calculated on a total return basis with gross dividends reinvested.
MSCI Latin America Index
Morgan Stanley Capital International Emerging Markets Free Latin American Index is a capitalization weighted index that measures the performance of Latin American companies. The average size of the emerging markets capitalization is US $800 million for the companies included in the MSCI Emerging Markets Free universe.
MSCI USA/Utilities Index
The MSCI USA/Utilities Index is a market capitalization-weighted index that monitors the performance of utility stocks from the United States. The index is calculated on a total return basis with gross dividends reinvested.
New York Shares (Guilder Shares)
Shares representing Dutch companies that are not permitted to trade outside of national borders.
REIT (Real Estate Investment Trust)
A publicly traded company that owns, develops and operates income-producing real estate such as apartments, office buildings, hotels, shopping centers and other commercial properties.
Russell 1000® Growth Index
The Russell 1000® Growth Index is a market capitalization-weighted index of growth-oriented stocks of the 1,000 largest companies in the Russell Universe, which comprises the 3,000 largest U.S. companies. The index is calculated on a total return basis with dividends reinvested.
Russell 1000® Value Index
The Russell 1000® Value Index is a market capitalization-weighted index of value-oriented stocks of the 1,000 largest companies in the Russell Universe, which comprises the 3,000 largest U.S. companies. The index is calculated on a total return basis with dividends reinvested.
5
GLOSSARY (Continued)
Russell 2000® Index
The Russell 2000® Index is a market capitalization-weighted index of the 2,000 smallest companies in the Russell Universe, which comprises the 3,000 largest U.S. companies. The index is calculated on a total return basis with dividends reinvested.
Russell 2000® Growth Index
The Russell 2000® Growth Index is a market capitalization-weighted index of growth-oriented stocks of the smallest 2,000 companies in the Russell Universe, which comprises the 3,000 largest U.S. companies. The index is calculated on a total return basis with dividends reinvested.
Russell 2000® Value Index
The Russell 2000® Value Index is a market capitalization-weighted index of value-oriented stocks of the smallest 2,000 companies in the Russell Universe, which comprises the 3,000 largest U.S. companies. The index is calculated on a total return basis with dividends reinvested.
Russell 2500TM Value Index
The Russell 2500™ Value Index is a market capitalization-weighted index of value-oriented stocks of the smallest 2,500 companies in the Russell Universe, which comprises the 3,000 largest U.S. companies. The index is calculated on a total return basis with dividends reinvested.
Russell MidCap® Growth Index
The Russell MidCap® Growth Index is a market capitalization-weighted index of medium-capitalization, growth-oriented stocks of U.S. companies. The index is calculated on a total return basis with dividends reinvested.
SBA
Small Business Administration.
S&P 500® Index
The S&P 500® Index is a free-float market capitalization-weighted index of 500 of the largest U.S. companies. The index is calculated on a total return basis with dividends reinvested.
Sponsored ADR (American Depositary Receipt)
An ADR which is issued with the cooperation of the company whose stock will underlie the ADR. These shares carry all the rights of the common share such as voting rights. ADRs must be sponsored to be able to trade on the NYSE.
Indexes are unmanaged and not available for direct investment; therefore, their performance does not reflect the expenses associated with the active management of an actual portfolio.
6
PHOENIX MONEY MARKET SERIES
(FORMERLY PHOENIX-GOODWIN MONEY MARKET SERIES)
ABOUT YOUR SERIES EXPENSES (Unaudited)
(For the six-month period of June 30, 2006 to December 31, 2006)
We believe it is important for you to understand the impact of costs on your investment. All mutual funds have operating expenses. As a shareholder of the Money Market Series, you incur ongoing costs including investment advisory fees and other expenses. This example is intended to help you understand your ongoing costs (in dollars) of investing in the series and to compare these costs with the ongoing costs of investing in other mutual funds. This example is based on an investment of $1,000 invested at the beginning of the period and held for the entire six-month period.
Actual Expenses
The first line of the accompanying table provides information about actual account values and actual expenses. You may use the information in this line, together with the amount you invested, to estimate the expenses that you paid over the period. Simply divide your account value by $1,000 (for example, an $8,600 account value divided by $1,000 = 8.6), then multiply the result by the number in the first line under the heading entitled “Expenses Paid During Period” to estimate the expenses you paid on your account during this period. The expense estimate does not include the fees or expenses associated with the separate insurance accounts, and if such charges were included, returns would be lower.
Hypothetical Example for Comparison Purposes
The second line of the accompanying table provides information about hypothetical account values and hypothetical expenses based on the series’ actual expense ratio and an assumed rate of return of 5% per year before expenses, which is not your series’ actual return. The hypothetical account values and expenses may not be used to estimate the actual ending account balance or expenses you paid for the period. You may use this information to compare the ongoing costs of investing in your series and other funds. To do so, compare these 5% hypothetical examples with the 5% hypothetical examples that appear in the shareholder reports of the other funds.
Please note that the expenses shown in the accompanying table are meant to highlight your ongoing costs only and do not reflect additional fees and expenses associated with the annuity or life insurance policy through which you invest. Therefore, the second line of the accompanying table is useful in comparing ongoing costs only, and will not help you determine the relative total costs of owning different funds. In addition, if the annuity or life insurance policy costs were included, your costs would have been higher. The calculations assume no shares were bought or sold during the period. Your actual costs may have been higher or lower, depending on the amount of your investment and the timing of any purchases or redemptions.
| | | | | | | | | |
Money Market Series | | Beginning
Account Value
June 30, 2006 | | Ending
Account Value
December 31, 2006 | | Expenses Paid
During
Period* |
Actual | | $ | 1,000.00 | | $ | 1,023.00 | | $ | 3.31 |
Hypothetical (5% return before expenses) | | | 1,000.00 | | | 1,021.89 | | | 3.32 |
| * | Expenses are equal to the series’ annualized expense ratio of 0.65%, which includes waived fees and reimbursed expenses, if applicable, multiplied by the average account value over the period, multiplied by the number of days (184) expenses were accrued in the most recent fiscal half-year, then divided by 365 to reflect the one-half year period. |
You can find more information about the series’ expenses in the Financial Statements section that follows. For additional information on operating expenses and other shareholder costs including contractual charges associated with the separate account refer to the series prospectus and the contract prospectus.
7
PHOENIX MONEY MARKET SERIES
(FORMERLY PHOENIX-GOODWIN MONEY MARKET SERIES)
| | |
| Sector Weightings | | 12/31/06 |
As a percentage of total investments
SCHEDULE OF INVESTMENTS
DECEMBER 31, 2006
| | | | | | | | | | |
FACE
VALUE
(000) | | DESCRIPTION | | INTEREST
RATE | | | MATURITY
DATE | | VALUE |
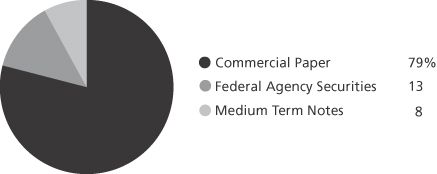
| FEDERAL AGENCY SECURITIES(b)—11.5% | | | | | | | | |
| $1,450 | | FHLB | | 3.00 | % | | 1/5/07 | | $ | 1,449,635 |
| 3,560 | | FNMA | | 3.31 | | | 1/26/07 | | | 3,555,201 |
| 1,000 | | FHLB(c) | | 4.47 | | | 2/22/07 | | | 998,754 |
| 920 | | FHLB | | 3.60 | | | 2/23/07 | | | 917,662 |
| 570 | | FHLB | | 3.63 | | | 2/28/07 | | | 568,442 |
| 1,000 | | FHLMC | | 4.13 | | | 4/12/07 | | | 996,801 |
| 3,000 | | FHLB(c) | | 5.17 | | | 6/14/07 | | | 3,000,000 |
| 240 | | FHLB | | 3.25 | | | 6/18/07 | | | 237,782 |
| 3,500 | | FHLB(c) | | 5.18 | | | 7/30/07 | | | 3,409,784 |
| 3,000 | | FHLB | | 5.27 | | | 11/21/07 | | | 2,998,668 |
| | | | | | | | | | |
| TOTAL FEDERAL AGENCY SECURITIES | | | | | | | | 18,132,729 |
| | | | | | | | | | |
| | | | |
| | | | | | | | RESET
DATE | | |
| FEDERAL AGENCY SECURITIES—VARIABLE(c)—1.2% | | | | | | | | |
| 323 | | SBA (Final Maturity 10/25/22) | | 5.75 | | | 1/1/07 | | | 320,744 |
| 501 | | SBA (Final Maturity 11/25/21) | | 5.88 | | | 1/1/07 | | | 501,221 |
| 170 | | SBA (Final Maturity 2/25/23) | | 5.75 | | | 1/1/07 | | | 169,831 |
| 199 | | SBA (Final Maturity 2/25/23) | | 5.75 | | | 1/1/07 | | | 199,406 |
| 211 | | SBA (Final Maturity 3/25/24) | | 5.63 | | | 1/1/07 | | | 210,744 |
| 64 | | SBA (Final Maturity 5/25/21) | | 5.75 | | | 1/1/07 | | | 63,667 |
| 399 | | SBA (Final Maturity 9/25/23) | | 5.63 | | | 1/1/07 | | | 396,514 |
| 15 | | SBA (Final Maturity 1/25/21) | | 5.75 | | | 1/1/07 | | | 15,149 |
| | | | | | | | | | |
| TOTAL FEDERAL AGENCY SECURITIES—VARIABLE | | | | | | | | 1,877,276 |
| | | | | | | | | | |
| | | | |
| | | | | | | | MATURITY
DATE | | |
| COMMERCIAL PAPER(d)—79.2% | | | | | | | | |
| 3,175 | | Abbott Laboratories | | 5.24 | | | 1/31/07 | | | 3,161,136 |
| 1,648 | | Archer Daniels Midland Co | | 5.24 | | | 1/16/07 | | | 1,644,402 |
| 1,960 | | Archer Daniels Midland Co | | 5.24 | | | 1/17/07 | | | 1,955,435 |
| 1,915 | | Archer Daniels Midland Co | | 5.30 | | | 1/30/07 | | | 1,906,824 |
| 2,080 | | Archer Daniels Midland Co | | 5.25 | | | 2/27/07 | | | 2,062,710 |
| 900 | | Bank of America Corp | | 5.26 | | | 1/17/07 | | | 897,896 |
| 3,100 | | Bank of America Corp | | 5.25 | | | 2/1/07 | | | 3,085,985 |
| 1,800 | | Bank of America Corp | | 5.24 | | | 2/15/07 | | | 1,788,210 |
| 2,140 | | CAFCO LLC | | 5.26 | | | 1/24/07 | | | 2,132,808 |
| 2,200 | | CAFCO LLC | | 5.26 | | | 1/30/07 | | | 2,190,678 |
| 1,700 | | CAFCO LLC | | 5.24 | | | 2/13/07 | | | 1,689,360 |
| 3,535 | | Cargill, Inc | | 5.25 | | | 1/11/07 | | | 3,529,845 |
| 3,500 | | Cargill, Inc | | 5.24 | | | 2/2/07 | | | 3,483,698 |
| 800 | | Cargill, Inc | | 5.28 | | | 2/2/07 | | | 796,245 |
| 2,975 | | Chariot Funding LLC | | 5.31 | | | 1/11/07 | | | 2,970,612 |
| 2,830 | | CIT Group, Inc | | 5.24 | | | 3/9/07 | | | 2,802,401 |
See Notes to Financial Statements
8
PHOENIX MONEY MARKET SERIES
(FORMERLY PHOENIX-GOODWIN MONEY MARKET SERIES)
| | | | | | | | | | | | |
FACE VALUE (000) | | DESCRIPTION | | INTEREST RATE | | | MATURITY
DATE | | | VALUE | |
| COMMERCIAL PAPER(d)—continued | | | | | | | | | | |
| $ 1,900 | | CIT Group, Inc. | | 5.18 | % | | 5/16/07 | | | $ | 1,863,093 | |
| 3,037 | | Clipper Receivables Co. LLC | | 5.30 | | | 2/6/07 | | | | 3,020,904 | |
| 760 | | Clipper Receivables Co. LLC | | 5.26 | | | 2/15/07 | | | | 755,003 | |
| 765 | | Danske Corp. | | 5.37 | | | 1/5/07 | | | | 764,544 | |
| 3,400 | | Danske Corp. | | 5.26 | | | 1/18/07 | | | | 3,391,563 | |
| 230 | | Danske Corp. | | 5.29 | | | 1/18/07 | | | | 229,426 | |
| 3,420 | | Danske Corp. | | 5.21 | | | 4/10/07 | | | | 3,371,000 | |
| 3,500 | | Gemini Securitization LLC | | 5.26 | | | 2/9/07 | | | | 3,480,075 | |
| 2,400 | | General Electric Capital Corp. | | 5.24 | | | 2/9/07 | | | | 2,386,376 | |
| 2,700 | | General Electric Capital Corp. | | 5.23 | | | 2/15/07 | | | | 2,682,349 | |
| 3,000 | | General Electric Capital Corp. | | 5.22 | | | 3/16/07 | | | | 2,967,810 | |
| 550 | | George Street Finance LLC | | 5.29 | | | 1/16/07 | | | | 548,788 | |
| 3,500 | | George Street Finance LLC | | 5.27 | | | 1/22/07 | | | | 3,489,240 | |
| 2,000 | | George Street Finance LLC | | 5.34 | | | 1/29/07 | | | | 1,991,693 | |
| 2,000 | | George Street Finance LLC | | 5.25 | | | 3/13/07 | | | | 1,979,292 | |
| 1,405 | | Govco, Inc. | | 5.24 | | | 1/10/07 | | | | 1,403,159 | |
| 1,000 | | Govco, Inc. | | 5.27 | | | 2/26/07 | | | | 991,802 | |
| 1,900 | | Govco, Inc. | | 5.25 | | | 3/8/07 | | | | 1,881,713 | |
| 1,000 | | Govco, Inc. | | 5.26 | | | 3/14/07 | | | | 989,480 | |
| 2,500 | | Govco, Inc. | | 5.25 | | | 1/25/07 | | | | 2,491,250 | |
| 2,955 | | Harley-Davidson Funding Co. | | 5.22 | | | 2/26/07 | | | | 2,931,005 | |
| 1,005 | | Honeywell International Co. | | 5.35 | | | 1/4/07 | | | | 1,004,552 | |
| 1,000 | | International Lease Finance Corp. | | 5.24 | | | 2/15/07 | | | | 993,450 | |
| 3,000 | | Lockhart Funding LLC | | 5.24 | | | 1/24/07 | | | | 2,989,957 | |
| 2,000 | | Lockhart Funding LLC | | 5.25 | | | 2/13/07 | | | | 1,987,458 | |
| 3,300 | | Lockhart Funding LLC | | 5.26 | | | 2/23/07 | | | | 3,274,445 | |
| 1,800 | | Old Line Funding Corp. | | 5.25 | | | 1/8/07 | | | | 1,798,163 | |
| 2,600 | | Old Line Funding Corp. | | 5.25 | | | 1/12/07 | | | | 2,595,829 | |
| 2,600 | | Old Line Funding Corp. | | 5.27 | | | 2/8/07 | | | | 2,585,537 | |
| 3,000 | | Private Export Funding Corp. | | 5.21 | | | 1/25/07 | | | | 2,989,580 | |
| 3,200 | | Private Export Funding Corp. | | 5.20 | | | 3/7/07 | | | | 3,169,956 | |
| 3,065 | | Ranger Funding Co. LLC | | 5.25 | | | 1/16/07 | | | | 3,058,295 | |
| 1,893 | | Ranger Funding Co. LLC | | 5.24 | | | 2/5/07 | | | | 1,883,356 | |
| 3,100 | | Ranger Funding Co. LLC | | 5.28 | | | 2/7/07 | | | | 3,083,177 | |
| 3,485 | | Sysco Corp. | | 5.33 | | | 1/3/07 | | | | 3,483,968 | |
| 2,500 | | Sysco Corp. | | 5.23 | | | 3/8/07 | | | | 2,476,029 | |
| 2,315 | | UBS Finance Delaware LLC | | 5.26 | | | 1/12/07 | | | | 2,311,279 | |
| 5,005 | | UBS Finance Delaware LLC | | 5.24 | | | 1/26/07 | | | | 4,986,787 | |
| | | | | | | | | | | | |
| TOTAL COMMERCIAL PAPER | | | | | | | | | 124,379,628 | |
| | | | | | | | | | | | |
| MEDIUM TERM NOTES—7.8% | | | | | | | | | | |
| 3,000 | | National Australia Bank Ltd. 144A (Australia) (c) (e) (f) | | 5.32 | | | 1/8/07 | (g) | | | 3,000,000 | |
| 3,000 | | Nordea Bank AB 144A (Sweden) (c) (e) (f) | | 5.33 | | | 1/9/07 | (g) | | | 3,000,000 | |
| 1,250 | | Bank of America (MBNA) Corp. (b) | | 6.25 | | | 1/17/07 | | | | 1,250,451 | |
| 5,000 | | HSH Nordbank AG 144A (Germany) (c) (e) (f) | | 5.38 | | | 1/23/07 | (g) | | | 5,000,000 | |
| | | | | | | | | | | | |
| TOTAL MEDIUM TERM NOTES | | | | | | | | | 12,250,451 | |
| | | | | | | | | | | | |
| TOTAL INVESTMENTS—99.7% | | | | | | | | | | |
| (Identified cost $156,640,084) | | | | | | | | | 156,640,084 | (a) |
| Other assets and liabilities, net—0.3% | | | | | | | | | 518,060 | |
| | | | | | | | | | | | |
| NET ASSETS—100.0% | | | | | | | | $ | 157,158,144 | |
| | | | | | | | | | | | |
(a) | Federal Income Tax Information: At December 31, 2006, the aggregate cost of securities was the same for book and federal income tax purposes. |
(b) | The interest rate shown is the coupon rate. |
(c) | Variable or step coupon security; interest rate shown reflects the rate currently in effect. |
(d) | The rate shown is the discount rate. |
(e) | Security exempt from registration under Rule 144A of the Securities Act of 1933. These securities may be resold in transactions exempt from registration, normally to qualified institutional buyers. At December 31, 2006, these securities amounted to a value of $11,000,000 or 7.0% of net assets. |
(f) | The country of risk, noted parenthetically, is determined based on criteria described in Note 2G “Foreign security country determination” in the Notes to Financial Statements. |
(g) | The maturity date shown is the reset date. |
See Notes to Financial Statements
9
PHOENIX MONEY MARKET SERIES
(FORMERLY PHOENIX-GOODWIN MONEY MARKET SERIES)
STATEMENT OF ASSETS AND LIABILITIES
December 31, 2006
| | | | |
Assets | | | | |
Investment securities at value (Identified cost $156,640,084) | | $ | 156,640,084 | |
Cash | | | 69,205 | |
Receivables | | | | |
Fund shares sold | | | 398,539 | |
Interest | | | 312,116 | |
Prepaid expenses | | | 21,029 | |
Other assets | | | 5,778 | |
| | | | |
Total assets | | | 157,446,751 | |
| | | | |
Liabilities | | | | |
Payables | | | | |
Fund shares repurchased | | | 84,783 | |
Investment advisory fee | | | 55,665 | |
Printing fee | | | 43,953 | |
Dividend distributions | | | 39,483 | |
Professional fee | | | 23,843 | |
Administration fee | | | 9,815 | |
Service fee | | | 8,868 | |
Trustee deferred compensation plan | | | 5,778 | |
Trustees’ fee | | | 5,409 | |
Other accrued expenses | | | 11,010 | |
| | | | |
Total liabilities | | | 288,607 | |
| | | | |
Net Assets | | $ | 157,158,144 | |
| | | | |
Net Assets Consist of: | | | | |
Capital paid in on shares of beneficial interest | | $ | 157,158,144 | |
| | | | |
Net Assets | | $ | 157,158,144 | |
| | | | |
Shares of beneficial interest outstanding, $1 par value, unlimited authorization | | | 15,715,878 | |
| | | | |
Net asset value and offering price per share | | $ | 10.00 | |
| | | | |
| |
STATEMENT OF OPERATIONS | | | | |
Year Ended December 31, 2006 | | | | |
| |
Investment Income | | | | |
Interest | | $ | 8,039,088 | |
| | | | |
Total investment income | | | 8,039,088 | |
| | | | |
Expenses | | | | |
Investment advisory fee | | | 642,741 | |
Financial agent fee | | | 54,221 | |
Administration fee | | | 33,706 | |
Service fee | | | 104,445 | |
Printing | | | 89,192 | |
Professional | | | 31,401 | |
Trustees | | | 26,777 | |
Custodian | | | 22,533 | |
Miscellaneous | | | 51,041 | |
| | | | |
Total expenses | | | 1,056,057 | |
Less expenses reimbursed by investment advisor | | | (9,904 | ) |
Custodian fees paid indirectly | | | (1,777 | ) |
| | | | |
Net expenses | | | 1,044,376 | |
| | | | |
Net investment income (loss) | | $ | 6,994,712 | |
| | | | |
See Notes to Financial Statements
10
PHOENIX MONEY MARKET SERIES
(FORMERLY PHOENIX-GOODWIN MONEY MARKET SERIES)
STATEMENT OF CHANGES IN NET ASSETS
| | | | | | | | |
| | | Year Ended
December 31,
2006 | | | Year Ended
December 31,
2005 | |
From Operations | | | | | | | | |
Net investment income | | $ | 6,994,712 | | | $ | 3,856,408 | |
| | | | | | | | |
Increase (decrease) in net assets resulting from operations | | | 6,994,712 | | | | 3,856,408 | |
| | | | | | | | |
From Distributions to Shareholders | | | | | | | | |
Net investment income | | | (6,994,712 | ) | | | (3,856,408 | ) |
| | | | | | | | |
Decrease in net assets from distributions to shareholders | | | (6,994,712 | ) | | | (3,856,408 | ) |
| | | | | | | | |
From Share Transactions | | | | | | | | |
Proceeds from sales of shares (10,626,027 and 9,829,813 shares, respectively) | | | 106,260,270 | | | | 98,298,132 | |
Net asset value of shares issued from reinvestment of distributions
(699,471 and 385,641 shares, respectively) | | | 6,994,712 | | | | 3,856,408 | |
Cost of shares repurchased (10,252,807 and 11,271,888 shares, respectively) | | | (102,528,067 | ) | | | (112,718,881 | ) |
| | | | | | | | |
Increase (decrease) in net assets from share transactions | | | 10,726,915 | | | | (10,564,341 | ) |
| | | | | | | | |
Net increase (decrease) in net assets | | | 10,726,915 | | | | (10,564,341 | ) |
Net Assets | | | | | | | | |
Beginning of period | | | 146,431,229 | | | | 156,995,570 | |
| | | | | | | | |
End of period | | $ | 157,158,144 | | | $ | 146,431,229 | |
| | | | | | | | |
FINANCIAL HIGHLIGHTS
(Selected data for a share outstanding throughout the indicated period)
| | | | | | | | | | | | | | | | | | | | |
| | | Year Ended December 31, | |
| | | 2006 | | | 2005 | | | 2004 | | | 2003 | | | 2002 | |
Net asset value, beginning of period | | $ | 10.00 | | | $ | 10.00 | | | $ | 10.00 | | | $ | 10.00 | | | $ | 10.00 | |
Income from investment operations | | | | | | | | | | | | | | | | | | | | |
Net investment income | | | 0.43 | | | | 0.26 | | | | 0.08 | | | | 0.07 | | | | 0.14 | |
| | | | | | | | | | | | | | | | | | | | |
Total from investment operations | | | 0.43 | | | | 0.26 | | | | 0.08 | | | | 0.07 | | | | 0.14 | |
| | | | | | | | | | | | | | | | | | | | |
Less distributions | | | | | | | | | | | | | | | | | | | | |
Dividends from net investment income | | | (0.43 | ) | | | (0.26 | ) | | | (0.08 | ) | | | (0.07 | ) | | | (0.14 | ) |
| | | | | | | | | | | | | | | | | | | | |
Total distributions | | | (0.43 | ) | | | (0.26 | ) | | | (0.08 | ) | | | (0.07 | ) | | | (0.14 | ) |
| | | | | | | | | | | | | | | | | | | | |
Net asset value, end of period | | $ | 10.00 | | | $ | 10.00 | | | $ | 10.00 | | | $ | 10.00 | | | $ | 10.00 | |
| | | | | | | | | | | | | | | | | | | | |
Total return | | | 4.41 | % | | | 2.58 | % | | | 0.79 | % | | | 0.68 | % | | | 1.42 | % |
Ratios/supplemental data: | | | | | | | | | | | | | | | | | | | | |
Net assets, end of period (thousands) | | $ | 157,158 | | | $ | 146,431 | | | $ | 156,996 | | | $ | 202,644 | | | $ | 255,759 | |
Ratio to average net assets of: | | | | | | | | | | | | | | | | | | | | |
Net operating expenses | | | 0.65 | % | | | 0.65 | % | | | 0.64 | % | | | 0.59 | % | | | 0.56 | % |
Gross operating expenses | | | 0.66 | % | | | 0.66 | % | | | 0.64 | % | | | 0.59 | % | | | 0.56 | % |
Net investment income | | | 4.35 | % | | | 2.54 | % | | | 0.77 | % | | | 0.69 | % | | | 1.41 | % |
See Notes to Financial Statements
11
THE PHOENIX EDGE SERIES FUND
NOTES TO FINANCIAL STATEMENTS
December 31, 2006
Note 1—Organization
The Phoenix Edge Series Fund (the “Fund”) is organized as a Massachusetts business trust and is registered under the Investment Company Act of 1940, as amended, as an open-end management investment company. The Fund is organized with series, which are available only to the following separate accounts: Phoenix Life Variable Accumulation Account, Phoenix Life Variable Universal Life Account, PHL Variable Accumulation Account, PHLVIC Variable Universal Life Account, Phoenix Life and Annuity Variable Universal Life Account, and Phoenix Life Separate Accounts B, C, and D.
The Fund is comprised of 18 series (each a “series”) each having a distinct investment objective as outlined below:
| | |
Fund Name | | Investment Objective |
Phoenix Capital Growth Series | | Intermediate and long-term capital appreciation, with income as a |
(“Capital Growth”) | | secondary consideration. |
(f/k/a Phoenix-Engemann Capital Growth) | | |
| |
Phoenix Growth and Income Series | | Dividend growth, current income and capital appreciation. |
(“Growth and Income”) | | |
(f/k/a Phoenix-Engemann Growth and Income Series) | | |
| |
Phoenix Mid-Cap Growth Series | | Capital appreciation. |
(“Mid-Cap Growth”) | | |
| |
Phoenix Money Market Series | | As high a level of current income as is consistent with the |
(“Money Market”) | | preservation of capital and maintenance of liquidity. |
(f/k/a Phoenix-Goodwin Money Market Series) | | |
| |
Phoenix Multi-Sector Fixed Income Series | | Long-term total return. |
(“Multi-Sector Fixed Income”) | | |
(f/k/a Phoenix-Goodwin Multi-Sector Fixed Income Series) | | |
| |
Phoenix Multi-Sector Short Term Bond Series | | To provide high current income while attempting to limit changes |
(“Multi-Sector Short Term Bond”) | | in the series’ net asset value per share caused by interest |
(f/k/a Phoenix-Goodwin Multi-Sector Short Term Bond Series) | | rate changes. |
| |
Phoenix Strategic Allocation Series | | High total return over an extended period of time consistent with |
(“Strategic Allocation”) | | prudent investment risk. |
(f/k/a Phoenix-Engemann Strategic Allocation Series) | | |
| |
Phoenix-Aberdeen International Series | | High total return consistent with reasonable risk. |
(“Aberdeen International”) | | |
| |
Phoenix-Alger Small-Cap Growth Series | | Long-term capital growth. |
(“Alger Small-Cap Growth”) | | |
| |
Phoenix-Duff & Phelps Real Estate Securities Series | | Capital appreciation and income with approximately equal |
(“Duff & Phelps Real Estate Securities”) | | emphasis. |
| |
Phoenix-S&P Dynamic Asset Allocation Series: Aggressive | | Seek long-term capital growth. |
Growth | | |
(“S&P Aggressive Growth”) | | |
| |
Phoenix-S&P Dynamic Asset Allocation Series: Growth | | Seek long-term capital growth with current income as a |
(“S&P Growth”) | | secondary consideration. |
| |
Phoenix-S&P Dynamic Asset Allocation Series: Moderate | | Seek long-term capital growth and current income, with a greater |
Growth | | emphasis on capital growth. |
(“S&P Moderate Growth”) | | |
| |
Phoenix-S&P Dynamic Asset Allocation Series: Moderate | | Seek current income with capital growth as a secondary |
(“S&P Moderate”) | | consideration. |
| |
Phoenix-Sanford Bernstein Mid-Cap Value Series | | Long-term capital appreciation with current income as a |
(“Sanford Bernstein Mid-Cap Value”) | | secondary consideration. |
| |
Phoenix-Sanford Bernstein Small-Cap Value Series | | Long-term capital appreciation by investing primarily in small- |
(“Sanford Bernstein Small-Cap Value”) | | capitalization stocks that appear to be undervalued, with current |
| | income as a secondary consideration. |
| |
Phoenix-Van Kampen Comstock Series | | Long-term capital appreciation with current income as a |
(“Van Kampen Comstock”) | | secondary consideration. |
(f/k/a Phoenix-Engemann Value Equity) | | |
| |
Phoenix-Van Kampen Equity 500 Index Series | | High total return. |
(“Van Kampen Equity 500 Index”) | | |
(f/k/a Phoenix-Alliance/Bernstein Enhanced Index Series) | | |
12
THE PHOENIX EDGE SERIES FUND
NOTES TO FINANCIAL STATEMENTS (Continued)
December 31, 2006
Note 2—Significant Accounting Policies
The following is a summary of significant accounting policies consistently followed by the Fund in the preparation of its financial statements. The preparation of financial statements in conformity with accounting principles generally accepted in the United States of America requires management to make estimates and assumptions that affect the reported amounts of assets and liabilities, and disclosure of contingent assets and liabilities at the date of the financial statements and the reported amounts of increases and decreases in net assets from operations during the reporting period. Actual results could differ from those estimates.
Equity securities are valued at the official closing price (typically last sale) on the exchange on which the securities are primarily traded, or if no closing price is available, at the last bid price.
Debt securities are valued on the basis of broker quotations or valuations provided by a pricing service, which utilizes information with respect to recent sales, market transactions in comparable securities, quotations from dealers, and various relationships between securities in determining value.
As required, some securities and assets may be valued at fair value as determined in good faith by or under the direction of the Trustees.
Certain foreign common stocks may be fair valued in cases where closing prices are not readily available or are deemed not reflective of readily available market prices. For example, significant events (such as movement in the U.S. securities market, or other regional and local developments) may occur between the time that foreign markets close (where the security is principally traded) and the time that the series calculates its net asset value (generally, the close of the NYSE) that may impact the value of securities traded in these foreign markets. In these cases, information from an external vendor may be utilized to adjust closing market prices of certain foreign common stocks to reflect their fair value. Because the frequency of significant events is not predictable, fair valuation of certain foreign common stocks may occur on a frequent basis.
Certain securities held by the Fund were valued on the basis of a price provided by a principal market maker. The prices provided by the principal market makers may differ from the value that would be realized if the securities were sold. At December 31, 2006, the total value of these securities represented the following approximate percentage of net assets:
| | | |
Series | | Percentage of Net Assets | |
Multi-Sector Fixed Income | | 3.3 | % |
Multi-Sector Short Term Bond | | 5.1 | |
Short-term investments having a remaining maturity of 60 days or less are valued at amortized cost, which approximates market.
Money Market uses the amortized cost method of security valuation absent extraordinary or unusual market conditions. In the opinion of the Trustees, this represents the fair value of the securities. The Trustees monitor the deviations between the net asset value per share as determined by using available market quotations and its net asset value per share using amortized cost. If the deviation exceeds 1/2 of 1%, the Board of Trustees will consider what action, if any, should be initiated to provide fair valuation. Using this method, the series attempts to maintain a constant net asset value of $10 per share.
In September 2006, Statement of Financial Accounting Standards No. 157, “Fair Value Measurements” (“SFAS 157”), was issued and is effective for fiscal years beginning after November 15, 2007. SFAS 157 defines fair value, establishes a framework for measuring fair value and expands disclosures about fair value measurements. Management is currently evaluating the impact the adoption of SFAS 157 will have on the Fund’s financial statement disclosures.
| B. | Security Transactions and Related Income |
Security transactions are recorded on the trade date. Dividend income is recorded on the ex-dividend date, or in the case of certain foreign securities, as soon as the series is notified. Interest income is recorded on the accrual basis. Each series amortizes premiums and accretes discounts using the effective interest method. Realized gains and losses are determined on the identified cost basis.
Each series is treated as a separate taxable entity. It is the policy of each series in the Fund to comply with the requirements of the Internal Revenue Code and to distribute substantially all of its taxable income to its shareholders. Therefore, no provision for federal income taxes or excise taxes has been made.
Certain series may be subject to foreign taxes on income, gains on investments or currency repatriation, a portion of which may be recoverable. Each series will accrue such taxes and recoveries as applicable based upon current interpretations of the tax rules and regulations that exist in the markets in which they invest.
In June 2006, the Financial Accounting Standards Board (FASB) issued FASB Interpretation 48 (“FIN 48”), “Accounting for Uncertainty in Income Taxes.” This standard defines the threshold for recognizing the benefits of tax-return positions in the financial statements as “more-likely-than-not” to be sustained by the taxing authority and requires measurement of a tax position meeting the more-likely-than-not criterion, based on the largest benefit that is more than 50 percent likely to be realized. FIN 48 is effective as of the beginning of the first fiscal year beginning after December 15, 2006, with early application permitted if no interim financial
13
THE PHOENIX EDGE SERIES FUND
NOTES TO FINANCIAL STATEMENTS (Continued)
December 31, 2006
statements have been issued. At adoption, companies must adjust their financial statements to reflect only those tax positions that are more likely-than-not to be sustained as of the adoption date. The evaluation of the impact that may result from adopting FIN 48 is in progress.
| D. | Distributions to shareholders |
Distributions are recorded by each series on the ex-dividend date. For Money Market, income distributions are recorded daily. Income and capital gain distributions are determined in accordance with income tax regulations which may differ from accounting principles generally accepted in the United States of America. These differences may include the treatment of non-taxable dividends, market premium and discount, non-deductible expenses, expiring capital loss carryovers, foreign currency gain or loss, gain or loss on futures contracts, partnerships, operating losses and losses deferred due to wash sales. Permanent book and tax basis differences relating to shareholder distributions will result in reclassifications to capital paid in on shares of beneficial interest.
Expenses incurred by the Fund with respect to more than one series are allocated in proportion to the net assets of each series, except where allocation of direct expense to each series or an alternative allocation method can be more appropriately made. In addition to the net operating expenses that the Phoenix-S&P Asset Allocation series’ bear directly, the contract owners, as investors in the series, indirectly bear the series’ pro-rata expenses of the underlying funds in which each series invests.
| F. | Foreign currency translation |
Foreign securities and other assets and liabilities are valued using the foreign currency exchange rate effective at the end of the reporting period. Cost of investments is translated at the currency exchange rate effective at the trade date. The gain or loss resulting from a change in currency exchange rates between the trade and settlement date of a portfolio transaction is treated as a gain or loss on foreign currency. Likewise, the gain or loss resulting from a change in currency exchange rates between the date income is accrued and paid, is treated as a gain or loss on foreign currency. The Fund does not isolate that portion of the results of operations arising from either changes in exchange rates or in the market prices of securities.
| G. | Foreign security country determination |
A combination of the following criteria is used to assign the countries of risk listed in the schedules of investments: country of incorporation, actual building address, primary exchange on which the security is traded and country in which the greatest percentage of company revenue is generated.
| H. | Forward currency contracts |
Certain series may enter into forward currency contracts in conjunction with the planned purchase or sale of foreign denominated securities in order to hedge the U.S. dollar cost or proceeds. Forward currency contracts involve, to varying degrees, elements of market risk in excess of the amount recognized in the Statements of Assets and Liabilities. Risks arise from the possible movements in foreign exchange rates or if a counterparty does not perform under the contract.
A forward currency contract involves an obligation to purchase or sell a specific currency at a future date, which may be any number of days from the date of the contract agreed upon by the parties, at a price set at the time of the contract. These contracts are traded directly between currency traders and their customers. The contract is marked-to-market daily and the change in market value is recorded by each series as unrealized gain or loss. When the contract is closed or offset with the same counterparty, the series records a realized gain or loss equal to the change in the value of the contract when it was opened and the value at the time it was closed or offset.
At December 31, 2006, the Fund had entered into forward currency contracts as follows:
| | | | | | | | | | | | | | | | | |
| | | Contract to Receive | | In Exchange for | | Settlement
Date | | Value | | Net Unrealized
Appreciation
(Depreciation) | |
Multi-Sector Fixed Income | | JPY | | 71,375,850 | | USD | | 610,050 | | 2/7/07 | | $ | 603,012 | | $ | (7,038 | ) |
| | JPY | | 139,794,450 | | USD | | 1,200,983 | | 2/7/07 | | | 1,181,040 | | | (19,943 | ) |
| | JPY | | 69,523,200 | | USD | | 599,855 | | 2/14/07 | | | 587,862 | | | (11,993 | ) |
| | | | | | | | | | | | | | | | | |
| | | | | | | | | | | | | | | $ | (38,974 | ) |
| | | | | | | | | | | | | | | | | |
| | | | | | | | | | | | | | | | | |
| | | Contract to Receive | | In Exchange for | | Settlement
Date | | Value | | Net Unrealized
Appreciation
(Depreciation) | |
Multi-Sector Short-Term Bond | | JPY | | 13,550,640 | | USD | | 114,724 | | 1/12/07 | | $ | 114,088 | | $ | (636 | ) |
| | JPY | | 42,683,625 | | USD | | 365,442 | | 1/24/07 | | | 359,969 | | | (5,473 | ) |
| | JPY | | 26,862,895 | | USD | | 230,781 | | 2/7/07 | | | 226,949 | | | (3,832 | ) |
| | JPY | | 10,980,900 | | USD | | 93,854 | | 2/7/07 | | | 92,771 | | | (1,083 | ) |
| | JPY | | 14,484,000 | | USD | | 124,970 | | 2/14/07 | | | 122,471 | | | (2,499 | ) |
| | | | | | | | | | | | | | | | | |
| | | | | | | | | | | | | | | $ | (13,523 | ) |
| | | | | | | | | | | | | | | | | |
14
THE PHOENIX EDGE SERIES FUND
NOTES TO FINANCIAL STATEMENTS (Continued)
December 31, 2006
| | | | | | | | | | | | | |
| | | Contract to
Receive | | In Exchange
for | | Settlement
Date | | Value | | Net Unrealized
Appreciation
(Depreciation) | |
Strategic Allocation | | JPY 38,433,150 | | USD 328,488 | | 2/7/07 | | $ | 324,698 | | $ | (3,790 | ) |
| | JPY 40,555,200 | | USD 349,915 | | 2/14/07 | | | 342,919 | | | (6,996 | ) |
| | | | | | | | | | | | | |
| | | | | | | | | | | $ | (10,786 | ) |
| | | | | | | | | | | | | |
A futures contract is an agreement between two parties to buy and sell a security at a set price on a future date. Certain series may enter into financial futures contracts as a hedge against anticipated changes in the market value of their portfolio securities. Upon entering into a futures contract, the series is required to pledge to the broker an amount of cash and/or securities equal to the “initial margin” requirements of the futures exchange on which the contract is traded. Pursuant to the contract, the series agrees to receive from or pay to the broker an amount of cash equal to the daily fluctuation in value of the contract. Such receipts or payments are known as variation margin and are recorded by the series as unrealized gains or losses. When the contract is closed, the series records a realized gain or loss equal to the difference between the value of the contract at the time it was opened and the value at the time it was closed. The potential risk to the series is that the change in value of the futures contract may not correspond to the change in value of the hedged instruments.
At December 31, 2006, the series had entered into futures contracts as follows:
| | | | | | | | | | | | | | |
| | | Expiration
Date | | Number
of
Contracts | | Value of
Contracts
when
Opened | | Market
Value of
Contracts | | Unrealized
Appreciation
(Depreciation) | |
Van Kampen Equity 500 Index | | | | | | | | | | | | | | |
S&P 500® Index | | March ‘07 | | 6 | | $ | 2,140,275 | | $ | 2,143,200 | | $ | 2,925 | |
S&P 500® Index E-Mini | | March ‘07 | | 4 | | | 287,800 | | | 285,850 | | | (1,950 | ) |
| | | | | | | | | | | | | | |
| | | | | | | | | | | | $ | 975 | |
| | | | | | | | | | | | | | |
Dividend income is recorded using management’s estimate of the income included in distributions received from the REIT investments. Distributions received in excess of this estimated amount are recorded as a reduction of the cost of investments or reclassified to capital gains. The actual amounts of income, return of capital, and capital gains are only determined by each REIT after its fiscal year-end, and may differ from the estimated amounts.
Certain series may loan securities to qualified brokers through an agreement with State Street Bank and Trust (the “Custodian”). Under the terms of the agreement, the series receives collateral with a market value not less than 100% of the market value of loaned securities. Collateral is adjusted daily in connection with changes in the market value of securities on loan. Collateral may consist of cash, securities issued or guaranteed by the U.S. Government or its agencies and the sovereign debt of foreign countries. Cash collateral is invested in a short-term money market fund. Dividends earned on the collateral and premiums paid by the borrower are recorded as income by the series net of fees and rebates charged by the Custodian for its services in connection with this securities lending program. Lending portfolio securities involves a risk of delay in the recovery of the loaned securities or in the foreclosure on collateral.
Certain series may invest in direct debt instruments, which are interests in amounts owed by a corporate, governmental, or other borrower to lenders or lending syndicates. The series’ investments in loans may be in the form of participations in loans or assignments of all or a portion of loans from third parties.
A loan is often administered by a bank or other financial institution (the lender) that acts as agent for all holders. The agent administers the terms of the loan, as specified in the loan agreement. When investing in a loan participation, the series has the right to receive payments of principal, interest and any fees to which it is entitled only from the lender selling the loan agreement and only upon receipt by the lender of payments from the borrower. The series generally has no right to enforce compliance with the terms of the loan agreement with the borrower. As a result, the series may be subject to the credit risk of both the borrower and the lender that is selling the loan agreement. When the series purchases assignments from lenders it acquires direct rights against the borrower on the loan.
15
THE PHOENIX EDGE SERIES FUND
NOTES TO FINANCIAL STATEMENTS (Continued)
December 31, 2006
Direct indebtedness of emerging countries involves a risk that the government entities responsible for the repayment of the debt may be unable, or unwilling to pay the principal and interest when due.
| M. | When-Issued and Delayed Delivery Transactions |
Certain series may engage in when-issued or delayed delivery transactions. Each series records when-issued and delayed delivery securities on the trade date. Each series maintains collateral for the securities purchased. Securities purchased on a when-issued or delayed delivery basis begin earning interest on the settlement date.
A repurchase agreement is a transaction where a series acquires a security for cash and obtains a simultaneous commitment from the seller to repurchase the security at an agreed upon price and date. Each series, through its custodian, takes possession of securities collateralizing the repurchase agreement. The collateral is marked-to-market daily to ensure that the market value of the underlying assets remains sufficient to protect the series in the event of default by the seller. If the seller defaults and the value of the collateral declines, or if the seller enters insolvency proceedings, realization of collateral may be delayed or limited.
Certain series may invest in credit-linked notes, which are usually issued by a special purpose vehicle that is selling credit protection through a credit default swap. The performance of the notes is linked to the performance of the underlying reference obligation. The special purpose vehicle invests the proceeds from the notes to cover its contingent obligation. Credit linked notes may also have risks with default by the referenced obligation, currency and/or interest rates.
Note 3—Investment Advisory Fees and Related Party Transactions
The advisors to the Fund are Phoenix Investment Counsel, Inc. (“PIC”), Phoenix Variable Advisors, Inc. (“PVA”), and Duff & Phelps Investment Management Co. (“DPIM”). PIC is an indirect wholly-owned subsidiary of Phoenix Investment Partners, Ltd. (“PXP”). DPIM is a direct subsidiary of PXP. PXP in turn is an indirect-wholly-owned subsidiary of The Phoenix Companies, Inc. (“PNX”). PVA is a wholly-owned subsidiary of PM Holdings. Inc., which is an indirect, wholly-owned subsidiary of Phoenix Life Insurance Company (“PLIC”).
As compensation for their services to the Fund, the advisors are entitled to a fee based upon the following annual rates as a percentage of the average daily net assets of each separate series listed below:
| | | | | | | | | | | | |
Series | | Advisor | | | $250 million | | | $250 million | | | $500 million | |
Capital Growth | | PIC | | | 0.70 | % | | 0.65 | % | | 0.60 | % |
Growth and Income | | PIC | (3) | | 0.70 | | | 0.65 | | | 0.60 | |
Mid-Cap Growth | | PVA | | | 0.80 | | | 0.80 | | | 0.80 | |
Money Market | | PIC | | | 0.40 | | | 0.35 | | | 0.30 | |
Multi-Sector Fixed Income | | PIC | | | 0.50 | | | 0.45 | | | 0.40 | |
Multi-Sector Short Term Bond | | PIC | | | 0.50 | | | 0.45 | | | 0.40 | |
Strategic Allocation | | PIC | | | 0.60 | | | 0.55 | | | 0.50 | |
Aberdeen International | | PIC | | | 0.75 | | | 0.70 | | | 0.65 | |
Alger Small-Cap Growth | | PVA | | | 0.85 | | | 0.85 | | | 0.85 | |
S&P Aggressive Growth | | PVA | (1) | | 0.40 | | | 0.40 | | | 0.40 | |
S&P Growth | | PVA | (1) | | 0.40 | | | 0.40 | | | 0.40 | |
S&P Moderate Growth | | PVA | (1) | | 0.40 | | | 0.40 | | | 0.40 | |
S&P Moderate | | PVA | (1) | | 0.40 | | | 0.40 | | | 0.40 | |
Sanford Bernstein Mid-Cap Value | | PVA | | | 1.05 | | | 1.05 | | | 1.05 | |
Sanford Bernstein Small-Cap Value | | PVA | | | 1.05 | | | 1.05 | | | 1.05 | |
Van Kampen Comstock | | PVA | (2) | | 0.70 | | | 0.65 | | | 0.60 | |
Van Kampen Equity 500 Index | | PVA | | | 0.45 | | | 0.45 | | | 0.45 | |
(1) | For the period February 3, 2006 through April 30, 2006, PIC served as the advisor to the series. |
(2) | For the period January 1, 2006 through April 30, 2006, Engemann Asset Management (“EAM”) served as the advisor to the series. |
(3) | For the period January 1, 2006 through October 22, 2006, EAM served as the advisor to the series. |
| | | | | | | | | | |
| | | | | Rate for first
$1 Billion | | | Rate for next
$1 Billion | | | Rate for over
$2 Billion |
Duff & Phelps Real Estate Securities | | DPIM | | 0.75 | % | | 0.70 | % | | 0.65 |
16
THE PHOENIX EDGE SERIES FUND
NOTES TO FINANCIAL STATEMENTS (Continued)
December 31, 2006
Pursuant to a subadvisory agreement with the Fund, certain advisors delegate certain investment decisions and/or research functions with respect to the following series to the subadvisor indicated, for which each is paid a fee by the respective advisor.
| | |
Series | | Subadvisor |
Capital Growth(1) | | Harris Investment Management, Inc. (“Harris”) |
Mid-Cap Growth | | Bennett Lawrence Management LLC (“Bennett Lawrence”) |
Aberdeen International | | Aberdeen Asset Management Inc. (“Aberdeen”) |
Alger Small-Cap Growth | | Fred Alger Management, Inc. (“Alger”) |
S&P Aggressive Growth | | Standard & Poor’s Investment Advisory Services LLC (“SPIAS”) |
S&P Growth | | Standard & Poor’s Investment Advisory Services LLC (“SPIAS”) |
S&P Moderate Growth | | Standard & Poor’s Investment Advisory Services LLC (“SPIAS”) |
S&P Moderate | | Standard & Poor’s Investment Advisory Services LLC (“SPIAS”) |
Sanford Bernstein Mid-Cap Value | | AllianceBernstein, L.P. (“Alliance”) |
Sanford Bernstein Small-Cap Value | | AllianceBernstein, L.P. (“Alliance”) |
Van Kampen Comstock | | Morgan Stanley Investment Management Inc. dba Van Kampen
(“Van Kampen”) |
Van Kampen Equity 500 Index(2) | | Morgan Stanley Investment Management Inc. dba Van Kampen
(“Van Kampen”) |
(1) | For the period of January 1, 2006 through June 22, 2006, EAM was the subadvisor to this series. |
(2) | For the period of January 1, 2006 through August 31, 2006, Alliance was the subadvisor to this series. |
PIC and PVA employ subadvisors to furnish portfolio management services to the series, subject to Investment Subadvisory Agreements.
For the period January 1, 2006 through October 22, 2006, with respect to the equity portion of Strategic Allocation, EAM was the subadvisor to the series. Effective October 23, 2006, PIC manages the equity portion of the series.
Effective September 1, 2006, the advisors (excluding management and distribution fees, interest, taxes, brokerage fees and commissions) have contractually agreed to reimburse expenses of the Fund, to the extent that such expenses exceed the operating expenses of the series’ average net assets (the “expense caps”) until December 31, 2007 as listed in the chart below.
| | | |
Series | | Maximum Operating
Expense | |
Capital Growth | | 0.25 | % |
Growth and Income | | 0.15 | (2) |
Mid-Cap Growth | | 0.30 | (3) |
Money Market | | 0.25 | |
Multi-Sector Fixed Income | | 0.25 | |
Multi-Sector Short Term Bond | | 0.20 | |
Strategic Allocation | | 0.25 | |
Aberdeen International | | 0.30 | (2) |
Alger Small-Cap Growth | | 0.15 | |
Duff & Phelps Real Estate Securities | | 0.35 | |
S&P Aggressive Growth | | 0.05 | (1) |
S&P Growth | | 0.05 | (1) |
S&P Moderate Growth | | 0.05 | (1) |
S&P Moderate | | 0.05 | (1) |
Sanford Bernstein Mid-Cap Value | | 0.25 | |
Sanford Bernstein Small-Cap Value | | 0.25 | |
Van Kampen Comstock | | 0.25 | |
Van Kampen Equity 500 Index | | 0.15 | (3) |
(1) | The Advisor has contractually agreed to reimburse certain operating expenses for the series until December 31, 2007. |
(2) | For the period of January 1, 2006 through August 31, 2006, the maximum operating expense was 0.10% higher than the rate shown in the table above. |
(3) | For the period of January 1, 2006 through August 31, 2006, the maximum operating expense was 0.05% higher than the rate shown in the table above. |
Effective July 1, 2006, Phoenix Equity Planning Corporation (“PEPCO”), an indirect majority-owned subsidiary of PNX, serves as the Administrator to the Fund. PEPCO receives an administration fee at an annual rate of 0.09% of the first $5 billion, 0.08% on the next $10 billion, and 0.07% over $15 billion of the average net assets across all non-money market funds in the Phoenix Funds and The Phoenix Edge Series Fund. For the money market funds, the fee is 0.035% of the average net assets across all Phoenix money market funds within the Phoenix Funds Family.
Until June 30, 2006, PEPCO served as Financial Agent to the Fund. PEPCO received a financial agent fee equal to the sum of (1) the documented cost of fund accounting and related services provided by PFPC, Inc., as subagent, to Financial Agent, plus (2) the documented cost to Financial Agent to provide tax services and oversight of subagent’s performance. For the fiscal year (the “period”) ended December 31, 2006, the Fund incurred administration and/or financial agent fees totaling $1,770,841.
17
THE PHOENIX EDGE SERIES FUND
NOTES TO FINANCIAL STATEMENTS (Continued)
December 31, 2006
Pursuant to a Service Agreement, Phoenix Life Insurance Company (“PLIC”), a wholly-owned subsidiary of PNX, receives a service fee at the annual rate of 0.065% of the average daily net assets of each series for providing certain stock transfer and accounting services for each series. For the period ended December 31, 2006, the Fund paid PLIC $1,471,678.
PEPCO serves as the distributor to the Phoenix-S&P Series’ shares. For its services each Phoenix-S&P Series pays PEPCO distribution and/or service fees at an annual rate not to exceed 0.25% of the average daily net assets of each respective Phoenix-S&P Series.
At December 31, 2006, PLIC and its affiliates held shares in the Fund which aggregate the following:
| | | | | |
| | | Shares | | Aggregate
Net Asset
Value |
S&P Aggressive Growth | | 20,202 | | $ | 225,225 |
S&P Growth | | 20,240 | | | 219,950 |
S&P Moderate Growth | | 20,292 | | | 217,559 |
S&P Moderate | | 20,299 | | | 211,384 |
The Fund provides a deferred compensation plan for its disinterested trustees. Under the deferred compensation plan, disinterested trustees may elect to defer all or a portion of their compensation. Amounts deferred are retained by the Fund, and to the extent permitted by the 1940 Act, as amended, and then, in turn, may be invested in the shares of unaffiliated mutual funds selected by the disinterested trustees. Investments in such unaffiliated mutual funds are included in “Other” assets on the Statement of Assets and Liabilities at December 31, 2006. As of December 31, 2006, the aggregate value of such investments is $94,818.
Note 4—Purchases and Sales of Securities
Purchases and sales of securities (excluding U.S. Government and agency securities, short-term securities, futures contracts, and forward currency contracts) during the period ended December 31, 2006, were as follows:
| | | | | | |
| | | Purchases | | Sales |
Capital Growth | | $ | 746,995,027 | | $ | 825,295,178 |
Growth and Income | | | 54,033,637 | | | 60,760,751 |
Mid-Cap Growth | | | 43,654,012 | | | 55,651,832 |
Money Market | | | 9,499,631 | | | — |
Multi-Sector Fixed Income | | | 158,472,426 | | | 157,307,512 |
Multi-Sector Short Term Bond | | | 28,998,326 | | | 26,433,425 |
Strategic Allocation | | | 241,071,378 | | | 294,947,339 |
Aberdeen International | | | 143,442,336 | | | 139,074,948 |
Alger Small-Cap Growth | | | 48,796,569 | | | 53,094,985 |
Duff & Phelps Real Estate Securities | | | 48,651,373 | | | 45,414,389 |
S&P Aggressive Growth | | | 16,549,340 | | | 6,020,711 |
S&P Growth | | | 20,376,277 | | | 8,040,448 |
S&P Moderate Growth | | | 13,160,382 | | | 4,259,429 |
S&P Moderate | | | 5,139,737 | | | 1,384,919 |
Sanford Bernstein Mid-Cap Value | | | 65,523,084 | | | 67,140,452 |
Sanford Bernstein Small-Cap Value | | | 41,422,709 | | | 42,437,983 |
Van Kampen Comstock | | | 106,453,283 | | | 128,149,474 |
Van Kampen Equity 500 Index | | | 80,658,562 | | | 100,060,805 |
Purchases and sales of long-term U.S. Government and agency securities during the period ended December 31, 2006, were as follows:
| | | | | | |
| | | Purchases | | Sales |
Multi-Sector Fixed Income | | $ | 63,259,103 | | $ | 58,719,256 |
Multi-Sector Short Term Bond | | | 11,415,202 | | | 13,784,671 |
Strategic Allocation | | | 37,265,696 | | | 44,434,864 |
Note 5—Credit Risk and Asset Concentrations
In countries with limited or developing markets, investments may present greater risks than in more developed markets and the prices of such investments may be volatile. The consequences of political, social or economic changes in these markets may have disruptive effects on the market prices of these investments and the income they generate, as well as a series’ ability to repatriate such amounts.
Certain series may invest a high percentage of their assets in specific sectors of the market in their pursuit of a greater investment return. Fluctuations in these sectors of concentration may have a greater impact on a series, positive or negative, than if a series did not concentrate its investments in such sectors.
18
THE PHOENIX EDGE SERIES FUND
NOTES TO FINANCIAL STATEMENTS (Continued)
December 31, 2006
At December 31, 2006, the series held securities in specific sectors as detailed below:
| | | | | |
Series | | Sector | | Percentage of Total Net Assets | |
| Growth and Income | | Financials | | 25 | % |
| Mid-Cap Growth | | Information Technology | | 26 | |
| Sanford Bernstein Mid-Cap Value | | Financials | | 26 | |
| Sanford Bernstein Small-Cap Value | | Financials | | 27 | |
| Van Kampen Comstock | | Financials | | 27 | |
High yield/high risk securities typically entail greater price volatility and/or principal and interest rate risk. There is a greater chance that an issuer will not be able to make principal and interest payments on time. Analysis of the creditworthiness of issuers of high yield securities may be complex, and as a result, it may be more difficult for the advisors and/or subadvisors to accurately predict risk.
Note 6—Illiquid and Restricted Securities
Investments shall be considered illiquid if they cannot be disposed of in seven days in the ordinary course of business at the approximate amount at which such securities have been valued by the series. Additionally, the following information is also considered in determining illiquidity: the frequency of trades and quotes for the investment, whether the investment is listed for trading on a recognized domestic exchange and/or whether two or more brokers are willing to purchase or sell the security at a comparable price, the extent of market making activity in the investment and the nature of the market for investment. Illiquid securities are noted as such at the end of each series’ Schedule of Investments where applicable.
Restricted securities are illiquid securities, as defined above, not registered under the Securities Act of 1933. Generally, 144A securities are excluded from this category, except where defined as illiquid.
At December 31, 2006, the Fund held the following restricted securities:
| | | | | | | | | | | |
| | | Acquisition Date | | Acquisition Cost | | Market
Value | | % of Net Assets
at December 31, 2006 | |
Multi-Sector Fixed Income | | | | | | | | | | | |
Candescent Technologies Corp. Cv
144A 8%, 5/1/03 | | 3/6/00 | | $ | 40,000 | | $ | 0 | | 0 | % |
Strategic Allocation | | | | | | | | | | | |
ITW Cupids Financing Trust I
144A 6.55%, 12/31/11 | | 4/18/02 | | | 1,996,980 | | | 2,082,706 | | 0.7 | |
Alger Small-Cap Growth | | | | | | | | | | | |
Autobytel, Inc | | 6/20/03 | | | 20,288 | | | 13,150 | | 0 | |
Van Kampen Equity 500 Index | | | | | | | | | | | |
Seagate Technology Tax Refund Rights | | 11/22/00 | | | 0 | | | 0 | | 0 | |
Each series will bear any costs, including those involved in registration under the Securities Act of 1933, in connection with the disposition of such securities.
Note 7—Indemnifications
Under the series’ organizational documents, its trustees and officers are indemnified against certain liabilities arising out of the performance of their duties to the series. In addition, the series enter into contracts that contain a variety of indemnifications. The series’ maximum exposure under these arrangements is unknown. However, the Fund has not had prior claims or losses pursuant to these contracts and expects the risk of loss to be remote.
Note 8—Regulatory Exams
Federal and state regulatory authorities from time to time make inquiries and conduct examinations regarding compliance by The Phoenix Companies, Inc. and its subsidiaries (collectively “the Company”) with securities and other laws and regulations affecting their registered products. During 2004 and 2005, the Boston District Office of the Securities and Exchange Commission (“SEC”) conducted an examination of the Company’s investment company and investment adviser affiliates. Following the examination, the staff of the Boston District Office issued a deficiency letter noting perceived weaknesses in procedures for monitoring trading to prevent market timing activity prior to 2004. The staff requested the Company to conduct an analysis as to whether shareholders, policyholders and contract holders who invested in the funds that may have been affected by undetected market timing activity had suffered harm and to advise the staff whether the Company believes reimbursement is necessary or appropriate under the circumstances. Market timing is an investment technique involving frequent short-term trading of mutual fund shares that is designed to exploit market movements or inefficiencies in the way mutual fund companies price their shares. A third party was retained to assist the Company in preparing the analysis. In 2005, based on the third party analysis the Company notified the staff at the SEC Boston District Office that reimbursements were not appropriate under the circumstances. The Company does not believe that the outcome of this matter will be material to these financial statements.
19
THE PHOENIX EDGE SERIES FUND
NOTES TO FINANCIAL STATEMENTS (Continued)
December 31, 2006
Note 9—Federal Income Tax Information
The following series have capital loss carryovers which may be used to offset future capital gains.
| | | | | | | | | | | | | | | | | | | | | | | | | | | |
| | | Expiration Year |
| | | 2007 | | 2008 | | 2009 | | 2010 | | 2011 | | 2012 | | 2013 | | 2014 | | Total |
Capital Growth | | | — | | | — | | $ | 211,269,784 | | $ | 84,341,763 | | $ | 5,973,373 | | $ | 2,820,243 | | | — | | | — | | $ | 304,405,163 |
Growth and Income | | | — | | | — | | | — | | | 1,919,085 | | | 5,418,582 | | | — | | | — | | | — | | | 7,337,667 |
Mid-Cap Growth | | | — | | $ | 60,050,708 | | | 39,729,684 | | | 16,035,347 | | | | | | | | $ | 980,825 | | | — | | | 116,796,564 |
Multi-Sector Fixed Income | | $ | 135,565 | | | 6,659,630 | | | 4,980,791 | | | 7,850,329 | | | — | | | — | | | — | | | — | | | 19,626,315 |
Multi-Sector Short
Term Bond | | | | | | | | | | | | | | | 18,992 | | | 171,793 | | | 158,707 | | $ | 167,631 | | | 517,123 |
Strategic Allocation | | | — | | | — | | | — | | | — | | | — | | | — | | | — | | | — | | | — |
Aberdeen International | | | — | | | — | | | — | | | — | | | 7,445,260 | | | — | | | — | | | — | | | 7,445,260 |
Alger Small-Cap Growth | | | — | | | — | | | — | | | — | | | — | | | — | | | — | | | — | | | — |
Duff & Phelps Real
Estate Securities | | | — | | | — | | | — | | | — | | | — | | | — | | | — | | | — | | | — |
S&P Aggressive Growth | | | — | | | — | | | — | | | — | | | — | | | — | | | — | | | 9,598 | | | 9,598 |
S&P Growth | | | — | | | — | | | — | | | — | | | — | | | — | | | — | | | 24,010 | | | 24,010 |
S&P Moderate Growth | | | — | | | — | | | — | | | — | | | — | | | — | | | — | | | — | | | — |
S&P Moderate | | | — | | | — | | | — | | | — | | | — | | | — | | | — | | | 2,051 | | | 2,051 |
Sanford Bernstein
Mid-Cap Value | | | — | | | — | | | — | | | — | | | — | | | — | | | — | | | — | | | — |
Sanford Bernstein
Small-Cap Value | | | — | | | — | | | — | | | — | | | — | | | — | | | — | | | — | | | — |
Van Kampen Comstock | | | — | | | — | | | — | | | — | | | — | | | — | | | — | | | — | | | — |
Van Kampen Equity
500 Index | | | — | | | — | | | — | | | 9,710,619 | | | 8,593,478 | | | 574,626 | | | 1,188,323 | | | | | | 20,067,046 |
Included in the Capital Growth amounts are $6,011,292 and $32,228,924, respectively, which were acquired in connection with the mergers of the Engemann Nifty Fifty Series on April 5, 2002 and AIM Growth, on October 27, 2006.
Included in the Growth and Income amounts are $6,488 and $303,453, respectively, which were acquired in connection with the mergers of the MFS Investors Trust Series and Alliance/Bernstein Growth & Value Series on September 17, 2004.
Included in the Mid-Cap Growth amounts are $88,351,165, which were acquired in connection with the merger of the Strategic Theme Series on October 27, 2006.
Included in the Van Kampen Equity 500 Index amounts are $729,773 and $2,722,300, respectively, which were acquired in connection with the mergers of the Northern Dow 30 Series and Northern Nasdaq-100 Index Series on October 27, 2006.
A series may not realize the benefit of these losses to the extent it does not realize gains on investments prior to the expiration of the capital loss carryovers.
The following series utilized losses deferred in prior years against current year capital gains as follows:
| | | |
Capital Growth | | $ | 51,382,377 |
Growth and Income | | | 3,452,935 |
Mid-Cap Growth | | | 476,342 |
Multi-Sector Fixed Income | | | 842,036 |
Aberdeen International | | | 28,715,906 |
Alger Small-Cap Growth | | | 2,253,947 |
Van Kampen Comstock | | | 1,311,866 |
Van Kampen Equity 500 Index | | | 9,044,207 |
Under current tax law, foreign currency and capital losses realized after October 31 may be deferred and treated as occurring on the first day of the following tax year. For the period ended December 31, 2006, the following series deferred and/or recognized post October losses as follows:
| | | | | | | | | | | | |
Series | | Capital
Deferred | | Capital
Recognized | | Currency
Deferred | | Currency
Recognized |
Mid-Cap Growth | | $ | 17,508 | | | — | | | — | | | — |
Multi-Sector Fixed Income | | | — | | $ | 185,847 | | $ | 111,258 | | $ | 289,184 |
Multi-Sector Short Term Bond | | | 5,333 | | | 44,414 | | | — | | | 101,921 |
Strategic Allocation | | | — | | | — | | | 17,426 | | | 114,841 |
Aberdeen International | | | — | | | — | | | 6,685 | | | 36,915 |
Alger Small-Cap Growth | | | — | | | 258,832 | | | — | | | — |
20
THE PHOENIX EDGE SERIES FUND
NOTES TO FINANCIAL STATEMENTS (Continued)
December 31, 2006
The components of distributable earnings on a tax basis, (excluding unrealized appreciation (depreciation), which are disclosed in the respective schedule of investments), consist of undistributed ordinary income and undistributed long-term capital gains as follows:
| | | | | | |
| | | Undistributed
Ordinary
Income | | Undistributed
Long-Term
Capital Gains |
Capital Growth | | $ | 226,129 | | | — |
Growth and Income | | | 47,025 | | | — |
Mid-Cap Growth | | | — | | | — |
Money Market | | | 3,905 | | | — |
Multi-Sector Fixed Income | | | 888,333 | | | — |
Multi-Sector Short Term Bond | | | 197,594 | | | — |
Strategic Allocation | | | 2,517,264 | | $ | 2,096,985 |
Aberdeen International | | | 1,415,002 | | | — |
Alger Small-Cap Growth | | | — | | | 5,379,439 |
Duff & Phelps Real Estate Securities | | | 1,098,195 | | | 2,651,325 |
S&P Aggressive Growth | | | 219 | | | — |
S&P Growth | | | — | | | — |
S&P Moderate Growth | | | 4,272 | | | — |
S&P Moderate | | | — | | | — |
Sanford Bernstein Mid-Cap Value | | | 1,202,756 | | | 2,362,818 |
Sanford Bernstein Small-Cap Value | | | 431,386 | | | 1,119,425 |
Van Kampen Comstock | | | 527,634 | | | 776,472 |
Van Kampen Equity 500 Index | | | 116,061 | | | — |
The differences between the book and tax basis components of distributable earnings relate principally to the timing of recognition of income and gains for federal tax purposes. Short-term gains distributions reported in the Statements of Changes in Net Assets, if any, are reported as ordinary income for federal tax purposes.
Note 10—Reclassification of Capital Accounts
For financial reporting purposes, book basis capital accounts are adjusted to reflect the tax character of permanent book/tax differences. Permanent reclassifications can arise from differing treatment of certain income and gain transactions, nondeductible current year net operating losses, expiring capital loss carryovers and investments in passive foreign investment companies. The reclassifications have no impact on the net assets or net asset values of the Funds. As of December 31, 2006, the following series recorded reclassifications to increase (decrease) the accounts listed below:
| | | | | | | | | | | | |
| | | Undistributed
Net Investment
Income (Loss) | | | Accumulated
Net Realized
Gain (Loss) | | | Capital Paid In
on Shares of
Beneficial Interest | |
Capital Growth | | $ | 10,767 | | | $ | (48,073,565 | ) | | $ | 48,062,798 | |
Growth and Income | | | — | | | | (14,552 | ) | | | 14,552 | |
Mid-Cap Growth | | | 381,970 | | | | (88,885,591 | ) | | | 88,503,621 | |
Multi-Sector Fixed Income | | | (552,141 | ) | | | 552,140 | | | | 1 | |
Multi-Sector Short Term Bond | | | (61,757 | ) | | | 61,757 | | | | — | |
Strategic Allocation | | | (148,980 | ) | | | 148,799 | | | | 181 | |
Aberdeen International | | | (201,436 | ) | | | 94,589 | | | | 106,847 | |
Alger Small-Cap Growth | | | 184,892 | | | | (2,583,614 | ) | | | 2,398,722 | |
Duff & Phelps Real Estate Securities | | | — | | | | — | | | | — | |
S&P Aggressive Growth | | | — | | | | — | | | | — | |
S&P Growth | | | 1,387 | | | | — | | | | (1,387 | ) |
S&P Moderate Growth | | | — | | | | — | | | | — | |
S&P Moderate | | | 853 | | | | — | | | | (853 | ) |
Sanford Bernstein Mid-Cap Value | | | 3,555 | | | | — | | | | (3,555 | ) |
Sanford Bernstein Small-Cap Value | | | 11,688 | | | | (11,689 | ) | | | 1 | |
Van Kampen Comstock | | | — | | | | 1 | | | | (1 | ) |
Van Kampen Equity 500 Index | | | — | | | | (8,497,172 | ) | | | 8,497,172 | |
Note 11—Manager of Managers
The Fund and PVA have received an exemptive order from the Securities and Exchange Commission (“SEC”) granting exemptions from certain provisions of the Investment Company Act of 1940, as amended, pursuant to which PVA will, subject to supervision and approval of the Fund’s Board of Trustees, be permitted to enter into and materially amend subadvisory agreements without such agreements being approved by the shareholders of the applicable series of the Fund. The Fund and PVA will therefore have the right to hire, terminate, or replace subadvisors without shareholder approval, including, without limitation, the replacement or reinstatement of any subadvisor with respect to which a subadvisory agreement has automatically terminated as a result of an assignment. PVA will continue to have the ultimate responsibility to oversee the subadvisors and recommend their hiring, termination and replacement.
21
THE PHOENIX EDGE SERIES FUND
NOTES TO FINANCIAL STATEMENTS (Continued)
December 31, 2006
Note 12—Mixed and Shared Funding
Shares of the Fund are not directly offered to the public. Shares of the Fund are currently offered through separate accounts to fund variable accumulation annuity contracts and variable universal life insurance policies issued by Phoenix Life Insurance Company, PHL Variable Insurance Company, and Phoenix Life and Annuity Company. Shares of the Fund may be offered to separate accounts of other insurance companies in the future.
The interests of variable annuity contract owners and variable life policy owners could diverge based on differences in federal and state regulatory requirements, tax laws, investment management or other unanticipated developments. The Fund’s Trustees do not foresee any such differences or disadvantages at this time. However, the Fund’s Trustees intend to monitor for any material conflicts and will determine what action, if any, should be taken in response to such conflicts. If such a conflict should occur, one or more separate accounts may be required to withdraw its investment in the Fund or shares of another fund may be substituted.
Note 13—Mergers
On October 20, 2006, the Growth and Income Series acquired all of the net assets of the Phoenix-Kayne Rising Dividends Series (“Kayne Rising Dividends”) pursuant to an Agreement and Plan of Reorganization approved by the Kayne Rising Dividends shareholders on October 5, 2006. The acquisition was accomplished by a tax-free exchange of 835,783 shares of Growth and Income outstanding on October 20, 2006 and valued at $11,722,358 for 1,002,388 shares of Kayne Rising Dividends outstanding on October 20, 2006. Kayne Rising Dividend’s net assets of $11,722,358, including $1,654,538 of net unrealized appreciation were combined with those of Growth and Income. The aggregate net assets of Growth and Income immediately after the merger were $163,685,403. The shareholders of Kayne Rising Dividends received for each share owned approximately 0.83 shares of Growth and Income.
On October 20, 2006, the Aberdeen International Series acquired all of the net assets of the Phoenix-Lazard International Equity Select Series (“Lazard International Equity Select”) pursuant to an Agreement and Plan of Reorganization approved by the Lazard International Equity Select shareholders on October 5, 2006. The acquisition was accomplished by a tax-free exchange of 10,426,631 shares of Aberdeen International outstanding on October 20, 2006 and valued at $175,009,666 for 10,514,476 shares of Lazard International Equity Select outstanding on October 20, 2006. Lazard International Equity Select’s net assets of $175,009,666, including $33,022,037 of net unrealized appreciation were combined with those of Aberdeen International. The aggregate net assets of Aberdeen International immediately after the merger were $389,209,267. The shareholders of Lazard International Equity Select received for each share owned approximately 0.99 shares of Aberdeen International.
On October 27, 2006, the Capital Growth Series acquired all of the net assets of the Phoenix-AIM Growth Series (“AIM Growth”) pursuant to an Agreement and Plan of Reorganization approved by the AIM Growth shareholders on October 5, 2006. The acquisition was accomplished by a tax-free exchange of 3,996,273 shares of Capital Growth outstanding on October 27, 2006 and valued at $61,016,844 for 8,399,603 shares of AIM Growth outstanding on October 27, 2006. AIM Growth’s net assets of $61,016,844, including $8,256,215 of net unrealized appreciation were combined with those of Capital Growth. The aggregate net assets of Capital Growth immediately after the merger were $452,685,507. The shareholders of AIM Growth received for each share owned approximately 0.48 shares of Capital Growth.
On October 27, 2006, the Mid-Cap Growth Series acquired all of the net assets of the Phoenix Strategic Theme Series (“Strategic Theme”) pursuant to an Agreement and Plan of Reorganization approved by the Strategic Theme shareholders on October 5, 2006. The acquisition was accomplished by a tax-free exchange of 3,950,319 shares of Mid-Cap Growth outstanding on October 27, 2006 and valued at $53,113,639 for 4,883,118 shares of Strategic Theme outstanding on October 27, 2006. Strategic Theme’s net assets of $53,113,639, including $7,454,914 of net unrealized appreciation were combined with those of Mid-Cap Growth. The aggregate net assets of Mid-Cap Growth immediately after the merger were $98,521,888. The shareholders of Strategic Theme received for each share owned approximately 0.81 shares of Mid-Cap Growth.
On October 27, 2006, the Alger Small-Cap Growth Series acquired all of the net assets of the Phoenix-Engemann Small-Cap Growth Series (“Engemann Small-Cap Growth”) and the Phoenix-Kayne Small-Cap Quality Value Series (“Kayne Small-Cap Quality Value”) pursuant to Agreements and Plans of Reorganization approved by the Engemann Small-Cap Growth and Kayne Small-Cap Quality Value shareholders on October 26, 2006. The acquisition was accomplished by a tax-free exchange of 1,912,431 shares of Alger Small-Cap Growth outstanding on October 27, 2006 and valued at $34,546,959 for 2,108,424 shares of Engemann Small-Cap Growth valued at $16,831,325 and 1,054,130 shares of Kayne Small-Cap Quality Value valued at $17,715,634. Engemann Small-Cap Growth’s net assets of $16,831,325, including $4,238,547 of net unrealized appreciation and Kayne Small-Cap Quality Value’s net assets of $17,715,634, including $4,213,331 of net unrealized appreciation were combined with those of Alger Small-Cap Growth. The aggregate net assets of Alger Small-Cap Growth immediately after the merger were $59,092,472. The shareholders of Engemann Small-Cap Growth received for each share owned approximately 0.44 shares of Alger Small-Cap Growth. The shareholders of Kayne Small-Cap Quality Value received for each share owned approximately 0.93 shares of Alger Small-Cap Growth.
On October 27, 2006, the Van Kampen Equity 500 Index Series acquired all of the net assets of the Phoenix-Northern Dow 30 Series (“Northern Dow 30”) and the Phoenix-Northern Nasdaq-100 Index® Series (“Northern Nasdaq-100 Index®”) pursuant to Agreements and Plans of Reorganization approved by the Northern Dow 30 and Northern Nasdaq-100 Index® shareholders on October 26, 2006. The acquisition was accomplished by a tax-free exchange of 3,550,335 shares of Van Kampen Equity 500 Index outstanding on October 27, 2006 and valued at $44,067,409 for 2,100,979 shares of Northern Dow 30 valued at $21,817,938 and 4,901,410 shares of Northern Nasdaq-100 Index® valued at $22,249,471. Northern Dow 30’s net assets of $21,817,938, including $4,937,365 of net unrealized appreciation and Northern Nasdaq-100 Index®’s net assets of $22,249,471, including $5,784,158 of net unrealized
22
THE PHOENIX EDGE SERIES FUND
NOTES TO FINANCIAL STATEMENTS (Continued)
December 31, 2006
appreciation were combined with those of Van Kampen Equity 500 Index. The aggregate net assets of Van Kampen Equity 500 Index immediately after the merger were $145,082,755. The shareholders of Northern Dow 30 received for each share owned approximately 0.84 shares of Van Kampen Equity 500 Index. The shareholders of Northern Nasdaq-100 Index® received for each share owned approximately 0.37 shares of Van Kampen Equity 500 Index.
Note 14—Exemptive Order
On June 5, 2006, the SEC issued an order under Section 12(d)(1)(J) of the Investment Company Act (“1940 Act”) granting an exemption from Sections 12(d)(1)(A) and (B) of the 1940 Act and under Sections 6(c) and 17(b) of the 1940 Act granting an exemption from Section 17(a) of the 1940 Act, which permits the Phoenix—S&P Series to invest in other affiliated and unaffiliated funds, including exchange traded funds. Before the order was granted, the Series could invest in affiliated funds only or exchange traded funds only, but not in unaffiliated funds or a combination of affiliated funds, exchange traded funds, and unaffiliated funds.
Note 15—Other
The insurance company affiliates of the Fund distribute the Fund as investment options in variable annuity and life insurance products (“Variable Products”) through non-affiliated advisors, broker-dealers and other financial intermediaries. There is substantial competition for business within most of these distributors. One of the largest distributors of the Variable Products (and the Fund) includes a subsidiary of State Farm Mutual Automobile Company, or State Farm. In 2006, State Farm accounted for approximately 29% of new life insurance and annuity sales, including the sales of Variable Products, based on first year commissions. The insurance company affiliates of the Fund have had distribution arrangements with State Farm since 2001. In 2007, the agreement with State Farm to provide life and annuity products and related services to State Farm’s affluent and high-net-worth customers through qualified State Farm agents was extended until 2016.
Tax Information Notice (Unaudited)
For the fiscal year ended December 31, 2006, the series designated long-term capital gains dividends as follows:
| | | |
Strategic Allocation | | $ | 27,937,023 |
Alger Small-Cap Growth | | | 5,385,639 |
Duff & Phelps Real Estate Securities | | | 12,278,837 |
Sanford Bernstein Mid-Cap Value | | | 13,794,301 |
Sanford Bernstein Small-Cap Value | | | 10,346,981 |
Van Kampen Comstock | | | 14,470,075 |
23
REPORT OF INDEPENDENT REGISTERED PUBLIC ACCOUNTING FIRM

To the Board of Trustees and Shareholders of
The Phoenix Edge Series Fund
In our opinion, the accompanying statements of assets and liabilities, including the schedules of investments, and the related statements of operations and of changes in net assets and the financial highlights present fairly, in all material respects, the financial position of each of the 18 series (constituting The Phoenix Edge Series Fund, hereafter referred to as the “Fund”) at December 31, 2006 and the results of their operations, the changes in their net assets and their financial highlights for each of the periods indicated, in conformity with accounting principles generally accepted in the United States of America. These financial statements and financial highlights (hereafter referred to as “financial statements”) are the responsibility of the Fund’s management; our responsibility is to express an opinion on these financial statements based on our audits. We conducted our audits of these financial statements in accordance with the standards of the Public Company Accounting Oversight Board (United States). Those standards require that we plan and perform the audit to obtain reasonable assurance about whether the financial statements are free of material misstatement. An audit includes examining, on a test basis, evidence supporting the amounts and disclosures in the financial statements, assessing the accounting principles used and significant estimates made by management, and evaluating the overall financial statement presentation. We believe that our audits, which included confirmation of securities at December 31, 2006 by correspondence with the custodian and brokers, provide a reasonable basis for our opinion.

Boston, Massachusetts
February 20, 2007
24
THE PHOENIX EDGE SERIES FUND
BOARD OF TRUSTEES’ CONSIDERATION OF INVESTMENT ADVISORY AND SUBADVISORY AGREEMENTS FOR
PHOENIX CAPITAL GROWTH SERIES (the “Series”)
(Unaudited)
The Board of Trustees is responsible for determining whether to approve the Fund’s advisory agreements. At a meeting held on November 13, 2006, the Board, including a majority of disinterested Trustees, approved the investment advisory agreement (the “Advisory Agreement”) between Phoenix Investment Counsel, Inc. (“PIC”) and the Fund and the investment subadvisory agreement (the “Subadvisory Agreement”) between PIC and Harris Investment Management, Inc. (the “Subadvisor”). Pursuant to the Advisory Agreement between PIC and the Fund, PIC provides advisory services to the Series. Pursuant to the Subadvisory Agreement between PIC and the Subadvisor, the Subadvisor provides the day to day investment management for the Series.
During the review process, the Board received assistance and advice from, and met separately with, independent legal counsel. In approving each agreement, the Board, including a majority of disinterested Trustees, determined that the fee structure was fair and reasonable and that approval of the agreements was in the best interests of the Series and its shareholders. While attention was given to all information furnished, the following discusses the primary factors relevant to the Board’s decision.
ADVISORY AGREEMENT CONSIDERATIONS
Nature, Extent and Quality of Services. The Board concluded that the nature, extent and quality of the overall services provided by PIC and its affiliates to the Series and its shareholders are reasonable. The Board’s conclusion was based, in part, upon services provided to the Series such as quarterly reports provided by PIC 1) comparing the performance of the Series with a peer group and benchmark, 2) showing that the investment policies and restrictions for the Series were followed and 3) covering matters such as the compliance of investment personnel and other access persons with the Code of Ethics of PIC and the Series, the adherence to fair value pricing procedures established by the Board, the monitoring of portfolio compliance, information on illiquid securities and derivatives, brokerage commissions and presentations regarding the economic environment and general investment outlook. The Board noted that PIC was responsible for the general oversight of the investment programs of the Series and the monitoring of the Subadvisor’s investment performance and its compliance with applicable laws, regulations, policies and procedures. In this regard, the Board considered the detailed performance review process of the Investment Performance Committee. With respect to compliance monitoring, the Board noted that PIC required quarterly compliance certifications from the Subadvisor and conducted compliance due diligence visits at the Subadvisor. The Board also considered the experience of PIC having acted as an investment adviser to mutual funds for over 70 years, its current experience in acting as an investment adviser to over 60 mutual funds and several institutional clients, and its role under the Fund’s “manager of managers” exemptive relief under the Investment Company Act of 1940, as amended. The Board also considered the transfer agent and shareholder services that are provided to Series shareholders by an affiliate of PIC, noting continuing improvements by management in the scope and quality of services and favorable reports on such service conducted by third parties.
Investment Performance. The Board placed emphasis on the investment performance of the Series in view of its importance to shareholders. While consideration was given to performance reports and discussions at Board meetings throughout the year, particular attention in assessing such performance was given to a report for the Series prepared by Lipper Financial Services (“Lipper”), which was furnished for the contract renewal process. The Lipper report showed the investment performance of the Series’ shares for the 1, 3, 5 and 10 year periods ended September 30, 2006, and the year-to-date period ended September 30, 2006. The Board reviewed the investment performance of the Series, along with comparative performance information given for a peer group of funds and a relevant market index. The Board noted that the Series performed below the index for the 1, 3 and 10 year and year-to-date periods. The Series had been slightly above the index for the 5 year period. The Board noted that the Subadvisor was hired in June 2006, and has asked PIC to monitor the changes in the portfolio closely.
Profitability. The Board also considered the level of profits realized by PIC and its affiliates in connection with the operation of the Series. In this regard, the Board reviewed the Series profitability analysis that addressed the overall profitability of PIC for its management of The Phoenix Edge Series Fund family, as well as its profits and that of its affiliates, for managing the Series. Specific attention was given to the methodology followed in allocating costs to the Series since allocation methodologies are inherently subjective and various allocation methodologies may each be reasonable while producing different results. In this regard, the Board noted that the allocation appeared reasonable. The Board concluded that the profitability to PIC from the Series was reasonable.
Management Fee and Total Expenses. The Board also placed emphasis on the review of Series expenses. Consideration was given to the comparative analysis of the management fees and total expense ratios of the Series compared with those of a group of funds selected by Lipper as its appropriate Lipper expense peer group. The Board noted that the total expenses of the Series were higher than the average total expenses for comparable funds; however the contractual management fee was slightly below the median for the peer group. The Board was satisfied with the management fee and total expenses of the Series in comparison to its peer group as shown in the Lipper report and concluded that such fee and expenses were reasonable.
Economies of Scale. The Board noted that the management fee included breakpoints based on the amount of assets under management. The Board noted that it was likely that PIC and the Series would achieve certain economies of scale as the assets grew in order to cover certain fixed costs. The Board concluded that shareholders would have an opportunity to benefit from these economies of scale.
25
THE PHOENIX EDGE SERIES FUND
BOARD OF TRUSTEES’ CONSIDERATION OF INVESTMENT ADVISORY AND SUBADVISORY AGREEMENTS FOR
PHOENIX CAPITAL GROWTH SERIES (the “Series”) (Continued)
(Unaudited)
SUBADVISORY AGREEMENT CONSIDERATIONS
Nature, Extent and Quality of Services. The Board concluded that the nature, extent and quality of the overall services that are to be provided by the Subadvisor to the Series and its shareholders were reasonable. In addition, they received from Subadvisor and reviewed substantial written information as requested. In the course of their deliberations and evaluation of materials, the Trustees considered, among other things the following factors: the Subadvisor, its current personnel (including particularly those personnel with responsibilities for providing investment and compliance services to the Series), and its financial condition, resources and investment process; the terms of the subadvisory agreement, including the standard of care and termination provisions; the scope and quality of the services that Subadvisor would provide to the Series; the structure and rate of advisory fees payable to Subadvisor by PIC, the methodology used by Subadvisor in determining the compensation payable to portfolio managers and the competition for investment management talent; and the Subadvisor’s compliance record. The Board’s opinion was based upon the extensive experience of the Subadvisor and the portfolio managers. With respect to portfolio manager compensation, the Board noted that a primary factor in the Subadvisor’s determination of the amount of bonus compensation to portfolio managers was the relative investment performance of the funds that they managed which would align their interests with those of the Series’ shareholders. The Board also considered the adequacy of the Subadvisor’s compliance program, based on the information provided by the Subadvisor.
Investment Performance. The Board placed emphasis on the investment performance of the Series in view of its importance to shareholder. While consideration was given to performance reports and discussions at Board meetings throughout the year, particular attention in assessing such performance was given to a report for the Series prepared by Lipper Financial Services (“Lipper”), which was furnished for the contract renewal process. The Lipper report showed the investment performance of the Series’ shares for the 1, 3, 5 and 10 year periods ended September 30, 2006 and the year-to-date period ended September 30, 2006. The Board reviewed the investment performance of the Series, along with comparative performance information given for a peer group of funds and a relevant market index. The Board noted that the Series had performed below the index for the 1, 3 and 10 year period, and year-to-date periods. The Series had performed above the index for the 5 year period. The Board noted that the Subadvisor was hired in June 2006.
Profitability. The Board noted that the subadvisory fee is paid by PIC and not by the Series.
Subadvisory Fee. The Board did not consider comparative fee information of subadvisory fees but noted that the subadvisory fee is paid by PIC and not by the Series.
Economies of Scale. The Board also considered the existence of any economies of scale and whether those economies would be passed along to the Series’ shareholders but noted that any economies would most likely be generated at the advisor level and not necessarily at the subadvisor level.
26
THE PHOENIX EDGE SERIES FUND
BOARD OF TRUSTEES’ CONSIDERATION OF INVESTMENT ADVISORY AGREEMENT FOR
PHOENIX GROWTH AND INCOME SERIES (previously known as
Phoenix-Engemann Growth and Income Series) (the “Series”)
(Unaudited)
The Board of Trustees is responsible for determining whether to approve the Fund’s investment advisory agreements. At a meeting held on November 13, 2006, the Board, including a majority of disinterested Trustees, approved the investment advisory agreement (the “Advisory Agreement”) between Phoenix Investment Counsel, Inc. (“PIC”) and the Fund. Pursuant to the Advisory Agreement between PIC and the Fund, PIC provides advisory services to the Series.
During the review process, the Board received assistance and advice from, and met separately with, independent legal counsel. In approving the Advisory Agreement, the Board, including a majority of disinterested Trustees, determined that the fee structure was fair and reasonable and that approval of the Advisory Agreement was in the best interests of the Series and its shareholders. While attention was given to all information furnished, the following discusses the primary factors relevant to the Board’s decision.
ADVISORY AGREEMENT CONSIDERATIONS
Nature, Extent and Quality of Services. The Board concluded that the nature, extent and quality of the overall services provided by PIC and its affiliates to the Series and its shareholders are reasonable. The Board’s conclusion was based, in part, upon services provided to the Series such as quarterly reports provided by PIC and its affiliates 1) comparing the performance of the Series with a peer group and benchmark, 2) showing that the investment policies and restrictions for the Series were followed and 3) covering matters such as the compliance of investment personnel and other access persons with the Code of Ethics of both PIC and the Series, the adherence to fair value pricing procedures established by the Board, the monitoring of portfolio compliance, information on illiquid securities and derivatives, brokerage commissions and presentations regarding the economic environment and general investment outlook. The Board also considered the experience of PIC as an investment advisor and the experience of the PIC portfolio managers that manage the Series. With respect to portfolio manager compensation, the Board noted that a primary factor in PIC’s determination of the amount of bonus compensation to portfolio managers was the relative investment performance of the funds that they managed, which aligned their interests with those of the Series’ shareholders. The Board also considered and was satisfied with the adequacy of PIC’s compliance program. The Board also considered the transfer agent and shareholder services that are provided to Series shareholders by an affiliate of PIC, noting continuing improvements by management in the scope and quality of services and favorable reports on such service conducted by third parties.
Investment Performance. The Board placed emphasis on the investment performance of the Series in view of its importance to shareholders. While consideration was given to performance reports and discussions at Board meetings throughout the year, particular attention in assessing such performance was given to a report for the Series prepared by Lipper Financial Services (“Lipper”), which was furnished for the contract renewal process. Due to an internal reorganization, PIC replaced Engemann Asset Management as advisor to the Series effective October 26, 2006. The Lipper report showed the investment performance of the Series’ shares for the 1, 3 and 5 year periods ended September 30, 2006 and the year-to-date period ended September 30, 2006. The Board reviewed the investment performance of the Series, along with comparative performance information given for a peer group of funds and a relevant market index. The Board noted and was satisfied that the Series had performed above the index for the 1 and 3 and year-to-date periods. The Board noted that the Series performed slightly below its benchmark for the 5 year period.
Profitability. The Board also considered the level of profits realized by PIC and its affiliates in connection with the operation of the Series. In this regard, the Board reviewed the Series profitability analysis that addressed the overall profitability of PIC for its management of The Phoenix Edge Series Fund family, as well as its profits and that of its affiliates, for managing the Series. Specific attention was given to the methodology followed in allocating costs to the Series, since allocation methodologies are inherently subjective and various allocation methodologies may each be reasonable while producing different results. In this regard, the Board noted that the allocation appeared reasonable. The Board also noted the contractual reimbursements provided to the Series. The Board concluded that the profitability to PIC from the Series was reasonable.
Management Fee and Total Expenses. The Board also placed emphasis on the review of Series expenses. Consideration was given to a comparative analysis of the management fees and total expense ratios of the Series compared with those of a group of funds selected by Lipper as the Series’ appropriate Lipper expense peer group. The Board noted that the total expenses of the Series were higher than the average total expenses for comparable funds and that the contractual management fee was slightly higher than the median for the peer group. Due to the size of the Series, the Board was satisfied with the management fee and total expenses of the Series in comparison to its expense peer group as shown in the Lipper report and concluded that such fee and expenses were reasonable.
Economies of Scale. The Board noted that the management fee included breakpoints based on the amount of assets under management. The Board also noted that it was likely that PIC and the Series would achieve certain economies of scale as the assets grew in order to cover certain fixed costs. The Board concluded that shareholders would have an opportunity to benefit from these economies of scale.
27
THE PHOENIX EDGE SERIES FUND
BOARD OF TRUSTEES’ CONSIDERATION OF INVESTMENT ADVISORY AND SUBADVISORY AGREEMENTS FOR PHOENIX MID-CAP GROWTH SERIES (the “Series”)
(Unaudited)
The Board of Trustees is responsible for determining whether to approve the Fund’s advisory agreements. At a meeting held on November 13, 2006, the Board, including a majority of disinterested Trustees, approved the investment advisory agreement (the “Advisory Agreement”) between Phoenix Variable Advisors, Inc. (“PVA”) and the Fund and the investment subadvisory agreement (the “Subadvisory Agreement”) between PVA and Bennett Lawrence Management LLC (the “Subadvisor”). Pursuant to the Advisory Agreement between PVA and the Fund, PVA provides advisory services to the Series. Pursuant to the Subadvisory Agreement between PVA and the Subadvisor, the Subadvisor provides the day to day investment management for the Series.
During the review process, the Board received assistance and advice from, and met separately with, independent legal counsel. In approving each agreement, the Board, including a majority of disinterested Trustees, determined that the fee structure was fair and reasonable and that approval of each agreement was in the best interests of the Series and its shareholders. While attention was given to all information furnished, the following discusses the primary factors relevant to the Board’s decision.
ADVISORY AGREEMENT CONSIDERATIONS
Nature, Extent and Quality of Services. The Board concluded that the nature, extent and quality of the overall services provided by PVA and its affiliates to the Series and its shareholders are reasonable. The Board’s conclusion was based, in part, upon services provided to the Series such as quarterly reports provided by PVA 1) comparing the performance of the Series with a peer group and benchmark, 2) showing that the investment policies and restrictions for the Series were followed and 3) covering matters such as the compliance of investment personnel and other access persons with the Code of Ethics of PVA and the Series, the adherence to fair value pricing procedures established by the Board, the monitoring of portfolio compliance, information on illiquid securities and derivatives, brokerage commissions and presentations regarding the economic environment and general investment outlook. The Board noted that PVA was responsible for the general oversight of the investment programs of the Series and the monitoring of the Subadvisor’s investment performance and its compliance with applicable laws, regulations, policies and procedures. In this regard, the Board considered the detailed performance review process of the Investment Performance Committee. With respect to compliance monitoring, the Board noted that PVA required quarterly compliance certifications from the Subadvisor and conducted compliance due diligence visits at the Subadvisor. The Board also considered the experience of PVA having acted as an investment adviser to mutual funds for 7 years, its current experience in acting as an investment adviser to 12 mutual funds, and its role under the Fund’s “manager of managers” exemptive relief under the Investment Company Act of 1940, as amended. The Board also considered the transfer agent and shareholder services that are provided to Series shareholders by an affiliate of PVA, noting continuing improvements by management in the scope and quality of services and favorable reports on such service conducted by third parties.
Investment Performance. The Board placed emphasis on the investment performance of the Series in view of its importance to shareholders. While consideration was given to performance reports and discussions at Board meetings throughout the year, particular attention in assessing such performance was given to a report for the Series prepared by Lipper Financial Services (“Lipper”), which was furnished for the contract renewal process. The Lipper report showed the investment performance of the Series’ shares for the 1, 3 and 5 year periods ended September 30, 2006 and the year-to-date period ended September 30, 2006. The Board reviewed the investment performance of the Series, along with comparative performance information given for a peer group of funds and a relevant market index. The Board noted that the Series underperformed the index for all periods. The Board also noted that the current Subadvisor has only been providing investment management for the Series since the third quarter of 2005 and performance has been improving since that time.
Profitability. The Board also considered the level of profits realized by PVA and its affiliates in connection with the operation of the Series. In this regard, the Board reviewed the Series profitability analysis that addressed the overall profitably of PVA for its management of The Phoenix Edge Series Fund family, as well as its profits and that of its affiliates, for managing the Series. Specific attention was given to the methodology followed in allocating costs to the Series, since allocation methodologies are inherently subjective and various allocation methodologies may each be reasonable while producing different results. In this regard, the Board noted that the allocation appeared reasonable. The Board also noted the voluntary reimbursements provided to the Series. The Board concluded that the profitability to PVA from the Fund was reasonable.
Management Fee and Total Expenses. The Board also placed emphasis on the review of Series expenses. Consideration was given to a comparative analysis of the management fees and total expense ratios of the Series compared with those of a group of funds selected by Lipper as the Series’ appropriate Lipper expense peer group. The Board noted that the total expenses of the Series were above the average total expenses for comparable funds; however the contractual management fee was below the median for the peer group. The Board was satisfied with the management fee and total expenses of the Series in comparison to its peer group as shown in the Lipper report and concluded that such fee and expenses were reasonable.
Economies of Scale. The Board noted that it was likely that PVA and the Series would achieve certain economies of scale as the assets grew in order to cover certain fixed costs. The Board concluded that shareholders would have an opportunity to benefit from these economies of scale.
28
THE PHOENIX EDGE SERIES FUND
BOARD OF TRUSTEES’ CONSIDERATION OF INVESTMENT ADVISORY AND SUBADVISORY AGREEMENTS FOR
PHOENIX MID-CAP GROWTH SERIES (the “Series”) (Continued)
(Unaudited)
SUBADVISORY AGREEMENT CONSIDERATIONS
Nature, Extent and Quality of Services. The Board concluded that the nature, extent and quality of the overall services that are provided by the Subadvisor to the Series and its shareholders was reasonable. In addition, they received from Subadvisor and reviewed substantial written information as requested. In the course of their deliberations and evaluation of materials, the Trustees considered, among other things the following factors: the Subadvisor, its current personnel (including particularly those personnel with responsibilities for providing investment and compliance services to the Series), and its financial condition, resources and investment process; the terms of the subadvisory agreement, including the standard of care and termination provisions; the scope and quality of the services that Subadvisor would provide to the Series; the structure and rate of advisory fees payable to Subadvisor by PVA, the methodology used by Subadvisor in determining the compensation payable to portfolio managers and the competition for investment management talent; and the Subadvisor’s compliance record. The Board’s opinion was based, in part, upon the experience of the Subadvisor and the portfolio managers. With respect to portfolio manager compensation, the Board noted that a primary factor in the Subadvisor’s determination of the amount of bonus compensation to portfolio managers was the relative investment performance of the funds that they managed, which would align their interests with those of the Series’ shareholders. The Board also considered the adequacy of the Subadvisor’s compliance program, based on the information provided by the Subadvisor.
Investment Performance. The Board placed emphasis on the investment performance of the Series in view of its importance to shareholders. While consideration was given to performance reports and discussions at Board meetings throughout the year, particular attention in assessing such performance was given to a report for the Series prepared by Lipper Financial Services (“Lipper”), which was furnished for the contract renewal process. The Lipper report showed the investment performance of the Series’ shares for the 1, 3 and 5 year periods ended September 30, 2006 and the year-to-date period ended September 30, 2006. The Board reviewed the investment performance of the Series, along with comparative performance information given for a peer group of funds and a relevant market index. The Board noted that the Series underperformed the index for all periods. The Board also noted that the current Subadvisor has only been providing investment management for the Series since the third quarter of 2005 and performance has been improving since that time. While it has been more than a year since the Subadvisor has taken over the management of the Series, and while performance has not been above average, the Series has shown a new consistency and rise in relative performance.
Profitability. The Board noted that the subadvisory fee is paid by PVA and not by the Series.
Subadvisory Fee. The Board did not receive comparative fee information of subadvisory fees but noted that the subadvisory fee is paid by PVA and not by the Series.
Economies of Scale. The Board also considered the existence of any economies of scale and whether those economies would be passed along to the Series’ shareholders but noted that any economies would most likely be generated at the advisor level and not necessarily at the subadvisor level.
29
THE PHOENIX EDGE SERIES FUND
BOARD OF TRUSTEES’ CONSIDERATION OF INVESTMENT ADVISORY AGREEMENT FOR
PHOENIX MONEY MARKET SERIES (previously known as
Phoenix-Goodwin Money Market Series) (the “Series”)
(Unaudited)
The Board of Trustees is responsible for determining whether to approve the Fund’s investment advisory agreements. At a meeting held on November 13, 2006, the Board, including a majority of disinterested Trustees, approved the investment advisory agreement (the “Advisory Agreement”) between Phoenix Investment Counsel, Inc. (“PIC”) and the Fund. Pursuant to the Advisory Agreement PIC provides advisory services to the Series.
During the review process, the Board received assistance and advice from, and met separately with, independent legal counsel. In approving the Advisory Agreement, the Board, including a majority of disinterested Trustees, determined that the fee structure was fair and reasonable and that approval of the Advisory Agreement was in the best interests of the Series and its shareholders. While attention was given to all information furnished, the following discusses the primary factors relevant to the Board’s decision.
ADVISORY AGREEMENT CONSIDERATIONS
Nature, Extent and Quality of Services. The Board concluded that the nature, extent and quality of the overall services provided by PIC and its affiliates to the Series and its shareholders are reasonable. The Board’s conclusion was based, in part, upon services provided to the Series such as quarterly reports provided by PIC and its affiliates 1) comparing the performance of the Series with a peer group and benchmark, 2) showing that the investment policies and restrictions for the Series were followed and 3) covering matters such as the compliance of investment personnel and other access persons with the Code of Ethics of both PIC and the Series, the adherence to fair value pricing procedures established by the Board, the monitoring of portfolio compliance, information on illiquid securities and derivatives, brokerage commissions and presentations regarding the economic environment and general investment outlook. The Board also considered the experience of PIC as an investment advisor and the experience of the PIC portfolio managers that manage the Series. With respect to portfolio manager compensation, the Board noted that a primary factor in PIC’s determination of the amount of bonus compensation to portfolio managers was the relative investment performance of the funds that they managed, which aligned their interests with those of the Series’ shareholders. The Board also considered and was satisfied with the adequacy of PIC’s compliance program. The Board also considered the transfer agent and shareholder services that are provided to Series shareholders by an affiliate of PIC, noting continuing improvements by management in the scope and quality of services and favorable reports on such service conducted by third parties.
Investment Performance. The Board placed emphasis on the investment performance of the Series in view of its importance to shareholders. While consideration was given to performance reports and discussions at Board meetings throughout the year, particular attention in assessing such performance was given to a report for the Series prepared by Lipper Financial Services (“Lipper”), which was furnished for the contract renewal process. The Lipper report showed the investment performance of the Series’ shares for the 1, 3, 5 and 10 year periods ended September 30, 2006 and the year-to-date period ended September 30, 2006. The Board reviewed the investment performance of the Series, along with comparative performance information given for a peer group of funds and a relevant market index. The Board noted that the performance of the Series was slightly below the index for all periods.
Profitability. The Board also considered the level of profits realized by PIC and its affiliates in connection with the operation of the Series. In this regard, the Board reviewed the Series profitability analysis that addressed the overall profitability of PIC for its management of The Phoenix Edge Series Fund family, as well as its profits and that of its affiliates, for managing the Series. Specific attention was given to the methodology followed in allocating costs to the Series since allocation methodologies are inherently subjective and various allocation methodologies may each be reasonable while producing different results. The Board also noted the contractual reimbursement provided to the Series. In this regard, the Board noted that the allocation appeared reasonable. The Board concluded that the profitability to PIC from the Series was reasonable.
Management Fee and Total Expenses. The Board also placed emphasis on the review of Series expenses. Consideration was given to a comparative analysis of the management fees and total expense ratios of the Series compared with those of a group of funds selected by Lipper as the Series’ appropriate Lipper expense peer group. The Board noted that the total expenses of the Series were higher than the average total expenses for comparable funds and that the contractual management fee was below the median for the peer group. The Board was satisfied with the management fee and total expenses of the Series in comparison to its expense peer group as shown in the Lipper report and concluded that such fee and expenses were reasonable.
Economies of Scale. The Board noted that the management fee included breakpoints based on the amount of assets under management. The Board also noted that it was likely that PIC and the Series would achieve certain economies of scale as the assets grew in order to cover certain fixed costs. The Board concluded that shareholders would have an opportunity to benefit from these economies of scale.
30
THE PHOENIX EDGE SERIES FUND
BOARD OF TRUSTEES’ CONSIDERATION OF INVESTMENT ADVISORY AGREEMENT FOR
PHOENIX MULTI-SECTOR FIXED INCOME SERIES (previously known as
Phoenix-Goodwin Multi-Sector Fixed Income Series) (the “Series”)
(Unaudited)
The Board of Trustees is responsible for determining whether to approve the Fund’s investment advisory agreements. At a meeting held on November 13, 2006, the Board, including a majority of disinterested Trustees, approved the investment advisory agreement (the “Advisory Agreement”) between Phoenix Investment Counsel, Inc. (“PIC”) and the Fund. Pursuant to the Advisory Agreement PIC provides advisory services to the Series.
During the review process, the Board received assistance and advice from, and met separately with, independent legal counsel. In approving the Advisory Agreement, the Board, including a majority of disinterested Trustees, determined that the fee structure was fair and reasonable and that approval of the Advisory Agreement was in the best interests of the Series and its shareholders. While attention was given to all information furnished, the following discusses the primary factors relevant to the Board’s decision.
ADVISORY AGREEMENT CONSIDERATIONS
Nature, Extent and Quality of Services. The Board concluded that the nature, extent and quality of the overall services provided by PIC and its affiliates to the Series and its shareholders are reasonable. The Board’s conclusion was based, in part, upon services provided to the Series such as quarterly reports provided by PIC and its affiliates 1) comparing the performance of the Series with a peer group and benchmark, 2) showing that the investment policies and restrictions for the Series were followed and 3) covering matters such as the compliance of investment personnel and other access persons with the Code of Ethics of both PIC and the Series, the adherence to fair value pricing procedures established by the Board, the monitoring of portfolio compliance, information on illiquid securities and derivatives, brokerage commissions and presentations regarding the economic environment and general investment outlook. The Board also considered the experience of PIC as an investment advisor and the experience of the PIC portfolio managers that manage the Series. With respect to portfolio manager compensation, the Board noted that a primary factor in PIC’s determination of the amount of bonus compensation to portfolio managers was the relative investment performance of the funds that they managed, which aligned their interests with those of the Series’ shareholders. The Board also considered and was satisfied with the adequacy of PIC’s compliance program. The Board also considered the transfer agent and shareholder services that are provided to Series shareholders by an affiliate of PIC, noting continuing improvements by management in the scope and quality of services and favorable reports on such service conducted by third parties.
Investment Performance. The Board placed emphasis on the investment performance of the Series in view of its importance to shareholders. While consideration was given to performance reports and discussions at Board meetings throughout the year, particular attention in assessing such performance was given to a report for the Series prepared by Lipper Financial Services (“Lipper”), which was furnished for the contract renewal process. The Lipper report showed the investment performance of the Series’ shares for the 1, 3, 5 and 10 year periods ended September 30, 2006 and the year-to-date period ended September 30, 2006. The Board reviewed the investment performance of the Series, along with comparative performance information given for a peer group of funds and a relevant market index. The Board noted and was satisfied that the Series had outperformed the index for all periods.
Profitability. The Board also considered the level of profits realized by PIC and its affiliates in connection with the operation of the Series. In this regard, the Board reviewed the Series profitability analysis that addressed the overall profitability of PIC for its management of The Phoenix Edge Series Fund family, as well as its profits and that of its affiliates, for managing the Series. Specific attention was given to the methodology followed in allocating costs to the Series, it being recognized that allocation methodologies are inherently subjective and various allocation methodologies may each be reasonable while producing different results. The Board also noted the contractual reimbursement provided to the Series. In this regard, the Board noted that the allocation appeared reasonable. The Board concluded that the profitability to PIC from the Series was reasonable.
Management Fee and Total Expenses. The Board also placed emphasis on the review of Series expenses. Consideration was given to a comparative analysis of the management fees and total expense ratios of the Series compared with those of a group of funds selected by Lipper as the Series’ appropriate Lipper expense peer group. The Board noted that the total expenses of the Series were slightly lower than the average total expenses for comparable funds and that the contractual management fee was below the median for the peer group. The Board was satisfied with the management fee and total expenses of the Series in comparison to its expense group as shown in the Lipper report and concluded that such fee and expenses were reasonable.
Economies of Scale. The Board noted that the management fee included breakpoints based on the amount of assets under management. The Board also noted that it was likely that PIC and the Series would achieve certain economies of scale as the assets grew in order to cover certain fixed costs. The Board concluded that shareholders would have an opportunity to benefit from these economies of scale.
31
THE PHOENIX EDGE SERIES FUND
BOARD OF TRUSTEES’ CONSIDERATION OF INVESTMENT ADVISORY AGREEMENT FOR
PHOENIX MULTI-SECTOR SHORT TERM BOND SERIES (previously known as
Phoenix-Goodwin Multi-Sector Short Term Bond Series) (the “Series”)
(Unaudited)
The Board of Trustees is responsible for determining whether to approve the Fund’s investment advisory agreements. At a meeting held on November 13, 2006, the Board, including a majority of disinterested Trustees, approved the investment advisory agreement (the “Advisory Agreement”) between Phoenix Investment Counsel, Inc. (“PIC”) and the Fund. Pursuant to the Advisory Agreement PIC provides advisory services to the Series.
During the review process, the Board received assistance and advice from, and met separately with, independent legal counsel. In approving the Advisory Agreement, the Board, including a majority of disinterested Trustees, determined that the fee structure was fair and reasonable and that approval of the Advisory Agreement was in the best interests of the Series and its shareholders. While attention was given to all information furnished, the following discusses the primary factors relevant to the Board’s decision.
ADVISORY AGREEMENT CONSIDERATIONS
Nature, Extent and Quality of Services. The Board concluded that the nature, extent and quality of the overall services provided by PIC and its affiliates to the Series and its shareholders are reasonable. The Board’s conclusion was based, in part, upon services provided to the Series such as quarterly reports provided by PIC and its affiliates 1) comparing the performance of the Series with a peer group and benchmark, 2) showing that the investment policies and restrictions for the Series were followed and 3) covering matters such as the compliance of investment personnel and other access persons with the Code of Ethics of both PIC and the Series, the adherence to fair value pricing procedures established by the Board, the monitoring of portfolio compliance, information on illiquid securities and derivatives, brokerage commissions and presentations regarding the economic environment and general investment outlook. The Board also considered the experience of PIC as an investment advisor and the experience of the PIC portfolio managers that manage the Series. With respect to portfolio manager compensation, the Board noted that a primary factor in PIC’s determination of the amount of bonus compensation to portfolio managers was the relative investment performance of the funds that they managed, which aligned their interests with those of the Series’ shareholders. The Board also considered and was satisfied with the adequacy of PIC’s compliance program. The Board also considered the transfer agent and shareholder services that are provided to Series shareholders by an affiliate of PIC, noting continuing improvements by management in the scope and quality of services and favorable reports on such service conducted by third parties.
Investment Performance. The Board placed emphasis on the investment performance of the Series in view of its importance to shareholders. While consideration was given to performance reports and discussions at Board meetings throughout the year, particular attention in assessing such performance was given to a report for the Series prepared by Lipper Financial Services (“Lipper”), which was furnished for the contract renewal process. The Lipper report showed the investment performance of the Series’ shares for the 1 and 3 year period ended September 30, 2006 and the year-to-date period ended September 30, 2006. The Board reviewed the investment performance of the Series, along with comparative performance information given for a peer group of funds and a relevant market index. The Board noted that the Series had performed below the index for the 1 year period and had performed above the index for the 3 year and year-to-date periods. The Board was satisfied that the Series had the best performance among its peer group for the 3 year and year-to-date period ended September 30, 2006.
Profitability. The Board also considered the level of profits realized by PIC and its affiliates in connection with the operation of the Series. In this regard, the Board reviewed the Series profitability analysis that addressed the overall profitability of PIC for its management of The Phoenix Edge Series Fund family, as well as its profits and that of its affiliates, for managing the Series. Specific attention was given to the methodology followed in allocating costs to the Series since allocation methodologies are inherently subjective and various allocation methodologies may each be reasonable while producing different results. In this regard, the Board noted that the allocation appeared reasonable. The Board also noted the contractual reimbursements provided to the Series. The Board concluded that the profitability to PIC from the Series was reasonable.
Management Fee and Total Expenses. The Board also placed emphasis on the review of Series expenses. Consideration was given to a comparative analysis of the management fees and total expense ratios of the Series compared with those of a group of funds selected by Lipper as the Series appropriate Lipper expense peer group. The Board noted that the total expenses of the Series were higher than the average total expenses for comparable funds and that the contractual management fee was the same compared to the median for the peer group. The Board was satisfied with the management fee and total expenses of the Series in comparison to its expense peer group as shown in the Lipper report and concluded that such fee and expenses were reasonable.
Economies of Scale. The Board noted that the management fee included breakpoints based on the amount of assets under management. The Board also noted that it was likely that PIC and the Series would achieve certain economies of scale as the assets grew in order to cover certain fixed costs. The Board concluded that shareholders would have an opportunity to benefit from these economies of scale.
32
THE PHOENIX EDGE SERIES FUND
BOARD OF TRUSTEES’ CONSIDERATION OF INVESTMENT ADVISORY AGREEMENT FOR
PHOENIX STRATEGIC ALLOCATION SERIES (previously known
as Phoenix-Engemann Strategic Allocation Series) (the “Series”)
(Unaudited)
The Board of Trustees is responsible for determining whether to approve the Fund’s investment advisory agreements. At a meeting held on November 13, 2006, the Board, including a majority of disinterested Trustees, approved the investment advisory agreement (the “Advisory Agreement”) between Phoenix Investment Counsel, Inc. (“PIC”) and the Fund. Pursuant to the Advisory Agreement, PIC provides advisory services to the Series.
During the review process, the Board received assistance and advice from, and met separately with, independent legal counsel. In approving the Advisory Agreement, the Board, including a majority of disinterested Trustees, determined that the fee structure was fair and reasonable and that approval of the Advisory Agreement was in the best interests of the Series and its shareholders. While attention was given to all information furnished, the following discusses the primary factors relevant to the Board’s decision.
ADVISORY AGREEMENT CONSIDERATIONS
Nature, Extent and Quality of Services. The Board concluded that the nature, extent and quality of the overall services provided by PIC and its affiliates to the Series and its shareholders are reasonable. The Board’s conclusion was based, in part, upon services provided to the Series such as quarterly reports provided by PIC and its affiliates 1) comparing the performance of the Series with a peer group and benchmark, 2) showing that the investment policies and restrictions for the Series were followed and 3) covering matters such as the compliance of investment personnel and other access persons with the Code of Ethics of PIC and the Series, the adherence to fair value pricing procedures established by the Board, the monitoring of portfolio compliance, information on illiquid securities and derivatives, brokerage commissions and presentations regarding the economic environment and general investment outlook. The Board also considered the experience of PIC as an investment advisor and the experience of the PIC portfolio managers that manage the Series. With respect to portfolio manager, compensation, the Board noted that a primary factor in PIC’s determination of the amount of bonus compensation to portfolio managers was the relative investment performance of the funds that they managed, which aligned their interests with those of the Series’ shareholders. The Board also considered and was satisfied with the adequacy of PIC’s compliance program. The Board also considered the transfer agent and shareholder services that are provided to Series shareholders by an affiliate of PIC, noting continuing improvements by management in the scope and quality of services and favorable reports on such services conducted by third parties.
Investment Performance. The Board placed emphasis on the investment performance of the Series in view of its importance to shareholders. While consideration was given to performance reports and discussions at Board meetings throughout the year, particular attention in assessing such performance was given to a report for the Series prepared by Lipper Financial Services (“Lipper”), which was furnished for the contract renewal process. The Lipper report showed the investment performance of the Series’ shares for the 1, 3, 5 and 10 year periods ended September 30, 2006 and the year-to-date period ended September 30, 2006. The Board reviewed the investment performance of the Series, along with comparative performance information given for a peer group of funds and a relevant market index. The Board noted that the Series performed above the index for the 1 year and year-to-date periods and had performed below the index for the other periods. The Board noted that PIC began managing the Series in October 2006, and that the Board will continue to monitor performance.
Profitability. The Board also considered the level of profits realized by PIC and its affiliates in connection with the operation of the Series. In this regard, the Board reviewed the Series profitability analysis that addressed the overall profitably of PIC for its management of The Phoenix Edge Series Fund family, as well as its profits and that of its affiliates, for managing the Series. Specific attention was given to the methodology followed in allocating costs to the Series since allocation methodologies are inherently subjective and various allocation methodologies may each be reasonable while producing different results. In this regard, the Board noted that the allocation appeared reasonable. The Board concluded that the profitability to PIC from the Series was reasonable.
Management Fee and Total Expenses. The Board also placed emphasis on the review of Series expenses. Consideration was given to a comparative analysis of the management fees and total expense ratios of the Series compared with those of a group of funds selected by Lipper as its appropriate Lipper expense peer group. The Board noted that the total expenses of the Series were above the average total expenses for comparable funds and the contractual management fee was lower compared to the median for the peer group. The Board was satisfied with the management fee and total expenses of the Series in comparison to its peer group as shown in the Lipper report and concluded that such fee and expenses were reasonable.
Economies of Scale. The Board also noted that it was likely that PIC and the Series would achieve certain economies of scale as the assets grew in order to cover certain fixed costs. The Board concluded that shareholders would have an opportunity to benefit from these economies of scale.
33
THE PHOENIX EDGE SERIES FUND
BOARD OF TRUSTEES’ CONSIDERATION OF INVESTMENT ADVISORY AND SUBADVISORY AGREEMENTS FOR
PHOENIX-ABERDEEN INTERNATIONAL SERIES (the “Series”)
(Unaudited)
The Board of Trustees is responsible for determining whether to approve the Fund’s advisory agreements. At a meeting held on November 13, 2006, the Board, including a majority of disinterested Trustees, approved the investment advisory agreement (the “Advisory Agreement”) between Phoenix Investment Counsel, Inc. (“PIC”) and the Fund and the investment subadvisory agreement (the “Subadvisory Agreement”) between PIC and Aberdeen Asset Management Inc. (the “Subadvisor”). Pursuant to the Advisory Agreement between PIC and the Fund, PIC provides advisory services to the Series. Pursuant to the Subadvisory Agreement between PIC and the Subadvisor, the Subadvisor provides the day to day investment management for the Series.
During the review process, the Board received assistance and advice from, and met separately with, independent legal counsel. In approving each agreement, the Board, including a majority of disinterested Trustees, determined that the fee structure was fair and reasonable and that approval of each agreement was in the best interests of the Series and its shareholders. While attention was given to all information furnished, the following discusses the primary factors relevant to the Board’s decision.
ADVISORY AGREEMENT CONSIDERATIONS
Nature, Extent and Quality of Services. The Board concluded that the nature, extent and quality of the overall services provided by PIC and its affiliates to the Series and its shareholders are reasonable. The Board’s conclusion was based, in part, upon services provided to the Series such as quarterly reports provided by PIC 1) comparing the performance of the Series with a peer group and benchmark, 2) showing that the investment policies and restrictions for the Series were followed and 3) covering matters such as the compliance of investment personnel and other access persons with the Code of Ethics, the adherence to fair value pricing procedures established by the Board, the monitoring of portfolio compliance, information on illiquid securities and derivatives, brokerage commissions and presentations regarding the economic environment and general investment outlook. The Board noted that PIC was responsible for the general oversight of the investment programs of the Series and the monitoring of the Series’ Subadvisor’s investment performance and its compliance with applicable laws, regulations, policies and procedures. In this regard, the Board considered the detailed performance review process of the investment oversight committee. With respect to compliance monitoring, the Board noted that PIC required quarterly compliance certifications from the Subadvisor and conducted compliance due diligence visits at the Subadvisor. The Board also considered the experience of PIC having acted as an investment adviser to mutual funds for over 70 years, its current experience in acting as an investment adviser to over 60 mutual funds and several institutional clients, and its role under the Fund’s “manager of managers” exemptive relief under the Investment Company Act of 1940, as amended. The Board also considered the transfer agent and shareholder services that are provided to Series shareholders by an affiliate of PIC, noting continuing improvements by management in the scope and quality of services and favorable reports on such service conducted by third parties.
Investment Performance. The Board placed emphasis on the investment performance of the Series in view of its importance to shareholders. While consideration was given to performance reports and discussions at Board meetings throughout the year, particular attention in assessing such performance was given to a report for the Series prepared by Lipper Financial Services (“Lipper”), which was furnished for the contract renewal process. The Lipper report showed the investment performance of the Series’ shares for the 1, 3, 5 and 10 year periods ended September 30, 2006 and the year-to-date period ended September 30, 2006. The Board reviewed the investment performance of the Series, along with comparative performance information given for a peer group of funds and a relevant market index. The Board noted and was satisfied that the Series had outperformed the index for all periods. The Board noted that its performance placed it 11th among its peer group for the 1 year period ended September 30, 2006.
Profitability. The Board also considered the level of profits realized by PIC and its affiliates in connection with the operation of the Series. In this regard, the Board reviewed the Series profitability analysis that addressed the overall profitably of PIC for its management of The Phoenix Edge Series Fund family, as well as its profits and that of its affiliates, for managing the Series. Specific attention was given to the methodology followed in allocating costs to the Series, it being recognized that allocation methodologies are inherently subjective and various allocation methodologies may each be reasonable while producing different results. In this regard, the Board noted that the allocation appeared reasonable. The Board concluded that the profitability to PIC from the Series was reasonable.
Management Fee and Total Expenses. The Board also placed emphasis on the review of Series expenses. Consideration was given to a comparative analysis of the management fees and total expense ratios of the Series compared with those of a group of funds selected by Lipper as its appropriate Lipper expense peer group under the Lipper report. The Board noted that the actual total expenses of the Series were equal to the median average total expenses for comparable funds and that the contractual management fee was below the median for the peer group. The Board was satisfied with the management fee and total expenses of the Series in comparison to its peer group as shown in the Lipper report and concluded that such fee and expenses were reasonable.
Economies of Scale. The Board noted that the management fee included breakpoints based on the amount of assets under management. The Board noted that it was likely that PIC and the Series would achieve certain economies of scale as the assets grew in order to cover certain fixed costs. The Board concluded that shareholders would have an opportunity to benefit from these economies of scale.
34
THE PHOENIX EDGE SERIES FUND
BOARD OF TRUSTEES’ CONSIDERATION OF INVESTMENT ADVISORY AND SUBADVISORY AGREEMENTS FOR
PHOENIX-ABERDEEN INTERNATIONAL SERIES (the “Series”) (Continued)
(Unaudited)
SUBADVISORY AGREEMENT CONSIDERATIONS
Nature, Extent and Quality of Services. The Board concluded that the nature, extent and quality of the overall services that are provided by the Subadvisor to the Series and its shareholders was reasonable. In addition, they received from Subadvisor and reviewed substantial written information as requested. In the course of their deliberations and evaluation of materials, the Trustees considered, among other things the following factors: the Subadvisor, its current personnel (including particularly those personnel with responsibilities for providing investment and compliance services to the Series), and its financial condition, resources and investment process; the terms of the subadvisory agreement, including the standard of care and termination provisions; the scope and quality of the services that Subadvisor would provide to the Series; the structure and rate of advisory fees payable to Subadvisor by PIC, the methodology used by Subadvisor in determining the compensation payable to portfolio managers and the competition for investment management talent; and the Subadvisor’s compliance record. The Board’s opinion was based, in part, upon the extensive experience of the Subadvisor and the portfolio managers. In this regard, the Board noted that the portfolio management team has many years of experience in the investment management business. With respect to portfolio manager compensation, the Board noted that a primary factor in the Subadvisor’s determination of the amount of bonus compensation to portfolio managers was the relative investment performance of the funds that they managed, which would align their interests with those of the Series’ shareholders. The Board also considered the adequacy of the Subadvisor’s compliance program, based on the information provided by the Subadvisor.
Investment Performance. The Board placed significant emphasis on the investment performance of the Series in view of its importance to shareholders. While consideration was given to performance reports and discussions at Board meetings throughout the year, particular attention in assessing such performance was given to a report for the Series prepared by Lipper Financial Services (“Lipper”), which was furnished for the contract renewal process. The Lipper report showed the investment performance of the Series’ shares for the 1, 3, 5 and 10 year periods ended September 30, 2006 and the year-to-date period ended September 30, 2006. The Board reviewed the investment performance of the Series, along with comparative performance information given for a peer group of funds and a relevant market index. The Board noted and was satisfied that the Series had outperformed the index for all periods. The Board noted that its performance placed it 11th among its peer group for the 1 year period ended September 30, 2006.
Profitability. The Board noted that the subadvisory fee is paid by PIC and not by the Series.
Subadvisory Fee. The Board did not receive comparative fee information of subadvisory fees but noted that the subadvisory fee is paid by PIC and not by the Series.
Economies of Scale. The Board also considered the existence of any economies of scale and whether those economies would be passed along to the Series’ shareholders but noted that any economies would most likely be generated at the advisor level and not necessarily at the subadvisor level.
35
THE PHOENIX EDGE SERIES FUND
BOARD OF TRUSTEES’ CONSIDERATION OF INVESTMENT ADVISORY AND SUBADVISORY AGREEMENTS FOR
PHOENIX-ALGER SMALL-CAP GROWTH SERIES (the “Series”)
(Unaudited)
The Board of Trustees is responsible for determining whether to approve the Fund’s advisory agreements. At a meeting held on November 13, 2006, the Board, including a majority of disinterested Trustees, approved the investment advisory agreement (the “Advisory Agreement”) between Phoenix Variable Advisors, Inc. (“PVA”) and the Fund and the investment subadvisory agreement (the “Subadvisory Agreement”) between PVA and Fred Alger Management, Inc. (the “Subadvisor”). Pursuant to the Advisory Agreement between PVA and the Fund, PVA provides advisory services to the Series. Pursuant to the Subadvisory Agreement between PVA and the Subadvisor, the Subadvisor provides the day to day investment management for the Series.
During the review process, the Board received assistance and advice from, and met separately with, independent legal counsel. In approving each agreement, the Board, including a majority of disinterested Trustees, determined that the fee structure was fair and reasonable and that approval of each agreement was in the best interests of the Series and its shareholders. While attention was given to all information furnished, the following discusses the primary factors relevant to the Board’s decision.
ADVISORY AGREEMENT CONSIDERATIONS
Nature, Extent and Quality of Services. The Board concluded that the nature, extent and quality of the overall services provided by PVA and its affiliates to the Series and its shareholders are reasonable. The Board’s conclusion was based, in part, upon services provided to the Series such as quarterly reports provided by PVA 1) comparing the performance of the Series with a peer group and benchmark, 2) showing that the investment policies and restrictions for the Series were followed and 3) covering matters such as the compliance of investment personnel and other access persons with the Code of Ethics of PVA and the Series, the adherence to fair value pricing procedures established by the Board, the monitoring of portfolio compliance, information on illiquid securities and derivatives, brokerage commissions and presentations regarding the economic environment and general investment outlook. The Board noted that PVA was responsible for the general oversight of the investment programs of the Series and the monitoring of the Subadvisor’s investment performance and its compliance with applicable laws, regulations, policies and procedures. In this regard, the Board considered the detailed performance review process of the Investment Performance Committee. With respect to compliance monitoring, the Board noted that PVA required quarterly compliance certifications from the Subadvisor and conducted compliance due diligence visits at the Subadvisor. The Board also considered the experience of PVA having acted as an investment adviser to mutual funds for 7 years, its current experience in acting as an investment adviser to over 12 mutual funds, and its role under the Fund’s “manager of managers” exemptive relief under the Investment Company Act of 1940, as amended. The Board also considered the transfer agent and shareholder services that are provided to Series shareholders by an affiliate of PVA, noting continuing improvements by management in the scope and quality of services and favorable reports on such service conducted by third parties.
Investment Performance. The Board placed emphasis on the investment performance of the Series in view of its importance to shareholders. While consideration was given to performance reports and discussions at Board meetings throughout the year, particular attention in assessing such performance was given to a report for the Series prepared by Lipper Financial Services (“Lipper”), which was furnished for the contract renewal process. The Lipper report showed the investment performance of the Series’ shares for the 1 and 3 year periods ended September 30, 2006 and the year-to-date period ended September 30, 2006. The Board reviewed the investment performance of the Series, along with comparative performance information given for a peer group of funds and a relevant market index. The Board noted and was satisfied that the Series had performed above the index for all periods. The Board also noted that its 1 year performance placed it 8th among its peer group.
Profitability. The Board also considered the level of profits realized by PVA and its affiliates in connection with the operation of the Series. In this regard, the Board reviewed the Series profitability analysis that addressed the overall profitably of PVA for its management of The Phoenix Edge Series Fund family, as well as its profits and that of its affiliates, for managing the Series. Specific attention was given to the methodology followed in allocating costs to the Series, since allocation methodologies are inherently subjective and various allocation methodologies may each be reasonable while producing different results. In this regard, the Board noted that the allocation appeared reasonable. The Board also noted the voluntary reimbursements provided to the Fund. The Board concluded that the profitability to PVA from the Series was reasonable.
Management Fee and Total Expenses. The Board also placed emphasis on the review of Series expenses. Consideration was given to a comparative analysis of the management fees and total expense ratios of the Series compared with those of a group of funds selected by Lipper as the Series’ appropriate Lipper expense peer group. The Board noted that the total expenses of the Series were slightly below the average total expenses for comparable funds and the contractual management fee was slightly higher compared to the median for the peer group. The Board was satisfied with the management fee and total expenses of the Series in comparison to its peer group as shown in the Lipper report and concluded that such fee and expenses were reasonable.
Economies of Scale. The Board noted that it was likely that PVA and the Series would achieve certain economies of scale as the assets grew in order to cover certain fixed costs. The Board concluded that shareholders would have an opportunity to benefit from these economies of scale.
36
THE PHOENIX EDGE SERIES FUND
BOARD OF TRUSTEES’ CONSIDERATION OF INVESTMENT ADVISORY AND SUBADVISORY AGREEMENTS
FOR PHOENIX-ALGER SMALL-CAP GROWTH SERIES (the “Series”) (Continued)
(Unaudited)
SUBADVISORY AGREEMENT CONSIDERATIONS
Nature, Extent and Quality of Services. The Board concluded that the nature, extent and quality of the overall services that are provided by the Subadvisor to the Series and its shareholders was reasonable. In addition, they received from Subadvisor and reviewed substantial written information as requested. In the course of their deliberations and evaluation of materials, the Trustees considered, among other things the following factors: the Subadvisor, its current personnel (including particularly those personnel with responsibilities for providing investment and compliance services to the Series), and its financial condition, resources and investment process; the terms of the subadvisory agreement, including the standard of care and termination provisions; the scope and quality of the services that Subadvisor would provide to the Series; the structure and rate of advisory fees payable to Subadvisor by PVA, the methodology used by Subadvisor in determining the compensation payable to portfolio managers and the competition for investment management talent; and the Subadvisor’s compliance record. The Board’s opinion was based, in part, upon the extensive experience of the Subadvisor and the portfolio managers. With respect to portfolio manager compensation, the Board noted that a primary factor in the Subadvisor’s determination of the amount of bonus compensation to portfolio managers was the relative investment performance of the funds that they managed which would align their interests with those of the Series’ shareholders. The Board also considered the adequacy of the Subadvisor’s compliance program, based on the information provided by the Subadvisor.
Investment Performance. The Board placed emphasis on the investment performance of the Series in view of its importance to shareholders. While consideration was given to performance reports and discussions at Board meetings throughout the year, particular attention in assessing such performance was given to a report for the Series prepared by Lipper Financial Services (“Lipper”), which was furnished for the contract renewal process. The Lipper report showed the investment performance of the Series’ shares for the 1 and 3 year periods ended September 30, 2006 and the year-to-date period ended September 30, 2006. The Board reviewed the investment performance of the Series, along with comparative performance information given for a peer group of funds and a relevant market index. The Board noted and was satisfied that the Series had performed above the index for all periods. The Board also noted that its 1 year performance placed it 8th among its peer group.
Profitability. The Board noted that the subadvisory fee is paid by PVA and not by the Series.
Subadvisory Fee. The Board did not receive comparative fee information of subadvisory fees but noted that the subadvisory fee is paid by PVA and not by the Series.
Economies of Scale. The Board also considered the existence of any economies of scale and whether those economies would be passed along to the Series’ shareholders but noted that any economies would most likely be generated at the advisor level and not necessarily at the subadvisor level.
37
THE PHOENIX EDGE SERIES FUND
BOARD OF TRUSTEES’ CONSIDERATION OF INVESTMENT ADVISORY AGREEMENT
FOR PHOENIX-DUFF & PHELPS REAL ESTATE SECURITIES SERIES (the “Series”)
(Unaudited)
The Board of Trustees is responsible for determining whether to approve the Fund’s investment advisory agreements. At a meeting held on November 13, 2006, the Board, including a majority of disinterested Trustees, approved the investment advisory agreement (the “Advisory Agreement”) between Duff & Phelps Investment Management Co. (“DPIM”) and the Fund. Pursuant to the Advisory Agreement DPIM provides advisory services to the Series.
During the review process, the Board received assistance and advice from, and met separately with, independent legal counsel. In approving the Advisory Agreement, the Board, including a majority of disinterested Trustees, determined that the fee structure was fair and reasonable and that approval of the Advisory Agreement was in the best interests of the Series and its shareholders. While attention was given to all information furnished, the following discusses the primary factors relevant to the Board’s decision.
ADVISORY AGREEMENT CONSIDERATIONS
Nature, Extent and Quality of Services. The Board concluded that the nature, extent and quality of the overall services provided by DPIM and its affiliates to the Series and its shareholders are reasonable. The Board’s conclusion was based, in part, upon services provided to the Series such as quarterly reports provided by DPIM and its affiliates 1) comparing the performance of the Series with a peer group and benchmark, 2) showing that the investment policies and restrictions for the Series were followed and 3) covering matters such as the compliance of investment personnel and other access persons with the Code of Ethics of both DPIM and the Series, the adherence to fair value pricing procedures established by the Board, the monitoring of portfolio compliance, information on illiquid securities and derivatives, brokerage commissions and presentations regarding the economic environment and general investment outlook. The Board also considered the experience of DPIM as an investment advisor and the experience of the DPIM portfolio managers that manage the Series. With respect to portfolio manager compensation, the Board noted that a primary factor in DPIM’s determination of the amount of bonus compensation to portfolio managers was the relative investment performance of the funds that they managed, which aligned their interests with those of the Series’ shareholders. The Board also considered and was satisfied with the adequacy of DPIM’s compliance program. The Board also considered the transfer agent and shareholder services that are provided to Series shareholders by an affiliate of DPIM, noting continuing improvements by management in the scope and quality of services and favorable reports on such service conducted by third parties.
Investment Performance. The Board placed emphasis on the investment performance of the Series in view of its importance to shareholders. While consideration was given to performance reports and discussions at Board meetings throughout the year, particular attention in assessing such performance was given to a report for the Series prepared by Lipper Financial Services (“Lipper”), which was furnished for the contract renewal process. The Lipper report showed the investment performance of the Series’ shares for the 1, 3, 5 and 10 year periods ended September 30, 2006 and the year-to-date period ended September 30, 2006. The Board reviewed the investment performance of the Series, along with comparative performance information given for a peer group of funds and a relevant market index. The Board noted and was satisfied that the Series had outperformed the index and the Lipper peer group average for all periods The Series was ranked number one for the 5 and 10 year periods and was in the top half of its peer group for the other periods.
Profitability. The Board also considered the level of profits realized by DPIM and its affiliates in connection with the operation of the Series. In this regard, the Board reviewed the Series profitability analysis. Specific attention was given to the methodology followed in allocating costs to the Series since allocation methodologies are inherently subjective and various allocation methodologies may each be reasonable while producing different results. In this regard, the Board noted that the allocation appeared reasonable. The Board concluded that the profitability to DPIM from the Series was reasonable.
Management Fee and Total Expenses. The Board also placed emphasis on the review of Series expenses. Consideration was given to a comparative analysis of the management fees and total expense ratios of the Series compared with those of a group of funds selected by Lipper as the Series’ appropriate Lipper expense peer group. The Board noted that the total expenses of the Series were higher than the average total expenses for comparable funds; however, the contractual management fee was less than the median for the peer group. The Board was satisfied with the management fee and total expenses of the Series in comparison to its peer group as shown in the Lipper report and concluded that such fee and expenses were reasonable.
Economies of Scale. The Board noted that the management fee included breakpoints based on the amount of assets under management. The Board also noted that it was likely that DPIM and the Series would achieve certain economies of scale as the assets grew in order to cover certain fixed costs. The Board concluded that shareholders would have an opportunity to benefit from these economies of scale.
38
THE PHOENIX EDGE SERIES FUND
BOARD OF TRUSTEES’ CONSIDERATION OF INVESTMENT ADVISORY AND SUBADVISORY AGREEMENTS
FOR PHOENIX-SANFORD BERNSTEIN MID-CAP VALUE SERIES (the “Series”)
(Unaudited)
The Board of Trustees is responsible for determining whether to approve the Fund’s advisory agreements. At a meeting held on November 13, 2006, the Board, including a majority of disinterested Trustees, approved the investment advisory agreement (the “Advisory Agreement”) between Phoenix Variable Advisors, Inc. (“PVA”) and the Fund and the investment subadvisory agreement (the “Subadvisory Agreement”) between PVA and Alliance/Bernstein L.P. (the “Subadvisor”). Pursuant to the Advisory Agreement between PVA and the Fund, PVA provides advisory services to the Series. Pursuant to the Subadvisory Agreement between PVA and the Subadvisor, the Subadvisor provides the day to day investment management for the Series.
During the review process, the Board received assistance and advice from, and met separately with, independent legal counsel. In approving each agreement, the Board, including a majority of disinterested Trustees, determined that the fee structure was fair and reasonable and that approval of each agreement was in the best interests of the Series and its shareholders. While attention was given to all information furnished, the following discusses the primary factors relevant to the Board’s decision.
ADVISORY AGREEMENT CONSIDERATIONS
Nature, Extent and Quality of Services. The Board concluded that the nature, extent and quality of the overall services provided by PVA and its affiliates to the Series and its shareholders are reasonable. The Board’s conclusion was based, in part, upon services provided to the Series such as quarterly reports provided by PVA 1) comparing the performance of the Series with a peer group and benchmark, 2) showing that the investment policies and restrictions for the Series were followed and 3) covering matters such as the compliance of investment personnel and other access persons with the Code of Ethics of PVA and the Series, the adherence to fair value pricing procedures established by the Board, the monitoring of portfolio compliance, information on illiquid securities and derivatives, brokerage commissions and presentations regarding the economic environment and general investment outlook. The Board noted that PVA was responsible for the general oversight of the investment programs of the Series and the monitoring of the Subadvisor’s investment performance and its compliance with applicable laws, regulations, policies and procedures. In this regard, the Board considered the detailed performance review process of the Investment Performance Committee. With respect to compliance monitoring, the Board noted that PVA required quarterly compliance certifications from the Subadvisor and conducted compliance due diligence visits at the Subadvisor. The Board also considered the experience of PVA having acted as an investment adviser to mutual funds for 7 years, its current experience in acting as an investment adviser to 12 mutual funds, and its role under the Fund’s “manager of managers” exemptive relief under the Investment Company Act of 1940, as amended. The Board also considered the transfer agent and shareholder services that are provided to Series shareholders by an affiliate of PVA, noting continuing improvements by management in the scope and quality of services and favorable reports on such service conducted by third parties.
Investment Performance. The Board placed emphasis on the investment performance of the Series in view of its importance to shareholders. While consideration was given to performance reports and discussions at Board meetings throughout the year, particular attention in assessing such performance was given to a report for the Series prepared by Lipper Financial Services (“Lipper”), which was furnished for the contract renewal process. The Lipper report showed the investment performance of the Series’ shares for the 1, 3 and 5 year periods ended September 30, 2006 and the year-to-date period ended September 30, 2006. The Board reviewed the investment performance of the Series, along with comparative performance information given for a peer group of funds and a relevant market index. The Board noted that the Series had performed below the index for all periods, but that performance is above the median for the peer group.
Profitability. The Board also considered the level of profits realized by PVA and its affiliates in connection with the operation of the Series. In this regard, the Board reviewed the Series profitability analysis that addressed the overall profitably of PVA for its management of The Phoenix Edge Series Fund family, as well as its profits and that of its affiliates, for managing the Series. Specific attention was given to the methodology followed in allocating costs to the Series, since allocation methodologies are inherently subjective and various allocation methodologies may each be reasonable while producing different results. In this regard, the Board noted that the allocation appeared reasonable. The Board also noted the voluntary reimbursements provided to the Series. The Board concluded that the profitability to PVA from the Series was reasonable.
Management Fee and Total Expenses. The Board also placed emphasis on the review of Series expenses. Consideration was given to a comparative analysis of the management fees and total expense ratios of the Series compared with those of a group of funds selected by Lipper as its appropriate Lipper expense peer group. The Board noted that the total expenses of the Series were higher than the average total expenses for comparable funds and that the contractual management fee was above the median for the peer group. The Board was satisfied with the management fee and total expenses of the Series in comparison to its expense group as shown in the Lipper report and concluded that such fee and expenses were reasonable.
Economies of Scale. The Board noted that it was likely that PVA and the Series would achieve certain economies of scale as the assets grew in order to cover certain fixed costs. The Board concluded that shareholders would have an opportunity to benefit from these economies of scale.
39
THE PHOENIX EDGE SERIES FUND
BOARD OF TRUSTEES’ CONSIDERATION OF INVESTMENT ADVISORY AND SUBADVISORY AGREEMENTS FOR
PHOENIX-SANFORD BERNSTEIN MID-CAP VALUE SERIES (the “Series”) (Continued)
(Unaudited)
SUBADVISORY AGREEMENT CONSIDERATIONS
Nature, Extent and Quality of Services. The Board concluded that the nature, extent and quality of the overall services that are provided by the Subadvisor to the Series and its shareholders was reasonable. In addition, they received from Subadvisor and reviewed substantial written information as requested. In the course of their deliberations and evaluation of materials, the Trustees considered, among other things the following factors: the Subadvisor, its current personnel (including particularly those personnel with responsibilities for providing investment and compliance services to the Series), and its financial condition, resources and investment process; the terms of the subadvisory agreement, including the standard of care and termination provisions; the scope and quality of the services that Subadvisor would provide to the Series; the structure and rate of advisory fees payable to Subadvisor by PVA, the methodology used by Subadvisor in determining the compensation payable to portfolio managers and the competition for investment management talent; and the Subadvisor’s compliance record. The Board’s opinion was based upon the extensive experience of the Subadvisor and the portfolio managers. With respect to portfolio manager compensation, the Board noted that a primary factor in the Subadvisor’s determination of the amount of bonus compensation to portfolio managers was the relative investment performance of the funds that they managed which would align their interests with those of the Series’ shareholders. The Board also considered the adequacy of the Subadvisor’s compliance program, based on the information provided by the Subadvisor.
Investment Performance. The Board placed emphasis on the investment performance of the Series in view of its importance to shareholders. While consideration was given to performance reports and discussions at Board meetings throughout the year, particular attention in assessing such performance was given to a report for the Series prepared by Lipper Financial Services (“Lipper”), which was furnished for the contract renewal process. The Lipper report showed the investment performance of the Series’ shares for the 1, 3 and 5 year periods ended September 30, 2006 and the year-to-date period ended September 30, 2006. The Board reviewed the investment performance of the Series, along with comparative performance information given for a peer group of funds and a relevant market index. The Board noted that the Series had performed below the index for all periods but that performance is above the median for the peer group.
Profitability. The Board noted that the subadvisory fee is paid by PVA and not by the Series.
Subadvisory Fee. The Board did not receive comparative fee information of subadvisory fees but noted that the subadvisory fee is paid by PVA and not by the Series.
Economies of Scale. The Board also considered the existence of any economies of scale and whether those economies would be passed along to the Series’ shareholders but noted that any economies would most likely be generated at the advisor level and not necessarily at the subadvisor level.
40
THE PHOENIX EDGE SERIES FUND
BOARD OF TRUSTEES’ CONSIDERATION OF INVESTMENT ADVISORY AND SUBADVISORY AGREEMENTS FOR
PHOENIX-SANFORD BERNSTEIN SMALL-CAP VALUE SERIES (the “Series”)
(Unaudited)
The Board of Trustees is responsible for determining whether to approve the Fund’s advisory agreements. At a meeting held on November 13, 2005, the Board, including a majority of disinterested Trustees, approved the investment advisory agreement (the “Advisory Agreement”) between Phoenix Variable Advisors, Inc. (“PVA”) and the Fund and the investment subadvisory agreement (the “Subadvisory Agreement”) between PVA and Alliance/Bernstein L.P. (the “Subadvisor”). Pursuant to the Advisory Agreement between PVA and the Fund, PVA provides advisory services to the Series. Pursuant to the Subadvisory Agreement between PVA and the Subadvisor, the Subadvisor provides the day to day investment management for the Series.
During the review process, the Board received assistance and advice from, and met separately with, independent legal counsel. In approving each agreement, the Board, including a majority of disinterested Trustees, determined that the fee structure was fair and reasonable and that approval of each agreement was in the best interests of the Series and its shareholders. While attention was given to all information furnished, the following discusses the primary factors relevant to the Board’s decision.
ADVISORY AGREEMENT CONSIDERATIONS
Nature, Extent and Quality of Services. The Board concluded that the nature, extent and quality of the overall services provided by PVA and its affiliates to the Series and its shareholders are reasonable. The Board’s conclusion was based, in part, upon services provided to the Series such as quarterly reports provided by PVA 1) comparing the performance of the Series with a peer group and benchmark, 2) showing that the investment policies and restrictions for the Series were followed and 3) covering matters such as the compliance of investment personnel and other access persons with the Code of Ethics of PVA and the Series, the adherence to fair value pricing procedures established by the Board, the monitoring of portfolio compliance, information on illiquid securities and derivatives, brokerage commissions and presentations regarding the economic environment and general investment outlook. The Board noted that PVA was responsible for the general oversight of the investment programs of the Series and the monitoring of the Subadvisor’s investment performance and its compliance with applicable laws, regulations, policies and procedures. In this regard, the Board considered the detailed performance review process of the Investment Performance Committee. With respect to compliance monitoring, the Board noted that PVA required quarterly compliance certifications from the Subadvisor and conducted compliance due diligence visits at the Subadvisor. The Board also considered the experience of PVA having acted as an investment adviser to mutual funds for 7 years, its current experience in acting as an investment adviser to 12 mutual funds, and its role under the Fund’s “manager of managers” exemptive relief under the Investment Company Act of 1940, as amended. The Board also considered the transfer agent and shareholder services that are provided to Series shareholders by an affiliate of PVA, noting continuing improvements by management in the scope and quality of services and favorable reports on such service conducted by third parties.
Investment Performance. The Board placed emphasis on the investment performance of the Series in view of its importance to shareholders. While consideration was given to performance reports and discussions at Board meetings throughout the year, particular attention in assessing such performance was given to a report for the Series prepared by Lipper Financial Services (“Lipper”), which was furnished for the contract renewal process. The Lipper report showed the investment performance of the Series’ shares for the 1, 3 and 5 year periods ended September 30, 2006 and the year-to-date period ended September 30, 2006. The Board reviewed the investment performance of the Series, along with comparative performance information given for a peer group of funds and a relevant market index. The Board noted that the Series had performed below the index for the 1 and 5 year and year-to-date periods. The Board also noted that the Series performed above the index for the 3 year period.
Profitability. The Board also considered the level of profits realized by PVA and its affiliates in connection with the operation of the Series. In this regard, the Board reviewed the Series profitability analysis that addressed the overall profitably of PVA for its management of The Phoenix Edge Series Fund family, as well as its profits and that of its affiliates, for managing the Series. Specific attention was given to the methodology followed in allocating costs to the Series, since allocation methodologies are inherently subjective and various allocation methodologies may each be reasonable while producing different results. In this regard, the Board noted that the allocation appeared reasonable. The Board also noted the voluntary reimbursements provided to the Series. The Board concluded that the profitability to PVA from the Series was reasonable.
Management Fee and Total Expenses. The Board also placed emphasis on the review of Series expenses. Consideration was given to a comparative analysis of the management fees and total expense ratios of the Series compared with those of a group of funds selected by Lipper as the Series’ appropriate Lipper expense peer group. The Board noted that the total expenses of the Series were above the average total expenses for comparable funds and that the contractual management fee was above the median for the peer group. The Board was satisfied with the management fee and total expenses of the Series in comparison to its peer group as shown in the Lipper report and concluded that such fee and expenses were reasonable.
Economies of Scale. The Board noted that it was likely that PVA and the Series would achieve certain economies of scale as the assets grew in order to cover certain fixed costs. The Board concluded that shareholders would have an opportunity to benefit from these economies of scale.
41
THE PHOENIX EDGE SERIES FUND
BOARD OF TRUSTEES’ CONSIDERATION OF INVESTMENT ADVISORY AND SUBADVISORY AGREEMENTS FOR
PHOENIX-SANFORD BERNSTEIN SMALL-CAP VALUE SERIES (the “Series”) (Continued)
(Unaudited)
SUBADVISORY AGREEMENT CONSIDERATIONS
Nature, Extent and Quality of Services. The Board concluded that the nature, extent and quality of the overall services that are provided by the Subadvisor to the Series and its shareholders was reasonable. In addition, they received from Subadvisor and reviewed substantial written information as requested. In the course of their deliberations and evaluation of materials, the Trustees considered, among other things the following factors: the Subadvisor, its current personnel (including particularly those personnel with responsibilities for providing investment and compliance services to the Series), and its financial condition, resources and investment process; the terms of the subadvisory agreement, including the standard of care and termination provisions; the scope and quality of the services that Subadvisor would provide to the Series; the structure and rate of advisory fees payable to Subadvisor by PVA, the methodology used by Subadvisor in determining the compensation payable to portfolio managers and the competition for investment management talent; and the Subadvisor’s compliance record. The Board’s opinion was based upon the extensive experience of the Subadvisor and the portfolio managers. With respect to portfolio manager compensation, the Board noted that a primary factor in the Subadvisor’s determination of the amount of bonus compensation to portfolio managers was the relative investment performance of the funds that they managed which would align their interests with those of the Series’ shareholders. The Board also considered the adequacy of the Subadvisor’s compliance program, based on the information provided by the Subadvisor.
Investment Performance. The Board placed emphasis on the investment performance of the Series in view of its importance to shareholders. While consideration was given to performance reports and discussions at Board meetings throughout the year, particular attention in assessing such performance was given to a report for the Series prepared by Lipper Financial Services (“Lipper”), which was furnished for the contract renewal process. The Lipper report showed the investment performance of the Series’ shares for the 1, 3 and 5 year periods ended September 30, 2006 and the year-to-date period ended September 30, 2006. The Board reviewed the investment performance of the Series, along with comparative performance information given for a peer group of funds and a relevant market index. The Board noted that the Series had performed below the index for the 1 and 5 year and year-to-date periods. The Board also noted that the Series performed above the index for the 3 year period.
Profitability. The Board noted that the subadvisory fee is paid by PVA and not by the Series.
Subadvisory Fee. The Board did not receive comparative fee information of subadvisory fees but noted that the subadvisory fee is paid by PVA and not by the Series.
Economies of Scale. The Board also considered the existence of any economies of scale and whether those economies would be passed along to the Series’ shareholders but noted that any economies would most likely be generated at the advisor level and not necessarily at the subadvisor level.
Please note that the advisory and subadvisory agreements for the Phoenix-Van Kampen Comstock Series, Phoenix-Van Kampen Equity 500 Index Series, Phoenix-S&P Dynamic Asset Allocation Series: Aggressive Growth, Phoenix-S&P Dynamic Asset Allocation Series: Growth, Phoenix-S&P Dynamic Asset Allocation Series: Moderate Growth, and Phoenix-S&P Dynamic Asset Allocation Series: Moderate were not considered by the Fund’s Board of Trustees during the period July 1, 2006 through December 31, 2006.
42
THE PHOENIX EDGE SERIES FUND
RESULTS OF SHAREHOLDER MEETINGS
December 31, 2006
(Unaudited)
Meeting 1: A Special Meeting of Shareholders of the Phoenix-Lazard International Equity Select Series of The Phoenix Edge Series Fund was held on October 5, 2006 to approve the following matter:
| | 1. | To consider and act upon a proposal to approve the Agreement and Plan of Reorganization, dated October 5, 2006 and the transactions it contemplates, including (a) the transfer of all the assets of the Phoenix-Lazard International Equity Select Series (the “Acquired Series”) to the Phoenix-Aberdeen International Series (the “Acquiring Series”), another series of The Phoenix Edge Series Fund in exchange solely for the shares of the Acquiring Series and the assumption by the Acquiring Series of all liabilities of the Acquired Series and (b) the distribution of the shares of the Acquiring Series so received to shareholders of the Acquired Series in complete liquidation of the Acquired Series. On the record date of August 14, 2006 there were 9,697,071.64 shares outstanding and 100% of the shares outstanding and entitled to vote were present by proxy. |
NUMBER OF VOTES
| | | | | | |
| | | For
| | Against
| | Abstain
|
1. Approve Agreement and Plan of Reorganization | | 8,577,750.841 | | 355,849.341 | | 752,714.072 |
Of the shares outstanding 1,437,355.020 shares or 14.839%, were voted by policyholders and contractowners. Since Phoenix echo votes its record date shares in the same proportion as the voted shares received from policyholders and contractowners, effectively 100% of the outstanding shares were voted.
Meeting 2: A Special Meeting of Shareholders of the Phoenix-Kayne Rising Dividends Series of The Phoenix Edge Series Fund was held on October 5, 2006 to approve the following matter:
| | 1. | To consider and act upon a proposal to approve the Agreement and Plan of Reorganization, dated October 5, 2006 and the transactions it contemplates, including (a) the transfer of all the assets of the Phoenix-Kayne Rising Dividends Series (the “Acquired Series”) to the Phoenix-Engemann Growth and Income Series (the “Acquiring Series”), another series of The Phoenix Edge Series Fund in exchange solely for the shares of the Acquiring Series and the assumption by the Acquiring Series of all liabilities of the Acquired Series and (b) the distribution of the shares of the Acquiring Series so received to shareholders of the Acquired Series in complete liquidation of the Acquired Series. On the record date of August 14, 2006 there were 1,041,591.15 shares outstanding and 100% of the shares outstanding and entitled to vote were present by proxy. |
NUMBER OF VOTES
| | | | | | |
| | | For
| | Against
| | Abstain
|
1. Approve Agreement and Plan of Reorganization | | 875,303.602 | | 113,998.502 | | 51,873.812 |
Of the shares outstanding 170,282.170 shares or 16.354%, were voted by policyholders and contractowners. Since Phoenix echo votes its record date shares in the same proportion as the voted shares received from policyholders and contractowners, effectively 100% of the outstanding shares were voted.
Meeting 3: A Special Meeting of Shareholders of the Phoenix Strategic Theme Series of The Phoenix Edge Series Fund was held on October 5, 2006 to approve the following matter:
| | 1. | To consider and act upon a proposal to approve the Agreement and Plan of Reorganization, dated October 5, 2006 and the transactions it contemplates, including (a) the transfer of all the assets of the Phoenix Strategic Theme Series (the “Acquired Series”) to the Phoenix Mid-Cap Growth Series (the “Acquiring Series”), another series of The Phoenix Edge Series Fund in exchange solely for the shares of the Acquiring Series and the assumption by the Acquiring Series of all liabilities of the Acquired Series and (b) the distribution of the shares of the Acquiring Series so received to shareholders of the Acquired Series in complete liquidation of the Acquired Series. On the record date of August 14, 2006 there were 4,633,736.27 shares outstanding and 100% of the shares outstanding and entitled to vote were present by proxy. |
NUMBER OF VOTES
| | | | | | |
| | | For
| | Against
| | Abstain
|
1. Approve Agreement and Plan of Reorganization | | 4,250,554.232 | | 130,819.794 | | 246,579.899 |
Of the shares outstanding 810,213.012 shares or 17.501%, were voted by policyholders and contractowners. Since Phoenix echo votes its record date shares in the same proportion as the voted shares received from policyholders and contractowners, effectively 100% of the outstanding shares were voted.
43
THE PHOENIX EDGE SERIES FUND
RESULTS OF SHAREHOLDER MEETINGS (Continued)
December 31, 2006
(Unaudited)
Meeting 4: A Special Meeting of Shareholders of the Phoenix-AIM Growth Series of The Phoenix Edge Series Fund was held on October 5, 2006 to approve the following matter:
| | 1. | To consider and act upon a proposal to approve the Agreement and Plan of Reorganization, dated October 5, 2006 and the transactions it contemplates, including (a) the transfer of all the assets of the Phoenix-AIM Growth Series (the “Acquired Series”) to the Phoenix Capital Growth Series (the “Acquiring Series”), another series of The Phoenix Edge Series Fund in exchange solely for the shares of the Acquiring Series and the assumption by the Acquiring Series of all liabilities of the Acquired Series and (b) the distribution of the shares of the Acquiring Series so received to shareholders of the Acquired Series in complete liquidation of the Acquired Series. On the record date of August 14, 2006 there were 8,653,726.95 shares outstanding and 100% of the shares outstanding and entitled to vote were present by proxy. |
NUMBER OF VOTES
| | | | | | |
| | | For | | Against | | Abstain |
1. Approve Agreement and Plan of Reorganization | | 7,650,281.843 | | 283,134.626 | | 697,389.472 |
Of the shares outstanding 1,404,957.551 shares or 16.243%, were voted by policyholders and contractowners. Since Phoenix echo votes its record date shares in the same proportion as the voted shares received from policyholders and contractowners, effectively 100% of the outstanding shares were voted.
Meeting 5: A Special Meeting of Shareholders of the Phoenix-Northern Nasdaq-100 Index® Series of The Phoenix Edge Series Fund was held on October 26, 2006 to approve the following matter:
| | 1. | To consider and act upon a proposal to approve the Agreement and Plan of Reorganization, dated October 26, 2006 and the transactions it contemplates, including (a) the transfer of all the assets of the Phoenix-Northern Nasdaq-100 Index® Series (the “Acquired Series”) to the Phoenix-Van Kampen Equity 500 Index Series (the “Acquiring Series”), another series of The Phoenix Edge Series Fund in exchange solely for the shares of the Acquiring Series and the assumption by the Acquiring Series of all liabilities of the Acquired Series and (b) the distribution of the shares of the Acquiring Series so received to shareholders of the Acquired Series in complete liquidation of the Acquired Series. On the record date of August 25, 2006 there were 5,043,678.983 shares outstanding and 100% of the shares outstanding and entitled to vote were present by proxy. |
NUMBER OF VOTES
| | | | | | |
| | | For | | Against | | Abstain |
1. Approve Agreement and Plan of Reorganization | | 4,153,471.980 | | 547,094.194 | | 307,118.589 |
Of the shares outstanding 773,359.041 shares or 15.342%, were voted by policyholders and contractowners. Since Phoenix echo votes its record date shares in the same proportion as the voted shares received from policyholders and contractowners, effectively 100% of the outstanding shares were voted.
Meeting 6: A Special Meeting of Shareholders of the Phoenix-Northern Dow 30 Series of The Phoenix Edge Series Fund was held on October 26, 2006 to approve the following matter:
| | 1. | To consider and act upon a proposal to approve the Agreement and Plan of Reorganization, dated October 26, 2006 and the transactions it contemplates, including (a) the transfer of all the assets of the Phoenix-Northern Dow 30 Series (the “Acquired Series”) to the Phoenix-Van Kampen Equity 500 Index Series (the “Acquiring Series”), another series of The Phoenix Edge Series Fund in exchange solely for the shares of the Acquiring Series and the assumption by the Acquiring Series of all liabilities of the Acquired Series and (b) the distribution of the shares of the Acquiring Series so received to shareholders of the Acquired Series in complete liquidation of the Acquired Series. On the record date of August 25, 2006 there were 2,313,232.046 shares outstanding and 100% of the shares outstanding and entitled to vote were present by proxy. |
NUMBER OF VOTES
| | | | | | |
| | | For | | Against | | Abstain |
1. Approve Agreement and Plan of Reorganization | | 2,057,350.602 | | 137,183.290 | | 118,652.357 |
Of the shares outstanding 315,445.510 shares or 13.636%, were voted by policyholders and contractowners. Since Phoenix echo votes its record date shares in the same proportion as the voted shares received from policyholders and contractowners, effectively 100% of the outstanding shares were voted.
44
THE PHOENIX EDGE SERIES FUND
RESULTS OF SHAREHOLDER MEETINGS (Continued)
December 31, 2006
(Unaudited)
Meeting 7: A Special Meeting of Shareholders of the Phoenix-Engemann Small-Cap Growth Series of The Phoenix Edge Series Fund was held on October 26, 2006 to approve the following matter:
| | 1. | To consider and act upon a proposal to approve the Agreement and Plan of Reorganization, dated October 26, 2006 and the transactions it contemplates, including (a) the transfer of all the assets of the Phoenix-Engemann Small-Cap Growth Series (the “Acquired Series”) to the Phoenix-Alger Small-Cap Growth Series (the “Acquiring Series”), another series of The Phoenix Edge Series Fund in exchange solely for the shares of the Acquiring Series and the assumption by the Acquiring Series of all liabilities of the Acquired Series and (b) the distribution of the shares of the Acquiring Series so received to shareholders of the Acquired Series in complete liquidation of the Acquired Series. On the record date of August 25, 2006 there were 2,127,089.823 shares outstanding and 100% of the shares outstanding and entitled to vote were present by proxy. |
NUMBER OF VOTES
| | | | | | |
| | | For
| | Against
| | Abstain
|
1. Approve Agreement and Plan of Reorganization | | 1,957,813.344 | | 91,367.679 | | 77,424.816 |
Of the shares outstanding 315, 850.381 shares or 14.852%, were voted by policyholders and contractowners. Since Phoenix echo votes its record date shares in the same proportion as the voted shares received from policyholders and contractowners, effectively 100% of the outstanding shares were voted.
Meeting 8: A Special Meeting of Shareholders of the Phoenix-Kayne Small-Cap Quality Value Series of The Phoenix Edge Series Fund was held on October 26, 2006 to approve the following matter:
| | 1. | To consider and act upon a proposal to approve the Agreement and Plan of Reorganization, dated October 26, 2006 and the transactions it contemplates, including (a) the transfer of all the assets of the Phoenix-Kayne Small-Cap Quality Value Series (the “Acquired Series”) to the Phoenix-Alger Small-Cap Growth Series (the “Acquiring Series”), another series of The Phoenix Edge Series Fund in exchange solely for the shares of the Acquiring Series and the assumption by the Acquiring Series of all liabilities of the Acquired Series and (b) the distribution of the shares of the Acquiring Series so received to shareholders of the Acquired Series in complete liquidation of the Acquired Series. On the record date of August 25, 2006 there were 1,257,189.101 shares outstanding and 100% of the shares outstanding and entitled to vote were present by proxy. |
NUMBER OF VOTES
| | | | | | |
| | | For
| | Against
| | Abstain
|
1. Approve Agreement and Plan of Reorganization | | 1,171,650.806 | | 3,920.962 | | 80,008.709 |
Of the shares outstanding 257,238.883 shares or 20.487%, were voted by policyholders and contractowners. Since Phoenix echo votes its record date shares in the same proportion as the voted shares received from policyholders and contractowners, effectively 100% of the outstanding shares were voted.
45
FUND MANAGEMENT TABLES
Information pertaining to the Trustees and officers of the Trust as of December 31, 2006, is set forth below. The statement of additional information (SAI) includes additional information about the Trustees and is available without charge, upon request, by calling (800) 541-0171.
| | | | | | |
Name, Address, and Date of Birth | | Position with the Trust and Length of Time Served | | Number of
Portfolios in Fund Complex Overseen by Trustee | | Principal Occupation(s) During Past 5 Years and Other Directorships Held by Trustee |
| DISINTERESTED TRUSTEES |
| | | |
Frank M. Ellmer, CPA c/o The Phoenix Edge Series Fund 101 Munson Street Greenfield, MA 01301 DOB: 4/11/40 | | Trustee Served since 1999 | | 18 | | Retired. |
| | | |
John A. Fabian c/o The Phoenix Edge Series Fund 101 Munson Street Greenfield, MA 01301 DOB: 2/5/34 | | Trustee Served since 1999 | | 18 | | Retired. |
| | | |
Roger A. Gelfenbien c/o The Phoenix Edge Series Fund 101 Munson Street Greenfield, MA 01301 DOB: 5/14/43 | | Trustee Served since 2000 | | 18 | | Retired. Director, Webster Bank (2003-present). Director USAllianz Variable Insurance Product Trust, 23 funds (1999-present). Chairman/Trustee, The University of Connecticut (1997-2003). |
| | | |
Eunice S. Groark c/o The Phoenix Edge Series Fund 101 Munson Street Greenfield, MA 01301 DOB: 2/1/38 | | Trustee Served since 1999 | | 18 | | Attorney. Director, Peoples’ Bank (1995-present). |
| | | |
Frank E. Grzelecki c/o The Phoenix Edge Series Fund 101 Munson Street Greenfield, MA 01301 DOB: 6/19/37 | | Trustee Served since 2000 | | 18 | | Retired. Director, Barnes Group Inc. (1997-present). |
| | | |
John R. Mallin c/o The Phoenix Edge Series Fund 101 Munson Street Greenfield, MA 01301 DOB: 7/28/50 | | Trustee Served since 1999 | | 18 | | Partner/Attorney, McCarter & English, LLP (2003-present); Principal/Attorney, Cummings & Lockwood, LLC (1996-2003). |
46
FUND MANAGEMENT TABLES
| | | | | | |
Name, Address, and Date of Birth | | Position with the Trust and Length of Time Served | | Number of
Portfolios in Fund Complex Overseen by Trustee | | Principal Occupation(s) During Past 5 Years and Other Directorships Held by Trustee |
| INTERESTED TRUSTEES |
| | | |
*Philip R. McLoughlin 200 Bridge Street Chatham, MA 20633 DOB: 10/23/46 | | Chairman/ Trustee Served since 2003 | | 80 | | Partner, Cross Pond Partners, LLC, (2006-present). Director, PXRE Corporation (Reinsurance) (1985-present), World Trust Fund (1991-present). Director/Trustee, Phoenix Funds Complex (1989-present). Management Consultant (2002-2004), Chairman (1997-2002), Chief Executive Officer (1995-2002) and Director (1995-2002), Phoenix Investment Partners, Ltd. Director and Executive Vice President, The Phoenix Companies, Inc. (2000-2002). Director (1994-2002) and Executive Vice President, Investments (1987-2002), Phoenix Life Insurance Company. Director (1983-2002) and Chairman (1995-2002), Phoenix Investment Counsel, Inc. Director (1982-2002), and Chairman (2000-2002), Phoenix Equity Planning Corporation. Chairman and President, Phoenix/Zweig Advisers LLC (2001-2002). Director (2001-2002) and President (April 2002-September 2002), Phoenix Investment Management Company. Director and Executive Vice President, Phoenix Life and Annuity Company (1996-2002). Executive Vice President (1994-2002) and Chief Investment Counsel (1994-2002), PHL Variable Insurance Company. Director, Phoenix National Trust Holding Company (2001-2002). Director (1985-2002) and Vice President (1986-2002) and Executive Vice President (April 2002-September 2002), PM Holdings, Inc. Director, WS Griffith Associates, Inc. (1995-2002). Director, WS Griffith Securities, Inc. (1992-2002) |
| | | |
**Philip K. Polkinghorn One American Row Hartford, CT 06102 DOB: 7/29/57 | | Trustee/ President Served since 2004 | | 18 | | Executive Vice President, The Phoenix Companies, Inc. (2004-present). Vice President, Sun Life Financial Company (2001-2004). |
| * | Mr. McLoughlin is an “interested person” as defined in the Investment Company Act of 1940, by reason of his former relationship with Phoenix Investment Partners, Ltd. and its affiliates. |
| ** | Mr. Polkinghorn is an “interested person” as defined under the Investment Company Act of 1940, by reason of his position with the Trust’s advisors and/or their affiliates. |
47
FUND MANAGEMENT TABLES
| | | | |
Name, Address, Date of Birth and Position(s)
with Trust | | Length of Time
Served | | Principal Occupation(s) During Past 5 Years |
| OFFICERS WHO ARE NOT TRUSTEES |
| | |
Gina C. O’Connell One American Row Hartford, CT 06102 DOB: 10/17/62 Senior Vice President | | Served since 2004 | | Senior Vice President, Life and Annuity Planning (2004-present); Senior Vice President, Life and Annuity Manufacturing (2003-2004); Senior Vice President, Life and Annuity Operations (2002-2003); Vice President, various marketing and product development departments (1998-2002), Phoenix Life Insurance Company. Senior Vice President, PHL Variable Insurance Company (2003-present). Director, Phoenix Distribution Holding Company (2003-present). Senior Vice President, Phoenix Life and Annuity Company, (2004-present). Director and Senior Vice President, Phoenix Variable Advisors, Inc. (2005-present). |
| | |
Nancy G. Curtiss 56 Prospect Street Hartford, CT 06115 DOB: 11/24/52 Vice President | | Served since 1994 | | Vice President, Fund Accounting (1994-2000), Treasurer (1996-2000), Assistant Treasurer (2001-present), Phoenix Equity Planning Corporation. Vice President, Phoenix Investment Partners, Ltd. (2003-present). Chief Financial Officer and Treasurer or Assistant Treasurer, certain Funds within the Phoenix Fund Complex (1994-present). |
| | |
Marc Baltuch 900 Third Avenue New York, NY 10022 DOB: 9/23/45 Vice President and Assistant Secretary | | Served since 2004 | | Chief Compliance Officer, Zweig-DiMenna Associates LLC (1989-present); Vice President and Compliance Officer, certain of the Funds within the Phoenix Fund Complex; Vice President, The Zweig Total Return Fund, Inc. (2004-present); Vice President, The Zweig Fund, Inc. (2004-present); President and Director of Watermark Securities, Inc. (1991-present); Assistant Secretary of Gotham Advisors Inc. (1990-present); Secretary, Phoenix-Zweig Trust (1969-2003); Secretary, Phoenix-Euclid Market Neutral Fund (1999-2002). |
| | |
Kathleen A. McGah One American Row Hartford, CT 06102 DOB: 10/5/50 Vice President, Chief Legal Officer, Counsel and Secretary | | Secretary since 2005 | | Vice President and Counsel, Phoenix Life Insurance Company (2005-present); Vice President and Assistant Secretary, PHL Variable Insurance Company (2005-present); Vice President and Assistant Secretary, American Phoenix Life and Reassurance Company (2005-present); Vice President and Assistant Secretary, Phoenix Life and Annuity Company (2005-present); Vice President and Assistant Secretary, Phoenix Variable Advisors, Inc. (2005-present); and Vice President and Assistant Secretary, Phoenix Investment Counsel, Inc. (2006-present). Chief Legal Officer and Secretary of five mutual funds and six variable annuity separate accounts within the Travelers Life & Annuity complex (2004-2005), Assistant Secretary (1995-2004) of five mutual funds and six variable annuity separate accounts within the Travelers Life & Annuity complex. Deputy General Counsel (1999-2005), The Travelers Insurance Company. |
| | |
W. Patrick Bradley 56 Prospect Street Hartford, CT 06115 DOB: 3/2/72 Vice President, Chief Financial Officer, Treasurer and Principal Accounting Officer | | Served since 2006 | | Second Vice President, Mutual Fund Administration, Phoenix Investment Partners, Ltd. (2004-present). Chief Financial Officer and Treasurer (2005-present), certain funds within the Phoenix Fund Family. Assistant Treasurer, certain funds within the Phoenix Fund Complex (2004-present). Senior Manager (2002-2004), Manager (2000-2002), Audit Services, Deloitte & Touche, LLP. |
48
THE PHOENIX EDGE SERIES FUND
101 Munson Street
Greenfield, MA 01301
| | |
Board of Trustees Frank M. Ellmer, CPA John A. Fabian Roger A. Gelfenbien Eunice S. Groark Frank E. Grzelecki John R. Mallin Philip R. McLoughlin Philip K. Polkinghorn Executive Officers Philip R. McLoughlin, Chairman W. Patrick Bradley, Vice President, Chief Financial Officer, Treasurer and Principal Accounting Officer Philip K. Polkinghorn, President Gina C. O’Connell, Senior Vice President Nancy G. Curtiss, Vice President Marc Baltuch, Vice President and Assistant Secretary Kathleen A. McGah, Vice President, Chief
Legal Officer, Counsel and Secretary | | Investment Advisors Phoenix Investment Counsel, Inc. 56 Prospect Street Hartford, CT 06115-0480 Duff & Phelps Investment Management Co. 55 East Monroe Street, Suite 3600 Chicago, IL 60603 Phoenix Variable Advisors, Inc. One American Row Hartford, CT 06102-5056 Custodian State Street Bank and Trust Company 225 Franklin Street Boston, MA 02110 Independent Registered Public Accounting Firm PricewaterhouseCoopers LLP 125 High Street Boston, MA 02110-1707 |
49
THIS PAGE INTENTIONALLY BLANK.
Phoenix Life Insurance Company
PO Box 22012
Albany, NY 12201-2012
Not insured by FDIC/NCUSIF or any federal government agency.
No bank guarantee. Not a deposit. May lose value.
Phoenix Life Insurance Company
A member of The Phoenix Companies, Inc.
phoenixwm.com
| | |
BPD30932 | | |
G0144A © 2007 The Phoenix Companies, Inc. | | 2-07 |
FRANKLIN TEMPLETON VARIABLE INSURANCE PRODUCTS TRUST SEMIANNUAL REPORT
TABLEOF CONTENTS
| | |
Important Notes to Performance Information | | i |
*Prospectus Supplement for All Funds | | SUPP-1 |
Fund Summaries | | |
Templeton Developing Markets Securities Fund | | TD-1 |
Templeton Foreign Securities Fund | | TF-1 |
Templeton Global Asset Allocation Fund | | TGA-1 |
Templeton Global Income Securities Fund | | TGI-1 |
Templeton Growth Securities Fund | | TG-1 |
Index Descriptions | | I-1 |
Board Members and Officers | | BOD-1 |
Shareholder Information | | SI-1 |
*Not part of the annual report
NOT FDIC INSURED | MAY LOSE VALUE | NO BANK GUARANTEE
PHOENIXTIP A06 02/07
IMPORTANT NOTESTOPERFORMANCE INFORMATION
Performance data is historical and cannot predict or guarantee future results. Principal value and investment return will fluctuate with market conditions, and you may have a gain or loss when you withdraw your money. Inception dates of the funds may have preceded the effective dates of the subaccounts, contracts, or their availability in all states.
When reviewing the index comparisons, please keep in mind that indexes have a number of inherent performance differentials over the funds. First, unlike the funds, which must hold a minimum amount of cash to maintain liquidity, indexes do not have a cash component. Second, the funds are actively managed and, thus, are subject to management fees to cover salaries of securities analysts or portfolio managers in addition to other expenses. Indexes are unmanaged and do not include any commissions or other expenses typically associated with investing in securities. Third, indexes often contain a different mix of securities than the fund to which they are compared. Additionally, please remember that indexes are simply a measure of performance and cannot be invested in directly.
i
SUPPLEMENT DATED FEBRUARY 16, 2007
TOTHE PROSPECTUSES DATED MAY 1, 2006OF
FRANKLIN TEMPLETON VARIABLE INSURANCE PRODUCTS TRUST
FRANKLIN FLEX CAP GROWTH SECURITIES FUND
FRANKLIN GLOBAL COMMUNICATIONS SECURITIES FUND
FRANKLIN GROWTHAND INCOME SECURITIES FUND
FRANKLIN HIGH INCOME SECURITIES FUND
FRANKLIN INCOME SECURITIES FUND
FRANKLIN LARGE CAP GROWTH SECURITIES FUND
FRANKLIN LARGE CAP VALUE SECURITIES FUND
FRANKLIN MONEY MARKET FUND
FRANKLIN REAL ESTATE FUND
FRANKLIN RISING DIVIDENDS SECURITIES FUND
FRANKLIN SMALL CAP VALUE SECURITIES FUND
FRANKLIN SMALL-MID CAP GROWTH SECURITIES FUND
FRANKLIN STRATEGIC INCOME SECURITIES FUND
FRANKLIN U.S. GOVERNMENT FUND
FRANKLIN ZERO COUPON FUND —MATURINGIN DECEMBER 2010
MUTUAL DISCOVERY SECURITIES FUND
MUTUAL SHARES SECURITIES FUND
TEMPLETON DEVELOPING MARKETS SECURITIES FUND
TEMPLETON FOREIGN SECURITIES FUND
TEMPLETON GLOBAL ASSET ALLOCATION FUND
TEMPLETON GLOBAL INCOME SECURITIES FUND
TEMPLETON GROWTH SECURITIES FUND (THE “FUNDS”)
The prospectuses of the Funds are amended by adding the following after the first paragraph in the section titled “Overview”:
Shares of the Funds may also be offered to and purchased by other investment companies. Throughout this prospectus and the Statement of Additional Information, references to “Contracts,” “Contract Owners,” and “Insurers,” each defined below, may also include such investment company purchasers where appropriate.
Please keep this supplement for future reference.
SUPP-1
TEMPLETON DEVELOPING MARKETS SECURITIES FUND
This annual report for Templeton Developing Markets Securities Fund covers the fiscal year ended December 31, 2006.
Performance Summary as of 12/31/06
Average annual total return of Class 1 shares* represents the average annual change in value, assuming reinvestment of dividends and capital gains. Average returns smooth out variations in returns, which can be significant; they are not the same as year-by-year results.
Periods ended 12/31/06
| | | | | | |
| | | 1-Year | | 5-Year | | 10-Year |
Average Annual Total Return | | +28.43% | | +25.80% | | +5.46% |
*Performance prior to the 5/1/00 merger reflects historical performance of Templeton Developing Markets Fund.
Total Return Index Comparison
for Hypothetical $10,000 Investment (1/1/97–12/31/06)
The graph below shows the change in value of a hypothetical $10,000 investment in the Fund over the indicated period and includes reinvestment of any income or distributions. The Fund’s performance* is compared to the performance of the Morgan Stanley Capital International (MSCI) Emerging Markets (EM) Index and the Standard & Poor’s/International Finance Corporation Investable (S&P/IFCI) Composite Index. One cannot invest directly in an index, nor is an index representative of the Fund’s portfolio. Please see Important Notes to Performance Information preceding the Fund Summaries.
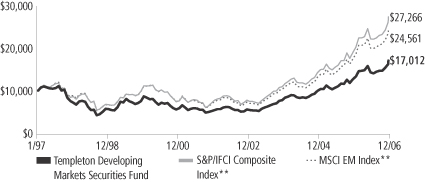
**Source: Standard & Poor’s Micropal. Please see Index Descriptions following the Fund Summaries.
Templeton Developing Markets Securities Fund Class 1
Performance reflects the Fund’s Class 1 operating expenses, but does not include any contract fees, expenses or sales charges. If they had been included, performance would be lower. These charges and deductions, particularly for variable life policies, can have a significant effect on contract values and insurance benefits. See the contract prospectus for a complete description of these expenses, including sales charges.
Performance data represent past performance, which does not guarantee future results. Investment return and principal value will fluctuate, and you may have a gain or loss when you sell your shares.
Current performance may differ from figures shown.
TD-1
Fund Goal and Main Investments: Templeton Developing Markets Securities Fund seeks long-term capital appreciation. The Fund normally invests at least 80% of its net assets in emerging market investments and normally invests primarily to predominantly in equity securities.
Performance Overview
You can find the Fund’s one-year total return in the Performance Summary. The Fund underperformed the MSCI EM Index’s +32.59% return, and the S&P/IFCI Composite Index’s +35.11% return for the same period.1 Please note that index performance numbers are purely for reference and that we do not attempt to track an index but rather undertake investments on the basis of fundamental research.
Economic and Market Overview
During the 12 months under review, strong investor confidence, continuing fund inflows, robust corporate earnings and a supportive economic environment led emerging markets to end 2006 at historical highs. After the markets experienced a correction in May, they recovered as fund flows stabilized, robust economic data was reported and the U.S. showed signs of an easing monetary policy. In addition, the interest rate spread on emerging market bonds relative to U.S. Treasury yields maintained a downward trend during the year, falling from about 250 basis points (100 basis points equal one percentage point) to about 170 basis points due to rising liquidity and low inflation.2 We believe this signaled greater investor confidence in emerging markets.
Eastern European markets recorded the strongest returns in 2006. Russia benefited from high commodity prices that supported its exports and from strong foreign investor participation, while a weaker U.S. dollar enhanced returns in Poland and the Czech Republic. Turkey was one of the few emerging markets to end the year with a negative return. Although that market recovered some of the losses from the correction earlier in the year, investors remained cautious due to slow progress for European Union accession talks and expectations of slower growth after a substantial interest rate increase in the second quarter.
In South Africa, a consumer spending boom, propelled by low borrowing rates and greater domestic demand, led to higher corporate earnings in related companies. Foreign investment reached a record high, which boosted returns for South Africa’s markets.
1. Source: Standard & Poor’s Micropal. One cannot invest directly in an index, nor is an index representative of the Fund’s portfolio. Please see Index Descriptions following the Fund Summaries.
2. Source: J.P. Morgan.
Fund Risks: The Fund’s investments in stocks offer the potential for long-term gains but can be subject to short-term price fluctuation. Investing in emerging markets is subject to all the risks of foreign investing generally, and has additional, heightened risks, including market and currency fluctuations, economic instability, adverse social and political developments, the relatively smaller size and lesser liquidity of these markets, and less effective or irregular government supervision and regulation of business and industry practices. The Fund’s prospectus also includes a description of the main investment risks.
TD-2
Latin American markets benefited from strong commodity prices, solid domestic demand and smooth power transitions in the region’s key
economies. International confidence in the region, especially in Brazil, remained high. A loosening monetary policy, growing foreign reserves and repayment of debt to foreign lenders further supported the Brazilian market.
Asian giants China and India continued to report strong economic growth, which led to significant fund inflows that pushed markets to record highs. Elsewhere in the region, Thailand and South Korea struggled with strong local currencies, which threatened to erode their export competitiveness. North Korea’s nuclear test in October exposed the region to geopolitical tensions. However, the resumption of six-party talks could yield some positive results in the longer term. Although a military coup and capital controls in Thailand initially rattled investor confidence in the nation’s financial markets, we continued to search for opportunities among Thai equities.
Investment Strategy
Our investment philosophy is bottom-up, value-oriented and long-term. In choosing investments, we may make onsite visits to companies to assess critical factors such as management strength and local conditions. In addition, we focus on the market price of a company’s securities relative to our evaluation of the company’s potential long-term (typically five years) earnings, asset value, cash flow and balance sheet. Among factors we consider are a company’s historical value measures, including price/earnings ratio, book value, profit margins and liquidation value. We perform in-depth research to construct an action list from which we make our investment decisions.
Manager’s Discussion
During the 12 months under review, relative to the MSCI EM index, the Fund’s performance benefited from underweighted exposure to Israel and exposure to Croatia (not in the index). Stock selection in South Africa, with the Fund’s overweighted exposure to non-index holdings Anglo American and Remgro, benefited the Fund’s relative performance. An underweighted position in Sasol also had a positive impact. In Israel, the largest contributor to performance was the Fund’s underweighted position in Teva Pharmaceutical. The Fund only held one Croatian stock, Pliva, which outperformed the index and contributed to relative performance. At the sector level, stock selection in the pharmaceuticals and biotechnology, automobiles, and components and
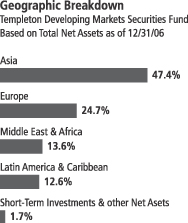
TD-3
diversified financials sectors contributed to relative Fund performance during the period.3 The Fund also benefited from an underweighted position in the technology hardware and equipment sector, which underperformed the broader MSCI EM index.4
It is important to recognize the effect of currency movements on the Fund’s performance. In general, if the value of the U.S. dollar goes up compared with a foreign currency, an investment traded in that foreign currency will go down in value because it will be worth fewer U.S. dollars. This can have a negative effect on Fund performance. Conversely, when the U.S. dollar weakens in relation to a foreign currency, an investment traded in that foreign currency will increase in value, which can contribute to Fund performance. For the 12 months ended December 31, 2006, the U.S. dollar declined in value relative to most non-U.S. currencies. As a result, the Fund’s performance was positively affected by the portfolio’s investment predominantly in securities with non-U.S. currency exposure. However, one cannot expect the same result in future periods.
Conversely, the Fund’s underweighted exposure to India and overweighted exposure to Turkey detracted from Fund returns relative to the index. The Fund’s positions in Poland and China also detracted from relative performance mainly due to an overweighted position in underperforming Telekomunikacja Polska and an underweighted position in China Life Insurance, which significantly outperformed the MSCI EM index. Overweighted positions in Turkish companies Arcelik, Turkiye Vakiflar Bankasi (Vakifbank) and Tupras-Turkiye Petrol Rafineleri (Tupras) negatively affected relative performance as these stocks declined in value during the reporting period. Despite a small decline for the year under review, the Turkish market actually rebounded more than 20% after a June correction. Moreover, we believed these companies’ valuations generally remained attractive, so we increased some of our holdings at lower prices during the year. By industry, the Fund’s positions in the banks, capital goods and insurance industries had a negative impact on relative performance partly due to overweighted positions in stocks such as KOC Holding and Old Mutual, as well as a position in HSBC Holdings, which is not an index component.5
3. The pharmaceuticals and biotechnology sector comprises pharmaceuticals in the SOI. The automobiles and components sector comprises automobiles in the SOI. The diversified financials sector comprises consumer finance and diversified financial services in the SOI.
4. The technology hardware and equipment sector comprises communications equipment, computers and peripherals, and electronic equipment and instruments in the SOI.
5. The banks sector comprises commercial banks in the SOI. The capital goods sector comprises building products, construction and engineering, construction materials and industrial conglomerates in the SOI.
Top 10 Holdings
Templeton Developing Markets Securities Fund
12/31/06
| | |
Company
Sector/Industry,
Country | | % of Total
Net Assets |
| Samsung Electronics Co. Ltd. | | 4.4% |
| Semiconductors & Semiconductor Equipment, South Korea | | |
| PetroChina Co. Ltd. | | 4.3% |
| Oil, Gas & Consumable Fuels, China | | |
| Petroleo Brasileiro SA, ADR, pfd. | | 3.3% |
| Oil, Gas & Consumable Fuels, Brazil | | |
| Remgro Ltd. | | 3.0% |
| Diversified Financial Services, South Africa | | |
| Gazprom | | 3.0% |
| Oil, Gas & Consumable Fuels, Russia | | |
| Akbank TAS | | 2.7% |
| Commercial Banks, Turkey | | |
| Old Mutual PLC | | 2.6% |
| Insurance, South Africa | | |
| Taiwan Semiconductor Manufacturing Co. Ltd. | | 2.4% |
| Semiconductors & Semiconductor Equipment, Taiwan | | |
| Anglo American PLC | | 2.2% |
| Metals & Mining, South Africa | | |
| LUKOIL, ADR | | 2.0% |
| Oil, Gas & Consumable Fuels, Russia | | |
The dollar value, number of shares or principal amount, and names of all portfolio holdings are listed in the Fund’s Statement of Investments (SOI).
TD-4
The Fund increased its exposure to Eastern and Southern Europe during the year under review. More specifically, we increased our allocations in Turkey, Russia, Hungary and Austria. Turkish investments included major commercial banks Akbank and Vakifbank; Tupras, the country’s largest industrial company with a dominant market share in oil refining; and Turkcell, a leading provider of mobile communications services. Turkey’s financial market correction lowered valuations and provided the Fund with an opportunity to build positions at what we considered attractive prices. The Fund also purchased MOL Magyar Olaj-es Gazipari, a Hungarian integrated oil and gas company with large exposure to Central and Eastern Europe; Russia’s Gazprom, the world’s largest gas producer in terms of reserves and production; and Austria’s OMV, one of the leading oil and gas groups in Central and Eastern Europe.
We also significantly increased our investments in South Africa during the reporting period. The Fund increased its holdings in consumer sectors such as insurance, wireless telecommunications, banking, home furnishing and retail clothing. Significant additions included Old Mutual, a major financial services group involved in life insurance, short-term insurance, asset management and banking; MTN Group, a dominant wireless telecommunications services provider in Africa; JD Group, the country’s leading furniture retailer; and Edgars Consolidated Stores, a leading specialty fashion retailer in southern Africa. Higher disposable incomes and strong consumer demand could lead to greater consumption of the products and services offered by these sectors of the economy.
We also undertook selective investments in Israel, Brazil and Pakistan. Purchases included Petroleo Brasileiro, Brazil’s national oil and gas company; Teva Pharmaceutical, which is among the world’s largest generic pharmaceutical companies; and Pakistan Telecommunications, the country’s dominant integrated telecommunication services provider.
The Fund increased its exposure to the oil, gas and consumable fuels industry. We believe energy stocks will benefit from greater revenues and earnings due to relatively higher oil prices in recent years. The correction in commodity prices during the year provided the Fund with an opportunity to build positions at lower prices. The consumer finance and banking industries also helped performance. We believe higher incomes, credit growth and greater demand for financial services should benefit banks. The Fund also invested in semiconductors and computer hardware companies in an attempt to benefit from greater export demand for Asian information technology products.
Top 10 Countries
Templeton Developing Markets Securities Fund
12/31/06
| | |
| | | % of Total
Net Assets |
| South Korea | | 15.0% |
| South Africa | | 13.1% |
| Taiwan | | 12.3% |
| China | | 11.5% |
| Brazil | | 9.9% |
| Russia | | 8.7% |
| Turkey | | 7.9% |
| Hungary | | 3.5% |
| Thailand | | 2.7% |
| Mexico | | 2.3% |
TD-5
On the other hand, we substantially reduced the Fund’s holdings in Singapore and South Korea as certain stocks reached their sell targets. Specific sales included Daewoo Shipping, South Korea’s major shipbuilder; CJ Corporation, a prominent integrated food maker in South Korea; Singapore Telecom, a leading integrated telecommunications services provider in Singapore; and shares of Fraser and Neave, a dominant player in the Singapore soft drinks and beer market. One of the largest sales during the year was Pliva, a Croatian pharmaceutical company. We sold our Pliva shares after the company was the subject of a takeover battle and the share price went far above our sell limit. We also sold stocks selectively in Mexico, India and China as the Fund continued to realign its exposure seeking to benefit from the continued economic recovery in emerging markets.
Thank you for your participation in Templeton Developing Markets Securities Fund. We look forward to serving your future investment needs.
The foregoing information reflects our analysis, opinions and portfolio holdings as of December 31, 2006, the end of the reporting period. The way we implement our main investment strategies and the resulting portfolio holdings may change depending on factors such as market and economic conditions. These opinions may not be relied upon as investment advice or an offer for a particular security. The information is not a complete analysis of every aspect of any market, country, industry, security or the Fund. Statements of fact are from sources considered reliable, but the investment manager makes no representation or warranty as to their completeness or accuracy. Although historical performance is no guarantee of future results, these insights may help you understand our investment management philosophy.
TD-6
Fund Expenses
As an investor in a variable insurance contract (“Contract”) that indirectly provides for investment in an underlying mutual fund, you can incur transaction and/or ongoing expenses at both the Fund level and the Contract level.
| • | | Transaction expenses can include sales charges (loads) on purchases, redemption fees, surrender fees, transfer fees and premium taxes. |
| • | | Ongoing expenses can include management fees, distribution and service (12b-1) fees, contract fees, annual maintenance fees, mortality and expense risk fees and other fees and expenses. All mutual funds and Contracts have some types of ongoing expenses. |
The expenses shown in the table are meant to highlight ongoing expenses at the Fund level only and do not include ongoing expenses at the Contract level, or transaction expenses at either the Fund or Contract level. While the Fund does not have transaction expenses, if the transaction and ongoing expenses at the Contract level were included, the expenses shown would be higher. You should consult your Contract prospectus or disclosure document for more information.
The table shows Fund-level ongoing expenses and can help you understand these expenses and compare them with those of other mutual funds offered through the Contract. The table assumes a $1,000 investment held for the six months indicated. Please refer to the Fund prospectus for additional information on operating expenses.
Actual Fund Expenses
The first line (Actual) of table provides actual account values and expenses. The “Ending Account Value” is derived from the Fund’s actual return, which includes the effect of ongoing Fund expenses, but does not include the effect of ongoing Contract expenses.
You can estimate the Fund-level expenses you incurred during the period by following these steps. Of course, your account value and expenses will differ from those in this illustration:
| 1. | Divide your account value by $1,000. |
If an account had an $8,600 value, then $8,600 ÷ $1,000 = 8.6.
| 2. | Multiply the result by the number under the heading “Fund-level Expenses Incurred During Period.” |
If Fund-level Expenses Incurred During Period were $7.50, then 8.6 × $7.50 = $64.50.
In this illustration, the estimated expenses incurred this period at the Fund level are $64.50.
Templeton Developing Markets Securities Fund Class 1
TD-7
Hypothetical Example for Comparison with Other Mutual Funds
Information in the second line (Hypothetical) of the table can help you compare ongoing expenses of the Fund with those of other mutual funds offered through the Contract. This information may not be used to estimate the actual ending account balance or expenses you incurred during the period. The hypothetical “Ending Account Value” is based on the Fund’s actual expense ratio and an assumed 5% annual rate of return before expenses, which does not represent the Fund’s actual return. The figure under the heading “Fund-Level Expenses Incurred During Period” shows the hypothetical expenses your account would have incurred under this scenario. You can compare this figure with the 5% hypothetical examples that appear in shareholder reports of other funds offered through a Contract.
| | | | | | | | | |
| Class 1 | | Beginning
Account
Value 7/1/06 | | Ending
Account
Value 12/31/06 | | Fund-Level
Expenses Incurred
During Period*
7/1/06-12/31/06 |
Actual | | $ | 1,000 | | $ | 1,212.50 | | $ | 8.31 |
Hypothetical (5% return before expenses) | | $ | 1,000 | | $ | 1,017.69 | | $ | 7.58 |
*Expenses are equal to the annualized expense ratio for the Fund’s Class 1 shares (1.49%), which does not include any ongoing expenses of the Contract for which the Fund is an investment option, multiplied by the average account value over the period, multiplied by 184/365 to reflect the one-half year period.
TD-8
Franklin Templeton Variable Insurance Products Trust
Financial Highlights
Templeton Developing Markets Securities Fund
| | | | | | | | | | | | | | | | | | | | |
| | | Year Ended December 31, | |
| Class 1 | | 2006 | | | 2005 | | | 2004 | | | 2003 | | | 2002 | |
| | | | |
Per share operating performance | | | | | | | | | | | | | | | | | | | | |
(for a share outstanding throughout the year) | | | | | | | | | | | | | | | | | | | | |
Net asset value, beginning of year | | $ | 10.99 | | | $ | 8.73 | | | $ | 7.14 | | | $ | 4.71 | | | $ | 4.78 | |
| | | | |
Income from investment operationsa: | | | | | | | | | | | | | | | | | | | | |
Net investment incomeb | | | 0.24 | | | | 0.17 | | | | 0.11 | | | | 0.13 | | | | 0.07 | |
Net realized and unrealized gains (losses) | | | 2.84 | | | | 2.23 | | | | 1.62 | | | | 2.38 | | | | (0.06 | ) |
| | | | |
Total from investment operations | | | 3.08 | | | | 2.40 | | | | 1.73 | | | | 2.51 | | | | 0.01 | |
| | | | |
Less distributions from net investment income | | | (0.15 | ) | | | (0.14 | ) | | | (0.14 | ) | | | (0.08 | ) | | | (0.08 | ) |
| | | | |
Redemption fees | | | — | d | | | — | d | | | — | | | | — | | | | — | |
| | | | |
Net asset value, end of year | | $ | 13.92 | | | $ | 10.99 | | | $ | 8.73 | | | $ | 7.14 | | | $ | 4.71 | |
| | | | |
| | | | | |
Total returnc | | | 28.43% | | | | 27.76% | | | | 24.83% | | | | 53.74% | | | | 0.04% | |
Ratios/supplemental data | | | | | | | | | | | | | | | | | | | | |
Net assets, end of year (000’s) | | $ | 749,120 | | | $ | 651,826 | | | $ | 477,290 | | | $ | 359,299 | | | $ | 225,454 | |
Ratios to average net assets: | | | | | | | | | | | | | | | | | | | | |
Expenses | | | 1.47% | e | | | 1.53% | e | | | 1.54% | e | | | 1.55% | | | | 1.58% | |
Net investment income | | | 1.93% | | | | 1.77% | | | | 1.52% | | | | 2.35% | | | | 1.45% | |
Portfolio turnover rate | | | 53.65% | | | | 31.24% | | | | 55.67% | | | | 46.20% | | | | 57.91% | |
| a | The amount shown for a share outstanding throughout the period may not correlate with the Statement of Operations for the period due to the timing of sales and repurchase of the Fund shares in relation to income earned and/or fluctuating market value of the investments of the Fund. |
| b | Based on average daily shares outstanding. |
| c | Total return does not include any fees, charges or expenses imposed by the variable annuity and life insurance contracts for which the Franklin Templeton Variable Insurance Products Trust serves as an underlying investment vehicle. |
| d | Amount rounds to less than $0.01 per share. |
| e | Benefit of expense reduction rounds to less than 0.01%. |
The accompanying notes are an integral part of these financial statements.
TD-9
Franklin Templeton Variable Insurance Products Trust
Financial Highlights (continued)
Templeton Developing Markets Securities Fund
| | | | | | | | | | | | | | | | | | | | |
| | | Year Ended December 31, | |
| Class 2 | | 2006 | | | 2005 | | | 2004 | | | 2003 | | | 2002 | |
| | | | |
Per share operating performance | | | | | | | | | | | | | | | | | | | | |
(for a share outstanding throughout the year) | | | | | | | | | | | | | | | | | | | | |
Net asset value, beginning of year | | $ | 10.90 | | | $ | 8.67 | | | $ | 7.09 | | | $ | 4.69 | | | $ | 4.76 | |
| | | | |
Income from investment operationsa: | | | | | | | | | | | | | | | | | | | | |
Net investment incomeb | | | 0.20 | | | | 0.14 | | | | 0.09 | | | | 0.11 | | | | 0.06 | |
Net realized and unrealized gains (losses) | | | 2.82 | | | | 2.21 | | | | 1.63 | | | | 2.35 | | | | (0.06 | ) |
| | | | |
Total from investment operations | | | 3.02 | | | | 2.35 | | | | 1.72 | | | | 2.46 | | | | — | |
| | | | |
Less distributions from net investment income | | | (0.13 | ) | | | (0.12 | ) | | | (0.14 | ) | | | (0.06 | ) | | | (0.07 | ) |
| | | | |
Redemption fees | | | — | d | | | — | d | | | — | | | | — | | | | — | |
| | | | |
Net asset value, end of year | | $ | 13.79 | | | $ | 10.90 | | | $ | 8.67 | | | $ | 7.09 | | | $ | 4.69 | |
| | | | |
| | | | | |
Total returnc | | | 28.09% | | | | 27.43% | | | | 24.71% | | | | 52.99% | | | | (0.15)% | |
Ratios/supplemental data | | | | | | | | | | | | | | | | | | | | |
Net assets, end of year (000’s) | | $ | 857,514 | | | $ | 650,646 | | | $ | 327,569 | | | $ | 170,953 | | | $ | 80,952 | |
Ratios to average net assets: | | | | | | | | | | | | | | | | | | | | |
Expenses | | | 1.72% | e | | | 1.78% | e | | | 1.79% | e | | | 1.80% | | | | 1.83% | |
Net investment income | | | 1.68% | | | | 1.52% | | | | 1.27% | | | | 2.10% | | | | 1.20% | |
Portfolio turnover rate | | | 53.65% | | | | 31.24% | | | | 55.67% | | | | 46.20% | | | | 57.91% | |
| a | The amount shown for a share outstanding throughout the period may not correlate with the Statement of Operations for the period due to the timing of sales and repurchase of the Fund shares in relation to income earned and/or fluctuating market value of the investments of the Fund. |
| b | Based on average daily shares outstanding. |
| c | Total return does not include any fees, charges or expenses imposed by the variable annuity and life insurance contracts for which the Franklin Templeton Variable Insurance Products Trust serves as an underlying investment vehicle. |
| d | Amount rounds to less than $0.01 per share. |
| e | Benefit of expense reduction rounds to less than 0.01%. |
The accompanying notes are an integral part of these financial statements.
TD-10
Franklin Templeton Variable Insurance Products Trust
Financial Highlights (continued)
Templeton Developing Markets Securities Fund
| | | | | | | | | | | | |
| | | Year Ended December 31, | |
| Class 3 | | 2006 | | | 2005 | | | 2004f | |
| | | | |
Per share operating performance | | | | | | | | | | | | |
(for a share outstanding throughout the year) | | | | | | | | | | | | |
Net asset value, beginning of year | | $ | 10.90 | | | $ | 8.68 | | | $ | 7.13 | |
| | | | |
Income from investment operationsa: | | | | | | | | | | | | |
Net investment incomeb | | | 0.20 | | | | 0.04 | | | | 0.08 | |
Net realized and unrealized gains (losses) | | | 2.83 | | | | 2.32 | | | | 1.61 | |
| | | | |
Total from investment operations | | | 3.03 | | | | 2.36 | | | | 1.69 | |
| | | | |
Less distributions from net investment income | | | (0.15 | ) | | | (0.14 | ) | | | (0.14 | ) |
| | | | |
Redemption fees | | | — | d | | | — | d | | | — | |
| | | | |
Net asset value, end of year | | $ | 13.78 | | | $ | 10.90 | | | $ | 8.68 | |
| | | | |
| | | |
Total returnc | | | 28.17% | | | | 27.45% | | | | 24.15% | |
Ratios/supplemental data | | | | | | | | | | | | |
Net assets, end of year (000’s) | | $ | 43,372 | | | $ | 11,521 | | | $ | 12 | |
Ratios to average net assets: | | | | | | | | | | | | |
Expenses | | | 1.72% | e | | | 1.78% | e | | | 1.54% | e,g |
Net investment income | | | 1.68% | | | | 1.52% | | | | 1.52% | g |
Portfolio turnover rate | | | 53.65% | | | | 31.24% | | | | 55.67% | |
| a | The amount shown for a share outstanding throughout the period may not correlate with the Statement of Operations for the period due to the timing of sales and repurchase of the Fund shares in relation to income earned and/or fluctuating market value of the investments of the Fund. |
| b | Based on average daily shares outstanding. |
| c | Total return does not include any fees, charges or expenses imposed by the variable annuity and life insurance contracts for which the Franklin Templeton Variable Insurance Products Trust serves as an underlying investment vehicle. Total return is not annualized for periods less than one year. |
| d | Amount rounds to less than $0.01 per share. |
| e | Benefit of expense reduction rounds to less than 0.01%. |
| f | For the period May 1, 2004 (effective date) to December 31, 2004. |
The accompanying notes are an integral part of these financial statements.
TD-11
Franklin Templeton Variable Insurance Products Trust
Statement of Investments, December 31, 2006
| | | | | | | |
| Templeton Developing Markets Securities Fund | | Industry | | Shares/
Rights | | Value |
Long Term Investments 98.3% | | | | | | | |
Austria 0.8% | | | | | | | |
OMV AG | | Oil, Gas & Consumable Fuels | | 83,060 | | $ | 4,713,568 |
Wienerberger AG | | Building Products | | 155,800 | | | 9,254,870 |
| | | | | | | |
| | | | | | | 13,968,438 |
| | | | | | | |
Brazil 9.9% | | | | | | | |
Banco Bradesco SA, ADR, pfd. | | Commercial Banks | | 728,772 | | | 29,405,950 |
Centrais Eletricas Brasileiras SA | | Electric Utilities | | 411,324,764 | | | 9,835,984 |
Companhia Vale do Rio Doce, ADR, pfd., A | | Metals & Mining | | 1,263,350 | | | 33,162,938 |
CPFL Energia SA | | Electric Utilities | | 409,872 | | | 5,755,282 |
Petroleo Brasileiro SA, ADR, pfd. | | Oil, Gas & Consumable Fuels | | 582,022 | | | 53,988,361 |
Souza Cruz SA | | Tobacco | | 639,338 | | | 11,386,291 |
Unibanco-Uniao de Bancos Brasileiros SA, GDR, pfd. | | Commercial Banks | | 221,000 | | | 20,544,160 |
| | | | | | | |
| | | | | | | 164,078,966 |
| | | | | | | |
China 11.5% | | | | | | | |
Aluminum Corp. of China Ltd., H | | Metals & Mining | | 27,316,000 | | | 25,282,351 |
aChina Coal Energy Co., H | | Oil, Gas & Consumable Fuels | | 2,739,000 | | | 1,778,080 |
a,bChina Coal Energy Co., H, 144A | | Oil, Gas & Consumable Fuels | | 1,076,000 | | | 698,508 |
China Mobile Ltd. | | Wireless Telecommunication Services | | 1,901,113 | | | 16,422,719 |
China Petroleum and Chemical Corp., H | | Oil, Gas & Consumable Fuels | | 19,412,000 | | | 17,966,796 |
China Shenhua Energy Co. Ltd., H | | Oil, Gas & Consumable Fuels | | 827,000 | | | 1,990,120 |
Citic Pacific Ltd. | | Industrial Conglomerates | | 878,959 | | | 3,033,757 |
CNOOC Ltd. | | Oil, Gas & Consumable Fuels | | 33,668,000 | | | 31,983,767 |
Denway Motors Ltd. | | Automobiles | | 18,950,234 | | | 7,673,491 |
PetroChina Co. Ltd., H | | Oil, Gas & Consumable Fuels | | 42,498,000 | | | 60,202,973 |
bPetroChina Co. Ltd., H, 144A | | Oil, Gas & Consumable Fuels | | 7,682,000 | | | 10,882,376 |
Shanghai Industrial Holdings Ltd. | | Industrial Conglomerates | | 3,999,000 | | | 8,512,940 |
Travelsky Technology Ltd., H | | IT Services | | 2,253,000 | | | 3,434,897 |
| | | | | | | |
| | | | | | | 189,862,775 |
| | | | | | | |
Czech Republic 0.2% | | | | | | | |
Philip Morris CR AS | | Tobacco | | 6,115 | | | 3,181,502 |
| | | | | | | |
Hong Kong 1.0% | | | | | | | |
Cheung Kong (Holdings) Ltd. | | Real Estate Management & Development | | 618,000 | | | 7,606,679 |
Cheung Kong Infrastructure Holdings Ltd. | | Electric Utilities | | 524,000 | | | 1,626,733 |
Dairy Farm International Holdings Ltd. | | Food & Staples Retailing | | 426,933 | | | 1,451,572 |
Hopewell Holdings Ltd. | | Transportation Infrastructure | | 724,000 | | | 2,540,792 |
MTR Corp. Ltd. | | Road & Rail | | 1,539,370 | | | 3,870,613 |
| | | | | | | |
| | | | | | | 17,096,389 |
| | | | | | | |
Hungary 3.5% | | | | | | | |
aMagyar Telekom PLC | | Diversified Telecommunication Services | | 2,692,482 | | | 14,957,841 |
MOL Magyar Olaj-es Gazipari Rt. | | Oil, Gas & Consumable Fuels | | 193,095 | | | 21,900,559 |
OTP Bank Nyrt. | | Commercial Banks | | 306,270 | | | 14,071,582 |
Richter Gedeon Nyrt. | | Pharmaceuticals | | 32,556 | | | 7,425,937 |
| | | | | | | |
| | | | | | | 58,355,919 |
| | | | | | | |
India 1.6% | | | | | | | |
Gail India Ltd. | | Gas Utilities | | 867,330 | | | 5,142,245 |
Indian Oil Corp. Ltd. | | Oil, Gas & Consumable Fuels | | 426,373 | | | 4,349,749 |
Oil & Natural Gas Corp. Ltd. | | Oil, Gas & Consumable Fuels | | 669,418 | | | 13,202,474 |
TD-12
Franklin Templeton Variable Insurance Products Trust
Statement of Investments, December 31, 2006 (continued)
| | | | | | | |
| Templeton Developing Markets Securities Fund | | Industry | | Shares/
Rights | | Value |
Long Term Investments (continued) | | | | | | | |
India (continued) | | | | | | | |
bOil & Natural Gas Corp. Ltd., 144A | | Oil, Gas & Consumable Fuels | | 193,545 | | $ | 3,817,156 |
Tata Chemicals Ltd. | | Chemicals | | 57,000 | | | 278,507 |
| | | | | | | |
| | | | | | | 26,790,131 |
| | | | | | | |
Indonesia 0.3% | | | | | | | |
PT Astra International Tbk | | Automobiles | | 2,577,500 | | | 4,499,555 |
| | | | | | | |
Israel 0.6% | | | | | | | |
aTaro Pharmaceutical Industries Ltd. | | Pharmaceuticals | | 306,702 | | | 3,067,020 |
Teva Pharmaceutical Industries Ltd., ADR | | Pharmaceuticals | | 205,240 | | | 6,378,859 |
| | | | | | | |
| | | | | | | 9,445,879 |
| | | | | | | |
Malaysia 1.3% | | | | | | | |
Maxis Communications Bhd. | | Wireless Telecommunication Services | | 5,093,500 | | | 14,717,762 |
Sime Darby Bhd. | | Industrial Conglomerates | | 3,660,700 | | | 7,466,584 |
| | | | | | | |
| | | | | | | 22,184,346 |
| | | | | | | |
Mexico 2.3% | | | | | | | |
Grupo Bimbo SA de CV, A | | Food Products | | 668,764 | | | 3,342,969 |
Kimberly Clark de Mexico SA de CV, A | | Household Products | | 4,538,033 | | | 20,962,056 |
Telefonos de Mexico SA de CV, L, ADR | | Diversified Telecommunication Services | | 474,564 | | | 13,411,178 |
| | | | | | | |
| | | | | | | 37,716,203 |
| | | | | | | |
Pakistan 0.3% | | | | | | | |
cPakistan Telecommunications Corp., A | | Diversified Telecommunication Services | | 6,012,103 | | | 4,381,250 |
| | | | | | | |
Panama 0.2% | | | | | | | |
Banco Latinoamericano de Exportaciones SA, E | | Commercial Banks | | 230,200 | | | 3,904,192 |
| | | | | | | |
Peru 0.1% | | | | | | | |
Compania de Minas Buenaventura SA, ADR | | Metals & Mining | | 58,100 | | | 1,630,286 |
| | | | | | | |
Philippines 0.4% | | | | | | | |
San Miguel Corp., B | | Beverages | | 4,239,593 | | | 6,698,643 |
| | | | | | | |
Poland 0.6% | | | | | | | |
aGrupa Lotos SA | | Oil, Gas & Consumable Fuels | | 86,100 | | | 1,462,036 |
Polski Koncern Naftowy Orlen SA | | Oil, Gas & Consumable Fuels | | 461,144 | | | 7,576,403 |
| | | | | | | |
| | | | | | | 9,038,439 |
| | | | | | | |
Russia 8.7% | | | | | | | |
bEvraz Group SA, GDR, 144A | | Metals & Mining | | 60,000 | | | 1,521,000 |
Gazprom | | Oil, Gas & Consumable Fuels | | 657,910 | | | 7,565,965 |
Gazprom, ADR | | Oil, Gas & Consumable Fuels | | 895,426 | | | 41,189,596 |
LUKOIL, ADR | | Oil, Gas & Consumable Fuels | | 383,176 | | | 33,490,446 |
Mining and Metallurgical Co. Norilsk Nickel | | Metals & Mining | | 130,562 | | | 20,498,234 |
Mobile Telesystems, ADR | | Wireless Telecommunication Services | | 143,300 | | | 7,192,227 |
a,bOAO TMK, 144A | | Energy Equipment & Services | | 184,274 | | | 1,529,474 |
TNK-BP | | Oil, Gas & Consumable Fuels | | 1,648,000 | | | 4,276,560 |
Unified Energy Systems | | Electric Utilities | | 21,157,300 | | | 22,849,884 |
aZAO Polyus Gold Co. | | Metals & Mining | | 56,819 | | | 2,801,177 |
| | | | | | | |
| | | | | | | 142,914,563 |
| | | | | | | |
TD-13
Franklin Templeton Variable Insurance Products Trust
Statement of Investments, December 31, 2006 (continued)
| | | | | | | |
| Templeton Developing Markets Securities Fund | | Industry | | Shares/
Rights | | Value |
Long Term Investments (continued) | | | | | | | |
Singapore 0.9% | | | | | | | |
ComfortDelGro Corp. Ltd. | | Road & Rail | | 6,447,000 | | $ | 6,768,835 |
Fraser and Neave Ltd. | | Industrial Conglomerates | | 3,005,005 | | | 8,818,365 |
| | | | | | | |
| | | | | | | 15,587,200 |
| | | | | | | |
South Africa 13.1% | | | | | | | |
Anglo American PLC | | Metals & Mining | | 754,236 | | | 36,803,811 |
Edgars Consolidated Stores Ltd. | | Specialty Retail | | 2,467,356 | | | 13,733,056 |
aImperial Holdings Ltd. | | Air Freight & Logistics | | 662,735 | | | 15,506,604 |
JD Group Ltd. | | Specialty Retail | | 847,960 | | | 9,624,429 |
Massmart Holdings Ltd. | | Food & Staples Retailing | | 106,590 | | | 1,067,611 |
MTN Group Ltd. | | Wireless Telecommunication Services | | 1,823,400 | | | 22,191,692 |
Nedbank Group Ltd. | | Commercial Banks | | 1,043,947 | | | 19,884,705 |
Old Mutual PLC | | Insurance | | 12,583,248 | | | 42,939,384 |
Remgro Ltd. | | Diversified Financial Services | | 1,919,805 | | | 48,759,692 |
Standard Bank Group Ltd. | | Commercial Banks | | 381,892 | | | 5,149,106 |
| | | | | | | |
| | | | | | | 215,660,090 |
| | | | | | | |
South Korea 15.0% | | | | | | | |
aGS Holdings Corp. | | Oil, Gas & Consumable Fuels | | 273,800 | | | 8,861,699 |
Hana Financial Group Inc. | | Commercial Banks | | 452,748 | | | 23,805,782 |
aHite Brewery Co. Ltd. | | Beverages | | 33,452 | | | 4,298,402 |
aHyundai Development Co. | | Construction & Engineering | | 259,620 | | | 15,856,361 |
aKangwon Land Inc. | | Hotels Restaurants & Leisure | | 1,267,005 | | | 27,519,894 |
LG Card Co. Ltd. | | Consumer Finance | | 358,580 | | | 23,866,776 |
aLG Corp. | | Industrial Conglomerates | | 93,390 | | | 2,997,518 |
aLotte Shopping Co. Ltd. | | Multiline Retail | | 36,570 | | | 15,178,516 |
Samsung Electronics Co. Ltd. | | Semiconductors & Semiconductor Equipment | | 109,028 | | | 71,864,692 |
Samsung Fine Chemicals Co. Ltd. | | Chemicals | | 12,670 | | | 317,431 |
aShinhan Financial Group Co. Ltd. | | Commercial Banks | | 331,000 | | | 16,905,914 |
aSK Corp. | | Oil, Gas & Consumable Fuels | | 248,030 | | | 19,469,022 |
SK Telecom Co. Ltd. | | Wireless Telecommunication Services | | 70,760 | | | 16,929,140 |
| | | | | | | |
| | | | | | | 247,871,147 |
| | | | | | | |
Sweden 0.9% | | | | | | | |
Oriflame Cosmetics SA, SDR | | Personal Products | | 354,688 | | | 14,599,197 |
| | | | | | | |
Taiwan 12.3% | | | | | | | |
Asustek Computer Inc. | | Computers & Peripherals | | 6,387,900 | | | 17,486,594 |
Chunghwa Telecom Co. Ltd. | | Diversified Telecommunication Services | | 6,265,860 | | | 11,652,942 |
D-Link Corp. | | Communications Equipment | | 7,292,411 | | | 9,556,113 |
Lite-On Technology Corp. | | Computers & Peripherals | | 9,937,092 | | | 13,433,448 |
MediaTek Inc. | | Semiconductors & Semiconductor Equipment | | 737,770 | | | 7,630,152 |
Mega Financial Holding Co. Ltd. | | Commercial Banks | | 24,442,503 | | | 17,965,259 |
President Chain Store Corp. | | Food & Staples Retailing | | 5,007,144 | | | 12,093,363 |
Realtek Semiconductor Corp. | | Semiconductors & Semiconductor Equipment | | 8,893,772 | | | 15,311,972 |
Siliconware Precision Industries Co. | | Semiconductors & Semiconductor Equipment | | 4,144,521 | | | 6,512,183 |
Sunplus Technology Co. Ltd. | | Semiconductors & Semiconductor Equipment | | 9,746,972 | | | 11,890,199 |
Synnex Technology International Corp. | | Electronic Equipment & Instruments | | 5,286,936 | | | 6,684,725 |
Taiwan Mobile Co. Ltd. | | Wireless Telecommunication Services | | 16,249,302 | | | 16,855,191 |
Taiwan Semiconductor Manufacturing Co. Ltd. | | Semiconductors & Semiconductor Equipment | | 19,298,004 | | | 39,975,917 |
United Microelectronics Corp. | | Semiconductors & Semiconductor Equipment | | 18,554,000 | | | 11,530,413 |
aYageo Corp. | | Electronic Equipment & Instruments | | 7,495,000 | | | 3,496,210 |
| | | | | | | |
| | | | | | | 202,074,681 |
| | | | | | | |
TD-14
Franklin Templeton Variable Insurance Products Trust
Statement of Investments, December 31, 2006 (continued)
| | | | | | | | |
| Templeton Developing Markets Securities Fund | | Industry | | Shares/
Rights | | Value |
Long Term Investments (continued) | | | | | | | | |
Thailand 2.7% | | | | | | | | |
Kasikornbank Public Co. Ltd., fgn. | | Commercial Banks | | | 6,272,600 | | $ | 11,058,886 |
PTT Public Co. Ltd., fgn. | | Oil, Gas & Consumable Fuels | | | 880,000 | | | 5,212,976 |
Siam Cement Public Co. Ltd., fgn. | | Construction Materials | | | 1,736,714 | | | 12,443,593 |
Siam Commercial Bank Public Co. Ltd., fgn. | | Commercial Banks | | | 4,325,000 | | | 7,076,164 |
Thai Airways International Public Co. Ltd., fgn. | | Airlines | | | 3,900,700 | | | 4,896,506 |
Thai Beverages Co. Ltd., fgn. | | Beverages | | | 17,228,000 | | | 3,033,395 |
aTrue Corp. Public Co. Ltd., fgn., rts., 3/28/08 | | Diversified Telecommunication Services | | | 344,616 | | | — |
| | | | | | | | |
| | | | | | | | 43,721,520 |
| | | | | | | | |
Turkey 7.9% | | | | | | | | |
Akbank TAS | | Commercial Banks | | | 7,419,776 | | | 45,079,529 |
Anadolu Efes Biracilik Ve Malt Sanayii AS | | Beverages | | | 19,690 | | | 608,575 |
Arcelik AS, Br. | | Household Durables | | | 2,342,781 | | | 13,820,008 |
aKOC Holding AS | | Industrial Conglomerates | | | 793,245 | | | 3,082,195 |
aMigros Turk TAS | | Food & Staples Retailing | | | 63,956 | | | 826,842 |
Tupras-Turkiye Petrol Rafineleri AS | | Oil, Gas & Consumable Fuels | | | 1,353,260 | | | 23,135,918 |
aTurk Hava Yollari Anonim Ortakligi | | Airlines | | | 420,000 | | | 1,809,961 |
a,bTurk Hava Yollari Anonim Ortakligi, 144A | | Airlines | | | 1,785,000 | | | 7,692,335 |
Turkcell Iletisim Hizmetleri AS | | Wireless Telecommunication Services | | | 3,706,728 | | | 18,723,494 |
Turkiye Vakiflar Bankasi T.A.O. | | Commercial Banks | | | 3,167,635 | | | 14,881,507 |
| | | | | | | | |
| | | | | | | | 129,660,364 |
| | | | | | | | |
United Kingdom 2.2% | | | | | | | | |
HSBC Holdings PLC | | Commercial Banks | | | 1,103,488 | | | 20,228,095 |
Provident Financial PLC | | Consumer Finance | | | 1,163,037 | | | 15,977,598 |
| | | | | | | | |
| | | | | | | | 36,205,693 |
| | | | | | | | |
Total Long Term Investments
(Cost $1,109,626,099) | | | | | | | | 1,621,127,368 |
| | | | | | | | |
| | | |
| | | | | Principal
Amount | | |
Short Term Investment (Cost $28,752,657) 1.7% | | | | | | | | |
U.S. Government and Agency Securities 1.7% | | | | | | | | |
dFHLB, 1/02/07 | | | | $ | 28,768,000 | | | 28,768,000 |
| | | | | | | | |
Total Investments (Cost $1,138,378,756) 100.0% | | | | | | | | 1,649,895,368 |
Other Assets, less Liabilities 0.0%e | | | | | | | | 110,384 |
| | | | | | | | |
Net Assets 100.0% | | | | | | | $ | 1,650,005,752 |
| | | | | | | | |
Selected Portfolio Abbreviations
ADR - American Depository Receipt
FHLB - Federal Home Loan Bank
GDR - Global Depository Receipt
SDR - Swedish Depository Receipt
a | Non-income producing for the twelve months ended December 31, 2006. |
b | Security was purchased pursuant to Rule 144A under the Securities Act of 1933 and may be sold in transactions exempt from registration only to qualified institutional buyers or in a public offering registered under the Securities Act of 1933. These securities have been deemed liquid under guidelines approved by the Trust’s Board of Trustees. At December 31, 2006, the aggregate value of these securities was $26,140,849, representing 1.58% of net assets. |
c | See Note 1(c) regarding securities purchased on a when-issued or delayed delivery basis. |
d | The security is traded on a discount basis with no stated coupon rate. |
e | Rounds to less than 0.1% of net assets. |
The accompanying notes are an integral part of these financial statements.
TD-15
Franklin Templeton Variable Insurance Products Trust
Financial Statements
Statement of Assets and Liabilities
December 31, 2006
| | | |
| | | Templeton Developing Markets Securities Fund |
Assets: | | | |
Investments in securities: | | | |
Cost | | $ | 1,138,378,756 |
| | | |
Value | | $ | 1,649,895,368 |
Foreign currency, at value (cost $1,695,601) | | | 1,696,692 |
Receivables: | | | |
Investment securities sold | | | 11,470,054 |
Capital shares sold | | | 1,404,800 |
Dividends | | | 3,549,718 |
Foreign tax | | | 234,375 |
| | | |
Total assets | | | 1,668,251,007 |
| | | |
Liabilities: | | | |
Payables: | | | |
Investment securities purchased | | | 12,629,482 |
Capital shares redeemed | | | 2,368,541 |
Affiliates | | | 2,198,422 |
Funds advanced by custodian | | | 203,564 |
Deferred taxes | | | 219,469 |
Accrued expenses and other liabilities | | | 625,777 |
| | | |
Total liabilities | | | 18,245,255 |
| | | |
Net assets, at value | | $ | 1,650,005,752 |
| | | |
Net assets consist of: | | | |
Paid-in capital | | $ | 993,247,172 |
Undistributed net investment income | | | 14,021,116 |
Net unrealized appreciation (depreciation) | | | 511,351,956 |
Accumulated net realized gain (loss) | | | 131,385,508 |
| | | |
Net assets, at value | | $ | 1,650,005,752 |
| | | |
Class 1: | | | |
Net assets, at value | | $ | 749,119,774 |
| | | |
Shares outstanding | | | 53,818,737 |
| | | |
Net asset value and maximum offering price per share | | $ | 13.92 |
| | | |
Class 2: | | | |
Net assets, at value | | $ | 857,514,239 |
| | | |
Shares outstanding | | | 62,180,852 |
| | | |
Net asset value and maximum offering price per share | | $ | 13.79 |
| | | |
Class 3: | | | |
Net assets, at value | | $ | 43,371,739 |
| | | |
Shares outstanding | | | 3,148,106 |
| | | |
Net asset value and maximum offering price per sharea | | $ | 13.78 |
| | | |
a | Redemption price is equal to net asset value less any redemption fees retained by the Fund. |
The accompanying notes are an integral part of these financial statements.
TD-16
Franklin Templeton Variable Insurance Products Trust
Financial Statements (continued)
Statement of Operations
for the year ended December 31, 2006
| | | | |
| | | Templeton Developing Markets Securities Fund | |
Investment income: | | | | |
Dividends (net of foreign taxes of $3,959,214) | | $ | 50,338,302 | |
Interest | | | 1,265,903 | |
Other income (Note 8) | | | 127,029 | |
| | | | |
Total investment income | | | 51,731,234 | |
| | | | |
Expenses: | | | | |
Management fees (Note 3a) | | | 18,722,761 | |
Administrative fees (Note 3b) | | | 1,713,923 | |
Distribution fees: (Note 3c) | | | | |
Class 2 | | | 1,945,195 | |
Class 3 | | | 67,037 | |
Unaffiliated transfer agent fees | | | 1,349 | |
Custodian fees (Note 4) | | | 1,403,325 | |
Reports to shareholders | | | 392,353 | |
Professional fees | | | 87,815 | |
Trustees’ fees and expenses | | | 7,461 | |
Other | | | 49,028 | |
| | | | |
Total expenses | | | 24,390,247 | |
Expense reductions (Note 4) | | | (6,678 | ) |
| | | | |
Net expenses | | | 24,383,569 | |
| | | | |
Net investment income | | | 27,347,665 | |
| | | | |
Realized and unrealized gains (losses): | | | | |
Net realized gain (loss) from: | | | | |
Investments (net of foreign taxes of $367,379) | | | 179,335,833 | |
Foreign currency transactions | | | (471,937 | ) |
| | | | |
Net realized gain (loss) | | | 178,863,896 | |
| | | | |
Net change in unrealized appreciation (depreciation) on: | | | | |
Investments | | | 155,108,514 | |
Translation of assets and liabilities denominated in foreign currencies | | | 45,295 | |
Change in deferred taxes on unrealized appreciation | | | (48,185 | ) |
| | | | |
Net change in unrealized appreciation (depreciation) | | | 155,105,624 | |
| | | | |
Net realized and unrealized gain (loss) | | | 333,969,520 | |
| | | | |
Net increase (decrease) in net assets resulting from operations | | $ | 361,317,185 | |
| | | | |
The accompanying notes are an integral part of these financial statements.
TD-17
Franklin Templeton Variable Insurance Products Trust
Financial Statements (continued)
Statements of Changes in Net Assets
| | | | | | | | |
| | | Templeton Developing
Markets Securities Fund | |
| | | Year Ended December 31, | |
| | | 2006 | | | 2005 | |
| | | | |
Increase (decrease) in net assets: | | | | | | | | |
Operations: | | | | | | | | |
Net investment income | | $ | 27,347,665 | | | $ | 16,601,225 | |
Net realized gain (loss) from investments and foreign currency transactions | | | 178,863,896 | | | | 99,606,542 | |
Net change in unrealized appreciation (depreciation) on investments, and translation of assets and liabilities denominated in foreign currencies, and deferred taxes | | | 155,105,624 | | | | 142,802,430 | |
| | | | |
Net increase (decrease) in net assets resulting from operations | | | 361,317,185 | | | | 259,010,197 | |
| | | | |
Distributions to shareholders from: | | | | | | | | |
Net investment income: | | | | | | | | |
Class 1 | | | (8,939,497 | ) | | | (7,605,217 | ) |
Class 2 | | | (8,560,133 | ) | | | (5,680,711 | ) |
Class 3 | | | (315,203 | ) | | | (9,713 | ) |
| | | | |
Total distributions to shareholders | | | (17,814,833 | ) | | | (13,295,641 | ) |
| | | | |
Capital share transactions: (Note 2) | | | | | | | | |
Class 1 | | | (65,550,558 | ) | | | 44,513,024 | |
Class 2 | | | 32,574,378 | | | | 208,495,324 | |
Class 3 | | | 25,467,947 | | | | 10,396,752 | |
| | | | |
Total capital share transactions | | | (7,508,233 | ) | | | 263,405,100 | |
| | | | |
Redemption fees | | | 19,233 | | | | 1,964 | |
| | | | |
Net increase (decrease) in net assets | | | 336,013,352 | | | | 509,121,620 | |
Net assets: | | | | | | | | |
Beginning of year | | | 1,313,992,400 | | | | 804,870,780 | |
| | | | |
End of year | | $ | 1,650,005,752 | | | $ | 1,313,992,400 | |
| | | | |
Undistributed net investment income included in net assets: | | | | | | | | |
End of year | | $ | 14,021,116 | | | $ | 4,018,236 | |
| | | | |
The accompanying notes are an integral part of these financial statements.
TD-18
Franklin Templeton Variable Insurance Products Trust
Notes to Financial Statements
Templeton Developing Markets Securities Fund
1. ORGANIZATION AND SIGNIFICANT ACCOUNTING POLICIES
Franklin Templeton Variable Insurance Products Trust (the Trust) is registered under the Investment Company Act of 1940, as amended, (the 1940 Act) as an open-end investment company, consisting of twenty-two separate funds. The Templeton Developing Markets Securities Fund (the Fund) included in this report is diversified. The financial statements of the remaining funds in the Trust are presented separately. Shares of the Fund are sold only to insurance company separate accounts to fund the benefits of variable life insurance policies or variable annuity contracts. The Fund offers three classes of shares: Class 1, Class 2, and Class 3. Each class of shares differs by its distribution fees, voting rights on matters affecting a single class and its exchange privilege.
The following summarizes the Fund’s significant accounting policies.
a. Security Valuation
Securities listed on a securities exchange or on the NASDAQ National Market System are valued at the last quoted sale price or the official closing price of the day, respectively. Over-the-counter securities and listed securities for which there is no reported sale are valued within the range of the most recent quoted bid and ask prices. Securities that trade in multiple markets or on multiple exchanges are valued according to the broadest and most representative market.
Government securities generally trade in the over-the-counter market rather than on a securities exchange. The Trust may utilize independent pricing services, quotations from bond dealers, and information with respect to bond and note transactions, to assist in determining a current market value for each security. The Trust’s pricing services may use valuation models or matrix pricing which considers information with respect to comparable bond and note transactions, quotations from bond dealers, or by reference to other securities that are considered comparable in such characteristics as rating, interest rate and maturity date, option adjusted spread models, prepayment projections, interest rate spreads and yield curves, to determine current value.
Foreign securities are valued as of the close of trading on the foreign stock exchange on which the security is primarily traded, or the NYSE, whichever is earlier. If no sale is reported at that time, the foreign security will be valued within the range of the most recent quoted bid and ask prices. The value is then converted into its U.S. dollar equivalent at the foreign exchange rate in effect at the close of the NYSE on the day that the value of the foreign security is determined.
The Trust has procedures to determine the fair value of individual securities and other assets for which market prices are not readily available or which may not be reliably priced. Methods for valuing these securities may include: fundamental analysis, matrix pricing, discounts from market prices of similar securities, or discounts applied due to the nature and duration of restrictions on the disposition of the securities. Due to the inherent uncertainty of valuations of such securities, the fair values may differ significantly from the values that would have been used had a ready market for such investments existed. Occasionally, events occur between the time at which trading in a security is completed and the close of the NYSE that might call into question the availability (including the reliability) of the value of a portfolio security held by the Fund. The investment manager monitors price movements following the close of trading in foreign stock markets through a series of country specific market proxies (such as baskets of American Depository Receipts, futures contracts and exchange traded funds). These price movements are measured against established trigger thresholds for each specific market proxy to assist in determining if an event has occurred. If such an event occurs, the securities may be valued using fair value procedures, which may include the use of independent pricing services. All security valuation procedures are approved by the Trust’s Board of Trustees.
b. Foreign Currency Translation
Portfolio securities and other assets and liabilities denominated in foreign currencies are translated into U.S. dollars based on the exchange rate of such currencies against U.S. dollars on the date of valuation. Purchases and sales of securities, income and expense items denominated in foreign currencies are translated into U.S. dollars at the exchange rate in effect on the transaction date. Occasionally, events may impact the availability or reliability of foreign exchange rates used to convert the U.S. dollar
TD-19
Franklin Templeton Variable Insurance Products Trust
Notes to Financial Statements (continued)
Templeton Developing Markets Securities Fund
1. ORGANIZATION AND SIGNIFICANT ACCOUNTING POLICIES (continued)
b. Foreign Currency Translation (continued)
equivalent value. If such an event occurs, the foreign exchange rate will be valued at fair value using procedures established and approved by the Trust’s Board of Trustees.
The Fund does not separately report the effect of changes in foreign exchange rates from changes in market prices on securities held. Such changes are included in net realized and unrealized gain or loss from investments on the Statement of Operations.
Realized foreign exchange gains or losses arise from sales of foreign currencies, currency gains or losses realized between the trade and settlement dates on securities transactions and the difference between the recorded amounts of dividends, interest, and foreign withholding taxes and the U.S. dollar equivalent of the amounts actually received or paid. Net unrealized foreign exchange gains and losses arise from changes in foreign exchange rates on foreign denominated assets and liabilities other than investments in securities held at the end of the reporting period.
c. Securities Purchased on a When-Issued or Delayed Delivery Basis
The Fund may purchase securities on a when-issued or delayed delivery basis, with payment and delivery scheduled for a future date. These transactions are subject to market fluctuations and are subject to the risk that the value at delivery may be more or less than the trade date purchase price. Although the Fund will generally purchase these securities with the intention of holding the securities, it may sell the securities before the settlement date. Sufficient assets have been segregated for these securities.
d. Foreign Currency Contracts
When the Fund purchases or sells foreign securities it may enter into foreign exchange contracts to minimize foreign exchange risk from the trade date to the settlement date of the transactions. A foreign exchange contract is an agreement between two parties to exchange different currencies at an agreed upon exchange rate at a future date. Realized and unrealized gains and losses on these contracts are included in the Statement of Operations.
The risks of these contracts include movement in the values of the foreign currencies relative to the U.S. dollar and the possible inability of the counterparties to fulfill their obligations under the contracts, which may be in excess of the amount reflected in the Statement of Assets and Liabilities.
e. Income and Deferred Taxes
No provision has been made for U.S. income taxes because the Fund intends to qualify as a regulated investment company under the Internal Revenue Code and to distribute to shareholders substantially all of its taxable income and net realized gains.
Foreign securities held by the Fund may be subject to foreign taxation on dividend and interest income received. Foreign taxes, if any, are recorded based on the tax regulations and rates that exist in the foreign markets in which the Fund invests.
The Fund may be subject to a tax imposed on net realized gains on securities of certain foreign countries. The Fund records an estimated deferred tax liability for net unrealized gains on these securities in an amount that would be payable if the securities were disposed of on the valuation date.
f. Security Transactions, Investment Income, Expenses and Distributions
Security transactions are accounted for on trade date. Realized gains and losses on security transactions are determined on a specific identification basis. Interest income and estimated expenses are accrued daily. Dividend income is recorded on the ex-dividend date except that certain dividends from foreign securities are recognized as soon as the Fund is notified of the
TD-20
Franklin Templeton Variable Insurance Products Trust
Notes to Financial Statements (continued)
Templeton Developing Markets Securities Fund
1. ORGANIZATION AND SIGNIFICANT ACCOUNTING POLICIES (continued)
f. Security Transactions, Investment Income, Expenses and Distributions (continued)
ex-dividend date. Distributions to shareholders are recorded on the ex-dividend date and are determined according to income tax regulations (tax basis). Such distributions are reinvested in additional shares of the Fund. Distributable earnings determined on a tax basis may differ from earnings recorded in accordance with accounting principles generally accepted in the United States. These differences may be permanent or temporary. Permanent differences are reclassified among capital accounts to reflect their tax character. These reclassifications have no impact on net assets or the results of operations. Temporary differences are not reclassified, as they may reverse in subsequent periods.
Common expenses incurred by the Trust are allocated among the funds based on the ratio of net assets of each fund to the combined net assets of the Trust. Fund specific expenses are charged directly to the fund that incurred the expense.
Realized and unrealized gains and losses and net investment income, other than class specific expenses, are allocated daily to each class of shares based upon the relative proportion of net assets of each class. Differences in class-level expenses may result in payment of different per share distributions by class.
g. Accounting Estimates
The preparation of financial statements in accordance with accounting principles generally accepted in the United States of America requires management to make estimates and assumptions that affect the reported amounts of assets and liabilities at the date of the financial statements and the amounts of income and expenses during the reporting period. Actual results could differ from those estimates.
h. Redemption Fees
Redemptions and exchanges of Class 3 shares held 60 days or less may be subject to the Fund’s redemption fee, which is 1% of the amount redeemed. Such fees are retained by the Fund and accounted for as an addition to paid-in capital.
i. Guarantees and Indemnifications
Under the Trust’s organizational documents, its officers and trustees are indemnified by the Trust against certain liabilities arising out of the performance of their duties to the Trust. Additionally, in the normal course of business, the Trust enters into contracts with service providers that contain general indemnification clauses. The Trust’s maximum exposure under these arrangements is unknown as this would involve future claims that may be made against the Trust that have not yet occurred. Currently, the Trust expects the risk of loss to be remote.
2. SHARES OF BENEFICIAL INTEREST
At December 31, 2006, there were an unlimited number of shares authorized ($0.01 par value). Transactions in the Fund’s shares were as follows:
| | | | | | | | | | | | | | |
| | | Year Ended December 31, | |
| | | 2006 | | | 2005 | |
| Class 1 Shares: | | Shares | | | Amount | | | Shares | | | Amount | |
Shares sold | | 8,227,856 | | | $ | 99,913,441 | | | 10,118,344 | | | $ | 96,449,675 | |
Shares issued in reinvestment of distributions | | 823,158 | | | | 8,939,497 | | | 833,905 | | | | 7,605,217 | |
Shares redeemed | | (14,545,716 | ) | | | (174,403,496 | ) | | (6,292,757 | ) | | | (59,541,868 | ) |
| | | | |
Net increase (decrease) | | (5,494,702 | ) | | $ | (65,550,558 | ) | | 4,659,492 | | | $ | 44,513,024 | |
| | | | |
TD-21
Franklin Templeton Variable Insurance Products Trust
Notes to Financial Statements (continued)
Templeton Developing Markets Securities Fund
2. SHARES OF BENEFICIAL INTEREST (continued)
| | | | | | | | | | | | | | |
| | | Year Ended December 31, | |
| | | 2006 | | | 2005 | |
| Class 2 Shares: | | Shares | | | Amount | | | Shares | | | Amount | |
Shares sold | | 18,145,883 | | | $ | 219,369,554 | | | 27,948,311 | | | $ | 264,714,321 | |
Shares issued in reinvestment of distributions | | 794,812 | | | | 8,560,133 | | | 627,010 | | | | 5,680,711 | |
Shares redeemed | | (16,460,489 | ) | | | (195,355,309 | ) | | (6,666,146 | ) | | | (61,899,708 | ) |
| | | | |
Net increase (decrease) | | 2,480,206 | | | $ | 32,574,378 | | | 21,909,175 | | | $ | 208,495,324 | |
| | | | |
| Class 3 Shares: | | | | | | | | | | | | |
Shares sold | | 2,626,549 | | | $ | 31,906,146 | | | 1,108,615 | | | $ | 10,932,663 | |
Shares issued in reinvestment of distributions | | 29,294 | | | | 315,203 | | | 1,051 | | | | 9,523 | |
Shares redeemed | | (564,285 | ) | | | (6,753,402 | ) | | (54,521 | ) | | | (545,434 | ) |
| | | | |
Net increase (decrease) | | 2,091,558 | | | $ | 25,467,947 | | | 1,055,145 | | | $ | 10,396,752 | |
| | | | |
3. TRANSACTIONS WITH AFFILIATES
Franklin Resources, Inc. is the holding company for various subsidiaries that together are referred to as Franklin Templeton Investments. Certain officers and trustees of the Trust are also officers and/or directors of the following subsidiaries:
| | |
| Subsidiary | | Affiliation |
Templeton Asset Management Ltd. (TAML) | | Investment manager |
Franklin Templeton Services, LLC (FT Services) | | Administrative manager |
Franklin Templeton Distributors, Inc. (Distributors) | | Principal underwriter |
Franklin Templeton Investor Services, LLC (Investor Services) | | Transfer agent |
a. Management Fees
The Fund pays an investment management fee to TAML based on the average daily net assets of the Fund as follows:
| | |
| Annualized Fee Rate | | Net Assets |
| 1.250% | | Up to and including $1 billion |
| 1.200% | | Over $1 billion, up to and including $5 billion |
| 1.150% | | Over $5 billion, up to and including $10 billion |
| 1.100% | | Over $10 billion, up to and including $15 billion |
| 1.050% | | Over $15 billion, up to and including $20 billion |
| 1.000% | | In excess of $20 billion |
b. Administrative Fees
The Fund pays an administrative fee to FT Services based on the average daily net assets of the Fund as follows:
| | |
| Annualized Fee Rate | | Net Assets |
| 0.150% | | Up to and including $200 million |
| 0.135% | | Over $200 million, up to and including $700 million |
| 0.100% | | Over $700 million, up to and including $1.2 billion |
| 0.075% | | In excess of $1.2 billion |
TD-22
Franklin Templeton Variable Insurance Products Trust
Notes to Financial Statements (continued)
Templeton Developing Markets Securities Fund
3. TRANSACTIONS WITH AFFILIATES (continued)
c. Distribution Fees
The Fund’s Board of Trustees has adopted distribution plans for Class 2 and Class 3 shares pursuant to Rule 12b-1 under the 1940 Act. Under the Fund’s compensation distribution plans, the Fund pays Distributors for costs incurred in connection with the servicing, sale and distribution of the Fund’s shares up to 0.25% and 0.35% per year of its average daily net assets of Class 2 and Class 3, respectively. The Board of Trustees has agreed to limit the current rate to 0.25% per year for Class 3.
d. Transfer Agent Fees
Investor Services, under terms of an agreement, performs shareholder servicing for the Fund and is not paid by the Fund for the services.
4. EXPENSE OFFSET ARRANGEMENT
The Fund has entered into an arrangement with its custodian whereby credits realized as a result of uninvested cash balances are used to reduce a portion of the Fund’s custodian expenses. During the year ended December 31, 2006, the custodian fees were reduced as noted in the Statement of Operations.
5. INCOME TAXES
For tax purposes, capital losses may be carried over to offset future capital gains, if any. During the year ended December 31, 2006, the Fund utilized $45,185,834 of capital loss carryforwards.
The tax character of distributions paid during the years ended December 31, 2006 and 2005, was as follows:
| | | | | | |
| | | 2006 | | 2005 |
Distributions paid from ordinary income | | $ | 17,814,833 | | $ | 13,295,641 |
| | | |
For tax purposes, realized currency losses occurring subsequent to October 31, may be deferred and treated as occurring on the first day of the following fiscal year. At December 31, 2006, the Fund deferred realized currency losses of $85,514.
At December 31, 2006, the cost of investments, net unrealized appreciation (depreciation), undistributed ordinary income and undistributed long term capital gains for income tax purposes were as follows:
| | | | |
Cost of investments | | $ | 1,168,670,771 | |
| | | | |
| |
Unrealized appreciation | | $ | 516,252,357 | |
Unrealized depreciation | | | (35,027,760 | ) |
| | | | |
Net unrealized appreciation (depreciation) | | $ | 481,224,597 | |
| | | | |
Undistributed ordinary income | | $ | 47,356,940 | |
Undistributed long term capital gains | | | 128,427,211 | |
| | | | |
Distributable earnings | | $ | 175,784,151 | |
| | | | |
Net investment income differs for financial statement and tax purposes primarily due to differing treatments of foreign currency transactions and passive foreign investment company shares.
TD-23
Franklin Templeton Variable Insurance Products Trust
Notes to Financial Statements (continued)
Templeton Developing Markets Securities Fund
5. INCOME TAXES (continued)
Net realized gains (losses) differ for financial statement and tax purposes primarily due to differing treatments of wash sales, foreign currency transactions and passive foreign investment company shares.
6. INVESTMENT TRANSACTIONS
Purchases and sales of investments (excluding short term securities) for the year ended December 31, 2006, aggregated $805,756,349 and $798,580,124, respectively.
7. CONCENTRATION OF RISK
Investing in foreign securities may include certain risks and considerations not typically associated with investing in U.S. securities, such as fluctuating currency values and changing local and regional economic, political and social conditions, which may result in greater market volatility. In addition, certain foreign securities may not be as liquid as U.S. securities.
8. REGULATORY MATTERS
As part of various investigations by a number of federal, state, and foreign regulators and governmental entities, including the Securities and Exchange Commission (“SEC”), relating to certain practices in the mutual fund industry, including late trading, market timing and marketing support payments to securities dealers who sell fund shares (“marketing support”), Franklin Resources, Inc. and certain of its subsidiaries (collectively, the “Company”), entered into settlements with certain of those regulators. Specifically, the Company entered into settlements with the SEC, among others, concerning market timing and marketing support.
On June 23, 2006, the SEC approved the proposed plan of distribution for the marketing support settlement, and disbursement of the settlement monies to the designated funds, in accordance with the terms and conditions of that settlement and plan, was completed in September 2006 and is recorded as other income.
The plan of distribution for the market timing settlement is currently under review by the SEC staff. After publication of notice of the plan and a 30-day comment period, the proposed plan of distribution will be submitted to the SEC for approval. Following the SEC’s approval of the plan of distribution, with modifications as appropriate, distribution of the settlement monies will begin in accordance with the terms and conditions of the settlement and plan.
In addition, the Company, as well as most of the mutual funds within Franklin Templeton Investments and certain current or former officers, Company directors, fund directors, and employees, have been named in private lawsuits (styled as shareholder class actions, or as derivative actions on behalf of either the named funds or Franklin Resources, Inc.). The lawsuits relate to the industry practices referenced above, as well as to allegedly excessive commissions and advisory and distribution fees.
The Company and fund management believe that the claims made in each of the private lawsuits referenced above are without merit and intend to defend against them vigorously. The Company cannot predict with certainty the eventual outcome of these lawsuits, nor whether they will have a material negative impact on the Company. If it is determined that the Company bears responsibility for any unlawful or inappropriate conduct that caused losses to the Fund, it is committed to making the Fund or its shareholders whole, as appropriate.
9. NEW ACCOUNTING PRONOUNCEMENTS
In July 2006, the Financial Accounting Standards Board (FASB) issued FASB Interpretation No. 48, “Accounting for Uncertainty in Income Taxes – an Interpretation of FASB Statement No. 109” (“FIN 48”), which clarifies the accounting for uncertainty in tax
TD-24
Franklin Templeton Variable Insurance Products Trust
Notes to Financial Statements (continued)
Templeton Developing Markets Securities Fund
9. NEW ACCOUNTING PRONOUNCEMENTS (continued)
positions taken or expected to be taken in a tax return. FIN 48 provides guidance on the measurement, recognition, classification and disclosure of tax positions, along with accounting for the related interest and penalties. FIN 48 is effective for fiscal years beginning after December 15, 2006, and is to be applied to all open tax years as of the date of effectiveness. On December 22, 2006, the Securities and Exchange Commission extended the implementation date to no later than the last net asset value calculation in the first semi-annual reporting period in 2007. The Fund is currently evaluating the impact, if any, of applying the various provisions of FIN 48.
In September 2006, FASB issued FASB Statement No. 157, “Fair Value Measurement” (“SFAS 157”), which defines fair value, establishes a framework for measuring fair value, and expands disclosures about fair value measurements. SFAS 157 is effective for fiscal years beginning after November 15, 2007, and interim periods within those fiscal years. The Trust believes the adoption of SFAS 157 will have no material impact on its financial statements.
TD-25
Franklin Templeton Variable Insurance Products Trust
Templeton Developing Markets Securities Fund
Report of Independent Registered Public Accounting Firm
To the Board of Trustees and Shareholders of Franklin Templeton Variable Insurance Products Trust
In our opinion, the accompanying statement of assets and liabilities, including the statement of investments, and the related statements of operations and of changes in net assets and the financial highlights present fairly, in all material respects, the financial position of Templeton Developing Markets Securities Fund (one of the funds constituting the Franklin Templeton Variable Insurance Products Trust, hereafter referred to as the “Fund”) at December 31, 2006, the results of its operations for the year then ended, the changes in its net assets for each of the two years in the period then ended and the financial highlights for each of the periods presented, in conformity with accounting principles generally accepted in the United States of America. These financial statements and financial highlights (hereafter referred to as “financial statements”) are the responsibility of the Fund’s management; our responsibility is to express an opinion on these financial statements based on our audits. We conducted our audits of these financial statements in accordance with the standards of the Public Company Accounting Oversight Board (United States). Those standards require that we plan and perform the audit to obtain reasonable assurance about whether the financial statements are free of material misstatement. An audit includes examining, on a test basis, evidence supporting the amounts and disclosures in the financial statements, assessing the accounting principles used and significant estimates made by management, and evaluating the overall financial statement presentation. We believe that our audits, which included confirmation of securities at December 31, 2006 by correspondence with the custodian and brokers, provide a reasonable basis for our opinion.
PricewaterhouseCoopers LLP
San Francisco, California
February 16, 2007
TD-26
Franklin Templeton Variable Insurance Products Trust
Tax Designation (unaudited)
Templeton Developing Markets Securities Fund
Under Section 852(b)(3)(C) of the Internal Revenue Code (Code), the Fund designates the maximum amount allowable but no less than $128,427,211 as a long term capital gain dividend for the fiscal year ended December 31, 2006.
At December 31, 2006, more than 50% of the Fund’s total assets were invested in securities of foreign issuers. In most instances, foreign taxes were withheld from dividends paid to the Fund on these investments. The Fund elects to treat foreign taxes paid as allowed under Section 853 of the Code. This election will allow shareholders of record in June 2007, to treat their proportionate share of foreign taxes paid by the Fund as having been paid directly by them. Shareholders shall consider these amounts as foreign taxes paid in the tax year in which they receive the Fund distribution.
The foreign tax information will be disclosed in the June 30, 2007, semi-annual report of the Fund.
TD-27
TEMPLETON FOREIGN SECURITIES FUND
This annual report for Templeton Foreign Securities Fund covers the fiscal year ended December 31, 2006.
Performance Summary as of 12/31/06
Average annual total return of Class 1 shares* represents the average annual change in value, assuming reinvestment of dividends and capital gains. Average returns smooth out variations in returns, which can be significant; they are not the same as year-by-year results.
Periods ended 12/31/06
| | | | | | |
| | | 1-Year | | 5-Year | | 10-Year |
Average Annual Total Return | | +21.70% | | +11.57% | | +8.17% |
*Performance prior to the 5/1/00 merger reflects historical performance of Templeton International Fund.
Total Return Index Comparison
for Hypothetical $10,000 Investment (1/1/97–12/31/06)
The graph below shows the change in value of a hypothetical $10,000 investment in the Fund over the indicated period and includes reinvestment of any income or distributions. The Fund’s performance* is compared to the performance of the Morgan Stanley Capital International (MSCI) Europe, Australasia, Far East (EAFE) Index. One cannot invest directly in an index, nor is an index representative of the Fund’s portfolio. Please see Important Notes to Performance Information preceding the Fund Summaries.
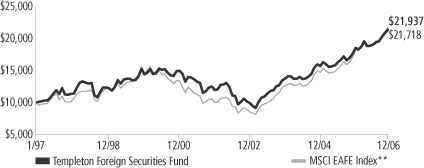
**Source: Standard & Poor’s Micropal. Please see Index Descriptions following the Fund Summaries.
Templeton Foreign Securities Fund – Class 1
Performance reflects the Fund’s Class 1 operating expenses, but does not include any contract fees, expenses or sales charges. If they had been included, performance would be lower. These charges and deductions, particularly for variable life policies, can have a significant effect on contract values and insurance benefits. See the contract prospectus for a complete description of these expenses, including sales charges.
Performance data represent past performance, which does not guarantee future results. Investment return and principal value will fluctuate, and you may have a gain or loss when you sell your shares.
Current performance may differ from figures shown.
TF-1
Fund Goal and Main Investments: Templeton Foreign Securities Fund seeks long-term capital growth. The Fund normally invests at least 80% of its net assets in investments of issuers located outside the U.S., including those in emerging markets, and normally invests predominantly in equity securities.
Performance Overview
You can find the Fund’s one-year total return in the Performance Summary. The Fund underperformed its benchmark, the MSCI EAFE Index, which returned +26.86% for the same period.1 Please note that index performance information is provided for reference and that we do not attempt to track the index but rather undertake investments on the basis of fundamental research.
Economic and Market Overview
The global economy grew in 2006, although gross domestic product growth slowed in the U.S. while it accelerated in Europe. The economic drivers remained consistent over the past four years: strong corporate and consumer demand, reasonably low inflation, a tight or improving labor market, and a relatively moderate interest rate environment, despite recent interest rate hikes by many of the world’s central banks. However, the economy also faced headwinds from elevated energy prices, higher global interest rates and a weaker U.S. housing market. These factors dampened investor confidence mid-year, when many equity markets declined before rebounding later in the year.
Despite such challenges, global economic activity was healthy. Strong global liquidity — whether petrodollars, corporate cash, private equity, household savings or central banks’ reserves — continued to search for a home. Largely as a result, bond yield spreads over U.S. Treasuries narrowed, and equity and commodity markets rose in the latter part of the year. The shift from risk aversion to risk tolerance was concurrent with the U.S. Federal Reserve Board’s decisions since June to hold the federal funds target rate at 5.25%, as well with as lower oil prices in the second half of the year.
Narrowing corporate credit spreads globally reflected greater risk tolerance, while abundant cash supplies in the capital markets contributed to record global merger and acquisition activity in 2006. The total value
1. Source: Standard & Poor’s Micropal. One cannot invest directly in an index, nor is an index representative of the Fund’s portfolio. Please see Index Descriptions following the Fund Summaries.
Fund Risks: The Fund’s investments in stocks offer the potential for long-term gains but can be subject to short-term price fluctuation. Foreign investing, especially in emerging markets, involves additional risks including currency fluctuations, economic instability, and social and political developments. The Fund’s prospectus also includes a description of the main investment risks.
TF-2
of deals announced as a result of hostile takeovers, private equity buyouts and broad corporate consolidation was $3.8 trillion.2 This figure surpassed the $3.4 trillion mark set in 2000.2 Announced deals from private equity alone reached a record $700 billion, more than double the record set in 2005 and 20 times greater than a decade ago.3
With this economic backdrop, the non-U.S. equity markets — including emerging markets that remained a major magnet for global fund flows — led global equity markets to end 2006 on a strong note, and all major regions delivered double-digit total returns for the year. Stock market indexes in the U.S. and most European countries reached six-year highs in the fourth quarter, and many emerging market indexes in Asia, Europe and Latin America neared or reached all-time highs.
Investment Strategy
Our investment philosophy is bottom-up, value-oriented and long-term. In choosing investments, we generally focus on the market price of a company’s securities relative to our evaluation of the company’s potential long-term earnings, asset value and cash flow. Among factors we consider are a company’s historical value measures, including price/earnings ratio, profit margins and liquidation value. We do in-depth research to construct a bargain list from which we buy.
Manager’s Discussion
During the year under review, Fund performance versus the benchmark index was driven by several factors. Stock selection in the consumer discretionary sector provided a significant boost to relative performance.4 German auto maker BMW (not an index component), U.K. publisher Pearson, U.K. foodservice giant Compass Group, and U.K. apparel manufacturer Burberry Group were some of the sector’s standout performers.
The Fund’s results were also aided by investments in the telecommunication services sector, benefiting from stock selection and a significantly overweighted allocation relative to the index.5 Notable contributors included Norway’s Telenor, Spain’s Telefonica, U.K.
2. Source: “Can M&A’s ‘Best of Times’ Get Better?,” The Wall Street Journal, 1/2/07.
3. Source: “TPG tops buy-out league with $101bn,” The Wall Street Journal, 12/27/06.
4. The consumer discretionary sector comprises hotels, restaurants and leisure; household durables; leisure equipment and products; media; specialty retail; and textiles, apparel and luxury goods in the SOI.
5. The telecommunications sector comprises diversified telecommunication services and wireless telecommunication services in the SOI.
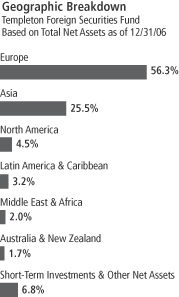
TF-3
wireless provider Vodafone Group, Russian wireless provider Mobile TeleSystems and China Mobile. Mobile TeleSystems and China Mobile are not part of the index.
The Fund’s industrials sector position also benefited relative performance due to stock selection and an underweighted allocation.6 Notable contributors included Australia’s Qantas Airways and European wind turbine manufacturers and wind farm operators Vestas Wind Systems and Gamesa Corporacion Tecnologica, which each experienced significant sales growth as interest increased in clean and renewable energy sources.
It is important to recognize the effect of currency movements on the Fund’s performance. In general, if the value of the U.S. dollar goes up compared with a foreign currency, an investment traded in that foreign currency will go down in value because it will be worth fewer U.S. dollars. This can have a negative effect on Fund performance. Conversely, when the U.S. dollar weakens in relation to a foreign currency, an investment traded in that foreign currency will increase in value, which can contribute to Fund performance. For the 12 months ended December 31, 2006, the U.S. dollar declined in value relative to most non-U.S. currencies. As a result, the Fund’s performance was positively affected by the portfolio’s investment predominantly in securities with non-U.S. currency exposure. However, one cannot expect the same result in future periods.
Despite the Fund’s positive results, there were some disappointments. Although the financials sector made the greatest absolute contribution to returns of any sector held by the Fund, relative performance versus the index suffered somewhat due to stock selection and our underweighting during a year of strong performance.7 Laggard stocks included Japanese banks Shinsei Bank, Mitsubishi UFJ Financial Group and Sumitomo Mitsui Financial Group, and insurer Sompo Japan Insurance.
The information technology sector hurt relative returns due to stock selection, especially within the technology hardware and equipment industry.8 Detractors from relative performance included Israeli Internet
6. The industrials sector comprises airlines, commercial services and supplies, electrical equipment, and industrial conglomerates in the SOI.
7. The financials sectors comprises capital markets, commercial banks, diversified financial services, insurance, and real estate management and development in the SOI.
8. The information technology sector comprises computers and peripherals, electronic equipment and instruments, semiconductors and semiconductor equipment, and software in the SOI.
Top 10 Holdings
Templeton Foreign Securities Fund 12/31/06
| | |
Company
Sector/Industry,
Country | | % of Total
Net Assets |
| Sumitomo Mitsui Financial Group Inc. | | 2.6% |
| Commercial Banks, Japan | | |
| Cheung Kong (Holdings) Ltd. | | 2.2% |
| Real Estate Management & Development, Hong Kong | | |
| Sanofi-Aventis | | 2.1% |
| Pharmaceuticals, France | | |
| GlaxoSmithKline PLC | | 2.0% |
| Pharmaceuticals, U.K. | | |
| ING Groep NV | | 2.0% |
| Diversified Financial Services, Netherlands | | |
| Mitsubishi UFJ Financial Group Inc. | | 1.9% |
| Commercial Banks, Japan | | |
| Royal Dutch Shell PLC, B | | 1.8% |
| Oil, Gas & Consumable Fuels, U.K. | | |
| British Sky Broadcasting Group PLC | | 1.8% |
| Media, U.K. | | |
| ACE Ltd. | | 1.8% |
| Insurance, Bermuda | | |
| Siemens AG | | 1.6% |
| Industrial Conglomerates, Germany | | |
The dollar value, number of shares or principal amount, and names of all portfolio holdings are listed in the Fund’s Statement of Investments (SOI).
TF-4
security specialist CheckPoint Software Technologies, Japanese industrial electronics manufacturer Hitachi, Singaporean computer hardware maker Flextronics International, and South Korean semiconductor manufacturer Samsung Electronics. Flextronics and Samsung are not index components.
Stock selection among health care sector stocks also hindered relative results, particularly large European pharmaceuticals producers GlaxoSmithKline and Sanofi-Aventis.9
Thank you for your participation in Templeton Foreign Securities Fund. We look forward to serving your future investment needs.
9. The health care sector comprises health care providers and services and pharmaceuticals in the SOI.
The foregoing information reflects our analysis, opinions and portfolio holdings as of December 31, 2006, the end of the reporting period. The way we implement our main investment strategies and the resulting portfolio holdings may change depending on factors such as market and economic conditions. These opinions may not be relied upon as investment advice or an offer for a particular security. The information is not a complete analysis of every aspect of any market, country, industry, security or the Fund. Statements of fact are from sources considered reliable, but the investment manager makes no representation or warranty as to their completeness or accuracy. Although historical performance is no guarantee of future results, these insights may help you understand our investment management philosophy.
TF-5
Templeton Foreign Securities Fund – Class 1
Fund Expenses
As an investor in a variable insurance contract (“Contract”) that indirectly provides for investment in an underlying mutual fund, you can incur transaction and/or ongoing expenses at both the Fund level and the Contract level.
| • | | Transaction expenses can include sales charges (loads) on purchases, redemption fees, surrender fees, transfer fees and premium taxes. |
| • | | Ongoing expenses can include management fees, distribution and service (12b-1) fees, contract fees, annual maintenance fees, mortality and expense risk fees and other fees and expenses. All mutual funds and Contracts have some types of ongoing expenses. |
The expenses shown in the table are meant to highlight ongoing expenses at the Fund level only and do not include ongoing expenses at the Contract level, or transaction expenses at either the Fund or Contract level. While the Fund does not have transaction expenses, if the transaction and ongoing expenses at the Contract level were included, the expenses shown would be higher. You should consult your Contract prospectus or disclosure document for more information.
The table shows Fund-level ongoing expenses and can help you understand these expenses and compare them with those of other mutual funds offered through the Contract. The table assumes a $1,000 investment held for the six months indicated. Please refer to the Fund prospectus for additional information on operating expenses.
Actual Fund Expenses
The first line (Actual) of the table provides actual account values and expenses. The “Ending Account Value” is derived from the Fund’s actual return, which includes the effect of ongoing Fund expenses, but does not include the effect of ongoing Contract expenses.
You can estimate the Fund-level expenses you incurred during the period by following these steps. Of course, your account value and expenses will differ from those in this illustration:
| 1. | Divide your account value by $1,000. |
If an account had an $8,600 value, then $8,600 ÷ $1,000 = 8.6.
| 2. | Multiply the result by the number under the heading “Fund-level Expenses Incurred During Period.” |
If Fund-level Expenses Incurred During Period were $7.50, then 8.6 × $7.50 = $64.50.
In this illustration, the estimated expenses incurred this period at the Fund level are $64.50.
TF-6
Hypothetical Example for Comparison with Other Mutual Funds
Information in the second line (Hypothetical) of the table can help you compare ongoing expenses of the Fund with those of other mutual funds offered through the Contract. This information may not be used to estimate the actual ending account balance or expenses you incurred during the period. The hypothetical “Ending Account Value” is based on the Fund’s actual expense ratio and an assumed 5% annual rate of return before expenses, which does not represent the Fund’s actual return. The figure under the heading “Fund-Level Expenses Incurred During Period” shows the hypothetical expenses your account would have incurred under this scenario. You can compare this figure with the 5% hypothetical examples that appear in shareholder reports of other funds offered through a Contract.
| | | | | | | | | |
| Class 1 | | Beginning
Account Value 7/1/06 | | Ending
Account Value 12/31/06 | | Fund-Level
Expenses Incurred
During Period*
7/1/06-12/31/06 |
Actual | | $ | 1,000 | | $ | 1,135.10 | | $ | 4.04 |
Hypothetical (5% return before expenses) | | $ | 1,000 | | $ | 1,021.42 | | $ | 3.82 |
*Expenses are equal to the annualized expense ratio for the Fund’s Class 1 shares (0.75%), which does not include any ongoing expenses of the Contract for which the Fund is an investment option, multiplied by the average account value over the period, multiplied by 184/365 to reflect the one-half year period.
TF-7
Franklin Templeton Variable Insurance Products Trust
Financial Highlights
Templeton Foreign Securities Fund
| | | | | | | | | | | | | | | | | | | | |
| | | Year Ended December 31, | |
| Class 1 | | 2006 | | | 2005 | | | 2004 | | | 2003 | | | 2002 | |
| | | | |
Per share operating performance | | | | | | | | | | | | | | | | | | | | |
(for a share outstanding throughout the year) | | | | | | | | | | | | | | | | | | | | |
Net asset value, beginning of year | | $ | 15.84 | | | $ | 14.53 | | | $ | 12.37 | | | $ | 9.51 | | | $ | 11.85 | |
| | | | |
Income from investment operationsa: | | | | | | | | | | | | | | | | | | | | |
Net investment incomeb | | | 0.46 | | | | 0.30 | | | | 0.26 | | | | 0.19 | | | | 0.22 | |
Net realized and unrealized gains (losses) | | | 2.94 | | | | 1.20 | | | | 2.05 | | | | 2.87 | | | | (2.37 | ) |
| | | | |
Total from investment operations | | | 3.40 | | | | 1.50 | | | | 2.31 | | | | 3.06 | | | | (2.15 | ) |
| | | | |
Less distributions from net investment income | | | (0.24 | ) | | | (0.19 | ) | | | (0.15 | ) | | | (0.20 | ) | | | (0.19 | ) |
| | | | |
Redemption fees | | | — | d | | | — | d | | | — | d | | | — | | | | — | |
| | | | |
Net asset value, end of year | | $ | 19.00 | | | $ | 15.84 | | | $ | 14.53 | | | $ | 12.37 | | | $ | 9.51 | |
| | | | |
| | | | | |
Total returnc | | | 21.70% | | | | 10.48% | | | | 18.87% | | | | 32.55% | | | | (18.40)% | |
Ratios/supplemental data | | | | | | | | | | | | | | | | | | | | |
Net assets, end of year (000’s) | | $ | 594,991 | | | $ | 531,775 | | | $ | 506,456 | | | $ | 472,665 | | | $ | 397,420 | |
Ratios to average net assets: | | | | | | | | | | | | | | | | | | | | |
Expenses | | | 0.75% | e | | | 0.77% | e | | | 0.82% | e | | | 0.87% | | | | 0.88% | |
Net investment income | | | 2.63% | | | | 2.03% | | | | 1.95% | | | | 1.81% | | | | 1.97% | |
Portfolio turnover rate | | | 18.97% | f | | | 14.61% | | | | 10.91% | | | | 18.01% | | | | 28.12% | |
a | The amount shown for a share outstanding throughout the period may not correlate with the Statement of Operations for the period due to the timing of sales and repurchase of the Fund shares in relation to income earned and/or fluctuating market value of the investments of the Fund. |
b | Based on average daily shares outstanding. |
c | Total return does not include any fees, charges or expenses imposed by the variable annuity and life insurance contracts for which the Franklin Templeton Variable Insurance Products Trust serves as an underlying investment vehicle. |
d | Amount rounds to less than $0.01 per share. |
e | Benefit of expense reduction rounds to less than 0.01%. |
f | Excludes the value of portfolio securities delivered as a result of a redemption in-kind. See Note 9. |
The accompanying notes are an integral part of these financial statements.
TF-8
Franklin Templeton Variable Insurance Products Trust
Financial Highlights (continued)
Templeton Foreign Securities Fund
| | | | | | | | | | | | | | | | | | | | |
| | | Year Ended December 31, | |
| Class 2 | | 2006 | | | 2005 | | | 2004 | | | 2003 | | | 2002 | |
| | | | |
Per share operating performance | | | | | | | | | | | | | | | | | | | | |
(for a share outstanding throughout the year) | | | | | | | | | | | | | | | | | | | | |
Net asset value, beginning of year | | $ | 15.63 | | | $ | 14.35 | | | $ | 12.24 | | | $ | 9.42 | | | $ | 11.74 | |
| | | | |
Income from investment operationsa: | | | | | | | | | | | | | | | | | | | | |
Net investment incomeb | | | 0.40 | | | | 0.26 | | | | 0.22 | | | | 0.15 | | | | 0.17 | |
Net realized and unrealized gains (losses) | | | 2.91 | | | | 1.19 | | | | 2.03 | | | | 2.85 | | | | (2.32 | ) |
| | | | |
Total from investment operations | | | 3.31 | | | | 1.45 | | | | 2.25 | | | | 3.00 | | | | (2.15 | ) |
| | | | |
Less distributions from net investment income | | | (0.21 | ) | | | (0.17 | ) | | | (0.14 | ) | | | (0.18 | ) | | | (0.17 | ) |
| | | | |
Redemption fees | | | — | d | | | — | d | | | — | d | | | — | | | | — | |
| | | | |
Net asset value, end of year | | $ | 18.73 | | | $ | 15.63 | | | $ | 14.35 | | | $ | 12.24 | | | $ | 9.42 | |
| | | | |
| | | | | |
Total returnc | | | 21.44% | | | | 10.17% | | | | 18.53% | | | | 32.21% | | | | (18.56)% | |
| | | | | |
Ratios/supplemental data | | | | | | | | | | | | | | | | | | | | |
Net assets, end of year (000’s) | | $ | 2,941,374 | | | $ | 2,232,990 | | | $ | 1,445,928 | | | $ | 653,594 | | | $ | 299,760 | |
Ratios to average net assets: | | | | | | | | | | | | | | | | | | | | |
Expenses | | | 1.00% | e | | | 1.02% | e | | | 1.07% | e | | | 1.12% | | | | 1.13% | |
Net investment income | | | 2.38% | | | | 1.78% | | | | 1.70% | | | | 1.56% | | | | 1.72% | |
Portfolio turnover rate | | | 18.97% | f | | | 14.61% | | | | 10.91% | | | | 18.01% | | | | 28.12% | |
a | The amount shown for a share outstanding throughout the period may not correlate with the Statement of Operations for the period due to the timing of sales and repurchase of the Fund shares in relation to income earned and/or fluctuating market value of the investments of the Fund. |
b | Based on average daily shares outstanding. |
c | Total return does not include any fees, charges or expenses imposed by the variable annuity and life insurance contracts for which the Franklin Templeton Variable Insurance Products Trust serves as an underlying investment vehicle. |
d | Amount rounds to less than $0.01 per share. |
e | Benefit of expense reduction rounds to less than 0.01%. |
f | Excludes the value of portfolio securities delivered as a result of a redemption in-kind. See Note 9. |
The accompanying notes are an integral part of these financial statements.
TF-9
Franklin Templeton Variable Insurance Products Trust
Financial Highlights (continued)
Templeton Foreign Securities Fund
| | | | | | | | | | | | |
| | | Year Ended December 31, | |
| Class 3 | | 2006 | | | 2005 | | | 2004g | |
| | | | |
Per share operating performance | | | | | | | | | | | | |
(for a share outstanding throughout the year) | | | | | | | | | | | | |
Net asset value, beginning of year | | $ | 15.60 | | | $ | 14.35 | | | $ | 12.48 | |
| | | | | | | | | | | | |
Income from investment operationsa: | | | | | | | | | | | | |
Net investment incomeb | | | 0.37 | | | | 0.25 | | | | 0.09 | |
Net realized and unrealized gains (losses) | | | 2.94 | | | | 1.18 | | | | 1.92 | |
| | | | |
Total from investment operations | | | 3.31 | | | | 1.43 | | | | 2.01 | |
| | | | |
Less distributions from net investment income | | | (0.23 | ) | | | (0.18 | ) | | | (0.14 | ) |
| | | | |
Redemption fees | | | —d | | | | —d | | | | —d | |
| | | | |
Net asset value, end of year | | $ | 18.68 | | | $ | 15.60 | | | $ | 14.35 | |
| | | | |
| | | |
Total returnc | | | 21.46% | | | | 10.13% | | | | 16.25% | |
Ratios/supplemental data | | | | | | | | | | | | |
Net assets, end of year (000’s) | | $ | 150,417 | | | $ | 47,462 | | | $ | 16,559 | |
Ratios to average net assets: | | | | | | | | | | | | |
Expenses | | | 1.00%e | | | | 1.02%e | | | | 1.07%e,h | |
Net investment income | | | 2.38% | | | | 1.78% | | | | 1.70% h | |
Portfolio turnover rate | | | 18.97% f | | | | 14.61% | | | | 10.91% | |
a | The amount shown for a share outstanding throughout the period may not correlate with the Statement of Operations for the period due to the timing of sales and repurchase of the Fund shares in relation to income earned and/or fluctuating market value of the investments of the Fund. |
b | Based on average daily shares outstanding. |
c | Total return does not include any fees, charges or expenses imposed by the variable annuity and life insurance contracts for which the Franklin Templeton Variable Insurance Products Trust serves as an underlying investment vehicle. Total return is not annualized for periods less than one year. |
d | Amount rounds to less than $0.01 per share. |
e | Benefit of expense reduction rounds to less than 0.01%. |
f | Excludes the value of portfolio securities delivered as a result of a redemption in-kind. See Note 9. |
g | For the period May 1, 2004 (effective date) to December 31, 2004. |
The accompanying notes are an integral part of these financial statements.
TF-10
Franklin Templeton Variable Insurance Products Trust
Statement of Investments, December 31, 2006
| | | | | | | |
| Templeton Foreign Securities Fund | | Country | | Shares | | Value |
Long Term Investments 93.2% | | | | | | | |
Common Stocks 91.7% | | | | | | | |
Air Freight & Logistics 0.9% | | | | | | | |
Deutsche Post AG | | Germany | | 1,087,912 | | $ | 32,886,648 |
| | | | | | | |
Airlines 0.8% | | | | | | | |
Qantas Airways Ltd. | | Australia | | 7,008,990 | | | 28,881,721 |
| | | | | | | |
Automobiles 0.8% | | | | | | | |
Bayerische Motoren Werke AG | | Germany | | 521,239 | | | 29,999,482 |
| | | | | | | |
Capital Markets 2.2% | | | | | | | |
Amvescap PLC | | United Kingdom | | 4,806,294 | | | 56,097,934 |
Nomura Holdings Inc. | | Japan | | 1,255,218 | | | 23,673,410 |
| | | | | | | |
| | | | | | | 79,771,344 |
| | | | | | | |
Chemicals 1.4% | | | | | | | |
Ciba Specialty Chemicals AG | | Switzerland | | 550,500 | | | 36,615,670 |
Lonza Group AG | | Switzerland | | 163,930 | | | 14,165,877 |
| | | | | | | |
| | | | | | | 50,781,547 |
| | | | | | | |
Commercial Banks 13.2% | | | | | | | |
Banco Santander Central Hispano SA | | Spain | | 1,814,669 | | | 33,871,715 |
DBS Group Holdings Ltd. | | Singapore | | 1,240,347 | | | 18,280,245 |
Hana Financial Group Inc. | | South Korea | | 672,040 | | | 35,336,297 |
aKookmin Bank, ADR | | South Korea | | 295,869 | | | 23,858,876 |
Mega Financial Holding Co. Ltd. | | Taiwan | | 34,084,000 | | | 25,051,766 |
Mitsubishi UFJ Financial Group Inc. | | Japan | | 5,541 | | | 68,427,521 |
Nordea Bank AB, FDR | | Sweden | | 2,018,478 | | | 31,227,843 |
Royal Bank of Scotland Group PLC | | United Kingdom | | 998,998 | | | 38,990,804 |
aShinhan Financial Group Co. Ltd. | | South Korea | | 762,930 | | | 38,966,855 |
Shinsei Bank Ltd. | | Japan | | 4,217,368 | | | 24,800,753 |
bShinsei Bank Ltd., 144A | | Japan | | 500,110 | | | 2,940,959 |
Sumitomo Mitsui Financial Group Inc. | | Japan | | 9,191 | | | 94,199,353 |
UniCredito Italiano SpA | | Italy | | 5,668,225 | | | 49,682,738 |
| | | | | | | |
| | | | | | | 485,635,725 |
| | | | | | | |
Commercial Services & Supplies 1.2% | | | | | | | |
Rentokil Initial PLC | | United Kingdom | | 6,271,598 | | | 20,388,091 |
Securitas AB, B | | Sweden | | 1,278,238 | | | 19,823,212 |
aSecuritas Systems AB, B | | Sweden | | 1,278,238 | | | 5,168,028 |
| | | | | | | |
| | | | | | | 45,379,331 |
| | | | | | | |
Computers & Peripherals 1.0% | | | | | | | |
Compal Electronics Inc. | | Taiwan | | 12,789,038 | | | 11,401,613 |
Lite-On Technology Corp. | | Taiwan | | 15,656,068 | | | 21,164,640 |
NEC Corp. | | Japan | | 1,000,219 | | | 4,781,153 |
| | | | | | | |
| | | | | | | 37,347,406 |
| | | | | | | |
Containers & Packaging 0.9% | | | | | | | |
Amcor Ltd. | | Australia | | 5,968,788 | | | 34,160,269 |
| | | | | | | |
Diversified Financial Services 3.5% | | | | | | | |
ING Groep NV | | Netherlands | | 1,621,448 | | | 71,895,778 |
KKR Private Equity Investors LP | | Guernsey Islands | | 1,150,749 | | | 26,294,615 |
bKKR Private Equity Investors LP, 144A | | Guernsey Islands | | 1,255,000 | | | 28,676,750 |
| | | | | | | |
| | | | | | | 126,867,143 |
| | | | | | | |
TF-11
Franklin Templeton Variable Insurance Products Trust
Statement of Investments, December 31, 2006 (continued)
| | | | | | | |
| Templeton Foreign Securities Fund | | Country | | Shares | | Value |
Long Term Investments (continued) | | | | | | | |
Common Stocks (continued) | | | | | | | |
Diversified Telecommunication Services 7.7% | | | | | | | |
BCE Inc. | | Canada | | 1,316,452 | | $ | 35,474,441 |
China Telecom Corp. Ltd., H | | China | | 58,406,357 | | | 31,984,353 |
Chunghwa Telecom Co. Ltd., ADR | | Taiwan | | 1,965,744 | | | 38,784,129 |
France Telecom SA | | France | | 1,996,173 | | | 55,204,257 |
aKT Corp., ADR | | South Korea | | 397,895 | | | 10,086,638 |
Singapore Telecommunications Ltd. | | Singapore | | 5,295,000 | | | 11,325,834 |
Telefonica SA, ADR | | Spain | | 612,344 | | | 39,036,930 |
Telefonos de Mexico SA de CV, L, ADR | | Mexico | | 1,476,635 | | | 41,729,705 |
Telenor ASA | | Norway | | 1,074,804 | | | 20,209,887 |
| | | | | | | |
| | | | | | | 283,836,174 |
| | | | | | | |
Electric Utilities 1.2% | | | | | | | |
aBritish Energy Group PLC | | United Kingdom | | 2,644,330 | | | 28,132,327 |
Hong Kong Electric Holdings Ltd. | | Hong Kong | | 3,453,969 | | | 16,916,529 |
| | | | | | | |
| | | | | | | 45,048,856 |
| | | | | | | |
Electrical Equipment 1.8% | | | | | | | |
Gamesa Corp. Tecnologica SA | | Spain | | 469,878 | | | 12,932,472 |
bGamesa Corp. Tecnologica SA, 144A | | Spain | | 1,012,244 | | | 27,860,033 |
aVestas Wind Systems AS | | Denmark | | 633,788 | | | 26,785,542 |
| | | | | | | |
| | | | | | | 67,578,047 |
| | | | | | | |
Electronic Equipment & Instruments 1.8% | | | | | | | |
Electrocomponents PLC | | United Kingdom | | 2,624,686 | | | 15,073,206 |
aFlextronics International Ltd. | | Singapore | | 1,755,290 | | | 20,150,729 |
Hitachi Ltd. | | Japan | | 3,178,263 | | | 19,811,578 |
Venture Corp. Ltd. | | Singapore | | 1,339,613 | | | 11,793,522 |
| | | | | | | |
| | | | | | | 66,829,035 |
| | | | | | | |
Food & Staples Retailing 2.2% | | | | | | | |
Alliance Boots PLC | | United Kingdom | | 3,483,927 | | | 57,174,627 |
William Morrison Supermarkets PLC | | United Kingdom | | 4,622,259 | | | 23,037,340 |
| | | | | | | |
| | | | | | | 80,211,967 |
| | | | | | | |
Food Products 1.9% | | | | | | | |
Nestle SA | | Switzerland | | 103,509 | | | 36,780,926 |
Unilever PLC | | United Kingdom | | 1,170,483 | | | 32,732,832 |
| | | | | | | |
| | | | | | | 69,513,758 |
| | | | | | | |
Health Care Providers & Services 0.4% | | | | | | | |
Celesio AG | | Germany | | 279,850 | | | 14,891,158 |
aHutchison China Meditech Ltd. | | Hong Kong | | 177 | | | 629 |
| | | | | | | |
| | | | | | | 14,891,787 |
| | | | | | | |
Hotels Restaurants & Leisure 1.9% | | | | | | | |
Compass Group PLC | | United Kingdom | | 9,792,178 | | | 55,611,879 |
TUI AG | | Germany | | 792,560 | | | 15,892,063 |
| | | | | | | |
| | | | | | | 71,503,942 |
| | | | | | | |
Household Durables 2.3% | | | | | | | |
aHusqvarna AB, B | | Sweden | | 785,757 | | | 12,271,719 |
Koninklijke Philips Electronics NV | | Netherlands | | 899,289 | | | 33,915,629 |
Sony Corp. | | Japan | | 904,219 | | | 38,740,849 |
| | | | | | | |
| | | | | | | 84,928,197 |
| | | | | | | |
TF-12
Franklin Templeton Variable Insurance Products Trust
Statement of Investments, December 31, 2006 (continued)
| | | | | | | |
| Templeton Foreign Securities Fund | | Country | | Shares | | Value |
Long Term Investments (continued) | | | | | | | |
Common Stocks (continued) | | | | | | | |
Industrial Conglomerates 3.2% | | | | | | | |
Hutchison Whampoa Ltd. | | Hong Kong | | 3,276,709 | | $ | 33,297,191 |
Siemens AG | | Germany | | 606,534 | | | 60,529,531 |
Smiths Group PLC | | United Kingdom | | 1,223,141 | | | 23,749,776 |
| | | | | | | |
| | | | | | | 117,576,498 |
| | | | | | | |
Insurance 7.1% | | | | | | | |
ACE Ltd. | | Bermuda | | 1,075,149 | | | 65,121,775 |
Aviva PLC | | United Kingdom | | 1,850,740 | | | 29,792,538 |
AXA SA | | France | | 453,589 | | | 18,363,973 |
bAXA SA, 144A | | France | | 38,270 | | | 1,549,396 |
Old Mutual PLC | | South Africa | | 12,806,104 | | | 43,699,864 |
Sompo Japan Insurance Inc. | | Japan | | 1,601,485 | | | 19,575,425 |
Swiss Reinsurance Co. | | Switzerland | | 495,733 | | | 42,146,764 |
XL Capital Ltd., A | | Bermuda | | 591,272 | | | 42,583,409 |
| | | | | | | |
| | | | | | | 262,833,144 |
| | | | | | | |
Leisure Equipment & Products 1.0% | | | | | | | |
FUJIFILM Holdings Corp. | | Japan | | 921,374 | | | 37,850,371 |
| | | | | | | |
Media 5.2% | | | | | | | |
British Sky Broadcasting Group PLC | | United Kingdom | | 6,401,066 | | | 65,435,448 |
Eutelsat Communications | | France | | 2,081,860 | | | 39,793,344 |
Pearson PLC | | United Kingdom | | 3,409,246 | | | 51,509,169 |
Reed Elsevier NV | | Netherlands | | 2,012,869 | | | 34,329,572 |
| | | | | | | |
| | | | | | | 191,067,533 |
| | | | | | | |
Metals & Mining 1.1% | | | | | | | |
Barrick Gold Corp. | | Canada | | 663,561 | | | 20,415,071 |
POSCO, ADR | | South Korea | | 255,230 | | | 21,099,864 |
| | | | | | | |
| | | | | | | 41,514,935 |
| | | | | | | |
Multi-Utilities 1.7% | | | | | | | |
Centrica PLC | | United Kingdom | | 2,772,071 | | | 19,244,687 |
Suez SA | | France | | 814,356 | | | 42,171,881 |
| | | | | | | |
| | | | | | | 61,416,568 |
| | | | | | | |
Oil, Gas & Consumable Fuels 7.7% | | | | | | | |
BP PLC | | United Kingdom | | 4,777,726 | | | 53,097,904 |
Eni SpA | | Italy | | 1,493,373 | | | 50,229,410 |
Hindustan Petroleum Corp. Ltd. | | India | | 1,031,444 | | | 6,509,215 |
Indian Oil Corp. Ltd. | | India | | 267,497 | | | 2,728,936 |
Reliance Industries Ltd. | | India | | 1,374,378 | | | 39,577,039 |
Repsol YPF SA | | Spain | | 1,487,591 | | | 51,448,793 |
Royal Dutch Shell PLC, B | | United Kingdom | | 1,879,537 | | | 65,886,158 |
Total SA, B | | France | | 204,496 | | | 14,752,491 |
| | | | | | | |
| | | | | | | 284,229,946 |
| | | | | | | |
Paper & Forest Products 3.2% | | | | | | | |
Norske Skogindustrier ASA | | Norway | | 1,362,151 | | | 23,483,102 |
Stora Enso OYJ, R | | Finland | | 2,665,971 | | | 42,025,465 |
UPM-Kymmene OYJ | | Finland | | 2,066,829 | | | 52,165,431 |
| | | | | | | |
| | | | | | | 117,673,998 |
| | | | | | | |
Pharmaceuticals 4.9% | | | | | | | |
GlaxoSmithKline PLC | | United Kingdom | | 2,755,715 | | | 72,531,029 |
Sanofi-Aventis | | France | | 855,625 | | | 79,006,268 |
Takeda Pharmaceutical Co. Ltd. | | Japan | | 421,454 | | | 28,926,611 |
| | | | | | | |
| | | | | | | 180,463,908 |
| | | | | | | |
TF-13
Franklin Templeton Variable Insurance Products Trust
Statement of Investments, December 31, 2006 (continued)
| | | | | | | |
| Templeton Foreign Securities Fund | | Country | | Shares | | Value |
Long Term Investments (continued) | | | | | | | |
Common Stocks (continued) | | | | | | | |
Real Estate Management & Development 2.2% | | | | | | | |
Cheung Kong (Holdings) Ltd. | | Hong Kong | | 6,650,922 | | $ | 81,863,158 |
| | | | | | | |
Semiconductors & Semiconductor Equipment 2.6% | | | | | | | |
aInfineon Technologies AG | | Germany | | 1,396,863 | | | 19,656,283 |
Samsung Electronics Co. Ltd. | | South Korea | | 85,747 | | | 56,519,259 |
Taiwan Semiconductor Manufacturing Co. Ltd. | | Taiwan | | 10,180,816 | | | 21,089,614 |
| | | | | | | |
| | | | | | | 97,265,156 |
| | | | | | | |
Software 0.9% | | | | | | | |
aCheck Point Software Technologies Ltd. | | Israel | | 1,448,281 | | | 31,746,320 |
| | | | | | | |
Specialty Retail 0.5% | | | | | | | |
Kingfisher PLC | | United Kingdom | | 3,691,096 | | | 17,239,870 |
| | | | | | | |
Textiles, Apparel & Luxury Goods 0.5% | | | | | | | |
Burberry Group PLC | | United Kingdom | | 1,512,618 | | | 19,121,228 |
| | | | | | | |
Water Utilities 0.6% | | | | | | | |
Companhia de Saneamento Basico do Estado de San Paulo, ADR | | Brazil | | 635,130 | | | 21,505,502 |
| | | | | | | |
Wireless Telecommunication Services 2.2% | | | | | | | |
Mobile Telesystems, ADR | | Russia | | 633,420 | | | 31,791,350 |
Vodafone Group PLC, ADR | | United Kingdom | | 1,773,520 | | | 49,268,385 |
| | | | | | | |
| | | | | | | 81,059,735 |
| | | | | | | |
Total Common Stocks (Cost $2,562,370,104) | | | | | | | 3,380,480,249 |
| | | | | | | |
Preferred Stocks 1.5% | | | | | | | |
Diversified Telecommunication Services 1.0% | | | | | | | |
Tele Norte Leste Participacoes SA, ADR, pfd. | | Brazil | | 2,524,665 | | | 37,668,001 |
| | | | | | | |
Metals & Mining 0.5% | | | | | | | |
Companhia Vale do Rio Doce, ADR, pfd., A | | Brazil | | 648,056 | | | 17,011,470 |
| | | | | | | |
Total Preferred Stocks (Cost $40,938,689) | | | | | | | 54,679,471 |
| | | | | | | |
Total Long Term Investments (Cost $2,603,308,792) | | | | | | | 3,435,159,720 |
| | | | | | | |
Short Term Investment (Cost $251,571,388) 6.8% | | | | | | | |
Money Market Fund 6.8% | | | | | | | |
cFranklin Institutional Fiduciary Trust Money Market Portfolio, 4.97% | | United States | | 251,571,388 | | | 251,571,388 |
| | | | | | | |
Total Investments (Cost $2,854,880,180) 100.0% | | | | | | | 3,686,731,108 |
Other Assets, less Liabilities 0.0% | | | | | | | 50,603 |
| | | | | | | |
Net Assets 100.0% | | | | | | $ | 3,686,781,711 |
| | | | | | | |
Selected Portfolio Abbreviations
ADR - American Depository Receipt
FDR - Foreign Depository Receipt
a | Non-income producing for the twelve months ended December 31, 2006. |
b | Security was purchased pursuant to Rule 144A under the Securities Act of 1933 and may be sold in transactions exempt from registration only to qualified institutional buyers or in a public offering registered under the Securities Act of 1933. These securities have been deemed liquid under guidelines approved by the Trust’s Board of Trustees. At December 31, 2006, the aggregate value of these securities was $61,027,138, representing 1.66% of net assets. |
c | See Note 7 regarding investments in the Franklin Institutional Fiduciary Trust Money Market Portfolio. The rate shown is the annualized seven-day yield at period end. |
The accompanying notes are an integral part of these financial statements.
TF-14
Franklin Templeton Variable Insurance Products Trust
Financial Statements
Statement of Assets and Liabilities
December 31, 2006
| | | |
| | | Templeton
Foreign
Securities Fund |
Assets: | | | |
Investments in securities: | | | |
Cost - Unaffiliated issuers | | $ | 2,603,308,792 |
Cost - Sweep Money Fund (Note 7) | | | 251,571,388 |
| | | |
Total cost of investments | | $ | 2,854,880,180 |
| | | |
Value - Unaffiliated issuers | | $ | 3,435,159,720 |
Value - Sweep Money Fund (Note 7) | | | 251,571,388 |
| | | |
Total value of investments | | | 3,686,731,108 |
Cash | | | 224,683 |
Receivables: | | | |
Capital shares sold | | | 7,715,765 |
Dividends | | | 3,986,528 |
| | | |
Total assets | | | 3,698,658,084 |
| | | |
Liabilities: | | | |
Payables: | | | |
Investment securities purchased | | | 281,308 |
Capital shares redeemed | | | 6,717,358 |
Affiliates | | | 3,394,595 |
Deferred taxes | | | 900,228 |
Accrued expenses and other liabilities | | | 582,884 |
| | | |
Total liabilities | | | 11,876,373 |
| | | |
Net assets, at value | | $ | 3,686,781,711 |
| | | |
Net assets consist of: | | | |
Paid-in capital | | $ | 2,598,327,587 |
Undistributed net investment income | | | 79,126,854 |
Net unrealized appreciation (depreciation) | | | 831,026,902 |
Accumulated net realized gain (loss) | | | 178,300,368 |
| | | |
Net assets, at value | | $ | 3,686,781,711 |
| | | |
Class 1: | | | |
Net assets, at value | | $ | 594,991,084 |
| | | |
Shares outstanding | | | 31,323,485 |
| | | |
Net asset value and maximum offering price per share | | $ | 19.00 |
| | | |
Class 2: | | | |
Net assets, at value | | $ | 2,941,373,961 |
| | | |
Shares outstanding | | | 157,076,790 |
| | | |
Net asset value and maximum offering price per share | | $ | 18.73 |
| | | |
Class 3: | | | |
Net assets, at value | | $ | 150,416,666 |
| | | |
Shares outstanding | | | 8,051,834 |
| | | |
Net asset value and maximum offering price per sharea | | $ | 18.68 |
| | | |
a | Redemption price is equal to net asset value less any redemption fees retained by the Fund. |
The accompanying notes are an integral part of these financial statements.
TF-15
Franklin Templeton Variable Insurance Products Trust
Financial Statements (continued)
Statement of Operations
for the year ended December 31, 2006
| | | | |
| | | Templeton
Foreign
Securities Fund | |
Investment income: | | | | |
Dividends: (net of foreign taxes $6,331,561) | | | | |
Unaffiliated issuers | | $ | 94,252,227 | |
Sweep Money Fund (Note 7) | | | 13,479,710 | |
Other income (Note 10) | | | 37,270 | |
| | | | |
Total investment income | | | 107,769,207 | |
| | | | |
Expenses: | | | | |
Management fees (Note 3a) | | | 19,201,074 | |
Administrative fees (Note 3b) | | | 2,961,776 | |
Distribution fees: (Note 3c) | | | | |
Class 2 | | | 6,336,161 | |
Class 3 | | | 220,422 | |
Unaffiliated transfer agent fees | | | 1,959 | |
Custodian fees (Note 4) | | | 928,195 | |
Reports to shareholders | | | 593,356 | |
Professional fees | | | 128,644 | |
Trustees’ fees and expenses | | | 14,831 | |
Other | | | 79,785 | |
| | | | |
Total expenses | | | 30,466,203 | |
Expense reductions (Note 4) | | | (17,577 | ) |
| | | | |
Net expenses | | | 30,448,626 | |
| | | | |
Net investment income | | | 77,320,581 | |
| | | | |
Realized and unrealized gains (losses): | | | | |
Net realized gain (loss) from: | | | | |
Investments (Includes gains from a redemption in-kind of $34,808,242) (Note 9) | | | 215,017,237 | |
Foreign currency transactions | | | 1,699,890 | |
| | | | |
Net realized gain (loss) | | | 216,717,127 | |
| | | | |
Net change in unrealized appreciation (depreciation) on: | | | | |
Investments | | | 343,266,282 | |
Translation of assets and liabilities denominated in foreign currencies | | | 39,935 | |
Change in deferred taxes on unrealized appreciation | | | (900,228 | ) |
| | | | |
Net change in unrealized appreciation (depreciation) | | | 342,405,989 | |
| | | | |
Net realized and unrealized gain (loss) | | | 559,123,116 | |
| | | | |
Net increase (decrease) in net assets resulting from operations | | $ | 636,443,697 | |
| | | | |
The accompanying notes are an integral part of these financial statements.
TF-16
Franklin Templeton Variable Insurance Products Trust
Financial Statements (continued)
Statements of Changes in Net Assets
| | | | | | | | |
| | | Templeton Foreign Securities Fund | |
| | | Year Ended December 31, | |
| | | 2006 | | | 2005 | |
| | | | |
Increase (decrease) in net assets: | | | | | | | | |
Operations: | | | | | | | | |
Net investment income | | $ | 77,320,581 | | | $ | 42,879,381 | |
Net realized gain (loss) from investments and foreign currency transactions | | | 216,717,127 | | | | 105,273,303 | |
Net change in unrealized appreciation (depreciation) on investments and translation of assets and liabilities denominated in foreign currencies and deferred taxes | | | 342,405,989 | | | | 103,792,704 | |
| | | | |
Net increase (decrease) in net assets resulting from operations | | | 636,443,697 | | | | 251,945,388 | |
| | | | |
Distribution to shareholders from: | | | | | | | | |
Net investment income: | | | | | | | | |
Class 1 | | | (7,899,286 | ) | | | (6,459,354 | ) |
Class 2 | | | (30,532,245 | ) | | | (20,723,612 | ) |
Class 3 | | | (1,067,001 | ) | | | (354,063 | ) |
| | | | |
Total distributions to shareholders | | | (39,498,532 | ) | | | (27,537,029 | ) |
| | | | |
Capital share transactions: (Note 2) | | | | | | | | |
Class 1 | | | (39,662,208 | ) | | | (19,374,244 | ) |
Class 2 | | | 232,018,498 | | | | 610,744,172 | |
Class 3 | | | 85,243,717 | | | | 27,501,947 | |
| | | | |
Total capital share transactions | | | 277,600,007 | | | | 618,871,875 | |
| | | | |
Redemption fees | | | 9,162 | | | | 4,290 | |
| | | | |
Net increase (decrease) in net assets | | | 874,554,334 | | | | 843,284,524 | |
Net assets: | | | | | | | | |
Beginning of year | | | 2,812,227,377 | | | | 1,968,942,853 | |
| | | | |
End of year | | $ | 3,686,781,711 | | | $ | 2,812,227,377 | |
| | | | |
Undistributed net investment income included in net assets: | | | | | | | | |
End of year | | $ | 79,126,854 | | | $ | 39,493,779 | |
| | | | |
The accompanying notes are an integral part of these financial statements.
TF-17
Franklin Templeton Variable Insurance Products Trust
Notes to Financial Statements
Templeton Foreign Securities Fund
1. ORGANIZATION AND SIGNIFICANT ACCOUNTING POLICIES
Franklin Templeton Variable Insurance Products Trust (the Trust) is registered under the Investment Company Act of 1940, as amended, (the 1940 Act) as an open-end investment company, consisting of twenty-two separate funds. The Templeton Foreign Securities Fund (the Fund) included in this report is diversified. The financial statements of the remaining funds in the Trust are presented separately. Shares of the Fund are sold only to insurance company separate accounts to fund the benefits of variable life insurance policies or variable annuity contracts. The Fund offers three classes of shares: Class 1, Class 2, and Class 3. Each class of shares differs by its distribution fees, voting rights on matters affecting a single class and its exchange privilege.
The following summarizes the Fund’s significant accounting policies.
a. Security Valuation
Securities listed on a securities exchange or on the NASDAQ National Market System are valued at the last quoted sale price or the official closing price of the day, respectively. Over-the-counter securities and listed securities for which there is no reported sale are valued within the range of the most recent quoted bid and ask prices. Securities that trade in multiple markets or on multiple exchanges are valued according to the broadest and most representative market. Investments in open-end mutual funds are valued at the closing net asset value.
Foreign securities are valued as of the close of trading on the foreign stock exchange on which the security is primarily traded, or the NYSE, whichever is earlier. If no sale is reported at that time, the foreign security will be valued within the range of the most recent quoted bid and ask prices. The value is then converted into its U.S. dollar equivalent at the foreign exchange rate in effect at the close of the NYSE on the day that the value of the foreign security is determined.
The Trust has procedures to determine the fair value of individual securities and other assets for which market prices are not readily available or which may not be reliably priced. Methods for valuing these securities may include: fundamental analysis, matrix pricing, discounts from market prices of similar securities, or discounts applied due to the nature and duration of restrictions on the disposition of the securities. Due to the inherent uncertainty of valuations of such securities, the fair values may differ significantly from the values that would have been used had a ready market for such investments existed. Occasionally, events occur between the time at which trading in a security is completed and the close of the NYSE that might call into question the availability (including the reliability) of the value of a portfolio security held by the Fund. The investment manager monitors price movements following the close of trading in foreign stock markets through a series of country specific market proxies (such as baskets of American Depository Receipts, futures contracts and exchange traded funds). These price movements are measured against established trigger thresholds for each specific market proxy to assist in determining if an event has occurred. If such an event occurs, the securities may be valued using fair value procedures, which may include the use of independent pricing services. All security valuation procedures are approved by the Trust’s Board of Trustees.
b. Foreign Currency Translation
Portfolio securities and other assets and liabilities denominated in foreign currencies are translated into U.S. dollars based on the exchange rate of such currencies against U.S. dollars on the date of valuation. Purchases and sales of securities, income and expense items denominated in foreign currencies are translated into U.S. dollars at the exchange rate in effect on the transaction date. Occasionally, events may impact the availability or reliability of foreign exchange rates used to convert the U.S. dollar equivalent value. If such an event occurs, the foreign exchange rate will be valued at fair value using procedures established and approved by the Trust’s Board of Trustees.
The Fund does not separately report the effect of changes in foreign exchange rates from changes in market prices on securities held. Such changes are included in net realized and unrealized gain or loss from investments on the Statement of Operations.
Realized foreign exchange gains or losses arise from sales of foreign currencies, currency gains or losses realized between the trade and settlement dates on securities transactions and the difference between the recorded amounts of dividends, interest, and
TF-18
Franklin Templeton Variable Insurance Products Trust
Notes to Financial Statements (continued)
Templeton Foreign Securities Fund
1. ORGANIZATION AND SIGNIFICANT ACCOUNTING POLICIES (continued)
b. Foreign Currency Translation (continued)
foreign withholding taxes and the U.S. dollar equivalent of the amounts actually received or paid. Net unrealized foreign exchange gains and losses arise from changes in foreign exchange rates on foreign denominated assets and liabilities other than investments in securities held at the end of the reporting period.
c. Foreign Currency Contracts
When the Fund purchases or sells foreign securities it may enter into foreign exchange contracts to minimize foreign exchange risk from the trade date to the settlement date of the transactions. A foreign exchange contract is an agreement between two parties to exchange different currencies at an agreed upon exchange rate on a specified date. Realized and unrealized gains and losses on these contracts are included in the Statement of Operations.
The risks of these contracts include movement in the values of the foreign currencies relative to the U.S. dollar and the possible inability of the counterparties to fulfill their obligations under the contracts, which may be in excess of the amount reflected in the Statement of Assets and Liabilities.
d. Income and Deferred Taxes
No provision has been made for U.S. income taxes because the Fund intends to qualify as a regulated investment company under the Internal Revenue Code and to distribute to shareholders substantially all of its taxable income and net realized gains.
Foreign securities held by the Fund may be subject to foreign taxation on dividend income received. Foreign taxes, if any, are recorded based on the tax regulations and rates that exist in the foreign markets in which the Fund invests.
The Fund may be subject to a tax imposed on net realized gains on securities of certain foreign countries. The Fund records an estimated deferred tax liability for net unrealized gains on these securities in an amount that would be payable if the securities were disposed of on the valuation date.
e. Security Transactions, Investment Income, Expenses and Distributions
Security transactions are accounted for on trade date. Realized gains and losses on security transactions are determined on a specific identification basis. Interest income and estimated expenses are accrued daily. Dividend income is recorded on the ex-dividend date except that certain dividends from foreign securities are recognized as soon as the Fund is notified of the ex-dividend date. Distributions to shareholders are recorded on the ex-dividend date and are determined according to income tax regulations (tax basis). Distributable earnings determined on a tax basis may differ from earnings recorded in accordance with accounting principles generally accepted in the United States. These differences may be permanent or temporary. Permanent differences are reclassified among capital accounts to reflect their tax character. These reclassifications have no impact on net assets or the results of operations. Temporary differences are not reclassified, as they may reverse in subsequent periods.
Common expenses incurred by the Trust are allocated among the funds based on the ratio of net assets of each fund to the combined net assets of the Trust. Fund specific expenses are charged directly to the fund that incurred the expense.
Realized and unrealized gains and losses and net investment income, other than class specific expenses, are allocated daily to each class of shares based upon the relative proportion of net assets of each class. Differences in class-level expenses may result in payment of different per share distributions by class.
TF-19
Franklin Templeton Variable Insurance Products Trust
Notes to Financial Statements (continued)
Templeton Foreign Securities Fund
1. ORGANIZATION AND SIGNIFICANT ACCOUNTING POLICIES (continued)
f. Accounting Estimates
The preparation of financial statements in accordance with accounting principles generally accepted in the United States of America requires management to make estimates and assumptions that affect the reported amounts of assets and liabilities at the date of the financial statements and the amounts of income and expenses during the reporting period. Actual results could differ from those estimates.
g. Redemption Fees
Redemptions and exchanges of Class 3 shares held 60 days or less may be subject to the Fund’s redemption fee, which is 1% of the amount redeemed. Such fees are retained by the Fund and accounted for as an addition to paid-in capital.
h. Guarantees and Indemnifications
Under the Trust’s organizational documents, its officers and trustees are indemnified by the Trust against certain liabilities arising out of the performance of their duties to the Trust. Additionally, in the normal course of business, the Trust enters into contracts with service providers that contain general indemnification clauses. The Trust’s maximum exposure under these arrangements is unknown as this would involve future claims that may be made against the Trust that have not yet occurred. Currently, the Trust expects the risk of loss to be remote.
2. SHARES OF BENEFICIAL INTEREST
At December 31, 2006, there were an unlimited number of shares authorized ($0.01 par value). Transactions in the Fund’s shares were as follows:
| | | | | | | | | | | | | | |
| | | Year Ended December 31, | |
| | | 2006 | | | 2005 | |
| Class 1 Shares: | | Shares | | | Amount | | | Shares | | | Amount | |
Shares sold | | 2,328,810 | | | $ | 39,073,549 | | | 3,758,655 | | | $ | 55,211,998 | |
Shares issued in reinvestment of distributions | | 492,781 | | | | 7,899,286 | | | 453,606 | | | | 6,459,354 | |
Shares redeemed | | (5,075,580 | ) | | | (86,635,043 | ) | | (5,489,770 | ) | | | (81,045,596 | ) |
| | | | | | | | | | | | | | |
Net increase (decrease) | | (2,253,989 | ) | | $ | (39,662,208 | ) | | (1,277,509 | ) | | $ | (19,374,244 | ) |
| | | | | | | | | | | | | | |
| |
| | | Year Ended December 31, | |
| | | 2006 | | | 2005 | |
| Class 2 Shares: | | Shares | | | Amount | | | Shares | | | Amount | |
Shares sold | | 43,227,824 | | | $ | 728,731,224 | | | 51,344,360 | | | $ | 745,826,623 | |
Shares issued in reinvestment of distributions | | 1,925,158 | | | | 30,455,999 | | | 1,472,894 | | | | 20,723,612 | |
Shares redeemed in-kind (Note 9) | | (8,720,489 | ) | | | (151,213,281 | ) | | — | | | | — | |
Shares redeemed | | (22,264,085 | ) | | | (375,955,444 | ) | | (10,646,257 | ) | | | (155,806,063 | ) |
| | | | | | | | | | | | | | |
Net increase (decrease) | | 14,168,408 | | | $ | 232,018,498 | | | 42,170,997 | | | $ | 610,744,172 | |
| | | | | | | | | | | | | | |
TF-20
Franklin Templeton Variable Insurance Products Trust
Notes to Financial Statements (continued)
Templeton Foreign Securities Fund
2. SHARES OF BENEFICIAL INTEREST (continued)
| | | | | | | | | | | | | | |
| | | Year Ended December 31, | |
| | | 2006 | | | 2005 | |
| Class 3 Shares: | | Shares | | | Amount | | | Shares | | | Amount | |
Shares sold | | 5,176,865 | | | $ | 88,136,330 | | | 2,107,457 | | | $ | 30,752,443 | |
Shares issued in reinvestment of distributions | | 67,617 | | | | 1,067,001 | | | 25,189 | | | | 353,916 | |
Shares redeemed | | (234,367 | ) | | | (3,959,614 | ) | | (244,990 | ) | | | (3,604,412 | ) |
| | | | | | | | | | | | | | |
Net increase (decrease) | | 5,010,115 | | | $ | 85,243,717 | | | 1,887,656 | | | $ | 27,501,947 | |
| | | | | | | | | | | | | | |
3. TRANSACTIONS WITH AFFILIATES
Franklin Resources, Inc. is the holding company for various subsidiaries that together are referred to as Franklin Templeton Investments. Certain officers and trustees of the Trust are also officers and/or directors of the following subsidiaries:
| | |
| Subsidiary | | Affiliation |
Templeton Investment Counsel, LLC (TIC) | | Investment manager |
Franklin Templeton Services, LLC (FT Services) | | Administrative manager |
Franklin Templeton Distributors, Inc. (Distributors) | | Principal underwriter |
Franklin Templeton Investor Services, LLC (Investor Services) | | Transfer agent |
a. Management Fees
Effective May 1, 2006, the Fund pays an investment management fee to TIC based on the average daily net assets of the Fund as follows:
| | |
| Annualized Fee Rate | | Net Assets |
| 0.750% | | Up to and including $200 million |
| 0.675% | | Over $200 million, up to and including $1.3 billion |
| 0.600% | | Over $1.3 billion, up to and including $10 billion |
| 0.580% | | Over $10 billion, up to and including $15 billion |
| 0.560% | | Over $15 billion, up to and including $20 billion |
| 0.540% | | In excess of $20 billion |
Prior to May 1, 2006, the annualized rate of 0.600% was applicable to net assets in excess of $1.3 billion.
b. Administrative Fees
The Fund pays an administrative fee to FT Services based on the average daily net assets of the Fund as follows:
| | |
| Annualized Fee Rate | | Net Assets |
| 0.150% | | Up to and including $200 million |
| 0.135% | | Over $200 million, up to and including $700 million |
| 0.100% | | Over $700 million, up to and including $1.2 billion |
| 0.075% | | In excess of $1.2 billion |
c. Distribution Fees
The Fund’s Board of Trustees has adopted distribution plans for Class 2 and Class 3 shares pursuant to Rule 12b-1 under the 1940 Act. Under the Fund’s compensation distribution plans, the Fund pays Distributors for costs incurred in connection with the servicing, sale and distribution of the Fund’s shares up to 0.25% and 0.35% per year of its average daily net assets of Class 2 and Class 3, respectively. The Board of Trustees has agreed to limit the current rate to 0.25% per year for Class 3.
TF-21
Franklin Templeton Variable Insurance Products Trust
Notes to Financial Statements (continued)
Templeton Foreign Securities Fund
3. TRANSACTIONS WITH AFFILIATES (continued)
d. Transfer Agent Fees
Investor Services, under terms of an agreement, performs shareholder servicing for the Fund and is not paid by the Fund for the services.
4. EXPENSE OFFSET ARRANGEMENT
The Fund has entered into an arrangement with its custodian whereby credits realized as a result of uninvested cash balances are used to reduce a portion of the Fund’s custodian expenses. During the year ended December 31, 2006, the custodian fees were reduced as noted in the Statement of Operations.
5. INCOME TAXES
For tax purposes, capital losses may be carried over to offset future capital gains, if any. During the year ended December 31, 2006, the Fund utilized $1,301,670 of capital loss carryforwards.
For tax purposes, realized currency losses, occurring subsequent to October 31, may be deferred and treated as occurring on the first day of the following fiscal year. At December 31, 2006, the Fund deferred realized currency losses of $606,955.
The tax character of distributions paid during the years ended December 31, 2006 and 2005, was as follows:
| | | | | | |
| | | 2006 | | 2005 |
Distributions paid from ordinary income | | $ | 39,498,532 | | $ | 27,537,029 |
| | | | | |
At December 31, 2006, the cost of investments, net unrealized appreciation (depreciation), undistributed ordinary income and undistributed long term capital gains for income tax purposes were as follows:
| | | | |
Cost of investments | | $ | 2,854,880,180 | |
| | | | |
Unrealized appreciation | | $ | 856,496,210 | |
Unrealized depreciation | | | (24,645,282 | ) |
| | | | |
Net unrealized appreciation (depreciation) | | $ | 831,850,928 | |
| | | | |
Undistributed ordinary income | | $ | 87,855,172 | |
Undistributed long term capital gains | | | 170,179,007 | |
| | | | |
Distributable earnings | | $ | 258,034,179 | |
| | | | |
Net investment income differs for financial statement and tax purposes primarily due to differing treatments of foreign currency transactions.
Net realized gains (losses) differ for financial statement and tax purposes primarily due to differing treatment of gains realized on in-kind shareholder redemptions and foreign currency transactions.
6. INVESTMENT TRANSACTIONS
Purchases and sales of investments (excluding short term securities) for the year ended December 31, 2006, aggregated $1,135,821,788 and $549,647,692, respectively. Sales of investments excludes $151,213,281 of an in-kind redemption.
TF-22
Franklin Templeton Variable Insurance Products Trust
Notes to Financial Statements (continued)
Templeton Foreign Securities Fund
7. INVESTMENTS IN FRANKLIN INSTITUTIONAL FIDUCIARY TRUST MONEY MARKET PORTFOLIO
The Fund may invest in the Franklin Institutional Fiduciary Trust Money Market Portfolio (the Sweep Money Fund), an open-end investment company managed by Franklin Advisers, Inc. (an affiliate of the investment manager). Management fees paid by the Fund are reduced on assets invested in the Sweep Money Fund, in an amount not to exceed the management and administrative fees paid by the Sweep Money Fund.
8. CONCENTRATION OF RISK
Investing in foreign securities may include certain risks and considerations not typically associated with investing in U.S. securities, such as fluctuating currency values and changing local and regional economic, political and social conditions, which may result in greater market volatility. In addition, certain foreign securities may not be as liquid as U.S. securities.
9. REDEMPTION IN-KIND
During the year ended December 31, 2006, the Fund realized $34,808,242 of net gains resulting from a redemption in-kind in which a shareholder redeemed fund shares for securities held by the Fund rather than for cash. Because such gains are not taxable to the Fund, and are not distributed to shareholders, they have been reclassified from accumulated net realized gains to paid-in capital.
10. REGULATORY MATTERS
As part of various investigations by a number of federal, state, and foreign regulators and governmental entities, including the Securities and Exchange Commission (“SEC”), relating to certain practices in the mutual fund industry, including late trading, market timing and marketing support payments to securities dealers who sell fund shares (“marketing support”), Franklin Resources, Inc. and certain of its subsidiaries (collectively, the “Company”), entered into settlements with certain of those regulators. Specifically, the Company entered into settlements with the SEC, among others, concerning market timing and marketing support.
On June 23, 2006, the SEC approved the proposed plan of distribution for the marketing support settlement, and disbursement of the settlement monies to the designated funds, in accordance with the terms and conditions of that settlement and plan, was completed in September 2006 and is recorded as other income.
The plan of distribution for the market timing settlement is currently under review by the SEC staff. After publication of notice of the plan and a 30-day comment period, the proposed plan of distribution will be submitted to the SEC for approval. Following the SEC’s approval of the plan of distribution, with modifications as appropriate, distribution of the settlement monies will begin in accordance with the terms and conditions of the settlement and plan.
In addition, the Company, as well as most of the mutual funds within Franklin Templeton Investments and certain current or former officers, Company directors, fund directors, and employees, have been named in private lawsuits (styled as shareholder class actions, or as derivative actions on behalf of either the named funds or Franklin Resources, Inc.). The lawsuits relate to the industry practices referenced above, as well as to allegedly excessive commissions and advisory and distribution fees.
The Company and fund management believe that the claims made in each of the private lawsuits referenced above are without merit and intend to defend against them vigorously. The Company cannot predict with certainty the eventual outcome of these lawsuits, nor whether they will have a material negative impact on the Company. If it is determined that the Company bears responsibility for any unlawful or inappropriate conduct that caused losses to the Trust, it is committed to making the Trust or its shareholders whole, as appropriate.
TF-23
Franklin Templeton Variable Insurance Products Trust
Notes to Financial Statements (continued)
Templeton Foreign Securities Fund
11. NEW ACCOUNTING PRONOUNCEMENTS
In July 2006, the Financial Accounting Standards Board (FASB) issued FASB Interpretation No. 48, “Accounting for Uncertainty in Income Taxes – an Interpretation of FASB Statement No. 109” (“FIN 48”), which clarifies the accounting for uncertainty in tax positions taken or expected to be taken in a tax return. FIN 48 provides guidance on the measurement, recognition, classification and disclosure of tax positions, along with accounting for the related interest and penalties. FIN 48 is effective for fiscal years beginning after December 15, 2006, and is to be applied to all open tax years as of the date of effectiveness. On December 22, 2006, the Securities and Exchange Commission extended the implementation date to no later than the last net asset value calculation in the first semi-annual reporting period in 2007. The Fund is currently evaluating the impact, if any, of applying the various provisions of FIN 48.
In September 2006, FASB issued FASB Statement No. 157, “Fair Value Measurement” (“SFAS 157”), which defines fair value, establishes a framework for measuring fair value, and expands disclosures about fair value measurements. SFAS 157 is effective for fiscal years beginning after November 15, 2007, and interim periods within those fiscal years. The Trust believes the adoption of SFAS 157 will have no material impact on its financial statements.
TF-24
Franklin Templeton Variable Insurance Products Trust
Templeton Foreign Securities Fund
Report of Independent Registered Public Accounting Firm
To the Board of Trustees and Shareholders of
Franklin Templeton Variable Insurance Products Trust
In our opinion, the accompanying statement of assets and liabilities, including the statement of investments, and the related statements of operations and of changes in net assets and the financial highlights present fairly, in all material respects, the financial position of the Templeton Foreign Securities Fund (one of the funds constituting the Franklin Templeton Variable Insurance Products Trust, hereafter referred to as the “Fund”) at December 31, 2006, the results of its operations for the year then ended, the changes in its net assets for each of the two years in the period then ended and the financial highlights for each of the periods presented, in conformity with accounting principles generally accepted in the United States of America. These financial statements and financial highlights (hereafter referred to as “financial statements”) are the responsibility of the Fund’s management; our responsibility is to express an opinion on these financial statements based on our audits. We conducted our audits of these financial statements in accordance with the standards of the Public Company Accounting Oversight Board (United States). Those standards require that we plan and perform the audit to obtain reasonable assurance about whether the financial statements are free of material misstatement. An audit includes examining, on a test basis, evidence supporting the amounts and disclosures in the financial statements, assessing the accounting principles used and significant estimates made by management, and evaluating the overall financial statement presentation. We believe that our audits, which included confirmation of securities at December 31, 2006 by correspondence with the custodian and brokers, provide a reasonable basis for our opinion.
PricewaterhouseCoopers LLP
San Francisco, California
February 16, 2007
TF-25
Franklin Templeton Variable Insurance Products Trust
Tax Designation (unaudited)
Templeton Foreign Securities Fund
Under Section 852(b)(3)(C) of the Internal Revenue Code (Code), the Fund designates the maximum amount allowable but no less than $170,179,007 as a long term capital gain dividend for the fiscal year ended December 31, 2006.
At December 31, 2006, more than 50% of the Fund’s total assets were invested in securities of foreign issuers. In most instances, foreign taxes were withheld from dividends paid to the Fund on these investments. The Fund elects to treat foreign taxes paid as allowed under Section 853 of the Internal Revenue Code (Code). This election will allow shareholders of record in June 2007, to treat their proportionate share of foreign taxes paid by the Fund as having been paid directly by them. Shareholders shall consider these amounts as foreign taxes paid in the tax year in which they receive the Fund distribution.
The foreign tax information will be disclosed in the June 30, 2007, semi-annual report of the Fund.
TF-26
TEMPLETON GLOBAL ASSET ALLOCATION FUND
We are pleased to bring you Templeton Global Asset Allocation Fund’s annual report for the fiscal year ended December 31, 2006.
Performance Summary as of 12/31/06
Average annual total return of Class 1 shares* represents the average annual change in value, assuming reinvestment of dividends and capital gains. Average returns smooth out variations in returns, which can be significant; they are not the same as year-by-year results.
Periods ended 12/31/06
| | | | | | |
| | | 1-Year | | 5-Year | | 10-Year |
Average Annual Total Return | | +21.39% | | +13.13% | | +9.74% |
*Performance prior to the 5/1/00 merger reflects historical performance of Templeton Asset Allocation Fund.
Total Return Index Comparison for Hypothetical $10,000 Investment (1/1/97–12/31/06)
The graph below shows the change in value of a hypothetical $10,000 investment in the Fund over the indicated period and includes reinvestment of any income or distributions. The Fund’s performance* is compared to the performance of the Morgan Stanley Capital International (MSCI) All Country (AC) World Index and the J.P. Morgan (JPM) Government Bond Index (GBI) Global. One cannot invest directly in an index, nor is an index representative of the Fund’s portfolio. Please see Important Notes to Performance Information preceding the Fund Summaries.
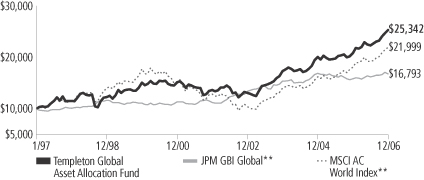
**Sources: Standard & Poor’s Micropal; J.P. Morgan. Please see Index Descriptions following the Fund Summaries.
Templeton Global Asset Allocation Fund – Class 1
Performance reflects the Fund’s Class 1 operating expenses, but does not include any contract fees, expenses or sales charges. If they had been included, performance would be lower. These charges and deductions, particularly for variable life policies, can have a significant effect on contract values and insurance benefits. See the contract prospectus for a complete description of these expenses, including sales charges.
Performance data represent past performance, which does not guarantee future results. Investment return and principal value will fluctuate, and you may have a gain or loss when you sell your shares. Current performance may differ from figures shown.
TGA-1
Fund Goal and Main Investments: Templeton Global Asset Allocation Fund seeks high total return. The Fund normally invests in equity securities of companies of any country, debt securities of companies and governments of any country, and in money market instruments. The Fund normally invests substantially to primarily in equity securities.
Performance Overview
You can find the Fund’s one-year total return in the Performance Summary. The Fund performed comparably with its broad equity benchmark, the MSCI AC World Index, which returned +21.53% for the period under review, while outperforming its fixed income benchmark, the JPM GBI Global, which had a +5.94% total return during the same time.1
Economic and Market Overview
The global economy grew in 2006, although gross domestic product (GDP) growth slowed in the U.S. while it accelerated in Europe. The economic drivers remained consistent over the past four years: strong corporate and consumer demand, reasonably low inflation, a tight or improving labor market, and a relatively moderate interest rate environment, despite recent interest rate hikes by many of the world’s central banks. However, the economy also faced headwinds from elevated energy prices, higher global interest rates and a weaker U.S. housing market. These factors dampened investor confidence mid-year, when many equity markets declined before rebounding later in the year.
Despite such challenges, global economic activity was healthy. Strong global liquidity — whether petrodollars, corporate cash, private equity, household savings or central banks’ reserves — continued to search for a home. Largely as a result, bond yield spreads over U.S. Treasuries narrowed, and equity and commodity markets rose in the latter part of the year. The shift from risk aversion to risk tolerance was concurrent with the U.S. Federal Reserve Board’s (Fed’s) decisions since June to hold the federal funds target rate at 5.25%, as well as with lower oil prices in the second half of the year.
Narrowing corporate credit spreads globally reflected greater risk tolerance, while abundant cash supplies in the capital markets contributed to record global merger and acquisition activity in 2006. The total value
1. Sources: Standard & Poor’s Micropal; J.P. Morgan. One cannot invest directly in an index, nor is an index representative of the Fund’s portfolio. Please see Index Descriptions following the Fund Summaries.
Fund Risks: The Fund’s investments in stocks offer the potential for long-term gains but can be subject to short-term price fluctuation. Foreign investing, especially in emerging markets, involves additional risks including currency fluctuations, economic instability, and social and political developments. Because the Fund invests in bonds and other debt obligations, the Fund’s share price and yield will be affected by interest rate movements. Bond prices generally move in the opposite direction of interest rates. Thus, as prices of bonds in the Fund adjust to a rise in interest rates, the Fund’s share price may decline. The Fund’s prospectus also includes a description of the main investment risks.
TGA-2
of deals announced as a result of hostile takeovers, private equity buyouts and broad corporate consolidation was $3.8 trillion.2 This figure surpassed the $3.4 trillion mark set in 2000.2 Announced deals from private equity alone reached a record $700 billion, more than double the record set in 2005 and 20 times greater than a decade ago.3
The U.S. trade and current account deficits grew to record size during the year. The current account deficit, which was 6.8% of GDP in third quarter 2006, was largely the result of low American savings that made the U.S. dependent on short-term financing from Asian and oil- producing countries with current account surpluses.4 Monetary policy did not loosen in response to this slowdown because inflationary concerns persisted, and the Fed kept its rate steady since June to slow the economy and reduce inflationary pressure.
In Japan, industrial production increased along with capacity utilization, an indication of economic improvement despite continuing low real GDP growth. The Bank of Japan raised its interest rate 25 basis points during the year in response to rising consumer prices in the second quarter, a positive sign for an economy that suffered prolonged deflation.
Many emerging market economies had a very good year, particularly commodity exporters. High international prices for raw materials, caused in part by Asia’s surge in demand, resulted in strong export growth. Higher profits in these sectors also increased foreign investment and boosted overall production. Growth helped improve many countries’ debt profiles, as did high liquidity in the international market, which lowered the cost of debt. Finally, inflation dropped in many countries due to effective monetary and fiscal policies.
With this economic backdrop, the non-U.S. equity markets —including emerging markets that remained a major magnet for global fund flows — led global equity markets to end 2006 on a strong note, and all major regions delivered double-digit total returns for the year. Stock market indexes in the U.S. and most European countries reached six-year highs in the fourth quarter, and many emerging market indexes in Asia, Europe and Latin America neared or reached all-time highs. Fixed income markets, on the other hand, were somewhat constrained by higher interest rates and robust equity markets.
2. Source: “Can M&A’s ‘Best of Times’ Get Better?,” The Wall Street Journal, 1/2/07.
3. Source: “TPG tops buy-out league with $101bn,” The Wall Street Journal, 12/27/06.
4. Source: Bureau of Economic Analysis.
What is a current account?
A current account is that part of the balance of payments where all of one country’s international transactions in goods and services are recorded.
What is balance of payments?
Balance of payments is a record of all of a country’s exports and imports of goods and services, borrowing and lending with the rest of the world during a particular time period. It helps a country evaluate its competitive strengths and weaknesses and forecast the strength of its currency.
TGA-3
Investment Strategy
Our investment philosophy is bottom-up, value-oriented and long-term. In choosing equity investments, we will focus on the market price of a company’s securities relative to our evaluation of the company’s potential long-term earnings, asset value and cash flow. Among factors we may consider are a company’s historical value measures, including price/earnings ratio, profit margins and liquidation value.
In choosing debt investments, we allocate our assets among issuers, geographic regions and currencies based upon our assessment of relative interest rates among currencies, our outlook for changes in interest rates among currencies, and credit risks. With respect to debt securities, we may also from time to time make use of forward currency exchange contracts (hedging instruments) to protect against currency risk.
Manager’s Discussion
Equity
During the year under review, Fund performance versus the equity benchmark MSCI AC World Index (the Index) was driven by several factors. Stock selection and an overweighted allocation in the consumer discretionary sector provided a significant boost to relative performance.5 German auto maker BMW, U.S. toy manufacturer Mattel, U.K. publisher Pearson, U.S. cable television and Internet service provider Comcast, U.K. foodservice giant Compass Group, U.S. media conglomerate News Corp. and U.S. satellite provider The DIRECTV Group were some of the Fund’s standout performers within the sector.
The Fund’s industrials sector position also benefited relative performance mainly due to stock selection.6 Notable contributors included U.K. defense contractor BAE Systems and European wind turbine manufacturers and wind farm operators Vestas Wind Systems and Gamesa Corporacion Tecnologica, which each experienced significant sales growth as interest increased in clean and renewable energy sources.
The Fund’s absolute and relative results were also aided by investments in the telecommunication services sector, benefiting from stock selection and a significantly overweighted allocation relative to the Index.7 Notable contributors included Norway’s Telenor, Spain’s Telefonica, U.K. wireless provider Vodafone Group and South Korean telecom operator SK Telecom.
5. The consumer discretionary sector comprises automobiles; diversified consumer services; hotels, restaurants and leisure; household durables; leisure equipment and products; media; multiline retail and specialty retail in the SOI.
6. The industrials sector comprises aerospace and defense, air freight and logistics, commercial services and supplies, electrical equipment and industrial conglomerates in the SOI.
7. The telecommunication services sector comprises diversified telecommunication services and wireless telecommunication services in the SOI.
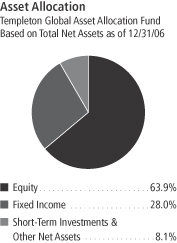
TGA-4
It is important to recognize the effect of currency movements on the Fund’s performance. In general, if the value of the U.S. dollar goes up compared with a foreign currency, an investment traded in that foreign currency will go down in value because it will be worth fewer U.S. dollars. This can have a negative effect on Fund performance. Conversely, when the U.S. dollar weakens in relation to a foreign currency, an investment traded in that foreign currency will increase in value, which can contribute to Fund performance. For the 12 months ended December 31, 2006, the U.S. dollar declined in value relative to most non-U.S. currencies. As a result, the Fund’s performance (equity portion) was positively affected by the portfolio’s investment primarily in securities with non-U.S. currency exposure. However, one cannot expect the same result in future periods.
Despite the Fund’s excellent 2006 results, there were a few areas of weakness in the portfolio. Health care stocks contributed to the Fund’s overall returns, but stock selection hindered our results relative to the Index.8 Laggard stocks included U.S. medical devices manufacturer Boston Scientific and U.S. hospital operator Tenet Healthcare.
In general, materials stocks did well in 2006.9 Unfortunately, the Fund was slightly underweighted versus the Index in this strong-performing sector, and missed some of the associated gains.
Fixed Income
Currency Strategy
In the current environment of rising interest rates and low spreads for credit risk, an increased share of total return came from exchange rate movements. Foreign currencies generally performed well in 2006 as the U.S. dollar fell 4.22% against its major trading partners.10 This decline was mainly due to slowing U.S. growth and continuing global imbalances centered on the U.S. current account deficit. Also contributing to the dollar’s depreciation was a narrower gap between U.S. interest rates and those of other developed countries as the Fed paused its rate hikes while other central banks continued theirs. The U.S. dollar’s weakness helped the Fund’s relative performance because the Fund was well diversified in currency exposure and was underweighted in the dollar compared with the benchmark JPM GBI Global.
8. The health care sector comprises health care equipment and supplies, health care providers and services, and pharmaceuticals in the SOI.
9. The materials sector comprises chemicals and paper and forest products in the SOI.
10. Source: Federal Reserve H10 Report.
Top 5 Country Holdings
Templeton Global Asset Allocation Fund
12/31/06
| | |
| | | % of Total
Net Assets |
| U.S. | | 19.7% |
| U.K. | | 13.6% |
| South Korea | | 5.6% |
| Germany | | 4.1% |
| Japan | | 3.8% |
Top 5 Sectors/Industries
Templeton Global Asset Allocation Fund Based on Equity Securities 12/31/06
| | |
| | | % of Total
Net Assets |
| Media | | 7.8% |
| Pharmaceuticals | | 4.9% |
| Insurance | | 4.5% |
| Oil, Gas & Consumable Fuels | | 4.4% |
| Commercial Banks | | 4.3% |
The dollar value, number of shares or principal amount, and names of all portfolio holdings are listed in the Fund’s Statement of Investments (SOI).
TGA-5
In the second half of the year, the Fund added a position in the Japanese yen due to improving fundamentals and our belief that it was relatively cheap because of weak past performance. During that period, deflation ended, the Japanese economy expanded and the central bank raised interest rates. However, the Fund remained underweighted compared with the benchmark index and benefited relatively from the yen’s 0.94% depreciation against the dollar during the year.11 The euro appreciated 11.79% against the dollar, largely because the European Central Bank hiked interest rates 125 basis points and euro-zone growth accelerated to 2.7% in the third quarter compared with a year earlier.11, 12 Despite this strong performance, our commitment to currency diversification led us to favor non-euro European countries. The Fund’s underweighted position versus the euro detracted from relative performance, but this was offset by our overweighted positions in other European currencies that outperformed the euro and the JPM GBI Global.
Our strategy of favoring peripheral countries worked well for the Fund in 2006, particularly in the cases of Sweden and South Korea. The Swedish krona appreciated 16.30% against the dollar in part because interest rates increased 150 basis points.11, 13 Also, Sweden accumulated a trade surplus of $18.9 billion through November and a fiscal surplus of $8.1 billion during that time frame.13 These strong fundamentals and increasing economic activity led the Fund to hold a significantly overweighted position throughout the year that helped relative performance. Also benefiting the Fund, the South Korean won appreciated 8.69% as interest rates increased 75 basis points, international reserves rose, the current account posted a surplus of nearly $6 billion through November, and growth accelerated.11, 14
Interest Rate Strategy
Strong growth in many parts of the world continued to push up interest rates. Therefore, we maintained short duration positions in many countries. However, we found select opportunities where specific cycles created falling interest rate environments that were profitable for the Fund in the past year. One notable example was Indonesia where interest rates were lowered 300 basis points as inflation fell significantly15. The country’s Consumer Price Index (CPI) declined from 17.1% in December 2005 to 6.6% in December 2006.15 Indonesia’s bond market
11. Source: Exshare (via Compustat via FactSet).
12. Source: Eurostat.
13. Sources: Sveriges Riksbank.
14. Source: Bank of Korea.
15. Source: Bank Indonesia.
TGA-6
returned +29.53% during the year in local currency terms according to the HSBC Asian Local Bond Index (ALBI), and contributed to the Fund’s outperformance.16 Poland was another example where a country’s specific interest rate cycle contributed to the Fund’s relative return. Poland’s bond market returned 5.2% in local currency terms according to the JPM GBI Global.17 Poland ended a long string of interest rate cuts in February, and its interest rate ended down 50 basis points for the year.18
Global Sovereign Debt Strategy
The Fund also invested in sovereign debt that typically compensates for greater credit risk by offering higher yields relative to U.S. and European benchmark Treasury curves. This risk premium declined in 2006 and more money entered the market. The yield spread between U.S. Treasuries and the JPM Emerging Markets Bond Index Global fell from 237 to 171 basis points over the 12-month period.17 This trend of higher valuations led the Fund to increasingly find value in local markets. In addition to being relatively cheaper, these instruments could benefit from currency appreciation in a weak dollar environment. The Fund’s performance benefited from the improving outlook for sovereign debt, especially of non-Japan Asia and Latin America, because lower perceived risk of credit events led to higher prices.
Thank you for your participation in Templeton Global Asset Allocation Fund. We look forward to serving your future investment needs.
16. Source: Standard & Poor’s Micropal. Please see Index Descriptions following the Fund Summaries.
17. Source: J.P. Morgan. Please see Index Descriptions following the Fund Summaries.
18. Source: National Bank of Poland.
The foregoing information reflects our analysis, opinions and portfolio holdings as of December 31, 2006, the end of the reporting period. The way we implement our main investment strategies and the resulting portfolio holdings may change depending on factors such as market and economic conditions. These opinions may not be relied upon as investment advice or an offer for a particular security. The information is not a complete analysis of every aspect of any market, country, industry, security or the Fund. Statements of fact are from sources considered reliable, but the investment manager makes no representation or warranty as to their completeness or accuracy. Although historical performance is no guarantee of future results, these insights may help you understand our investment management philosophy.
TGA-7
Fund Expenses
As an investor in a variable insurance contract (“Contract”) that indirectly provides for investment in an underlying mutual fund, you can incur transaction and/or ongoing expenses at both the Fund level and the Contract level.
| • | | Transaction expenses can include sales charges (loads) on purchases, redemption fees, surrender fees, transfer fees and premium taxes. |
| • | | Ongoing expenses can include management fees, distribution and service (12b-1) fees, contract fees, annual maintenance fees, mortality and expense risk fees and other fees and expenses. All mutual funds and Contracts have some types of ongoing expenses. |
The expenses shown in the table are meant to highlight ongoing expenses at the Fund level only and do not include ongoing expenses at the Contract level, or transaction expenses at either the Fund or Contract level. While the Fund does not have transaction expenses, if the transaction and ongoing expenses at the Contract level were included, the expenses shown would be higher. You should consult your Contract prospectus or disclosure document for more information.
The table shows Fund-level ongoing expenses and can help you understand these expenses and compare them with those of other mutual funds offered through the Contract. The table assumes a $1,000 investment held for the six months indicated. Please refer to the Fund prospectus for additional information on operating expenses.
Actual Fund Expenses
The first line (Actual) of the table provides actual account values and expenses. The “Ending Account Value” is derived from the Fund’s actual return, which includes the effect of ongoing Fund expenses, but does not include the effect of ongoing Contract expenses.
You can estimate the Fund-level expenses you incurred during the period by following these steps. Of course, your account value and expenses will differ from those in this illustration:
| 1. | Divide your account value by $1,000. |
If an account had an $8,600 value, then $8,600 ÷ $1,000 = 8.6.
| 2. | Multiply the result by the number under the heading “Fund-level Expenses Incurred During Period.” |
If Fund-level Expenses Incurred During Period were $7.50, then 8.6 × $7.50 = $64.50.
In this illustration, the estimated expenses incurred this period at the Fund level are $64.50.
Templeton Global Asset Allocation Fund – Class 1
TGA-8
Hypothetical Example for Comparison with Other Mutual Funds
Information in the second line (Hypothetical) of the table can help you compare ongoing expenses of the Fund with those of other mutual funds offered through the Contract. This information may not be used to estimate the actual ending account balance or expenses you incurred during the period. The hypothetical “Ending Account Value” is based on the Fund’s actual expense ratio and an assumed 5% annual rate of return before expenses, which does not represent the Fund’s actual return. The figure under the heading “Fund-Level Expenses Incurred During Period” shows the hypothetical expenses your account would have incurred under this scenario. You can compare this figure with the 5% hypothetical examples that appear in shareholder reports of other funds offered through a Contract.
| | | | | | | | | |
| Class 1 | | Beginning
Account
Value 7/1/06 | | Ending
Account
Value 12/31/06 | | Fund-Level
Expenses Incurred
During Period*
7/1/06-12/31/06 |
Actual | | $ | 1,000 | | $ | 1,132.50 | | $ | 4.25 |
Hypothetical (5% return before expenses) | | $ | 1,000 | | $ | 1,021.22 | | $ | 4.02 |
*Expenses are equal to the annualized expense ratio for the Fund’s Class 1 shares (0.79%), which does not include any ongoing expenses of the Contract for which the Fund is an investment option, multiplied by the average account value over the period, multiplied by 184/365 to reflect the one-half year period.
TGA-9
Franklin Templeton Variable Insurance Products Trust
Financial Highlights
Templeton Global Asset Allocation Fund
| | | | | | | | | | | | | | | | | | | | |
| | | Year Ended December 31, | |
| Class 1 | | 2006 | | | 2005 | | | 2004 | | | 2003 | | | 2002 | |
| | | | |
Per share operating performance | | | | | | | | | | | | | | | | | | | | |
(for a share outstanding throughout the year) | | | | | | | | | | | | | | | | | | | | |
Net asset value, beginning of year | | $ | 21.06 | | | $ | 21.11 | | | $ | 18.78 | | | $ | 14.59 | | | $ | 15.51 | |
| | | | |
Income from investment operationsa: | | | | | | | | | | | | | | | | | | | | |
Net investment incomeb | | | 0.64 | | | | 0.49 | | | | 0.48 | | | | 0.41 | | | | 0.39 | |
Net realized and unrealized gains (losses) | | | 3.36 | | | | 0.28 | | | | 2.42 | | | | 4.23 | | | | (1.01 | ) |
| | | | |
Total from investment operations | | | 4.00 | | | | 0.77 | | | | 2.90 | | | | 4.64 | | | | (0.62 | ) |
| | | | |
Less distributions from: | | | | | | | | | | | | | | | | | | | | |
Net investment income and net foreign currency gains | | | (1.66 | ) | | | (0.82 | ) | | | (0.57 | ) | | | (0.45 | ) | | | (0.30 | ) |
Net realized gains | | | (1.44 | ) | | | — | | | | — | | | | — | | | | — | |
| | | | |
Total distributions | | | (3.10 | ) | | | (0.82 | ) | | | (0.57 | ) | | | (0.45 | ) | | | (0.30 | ) |
| | | | |
Net asset value, end of year | | $ | 21.96 | | | $ | 21.06 | | | $ | 21.11 | | | $ | 18.78 | | | $ | 14.59 | |
| | | | |
| | | | | |
Total returnc | | | 21.39% | | | | 3.85% | | | | 15.94% | | | | 32.31% | | | | (4.17)% | |
Ratios/supplemental data | | | | | | | | | | | | | | | | | | | | |
Net assets, end of year (000’s) | | $ | 276,790 | | | $ | 638,006 | | | $ | 625,728 | | | $ | 572,798 | | | $ | 425,470 | |
Ratios to average net assets: | | | | | | | | | | | | | | | | | | | | |
Expenses | | | 0.84% | d | | | 0.85% | d | | | 0.84% | d | | | 0.81% | | | | 0.81% | |
Net investment income | | | 2.91% | | | | 2.36% | | | | 2.52% | | | | 2.54% | | | | 2.56% | |
Portfolio turnover rate | | | 23.74% | e | | | 26.23% | | | | 27.43% | | | | 34.25% | | | | 27.27% | |
a | The amount shown for a share outstanding throughout the period may not correlate with the Statement of Operations for the period due to the timing of sales and repurchase of the Fund shares in relation to income earned and/or fluctuating market value of the investments of the Fund. |
b | Based on average daily shares outstanding. |
c | Total return does not include any fees, charges or expenses imposed by the variable annuity and life insurance contracts for which the Franklin Templeton Variable Insurance Products Trust serves as an underlying investment vehicle. |
d | Benefit of expense reduction rounds to less than 0.01%. |
e | Excludes the value of portfolio securities delivered as a result of a redemption in-kind. See Note 10. |
The accompanying notes are an integral part of these financial statements.
TGA-10
Franklin Templeton Variable Insurance Products Trust
Financial Highlights (continued)
Templeton Global Asset Allocation Fund
| | | | | | | | | | | | | | | | | | | | |
| | | Year Ended December 31, | |
| Class 2 | | 2006 | | | 2005 | | | 2004 | | | 2003 | | | 2002 | |
| | | | |
Per share operating performance | | | | | | | | | | | | | | | | | | | | |
(for a share outstanding throughout the year) | | | | | | | | | | | | | | | | | | | | |
Net asset value, beginning of year | | $ | 20.88 | | | $ | 20.94 | | | $ | 18.64 | | | $ | 14.49 | | | $ | 15.41 | |
| | | | |
Income from investment operationsa: | | | | | | | | | | | | | | | | | | | | |
Net investment incomeb | | | 0.52 | | | | 0.43 | | | | 0.43 | | | | 0.36 | | | | 0.34 | |
Net realized and unrealized gains (losses) | | | 3.40 | | | | 0.29 | | | | 2.41 | | | | 4.20 | | | | (1.00 | ) |
| | | | |
Total from investment operations | | | 3.92 | | | | 0.72 | | | | 2.84 | | | | 4.56 | | | | (0.66 | ) |
| | | | |
Less distributions from: | | | | | | | | | | | | | | | | | | | | |
Net investment income and net foreign currency gains | | | (1.61 | ) | | | (0.78 | ) | | | (0.54 | ) | | | (0.41 | ) | | | (0.26 | ) |
Net realized gains | | | (1.44 | ) | | | — | | | | — | | | | — | | | | — | |
| | | | |
Total distributions | | | (3.05 | ) | | | (0.78 | ) | | | (0.54 | ) | | | (0.41 | ) | | | (0.26 | ) |
| | | | |
Net asset value, end of year | | $ | 21.75 | | | $ | 20.88 | | | $ | 20.94 | | | $ | 18.64 | | | $ | 14.49 | |
| | | | |
| | | | | |
Total returnc | | | 21.11% | | | | 3.55% | | | | 15.72% | | | | 31.95% | | | | (4.39)% | |
Ratios/supplemental data | | | | | | | | | | | | | | | | | | | | |
Net assets, end of year (000’s) | | $ | 78,021 | | | $ | 68,385 | | | $ | 65,806 | | | $ | 55,754 | | | $ | 39,926 | |
Ratios to average net assets: | | | | | | | | | | | | | | | | | | | | |
Expenses | | | 1.09% | d | | | 1.10% | d | | | 1.09% | d | | | 1.06% | | | | 1.06% | |
Net investment income | | | 2.66% | | | | 2.11% | | | | 2.27% | | | | 2.29% | | | | 2.31% | |
Portfolio turnover rate | | | 23.74% | e | | | 26.23% | | | | 27.43% | | | | 34.25% | | | | 27.27% | |
a | The amount shown for a share outstanding throughout the period may not correlate with the Statement of Operations for the period due to the timing of sales and repurchase of the Fund shares in relation to income earned and/or fluctuating market value of the investments of the Fund. |
b | Based on average daily shares outstanding. |
c | Total return does not include any fees, charges or expenses imposed by the variable annuity and life insurance contracts for which the Franklin Templeton Variable Insurance Products Trust serves as an underlying investment vehicle. |
d | Benefit of expense reduction rounds to less than 0.01%. |
e | Excludes the value of portfolio securities delivered as a result of a redemption in-kind. See Note 10. |
The accompanying notes are an integral part of these financial statements.
TGA-11
Franklin Templeton Variable Insurance Products Trust
Statement of Investments, December 31, 2006
| | | | | | | |
| Templeton Global Asset Allocation Fund | | Country | | Shares/
Warrants | | Value |
Long Term Investments 91.9% | | | | | | | |
Common Stocks and Warrants 63.4% | | | | | | | |
Aerospace & Defense 1.2% | | | | | | | |
BAE Systems PLC | | United Kingdom | | 293,926 | | $ | 2,450,659 |
aRaytheon Co., wts., 6/14/11 | | United States | | 157 | | | 2,814 |
aRolls-Royce Group PLC | | United Kingdom | | 204,428 | | | 1,792,529 |
aRolls-Royce Group PLC, B | | United Kingdom | | 7,502,507 | | | 14,913 |
| | | | | | | |
| | | | | | | 4,260,915 |
| | | | | | | |
Air Freight & Logistics 1.0% | | | | | | | |
Deutsche Post AG | | Germany | | 112,393 | | | 3,397,544 |
| | | | | | | |
Automobiles 0.7% | | | | | | | |
Bayerische Motoren Werke AG | | Germany | | 42,925 | | | 2,470,513 |
| | | | | | | |
Capital Markets 1.2% | | | | | | | |
Amvescap PLC | | United Kingdom | | 193,261 | | | 2,255,697 |
Morgan Stanley | | United States | | 13,607 | | | 1,108,018 |
Nomura Holdings Inc. | | Japan | | 54,494 | | | 1,027,757 |
| | | | | | | |
| | | | | | | 4,391,472 |
| | | | | | | |
Chemicals 0.6% | | | | | | | |
The Dow Chemical Co. | | United States | | 51,432 | | | 2,054,194 |
| | | | | | | |
Commercial Banks 4.3% | | | | | | | |
Banco Santander Central Hispano SA | | Spain | | 155,839 | | | 2,908,814 |
DBS Group Holdings Ltd. | | Singapore | | 209,603 | | | 3,089,131 |
HSBC Holdings PLC | | United Kingdom | | 127,347 | | | 2,334,404 |
aKookmin Bank, ADR | | South Korea | | 25,932 | | | 2,091,156 |
Mitsubishi UFJ Financial Group Inc. | | Japan | | 89 | | | 1,099,089 |
Nordea Bank AB, FDR | | Sweden | | 160,175 | | | 2,478,065 |
Sumitomo Mitsui Financial Group Inc. | | Japan | | 119 | | | 1,219,641 |
| | | | | | | |
| | | | | | | 15,220,300 |
| | | | | | | |
Commercial Services & Supplies 1.7% | | | | | | | |
Group 4 Securicor PLC | | United Kingdom | | 664,467 | | | 2,446,367 |
R. R. Donnelley & Sons Co. | | United States | | 45,646 | | | 1,622,259 |
Rentokil Initial PLC | | United Kingdom | | 635,457 | | | 2,065,782 |
| | | | | | | |
| | | | | | | 6,134,408 |
| | | | | | | |
Communications Equipment 0.6% | | | | | | | |
aAvaya Inc. | | United States | | 160,479 | | | 2,243,496 |
| | | | | | | |
Computers & Peripherals 1.3% | | | | | | | |
Lite-On Technology Corp. | | Taiwan | | 866,508 | | | 1,171,388 |
Seagate Technology | | United States | | 125,853 | | | 3,335,104 |
| | | | | | | |
| | | | | | | 4,506,492 |
| | | | | | | |
Diversified Consumer Services 0.5% | | | | | | | |
H&R Block Inc. | | United States | | 80,935 | | | 1,864,742 |
| | | | | | | |
Diversified Financial Services 2.1% | | | | | | | |
ING Groep NV | | Netherlands | | 92,795 | | | 4,114,574 |
JPMorgan Chase & Co. | | United States | | 68,196 | | | 3,293,867 |
| | | | | | | |
| | | | | | | 7,408,441 |
| | | | | | | |
Diversified Telecommunication Services 3.6% | | | | | | | |
Chunghwa Telecom Co. Ltd., ADR | | Taiwan | | 63,420 | | | 1,251,277 |
France Telecom SA, ADR | | France | | 119,038 | | | 3,297,353 |
TGA-12
Franklin Templeton Variable Insurance Products Trust
Statement of Investments, December 31, 2006 (continued)
| | | | | | | |
| Templeton Global Asset Allocation Fund | | Country | | Shares/
Warrants | | Value |
Long Term Investments (continued) | | | | | | | |
Common Stocks and Warrants (continued) | | | | | | | |
Diversified Telecommunication Services (continued) | | | | | | | |
Singapore Telecommunications Ltd. | | Singapore | | 339,000 | | $ | 725,110 |
Telefonica SA, ADR | | Spain | | 44,119 | | | 2,812,586 |
Telefonos de Mexico SA de CV, L, ADR | | Mexico | | 41,929 | | | 1,184,913 |
Telenor ASA | | Norway | | 187,278 | | | 3,521,449 |
| | | | | | | |
| | | | | | | 12,792,688 |
| | | | | | | |
Electric Utilities 0.8% | | | | | | | |
E.ON AG | | Germany | | 21,441 | | | 2,923,437 |
| | | | | | | |
Electrical Equipment 1.5% | | | | | | | |
Gamesa Corp. Tecnologica SA | | Spain | | 10,039 | | | 276,304 |
bGamesa Corp. Tecnologica SA, 144A | | Spain | | 124,152 | | | 3,417,040 |
aVestas Wind Systems AS | | Denmark | | 41,732 | | | 1,763,704 |
| | | | | | | |
| | | | | | | 5,457,048 |
| | | | | | | |
Electronic Equipment & Instruments 1.0% | | | | | | | |
Hitachi Ltd. | | Japan | | 372,089 | | | 2,319,402 |
Venture Corp. Ltd. | | Singapore | | 151,038 | | | 1,329,690 |
| | | | | | | |
| | | | | | | 3,649,092 |
| | | | | | | |
Food & Staples Retailing 0.5% | | | | | | | |
Alliance Boots PLC | | United Kingdom | | 108,015 | | | 1,772,631 |
| | | | | | | |
Food Products 0.8% | | | | | | | |
Unilever PLC | | United Kingdom | | 101,782 | | | 2,846,358 |
| | | | | | | |
Health Care Equipment & Supplies 0.7% | | | | | | | |
aBoston Scientific Corp. | | United States | | 142,849 | | | 2,454,146 |
| | | | | | | |
Health Care Providers & Services 0.5% | | | | | | | |
aTenet Healthcare Corp. | | United States | | 259,563 | | | 1,809,154 |
| | | | | | | |
Hotels Restaurants & Leisure 1.1% | | | | | | | |
Compass Group PLC | | United Kingdom | | 665,630 | | | 3,780,256 |
| | | | | | | |
Household Durables 1.2% | | | | | | | |
Koninklijke Philips Electronics NV | | Netherlands | | 79,661 | | | 3,004,321 |
Sony Corp., ADR | | Japan | | 30,013 | | | 1,285,457 |
| | | | | | | |
| | | | | | | 4,289,778 |
| | | | | | | |
Industrial Conglomerates 2.3% | | | | | | | |
Siemens AG, ADR | | Germany | | 30,680 | | | 3,023,514 |
Smiths Group PLC | | United Kingdom | | 122,680 | | | 2,382,082 |
Tyco International Ltd. | | United States | | 83,615 | | | 2,541,896 |
| | | | | | | |
| | | | | | | 7,947,492 |
| | | | | | | |
Insurance 4.5% | | | | | | | |
ACE Ltd. | | Bermuda | | 44,783 | | | 2,712,507 |
American International Group Inc. | | United States | | 35,320 | | | 2,531,031 |
Aviva PLC | | United Kingdom | | 139,940 | | | 2,252,703 |
AXA SA | | France | | 92,795 | | | 3,756,892 |
Old Mutual PLC | | South Africa | | 347,710 | | | 1,186,534 |
Swiss Reinsurance Co. | | Switzerland | | 17,079 | | | 1,452,041 |
XL Capital Ltd., A | | Bermuda | | 30,300 | | | 2,182,206 |
| | | | | | | |
| | | | | | | 16,073,914 |
| | | | | | | |
Leisure Equipment & Products 0.7% | | | | | | | |
FUJIFILM Holdings Corp. | | Japan | | 62,793 | | | 2,579,559 |
| | | | | | | |
TGA-13
Franklin Templeton Variable Insurance Products Trust
Statement of Investments, December 31, 2006 (continued)
| | | | | | | |
| Templeton Global Asset Allocation Fund | | Country | | Shares/
Warrants | | Value |
Long Term Investments (continued) | | | | | | | |
Common Stocks and Warrants (continued) | | | | | | | |
Media 7.8% | | | | | | | |
British Sky Broadcasting Group PLC | | United Kingdom | | 302,912 | | $ | 3,096,544 |
aComcast Corp., A | | United States | | 88,933 | | | 3,724,514 |
aThe DIRECTV Group Inc. | | United States | | 150,174 | | | 3,745,340 |
Mediaset SpA | | Italy | | 87,570 | | | 1,039,215 |
News Corp., A | | United States | | 162,113 | | | 3,482,187 |
Pearson PLC | | United Kingdom | | 160,461 | | | 2,424,352 |
Reed Elsevier NV | | Netherlands | | 220,876 | | | 3,767,050 |
Time Warner Inc. | | United States | | 151,764 | | | 3,305,420 |
aViacom Inc., B | | United States | | 70,810 | | | 2,905,334 |
| | | | | | | |
| | | | | | | 27,489,956 |
| | | | | | | |
Multi-Utilities 1.4% | | | | | | | |
Centrica PLC | | United Kingdom | | 211,452 | | | 1,467,974 |
National Grid PLC | | United Kingdom | | 162,336 | | | 2,344,591 |
Suez SA | | France | | 24,682 | | | 1,278,171 |
| | | | | | | |
| | | | | | | 5,090,736 |
| | | | | | | |
Multiline Retail 0.8% | | | | | | | |
Target Corp. | | United States | | 47,117 | | | 2,688,025 |
| | | | | | | |
Oil, Gas & Consumable Fuels 4.4% | | | | | | | |
BP PLC | | United Kingdom | | 219,075 | | | 2,434,720 |
El Paso Corp. | | United States | | 267,614 | | | 4,089,142 |
Eni SpA | | Italy | | 98,648 | | | 3,318,013 |
Repsol YPF SA | | Spain | | 71,406 | | | 2,469,598 |
Royal Dutch Shell PLC, B | | United Kingdom | | 95,666 | | | 3,353,520 |
| | | | | | | |
| | | | | | | 15,664,993 |
| | | | | | | |
Paper & Forest Products 2.0% | | | | | | | |
Stora Enso OYJ, R | | Finland | | 228,287 | | | 3,616,203 |
UPM-Kymmene OYJ | | Finland | | 130,993 | | | 3,306,179 |
| | | | | | | |
| | | | | | | 6,922,382 |
| | | | | | | |
Pharmaceuticals 4.9% | | | | | | | |
Abbott Laboratories | | United States | | 51,961 | | | 2,531,020 |
Bristol-Myers Squibb Co. | | United States | | 95,740 | | | 2,519,877 |
GlaxoSmithKline PLC | | United Kingdom | | 128,035 | | | 3,369,910 |
Pfizer Inc. | | United States | | 124,481 | | | 3,224,058 |
Sanofi-Aventis | | France | | 33,418 | | | 3,085,734 |
Takeda Pharmaceutical Co. Ltd. | | Japan | | 37,121 | | | 2,547,810 |
| | | | | | | |
| | | | | | | 17,278,409 |
| | | | | | | |
Real Estate Management & Development 1.2% | | | | | | | |
Cheung Kong (Holdings) Ltd. | | Hong Kong | | 190,176 | | | 2,340,789 |
Swire Pacific Ltd., A | | Hong Kong | | 171,734 | | | 1,844,466 |
| | | | | | | |
| | | | | | | 4,185,255 |
| | | | | | | |
Semiconductors & Semiconductor Equipment 1.5% | | | | | | | |
aInfineon Technologies AG, ADR | | Germany | | 130,060 | | | 1,824,742 |
Samsung Electronics Co. Ltd. | | South Korea | | 5,490 | | | 3,618,677 |
| | | | | | | |
| | | | | | | 5,443,419 |
| | | | | | | |
Software 2.3% | | | | | | | |
aCheck Point Software Technologies Ltd. | | Israel | | 93,261 | | | 2,044,281 |
Microsoft Corp. | | United States | | 97,946 | | | 2,924,667 |
TGA-14
Franklin Templeton Variable Insurance Products Trust
Statement of Investments, December 31, 2006 (continued)
| | | | | | | | |
| Templeton Global Asset Allocation Fund | | Country | | Shares/
Warrants | | | Value |
Long Term Investments (continued) | | | | | | | | |
Common Stocks and Warrants (continued) | | | | | | | | |
Software (continued) | | | | | | | | |
Nintendo Co. Ltd. | | Japan | | 5,876 | | | $ | 1,525,336 |
aOracle Corp. | | United States | | 100,140 | | | | 1,716,400 |
| | | | | | | | |
| | | | | | | | 8,210,684 |
| | | | | | | | |
Specialty Retail 1.0% | | | | | | | | |
aChico’s FAS Inc. | | United States | | 91,540 | | | | 1,893,963 |
The Gap Inc. | | United States | | 91,810 | | | | 1,790,295 |
| | | | | | | | |
| | | | | | | | 3,684,258 |
| | | | | | | | |
Thrifts & Mortgage Finance 0.4% | | | | | | | | |
Fannie Mae | | United States | | 22,194 | | | | 1,318,102 |
| | | | | | | | |
Wireless Telecommunication Services 1.3% | | | | | | | | |
SK Telecom Co. Ltd., ADR | | South Korea | | 45,160 | | | | 1,195,837 |
Vodafone Group PLC, ADR | | United Kingdom | | 127,022 | | | | 3,528,671 |
| | | | | | | | |
| | | | | | | | 4,724,508 |
| | | | | | | | |
Total Common Stocks and Warrants (Cost $156,151,371) | | | | | | | | 225,028,797 |
| | | | | | | | |
Preferred Stock (Cost $270,002) 0.5% | | | | | | | | |
Metals & Mining 0.5% | | | | | | | | |
Companhia Vale do Rio Doce, ADR, pfd., A | | Brazil | | 61,860 | | | | 1,623,825 |
| | | | | | | | |
| | | Country/
Organization | | Principal
Amountc | | | |
Foreign Government and Agency Securities 27.1% | | | | | | | | |
Bank of Thailand Bond, | | | | | | | | |
5.00%, 1/12/08 | | Thailand | | 9,050,000 | THB | | | 255,359 |
5.50%, 8/10/08 | | Thailand | | 14,950,000 | THB | | | 423,089 |
European Investment Bank, 2.125%, 9/20/07 | | Supranationald | | 221,000,000 | JPY | | | 1,876,990 |
Government of Argentina, | | | | | | | | |
e,fFRN, 5.59%, 8/03/12 | | Argentina | | 3,347,000 | | | | 2,380,304 |
gGross Domestic Product Linked Security, 12/15/35, wts. | | Argentina | | 23,335,000 | | | | 3,208,562 |
gGross Domestic Product Linked Security, 12/15/35, wts. | | Argentina | | 7,900,000 | EUR | | | 1,376,548 |
Government of Austria, 5.00%, 7/15/12 | | Austria | | 2,114,000 | EUR | | | 2,933,692 |
Government of Belgium, 5.00%, 9/28/12 | | Belgium | | 776,000 | EUR | | | 1,078,650 |
Government of Canada, | | | | | | | | |
4.50%, 9/01/07 | | Canada | | 1,762,000 | CAD | | | 1,515,237 |
6.00%, 6/01/08 | | Canada | | 975,000 | CAD | | | 858,586 |
6.00%, 6/01/11 | | Canada | | 3,016,000 | CAD | | | 2,797,368 |
Government of Finland, 3.00%, 7/04/08 | | Finland | | 815,000 | EUR | | | 1,062,500 |
Government of France, 4.00%, 10/25/09 | | France | | 712,000 | EUR | | | 942,442 |
Government of Germany, 5.00%, 7/04/11 | | Germany | | 615,000 | EUR | | | 846,665 |
Government of Indonesia, | | | | | | | | |
14.275%, 12/15/13 | | Indonesia | | 6,653,000,000 | IDR | | | 906,144 |
10.75%, 5/15/16 | | Indonesia | | 26,600,000,000 | IDR | | | 3,030,163 |
11.00%, 11/15/20 | | Indonesia | | 18,000,000,000 | IDR | | | 2,119,030 |
12.80%, 6/15/21 | | Indonesia | | 7,415,000,000 | IDR | | | 985,258 |
12.00%, 9/15/26 | | Indonesia | | 8,000,000,000 | IDR | | | 1,011,842 |
bGovernment of Iraq, 144A, 5.80%, 1/15/28 | | Iraq | | 600,000 | | | | 391,500 |
Government of Malaysia, | | | | | | | | |
3.135%, 12/17/07 | | Malaysia | | 3,853,000 | MYR | | | 1,088,163 |
6.45%, 7/01/08 | | Malaysia | | 10,885,000 | MYR | | | 3,214,313 |
TGA-15
Franklin Templeton Variable Insurance Products Trust
Statement of Investments, December 31, 2006 (continued)
| | | | | | | | |
| Templeton Global Asset Allocation Fund | | Country/
Organization | | Principal
Amountc | | | Value |
Long Term Investments (continued) | | | | | | | | |
Foreign Government and Agency Securities (continued) | | | | | | | | |
Government of Mexico, 10.00%, 12/05/24 | | Mexico | | 152,000 | h MXN | | $ | 1,746,852 |
Government of New Zealand, 7.00%, 7/15/09 | | New Zealand | | 8,043,000 | NZD | | | 5,716,626 |
Government of Norway, 6.75%, 1/15/07 | | Norway | | 40,712,000 | NOK | | | 6,535,420 |
Government of the Philippines, 9.00%, 2/15/13 | | Philippines | | 628,000 | | | | 728,480 |
Government of Poland, | | | | | | | | |
8.50%, 5/12/07 | | Poland | | 7,550,000 | PLN | | | 2,640,932 |
6.00%, 5/24/09 | | Poland | | 9,900,000 | PLN | | | 3,514,843 |
6.25%, 10/24/15 | | Poland | | 2,700,000 | PLN | | | 998,515 |
5.75%, 9/23/22 | | Poland | | 4,075,000 | PLN | | | 1,464,911 |
Government of Singapore, 4.00%, 3/01/07 | | Singapore | | 3,939,000 | SGD | | | 2,571,315 |
Government of Slovakia, | | | | | | | | |
4.80%, 4/14/09 | | Slovak Republic | | 700,000 | SKK | | | 27,124 |
4.90%, 2/11/14 | | Slovak Republic | | 86,500,000 | SKK | | | 3,446,568 |
5.30%, 5/12/19 | | Slovak Republic | | 600,000 | SKK | | | 25,252 |
iStrip, 1/14/07 | | Slovak Republic | | 80,000,000 | SKK | | | 3,060,866 |
Government of Sweden, | | | | | | | | |
8.00%, 8/15/07 | | Sweden | | 40,500,000 | SEK | | | 6,074,527 |
5.50%, 10/08/12 | | Sweden | | 21,630,000 | SEK | | | 3,425,150 |
Government of Thailand, 5.60%, 7/07/07 | | Thailand | | 7,540,000 | THB | | | 213,442 |
Korea Treasury Note, | | | | | | | | |
6.90%, 1/16/07 | | South Korea | | 5,000,000,000 | KRW | | | 5,379,959 |
4.75%, 3/03/07 | | South Korea | | 4,700,000,000 | KRW | | | 5,052,063 |
3.75%, 9/10/07 | | South Korea | | 1,900,000,000 | KRW | | | 2,027,030 |
4.50%, 9/09/08 | | South Korea | | 600,000,000 | KRW | | | 640,435 |
New South Wales Treasury Corp., 8.00%, 3/01/08 | | Australia | | 2,471,000 | AUD | | | 1,984,567 |
jNota Do Tesouro Nacional, Index Linked, | | | | | | | | |
6.00%, 11/15/09 | | Brazil | | 1,250 | k BRL | | | 903,302 |
9.762%, 1/01/12 | | Brazil | | 4,000 | k BRL | | | 1,708,982 |
6.00%, 5/15/15 | | Brazil | | 1,300 | k BRL | | | 881,192 |
Queensland Treasury Corp., Series 07G, 8.00%, 9/14/07 | | Australia | | 1,360,000 | AUD | | | 1,086,081 |
| | | | | | | | |
Total Foreign Government and Agency Securities
(Cost $81,389,553) | | | | | | | | 96,156,839 |
| | | | | | | | |
U.S. Government and Agency Securities (Cost $3,389,880) 0.9% | | | | | | | | |
FNMA, 2.125%, 10/09/07 | | United States | | 370,000,000 | JPY | | | 3,145,626 |
| | | | | | | | |
Total Long Term Investments (Cost $241,200,806) | | | | | | | | 325,955,087 |
| | | | | | | | |
Short Term Investments 7.7% | | | | | | | | |
Foreign Government Securities 4.9% | | | | | | | | |
iCanada Treasury Bill, 6/14/07 | | Canada | | 2,500,000 | CAD | | | 2,104,602 |
iEgypt Certificate of Deposit, 9/12/07 | | Egypt | | 2,000,000 | EGP | | | 326,233 |
iEgypt Treasury Bill, | | | | | | | | |
2/20/07 | | Egypt | | 10,800,000 | EGP | | | 1,864,902 |
6/19/07 | | Egypt | | 1,075,000 | EGP | | | 179,835 |
7/31/07 | | Egypt | | 4,175,000 | EGP | | | 690,999 |
8/28/07 | | Egypt | | 1,075,000 | EGP | | | 176,639 |
9/25/07 | | Egypt | | 1,000,000 | EGP | | | 163,180 |
11/20/07 | | Egypt | | 14,475,000 | EGP | | | 2,329,271 |
iNorwegian Treasury Bill, 6/20/07 | | Norway | | 5,300,000 | NOK | | | 835,467 |
iThailand Treasury Bill, | | | | | | | | |
2/22/07 | | Thailand | | 63,980,000 | THB | | | 1,793,008 |
3/08/07 | | Thailand | | 17,042,000 | THB | | | 475,778 |
TGA-16
Franklin Templeton Variable Insurance Products Trust
Statement of Investments, December 31, 2006 (continued)
| | | | | | | | | |
| Templeton Global Asset Allocation Fund | | Country | | Principal
Amountc | | | Value | |
Short Term Investments (continued) | | | | | | | | | |
Foreign Government Securities (continued) | | | | | | | | | |
Thailand Treasury Bill, (continued) | | | | | | | | | |
4/05/07 | | Thailand | | 47,000,000 | THB | | $ | 1,309,810 | |
5/03/07 | | Thailand | | 62,969,000 | THB | | | 1,748,353 | |
6/07/07 | | Thailand | | 47,000,000 | THB | | | 1,298,970 | |
8/02/07 | | Thailand | | 6,492,000 | THB | | | 178,190 | |
9/06/07 | | Thailand | | 4,740,000 | THB | | | 129,430 | |
10/04/07 | | Thailand | | 26,495,000 | THB | | | 720,771 | |
12/06/07 | | Thailand | | 37,710,000 | THB | | | 1,017,571 | |
| | | | | | | | | |
Total Foreign Government Securities (Cost $16,849,567) | | | | | | | | 17,343,009 | |
| | | | | | | | | |
Total Investments before Money Market Fund
(Cost $258,050,373) | | | | | | | | 343,298,096 | |
| | | | | | | | | |
| | | | | Shares | | | | |
Money Market Fund (Cost $10,065,934) 2.8% | | | | | | | | | |
lFranklin Institutional Fiduciary Trust Money Market Portfolio, 4.97% | | United States | | 10,065,934 | | | | 10,065,934 | |
| | | | | | | | | |
Total Investments (Cost $268,116,307) 99.6% | | | | | | | | 353,364,030 | |
Net Unrealized Loss on Forward Exchange Contracts (0.2)% | | | | | | | | (567,414 | ) |
Other Assets, less Liabilities 0.6% | | | | | | | | 2,014,306 | |
| | | | | | | | | |
Net Assets 100.0% | | | | | | | $ | 354,810,922 | |
| | | | | | | | | |
Currency Abbreviations
AUD - Australian Dollar
BRL - Brazilian Real
CAD - Canadian Dollar
EGP - Egyptian Pounds
EUR - Euro
IDR - Indonesian Rupiah
JPY - Japanese Yen
KRW - South Korean Won
MXN - Mexican Peso
MYR - Malaysian Ringgit
NOK - Norwegian Krone
NZD - New Zealand Dollar
PLN - Polish Zloty
SEK - Swedish Krona
SGD - Singapore Dollar
SKK - Slovak Koruna
THB - Thai Baht
Selected Portfolio Abbreviations
ADR - American Depository Receipt
FDR - Foreign Depository Receipt
FNMA - Federal National Mortgage Association
FRN - Floating Rate Note
a | Non-income producing for the twelve months ended December 31, 2006. |
b | Security was purchased pursuant to Rule 144A under the Securities Act of 1933 and may be sold in transactions exempt from registration only to qualified institutional buyers or in a public offering registered under the Securities Act of 1933. These securities have been deemed liquid under guidelines approved by the Trust’s Board of Trustees. At December 31, 2006, the aggregate value of these securities was $3,808,540, representing 1.07% of net assets. |
c | The principal amount is stated in U.S. dollars unless otherwise indicated. |
d | A supranational organization is an entity formed by two or more central governments through international treaties. |
e | The coupon rate shown represents the rate at period end. |
f | The principal amount is stated in original face, and scheduled paydowns are reflected in the market price on ex-date. |
g | Warrants are linked to the Argentine Republic Gross Domestic Product (GDP) and do not pay principal over the life of the security or at expiration. Warrants entitle the holder to receive only variable income payments, subject to certain conditions, which are based on growth of the Argentine GDP and the principal or “notional” value of these GDP linked warrants. |
h | Principal is stated in 100 Peso units. |
i | The security is traded on a discount basis with no stated coupon rate. |
j | Redemption price at maturity is adjusted for inflation. See Note 1(e). |
k | Principal is stated in 1,000 Real units. |
l | See Note 7 regarding investments in the Franklin Institutional Fiduciary Trust Money Market Portfolio. The rate shown is the annualized seven-day yield at period end. |
The accompanying notes are an integral part of these financial statements.
TGA-17
Franklin Templeton Variable Insurance Products Trust
Financial Statements
Statement of Assets and Liabilities
December 31, 2006
| | | |
| | | Templeton
Global Asset
Allocation Fund |
Assets: | | | |
Investments in securities: | | | |
Cost - Unaffiliated issuers | | $ | 258,050,373 |
Cost - Sweep Money Fund (Note 7) | | | 10,065,934 |
| | | |
Total cost of investments | | $ | 268,116,307 |
| | | |
Value - Unaffiliated issuers | | $ | 343,298,096 |
Value - Sweep Money Fund (Note 7) | | | 10,065,934 |
| | | |
Total value of investments | | | 353,364,030 |
Cash | | | 103,049 |
Receivables: | | | |
Capital shares sold | | | 9,618 |
Dividends and interest | | | 2,545,286 |
Unrealized gain on forward exchange contracts (Note 8) | | | 206,269 |
| | | |
Total assets | | | 356,228,252 |
| | | |
Liabilities: | | | |
Payables: | | | |
Capital shares redeemed | | | 238,881 |
Affiliates | | | 258,420 |
Reports to shareholders | | | 95,734 |
Unrealized loss on forward exchange contracts (Note 8) | | | 773,683 |
Accrued expenses and other liabilities | | | 50,612 |
| | | |
Total liabilities | | | 1,417,330 |
| | | |
Net assets, at value | | $ | 354,810,922 |
| | | |
Net assets consist of: | | | |
Paid-in capital | | $ | 213,905,785 |
Undistributed net investment income | | | 23,255,087 |
Net unrealized appreciation (depreciation) | | | 84,730,820 |
Accumulated net realized gain (loss) | | | 32,919,230 |
| | | |
Net assets, at value | | $ | 354,810,922 |
| | | |
Class 1: | | | |
Net assets, at value | | $ | 276,790,188 |
| | | |
Shares outstanding | | | 12,605,495 |
| | | |
Net asset value and maximum offering price per share | | $ | 21.96 |
| | | |
Class 2: | | | |
Net assets, at value | | $ | 78,020,734 |
| | | |
Shares outstanding | | | 3,587,555 |
| | | |
Net asset value and maximum offering price per share | | $ | 21.75 |
| | | |
The accompanying notes are an integral part of these financial statements.
TGA-18
Franklin Templeton Variable Insurance Products Trust
Financial Statements (continued)
Statement of Operations
for the year ended December 31, 2006
| | | | |
| | | Templeton
Global Asset
Allocation Fund | |
Investment income: | | | | |
Dividends: (net of foreign taxes of $744,949) | | | | |
Unaffiliated issuers | | $ | 10,242,304 | |
Sweep Money Fund (Note 7) | | | 414,795 | |
Interest (net of foreign taxes of $252,075) | | | 7,707,335 | |
Other income (Note 11) | | | 33,517 | |
| | | | |
Total investment income | | | 18,397,951 | |
| | | | |
Expenses: | | | | |
Management fees (Note 3a) | | | 2,971,123 | |
Administrative fees (Note 3b) | | | 689,388 | |
Distribution fees - Class 2 (Note 3c) | | | 178,150 | |
Unaffiliated transfer agent fees | | | 147 | |
Custodian fees (Note 4) | | | 198,236 | |
Reports to shareholders | | | 182,402 | |
Professional fees | | | 53,891 | |
Trustees’ fees and expenses | | | 2,890 | |
Other | | | 19,724 | |
| | | | |
Total expenses | | | 4,295,951 | |
Expense reductions (Note 4) | | | (1,670 | ) |
| | | | |
Net expenses | | | 4,294,281 | |
| | | | |
Net investment income | | | 14,103,670 | |
| | | | |
Realized and unrealized gains (losses): | | | | |
Net realized gain (loss) from: | | | | |
Investments (Includes gains from a redemption in-kind of $67,648,833) (Note 10) | | | 100,742,556 | |
Foreign currency transactions | | | 11,196,470 | |
| | | | |
Net realized gain (loss) | | | 111,939,026 | |
| | | | |
Net change in unrealized appreciation (depreciation) on: | | | | |
Investments | | | (29,937,287 | ) |
Translation of assets and liabilities denominated in foreign currencies | | | 52,484 | |
| | | | |
Net change in unrealized appreciation (depreciation) | | | (29,884,803 | ) |
| | | | |
Net realized and unrealized gain (loss) | | | 82,054,223 | |
| | | | |
Net increase (decrease) in net assets resulting from operations | | $ | 96,157,893 | |
| | | | |
The accompanying notes are an integral part of these financial statements.
TGA-19
Franklin Templeton Variable Insurance Products Trust
Financial Statements (continued)
Statements of Changes in Net Assets
| | | | | | | | |
| | | Templeton Global
Asset Allocation Fund | |
| | | Year Ended December 31, | |
| | | 2006 | | | 2005 | |
| | | | |
Increase (decrease) in net assets: | | | | | | | | |
Operations: | | | | | | | | |
Net investment income | | $ | 14,103,670 | | | $ | 16,277,721 | |
Net realized gain (loss) from investments and foreign currency transactions | | | 111,939,026 | | | | 56,460,404 | |
Net change in unrealized appreciation (depreciation) on investments and translation of assets and liabilities denominated in foreign currencies | | | (29,884,803 | ) | | | (46,246,407 | ) |
| | | | |
Net increase (decrease) in net assets resulting from operations | | | 96,157,893 | | | | 26,491,718 | |
| | | | |
Distributions to shareholders from: | | | | | | | | |
Net investment income and net foreign currency gains: | | | | | | | | |
Class 1 | | | (18,191,422 | ) | | | (24,700,828 | ) |
Class 2 | | | (5,009,742 | ) | | | (2,527,126 | ) |
Net realized gains: | | | | | | | | |
Class 1 | | | (15,734,572 | ) | | | — | |
Class 2 | | | (4,478,496 | ) | | | — | |
| | | | |
Total distributions to shareholders | | | (43,414,232 | ) | | | (27,227,954 | ) |
| | | | |
Capital share transactions: (Note 2) | | | | | | | | |
Class 1 | | | (409,674,691 | ) | | | 12,930,774 | |
Class 2 | | | 5,351,089 | | | | 2,662,831 | |
| | | | |
Total capital share transactions | | | (404,323,602 | ) | | | 15,593,605 | |
| | | | |
Net increase (decrease) in net assets | | | (351,579,941 | ) | | | 14,857,369 | |
Net assets: | | | | | | | | |
Beginning of year | | | 706,390,863 | | | | 691,533,494 | |
| | | | |
End of year | | $ | 354,810,922 | | | $ | 706,390,863 | |
| | | | |
Undistributed net investment income included in net assets: | | | | | | | | |
End of year | | $ | 23,255,087 | | | $ | 19,276,987 | |
| | | | |
The accompanying notes are an integral part of these financial statements.
TGA-20
Franklin Templeton Variable Insurance Products Trust
Notes to Financial Statements
Templeton Global Asset Allocation Fund
1. ORGANIZATION AND SIGNIFICANT ACCOUNTING POLICIES
Franklin Templeton Variable Insurance Products Trust (the Trust) is registered under the Investment Company Act of 1940, as amended, (the 1940 Act) as an open-end investment company, consisting of twenty-two separate funds. The Templeton Global Asset Allocation Fund (the Fund) included in this report is diversified. The financial statements of the remaining funds in the Trust are presented separately. Shares of the Fund are sold only to insurance company separate accounts to fund the benefits of variable life insurance policies or variable annuity contracts. As of December 31, 2006, 59.40% of the Fund’s shares were held through one insurance company. The Fund offers two classes of shares: Class 1 and Class 2. Each class of shares differs by its distribution fees, voting rights on matters affecting a single class and its exchange privilege.
The following summarizes the Fund’s significant accounting policies.
a. Security Valuation
Securities listed on a securities exchange or on the NASDAQ National Market System are valued at the last quoted sale price or the official closing price of the day, respectively. Over-the-counter securities and listed securities for which there is no reported sale are valued within the range of the most recent quoted bid and ask prices. Securities that trade in multiple markets or on multiple exchanges are valued according to the broadest and most representative market. Investments in open-end mutual funds are valued at the closing net asset value.
Government securities and asset-backed securities generally trade in the over-the-counter market rather than on a securities exchange. The Trust may utilize independent pricing services, quotations from bond dealers, and information with respect to bond and note transactions, to assist in determining a current market value for each security. The Trust’s pricing services may use valuation models or matrix pricing which considers information with respect to comparable bond and note transactions, quotations from bond dealers, or by reference to other securities that are considered comparable in such characteristics as rating, interest rate and maturity date, option adjusted spread models, prepayment projections, interest rate spreads and yield curves, to determine current value.
Foreign securities are valued as of the close of trading on the foreign stock exchange on which the security is primarily traded, or the NYSE, whichever is earlier. If no sale is reported at that time, the foreign security will be valued within the range of the most recent quoted bid and ask prices. The value is then converted into its U.S. dollar equivalent at the foreign exchange rate in effect at the close of the NYSE on the day that the value of the foreign security is determined.
The Trust has procedures to determine the fair value of individual securities and other assets for which market prices are not readily available or which may not be reliably priced. Methods for valuing these securities may include: fundamental analysis, matrix pricing, discounts from market prices of similar securities, or discounts applied due to the nature and duration of restrictions on the disposition of the securities. Due to the inherent uncertainty of valuations of such securities, the fair values may differ significantly from the values that would have been used had a ready market for such investments existed. Occasionally, events occur between the time at which trading in a security is completed and the close of the NYSE that might call into question the availability (including the reliability) of the value of a portfolio security held by the Fund. The investment manager monitors price movements following the close of trading in foreign stock markets through a series of country specific market proxies (such as baskets of American Depository Receipts, futures contracts and exchange traded funds). These price movements are measured against established trigger thresholds for each specific market proxy to assist in determining if an event has occurred. If such an event occurs, the securities may be valued using fair value procedures, which may include the use of independent pricing services. All security valuation procedures are approved by the Trust’s Board of Trustees.
b. Foreign Currency Translation
Portfolio securities and other assets and liabilities denominated in foreign currencies are translated into U.S. dollars based on the exchange rate of such currencies against U.S. dollars on the date of valuation. Purchases and sales of securities, income and expense items denominated in foreign currencies are translated into U.S. dollars at the exchange rate in effect on the transaction
TGA-21
Franklin Templeton Variable Insurance Products Trust
Notes to Financial Statements (continued)
Templeton Global Asset Allocation Fund
1. ORGANIZATION AND SIGNIFICANT ACCOUNTING POLICIES (continued)
b. Foreign Currency Translation (continued)
date. Occasionally, events may impact the availability or reliability of foreign exchange rates used to convert the U.S. dollar equivalent value. If such an event occurs, the foreign exchange rate will be valued at fair value using procedures established and approved by the Trust’s Board of Trustees.
The Fund does not separately report the effect of changes in foreign exchange rates from changes in market prices on securities held. Such changes are included in net realized and unrealized gain or loss from investments on the Statement of Operations.
Realized foreign exchange gains or losses arise from sales of foreign currencies, currency gains or losses realized between the trade and settlement dates on securities transactions and the difference between the recorded amounts of dividends, interest, and foreign withholding taxes and the U.S. dollar equivalent of the amounts actually received or paid. Net unrealized foreign exchange gains and losses arise from changes in foreign exchange rates on foreign denominated assets and liabilities other than investments in securities held at the end of the reporting period.
c. Foreign Currency Contracts
When the Fund purchases or sells foreign securities it may enter into foreign exchange contracts to minimize foreign exchange risk from the trade date to the settlement date of the transactions. A foreign exchange contract is an agreement between two parties to exchange different currencies at an agreed upon exchange rate at a future date. Realized and unrealized gains and losses on these contracts are included in the Statement of Operations.
The Fund may also enter into forward exchange contracts to hedge against fluctuations in foreign exchange rates. These contracts are valued daily by the Fund and the unrealized gains or losses on the contracts, as measured by the difference between the contractual forward foreign exchange rates and the forward rates at the reporting date, are included in the Statement of Assets and Liabilities. Realized and unrealized gains and losses on these contracts are included in the Statement of Operations.
The risks of these contracts include movement in the values of the foreign currencies relative to the U.S. dollar and the possible inability of the counterparties to fulfill their obligations under the contracts, which may be in excess of the amount reflected in the Statement of Assets and Liabilities.
d. Income Taxes
No provision has been made for U.S. income taxes because the Fund intends to qualify as a regulated investment company under the Internal Revenue Code and to distribute to shareholders substantially all of its taxable income and net realized gains.
Foreign securities held by the Fund may be subject to foreign taxation on dividend and interest income received. Foreign taxes, if any, are recorded based on the tax regulations and rates that exist in the foreign markets in which the Fund invests.
TGA-22
Franklin Templeton Variable Insurance Products Trust
Notes to Financial Statements (continued)
Templeton Global Asset Allocation Fund
1. ORGANIZATION AND SIGNIFICANT ACCOUNTING POLICIES (continued)
e. Security Transactions, Investment Income, Expenses and Distributions
Security transactions are accounted for on trade date. Realized gains and losses on security transactions are determined on a specific identification basis. Interest income and estimated expenses are accrued daily. Amortization of premium and accretion of discount on debt securities are included in interest income. Dividend income is recorded on the ex-dividend date except that certain dividends from foreign securities are recognized as soon as the Fund is notified of the ex-dividend date. Distributions to shareholders are recorded on the ex-dividend date and are determined according to income tax regulations (tax basis). Such distributions are reinvested in additional shares of the Fund. Distributable earnings determined on a tax basis may differ from earnings recorded in accordance with accounting principles generally accepted in the United States. These differences may be permanent or temporary. Permanent differences are reclassified among capital accounts to reflect their tax character. These reclassifications have no impact on net assets or the results of operations. Temporary differences are not reclassified, as they may reverse in subsequent periods.
Common expenses incurred by the Trust are allocated among the funds based on the ratio of net assets of each fund to the combined net assets of the Trust. Fund specific expenses are charged directly to the fund that incurred the expense.
Realized and unrealized gains and losses and net investment income, other than class specific expenses, are allocated daily to each class of shares based upon the relative proportion of net assets of each class. Differences in class-level expenses may result in payment of different per share distributions by class.
Inflation-indexed bonds provide an inflation hedge through periodic increases in the security’s interest accruals and principal redemption value, by amounts corresponding to the current rate of inflation. Any such adjustments, including adjustments to principal redemption value, are recorded as interest income.
f. Accounting Estimates
The preparation of financial statements in accordance with accounting principles generally accepted in the United States of America requires management to make estimates and assumptions that affect the reported amounts of assets and liabilities at the date of the financial statements and the amounts of income and expenses during the reporting period. Actual results could differ from those estimates.
g. Guarantees and Indemnifications
Under the Trust’s organizational documents, its officers and trustees are indemnified by the Trust against certain liabilities arising out of the performance of their duties to the Trust. Additionally, in the normal course of business, the Trust enters into contracts with service providers that contain general indemnification clauses. The Trust’s maximum exposure under these arrangements is unknown as this would involve future claims that may be made against the Trust that have not yet occurred. Currently, the Trust expects the risk of loss to be remote.
TGA-23
Franklin Templeton Variable Insurance Products Trust
Notes to Financial Statements (continued)
Templeton Global Asset Allocation Fund
2. SHARES OF BENEFICIAL INTEREST
At December 31, 2006, there were an unlimited number of shares authorized ($0.01 par value). Transactions in the Fund’s shares were as follows:
| | | | | | | | | | | | | | |
| | | Year Ended December 31, | |
| | | 2006 | | | 2005 | |
| Class 1 Shares: | | Shares | | | Amount | | | Shares | | | Amount | |
Shares sold | | 671,163 | | | $ | 14,177,128 | | | 1,742,106 | | | $ | 36,156,220 | |
Shares issued in reinvestment of distributions | | 1,797,880 | | | | 33,925,994 | | | 1,232,576 | | | | 24,700,828 | |
Shares redeemed in-kind (Note 10) | | (14,967,877 | ) | | | (342,015,981 | ) | | — | | | | — | |
Shares redeemed | | (5,187,026 | ) | | | (115,761,832 | ) | | (2,319,937 | ) | | | (47,926,274 | ) |
| | | | |
Net increase (decrease) | | (17,685,860 | ) | | $ | (409,674,691 | ) | | 654,745 | | | $ | 12,930,774 | |
| | | | |
| Class 2 Shares: | | | | | | | | | | | | |
Shares sold | | 978,403 | | | $ | 19,484,840 | | | 650,005 | | | $ | 13,320,533 | |
Shares issued in reinvestment of distributions | | 507,121 | | | | 9,488,238 | | | 126,991 | | | | 2,527,126 | |
Shares redeemed | | (1,172,793 | ) | | | (23,621,989 | ) | | (644,040 | ) | | | (13,184,828 | ) |
| | | | |
Net increase (decrease) | | 312,731 | | | $ | 5,351,089 | | | 132,956 | | | $ | 2,662,831 | |
| | | | |
3. TRANSACTIONS WITH AFFILIATES
Franklin Resources, Inc. is the holding company for various subsidiaries that together are referred to as Franklin Templeton Investments. Certain officers and trustees of the Trust are also officers and/or directors of the following subsidiaries:
| | |
| Subsidiary | | Affiliation |
Templeton Investment Counsel, LLC (TIC) | | Investment manager |
Franklin Advisers, Inc. (Advisers) | | Investment manager |
Franklin Templeton Services, LLC (FT Services) | | Administrative manager |
Franklin Templeton Distributors, Inc. (Distributors) | | Principal underwriter |
Franklin Templeton Investor Services, LLC (Investor Services) | | Transfer agent |
a. Management Fees
The Fund pays an investment management fee to TIC based on the average daily net assets of the Fund as follows:
| | |
| Annualized Fee Rate | | Net Assets |
| 0.650% | | Up to and including $200 million |
| 0.585% | | Over $200 million, up to and including $1.3 billion |
| 0.520% | | In excess of $1.3 billion |
Under a subadvisory agreement, Advisers, an affiliate of TIC, provides subadvisory services to the Fund and receives from TIC fees based on the average daily net assets of the Fund.
b. Administrative Fees
The Fund pays an administrative fee to FT Services based on the average daily net assets of the Fund as follows:
| | |
| Annualized Fee Rate | | Net Assets |
| 0.150% | | Up to and including $200 million |
| 0.135% | | Over $200 million, up to and including $700 million |
| 0.100% | | Over $700 million, up to and including $1.2 billion |
| 0.075% | | In excess of $1.2 billion |
TGA-24
Franklin Templeton Variable Insurance Products Trust
Notes to Financial Statements (continued)
Templeton Global Asset Allocation Fund
3. TRANSACTIONS WITH AFFILIATES (continued)
c. Distribution Fees
The Fund’s Board of Trustees has adopted a distribution plan for Class 2 shares pursuant to Rule 12b-1 under the 1940 Act. Under the Fund’s compensation distribution plan, the Fund pays Distributors for costs incurred in connection with the servicing, sale and distribution of the Fund’s shares up to 0.25% per year of its average daily net assets.
d. Transfer Agent Fees
Investor Services, under terms of an agreement, performs shareholder servicing for the Fund and is not paid by the Fund for the services.
4. EXPENSE OFFSET ARRANGEMENT
The Fund has entered into an arrangement with its custodian whereby credits realized as a result of uninvested cash balances are used to reduce a portion of the Fund’s custodian expenses. During the year ended December 31, 2006, the custodian fees were reduced as noted in the Statement of Operations.
5. INCOME TAXES
For tax purposes, realized capital losses, occurring subsequent to October 31, may be deferred and treated as occurring on the first day of the following fiscal year. At December 31, 2006, the Fund deferred realized capital losses of $166,246.
The tax character of distributions paid during the years ended December 31, 2006 and 2005, was as follows:
| | | | | | |
| | | 2006 | | 2005 |
Distributions paid from: | | | | | | |
Ordinary income | | $ | 23,239,156 | | $ | 27,227,954 |
Long term capital gain | | | 20,175,076 | | | — |
| | | |
| | $ | 43,414,232 | | $ | 27,227,954 |
| | | |
At December 31, 2006, the cost of investments, net unrealized appreciation (depreciation), undistributed ordinary income and undistributed long term capital gains for income tax purposes were as follows:
| | | | |
Cost of investments | | $ | 270,220,313 | |
| | | | |
| |
Unrealized appreciation | | $ | 86,703,591 | |
Unrealized depreciation | | | (3,559,874 | ) |
| | | | |
Net unrealized appreciation (depreciation) | | $ | 83,143,717 | |
| | | | |
Undistributed ordinary income | | $ | 26,520,517 | |
Undistributed long term capital gains | | | 31,858,022 | |
| | | | |
Distributable earnings | | $ | 58,378,539 | |
| | | | |
Net investment income differs for financial statement and tax purposes primarily due to differing treatments of foreign currency transactions, bond discounts and premiums.
Net realized gains (losses) differ for financial statement and tax purposes primarily due to differing treatments of wash sales, foreign currency transactions, bond discounts and premiums, and gains realized on in-kind shareholder redemptions.
TGA-25
Franklin Templeton Variable Insurance Products Trust
Notes to Financial Statements (continued)
Templeton Global Asset Allocation Fund
6. INVESTMENT TRANSACTIONS
Purchases and sales of investments (excluding short term securities) for the year ended December 31, 2006, aggregated $108,755,642 and $196,270,885, respectively. Sales of investments excludes $342,015,981 of an in-kind redemption.
7. INVESTMENTS IN FRANKLIN INSTITUTIONAL FIDUCIARY TRUST MONEY MARKET PORTFOLIO
The Fund may invest in the Franklin Institutional Fiduciary Trust Money Market Portfolio (the Sweep Money Fund), an open-end investment company managed by Franklin Advisers, Inc. (an affiliate of the investment manager). Management fees paid by the Fund are reduced on assets invested in the Sweep Money Fund, in an amount not to exceed the management and administrative fees paid by the Sweep Money Fund.
8. FORWARD EXCHANGE CONTRACTS
At December 31, 2006, the Fund had the following forward exchange contracts outstanding:
| | | | | | | | | | | | | | |
| Contracts to Buy | | Contract
Amounta | | | Settlement
Date | | Unrealized
Gain | | Unrealized
Loss | |
| 4,300,000 | | Brazilian Real | | 1,807,102 | | | 1/04/07 | | $ | 203,230 | | $ | — | |
| 90,780,102 | | Japanese Yen | | 642,600 | EUR | | 3/06/07 | | | — | | | (81,529 | ) |
| 47,000,000 | | Indian Rupee | | 1,670,220 | NZD | | 3/21/07 | | | — | | | (115,892 | ) |
| 250,565,000 | | Japanese Yen | | 1,750,000 | EUR | | 3/29/07 | | | — | | | (189,287 | ) |
| 41,300,000 | | Iceland Krona | | 556,529 | | | 6/20/07 | | | 395 | | | — | |
| 61,950,000 | | Iceland Krona | | 838,295 | | | 6/21/07 | | | — | | | (3,102 | ) |
| 61,950,000 | | Iceland Krona | | 867,647 | | | 6/25/07 | | | — | | | (33,219 | ) |
| 80,151,813 | | Indian Rupee | | 2,679,766 | NZD | | 7/27/07 | | | — | | | (79,926 | ) |
| 349,220,758 | | Chilean Peso | | 7,115,337 | MXN | | 8/16/07 | | | 2,644 | | | — | |
| 242,842,847 | | Chilean Peso | | 4,976,696 | MXN | | 8/20/07 | | | — | | | (723 | ) |
| 191,937,108 | | Chilean Peso | | 4,002,526 | MXN | | 9/12/07 | | | — | | | (6,549 | ) |
| 69,658,179 | | Chilean Peso | | 1,461,258 | MXN | | 9/14/07 | | | — | | | (3,156 | ) |
| 87,100,000 | | Indian Rupee | | 2,899,950 | NZD | | 10/29/07 | | | — | | | (76,185 | ) |
| 85,000,000 | | Indian Rupee | | 2,805,558 | NZD | | 10/29/07 | | | — | | | (57,463 | ) |
| 81,000,000 | | Indian Rupee | | 2,777,778 | NZD | | 10/30/07 | | | — | | | (126,652 | ) |
| | | | | | | | | | | | | | |
| Unrealized gain (loss) on forward exchange contracts | | | | | | | $ | 206,269 | | $ | (773,683 | ) |
| | | | | | | | | | | | | | |
| Net unrealized gain (loss) on forward exchange contracts | | | | | | | $ | — | | $ | (567,414 | ) |
| | | | | | | | | | | | | | |
a | In U.S. Dollar unless otherwise indicated. |
Currency Abbreviations
EUR - Euro
MXN - Mexican Peso
NZD - New Zealand Dollar
9. CONCENTRATION OF RISK
Investing in foreign securities may include certain risks and considerations not typically associated with investing in U.S. securities, such as fluctuating currency values and changing local and regional economic, political and social conditions, which may result in greater market volatility. In addition, certain foreign securities may not be as liquid as U.S. securities.
TGA-26
Franklin Templeton Variable Insurance Products Trust
Notes to Financial Statements (continued)
Templeton Global Asset Allocation Fund
10. REDEMPTION IN-KIND
During the year ended December 31, 2006, the Fund realized $67,648,833 of net gains resulting from a redemption in-kind in which a shareholder redeemed fund shares for securities held by the Fund rather than for cash. Because such gains are not taxable to the Fund, and are not distributed to shareholders, they have been reclassified from accumulated net realized gains to paid-in capital.
11. REGULATORY MATTERS
As part of various investigations by a number of federal, state, and foreign regulators and governmental entities, including the Securities and Exchange Commission (“SEC”), relating to certain practices in the mutual fund industry, including late trading, market timing and marketing support payments to securities dealers who sell fund shares (“marketing support”), Franklin Resources, Inc. and certain of its subsidiaries (collectively, the “Company”), entered into settlements with certain of those regulators. Specifically, the Company entered into settlements with the SEC, among others, concerning market timing and marketing support.
On June 23, 2006, the SEC approved the proposed plan of distribution for the marketing support settlement, and disbursement of the settlement monies to the designated funds, in accordance with the terms and conditions of that settlement and plan, was completed in September 2006 and is recorded as other income.
The plan of distribution for the market timing settlement is currently under review by the SEC staff. After publication of notice of the plan and a 30-day comment period, the proposed plan of distribution will be submitted to the SEC for approval. Following the SEC’s approval of the plan of distribution, with modifications as appropriate, distribution of the settlement monies will begin in accordance with the terms and conditions of the settlement and plan.
In addition, the Company, as well as most of the mutual funds within Franklin Templeton Investments and certain current or former officers, Company directors, fund directors, and employees, have been named in private lawsuits (styled as shareholder class actions, or as derivative actions on behalf of either the named funds or Franklin Resources, Inc.). The lawsuits relate to the industry practices referenced above, as well as to allegedly excessive commissions and advisory and distribution fees.
The Company and fund management believe that the claims made in each of the private lawsuits referenced above are without merit and intend to defend against them vigorously. The Company cannot predict with certainty the eventual outcome of these lawsuits, nor whether they will have a material negative impact on the Company. If it is determined that the Company bears responsibility for any unlawful or inappropriate conduct that caused losses to the Trust, it is committed to making the Trust or its shareholders whole, as appropriate.
12. NEW ACCOUNTING PRONOUNCEMENTS
In July 2006, the Financial Accounting Standards Board (FASB) issued FASB Interpretation No. 48, “Accounting for Uncertainty in Income Taxes — an Interpretation of FASB Statement No. 109” (“FIN 48”), which clarifies the accounting for uncertainty in tax positions taken or expected to be taken in a tax return. FIN 48 provides guidance on the measurement, recognition, classification and disclosure of tax positions, along with accounting for the related interest and penalties. FIN 48 is effective for fiscal years beginning after December 15, 2006, and is to be applied to all open tax years as of the date of effectiveness. On December 22, 2006, the Securities and Exchange Commission extended the implementation date to no later than the last net asset value calculation in the first semi-annual reporting period in 2007. The Fund is currently evaluating the impact, if any, of applying the various provisions of FIN 48.
In September 2006, FASB issued FASB Statement No. 157, “Fair Value Measurement” (“SFAS 157”), which defines fair value, establishes a framework for measuring fair value, and expands disclosures about fair value measurements. SFAS 157 is effective for fiscal years beginning after November 15, 2007, and interim periods within those fiscal years. The Trust believes the adoption of SFAS 157 will have no material impact on its financial statements.
TGA-27
Franklin Templeton Variable Insurance Products Trust
Templeton Global Asset Allocation Fund
Report of Independent Registered Public Accounting Firm
To the Board of Trustees and Shareholders of Franklin Templeton Variable Insurance Products Trust
In our opinion, the accompanying statement of assets and liabilities, including the statement of investments, and the related statements of operations and of changes in net assets and the financial highlights present fairly, in all material respects, the financial position of Templeton Global Asset Allocation Fund (one of the funds constituting the Franklin Templeton Variable Insurance Products Trust, hereafter referred to as the “Fund”) at December 31, 2006, the results of its operations for the year then ended, the changes in its net assets for each of the two years in the period then ended and the financial highlights for each of the five years in the period then ended, in conformity with accounting principles generally accepted in the United States of America. These financial statements and financial highlights (hereafter referred to as “financial statements”) are the responsibility of the Fund’s management; our responsibility is to express an opinion on these financial statements based on our audits. We conducted our audits of these financial statements in accordance with the standards of the Public Company Accounting Oversight Board (United States). Those standards require that we plan and perform the audit to obtain reasonable assurance about whether the financial statements are free of material misstatement. An audit includes examining, on a test basis, evidence supporting the amounts and disclosures in the financial statements, assessing the accounting principles used and significant estimates made by management, and evaluating the overall financial statement presentation. We believe that our audits, which included confirmation of securities at December 31, 2006 by correspondence with the custodian, provide a reasonable basis for our opinion.
PricewaterhouseCoopers LLP
San Francisco, California
February 16, 2007
TGA-28
Franklin Templeton Variable Insurance Products Trust
Tax Designation (unaudited)
Templeton Global Asset Allocation Fund
Under Section 852(b)(3)(C) of the Internal Revenue Code (Code), the Fund designates the maximum amount allowable but no less than $31,858,708 as a long term capital gain dividend for the fiscal year ended December 31, 2006.
Under Section 854(b)(2) of the Code, the Fund designates 5.05% of the ordinary income dividends as income qualifying for the dividends received deduction for the fiscal year ended December 31, 2006.
At December 31, 2006, more than 50% of the Fund’s total assets were invested in securities of foreign issuers. In most instances, foreign taxes were withheld from dividends paid to the Fund on these investments. The Fund elects to treat foreign taxes paid as allowed under Section 853 of the Code. This election will allow shareholders of record in June 2007, to treat their proportionate share of foreign taxes paid by the Fund as having been paid directly by them. Shareholders shall consider these amounts as foreign taxes paid in the tax year in which they receive the Fund distribution.
The foreign tax information will be disclosed in the June 30, 2007, semi-annual report of the Fund.
TGA-29
TEMPLETON GLOBAL INCOME SECURITIES FUND
We are pleased to bring you Templeton Global Income Securities Fund’s annual report for the fiscal year ended December 31, 2006.
Performance Summary as of 12/31/06
Average annual total return of Class 1 shares represents the average annual change in value, assuming reinvestment of dividends and capital gains. Average returns smooth out variations in returns, which can be significant; they are not the same as year-by-year results.
Periods ended 12/31/06
| | | | | | |
| | | 1-Year | | 5-Year | | 10-Year |
Average Annual Total Return | | +13.14% | | +13.51% | | +7.62% |
Total Return Index Comparison
for Hypothetical $10,000 Investment (1/1/97–12/31/06)
The graph below shows the change in value of a hypothetical $10,000 investment in the Fund over the indicated period and includes reinvestment of any income or distributions. The Fund’s performance is compared to the performance of the J.P. Morgan (JPM) Government Bond Index (GBI) Global, as well as the Consumer Price Index (CPI). One cannot invest directly in an index, nor is an index representative of the Fund’s portfolio. Please see Important Notes to Performance Information preceding the Fund Summaries.
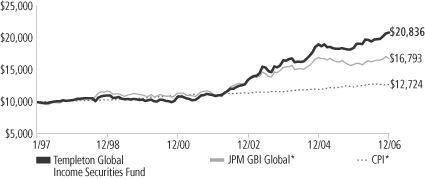
*Sources: J.P. Morgan; Standard & Poor’s Micropal. Please see Index Descriptions following the Fund Summaries.
Templeton Global Income Securities Fund – Class 1
Performance reflects the Fund’s Class 1 operating expenses, but does not include any contract fees, expenses or sales charges. If they had been included, performance would be lower. These charges and deductions, particularly for variable life policies, can have a significant effect on contract values and insurance benefits. See the contract prospectus for a complete description of these expenses, including sales charges.
Performance data represent past performance, which does not guarantee future results. Investment return and principal value will fluctuate, and you may have a gain or loss when you sell your shares. Current performance may differ from figures shown.
TGI-1
Fund Goals and Main Investments: Templeton Global Income Securities Fund seeks high current income, consistent with preservation of capital, with capital appreciation as a secondary consideration. The Fund normally invests mainly in debt securities of governments and their political subdivisions and agencies, supranational organizations and companies located anywhere in the world, including emerging markets.
Performance Overview
You can find the Fund’s one-year total return in the Performance Summary. The Fund outperformed its benchmark, the JPM GBI Global, which delivered a +5.94% total return in U.S. dollar terms for the year under review.1
Economic and Market Overview
The U.S. economy slowed in 2006, led by a downturn in investment, particularly in housing. Consumption continued to be strong, hurting the country’s external balance of payments as the trade and current account deficits grew to record size. The current account deficit, which was 6.8% of gross domestic product (GDP) in third quarter 2006, was largely the result of low American savings that made the U.S. dependent on short-term financing from Asian and oil-producing countries with current account surpluses.2 Monetary policy did not loosen in response to this slowdown because inflationary concerns persisted. The Federal Reserve Board raised rates 100 basis points (100 basis points equal one percentage point) bringing it to 5.25% in June to reduce inflationary pressure.
In other parts of the developed world, Europe’s growth accelerated while Japan slowly came out of deflation. Euro-zone GDP growth increased, led by exports and investment. Capacity utilization increased as the labor market improved despite interest rate hikes. In Japan, industrial production increased along with capacity utilization, an indication of economic improvement despite continuing low real GDP growth. The Bank of Japan raised its interest rate 25 basis points during the year in response to rising consumer prices in the second quarter, a positive sign for an economy that suffered prolonged deflation.
Many emerging market economies had a very good year, particularly commodity exporters. High international prices for raw materials,
1. Source: J.P. Morgan. One cannot invest directly in an index, nor is an index representative of the Fund’s portfolio. Please see Index Descriptions following the Fund Summaries.
2. Source: Bureau of Economic Analysis.
Fund Risks: Because the Fund invests in bonds and other debt obligations, the Fund’s share price and yield will be affected by interest rate movements. Bond prices generally move in the opposite direction of interest rates. Thus, as prices of bonds in the Fund adjust to a rise in interest rates, the Fund’s share price may decline. High yield, lower-rated (junk) bonds generally have greater price swings and higher default risks. Foreign investing, especially in emerging markets, involves additional risks including currency fluctuations, economic instability, and social and political developments. The Fund’s prospectus also includes a description of the main investment risks.
What is a current account?
A current account is that part of the balance of payments where all of one country’s international transactions in goods and services are recorded.
What is balance of payments?
Balance of payments is a record of all of a country’s exports and imports of goods and services, borrowing and lending with the rest of the world during a particular time period. It helps a country evaluate its competitive strengths and weaknesses and forecast the strength of its currency.
TGI-2
caused in part by Asia’s surge in demand, resulted in strong export growth. Higher profits in these sectors also increased foreign investment and boosted overall production. Growth helped improve many
countries’ debt profiles, as did high liquidity in the international market, which lowered the cost of debt. Finally, inflation dropped in many countries due to effective monetary and fiscal policies.
Investment Strategy
We allocate the Fund’s assets among issuers, geographic regions, and currencies based upon our assessment of relative interest rates among currencies, our outlook for changes in interest rates and currencies, and credit risks. In considering these factors, we may evaluate a country’s changing market, economic and political conditions, such as inflation rate, growth prospects, global trade patterns and government policies. We seek to manage the Fund’s exposure to various currencies, and may from time to time seek to hedge (protect) against currency risk by using forward currency exchange contracts.
Manager’s Discussion
The Fund’s total return was influenced by various factors including currency movements, interest rate developments and exposure to sovereign debt markets.
Currency Strategy
In the current environment of rising interest rates and low spreads for credit risk, an increased share of total return came from exchange rate movements. Foreign currencies generally performed well in 2006 as the U.S. dollar fell 4.22% against its major trading partners.3 This decline was mainly due to slowing U.S. growth and continuing global imbalances centered on the U.S. current account deficit. Also contributing to the dollar’s depreciation was a narrower gap between U.S. interest rates and those of other developed countries as the Fed paused its rate hikes while other central banks continued theirs. The U.S. dollar’s weakness helped the Fund’s relative performance because the Fund was well diversified in currency exposure and was underweighted in the dollar compared with the benchmark index.
In the second half of the year, the Fund added a position in the Japanese yen due to improving fundamentals and our belief that it was relatively cheap because of weak past performance. During that period, deflation ended, the economy expanded and the central bank raised
3. Source: Federal Reserve H10 Report.
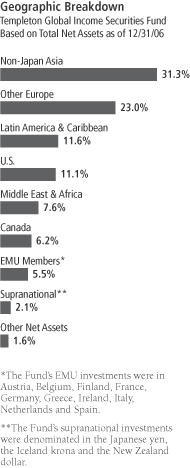
TGI-3
interest rates. However, the Fund remained underweighted compared with the benchmark index and benefited relatively from the yen’s 0.94% depreciation against the dollar during the year.4 The euro appreciated 11.79% against the dollar, largely because the European Central Bank hiked interest rates 125 basis points and euro-zone growth accelerated to 2.7% in the third quarter compared with a year earlier.4, 5 Despite this strong performance, our commitment to currency diversification led us to favor non-euro European countries. The Fund’s underweighted position versus the euro detracted from relative performance, but this was offset by our overweighted positions in other European currencies that outperformed the index and the euro.
Our strategy of favoring peripheral countries worked well for the Fund in 2006, particularly in the cases of Sweden and South Korea. The Swedish krona appreciated 16.3% against the dollar in part because interest rates increased 150 basis points.4, 6 Also, Sweden accumulated a trade surplus of $18.9 billion through November and a fiscal surplus of $8.1 billion during that time frame.6 These strong fundamentals and increasing economic activity led the Fund to hold a significantly overweighted position throughout the year that helped relative performance. Also benefiting the Fund, the South Korean won appreciated 8.69% as interest rates increased 75 basis points, international reserves rose, the current account posted a surplus of nearly $6 billion through November, and growth accelerated.4, 7
Interest Rate Strategy
Strong growth in many parts of the world continued to push up interest rates. Therefore, we maintained short duration positions in many countries. However, we found select opportunities where specific cycles created falling interest rate environments that were profitable for the Fund in the past year. One notable example was Indonesia where interest rates were lowered 300 basis points as inflation fell significantly.8 The country’s CPI declined from 17.1% in December 2005 to 6.6% in December 2006.8 Indonesia’s bond market returned +29.53% during the year in local currency terms according to the HSBC Asian Local
4. Source: Exshare (via Compustat via FactSet).
5. Source: Eurostat.
6. Source: Sveriges Riksbank.
7. Source: Bank of Korea.
8. Source: Bank Indonesia.
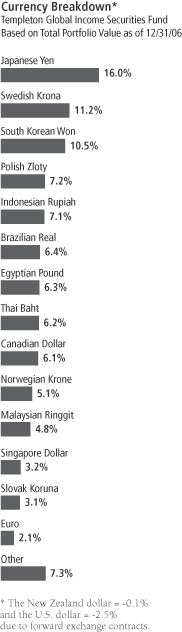
The dollar value, number of shares or principal amount, and names of all portfolio holdings are listed in the Fund’s Statement of Investments.
TGI-4
Bond Index (ALBI), and contributed to the Fund’s outperformance.9 Poland was another example where a country’s specific interest rate cycle contributed to the Fund’s relative return. Poland’s bond market returned 5.2% in local currency terms according to the JPM GBI Global.10 Poland ended a long string of interest rate cuts in February, and its interest rate ended down 50 basis points for the year.11
Global Sovereign Debt Strategy
The Fund also invested in sovereign debt that typically compensates for greater credit risk by offering higher yields relative to U.S. and European benchmark Treasury curves. This risk premium declined in 2006 and more money entered the market. The yield spread between U.S. Treasuries and the JPM Emerging Markets Bond Index Global (EMBIG) fell from 237 to 171 basis points over the 12-month period.10 This trend of higher valuations led the Fund to increasingly find value in local markets. In addition to being relatively cheaper, these instruments could benefit from currency appreciation in a weak dollar environment. The Fund’s performance benefited from the improving outlook for sovereign debt, especially of non-Japan Asia and Latin America, because lower perceived risk of credit events led to higher prices.
Thank you for your participation in Templeton Global Income Securities Fund. We look forward to serving your future investment needs.
9. Source: S&P Micropal. Please see Index Descriptions following the Fund Summaries.
10. Source: J.P. Morgan. Please see Index Descriptions following the Fund Summaries.
11. Source: National Bank of Poland.
The foregoing information reflects our analysis, opinions and portfolio holdings as of December 31, 2006, the end of the reporting period. The way we implement our main investment strategies and the resulting portfolio holdings may change depending on factors such as market and economic conditions. These opinions may not be relied upon as investment advice or an offer for a particular security. The information is not a complete analysis of every aspect of any market, country, industry, security or the Fund. Statements of fact are from sources considered reliable, but the investment manager makes no representation or warranty as to their completeness or accuracy. Although historical performance is no guarantee of future results, these insights may help you understand our investment management philosophy.
TGI-5
Fund Expenses
As an investor in a variable insurance contract (“Contract”) that indirectly provides for investment in an underlying mutual fund, you can incur transaction and/or ongoing expenses at both the Fund level and the Contract level.
| • | | Transaction expenses can include sales charges (loads) on purchases, redemption fees, surrender fees, transfer fees and premium taxes. |
| • | | Ongoing expenses can include management fees, distribution and service (12b-1) fees, contract fees, annual maintenance fees, mortality and expense risk fees and other fees and expenses. All mutual funds and Contracts have some types of ongoing expenses. |
The expenses shown in the table are meant to highlight ongoing expenses at the Fund level only and do not include ongoing expenses at the Contract level, or transaction expenses at either the Fund or Contract level. While the Fund does not have transaction expenses, if the transaction and ongoing expenses at the Contract level were included, the expenses shown would be higher. You should consult your Contract prospectus or disclosure document for more information.
The table shows Fund-level ongoing expenses and can help you understand these expenses and compare them with those of other mutual funds offered through the Contract. The table assumes a $1,000 investment held for the six months indicated. Please refer to the Fund prospectus for additional information on operating expenses.
Actual Fund Expenses
The first line (Actual) of the table provides actual account values and expenses. The “Ending Account Value” is derived from the Fund’s actual return, which includes the effect of ongoing Fund expenses, but does not include the effect of ongoing Contract expenses.
You can estimate the Fund-level expenses you incurred during the period by following these steps. Of course, your account value and expenses will differ from those in this illustration:
| 1. | Divide your account value by $1,000. |
If an account had an $8,600 value, then $8,600 ÷ $1,000 = 8.6.
| 2. | Multiply the result by the number under the heading “Fund-level Expenses Incurred During Period.” |
If Fund-level Expenses Incurred During Period were $7.50, then 8.6 × $7.50 = $64.50.
In this illustration, the estimated expenses incurred this period at the Fund level are $64.50.
Templeton Global Income Securities Fund – Class 1
TGI-6
Hypothetical Example for Comparison with Other Mutual Funds
Information in the second line (Hypothetical) of the table can help you compare ongoing expenses of the Fund with those of other mutual funds offered through the Contract. This information may not be used to estimate the actual ending account balance or expenses you incurred during the period. The hypothetical “Ending Account Value” is based on the Fund’s actual expense ratio and an assumed 5% annual rate of return before expenses, which does not represent the Fund’s actual return. The figure under the heading “Fund-Level Expenses Incurred During Period” shows the hypothetical expenses your account would have incurred under this scenario. You can compare this figure with the 5% hypothetical examples that appear in shareholder reports of other funds offered through a Contract.
| | | | | | | | | |
| Class 1 | | Beginning
Account
Value 7/1/06 | | Ending
Account
Value 12/31/06 | | Fund-Level
Expenses Incurred
During Period*
7/1/06-12/31/06 |
Actual | | $ | 1,000 | | $ | 1,070.80 | | $ | 3.91 |
Hypothetical (5% return before expenses) | | $ | 1,000 | | $ | 1,021.42 | | $ | 3.82 |
*Expenses are equal to the annualized expense ratio for the Fund’s Class 1 shares (0.75%), which does not include any ongoing expenses of the Contract for which the Fund is an investment option, multiplied by the average account value over the period, multiplied by 184/365 to reflect the one-half year period.
TGI-7
Franklin Templeton Variable Insurance Products Trust
Financial Highlights
Templeton Global Income Securities Fund
| | | | | | | | | | | | | | | | | | | | |
| | | Year Ended December 31, | |
| Class 1 | | 2006 | | | 2005 | | | 2004 | | | 2003 | | | 2002 | |
| | | | |
Per share operating performance | | | | | | | | | | | | | | | | | | | | |
(for a share outstanding throughout the year) | | | | | | | | | | | | | | | | | | | | |
Net asset value, beginning of year | | $ | 14.36 | | | $ | 15.80 | | | $ | 15.54 | | | $ | 13.67 | | | $ | 11.39 | |
| | | | |
Income from investment operationsa: | | | | | | | | | | | | | | | | | | | | |
Net investment incomeb | | | 0.61 | | | | 0.57 | | | | 0.66 | | | | 0.69 | | | | 0.59 | |
Net realized and unrealized gains (losses) | | | 1.24 | | | | (1.03 | ) | | | 1.37 | | | | 2.35 | | | | 1.83 | |
| | | | |
Total from investment operations | | | 1.85 | | | | (0.46 | ) | | | 2.03 | | | | 3.04 | | | | 2.42 | |
| | | | |
Less distributions from net investment income | | | (0.48 | ) | | | (0.98 | ) | | | (1.77 | ) | | | (1.17 | ) | | | (0.14 | ) |
| | | | |
Redemption fees | | | — | d | | | — | d | | | — | | | | — | | | | — | |
| | | | |
Net asset value, end of year | | $ | 15.73 | | | $ | 14.36 | | | $ | 15.80 | | | $ | 15.54 | | | $ | 13.67 | |
| | | | |
| | | | | |
Total returnc | | | 13.14% | | | | (2.91)% | | | | 15.09% | | | | 22.72% | | | | 21.44% | |
Ratios/supplemental data | | | | | | | | | | | | | | | | | | | | |
Net assets, end of year (000’s) | | $ | 75,843 | | | $ | 53,115 | | | $ | 49,845 | | | $ | 52,842 | | | $ | 50,622 | |
Ratios to average net assets: | | | | | | | | | | | | | | | | | | | | |
Expenses before expense reduction | | | 0.80% | | | | 0.78% | | | | 0.79% | | | | 0.76% | | | | 0.73% | |
Expenses net of expense reduction | | | 0.72% | | | | 0.74% | | | | 0.78% | | | | 0.76% | | | | 0.73% | |
Net investment income | | | 4.09% | | | | 3.81% | | | | 4.40% | | | | 4.72% | | | | 4.88% | |
Portfolio turnover rate | | | 30.65% | | | | 30.28% | | | | 37.39% | | | | 53.01% | | | | 27.91% | |
| a | The amount shown for a share outstanding throughout the period may not correlate with the Statement of Operations for the period due to the timing of sales and repurchase of the Fund shares in relation to income earned and/or fluctuating market value of the investments of the Fund. |
| b | Based on average daily shares outstanding. |
| c | Total return does not include any fees, charges or expenses imposed by the variable annuity and life insurance contracts for which the Franklin Templeton Variable Insurance Products Trust serves as an underlying investment vehicle. |
| d | Amount rounds to less than $0.01 per share. |
The accompanying notes are an integral part of these financial statements.
TGI-8
Franklin Templeton Variable Insurance Products Trust
Financial Highlights (continued)
Templeton Global Income Securities Fund
| | | | | | | | | | | | | | | | | | | | |
| | | Year Ended December 31, | |
| Class 2 | | 2006 | | | 2005 | | | 2004 | | | 2003 | | | 2002 | |
| | | | |
Per share operating performance | | | | | | | | | | | | | | | | | | | | |
(for a share outstanding throughout the year) | | | | | | | | | | | | | | | | | | | | |
Net asset value, beginning of year | | $ | 14.19 | | | $ | 15.64 | | | $ | 15.42 | | | $ | 13.59 | | | $ | 11.33 | |
| | | | |
Income from investment operationsa: | | | | | | | | | | | | | | | | | | | | |
Net investment incomeb | | | 0.57 | | | | 0.52 | | | | 0.60 | | | | 0.65 | | | | 0.54 | |
Net realized and unrealized gains (losses) | | | 1.21 | | | | (1.00 | ) | | | 1.36 | | | | 2.33 | | | | 1.84 | |
| | | | |
Total from investment operations | | | 1.78 | | | | (0.48 | ) | | | 1.96 | | | | 2.98 | | | | 2.38 | |
| | | | |
Less distributions from net investment income | | | (0.47 | ) | | | (0.97 | ) | | | (1.74 | ) | | | (1.15 | ) | | | (0.12 | ) |
| | | | |
Redemption fees | | | — | d | | | — | d | | | — | | | | — | | | | — | |
| | | | |
Net asset value, end of year | | $ | 15.50 | | | $ | 14.19 | | | $ | 15.64 | | | $ | 15.42 | | | $ | 13.59 | |
| | | | |
| | | | | |
Total returnc | | | 12.77% | | | | (3.08)% | | | | 14.74% | | | | 22.44% | | | | 21.15% | |
Ratios/supplemental data | | | | | | | | | | | | | | | | | | | | |
Net assets, end of year (000’s) | | $ | 205,768 | | | $ | 61,255 | | | $ | 19,779 | | | $ | 5,181 | | | $ | 2,119 | |
Ratios to average net assets: | | | | | | | | | | | | | | | | | | | | |
Expenses before expense reduction | | | 1.05% | | | | 1.03% | | | | 1.04% | | | | 1.01% | | | | 0.98% | |
Expenses net of expense reduction | | | 0.97% | | | | 0.99% | | | | 1.03% | | | | 1.01% | | | | 0.98% | |
Net investment income | | | 3.84% | | | | 3.56% | | | | 4.15% | | | | 4.47% | | | | 4.63% | |
Portfolio turnover rate | | | 30.65% | | | | 30.28% | | | | 37.39% | | | | 53.01% | | | | 27.91% | |
| a | The amount shown for a share outstanding throughout the period may not correlate with the Statement of Operations for the period due to the timing of sales and repurchase of the Fund shares in relation to income earned and/or fluctuating market value of the investments of the Fund. |
| b | Based on average daily shares outstanding. |
| c | Total return does not include any fees, charges or expenses imposed by the variable annuity and life insurance contracts for which the Franklin Templeton Variable Insurance Products Trust serves as an underlying investment vehicle. |
| d | Amount rounds to less than $0.01 per share. |
The accompanying notes are an integral part of these financial statements.
TGI-9
Franklin Templeton Variable Insurance Products Trust
Financial Highlights (continued)
Templeton Global Income Securities Fund
| | | | | | | | |
| | | Year Ended December 31, | |
| Class 3 | | 2006 | | | 2005e | |
| | | | |
Per share operating performance | | | | | | | | |
(for a share outstanding throughout the year) | | | | | | | | |
Net asset value, beginning of year | | $ | 14.18 | | | $ | 15.27 | |
| | | | |
Income from investment operationsa: | | | | | | | | |
Net investment incomeb | | | 0.58 | | | | 0.38 | |
Net realized and unrealized gains (losses) | | | 1.21 | | | | (0.50 | ) |
| | | | |
Total from investment operations | | | 1.79 | | | | (0.12 | ) |
| | | | |
Less distributions from net investment income | | | (0.48 | ) | | | (0.97 | ) |
| | | | |
Redemption fees | | | — | d | | | — | d |
| | | | |
Net asset value, end of year | | $ | 15.49 | | | $ | 14.18 | |
| | | | |
| | |
Total returnc | | | 12.84% | | | | (0.80)% | |
Ratios/supplemental data | | | | | | | | |
Net assets, end of year (000’s) | | $ | 35,572 | | | $ | 5,769 | |
Ratios to average net assets: | | | | | | | | |
Expenses before expense reduction | | | 1.05% | | | | 1.03% | f |
Expenses net of expense reduction | | | 0.97% | | | | 0.99% | f |
Net investment income | | | 3.84% | | | | 3.56% | f |
Portfolio turnover rate | | | 30.65% | | | | 30.28% | |
| a | The amount shown for a share outstanding throughout the period may not correlate with the Statement of Operations for the period due to the timing of sales and repurchase of the Fund shares in relation to income earned and/or fluctuating market value of the investments of the Fund. |
| b | Based on average daily shares outstanding. |
| c | Total return does not include any fees, charges or expenses imposed by the variable annuity and life insurance contracts for which the Franklin Templeton Variable Insurance Products Trust serves as an underlying investment vehicle. |
| d | Amount rounds to less than $0.01 per share. |
| e | For the period April 1, 2005 (effective date) to December 31, 2005. |
The accompanying notes are an integral part of these financial statements.
TGI-10
Franklin Templeton Variable Insurance Products Trust
Statement of Investments, December 31, 2006
| | | | | | |
| Templeton Global Income Securities Fund | | Principal
Amounta | | | Value |
Government and Agency Securities 74.2% | | | | | | |
Argentina 3.8% | | | | | | |
Government of Argentina, | | | | | | |
b,cFRN, 5.59%, 8/03/12 | | 13,522,000 | | | $ | 9,616,512 |
dGross Domestic Product Linked Security, 12/15/35, wts. | | 13,185,000 | | | | 1,812,938 |
dGross Domestic Product Linked Security, 12/15/35, wts. | | 4,380,000 | EUR | | | 763,200 |
| | | | | | |
| | | | | | 12,192,650 |
| | | | | | |
Australia 0.5% | | | | | | |
New South Wales Treasury Corp., 8.00%, 3/01/08 | | 1,990,000 | AUD | | | 1,598,255 |
| | | | | | |
Austria 0.4% | | | | | | |
Government of Austria, | | | | | | |
5.50%, 10/20/07 | | 425,000 | EUR | | | 567,557 |
5.00%, 7/15/12 | | 400,000 | EUR | | | 555,098 |
| | | | | | |
| | | | | | 1,122,655 |
| | | | | | |
Belgium 0.3% | | | | | | |
Government of Belgium, 7.50%, 7/29/08 | | 686,000 | EUR | | | 953,911 |
| | | | | | |
Brazil 5.3% | | | | | | |
Nota Do Tesouro Nacional, | | | | | | |
9.762%, 1/01/10 | | 4,500 | eBRL | | | 1,986,900 |
9.762%, 1/01/12 | | 19,250 | eBRL | | | 8,224,476 |
9.762%, 1/01/14 | | 7,100 | eBRL | | | 2,951,142 |
fIndex Linked, 6.00%, 11/15/09 | | 2,500 | eBRL | | | 1,799,618 |
fIndex Linked, 6.00%, 5/15/15 | | 2,750 | eBRL | | | 1,856,264 |
| | | | | | |
| | | | | | 16,818,400 |
| | | | | | |
Canada 2.2% | | | | | | |
Province of Alberta, 5.00%, 12/16/08 | | 170,000 | CAD | | | 148,329 |
Province of Manitoba, 6.375%, 9/01/15 | | 1,638,000 | NZD | | | 1,123,559 |
Province of Newfoundland, 5.90%, 12/12/07 | | 300,000 | CAD | | | 260,751 |
Province of Ontario, | | | | | | |
6.125%, 9/12/07 | | 3,555,000 | CAD | | | 3,086,329 |
3.875%, 3/08/08 | | 1,925,000 | CAD | | | 1,647,777 |
6.25%, 6/16/15 | | 925,000 | NZD | | | 623,649 |
| | | | | | |
| | | | | | 6,890,394 |
| | | | | | |
Finland 0.2% | | | | | | |
Government of Finland, 5.375%, 7/04/13 | | 540,000 | EUR | | | 770,744 |
| | | | | | |
France 0.1% | | | | | | |
Government of France, 4.00%, 10/25/09 | | 195,000 | EUR | | | 258,113 |
| | | | | | |
Germany 4.0% | | | | | | |
Government of Germany, 4.00%, 2/16/07 | | 110,000 | EUR | | | 145,252 |
KfW Bankengruppe, | | | | | | |
bFRN, 0.233%, 8/08/11 | | 1,280,000,000 | JPY | | | 10,758,936 |
senior note, E, 8.25%, 9/20/07 | | 129,000,000 | ISK | | | 1,745,773 |
| | | | | | |
| | | | | | 12,649,961 |
| | | | | | |
Greece 0.1% | | | | | | |
Government of the Hellenic Republic, 3.25%, 6/21/07 | | 270,000 | EUR | | | 355,473 |
| | | | | | |
Indonesia 6.6% | | | | | | |
Government of Indonesia,
10.00%, 10/15/11 | | 1,800,000,000 | IDR | | | 200,031 |
11.00%, 12/15/12 | | 450,000,000 | IDR | | | 53,196 |
TGI-11
Franklin Templeton Variable Insurance Products Trust
Statement of Investments, December 31, 2006 (continued)
| | | | | | |
| Templeton Global Income Securities Fund | | Principal
Amounta | | | Value |
Government and Agency Securities (continued) | | | | | | |
Indonesia (continued) | | | | | | |
Government of Indonesia (continued) | | | | | | |
14.25%, 6/15/13 | | 11,269,000,000 | IDR | | $ | 1,528,679 |
14.275%, 12/15/13 | | 21,167,000,000 | IDR | | | 2,882,962 |
11.00%, 10/15/14 | | 3,390,000,000 | IDR | | | 400,969 |
10.75%, 5/15/16 | | 3,300,000,000 | IDR | | | 375,923 |
10.00%, 7/15/17 | | 3,500,000,000 | IDR | | | 390,143 |
11.50%, 9/15/19 | | 30,075,000,000 | IDR | | | 3,604,390 |
11.00%, 11/15/20 | | 31,230,000,000 | IDR | | | 3,676,517 |
12.80%, 6/15/21 | | 31,965,000,000 | IDR | | | 4,247,308 |
12.90%, 6/15/22 | | 10,710,000,000 | IDR | | | 1,437,070 |
11.75%, 8/15/23 | | 1,615,000,000 | IDR | | | 194,038 |
11.00%, 9/15/25 | | 8,550,000,000 | IDR | | | 1,004,400 |
12.00%, 9/15/26 | | 6,500,000,000 | IDR | | | 822,121 |
| | | | | | |
| | | | | | 20,817,747 |
| | | | | | |
Iraq 1.9% | | | | | | |
gGovernment of Iraq, Reg S, 5.80%, 1/15/28 | | 9,300,000 | | | | 6,068,250 |
| | | | | | |
Malaysia 4.4% | | | | | | |
Government of Malaysia, | | | | | | |
6.90%, 3/15/07 | | 1,075,000 | MYR | | | 306,643 |
8.60%, 12/01/07 | | 19,995,000 | MYR | | | 5,924,207 |
3.135%, 12/17/07 | | 14,625,000 | MYR | | | 4,130,388 |
6.45%, 7/01/08 | | 8,900,000 | MYR | | | 2,628,147 |
4.305%, 2/27/09 | | 3,660,000 | MYR | | | 1,051,959 |
| | | | | | |
| | | | | | 14,041,344 |
| | | | | | |
Mexico 1.2% | | | | | | |
Government of Mexico, | | | | | | |
h144A, 7.50%, 3/08/10 | | 450,000 | EUR | | | 648,851 |
8.00%, 12/17/15 | | 76,000 | iMXN | | | 728,886 |
10.00%, 12/05/24 | | 205,000 | iMXN | | | 2,355,951 |
| | | | | | |
| | | | | | 3,733,688 |
| | | | | | |
Netherlands 0.2% | | | | | | |
Government of the Netherlands, 5.75%, 2/15/07 | | 488,000 | EUR | | | 645,705 |
| | | | | | |
New Zealand 0.5% | | | | | | |
Government of New Zealand, 7.00%, 7/15/09 | | 2,435,000 | NZD | | | 1,730,696 |
| | | | | | |
Norway 2.8% | | | | | | |
Government of Norway, 6.75%, 1/15/07 | | 54,660,000 | NOK | | | 8,774,466 |
| | | | | | |
Peru 1.3% | | | | | | |
Government of Peru, | | | | | | |
8.60%, 8/12/17 | | 6,185,000 | PEN | | | 2,285,075 |
7.84%, 8/12/20 | | 4,945,000 | PEN | | | 1,765,314 |
| | | | | | |
| | | | | | 4,050,389 |
| | | | | | |
Philippines 0.4% | | | | | | |
Government of the Philippines, | | | | | | |
9.00%, 2/15/13 | | 800,000 | | | | 928,000 |
gReg S, 9.125%, 2/22/10 | | 330,000 | EUR | | | 490,613 |
| | | | | | |
| | | | | | 1,418,613 |
| | | | | | |
TGI-12
Franklin Templeton Variable Insurance Products Trust
Statement of Investments, December 31, 2006 (continued)
| | | | | | |
| Templeton Global Income Securities Fund | | Principal
Amounta | | | Value |
Government and Agency Securities (continued) | | | | | | |
Poland 6.6% | | | | | | |
Government of Poland, | | | | | | |
8.50%, 5/12/07 | | 16,290,000 | PLN | | $ | 5,698,116 |
5.75%, 6/24/08 | | 3,900,000 | PLN | | | 1,366,538 |
6.00%, 5/24/09 | | 8,195,000 | PLN | | | 2,909,509 |
5.75%, 9/23/22 | | 30,500,000 | PLN | | | 10,964,368 |
| | | | | | |
| | | | | | 20,938,531 |
| | | | | | |
Singapore 3.0% | | | | | | |
Government of Singapore, | | | | | | |
1.75%, 2/01/07 | | 2,335,000 | SGD | | | 1,520,955 |
4.00%, 3/01/07 | | 7,160,000 | SGD | | | 4,673,930 |
2.625%, 10/01/07 | | 4,980,000 | SGD | | | 3,237,843 |
| | | | | | |
| | | | | | 9,432,728 |
| | | | | | |
Slovak Republic 2.9% | | | | | | |
Government of Slovakia, | | | | | | |
4.95%, 3/05/08 | | 81,000,000 | SKK | | | 3,115,543 |
4.80%, 4/14/09 | | 33,500,000 | SKK | | | 1,298,056 |
4.90%, 2/05/10 | | 1,000,000 | SKK | | | 39,081 |
8.50%, 8/17/10 | | 70,000,000 | SKK | | | 3,059,712 |
7.50%, 3/13/12 | | 19,000,000 | SKK | | | 837,989 |
5.00%, 1/22/13 | | 6,000,000 | SKK | | | 240,216 |
4.90%, 2/11/14 | | 4,900,000 | SKK | | | 195,239 |
5.30%, 5/12/19 | | 11,200,000 | SKK | | | 471,377 |
| | | | | | |
| | | | | | 9,257,213 |
| | | | | | |
South Africa 0.1% | | | | | | |
Government of South Africa, 5.25%, 5/16/13 | | 200,000 | EUR | | | 273,029 |
| | | | | | |
South Korea 9.7% | | | | | | |
Government of Korea, 4.25%, 3/10/08 | | 2,700,000,000 | KRW | | | 2,879,402 |
Korea Treasury Note, | | | | | | |
6.90%, 1/16/07 | | 1,200,000,000 | KRW | | | 1,291,190 |
4.75%, 3/03/07 | | 5,740,000,000 | KRW | | | 6,169,966 |
3.75%, 9/10/07 | | 5,950,000,000 | KRW | | | 6,347,806 |
4.75%, 3/12/08 | | 3,768,000,000 | KRW | | | 4,039,491 |
4.50%, 9/09/08 | | 1,945,000,000 | KRW | | | 2,076,075 |
4.25%, 9/10/08 | | 7,500,000,000 | KRW | | | 7,974,480 |
| | | | | | |
| | | | | | 30,778,410 |
| | | | | | |
Spain 0.2% | | | | | | |
Government of Spain, 6.00%, 1/31/08 | | 390,000 | EUR | | | 526,102 |
| | | | | | |
jSupranational 2.1% | | | | | | |
European Investment Bank, | | | | | | |
2.125%, 9/20/07 | | 300,000,000 | JPY | | | 2,547,950 |
bsenior note, FRN, 0.205%, 9/21/11 | | 305,000,000 | JPY | | | 2,562,579 |
Inter-American Development Bank, | | | | | | |
9.00%, 1/04/07 | | 79,500,000 | ISK | | | 1,119,324 |
6.00%, 12/15/17 | | 575,000 | NZD | | | 385,652 |
| | | | | | |
| | | | | | 6,615,505 |
| | | | | | |
TGI-13
Franklin Templeton Variable Insurance Products Trust
Statement of Investments, December 31, 2006 (continued)
| | | | | | |
| Templeton Global Income Securities Fund | | Principal
Amounta | | | Value |
Government and Agency Securities (continued) | | | | | | |
Sweden 8.8% | | | | | | |
Government of Sweden, 8.00%, 8/15/07 | | 148,705,000 | SEK | | $ | 22,304,014 |
kSwedish Treasury Bill, 12/19/07 | | 38,775,000 | SEK | | | 5,476,436 |
| | | | | | |
| | | | | | 27,780,450 |
| | | | | | |
Thailand 0.5% | | | | | | |
Bank of Thailand Bond, | | | | | | |
5.00%, 1/12/08 | | 14,350,000 | THB | | | 404,907 |
5.50%, 8/10/08 | | 23,700,000 | THB | | | 670,716 |
Government of Thailand, | | | | | | |
5.60%, 7/07/07 | | 11,960,000 | THB | | | 338,564 |
4.125%, 2/12/08 | | 9,000,000 | THB | | | 251,621 |
8.50%, 12/08/08 | | 1,000,000 | THB | | | 30,015 |
| | | | | | |
| | | | | | 1,695,823 |
| | | | | | |
United States 4.1% | | | | | | |
FNMA, | | | | | | |
2.125%, 10/09/07 | | 1,350,000,000 | JPY | | | 11,477,285 |
1.75%, 3/26/08 | | 180,000,000 | JPY | | | 1,532,354 |
| | | | | | |
| | | | | | 13,009,639 |
| | | | | | |
Total Government and Agency Securities (Cost $220,144,919) | | | | | | 235,198,884 |
| | | | | | |
Short Term Investments 24.2% | | | | | | |
Government and Agency Securities 17.2% | | | | | | |
Australia 0.6% | | | | | | |
Queensland Treasury Corp., Series 07G, 8.00%, 9/14/07 | | 2,400,000 | AUD | | | 1,916,613 |
| | | | | | |
Canada 4.0% | | | | | | |
Government of Canada, 4.50%, 9/01/07 | | 14,655,000 | CAD | | | 12,602,608 |
| | | | | | |
Egypt 5.6% | | | | | | |
kEgypt Certificate of Deposit, 9/12/07 | | 10,000,000 | EGP | | | 1,631,167 |
kEgypt Treasury Bill, 1/16/07 | | 2,300,000 | EGP | | | 401,365 |
1/30/07 | | 2,000,000 | EGP | | | 347,770 |
2/20/07 | | 2,100,000 | EGP | | | 362,620 |
3/06/07 | | 6,400,000 | EGP | | | 1,102,946 |
3/27/07 | | 10,500,000 | EGP | | | 1,799,685 |
4/17/07 | | 5,000,000 | EGP | | | 852,353 |
6/19/07 | | 775,000 | EGP | | | 129,648 |
6/26/07 | | 8,400,000 | EGP | | | 1,405,846 |
7/17/07 | | 25,000 | EGP | | | 4,161 |
7/24/07 | | 700,000 | EGP | | | 116,037 |
7/31/07 | | 5,550,000 | EGP | | | 918,574 |
8/28/07 | | 775,000 | EGP | | | 127,344 |
9/04/07 | | 3,500,000 | EGP | | | 574,216 |
9/25/07 | | 725,000 | EGP | | | 118,306 |
10/09/07 | | 4,000,000 | EGP | | | 650,393 |
10/23/07 | | 2,750,000 | EGP | | | 445,555 |
11/06/07 | | 5,875,000 | EGP | | | 948,736 |
11/13/07 | | 10,900,000 | EGP | | | 1,757,095 |
11/20/07 | | 10,450,000 | EGP | | | 1,681,580 |
1/01/08 | | 15,000,000 | EGP | | | 2,388,989 |
| | | | | | |
| | | | | | 17,764,386 |
| | | | | | |
TGI-14
Franklin Templeton Variable Insurance Products Trust
Statement of Investments, December 31, 2006 (continued)
| | | | | | | |
| Templeton Global Income Securities Fund | | Principal
Amounta | | | Value | |
Short Term Investments (continued) | | | | | | | |
Government and Agency Securities (continued) | | | | | | | |
Norway 1.9% | | | | | | | |
kNorwegian Treasury Bill, | | | | | | | |
3/21/07 | | 7,525,000 | NOK | | $ | 1,194,779 | |
6/20/07 | | 8,000,000 | NOK | | | 1,261,081 | |
9/19/07 | | 23,100,000 | NOK | | | 3,602,742 | |
| | | | | | | |
| | | | | | 6,058,602 | |
| | | | | | | |
Thailand 5.1% | | | | | | | |
kThailand Treasury Bill, | | | | | | | |
1/18/07 | | 43,100,000 | THB | | | 1,211,508 | |
3/08/07 | | 48,350,000 | THB | | | 1,349,833 | |
4/05/07 | | 8,850,000 | THB | | | 246,634 | |
4/19/07 | | 25,780,000 | THB | | | 717,114 | |
5/03/07 | | 88,000,000 | THB | | | 2,443,346 | |
5/17/07 | | 18,000,000 | THB | | | 498,976 | |
7/05/07 | | 20,000,000 | THB | | | 550,434 | |
7/19/07 | | 6,400,000 | THB | | | 175,903 | |
8/02/07 | | 22,000,000 | THB | | | 603,847 | |
8/16/07 | | 90,255,000 | THB | | | 2,471,407 | |
9/06/07 | | 63,160,000 | THB | | | 1,724,642 | |
10/04/07 | | 69,615,000 | THB | | | 1,893,810 | |
11/08/07 | | 30,000,000 | THB | | | 812,325 | |
12/06/07 | | 59,780,000 | THB | | | 1,613,111 | |
| | | | | | | |
| | | | | | 16,312,890 | |
| | | | | | | |
Total Government and Agency Securities (Cost $53,813,882) | | | | | | 54,655,099 | |
| | | | | | | |
Total Investments before Repurchase Agreement (Cost $273,958,801) | | | | | | 289,853,983 | |
| | | | | | | |
United States 7.0% | | | | | | | |
Repurchase Agreement (Cost $22,226,951) 7.0% | | | | | | | |
lJoint Repurchase Agreement, 5.137%, 1/02/07 (Maturity Value $22,239,638) | | 22,226,951 | | | | 22,226,951 | |
ABN AMRO Bank, N.V., New York Branch (Maturity Value $2,135,005) | | | | | | | |
Banc of America Securities LLC (Maturity Value $2,135,005) | | | | | | | |
Barclays Capital Inc. (Maturity Value $993,223) | | | | | | | |
Bear, Stearns & Co. Inc. (Maturity Value $993,223) | | | | | | | |
BNP Paribas Securities Corp. (Maturity Value $2,135,005) | | | | | | | |
Deutsche Bank Securities Inc. (Maturity Value $496,833) | | | | | | | |
Dresdner Kleinwort Wasserstein Securities LLC (Maturity Value $496,833) | | | | | | | |
Goldman, Sachs & Co. (Maturity Value $2,135,005) | | | | | | | |
Greenwich Capital Markets Inc. (Maturity Value $2,135,005) | | | | | | | |
Lehman Brothers Inc. (Maturity Value $2,179,486) | | | | | | | |
Merrill Lynch Government Securities Inc. (Maturity Value $2,135,005) | | | | | | | |
Morgan Stanley & Co. Inc. (Maturity Value $2,135,005) | | | | | | | |
UBS Securities LLC (Maturity Value $2,135,005) | | | | | | | |
Collateralized by U.S Government Agency Securities, 2.75% - 7.625%, 2/23/07 - 12/09/11;
kU.S. Government Agency Discount Notes, 1/12/07 - 2/08/07; kU.S. Treasury Bills, 1/25/07;
and U.S. Treasury Notes, 3.625% - 6.125%, 5/15/07 - 5/31/11 | | | | | | | |
| | | | | | | |
Total Short Term Investments (Cost $76,040,833) | | | | | | 76,882,050 | |
| | | | | | | |
Total Investments (Cost $296,185,752) 98.4% | | | | | | 312,080,934 | |
Net Unrealized Loss on Forward Exchange Contracts (0.2)% | | | | | | (494,400 | ) |
Other Assets, less Liabilities 1.8% | | | | | | 5,596,462 | |
| | | | | | | |
Net Assets 100.0% | | | | | $ | 317,182,996 | |
| | | | | | | |
TGI-15
Franklin Templeton Variable Insurance Products Trust
Statement of Investments, December 31, 2006 (continued)
Currency Abbreviations
AUD - Australian Dollar
BRL - Brazilian Real
CAD - Canadian Dollar
EGP - Egyptian Pounds
EUR - Euro
IDR - Indonesian Rupiah
ISK - Iceland Krona
JPY - Japanese Yen
KRW - South Korean Won
MXN - Mexican Peso
MYR - Malaysian Ringgit
NOK - Norwegian Krone
NZD - New Zealand Dollar
PEN - Peruvian Nuevo Sol
PLN - Polish Zloty
SEK - Swedish Krona
SGD - Singapore Dollar
SKK - Slovak Koruna
THB - Thai Baht
Selected Portfolio Abbreviations
FNMA - Federal National Mortgage Association
FRN - Floating Rate Note
a | The principal amount is stated in U.S. dollars unless otherwise indicated. |
b | The coupon rate shown represents the rate at period end. |
c | The principal amount is stated in original face, and scheduled paydowns are reflected in the market price on ex-date. |
d | Warrants are linked to the Argentine Republic Gross Domestic Product (GDP) and do not pay principal over life of security or at expiration. Warrants entitle the holder to receive only variable income payments, subject to certain conditions, which are based on growth of the Argentine GDP and the principal or “notional” value of these GDP linked warrants. |
e | Principal is stated in 1,000 Real units. |
f | Principal amount of security is adjusted for inflation. See Note 1(f) |
g | Security was purchased pursuant to Regulation S under the Securities Act of 1933, which exempts from registration securities offered and sold outside of the United States. Such a security cannot be sold in the United States without either an effective registration statement filed pursuant to the Securities Act of 1933, or pursuant to an exemption from registration. These securities have been deemed liquid under guidelines approved by the Trust’s Board of Trustees. At December 31, 2006, the value of these securities was $6,558,863, representing 2.07% of net assets. |
h | Security was purchased pursuant to Rule 144A under the Securities Act of 1933 and may be sold in transactions exempt from registration only to qualified institutional buyers or in a public offering registered under the Securities Act of 1933. These securities have been deemed liquid under guidelines approved by the Trust’s Board of Trustees. At December 31, 2006, the value of this security was $648,851, representing 0.20% of net assets. |
i | Principal is stated in 100 Peso units. |
j | A supranational organization is an entity formed by two or more central governments through international treaties. |
k | The security is traded on a discount basis with no stated coupon rate. |
l | See Note 1(c) regarding joint repurchase agreement. |
The accompanying notes are an integral part of these financial statements.
TGI-16
Franklin Templeton Variable Insurance Products Trust
Financial Statements
Statement of Assets and Liabilities
December 31, 2006
| | | | |
| | | Templeton
Global Income
Securities Fund | |
Assets: | | | | |
Investments in securities: | | | | |
Cost - Unaffiliated issuers | | $ | 273,958,801 | |
Cost - Repurchase agreement | | | 22,226,951 | |
| | | | |
Total cost of investments | | $ | 296,185,752 | |
| | | | |
Value - Unaffiliated issuers | | $ | 289,853,983 | |
Value - Repurchase agreement | | | 22,226,951 | |
| | | | |
Total value of investments | | | 312,080,934 | |
Foreign currency, at value (cost $2,501,786) | | | 2,503,087 | |
Receivables: | | | | |
Capital shares sold | | | 584,562 | |
Interest | | | 5,403,606 | |
Unrealized gain on forward exchange contracts (Note 7) | | | 560,584 | |
| | | | |
Total assets | | | 321,132,773 | |
| | | | |
Liabilities: | | | | |
Payables: | | | | |
Investment securities purchased | | | 2,396,309 | |
Capital shares redeemed | | | 127,043 | |
Affiliates | | | 236,262 | |
Unrealized loss on forward exchange contracts (Note 7) | | | 1,054,984 | |
Accrued expenses and other liabilities | | | 135,179 | |
| | | | |
Total liabilities | | | 3,949,777 | |
| | | | |
Net assets, at value | | $ | 317,182,996 | |
| | | | |
Net assets consist of: | | | | |
Paid-in capital | | $ | 298,607,930 | |
Undistributed net investment income | | | 9,842,829 | |
Net unrealized appreciation (depreciation) | | | 15,501,486 | |
Accumulated net realized gain (loss) | | | (6,769,249 | ) |
| | | | |
Net assets, at value | | $ | 317,182,996 | |
| | | | |
Class 1: | | | | |
Net assets, at value | | $ | 75,843,303 | |
| | | | |
Shares outstanding | | | 4,822,638 | |
| | | | |
Net asset value and maximum offering price per share | | $ | 15.73 | |
| | | | |
Class 2: | | | | |
Net assets, at value | | $ | 205,767,610 | |
| | | | |
Shares outstanding | | | 13,273,761 | |
| | | | |
Net asset value and maximum offering price per share | | $ | 15.50 | |
| | | | |
Class 3: | | | | |
Net assets, at value | | $ | 35,572,083 | |
| | | | |
Shares outstanding | | | 2,296,389 | |
| | | | |
Net asset value and maximum offering price per sharea | | $ | 15.49 | |
| | | | |
a | Redemption price is equal to net asset value less any redemption fees retained by the Fund. |
The accompanying notes are an integral part of these financial statements.
TGI-17
Franklin Templeton Variable Insurance Products Trust
Financial Statements (continued)
Statement of Operations
for the year ended December 31, 2006
| | | | |
| | | Templeton
Global Income
Securities Fund | |
Investment income: | | | | |
Interest (net of foreign taxes of $345,106) | | $ | 9,588,047 | |
| | | | |
Expenses: | | | | |
Management fees (Note 3a) | | | 1,115,338 | |
Distribution fees: (Note 3c) | | | | |
Class 2 | | | 293,718 | |
Class 3 | | | 45,946 | |
Unaffiliated transfer agent fees | | | 756 | |
Custodian fees (Note 4) | | | 225,670 | |
Reports to shareholders | | | 208,217 | |
Professional fees | | | 24,092 | |
Trustees’ fees and expenses | | | 766 | |
Other | | | 11,538 | |
| | | | |
Total expenses | | | 1,926,041 | |
Expense reductions (Note 4) | | | (149,015 | ) |
| | | | |
Net expenses | | | 1,777,026 | |
| | | | |
Net investment income | | | 7,811,021 | |
| | | | |
Realized and unrealized gains (losses): | | | | |
Net realized gain (loss) from: | | | | |
Investments (net of foreign taxes of $6,256) | | | 4,121,530 | |
Foreign currency transactions | | | 127,026 | |
| | | | |
Net realized gain (loss) | | | 4,248,556 | |
| | | | |
Net change in unrealized appreciation (depreciation) on: | | | | |
Investments | | | 12,138,312 | |
Translation of assets and liabilities denominated in foreign currencies | | | 135,055 | |
| | | | |
Net change in unrealized appreciation (depreciation) | | | 12,273,367 | |
| | | | |
Net realized and unrealized gain (loss) | | | 16,521,923 | |
| | | | |
Net increase (decrease) in net assets resulting from operations | | $ | 24,332,944 | |
| | | | |
The accompanying notes are an integral part of these financial statements.
TGI-18
Franklin Templeton Variable Insurance Products Trust
Financial Statements (continued)
Statements of Changes in Net Assets
| | | | | | | | |
| | | Templeton Global Income
Securities Fund | |
| | | Year Ended December 31, | |
| | | 2006 | | | 2005 | |
| | | | |
Increase (decrease) in net assets: | | | | | | | | |
Operations: | | | | | | | | |
Net investment income | | $ | 7,811,021 | | | $ | 3,292,059 | |
Net realized gain (loss) from investments and foreign currency transactions | | | 4,248,556 | | | | 3,899,560 | |
Net change in unrealized appreciation (depreciation) on investments and translation of assets and liabilities denominated in foreign currencies | | | 12,273,367 | | | | (9,226,450 | ) |
| | | | |
Net increase (decrease) in net assets resulting from operations | | | 24,332,944 | | | | (2,034,831 | ) |
| | | | |
Distributions to shareholders from: | | | | | | | | |
Net investment income: | | | | | | | | |
Class 1 | | | (2,013,759 | ) | | | (3,016,853 | ) |
Class 2 | | | (3,259,404 | ) | | | (2,073,846 | ) |
Class 3 | | | (431,514 | ) | | | (32,207 | ) |
| | | | |
Total distributions to shareholders | | | (5,704,677 | ) | | | (5,122,906 | ) |
| | | | |
Capital share transactions: (Note 2) | | | | | | | | |
Class 1 | | | 16,986,934 | | | | 7,710,594 | |
Class 2 | | | 133,487,737 | | | | 44,184,638 | |
Class 3 | | | 27,934,695 | | | | 5,777,317 | |
| | | | |
Total capital share transactions | | | 178,409,366 | | | | 57,672,549 | |
| | | | |
Redemption fees | | | 6,342 | | | | 36 | |
| | | | |
Net increase (decrease) in net assets | | | 197,043,975 | | | | 50,514,848 | |
Net assets: | | | | | | | | |
Beginning of year | | | 120,139,021 | | | | 69,624,173 | |
| | | | |
End of year | | $ | 317,182,996 | | | $ | 120,139,021 | |
| | | | |
Undistributed net investment income included in net assets: | | | | | | | | |
End of year | | $ | 9,842,829 | | | $ | 4,412,581 | |
| | | | |
The accompanying notes are an integral part of these financial statements.
TGI-19
Franklin Templeton Variable Insurance Products Trust
Notes to Financial Statements
Templeton Global Income Securities Fund
1. ORGANIZATION AND SIGNIFICANT ACCOUNTING POLICIES
Franklin Templeton Variable Insurance Products Trust (the Trust) is registered under the Investment Company Act of 1940, as amended, (the 1940 Act) as an open-end investment company, consisting of twenty-two separate funds. The Templeton Global Income Securities Fund (the Fund) included in this report is non-diversified. The financial statements of the remaining funds in the Trust are presented separately. Shares of the Fund are sold only to insurance company separate accounts to fund the benefits of variable life insurance policies or variable annuity contracts. The Fund offers three classes of shares: Class 1, Class 2, and Class 3. Each class of shares differs by its distribution fees, voting rights on matters affecting a single class and its exchange privilege.
The following summarizes the Fund’s significant accounting policies.
a. Security Valuation
Securities listed on a securities exchange or on the NASDAQ National Market System are valued at the last quoted sale price or the official closing price of the day, respectively. Over-the-counter securities and listed securities for which there is no reported sale are valued within the range of the most recent quoted bid and ask prices. Securities that trade in multiple markets or on multiple exchanges are valued according to the broadest and most representative market.
Corporate debt securities and government securities generally trade in the over-the-counter market rather than on a securities exchange. The Trust may utilize independent pricing services, quotations from bond dealers, and information with respect to bond and note transactions, to assist in determining a current market value for each security. The Trust’s pricing services may use valuation models or matrix pricing which considers information with respect to comparable bond and note transactions, quotations from bond dealers, or by reference to other securities that are considered comparable in such characteristics as rating, interest rate and maturity date, option adjusted spread models, prepayment projections, interest rate spreads and yield curves, to determine current value.
Foreign securities are valued as of the close of trading on the foreign stock exchange on which the security is primarily traded, or the NYSE, whichever is earlier. If no sale is reported at that time, the foreign security will be valued within the range of the most recent quoted bid and ask prices. The value is then converted into its U.S. dollar equivalent at the foreign exchange rate in effect at the close of the NYSE on the day that the value of the foreign security is determined.
The Trust has procedures to determine the fair value of individual securities and other assets for which market prices are not readily available or which may not be reliably priced. Methods for valuing these securities may include: fundamental analysis, matrix pricing, discounts from market prices of similar securities, or discounts applied due to the nature and duration of restrictions on the disposition of the securities. Due to the inherent uncertainty of valuations of such securities, the fair values may differ significantly from the values that would have been used had a ready market for such investments existed. Occasionally, events occur between the time at which trading in a security is completed and the close of the NYSE that might call into question the availability (including the reliability) of the value of a portfolio security held by the Fund. The investment manager monitors price movements following the close of trading in foreign stock markets through a series of country specific market proxies (such as baskets of American Depository Receipts, futures contracts and exchange traded funds). These price movements are measured against established trigger thresholds for each specific market proxy to assist in determining if an event has occurred. If such an event occurs, the securities may be valued using fair value procedures, which may include the use of independent pricing services. All security valuation procedures are approved by the Trust’s Board of Trustees.
b. Foreign Currency Translation
Portfolio securities and other assets and liabilities denominated in foreign currencies are translated into U.S. dollars based on the exchange rate of such currencies against U.S. dollars on the date of valuation. Purchases and sales of securities, income and expense items denominated in foreign currencies are translated into U.S. dollars at the exchange rate in effect on the transaction
TGI-20
Franklin Templeton Variable Insurance Products Trust
Notes to Financial Statements (continued)
Templeton Global Income Securities Fund
1. ORGANIZATION AND SIGNIFICANT ACCOUNTING POLICIES (continued)
b. Foreign Currency Translation (continued)
date. Occasionally, events may impact the availability or reliability of foreign exchange rates used to convert the U.S. dollar equivalent value. If such an event occurs, the foreign exchange rate will be valued at fair value using procedures established and approved by the Trust’s Board of Trustees.
The Fund does not separately report the effect of changes in foreign exchange rates from changes in market prices on securities held. Such changes are included in net realized and unrealized gain or loss from investments on the Statement of Operations.
Realized foreign exchange gains or losses arise from sales of foreign currencies, currency gains or losses realized between the trade and settlement dates on securities transactions and the difference between the recorded amounts of dividends, interest, and foreign withholding taxes and the U.S. dollar equivalent of the amounts actually received or paid. Net unrealized foreign exchange gains and losses arise from changes in foreign exchange rates on foreign denominated assets and liabilities other than investments in securities held at the end of the reporting period.
c. Joint Repurchase Agreement
The Fund may enter into a joint repurchase agreement whereby its uninvested cash balance is deposited into a joint cash account with other funds managed by the investment manager or an affiliate of the investment manager and is used to invest in one or more repurchase agreements. The value and face amount of the joint repurchase agreement are allocated to the funds based on their pro-rata interest. A repurchase agreement is accounted for as a loan by the Fund to the seller, collateralized by securities which are delivered to the Fund’s custodian. The market value, including accrued interest, of the initial collateralization is required to be at least 102% of the dollar amount invested by the funds, with the value of the underlying securities marked to market daily to maintain coverage of at least 100%. The joint repurchase agreement held by the Fund at year end had been entered into on December 29, 2006. The joint repurchase agreement is valued at cost.
d. Foreign Currency Contracts
When the Fund purchases or sells foreign securities it may enter into foreign exchange contracts to minimize foreign exchange risk from the trade date to the settlement date of the transactions. A foreign exchange contract is an agreement between two parties to exchange different currencies at an agreed upon exchange rate at a future date. Realized and unrealized gains and losses on these contracts are included in the Statement of Operations.
The Fund may also enter into forward exchange contracts to hedge against fluctuations in foreign exchange rates. These contracts are valued daily by the Fund and the unrealized gains or losses on the contracts, as measured by the difference between the contractual forward foreign exchange rates and the forward rates at the reporting date, are included in the Statement of Assets and Liabilities. Realized and unrealized gains and losses on these contracts are included in the Statement of Operations.
The risks of these contracts include movement in the values of the foreign currencies relative to the U.S. dollar and the possible inability of the counterparties to fulfill their obligations under the contracts, which may be in excess of the amount reflected in the Statement of Assets and Liabilities.
e. Income Taxes
No provision has been made for U.S. income taxes because the Fund intends to qualify as a regulated investment company under the Internal Revenue Code and to distribute to shareholders substantially all of its taxable income and net realized gains.
Foreign securities held by the Fund may be subject to foreign taxation on dividend and interest income received. Foreign taxes, if any, are recorded based on the tax regulations and rates that exist in the foreign markets in which the Fund invests.
TGI-21
Franklin Templeton Variable Insurance Products Trust
Notes to Financial Statements (continued)
Templeton Global Income Securities Fund
1. ORGANIZATION AND SIGNIFICANT ACCOUNTING POLICIES (continued)
f. Security Transactions, Investment Income, Expenses and Distributions
Security transactions are accounted for on trade date. Realized gains and losses on security transactions are determined on a specific identification basis. Interest income and estimated expenses are accrued daily. Amortization of premium and accretion of discount on debt securities are included in interest income. Distributions to shareholders are recorded on the ex-dividend date and are determined according to income tax regulations (tax basis). Distributable earnings determined on a tax basis may differ from earnings recorded in accordance with accounting principles generally accepted in the United States. These differences may be permanent or temporary. Permanent differences are reclassified among capital accounts to reflect their tax character. These reclassifications have no impact on net assets or the results of operations. Temporary differences are not reclassified, as they may reverse in subsequent periods.
Common expenses incurred by the Trust are allocated among the funds based on the ratio of net assets of each fund to the combined net assets of the Trust. Fund specific expenses are charged directly to the fund that incurred the expense.
Realized and unrealized gains and losses and net investment income, other than class specific expenses, are allocated daily to each class of shares based upon the relative proportion of net assets of each class. Differences in class-level expenses may result in payment of different per share distributions by class.
Inflation-indexed bonds provide an inflation hedge through periodic increases in the security’s interest accruals and principal redemption value, by amounts corresponding to the current rate of inflation. Any such adjustments, including adjustments to principal redemption value, are recorded as interest income.
g. Accounting Estimates
The preparation of financial statements in accordance with accounting principles generally accepted in the United States of America requires management to make estimates and assumptions that affect the reported amounts of assets and liabilities at the date of the financial statements and the amounts of income and expenses during the reporting period. Actual results could differ from those estimates.
h. Redemption Fees
Redemptions and exchanges of Class 3 shares held 60 days or less may be subject to the Fund’s redemption fee, which is 1% of the amount redeemed. Such fees are retained by the Fund and accounted for as an addition to paid-in capital.
i. Guarantees and Indemnifications
Under the Trust’s organizational documents, its officers and trustees are indemnified by the Trust against certain liabilities arising out of the performance of their duties to the Trust. Additionally, in the normal course of business, the Trust enters into contracts with service providers that contain general indemnification clauses. The Trust’s maximum exposure under these arrangements is unknown as this would involve future claims that may be made against the Trust that have not yet occurred. Currently, the Trust expects the risk of loss to be remote.
TGI-22
Franklin Templeton Variable Insurance Products Trust
Notes to Financial Statements (continued)
Templeton Global Income Securities Fund
2. SHARES OF BENEFICIAL INTEREST
At December 31, 2006, there were an unlimited number of shares authorized ($0.01 par value). Transactions in the Fund’s shares were as follows:
| | | | | | | | | | | | | | |
| | | Year Ended December 31, | |
| | | 2006 | | | 2005a | |
| Class 1 Shares: | | Shares | | | Amount | | | Shares | | | Amount | |
Shares sold | | 2,027,528 | | | $ | 30,612,502 | | | 1,067,253 | | | $ | 15,508,065 | |
Shares issued in reinvestment of distributions | | 137,929 | | | | 2,013,759 | | | 210,969 | | | | 3,016,853 | |
Shares redeemed | | (1,040,680 | ) | | | (15,639,327 | ) | | (735,231 | ) | | | (10,814,324 | ) |
| | | | |
Net increase (decrease) | | 1,124,777 | | | $ | 16,986,934 | | | 542,991 | | | $ | 7,710,594 | |
| | | | |
| Class 2 Shares: | | | | | | | | | | | | |
Shares sold | | 8,960,584 | | | $ | 133,647,009 | | | 3,017,652 | | | $ | 43,735,355 | |
Shares issued in reinvestment of distributions | | 226,190 | | | | 3,259,404 | | | 146,665 | | | | 2,073,846 | |
Shares redeemed | | (230,816 | ) | | | (3,418,676 | ) | | (110,837 | ) | | | (1,624,563 | ) |
| | | | |
Net increase (decrease) | | 8,955,958 | | | $ | 133,487,737 | | | 3,053,480 | | | $ | 44,184,638 | |
| | | | |
| Class 3 Shares: | | | | | | | | | | | | |
Shares sold | | 2,255,932 | | | $ | 33,481,415 | | | 427,371 | | | $ | 6,068,634 | |
Shares issued in reinvestment of distributions | | 29,966 | | | | 431,514 | | | 2,233 | | | | 31,575 | |
Shares redeemed | | (396,229 | ) | | | (5,978,234 | ) | | (22,884 | ) | | | (322,892 | ) |
| | | | |
Net increase (decrease) | | 1,889,669 | | | $ | 27,934,695 | | | 406,720 | | | $ | 5,777,317 | |
| | | | |
| a | For Class 3 shares, for the period April 1, 2005 (effective date) to December 31, 2005. |
3. TRANSACTIONS WITH AFFILIATES
Franklin Resources, Inc. is the holding company for various subsidiaries that together are referred to as Franklin Templeton Investments. Certain officers and trustees of the Trust are also officers and/or directors of the following subsidiaries:
| | |
| Subsidiary | | Affiliation |
Franklin Advisers, Inc. (Advisers) | | Investment manager |
Franklin Templeton Services, LLC (FT Services) | | Administrative manager |
Franklin Templeton Distributors, Inc. (Distributors) | | Principal underwriter |
Franklin Templeton Investor Services, LLC (Investor Services) | | Transfer agent |
a. Management Fees
The Fund pays an investment management fee to Advisers based on the average daily net assets of the Fund as follows:
| | |
| Annualized Fee Rate | | Net Assets |
0.625% | | up to and including $100 million |
0.500% | | over $100 million, up to and including $250 million |
0.450% | | over $250 million, up to and including $10 billion |
0.440% | | over $10 billion, up to and including $12.5 billion |
0.420% | | over $12.5 billion, up to and including $15 billion |
0.400% | | in excess of $15 billion |
b. Administrative Fees
Under an agreement with Advisers, FT Services provides administrative services to the Fund. The fee is paid by Advisers based on average daily net assets, and is not an additional expense of the Fund.
TGI-23
Franklin Templeton Variable Insurance Products Trust
Notes to Financial Statements (continued)
Templeton Global Income Securities Fund
3. TRANSACTIONS WITH AFFILIATES (continued)
c. Distribution Fees
The Fund’s Board of Trustees has adopted distribution plans for Class 2 and Class 3 shares pursuant to Rule 12b-1 under the 1940 Act. Under the Fund’s compensation distribution plans, the Fund pays Distributors for costs incurred in connection with the servicing, sale and distribution of the Fund’s shares up to 0.25% and 0.35% per year of its average daily net assets of Class 2 and Class 3, respectively. The Board of Trustees has agreed to limit the current rate to 0.25% per year for Class 3.
d. Transfer Agent Fees
Investor Services, under terms of an agreement, performs shareholder servicing for the Fund and is not paid by the Fund for the services.
4. EXPENSE OFFSET ARRANGEMENT
The Fund has entered into an arrangement with its custodian whereby credits realized as a result of uninvested cash balances are used to reduce a portion of the Fund’s custodian expenses. During the year ended December 31, 2006, the custodian fees were reduced as noted in the Statement of Operations.
5. INCOME TAXES
For tax purposes, capital losses may be carried over to offset future capital gains, if any. At December 31, 2006, the capital loss carryforwards were as follows:
Capital loss carryforwards expiring in:
| | | |
2007 | | $ | 2,569,857 |
2008 | | | 2,370,518 |
2009 | | | 1,649,033 |
2010 | | | 177,731 |
| | | |
| | $ | 6,767,139 |
| �� | | |
During the year ended December 31, 2006, the Fund utilized $875,316 of capital loss carryforwards.
The tax character of distributions paid during the years ended December 31, 2006 and 2005, was as follows:
| | | | | | |
| | | 2006 | | 2005 |
Distributions paid from ordinary income | | $ | 5,704,677 | | $ | 5,122,906 |
| | | |
At December 31, 2006, the cost of investments, net unrealized appreciation (depreciation) and undistributed ordinary income for income tax purposes were as follows:
| | | | |
Cost of investments | | $ | 299,036,842 | |
| | | | |
| |
Unrealized appreciation | | $ | 15,259,341 | |
Unrealized depreciation | | | (2,215,249 | ) |
| | | | |
Net unrealized appreciation (depreciation) | | $ | 13,044,092 | |
| | | | |
Distributable earnings – Undistributed ordinary income | | $ | 12,260,730 | |
| | | | |
TGI-24
Franklin Templeton Variable Insurance Products Trust
Notes to Financial Statements (continued)
Templeton Global Income Securities Fund
5. INCOME TAXES (continued)
Net investment income differs for financial statement and tax purposes primarily due to differing treatments of foreign currency transactions, and bond discounts and premiums.
Net realized gains (losses) differ for financial statement and tax purposes primarily due to differing treatments of wash sales, foreign currency transactions, and bond discounts and premiums.
6. INVESTMENT TRANSACTIONS
Purchases and sales of investments (excluding short term securities) for the year ended December 31, 2006, aggregated $181,459,475 and $49,573,650, respectively.
7. FORWARD EXCHANGE CONTRACTS
At December 31, 2006, the Fund had the following forward exchange contracts outstanding:
| | | | | | | | | | | | | | |
| Contracts to Buy | | Contract
Amounta | | | Settlement
Date | | Unrealized
Gain | | Unrealized
Loss | |
| 900,000 | | Brazilian Real | | 378,231 | | | 1/4/07 | | $ | 42,537 | | $ | — | |
| 172,000,000 | | Japanese Yen | | 1,557,266 | | | 2/1/07 | | | — | | | (105,567 | ) |
| 174,752,000 | | Japanese Yen | | 1,600,000 | | | 2/9/07 | | | — | | | (123,633 | ) |
| 87,450,400 | | Japanese Yen | | 800,000 | | | 2/9/07 | | | — | | | (61,188 | ) |
| 87,432,000 | | Japanese Yen | | 800,000 | | | 2/9/07 | | | — | | | (61,343 | ) |
| 43,888,000 | | Japanese Yen | | 400,000 | | | 2/9/07 | | | — | | | (29,219 | ) |
| 43,924,000 | | Japanese Yen | | 400,000 | | | 2/9/07 | | | — | | | (28,914 | ) |
| 48,129,750 | | Japanese Yen | | 450,000 | | | 2/13/07 | | | — | | | (43,184 | ) |
| 48,204,000 | | Japanese Yen | | 450,000 | | | 2/13/07 | | | — | | | (42,556 | ) |
| 996,625 | | Brazilian Real | | 425,000 | | | 2/21/07 | | | 37,182 | | | — | |
| 48,073,500 | | Japanese Yen | | 450,000 | | | 2/22/07 | | | — | | | (43,212 | ) |
| 1,111,500 | | Brazilian Real | | 450,000 | | | 2/26/07 | | | 65,076 | | | — | |
| 1,083,600 | | Brazilian Real | | 430,000 | | | 2/28/07 | | | 71,988 | | | — | |
| 21,500,000 | | Swedish Krona | | 3,007,414 | | | 2/28/07 | | | 142,617 | | | — | |
| 38,027,500 | | Japanese Yen | | 350,000 | | | 3/5/07 | | | — | | | (27,764 | ) |
| 25,000,000 | | Indian Rupee | | 888,415 | NZD | | 3/21/07 | | | — | | | (61,644 | ) |
| 42,030,000 | | Indian Rupee | | 900,000 | | | 3/27/07 | | | 42,645 | | | — | |
| 1,235,688 | | Romania Leu | | 425,000 | | | 3/28/07 | | | 54,319 | | | — | |
| 33,600,000 | | Japanese Yen | | 300,000 | | | 4/19/07 | | | — | | | (13,598 | ) |
| 2,451,400 | | Romania Leu | | 850,000 | | | 4/23/07 | | | 99,148 | | | — | |
| 34,696,800 | | Japanese Yen | | 240,000 | EUR | | 4/27/07 | | | — | | | (22,374 | ) |
| 101,142,000 | | Japanese Yen | | 900,000 | | | 5/24/07 | | | — | | | (34,005 | ) |
| 21,250,000 | | Iceland Krona | | 286,350 | | | 6/20/07 | | | 203 | | | — | |
| 31,875,000 | | Iceland Krona | | 431,326 | | | 6/21/07 | | | — | | | (1,596 | ) |
| 31,875,000 | | Iceland Krona | | 427,852 | | | 6/27/07 | | | 1,287 | | | — | |
| 426,288,750 | | Japanese Yen | | 3,750,000 | | | 7/5/07 | | | — | | | (80,433 | ) |
| 433,331,250 | | Japanese Yen | | 3,750,000 | | | 7/13/07 | | | — | | | (16,136 | ) |
| 175,000,000 | | Japanese Yen | | 1,513,727 | | | 7/17/07 | | | — | | | (5,070 | ) |
| 27,917,500 | | Japanese Yen | | 250,000 | | | 9/4/07 | | | — | | | (7,865 | ) |
| 14,000,000 | | Indian Rupee | | 462,092 | NZD | | 10/29/07 | | | — | | | (9,465 | ) |
| 14,500,000 | | Indian Rupee | | 488,594 | NZD | | 10/29/07 | | | — | | | (16,701 | ) |
| 27,925,000 | | Indian Rupee | | 929,749 | NZD | | 10/29/07 | | | — | | | (24,426 | ) |
| 31,600,000 | | Indian Rupee | | 1,083,676 | NZD | | 10/30/07 | | | — | | | (49,410 | ) |
TGI-25
Franklin Templeton Variable Insurance Products Trust
Notes to Financial Statements (continued)
Templeton Global Income Securities Fund
7. FORWARD EXCHANGE CONTRACTS (continued)
| | | | | | | | | | | | | | |
| Contracts to Sell | | Contract
Amounta | | | Settlement
Date | | Unrealized
Gain | | Unrealized
Loss | |
| 357,000 | | Euro | | 50,433,390 | JPY | | 3/6/07 | | $ | — | | $ | (45,294 | ) |
| 9,640,135 | | Mexican Peso | | 473,137,801 | CLP | | 8/16/07 | | | 3,582 | | | — | |
| 6,597,015 | | Mexican Peso | | 321,907,960 | CLP | | 8/20/07 | | | — | | | (959 | ) |
| 7,962,312 | | Mexican Peso | | 380,200,405 | CLP | | 8/21/07 | | | — | | | (16,717 | ) |
| 2,017,928 | | Mexican Peso | | 96,194,629 | CLP | | 9/14/07 | | | — | | | (4,359 | ) |
| 5,422,023 | | Mexican Peso | | 260,007,686 | CLP | | 9/12/07 | | | — | | | (8,871 | ) |
| 2,329,569 | | New Zealand Dollar | | 69,677,396 | INR | | 7/27/07 | | | — | | | (69,481 | ) |
| | | | | | | | | | | | | | |
| Unrealized gain (loss) on forward exchange contracts | | | | | | | | 560,584 | | | (1,054,984 | ) |
| | | | | | | | | | | | | | |
| Net unrealized gain (loss) on forward exchange contracts | | | | | | | | | | $ | (494,400 | ) |
| | | | | | | | | | | | | | |
| a | In U.S. Dollar unless otherwise indicated. |
Currency Abbreviations
CLP - Chilean Peso
EUR - Euro
INR - Indian Rupee
JPY - Japanese Yen
NZD - New Zealand Dollar
8. CREDIT RISK
The Fund has 19.66% of its portfolio invested in below investment grade and comparable quality unrated high yield securities, which tend to be more sensitive to economic conditions than higher rated securities. The risk of loss due to default by the issuer may be significantly greater for the holders of high yielding securities because such securities are generally unsecured and are often subordinated to other creditors of the issuer.
9. CONCENTRATION OF RISK
Investing in foreign securities may include certain risks and considerations not typically associated with investing in U.S. securities, such as fluctuating currency values and changing local and regional economic, political and social conditions, which may result in greater market volatility. In addition, certain foreign securities may not be as liquid as U.S. securities.
10. REGULATORY MATTERS
As part of various investigations by a number of federal, state, and foreign regulators and governmental entities, including the Securities and Exchange Commission (“SEC”), relating to certain practices in the mutual fund industry, including late trading, market timing and marketing support payments to securities dealers who sell fund shares (“marketing support”), Franklin Resources, Inc. and certain of its subsidiaries (collectively, the “Company”), entered into settlements with certain of those regulators. Specifically, the Company entered into settlements with the SEC, among others, concerning market timing and marketing support.
On June 23, 2006, the SEC approved the proposed plan of distribution for the marketing support settlement, and disbursement of the settlement monies to the designated funds, in accordance with the terms and conditions of that settlement and plan, was completed in September 2006. The Fund did not participate in that Settlement.
TGI-26
Franklin Templeton Variable Insurance Products Trust
Notes to Financial Statements (continued)
Templeton Global Income Securities Fund
10. REGULATORY MATTERS (continued)
The plan of distribution for the market timing settlement is currently under review by the SEC staff. After publication of notice of the plan and a 30-day comment period, the proposed plan of distribution will be submitted to the SEC for approval. Following the SEC’s approval of the plan of distribution, with modifications as appropriate, distribution of the settlement monies will begin in accordance with the terms and conditions of the settlement and plan.
In addition, the Company, as well as most of the mutual funds within Franklin Templeton Investments and certain current or former officers, Company directors, fund directors, and employees, have been named in private lawsuits (styled as shareholder class actions, or as derivative actions on behalf of either the named funds or Franklin Resources, Inc.). The lawsuits relate to the industry practices referenced above, as well as to allegedly excessive commissions and advisory and distribution fees.
The Company and fund management believe that the claims made in each of the private lawsuits referenced above are without merit and intend to defend against them vigorously. The Company cannot predict with certainty the eventual outcome of these lawsuits, nor whether they will have a material negative impact on the Company. If it is determined that the Company bears responsibility for any unlawful or inappropriate conduct that caused losses to the Trust, it is committed to making the Trust or its shareholders whole, as appropriate.
11. NEW ACCOUNTING PRONOUNCEMENTS
In July 2006, the Financial Accounting Standards Board (FASB) issued FASB Interpretation No. 48, “Accounting for Uncertainty in Income Taxes - an Interpretation of FASB Statement No. 109” (“FIN 48”), which clarifies the accounting for uncertainty in tax positions taken or expected to be taken in a tax return. FIN 48 provides guidance on the measurement, recognition, classification and disclosure of tax positions, along with accounting for the related interest and penalties. FIN 48 is effective for fiscal years beginning after December 15, 2006, and is to be applied to all open tax years as of the date of effectiveness. On December 22, 2006, the Securities and Exchange Commission extended the implementation date to no later than the last net asset value calculation in the first semi-annual reporting period in 2007. The Fund is currently evaluating the impact, if any, of applying the various provisions of FIN 48.
In September 2006, FASB issued FASB Statement No. 157, “Fair Value Measurement” (“SFAS 157”), which defines fair value, establishes a framework for measuring fair value, and expands disclosures about fair value measurements. SFAS 157 is effective for fiscal years beginning after November 15, 2007, and interim periods within those fiscal years. The Trust believes the adoption of SFAS 157 will have no material impact on its financial statements.
TGI-27
Franklin Templeton Variable Insurance Products Trust
Templeton Global Income Securities Fund
Report of Independent Registered Public Accounting Firm
To the Board of Trustees and Shareholders of
Franklin Templeton Variable Insurance Products Trust
In our opinion, the accompanying statement of assets and liabilities, including the statement of investments, and the related statements of operations and of changes in net assets and the financial highlights present fairly, in all material respects, the financial position of Templeton Global Income Securities Fund (one of the funds constituting the Franklin Templeton Variable Insurance Products Trust, hereafter referred to as the “Fund”) at December 31, 2006, the results of its operations for the year then ended, the changes in its net assets for each of the two years in the period then ended and the financial highlights for each of the periods presented, in conformity with accounting principles generally accepted in the United States of America. These financial statements and financial highlights (hereafter referred to as “financial statements”) are the responsibility of the Fund’s management; our responsibility is to express an opinion on these financial statements based on our audits. We conducted our audits of these financial statements in accordance with the standards of the Public Company Accounting Oversight Board (United States). Those standards require that we plan and perform the audit to obtain reasonable assurance about whether the financial statements are free of material misstatement. An audit includes examining, on a test basis, evidence supporting the amounts and disclosures in the financial statements, assessing the accounting principles used and significant estimates made by management, and evaluating the overall financial statement presentation. We believe that our audits, which included confirmation of securities at December 31, 2006 by correspondence with the custodian and brokers, provide a reasonable basis for our opinion.
PricewaterhouseCoopers LLP
San Francisco, California
February 16, 2007
TGI-28
Franklin Templeton Variable Insurance Products Trust
Tax Designation (unaudited)
Templeton Global Income Securities Fund
At December 31, 2006, more than 50% of the Fund’s total assets were invested in securities of foreign issuers. In most instances, foreign taxes were withheld from dividends paid to the Fund on these investments. The Fund elects to treat foreign taxes paid as allowed under Section 853 of the Internal Revenue Code. This election will allow shareholders of record in June 2007, to treat their proportionate share of foreign taxes paid by the Fund as having been paid directly by them. Shareholders shall consider these amounts as foreign taxes paid in the tax year in which they receive the Fund distribution.
The foreign tax information will be disclosed in the June 30, 2007, semi-annual report of the Fund.
TGI-29
TEMPLETON GROWTH SECURITIES FUND
We are pleased to bring you Templeton Growth Securities Fund’s annual report for the fiscal year ended December 31, 2006.
Performance Summary as of 12/31/06
Average annual total return of Class 1 shares represents the average annual change in value, assuming reinvestment of dividends and capital gains. Average returns smooth out variations in returns, which can be significant; they are not the same as year-by-year results.
Periods ended 12/31/06
| | | | | | |
| | | 1-Year | | 5-Year | | 10-Year |
Average Annual Total Return | | +22.20% | | +10.91% | | +9.73% |
Total Return Index Comparison for Hypothetical $10,000 Investment (1/1/97–12/31/06)
The graph below shows the change in value of a hypothetical $10,000 investment in the Fund over the indicated period and includes reinvestment of any income or distributions. The Fund’s performance is compared to the performance of the Morgan Stanley Capital International (MSCI) World Index. One cannot invest directly in an index, nor is an index representative of the Fund’s portfolio. Please see Important Notes to Performance Information preceding the Fund Summaries.
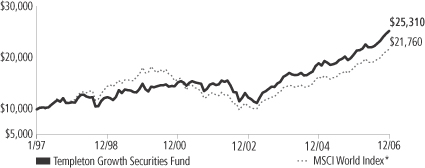
*Source: Standard & Poor’s Micropal. Please see Index Descriptions following the Fund Summaries.
Templeton Growth Securities Fund – Class 1
Performance reflects the Fund’s Class 1 operating expenses, but does not include any contract fees, expenses or sales charges. If they had been included, performance would be lower. These charges and deductions, particularly for variable life policies, can have a significant effect on contract values and insurance benefits. See the contract prospectus for a complete description of these expenses, including sales charges.
Performance data represent past performance, which does not guarantee future results. Investment return and principal value will fluctuate, and you may have a gain or loss when you sell your shares.
Current performance may differ from figures shown.
TG-1
Fund Goal and Main Investments: Templeton Growth Securities Fund seeks long-term capital growth. The Fund normally invests primarily in equity securities of companies located anywhere in the world, including those in the U.S. and in emerging markets.
Performance Overview
You can find the Fund’s one-year total return in the Performance Summary. The Fund outperformed the +20.65% return of the MSCI World Index for the period under review.1
Economic and Market Overview
The global economy grew in 2006, although gross domestic product growth slowed in the U.S. while it accelerated in Europe. The economic drivers remained consistent over the past four years: strong corporate and consumer demand, reasonably low inflation, a tight or improving labor market, and a relatively moderate interest rate environment, despite recent interest rate hikes by many of the world’s central banks. However, the economy also faced headwinds from elevated energy prices, higher global interest rates and a weaker U.S. housing market. These factors dampened investor confidence mid-year, when many equity markets declined before rebounding later in the year.
Despite such challenges, global economic activity was healthy. Strong global liquidity — whether petrodollars, corporate cash, private equity, household savings or central banks’ reserves — continued to search for a home. Largely as a result, bond yield spreads over U.S. Treasuries narrowed, and equity and commodity markets rose in the latter part of the year. The shift from risk aversion to risk tolerance was concurrent with the U.S. Federal Reserve Board’s decisions since June to hold the federal funds target rate at 5.25%, as well as with lower oil prices in the second half of the year.
Narrowing corporate credit spreads globally reflected greater risk tolerance, while abundant cash supplies in the capital markets contributed to record global merger and acquisition activity in 2006. The total value of deals announced as a result of hostile takeovers, private equity buyouts and broad corporate consolidation was $3.8 trillion.2 This figure surpassed the $3.4 trillion mark set in 2000.2 Announced deals from
1. Source: Standard & Poor’s Micropal. One cannot invest directly in an index, nor is an index representative of the Fund’s portfolio. Please see Index Descriptions following the Fund Summaries.
2. Source: “Can M&A’s ‘Best of Times’ Get Better?,” The Wall Street Journal, 1/2/07.
Fund Risks: The Fund’s investments in stocks offer the potential for long-term gains but can be subject to short-term price fluctuation. Foreign investing, especially in emerging markets, involves additional risks including currency fluctuations, economic instability, and social and political developments. By focusing on particular countries or sectors from time to time, the Fund may carry greater risk of adverse developments in a country or sector than a fund that invests in a wide variety of countries or sectors. Because the Fund invests in bonds and other debt obligations, the Fund’s share price and yield will be affected by interest rate movements. Bond prices generally move in the opposite direction from interest rates. Thus, as prices of bonds in the Fund adjust to a rise in interest rates, the Fund’s share price may decline. High yield, lower-rated (junk) bonds generally have greater price swings and higher default risks. The Fund’s prospectus also includes a description of the main investment risks.
TG-2
private equity alone reached a record $700 billion, more than double the record set in 2005 and 20 times greater than a decade ago.3
With this economic backdrop, the non-U.S. equity markets — including emerging markets that remained a major magnet for global fund flows — led global equity markets to end 2006 on a strong note, and all major regions delivered double-digit total returns for the year. Stock market indexes in the U.S. and most European countries reached six-year highs in the fourth quarter, and many emerging market indexes in Asia, Europe and Latin America neared or reached all-time highs.
Investment Strategy
Our investment philosophy is bottom-up, value-oriented and long-term. In choosing investments, we will focus on the market price of a company’s securities relative to our evaluation of the company’s potential long-term earnings, asset value and cash flow. Among factors we may consider are a company’s historical value measures, including price/earnings ratio, profit margins and liquidation value. We do in-depth research to construct a bargain list from which we buy.
Manager’s Discussion
During the reporting period, our stock selection in the consumer discretionary, health care and information technology (IT) sectors contributed to Fund performance relative to the MSCI World Index.4 U.S. media stocks within the consumer discretionary sector such as satellite broadcast service provider The DIRECTV Group, media conglomerate News Corp. and cable operator Comcast were among the best performers. Pharmaceuticals company Merck was a notable performer in the health care sector, while video game company Nintendo and software giant Microsoft led the IT sector. In addition, our overweighting in the consumer discretionary sector and underweighting in the energy sector relative to the benchmark index helped Fund performance.5
3. Source: “TPG tops buy-out league with $101bn,” The Wall Street Journal, 12/27/06.
4. The consumer discretionary sector comprises auto components; automobiles; diversified consumer services; hotels, restaurants and leisure; household durables; Internet and catalog retail; leisure equipment and products; media; and specialty retail in the SOI. The health care sector comprises health care equipment and supplies, health care providers and services, and pharmaceuticals in the SOI. The IT sector comprises computers and peripherals, electronic equipment and instruments, IT services, office electronics, semiconductors and semiconductor equipment, and software in the SOI.
5. The energy sector comprises oil, gas and consumable fuels in the SOI.
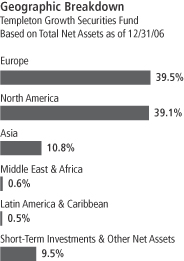
TG-3
On the other hand, our stock selection and underweighted position in the financials sector hurt relative Fund performance the most in the 12 months under review.6 Detractors included Japan’s banking conglomerate Mitsubishi UFJ Financial Group, South Korea’s Kookmin Bank, insurer American International Group (AIG) and Japan’s leading brokerage house Nomura Holdings. Furthermore, our underweighting in the utilities sector had a negative impact on the Fund.7
From a geographic perspective, our holdings in the U.S. and Japan contributed the most to relative Fund performance, while positions in France and Spain detracted. Cash was also a drag on relative performance.
It is important to recognize the effect of currency movements on the Fund’s performance. In general, if the value of the U.S. dollar goes up compared with a foreign currency, an investment traded in that foreign currency will go down in value because it will be worth fewer U.S. dollars. This can have a negative effect on Fund performance. Conversely, when the U.S. dollar weakens in relation to a foreign currency, an investment traded in that foreign currency will increase in value, which can contribute to Fund performance. For the 12 months ended December 31, 2006, the U.S. dollar declined in value relative to most non-U.S. currencies. As a result, the Fund’s performance was positively affected by the portfolio’s significant investment in securities with non-U.S. currency exposure. However, one cannot expect the same result in future periods.
Thank you for your participation in Templeton Growth Securities Fund. We look forward to serving your future investment needs.
6. The financials sector comprises capital markets, commercial banks, diversified financial services, insurance, and real estate management and development in the SOI.
7. The utilities sector comprises electric utilities and multi-utilities in the SOI.
The foregoing information reflects our analysis, opinions and portfolio holdings as of December 31, 2006, the end of the reporting period. The way we implement our main investment strategies and the resulting portfolio holdings may change depending on factors such as market and economic conditions. These opinions may not be relied upon as investment advice or an offer for a particular security. The information is not a complete analysis of every aspect of any market, country, industry, security or the Fund. Statements of fact are from sources considered reliable, but the investment manager makes no representation or warranty as to their completeness or accuracy. Although historical performance is no guarantee of future results, these insights may help you understand our investment management philosophy.
Top 10 Holdings
Templeton Growth Securities Fund
12/31/06
| | |
Company
Sector/Industry,
Country | | % of Total
Net Assets |
| Microsoft Corp. | | 2.2% |
| Software, U.S. | | |
| Tyco International Ltd. | | 2.1% |
| Industrial Conglomerates, U.S. | | |
| News Corp., A | | 2.0% |
| Media, U.S. | | |
| American International Group Inc. | | 1.9% |
| Insurance, U.S. | | |
| Royal Bank of Scotland Group PLC | | 1.9% |
| Commercial Banks, U.K. | | |
| Siemens AG | | 1.9% |
| Industrial Conglomerates, Germany | | |
| Merck & Co. Inc. | | 1.7% |
| Pharmaceuticals, U.S. | | |
| Viacom Inc., B | | 1.7% |
| Media, U.S. | | |
| Pfizer Inc. | | 1.6% |
| Pharmaceuticals, U.S. | | |
| HSBC Holdings PLC | | 1.6% |
| Commercial Banks, U.K. | | |
The dollar value, number of shares or principal amount, and names of portfolio holdings are listed in the Fund’s Statement of Investments (SOI).
TG-4
Templeton Growth Securities Fund – Class 1
Fund Expenses
As an investor in a variable insurance contract (“Contract”) that indirectly provides for investment in an underlying mutual fund, you can incur transaction and/or ongoing expenses at both the Fund level and the Contract level.
| • | | Transaction expenses can include sales charges (loads) on purchases, redemption fees, surrender fees, transfer fees and premium taxes. |
| • | | Ongoing expenses can include management fees, distribution and service (12b-1) fees, contract fees, annual maintenance fees, mortality and expense risk fees and other fees and expenses. All mutual funds and Contracts have some types of ongoing expenses. |
The expenses shown in the table are meant to highlight ongoing expenses at the Fund level only and do not include ongoing expenses at the Contract level, or transaction expenses at either the Fund or Contract level. While the Fund does not have transaction expenses, if the transaction and ongoing expenses at the Contract level were included, the expenses shown would be higher. You should consult your Contract prospectus or disclosure document for more information.
The table shows Fund-level ongoing expenses and can help you understand these expenses and compare them with those of other mutual funds offered through the Contract. The table assumes a $1,000 investment held for the six months indicated. Please refer to the Fund prospectus for additional information on operating expenses.
Actual Fund Expenses
The first line (Actual) of the table provides actual account values and expenses. The “Ending Account Value” is derived from the Fund’s actual return, which includes the effect of ongoing Fund expenses, but does not include the effect of ongoing Contract expenses.
You can estimate the Fund-level expenses you incurred during the period by following these steps. Of course, your account value and expenses will differ from those in this illustration:
| 1. | Divide your account value by $1,000. |
If an account had an $8,600 value, then $8,600 ÷ $1,000 = 8.6.
| 2. | Multiply the result by the number under the heading “Fund-Level Expenses Incurred During Period.” |
If Fund-Level Expenses Incurred During Period were $7.50, then 8.6 x $7.50 = $64.50.
In this illustration, the estimated expenses incurred this period at the Fund level are $64.50.
TG-5
Hypothetical Example for Comparison with Other Mutual Funds
Information in the second line (Hypothetical) of the table can help you compare ongoing expenses of the Fund with those of other mutual funds offered through the Contract. This information may not be used to estimate the actual ending account balance or expenses you incurred during the period. The hypothetical “Ending Account Value” is based on the Fund’s actual expense ratio and an assumed 5% annual rate of return before expenses, which does not represent the Fund’s actual return. The figure under the heading “Fund-Level Expenses Incurred During Period” shows the hypothetical expenses your account would have incurred under this scenario. You can compare this figure with the 5% hypothetical examples that appear in shareholder reports of other funds offered through a Contract.
| | | | | | | | | |
| Class 1 | | Beginning
Account
Value 7/1/06 | | Ending
Account
Value 12/31/06 | | Fund-Level
Expenses Incurred
During Period*
7/1/06–12/31/06 |
Actual | | $ | 1,000 | | $ | 1,145.30 | | $ | 4.11 |
Hypothetical (5% return before expenses) | | $ | 1,000 | | $ | 1,021.37 | | $ | 3.87 |
*Expenses are equal to the annualized expense ratio for the Fund’s Class 1 shares (0.76%), which does not include any ongoing expenses of the Contract for which the Fund is an investment option, multiplied by the average account value over the period, multiplied by 184/365 to reflect the one-half year period.
TG-6
Franklin Templeton Variable Insurance Products Trust
Financial Highlights
Templeton Growth Securities Fund
| | | | | | | | | | | | | | | | | | | | |
| | | Year Ended December 31, | |
| Class 1 | | 2006 | | | 2005 | | | 2004 | | | 2003 | | | 2002 | |
| | | | |
Per share operating performance | | | | | | | | | | | | | | | | | | | | |
(for a share outstanding throughout the year) | | | | | | | | | | | | | | | | | | | | |
Net asset value, beginning of year | | $ | 13.98 | | | $ | 12.98 | | | $ | 11.31 | | | $ | 8.67 | | | $ | 11.09 | |
| | | | |
Income from investment operationsa: | | | | | | | | | | | | | | | | | | | | |
Net investment incomeb | | | 0.29 | | | | 0.24 | | | | 0.21 | | | | 0.17 | | | | 0.17 | |
Net realized and unrealized gains (losses) | | | 2.67 | | | | 0.92 | | | | 1.61 | | | | 2.63 | | | | (2.13 | ) |
| | | | |
Total from investment operations | | | 2.96 | | | | 1.16 | | | | 1.82 | | | | 2.80 | | | | (1.96 | ) |
| | | | |
Less distributions from: | | | | | | | | | | | | | | | | | | | | |
Net investment income | | | (0.23 | ) | | | (0.16 | ) | | | (0.15 | ) | | | (0.16 | ) | | | (0.24 | ) |
Net realized gains | | | (0.55 | ) | | | — | | | | — | | | | — | | | | (0.22 | ) |
| | | | |
Total distributions | | | (0.78 | ) | | | (0.16 | ) | | | (0.15 | ) | | | (0.16 | ) | | | (0.46 | ) |
| | | | |
Net asset value, end of year | | $ | 16.16 | | | $ | 13.98 | | | $ | 12.98 | | | $ | 11.31 | | | $ | 8.67 | |
| | | | |
| | | | | |
Total returnc | | | 22.20% | | | | 9.06% | | | | 16.25% | | | | 32.62% | | | | (18.32)% | |
Ratios/supplemental data | | | | | | | | | | | | | | | | | | | | |
Net assets, end of year (000’s) | | $ | 413,871 | | | $ | 779,347 | | | $ | 800,118 | | | $ | 769,339 | | | $ | 665,537 | |
Ratios to average net assets: | | | | | | | | | | | | | | | | | | | | |
Expenses | | | 0.78% | d | | | 0.82% | d | | | 0.86% | d | | | 0.88% | | | | 0.87% | |
Net investment income | | | 1.93% | | | | 1.81% | | | | 1.75% | | | | 1.74% | | | | 1.69% | |
Portfolio turnover rate | | | 20.29% | e | | | 22.16% | | | | 19.13% | | | | 37.43% | | | | 30.67% | |
| a | The amount shown for a share outstanding throughout the period may not correlate with the Statement of Operations for the period due to the timing of sales and repurchase of the Fund shares in relation to income earned and/or fluctuating market value of the investments of the Fund. |
| b | Based on average daily shares outstanding. |
| c | Total return does not include any fees, charges or expenses imposed by the variable annuity and life insurance contracts for which the Franklin Templeton Variable Insurance Products Trust serves as an underlying investment vehicle. |
| d | Benefit of expense reduction rounds to less than 0.01%. |
| e | Excludes the value of portfolio securities delivered as a result of a redemption in-kind. See Note 8. |
The accompanying notes are an integral part of these financial statements.
TG-7
Franklin Templeton Variable Insurance Products Trust
Financial Highlights (continued)
Templeton Growth Securities Fund
| | | | | | | | | | | | | | | | | | | | |
| | | Year Ended December 31, | |
| Class 2 | | 2006 | | | 2005 | | | 2004 | | | 2003 | | | 2002 | |
| | | | |
Per share operating performance | | | | | | | | | | | | | | | | | | | | |
(for a share outstanding throughout the year) | | | | | | | | | | | | | | | | | | | | |
Net asset value, beginning of year | | $ | 13.81 | | | $ | 12.83 | | | $ | 11.19 | | | $ | 8.59 | | | $ | 11.01 | |
| | | | |
Income from investment operationsa: | | | | | | | | | | | | | | | | | | | | |
Net investment incomeb | | | 0.24 | | | | 0.20 | | | | 0.17 | | | | 0.13 | | | | 0.13 | |
Net realized and unrealized gains (losses) | | | 2.63 | | | | 0.93 | | | | 1.61 | | | | 2.62 | | | | (2.10 | ) |
| | | | |
Total from investment operations | | | 2.87 | | | | 1.13 | | | | 1.78 | | | | 2.75 | | | | (1.97 | ) |
| | | | |
Less distributions from: | | | | | | | | | | | | | | | | | | | | |
Net investment income | | | (0.20 | ) | | | (0.15 | ) | | | (0.14 | ) | | | (0.15 | ) | | | (0.23 | ) |
Net realized gains | | | (0.55 | ) | | | — | | | | — | | | | — | | | | (0.22 | ) |
| | | | |
Total distributions | | | (0.75 | ) | | | (0.15 | ) | | | (0.14 | ) | | | (0.15 | ) | | | (0.45 | ) |
| | | | |
Net asset value, end of year | | $ | 15.93 | | | $ | 13.81 | | | $ | 12.83 | | | $ | 11.19 | | | $ | 8.59 | |
| | | | |
| | | | | |
Total returnc | | | 21.81% | | | | 8.86% | | | | 16.03% | | | | 32.13% | | | | (18.49)% | |
Ratios/supplemental data | | | | | | | | | | | | | | | | | | | | |
Net assets, end of year (000’s) | | $ | 2,821,818 | | | $ | 1,912,825 | | | $ | 1,189,112 | | | $ | 511,659 | | | $ | 190,054 | |
Ratios to average net assets: | | | | | | | | | | | | | | | | | | | | |
Expenses | | | 1.03% | d | | | 1.07% | d | | | 1.11% | d | | | 1.13% | | | | 1.12% | |
Net investment income | | | 1.68% | | | | 1.56% | | | | 1.50% | | | | 1.49% | | | | 1.44% | |
Portfolio turnover rate | | | 20.29% | e | | | 22.16% | | | | 19.13% | | | | 37.43% | | | | 30.67% | |
| a | The amount shown for a share outstanding throughout the period may not correlate with the Statement of Operations for the period due to the timing of sales and repurchase of the Fund shares in relation to income earned and/or fluctuating market value of the investments of the Fund. |
| b | Based on average daily shares outstanding. |
| c | Total return does not include any fees, charges or expenses imposed by the variable annuity and life insurance contracts for which the Franklin Templeton Variable Insurance Products Trust serves as an underlying investment vehicle. |
| d | Benefit of expense reduction rounds to less than 0.01%. |
| e | Excludes the value of portfolio securities delivered as a result of a redemption in-kind. See Note 8. |
The accompanying notes are an integral part of these financial statements.
TG-8
Franklin Templeton Variable Insurance Products Trust
Statement of Investments, December 31, 2006
| | | | | | | |
| Templeton Growth Securities Fund | | Country | | Shares | | Value |
Common Stocks 90.5% | | | | | | | |
Aerospace & Defense 1.6% | | | | | | | |
BAE Systems PLC | | United Kingdom | | 1,366,792 | | $ | 11,395,867 |
aBAE Systems PLC, 144A | | United Kingdom | | 364 | | | 3,035 |
Raytheon Co. | | United States | | 552,687 | | | 29,181,874 |
bRolls-Royce Group PLC | | United Kingdom | | 1,349,842 | | | 11,836,105 |
bRolls-Royce Group PLC, B | | United Kingdom | | 49,539,201 | | | 98,470 |
| | | | | | | |
| | | | | | | 52,515,351 |
| | | | | | | |
Air Freight & Logistics 1.0% | | | | | | | |
Deutsche Post AG | | Germany | | 1,080,888 | | | 32,674,319 |
| | | | | | | |
Auto Components 0.5% | | | | | | | |
Lear Corp. | | United States | | 240,108 | | | 7,090,389 |
Valeo SA | | France | | 202,767 | | | 8,439,401 |
| | | | | | | |
| | | | | | | 15,529,790 |
| | | | | | | |
Automobiles 3.3% | | | | | | | |
Bayerische Motoren Werke AG | | Germany | | 859,457 | | | 49,465,340 |
Harley-Davidson Inc. | | United States | | 299,480 | | | 21,104,356 |
Peugeot SA | | France | | 529,892 | | | 35,114,092 |
| | | | | | | |
| | | | | | | 105,683,788 |
| | | | | | | |
Building Products 1.2% | | | | | | | |
American Standard Cos. Inc. | | United States | | 394,750 | | | 18,099,287 |
Assa Abloy AB, B | | Sweden | | 886,200 | | | 19,273,091 |
| | | | | | | |
| | | | | | | 37,372,378 |
| | | | | | | |
Capital Markets 1.9% | | | | | | | |
The Bank of New York Co. Inc. | | United States | | 831,996 | | | 32,755,682 |
Nomura Holdings Inc. | | Japan | | 433,174 | | | 8,169,661 |
UBS AG | | Switzerland | | 364,684 | | | 22,161,463 |
| | | | | | | |
| | | | | | | 63,086,806 |
| | | | | | | |
Commercial Banks 8.0% | | | | | | | |
Banco Santander Central Hispano SA | | Spain | | 605,923 | | | 11,309,859 |
Hana Financial Group Inc. | | South Korea | | 161,640 | | | 8,499,135 |
HSBC Holdings PLC | | United Kingdom | | 2,755,409 | | | 50,509,545 |
Kookmin Bank | | South Korea | | 349,400 | | | 28,139,849 |
Mitsubishi UFJ Financial Group Inc. | | Japan | | 3,886 | | | 47,989,415 |
Royal Bank of Scotland Group PLC | | United Kingdom | | 1,560,360 | | | 60,900,713 |
cShinsei Bank Ltd. | | Japan | | 3,431,000 | | | 20,176,419 |
UniCredito Italiano SpA | | Italy | | 3,502,597 | | | 30,700,724 |
| | | | | | | |
| | | | | | | 258,225,659 |
| | | | | | | |
Commercial Services & Supplies 0.2% | | | | | | | |
Rentokil Initial PLC | | United Kingdom | | 1,889,475 | | | 6,142,420 |
| | | | | | | |
Computers & Peripherals 1.4% | | | | | | | |
Seagate Technology | | United States | | 1,741,718 | | | 46,155,527 |
| | | | | | | |
Diversified Consumer Services 0.8% | | | | | | | |
H&R Block Inc. | | United States | | 1,080,479 | | | 24,894,236 |
| | | | | | | |
Diversified Financial Services 0.6% | | | | | | | |
ING Groep NV | | Netherlands | | 415,250 | | | 18,412,383 |
| | | | | | | |
Diversified Telecommunication Services 4.3% | | | | | | | |
BCE Inc. | | Canada | | 610,643 | | | 16,455,001 |
Belgacom | | Belgium | | 233,162 | | | 10,270,801 |
TG-9
Franklin Templeton Variable Insurance Products Trust
Statement of Investments, December 31, 2006 (continued)
| | | | | | | |
| Templeton Growth Securities Fund | | Country | | Shares | | Value |
Common Stocks (continued) | | | | | | | |
Diversified Telecommunication Services (continued) | | | | | | | |
France Telecom SA | | France | | 1,428,670 | | $ | 39,509,935 |
KT Corp., ADR | | South Korea | | 862,201 | | | 21,856,795 |
Singapore Telecommunications Ltd. | | Singapore | | 5,541,000 | | | 11,852,020 |
Telefonos de Mexico SA de CV, L, ADR | | Mexico | | 604,945 | | | 17,095,746 |
Telenor ASA | | Norway | | 1,194,827 | | | 22,466,718 |
| | | | | | | |
| | | | | | | 139,507,016 |
| | | | | | | |
Electric Utilities 0.4% | | | | | | | |
Hong Kong Electric Holdings Ltd. | | Hong Kong | | 2,443,681 | | | 11,968,434 |
| | | | | | | |
Electronic Equipment & Instruments 0.7% | | | | | | | |
bCelestica Inc. | | Canada | | 343,812 | | | 2,685,172 |
bFlextronics International Ltd. | | Singapore | | 641,110 | | | 7,359,943 |
Hitachi Ltd. | | Japan | | 1,996,278 | | | 12,443,720 |
| | | | | | | |
| | | | | | | 22,488,835 |
| | | | | | | |
Food Products 2.2% | | | | | | | |
Nestle SA | | Switzerland | | 112,864 | | | 40,105,135 |
Unilever NV | | Netherlands | | 1,157,441 | | | 31,627,114 |
| | | | | | | |
| | | | | | | 71,732,249 |
| | | | | | | |
Health Care Equipment & Supplies 1.4% | | | | | | | |
bBoston Scientific Corp. | | United States | | 2,707,060 | | | 46,507,291 |
Olympus Corp. | | Japan | | 800 | | | 25,135 |
| | | | | | | |
| | | | | | | 46,532,426 |
| | | | | | | |
Health Care Providers & Services 0.6% | | | | | | | |
bTenet Healthcare Corp. | | United States | | 2,881,768 | | | 20,085,923 |
| | | | | | | |
Hotels, Restaurants & Leisure 1.9% | | | | | | | |
Accor SA | | France | | 369,590 | | | 28,638,395 |
Compass Group PLC | | United Kingdom | | 5,578,849 | | | 31,683,480 |
| | | | | | | |
| | | | | | | 60,321,875 |
| | | | | | | |
Household Durables 1.4% | | | | | | | |
Koninklijke Philips Electronics NV | | Netherlands | | 912,198 | | | 34,402,477 |
Sony Corp. | | Japan | | 263,169 | | | 11,275,355 |
| | | | | | | |
| | | | | | | 45,677,832 |
| | | | | | | |
Industrial Conglomerates 4.2% | | | | | | | |
Siemens AG | | Germany | | 602,004 | | | 60,077,456 |
Smiths Group PLC | | United Kingdom | | 429,459 | | | 8,338,822 |
Tyco International Ltd. | | United States | | 2,268,472 | | | 68,961,549 |
| | | | | | | |
| | | | | | | 137,377,827 |
| | | | | | | |
Insurance 7.6% | | | | | | | |
ACE Ltd. | | Bermuda | | 253,274 | | | 15,340,806 |
American International Group Inc. | | United States | | 860,005 | | | 61,627,958 |
Aviva PLC | | United Kingdom | | 2,227,806 | | | 35,862,409 |
Muenchener Rueckversicherungs-Gesellschaft AG | | Germany | | 175,630 | | | 30,371,088 |
Swiss Reinsurance Co. | | Switzerland | | 367,341 | | | 31,230,994 |
Torchmark Corp. | | United States | | 253,277 | | | 16,148,942 |
Willis Group Holdings Ltd. | | United States | | 755,250 | | | 29,990,977 |
XL Capital Ltd., A | | Bermuda | | 338,433 | | | 24,373,945 |
| | | | | | | |
| | | | | | | 244,947,119 |
| | | | | | | |
TG-10
Franklin Templeton Variable Insurance Products Trust
Statement of Investments, December 31, 2006 (continued)
| | | | | | | |
| Templeton Growth Securities Fund | | Country | | Shares | | Value |
Common Stocks (continued) | | | | | | | |
Internet & Catalog Retail 0.6% | | | | | | | |
bExpedia Inc. | | United States | | 864,020 | | $ | 18,127,140 |
| | | | | | | |
IT Services 1.9% | | | | | | | |
Accenture Ltd., A | | United States | | 969,457 | | | 35,802,047 |
Electronic Data Systems Corp. | | United States | | 988,270 | | | 27,226,839 |
| | | | | | | |
| | | | | | | 63,028,886 |
| | | | | | | |
Leisure Equipment & Products 2.0% | | | | | | | |
Eastman Kodak Co. | | United States | | 1,484,649 | | | 38,303,944 |
FUJIFILM Holdings Corp. | | Japan | | 643,837 | | | 26,449,053 |
Mattel Inc. | | United States | | 7,329 | | | 166,075 |
| | | | | | | |
| | | | | | | 64,919,072 |
| | | | | | | |
Media 12.0% | | | | | | | |
British Sky Broadcasting Group PLC | | United Kingdom | | 2,318,893 | | | 23,705,083 |
bComcast Corp., A | | United States | | 862,068 | | | 36,103,408 |
bThe DIRECTV Group Inc. | | United States | | 1,645,844 | | | 41,047,349 |
bInterpublic Group of Cos. Inc. | | United States | | 2,797,188 | | | 34,237,581 |
Mediaset SpA | | Italy | | 1,237,070 | | | 14,680,618 |
News Corp., A | | United States | | 3,066,692 | | | 65,872,544 |
Pearson PLC | | United Kingdom | | 1,800,148 | | | 27,197,840 |
Reed Elsevier NV | | Netherlands | | 2,518,906 | | | 42,960,056 |
Time Warner Inc. | | United States | | 2,169,122 | | | 47,243,477 |
bViacom Inc., B | | United States | | 1,325,938 | | | 54,403,236 |
| | | | | | | |
| | | | | | | 387,451,192 |
| | | | | | | |
Multi-Utilities 1.5% | | | | | | | |
DTE Energy Co. | | United States | | 514,252 | | | 24,894,940 |
National Grid PLC | | United Kingdom | | 1,745,761 | | | 25,213,729 |
| | | | | | | |
| | | | | | | 50,108,669 |
| | | | | | | |
Office Electronics 0.8% | | | | | | | |
bKonica Minolta Holdings Ltd. | | Japan | | 1,733,800 | | | 24,469,979 |
| | | | | | | |
Oil, Gas & Consumable Fuels 5.0% | | | | | | | |
BP PLC | | United Kingdom | | 2,926,978 | | | 32,529,366 |
El Paso Corp. | | United States | | 2,309,384 | | | 35,287,387 |
Eni SpA | | Italy | | 647,787 | | | 21,788,233 |
Repsol YPF SA | | Spain | | 901,858 | | | 31,191,037 |
Royal Dutch Shell PLC, B | | United Kingdom | | 1,145,483 | | | 40,154,290 |
| | | | | | | |
| | | | | | | 160,950,313 |
| | | | | | | |
Paper & Forest Products 3.8% | | | | | | | |
International Paper Co. | | United States | | 855,873 | | | 29,185,269 |
Sappi Ltd. | | South Africa | | 1,108,320 | | | 18,580,717 |
Stora Enso OYJ, R | | Finland | | 1,589,082 | | | 25,172,011 |
Svenska Cellulosa AB, B | | Sweden | | 452,391 | | | 23,606,052 |
UPM-Kymmene OYJ | | Finland | | 1,087,262 | | | 27,441,792 |
| | | | | | | |
| | | | | | | 123,985,841 |
| | | | | | | |
Pharmaceuticals 8.0% | | | | | | | |
Abbott Laboratories | | United States | | 266,915 | | | 13,001,430 |
Bristol-Myers Squibb Co. | | United States | | 1,093,151 | | | 28,771,734 |
GlaxoSmithKline PLC | | United Kingdom | | 1,604,908 | | | 42,241,534 |
Merck & Co. Inc. | | United States | | 1,275,321 | | | 55,603,996 |
Novartis AG | | Switzerland | | 351,524 | | | 20,265,529 |
TG-11
Franklin Templeton Variable Insurance Products Trust
Statement of Investments, December 31, 2006 (continued)
| | | | | | | |
| Templeton Growth Securities Fund | | Country | | Shares | | Value |
Common Stocks (continued) | | | | | | | |
Pharmaceuticals (continued) | | | | | | | |
Pfizer Inc. | | United States | | 1,988,323 | | $ | 51,497,566 |
Sanofi-Aventis | | France | | 278,917 | | | 25,754,496 |
Takeda Pharmaceutical Co. Ltd. | | Japan | | 304,236 | | | 20,881,322 |
| | | | | | | |
| | | | | | | 258,017,607 |
| | | | | | | |
Real Estate Management & Development 0.9% | | | | | | | |
Cheung Kong (Holdings) Ltd. | | Hong Kong | | 1,199,833 | | | 14,768,196 |
Swire Pacific Ltd., A | | Hong Kong | | 1,408,516 | | | 15,127,811 |
| | | | | | | |
| | | | | | | 29,896,007 |
| | | | | | | |
Semiconductors & Semiconductor Equipment 1.6% | | | | | | | |
bInfineon Technologies AG | | Germany | | 2,227,809 | | | 31,349,132 |
Samsung Electronics Co. Ltd. | | South Korea | | 33,440 | | | 22,041,634 |
| | | | | | | |
| | | | | | | 53,390,766 |
| | | | | | | |
Software 4.2% | | | | | | | |
bCadence Design Systems Inc. | | United States | | 789,718 | | | 14,143,849 |
Microsoft Corp. | | United States | | 2,376,979 | | | 70,976,593 |
Nintendo Co. Ltd. | | Japan | | 39,297 | | | 10,201,011 |
bOracle Corp. | | United States | | 2,348,500 | | | 40,253,290 |
| | | | | | | |
| | | | | | | 135,574,743 |
| | | | | | | |
Specialty Retail 0.7% | | | | | | | |
bChico’s FAS Inc. | | United States | | 1,053,390 | | | 21,794,639 |
| | | | | | | |
Wireless Telecommunication Services 2.3% | | | | | | | |
Advanced Info Service Public Co. Ltd., fgn. | | Thailand | | 1,708,800 | | | 3,759,842 |
SK Telecom Co. Ltd. | | South Korea | | 80,853 | | | 19,343,863 |
SK Telecom Co. Ltd., ADR | | South Korea | | 108,491 | | | 2,872,842 |
Vodafone Group PLC | | United Kingdom | | 17,441,861 | | | 48,332,530 |
| | | | | | | |
| | | | | | | 74,309,077 |
| | | | | | | |
Total Common Stocks (Cost $2,254,499,848) | | | | | | | 2,927,356,124 |
| | | | | | | |
TG-12
Franklin Templeton Variable Insurance Products Trust
Statement of Investments, December 31, 2006 (continued)
| | | | | | | | |
| Templeton Growth Securities Fund | | | | Principal
Amount | | Value |
Short Term Investments (Cost $307,272,235) 9.5% | | | | | | | | |
U.S. Government and Agency Securities 9.5% | | | | | | | | |
dFederal Home Loan Bank, 1/02/07 | | | | $ | 49,518,000 | | $ | 49,518,000 |
dFHLMC, 1/05/07 | | | | | 25,000,000 | | | 24,992,900 |
dFHLMC, 1/23/07 | | | | | 35,000,000 | | | 34,900,530 |
dFHLMC, 2/16/07 | | | | | 25,000,000 | | | 24,844,025 |
dFHLMC, 3/30/07 | | | | | 15,000,000 | | | 14,817,435 |
dFHLMC, 4/30/07 | | | | | 75,000,000 | | | 73,760,550 |
dFNMA, 1/19/07 | | | | | 40,000,000 | | | 39,909,080 |
dFNMA, 1/22/07 | | | | | 30,000,000 | | | 29,919,000 |
dFNMA, 5/08/07 | | | | | 15,000,000 | | | 14,736,195 |
| | | | | | | | |
| | | | | | | | 307,397,715 |
| | | | | | | | |
Total Investments (Cost $2,561,772,083) 100.0% | | | | | | | | 3,234,753,839 |
Other Assets, less Liabilities 0.0%e | | | | | | | | 935,584 |
| | | | | | | | |
Net Assets 100.0% | | | | | | | $ | 3,235,689,423 |
| | | | | | | | |
Selected Portfolio Abbreviations
ADR - American Depository Receipt
FHLMC - Federal Home Loan Mortgage Corp.
FNMA - Federal National Mortgage Association
| a | Security was purchased pursuant to Rule 144A under the Securities Act of 1933 and may be sold in transactions exempt from registration only to qualified institutional buyers or in a public offering registered under the Securities Act of 1933. These securities have been deemed liquid under guidelines approved by the Trust’s Board of Trustees. At December 31, 2006, the value of this security was $3,035, representing less than 0.1% of net assets. |
| b | Non-income producing for the twelve months ended December 31, 2006. |
| c | See Note 1(c) regarding securities purchased on a when-issued or delayed delivery basis. |
| d | The security is traded on a discount basis with no stated coupon rate. |
| e | Rounds to less than 0.1% of net assets. |
The accompanying notes are an integral part of these financial statements.
TG-13
Franklin Templeton Variable Insurance Products Trust
Financial Statements
Statement of Assets and Liabilities
December 31, 2006
| | | |
| | | Templeton
Growth
Securities Fund |
Assets: | | | |
Investments in securities: | | | |
Cost | | $ | 2,561,772,083 |
| | | |
Value | | $ | 3,234,753,839 |
Cash | | | 135,731 |
Receivables: | | | |
Capital shares sold | | | 4,296,706 |
Dividends | | | 4,739,415 |
| | | |
Total assets | | | 3,243,925,691 |
| | | |
Liabilities: | | | |
Payables: | | | |
Investment securities purchased | | | 1,373,581 |
Capital shares redeemed | | | 3,306,086 |
Affiliates | | | 3,118,503 |
Accrued expenses and other liabilities | | | 438,098 |
| | | |
Total liabilities | | | 8,236,268 |
| | | |
Net assets, at value | | $ | 3,235,689,423 |
| | | |
Net assets consist of: | | | |
Paid-in capital | | $ | 2,363,086,960 |
Undistributed net investment income | | | 48,319,480 |
Net unrealized appreciation (depreciation) | | | 673,051,568 |
Accumulated net realized gain (loss) | | | 151,231,415 |
| | | |
Net assets, at value | | $ | 3,235,689,423 |
| | | |
Class 1: | | | |
Net assets, at value | | $ | 413,871,386 |
| | | |
Shares outstanding | | | 25,617,393 |
| | | |
Net asset value and maximum offering price per share | | $ | 16.16 |
| | | |
Class 2: | | | |
Net assets, at value | | $ | 2,821,818,037 |
| | | |
Shares outstanding | | | 177,114,983 |
| | | |
Net asset value and maximum offering price per share | | $ | 15.93 |
| | | |
The accompanying notes are an integral part of these financial statements.
TG-14
Franklin Templeton Variable Insurance Products Trust
Financial Statements (continued)
Statement of Operations
for the year ended December 31, 2006
| | | | |
| | | Templeton
Growth
Securities Fund | |
Investment income: | | | | |
Dividends (net of foreign taxes of $3,681,980) | | $ | 65,878,317 | |
Interest | | | 10,165,600 | |
Other income (Note 9) | | | 141,632 | |
| | | | |
Total investment income | | | 76,185,549 | |
| | | | |
Expenses: | | | | |
Management fees (Note 3a) | | | 20,781,515 | |
Distribution fees - Class 2 (Note 3c) | | | 5,676,318 | |
Custodian fees (Note 4) | | | 547,571 | |
Reports to shareholders | | | 401,006 | |
Professional fees | | | 103,461 | |
Trustees’ fees and expenses | | | 13,532 | |
Other | | | 65,105 | |
| | | | |
Total expenses | | | 27,588,508 | |
Expense reductions (Note 4) | | | (18,313 | ) |
| | | | |
Net expenses | | | 27,570,195 | |
| | | | |
Net investment income | | | 48,615,354 | |
| | | | |
Realized and unrealized gains (losses): | | | | |
Net realized gain (loss) from: | | | | |
Investments (Includes gains from a redemption in-kind of $68,398,083) (Note 8) | | | 220,549,333 | |
Foreign currency transactions | | | (42,606 | ) |
| | | | |
Net realized gain (loss) | | | 220,506,727 | |
| | | | |
Net change in unrealized appreciation (depreciation) on: | | | | |
Investments | | | 310,920,742 | |
Translation of assets and liabilities denominated in foreign currencies | | | 142,828 | |
| | | | |
Net change in unrealized appreciation (depreciation) | | | 311,063,570 | |
| | | | |
Net realized and unrealized gain (loss) | | | 531,570,297 | |
| | | | |
Net increase (decrease) in net assets resulting from operations | | $ | 580,185,651 | |
| | | | |
The accompanying notes are an integral part of these financial statements.
TG-15
Franklin Templeton Variable Insurance Products Trust
Financial Statements (continued)
Statements of Changes in Net Assets
| | | | | | | | |
| | | Templeton Growth
Securities Fund | |
| | | Year Ended December 31, | |
| | | 2006 | | | 2005 | |
| | | | |
Increase (decrease) in net assets: | | | | | | | | |
Operations: | | | | | | | | |
Net investment income | | $ | 48,615,354 | | | $ | 37,640,984 | |
Net realized gain (loss) from investments and foreign currency transactions | | | 220,506,727 | | | | 106,724,452 | |
Net change in unrealized appreciation (depreciation) on investments and translation of assets and liabilities denominated in foreign currencies | | | 311,063,570 | | | | 64,432,128 | |
| | | | |
Net increase (decrease) in net assets resulting from operations | | | 580,185,651 | | | | 208,797,564 | |
| | | | |
Distributions to shareholders from: | | | | | | | | |
Net investment income: | | | | | | | | |
Class 1 | | | (6,338,891 | ) | | | (9,572,633 | ) |
Class 2 | | | (29,026,054 | ) | | | (16,496,404 | ) |
Net realized gains: | | | | | | | | |
Class 1 | | | (15,619,027 | ) | | | — | |
Class 2 | | | (80,864,543 | ) | | | — | |
| | | | |
Total distributions to shareholders | | | (131,848,515 | ) | | | (26,069,037 | ) |
| | | | |
Capital share transactions: (Note 2) | | | | | | | | |
Class 1 | | | (460,756,992 | ) | | | (78,704,685 | ) |
Class 2 | | | 555,937,357 | | | | 598,918,011 | |
| | | | |
Total capital share transactions | | | 95,180,365 | | | | 520,213,326 | |
| | | | |
Net increase (decrease) in net assets | | | 543,517,501 | | | | 702,941,853 | |
Net assets: | | | | | | | | |
Beginning of year | | | 2,692,171,922 | | | | 1,989,230,069 | |
| | | | |
End of year | | $ | 3,235,689,423 | | | $ | 2,692,171,922 | |
| | | | |
Undistributed net investment income included in net assets: | | | | | | | | |
End of year | | $ | 48,319,480 | | | $ | 35,116,077 | |
| | | | |
The accompanying notes are an integral part of these financial statements.
TG-16
Franklin Templeton Variable Insurance Products Trust
Notes to Financial Statements
Templeton Growth Securities Fund
1. ORGANIZATION AND SIGNIFICANT ACCOUNTING POLICIES
Franklin Templeton Variable Insurance Products Trust (the Trust) is registered under the Investment Company Act of 1940, as amended, (the 1940 Act) as an open-end investment company, consisting of twenty-two separate funds. The Templeton Growth Securities Fund (the Fund) included in this report is diversified. The financial statements of the remaining funds in the Trust are presented separately. Shares of the Fund are sold only to insurance company separate accounts to fund the benefits of variable life insurance policies or variable annuity contracts. The Fund offers two classes of shares: Class 1 and Class 2. Each class of shares differs by its distribution fees, voting rights on matters affecting a single class and its exchange privilege.
The following summarizes the Fund’s significant accounting policies.
a. Security Valuation
Securities listed on a securities exchange or on the NASDAQ National Market System are valued at the last quoted sale price or the official closing price of the day, respectively. Over-the-counter securities and listed securities for which there is no reported sale are valued within the range of the most recent quoted bid and ask prices. Securities that trade in multiple markets or on multiple exchanges are valued according to the broadest and most representative market.
Government securities generally trade in the over-the-counter market rather than on a securities exchange. The Trust may utilize independent pricing services, quotations from bond dealers, and information with respect to bond and note transactions, to assist in determining a current market value for each security. The Trust’s pricing services may use valuation models or matrix pricing which considers information with respect to comparable bond and note transactions, quotations from bond dealers, or by reference to other securities that are considered comparable in such characteristics as rating, interest rate and maturity date, option adjusted spread models, prepayment projections, interest rate spreads and yield curves, to determine current value.
Foreign securities are valued as of the close of trading on the foreign stock exchange on which the security is primarily traded, or the NYSE, whichever is earlier. If no sale is reported at that time, the foreign security will be valued within the range of the most recent quoted bid and ask prices. The value is then converted into its U.S. dollar equivalent at the foreign exchange rate in effect at the close of the NYSE on the day that the value of the foreign security is determined.
The Trust has procedures to determine the fair value of individual securities and other assets for which market prices are not readily available or which may not be reliably priced. Methods for valuing these securities may include: fundamental analysis, matrix pricing, discounts from market prices of similar securities, or discounts applied due to the nature and duration of restrictions on the disposition of the securities. Due to the inherent uncertainty of valuations of such securities, the fair values may differ significantly from the values that would have been used had a ready market for such investments existed. Occasionally, events occur between the time at which trading in a security is completed and the close of the NYSE that might call into question the availability (including the reliability) of the value of a portfolio security held by the Fund. The investment manager monitors price movements following the close of trading in foreign stock markets through a series of country specific market proxies (such as baskets of American Depository Receipts, futures contracts and exchange traded funds). These price movements are measured against established trigger thresholds for each specific market proxy to assist in determining if an event has occurred. If such an event occurs, the securities may be valued using fair value procedures, which may include the use of independent pricing services. All security valuation procedures are approved by the Trust’s Board of Trustees.
b. Foreign Currency Translation
Portfolio securities and other assets and liabilities denominated in foreign currencies are translated into U.S. dollars based on the exchange rate of such currencies against U.S. dollars on the date of valuation. Purchases and sales of securities, income and expense items denominated in foreign currencies are translated into U.S. dollars at the exchange rate in effect on the transaction date. Occasionally, events may impact the availability or reliability of foreign exchange rates used to convert the U.S. dollar equivalent value. If such an event occurs, the foreign exchange rate will be valued at fair value using procedures established and approved by the Trust’s Board of Trustees.
TG-17
Franklin Templeton Variable Insurance Products Trust
Notes to Financial Statements (continued)
Templeton Growth Securities Fund
1. ORGANIZATION AND SIGNIFICANT ACCOUNTING POLICIES (continued)
b. Foreign Currency Translation (continued)
The Fund does not separately report the effect of changes in foreign exchange rates from changes in market prices on securities held. Such changes are included in net realized and unrealized gain or loss from investments on the Statement of Operations.
Realized foreign exchange gains or losses arise from sales of foreign currencies, currency gains or losses realized between the trade and settlement dates on securities transactions and the difference between the recorded amounts of dividends, interest, and foreign withholding taxes and the U.S. dollar equivalent of the amounts actually received or paid. Net unrealized foreign exchange gains and losses arise from changes in foreign exchange rates on foreign denominated assets and liabilities other than investments in securities held at the end of the reporting period.
c. Securities Purchased on a When-Issued or Delayed Delivery Basis
The Fund may purchase securities on a when-issued or delayed delivery basis, with payment and delivery scheduled for a future date. These transactions are subject to market fluctuations and are subject to the risk that the value at delivery may be more or less than the trade date purchase price. Although the Fund will generally purchase these securities with the intention of holding the securities, it may sell the securities before the settlement date. Sufficient assets have been segregated for these securities.
d. Foreign Currency Contracts
When the Fund purchases or sells foreign securities it may enter into foreign exchange contracts to minimize foreign exchange risk from the trade date to the settlement date of the transactions. A foreign exchange contract is an agreement between two parties to exchange different currencies at an agreed upon exchange rate on a specified date. Realized and unrealized gains and losses on these contracts are included in the Statement of Operations.
The risks of these contracts include movement in the values of the foreign currencies relative to the U.S. dollar and the possible inability of the counterparties to fulfill their obligations under the contracts, which may be in excess of the amount reflected in the Statement of Assets and Liabilities.
e. Income Taxes
No provision has been made for U.S. income taxes because the Fund intends to qualify as a regulated investment company under the Internal Revenue Code and to distribute to shareholders substantially all of its taxable income and net realized gains.
Foreign securities held by the Fund may be subject to foreign taxation on dividend income received. Foreign taxes, if any, are recorded based on the tax regulations and rates that exist in the foreign markets in which the Fund invests.
f. Security Transactions, Investment Income, Expenses and Distributions
Security transactions are accounted for on trade date. Realized gains and losses on security transactions are determined on a specific identification basis. Interest income and estimated expenses are accrued daily. Amortization of premium and accretion of discount on debt securities are included in interest income. Dividend income is recorded on the ex-dividend date except that certain dividends from foreign securities are recognized as soon as the Fund is notified of the ex-dividend date. Distributions to shareholders are recorded on the ex-dividend date and are determined according to income tax regulations (tax basis). Distributable earnings determined on a tax basis may differ from earnings recorded in accordance with accounting principles generally accepted in the United States. These differences may be permanent or temporary. Permanent differences are reclassified among capital accounts to reflect their tax character. These reclassifications have no impact on net assets or the results of operations. Temporary differences are not reclassified, as they may reverse in subsequent periods.
TG-18
Franklin Templeton Variable Insurance Products Trust
Notes to Financial Statements (continued)
Templeton Growth Securities Fund
1. ORGANIZATION AND SIGNIFICANT ACCOUNTING POLICIES (continued)
f. Security Transactions, Investment Income, Expenses and Distributions (continued)
Common expenses incurred by the Trust are allocated among the funds based on the ratio of net assets of each fund to the combined net assets of the Trust. Fund specific expenses are charged directly to the fund that incurred the expense.
Realized and unrealized gains and losses and net investment income, other than class specific expenses, are allocated daily to each class of shares based upon the relative proportion of net assets of each class. Differences in class-level expenses may result in payment of different per share distributions by class.
g. Accounting Estimates
The preparation of financial statements in accordance with accounting principles generally accepted in the United States of America requires management to make estimates and assumptions that affect the reported amounts of assets and liabilities at the date of the financial statements and the amounts of income and expenses during the reporting period. Actual results could differ from those estimates.
h. Guarantees and Indemnifications
Under the Trust’s organizational documents, its officers and trustees are indemnified by the Trust against certain liabilities arising out of the performance of their duties to the Trust. Additionally, in the normal course of business, the Trust enters into contracts with service providers that contain general indemnification clauses. The Trust’s maximum exposure under these arrangements is unknown as this would involve future claims that may be made against the Trust that have not yet occurred. Currently, the Trust expects the risk of loss to be remote.
2. SHARES OF BENEFICIAL INTEREST
At December 31, 2006, there were an unlimited number of shares authorized ($0.01 par value). Transactions in the Fund’s shares were as follows:
| | | | | | | | | | | | | | |
| | | Year Ended December 31, | |
| | | 2006 | | | 2005 | |
| Class 1 Shares: | | Shares | | | Amount | | | Shares | | | Amount | |
Shares sold | | 816,455 | | | $ | 12,140,817 | | | 1,516,368 | | | $ | 19,918,799 | |
Shares issued in reinvestment of distributions | | 1,610,999 | | | | 21,957,918 | | | 740,916 | | | | 9,572,633 | |
Shares redeemed in-kind (Note 8) | | (24,637,081 | ) | | | (376,956,857 | ) | | — | | | | — | |
Shares redeemed | | (7,904,739 | ) | | | (117,898,870 | ) | | (8,179,119 | ) | | | (108,196,117 | ) |
| | | | |
Net increase (decrease) | | (30,114,366 | ) | | $ | (460,756,992 | ) | | (5,921,835 | ) | | $ | (78,704,685 | ) |
| | | | |
| Class 2 Shares: | | | | | | | | | | | | |
Shares sold | | 44,417,686 | | | $ | 652,914,455 | | | 53,621,660 | | | $ | 698,169,420 | |
Shares issued in reinvestment of distributions | | 8,154,097 | | | | 109,754,141 | | | 1,291,809 | | | | 16,496,404 | |
Shares redeemed in-kind (Note 8) | | (1,903,026 | ) | | | (28,650,852 | ) | | — | | | | — | |
Shares redeemed | | (12,095,685 | ) | | | (178,080,387 | ) | | (9,052,089 | ) | | | (115,747,813 | ) |
| | | | |
Net increase (decrease) | | 38,573,072 | | | $ | 555,937,357 | | | 45,861,380 | | | $ | 598,918,011 | |
| | | | |
TG-19
Franklin Templeton Variable Insurance Products Trust
Notes to Financial Statements (continued)
Templeton Growth Securities Fund
3. TRANSACTIONS WITH AFFILIATES
Franklin Resources, Inc. is the holding company for various subsidiaries that together are referred to as Franklin Templeton Investments. Certain officers and trustees of the Trust are also officers and/or directors of the following subsidiaries:
| | |
| Subsidiary | | Affiliation |
Templeton Global Advisors Limited (TGAL) | | Investment manager |
Templeton Asset Management Ltd. (TAML) | | Investment manager |
Franklin Templeton Services, LLC (FT Services) | | Administrative manager |
Franklin Templeton Distributors, Inc. (Distributors) | | Principal underwriter |
Franklin Templeton Investor Services, LLC (Investor Services) | | Transfer agent |
a. Management Fees
The Fund pays an investment management fee to TGAL based on the average daily net assets of the Fund as follows:
| | |
| Annualized Fee Rate | | Net Assets |
| 1.000% | | Up to and including $100 million |
| 0.900% | | Over $100 million, up to and including $250 million |
| 0.800% | | Over $250 million, up to and including $500 million |
| 0.750% | | Over $500 million, up to and including $1 billion |
| 0.700% | | Over $1 billion, up to and including $5 billion |
| 0.675% | | Over $5 billion, up to and including $10 billion |
| 0.655% | | Over $10 billion, up to and including $15 billion |
| 0.635% | | Over $15 billion, up to and including $20 billion |
| 0.615% | | In excess of $20 billion |
Under a subadvisory agreement, TAML, an affiliate of TGAL, provides subadvisory services to the Fund and receives from TGAL fees based on the average daily net assets of the Fund.
b. Administrative Fees
Under an agreement with TGAL, FT Services provides administrative services to the Fund. The fee is paid by TGAL based on average daily net assets, and is not an additional expense of the Fund.
c. Distribution Fees
The Fund’s Board of Trustees has adopted a distribution plan for Class 2 shares pursuant to Rule 12b-1 under the 1940 Act. Under the Fund’s compensation distribution plan, the Fund pays Distributors for costs incurred in connection with the servicing, sale and distribution of the Fund’s shares up to 0.35% per year of its average daily net assets. The Board of Trustees has agreed to limit the current rate to 0.25% per year.
d. Transfer Agent Fees
Investor Services, under terms of an agreement, performs shareholder servicing for the Fund and is not paid by the Fund for the services.
4. EXPENSE OFFSET ARRANGEMENT
The Fund has entered into an arrangement with its custodian whereby credits realized as a result of uninvested cash balances are used to reduce a portion of the Fund’s custodian expenses. During the year ended December 31, 2006, the custodian fees were reduced as noted in the Statement of Operations.
TG-20
Franklin Templeton Variable Insurance Products Trust
Notes to Financial Statements (continued)
Templeton Growth Securities Fund
5. INCOME TAXES
For tax purposes, realized currency losses, occurring subsequent to October 31, may be deferred and treated as occurring on the first day of the following fiscal year. At December 31, 2006, the Fund deferred realized currency losses of $45,089.
The tax character of distributions paid during the years ended December 31, 2006 and 2005, was as follows:
| | | | | | |
| | | 2006 | | 2005 |
Distributions paid from: | | | | | | |
Ordinary income | | $ | 35,364,945 | | $ | 26,069,037 |
Long term capital gain | | | 96,483,570 | | | — |
| | | |
| | $ | 131,848,515 | | $ | 26,069,037 |
| | | |
At December 31, 2006, the cost of investments, net unrealized appreciation (depreciation), undistributed ordinary income and undistributed long term capital gains for income tax purposes were as follows:
| | | | |
Cost of investments | | $ | 2,562,483,733 | |
| | | | |
| |
Unrealized appreciation | | $ | 695,298,544 | |
Unrealized depreciation | | | (23,028,438 | ) |
| | | | |
Net unrealized appreciation (depreciation) | | $ | 672,270,106 | |
| | | | |
Undistributed ordinary income | | $ | 60,550,530 | |
Undistributed long term capital gains | | | 139,757,102 | |
| | | | |
Distributable earnings | | $ | 200,307,632 | |
| | | | |
Net investment income differs for financial statement and tax purposes primarily due to differing treatment of foreign currency transactions.
Net realized gains (losses) differ for financial statement and tax purposes primarily due to differing treatments of wash sales, foreign currency transactions, and gains realized on in-kind shareholder redemptions.
6. INVESTMENT TRANSACTIONS
Purchases and sales of investments (excluding short term securities) for the year ended December 31, 2006, aggregated $923,899,844 and $533,760,642, respectively. Sales of investments excludes $405,607,709 of an in-kind redemption.
7. CONCENTRATION OF RISK
Investing in foreign securities may include certain risks and considerations not typically associated with investing in U.S. securities, such as fluctuating currency values and changing local and regional economic, political and social conditions, which may result in greater market volatility. In addition, certain foreign securities may not be as liquid as U.S. securities.
8. REDEMPTION IN-KIND
During the year ended December 31, 2006, the Fund realized $68,398,083 of net gains resulting from a redemption in-kind in which a shareholder redeemed fund shares for securities held by the Fund rather than for cash. Because such gains are not taxable to the Fund, and are not distributed to shareholders, they have been reclassified from accumulated net realized gains to paid-in capital.
TG-21
Franklin Templeton Variable Insurance Products Trust
Notes to Financial Statements (continued)
Templeton Growth Securities Fund
9. REGULATORY MATTERS
As part of various investigations by a number of federal, state, and foreign regulators and governmental entities, including the Securities and Exchange Commission (“SEC”), relating to certain practices in the mutual fund industry, including late trading, market timing and marketing support payments to securities dealers who sell fund shares (“marketing support”), Franklin Resources, Inc. and certain of its subsidiaries (collectively, the “Company”), entered into settlements with certain of those regulators. Specifically, the Company entered into settlements with the SEC, among others, concerning market timing and marketing support.
On June 23, 2006, the SEC approved the proposed plan of distribution for the marketing support settlement, and disbursement of the settlement monies to the designated funds, in accordance with the terms and conditions of that settlement and plan, was completed in September 2006 and is recorded as other income.
The plan of distribution for the market timing settlement is currently under review by the SEC staff. After publication of notice of the plan and a 30-day comment period, the proposed plan of distribution will be submitted to the SEC for approval. Following the SEC’s approval of the plan of distribution, with modifications as appropriate, distribution of the settlement monies will begin in accordance with the terms and conditions of the settlement and plan.
In addition, the Company, as well as most of the mutual funds within Franklin Templeton Investments and certain current or former officers, Company directors, fund directors, and employees, have been named in private lawsuits (styled as shareholder class actions, or as derivative actions on behalf of either the named funds or Franklin Resources, Inc.). The lawsuits relate to the industry practices referenced above, as well as to allegedly excessive commissions and advisory and distribution fees.
The Company and fund management believe that the claims made in each of the private lawsuits referenced above are without merit and intend to defend against them vigorously. The Company cannot predict with certainty the eventual outcome of these lawsuits, nor whether they will have a material negative impact on the Company. If it is determined that the Company bears responsibility for any unlawful or inappropriate conduct that caused losses to the Trust, it is committed to making the Trust or its shareholders whole, as appropriate.
10. NEW ACCOUNTING PRONOUNCEMENTS
In July 2006, the Financial Accounting Standards Board (FASB) issued FASB Interpretation No. 48, “Accounting for Uncertainty in Income Taxes – an Interpretation of FASB Statement No. 109” (“FIN 48”), which clarifies the accounting for uncertainty in tax positions taken or expected to be taken in a tax return. FIN 48 provides guidance on the measurement, recognition, classification and disclosure of tax positions, along with accounting for the related interest and penalties. FIN 48 is effective for fiscal years beginning after December 15, 2006, and is to be applied to all open tax years as of the date of effectiveness. On December 22, 2006, the Securities and Exchange Commission extended the implementation date to no later than the last net asset value calculation in the first semi-annual reporting period in 2007. The Fund is currently evaluating the impact, if any, of applying the various provisions of FIN 48.
In September 2006, FASB issued FASB Statement No. 157, “Fair Value Measurement” (“SFAS 157”), which defines fair value, establishes a framework for measuring fair value, and expands disclosures about fair value measurements. SFAS 157 is effective for fiscal years beginning after November 15, 2007, and interim periods within those fiscal years. The Trust believes the adoption of SFAS 157 will have no material impact on its financial statements.
TG-22
Franklin Templeton Variable Insurance Products Trust
Templeton Growth Securities Fund
Report of Independent Registered Public Accounting Firm
To the Board of Trustees and Shareholders of
Franklin Templeton Variable Insurance Products Trust
In our opinion, the accompanying statement of assets and liabilities, including the statement of investments, and the related statements of operations and of changes in net assets and the financial highlights present fairly, in all material respects, the financial position of Templeton Growth Securities Fund (one of the funds constituting the Franklin Templeton Variable Insurance Products Trust, hereafter referred to as the “Fund”) at December 31, 2006, the results of its operations for the year then ended, the changes in its net assets for each of the two years in the period then ended and the financial highlights for each of the five years in the period then ended, in conformity with accounting principles generally accepted in the United States of America. These financial statements and financial highlights (hereafter referred to as “financial statements”) are the responsibility of the Fund’s management; our responsibility is to express an opinion on these financial statements based on our audits. We conducted our audits of these financial statements in accordance with the standards of the Public Company Accounting Oversight Board (United States). Those standards require that we plan and perform the audit to obtain reasonable assurance about whether the financial statements are free of material misstatement. An audit includes examining, on a test basis, evidence supporting the amounts and disclosures in the financial statements, assessing the accounting principles used and significant estimates made by management, and evaluating the overall financial statement presentation. We believe that our audits, which included confirmation of securities at December 31, 2006 by correspondence with the custodian and brokers, provide a reasonable basis for our opinion.
PricewaterhouseCoopers LLP
San Francisco, California
February 16, 2007
TG-23
Franklin Templeton Variable Insurance Products Trust
Tax Designation (unaudited)
Templeton Growth Securities Fund
Under Section 852(b)(3)(C) of the Internal Revenue Code (Code), the Fund designates the maximum amount allowable but no less than $139,767,620 as a long term capital gain dividend for the fiscal year ended December 31, 2006.
Under Section 854(b)(2) of Code, the Fund designates 45.94% of the ordinary income dividends as income qualifying for the dividends received deduction for the fiscal year ended December 31, 2006.
At December 31, 2006, more than 50% of the Fund’s total assets were invested in securities of foreign issuers. In most instances, foreign taxes were withheld from dividends paid to the Fund on these investments. The Fund elects to treat foreign taxes paid as allowed under Section 853 of the Code. This election will allow shareholders of record in June 2007, to treat their proportionate share of foreign taxes paid by the Fund as having been paid directly by them. Shareholders shall consider these amounts as foreign taxes paid in the tax year in which they receive the Fund distribution.
The foreign tax information will be disclosed in the June 30, 2007, semi-annual report of the Fund.
TG-24
INDEX DESCRIPTIONS
The indexes are unmanaged and include reinvested distributions.
Consumer Price Index (CPI), calculated by the U.S. Bureau of Labor Statistics, is a commonly used measure of the inflation rate.
CS High Yield Index is designed to mirror the investible universe of the U.S. dollar-denominated high yield debt market.
Dow Jones Industrial Average (the Dow) is price weighted based on the average market price of 30 blue chip stocks of companies that are generally industry leaders.
Dow Jones Wilshire Real Estate Securities Index is a broad measure of the performance of publicly traded real estate securities, such as real estate investment trusts and real estate operating companies. The index is capitalization weighted and rebalanced monthly, and returns are calculated on a buy-and-hold basis.
HSBC Asian Local Bond Index (ALBI) tracks total return performance of a bond portfolio, which consists of local-currency denominated, high quality and liquid bonds in Asia ex-Japan. Local bond market returns are from country sub-indexes of the HSBC ALBI.
J.P. Morgan (JPM) Emerging Markets Bond Index (EMBI) Global tracks total returns for U.S. dollar-denominated debt instruments issued by emerging market sovereign and quasi-sovereign entities: Brady bonds, loans and Eurobonds.
J.P. Morgan (JPM) Government Bond Index (GBI) Global tracks total returns for liquid, fixed-rate, domestic government bonds with maturities greater than one year issued by developed countries globally.
Lehman Brothers (LB) U.S. Aggregate Index represents securities that are SEC-registered, taxable and dollar denominated. The index covers the U.S. investment grade fixed-rate bond market, with index components for government and corporate securities, mortgage pass-through securities and asset-backed securities. All issues included must have at least one year to final maturity and must be rated investment grade (Baa3 or better) by Moody’s Investors Service. They must also be dollar denominated and nonconvertible. Total return includes price appreciation/depreciation and income as a percentage of the original investment. The index is rebalanced monthly by market capitalization.
Lehman Brothers (LB) U.S. Government: Intermediate Index is the intermediate component of the LB U.S. Government Index. The index includes securities issued by the U.S. government or agency. These include obligations of the U.S. Treasury with remaining maturity of one year or more and publicly issued debt of U.S. governmental agencies, quasi-federal corporations, and corporate or foreign debt guaranteed by the U.S. government.
Lipper Multi-Sector Income Funds Classification Average is calculated by averaging the total returns of all funds within the Lipper Multi-Sector Income Funds classification in the Lipper Open-End underlying funds universe. Lipper Multi-Sector Income Funds are defined as funds that seek current income by allocating assets among different fixed income securities sectors (not primarily in one sector except for defensive purposes), including U.S. and foreign governments, with a significant portion rated below investment grade. For the 12-month period ended 12/31/06, there were 114 funds in this category. Lipper calculations do not include sales charges, but include reinvestment of any income or distributions. Fund performance relative to the average may have differed if these and other factors had been considered.
Lipper VIP Equity Income Funds Classification Average is an equally weighted average calculation of performance figures for all funds within the Lipper Equity Income Funds classification in the Lipper VIP underlying funds universe. Lipper Equity Income Funds seek relatively high current income and growth of income through investing 60% or more of their portfolios in equities. For the 12-month period ended 12/31/06, there were 61 funds in this category. Lipper calculations do not include contract fees, expenses or sales charges, and may have been different if such charges had been considered.
Lipper VIP General U.S. Government Funds Classification Average is an equally weighted average calculation of performance figures for all funds within the Lipper U.S. Government Funds classification in the Lipper VIP underlying fund universe. Lipper U.S. Government Funds invest primarily in U.S. government and agency issues. For the 12-month period ended 12/31/06, there were 63 funds in this category. Lipper calculations do not include contract fees, expenses or sales charges, and may have been different if such charges had been considered.
Lipper VIP High Current Yield Funds Classification Average is an equally weighted average calculation for performance figures for all funds within the Lipper High Current Yield Funds aim at high (relative) current yield from fixed income securities, have no quality or maturity restrictions, and tend to invest in lower grade debt issues. For the 12-month period ended 12/31/06, there were 100 funds in this category. Lipper calculations do not include contract fees, expenses or sales charges, and may have been different if such charges had been considered.
I-1
Merrill Lynch 2- and 5-Year Zero Coupon Bond Indexes include zero coupon bonds that pay no interest and are issued at a discount from redemption price.
Morgan Stanley Capital International (MSCI) All Country (AC) World Index is a free float-adjusted, market capitalization-weighted index designed to measure equity market performance in global developed and emerging markets.
Morgan Stanley Capital International (MSCI) Emerging Markets (EM) Index is a free float-adjusted, market capitalization-weighted index designed to measure equity market performance in global emerging markets.
Morgan Stanley Capital International (MSCI) Europe, Australasia, Far East (EAFE) Index is a free float-adjusted, market capitalization-weighted index designed to measure equity market performance in global developed markets excluding the U.S. and Canada.
Morgan Stanley Capital International (MSCI) World Index is a free float-adjusted, market capitalization-weighted index designed to measure equity market performance in global developed markets.
NASDAQ Composite Index measures all NASDAQ domestic and international based common type stocks listed on The NASDAQ Stock Market. The index is market value weighted and includes over 3,000 companies.
Russell 1000® Growth Index is market capitalization weighted and measures performance of those Russell 1000 Index companies with higher price-to-book ratios and higher forecasted growth values.
Russell 1000 Index is market capitalization weighted and measures performance of the 1,000 largest companies in the Russell 3000 Index, which represent approximately 92% of total market capitalization of the Russell 3000 Index.
Russell 1000 Value Index is market capitalization weighted and measures performance of those Russell 1000 Index companies with lower price-to-book ratios and lower forecasted growth values.
Russell 2500™ Index is market capitalization weighted and measures performance of the 2,500 smallest companies in the Russell 3000 Index, which represent approximately 17% of total market capitalization of the Russell 3000 Index.
Russell 2500 Value Index is market capitalization weighted and measures performance of those Russell 2500 Index companies with lower price-to-book ratios and lower forecasted growth values.
Russell 3000® Growth Index is market capitalization weighted and measures performance of those Russell 3000 Index companies with higher price-to-book ratios and higher forecasted growth values.
Russell 3000 Index is market capitalization weighted and measures performance of the 3,000 largest U.S. companies based on total market capitalization, which represent approximately 98% of the investible U.S. equity market.
Russell Midcap™ Growth Index is market capitalization weighted and measures performance of those Russell Midcap Index companies with higher price-to-book ratios and higher forecasted growth values.
Russell Midcap Index is market capitalization weighted and measures performance of the 800 smallest companies in the Russell 1000 Index, which represent approximately 26% of total market capitalization of the Russell 1000 Index.
Standard & Poor’s 500 Index (S&P 500) consists of 500 stocks chosen for market size, liquidity and industry group representation. Each stock’s weight in the index is proportionate to its market value. The S&P 500 is one of the most widely used benchmarks of U.S. equity performance.
Standard & Poor’s/International Finance Corporation Investable (S&P/IFCI) Composite Index is a free float-adjusted, market capitalization-weighted index designed to measure equity performance in global emerging markets.
I-2
Board Members and Officers
The name, year of birth and address of the officers and board members, as well as their affiliations, positions held with the Trust, principal occupation during the past five years and number of portfolios overseen in the Franklin Templeton Investments fund complex are shown below. Generally, each board member will serve until that person’s successor is elected and qualified.
Independent Board Members
| | | | | | | | |
| Name, Year of Birth and Address | | Position | | Length of
Time Served | | Number of
Portfolios in Fund
Complex Overseen
by Board Member* | | Other Directorships Held |
HARRIS J. ASHTON (1932) One Franklin Parkway San Mateo, CA 94403-1906 | | Trustee | | Since 1988 | | 142 | | Director, Bar-S Foods (meat packing company). |
|
Principal Occupation During Past 5 Years: Director of various companies; and formerly, Director, RBC Holdings, Inc. (bank holding company) (until 2002); and President, Chief Executive Officer and Chairman of the Board, General Host Corporation (nursery and craft centers) (until 1998). |
ROBERT F. CARLSON (1928) One Franklin Parkway San Mateo, CA 94403-1906 | | Trustee | | Since 1998 | | 57 | | None |
|
Principal Occupation During Past 5 Years: Vice President, senior member and past President, Board of Administration, California Public Employees Retirement Systems (CALPERS); and formerly, member and Chairman of the Board, Sutter Community Hospitals; member, Corporate Board, Blue Shield of California; and Chief Counsel, California Department of Transportation. |
EDITH E. HOLIDAY (1952) One Franklin Parkway San Mateo, CA 94403-1906 | | Trustee | | Since 2005 | | 143 | | Director, Hess Corporation (formerly Amerada Hess Corporation) (exploration and refining of oil and gas), H.J. Heinz Company (processed foods and allied products), RTI International Metals, Inc. (manufacture and distribution of titanium), Canadian National Railway (railroad) and White Mountains Insurance Group, Ltd. (holding company). |
|
Principal Occupation During Past 5 Years: Director or Trustee of various companies and trusts; and formerly, Assistant to the President of the United States and Secretary of the Cabinet (1990-1993); General Counsel to the United States Treasury Department (1989-1990); and Counselor to the Secretary and Assistant Secretary for Public Affairs and Public Liaison-United States Treasury Department (1988-1989). |
FRANK W.T. LAHAYE (1929) One Franklin Parkway San Mateo, CA 94403-1906 | | Trustee | | Since 1988 | | 116 | | Director, Center for Creative Land Recycling (redevelopment). |
|
Principal Occupation During Past 5 Years: General Partner, Las Olas L.P. (Asset Management); and formerly, Chairman, Peregrine Venture Management Company (venture capital). |
FRANK A. OLSON (1932) One Franklin Parkway San Mateo, CA 94403-1906 | | Trustee | | Since 2005 | | 103 | | Director, Hess Corporation (formerly Amerada Hess Corporation) (exploration and refining of oil and gas) and Sentient Jet (private jet service); and formerly, Director, Becton Dickinson and Company (medical technology), Cooper Industries, Inc. (electrical products and tools and hardware), Health Net, Inc. (formerly Foundation Health) (integrated managed care), The Hertz Corporation (car rental), Pacific Southwest Airlines, The RCA Corporation, Unicom (formerly Commonwealth Edison), UAL Corporation (airlines) and White Mountains Insurance Group, Ltd. (holding company). |
|
Principal Occupation During Past 5 Years: Chairman Emeritus, The Hertz Corporation (since 2000) (Chairman of the Board (1980-2000) and Chief Executive Officer (1977-1999)); and formerly, Chairman of the Board, President and Chief Executive Officer, UAL Corporation. |
BOD-1
Interested Board Members and Officers
| | | | | | | | |
| Name, Year of Birth and Address | | Position | | Length of
Time Served | | Number of
Portfolios in Fund
Complex Overseen
by Board Member* | | Other Directorships Held |
**CHARLES B. JOHNSON (1933) One Franklin Parkway San Mateo, CA 94403-1906 | | Trustee and Chairman of the Board | | Since 1988 | | 142 | | None |
|
Principal Occupation During Past 5 Years: Chairman of the Board, Member—Office of the Chairman and Director, Franklin Resources, Inc.; Director, Templeton Worldwide, Inc.; and officer and/or director or trustee, as the case may be, of some of the other subsidiaries of Franklin Resources, Inc. and of 41 of the investment companies in Franklin Templeton Investments. |
**RUPERT H. JOHNSON, JR. (1940) One Franklin Parkway San Mateo, CA 94403-1906 | | Trustee, President and Chief Executive Officer—Investment Management | | Trustee since 1988 and President and Chief Executive Officer—Investment Management since 2002 | | 126 | | None |
|
Principal Occupation During Past 5 Years: Vice Chairman, Member—Office of the Chairman and Director, Franklin Resources, Inc.; Director, Franklin Advisers, Inc. and Templeton Worldwide, Inc.; Senior Vice President, Franklin Advisory Services, LLC; and officer and/or director or trustee, as the case may be, of some of the other subsidiaries of Franklin Resources, Inc. and of 44 of the investment companies in Franklin Templeton Investments. |
JAMES M. DAVIS (1952) One Franklin Parkway San Mateo, CA 94403-1906 | | Chief Compliance Officer and Vice President—AML Compliance | | Chief Compliance Officer since 2004 and Vice President—AML Compliance since February 2006 | | Not
Applicable | | Not Applicable |
|
Principal Occupation During Past 5 Years: Director, Global Compliance, Franklin Resources, Inc.; officer of some of the other subsidiaries of Franklin Resources, Inc. and of 46 of the investment companies in Franklin Templeton Investments; and formerly, Director of Compliance, Franklin Resources, Inc. (1994-2001). |
LAURA FERGERSON (1962) One Franklin Parkway San Mateo, CA 94403-1906 | | Treasurer | | Since 2004 | | Not
Applicable | | Not Applicable |
|
Principal Occupation During Past 5 Years: Vice President, Franklin Templeton Services, LLC; officer of 30 of the investment companies in Franklin Templeton Investments; and formerly, Director and member of Audit and Valuation Committees, Runkel Funds, Inc. (2003-2004); Assistant Treasurer of most of the investment companies in Franklin Templeton Investments (1997-2003); and Vice President, Franklin Templeton Services, LLC (1997-2003). |
JIMMY D. GAMBILL (1947) 500 East Broward Blvd. Suite 2100 Fort Lauderdale, FL 33394-3091 | | Senior Vice President and Chief Executive Officer—Finance and Administration | | Since 2002 | | Not
Applicable | | Not Applicable |
|
Principal Occupation During Past 5 Years: President, Franklin Templeton Services, LLC; Senior Vice President, Templeton Worldwide, Inc.; and officer of some of the other subsidiaries of Franklin Resources, Inc. and of 46 of the investment companies in Franklin Templeton Investments. |
DAVID P. GOSS (1947) One Franklin Parkway San Mateo, CA 94403-1906 | | Vice President | | Since 2000 | | Not
Applicable | | Not Applicable |
|
Principal Occupation During Past 5 Years: Senior Associate General Counsel, Franklin Templeton Investments; officer and director of one of the subsidiaries of Franklin Resources, Inc.; and officer of 46 of the investment companies in Franklin Templeton Investments. |
BOD-2
| | | | | | | | |
| Name, Year of Birth and Address | | Position | | Length of
Time Served | | Number of
Portfolios in Fund
Complex Overseen
by Board Member* | | Other Directorships Held |
BARBARA J. GREEN (1947) One Franklin Parkway San Mateo, CA 94403-1906 | | Vice President | | Since 2000 | | Not
Applicable | | Not Applicable |
|
Principal Occupation During Past 5 Years: Vice President, Deputy General Counsel and Secretary, Franklin Resources, Inc.; Secretary and Senior Vice President, Templeton Worldwide, Inc.; Secretary, Franklin Advisers, Inc., Franklin Advisory Services, LLC, Franklin Investment Advisory Services, LLC, Franklin Mutual Advisers, LLC, Franklin Templeton Institutional, LLC, Franklin Templeton Investor Services, LLC, Franklin Templeton Services, LLC, Franklin Templeton Distributors, Inc., Templeton Investment Counsel, LLC, and Templeton/Franklin Investment Services, Inc.; Vice President, Templeton Global Advisers Limited; and officer of some of the other subsidiaries of Franklin Resources, Inc. and of 46 of the investment companies in Franklin Templeton Investments; and formerly, Deputy Director, Division of Investment Management, Executive Assistant and Senior Advisor to the Chairman, Counselor to the Chairman, Special Counsel and Attorney Fellow, U.S. Securities and Exchange Commission (1986-1995); Attorney, Rogers & Wells (until 1986); and Judicial Clerk, U.S. District Court (District of Massachusetts) (until 1979). |
KAREN L. SKIDMORE (1952) One Franklin Parkway San Mateo, CA 94403-1906 | | Vice President and Secretary | | Vice President since February 2006 Secretary since April 2006 | | Not
Applicable | | Not Applicable |
|
Principal Occupation During Past 5 Years: Senior Associate General Counsel, Franklin Templeton Investments; Vice President and Secretary, Templeton Funds Annuity Company; and officer of 30 of the investment companies in Franklin Templeton Investments. |
CRAIG S. TYLE (1960) One Franklin Parkway San Mateo, CA 94403-1906 | | Vice President | | Since 2005 | | Not
Applicable | | Not Applicable |
|
Principal Occupation During Past 5 Years: General Counsel and Executive Vice President, Franklin Resources, Inc.; officer of some of the other subsidiaries of Franklin Resources, Inc. and of 46 of the investment companies in Franklin Templeton Investments; and formerly, Partner, Shearman & Sterling, LLP (2004-2005); and General Counsel, Investment Company Institute (ICI) (1997-2004). |
BOD-3
| | | | | | | | |
| Name, Year of Birth and Address | | Position | | Length of
Time Served | | Number of
Portfolios in Fund
Complex Overseen
by Board Member* | | Other Directorships Held |
GALEN G. VETTER (1951) 500 East Broward Blvd. Suite 2100 Fort Lauderdale, FL 33394-3091 | | Chief Financial Officer and Chief Accounting Officer | | Since 2004 | | Not
Applicable | | Not Applicable |
|
Principal Occupation During Past 5 Years: Senior Vice President, Franklin Templeton Services, LLC; officer of 46 of the investment companies in Franklin Templeton Investments; and formerly, Managing Director, RSM McGladrey, Inc. (1999-2004); and Partner, McGladrey & Pullen, LLP (1979-1987 and 1991-2004). |
| *We | base the number of portfolios on each separate series of the U.S. registered investment companies within the Franklin Templeton Investments fund complex. These portfolios have a common investment manager or affiliated investment managers. |
| **Charles | B. Johnson and Rupert H. Johnson, Jr. are considered to be interested persons of the Fund under the federal securities laws due to their positions as officers and directors and major shareholders of Franklin Resources, Inc., which is the parent company of the Trust’s manager and distributor. |
Note 1: Charles B. Johnson and Rupert H. Johnson, Jr. are brothers.
Note 2: Prior to December 31, 2006, S. Joseph Fortunato and Gordon S. Macklin ceased to be a trustee of the Trust.
The Sarbanes-Oxley Act of 2002 and Rules adopted by the Securities and Exchange Commission require the Fund to disclose whether the Fund’s Audit Committee includes at least one member who is an audit committee financial expert within the meaning of such Act and Rules. The Fund’s Board of Trustees has determined that there is at least one such financial expert on the Audit Committee and has designated Frank W.T. LaHaye as its audit committee financial expert. The Board believes that Mr. LaHaye qualifies as such an expert in view of his extensive business background and experience, including service as President and Director of McCormick Selph Associates from 1954 through 1965; Director and Chairman of Teledyne Canada Ltd. from 1966 through 1971; Director and Chairman of Quarterdeck Corporation from 1982 through 1998; and services as a Director of various other public companies including U.S. Telephone Inc. (1981-1984), Fisher Imaging Inc. (1991-1998) and Digital Transmissions Systems (1995-1999). In addition, Mr. LaHaye served from 1981 to 2000 as a Director and Chairman of Peregrine Venture Management Co., a venture capital firm, and has been a Member and Chairman of the Fund’s Audit Committee since its inception. As a result of such background and experience, the Board of Trustees believes that Mr. LaHaye has acquired an understanding of generally accepted accounting principles and financial statements, the general application of such principles in connection with the accounting estimates, accruals and reserves, and analyzing and evaluating financial statements that present a breadth and level of complexity of accounting issues generally comparable to those of the Fund, as well as an understanding of internal controls and procedures for financial reporting and an understanding of audit committee functions. Mr. LaHaye is an independent Trustee as that term is defined under the relevant Securities and Exchange Commission Rules and Releases.
The Statement of Additional Information (SAI) includes additional information about the board members and is available, without charge, upon request. Shareholders may call 1-800/321-8563 or their insurance companies to request the SAI.
BOD-4
Franklin Templeton Variable Insurance Products Trust
Shareholder Information
Proxy Voting Policies and Procedures
The Trust has established Proxy Voting Policies and Procedures (“Policies”) that the Trust uses to determine how to vote proxies relating to portfolio securities. Shareholders may view the Trust’s complete Policies online at franklintempleton.com. Alternatively, shareholders may request copies of the Policies free of charge by calling the Proxy Group collect at 1-954/527-7678 or by sending a written request to: Franklin Templeton Companies, LLC, 500 East Broward Boulevard, Suite 1500, Fort Lauderdale, FL 33394, Attention: Proxy Group. Copies of the Trust’s proxy voting records are also made available online at franklintempleton.com and posted on the U.S. Securities and Exchange Commission’s website at sec.gov and reflect the most recent 12-month period ended June 30.
Quarterly Statement of Investments
The Trust files a complete statement of investments with the U.S. Securities and Exchange Commission for the first and third quarters for each fiscal year on Form N-Q. Shareholders may view the filed Form N-Q by visiting the Commission’s website at sec.gov. The filed form may also be viewed and copied at the Commission’s Public Reference Room in Washington, DC. Information regarding the operations of the Public Reference Room may be obtained by calling 1-800/SEC-0330.
SI-1
| | |
 | | One Franklin Parkway San Mateo, CA 94403-1906 |
Annual Report
Insurance Issuer
Phoenix Life Insurance Company
Service Center
Variable Annuity Operations
800/243-4840
Investment Managers
Franklin Advisers, Inc.
Templeton Investment Counsel, LLC
Templeton Asset Management Ltd.
Templeton Global Advisors Limited
Phoenix Investment Counsel, Inc.
FTVIP Trust Distributor
Franklin Templeton Distributors, Inc.
This report must be preceded or accompanied by the current Templeton Investment Plus (TIP) prospectus which includes the Franklin Templeton Variable Insurance Products Trust (FTVIP Trust) and The Phoenix Edge Series Fund prospectuses, which contain more detailed information, including sales charges and risks of an investment in TIP. Please read the prospectuses carefully before investing or sending your money. These reports and prospectuses do not constitute an offering in any jurisdiction in which such offering may not lawfully be made.
To ensure the highest quality of service, telephone calls to or from our service departments may be monitored, recorded and accessed. These calls can be determined by the presence of a regular beeping tone.
Phoenix Life Insurance Company
P.O. Box 22012
Albany, NY 12201-2012
| (a) | The Registrant has adopted a code of ethics that applies to its principal executive officers and principal financial and accounting officer. |
| (f) | Pursuant to Item 12(a)(1), the Registrant is attaching as an exhibit a copy of its code of ethics that applies to its principal executive officers and principal financial and accounting officer. |
| Item 3. | Audit Committee Financial Expert. |
| | |
| (a) (1) | | The Registrant has an audit committee financial expert serving on its audit committee. |
| | |
| (2) | | The audit committee financial expert is Frank W.T. LaHaye and he is “Independent” as defined under the relevant Securities and Exchange Commission Rules And Releases. |
| Item 4. | Principal Accountant Fees and Services. |
(a) Audit Fees
The aggregate fees paid to the principal accountant for professional services rendered by the principal accountant for the audit of the registrant’s annual financial statements or for services that are normally provided by the principal accountant in connection with statutory and regulatory filings or engagements were $771,109 for the fiscal year ended December 31, 2006 and $729,089 for the fiscal year ended December 31, 2005.
(b) Audit-Related Fees
There were no fees paid to the principal accountant for assurance and related services rendered by the principal accountant to the registrant that are reasonably related to the performance of the audit of the registrant’s financial statements and are not reported under paragraph (a) of Item 4.
There were no fees paid to the principal accountant for assurance and related services rendered by the principal accountant to the registrant’s investment adviser and any entity controlling, controlled by or under common control with the investment adviser that provides ongoing services to the registrant that are reasonably related to the performance of the audit of their financial statements.
(c) Tax Fees
There were no fees paid to the principal accountant for professional services rendered by the principal accountant to the registrant for tax compliance, tax advice and tax planning.
The aggregate fees paid to the principal accountant for professional services rendered by the principal accountant to the registrant’s investment adviser and any entity controlling, controlled by or under common control with the investment adviser that provides ongoing services to the registrant for tax compliance, tax advice and tax planning were $3,961 for the fiscal year ended December 31, 2006 and $4,955 for the fiscal year ended December 31, 2005. The services for which these fees were paid included tax compliance and advice.
(d) All Other Fees
The aggregate fees paid to the principal accountant for products and services rendered by the principal accountant to the registrant not reported in paragraphs (a)-(c) of Item 4 were $14,799 for the fiscal year ended December 31, 2006 and $0 for the fiscal year ended December 31, 2005. The services for which these fees were paid included review of materials provided to the fund Board in connection with the investment management contract renewal process.
The aggregate fees paid to the principal accountant for products and services rendered by the principal accountant to the registrant’s investment adviser and any entity controlling, controlled by or under common control with the investment adviser that provides ongoing
services to the registrant not reported in paragraphs (a)-(c) of Item 4 were $161,062 for the fiscal year ended December 31, 2006 and $5,835 for the fiscal year ended December 31, 2005. The services for which these fees were paid included review of materials provided to the fund Board in connection with the investment management contract renewal process and the review of the ICI transfer agent survey.
(e) (1) The registrant’s audit committee is directly responsible for approving the services to be provided by the auditors, including:
(i) pre-approval of all audit and audit related services;
(ii) pre-approval of all non-audit related services to be provided to the Fund by the auditors;
(iii) pre-approval of all non-audit related services to be provided to the registrant by the auditors to the registrant’s investment adviser or to any entity that controls, is controlled by or is under common control with the registrant’s investment adviser and that provides ongoing services to the registrant where the non-audit services relate directly to the operations or financial reporting of the registrant; and
(iv) establishment by the audit committee, if deemed necessary or appropriate, as an alternative to committee pre-approval of services to be provided by the auditors, as required by paragraphs (ii) and (iii) above, of policies and procedures to permit such services to be pre-approved by other means, such as through establishment of guidelines or by action of a designated member or members of the committee; provided the policies and procedures are detailed as to the particular service and the committee is informed of each service and such policies and procedures do not include delegation of audit committee responsibilities, as contemplated under the Securities Exchange Act of 1934, to management; subject, in the case of (ii) through (iv), to any waivers, exceptions or exemptions that may be available under applicable law or rules.
(e) (2) None of the services provided to the registrant described in paragraphs (b)-(d) of Item 4 were approved by the audit committee pursuant to paragraph (c)(7)(i)(C) of Rule 2-01 of regulation S-X.
(f) No disclosures are required by this Item 4(f).
(g) The aggregate non-audit fees paid to the principal accountant for services rendered by the principal accountant to the registrant and the registrant’s investment adviser and any entity controlling, controlled by or under common control with the investment adviser that provides ongoing services to the registrant were $179,822 for the fiscal year ended December 31, 2006 and $10,790 for the fiscal year ended December 31, 2005.
(h) The registrant’s audit committee of the board has considered whether the provision of non-audit services that were rendered to the registrant’s investment adviser (not including any sub-adviser whose role is primarily portfolio management and is subcontracted with or overseen by another investment adviser), and any entity controlling, controlled by, or under common control with the investment adviser that
provides ongoing services to the registrant that were not pre-approved pursuant to paragraph (c)(7)(ii) of Rule 2-01 of Regulation S-X is compatible with maintaining the principal accountant’s independence.
| Item 5. | Audit Committee of Listed Registrants. N/A |
| Item 6. | Schedule of Investments. N/A |
| Item 7. | Disclosure of Proxy Voting Policies and Procedures for Closed-End Management Investment Companies. N/A |
| Item 8. | Portfolio Managers of Closed-End Management Investment Companies. N/A |
| Item 9. | Purchases of Equity Securities by Closed-End Management Investment Companies and Affiliated Purchases. N/A |
| Item 10. | Submission of Matters to a vote of Security Holders. |
There have been no changes to the procedures by which shareholders may recommend nominees to the Registrant’s Board of Trustees that would require disclosure herein.
| Item 11. | Controls and Procedures. |
(a) Evaluation of Disclosure Controls and Procedures. The Registrant maintains disclosure controls and procedures that are designed to ensure that information required to be disclosed in the Registrant’s filings under the Securities Exchange Act of 1934 and the Investment Company Act of 1940 is recorded, processed, summarized and reported within the periods specified in the rules and forms of the Securities and Exchange Commission. Such information is accumulated and communicated to the Registrant’s management, including its principal executive officer and principal financial officer, as appropriate, to allow timely decisions regarding required disclosure. The Registrant’s management, including the principal executive officer and the principal financial officer, recognizes that any set of controls and procedures, no matter how well designed and operated, can provide only reasonable assurance of achieving the desired control objectives.
Within 90 days prior to the filing date of this Shareholder Report on Form N-CSR, the Registrant had carried out an evaluation, under the supervision and with the participation of the Registrant’s management, including the Registrant’s principal executive officer and the Registrant’s principal financial officer, of the effectiveness of the design and operation of the Registrant’s disclosure controls and procedures. Based on such evaluation, the Registrant’s principal executive officer and principal financial officer concluded that the Registrant’s disclosure controls and procedures are effective.
(b) Changes in Internal Controls. There have been no significant changes in the Registrant’s internal controls or in other factors that
could significantly affect the internal controls subsequent to the date of their evaluation in connection with the preparation of this Shareholder Report on Form N-CSR.
(a) (1) Code of Ethics
(a) (2) Certifications pursuant to Section 302 of the Sarbanes-Oxley Act of 2002 of Jimmy D. Gambill, Chief Executive Officer - Finance and Administration, and Galen G. Vetter, Chief Financial Officer
(b) Certifications pursuant to Section 906 of the Sarbanes-Oxley Act of 2002 of Jimmy D. Gambill, Chief Executive Officer - Finance and Administration, and Galen G. Vetter, Chief Financial Officer
SIGNATURES
Pursuant to the requirements of the Securities Exchange Act of 1934 and the Investment Company Act of 1940, the registrant has duly caused this report to be signed on its behalf by the undersigned, thereunto duly authorized.
FRANKLIN TEMPLETON VARIABLE INSURANCE PRODUCTS TRUST
| | |
| |
| By | | /s/ Jimmy D. Gambill |
Jimmy D. Gambill |
Chief Executive Officer -Finance and Administration |
Date February 27, 2007 |
Pursuant to the requirements of the Securities Exchange Act of 1934 and the Investment Company Act of 1940, this report has been signed below by the following persons on behalf of the registrant and in the capacities and on the dates indicated.
| | |
| |
| By | | /s/ Jimmy D. Gambill |
Jimmy D. Gambill |
Chief Executive Officer -Finance and Administration |
Date February 27, 2007 |
| | |
| |
| By | | /s/ Galen G. Vetter |
Galen G. Vetter |
Chief Financial Officer |
Date February 27, 2007 |