UNITED STATES
SECURITIES AND EXCHANGE COMMISSION
Washington, D.C. 20549
FORM N-CSR
CERTIFIED SHAREHOLDER REPORT OF REGISTERED
MANAGEMENT INVESTMENT COMPANIES
| | |
Investment Company Act file number | | 811-05583 |
Franklin Templeton Variable Insurance Products Trust
|
| (Exact name of registrant as specified in charter) |
| | |
| One Franklin Parkway, San Mateo, CA | | 94403-1906 |
| (Address of principal executive offices) | | (Zip code) |
Craig S. Tyle, One Franklin Parkway, San Mateo, CA 94403-1906
|
| (Name and address of agent for service) |
Registrant’s telephone number, including area code: (650) 312-2000
Date of fiscal year end: 12/31
Date of reporting period: 12/31/07
| Item 1. | Reports to Stockholders. |

December 31, 2007
TEMPLETON INVESTMENT PLUS
ANNUAL REPORT
THE PHOENIX EDGE SERIES FUND
· PHOENIX MONEY MARKET SERIES
FRANKLIN TEMPLETON VARIABLE INSURANCE PRODUCTS TRUST
· TEMPLETON DEVELOPING MARKETS SECURITIES FUND - CLASS 1
· TEMPLETON FOREIGN SECURITIES FUND - CLASS 1
· TEMPLETON GLOBAL ASSET ALLOCATION FUND - CLASS 1
· TEMPLETON GLOBAL INCOME SECURITIES FUND - CLASS 1
· TEMPLETON GROWTH SECURITIES FUND - CLASS 1


ANNUAL REPORT
THE PHOENIX EDGE
SERIES FUND
Variable Products Fund
December 31, 2007

To our Templeton Investment Plus contractowners:
The 2007 annual report for the Phoenix Money Market Series, an investment option offered through your contract, is included in the following compilation of Phoenix Edge Series Fund annual reports.
Table of Contents
Proxy Voting Procedures and Voting Record (Form N-PX)
The advisor and subadvisors vote proxies relating to portfolio securities in accordance with procedures that have been approved by the Fund’s Board of Trustees. You may obtain a description of these procedures, along with information regarding how the series voted proxies during the most recent 12-month period ended June 30, 2007, free of charge, by calling toll-free 800-541-0171. This information is also available through the Securities and Exchange Commission’s website at http://www.sec.gov.
Form N-Q Information
The Fund files a complete schedule of portfolio holdings with the Securities and Exchange Commission (the “SEC”) for the first and third quarters of each fiscal year on Form N-Q. Form N-Q is available on the SEC’s website at http://www.sec.gov. Form N-Q may be reviewed and copied at the SEC’s Public Reference Room. Information on the operation of the SEC’s Public Reference Room can be obtained by calling toll-free 1-800-SEC-0330.
| | | | |
| Not FDIC Insured | | No Bank Guarantee | | May Lose Value |
A MESSAGE FROM THE PRESIDENT
Dear Phoenix Edge Series Fund Shareholder:
| | |
 | | This report provides performance and portfolio details about the underlying investments of your Phoenix variable annuity or life insurance policy for the fiscal year ended December 31, 2007. I hope you will take time to review this important information. At Phoenix, we are committed to providing you with a choice of quality investment options from professional money managers across the industry, including many well-known names. In addition to The Phoenix Edge Series Fund options discussed in this report, we also offer a selection of other investment options for your consideration. You may wish to visit our Web site, phoenixwm.com, to learn more about the variable investments available to you, which may include new offerings from time to time. Also, if you haven’t done so, this is a good time of year to meet with your financial professional to review your portfolio and make sure that your asset allocation strategy is consistent with your financial goals, especially if there have been any recent changes in your personal situation. |
We appreciate your business and thank you for choosing Phoenix to be part of your financial plan. It is our great privilege to serve you.
Sincerely yours,
|
|
 |
| Philip K. Polkinghorn |
| President, The Phoenix Edge Series Fund |
January 2008
Asset Allocation does not guarantee against a loss, and there is no guarantee that a diversified portfolio will outperform a non-diversified portfolio.
1
GLOSSARY
ADR (American Depositary Receipt)
Represents shares of foreign companies traded in U.S. dollars on U.S. exchanges that are held by a bank or a trust. Foreign companies use ADRs in order to make it easier for Americans to buy their shares.
AMBAC
American Municipal Bond Assurance Corporation.
Composite Index for Strategic Allocation Series
A composite index made up of 60% of the S&P 500 Index, which measures stock market total return performance, and 40% of the Lehman Brothers Aggregate Bond Index, which measures bond market total return performance.
Composite Index for S&P Dynamic Asset Allocation Series: Aggressive Growth
A composite index made up of 75% of the S&P 500 Index, which measures stock market total return performance, 8% of the Lehman Brothers Aggregate Bond Index, which measures bond market total return performance, and 17% of the MSCI EAFE Index, which measures foreign market equity performance.
Composite Index for S&P Dynamic Asset Allocation Series: Growth
A composite index made up of 60% of the S&P 500 Index, which measures stock market total return performance, 27% of the Lehman Brothers Aggregate Bond Index, which measures bond market total return performance, and 13% of the MSCI EAFE Index, which measures foreign market equity performance.
Composite Index for S&P Dynamic Asset Allocation Series: Moderate Growth
A composite index made up of 50% of the S&P 500 Index, which measures stock market total return performance, 40% of the Lehman Brothers Aggregate Bond Index, which measures bond market total return performance, and 10% of the MSCI EAFE Index, which measures foreign market equity performance.
Composite Index for S&P Dynamic Asset Allocation Series: Moderate
A composite index made up of 30% of the S&P 500 Index, which measures stock market total return performance, 65% of the Lehman Brothers Aggregate Bond Index, which measures bond market total return performance, and 5% of the MSCI EAFE Index, which measures foreign market equity performance.
ETF (Exchange Traded Fund)
A Fund that tracks an index, but can be traded like a stock.
Federal Reserve (the “Fed”)
The central bank of the United States, responsible for controlling the money supply, interest rates and credit with the goal of keeping the U.S. economy and currency stable. Governed by a seven-member board, the system includes 12 regional Federal Reserve Banks, 25 branches and all national and state banks that are part of the system.
FGIC
Financial Guaranty Insurance Company.
FHLB
Federal Home Loan Bank.
FHLMC
Federal Home Loan Mortgage Corporation.
FNMA or “Fannie Mae”
Federal National Mortgage Association.
FSA
Financial Security Assurance, Inc.
FTSE NAREIT Equity REITs Index
The FTSE NAREIT Equity REITs Index is a free-float market capitalization-weighted index measuring equity tax-qualified real estate investment trusts, which meet minimum size and liquidity criteria, that are listed on the New York Stock Exchange, the American Stock Exchange and the NASDAQ National Market System. The index is calculated on a total return basis with dividends reinvested.
Lehman Brothers Aggregate Bond Index
The Lehman Brothers Aggregate Bond Index measures the U.S. investment grade fixed rate bond market. The index is calculated on a total return basis.
MBIA
Municipal Bond Insurance Association.
Merrill Lynch 1-2.99 Year Medium Quality Corporate Bonds Index
The Merrill Lynch 1-2.99 Year Medium Quality Corporate Bonds Index measures performance of U.S. investment grade corporate bond issues rated “BBB” and “A” by Standard & Poor’s/Moody’s with maturities between one and three years. The index is calculated on a total return basis.
2
GLOSSARY (Continued)
MSCI Asia excluding Japan Total Return Index
The MSCI AC (All Country) Far East ex Japan Index is a free float-adjusted market capitalization weighted index that is designed to measure the equity market performance of the Far East, excluding Japan. As of June 2007 the MSCI AC Far East ex Japan Index consisted of the following 9 developed and emerging market country indices: China, Hong Kong, Indonesia, Korea, Malaysia, Philippines, Singapore Free, Taiwan, and Thailand.
MSCI EAFE® Index
The MSCI EAFE® Index is a free float-adjusted market capitalization index that measures developed foreign market equity performance, excluding the U.S. and Canada. The index is calculated on a total return basis with gross dividends reinvested.
MSCI Eastern Europe Total Return Index
The MSCI EM (Emerging Markets) Europe, Middle East and Africa Index is a free float-adjusted market capitalization weighted index that is designed to measure the equity market performance of the emerging market countries of Europe, the Middle East & Africa. As of June 2007, the MSCI EM EMEA Index consisted of the following 10 emerging market country indices: Czech Republic, Hungary, Poland, Russia, Turkey, Israel, Jordan, Egypt, Morocco, and South Africa.
MSCI EMU Total Return Index
The MSCI EMU (European Economic and Monetary Union) Index is a free float-adjusted market capitalization weighted index that is designed to measure the equity market performance of countries within EMU. As of June 2007 the MSCI EMU Index consisted of the following 11 developed market country indices: Austria, Belgium, Finland, France, Germany, Greece, Ireland, Italy, the Netherlands, Portugal, and Spain.
MSCI Europe Total Return Index
The MSCI Europe Index is a free float-adjusted market capitalization weighted index that is designed to measure the equity market performance of the developed markets in Europe. As of June 2007, the MSCI Europe Index consisted of the following 16 developed market country indices: Austria, Belgium, Denmark, Finland, France, Germany, Greece, Ireland, Italy, the Netherlands, Norway, Portugal, Spain, Sweden, Switzerland, and the United Kingdom.
MSCI Japan Index
The MSCI Japan IndexSM is an equity index of securities listed on Japanese stock exchanges. The index is calculated on a total return basis with gross dividends reinvested.
MSCI Latin America Total Return Index
The MSCI EM (Emerging Markets) Latin America Index is a free float-adjusted market capitalization weighted index that is designed to measure the equity market performance of emerging markets in Latin America. As of June 2007 the MSCI EM Latin America Index consisted of the following 6 emerging market country indices: Argentina, Brazil, Chile, Colombia, Mexico, and Peru.
MSCI World excluding U.S. Total Return Index
The MSCI World Index is a free float-adjusted market capitalization weighted index that is designed to measure the equity market performance of developed markets. As of June 2007 the MSCI World Index consisted of the following 23 developed market country indices: Australia, Austria, Belgium, Canada, Denmark, Finland, France, Germany, Greece, Hong Kong, Ireland, Italy, Japan, Netherlands, New Zealand, Norway, Portugal, Singapore, Spain, Sweden, Switzerland, the United Kingdom, and the United States.
PIK (Payment-in-Kind)
A bond which pays interest in the form of additional bonds, or preferred stock which pays dividends in the form of additional preferred stock.
REIT (Real Estate Investment Trust)
A publicly traded company that owns, develops and operates income-producing real estate such as apartments, office buildings, hotels, shopping centers and other commercial properties.
Russell 1000® Growth Index
The Russell 1000® Growth Index is a market capitalization-weighted index of growth-oriented stocks of the 1,000 largest companies in the Russell Universe, which comprises the 3,000 largest U.S. companies. The index is calculated on a total return basis with dividends reinvested.
Russell 1000® Value Index
The Russell 1000® Value Index is a market capitalization-weighted index of value-oriented stocks of the 1,000 largest companies in the Russell Universe, which comprises the 3,000 largest U.S. companies. The index is calculated on a total return basis with dividends reinvested.
3
GLOSSARY (Continued)
Russell 2000® Growth Index
The Russell 2000® Growth Index is a market capitalization-weighted index of growth-oriented stocks of the smallest 2,000 companies in the Russell Universe, which comprises the 3,000 largest U.S. companies. The index is calculated on a total return basis with dividends reinvested.
Russell 2000® Value Index
The Russell 2000® Value Index is a market capitalization-weighted index of value-oriented stocks of the smallest 2,000 companies in the Russell Universe, which comprises the 3,000 largest U.S. companies. The index is calculated on a total return basis with dividends reinvested.
Russell 2500TM Value Index
The Russell 2500™ Value Index is a market capitalization-weighted index of value-oriented stocks of the smallest 2,500 companies in the Russell Universe, which comprises the 3,000 largest U.S. companies. The index is calculated on a total return basis with dividends reinvested.
Russell MidCap® Growth Index
The Russell MidCap® Growth Index is a market capitalization-weighted index of medium-capitalization, growth-oriented stocks of U.S. companies. The index is calculated on a total return basis with dividends reinvested.
SBA
Small Business Administration.
S&P 500® Index
The S&P 500® Index is a free-float market capitalization-weighted index of 500 of the largest U.S. companies. The index is calculated on a total return basis with dividends reinvested.
Sponsored ADR (American Depositary Receipt)
An ADR which is issued with the cooperation of the company whose stock will underlie the ADR. These shares carry all the rights of the common share such as voting rights. ADRs must be sponsored to be able to trade on the NYSE.
Indexes are unmanaged and not available for direct investment; therefore, their performance does not reflect the expenses associated with active management of an actual portfolio.
4
THIS PAGE INTENTIONALLY BLANK.
THE PHOENIX EDGE SERIES FUND
Disclosure of Fund Expenses (Unaudited)
For the six-month period of July 1, 2007 to December 31, 2007
We believe it is important for you to understand the impact of costs on your investment. All mutual funds have operating expenses. As a shareholder of The Phoenix Edge Series Fund, you incur ongoing costs including investment advisory fees and other expenses. These examples are intended to help you understand your ongoing costs (in dollars) of investing in one of the series and to compare these costs with the ongoing costs of investing in other mutual funds. These examples are based on an investment of $1,000 invested at the beginning of the period and held for the entire six-month period.
Actual Expenses
This section of the accompanying tables provides information about actual account values and actual expenses. You may use the information in this line, together with the amount you invested, to estimate the expenses that you paid over the period. Simply divide your account value by $1,000 (for example, an $8,600 account value divided by $1,000 = 8.6), then multiply the result by the number in the first line under the heading entitled “Expenses Paid During Period” to estimate the expenses you paid on your account during this period. The expense estimate does not include the fees or expenses associated with the separate insurance accounts, and if such charges were included, returns would be lower.
Hypothetical Example for Comparison Purposes
This section of the accompanying tables provides information about hypothetical account values and hypothetical expenses based on the series’ actual expense ratio and an assumed rate of return of 5% per year before expenses, which is not your series’ actual return. The hypothetical account values and expenses may not be used to estimate the actual ending account balance or expenses you paid for the period. You may use this information to compare the ongoing costs of investing in your series and other funds. To do so, compare these 5% hypothetical examples with the 5% hypothetical examples that appear in the shareholder reports of the other funds.
Please note that the expenses shown in the accompanying tables are meant to highlight your ongoing costs only and do not reflect additional fees and expenses associated with the annuity or life insurance policy through which you invest. Therefore, this section of the accompanying tables is useful in comparing ongoing costs only, and will not help you determine the relative total costs of owning different funds. In addition, if the annuity or life insurance policy costs were included, your costs would have been higher. The calculations assume no shares were bought or sold during the period. Your actual costs may have been higher or lower, depending on the amount of your investment and the timing of any purchases or redemptions.
| | | | | | | | | | | | |
Expense Table | | | | | | | | | |
| | | Beginning | | Ending | | Annualized | | | Expenses Paid |
| | | Account Value | | Account Value | | Expense | | | During |
| | | 7/1/07 | | 12/31/07 | | Ratio | | | Period* |
Capital Growth Series | | | | | | | | | | | | |
Actual | | $ | 1,000.00 | | $ | 1,017.88 | | 0.91 | % | | $ | 4.63 |
Hypothetical (5% return before expenses) | | | 1,000.00 | | | 1,020.56 | | 0.91 | | | | 4.65 |
| | | | |
Growth and Income Series | | | | | | | | | | | | |
Actual | | $ | 1,000.00 | | $ | 998.09 | | 0.85 | % | | $ | 4.28 |
Hypothetical (5% return before expenses) | | | 1,000.00 | | | 1,020.87 | | 0.85 | | | | 4.34 |
| | | | |
Mid-Cap Growth Series | | | | | | | | | | | | |
Actual | | $ | 1,000.00 | | $ | 1,049.44 | | 1.05 | % | | $ | 5.42 |
Hypothetical (5% return before expenses) | | | 1,000.00 | | | 1,019.85 | | 1.05 | | | | 5.36 |
| | | | |
Money Market Series | | | | | | | | | | | | |
Actual | | $ | 1,000.00 | | $ | 1,024.61 | | 0.59 | % | | $ | 3.01 |
Hypothetical (5% return before expenses) | | | 1,000.00 | | | 1,022.19 | | 0.59 | | | | 3.01 |
| | | | |
Multi-Sector Fixed Income Series | | | | | | | | | | | | |
Actual | | $ | 1,000.00 | | $ | 1,022.49 | | 0.75 | % | | $ | 3.82 |
Hypothetical (5% return before expenses) | | | 1,000.00 | | | 1,021.38 | | 0.75 | | | | 3.83 |
| | | | |
Multi-Sector Short Term Bond Series | | | | | | | | | | | | |
Actual | | $ | 1,000.00 | | $ | 1,020.23 | | 0.70 | % | | $ | 3.56 |
Hypothetical (5% return before expenses) | | | 1,000.00 | | | 1,021.63 | | 0.70 | | | | 3.57 |
| | | | |
Strategic Allocation Series | | | | | | | | | | | | |
Actual | | $ | 1,000.00 | | $ | 1,015.68 | | 0.86 | % | | $ | 4.37 |
Hypothetical (5% return before expenses) | | | 1,000.00 | | | 1,020.82 | | 0.86 | | | | 4.39 |
| * | Expenses are equal to the Series’ annualized expense ratio which includes waived fees and reimbursed expenses, if applicable multiplied by the average account value over the period, multiplied by the number of days (184) expenses were accrued in the most recent fiscal half-year, then divided by 365 days to reflect the one-half year period. |
You can find more information about the Series’ expenses in the Financial Statements section that follows. For additional information on operating expenses and other shareholder costs including contractual charges associated with the separate account refer to the series prospectus and the contract prospectus.
6
THE PHOENIX EDGE SERIES FUND
Disclosure of Fund Expenses (Unaudited) (Continued)
For the six-month period of July 1, 2007 to December 31, 2007
| | | | | | | | | | | | |
Expense Table | | | | | | | | | |
| | | Beginning | | Ending | | Annualized | | | Expenses Paid |
| | | Account Value | | Account Value | | Expense | | | During |
| | | 7/1/07 | | 12/31/07 | | Ratio | | | Period* |
Aberdeen International Series | | | | | | | | | | | | |
Actual | | $ | 1,000.00 | | $ | 1,048.86 | | 0.98 | % | | $ | 5.06 |
Hypothetical (5% return before expenses) | | | 1,000.00 | | | 1,020.20 | | 0.98 | | | | 5.00 |
| | | | |
Alger Small-Cap Growth Series | | | | | | | | | | | | |
Actual | | $ | 1,000.00 | | $ | 1,036.63 | | 1.00 | % | | $ | 5.13 |
Hypothetical (5% return before expenses) | | | 1,000.00 | | | 1,020.10 | | 1.00 | | | | 5.10 |
| | | | |
Duff & Phelps Real Estate Securities Series | | | | | | | | | | | | |
Actual | | $ | 1,000.00 | | $ | 913.58 | | 1.00 | % | | $ | 4.82 |
Hypothetical (5% return before expenses) | | | 1,000.00 | | | 1,020.10 | | 1.00 | | | | 5.10 |
| | | | |
S&P Dynamic Asset Allocation Series: Aggressive Growth | | | | | | | | | | | | |
Actual | | $ | 1,000.00 | | $ | 1,000.86 | | 0.70 | % | | $ | 3.53 |
Hypothetical (5% return before expenses) | | | 1,000.00 | | | 1,021.63 | | 0.70 | | | | 3.57 |
| | | | |
S&P Dynamic Asset Allocation Series: Growth | | | | | | | | | | | | |
Actual | | $ | 1,000.00 | | $ | 1,012.16 | | 0.70 | % | | $ | 3.55 |
Hypothetical (5% return before expenses) | | | 1,000.00 | | | 1,021.63 | | 0.70 | | | | 3.57 |
| | | | |
S&P Dynamic Asset Allocation Series: Moderate | | | | | | | | | | | | |
Actual | | $ | 1,000.00 | | $ | 1,039.69 | | 0.70 | % | | $ | 3.60 |
Hypothetical (5% return before expenses) | | | 1,000.00 | | | 1,021.63 | | 0.70 | | | | 3.57 |
| | | | |
S&P Dynamic Asset Allocation Series: Moderate Growth | | | | | | | | | | | | |
Actual | | $ | 1,000.00 | | $ | 1,025.21 | | 0.70 | % | | $ | 3.57 |
Hypothetical (5% return before expenses) | | | 1,000.00 | | | 1,021.63 | | 0.70 | | | | 3.57 |
| | | | |
Sanford Bernstein Mid-Cap Value Series | | | | | | | | | | | | |
Actual | | $ | 1,000.00 | | $ | 891.06 | | 1.30 | % | | $ | 6.20 |
Hypothetical (5% return before expenses) | | | 1,000.00 | | | 1,018.57 | | 1.30 | | | | 6.64 |
| | | | |
Sanford Bernstein Small-Cap Value Series | | | | | | | | | | | | |
Actual | | $ | 1,000.00 | | $ | 878.16 | | 1.30 | % | | $ | 6.15 |
Hypothetical (5% return before expenses) | | | 1,000.00 | | | 1,018.57 | | 1.30 | | | | 6.64 |
| | | | |
Van Kampen Comstock Series | | | | | | | | | | | | |
Actual | | $ | 1,000.00 | | $ | 921.26 | | 0.95 | % | | $ | 4.60 |
Hypothetical (5% return before expenses) | | | 1,000.00 | | | 1,020.36 | | 0.95 | | | | 4.85 |
| | | | |
Van Kampen Equity 500 Index Series | | | | | | | | | | | | |
Actual | | $ | 1,000.00 | | $ | 983.01 | | 0.55 | % | | $ | 2.75 |
Hypothetical (5% return before expenses) | | | 1,000.00 | | | 1,022.40 | | 0.55 | | | | 2.81 |
| * | Expenses are equal to the Series’ annualized expense ratio which includes waived fees and reimbursed expenses, if applicable multiplied by the average account value over the period, multiplied by the number of days (184) expenses were accrued in the most recent fiscal half-year, then divided by 365 days to reflect the one-half year period. |
You can find more information about the Series’ expenses in the Financial Statements section that follows. For additional information on operating expenses and other shareholder costs including contractual charges associated with the separate account refer to the series prospectus and the contract prospectus.
7
Capital Growth Series
Product Manager Commentary
| • | | Phoenix Capital Growth Series (“Capital Growth”) Seeks intermediate and long-term capital appreciation, with income as a secondary consideration. |
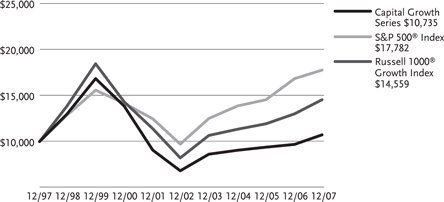
• | | For the 12-month reporting period, the Series returned 10.75%. For the same period, the S&P 500® Index, a broad-based equity index, returned 5.49% and the Russell 1000® Growth Index, the Series’ style-specific benchmark, returned 11.81%. |
All performance figures assume the reinvestment of distributions and exclude the effect of fees and expenses associated with the variable life insurance or annuity product through which you invest. Past performance is no guarantee of future results and current performance may be higher or lower than the performance shown above.
How did the equity markets perform during the Fund’s fiscal year?
| • | | The four quarters of 2007 experienced significant shifts in economic expectations. In the first quarter of 2007 the market’s focus became the subprime mortgage issues, and the widespread impact. The result being the toll taken on financial stocks, resulting in a volatile and flat equity market. Second quarter ‘07 experienced thriving merger and acquisition activity, despite rising inflationary (commodity driven) fears, interest rates, and the continued deterioration of the housing markets. Third quarter of ‘07 experienced a liquidity freeze-up and credit-market meltdown which led to a volatile quarter. Investors reassessed their appetite for risk, as mergers and acquisitions activity came to a near standstill. These pressures and issues inspired the Federal Reserve to lower interest rates, leading to a rally, yet overall equity market sectors posted mixed results. During this period, as Hedge funds were forced to unwind leveraged positions (sell long holdings and cover short positions) to raise liquidity, investment strategies focusing on attractive valuations and higher quality suffered. Many of the same themes which impacted returns in the third quarter continued to negatively impact the U.S. equity markets during fourth quarter ‘07 as well. Most notably, the uncertainty surrounding the real estate and subprime mortgage markets intensified, leading to further doubt as to whether the ever-resilient consumer will be able to keep the economy free from recession in 2008. Further, energy prices continued on their upward path, resulting in a further cut of the consumer wallet. The Fed is doing its best trapeze act — trying to balance inflation and economic weakness. In all, these fears, issues and uncertainties have led to a volatile market environment. Over the year, growth stocks generally outperformed value. |
What factors affected the Fund’s performance during its fiscal year?
| • | | Overall, sector allocation proved very additive to returns due primarily to being underweight in the Consumer Discretionary Sector and overweight in the Materials and Energy Sectors. However, selective stock holdings detracted from returns, primarily within the Industrials and Information Technology Sectors. |
| • | | Apple, a computer, digital music and mobile communications equipment manufacturer; Freeport-McMoRan, a metals mining and manufacturing company; Celanese, an industrial chemical provider; and Oracle, an enterprise software provider were the top contributors during the year. Detracting from performance were Continental Airlines, an air carrier; Electronic Data Systems, an electronic data processing provider; Watson Pharmaceuticals, a generic and branded pharmaceutical products company and WellCare Group, a managed healthcare provider. |
| • | | Looking ahead to 2008, investors will continue to weigh the severity of any potential economic slowdown, the Federal Reserve’s stance on inflationary pressures, the impact of the mortgage and real estate markets, the trend in both energy prices and the dollar, the level and outlook for employment, and overall, the affects felt by the consumer. We strongly believe that over the long-term, what matters most is the earnings growth and valuation of individual companies. Our investment process mirrors this view, with a continued focus on quality companies exhibiting improving fundamentals, attractive valuations and positive investor interest. We remain confident that the consistent application of our disciplined investment process will continue to produce superior results over the long term. |
The preceding information is the opinion of portfolio management only through the end of the period of the report as stated on the cover. Any such opinions are subject to change at any time based upon market or conditions and should not be relied on as investment advice.
Because the Series is heavily weighted in the technology sector, it will be impacted by that Sector’s performance more than a series with broader sector diversification.
For information regarding the indexes and certain investment terms see the glossary starting on page 2.
8
Capital Growth Series (continued)
Average Annual Total Return1 for periods ended 12/31/07
| | | | | | | | | |
| | | 1 year | | | 5 years | | | 10 years | |
Capital Growth Series | | 10.75 | % | | 9.50 | % | | 0.71 | % |
S&P 500® Index | | 5.49 | | | 12.83 | | | 5.92 | |
Russell 1000® Growth Index | | 11.81 | | | 12.11 | | | 3.83 | |
Series expense ratios2: Gross: 0.92%; Net: 0.92%.
Returns represent past performance, which is no guarantee of future results. The investment return and principal value will fluctuate so that an investor’s shares, when redeemed, may be worth more or less than the original cost. Total return does not reflect expenses associated with the separate account such as the administrative fees, account charges and surrender charges, which if reflected, would reduce total return. Performance figures may reflect voluntary fee waivers and/or expense reimbursements. In the absence of voluntary fee waivers and/or expense reimbursements, the total return would have been lower. Please visit PhoenixWM.com for performance data current to the most recent month-end.
1 | Total returns are historical and include changes in share price and the reinvestment of both dividends and capital gains distributions. |
2 | The expense ratio(s) of the Series, both net and gross are set forth according to the prospectus for the Series effective 5/1/07, and may differ from the expense ratios disclosed in the financial highlights tables in this report. Net expenses: Expenses reduced by a contractual waiver in effect through 4/30/08. Gross Expenses: Do not reflect the effect of the contractual waiver. |
Growth of $10,000 For periods ended 12/31
This chart assumes an initial investment of $10,000 made on 12/31/97. Returns shown include the reinvestment of all distributions at net asset value, and the change in share price for the stated period.
Sector Weightings as of 12/31/07*
| | | |
Information Technology | | 31 | % |
Health Care | | 19 | |
Industrials | | 12 | |
Energy | | 9 | |
Consumer Discretionary | | 7 | |
Materials | | 7 | |
Consumer Staples | | 6 | |
Other (includes short-term investments) | | 9 | |
| * | % of total investments as of December 31, 2007. |
For information regarding the indexes and certain investment terms see the glossary starting on page 2.
9
Growth and Income Series
Product Manager Commentary
| • | | Phoenix Growth and Income Series (“Growth and Income”) Seeks dividend growth, current income and capital appreciation. |
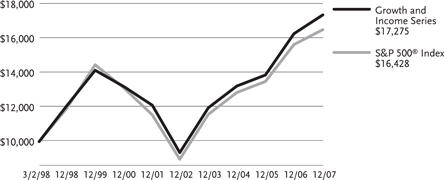
• | | For the 12-month reporting period the Series returned 6.66%. For the same period, the S&P 500® Index, a broad-based equity index, returned 5.49%. |
All performance figures assume the reinvestment of distributions and exclude the effect of fees and expenses associated with the variable life insurance or annuity product through which you invest. Past performance is no guarantee of future results and current performance may be higher or lower than the performance shown.
How did the Equity markets perform during the Series’ fiscal year?
| • | | The return of volatility was the key theme for the year. After posting new highs for the S&P 500 in early October, stocks turned lower on credit issues tied to subprime mortgages. The mortgages had been dissected and repackaged into securities held by large banks, brokers and insurance companies. When the low teaser rates on the mortgages reset, homeowners could no longer make their payments and the instruments defaulted. This resulted in a huge credit squeeze, causing the Fed to begin lowering interest rates in order to steer the economy away from falling into a recession. There were billion dollar write-downs of investments and several CEOs were fired. |
Also affecting the markets was a rise in the price of crude oil and a sharp decline in the value of the U.S. Dollar. Because of these issues, the United States equity markets posted mixed returns for the calendar year 2007.
The fund’s benchmark, the Standard & Poor’s 500, is a representative index for large capitalization stocks and it returned 5.49%. The small cap benchmark, Russell 2000, posted a loss of 1.57%. In terms of style indices, Value stocks returned less than Growth stocks for the fiscal year. The Russell 1000 Value Index had a slight loss of 0.17%, while the Russell 1000 Growth Index had a double-digit gain of 11.81%. With sub-par returns in broad-based U.S. indices, the real action was in overseas emerging markets stocks. The MSCI Emerging Markets index posted a huge gain of 39.78%. We did not participate in this market because emerging foreign companies are not in our investment universe.
What factors affected the Series’ performance during its fiscal year?
| • | | Performance for the year was favorable. The Growth & Income Series returned 6.66%. The investment portfolio return was 117 basis points higher than the 5.49% total return for the fund’s benchmark, the Standard & Poor’s 500. |
In relation to the benchmark index, the fund benefited the most from sector positioning in Financials, Consumer Discretionary and Health Care. Sector positioning in Information Technology, Consumer Staples and Materials had an adverse impact on the funds performance relative to its benchmark. The top five individual stock contributors were Exxon Mobil, Occidental Petroleum, Microsoft, AT&T and National Oilwell Varco. The bottom five contributors were Citigroup, Bank of America, Merrill Lynch, American International Group and Tyco.
The preceding information is the opinion of portfolio management only through the end of the period of the report as stated on the cover. Any such opinions are subject to change at any time based upon market or other conditions and should not be relied on as investment advice.
Investing internationally involves risks not associated with investing solely in the U.S., such as currency fluctuation, political risk, differences in accounting and the limited availability of information.
For information regarding the indexes and certain investment terms see the glossary starting on page 2.
10
Growth and Income Series (continued)
Average Annual Total Return1 for periods ended 12/31/07
| | | | | | | | | | | |
| | | | | | | | | Inception | | | Inception |
| | | 1 year | | | 5 years | | | to 12/31/07 | | | Date |
Growth and Income Series | | 6.66 | % | | 13.02 | % | | 5.71 | % | | 3/2/98 |
S&P 500® Index | | 5.49 | | | 12.83 | | | 5.18 | | | 3/2/98 |
Series expense ratios2: Gross: 0.97%; Net: 0.91%.
Returns represent past performance, which is no guarantee of future results. The investment return and principal value will fluctuate so that an investor’s shares, when redeemed, may be worth more or less than their original cost. Total return does not reflect expenses associated with the separate account such as the administrative fees, account charges and surrender charges, which if reflected, would reduce total return. Performance figures may reflect voluntary fee waivers and/or expense reimbursements. In the absence of voluntary fee waivers and/or expense reimbursements, the total return would have been lower. Please visit PhoenixWM.com for performance data current to the most recent month-end.
1 | Total returns are historical and include changes in share price and the reinvestment of both dividends and capital gains distributions. |
2 | The expense ratio(s) of the Series, both net and gross are set forth according to the prospectus for the Series effective 5/1/07 and may differ from the expense ratios disclosed in the financial highlights tables in this report. Net expenses: Expenses reduced by a contractual waiver in effect through 4/30/08. Gross Expenses: Do not reflect the effect of the contractual waiver. |
Growth of $10,000 For periods ended 12/31
This chart assumes an initial investment of $10,000 made on 3/2/98. Returns shown include the reinvestment of all distributions at net asset value, and the change in share price for the stated period.
Sector Weightings as of 12/31/07*
| | | |
Financials | | 20 | % |
Information Technology | | 18 | |
Health Care | | 13 | |
Energy | | 12 | |
Industrials | | 11 | |
Consumer Discretionary | | 9 | |
Consumer Staples | | 7 | |
Other (includes short-term investments) | | 10 | |
| * | % of total investments as of December 31, 2007. |
For information regarding the indexes and certain investment terms see the glossary starting on page 2.
11
Mid-Cap Growth Series
Product Manager Commentary
| • | | Phoenix Mid-Cap Growth Series (“Mid-Cap Growth”) Seeks capital appreciation. |
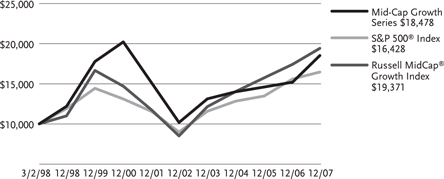
• | | For the 12-month reporting period the Series returned 21.80%. For the same period, the S&P 500® Index, a broad-based equity index, returned 5.49% and the Russell MidCap® Growth Index, the Series’ style-specific benchmark, returned 11.43%. |
| • | | All performance figures assume the reinvestment of distributions and exclude the effect of fees and expenses associated with the variable life insurance or annuity product through which you invest. Past performance is no guarantee of future results and current performance may be higher or lower than the performance shown. |
For the period of January 1, 2007 through November 2007 Bennett Lawrence Management, LLC was the sub-advisor for the Phoenix Mid-Cap Growth Edge Series.
How did the Equity markets perform during the Series’ fiscal year?
In the following commentary Bennett Lawrence Management, LLC discusses the performance under their management Series.
| • | | The year started off on a strong note as inflation and interest rate concerns took a back seat to good earnings reports and reasonable equity valuations. Beneath the surface, a change in investor preferences had begun. For the first time in a long while, demand for growth stocks strengthened. Historically, mid-cycle slowdowns (the stage in the cycle that we appeared to be in the majority of the year) have tended to favor equities in general and growth stocks in particular. As a result, earnings visibility became a most desirable trait and for the first time in seven years, growth stocks outperformed value. |
| • | | Toward the end of the year, worries mounted over housing, a credit crunch and possible recession. Volatility became pronounced and the averages started to lose ground. Fortunately, the Federal Reserve had begun a campaign to restore liquidity to the credit markets. Hopefully this will provide a counterbalance to the host of issues that are on the minds of investors and weighing on share prices. |
What factors affected the Series’ performance during its fiscal year?
| • | | The combination of strong demand for growth stocks, prescient industry/sector allocation decisions and strong operating results from our portfolio companies enabled the Series portfolio to enjoy performance that was over 2.5 times greater than the Russell Midcap Growth Index. |
| • | | For the first time in a long while, earnings growth was directly correlated to share performance. Generally speaking, the better the operating results, the more impressive the share gains. Needless to say, this was a very good backdrop for our high-growth investment strategy. In addition, we were rewarded for overweighting the technology sector, as trends including electronic payment transfer, e-commerce, software as a service, online advertising and solar energy were very pervasive. Finally, the overwhelming majority of our companies delivered operating results that exceeded consensus estimates and led to positive momentum among the Series’ portfolio holdings. |
Neuberger Berman began sub-advising the Portfolio at the end of November 2007.
How did the Equity markets perform during the Series’ fiscal year?
| • | | In the following commentary Neuberger Berman Management, Inc. discusses the Series performance since their becoming subadvisor. |
| • | | In 2007, Large- and Mid-Cap shares outpaced smaller issues while growth style results outpaced value across the capitalization spectrum, the first time since 1999. As the subprime issues continued to work their way through the system, Financials, a large percentage of the value indices, were among the weakest performing sectors for the year. Other sectors that were weaker links included consumer-related areas. Telecom was an area of weakness as concerns regarding a slowdown in consumer spending negatively impacted the sector. Mid-Caps were the best performing capitalization bucket for the year. This was in part due to private equity firms fueling acquisitions in the Mid-Cap space which impacted the portfolio as we had several take overs during the year. |
What factors affected the Series’ performance during its fiscal year?
| • | | Equity market returns for the year 2007 were for the most part positive and volatility had been on an up tick for much of the year as subprime issues continued to unfold throughout the year. As volatility increases, companies that exhibit earnings quality, which is what we seek to identify in our process, continue to be rewarded in the marketplace. This type of environment serves our quality focus well. We continue to believe that companies that demonstrate the ability to grow earnings on a consistent basis in this slowing environment will be rewarded as investors will pay up for this attribute. This was the case for much of 2007 and we believe that this will continue to be the backdrop for adding value in 2008. |
| • | | We remain cautious of areas linked to the average consumer and will therefore remain market-underweight in both Consumer Staples and Discretionary. We continue to play niche areas within Consumer Discretionary such as hotels, gaming and secondary education. The Portfolio continues to be market weight in Industrials with an emphasis on niche areas such as aviation. Although slightly underweight at this time, we continue to believe that Energy will provide earnings growth potential given worldwide demand, and we anticipate moving toward a neutral weighting opportunistically. Due to the spread of subprime worries, and especially their effect on Financials, we will remain underweight in this area at this time. We are also currently overweighted in both the Health Care and Information Technology sectors emphasizing medical diagnostics and specialized software and services, respectively. |
The preceding information is the opinion of portfolio management only through the end of the period of the report as stated on the cover. Any such opinions are subject to change at any time based upon market or conditions and should not be relied on as investment advice.
Investing internationally involves risks not associated with investing solely in the U.S., such as currency fluctuation, political risk, differences in accounting and the limited availability of information.
Investing in the securities of small and mid-sized companies involves risks, such as relatively low trading volumes, more price volatility and less liquidity than securities from larger, more established companies.
For information regarding the indexes and certain investment terms see the glossary starting on page 2.
12
Mid-Cap Growth Series (continued)
Average Annual Total Return1 for periods ended 12/31/07
| | | | | | | | | | | |
| | | | | | | | | Inception
to 12/31/07 | | | Inception
Date |
| | | 1 year | | | 5 years | | | |
Mid-Cap Growth Series | | 21.80 | % | | 12.68 | % | | 6.44 | % | | 3/2/98 |
S&P 500® Index | | 5.49 | | | 12.83 | | | 5.18 | | | 3/2/98 |
Russell MidCap® Growth Index | | 11.43 | | | 17.90 | | | 6.95 | | | 3/2/98 |
Series expense ratios2: Gross: 1.14%; Net: 1.10%.
Returns represent past performance, which is no guarantee of future results. The investment return and principal value will fluctuate so that an investor’s shares, when redeemed, may be worth more or less than their original cost. Total return does not reflect expenses associated with the separate account such as the administrative fees, account charges and surrender charges, which if reflected, would reduce total return. Performance figures may reflect voluntary fee waivers and/or expense reimbursements. In the absence of voluntary fee waivers and/or expense reimbursements, the total return would have been lower. Please visit PhoenixWM.com for performance data current to the most recent month-end.
1 | Total returns are historical and include changes in share price and the reinvestment of both dividends and capital gains distributions. |
2 | The expense ratio(s) of the Series, both net and gross are set forth according to the prospectus for the Series effective 5/1/07, and may differ from the expense ratios disclosed in the financial highlights tables in this report. Net expenses: Expenses reduced by a contractual waiver in effect through 4/30/08. Gross Expenses: Do not reflect the effect of the contractual waiver. |
Growth of $10,000 For periods ended 12/31
This chart assumes an initial investment of $10,000 made on 3/2/98. Returns shown include the reinvestment of all distributions at net asset value, and the change in share price for the stated period.
Fund Investment Allocation as of 12/31/07*
| | | |
Information Technology | | 21 | % |
Industrials | | 16 | |
Health Care | | 16 | |
Consumer Discretionary | | 15 | |
Energy | | 10 | |
Financials | | 6 | |
Consumer Staples | | 5 | |
Other (includes short-term investments) | | 11 | |
| * | % of total investments as of December 31, 2007. |
For information regarding the indexes and certain investment terms see the glossary starting on page 2.
13
Money Market Series
| • | | Phoenix Money Market Series (“Money Market”) |
Seeks as high a level of current income as is consistent with the preservation of capital and maintenance of liquidity.
Average Annual Total Return1 for periods ended 12/31/07
| | | | | | | | | |
| | | 1 year | | | 5 years | | | 10 years | |
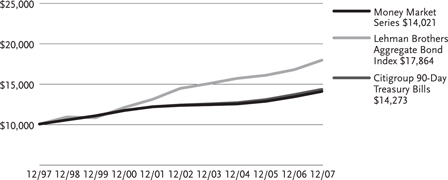
Money Market Series at NAV2 | | 4.88 | % | | 2.65 | % | | 3.44 | % |
Lehman Brothers Aggregate Bond Index | | 6.97 | | | 4.42 | | | 5.97 | |
Citigroup 90-Day Treasury Bills | | 4.74 | | | 2.95 | | | 3.62 | |
Series expense ratios2: Gross: 0.66%; Net: 0.65%.
All returns represent past performance which is no guarantee of future results. Current performance may be higher or lower than the performance shown. The investment return and principal value of an investment will fluctuate so that an investor’s shares, when redeemed, may be worth more or less than their original cost. The above table and graph below do not reflect the deduction of taxes that a shareholder would pay on fund distributions or the redemption of shares. Please visit phoenixfunds.com for performance data current to the most recent month-end.
1 | Total returns are historical and include changes in share price and the reinvestment of both dividends and capital gains distributions. |
2 | The expense ratio(s) of the Series, both net and gross are set forth according to the prospectus for the Series effective 5/1/07, and may differ from the expense ratios disclosed in the financial highlights tables in this report. Net expenses: Expenses reduced by a contractual waiver in effect through 4/30/08. Gross Expenses: Do not reflect the effect of the contractual waiver. |
Growth of $10,000 For periods ended 12/31
This chart assumes an initial investment of $10,000 made on 12/31/97. Returns shown include the reinvestment of all distributions at net asset value, and the change in share price for the stated period.
Sector Weightings as of 12/31/07*
| | | |
Commercial Paper | | 64 | % |
Federal Agency Securities | | 19 | |
Medium Term Notes | | 17 | |
| * | % of total investments as of December 31, 2007. |
For information regarding the indexes and certain investment terms see the glossary starting on page 2.
14
THIS PAGE INTENTIONALLY BLANK.
Multi-Sector Fixed Income Series
Product Manager Commentary
| • | | Phoenix Multi-Sector Fixed Income Series (“Multi-Sector Fixed Income”) Seeks long-term total return. |
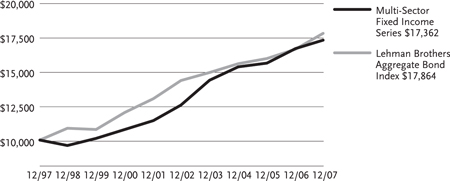
| • | | For the 12-month reporting period the Series returned 3.71%. For the same period, the Lehman Brothers Aggregate Bond Index, a broad-based fixed income index, returned 6.97%. |
All performance figures assume the reinvestment of distributions and exclude the effect of fees and expenses associated with the variable life insurance or annuity product through which you invest. Past performance is no guarantee of future results and current performance may be higher or lower than the performance shown.
How did the Fixed Income markets perform during the Series’ fiscal year?
• | | The broad U.S. fixed income market, as represented by the Lehman Brothers Aggregate Bond Index returned 6.97% for the fiscal year ended December 31, 2007. In the first five meetings of the year, the Fed kept the federal funds rate unchanged at 5.25%. On September 18, 2007, the Fed cut the federal funds rate by 0.50% to 4.75%, citing concerns that tightening credit conditions could potentially increase the strain on the housing market, eventually leading to lower-than-expected economic growth. The Fed proceeded to cut rates another 0.25% at each of its next two meetings on October 31 st and December 11th. Since the beginning of the year the yield curve has steepened, with rates declining across the curve. |
• | | The 1st half of 2007 can best be characterized as a low volatility, benign credit environment. It was in this atmosphere that non-treasury fixed income sectors outperformed. In stark contrast, the 2nd half of 2007 was extraordinarily volatile. This was primarily due to fear surrounding the subprime mortgage market and its resulting contagion. These fears caused a very significant flight to quality which resulted in dramatic spread widening in all sectors of the bond market. So significant was this flight to quality, that it caused treasuries to outperform almost all spread sectors, the exception being out-performance by some non-U.S. Dollar investments. |
What factors affected the Series’ performance during its fiscal year?
| • | | The decision to maintain an underweight to U.S. Treasuries in favor of spread sectors was the largest detractor to performance for the fiscal year ended December 31, 2007. Treasuries outperformed as concerns over subprime sparked a flight to quality, causing spreads in many sectors to widen. This environment typically does not favor our style of investing. Among the series’ investment in spread sectors, the allocation to emerging market securities detracted the most from performance. Within emerging markets, the overweight to Argentina and Venezuela were the key drivers of underperformance. |
| • | | The largest positive contributor to performance was the series’ exposure to non U.S. Dollar investments, which benefited from market expectations that the Federal Reserve would cut U.S. interest rates in 2007 and stronger growth outside of the United States. An additional positive contributor to the series’ performance was our issue selection within the investment grade corporate sector, which out-performed the Lehman U.S. Corporate Investment Grade Bond Index. Although the series’ allocation to the corporate high-yield sector hurt performance the higher quality focus and underweight to CCC securities within the sector helped performance. For the year the Caa component of the Lehman High Yield Index returned -0.13%, while the Ba and B components returned 1.75% and 3.12%, respectively. |
The preceding information is the opinion of portfolio management only through the end of the period of the report as stated on the cover. Any such opinions are subject to change at any time based upon market or conditions and should not be relied on as investment advice.
Investing internationally involves risks not associated with investing solely in the U.S., such as currency fluctuation, political risk, differences in accounting and the limited availability of information.
The series’ use of derivatives such as futures, options and swap agreements to pursue their investment objectives may expose the series to additional risks that it would not be subject to if it invested directly in the securities underlying those derivatives. These risks may cause the series to experience higher losses than series that do not use derivatives.
For information regarding the indexes and certain investment terms see the glossary starting on page 2.
16
Multi-Sector Fixed Income Series (continued)
Average Annual Total Return1 for periods ended 12/31/07
| | | | | | | | | |
| | | 1 year | | | 5 years | | | 10 years | |
Multi-Sector Fixed Income Series | | 3.71 | % | | 6.66 | % | | 5.67 | % |
Lehman Brothers Aggregate Bond Index | | 6.97 | | | 4.42 | | | 5.97 | |
Series expense ratios2: Gross: 0.74%; Net: 0.74%.
Returns represent past performance, which is no guarantee of future results. The investment return and principal value will fluctuate so that an investor’s shares, when redeemed, may be worth more or less than the original cost. Total return does not reflect expenses associated with the separate account such as the administrative fees, account charges and surrender charges, which if reflected, would reduce total return. Performance figures may reflect voluntary fee waivers and/or expense reimbursements. In the absence of voluntary fee waivers and/or expense reimbursements, the total return would have been lower. Please visit PhoenixWM.com for performance data current to the most recent month-end.
1 | Total returns are historical and include changes in share price and the reinvestment of both dividends and capital gains distributions. |
2 | The expense ratio(s) of the Series, both net and gross are set forth according to the prospectus for the Series effective 5/1/07, and may differ from the expense ratios disclosed in the financial highlights tables in this report. Net expenses: Expenses reduced by a contractual waiver in effect through 4/30/08. Gross Expenses: Do not reflect the effect of the contractual waiver. |
Growth of $10,000 For periods ended 12/31
This chart assumes an initial investment of $10,000 made on 12/31/97. Returns shown include the reinvestment of all distributions at net asset value, and the change in share price for the stated period.
Fund Investment Allocation as of 12/31/07*
| | | |
Domestic Corporate Bonds | | 24 | % |
Foreign Government Securities | | 17 | |
Foreign Corporate Bonds | | 9 | |
Non-Agency Mortgage-Backed Securities | | 8 | |
Domestic Loan Agreements | | 8 | |
Agency Mortgage-Backed Securities | | 7 | |
U.S. Government Securities | | 5 | |
Other (includes short-term investments) | | 22 | |
| * | % of total investments as of December 31, 2007. |
For information regarding the indexes and certain investment terms see the glossary starting on page 2.
17
Multi-Sector Short Term Bond Series
Product Manager Commentary
| • | | Phoenix Multi-Sector Short-Term Bond Series (“Multi-Sector Short Term Bond”) Seeks to provide high current income while attempting to limit changes in the Series net assets caused by interest rate changes. |
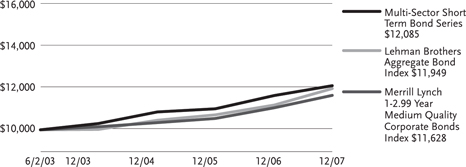
| • | | For the 12-month reporting period the Series returned 3.99%. For the same period, the Lehman Brothers Aggregate Bond Index, a broad-based fixed income index, returned 6.97% and the Merrill Lynch 1-2.99 Year Medium Quality Corporate Bonds Index, the Series’ style-specific benchmark, returned 5.31%. |
All performance figures assume the reinvestment of distributions and exclude the effect of fees and expenses associated with the variable life insurance or annuity product through which you invest. Past performance is no guarantee of future results and current performance may be higher or lower than the performance shown.
How did the Fixed Income markets perform during the Series’ fiscal year?
• | | The broad U.S. fixed income market, as represented by the Lehman Brothers Aggregate Bond Index returned 6.97% for the fiscal year ended December 31, 2007. In the first five meetings of the year the Fed kept the federal funds rate unchanged at 5.25%. On September 18, 2007, the Fed cut the federal funds rate by 0.50% to 4.75%, citing concerns that tightening credit conditions could potentially increase the strain on the housing market, eventually leading to lower than expected economic growth. The Fed proceeded to cut rates another 0.25% at each of its next two meetings on October 31 st and December 11th. Since the beginning of the year the yield curve has steepened, with rates declining across the curve. |
• | | The 1st half of 2007 can best be characterized as a low volatility, benign credit environment. It was in this atmosphere that non-treasury fixed income sectors outperformed. In stark contrast, the 2nd half of 2007 was extraordinarily volatile. This was primarily due to fear surrounding the subprime mortgage market and its resulting contagion. These fears caused a very significant flight to quality which resulted in dramatic spread widening in all sectors of the bond market. So significant was this flight to quality, that it caused treasuries to outperform almost all spread sectors, the exception being out-performance by some non-U.S. Dollar investments. |
What factors affected the Series’ performance during its fiscal year?
| • | | The decision to maintain an underweight to U.S. Treasuries in favor of spread sectors was the largest detractor to performance for the fiscal year ended December 31, 2007. Treasuries outperformed as concerns over subprime sparked a flight to quality, causing spreads in many sectors to widen. This environment typically does not favor our style of investing, however, our ability to be tactical in our use of high quality substitutes for investment-grade corporates contributed positively to performance for the year. Among the series’ investment in spread sectors, the overweight to asset backed securities detracted the most from performance. The asset-backed sector was pressured by the home equity sub-component, which suffered from weakness in the underlying collateral. |
| • | | The largest positive contributor to performance was the series’ exposure to non U.S. Dollar investments, which benefited from market expectations that the Federal Reserve would cut U.S. interest rates in 2007 and stronger growth outside of the United States. Although the series’ allocation to the corporate high yield sector hurt performance the higher quality focus and underweight to CCC securities within the sector helped performance. For the year the Caa component of the Lehman High Yield Index returned -0.13%, while the Ba and B components returned 1.75% and 3.12% respectively. As of 12/31/07, the series held 0% in Caa U.S. corporate securities, while the index had 19.96%. |
The preceding information is the opinion of portfolio management only through the end of the period of the report as stated on the cover. Any such opinions are subject to change at any time based upon market or conditions and should not be relied on as investment advice.
Investing internationally involves risks not associated with investing solely in the U.S., such as currency fluctuation, political risk, differences in accounting and the limited availability of information.
The value of mortgage-backed and other asset securities, including pass-through type securities and collateralized mortgage obligations (CMO’s) may fluctuate to a greater degree than other debt securities in response to interest rate changes.
The series’ use of derivatives such as futures, options and swap agreements to pursue their investment objectives may expose the series to additional risks that it would not be subject to if it invested directly in the securities underlying those derivatives. These risks may cause the series to experience higher losses than series that do not use derivatives.
For information regarding the indexes and certain investment terms see the glossary starting on page 2.
18
Multi-Sector Short Term Bond Series (continued)
Average Annual Total Return1 for periods ended 12/31/07
| | | | | | | | |
| | | | | | Inception | | | Inception |
| | | 1 year | | | to 12/31/07 | | | Date |
Multi-Sector Short Term Bond Series | | 3.99 | % | | 4.22 | % | | 6/2/03 |
Lehman Brothers Aggregate Bond Index | | 6.97 | | | 3.96 | | | 6/2/03 |
Merrill Lynch 1-2.99 Year Medium Quality Corporate Bonds Index | | 5.31 | | | 3.40 | | | 6/2/03 |
Series expense ratios2: Gross: 0.88%; Net: 0.70%.
Returns represent past performance, which is no guarantee of future results. The investment return and principal value will fluctuate so that an investor’s shares, when redeemed, may be worth more or less than their original cost. Total return does not reflect expenses associated with the separate account such as the administrative fees, account charges and surrender charges, which if reflected, would reduce total return. Performance figures may reflect voluntary fee waivers and/or expense reimbursements. In the absence of voluntary fee waivers and/or expense reimbursements, the total return would have been lower. Please visit PhoenixWM.com for performance data current to the most recent month-end.
1 | Total returns are historical and include changes in share price and the reinvestment of both dividends and capital gains distributions. |
2 | The expense ratio(s) of the Series, both net and gross are set forth according to the prospectus for the Series effective 5/1/07, and may differ from the expense ratios disclosed in the financial highlights tables in this report. Net expenses: Expenses reduced by a contractual waiver in effect through 4/30/08. Gross Expenses: Do not reflect the effect of the contractual waiver. |
Growth of $10,000 For periods ended 12/31
This chart assumes an initial investment of $10,000 made on 6/2/03. Returns shown include the reinvestment of all distributions at net asset value, and the change in share price for the stated period.
Fund Investment Allocation as of 12/31/07*
| | | |
Non-Agency Mortgage-Backed Securities | | 22 | % |
Domestic Corporate Bonds | | 19 | |
Foreign Government Securities | | 16 | |
Foreign Corporate Bonds | | 9 | |
Domestic Loan Agreements | | 9 | |
Agency Mortgage-Backed Securities | | 8 | |
Asset-Backed Securities | | 6 | |
Other (includes short-term investments) | | 11 | |
| * | % of total investments as of December 31, 2007. |
For information regarding the indexes and certain investment terms see the glossary starting on page 2.
19
Strategic Allocation Series
Product Manager Commentary
| • | | Phoenix Strategic Allocation Series (“Strategic Allocation”) Seeks high total return over an extended period of time consistent with prudent investment risk. |
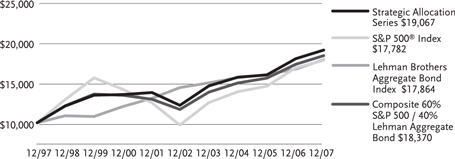
• | | For the 12-month reporting period the Series returned 5.98%. For the same period, the S&P 500® Index, a broad-based equity index, returned 5.49% and the Lehman Brothers Aggregate Bond Index, a broad-based fixed income index returned 6.97%. The Composite Index for Strategic Allocation Series, the Series’ style-specific benchmark, returned 6.22%. |
All performance figures assume the reinvestment of distributions and exclude the effect of fees and expenses associated with the variable life insurance or annuity product through which you invest. Past performance is no guarantee of future results and current performance may be higher or lower than the performance shown.
How did the Equity markets perform during the Series’ fiscal year?
| • | | The return of volatility was the key theme for the year. After posting new highs for the S&P 500 in early October, stocks turned lower on credit issues tied to subprime mortgages. The mortgages had been dissected and repackaged into securities held by large banks, brokers and insurance companies. When the low teaser rates on the mortgages reset, homeowners could no longer make their payments and the instruments defaulted. This resulted in a huge credit squeeze, causing the Fed to begin lowering interest rates in order to steer the economy away from falling into a recession. There were billion dollar write-downs of investments and several CEOs were fired. Also, affecting the markets was a rise in the price of crude oil and a sharp decline in the value of the U.S. dollar. Because of these issues, the United States equity markets posted mixed returns for the calendar year 2007. |
The fund’s benchmark, the Standard & Poor’s 500, is a representative index for large capitalization stocks and it returned 5.49%. The small cap benchmark, Russell 2000, posted a loss of 1.57%. In terms of style indices, Value stocks returned less than Growth stocks for the fiscal year. The Russell 1000 Value Index had a slight loss of 0.17%, while the Russell 1000 Growth Index had a double-digit gain of 11.81%. With sub-par returns in broad-based U.S. indices, the real action was in overseas emerging markets stocks.
The MSCI Emerging Markets index posted a huge gain of 39.78%. We did not participate in this market because emerging foreign companies are not in our investment universe.
What factors affected the equity portion Series’ performance during its fiscal year?
| • | | Equity performance for the year was favorable. The Strategic Allocation Series stock portion of the portfolio returned 7.47% before taking into account fund expenses. The investment portfolio return was 198 basis points higher than the 5.49% total return for the fund’s benchmark, the Standard & Poor’s 500. |
In relation to the benchmark index, the fund benefited the most from sector positioning in Financials, Consumer Discretionary and Health Care. Sector positioning in Information Technology, Consumer Staples and Materials had an adverse impact on the Series’ performance relative to its benchmark. The top five individual stock contributors were Exxon Mobil, Occidental Petroleum, Microsoft, AT&T and National Oilwell Varco. The bottom five contributors were Citigroup, Bank of America, Merrill Lynch, American International Group and Tyco.
How did the Fixed Income markets perform during the Series’ fiscal year?
• | | The broad U.S. fixed income market, as represented by the Lehman Brothers Aggregate Bond Index returned 6.97% for the fiscal year ended December 31, 2007. In the first five meetings of the year the Fed kept the federal funds rate unchanged at 5.25%. On September 18, 2007, the Fed cut the federal funds rate by 0.50% to 4.75%, citing concerns that tightening credit conditions could potentially increase the strain on the housing market, eventually leading to lower than expected economic growth. The Fed proceeded to cut rates another 0.25% at each of its next two meetings on October 31 st and December 11th. Since the beginning of the year the yield curve has steepened, with rates declining across the curve. |
• | | The 1st half of 2007 can best be characterized as a low volatility, benign credit environment. It was in this atmosphere that non-treasury fixed income sectors outperformed. In stark contrast, the 2nd half of 2007 was extraordinarily volatile. This was primarily due to fear surrounding the subprime mortgage market and its resulting contagion. These fears caused a very significant flight to quality which resulted in dramatic spread widening in all sectors of the bond market. So significant was this flight to quality, that it caused treasuries to outperform almost all spread sectors, the exception being out-performance by some non-U.S. Dollar investments. |
What factors affected the Series’ performance during its fiscal year?
| • | | The decision to maintain an underweight to U.S. Treasuries in favor of spread sectors was the largest detractor to performance for the fiscal year ended December 31, 2007. Treasuries outperformed as concerns over subprime sparked a flight to quality, causing spreads in many sectors to widen. This environment typically does not favor our style of investing, however, our ability to be tactical in our use of high quality substitutes for investment-grade corporates contributed positively to performance for the year. Among the series’ investment in spread sectors, the overweight to asset backed securities and corporate high yield detracted the most from performance. The asset-backed sector was pressured by the home equity sub-component, which suffered from weakness in the underlying collateral. The high-yield market weakened over increased concerns that tightening credit conditions could potentially increase the strain on the housing market, eventually leading to lower than expected economic growth. |
| • | | The largest positive contributor to performance was the series’ exposure to non U.S. Dollar investments, which benefited from market expectations that the Federal Reserve would cut U.S. interest rates in 2007 and stronger growth outside of the United States. An additional positive contributor to the series’ performance was our issue selection within the investment grade corporate sector, which out-performed the Lehman U.S. Corporate Investment Grade Bond Index. |
The preceding information is the opinion of portfolio management only through the end of the period of the report as stated on the cover. Any such opinions are subject to change at any time based upon market or other conditions and should not be relied on as investment advice.
For information regarding the indexes and certain investment terms see the glossary starting on page 2.
20
Strategic Allocation Series (continued)
Portfolios that invest in high yield securities are subject to greater credit risk and price fluctuation than portfolios that invest in higher quality securities. The series’ use of derivatives such as futures, options and swap agreements to pursue the investment objectives may expose the series to additional risks that it would not be subject to if the investment options invested directly in the securities underlying those derivatives. These risks may cause the series to experience higher losses than series that do not use derivatives.
The economies of developing countries may be adversely affected by trade barriers, exchange controls, managed adjustments in relative currency values and other protagonist measures imposed or negotiated by the countries with which they trade.
Average Annual Total Return1 for periods ended 12/31/07
| | | | | | | | | |
| | | 1 year | | | 5 years | | | 10 years | |
Strategic Allocation Series | | 5.98 | % | | 9.38 | % | | 6.67 | % |
S&P 500® Index | | 5.49 | | | 12.83 | | | 5.92 | |
Lehman Brothers Aggregate Bond Index | | 6.97 | | | 4.42 | | | 5.97 | |
Composite Index for Strategic Allocation Series | | 6.22 | | | 9.51 | | | 6.27 | |
Series expense ratios2: Gross: 0.84%; Net: 0.83%.
Returns represent past performance, which is no guarantee of future results. The investment return and principal value will fluctuate so that an investor’s shares, when redeemed, may be worth more or less than the original cost. Total return does not reflect expenses associated with the separate account such as the administrative fees, account charges and surrender charges, which if reflected, would reduce total return. Performance figures may reflect voluntary fee waivers and/or expense reimbursements. In the absence of voluntary fee waivers and/or expense reimbursements, the total return would have been lower. Please visit PhoenixWM.com for performance data current to the most recent month-end.
1 | Total returns are historical and include changes in share price and the reinvestment of both dividends and capital gains distributions. |
2 | The expense ratio(s) of the Series, both net and gross are set forth according to the prospectus for the Series effective 5/1/07, and may differ from the expense ratios disclosed in the financial highlights tables in this report. Net expenses: Expenses reduced by a contractual waiver in effect through 4/30/08. Gross Expenses: Do not reflect the effect of the contractual waiver. |
Growth of $10,000 For periods ended 12/31
This chart assumes an initial investment of $10,000 made on 12/31/97. Returns shown include the reinvestment of all distributions at net asset value, and the change in share price for the stated period.
Sector Weightings as of 12/31/07*
| | | |
Domestic Common Stocks | | 57 | % |
Non-Agency Mortgage-Backed Securities | | 12 | |
Domestic Corporate Bonds | | 9 | |
Agency Mortgage-Backed Securities | | 7 | |
Foreign Corporate Bonds | | 3 | |
Municipal Bonds | | 3 | |
Asset-Backed Securities | | 3 | |
Other (includes short-term investments) | | 6 | |
| * | % of total investments as of December 31, 2007. |
For information regarding the indexes and certain investment terms see the glossary starting on page 2.
21
Aberdeen International Series
Product Manager Commentary
| • | | Phoenix-Aberdeen International Series (“Aberdeen International”) Seeks high total return consistent with reasonable risk. |
• | | For the 12-month reporting period the Series returned 14.94%. For the same period, the S&P 500® Index, a broad-based equity index, returned 5.49% and the MSCI EAFE® Index, the Series’ style-specific benchmark, returned 11.63%. |
All performance figures assume the reinvestment of distributions and exclude the effect of fees and expenses associated with the variable life insurance or annuity product through which you invest. Past performance is no guarantee of future results and current performance may be higher or lower than the performance shown.
How did the Equity markets perform during the Series’ fiscal year?
| • | | The majority of International equity markets posted positive returns in 2007, despite ending the year on a negative tone. The MSCI EAFE index had a total return of 11.63% for the year. U.S. investors benefited once again from the weakness of the U.S. Dollar against most foreign currencies, helping to boost overall returns. |
| • | | Latin America was again the highest returning region, posting a return of 50.7%. Within Latin America, Brazil was a notable standout, achieving a return of 80% as it benefited from significant exposure to its rich natural resources within the commodities sector. Elsewhere in Emerging Markets, China and India also performed exceptionally well posting returns in excess of 50% each for the year. |
| • | | In Continental Europe, equity market returns were boosted by a sharp rise in the Euro versus the U.S. Dollar while continued strong economic growth boosted corporate profits. Europe’s largest economy, Germany, was the single best performing market in the region, posting a U.S. Dollar return of 35.6%. Of the other major International markets Japan was the greatest disappointment, posting a negative return of 4.1% for the fiscal year under review. |
| • | | Within sectors, financials fared worst as the fallout from the U.S. subprime crisis proved to be a major problem for Financial institutions globally rather than being solely confined to the U.S. financial market. The Materials and Energy sectors achieved high returns aided by continued upward momentum in the underlying prices of oil and other natural resources. |
What factors affected the Series’ performance during its fiscal year?
| • | | The fund produced a return of 14.94% for 2007. The exposure to Emerging Markets had a positive contribution to performance with companies such as Petrobras in Brazil, ICICI Bank in India, and Grupo Asur in Mexico, producing very strong returns and comfortably outperforming the benchmark index. This was partly offset by disappointing negative returns from longterm holdings Samsung Electronics in South Korea and Taiwan Semiconductor in Taiwan. The two Chinese positions of Petrochina and China Mobile also contributed very strong returns during the year and profits were taken in October 2007 due to our concern over the very high valuation levels of Chinese equities. |
| • | | Stock selection was strong within the United Kingdom (“UK”), as engineering company, Weir Group continued to perform robustly and British American Tobacco, Vodafone and food retailer William Morrison also posted solid returns. Within the Continental European holdings, strong showings from Belgacom and German companies Eon and Adidas, were partly offset by disappointments in Swedish telecommunications company Ericsson and Dutch financial giant ING Groep, where we sold our position in the second half of the year. Within the Japanese portion of the portfolio, a number of financial holdings suffered a knock on effect from the U.S. subprime crisis with banking giant MUFJ performing poorly as did leasing company Orix. Export giants Canon and Toyota also underperformed on fears of a U.S. economic slowdown and a rise in the Yen in the second half of the year. |
The preceding information is the opinion of portfolio management only through the end of the period of the report as stated on the cover. Any such opinions are subject to change at any time based upon market or other conditions and should not be relied upon as investment advice.
Investing internationally involves risks not associated with investing solely in the U.S., such as currency fluctuation, political risk, differences in accounting and the limited availability of information. The economies of developing countries may be adversely affected by trade barriers, exchange controls, managed adjustments in relative currency values and other protagonist measures imposed or negotiated by the countries with which they trade.
For information regarding the indexes and certain investment terms see the glossary starting on page 2.
22
Aberdeen International Series (continued)
Average Annual Total Return1 for periods ended 12/31/07
| | | | | | | | | |
| | | 1 year | | | 5 years | | | 10 years | |
Aberdeen International Series | | 14.94 | % | | 22.56 | % | | 9.57 | % |
S&P 500® Index | | 5.49 | | | 12.83 | | | 5.92 | |
MSCI EAFE® Index | | 11.63 | | | 22.08 | | | 9.04 | |
Series expense ratios2: Gross: 1.01%; Net: 1.01%.
Returns represent past performance, which is no guarantee of future results. The investment return and principal value will fluctuate so that an investor’s shares, when redeemed, may be worth more or less than the original cost. Total return does not reflect expenses associated with the separate account such as the administrative fees, account charges and surrender charges, which if reflected, would reduce total return. Performance figures may reflect voluntary fee waivers and/or expense reimbursements. In the absence of voluntary fee waivers and/or expense reimbursements, the total return would have been lower. Please visit PhoenixWM.com for performance data current to the most recent month-end.
1 | Total returns are historical and include changes in share price and the reinvestment of both dividends and capital gains distributions. |
2 | The expense ratio(s) of the Series, both net and gross are set forth according to the prospectus for the Series effective 5/1/07, and may differ from the expense ratios disclosed in the financial highlights tables in this report. Net expenses: Expenses reduced by a contractual waiver in effect through 4/30/08. Gross Expenses: Do not reflect the effect of the contractual waiver. |
Growth of $10,000 For periods ended 12/31
This chart assumes an initial investment of $10,000 made on 12/31/97. Returns shown include the reinvestment of all distributions at net asset value, and the change in share price for the stated period.
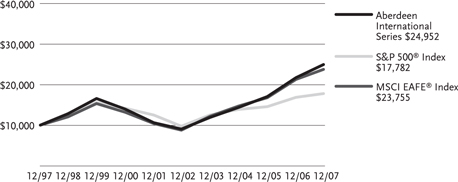
Country Weightings as of 12/31/07*
| | | |
| | | | |
United Kingdom | | 20 | % |
Japan | | 17 | |
Germany | | 12 | |
Switzerland | | 6 | |
Italy | | 5 | |
Hong Kong | | 5 | |
Sweden | | 4 | |
Other (includes short-term investments) | | 31 | |
| * | % of total investments as of December 31, 2007. |
For information regarding the indexes and certain investment terms see the glossary starting on page 2.
23
Alger Small-Cap Growth Series
Product Manager Commentary
| • | | Phoenix -Alger Small-Cap Growth Series (“Alger Small-Cap Growth”) Seeks long-term capital growth. |
• | | For the 12-month reporting period the Series returned 16.10%. For the same period, the S&P 500® Index, a broad-based equity index, returned 5.49% and the Russell 2000® Growth Index, the Series’ style-specific benchmark, returned 7.05%. |
All performance figures assume the reinvestment of distributions and exclude the effect of fees and expenses associated with the variable life insurance or annuity product through which you invest. Past performance is no guarantee of future results and current performance may be higher or lower than the performance shown.
How did the Equity markets perform during the Series’ fiscal year?
| • | | Judging from the tenor of the news and the sentiment of investors, you would think that the markets this year were either down 10% or flat. Even with the bottom falling out of financial services stocks in the third and fourth quarters, however, the major indices were up for the year, some quite decently. The S&P 500 Stock Index was up 5.5% and the Dow Jones Industrial Average 8.9%. Large capitalization stocks performed better than their smaller cap brethren; the Russell 1000, a large cap index, was up 5.8%, while the smaller cap Russell 2000 Index posted a -1.6% decline. As a result of the problems in the Financial Services sector, value indices sharply underperformed growth counterparts. Because of the heavy weighting of banks, brokerage and insurance companies in the value indices, the Russell 3000 Value Index posted a loss of -1.0% while the broadly-based Russell 3000 Growth Index was up 11.4%. Within the small cap space, the disparity between growth and value was even greater as the Russell 2000 Value Index was down -9.8% and the Russell 2000 Growth Index was up 7.1%. |
| • | | We continue to sound the theme that many U.S. growth companies are deeply immersed in a global economy that is showing signs of “decoupling” from the United States and expanding at a much more rapid pace. Those companies are seeing robust growth from places as diverse as Latin America, the Gulf region, and especially China. These regions have been a source of new markets and new business for many companies that trade on U.S. exchanges. Yet, many of those companies have not seen multiple expansion commensurate with that growth. They have done well but have not overshot this year. That’s why we believe they have potential for the year ahead. |
What factors affected the Series’ performance during its fiscal year?
| • | | Over the fiscal year, relative to the Russell 2000 Growth Index, the Fund benefited from positive security selection in all ten sectors, with the greatest impact coming from the Industrials, Consumer Discretionary, Energy and Information Technology sectors. In terms of allocation, there were no significant contributors or detractors at the sector level. The top contributing securities were Petrobank Energy & Resources Ltd. (in the Energy sector), Synchronoss Technologies Inc. (Information Technology), priceline.com Inc. (Consumer Discretionary), Deckers Outdoor Corp. (Consumer Discretionary) and BE Aerospace Inc. (Industrials), while the top detractors were Coldwater Creek Inc. (Consumer Discretionary), InterNAP Network Services Corp. (Information Technology), HFF Inc. Class A (Financials), American Reprographics Co. (Industrials) and DSW Inc. Class A (Consumer Discretionary). |
| • | | As of December 31, 2007, the portfolio remained well diversified, consisting of investments in more than 100 securities across 42 industries. The top five industries were: Biotechnology, Software, Oil Gas & Consumable Fuels, Machinery and Semiconductors & Semiconductor Equipment. |
| • | | If we are correct in our view that big-picture statistics are of less and less use in steering investment decisions, then focusing on specific companies and specific business opportunities will become even more vital than ever. Already, many active investment managers (and growth managers in particular) who focus on fundamentals have outperformed their respective indices simply because they have the flexibility to focus on the strengths and avoid some of the weaker areas of the economy and the markets. Given how the year ahead appears to be shaping up, that will be just as important going forward as it has been in 2007. |
The preceding information is the opinion of portfolio management only through the end of the period of the report as stated on the cover. Any such opinions are subject to change at any time based upon market or other conditions and should not be relied upon as investment advice.
Investing internationally involves risks not associated with investing solely in the U.S., such as currency fluctuation, political risk, differences in accounting and the limited availability of information.
Investing in the securities of small and mid-sized companies involves risks, such as relatively low trading volumes, more price volatility and less liquidity than securities from larger, more established companies.
For information regarding the indexes and certain investment terms see the glossary starting on page 2.
24
Alger Small-Cap Growth Series (continued)
Average Annual Total Return1 for periods ended 12/31/07
| | | | | | | | | | | |
| | | | | | | | | Inception
to 12/31/07 | | | Inception
Date |
| | | 1 year | | | 5 years | | | |
Alger Small-Cap Growth Series | | 16.10 | % | | 20.23 | % | | 18.83 | % | | 8/12/02 |
S&P 500® Index | | 5.49 | | | 12.83 | | | 11.45 | | | 8/12/02 |
Russell 2000® Growth Index | | 7.05 | | | 16.50 | | | 15.41 | | | 8/12/02 |
Series expense ratios2: Gross: 1.27%; Net: 1.00%.
Returns represent past performance, which is no guarantee of future results. The investment return and principal value will fluctuate so that an investor’s shares, when redeemed, may be worth more or less than their original cost. Total return does not reflect expenses associated with the separate account such as the administrative fees, account charges and surrender charges, which if reflected, would reduce total return. Performance figures may reflect voluntary fee waivers and/or expense reimbursements. In the absence of voluntary fee waivers and/or expense reimbursements, the total return would have been lower. Please visit PhoenixWM.com for performance data current to the most recent month-end.
1 | Total returns are historical and include changes in share price and the reinvestment of both dividends and capital gains distributions. |
2 | The expense ratio(s) of the Series, both net and gross are set forth according to the prospectus for the Series effective 5/1/07, and may differ from the expense ratios disclosed in the financial highlights tables in this report. Net expenses: Expenses reduced by a contractual waiver in effect through 4/30/08. Gross Expenses: Do not reflect the effect of the contractual waiver. |
Growth of $10,000 For periods ended 12/31
This chart assumes an initial investment of $10,000 made on 8/12/02. Returns shown include the reinvestment of all distributions at net asset value, and the change in share price for the stated period.
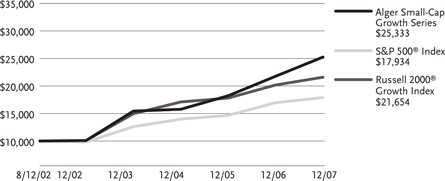
Sector Weightings as of 12/31/07*
| | | |
Information Technology | | 26 | % |
Health Care | | 19 | |
Industrials | | 16 | |
Consumer Discretionary | | 14 | |
Energy | | 8 | |
Financials | | 7 | |
Materials | | 4 | |
Other (includes short-term investments) | | 6 | |
| * | % of total investments as of December 31, 2007. |
For information regarding the indexes and certain investment terms see the glossary starting on page 2.
25
Duff & Phelps Real Estate Securities Series
Product Manager Commentary
| • | | Phoenix-Duff & Phelps Real Estate Securities Series (“Duff & Phelps Real Estate Securities”) Seeks capital appreciation and income with approximately equal emphasis. |
• | | For the 12-month reporting period the Series returned -15.71%. For the same period, the S&P 500® Index, a broad-based equity index, returned 5.49% and the FTSE NAREIT Equity REITs Index, the Series’ style-specific benchmark, returned -15.69%. |
All performance figures assume the reinvestment of distributions and exclude the effect of fees and expenses associated with the variable life insurance or annuity product through which you invest. Past performance is no guarantee of future results and current performance may be higher or lower than the performance shown.
How did the Equity markets perform during the Series’ fiscal year?
| • | | After two years of highly liquid and accommodative debt markets, compressing risk premia across all investment classes and a wave of privatizations, both within the real estate world and the broader market, an environment of vulnerability was created. The ensuing subprime credit crisis triggered an increase in the cost of capital across all investment classes. The low IRRs (internal rate of return targets) implicit in private market transactions could no longer be supported. |
| • | | The seven year run of positive fund flows and outperformance for REITs versus the broader market as of year-end 2006 was about to end on above average valuations, low implied cap rates and dividend yields well below the 90 basis point historical premium to the Ten-Year Treasury Bond. |
| • | | REITs came under profit taking pressure as the credit crisis emerged. |
| • | | Borrowing spreads increased rapidly across equity markets and the historically unavailable credit terms were removed (i.e., high loan-to-value advance rates used by the private real estate funds, interest only loans, and covenant light debt issuances, all of which had driven a significant compression in capitalization rates used to value net operating income of real estate). |
| • | | In early July, after Hilton announced its sale to Blackstone, privatizations came to an abrupt halt as take over financing shut down. |
| • | | The Street, which had been financing both debt and equity of privatizations in the broader market and within the REIT space, suddenly realized how much exposure of subprime paper and take over financing it had on its shelf. Write-downs ensued and are by no means complete. |
| • | | By the start of 2008, REIT valuations had returned to attractive levels as measured by implied cap rates, material discounts to net asset values calculated with higher cap rates than those seen in the private real estate market, a dividend yield which had rapidly moved beyond the historical premium to the Ten-Year Treasury Bond, and average historical multiples. |
What factors affected the Series’ performance during its fiscal year?
| • | | Once the environment changed and privatizations came to a halt, we were pleased to see the focus shift away from the next go-private rumor for REITs which would not have met our screens towards an environment better suited to our GARP style (focusing on cash flow growth at a reasonable price). |
| • | | While we performed well against the benchmark both before and during the go-privatization period, as evidenced by our annual performance in 2005, 2006 and 2007, the unique window favored a “deep-value” or “NAV-centric” focus. A move away from go-privatizations helped us outperform the benchmark in all but one month in the second half of 2007. |
| • | | Field research, including visits with REIT management at all levels, and regular property tours by all members of our team, remains the driver behind our stock selection. It’s been a hallmark of our process since we founded our REIT business and is even more critical in uncertain times. |
| • | | We anticipate the portfolio we have constructed can deliver earnings and cash flow growth for ‘08 and ‘09 above the benchmark levels for reasonable prices. |
| • | | Current consensus estimates call for our benchmark to deliver 5-6% growth in ‘08 and ‘09. Keep in mind ‘07 estimates actually ticked up slightly from the start to the end of the year, and ‘08 estimates stayed flat – low beta cash flow streams compared to the broader market. |
| • | | We continue to emphasize secure, attractive and visible dividend yields and diversification of holdings. |
The preceding information is the opinion of portfolio management only through the end of the period of the report as stated on the cover. Any such opinions are subject to change at any time based upon market or other conditions and should not be relied on as investment advice. Past performance is no guarantee of future results, and there is no guarantee that market forecasts will be realized.
Investing in REIT involves certain risks such as refinancing, changes in the value of properties REITs own, dependency on management skills, economic impact on the industry and risks similar to those linked to small-company investing.
For information regarding the indexes and certain investment terms see the glossary starting on page 2.
26
Duff & Phelps Real Estate Securities Series (continued)
Average Annual Total Return1 for periods ended 12/31/07
| | | | | | | | | |
| | | 1 year | | | 5 years | | | 10 years | |
Duff & Phelps Real Estate Securities Series | | -15.71 | % | | 19.88 | % | | 12.32 | % |
S&P 500® Index | | 5.49 | | | 12.83 | | | 5.92 | |
FTSE NAREIT Equity REITs Index | | -15.69 | | | 18.17 | | | 10.48 | |
Series expense ratios2: Gross: 1.02%; Net: 1.02%.
Returns represent past performance, which is no guarantee of future results. The investment return and principal value will fluctuate so that an investor’s shares, when redeemed, may be worth more or less than their original cost. Total return does not reflect expenses associated with the separate account such as the administrative fees, account charges and surrender charges, which if reflected, would reduce total return. Performance figures may reflect voluntary fee waivers and/or expense reimbursements. In the absence of voluntary fee waivers and/or expense reimbursements, the total return would have been lower. Please visit PhoenixWM.com for performance data current to the most recent month-end.
1 | Total returns are historical and include changes in share price and the reinvestment of both dividends and capital gains distributions. |
2 | The expense ratio(s) of the Series, both net and gross are set forth according to the prospectus for the Series effective 5/1/07 and may differ from the expense ratios disclosed in the financial highlights tables in this report. Net expenses: Expenses reduced by a contractual waiver in effect through 4/30/08. Gross Expenses: Do not reflect the effect of the contractual waiver. |
Growth of $10,000 For periods ended 12/31
This chart assumes an initial investment of $10,000 made on 12/31/97. Returns shown include the reinvestment of all distributions at net asset value, and the change in share price for the stated period.
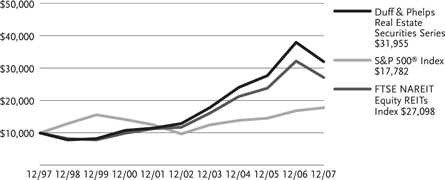
Sector Weightings as of 12/31/07*
| | | |
Regional Malls | | 16 | % |
Office | | 15 | |
Shopping Centers | | 12 | |
Health Care | | 12 | |
Apartments | | 10 | |
Industrial | | 10 | |
Lodging/Resorts | | 7 | |
Other (includes short-term investments) | | 18 | |
| * | % of total investments as of December 31, 2007. |
For information regarding the indexes and certain investment terms see the glossary starting on page 2.
27
S&P Dynamic Asset Allocation Series:
Aggressive Growth
Product Manager Commentary
| • | | Phoenix-S&P Dynamic Asset Allocation Series: Aggressive Growth (“S&P Dynamic Asset Allocation: Aggressive Growth”) Seeks long-term capital growth. |
• | | For the 12-month reporting period the Series returned 8.45%. For the same period the S&P 500® Index, a broad-based equity index, returned 5.49%, and the Composite Index for Phoenix-S&P Dynamic Asset Allocation Series: Aggressive Growth returned 6.70%. |
All performance figures assume the reinvestment of distributions and exclude the effect of fees and expenses associated with the variable life insurance or annuity product through which you invest. Past performance is no guarantee of future results and current performance may be higher or lower than the performance shown.
How did the Equity markets perform during the Series’ fiscal year?
• | | Emerging equity markets turned in a stronger performance than their more developed counterparts during 2007 with the MSCI EM Latin America Index leading the way with nearly a 50% total return for the year. The MSCI AC Far East ex Japan Index posted a 33% gain, and the MSCI EM Europe, Middle East and Africa Index scored almost a 31% total return. At the other end of the spectrum, the S & P 500® Total Return Index gained a mere 5.5%, while the MSCI Japan Index plunged 4.1% and the MSCI Europe Index scored a much less impressive advance of 14.4% compared with the MSCI EMU Index equity market bloc – which posted a hefty 20.4% gain. Overall, the MSCI World excluding the U.S. Index advanced a respectable 12.9% for the year despite the second-half downturn instigated by the global credit crisis. (All returns are denominated in U.S. dollars.) |
What factors affected the Series’ performance during its fiscal year?
| • | | A consistently firm exposure to international equities and a solid short-duration bias in fixed income allocations benefited the series’ performance the most; since international equities out-performed domestic U.S. stock markets and the flight to quality in the second half of 2007. The Fed’s reversion to an accommodative credit posture worked in favor of debt positions concentrated at the short-end of the U.S. Treasury yield curve. |
The preceding information is the opinion of portfolio management only through the end of the period of the report as stated on the cover. Any such opinions are subject to change at any time based upon market or conditions and should not be relied on as investment advice.
Investing in sector funds or non-diversified funds may be more volatile than investing in broadly diversified funds, and may be more susceptible to adverse economic, political or regulatory developments affecting a single issuer than would be the case if it were more broadly diversified.
See Note 16 in the Notes to Financial Statements, in reference to a sub-advisory change.
For information regarding the indexes and certain investment terms see the glossary starting on page 2.
28
S&P Dynamic Asset Allocation Series:
Aggressive Growth (continued)
Average Annual Total Return1 for periods ended 12/31/07
| | | | | | | | |
| | | | | | Inception | | | Inception |
| | | 1 year | | | to 12/31/07 | | | Date |
S&P Dynamic Asset Allocation Series: Aggressive Growth | | 8.45 | % | | 11.05 | % | | 2/3/06 |
S&P 500® Index | | 5.49 | | | 10.25 | | | 2/3/06 |
Composite Index for S&P Dynamic Asset Allocation Series: Aggressive Growth | | 6.70 | | | 11.10 | | | 2/3/06 |
Series expense ratios2: Gross: 1.98%; Net: 1.01%.
Returns represent past performance, which is no guarantee of future results. The investment return and principal value will fluctuate so that an investor’s shares, when redeemed, may be worth more or less than their original cost. Total return does not reflect expenses associated with the separate account such as the administrative fees, account charges and surrender charges, which if reflected, would reduce total return. Performance figures may reflect voluntary fee waivers and/or expense reimbursements. In the absence of voluntary fee waivers and/or expense reimbursements, the total return would have been lower. Please visit PhoenixWM.com for performance data current to the most recent month-end.
1 | Total returns are historical and include changes in share price and the reinvestment of both dividends and capital gains distributions. |
2 | The expense ratio(s) of the Series, both net and gross are set forth according to the prospectus for the Series effective 5/1/07, and may differ from the expense ratios disclosed in the financial highlights tables in this report. Net expenses: Expenses reduced by a contractual waiver in effect through 4/30/08. Gross Expenses: Do not reflect the effect of the contractual waiver. |
Growth of $10,000 For periods ended 12/31
This chart assumes an initial investment of $10,000 made on 2/3/06. Returns shown include the reinvestment of all distributions at net asset value, and the change in share price for the stated period.
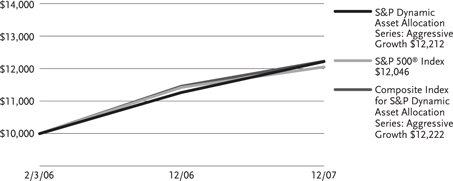
Sector Weightings as of 12/31/07*
| | | |
Domestic Equity ETF’s | | 70 | % |
International ETF’s | | 25 | |
Fixed Income ETF’s | | 5 | |
| | | |
| * | % of total investments as of December 31, 2007. |
For information regarding the indexes and certain investment terms see the glossary starting on page 2.
29
S&P Dynamic Asset Allocation Series: Growth
Product Manager Commentary
| • | | Phoenix-S&P Dynamic Asset Allocation Series: Growth (“Dynamic Asset Allocation Series: Growth”) Seeks long-term capital growth as its primary objective with current income as a secondary consideration. |
• | | For the 12-month reporting period the Series returned 8.33%. For the same period the S&P 500® Index, a broad-based equity index, returned 5.49%, and the Composite Index for Phoenix-S&P Dynamic Asset Allocation Series: Growth returned 6.80%. |
All performance figures assume the reinvestment of distributions and exclude the effect of fees and expenses associated with the variable life insurance or annuity product through which you invest. Past performance is no guarantee of future results and current performance may be higher or lower than the performance shown.
How did the Equity markets perform during the Series’ fiscal year?
• | | Emerging equity markets turned in a stronger performance than their more developed counterparts during 2007 with the MSCI EM Latin America Index leading the way with nearly a 50% total return for the year. The MSCI AC Far East ex Japan Index posted a 33% gain, and the MSCI EM Europe, Middle East and Africa Index scored almost a 31% total return. At the other end of the spectrum, the S & P 500® Total Return Index gained a mere 5.5%, while the MSCI Japan Index plunged 4.1% and the MSCI Europe Index scored a much less impressive advance of 14.4% compared with the MSCI EMU Index equity market bloc – which posted a hefty 20.4% gain. Overall, the MSCI World excluding the U.S. Index advanced a respectable 12.9% for the year despite the second-half downturn instigated by the global credit crisis. (All returns are denominated in U.S. dollars.) |
What factors affected the Series’ performance during its fiscal year?
| • | | A consistently firm exposure to international equities and a solid short-duration bias in fixed income allocations benefited the series’ performance the most; since international equities out-performed domestic U.S. stock markets and the flight to quality in the second half of 2007. The Fed’s reversion to an accommodative credit posture worked in favor of debt positions concentrated at the short-end of the U.S. Treasury yield curve. |
The preceding information is the opinion of portfolio management only through the end of the period of the report as stated on the cover. Any such opinions are subject to change at any time based upon market or conditions and should not be relied on as investment advice.
Investing in sector funds or non-diversified funds may be more volatile than investing in broadly diversified funds, and may be more susceptible to adverse economic, political or regulatory developments affecting a single issuer than would be the case if it were more broadly diversified.
See Note 16 in the Notes to Financial Statements, in reference to a sub-advisory change.
For information regarding the indexes and certain investment terms see the glossary starting on page 2.
30
S&P Dynamic Asset Allocation Series:
Growth (continued)
Average Annual Total Return1 for periods ended 12/31/07
| | | | | | | | |
| | | | | | Inception | | | Inception |
| | | 1 year | | | to 12/31/07 | | | Date |
S&P Dynamic Asset Allocation Series: Growth | | 8.33 | % | | 9.62 | % | | 2/3/06 |
S&P 500® Index | | 5.49 | | | 10.25 | | | 2/3/06 |
Composite Index for S&P Dynamic Asset Allocation Series: Growth | | 6.80 | | | 10.03 | | | 2/3/06 |
Series expense ratios2: Gross: 1.72%; Net: 0.84%.
Returns represent past performance, which is no guarantee of future results. The investment return and principal value will fluctuate so that an investor’s shares, when redeemed, may be worth more or less than their original cost. Total return does not reflect expenses associated with the separate account such as the administrative fees, account charges and surrender charges, which if reflected, would reduce total return. Performance figures may reflect voluntary fee waivers and/or expense reimbursements. In the absence of voluntary fee waivers and/or expense reimbursements, the total return would have been lower. Please visit PhoenixWM.com for performance data current to the most recent month-end.
1 | Total returns are historical and include changes in share price and the reinvestment of both dividends and capital gains distributions. |
2 | The expense ratio(s) of the Series, both net and gross are set forth according to the prospectus for the Series effective 5/1/07, and may differ from the expense ratios disclosed in the financial highlights tables in this report. Net expenses: Expenses reduced by a contractual waiver in effect through 4/30/08. Gross Expenses: Do not reflect the effect of the contractual waiver. |
Growth of $10,000 For periods ended 12/31
This chart assumes an initial investment of $10,000 made on 2/3/06. Returns shown include the reinvestment of all distributions at net asset value, and the change in share price for the stated period.
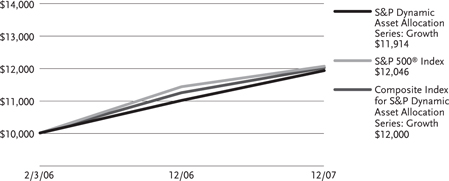
Sector Weightings as of 12/31/07*
| | | |
Domestic Equity ETF’s | | 50 | % |
Fixed Income ETF’s | | 30 | |
International ETF’s | | 19 | |
Other (includes short-term investments) | | 1 | |
| * | % of total investments as of December 31, 2007. |
For information regarding the indexes and certain investment terms see the glossary starting on page 2.
31
S&P Dynamic Asset Allocation Series: Moderate
Product Manager Commentary
| • | | Phoenix-S&P Dynamic Asset Allocation Series: Moderate (“ S&P Dynamic Asset Allocation Series: Moderate”) Seeks current income with capital growth as a secondary consideration. |
• | | For the 12-month reporting period the Series returned 7.98%. For the same period the S&P 500® Index, a broad-based equity index, returned 5.49%, and the Composite Index for Phoenix-S&P Dynamic Asset Allocation Series: Moderate returned 6.89%. |
All performance figures assume the reinvestment of distributions and exclude the effect of fees and expenses associated with the variable life insurance or annuity product through which you invest. Past performance is no guarantee of future results and current performance may be higher or lower than the performance shown.
How did the Equity markets perform during the Series’ fiscal year?
• | | Emerging equity markets turned in a stronger performance than their more developed counterparts during 2007 with the MSCI EM Latin America Index leading the way with nearly a 50% total return for the year. The MSCI AC Far East ex Japan Index posted a 33% gain, and the MSCI EM Europe, Middle East and Africa Index scored almost a 31% total return. At the other end of the spectrum, the S & P 500® Total Return Index gained a mere 5.5%, while the MSCI Japan Index plunged 4.1% and the MSCI Europe Index scored a much less impressive advance of 14.4% compared with the MSCI EMU Index equity market bloc – which posted a hefty 20.4% gain. Overall, the MSCI World excluding the U.S. Index advanced a respectable 12.9% for the year despite the second-half downturn instigated by the global credit crisis. (All returns are denominated in U.S. dollars.) |
What factors affected the Series’ performance during its fiscal year?
| • | | A consistently firm exposure to international equities and a solid short-duration bias in fixed income allocations benefited the series’ performance the most; since international equities out-performed domestic (U.S.) stock markets and the flight to quality in the second half of 2007. The Fed’s reversion to an accommodative credit posture worked in favor of debt positions concentrated at the short-end of the U.S. Treasury yield curve. |
The preceding information is the opinion of portfolio management only through the end of the period of the report as stated on the cover. Any such opinions are subject to change at any time based upon market or conditions and should not be relied on as investment advice.
Investing in sector funds or non-diversified funds may be more volatile than investing in broadly diversified funds, and may be more susceptible to adverse economic, political or regulatory developments affecting a single issuer than would be the case if it were more broadly diversified.
See Note 16 in the Notes to Financial Statements, in reference to a sub-advisory change.
For information regarding the indexes and certain investment terms see the glossary starting on page 2.
32
S&P Dynamic Asset Allocation Series:
Moderate (continued)
Average Annual Total Return1 for periods ended 12/31/07
| | | | | | | | |
| | | | | | Inception | | | Inception |
| | | 1 year | | | to 12/31/07 | | | Date |
S&P Dynamic Asset Allocation Series: Moderate | | 7.98 | % | | 7.17 | % | | 2/3/06 |
S&P 500® Index | | 5.49 | | | 10.25 | | | 2/3/06 |
Composite Index for S&P Dynamic Asset Allocation Series: Moderate | | 6.89 | | | 7.85 | | | 2/3/06 |
Series expense ratios: Gross: 3.29%; Net: 0.89%.
Returns represent past performance, which is no guarantee of future results. The investment return and principal value will fluctuate so that an investor’s shares, when redeemed, may be worth more or less than their original cost. Total return does not reflect expenses associated with the separate account such as the administrative fees, account charges and surrender charges, which if reflected, would reduce total return. Performance figures may reflect voluntary fee waivers and/or expense reimbursements. In the absence of voluntary fee waivers and/or expense reimbursements, the total return would have been lower. Please visit PhoenixWM.com for performance data current to the most recent month-end.
1 | Total returns are historical and include changes in share price and the reinvestment of both dividends and capital gains distributions. |
2 | The expense ratio(s) of the Series, both net and gross are set forth according to the prospectus for the Series effective 5/1/07, and may differ from the expense ratios disclosed in the financial highlights tables in this report. Net expenses: Expenses reduced by a contractual waiver in effect through 4/30/08. Gross Expenses: Do not reflect the effect of the contractual waiver. |
Growth of $10,000 For periods ended 12/31
This chart assumes an initial investment of $10,000 made on 2/3/06. Returns shown include the reinvestment of all distributions at net asset value, and the change in share price for the stated period.
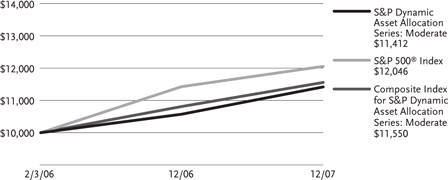
Sector Weightings as of 12/31/07*
| | | |
Fixed Income ETF’s | | 70 | % |
Domestic Equity ETF’s | | 20 | |
International ETF’s | | 10 | |
| * | % of total investments as of December 31, 2007. |
For information regarding the indexes and certain investment terms see the glossary starting on page 2.
33
S&P Dynamic Asset Allocation Series:
Moderate Growth
Product Manager Commentary
| • | | Phoenix-S&P Dynamic Asset Allocation Series: Moderate Growth (“ S&P Dynamic Asset Allocation Series: Moderate Growth”) Seeks long-term capital growth and current income with a greater emphasis on capital growth. |
• | | For the 12-month reporting period the Series returned 8.50%. For the same period the S&P 500® Index, a broad-based equity index, returned 5.49%, and the Composite Index for Phoenix-S&P Dynamic Asset Allocation Series: Moderate Growth returned 6.83%. |
All performance figures assume the reinvestment of distributions and exclude the effect of fees and expenses associated with the variable life insurance or annuity product through which you invest. Past performance is no guarantee of future results and current performance may be higher or lower than the performance shown.
How did the Equity markets perform during the Series’ fiscal year?
• | | Emerging equity markets turned in a stronger performance than their more developed counterparts during 2007 with the MSCI EM Latin America Total Returns Index leading the way with nearly a 50% total return for the year. The MSCI EM Far East ex Japan excluding Japan Total Return Index posted a 33% gain, and the MSCI EM Europe, Middle East and Africa Index scored almost a 31% total return. At the other end of the spectrum, the S & P 500® Total Return Index gained a mere 5.5%, while the MSCI Japan Index plunged 4.1% and the MSCI Europe Total Return Index scored a much less impressive advance of 14.4% compared with the MSCI EMU Index equity market bloc – which posted a hefty 20.4% gain. Overall, the MSCI World excluding the U.S. Index advanced a respectable 12.9% for the year despite the second-half downturn instigated by the global credit crisis. (All returns are denominated in U.S. dollars.) |
What factors affected the Series’ performance during its fiscal year?
| • | | A consistently firm exposure to international equities and a solid short-duration bias in fixed income allocations benefited the series’ performance the most; since international equities outperformed domestic U.S. stock markets and the flight to quality in the second half of 2007. The Fed’s reversion to an accommodative credit posture worked in favor of debt positions concentrated at the short-end of the U.S. Treasury yield curve. |
The preceding information is the opinion of portfolio management only through the end of the period of the report as stated on the cover. Any such opinions are subject to change at any time based upon market or conditions and should not be relied on as investment advice.
Investing in sector funds or non-diversified funds may be more volatile than investing in broadly diversified funds, and may be more susceptible to adverse economic, political or regulatory developments affecting a single issuer than would be the case if it were more broadly diversified.
See Note 16 in the Notes to Financial Statements, in reference to a sub-advisory change.
For information regarding the indexes and certain investment terms see the glossary starting on page 2.
34
S&P Dynamic Asset Allocation Series:
Moderate Growth (continued)
Average Annual Total Return1 for periods ended 12/31/07
| | | | | | | | |
| | | | | | Inception
to 12/31/07 | | | Inception
Date |
| | | 1 year | | | |
S&P Dynamic Asset Allocation Series: Moderate Growth | | 8.50 | % | | 9.08 | % | | 2/3/06 |
S&P 500® Index | | 5.49 | | | 10.25 | | | 2/3/06 |
Composite Index for S&P Dynamic Asset Allocation Series: Moderate Growth | | 6.83 | | | 9.28 | | | 2/3/06 |
Series expense ratios2: Gross: 2.14%; Net: 0.85%.
Returns represent past performance, which is no guarantee of future results. The investment return and principal value will fluctuate so that an investor’s shares, when redeemed, may be worth more or less than their original cost. Total return does not reflect expenses associated with the separate account such as the administrative fees, account charges and surrender charges, which if reflected, would reduce total return. Performance figures may reflect voluntary fee waivers and/or expense reimbursements. In the absence of voluntary fee waivers and/or expense reimbursements, the total return would have been lower. Please visit PhoenixWM.com for performance data current to the most recent month-end.
1 | Total returns are historical and include changes in share price and the reinvestment of both dividends and capital gains distributions. |
2 | The expense ratio(s) of the Series, both net and gross are set forth according to the prospectus for the Series effective 5/1/07, and may differ from the expense ratios disclosed in the financial highlights tables in this report. Net expenses: Expenses reduced by a contractual waiver in effect through 4/30/08. Gross Expenses: Do not reflect the effect of the contractual waiver. |
Growth of $10,000 For periods ended 12/31
This chart assumes an initial investment of $10,000 made on 2/3/06. Returns shown include the reinvestment of all distributions at net asset value, and the change in share price for the stated period.
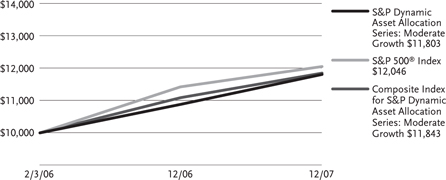
Sector Weightings as of 12/31/07*
| | | |
Fixed Income ETF’s | | 45 | % |
Domestic Equity ETF’s | | 40 | |
International ETF’s | | 15 | |
| | | |
| * | % of total investments as of December 31, 2007. |
For information regarding the indexes and certain investment terms see the glossary starting on page 2.
35
Sanford Bernstein Mid-Cap Value Series
Product Manager Commentary
| • | | Phoenix-Sanford Bernstein Mid-Cap Value Series (“Sanford Bernstein Mid-Cap Value”) Seeks long-term capital appreciation. Current income is a secondary investment objective. |
• | | For the 12-month reporting period the Series returned 2.00%. For the same period, the S&P 500® Index, a broad-based equity index, returned 5.49% and the Russell 2500TM Value Index, the Series’ style-specific benchmark, returned -7.27%. |
All performance figures assume the reinvestment of distributions and exclude the effect of fees and expenses associated with the variable life insurance or annuity product through which you invest. Past performance is no guarantee of future results and current performance may be higher or lower than the performance shown.
How did the Equity markets perform during the Series’ fiscal year?
| • | | The past year was a transitional one in many ways in the market for small and mid-capitalization stocks. After a five-year period of strong earnings growth relative to larger companies, in 2007 earnings for these companies suffered a sharp compression and ended the year at or below growth rates for larger stocks. This shift caused investors, who had viewed the more robust earnings as a basis for investing in the smallest riskiest stocks in the sector, to question those judgments and the high multiples that they had awarded those stocks. Further, with increased scarcity of sustainable earnings, the markets rediscovered quality. The result was companies with measures of corporate success such as trailing profitability dramatically outperformed those with stronger value characteristics. Not surprisingly, in this environment larger companies outperformed smaller ones and growth outperformed value. |
| • | | Exacerbating this shift was the renewed volatility seen in the markets in the second half of the year. Investors became increasingly uncertain about the size and scope of the subprime contagion and stocks with perceived exposure to housing or consumer spending were sharply marked down. Sectors with perceived safety such as consumer staples and utilities outperformed while more economically sensitive sectors such as transports and consumer cyclicals underperformed. The more domestic focus of Small- and Mid-Caps was also a headwind in this period as they gained less from the recent boom in U.S. exports and will continue to be more vulnerable to the housing-led U.S. economic slowdown or downturn, if one occurs. |
What factors affected the Series’ performance during its fiscal year?
| • | | Our Portfolio’s 2.00% performance outperformed the Russell 2500 Value Index which was down 7.3%. |
| • | | Strong stock selection in the Utilities, Consumer Cyclicals and Energy sectors. The Portfolio also received a boost from its significant underweight in Financials, especially those with more direct exposure to the subprime contagion. We saw further benefit from overweight positions in the industrial resource and capital equipment sectors. With increased concerns about U.S. economic growth, companies in these sectors were bolstered by their relatively greater exposure to foreign markets, where revenues and profits remain robust. Specific stocks that outperformed include Hess, AGCO, Steel Dynamics, SPX Corp and Enersys. |
| • | | The biggest detractor from performance for the year was our stock selection within the Consumer Growth sector where investors bid down shares of companies over fears of a slowdown in U.S. consumer spending. An underweight in Utilities hurt performance as investors bid the sector up, drawn to its defensive characteristics in a period of economic uncertainty. Specific stocks that underperformed include Avis Budget Group, TRW Automotive, Central Pacific Financial, Terex and Quebecor World. |
| • | | In spite of significant earnings disappointments in 2007, consensus forecasts for 2008 appear to assume that small-capitalization stocks will regain their recent earnings growth edge vs. large-capitalization stocks. We continue to believe that for smaller stocks as a whole, earnings expectations for 2008 remain too optimistic, valuations too high, and valuation spreads between stocks too narrow. |
| • | | Small- and Mid-Capitalization stocks continue to trade too much as a group, without regard for fundamentals, despite greater performance differentials in the last year. In 2007, stocks with greater overseas revenues did markedly better than those that were mostly domestic, and stocks reliant on the U.S. housing sector dramatically underperformed. |
| • | | Thus, our Portfolio stance remains largely unchanged. We continue to emphasize companies with strong historical returns and current success at attractive valuations. These companies have benefited from breadth in their revenue streams, generating a higher share from international markets than the universe as a whole. On average, they also tend to be larger. Thus, we expect our average market capitalization to be larger than the benchmark for some time to come. |
| • | | Recent market distress, however, is beginning to create some new opportunities. While our fundamental and quantitative research suggests caution, in a few instances the return potential appears sufficiently compelling to justify the risk. In particular, our research suggests that a few companies with a high degree of exposure to the U.S. economy—such as those that make and sell high-priced discretionary consumer products—have traded down too far and thus offer attractive investment opportunities. |
The preceding information is the opinion of portfolio management only through the end of the period of the report as stated on the cover. Any such opinions are subject to change at any time based upon market or conditions and should not be relied on as investment advice.
Mid-cap stocks are more volatile and may be less liquid than large-cap stocks.
For information regarding the indexes and certain investment terms see the glossary starting on page 2.
36
Sanford Bernstein Mid-Cap Value Series (continued)
Average Annual Total Return1 for periods ended 12/31/07
| | | | | | | | | | | |
| | | 1 year | | | 5 years | | | Inception
to 12/31/07 | | | Inception
Date |
Sanford Bernstein Mid-Cap Value Series | | 2.00 | % | | 16.47 | % | | 8.55 | % | | 3/2/98 |
S&P 500® Index | | 5.49 | | | 12.83 | | | 5.18 | | | 3/2/98 |
Russell 2500TM Value Index | | -7.27 | | | 16.17 | | | 9.33 | | | 3/2/98 |
Series expense ratios2: Gross: 1.33%; Net: 1.31%.
Returns represent past performance, which is no guarantee of future results. The investment return and principal value will fluctuate so that an investor’s shares, when redeemed, may be worth more or less than their original cost. Total return does not reflect expenses associated with the separate account such as the administrative fees, account charges and surrender charges, which if reflected, would reduce total return. Performance figures may reflect voluntary fee waivers and/or expense reimbursements. In the absence of voluntary fee waivers and/or expense reimbursements, the total return would have been lower. Please visit PhoenixWM.com for performance data current to the most recent month-end.
1 | Total returns are historical and include changes in share price and the reinvestment of both dividends and capital gains distributions. |
2 | The expense ratio(s) of the Series, both net and gross are set forth according to the prospectus for the Series effective 5/1/07 and may differ from the expense ratios disclosed in the financial highlights tables in this report. Net expenses: Expenses reduced by a contractual waiver in effect through 4/30/08. Gross Expenses: Do not reflect the effect of the contractual waiver. |
Growth of $10,000 For periods ended 12/31
This chart assumes an initial investment of $10,000 made on 3/2/98. Returns shown include the reinvestment of all distributions at net asset value, and the change in share price for the stated period.
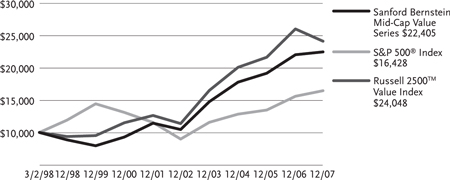
Sector Weightings as of 12/31/07*
| | | |
Industrials | | 23 | % |
Financials | | 20 | |
Materials | | 14 | |
Consumer Staples | | 8 | |
Information Technology | | 8 | |
Utilities | | 7 | |
Consumer Discretionary | | 6 | |
Other (includes short-term investments) | | 14 | |
| * | % of total investments as of December 31, 2007. |
For information regarding the indexes and certain investment terms see the glossary starting on page 2.
37
Sanford Bernstein Small-Cap Value Series
Product Manager Commentary
| • | | Phoenix-Sanford Bernstein Small-Cap Value Series (“ Sanford Bernstein Small-Cap Value”) Seeks long-term capital appreciation by investing primarily in small capitalization stocks that appear to be under valued. Current income is a secondary investment objective. |
• | | For the 12-month reporting period the Series returned -2.10%. For the same period, the S&P 500® Index, a broad-based equity index, returned 5.49% and the Russell 2000® Value Index, the Series’ style-specific benchmark, returned -9.78%. |
All performance figures assume the reinvestment of distributions and exclude the effect of fees and expenses associated with the variable life insurance or annuity product through which you invest. Past performance is no guarantee of future results and current performance may be higher or lower than the performance shown.
How did the Equity markets perform during the Series’ fiscal year?
| • | | The past year was a transitional one in many ways in the market for smaller cap stocks. After a five-year period of stronger earnings growth for small-cap stocks, in 2007 Small-Caps’ earnings growth suffered a sharp compression and ended the year at or below growth rates for larger stocks. This shift caused investors, who had viewed the more robust earnings as a basis for investing in the smallest riskiest stocks in the sector, to question those judgments and the high multiples that they had awarded those stocks. Further, with increased scarcity of sustainable earnings, the markets rediscovered quality. The result was companies with measures of corporate success such as trailing profitability dramatically outperformed those with stronger value characteristics. Not surprisingly, in this environment larger companies outperformed smaller ones and growth outperformed value. |
| • | | Exacerbating this shift was the renewed volatility seen in the markets in the second half of the year. Investors became increasingly uncertain about the size and scope of the subprime contagion and stocks with perceived exposure to housing or consumer spending were sharply marked down. Sectors with perceived safety such as consumer staples and utilities outperformed while more economically sensitive sectors such as transports and consumer cyclicals underperformed. The more domestic focus of small-caps was also a headwind in this period as they gained less from the recent boom in U.S. exports and will continue to be more vulnerable to the housing-led U.S. economic slowdown or downturn, if one occurs. |
| • | | For the year 2007, our Portfolio returned -0.8%, before fees, strongly outperforming both its benchmark the Russell 2000 Value Index, which was down -9.8%, and the Russell 2000 Index which was down -1.6%. |
| • | | Strong stock selection was an important contributor to our premium. It was spread over a number of sectors but was more prevalent in financials, capital equipment and industrial resources. In financials, the portfolio benefited from our underweight of companies most directly exposed to the issues in the subprime markets. For industrial resources and capital equipment, the portfolio’s holdings benefited from high exposure to international markets where economic growth was perceived to be more sustainable. Overweighted positions in industrial resources and capital equipment were also strong drivers of performance, as was underweighting financials. Specific stocks that contributed to performance include Columbus McKinnon, Steel Dynamics, Commscope, Enersys and Zoran. |
| • | | The biggest detractor from performance for the year was our stock selection in transportation where concerns over the impact of higher fuel costs and a slowdown in the economy hurt some of our holdings. Technology stock selection was also a detractor. Underweight positions in the utilities and energy sectors also negatively impacted performance. Specific stocks that underperformed include Avis Budget, Central Pacific Financial, Shoe Carnival, Quebecor World and CTS Corp. |
| • | | In spite of significant earnings disappointments in 2007, consensus forecasts for 2008 appear to assume that small-capitalization stocks will regain their recent earnings growth edge vs. Large-Capitalization stocks. We continue to believe that for smaller stocks as a whole, earnings expectations for 2008 remain too optimistic, valuations too high, and valuation spreads between stocks too narrow. |
| • | | Small-Capitalization stocks continue to trade too much as a group, without regard for fundamentals, despite greater performance differentials in the last year. In 2007, stocks with greater overseas revenues did markedly better than those that were mostly domestic, and stocks reliant on the U.S. housing sector dramatically underperformed. |
| • | | Thus, our Portfolio stance remains largely unchanged. We continue to emphasize companies with strong historical returns and current success at attractive valuations. These companies have benefited from breadth in their revenue steams, generating a higher share from international markets than the universe as a whole. On average, they also tend to be larger. Thus, we expect our average market capitalization to be larger than the benchmark for some time to come. |
| • | | Recent market distress, however, is beginning to create some new opportunities. While our fundamental and quantitative research suggests caution, in a few instances the return potential appears sufficiently compelling to justify the risk. In particular, our research suggests that a few companies with a high degree of exposure to the U.S. economy—such as those that make and sell high-priced discretionary consumer products—have traded down too far and thus offer attractive investment opportunities. |
The preceding information is the opinion of portfolio management only through the end of the period of the report as stated on the cover. Any such opinions are subject to change at any time based upon market or conditions and should not be relied on as investment advice.
Small-Cap investing includes the risk of greater price volatility, less liquidity and increased competitive threat.
For information regarding the indexes and certain investment terms see the glossary starting on page 2.
38
Sanford Bernstein Small-Cap Value Series (continued)
Average Annual Total Return1 for periods ended 12/31/07
| | | | | | | | | | | |
| | | | | | | | | Inception
to 12/31/07 | | | Inception
Date |
| | | 1 year | | | 5 years | | | |
Sanford Bernstein Small-Cap Value Series | | -2.10 | % | | 16.73 | % | | 13.37 | % | | 11/20/00 |
S&P 500® Index | | 5.49 | | | 12.83 | | | 3.02 | | | 11/20/00 |
Russell 2000® Value Index | | -9.78 | | | 15.80 | | | 12.43 | | | 11/20/00 |
Series expense ratios2: Gross: 1.35%; Net: 1.30%.
Returns represent past performance, which is no guarantee of future results. The investment return and principal value will fluctuate so that an investor’s shares, when redeemed, may be worth more or less than their original cost. Total return does not reflect expenses associated with the separate account such as the administrative fees, account charges and surrender charges, which if reflected, would reduce total return. Performance figures may reflect voluntary fee waivers and/or expense reimbursements. In the absence of voluntary fee waivers and/or expense reimbursements, the total return would have been lower. Please visit PhoenixWM.com for performance data current to the most recent month-end.
1 | Total returns are historical and include changes in share price and the reinvestment of both dividends and capital gains distributions. |
2 | The expense ratio(s) of the Series, both net and gross are set forth according to the prospectus for the Series effective 5/1/07, and may differ from the expense ratios disclosed in the financial highlights tables in this report. Net expenses: Expenses reduced by a contractual waiver in effect through 4/30/08. Gross Expenses: Do not reflect the effect of the contractual waiver. |
Growth of $10,000 For periods ended 12/31
This chart assumes an initial investment of $10,000 made on 10/20/00. Returns shown include the reinvestment of all distributions at net asset value, and the change in share price for the stated period.
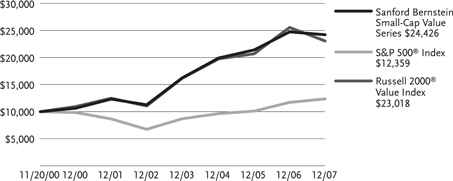
Sector Weightings as of 12/31/07*
| | | |
Industrials | | 25 | % |
Financials | | 22 | |
Materials | | 15 | |
Health Care | | 9 | |
Consumer Discretionary | | 8 | |
Information Technology | | 7 | |
Consumer Staples | | 7 | |
Other (includes short-term investments) | | 6 | |
| * | % of total investments as of December 31, 2007. |
For information regarding the indexes and certain investment terms see the glossary starting on page 2.
39
Van Kampen Comstock Series
Product Manager Commentary
| • | | Phoenix-Van Kampen Comstock Series (“ Van Kampen Comstock”) Seeks long-term capital appreciation. The Series has a secondary investment objective to seek current income. |
• | | For the 12-month reporting period the Series returned -2.22%. For the same period, the S&P 500® Index, a broad-based equity index, returned 5.49% and the Russell 1000® Value Index, the Series’ style-specific benchmark, returned -0.17%. |
All performance figures assume the reinvestment of distributions and exclude the effect of fees and expenses associated with the variable life insurance or annuity product through which you invest. Past performance is no guarantee of future results and current performance may be higher or lower than the performance shown.
How did the Equity markets perform during the Series’ fiscal year?
| • | | Despite the strong performance of the broad stock market in the first half of the year, rising uncertainties about the economy dampened performance in the second half of the year. Investors worried about how well the U.S. economy would weather ever-higher oil prices, a weakening housing market and slackening consumer spending, as well as the effects of an economic slowdown on corporate profitability. Against this backdrop, the broad market (as measured by the S&P 500 Index) had a small gain of 5.49%, while large cap value stocks lagged with a return of -0.17% (as measured by the Russell 1000 Value Index) for the period. |
| • | | In the 12-month period, stocks experienced several periods of significant volatility, such as in July and October-November, in which investors briefly rotated away from cyclical areas of the market (those with greater economic sensitivity such as materials and energy) that have driven performance for the past several years. During these periods of volatility, the Portfolio’s holdings of undervalued stocks performed relatively well, as we would expect the Portfolio to do in this type of environment. Because of our emphasis on stocks with reasonable valuations relative to our assessment of fair value, the Portfolio had no exposure to the richly valued cyclical stocks, which therefore minimized some of the damage to the Portfolio caused by these sharp downdrafts. |
What factors affected the Series’ performance during its fiscal year?
| • | | The primary detractor from performance relative to both indexes was the Portfolio’s lack of exposure to the energy sector. Within both indexes, energy was the best-performing sector for the period as oil prices continued to soar. However, we believe energy stock valuations are too expensive based on our strict risk-reward criteria. |
• | | Relative to the S&P 500® Index, an overweight allocation in the financials sector further dampened relative performance, as the sector was among the weakest performing groups in the index during the period. The health care sector was another area of relative weakness. Two pharmaceutical holdings declined after the FDA did not approve their late-stage drugs. Conversely, stock selection and a resulting overweight allocation in the consumer staples sector were chief contributors to positive relative performance during the period. Stock selection in the telecommunication services sector also added to relative performance. |
• | | Relative to the Russell 1000® Value Index, other notable detractors from performance were the utilities and industrials sectors. The Portfolio had minimal utilities stocks, given their expensive valuations, and the sector performed well owing to high energy prices. The Portfolio also had minimal exposure to the industrials sector, which benefited from strong economic growth over the past several years. However, the Portfolio’s largest positive contribution came from our stock selection and the resulting underweight allocation in the financials sector. Within the sector, the Portfolio owned holdings in banks, brokerages, insurers, and government sponsored enterprises. Strong stock selection and a resulting overweight position in the consumer staples sector also bolstered the Portfolio’s relative performance. |
The preceding information is the opinion of portfolio management only through the end of the period of the report as stated on the cover. Any such opinions are subject to change at any time based upon market or conditions and should not be relied on as investment advice.
Investing internationally involves risks not associated with investing solely in the U.S., such as currency fluctuation, political risk, differences in accounting and the limited availability of information.
The economies of developing countries may be adversely affected by trade barriers, exchange controls, managed adjustments in relative currency values and other protagonist measures imposed or negotiated by the countries with which they trade.
The series’ use of derivatives such as futures, options and swap agreements to pursue their investment objectives may expose the series to additional risks that it would not be subject to if it invested directly in the securities underlying those derivatives. These risks may cause the series to experience higher losses than series that do not use derivatives.
For information regarding the indexes and certain investment terms see the glossary starting on page 2.
40
Van Kampen Comstock Series (continued)
Average Annual Total Return1 for periods ended 12/31/07
| | | | | | | | | | | |
| | | 1 year | | | 5 years | | | Inception
to 12/31/07 | | | Inception
Date |
Van Kampen Comstock Series | | -2.22 | % | | 11.76 | % | | 7.48 | % | | 3/2/98 |
S&P 500® Index | | 5.49 | | | 12.83 | | | 5.18 | | | 3/2/98 |
Russell 1000® Value Index | | -0.17 | | | 14.63 | | | 7.23 | | | 3/2/98 |
Series expense ratios2: Gross: 1.00%; Net: 0.95%.
Returns represent past performance, which is no guarantee of future results. The investment return and principal value will fluctuate so that an investor’s shares, when redeemed, may be worth more or less than their original cost. Total return does not reflect expenses associated with the separate account such as the administrative fees, account charges and surrender charges, which if reflected, would reduce total return. Performance figures may reflect voluntary fee waivers and/or expense reimbursements. In the absence of voluntary fee waivers and/or expense reimbursements, the total return would have been lower. Please visit PhoenixWM.com for performance data current to the most recent month-end.
1 | Total returns are historical and include changes in share price and the reinvestment of both dividends and capital gains distributions. |
2 | The expense ratio(s) of the Series, both net and gross are set forth according to the prospectus for the Series effective 5/1/07 and may differ from the expense ratios disclosed in the financial highlights tables in this report. Net expenses: Expenses reduced by a contractual waiver in effect through 4/30/08. Gross Expenses: Do not reflect the effect of the contractual waiver. |
Growth of $10,000 For periods ended 12/31
This chart assumes an initial investment of $10,000 made on 3/2/98. Returns shown include the reinvestment of all distributions at net asset value, and the change in share price for the stated period.

Sector Weightings as of 12/31/07*
| | | |
Financials | | 26 | % |
Consumer Staples | | 19 | |
Health Care | | 17 | |
Consumer Discretionary | | 12 | |
Materials | | 8 | |
Information Technology | | 6 | |
Telecommunication Services | | 5 | |
Other (includes short-term investments) | | 7 | |
| * | % of total investments as of December 31, 2007. |
For information regarding the indexes and certain investment terms see the glossary starting on page 2.
41
Van Kampen Equity 500 Index Series
Product Manager Commentary
| • | | Phoenix-Van Kampen Equity 500 Index Series (“ Van Kampen Equity 500 Index”) Seeks high total return. |
• | | For the 12-month reporting period the Series returned 4.87%. For the same period, the S&P 500® Index, a broad-based equity index, returned 5.49%. |
All performance figures assume the reinvestment of distributions and exclude the effect of fees and expenses associated with the variable life insurance or annuity product through which you invest. Past performance is no guarantee of future results and current performance may be higher or lower than the performance shown.
How did the Equity markets perform during the Series’ fiscal year?
• | | The S&P 500® Index returned a moderate gain of 5.49% for the year ended December 31, 2007. Stock price volatility was much more pronounced in 2007 than it had been over the past several years, largely driven by investor uncertainty as to the short- and long-term impacts of the subprime mortgage market’s troubles on the broader economy. In the first quarter, investors took notice of distress signs in the subprime market, which fueled stock price turbulence in March. Yet, corporate profits stayed positive and economic data was generally favorably, contributing to the belief that the effect of the subprime event would be contained. |
| • | | However, by the third quarter, subprime troubles spilled into the credit market and the broader economy. A tightening in credit standards, mortgage lender bankruptcies and hedge fund implosions were followed by multi-billion dollar losses reported at several large financial institutions in the fourth quarter. At the same time, a cross current of unfavorable data buffeted the market, indicating a languishing housing market, declining consumer spending, rising oil prices and negative year-over-year corporate profit growth. |
| • | | A series of reductions to both the discount rate and the target federal funds rate from the Federal Reserve (the “Fed”) helped financial markets regain their footing at several points in the third and fourth quarters. In fact, the S&P 500 Index reached a record high early in the fourth quarter. However, skepticism quickly returned as investors worried that the Fed’s ability to steer the economy away from recession would be limited by potentially rising inflation. Fourth quarter corporate earnings expectations were dismal, with only the largest multi-national companies expected to generate growth through their exposure to international markets. |
What factors affected the Series’ performance during its fiscal year?
| • | | Within the S&P 500 Index and therefore the Fund, eight of the ten sectors had positive absolute performance during the period, led by energy. Rising energy prices in 2007 continued to provide a favorable backdrop for energy companies to generate significant earnings. The materials sector also performed very well, benefiting from a strong global economic backdrop and robust demand for materials, particularly in China and India. The utilities sector also placed within the top three performing sectors, as utilities companies garnered considerable pricing power from the rising energy price environment. |
| • | | The two negative returning sectors in the Index and Fund were consumer discretionary and financials. Investors generally avoided consumer-related stocks as a weakening housing market, high energy prices and tightening credit standards did not bode well for consumers’ ability to spend. Such fears were validated by declining consumer confidence and retail sales data in the second half of 2007 and disappointing receipts from the holiday shopping season. |
| • | | Because the S&P 500 Index is market capitalization weighted (and that the Fund seeks to replicate the performance attributes of the S&P 500 Index before Fund fees), the overall contribution of each sector was influenced by its relative size within the S&P 500 Index and the Fund portfolio. As such, the sectors that contributed most to the Fund’s return were energy and technology, while financials and consumer discretionary were the largest detractors. |
The preceding information is the opinion of portfolio management only through the end of the period of the report as stated on the cover. Any such opinions are subject to change at any time based upon market or conditions and should not be relied on as investment advice.
Investing internationally involves risks not associated with investing solely in the U.S., such as currency fluctuation, political risk, differences in accounting and the limited availability of information.
For information regarding the indexes and certain investment terms see the glossary starting on page 2.
42
Van Kampen Equity 500 Index Series (continued)
Average Annual Total Return1 for periods ended 12/31/07
| | | | | | | | | |
| | | 1 year | | | 5 years | | | 10 years | |
Van Kampen Equity 500 Index Series | | 4.87 | % | | 11.48 | % | | 4.84 | % |
S&P 500® Index | | 5.49 | | | 12.83 | | | 5.92 | |
Series expense ratios2: Gross: 0.77%; Net: 0.63%.
Returns represent past performance, which is no guarantee of future results. The investment return and principal value will fluctuate so that an investor’s shares, when redeemed, may be worth more or less than their original cost. Total return does not reflect expenses associated with the separate account such as the administrative fees, account charges and surrender charges, which if reflected, would reduce total return. Performance figures may reflect voluntary fee waivers and/or expense reimbursements. In the absence of voluntary fee waivers and/or expense reimbursements, the total return would have been lower. Please visit PhoenixWM.com for performance data current to the most recent month-end.
1 | Total returns are historical and include changes in share price and the reinvestment of both dividends and capital gains distributions. |
2 | The expense ratio(s) of the Series, both net and gross are set forth according to the prospectus for the Series effective 5/1/07, and may differ from the expense ratios disclosed in the financial highlights tables in this report. Net expenses: Expenses reduced by a contractual waiver in effect through 4/30/08. Gross Expenses: Do not reflect the effect of the contractual waiver. |
Growth of $10,000 For periods ended 12/31
This chart assumes an initial investment of $10,000 made on 12/31/97. Returns shown include the reinvestment of all distributions at net asset value, and the change in share price for the stated period.
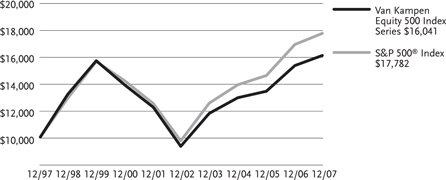
Sector Weightings as of 12/31/07*
| | | |
Financials | | 17 | % |
Information Technology | | 17 | |
Energy | | 13 | |
Health Care | | 12 | |
Industrials | | 11 | |
Consumer Staples | | 10 | |
Consumer Discretionary | | 8 | |
Other (includes short-term investments) | | 12 | |
| * | % of total investments as of December 31, 2007. |
For information regarding the indexes and certain investment terms see the glossary starting on page 2.
43
PHOENIX CAPITAL GROWTH SERIES
SCHEDULE OF INVESTMENTS
DECEMBER 31, 2007
| | | | | |
| | | SHARES | | VALUE
(000) |
DOMESTIC COMMON STOCKS—95.8% | | | | | |
Aerospace & Defense—5.7% | | | | | |
Boeing Co. (The) | | 6,336 | | $ | 554 |
Goodrich Corp. | | 123,800 | | | 8,742 |
Lockheed Martin Corp. | | 90,700 | | | 9,547 |
Precision Castparts Corp. | | 19,850 | | | 2,753 |
United Technologies Corp. | | 13,552 | | | 1,037 |
| | | | | |
| | | | | 22,633 |
| | | | | |
Airlines—0.8% | | | | | |
Continental Airlines, Inc. Class B(b)(d) | | 139,450 | | | 3,103 |
| | | | | |
Application Software—1.0% | | | | | |
Autodesk, Inc.(b) | | 76,900 | | | 3,827 |
| | | | | |
Asset Management & Custody Banks—0.9% | | | | | |
Janus Capital Group, Inc.(d) | | 109,950 | | | 3,612 |
| | | | | |
Biotechnology—3.5% | | | | | |
Amgen, Inc.(b) | | 6,161 | | | 286 |
Gilead Sciences, Inc.(b) | | 302,564 | | | 13,921 |
| | | | | |
| | | | | 14,207 |
| | | | | |
Commodity Chemicals—0.9% | | | | | |
Celanese Corp. Series A | | 88,600 | | | 3,750 |
| | | | | |
Communications Equipment—3.5% | | | | | |
Cisco Systems, Inc.(b) | | 498,646 | | | 13,498 |
QUALCOMM, Inc. | | 15,745 | | | 620 |
| | | | | |
| | | | | 14,118 |
| | | | | |
Computer Hardware—7.9% | | | | | |
Apple, Inc.(b) | | 78,000 | | | 15,450 |
Dell, Inc.(b) | | 253,700 | | | 6,218 |
Hewlett-Packard Co. | | 138,366 | | | 6,985 |
International Business Machines Corp. | | 26,100 | | | 2,822 |
| | | | | |
| | | | | 31,475 |
| | | | | |
Computer Storage & Peripherals—1.5% | | | | | |
EMC Corp.(b) | | 330,650 | | | 6,127 |
| | | | | |
Construction & Farm Machinery & | | | | | |
Heavy Trucks—1.7% | | | | | |
Cummins, Inc. | | 23,950 | | | 3,050 |
Deere & Co. | | 42,500 | | | 3,958 |
| | | | | |
| | | | | 7,008 |
| | | | | |
Distillers & Vintners—1.0% | | | | | |
Constellation Brands, Inc. Class A(b) | | 163,450 | | | 3,864 |
| | | | | |
Diversified Metals & Mining—3.2% | | | | | |
Freeport-McMoRan Copper & Gold, Inc. (Indonesia)(c) | | 123,800 | | | 12,682 |
| | | | | |
Electrical Components & Equipment—0.2% | | | | | |
Emerson Electric Co. | | 15,274 | | | 865 |
| | | | | |
Environmental & Facilities Services—2.5% | | | | | |
Allied Waste Industries, Inc.(b)(d) | | 890,850 | | | 9,817 |
| | | | | |
Food Retail—0.6% | | | | | |
Kroger Co. (The) | | 91,950 | | | 2,456 |
| | | | | |
Footwear—0.7% | | | | | |
NIKE, Inc. Class B | | 42,550 | | | 2,733 |
| | | | | |
Health Care Equipment—1.0% | | | | | |
Baxter International, Inc. | | 69,400 | | | 4,029 |
| | | | | |
Health Care Services—2.4% | | | | | |
Express Scripts, Inc.(b) | | 131,800 | | | 9,621 |
| | | | | |
Household Products—2.4% | | | | | |
Colgate-Palmolive Co. | | 84,731 | | | 6,606 |
Energizer Holdings, Inc.(b)(d) | | 26,350 | | | 2,954 |
| | | | | |
| | | | | 9,560 |
| | | | | |
Independent Power Producers & Energy Traders—2.2% | | | | | |
AES Corp. (The) | | 128,300 | | | 2,744 |
NRG Energy, Inc.(b)(d) | | 141,600 | | | 6,137 |
| | | | | |
| | | | | 8,881 |
| | | | | |
Industrial Conglomerates—0.8% | | | | | |
General Electric Co. | | 89,300 | | | 3,310 |
| | | | | |
Integrated Oil & Gas—3.2% | | | | | |
Exxon Mobil Corp. | | 98,400 | | | 9,219 |
Occidental Petroleum Corp. | | 44,800 | | | 3,449 |
| | | | | |
| | | | | 12,668 |
| | | | | |
Internet Retail—1.6% | | | | | |
Amazon.com, Inc.(b) | | 34,100 | | | 3,159 |
Expedia, Inc.(b)(d) | | 98,850 | | | 3,126 |
| | | | | |
| | | | | 6,285 |
| | | | | |
Internet Software & Services—1.6% | | | | | |
eBay, Inc.(b) | | 160,750 | | | 5,335 |
Google, Inc. Class A(b) | | 1,400 | | | 968 |
| | | | | |
| | | | | 6,303 |
| | | | | |
Investment Banking & Brokerage—1.0% | | | | | |
Goldman Sachs Group, Inc. (The) | | 5,100 | | | 1,097 |
Morgan Stanley | | 56,920 | | | 3,023 |
| | | | | |
| | | | | 4,120 |
| | | | | |
Life Sciences Tools & Services—2.2% | | | | | |
Invitrogen Corp.(b) | | 54,050 | | | 5,049 |
Waters Corp.(b) | | 46,450 | | | 3,673 |
| | | | | |
| | | | | 8,722 |
| | | | | |
Managed Health Care—3.9% | | | | | |
Aetna, Inc. | | 52,900 | | | 3,054 |
CIGNA Corp. | | 46,150 | | | 2,480 |
Health Net, Inc.(b) | | 16,589 | | | 801 |
Humana, Inc.(b) | | 82,450 | | | 6,209 |
UnitedHealth Group, Inc. | | 51,550 | | | 3,000 |
| | | | | |
| | | | | 15,544 |
| | | | | |
Metal & Glass Containers—2.1% | | | | | |
Owens-Illinois, Inc.(b) | | 168,350 | | | 8,333 |
| | | | | |
Movies & Entertainment—3.6% | | | | | |
News Corp. Class A | | 37,792 | | | 774 |
Regal Entertainment Group Class A(d) | | 351,750 | | | 6,356 |
Walt Disney Co. (The) | | 227,600 | | | 7,347 |
| | | | | |
| | | | | 14,477 |
| | | | | |
Oil & Gas Equipment & Services—4.1% | | | | | |
Baker Hughes, Inc. | | 10,515 | | | 853 |
BJ Services Co.(d) | | 15,747 | | | 382 |
Global Industries Ltd.(b) | | 218,650 | | | 4,683 |
Halliburton Co. | | 63,250 | | | 2,398 |
National Oilwell Varco, Inc.(b) | | 112,000 | | | 8,228 |
| | | | | |
| | | | | 16,544 |
| | | | | |
Oil & Gas Refining & Marketing—2.1% | | | | | |
Frontier Oil Corp. | | 124,950 | | | 5,070 |
Valero Energy Corp. | | 49,200 | | | 3,446 |
| | | | | |
| | | | | 8,516 |
| | | | | |
Pharmaceuticals—5.8% | | | | | |
Abbott Laboratories | | 6,212 | | | 349 |
Johnson & Johnson | | 6,954 | | | 464 |
Merck & Co., Inc. | | 164,700 | | | 9,571 |
Schering-Plough Corp. | | 146,150 | | | 3,893 |
Watson Pharmaceuticals, Inc.(b) | | 303,900 | | | 8,248 |
Wyeth | | 13,718 | | | 606 |
| | | | | |
| | | | | 23,131 |
| | | | | |
Property & Casualty Insurance—1.4% | | | | | |
Berkley (W.R.) Corp. | | 194,300 | | | 5,792 |
| | | | | |
Railroads—0.7% | | | | | |
Burlington Northern | | | | | |
Santa Fe Corp. | | 5,417 | | | 451 |
Norfolk Southern Corp. | | 46,150 | | | 2,328 |
| | | | | |
| | | | | 2,779 |
| | | | | |
See Notes to Financial Statements
44
PHOENIX CAPITAL GROWTH SERIES
| | | | | | | |
| | | SHARES | | VALUE
(000) | |
Restaurants—1.1% | | | | | | | |
Yum! Brands, Inc. | | | 119,700 | | $ | 4,581 | |
| | | | | | | |
Semiconductor Equipment—2.8% | | | | | | | |
Applied Materials, Inc. | | | 526,800 | | | 9,356 | |
Lam Research Corp.(b) | | | 46,200 | | | 1,997 | |
| | | | | | | |
| | | | | | 11,353 | |
| | | | | | | |
Semiconductors—2.4% | | | | | | | |
Intel Corp. | | | 250,550 | | | 6,680 | |
NVIDIA Corp.(b) | | | 85,650 | | | 2,914 | |
| | | | | | | |
| | | | | | 9,594 | |
| | | | | | | |
Soft Drinks—2.4% | | | | | | | |
Pepsi Bottling Group, Inc. (The) | | | 233,900 | | | 9,230 | |
PepsiCo, Inc. | | | 7,139 | | | 542 | |
| | | | | | | |
| | | | | | 9,772 | |
| | | | | | | |
Specialized Finance—0.8% | | | | | | | |
Nasdaq Stock Market, Inc. (The)(b)(d) | | | 66,200 | | | 3,276 | |
| | | | | | | |
Specialty Chemicals—0.8% | | | | | | | |
Sigma-Aldrich Corp. | | | 57,450 | | | 3,137 | |
| | | | | | | |
Specialty Stores—0.1% | | | | | | | |
PetSmart, Inc. | | | 20,256 | | | 477 | |
| | | | | | | |
Systems Software—7.7% | | | | | | | |
Microsoft Corp. | | | 418,479 | | | 14,898 | |
Oracle Corp.(b) | | | 714,500 | | | 16,133 | |
| | | | | | | |
| | | | | | 31,031 | |
| | | | | | | |
Total Domestic Common Stocks | | | | | | | |
(Identified Cost $313,730) | | | | | | 384,113 | |
| | | | | | | |
FOREIGN COMMON STOCKS(c) —2.9% | | | | | | | |
Communications Equipment—2.9% | | | | | | | |
Nokia Oyj Sponsored ADR (Finland) | | | 146,000 | | | 5,605 | |
Research In Motion Ltd. (Canada)(b) | | | 52,700 | | | 5,976 | |
| | | | | | | |
Total Foreign Common Stocks | | | | | | | |
(Identified Cost $11,398) | | | | | | 11,581 | |
| | | | | | | |
TOTAL LONG TERM INVESTMENTS—98.7% | | | | | | | |
(Identified cost $325,128) | | | | | | 395,694 | |
| | | | | | | |
SHORT-TERM INVESTMENTS—7.8% | | | | | | | |
Money Market Mutual Funds—6.5% | | | | | | | |
State Street Navigator Prime Plus (4.88% seven-day effective yield)(e) | | | 25,979,590 | | | 25,980 | |
| | | | | | | |
| | |
| | | PAR
VALUE
(000) | | | |
Commercial Paper(f)—1.3% | | | | | | | |
Nicor, Inc. | | | | | | | |
4.000% due 1/2/08 | | $ | 5,125 | | | 5,124 | |
| | | | | | | |
Total Short-Term Investments | | | | | | | |
(Identified Cost $31,104) | | | | | | 31,104 | |
| | | | | | | |
TOTAL INVESTMENTS—106.5% | | | | | | | |
(Identified Cost $356,232) | | | | | | 426,798 | (a) |
Other assets and liabilities, net—(6.5)% | | | | | | (26,186 | ) |
| | | | | | | |
NET ASSETS—100.0% | | | | | $ | 400,612 | |
| | | | | | | |
(a) | Federal Income Tax Information (reported in 000’s): Net unrealized appreciation of investment securities is comprised of gross appreciation of $78,466 and gross depreciation of $10,131 for federal income tax purposes. At December 31, 2007, the aggregate cost of securities for federal income tax purposes was $358,463. |
(c) | A security is considered to be foreign if the security is issued in a foreign country. The country of risk, noted parenthetically, is determined based on criteria described in Note 2G “Foreign security country determination” in the Notes to Financial Statements. |
(d) | All or a portion of security is on loan. |
(e) | Represents security purchased with cash collateral received for securities on loan. |
(f) | The rate shown is the discount rate. |
See Notes to Financial Statements
45
PHOENIX GROWTH AND INCOME SERIES
SCHEDULE OF INVESTMENTS
DECEMBER 31, 2007
| | | | | |
| | | SHARES | | VALUE
(000) |
DOMESTIC COMMON STOCKS—97.7% | | | | | |
Aerospace & Defense—5.2% | | | | | |
Boeing Co. (The) | | 20,100 | | $ | 1,758 |
General Dynamics Corp. | | 5,200 | | | 463 |
Honeywell International, Inc. | | 16,800 | | | 1,034 |
Lockheed Martin Corp. | | 13,000 | | | 1,368 |
Northrop Grumman Corp. | | 8,400 | | | 661 |
Raytheon Co. | | 9,100 | | | 552 |
United Technologies Corp. | | 31,300 | | | 2,396 |
| | | | | |
| | | | | 8,232 |
| | | | | |
Air Freight & Logistics—0.2% | | | | | |
United Parcel Service, Inc. Class B | | 5,200 | | | 368 |
| | | | | |
Airlines—0.1% | | | | | |
AMR Corp.(b) | | 10,600 | | | 149 |
Continental Airlines, Inc. Class B(b) | | 3,800 | | | 84 |
| | | | | |
| | | | | 233 |
| | | | | |
Apparel Retail—0.5% | | | | | |
Aeropostale, Inc.(b) | | 7,000 | | | 186 |
Gap, Inc. (The) | | 23,700 | | | 504 |
Men’s Wearhouse, Inc. (The) | | 4,500 | | | 121 |
| | | | | |
| | | | | 811 |
| | | | | |
Apparel, Accessories & Luxury Goods—0.2% | | | | | |
VF Corp. | | 5,700 | | | 391 |
| | | | | |
Application Software—0.2% | | | | | |
Aspen Technology, Inc.(b) | | 16,900 | | | 274 |
| | | | | |
Asset Management & Custody Banks—3.4% | | | | | |
Ameriprise Financial, Inc. | | 4,100 | | | 226 |
Bank of New York Mellon Corp. (The) | | 25,315 | | | 1,235 |
Federated Investors, Inc. Class B | | 8,800 | | | 362 |
Franklin Resources, Inc. | | 5,700 | | | 652 |
Legg Mason, Inc. | | 6,600 | | | 483 |
Northern Trust Corp. | | 10,600 | | | 812 |
SEI Investments Co. | | 12,600 | | | 405 |
State Street Corp. | | 15,200 | | | 1,234 |
| | | | | |
| | | | | 5,409 |
| | | | | |
Auto Parts & Equipment—0.4% | | | | | |
American Axle & Manufacturing Holdings, Inc. | | 5,400 | | | 100 |
Lear Corp.(b) | | 17,200 | | | 476 |
| | | | | |
| | | | | 576 |
| | | | | |
Automobile Manufacturers—0.1% | | | | | |
Thor Industries, Inc. | | 5,000 | | | 190 |
| | | | | |
Biotechnology—0.6% | | | | | |
Cephalon, Inc.(b) | | 1,900 | | | 137 |
OSI Pharmaceuticals, Inc.(b) | | 17,900 | | | 868 |
| | | | | |
| | | | | 1,005 |
| | | | | |
Brewers—0.7% | | | | | |
Anheuser-Busch Cos., Inc. | | 20,400 | | | 1,068 |
| | | | | |
Broadcasting & Cable TV—0.6% | | | | | |
CBS Corp. Class B | | 35,500 | | | 967 |
| | | | | |
Building Products—0.2% | | | | | |
Masco Corp. | | 15,700 | | | 339 |
| | | | | |
Coal & Consumable Fuels—0.4% | | | | | |
Massey Energy Co. | | 18,500 | | | 661 |
| | | | | |
Commercial Printing—0.3% | | | | | |
RR Donnelley & Sons Co. | | 12,700 | | | 479 |
| | | | | |
Communications Equipment—1.8% | | | | | |
Cisco Systems, Inc.(b) | | 102,800 | | | 2,783 |
| | | | | |
Computer & Electronics Retail—0.1% | | | | | |
RadioShack Corp. | | 12,100 | | | 204 |
| | | | | |
Computer Hardware—3.9% | | | | | |
Hewlett-Packard Co. | | 52,700 | | | 2,660 |
International Business Machines Corp. | | 32,400 | | | 3,503 |
NCR Corp.(b) | | 3,300 | | | 83 |
| | | | | |
| | | | | 6,246 |
| | | | | |
Computer Storage & Peripherals—0.4% | | | | | |
Emulex Corp.(b) | | 18,500 | | | 302 |
Network Appliance, Inc.(b) | | 10,300 | | | 257 |
QLogic Corp.(b) | | 10,300 | | | 146 |
| | | | | |
| | | | | 705 |
| | | | | |
Construction & Engineering—0.1% | | | | | |
Perini Corp.(b) | | 1,800 | | | 75 |
| | | | | |
Construction & Farm Machinery & Heavy Trucks—0.7% | | | | | |
AGCO Corp.(b) | | 7,600 | | | 517 |
Cummins, Inc. | | 1,200 | | | 153 |
Toro Co. (The) | | 7,300 | | | 397 |
| | | | | |
| | | | | 1,067 |
| | | | | |
Data Processing & Outsourced Services—1.4% | | | | | |
Automatic Data Processing, Inc. | | 15,000 | | | 668 |
Computer Sciences Corp.(b) | | 8,400 | | | 416 |
Electronic Data Systems Corp. | | 23,500 | | | 487 |
Fiserv, Inc.(b) | | 13,100 | | | 727 |
| | | | | |
| | | | | 2,298 |
| | | | | |
Diversified Banks—1.3% | | | | | |
Comerica, Inc. | | 6,900 | | | 300 |
Wells Fargo & Co. | | 56,200 | | | 1,697 |
| | | | | |
| | | | | 1,997 |
| | | | | |
Diversified Chemicals—0.9% | | | | | |
Dow Chemical Co. (The) | | 12,900 | | | 509 |
E.I. du Pont de Nemours & Co. | | 20,300 | | | 895 |
| | | | | |
| | | | | 1,404 |
| | | | | |
Diversified Commercial & Professional Services—0.3% | | | | | |
Dun & Bradstreet Corp. | | 5,000 | | | 443 |
| | | | | |
Diversified Metals & Mining—0.5% | | | | | |
Freeport-McMoRan Copper & Gold, Inc. (Indonesia)(c) | | 2,900 | | | 297 |
Southern Copper Corp. | | 4,300 | | | 452 |
| | | | | |
| | | | | 749 |
| | | | | |
Electric Utilities—1.2% | | | | | |
FirstEnergy Corp. | | 26,400 | | | 1,910 |
| | | | | |
Electrical Components & Equipment—1.1% | | | | | |
Emerson Electric Co. | | 28,100 | | | 1,592 |
GrafTech International Ltd.(b) | | 6,400 | | | 114 |
| | | | | |
| | | | | 1,706 |
| | | | | |
Electronic Equipment Manufacturers—0.4% | | | | | |
Agilent Technologies, Inc.(b) | | 18,400 | | | 676 |
| | | | | |
Electronic Manufacturing Services—0.4% | | | | | |
Tyco Electronics Ltd. | | 15,600 | | | 579 |
| | | | | |
Fertilizers & Agricultural Chemicals—0.1% | | | | | |
Terra Industries, Inc.(b) | | 2,500 | | | 119 |
| | | | | |
Food Retail—0.5% | | | | | |
Kroger Co. (The) | | 17,500 | | | 467 |
SUPERVALU, Inc. | | 6,600 | | | 248 |
| | | | | |
| | | | | 715 |
| | | | | |
Footwear—0.6% | | | | | |
NIKE, Inc. Class B | | 14,700 | | | 944 |
| | | | | |
General Merchandise Stores—0.2% | | | | | |
Big Lots, Inc.(b) | | 10,800 | | | 173 |
Family Dollar Stores, Inc. | | 10,300 | | | 198 |
| | | | | |
| | | | | 371 |
| | | | | |
Health Care Distributors—1.1% | | | | | |
Cardinal Health, Inc. | | 12,300 | | | 710 |
McKesson Corp. | | 15,600 | | | 1,022 |
| | | | | |
| | | | | 1,732 |
| | | | | |
See Notes to Financial Statements
46
PHOENIX GROWTH AND INCOME SERIES
| | | | | |
| | | SHARES | | VALUE
(000) |
Health Care Equipment—0.6% | | | | | |
Baxter International, Inc. | | 15,200 | | $ | 882 |
| | | | | |
Health Care Services—0.3% | | | | | |
Medco Health Solutions, Inc.(b) | | 3,900 | | | 395 |
| | | | | |
Home Improvement Retail—0.6% | | | | | |
Sherwin-Williams Co. (The) | | 17,000 | | | 987 |
| | | | | |
Household Appliances—0.3% | | | | | |
Stanley Works (The) | | 6,200 | | | 301 |
Whirlpool Corp. | | 2,800 | | | 228 |
| | | | | |
| | | | | 529 |
| | | | | |
Household Products—1.2% | | | | | |
Clorox Co. (The) | | 14,200 | | | 925 |
Kimberly-Clark Corp. | | 5,700 | | | 395 |
Procter & Gamble Co. (The) | | 8,900 | | | 654 |
| | | | | |
| | | | | 1,974 |
| | | | | |
Housewares & Specialties—0.3% | | | | | |
American Greetings Corp. Class A | | 6,300 | | | 128 |
Newell Rubbermaid, Inc. | | 12,700 | | | 329 |
| | | | | |
| | | | | 457 |
| | | | | |
Hypermarkets & Super Centers—0.7% | | | | | |
BJ’s Wholesale Club, Inc.(b) | | 8,400 | | | 284 |
Wal-Mart Stores, Inc. | | 18,000 | | | 856 |
| | | | | |
| | | | | 1,140 |
| | | | | |
Industrial Conglomerates—0.8% | | | | | |
Teleflex, Inc. | | 3,500 | | | 221 |
Tyco International Ltd. | | 28,225 | | | 1,119 |
| | | | | |
| | | | | 1,340 |
| | | | | |
Industrial Machinery—1.5% | | | | | |
Dover Corp. | | 4,100 | | | 189 |
Eaton Corp. | | 13,200 | | | 1,280 |
Gardner Denver, Inc.(b) | | 5,300 | | | 175 |
Parker Hannifin Corp. | | 9,250 | | | 696 |
| | | | | |
| | | | | 2,340 |
| | | | | |
Insurance Brokers—0.3% | | | | | |
AON Corp. | | 11,400 | | | 544 |
| | | | | |
Integrated Oil & Gas—9.1% | | | | | |
Chevron Corp. | | 14,300 | | | 1,334 |
ConocoPhillips | | 19,200 | | | 1,695 |
Exxon Mobil Corp. | | 75,000 | | | 7,027 |
Marathon Oil Corp. | | 9,100 | | | 554 |
Occidental Petroleum Corp. | | 49,600 | | | 3,819 |
| | | | | |
| | | | | 14,429 |
| | | | | |
Integrated Telecommunication Services—3.8% | | | | | |
AT&T, Inc. | | 101,205 | | | 4,206 |
Qwest Communications | | | | | |
International, Inc.(b) | | 39,900 | | | 280 |
Verizon Communications, Inc. | | 21,100 | | | 922 |
Windstream Corp. | | 48,100 | | | 626 |
| | | | | |
| | | | | 6,034 |
| | | | | |
Internet Retail—0.3% | | | | | |
Expedia, Inc.(b) | | 4,900 | | | 155 |
IAC/InterActiveCorp.(b) | | 9,800 | | | 264 |
| | | | | |
| | | | | 419 |
| | | | | |
Internet Software & Services—0.6% | | | | | |
eBay, Inc.(b) | | 30,500 | | | 1,012 |
| | | | | |
Investment Banking & Brokerage—1.2% | | | | | |
Charles Schwab Corp. (The) | | 15,500 | | | 396 |
Goldman Sachs Group, Inc. (The) | | 5,700 | | | 1,226 |
TD Ameritrade Holding Corp.(b) | | 16,800 | | | 337 |
| | | | | |
| | | | | 1,959 |
| | | | | |
Leisure Products—0.1% | | | | | |
Hasbro, Inc. | | 5,500 | | | 141 |
| | | | | |
Life & Health Insurance—3.9% | | | | | |
AFLAC, Inc. | | 11,900 | | | 745 |
Lincoln National Corp. | | 15,200 | | | 885 |
MetLife, Inc. | | 33,500 | | | 2,064 |
Principal Financial Group, Inc. (The) | | 13,100 | | | 902 |
Prudential Financial, Inc. | | 15,300 | | | 1,424 |
StanCorp Financial Group, Inc. | | 2,500 | | | 126 |
Unum Group | | 5,200 | | | 124 |
| | | | | |
| | | | | 6,270 |
| | | | | |
Life Sciences Tools & Services—0.2% | | | | | |
Invitrogen Corp.(b) | | 3,900 | | | 364 |
| | | | | |
Managed Health Care—3.0% | | | | | |
Aetna, Inc. | | 18,400 | | | 1,062 |
CIGNA Corp. | | 12,600 | | | 677 |
Coventry Health Care, Inc.(b) | | 3,000 | | | 178 |
UnitedHealth Group, Inc. | | 30,000 | | | 1,746 |
WellPoint, Inc.(b) | | 11,900 | | | 1,044 |
| | | | | |
| | | | | 4,707 |
| | | | | |
Metal & Glass Containers—0.2% | | | | | |
Ball Corp. | | 3,300 | | | 148 |
Owens-Illinois, Inc.(b) | | 4,600 | | | 228 |
| | | | | |
| | | | | 376 |
| | | | | |
Mortgage REITs—0.5% | | | | | |
Annaly Capital Management, Inc. | | 40,200 | | | 731 |
CapitalSource, Inc. | | 5,200 | | | 91 |
| | | | | |
| | | | | 822 |
| | | | | |
Movies & Entertainment—2.8% | | | | | |
Time Warner, Inc. | | 76,900 | | | 1,269 |
Viacom, Inc. Class B(b) | | 34,700 | | | 1,524 |
Walt Disney Co. (The) | | 52,500 | | | 1,695 |
| | | | | |
| | | | | 4,488 |
| | | | | |
Multi-line Insurance—1.8% | | | | | |
American International Group, Inc. | | 46,200 | | | 2,694 |
Hartford Financial Services Group, Inc. (The) | | 2,000 | | | 174 |
| | | | | |
| | | | | 2,868 |
| | | | | |
Multi-Utilities—0.8% | | | | | |
Public Service Enterprise Group, Inc. | | 13,600 | | | 1,336 |
| | | | | |
Office Electronics—0.1% | | | | | |
Xerox Corp. | | 7,600 | | | 123 |
| | | | | |
Oil & Gas Drilling—0.8% | | | | | |
ENSCO International, Inc. | | 3,000 | | | 179 |
Transocean, Inc. | | 7,600 | | | 1,088 |
| | | | | |
| | | | | 1,267 |
| | | | | |
Oil & Gas Equipment & Services—1.2% | | | | | |
Dresser-Rand Group, Inc.(b) | | 7,100 | | | 277 |
National Oilwell Varco, Inc.(b) | | 16,100 | | | 1,183 |
Tidewater, Inc. | | 7,600 | | | 417 |
| | | | | |
| | | | | 1,877 |
| | | | | |
Oil & Gas Exploration & Production—0.4% | | | | | |
Devon Energy Corp. | | 1,500 | | | 133 |
Noble Energy, Inc. | | 1,800 | | | 143 |
W&T Offshore, Inc. | | 10,900 | | | 327 |
| | | | | |
| | | | | 603 |
| | | | | |
Oil & Gas Refining & Marketing—0.5% | | | | | |
Holly Corp. | | 3,300 | | | 168 |
Valero Energy Corp. | | 8,500 | | | 595 |
| | | | | |
| | | | | 763 |
| | | | | |
Other Diversified Financial Services—5.0% | | | | | |
Bank of America Corp. | | 94,300 | | | 3,891 |
Citigroup, Inc. | | 9,800 | | | 288 |
JPMorgan Chase & Co. | | 85,400 | | | 3,728 |
| | | | | |
| | | | | 7,907 |
| | | | | |
Packaged Foods & Meats—0.4% | | | | | |
General Mills, Inc. | | 9,800 | | | 559 |
| | | | | |
Paper Packaging—0.2% | | | | | |
Packaging Corporation of America | | 13,200 | | | 372 |
| | | | | |
Personal Products—0.3% | | | | | |
NBTY, Inc.(b) | | 17,500 | | | 480 |
| | | | | |
See Notes to Financial Statements
47
PHOENIX GROWTH AND INCOME SERIES
| | | | | | | |
| | | SHARES | | VALUE
(000) | |
Pharmaceuticals—6.9% | | | | | | | |
Abbott Laboratories | | | 7,300 | | $ | 410 | |
Bristol-Myers Squibb Co. | | | 13,500 | | | 358 | |
Endo Pharmaceuticals Holdings, Inc.(b) | | | 8,600 | | | 229 | |
Forest Laboratories, Inc.(b) | | | 13,300 | | | 485 | |
Johnson & Johnson | | | 52,000 | | | 3,469 | |
Merck & Co., Inc. | | | 52,700 | | | 3,062 | |
Pfizer, Inc. | | | 116,700 | | | 2,653 | |
Wyeth | | | 8,600 | | | 380 | |
| | | | | | | |
| | | | | | 11,046 | |
| | | | | | | |
Photographic Products—0.1% | | | | | | | |
Eastman Kodak Co. | | | 9,800 | | | 214 | |
| | | | | | | |
Property & Casualty Insurance—1.4% | | | | | | | |
Chubb Corp. (The) | | | 6,500 | | | 355 | |
Cincinnati Financial Corp. | | | 5,800 | | | 229 | |
Philadelphia Consolidated Holding Co.(b) | | | 3,000 | | | 118 | |
Travelers Cos., Inc. (The) | | | 27,900 | | | 1,501 | |
| | | | | | | |
| | | | | | 2,203 | |
| | | | | | | |
Railroads—0.2% | | | | | | | |
Norfolk Southern Corp. | | | 7,600 | | | 383 | |
| | | | | | | |
Real Estate Management & Development—0.0% | | | | | | | |
Jones Lang LaSalle, Inc. | | | 1,000 | | | 71 | |
| | | | | | | |
Regional Banks—0.6% | | | | | | | |
Bank of Hawaii Corp. | | | 1,900 | | | 97 | |
KeyCorp | | | 12,200 | | | 286 | |
Regions Financial Corp. | | | 14,500 | | | 343 | |
SunTrust Banks, Inc. | | | 2,700 | | | 169 | |
| | | | | | | |
| | | | | | 895 | |
| | | | | | | |
Restaurants—1.9% | | | | | | | |
McDonald’s Corp. | | | 36,400 | | | 2,144 | |
Yum! Brands, Inc. | | | 23,400 | | | 896 | |
| | | | | | | |
| | | | | | 3,040 | |
| | | | | | | |
Semiconductor Equipment—1.1% | | | | | | | |
Applied Materials, Inc. | | | 43,800 | | | 778 | |
Lam Research Corp.(b) | | | 5,100 | | | 221 | |
MEMC Electronic Materials, Inc.(b) | | | 3,700 | | | 327 | |
Novellus Systems, Inc.(b) | | | 13,000 | | | 358 | |
| | | | | | | |
| | | | | | 1,684 | |
| | | | | | | |
Semiconductors—2.0% | | | | | | | |
Amkor Technology, Inc.(b) | | | 15,300 | | | 131 | |
Integrated Device Technology, Inc. (b) | | | 21,900 | | | 248 | |
Intel Corp. | | | 48,400 | | | 1,290 | |
NVIDIA Corp.(b) | | | 16,950 | | | 577 | |
Texas Instruments, Inc. | | | 29,800 | | | 995 | |
| | | | | | | |
| | | | | | 3,241 | |
| | | | | | | |
Soft Drinks—1.6% | | | | | | | |
Coca-Cola Co. (The) | | | 22,600 | | | 1,387 | |
Pepsi Bottling Group, Inc. (The) | | | 29,100 | | | 1,148 | |
| | | | | | | |
| | | | | | 2,535 | |
| | | | | | | |
Specialized REITs—0.3% | | | | | | | |
FelCor Lodging Trust, Inc. | | | 14,500 | | | 226 | |
Host Hotels & Resorts, Inc. | | | 12,500 | | | 213 | |
| | | | | | | |
| | | | | | 439 | |
| | | | | | | |
Specialty Chemicals—0.1% | | | | | | | |
H.B. Fuller Co. | | | 8,400 | | | 189 | |
| | | | | | | |
Steel—0.3% | | | | | | | |
AK Steel Holding Corp.(b) | | | 11,000 | | | 509 | |
| | | | | | | |
Systems Software—5.1% | | | | | | | |
BMC Software, Inc.(b) | | | 9,000 | | | 321 | |
McAfee, Inc.(b) | | | 4,200 | | | 157 | |
Microsoft Corp. | | | 148,900 | | | 5,301 | |
Oracle Corp.(b) | | | 76,700 | | | 1,732 | |
Symantec Corp.(b) | | | 39,900 | | | 644 | |
| | | | | | | |
| | | | | | 8,155 | |
| | | | | | | |
Technology Distributors—0.1% | | | | | | | |
Arrow Electronics, Inc.(b) | | | 2,500 | | | 98 | |
| | | | | | | |
Tobacco—1.8% | | | | | | | |
Altria Group, Inc. | | | 15,300 | | | 1,156 | |
Loews Corp. - Carolina Group | | | 14,200 | | | 1,211 | |
Reynolds American, Inc. | | | 2,500 | | | 165 | |
Universal Corp. | | | 4,800 | | | 246 | |
| | | | | | | |
| | | | | | 2,778 | |
| | | | | | | |
Wireless Telecommunication Services—0.3% | | | | | | | |
Sprint Nextel Corp. | | | 41,300 | | | 542 | |
| | | | | | | |
Total Domestic Common Stocks | | | | | | | |
(Identified Cost $119,266) | | | | | | 155,512 | |
| | | | | | | |
FOREIGN COMMON STOCKS(c)—1.1% | | | | | | | |
Computer Storage & Peripherals—0.3% | | | | | | | |
Seagate Technology (Singapore) | | | 15,100 | | | 385 | |
| | | | | | | |
Industrial Machinery—0.1% | | | | | | | |
Ingersoll-Rand Co., Ltd. Class A (United States) | | | 3,500 | | | 163 | |
| | | | | | | |
IT Consulting & Other Services—0.5% | | | | | | | |
Accenture Ltd. Class A (United States) | | | 23,400 | | | 843 | |
| | | | | | | |
Property & Casualty Insurance—0.2% | | | | | | | |
XL Capital Ltd. Class A (United States) | | | 6,700 | | | 337 | |
| | | | | | | |
Total Foreign Common Stocks | | | | | | | |
(Identified Cost $2,003) | | | | | | 1,728 | |
| | | | | | | |
TOTAL LONG TERM INVESTMENTS—98.8% | | | | | | | |
(Identified cost $121,269) | | | | | | 157,240 | |
| | | | | | | |
SHORT-TERM INVESTMENTS—0.8% | | | | | | | |
| | | PAR
VALUE
(000) | | | |
Commercial Paper(d)—0.8% | | | | | | | |
Praxair, Inc. | | | | | | | |
3.600% due 1/2/08 | | $ | 1,250 | | | 1,250 | |
| | | | | | | |
Total Short-Term Investments | | | | | | | |
(Identified Cost $1,250) | | | | | | 1,250 | |
| | | | | | | |
TOTAL INVESTMENTS—99.6% | | | | | | | |
(Identified Cost $122,519) | | | | | | 158,490 | (a) |
Other assets and liabilities, net—0.4% | | | | | | 584 | |
| | | | | | | |
NET ASSETS—100.0% | | | | | $ | 159,074 | |
| | | | | | | |
(a) | Federal Income Tax Information (reported in 000’s): Net unrealized appreciation of investment securities is comprised of gross appreciation of $41,103 and gross depreciation of $5,729 for federal income tax purposes. At December 31, 2007, the aggregate cost of securities for federal income tax purposes was $123,116. |
(c) | A security is considered to be foreign if the security is issued in a foreign country. The country of risk, noted parenthetically, is determined based on criteria described in Note 2G “Foreign security country determination” in the Notes to Financial Statements. |
(d) | The interest rate shown is the coupon rate. |
See Notes to Financial Statements
48
PHOENIX MID-CAP GROWTH SERIES
SCHEDULE OF INVESTMENTS
DECEMBER 31, 2007
| | | | | |
| | | SHARES | | VALUE
(000) |
DOMESTIC COMMON STOCKS—89.4% | | | | | |
Advertising—1.0% | | | | | |
Lamar Advertising Co. Class A | | 17,300 | | $ | 832 |
| | | | | |
Aerospace & Defense—6.2% | | | | | |
Aercap Holdings N.V.(b) | | 36,000 | | | 752 |
BE Aerospace, Inc.(b) | | 26,600 | | | 1,407 |
Precision Castparts Corp. | | 15,200 | | | 2,108 |
Rockwell Collins, Inc. | | 15,800 | | | 1,137 |
| | | | | |
| | | | | 5,404 |
| | | | | |
Air Freight & Logistics—1.5% | | | | | |
Expeditors International of Washington, Inc. | | 13,000 | | | 581 |
Robinson (C.H.) Worldwide, Inc. | | 13,500 | | | 730 |
| | | | | |
| | | | | 1,311 |
| | | | | |
Apparel Retail—1.2% | | | | | |
Abercrombie & Fitch Co. Class A | | 6,800 | | | 544 |
Urban Outfitters, Inc.(b) | | 17,700 | | | 482 |
| | | | | |
| | | | | 1,026 |
| | | | | |
Apparel, Accessories & Luxury Goods—0.7% | | | | | |
Coach, Inc.(b) | | 20,000 | | | 612 |
| | | | | |
Application Software—3.4% | | | | | |
ANSYS, Inc.(b) | | 19,100 | | | 792 |
Autodesk, Inc.(b) | | 18,200 | | | 906 |
Citrix Systems, Inc.(b) | | 22,000 | | | 836 |
Intuit, Inc.(b) | | 14,900 | | | 471 |
| | | | | |
| | | | | 3,005 |
| | | | | |
Asset Management & Custody Banks—1.1% | | | | | |
AllianceBernstein Holding LP | | 4,900 | | | 369 |
Northern Trust Corp. | | 7,500 | | | 574 |
| | | | | |
| | | | | 943 |
| | | | | |
Biotechnology—2.7% | | | | | |
Applera Corp.—Celera Group(b) | | 15,000 | | | 238 |
Celgene Corp.(b) | | 8,800 | | | 407 |
IDEXX Laboratories, Inc.(b) | | 8,000 | | | 469 |
Myriad Genetics, Inc.(b) | | 9,900 | | | 459 |
United Therapeutics Corp.(b) | | 8,200 | | | 801 |
| | | | | |
| | | | | 2,374 |
| | | | | |
Broadcasting & Cable TV—0.5% | | | | | |
Liberty Global, Inc. Class A(b) | | 11,100 | | | 435 |
| | | | | |
Casinos & Gaming—4.3% | | | | | |
International Game Technology | | 7,600 | | | 334 |
Melco PBL Entertainment Ltd(b) | | 42,000 | | | 486 |
Penn National Gaming, Inc.(b) | | 14,700 | | | 875 |
Scientific Games Corp. Class A(b) | | 29,000 | | | 964 |
WMS Industries, Inc.(b) | | 29,900 | | | 1,096 |
| | | | | |
| | | | | 3,755 |
| | | | | |
Communications Equipment—4.1% | | | | | |
Arris Group, Inc.(b) | | 70,400 | | | 703 |
F5 Networks, Inc.(b) | | 15,700 | | | 448 |
Foundry Networks, Inc.(b) | | 40,900 | | | 716 |
Harris Corp. | | 10,300 | | | 646 |
Juniper Networks, Inc.(b) | | 19,100 | | | 634 |
Polycom, Inc.(b) | | 16,000 | | | 444 |
| | | | | |
| | | | | 3,591 |
| | | | | |
Computer & Electronics Retail—1.3% | | | | | |
GameStop Corp. Class A(b) | | 19,000 | | | 1,180 |
| | | | | |
Construction & Engineering—1.7% | | | | | |
Fluor Corp. | | 6,700 | | | 976 |
Shaw Group, Inc. (The)(b) | | 8,000 | | | 484 |
| | | | | |
| | | | | 1,460 |
| | | | | |
Data Processing & Outsourced Services—2.8% | | | | | |
Iron Mountain, Inc.(b) | | 26,400 | | | 977 |
MasterCard, Inc. Class A | | 5,600 | | | 1,205 |
Total System Services, Inc. | | 8,000 | | | 224 |
| | | | | |
| | | | | 2,406 |
| | | | | |
Diversified Commercial & Professional Services—2.2% | | | | | |
Corrections Corporation of America(b) | | 30,000 | | | 885 |
Huron Consulting Group, Inc.(b) | | 2,600 | | | 210 |
IHS, Inc.(b) | | 13,700 | | | 830 |
| | | | | |
| | | | | 1,925 |
| | | | | |
Education Services—2.1% | | | | | |
DeVry, Inc. | | 20,200 | | | 1,049 |
Strayer Education, Inc. | | 4,500 | | | 768 |
| | | | | |
| | | | | 1,817 |
| | | | | |
Electrical Components & Equipment—0.3% | | | | | |
Ametek, Inc. | | 5,500 | | | 258 |
| | | | | |
Electronic Equipment Manufacturers—0.6% | | | | | |
Dolby Laboratories, Inc. Class A(b) | | 11,400 | | | 567 |
| | | | | |
Electronic Manufacturing Services—1.0% | | | | | |
Trimble Navigation Ltd.(b) | | 28,100 | | | 850 |
| | | | | |
Environmental & Facilities Services—1.1% | | | | | |
Stericycle, Inc.(b) | | 15,800 | | | 939 |
| | | | | |
Health Care Equipment—6.4% | | | | | |
Bard (C.R.), Inc. | | 10,700 | | | 1,014 |
Gen-Probe, Inc.(b) | | 12,200 | | | 768 |
Hologic, Inc.(b) | | 28,300 | | | 1,943 |
Intuitive Surgical, Inc.(b) | | 3,500 | | | 1,136 |
Wright Medical Group, Inc.(b) | | 23,500 | | | 685 |
| | | | | |
| | | | | 5,546 |
| | | | | |
Health Care Facilities—1.6% | | | | | |
Psychiatric Solutions, Inc.(b) | | 12,000 | | | 390 |
VCA Antech, Inc.(b) | | 22,800 | | | 1,008 |
| | | | | |
| | | | | 1,398 |
| | | | | |
Health Care Services—1.0% | | | | | |
Express Scripts, Inc.(b) | | 12,300 | | | 898 |
| | | | | |
Health Care Supplies—0.8% | | | | | |
Inverness Medical Innovations, Inc.(b) | | 13,000 | | | 730 |
| | | | | |
Health Care Technology—1.2% | | | | | |
Cerner Corp.(b) | | 18,500 | | | 1,043 |
| | | | | |
Home Entertainment Software—1.7% | | | | | |
Activision, Inc.(b) | | 51,500 | | | 1,530 |
| | | | | |
Hotels, Resorts & Cruise Lines—0.7% | | | | | |
Gaylord Entertainment Co.(b) | | 15,000 | | | 607 |
| | | | | |
Household Products—0.6% | | | | | |
Energizer Holdings, Inc.(b) | | 5,000 | | | 561 |
| | | | | |
Industrial Gases—1.3% | | | | | |
Airgas, Inc. | | 21,300 | | | 1,110 |
| | | | | |
Industrial Machinery—1.2% | | | | | |
Danaher Corp. | | 11,900 | | | 1,044 |
| | | | | |
Integrated Oil & Gas—0.6% | | | | | |
Murphy Oil Corp. | | 6,700 | | | 568 |
| | | | | |
Internet Retail—1.1% | | | | | |
GSI Commerce®, Inc.(b) | | 18,400 | | | 359 |
IAC/InterActiveCorp.(b) | | 20,900 | | | 562 |
| | | | | |
| | | | | 921 |
| | | | | |
Internet Software & Services—1.5% | | | | | |
Equinix, Inc. | | 4,500 | | | 455 |
Omniture, Inc.(b) | | 7,000 | | | 233 |
VistaPrint Ltd.(b) | | 15,500 | | | 664 |
| | | | | |
| | | | | 1,352 |
| | | | | |
Investment Banking & Brokerage—1.0% | | | | | |
GFI Group, Inc.(b) | | 9,300 | | | 890 |
| | | | | |
IT Consulting & Other Services—1.7% | | | | | |
Cognizant Technology Solutions Corp. Class A(b) | | 43,300 | | | 1,470 |
| | | | | |
See Notes to Financial Statements
49
PHOENIX MID-CAP GROWTH SERIES
| | | | | | | |
| | | SHARES | | VALUE
(000) | |
Leisure Facilities—0.5% | | | | | | | |
Vail Resorts, Inc.(b) | | | 7,600 | | $ | 409 | |
| | | | | | | |
Life Sciences Tools & Services—1.3% | | | | | | | |
Amag Pharmaceuticals, Inc.(b) | | | 6,500 | | | 391 | |
Pharmaceutical Product Development, Inc. | | | 18,400 | | | 743 | |
| | | | | | | |
| | | | | | 1,134 | |
| | | | | | | |
Oil & Gas Equipment & Services—3.7% | | | | | | | |
Dresser-Rand Group, Inc.(b) | | | 12,000 | | | 469 | |
ION Geophysical Corp. | | | 23,700 | | | 374 | |
National Oilwell Varco, Inc.(b) | | | 17,400 | | | 1,278 | |
Smith International, Inc. | | | 14,800 | | | 1,093 | |
| | | | | | | |
| | | | | | 3,214 | |
| | | | | | | |
Oil & Gas Exploration & Production—5.7% | | | | | | | |
Concho Resources, Inc.(b) | | | 18,000 | | | 371 | |
Continental Resources, Inc.(b) | | | 12,800 | | | 334 | |
Denbury Resources, Inc.(b) | | | 64,800 | | | 1,928 | |
Range Resources Corp. | | | 28,500 | | | 1,464 | |
XTO Energy, Inc. | | | 17,500 | | | 899 | |
| | | | | | | |
| | | | | | 4,996 | |
| | | | | | | |
Packaged Foods & Meats—0.3% | | | | | | | |
Ralcorp Holdings, Inc.(b) | | | 4,100 | | | 249 | |
| | | | | | | |
Personal Products—1.6% | | | | | | | |
Bare Escentuals, Inc. | | | 22,500 | | | 545 | |
Chattem, Inc.(b) | | | 11,700 | | | 884 | |
| | | | | | | |
| | | | | | 1,429 | |
| | | | | | | |
Semiconductor Equipment—1.9% | | | | | | | |
MEMC Electronic Materials, Inc.(b) | | | 12,100 | | | 1,071 | |
Varian Semiconductor Equipment Associates, Inc.(b) | | | 15,800 | | | 584 | |
| | | | | | | |
| | | | | | 1,655 | |
| | | | | | | |
Semiconductors—2.3% | | | | | | | |
Microchip Technology, Inc. | | | 13,800 | | | 434 | |
Microsemi Corp.(b) | | | 19,000 | | | 421 | |
NVIDIA Corp.(b) | | | 19,500 | | | 663 | |
Sigma Designs, Inc.(b) | | | 8,500 | | | 469 | |
| | | | | | | |
| | | | | | 1,987 | |
| | | | | | | |
Soft Drinks—0.9% | | | | | | | |
Hansen Natural Corp.(b) | | | 17,700 | | | 784 | |
| | | | | | | |
Specialized Finance—3.1% | | | | | | | |
CME Group, Inc. | | | 2,200 | | | 1,509 | |
IntercontinentalExchange, Inc.(b) | | | 6,000 | | | 1,155 | |
| | | | | | | |
| | | | | | 2,664 | |
| | | | | | | |
Specialty Chemicals—1.2% | | | | | | | |
Ecolab, Inc. | | | 20,800 | | | 1,065 | |
| | | | | | | |
Trading Companies & Distributors—0.7% | | | | | | | |
Fastenal Co. | | | 15,300 | | | 618 | |
| | | | | | | |
Wireless Telecommunication Services—4.0% | | | | | | | |
American Tower Corp. Class A | | | 25,700 | | | 1,095 | |
NII Holdings, Inc. (b) | | | 29,900 | | | 1,445 | |
SBA Communications Corp. Class A(b) | | | 27,000 | | | 913 | |
| | | | | | | |
| | | | | | 3,453 | |
| | | | | | | |
Total Domestic Common Stocks (Identified Cost $69,347) | | | | | | 78,015 | |
| | | | | | | |
FOREIGN COMMON STOCKS(c) —5.8% | | | | | | | |
Advertising—1.2% | | | | | | | |
Focus Media Holding Ltd. ADR (China)(b) | | | 18,600 | | | 1,057 | |
| | | | | | | |
Aerospace & Defense—1.0% | | | | | | | |
CAE, Inc. (Canada) | | | 67,500 | | | 910 | |
| | | | | | | |
Drug Retail—1.2% | | | | | | | |
Shoppers Drug Mart Corp. (Canada) | | | 18,900 | | | 1,020 | |
| | | | | | | |
Hotels, Resorts & Cruise Lines—0.9% | | | | | | | |
Orient-Express Hotel Ltd. Class A (Bermuda) | | | 12,800 | | | 736 | |
| | | | | | | |
Investment Banking & Brokerage—0.9% | | | | | | | |
Lazard Ltd. Class A (United States) | | | 20,000 | | | 814 | |
| | | | | | | |
Pharmaceuticals—0.6% | | | | | | | |
Shire Pharmaceuticals Group plc ADR (United Kingdom) | | | 7,800 | | | 538 | |
| | | | | | | |
Total Foreign Common Stocks | | | | | | | |
(Identified Cost $4,934) | | | | | | 5,075 | |
| | | | | | | |
TOTAL LONG TERM INVESTMENTS—95.2% (Identified cost $74,281) | | | | | | 83,090 | |
| | | | | | | |
SHORT-TERM INVESTMENTS—5.1% | | | | | | | |
| | |
| | | PAR
VALUE
(000) | | | |
Repurchase Agreements—5.1% | | | | | | | |
State Street Bank and Trust Co. repurchase agreement 1.10% dated 12/31/07, due 1/2/08, repurchase price $4,419 collateralized by U.S. Treasury Bond 5%, 5/15/37 market value $4,512 | | $ | 4,419 | | | 4,419 | |
| | | | | | | |
Total Short-Term Investments | | | | | | | |
(Identified Cost $4,419) | | | | | | 4,419 | |
| | | | | | | |
TOTAL INVESTMENTS—100.3% (Identified Cost $78,700) | | | | | | 87,509 | (a) |
Other assets and liabilities, net—(0.3)% | | | | | | (256 | ) |
| | | | | | | |
NET ASSETS—100.0% | | | | | $ | 87,253 | |
| | | | | | | |
(a) | Federal Income Tax Information (reported in 000’s): Net unrealized appreciation of investment securities is comprised of gross appreciation of $9,805 and gross depreciation of $1,026 for federal income tax purposes. At December 31, 2007, the aggregate cost of securities for federal income tax purposes was $78,730. |
(c) | A security is considered to be foreign if the security is issued in a foreign country. The country of risk, noted parenthetically, is determined based on criteria described in Note 2G “Foreign security country determination” in the Notes to Financial Statements. |
See Notes to Financial Statements
50
PHOENIX MONEY MARKET SERIES
SCHEDULE OF INVESTMENTS
DECEMBER 31, 2007
| | | | | | | |
| | | FACE
VALUE
(000) | | VALUE
(000) | |
FEDERAL AGENCY SECURITIES(d) —18.5% | | | | | | | |
FFCB
4.756% due 9/22/08(c) | | $ | 500 | | $ | 501 | |
FHLB
4.350% due 1/7/08 | | | 2,965 | | | 2,963 | |
5.083% due 1/10/08(c) | | | 2,300 | | | 2,300 | |
4.305% due 1/18/08 | | | 3,500 | | | 3,493 | |
3.790% due 4/29/08 | | | 2,500 | | | 2,496 | |
3.190% due 7/14/08 | | | 1,000 | | | 994 | |
3.400% due 7/30/08 | | | 830 | | | 825 | |
4.700% due 10/9/08 | | | 1,000 | | | 1,000 | |
4.782% due 11/21/08(c) | | | 3,000 | | | 3,000 | |
4.600% due 11/28/08 | | | 3,500 | | | 3,500 | |
4.500% due 12/11/08 | | | 2,650 | | | 2,650 | |
FHLMC
4.320% due 1/30/08 | | | 2,000 | | | 1,993 | |
5.000% due 2/8/08 | | | 2,650 | | | 2,651 | |
5.750% due 4/15/08 | | | 2,400 | | | 2,410 | |
3.060% due 7/15/08 | | | 500 | | | 497 | |
| | | | | | | |
Total Federal Agency Securities (Identified Cost $31,273) | | | | | | 31,273 | |
| | | | | | | |
FEDERAL AGENCY SECURITIES—VARIABLE (c)—0.7% | | | | | | | |
SBA (Final Maturity 2/25/23)
5.250% due 1/1/08(g) | | | 170 | | | 170 | |
SBA (Final Maturity 1/25/21) | | | | | | | |
5.000% due 1/1/08(g) | | | 15 | | | 15 | |
SBA (Final Maturity 10/25/22) | | | | | | | |
5.250% due 1/1/08(g) | | | 285 | | | 284 | |
SBA (Final Maturity 11/25/21) | | | | | | | |
5.375% due 1/1/08(g) | | | 294 | | | 294 | |
SBA (Final Maturity 2/25/23) | | | | | | | |
5.250% due 1/1/08(g) | | | 146 | | | 146 | |
SBA (Final Maturity 3/25/24) | | | | | | | |
4.875% due 1/1/08(g) | | | 115 | | | 115 | |
SBA (Final Maturity 5/25/21) | | | | | | | |
5.250% due 1/1/08(g) | | | 61 | | | 61 | |
SBA (Final Maturity 9/25/23) | | | | | | | |
5.125% due 1/1/08(g) | | | 191 | | | 191 | |
| | | | | | | |
Total Federal Agency Securities—Variable (Identified Cost $1,276) | | | | | | 1,276 | |
| | | | | | | |
COMMERCIAL PAPER(f)—63.0% | | | | | | | |
ABN-AMRO N. A. Finance, Inc.
5.000% due 1/15/08 | | | 2,700 | | | 2,695 | |
5.020% due 1/15/08 | | | 3,500 | | | 3,493 | |
5.250% due 1/15/08 | | | 2,090 | | | 2,086 | |
Air Products & Chemicals, Inc.
4.480% due 1/11/08 | | | 3,305 | | | 3,301 | |
Archer-Daniels-Midland Co.
4.500% due 1/8/08 | | | 3,815 | | | 3,812 | |
4.460% due 1/10/08 | | | 2,470 | | | 2,467 | |
4.380% due 1/31/08 | | | 2,100 | | | 2,092 | |
Bank of America Corp.
4.820% due 1/24/08 | | | 2,800 | | | 2,791 | |
4.810% due 2/22/08 | | | 3,200 | | | 3,178 | |
Cargill, Inc.
4.700% due 2/13/08 | | | 3,500 | | | 3,480 | |
4.720% due 2/26/08 | | | 3,250 | | | 3,226 | |
5.000% due 2/29/08 | | | 1,355 | | | 1,344 | |
Cintas Corp.
4.400% due 1/7/08 | | | 4,796 | | | 4,792 | |
Danaher Corp.
4.350% due 1/23/08 | | | 3,440 | | | 3,431 | |
4.650% due 1/29/08 | | | 2,300 | | | 2,292 | |
Danske Corp.
4.670% due 2/1/08 | | | 800 | | | 797 | |
Eaton Corp.
4.250% due 1/2/08 | | | 7,340 | | | 7,339 | |
General Electric Capital Corp.
4.740% due 1/23/08
4.570% due 2/4/08
4.620% due 2/20/08 | |
| 1,900
1,900
3,700 | |
| 1,895
1,892
3,676 |
|
Govco, Inc.
5.250% due 1/9/08
5.100% due 1/16/08
4.700% due 1/30/08 | |
| 3,800
1,200
3,600 | |
| 3,796
1,197
3,586 |
|
Harley-Davidson Funding Corp.
4.530% due 2/14/08
4.480% due 2/21/08 | |
| 1,820
2,675 | |
| 1,810
2,658 |
|
International Lease Finance Corp.
4.750% due 1/28/08
4.670% due 1/30/08 | |
| 2,700
3,500 | |
| 2,690
3,487 |
|
Nicor, Inc.
4.000% due 1/2/08 | | | 4,970 | | | 4,969 | |
Praxair, Inc.
4.500% due 1/4/08 | | | 2,840 | | | 2,839 | |
Private Export Funding Corp.
4.760% due 1/31/08 | | | 2,900 | | | 2,889 | |
Toyota Motor Credit Corp.
4.620% due 2/21/08
4.470% due 3/12/08
4.440% due 3/27/08 | |
| 1,600
3,445
3,300 | |
| 1,590
3,415
3,265 |
|
UBS Finance Delaware LLC
4.960% due 1/14/08
4.860% due 1/25/08
4.770% due 2/25/08 | |
| 1,500
3,545
3,400 | |
| 1,497
3,534
3,375 |
|
| | | | | | | |
Total Commercial Paper (Identified Cost $106,676) | | | | | | 106,676 | |
| | | | | | | |
MEDIUM TERM NOTES—16.9% | | | | | | | |
Citigroup Global Markets Holdings, Inc.
6.500% due 2/15/08 | | | 3,500 | | | 3,505 | |
Danske Bank A/S 144A (Denmark)
4.919% due 1/16/09(b) (c) (e) (g) | | | 3,000 | | | 3,000 | |
FleetBoston Financial Corp.
3.850% due 2/15/08 | | | 2,500 | | | 2,496 | |
HSBC Finance Corp.
5.836% due 2/15/08 | | | 4,500 | | | 4,503 | |
HSH Nordbank AG NY 144A (Germany)
4.956% due 9/22/08(b) (c) (e) (g) | | | 5,000 | | | 5,000 | |
International Lease Finance Corp.
4.480% due 3/25/08 | | | 1,130 | | | 1,127 | |
National Australia Bank Ltd. 144A (Australia)
5.240% due 1/6/09(b) (c) (e) (g) | | | 3,000 | | | 3,000 | |
Nordea Bank AB 144A (Sweden)
5.233% due 1/8/09(b) (c) (e) (g) | | | 3,000 | | | 3,000 | |
Wells Fargo & Co.
5.076% due 1/17/09(c) | | | 3,000 | | | 3,000 | |
| | | | | | | |
Total Medium Term Notes (Identified Cost $28,631) | | | | | | 28,631 | |
| | | | | | | |
TOTAL INVESTMENTS—99.1% (Identified Cost $167,856) | | | | | | 167,856 | (a) |
Other assets and liabilities, net—0.9% | | | | | | 1,581 | |
| | | | | | | |
NET ASSETS—100.0% | | | | | $ | 169,437 | |
| | | | | | | |
(a) | Federal Income Tax Information: At December 31, 2007, the aggregate cost of securities was the same for book and federal income tax purposes. |
(b) | Security exempt from registration under Rule 144A of the Securities Act of 1933. These securities may be resold in transactions exempt from registration, normally to qualified institutional buyers. At December 31, 2007, these securities amounted to a value of $14,000 (reported in 000’s) or 8.3% of net assets. |
(c) | Variable or step coupon security; interest rate shown reflects the rate currently in effect. |
(d) | The interest rate shown is the coupon rate. |
(e) | The country of risk, noted parenthetically, is determined based on criteria described in Note 2G, “Foreign security country determination” in the Notes to Financial Statements. |
(f) | The rate shown is the discount rate. |
(g) | The date shown is the reset date. |
See Notes to Financial Statements
51
PHOENIX MULTI-SECTOR FIXED INCOME SERIES
SCHEDULE OF INVESTMENTS
DECEMBER 31, 2007
| | | | | | |
| | | PAR
VALUE
(000) | | VALUE
(000) |
U.S. GOVERNMENT SECURITIES—5.2% | | | | | | |
U.S. Treasury Bonds—2.4% | | | | | | |
U.S. Treasury Bond
5.000% due 5/15/37 | | $ | 5,425 | | $ | 5,913 |
| | | | | | |
U.S. Treasury Notes—2.8% | | | | | | |
U.S. Treasury Note
4.250% due 11/15/17 | | | 6,925 | | | 7,046 |
| | | | | | |
Total U.S. Government Securities (Identified Cost $12,843) | | | | | | 12,959 |
| | | | | | |
AGENCY MORTGAGE-BACKED SECURITIES—8.3% | | | | | | |
FNMA
5.000% due 8/1/20
5.000% due 4/1/34
5.000% due 5/1/34
6.000% due 5/1/34
5.500% due 6/1/34
5.500% due 1/1/35
5.000% due 10/1/35
5.500% due 10/1/35
6.000% due 3/1/36
6.500% due 8/1/36
6.000% due 2/1/37 | |
| 212
1,281
1,303
399
1,469
520
5,138
785
1,843
1,702
1,487 | |
| 213
1,252
1,272
406
1,469
520
5,016
785
1,872
1,749
1,510 |
FNMA 04-W6, 1A4
5.500% due 7/25/34 | | | 1,680 | | | 1,680 |
FNMA 05-57, CK
5.000% due 7/25/35 | | | 889 | | | 888 |
FNMA 05-74, AG
5.000% due 9/25/35 | | | 527 | | | 526 |
GNMA
6.500% due 10/15/23
6.500% due 12/15/25
6.500% due 1/15/26
6.500% due 8/15/31
6.500% due 11/15/31
6.500% due 3/15/32
6.500% due 4/15/32 | | | 26 47 6 359 70 204 940 | | | 27 49 6 372 73 211 974 |
| | | | | | |
Total Agency Mortgage-Backed Securities (Identified Cost $20,698) | | | | | | 20,870 |
| | | | | | |
AGENCY NON-MORTGAGE BACKED SECURITIES—1.2% FHLMC 5.20%, 3/5/19 | | | 3,140 | | | 3,143 |
| | | | | | |
Total Agency Non-Mortgage Backed Securities (Identified Cost $3,082) | | | | | | 3,143 |
| | | | | | |
MUNICIPAL BONDS—4.0% | | | | | | |
California—0.8% | | | | | | |
Alameda Corridor Transportation Authority Series C Taxable (MBIA Insured)
6.600% due 10/1/29 | | | 1,750 | | | 1,920 |
| | | | | | |
Illinois—0.6% | | | | | | |
Illinois Educational Facilities Authority – Loyola University Series C Taxable (AMBAC Insured)
7.120% due 7/1/11 | | | 1,330 | | | 1,438 |
| | | | | | |
Massachusetts—0.4% | | | | | | |
Commonwealth of Massachusetts General Obligation Series C (FSA Insured)
5.500% due 12/1/17 | | | 890 | | | 1,020 |
| | | | | | |
Minnesota—1.1% | | | | | | |
State of Minnesota, General Revenue
5.000% due 8/1/19 | | | 2,500 | | | 2,747 |
| | | | | | |
South Dakota—0.1% | | | | | | |
South Dakota State Educational Enhancement Funding Corp. Taxable Series A
6.720% due 6/1/25 | | | 285 | | | 282 |
| | | | | | |
Texas—1.0% | | | | | | |
City of Dallas
5.000% due 2/15/17 | | | 2,350 | | | 2,569 |
| | | | | | |
Total Municipal Bonds (Identified Cost $9,682) | | | | | | 9,976 |
| | | | | | |
ASSET-BACKED SECURITIES—1.8% | | | | | | |
Bear Stearns Structured Products, Inc. 05-20N, B 144A
8.365% due 10/25/45(b) (c) | | | 1,250 | | | 1,006 |
Bombardier Capital Mortgage Securitization Corp. 99-A, A3
5.980% due 1/15/18(c) | | | 930 | | | 907 |
Conseco Finance Securitizations Corp. 01-3, A4
6.910% due 5/1/33(c) | | | 1,465 | | | 1,473 |
Dunkin Securitization 06-1, M1 144A
8.285% due 6/20/31(b) | | | 1,100 | | | 1,112 |
MASTR Alternative Net Interest Margin 06-6, N1 144A
6.129% due 9/26/46(b) (c) (u) (y) | | | 150 | | | 11 |
| | | | | | |
Total Asset-Backed Securities (Identified Cost $4,880) | | | | | | 4,509 |
| | | | | | |
DOMESTIC CORPORATE BONDS—26.8% | | | | | | |
Aerospace & Defense—0.8% | | | | | | |
DRS Technologies, Inc.
6.625% due 2/1/16 | | | 500 | | | 496 |
L-3 Communications Corp.(f)
7.625% due 6/15/12
6.125% due 1/15/14 | |
| 625
550 | | | 643 542 |
L-3 Communications Corp. Series B
6.375% due 10/15/15(f) | | | 250 | | | 247 |
Precision Castparts Corp.
5.600% due 12/15/13(f) | | | 150 | | | 159 |
| | | | | | |
| | | | | | 2,087 |
| | | | | | |
Airlines—1.8% | | | | | | |
American Airlines, Inc. 01-1
6.977% due 11/23/22 | | | 1,168 | | | 1,080 |
Continental Airlines, Inc. 98-1A
6.648% due 9/15/17 | | | 832 | | | 836 |
Delta Air Lines, Inc. 00-1
7.379% due 5/18/10 | | | 605 | | | 608 |
JetBlue Airways Corp. 04-2
7.969% due 11/15/08(c) | | | 376 | | | 374 |
United Airlines, Inc. 00-2
7.032% due 10/1/10 | | | 1,311 | | | 1,311 |
United Airlines, Inc. 01-1
6.071% due 3/1/13 | | | 386 | | | 384 |
| | | | | | |
| | | | | | 4,593 |
| | | | | | |
Application Software—0.2% | | | | | | |
Intuit, Inc.
5.750% due 3/15/17 | | | 415 | | | 408 |
| | | | | | |
Asset Management & Custody Banks—0.3% | | | | | | |
Bank of New York Co., Inc. (The)
3.625% due 1/15/09 | | | 180 | | | 177 |
Janus Capital Group, Inc.
6.250% due 6/15/12 | | | 500 | | | 512 |
| | | | | | |
| | | | | | 689 |
| | | | | | |
Automobile Manufacturers—0.2% | | | | | | |
Ford Motor Co.
7.450% due 7/16/31 | | | 625 | | | 467 |
| | | | | | |
Automotive Retail—0.3% | | | | | | |
Hertz Corp. (The)
10.500% due 1/1/16 | | | 150 | | | 156 |
Hertz Corp.(The)
8.875% due 1/1/14(f) | | | 600 | | | 611 |
| | | | | | |
| | | | | | 767 |
| | | | | | |
Broadcasting & Cable TV—1.0% | | | | | | |
Charter Communications Holdings I LLC
11.750% due 5/15/14(c) (f) | | | 275 | | | 175 |
Comcast Cable Holdings LLC
7.875% due 8/1/13(f) | | | 500 | | | 548 |
COX Communications, Inc.
5.450% due 12/15/14 | | | 625 | | | 613 |
DIRECTV Holdings LLC/DIRECTV Financing Co., Inc.
6.375% due 6/15/15(f) | | | 1,000 | | | 965 |
Intelsat Corp.
9.000% due 6/15/16 | | | 300 | | | 304 |
| | | | | | |
| | | | | | 2,605 |
| | | | | | |
See Notes to Financial Statements
52
PHOENIX MULTI-SECTOR FIXED INCOME SERIES
| | | | | | |
| | | PAR
VALUE
(000) | | VALUE
(000) |
Building Products—0.9% | | | | | | |
Building Materials Corp. of America 7.750% due 8/1/14(f) | | $ | 610 | | $ | 470 |
Esco Corp. 144A 8.625% due 12/15/13(b) | | | 600 | | | 603 |
Masco Corp. 5.850% due 3/15/17 | | | 825 | | | 800 |
Owens Corning, Inc. 6.500% due 12/1/16 | | | 495 | | | 453 |
| | | | | | |
| | | | | | 2,326 |
| | | | | | |
Casinos & Gaming—0.4% | | | | | | |
MGM MIRAGE 8.500% due 9/15/10(f) | | | 630 | | | 657 |
Pokagon Gaming Authority 144A 10.375% due 6/15/14(b) | | | 125 | | | 135 |
Seminole Hard Rock Entertainment, Inc./Seminole Hard Rock International LLC 144A 8.194% due 3/15/14(b) (c) | | | 125 | | | 120 |
| | | | | | |
| | | | | | 912 |
| | | | | | |
Catalog Retail—0.4% | | | | | | |
IAC/InterActiveCorp 7.000% due 1/15/13 | | | 875 | | | 945 |
| | | | | | |
Consumer Finance—2.6% | | | | | | |
Capital One Bank 5.750% due 9/15/10 | | | 125 | | | 125 |
Ford Motor Credit Co. LLC 7.875% due 6/15/10 8.625% due 11/1/10(f) 9.875% due 8/10/11(f) 9.693% due 4/15/12(c) 7.800% due 6/1/12(f) | |
| 615
650
57595 435 | |
| 568
604
54493 382 |
GMAC LLC(f) 7.250% due 3/2/11 6.875% due 9/15/11 6.000% due 12/15/11 | |
| 1,250
993
1,000 | |
| 1,096
850
839 |
HSBC Finance Corp. 4.125% due 11/16/09(f) | | | 275 | | | 272 |
Residential Capital LLC(f) 7.625% due 11/21/08 8.375% due 6/30/15 | |
| 500
495 | |
| 400
302 |
SLM Corp. 3.950% due 8/15/08 5.450% due 4/25/11(f) 4.810% due 1/31/14(c) | |
| 250
25050 | |
| 244
23037 |
| | | | | | |
| | | | | | 6,586 |
| | | | | | |
Data Processing & Outsourced Services—1.5% | | | | | | |
Broadridge Financial Solutions, Inc. 6.125% due 6/1/17 | | | 1,000 | | | 988 |
Convergys Corp. 4.875% due 12/15/09 | | | 1,000 | | | 1,013 |
First Data Corp. 144A 9.875% due 9/24/15(b) | | | 605 | | | 563 |
Fiserv, Inc. 3.000% due 6/27/08(f) | | | 150 | | | 149 |
Western Union Co. (The) 5.930% due 10/1/16 | | | 940 | | | 938 |
| | | | | | |
| | | | | | 3,651 |
| | | | | | |
Distillers & Vintners—0.3% | | | | | | |
Constellation Brands, Inc. 8.375% due 12/15/14 7.250% due 9/1/16(f) | |
| 280
220 | |
| 282
207 |
Constellation Brands, Inc. 144A 7.250% due 5/15/17(b) | | | 180 | | | 168 |
| | | | | | |
| | | | | | 657 |
| | | | | | |
Diversified Chemicals—0.3% | | | | | | |
Cabot Corp. 144A 5.250% due 9/1/13(b) | | | 750 | | | 769 |
Nalco Co. 7.750% due 11/15/11(f) | | | 50 | | | 51 |
| | | | | | |
| | | | | | 820 |
| | | | | | |
Diversified Commercial & Professional Services—0.6% | | | | | | |
Cintas Corp. 6.000% due 6/1/12 | | | 50 | | | 53 |
Equifax, Inc. 6.300% due 7/1/17(f) | | | 1,250 | | | 1,269 |
Mobile Mini, Inc. 144A 6.875% due 5/1/15(b) | | | 250 | | | 230 |
| | | | | | |
| | | | | | 1,552 |
| | | | | | |
Diversified Metals & Mining—0.7% | | | | | | |
Freeport-McMoRan Copper & Gold, Inc. (Indonesia) 6.875% due 2/1/14(d) (f) | | | 540 | | | 545 |
Glencore Funding LLC 144A 6.000% due 4/15/14(b) | | | 1,150 | | | 1,157 |
| | | | | | |
| | | | | | 1,702 |
| | | | | | |
Electric Utilities—1.1% | | | | | | |
Consumers Energy Co. Series J 6.000% due 2/15/14(f) | | | 1,250 | | | 1,283 |
Entergy Gulf States, Inc. 3.600% due 6/1/08(f) | | | 1,000 | | | 992 |
Public Service Co. of Colorado Series A 6.875% due 7/15/09 | | | 25 | | | 26 |
Southern California Edison Co. 7.625% due 1/15/10 | | | 100 | | | 106 |
Southern California Edison Co. 04-A 5.000% due 1/15/14(f) | | | 50 | | | 50 |
Southern California Edison Co. 04-B 6.000% due 1/15/34(f) | | | 100 | | | 101 |
Southern California Edison Co. 04-G 5.750% due 4/1/35 | | | 125 | | | 122 |
| | | | | | |
| | | | | | 2,680 |
| | | | | | |
Electrical Components & Equipment—0.2% | | | | | | |
General Cable Corp. 7.125% due 4/1/17(f) | | | 500 | | | 493 |
| | | | | | |
Electronic Manufacturing Services—0.4% | | | | | | |
Jabil Circuit, Inc. 5.875% due 7/15/10 | | | 1,000 | | | 1,012 |
| | | | | | |
Environmental & Facilities Services—0.4% | | | | | | |
Allied Waste North America, Inc. 6.125% due 2/15/14(f) | | | 500 | | | 483 |
Waste Management, Inc. 7.375% due 8/1/10 | | | 430 | | | 454 |
| | | | | | |
| | | | | | 937 |
| | | | | | |
Gas Utilities—0.3% | | | | | | |
AmeriGas Partners LP 7.250% due 5/20/15 | | | 500 | | | 492 |
Panhandle Eastern Pipe Line Co. LP 4.800% due 8/15/08 | | | 100 | | | 100 |
Southwest Gas Corp. 7.625% due 5/15/12 | | | 140 | | | 154 |
| | | | | | |
| | | | | | 746 |
| | | | | | |
Health Care Services—0.2% | | | | | | |
Fresenius Medical Care Capital Trust IV 7.875% due 6/15/11 | | | 25 | | | 26 |
Quest Diagnostics, Inc. 7.500% due 7/12/11 6.400% due 7/1/17(f) | | | 35 510 | | | 38 527 |
| | | | | | |
| | | | | | 591 |
| | | | | | |
Health Care Supplies—0.0% | | | | | | |
Bausch & Lomb, Inc. 144A 9.875% due 11/1/15(b) | | | 125 | | | 127 |
| | | | | | |
Homebuilding—0.0% | | | | | | |
K. Hovnanian Enterprises, Inc. 6.500% due 1/15/14(f) | | | 75 | | | 53 |
| | | | | | |
Hotels, Resorts & Cruise Lines—0.5% | | | | | | |
Royal Caribbean Cruises Ltd. 6.875% due 12/1/13(f) | | | 1,250 | | | 1,214 |
| | | | | | |
Independent Power Producers & Energy Traders—0.2% | | | | | | |
AES Corp. (The) 144A 7.750% due 10/15/15(b) (f) | | | 150 | | | 153 |
Texas Competitive Electric Holdings Co. LLC 144A 10.250% due 11/1/15(b) | | | 360 | | | 358 |
| | | | | | |
| | | | | | 511 |
| | | | | | |
Industrial Machinery—0.1% | | | | | | |
Kennametal, Inc. 7.200% due 6/15/12 | | | 225 | | | 245 |
| | | | | | |
Integrated Oil & Gas—0.0% | | | | | | |
Occidental Petroleum Corp. 4.250% due 3/15/10 | | | 80 | | | 80 |
| | | | | | |
Integrated Telecommunication Services—0.9% | | | | | | |
Qwest Corp. 6.500% due 6/1/17 | | | 307 | | | 294 |
Verizon Global Funding Corp. 6.875% due 6/15/12(f) | | | 1,000 | | | 1,082 |
Windstream Corp.(f) 8.625% due 8/1/16 7.000% due 3/15/19 | |
| 500
250 | |
| 528
239 |
| | | | | | |
| | | | | | 2,143 |
| | | | | | |
See Notes to Financial Statements
53
PHOENIX MULTI-SECTOR FIXED INCOME SERIES
| | | | | | | |
| | | PAR
VALUE
(000) | | | VALUE
(000) |
Investment Banking & Brokerage—0.6% | | | | | | | |
BlackRock, Inc.
6.250% due 9/15/17 | | $ | 375 | | | $ | 386 |
Jefferies Group, Inc.
5.500% due 3/15/16 | | | 225 | | | | 214 |
Merrill Lynch & Co., Inc.
6.110% due 1/29/37(f) | | | 500 | | | | 442 |
Morgan Stanley 144A (Brazil)
10.090% due 5/3/17(b) (d) (f) | | | 1,000 | (j) | | | 511 |
| | | | | | | |
| | | | | | | 1,553 |
| | | | | | | |
Leisure Products—0.2% | | | | | | | |
Hasbro, Inc.
6.300% due 9/15/17 | | | 475 | | | | 486 |
| | | | | | | |
Life & Health Insurance—0.2% | | | | | | | |
Americo Life, Inc. 144A
7.875% due 5/1/13(b) | | | 200 | | | | 204 |
New York Life Insurance Co. 144A
5.875% due 5/15/33(b) | | | 100 | | | | 99 |
StanCorp Financial Group, Inc.
6.875% due 10/1/12 | | | 225 | | | | 245 |
| | | | | | | |
| | | | | | | 548 |
| | | | | | | |
Life Sciences Tools & Services—0.3% | | | | | | | |
Fisher Scientific International, Inc.
6.750% due 8/15/14(f) | | | 725 | | | | 743 |
| | | | | | | |
Managed Health Care—0.1% | | | | | | | |
UnitedHealth Group, Inc.
3.300% due 1/30/08
4.875% due 4/1/13 | |
| 220
125 |
| |
| 220
123 |
| | | | | | | |
| | | | | | | 343 |
| | | | | | | |
Metal & Glass Containers—0.2% | | | | | | | |
Owens-Brockway Glass Container, Inc.
8.875% due 2/15/09 | | | 123 | | | | 124 |
Plastipak Holdings, Inc. 144A
8.500% due 12/15/15(b) | | | 500 | | | | 502 |
| | | | | | | |
| | | | | | | 626 |
| | | | | | | |
Mortgage REITs—0.0% | | | | | | | |
iStar Financial, Inc. Series B
5.125% due 4/1/11 | | | 75 | | | | 67 |
| | | | | | | |
Motorcycle Manufacturers—0.0% | | | | | | | |
Harley-Davidson, Inc. 144A
3.625% due 12/15/08(b) | | | 100 | | | | 99 |
| | | | | | | |
Movies & Entertainment—0.4% | | | | | | | |
Time Warner, Inc.
6.875% due 5/1/12 | | | 275 | | | | 289 |
Viacom, Inc.
6.250% due 4/30/16(f) | | | 625 | | | | 629 |
| | | | | | | |
| | | | | | | 918 |
| | | | | | | |
Multi-line Insurance—0.2% | | | | | | | |
Assurant, Inc.
6.750% due 2/15/34 | | | 75 | | | | 73 |
Farmers Insurance Exchange 144A
8.625% due 5/1/24(b) | | | 75 | | | | 84 |
Liberty Mutual Group, Inc. 144A(b)
5.750% due 3/15/14
7.000% due 3/15/34 | |
| 200
150 |
| |
| 204
146 |
Liberty Mutual Insurance Co. 144A
8.500% due 5/15/25(b) | | | 25 | | | | 27 |
| | | | | | | |
| | | | | | | 534 |
| | | | | | | |
Multi-Utilities—0.2% | | | | | | | |
CMS Energy Corp.
7.750% due 8/1/10(f) | | | 100 | | | | 105 |
Dominion Resources, Inc.
Series D
5.125%due 12/15/09 | | | 100 | | | | 101 |
MidAmerican Energy Holdings Co.
3.500% due 5/15/08 | | | 200 | | | | 199 |
Xcel Energy, Inc.
3.400% due 7/1/08(f) | | | 140 | | | | 139 |
| | | | | | | |
| | | | | | | 544 |
| | | | | | | |
Office Electronics—0.2% | | | | | | | |
Xerox Corp.
6.750% due 2/1/17(f) | | | 600 | | | | 625 |
| | | | | | | |
Office REITs—0.3% | | | | | | | |
Mack-Cali Realty LP
5.125% due 2/15/14 | | | 700 | | | | 694 |
| | | | | | | |
Oil & Gas Equipment & Services—0.2% | | | | | | | |
Helix Energy Solutions 144A
9.500% due 1/15/16(b) (f) | | | 400 | | | | 409 |
| | | | | | | |
Oil & Gas Exploration & Production—1.0% | | | | | | | |
Anadarko Petroleum Corp.
3.250% due 5/1/08 | | | 345 | | | | 343 |
Forest Oil Corp. 144A
7.250% due 6/15/19(b) | | | 1,000 | | | | 1,010 |
Plains Exploration & Production Co.
7.750% due 6/15/15(f) | | | 610 | | | | 613 |
Swift Energy Co.
7.625% due 7/15/11 | | | 500 | | | | 505 |
| | | | | | | |
| | | | | | | 2,471 |
| | | | | | | |
Oil & Gas Refining & Marketing—0.6% | | | | | | | |
Kern River Funding Corp. 144A
4.893% due 4/30/18(b) | | | 79 | | | | 77 |
Tesoro Corp.
6.500% due 6/1/17 | | | 780 | | | | 776 |
Valero Energy Corp.
4.750% due 6/15/13 | | | 550 | | | | 534 |
| | | | | | | |
| | | | | | | 1,387 |
| | | | | | | |
Oil & Gas Storage & Transportation—0.6% | | | | | | | |
Kaneb Pipe Line Operating Partnership LP
5.875% due 6/1/13 | | | 125 | | | | 127 |
Kinder Morgan Management Co. ULC
5.700% due 1/5/16(f) | | | 700 | | | | 637 |
Williams Cos., Inc. (The)
7.125% due 9/1/11 | | | 500 | | | | 531 |
| | | | | | | |
| | | | | | | 1,295 |
| | | | | | | |
Other Diversified Financial Services—0.1% | | | | | | | |
Citigroup, Inc.
4.875% due 5/7/15(f) | | | 175 | | | | 165 |
OneAmerica Financial Partners, Inc. 144A
7.000% due 10/15/33(b) | | | 175 | | | | 184 |
| | | | | | | |
| | | | | | | 349 |
| | | | | | | |
Packaged Foods & Meats—0.2% | | | | | | | |
Dean Holding Co.
6.900% due 10/15/17 | | | 50 | | | | 44 |
Kellogg Co. Series B
6.600% due 4/1/11 | | | 75 | | | | 79 |
Tyson Foods, Inc.
6.850% due 4/1/16 | | | 400 | | | | 410 |
| | | | | | | |
| | | | | | | 533 |
| | | | | | | |
Paper Packaging—0.2% | | | | | | | |
Jefferson Smurfit Corp.
8.250% due 10/1/12(f) | | | 215 | | | | 213 |
Sealed Air Corp. 144A
5.375% due 4/15/08(b) | | | 250 | | | | 250 |
| | | | | | | |
| | | | | | | 463 |
| | | | | | | |
Paper Products—0.3% | | | | | | | |
Verso Paper Holdings LLC &
Verso Paper, Inc. Series B
11.375% due 8/1/16(f) | | | 625 | | | | 638 |
| | | | | | | |
Property & Casualty Insurance—0.4% | | | | | | | |
Berkley (W.R.) Corp.
5.875% due 2/15/13 | | | 75 | | | | 76 |
Berkshire Hathaway Finance Corp.
4.625% due 10/15/13(f) | | | 100 | | | | 100 |
Fund American Cos., Inc.
5.875% due 5/15/13 | | | 175 | | | | 176 |
Kingsway America, Inc.
7.500% due 2/1/14 | | | 125 | | | | 132 |
Markel Corp.
6.800% due 2/15/13(f) | | | 175 | | | | 184 |
NYMAGIC, Inc.
6.500% due 3/15/14 | | | 150 | | | | 154 |
Progressive Corp. (The)
6.250% due 12/1/32(f) | | | 75 | | | | 77 |
| | | | | | | |
| | | | | | | 899 |
| | | | | | | |
Publishing—0.6% | | | | | | | |
Dex Media, Inc.
8.000% due 11/15/13 | | | 50 | | | | 47 |
Donnelley (RH) Corp. 144A
8.875% due 10/15/17(b) | | | 475 | | | | 442 |
Idearc, Inc.
8.000% due 11/15/16(f) | | | 500 | | | | 462 |
News America, Inc.
6.625% due 1/9/08 | | | 250 | | | | 250 |
Reader’s Digest Association, Inc.
(The) 144A
9.000% due 2/15/17(b) | | | 500 | | | | 421 |
| | | | | | | |
| | | | | | | 1,622 |
| | | | | | | |
See Notes to Financial Statements
54
PHOENIX MULTI-SECTOR FIXED INCOME SERIES
| | | | | | | |
| | | PAR
VALUE
(000) | | | VALUE
(000) |
Regional Banks—0.1% | | | | | | | |
Citizens Republic Bancorp, Inc.
5.750% due 2/1/13 | | $ | 25 | | | $ | 26 |
Hudson United Bank
7.000% due 5/15/12 | | | 80 | | | | 85 |
Zions Bancorp.
6.000% due 9/15/15 | | | 125 | | | | 121 |
| | | | | | | |
| | | | | | | 232 |
| | | | | | | |
Restaurants—0.0% | | | | | | | |
Outback Steakhouse, Inc. 144A
10.000% due 6/15/15(b) (f) | | | 50 | | | | 37 |
| | | | | | | |
Soft Drinks—0.1% | | | | | | | |
Coca-Cola Enterprises, Inc.
7.125% due 8/1/17(f) | | | 133 | | | | 152 |
| | | | | | | |
Specialized Finance—0.3% | | | | | | | |
Yankee Acquisition Corp. Series B
9.750% due 2/15/17(f) | | | 815 | | | | 750 |
| | | | | | | |
Specialized REITs—1.1% | | | | | | | |
Health Care REIT, Inc.
5.875% due 5/15/15 | | | 1,775 | | | | 1,697 |
Host Hotels & Resorts LP
6.875% due 11/1/14(f) | | | 650 | | | | 650 |
Realty Income Corp.
6.750% due 8/15/19 | | | 425 | | | | 439 |
| | | | | | | |
| | | | | | | 2,786 |
| | | | | | | |
Specialty Stores—0.4% | | | | | | | |
Office Depot, Inc.
6.250% due 8/15/13 | | | 1,000 | | | | 1,044 |
| | | | | | | |
Steel—0.1% | | | | | | | |
Steel Dynamics, Inc. 144A
7.375% due 11/1/12(b) (f) | | | 337 | | | | 340 |
| | | | | | | |
Tobacco—0.6% | | | | | | | |
Reynolds American, Inc.(f)
7.300% due 7/15/15 | | | 750 | | | | 779 |
7.625% due 6/1/16 | | | 600 | | | | 641 |
| | | | | | | |
| | | | | | | 1,420 |
| | | | | | | |
Wireless Telecommunication Services—0.4% | | | | | | | |
Nextel Communications, Inc. Series D
7.375% due 8/1/15(f) | | | 1,000 | | | | 985 |
| | | | | | | |
Total Domestic Corporate Bonds (Identified Cost $68,315) | | | | | | | 67,191 |
| | | | | | | |
NON-AGENCY MORTGAGE-BACKED SECURITIES—9.5% | | | | | | | |
Adjustable Rate Mortgage Trust 05-3, 2A1
4.695% due 7/25/35(c) | | | 1,568 | | | | 1,551 |
American Home Mortgage Assets 07-2, M4
5.395% due 3/25/47(c) (u) | | | 1,088 | | | | 754 |
American Tower Trust L 07-1A, C 144A
5.615% due 4/15/37(b) | | | 500 | | | | 469 |
Bear Stearns Commercial Mortgage Securities 07-PW18, AM
6.084% due 6/11/50(c) | | | 1,475 | | | | 1,483 |
Bear Stearns Structured Products, Inc. 04-15, A2 144A
0% due 11/27/34(b) | | | 196 | | | | 186 |
Bear Stearns Structured Products, Inc. 05-10 144A
7.365% due 4/26/35(b) (c) | | | 390 | | | | 366 |
Chase Mortgage Finance Corp. 06-A1, 4A1
6.044% due 9/25/36(c) | | | 2,097 | | | | 2,118 |
Citicorp Mortgage Securities, Inc. 06-7, 1A1
6.000% due 12/25/36 | | | 1,508 | | | | 1,515 |
Countrywide Home Loan Mortgage Pass-Through Trust 04-13, 1A1 5.
500% due 8/25/34 | | | 1,075 | | | | 1,079 |
Countrywide Home Loan Mortgage Pass-Through Trust 07-1, A2
6.000% due 3/25/37 | | | 1,878 | | | | 1,891 |
DLJ Commercial Mortgage Corp. 98-CF2, A1B
6.240% due 11/12/31 | | | 327 | | | | 329 |
First Horizon Asset Securities, Inc. 05-AR1, 2A1
5.012% due 4/25/35(c) | | | 1,057 | | | | 1,064 |
Franchise Mortgage Acceptance Co. Loan Receivables Trust 98-CA, A2 144A
6.660% due 1/15/12(b) | | | 330 | | | | 317 |
GS Mortgage Securities Corp. II 99-C1, A2
6.110% due 11/18/30(c) | | | 304 | | | | 304 |
Harborview Net Interest Margin Corp. 06-12, N1 144A
6.409% due 12/19/36(b) | | | 208 | | | | 206 |
IndyMac Index Mortgage Loan Trust 06-AR25, 3A1
6.368% due 9/25/36(c) | | | 1,509 | | | | 1,512 |
Lehman Brothers-UBS Commercial Mortgage Trust 07-C2, H 144A
5.980% due 2/15/40(b) (c) | | | 1,400 | | | | 952 |
Lehman XS Net Interest Margin 06-GPM5, A1 144A
6.250% due 10/28/46(b) | | | 170 | | | | 168 |
Lehman XS Net Interest Margin 06-GPM7, A1 144A
6.250% due 12/28/46(b) | | | 193 | | | | 190 |
MASTR Resecuritization Trust 04-3 144A
5.000% due 3/28/34(b) | | | 506 | | | | 451 |
MASTR Resecuritization Trust 05-1 144A
5.000% due 10/28/34(b) | | | 493 | | | | 466 |
Residential Accredit Loans, Inc. 02-QS12, B1
6.250% due 9/25/32 | | | 607 | | | | 505 |
Residential Accredit Loans, Inc. 05-QA4, A5
5.450% due 4/25/35(c) | | | 1,375 | | | | 1,350 |
Structured Asset Securities Corp. 03-32, 1A1
5.210% due 11/25/33(c) | | | 887 | | | | 869 |
Structured Asset Securities Corp. 05-1, 6A1
6.000% due 2/25/35 | | | 1,490 | | | | 1,476 |
Timberstar Trust 06-1A, A 144A
5.668% due 10/15/36(b) | | | 1,275 | | | | 1,238 |
Wells Fargo Mortgage Backed Securities Trust 05-5, 1A1
5.000% due 5/25/20 | | | 918 | | | | 905 |
| | | | | | | |
Total Non-Agency Mortgage-Backed Securities (Identified Cost $24,723) | | | | | | | 23,714 |
| | | | | | | |
FOREIGN GOVERNMENT SECURITIES—18.6% | | | | | | | |
Argentina—0.8% | | | | | | | |
Republic of Argentina PIK Interest Capitalization
8.28% due 12/31/33(f) | | | 1,654 | | | | 1,592 |
Republic of Argentina Series GDP
0% due 12/15/35(c) | | | 3,676 | | | | 425 |
| | | | | | | |
| | | | | | | 2,017 |
| | | | | | | |
Australia—1.9% | | | | | | | |
Commonwealth of Australia Series 909
7.500% due 9/15/09 | | | 5,486 | (i) | | | 4,867 |
| | | | | | | |
Brazil—2.5% | | | | | | | |
Federative Republic of Brazil
12.500% due 1/5/16 | | | 3,499 | (j) | | | 2,140 |
12.500% due 1/5/22 | | | 1,875 | (j) | | | 1,179 |
10.250% due 1/10/28 | | | 3,350 | (j) | | | 1,810 |
7.125% due 1/20/37 | | | 415 | | | | 470 |
11.000% due 8/17/40 | | | 550 | | | | 735 |
| | | | | | | |
| | | | | | | 6,334 |
| | | | | | | |
Canada—0.9% | | | | | | | |
Commonwealth of Canada
4.250% due 9/1/09 | | | 2,220 | (k) | | | 2,265 |
| | | | | | | |
Germany—0.3% | | | | | | | |
Federal Republic of Germany 144A
3.250% due 4/17/09(b) | | | 495 | (l) | | | 716 |
| | | | | | | |
Hungary—0.4% | | | | | | | |
Republic of Hungary
6.250% due 4/24/09 | | | 200,000 | (m) | | | 1,136 |
| | | | | | | |
Indonesia—0.3% | | | | | | | |
Republic of Indonesia 144A
7.250% due 4/20/15(b) (f) | | | 600 | | | | 636 |
| | | | | | | |
Mexico—0.2% | | | | | | | |
United Mexican States Series B
6.750% due 9/27/34 | | | 500 | | | | 552 |
| | | | | | | |
See Notes to Financial Statements
55
PHOENIX MULTI-SECTOR FIXED INCOME SERIES
| | | | | | | |
| | | PAR
VALUE
(000) | | | VALUE
(000) |
New Zealand—1.1% | | | | | | | |
Commonwealth of New Zealand Series 708
6.000% due 7/15/08 | | | 3,475 | (n) | | $ | 2,653 |
| | | | | | | |
Norway—1.3% | | | | | | | |
Kingdom of Norway
5.500% due 5/15/09 | | | 17,485 | (o) | | | 3,254 |
| | | | | | | |
Philippines—0.6% | | | | | | | |
Republic of Philippines
7.750% due 1/14/31 | | $ | 1,405 | | | | 1,628 |
| | | | | | | |
Russia—1.7% | | | | | | | |
Russian Federation 144A
7.500% due 3/31/30(b) (c) | | | 2,054 | | | | 2,337 |
Russian Federation RegS
7.500% due 3/31/30(c) (e) | | | 1,584 | | | | 1,811 |
| | | | | | | |
| | | | | | | 4,148 |
| | | | | | | |
Singapore—0.3% | | | | | | | |
Singapore Government
2.500% due 10/1/12 | | | 925 | (q) | | | 649 |
| | | | | | | |
South Africa—0.5% | | | | | | | |
Republic of South Africa Series R153
13.000% due 8/31/10 | | | 7,700 | (r) | | | 1,220 |
| | | | | | | |
Sweden—0.3% | | | | | | | |
Kingdom of Sweden Series 1043
5.000% due 1/28/09 | | | 5,270 | (s) | | | 822 |
| | | | | | | |
Trinidad and Tobago—0.1% | | | | | | | |
Republic of Trinidad and Tobago RegS
9.875% due 10/1/09(e) | | | 225 | | | | 246 |
| | | | | | | |
Turkey—1.9% | | | | | | | |
Republic of Turkey
10.500% due 1/13/08 | | | 500 | | | | 501 |
0% due 5/6/09(c) | | | 3,575 | (t) | | | 2,481 |
9.000% due 6/30/11 | | | 500 | | | | 559 |
11.500% due 1/23/12 | | | 750 | | | | 911 |
7.250% due 3/15/15 | | | 350 | | | | 376 |
| | | | | | | |
| | | | | | | 4,828 |
| | | | | | | |
Ukraine—0.3% | | | | | | | |
Republic of Ukraine 144A
6.580% due 11/21/16(b) (f) | | | 750 | | | | 737 |
| | | | | | | |
Venezuela—3.2% | | | | | | | |
Republic of Venezuela
7.650% due 4/21/25 | | | 750 | | | | 643 |
9.250% due 9/15/27 | | | 4,975 | | | | 4,975 |
9.375% due 1/13/34 | | | 1,000 | | | | 997 |
Republic of Venezuela RegS
5.375% due 8/7/10(e) | | | 1,500 | | | | 1,414 |
| | | | | | | |
| | | | | | | 8,029 |
| | | | | | | |
Total Foreign Government Securities (Identified Cost $44,664) | | | | | | | 46,737 |
| | | | | | | |
FOREIGN CORPORATE BONDS (d)—10.1% | | | | | | | |
Brazil—0.5% | | | | | | | |
GTL Trade Finance, Inc. 144A
7.250% due 10/20/17(b) (f) | | | 545 | | | | 553 |
Vale Overseas Ltd. | | | | | | | |
6.250% due 1/11/16(f) | | | 500 | | | | 501 |
6.250% due 1/23/17(g) | | | 200 | | | | 201 |
| | | | | | | |
| | | | | | | 1,255 |
| | | | | | | |
Canada—0.8% | | | | | | | |
Catalyst Paper Corp.
7.375% due 3/1/14(f) | | | 355 | | | | 270 |
EnCana Corp.
5.900% due 12/1/17 | | | 420 | | | | 430 |
European Investment Bank 144A
4.600% due 1/30/37(b) | | | 625 | (k) | | | 620 |
Rogers Wireless Communications, Inc.
6.375% due 3/1/14 | | | 575 | | | | 592 |
| | | | | | | |
| | | | | | | 1,912 |
| | | | | | | |
Chile—0.2% | | | | | | | |
Empresa Nacional de Electricidad SA
8.350% due 8/1/13 | | | 500 | | | | 566 |
| | | | | | | |
Cyprus—0.1% | | | | | | | |
ABH Financial Ltd. (Alfa Markets Ltd.) 144A
8.200% due 6/25/12(b) | | | 250 | | | | 235 |
| | | | | | | |
Egypt—0.1% | | | | | | | |
Orascom Telecom Finance SCA 144A
7.875% due 2/8/14(b) | | | 300 | | | | 285 |
| | | | | | | |
Hong Kong—0.2% | | | | | | | |
China Properties Group Ltd. 144A
9.125% due 5/4/14(b) (f) | | | 500 | | | | 411 |
Hutchison Whampoa International Ltd. 144A
5.450% due 11/24/10(b) | | | 150 | | | | 152 |
| | | | | | | |
| | | | | | | 563 |
| | | | | | | |
India—0.2% | | | | | | | |
ICICI Bank Ltd. 144A
6.375% due 4/30/22(b) (c) | | | 625 | | | | 566 |
| | | | | | | |
Japan—0.5% | | | | | | | |
Resona Bank Ltd. 144A
5.850% due 9/29/49(b) (c) | | | 1,250 | | | | 1,162 |
| | | | | | | |
Kazakhstan—0.7% | | | | | | | |
Kazkommerts International BV RegS
8.000% due 11/3/15(e) | | | 1,000 | | | | 825 |
Tengizchevroil Finance Co. SARL 144A
6.124% due 11/15/14(b) (f) | | | 1,000 | | | | 942 |
| | | | | | | |
| | | | | | | 1,767 |
| | | | | | | |
Luxembourg—0.3% | | | | | | | |
TNK-BP Finance SA 144A
7.500% due 3/13/13(b) | | | 425 | | | | 426 |
Tyco Electronic Group SA 144A
6.000% due 10/1/12(b) | | | 210 | | | | 215 |
| | | | | | | |
| | | | | | | 641 |
| | | | | | | |
Malaysia—0.5% | | | | | | | |
Malaysia International Shipping Corp. Capital Ltd. 144A
6.125% due 7/1/14(b) | | | 1,250 | | | | 1,291 |
| | | | | | | |
Mexico—0.2% | | | | | | | |
Pemex Project Funding Master Trust
6.125% due 8/15/08 | | | 7 | | | | 7 |
Vitro S.A.B. de C.V.
8.625% due 2/1/12(f) | | | 570 | | | | 539 |
| | | | | | | |
| | | | | | | 546 |
| | | | | | | |
Netherlands—0.3% | | | | | | | |
Majapahit Holding BV 144A
7.250% due 6/28/17(b) | | | 825 | | | | 794 |
| | | | | | | |
Russia—2.5% | | | | | | | |
European Bank for Reconstruction & Development
6.000% due 2/14/12 | | | 46,600 | (p) | | | 1,838 |
Gazprom International SA 144A
7.201% due 2/1/20(b) | | | 906 | | | | 919 |
Gazprom OAO (Gaz Capital SA) 144A(b)
6.212% due 11/22/16(f) | | | 1,530 | | | | 1,468 |
6.510% due 3/7/22 | | | 520 | | | | 494 |
OJSC AK Transneft (TransCapitalInvest Ltd.) 144A
5.670% due 3/5/14(b) | | | 610 | | | | 585 |
OJSC Vimpel Communications (UBS Luxembourg SA) 144A
8.375% due 10/22/11(b) | | | 250 | | | | 256 |
Russian Agricultural Bank OJSC (RSHB Capital SA) 144A
6.299% due 5/15/17(b) | | | 615 | | | | 583 |
| | | | | | | |
| | | | | | | 6,143 |
| | | | | | | |
Singapore—0.3% | | | | | | | |
UOB Cayman Ltd. 144A
5.796% due 12/29/49(b) (c) | | | 700 | | | | 695 |
| | | | | | | |
South Africa—0.0% | | | | | | | |
SABMiller plc 144A
6.625% due 8/15/33(b) | | | 75 | | | | 77 |
| | | | | | | |
See Notes to Financial Statements
56
PHOENIX MULTI-SECTOR FIXED INCOME SERIES
| | | | | | |
| | | PAR
VALUE
(000) | | VALUE
(000) |
South Korea—0.7% | | | | | | |
Hynix Semiconductor, Inc. 144A
7.875% due 6/27/17(b) (f) | | $ | 700 | | $ | 635 |
Woori Bank 144A
6.125% due 5/3/16(b) (c) (f) | | | 1,000 | | | 1,005 |
| | | | | | |
| | | | | | 1,640 |
| | | | | | |
Switzerland—0.2% | | | | | | |
Petroplus Finance Ltd. 144A
6.750% due 5/1/14(b) | | | 500 | | | 468 |
| | | | | | |
United Arab Emirates—0.3% | | | | | | |
Abu Dhabi National Energy Co. 144A
5.875% due 10/27/16(b) | | | 825 | | | 808 |
| | | | | | |
United Kingdom—0.6% | | | | | | |
British Sky Broadcasting Group plc
6.875% due 2/23/09 | | | 650 | | | 663 |
Hanson Australia Funding Ltd.
5.250% due 3/15/13(f) | | | 125 | | | 125 |
Ineos Group Holdings plc 144A
8.500% due 2/15/16(b) (f) | | | 500 | | | 447 |
Vodafone Group plc
6.150% due 2/27/37(f) | | | 375 | | | 370 |
| | | | | | |
| | | | | | 1,605 |
| | | | | | |
United States—0.5% | | | | | | |
Nova Chemicals Corp.
7.863% due 11/15/13(c) (f) | | | 1,218 | | | 1,145 |
| | | | | | |
Venezuela—0.4% | | | | | | |
Petroleos de Venezuela S.A.
5.250% due 4/12/17 | | | 1,500 | | | 1,069 |
| | | | | | |
Total Foreign Corporate Bonds (Identified Cost $26,188) | | | | | | 25,233 |
| | | | | | |
FOREIGN CREDIT LINKED NOTES—0.2% | | | | | | |
Indonesia—0.2% | | | | | | |
Republic of Indonesia (Citigroup, Inc.)
11.867% due 6/15/09 | | | 640 | | | 565 |
| | | | | | |
Total Foreign Credit Linked Notes (Identified Cost $590) | | | | | | 565 |
| | | | | | |
DOMESTIC CONVERTIBLE BONDS—0.1% | | | | | | |
Pharmaceuticals—0.1% | | | | | | |
Par Pharmaceutical Cos., Inc.
2.875% due 9/30/10 | | | 300 | | | 278 |
| | | | | | |
Total Domestic Convertible Bonds (Identified Cost $264) | | | | | | 278 |
| | | | | | |
DOMESTIC LOAN AGREEMENTS—9.3% | | | | | | |
Advertising—0.1% | | | | | | |
Lamar Media Corp. Tranche F
6.375% due 3/31/14(c) | | | 190 | | | 189 |
| | | | | | |
Alternative Carriers—0.5% | | | | | | |
Level 3 Communications, Inc. Tranche B
7.605% due 3/13/14(c) | | | 115 | | | 110 |
Time Warner Telecom Holdings Tranche B
8.471% due 1/7/13(c) | | | 1,248 | | | 1,206 |
| | | | | | |
| | | | | | 1,316 |
| | | | | | |
Apparel Retail—0.4% | | | | | | |
Hanesbrands, Inc. Tranche B
7.600% due 9/5/13(c) | | | 207 | | | 199 |
HBI Branded Apparel Ltd., Inc. Tranche
2 9.110% due 3/5/14(c) | | | 325 | | | 325 |
Totes Isotoner Corp. Tranche 2
11.360% due 1/16/14(c) | | | 500 | | | 470 |
| | | | | | |
| | | | | | 994 |
| | | | | | |
Application Software—0.2% | | | | | | |
Reynolds & Reynolds Co. (The) Tranche FL
7.198% due 10/24/12(c) | | | 499 | | | 480 |
| | | | | | |
Asset Management & Custody Banks—0.0% | | | | | | |
Nuveen Investments, Inc. Tranche Term B
7.841% due 11/13/14(c) | | | 108 | | | 106 |
| | | | | | |
Auto Parts & Equipment—0.5% | | | | | | |
Mark IV Industries, Inc. Tranche 2
11.095% due 12/19/11(c) | | | 325 | | | 293 |
Mark IV Industries, Inc. Tranche B
7.847% due 6/21/11(c) | | | 950 | | | 887 |
| | | | | | |
| | | | | | 1,180 |
| | | | | | |
Automobile Manufacturers—0.4% | | | | | | |
Ford Motor Co. Tranche B
8.000% due 12/15/13(c) | | | 612 | | | 568 |
General Motors Corp. Tranche B
7.615% due 11/29/13(c) | | | 596 | | | 560 |
| | | | | | |
| | | | | | 1,128 |
| | | | | | |
Automotive Retail—0.2% | | | | | | |
Hertz Corp. Letter of Credit
7.110% due 12/21/12(c) | | | 83 | | | 82 |
Hertz Corp. Tranche B
7.090% due 12/21/12(c) | | | 395 | | | 386 |
| | | | | | |
| | | | | | 468 |
| | | | | | |
Broadcasting & Cable TV—0.4% | | | | | | |
Charter Communications Operating LLC Tranche
7.360% due 3/6/14(c) | | | 992 | | | 929 |
| | | | | | |
Casinos & Gaming—0.0% | | | | | | |
Wimar Operating Co. LLC Tranche B
7.860% due 1/3/12(c) | | | 110 | | | 108 |
| | | | | | |
Data Processing & Outsourced Services—0.3% | | | | | | |
First Data Corp. Tranche B3
7.640% due 9/24/14(c) | | | 833 | | | 793 |
| | | | | | |
Department Stores—0.6% | | | | | | |
Neiman-Marcus Group, Inc. (The) Tranche
7.090% due 4/6/13(c) | | | 1,473 | | | 1,418 |
| | | | | | |
Diversified Chemicals—0.5% | | | | | | |
Celanese Holdings LLC Tranche Term B
8.181% due 3/30/14(c) | | | 1,250 | | | 1,197 |
| | | | | | |
Diversified Commercial & Professional Services—0.1% | | | | | | |
ARAMARK Corp. Letter of Credit
7.490% due 1/26/14(c) | | | 19 | | | 18 |
ARAMARK Corp. Tranche B
7.490% due 1/26/14(c) | | | 261 | | | 248 |
| | | | | | |
| | | | | | 266 |
| | | | | | |
Electric Utilities—0.2% | | | | | | |
Energy Future Holdings Tranche B2
8.645% due 10/10/14(c) | | | 439 | | | 431 |
| | | | | | |
Electrical Components & Equipment—0.2% | | | | | | |
Baldor Electric Co. Tranche
7.063% due 1/31/14(c) | | | 524 | | | 516 |
| | | | | | |
Environmental & Facilities Services—0.2% | | | | | | |
Allied Waste North America, Inc. Letter of Credit A
5.320% due 3/28/14(c) | | | 206 | | | 197 |
Allied Waste North America, Inc. Tranche B
7.100% due 3/28/14(c) | | | 342 | | | 327 |
| | | | | | |
| | | | | | 524 |
| | | | | | |
Health Care Facilities—0.4% | | | | | | |
HCA, Inc. Tranche B
8.086% due 11/16/13(c) | | | 426 | | | 412 |
Health Management Associates, Inc. Tranche B
6.760% due 2/28/14(c) | | | 258 | | | 241 |
LifePoint Hospitals, Inc. Tranche B
6.975% due 4/15/12(c) | | | 390 | | | 374 |
| | | | | | |
| | | | | | 1,027 |
| | | | | | |
Housewares & Specialties—0.1% | | | | | | |
Yankee Candle Co., Inc. Tranche B
8.891% due 2/6/14(c) | | | 250 | | | 235 |
| | | | | | |
Independent Power Producers & Energy Traders—0.2% | | | | | | |
NRG Energy, Inc. Letter of Credit
7.070% due 2/1/13(c) | | | 325 | | | 325 |
NRG Energy, Inc. Tranche B1
7.070% due 2/1/13(c) | | | 121 | | | 115 |
| | | | | | |
| | | | | | 440 |
| | | | | | |
Integrated Telecommunication Services—0.3% | | | | | | |
NTELOS, Inc. Tranche B1
7.570% due 8/24/11(c) | | | 748 | | | 742 |
| | | | | | |
See Notes to Financial Statements
57
PHOENIX MULTI-SECTOR FIXED INCOME SERIES
| | | | | | | | |
| | | PAR
VALUE
(000) | | | VALUE
(000) | |
Leisure Facilities—0.3% | | | | | | | | |
AMF Bowling Worldwide, Inc. Tranche B
7.978% due 5/17/13(c) | | $ | 871 | | | $ | 823 | |
| | | | | | | | |
Oil & Gas Drilling—0.1% | | | | | | | | |
Hercules Offshore, Inc. Tranche
6.990% due 7/11/13(c) | | | 373 | | | | 363 | |
| | | | | | | | |
Oil & Gas Equipment & Services—0.1% | | | | | | | | |
Helix Energy Solutions Group, Inc. Tranche
7.453% due 7/1/13(c) | | | 196 | | | | 189 | |
| | | | | | | | |
Paper Products—0.7% | | | | | | | | |
Georgia-Pacific Corp. Tranche A
6.872% due 12/20/10(c) | | | 638 | | | | 619 | |
Georgia-Pacific Corp. Tranche B1
6.893% due 12/20/12(c) | | | 1,078 | | | | 1,030 | |
NewPage Corp. Tranche B
8.688% due 12/20/14(c) | | | 155 | | | | 151 | |
| | | | | | | | |
| | | | | | | 1,800 | |
| | | | | | | | |
Publishing—0.5% | | | | | | | | |
Idearc, Inc. Tranche B
7.200% due 11/17/14(c) | | | 990 | | | | 945 | |
Tribune Co. Tranche B
7.910% due 5/30/14(c) | | | 338 | | | | 288 | |
| | | | | | | | |
| | | | | | | 1,233 | |
| | | | | | | | |
Restaurants—0.2% | | | | | | | | |
Burger King Corp. Tranche B1
7.690% due 6/30/12(c) | | | 582 | | | | 573 | |
| | | | | | | | |
Specialized Finance—0.8% | | | | | | | | |
Solar Capital Corp. Tranche US
7.356% due 2/28/14(c) | | | 1,957 | | | | 1,893 | |
| | | | | | | | |
Specialty Chemicals—0.1% | | | | | | | | |
JohnsonDiversey, Inc. Tranche B
6.878% due 12/16/11(c) | | | 205 | | | | 201 | |
| | | | | | | | |
Trading Companies & Distributors—0.2% | | | | | | | | |
United Rentals, Inc. Letter of Credit
7.570% due 2/14/11 | | | 117 | | | | 114 | |
United Rentals, Inc. Tranche B
7.320% due 2/14/11(c) | | | 277 | | | | 270 | |
| | | | | | | | |
| | | | | | | 384 | |
| | | | | | | | |
Wireless Telecommunication Services—0.5% | | | | | | | | |
ALLTEL Communications, Inc. Tranche B
3 9.029% due 5/15/15(c) | | | 623 | | | | 599 | |
Cricket Communications, Inc. Tranche B1
8.198% due 6/16/13(c) | | | 615 | | | | 608 | |
| | | | | | | | |
| | | | | | | 1,207 | |
| | | | | | | | |
Total Domestic Loan Agreements (Identified Cost $23,924) | | | | | | | 23,153 | |
| | | | | | | | |
FOREIGN LOAN AGREEMENTS (d) —0.5% | | | | | | | | |
Germany—0.3% | | | | | | | | |
Fresenius Medical Care AG & Co. KGaA Tranche B
6.516% due 3/31/13(c) | | | 902 | | | | 877 | |
| | | | | | | | |
United States—0.2% | | | | | | | | |
Bausch & Lomb, Inc. Tranche
8.127% due 4/11/15(c) | | | 264 | (l) | | | 384 | |
| | | | | | | | |
Total Foreign Loan Agreements (Identified Cost $1,272) | | | | | | | 1,261 | |
| | | | | | | | |
DOMESTIC PREFERRED STOCK—0.1% | | | | | | | | |
| | |
| | | SHARES | | | | |
Specialized REITs—0.0% | | | | | | | | |
Saul Centers, Inc. Series A Pfd. 8%(f) | | | 425 | | | | 10 | |
| | | | | | | | |
Thrifts & Mortgage Finance—0.1% | | | | | | | | |
Chevy Chase Bank FSB Series C Pfd. 8%(f) | | | 3,925 | | | | 100 | |
Chevy Chase Preferred Capital Corp. Series A Pfd. 10.375% | | | 1,225 | | | | 62 | |
| | | | | | | | |
| | | | | | | 162 | |
| | | | | | | | |
Total Domestic Preferred Stock (Identified Cost $179) | | | | | | | 172 | |
| | | | | | | | |
DOMESTIC CONVERTIBLE PREFERRED STOCKS—0.2% | | | | | | | | |
Diversified Metals & Mining—0.2% | | | | | | | | |
Vale Capital Ltd. | | | 6,000 | | | | 388 | |
| | | | | | | | |
Total Domestic Convertible Preferred Stocks (Identified Cost $301) | | | | | | | 388 | |
| | | | | | | | |
DOMESTIC COMMON STOCKS—0.0% | | | | | | | | |
Integrated Telecommunication Services—0.0% | | | | | | | | |
AT&T Latin America Corp. Class A(v) | | | 64,050 | | | | 0 | (w) |
| | | | | | | | |
Total Domestic Common Stocks (Identified Cost $282) | | | | | | | 0 | |
| | | | | | | | |
EXCHANGE TRADED FUNDS—1.9% | | | | | | | | |
DIAMONDS® Trust Series I | | | 12,894 | | | | 1,709 | |
iShares MSCI EAFE® Index Fund(f) | | | 22,414 | | | | 1,761 | |
iShares Russell 2000® Index Fund(f) | | | 8,144 | | | | 619 | |
PowerShares QQQ(f) | | | 11,020 | | | | 565 | |
| | | | | | | | |
Total Exchange Traded Funds (Identified Cost $ 4,780) | | | | | | | 4,654 | |
| | | | | | | | |
TOTAL LONG TERM INVESTMENTS—97.8% (Identified cost $246,667) | | | | | | | 244,803 | |
| | | | | | | | |
SHORT-TERM INVESTMENTS—14.9% | | | | | | | | |
Money Market Mutual Funds—13.2% | | | | | | | | |
State Street Navigator Prime Plus (4.88% seven-day effective yield)(h) | | | 33,024,350 | | | | 33,024 | |
| | | | | | | | |
| | |
| | | PAR
VALUE
(000) | | | | |
Commercial Paper(x)—1.7% | | | | | | | | |
Nicor, Inc.
4.000% due 1/2/08 | | $ | 4,385 | | | | 4,385 | |
| | | | | | | | |
Total Short-Term Investments (Identified Cost $37,409) | | | | | | | 37,409 | |
| | | | | | | | |
TOTAL INVESTMENTS—112.5% (Identified Cost $284,076) | | | | | | | 282,212 | (a) |
Other assets and liabilities, net—(12.5)% | | | | | | | (31,345 | ) |
| | | | | | | | |
NET ASSETS—100.0% | | | | | | $ | 250,867 | |
| | | | | | | | |
See Notes to Financial Statements
58
PHOENIX MULTI-SECTOR FIXED INCOME SERIES
At December 31, 2007, the Fund had entered into forward currency contracts as follows (reported in 000’s):
| | | | | | | | | | | |
Contract to Receive | | In Exchange for | | Settlement Date | | Value | | Unrealized
Appreciation
(Depreciation) | |
JPY 270,936 | | USD 2,542 | | 2/28/08 | | $ | 2,441 | | $ | (101 | ) |
| | | | | | | | | | | |
| | | | | | | | | | (101 | ) |
| | | | | | | | | | | |
| | | | | | |
| USD | | United States Dollar | | JPY | | Japanese Yen |
(a) | Federal Income Tax Information (reported in 000’s): Net unrealized depreciation of investment securities is comprised of gross appreciation of $3,485 and gross depreciation of $5,893 for federal income tax purposes. At December 31, 2007, the aggregate cost of securities for federal income tax purposes was $284,620. |
(b) | Security exempt from registration under Rule 144A of the Securities Act of 1933. These securities may be resold in transactions exempt from registration, normally to qualified institutional buyers. At December 31, 2007, these securities amounted to a value of $37,085 (reported in 000’s) or 14.8% of net assets. |
(c) | Variable or step coupon security; interest rate shown reflects the rate currently in effect. |
(d) | A security is considered to be foreign if the security is issued in a foreign country. The country of risk, noted in the header, is determined based on criteria described in Note 2G, “Foreign security country determination” in the Notes to Financial Statements. |
(e) | Regulation S security. Security is offered and sold outside of the United States, therefore, it is exempt from registration with the SEC under rules 903 and 904 of the Securities Act of 1933. |
(f) | All or a portion of security is on loan. |
(g) | All or a portion segregated as collateral for forward currency contracts. |
(h) | Represents security purchased with cash collateral received for securities on loan. |
(i) | Par value represents Australian Dollar. |
(j) | Par value represents Brazilian Real. |
(k) | Par value represents Canadian Dollar. |
(l) | Par value represents Euro. |
(m) | Par value represents Hungarian Forint. |
(n) | Par value represents New Zealand Dollar. |
(o) | Par value represents Norwegian Krone. |
(p) | Par value represents Russian Ruble. |
(q) | Par value represents Singapore Dollar. |
(r) | Par value represents South African Rand. |
(s) | Par value represents Swedish Krona. |
(t) | Par value represents Turkish Lira. |
(w) | Amount is less than $1,000. |
(x) | The rate shown is the discount rate. |
(y) | Illiquid and restricted security. At December 31, 2007 this security amounted to a value of $11 or 0.0% of (reported in 000’s) net assets. For acquisition information, see Note 6 “Illiquid and Restricted Securities” in the Notes to Financial Statements. |
See Notes to Financial Statements
59
PHOENIX MULTI-SECTOR SHORT TERM BOND SERIES
SCHEDULE OF INVESTMENTS
DECEMBER 31, 2007
| | | | | | |
| | | PAR
VALUE
(000) | | VALUE
(000) |
U.S. GOVERNMENT SECURITIES—3.1% | | | | | | |
U.S. Treasury Notes—3.1% | | | | | | |
U.S. Treasury Note
3.125% due 11/30/09 | | $ | 75 | | $ | 75 |
3.375% due 11/30/12 | | | 875 | | | 872 |
4.250% due 11/15/17 | | | 400 | | | 407 |
| | | | | | |
Total U.S. Government Securities (Identified Cost $1,348) | | | | | | 1,354 |
| | | | | | |
AGENCY MORTGAGE-BACKED SECURITIES—7.7% | | | | | | |
FHLMC
4.650% due 10/10/13 | | | 160 | | | 159 |
4.500% due 12/1/18 | | | 342 | | | 336 |
FNMA
4.000% due 7/1/19 | | | 184 | | | 177 |
5.000% due 2/1/20 | | | 95 | | | 95 |
5.000% due 8/1/20 | | | 52 | | | 52 |
6.000% due 8/1/34 | | | 198 | | | 202 |
5.500% due 3/1/35 | | | 246 | | | 246 |
5.500% due 4/1/35 | | | 579 | | | 579 |
6.500% due 8/1/36 | | | 101 | | | 104 |
6.000% due 1/1/37 | | | 532 | | | 540 |
FNMA 04-W6, 1A4
5.500% due 7/25/34 | | | 303 | | | 303 |
FNMA 05-57, CK
5.000% due 7/25/35 | | | 56 | | | 56 |
FNMA 05-65, DK
5.000% due 8/25/35 | | | 68 | | | 68 |
FNMA 05-65, PJ
5.000% due 8/25/35 | | | 191 | | | 191 |
FNMA 05-74, AG
5.000% due 9/25/35 | | | 70 | | | 70 |
FNMA 05-80, AD
5.500% due 9/25/35 | | | 222 | | | 221 |
| | | | | | |
Total Agency Mortgage-Backed Securities (Identified Cost $3,394) | | | | | | 3,399 |
| | | | | | |
AGENCY NON-MORTGAGE BACKED SECURITIES—1.3% | | | | | | |
FHLMC
5.200% due 3/5/19 | | | 595 | | | 596 |
| | | | | | |
TOTAL AGENCY NON-MORTGAGE BACKED SECURITIES (Identified Cost $584) | | | | | | 596 |
| | | | | | |
MUNICIPAL BONDS—4.1% | | | | | | |
Colorado—0.6% | | | | | | |
Colorado Department of Transportation Revenue (AMBAC Insured)
6.000% due 6/15/11 | | | 240 | | | 258 |
| | | | | | |
Georgia—0.6% | | | | | | |
Georgia State Series C
5.250% due 7/1/16 | | | 115 | | | 121 |
5.250% due 7/1/18 | | | 160 | | | 168 |
| | | | | | |
| | | | | | 289 |
| | | | | | |
Maryland—0.4% | | | | | | |
Maryland State
5.000% due 8/1/10 | | | 170 | | | 178 |
| | | | | | |
Massachusetts—0.4% | | | | | | |
Commonwealth of Massachusetts General Obligation Series C (FSA Insured)
5.500% due 12/1/17 | | | 150 | | | 172 |
| | | | | | |
New York—0.7% | | | | | | |
New York State Dormitory Authority Series B Taxable
3.350% due 12/15/09 | | | 315 | | | 309 |
| | | | | | |
Pennsylvania—0.8% | | | | | | |
Philadelphia School District Taxable Series C (FSA Insured)
4.290% due 7/1/10 | | | 350 | | | 348 |
| | | | | | |
Texas—0.6% | | | | | | |
Houston Texas Independent School District (FSA Insured)
5.500% due 7/15/18 | | | 235 | | | 253 |
| | | | | | |
Total Municipal Bonds (Identified Cost $1,808) | | | | | | 1,807 |
| | | | | | |
ASSET-BACKED SECURITIES—7.2% | | | | | | |
Bombardier Capital Mortgage Securitization Corp. 99-A, A3
5.980% due 1/15/18(c) | | | 110 | | | 108 |
Capital One Auto Finance Trust 05-BSS B
4.320% due 5/15/10 | | | 350 | | | 349 |
Carmax Auto Owner Trust 05-1 C
4.820% due 10/15/11 | | | 200 | | | 199 |
Chase Funding Mortgage Loan Asset-Backed Certificates 04-1, 1A4
4.111% due 8/25/30 | | | 80 | | | 79 |
DaimlerChrysler Auto Trust 05-A, B
3.880% due 7/8/11 | | | 250 | | | 249 |
Dunkin Securitization 06-1, M1 144A
8.285% due 6/20/31(b) | | | 160 | | | 162 |
GMAC Mortgage Corp. Loan Trust 06-HE3, A2
5.750% due 10/25/36(c) | | | 350 | | | 316 |
Great America Leasing Receivables 05-1, A4 144A
4.970% due 8/20/10(b) | | | 230 | | | 230 |
GS Auto Loan Trust 06-1, A2
5.470% due 2/15/09 | | | 68 | | | 68 |
GSAMP Trust 06-S4, M6
6.065% due 5/25/36(c) (t) | | | 310 | | | 3 |
JPMorgan Mortgage Acquisition Corp. 06-CW2, AF3 6.080% due 8/25/36(c) | | | 225 | | | 223 |
MASTR Alternative Net Interest Margin 06-6, N1 144A
5.865% due 9/26/46(b) (c) (s) | | | 26 | | | 2 |
Renaissance Home Equity Loan Trust 05-3, AF3
4.814% due 11/25/35(c) | | | 625 | | | 618 |
Renaissance Home Equity Loan Trust 06-1, AF2
5.533% due 5/25/36(c) | | | 131 | | | 129 |
Residential Funding Mortgage Securities II, Inc. 05-HI2, A3
4.460% due 5/25/35 | | | 131 | | | 130 |
Structured Asset Securities Corp. 05-7XS, 1A2B
5.270% due 4/25/35(c) | | | 300 | | | 297 |
| | | | | | |
Total Asset-Backed Securities (Identified Cost $3,542) | | | | | | 3,162 |
| | | | | | |
DOMESTIC CORPORATE BONDS—18.7% | | | | | | |
Aerospace & Defense—0.3% | | | | | | |
L-3 Communications Corp.
7.625% due 6/15/12 | | | 115 | | | 118 |
| | | | | | |
Agricultural Products—0.3% | | | | | | |
Cargill, Inc. 144A
5.600% due 9/15/12(b) | | | 115 | | | 117 |
| | | | | | |
Airlines—3.2% | | | | | | |
American Airlines, Inc. 01-1
6.977% due 11/23/22 | | | 412 | | | 381 |
Continental Airlines, Inc. 98-1A
6.648% due 3/15/19 | | | 164 | | | 165 |
Delta Air Lines, Inc. 00-1
7.379% due 11/18/11 | | | 211 | | | 211 |
JetBlue Airways Corp. 04-2
7.969% due 5/15/10(c) | | | 251 | | | 250 |
United Airlines, Inc. 00-2
7.032% due 4/1/12 | | | 123 | | | 123 |
United Airlines, Inc. 01-1
6.071% due 9/1/14 | | | 266 | | | 264 |
| | | | | | |
| | | | | | 1,394 |
| | | | | | |
Application Software—0.1% | | | | | | |
Intuit, Inc.
5.750% due 3/15/17(f) | | | 41 | | | 40 |
| | | | | | |
Asset Management & Custody Banks—0.4% | | | | | | |
Janus Capital Group, Inc.
6.250% due 6/15/12 | | | 75 | | | 77 |
Nuveen Investments, Inc.
5.000% due 9/15/10 | | | 95 | | | 87 |
| | | | | | |
| | | | | | 164 |
| | | | | | |
Automobile Manufacturers—0.2% | | | | | | |
Daimler Finance North America LLC
6.500% due 11/15/13 | | | 70 | | | 73 |
| | | | | | |
See Notes to Financial Statements
60
PHOENIX MULTI-SECTOR SHORT TERM BOND SERIES
| | | | | | | |
| | | PAR
VALUE
(000) | | | VALUE
(000) |
Automotive Retail—0.2% | | | | | | | |
Hertz Corp.(The)
8.875% due 1/1/14 | | $ | 100 | | | $ | 102 |
| | | | | | | |
Broadcasting & Cable TV—0.9% | | | | | | | |
Comcast Cable Holdings LLC
7.875% due 8/1/13 | | | 150 | | | | 165 |
COX Communications, Inc.
4.625% due 6/1/13 | | | 250 | | | | 239 |
| | | | | | | |
| | | | | | | 404 |
| | | | | | | |
Building Products—0.1% | | | | | | | |
Esco Corp. 144A
8.625% due 12/15/13(b) | | | 54 | | | | 54 |
| | | | | | | |
Casinos & Gaming—0.1% | | | | | | | |
MGM MIRAGE
8.500% due 9/15/10 | | | 15 | | | | 16 |
Seminole Hard Rock Entertainment, Inc./Seminole Hard Rock International LLC 144A
7.491% due 3/15/14(b) (c) | | | 25 | | | | 24 |
| | | | | | | |
| | | | | | | 40 |
| | | | | | | |
Consumer Finance—3.1% | | | | | | | |
Ford Motor Credit Co. LLC
5.625% due 10/1/08 | | | 345 | | | | 335 |
9.875% due 8/10/11 | | | 118 | | | | 112 |
9.693% due 4/15/12(c) | | | 135 | | | | 132 |
GMAC LLC
6.034% due 9/23/08(c) | | | 185 | | | | 179 |
6.119% due 5/15/09(c) | | | 135 | | | | 126 |
6.875 % due 9/15/11 | | | 38 | | | | 32 |
MBNA Corp.
4.625% due 9/15/08 | | | 100 | | | | 100 |
Residential Capital LLC
7.625% due 11/21/08 | | | 100 | | | | 80 |
7.500% due 2/22/11 | | | 50 | | | | 31 |
SLM Corp.
4.035% due 2/1/10(c) | | | 250 | | | | 227 |
| | | | | | | |
| | | | | | | 1,354 |
| | | | | | | |
Data Processing & Outsourced Services—0.7% | | | | | | | |
Convergys Corp.
4.875% due 12/15/09 | | | 250 | | | | 253 |
First Data Corp. 144A
9.875% due 9/24/15(b) | | | 65 | | | | 61 |
| | | | | | | |
| | | | | | | 314 |
| | | | | | | |
Distillers & Vintners—0.1% | | | | | | | |
Constellation Brands, Inc.
8.375% due 12/15/14 | | | 40 | | | | 40 |
| | | | | | | |
Electric Utilities—0.7% | | | | | | | |
Consumers Energy Co. Series H
4.800% due 2/17/09 | | | 100 | | | | 100 |
Entergy Gulf States, Inc.
3.600% due 6/1/08 | | | 200 | | | | 198 |
| | | | | | | |
| | | | | | | 298 |
| | | | | | | |
Electrical Components & Equipment—0.2% | | | | | | | |
General Cable Corp.
7.606% due 4/1/15(c) | | | 100 | | | | 96 |
| | | | | | | |
Health Care Facilities—0.1% | | | | | | | |
HCA, Inc.
9.125% due 11/15/14 | | | 45 | | | | 47 |
| | | | | | | |
Hotels, Resorts & Cruise Lines—0.1% | | | | | | | |
Starwood Hotels & Resort Worldwide, Inc.
6.250% due 2/15/13 | | | 63 | | | | 63 |
| | | | | | | |
Independent Power Producers & Energy Traders—0.1% | | | | | | | |
Texas Competitive Electric Holdings Co. LLC 144A
10.250% due 11/1/15(b) | | | 36 | | | | 36 |
| | | | | | | |
Industrial Conglomerates—0.2% | | | | | | | |
Textron Financial Corp.
5.125% due 11/1/10 | | | 100 | | | | 102 |
| | | | | | | |
Investment Banking & Brokerage—0.9% | | | | | | | |
Lehman Brothers Holdings, Inc.
6.000% due 7/19/12 | | | 65 | | | | 66 |
Merrill Lynch & Co., Inc. (Brazil)
10.710% due 3/8/17(d) | | | 200 | (h) | | | 104 |
Morgan Stanley 144A (Brazil)
10.090% due 5/3/17(b)(d) | | | 250 | (h) | | | 128 |
Piper Jaffray Equipment Trust Securities 144A
6.000% due 9/10/11(b) | | | 125 | | | | 119 |
| | | | | | | |
| | | | | | | 417 |
| | | | | | | |
Life Sciences Tools & Services—0.3% | | | | | | | |
Fisher Scientific International, Inc.
6.750% due 8/15/14 | | | 140 | | | | 143 |
| | | | | | | |
Movies & Entertainment—0.2% | | | | | | | |
Time Warner, Inc.
6.875% due 5/1/12 | | | 100 | | | | 105 |
| | | | | | | |
Office Services & Supplies—0.2% | | | | | | | |
Steelcase, Inc.
6.500% due 8/15/11 | | | 100 | | | | 105 |
| | | | | | | |
Oil & Gas Equipment & Services—0.0% | | | | | | | |
Helix Energy Solutions 144A
9.500% due 1/15/16(b) | | | 13 | | | | 13 |
| | | | | | | |
Oil & Gas Exploration & Production—0.3% | | | | | | | |
Swift Energy Co.
7.625% due 7/15/11 | | | 125 | | | | 126 |
| | | | | | | |
Oil & Gas Refining & Marketing—0.8% | | | | | | | |
Tesoro Corp.
6.250% due 11/1/12 | | | 115 | | | | 116 |
Valero Energy Corp.
4.750% due 6/15/13 | | | 225 | | | | 218 |
| | | | | | | |
| | | | | | | 334 |
| | | | | | | |
Oil & Gas Storage & Transportation—0.7% | | | | | | | |
Knight, Inc.
6.500% due 9/1/12 | | | 110 | | | | 110 |
Pacific Energy Partners LP/Pacific Energy Finance Corp.
7.125% due 6/15/14 | | | 75 | | | | 78 |
Transcont Gas Pipe Corp.
7.000% due 8/15/11 | | | 100 | | | | 105 |
| | | | | | | |
| | | | | | | 293 |
| | | | | | | |
Other Diversified Financial Services—0.8% | | | | | | | |
ERAC USA Finance Co. 144A
5.300% due 11/15/08(b) | | | 85 | | | | 84 |
General Electric Capital Corp.
6.125% due 2/22/11 | | | 125 | | | | 131 |
JP Morgan & Co., Inc.
6.250% due 1/15/09 | | | 50 | | | | 51 |
MassMutual Global Funding II 144A
3.500% due 3/15/10(b) | | | 100 | | | | 99 |
| | | | | | | |
| | | | | | | 365 |
| | | | | | | |
Paper Packaging—0.6% | | | | | | | |
Jefferson Smurfit Corp.
8.250% due 10/1/12 | | | 40 | | | | 39 |
Packaging Corp. of America
4.375% due 8/1/08 | | | 250 | | | | 248 |
| | | | | | | |
| | | | | | | 287 |
| | | | | | | |
Paper Products—0.5% | | | | | | | |
AbitibiBowater, Inc.
7.991% due 3/15/10(c) | | | 165 | | | | 145 |
Verso Paper Holdings LLC and Verso Paper, Inc. Series B
8.661% due 8/1/14(c) | | | 85 | | | | 83 |
| | | | | | | |
| | | | | | | 228 |
| | | | | | | |
Real Estate Management & Development—0.5% | | | | | | | |
Colonial Realty LP
4.800% due 4/1/11 | | | 250 | | | | 244 |
| | | | | | | |
Retail REITs—0.1% | | | | | | | |
Simon Property Group LP
5.600% due 9/1/11 | | | 55 | | | | 55 |
| | | | | | | |
Specialized Finance—0.2% | | | | | | | |
Yankee Acquisition Corp. Series B
8.500% due 2/15/15 | | | 80 | | | | 74 |
| | | | | | | |
Specialized REITs—0.7% | | | | | | | |
Host Hotels & Resorts LP
6.875% due 11/1/14 | | | 115 | | | | 115 |
Nationwide Health Properties
6.250% due 2/1/13 | | | 130 | | | | 135 |
Ventas Realty LP/Ventas Capital Corp.
6.750% due 6/1/10 | | | 50 | | | | 51 |
| | | | | | | |
| | | | | | | 301 |
| | | | | | | |
See Notes to Financial Statements
61
PHOENIX MULTI-SECTOR SHORT TERM BOND SERIES
| | | | | | | |
| | | PAR
VALUE
(000) | | | VALUE
(000) |
Steel—0.1% | | | | | | | |
Steel Dynamics, Inc. 144A
7.375% due 11/1/12(b) | | $ | 41 | | | $ | 41 |
| | | | | | | |
Tobacco—0.5% | | | | | | | |
Philip Morris Capital Corp.
7.500% due 7/16/09 | | | 200 | | | | 204 |
| | | | | | | |
Wireless Telecommunication Services—0.2% | | | | | | | |
Nextel Communications, Inc. Series D
7.375% due 8/1/15 | | | 75 | | | | 74 |
| | | | | | | |
Total Domestic Corporate Bonds (Identified Cost $ 8,380) | | | | | | | 8,265 |
| | | | | | | |
NON-AGENCY MORTGAGE-BACKED SECURITIES—20.6% | | | | | | | |
American General Mortgage Loan Trust 06-1, A2 144A
5.750% due 12/25/35(b) (c) | | | 275 | | | | 273 |
Asset Securitization Corp. 96-D3, A1C
7.400% due 10/13/26 | | | 25 | | | | 26 |
Banc of America Alternative Loan Trust 06-9, A1
6.000% due 1/25/37 | | | 413 | | | | 408 |
Bear Stearns Commercial Mortgage Securities 04-ESA, J 144A
5.817% due 5/14/16(b) | | | 350 | | | | 359 |
Bear Stearns Structured Products, Inc. 04-15, A2 144A
0% due 11/27/34 (b) | | | 39 | | | | 37 |
Bear Stearns Structured Products, Inc. 05-10 144A
7.365% due 4/26/35(b) (c) | | | 108 | | | | 102 |
Bear Stearns Structured Products, Inc. 05-20N, A 144A
8.365% due 10/25/45(b) (c) | | | 86 | | | | 86 |
Chase Mortgage Finance Corp. 04-S1 M
5.098% due 2/25/19(c) | | | 80 | | | | 76 |
Chase Mortgage Finance Corp. 04-S3, 3A1
6.000% due 3/25/34 | | | 353 | | | | 356 |
Chase Mortgage Finance Corp. 06-A1, 4A1
6.044% due 9/25/36(c) | | | 415 | | | | 419 |
Citicorp Mortgage Securities, Inc. 06-7, 1A1
6.000% due 12/25/36 | | | 111 | | | | 111 |
Countrywide Home Loan Mortgage Pass-Through Trust 04-13, 1A1
5.500% due 8/25/34 | | | 179 | | | | 180 |
Countrywide Home Loan Mortgage Pass-Through Trust 07-1, A2
6.000% due 3/25/37 | | | 258 | | | | 260 |
Credit Suisse First Boston Mortgage Securities Corp. 03-8, 3A24
5.500% due 4/25/33 | | | 290 | | | | 279 |
Credit Suisse First Boston Mortgage Securities Corp. 05-12, 6A1
6.000% due 1/25/36 | | | 143 | | | | 141 |
Credit Suisse First Boston Mortgage Securities Corp. 98-C1, B
6.590% due 5/17/40 | | | 390 | | | | 391 |
Crown Castle Towers LLC 05-1A, AFX 144A
4.643% due 6/15/35(b) | | | 250 | | | | 250 |
First Horizon Asset Securities, Inc. 05-AR1, 2A1
5.012% due 4/25/35(c) | | | 235 | | | | 236 |
Franchise Mortgage Acceptance Co. Loan Receivables Trust 98-CA, A2 144A
6.660% due 9/15/20(b) | | | 65 | | | | 63 |
GMAC Commercial Mortgage Securities, Inc 98-C2 E
6.500% due 5/15/35 | | | 50 | | | | 52 |
GMAC Mortgage Corp. Loan Trust 05-AR2, 2A
4.862% due 5/25/35(c) | | | 303 | | | | 300 |
GMAC Mortgage Corp. Loan Trust 05-HE2, A3
4.622% due 11/25/35(c) | | | 76 | | | | 75 |
GMAC Mortgage Corp. Loan Trust 06-HE2, A3
6.320% due 5/25/36 | | | 350 | | | | 342 |
Greenwich Structured Adjustable Rate Mortgage Products 05-4A, N1 144A
7.793% due 7/27/45(b) (c) | | | 25 | | | | 25 |
GS Mortgage Securities Corp. II 07-EOP, G 144A
5.060% due 3/6/20(b) (c) | | | 130 | | | | 122 |
GS Mortgage Securities Corp. II 07-EOP, H 144A
5.190% due 3/6/20(b) (c) | | | 110 | | | | 105 |
Harborview Mortgage Loan Trust 05-15, B8
6.699% due 10/20/45(c) | | | 200 | | | | 140 |
Harborview Mortgage Loan Trust 05-9, B10
6.699% due 6/20/35(c) | | | 129 | | | | 105 |
Harborview Net Interest Margin Corp. 06-12, N1 144A
6.409% due 12/19/36(b) | | | 48 | | | | 48 |
IndyMac Index Mortgage Loan Trust 06-AR25, 3A1
6.368% due 9/25/36(c) | | | 184 | | | | 184 |
Indymac Index Mortgage Loan Trust 07-AR2, B1
5.868% due 6/25/37(c) | | | 135 | | | | 116 |
JPMorgan Mortgage Trust 05-S3, 2A2
5.500% due 1/25/21 | | | 49 | | | | 49 |
JPMorgan Mortgage Trust 06-A1, B1
5.399% due 2/25/36(c) | | | 248 | | | | 243 |
Lehman Brothers – UBS Commercial Mortgage Trust 07-C2, A2
5.303% due 2/15/40 | | | 225 | | | | 226 |
Lehman XS Net Interest Margin 06-GPM4, A1 144A
6.250% due 9/28/46(b) | | | 19 | | | | 19 |
Lehman XS Net Interest Margin 06-GPM7, A1 144A
6.250% due 12/28/46(b) | | | 62 | | | | 61 |
MASTR Alternative Net Interest Margin Trust 05-CW1A, N1 144A
6.750% due 12/26/35(b) (s) | | | 22 | | | | 19 |
MASTR Resecuritization Trust 05-4CI, N2 144A
7.865% due 4/26/45(b) (c) (s) | | | 120 | | | | 59 |
Merrill Lynch/Countrywide Commercial Mortgage Investors, Inc. 06-3, 2A1
6.090% due 10/25/36(c) | | | 195 | | | | 198 |
Residential Accredit Loans, Inc. 05-QA4, A5
5.450% due 4/25/35(c) | | | 229 | | | | 225 |
Residential Funding Mortgage Securities I, Inc. 05-SA1, 2A
4.856% due 3/25/35(c) | | | 165 | | | | 163 |
Residential Funding Mortgage Securities I, Inc. 06-S4, A2
6.000% due 4/25/36 | | | 215 | | | | 217 |
SBA Commercial Mortgage Backed Securities Trust 06-1A, B 144A
5.451% due 11/15/36(b) | | | 95 | | | | 94 |
Structured Asset Securities Corp. 03-32, 1A1
5.210% due 11/25/33(c) | | | 165 | | | | 161 |
Wachovia Bank Commercial Mortgage Trust 2004-C12, A2
5.001% due 7/15/41 | | | 215 | | | | 216 |
Wachovia Mortgage Loan Trust LLC 06-A, B1
5.416% due 5/20/36(c) | | | 249 | | | | 237 |
Wells Fargo Mortgage Backed Securities Trust 04-EE, 2A3
3.989% due 12/25/34(c) | | | 165 | | | | 163 |
Wells Fargo Mortgage Backed Securities Trust 04-R, 2A1
4.360% due 9/25/34(c) | | | 276 | | | | 275 |
Wells Fargo Mortgage Backed Securities Trust 05-14, 2A1
5.500% due 12/25/35 | | | 224 | | | | 219 |
Wells Fargo Mortgage Backed Securities Trust 05-5, 1A1
5.000% due 5/25/20 | | | 178 | | | | 175 |
Wells Fargo Mortgage Backed Securities Trust 05-AR10, 2A16
4.109% due 6/25/35(c) | | | 210 | | | | 204 |
Wells Fargo Mortgage Backed Securities Trust 05-AR16, 6A3
5.000% due 10/25/35(c) | | | 223 | | | | 224 |
| | | | | | | |
Total Non-Agency Mortgage-Backed Securities (Identified Cost $ 9,322) | | | | | | | 9,114 |
| | | | | | | |
FOREIGN GOVERNMENT SECURITIES—15.6% | | | | | | | |
Argentina—0.4% | | | | | | | |
Republic of Argentina
5.389% due 8/3/12(c) | | | 194 | | | | 171 |
| | | | | | | |
Australia—1.2% | | | | | | | |
Commonwealth of Australia Series 909
7.500% due 9/15/09 | | | 622 | (g) | | | 552 |
| | | | | | | |
Brazil—1.9% | | | | | | | |
Federative Republic of Brazil
10.500% due 7/14/14 | | | 45 | | | | 57 |
7.875% due 3/7/15 | | | 150 | | | | 170 |
12.500% due 1/5/16 | | | 737 | (h) | | | 451 |
12.500% due 1/5/22 | | | 250 | (h) | | | 157 |
| | | | | | | |
| | | | | | | 835 |
| | | | | | | |
See Notes to Financial Statements
62
PHOENIX MULTI-SECTOR SHORT TERM BOND SERIES
| | | | | | | |
| | | PAR | | | |
| | | VALUE | | | VALUE |
| | | (000) | | | (000) |
Canada—0.4% | | | | | | | |
Commonwealth of Canada
3.750% due 6/1/08 | | | 193 | (i) | | $ | 195 |
| | | | | | | |
Chile—0.6% | | | | | | | |
Republic of Chile
5.411% due 1/28/08(c) | | $ | 250 | | | | 250 |
| | | | | | | |
| Colombia—0.2% | | | | | | | |
Republic of Colombia
10.000% due 1/23/12 | | | 60 | | | | 70 |
| | | | | | | |
| Germany—0.4% | | | | | | | |
Federal Republic of Germany 144A
3.250% due 4/17/09(b) | | | 115 | (j) | | | 166 |
| | | | | | | |
| Hungary—0.2% | | | | | | | |
Republic of Hungary
6.250% due 4/24/09 | | | 20,000 | (k) | | | 114 |
| | | | | | | |
| Indonesia—0.2% | | | | | | | |
Republic of Indonesia 144A
7.250% due 4/20/15(b) | | | 100 | | | | 106 |
| | | | | | | |
| Mexico—0.6% | | | | | | | |
United Mexican States
5.943% due 1/13/09(c) | | | 250 | | | | 250 |
| | | | | | | |
| New Zealand—0.5% | | | | | | | |
Commonwealth of New Zealand Series 708
6.000% due 7/15/08 | | | 307 | (l) | | | 234 |
| | | | | | | |
| Norway—1.4% | | | | | | | |
Kingdom of Norway
5.500% due 5/15/09 | | | 3,225 | (m) | | | 600 |
| | | | | | | |
| Philippines—1.2% | | | | | | | |
Republic of Philippines
8.375% due 3/12/09
| | | 200 | | | | 208 |
8.375% due 2/15/11 | | | 285 | | | | 308 |
| | | | | | | |
| | | | | | | 516 |
| | | | | | | |
| Russia—0.3% | | | | | | | |
Russian Federation RegS
7.500% due 3/31/30(c) (e) | | | 114 | | | | 130 |
| | | | | | | |
| Singapore—0.3% | | | | | | | |
Singapore Government
2.500% due 10/1/12 | | | 175 | (o) | | | 123 |
| | | | | | | |
| Sweden—0.2% | | | | | | | |
Kingdom of Sweden Series 1043
5.000% due 1/28/09 | | | 715 | (p) | | | 112 |
| | | | | | | |
| Trinidad and Tobago—0.2% | | | | | | | |
Republic of Trinidad and Tobago RegS
9.875% due 10/1/09(e) | | | 75 | | | | 82 |
| | | | | | | |
| Turkey—2.3% | | | | | | | |
Republic of Turkey
10.500% due 1/13/08 | | | 350 | | | | 351 |
0% due 5/6/09 | | | 400 | (q) | | | 277 |
11.750% due 6/15/10 | | | 340 | | | | 395 |
| | | | | | | |
| | | | | | | 1,023 |
| | | | | | | |
| Venezuela—3.1% | | | | | | | |
Republic of Venezuela
8.500% due 10/8/14 | | | 330 | | | | 319 |
5.750% due 2/26/16 | | | 140 | | | | 113 |
Republic of Venezuela RegS
5.375% due 8/7/10(e) | | | 975 | | | | 919 |
| | | | | | | |
| | | | | | | 1,351 |
| | | | | | | |
Total Foreign Government Securities (Identified Cost $6,630) | | | | | | | 6,880 |
| | | | | | | |
FOREIGN CORPORATE BONDS(d) —9.1% | | | | | | | |
| | |
| Canada—0.6% | | | | | | | |
European Investment Bank 144A
4.600% due 1/30/37(b) | | | 150 | (j) | | | 149 |
Thomson Corp. (The)
4.250% due 8/15/09 | | | 100 | | | | 100 |
| | | | | | | |
| | | | | | | 249 |
| | | | | | | |
| Chile—0.7% | | | | | | | |
Celulosa Arauco y Constitucion SA
7.750% due 9/13/11 | | | 165 | | | | 178 |
Empresa Nacional de Electricidad SA
7.750% due 7/15/08 | | | 120 | | | | 121 |
| | | | | | | |
| | | | | | | 299 |
| | | | | | | |
| Germany—0.6% | | | | | | | |
Deutsche Bank AG NY Series GS
4.055% due 3/22/12(c) | | | 250 | | | | 250 |
| | | | | | | |
| Hong Kong—0.6% | | | | | | | |
Hutchison Whampoa International Ltd. 144A
5.450% due 11/24/10(b) | | | 250 | | | | 253 |
| | | | | | | |
| India—0.4% | | | | | | | |
ICICI Bank Ltd. 144A
5.750% due 11/16/10(b) | | | 175 | | | | 174 |
| | | | | | | |
| Luxembourg—0.1% | | | | | | | |
Tyco Electronic Group SA 144A
6.000% due 10/1/12(b) | | | 35 | | | | 36 |
| | | | | | | |
| Malaysia—0.4% | | | | | | | |
Malaysia International Shipping Corporation Capital Ltd. 144A
5.000% due 7/1/09(b) | | | 200 | | | | 201 |
| | | | | | | |
| Mexico—0.4% | | | | | | | |
Fideicomiso Petacalco Trust 144A
10.160% due 12/23/09(b) | | | 74 | | | | 76 |
Vitro S.A.B. de C.V.
8.625% due 2/1/12 | | | 115 | | | | 109 |
| | | | | | | |
| | | | | | | 185 |
| | | | | | | |
| Netherlands—0.4% | | | | | | | |
Majapahit Holding BV 144A
7.250% due 6/28/17(b) | | | 100 | | | | 96 |
NXP BV/NXP Funding LLC
7.993% due 10/15/13(c) | | | 105 | | | | 97 |
| | | | | | | |
| | | | | | | 193 |
| | | | | | | |
Poland—0.5% | | | | | | | |
Telekomunikacja Polska SA Finance BV 144A
7.750% due 12/10/08(b) | | | 225 | | | | 231 |
| | | | | | | |
| Qatar—0.2% | | | | | | | |
Ras Laffan Liquefied Natural Gas Co. Ltd. 144A
3.437% due 9/15/09(b) | | | 97 | | | | 97 |
| | | | | | | |
| Russia—2.2% | | | | | | | |
European Bank for Reconstruction & Development
6.000% due 2/14/12 | | | 5,000 | (n) | | | 197 |
Gazprom OAO (Gaz Capital SA) 144A(b)
6.212% due 11/22/16 | | | 230 | | | | 221 |
6.510% due 3/7/22 | | | 100 | | | | 95 |
OJSC AK Transneft (TransCapitalInvest Ltd.) 144A
5.670% due 3/5/14(b) | | | 270 | | | | 259 |
Russian Agricultural Bank OJSC (RSHB Capital SA) 144A
6.299% due 5/15/17(b) | | | 100 | | | | 95 |
TNK-BP Finance SA RegS
6.125% due 3/20/12(e) | | | 115 | | | | 110 |
| | | | | | | |
| | | | | | | 977 |
| | | | | | | |
| South Korea—0.3% | | | | | | | |
Export-Import Bank of Korea
4.500% due 8/12/09 | | | 120 | | | | 119 |
| | | | | | | |
| Switzerland—0.2% | | | | | | | |
Petroplus Finance Ltd. 144A
6.750% due 5/1/14(b) | | | 75 | | | | 70 |
| | | | | | | |
| Ukraine—0.2% | | | | | | | |
NAK Naftogaz Ukrainy (Standard Bank London Holdings plc)
8.125% due 9/30/09 | | | 100 | | | | 95 |
| | | | | | | |
| United Arab Emirates—0.4% | | | | | | | |
Abu Dhabi National Energy Co. 144A
5.620% due 10/25/12(b) | | | 170 | | | | 172 |
United States—0.9% | | | | | | | |
Invesco plc
4.500% due 12/15/09 | | | 250 | | | | 246 |
Nova Chemicals Corp.
7.863% due 11/15/13(c) | | | 170 | | | | 160 |
| | | | | | | |
| | | | | | | 406 |
| | | | | | | |
Total Foreign Corporate Bonds (Identified Cost $ 4,060) | | | | | | | 4,007 |
| | | | | | | |
| DOMESTIC CONVERTIBLE BONDS—0.1% | | | | | | | |
| Pharmaceuticals—0.1% | | | | | | | |
Par Pharmaceutical Cos., Inc.
2.875% due 9/30/10 | | | 40 | | | | 37 |
| | | | | | | |
Total Domestic Convertible Bonds (Identified Cost $35) | | | | | | | 37 |
| | | | | | | |
See Notes to Financial Statements
63
PHOENIX MULTI-SECTOR SHORT TERM BOND SERIES
| | | | | | |
| | | PAR
VALUE
(000) | | VALUE
(000) |
FOREIGN CREDIT LINKED NOTES—0.2% | | | | | | |
| | |
Indonesia—0.2% | | | | | | |
Republic of Indonesia
(Citigroup, Inc.)
11.867% due 6/15/09 | | $ | 120 | | $ | 106 |
| | | | | | |
Total Foreign Credit Linked Notes | | | | | | |
(Identified Cost $ 111) | | | | | | 106 |
| | | | | | |
DOMESTIC LOAN AGREEMENTS (c) —8.5% | | | | | | |
Advertising—0.1% | | | | | | |
Lamar Media Corp. Tranche F
6.875% due 3/31/14 | | | 25 | | | 25 |
| | | | | | |
Alternative Carriers—0.3% | | | | | | |
Level 3 Communications, Inc.
Tranche B
7.493% due 3/13/14 | | | 17 | | | 16 |
| | |
| | |
Time Warner Telecom Holdings
Tranche B
8.471% due 1/7/13 | | | 120 | | | 116 |
| | | | | | |
| | | | | | 132 |
| | | | | | |
Apparel Retail—0.3% | | | | | | |
Hanesbrands, Inc. Tranche B
7.090% due 9/5/13 | | | 40 | | | 40 |
HBI Branded Apparel Ltd., Inc.
Tranche 2
9.110% due 3/5/14 | | | 65 | | | 65 |
Totes Isotoner Corp. Tranche B
7.814% due 1/16/13 | | | 16 | | | 15 |
| | | | | | |
| | | | | | 120 |
| | | | | | |
Application Software—0.2% | | | | | | |
Reynolds & Reynolds Co. (The)
Tranche FL
7.198% due 10/24/12 | | | 93 | | | 89 |
| | | | | | |
Asset Management & Custody Banks—0.0% | | | | | | |
Nuveen Investments, Inc.
Tranche Term B
7.841% due 11/13/14 | | | 19 | | | 19 |
| | | | | | |
Automobile Manufacturers—0.4% | | | | | | |
Ford Motor Co. Tranche B
8.360% due 12/15/13 | | | 114 | | | 106 |
General Motors Corp. Tranche B
7.745% due 11/29/13 | | | 94 | | | 89 |
| | | | | | |
| | | | | | 195 |
| | | | | | |
Broadcasting & Cable TV—0.7% | | | | | | |
Charter Communications
Operating LLC Tranche
7.360% due 3/6/14 | | | 248 | | | 232 |
DIRECTV Holdings LLC Tranche B
6.820% due 4/13/13 | | | 65 | | | 65 |
| | | | | | |
| | | | | | 297 |
| | | | | | |
Casinos & Gaming—0.0% | | | | | | |
Wimar Operating Co. LLC Tranche B
7.610% due 1/3/12 | | | 17 | | | 16 |
| | | | | | |
Data Processing & Outsourced Services—0.3% | | | | | | |
First Data Corp. Tranche B3
7.710% due 9/24/14 | | $ | 149 | | $ | 142 |
| | | | | | |
Department Stores—0.3% | | | | | | |
Neiman-Marcus Group, Inc. (The)
Tranche
7.346% due 4/6/13 | | | 144 | | | 139 |
| | | | | | |
Distributors—0.3% | | | | | | |
Building Materials Holding Corp.
Tranche B
7.850% due 11/10/13 | | | 158 | | | 135 |
| | | | | | |
Diversified Chemicals—0.3% | | | | | | |
Celanese Holdings LLC Tranche
Term B
8.181% due 3/30/14 | | | 120 | | | 115 |
Huntsman Corp. Tranche B
7.070% due 8/16/12 | | | 17 | | | 17 |
| | | | | | |
| | | | | | 132 |
| | | | | | |
Diversified Commercial & Professional Services—0.1% | | | | | | |
ARAMARK Corp. Letter of Credit
7.198% due 1/26/14 | | | 3 | | | 3 |
ARAMARK Corp. Tranche B
7.198% due 1/26/14 | | | 41 | | | 39 |
| | | | | | |
| | | | | | 42 |
| | | | | | |
Electric Utilities—0.1% | | | | | | |
Energy Future Holdings Tranche B2
8.645% due 10/10/14 | | | 62 | | | 61 |
| | | | | | |
Electrical Components & Equipment—0.2% | | | | | | |
Baldor Electric Co. Tranche
6.938% due 1/31/14 | | | 74 | | | 72 |
| | | | | | |
Environmental & Facilities Services—0.5% | | | | | | |
Allied Waste North America, Inc. Letter of Credit A
6.621% due 3/28/14 | | | 33 | | | 31 |
Allied Waste North America, Inc. Tranche B
6.440% due 3/28/14 | | | 54 | | | 52 |
Duratek, Inc. Tranche B
7.660% due 6/30/16 | | | 11 | | | 11 |
EnergySolutions LLC Tranche
7.570% due 2/26/14 | | | 107 | | | 104 |
EnergySolutions LLC Tranche B
7.660% due 6/7/13 | | | 23 | | | 23 |
EnviroCare Tranche C
7.570% due 6/30/16 | | | 1 | | | 1 |
| | | | | | |
| | | | | | 222 |
| | | | | | |
Fertilizers & Agricultural Chemicals—0.0% | | | | | | |
Mosaic Co. (The) Tranche B
7.112% due 12/1/13 | | | 6 | | | 6 |
| | | | | | |
Health Care Facilities—0.4% | | | | | | |
HCA, Inc. Tranche B
7.610% due 11/16/13 | | | 55 | | | 53 |
Health Management Associates, Inc.
Tranche B
7.110% due 2/28/14 | | $ | 35 | | $ | 33 |
LifePoint Hospitals, Inc.
Tranche B
6.985% due 4/15/12 | | | 83 | | | 79 |
| | | | | | |
| | | | | | 165 |
| | | | | | |
Health Care Services—0.2% | | | | | | |
Davita Inc. Tranche B1
6.860% due 10/5/12 | | | 113 | | | 109 |
| | | | | | |
Housewares & Specialties—0.1% | | | | | | |
Yankee Candle Co., Inc.
Tranche B
8.891% due 2/6/14 | | | 50 | | | 47 |
| | | | | | |
Independent Power Producers & Energy Traders—0.4% | | | | | | |
Mirant North America LLC
Tranche B
7.070% due 1/3/13 | | | 40 | | | 38 |
NRG Energy, Inc. Letter of Credit
7.070% due 2/1/13 | | | 108 | | | 108 |
NRG Energy, Inc. Tranche B1
7.070% due 2/1/13 | | | 39 | | | 38 |
| | | | | | |
| | | | | | 184 |
| | | | | | |
Integrated Telecommunication Services—0.6% | | | | | | |
NTELOS, Inc. Tranche B1
7.570% due 8/24/11 | | | 265 | | | 263 |
| | | | | | |
Leisure Facilities—0.1% | | | | | | |
AMF Bowling Worldwide, Inc. Tranche B
7.860% due 5/17/13 | | | 60 | | | 57 |
| | | | | | |
Oil & Gas Drilling—0.1% | | | | | | |
Hercules Offshore, Inc. Tranche
7.110% due 7/11/13 | | | 52 | | | 50 |
| | | | | | |
Oil & Gas Equipment & Services—0.2% | | | | | | |
Helix Energy Solutions Group, Inc.
Tranche
7.320% due 7/1/13 | | | 90 | | | 87 |
| | | | | | |
Paper Products—0.1% | | | | | | |
NewPage Corp. Tranche B
9.891% due 12/20/14 | | | 24 | | | 23 |
| | | | | | |
Publishing—0.4% | | | | | | |
Idearc, Inc. Tranche B
7.360% due 11/17/14 | | | 114 | | | 109 |
Tribune Co. Tranche B
8.375% due 5/17/14 | | | 60 | | | 51 |
| | | | | | |
| | | | | | 160 |
| | | | | | |
Restaurants—0.3% | | | | | | |
Burger King Corp. Tranche B1
6.750% due 6/30/12 | | | 117 | | | 115 |
| | | | | | |
See Notes to Financial Statements
64
PHOENIX MULTI-SECTOR SHORT TERM SERIES
| | | | | | | | |
| | | PAR | | | | |
| | | VALUE | | | VALUE | |
| | | (000) | | | (000) | |
Semiconductors—0.3% | | | | | | | | |
Freescale Semiconductor, Inc. Tranche
7.110% due 12/1/13 | | $ | 124 | | | $ | 115 | |
| | | | | | | | |
| Specialized Finance—0.4% | | | | | | | | |
Solar Capital Corp. Tranche US
7.590% due 2/11/13 | | | 191 | | | | 184 | |
| | | | | | | | |
| Specialty Chemicals—0.1% | | | | | | | | |
JohnsonDiversey, Inc. Tranche B
7.860% due 12/16/11 | | | 26 | | | | 26 | |
| | | | | | | | |
| Wireless Telecommunication Services—0.7% | | | | | | | | |
ALLTEL Communications, Inc. Tranche B3
9.029% due 5/15/15 | | | 114 | | | | 109 | |
Cricket Communications, Inc. Tranche B1
7.360% due 6/16/13 | | | 111 | | | | 110 | |
MetroPCS Wireless, Inc. Tranche B
7.625% due 11/3/13 | | | 118 | | | | 113 | |
| | | | | | | | |
| | | | | | | 332 | |
| | | | | | | | |
Total Domestic Loan Agreements
(Identified Cost $3,874) | | | | | | | 3,761 | |
| | | | | | | | |
FOREIGN LOAN AGREEMENTS (c) —0.6% | | | | | | | | |
| Germany—0.3% | | | | | | | | |
Fresenius Medical Care AG & Co. KGaA Tranche B
6.735% due 3/31/13 | | | 135 | | | | 132 | |
| | | | | | | | |
United Kingdom—0.2% | | | | | | | | |
Yell Group plc Tranche B1
7.320% due 2/10/13 | | | 75 | | | | 72 | |
| | | | | | | | |
United States—0.1% | | | | | | | | |
Bausch & Lomb, Inc. Tranche
8.127% due 4/11/15 | | | 33 | (l) | | | 48 | |
| | | | | | | | |
Total Foreign Loan Agreements (Identified Cost $257) | | | | | | | 252 | |
| | | | | | | | |
| | |
| | | SHARES | | | | |
| EXCHANGE TRADED FUNDS—0.8% | | | | | | | | |
DIAMONDS® Trust Series I | | | 1,444 | | | | 191 | |
iShares MSCI EAFE® Index Fund | | | 920 | | | | 72 | |
iShares Russell 2000® Index Fund | | | 730 | | | | 56 | |
PowerShares QQQ | | | 1,100 | | | | 56 | |
| | | | | | | | |
Total Exchange Traded Funds (Identified Cost $382) | | | | | | | 375 | |
| | | | | | | | |
TOTAL LONG TERM INVESTMENTS—97.6% (Identified cost $43,724) | | | | | | | 43,115 | |
| | | | | | | | |
SHORT-TERM INVESTMENTS—2.0% | | | | | | | | |
Commercial Paper(r)—2.0% | | | | | | | | |
Nicor, Inc.
4.000% due 1/2/08 | | | 870 | | | | 870 | |
| | | | | | | | |
Total Short-Term Investments (Identified Cost $870) | | | | | | | 870 | |
| | | | | | | | |
TOTAL INVESTMENTS—99.6% (Identified Cost $44,594) | | | | | | | 43,985 | (a) |
| | | | | | | | |
Other assets and liabilities, net—0.4% | | | | | | | 183 | |
NET ASSETS—100.0% | | | | | | $ | 44,168 | |
| | | | | | | | |
At December 31, 2007, the Fund had entered into forward currency contracts as follows (reported in 000’s):
| | | | | | | | | | | |
| | | | | | | | | Unrealized | |
| | | | | | | | | Appreciation | |
| Contract to Receive | | In Exchange for | | Settlement Date | | Value | | (Depreciation) | |
JPY 48,453 | | USD 455 | | 2/28/08 | | $ | 437 | | $ | (18 | ) |
| | | | | | | | | | | |
| | | | | | | | | | (18 | ) |
| | | | | | | | | | | |
| | | | | | |
| USD | | United States Dollar | | JPY | | Japanese Yen |
(a) | Federal Income Tax Information (reported in 000’s): Net unrealized depreciation of investment securities is comprised of gross appreciation of $298 and gross depreciation of $940 for federal income tax purposes. At December 31, 2007, the aggregate cost of securities for federal income tax purposes was $44,627. |
(b) | Security exempt from registration under Rule 144A of the Securities Act of 1933. These securities may be resold in transactions exempt from registration, normally to qualified institutional buyers. At December 31, 2007, these securities amounted to a value of $5,389 or 12.2% (reported in 000’s) of net assets. |
(c) | Variable or step coupon security; interest rate shown reflects the rate currently in effect. |
(d) | A security is considered to be foreign if the security is issued in a foreign country. The country of risk, noted parenthetically or in the header, is determined based on criteria described in Note 2G, “Foreign security country determination” in the Notes to Financial Statements. |
(e) | Regulation S security. Security is offered and sold outside of the United States, therefore, it is exempt from registration with the SEC under rules 903 and 904 of the Securities Act of 1933. |
(f) | All or a portion segregated as collateral for forward currency contracts. |
(g) | Par value represents Australian Dollar. |
(h) | Par value represents Brazilian Real. |
(i) | Par value represents Canadian Dollar. |
(j) | Par value represents Euro. |
(k) | Par value represents Hungarian Forint. |
(l) | Par value represents New Zealand Dollar. |
(m) | Par value represents Norwegian Krone. |
(n) | Par value represents Russian Ruble. |
(o) | Par value represents Singapore Dollar. |
(p) | Par value represents Swedish Krona. |
(q) | Par value represents Turkish Lira. |
(r) | The rate shown is the discount rate. |
(s) | Illiquid and restricted security. |
At December 31, 2007, these securities amounted to a value of $80 or 0.2% of (reported in 000’s) net assets. For acquisition information, see Note 6 “Illiquid and Restricted Securities” in the Notes to Financial Statements.
See Notes to Financial Statements
65
PHOENIX STRATEGIC ALLOCATION SERIES
SCHEDULE OF INVESTMENTS
DECEMBER 31, 2007
| | | | | | |
| | | PAR | | |
| | | VALUE | | VALUE |
| | | (000) | | (000) |
U.S. GOVERNMENT SECURITIES—1.1% | | | | | | |
U.S. Treasury Bonds—0.7% | | | | | | |
U.S. Treasury Bond
5.000% due 5/15/37 | | $ | 1,620 | | $ | 1,766 |
| | | | | | |
U.S. Treasury Notes—0.4% | | | | | | |
U.S. Treasury Note
3.375% due 11/30/12 | | | 125 | | | 124 |
4.250% due 11/15/17 | | | 1,075 | | | 1,094 |
| | | | | | |
| | | | | | 1,218 |
| | | | | | |
Total U.S. Government Securities (Identified Cost $2,953) | | | | | | 2,984 |
| | | | | | |
AGENCY NON-MORTGAGE BACKED | | | | | | |
SECURITIES—0.6% | | | | | | |
FHLMC
5.200% due 3/5/19 | | | 1,520 | | | 1,521 |
| | | | | | |
Total Agency Non-Mortgage Backed Securities (Identified Cost $1,492) | | | | | | 1,521 |
| | | | | | |
AGENCY MORTGAGE-BACKED SECURITIES—6.7% | | | | | | |
FHLMC R010-AB
5.500% due 12/15/19 | | | 568 | | | 574 |
FNMA | | | | | | |
4.500% due 6/1/19 | | | 455 | | | 448 |
4.000% due 6/1/20 | | | 618 | | | 592 |
5.000% due 6/1/20 | | | 1,453 | | | 1,454 |
4.500% due 7/1/20 | | | 1,142 | | | 1,123 |
6.500% due 10/1/31 | | | 32 | | | 33 |
6.000% due 9/1/32 | | | 210 | | | 214 |
5.000% due 5/1/34 | | | 947 | | | 925 |
5.500% due 5/1/34 | | | 1,029 | | | 1,029 |
5.500% due 6/1/34 | | | 2,834 | | | 2,834 |
6.000% due 7/1/34 | | | 454 | | | 462 |
5.000% due 6/1/35 | | | 4,361 | | | 4,257 |
5.000% due 11/1/35 | | | 1,268 | | | 1,237 |
5.000% due 3/1/36 | | | 665 | | | 649 |
5.500% due 1/1/37 | | | 540 | | | 539 |
5.500% due 4/1/37 | | | 298 | | | 298 |
FNMA 04-W6, 1A4
5.500% due 7/25/34 | | | 491 | | | 491 |
GNMA
6.500% due 11/15/23 | | | 76 | | | 79 |
6.500% due 12/15/23 | | | 18 | | | 19 |
6.500% due 2/15/24 | | | 143 | | | 148 |
6.500% due 6/15/28 | | | 168 | | | 174 |
6.500% due 7/15/31 | | | 115 | | | 119 |
6.500% due 11/15/31 | | | 105 | | | 109 |
6.500% due 2/15/32 | | | 143 | | | 149 |
6.500% due 4/15/32 | | | 122 | | | 127 |
| | | | | | |
Total Agency Mortgage-Backed Securities (Identified Cost $18,173) | | | | | | 18,083 |
| | | | | | |
| MUNICIPAL BONDS—2.8% | | | | | | |
| California—1.0% | | | | | | |
Alameda Corridor Transportation Authority Series C Taxable (MBIA Insured)
6.600% due 10/1/29 | | $ | 1,000 | | $ | 1,097 |
Kern County Pension Obligation Taxable (MBIA Insured)
7.260% due 8/15/14 | | | 420 | | | 468 |
Sonoma County Pension Obligation Taxable (FSA Insured)
6.625% due 6/1/13 | | | 1,065 | | | 1,116 |
| | | | | | |
| | | | | | 2,681 |
| | | | | | |
Florida—0.1% | | | | | | |
Miami-Dade County Educational Facilities Authority Taxable Series C
5.480% due 4/1/16 | | | 200 | | | 201 |
| | | | | | |
Massachusetts—0.1% | | | | | | |
Commonwealth of Massachusetts General Obligation Series C (FSA Insured)
5.500% due 12/1/17 | | | 295 | | | 338 |
| | | | | | |
Minnesota—0.4% | | | | | | |
State of Minnesota, General Revenue
5.000% due 8/1/19 | | | 900 | | | 989 |
| | | | | | |
| Mississippi—0.3% | | | | | | |
Mississippi Development Bank Series A Taxable (FSA Insured)
5.000% due 6/1/12 | | | 710 | | | 718 |
| | | | | | |
| Pennsylvania—0.5% | | | | | | |
City of Pittsburgh Pension Obligation Taxable Series C (FGIC Insured)
6.500% due 3/1/17 | | | 1,250 | | | 1,359 |
| | | | | | |
| Texas—0.4% | | | | | | |
City of Dallas
5.000% due 2/15/17 | | | 1,100 | | | 1,203 |
| | | | | | |
Total Municipal Bonds (Identified Cost $7,104) | | | | | | 7,489 |
| | | | | | |
ASSET-BACKED SECURITIES—2.5% | | | | | | |
Bayview Financial Acquisition Trust 06-A, 1A2
5.483% due 2/28/41(c) | | | 325 | | | 316 |
Capital One Auto Finance Trust 07-B, A3A
5.030% due 4/15/12 | | | 925 | | | 931 |
Carmax Auto Owner Trust 05-2, A4
4.340% due 9/15/10 | | | 900 | | | 897 |
Carmax Auto Owner Trust 07-2, A3
5.230% due 12/15/11 | | $ | 1,550 | | $ | 1,566 |
Dunkin Securitization 06-1, M1 144A
8.285% due 6/20/31(b) | | | 305 | | | 308 |
GS Auto Loan Trust 06-1, A2
5.470% due 2/15/09 | | | 137 | | | 137 |
JPMorgan Mortgage Acquisition Corp. 06-CW2, AF3
6.080% due 8/25/36(c) | | | 470 | | | 465 |
Nomura Asset Acceptance Corp. 07-1, 1A2
5.669% due 3/25/47(c) | | | 620 | | | 558 |
Residential Funding Mortgage Securities II, Inc. 06-HSA1, A3
5.230% due 2/25/36(c) | | | 1,000 | | | 811 |
Wachovia Auto Loan Owner Trust 06-2A, A3 144A
5.230% due 8/22/11(b) | | | 675 | | | 676 |
| | | | | | |
Total Asset-Backed Securities (Identified Cost $6,908) | | | | | | 6,665 |
| | | | | | |
DOMESTIC CORPORATE BONDS—9.5% | | | | | | |
Aerospace & Defense—0.5% | | | | | | |
L-3 Communications Corp.
7.625% due 6/15/12 | | | 250 | | | 257 |
Rockwell Collins, Inc.
4.750% due 12/1/13 | | | 1,000 | | | 1,019 |
| | | | | | |
| | | | | | 1,276 |
| | | | | | |
Airlines—0.6% | | | | | | |
American Airlines, Inc. 01-1
6.977% due 11/23/22 | | | 597 | | | 552 |
Continental Airlines, Inc. 98-1A
6.648% due 3/15/19 | | | 457 | | | 460 |
JetBlue Airways Corp. 04-2
7.969% due 5/15/10(c) | | | 387 | | | 385 |
United Airlines, Inc. 01-1
6.071% due 9/1/14 | | | 286 | | | 285 |
| | | | | | |
| | | | | | 1,682 |
| | | | | | |
Application Software—0.0% | | | | | | |
Intuit, Inc.
5.750% due 3/15/17 | | | 71 | | | 70 |
| | | | | | |
Asset Management & Custody Banks—0.1% | | | | | | |
Bank of New York Mellon Corp. (The)
4.950% due 11/1/12 | | | 180 | | | 180 |
Janus Capital Group, Inc.
6.250% due 6/15/12 | | | 150 | | | 154 |
| | | | | | |
| | | | | | 334 |
| | | | | | |
Automobile Manufacturers—0.1% | | | | | | |
Daimler Finance North America LLC
6.500% due 11/15/13 | | | 130 | | | 136 |
| | | | | | |
See Notes to Financial Statements
66
PHOENIX STRATEGIC ALLOCATION SERIES
| | | | | | | |
| | | PAR | | | |
| | | VALUE | | | VALUE |
| | | (000) | | | (000) |
Automotive Retail—0.1% | | | | | | | |
AutoNation, Inc.
7.000% due 4/15/14 | | $ | 245 | | | $ | 233 |
| | | | | | | |
Broadcasting & Cable TV—0.0% | | | | | | | |
Time Warner Cable, Inc.
5.850% due 5/1/17 | | | 130 | | | | 130 |
| | | | | | | |
Building Products—0.2% | | | | | | | |
CRH America, Inc. (Ireland)
6.000% due 9/30/16(d) | | | 255 | | | | 249 |
Masco Corp.
5.850% due 3/15/17 | | | 165 | | | | 160 |
Owens Corning, Inc.
6.500% due 12/1/16 | | | 60 | | | | 55 |
| | | | | | | |
| | | | | | | 464 |
| | | | | | | |
Casinos & Gaming—0.1% | | | | | | | |
MGM MIRAGE
8.500% due 9/15/10 | | | 25 | | | | 26 |
Seneca Gaming, Corp. Series B
7.250% due 5/1/12 | | | 225 | | | | 228 |
| | | | | | | |
| | | | | | | 254 |
| | | | | | | |
Communications Equipment—0.1% | | | | | | | |
Cisco Systems, Inc.
5.500% due 2/22/16 | | | 250 | | | | 254 |
| | | | | | | |
Construction Materials—0.1% | | | | | | | |
Vulcan Materials Co.
5.600% due 11/30/12 | | | 190 | | | | 191 |
| | | | | | | |
Consumer Finance—1.1% | | | | | | | |
Ford Motor Credit Co. LLC
8.625% due 11/1/10 | | | 180 | | | | 167 |
9.875% due 8/10/11 | | | 238 | | | | 225 |
9.693% due 4/15/12(c) | | | 50 | | | | 49 |
7.800% due 6/1/12 | | | 200 | | | | 175 |
GMAC LLC
6.875% due 9/15/11 | | | 38 | | | | 33 |
6.875% due 8/28/12 | | | 500 | | | | 419 |
6.750% due 12/1/14 | | | 80 | | | | 65 |
Residential Capital LLC
7.625% due 11/21/08 | | | 125 | | | | 100 |
SLM Corp.
4.035% due 2/1/10(c) | | | 1,950 | | | | 1,772 |
| | | | | | | |
| | | | | | | 3,005 |
| | | | | | | |
Data Processing & Outsourced Services—0.1% | | | | | | | |
Broadridge Financial Solutions, Inc.
6.125% due 6/1/17 | | | 250 | | | | 247 |
First Data Corp. 144A
9.875% due 9/24/15(b) | | | 110 | | | | 103 |
| | | | | | | |
| | | | | | | 350 |
| | | | | | | |
Diversified Banks—0.4% | | | | | | | |
National Capital Trust II 144A
5.486% due 12/29/49(b) (c) | | | 950 | | | | 868 |
Wachovia Corp.
4.875% due 2/15/14 | | | 355 | | | | 341 |
| | | | | | | |
| | | | | | | 1,209 |
| | | | | | | |
Diversified Commercial & Professional | | | | | | | |
Services—0.1% | | | | | | | |
Equifax, Inc.
6.300% due 7/1/17 | | $ | 240 | | | $ | 244 |
| | | | | | | |
Drug Retail—0.1% | | | | | | | |
CVS Caremark Corp.
5.750% due 6/1/17 | | | 260 | | | | 262 |
| | | | | | | |
Electric Utilities—0.5% | | | | | | | |
Entergy Gulf States, Inc.
5.700% due 6/1/15 | | | 1,000 | | | | 973 |
Great River Energy 144A
5.829% due 7/1/17(b) | | | 150 | | | | 156 |
Southern Power Co. Series D
4.875% due 7/15/15 | | | 280 | | | | 265 |
| | | | | | | |
| | | | | | | 1,394 |
| | | | | | | |
Electronic Equipment Manufacturers—0.4% | | | | | | | |
Mettler-Toledo International, Inc.
4.850% due 11/15/10 | | | 1,000 | | | | 1,023 |
| | | | | | | |
Food Retail—0.1% | | | | | | | |
Kroger Co. (The)
6.800% due 12/15/18 | | | 130 | | | | 138 |
Safeway, Inc.
6.350% due 8/15/17 | | | 190 | | | | 198 |
| | | | | | | |
| | | | | | | 336 |
| | | | | | | |
Gas Utilities—0.2% | | | | | | | |
AmeriGas Partners LP
7.250% due 5/20/15 | | | 500 | | | | 492 |
| | | | | | | |
Health Care Distributors—0.0% | | | | | | | |
Cardinal Health, Inc. 144A
6.000% due 6/15/17(b) | | | 80 | | | | 81 |
| | | | | | | |
Health Care Equipment—0.1% | | | | | | | |
HCA, Inc. 144A
9.250% due 11/15/16(b) | | | 180 | | | | 189 |
| | | | | | | |
Health Care Services—0.1% | | | | | | | |
Quest Diagnostics, Inc.
6.400% due 7/1/17 | | | 280 | | | | 289 |
| | | | | | | |
Home Furnishings—0.1% | | | | | | | |
Mohawk Industries, Inc.
6.125% due 1/15/16 | | | 275 | | | | 275 |
| | | | | | | |
Hotels, Resorts & Cruise Lines—0.1% | | | | | | | |
Royal Caribbean Cruises Ltd.
7.250% due 6/15/16 | | | 285 | | | | 282 |
| | | | | | | |
Independent Power Producers & Energy | | | | | | | |
Traders—0.1% | | | | | | | |
AES Corp. (The) 144A
7.750% due 10/15/15(b) | | | 250 | | | | 255 |
| | | | | | | |
Industrial Machinery—0.8% | | | | | | | |
ITW Cupids Financing Trust I 144A
6.550% due 12/31/11(b) | | | 2,000 | | | | 2,102 |
| | | | | | | |
Integrated Telecommunication Services—0.2% | | | | | | | |
Citizens Communications Co.
6.250% due 1/15/13 | | $ | 190 | | | $ | 185 |
Qwest Corp.
7.875% due 9/1/11 | | | 125 | | | | 130 |
6.500% due 6/1/17 | | | 143 | | | | 137 |
Verizon Communications, Inc.
4.900% due 9/15/15 | | | 225 | | | | 219 |
| | | | | | | |
| | | | | | | 671 |
| | | | | | | |
Investment Banking & Brokerage—0.5% | | | | | | | |
BlackRock, Inc.
6.250% due 9/15/17 | | | 300 | | | | 309 |
Lehman Brothers Holdings, Inc.
6.000% due 7/19/12 | | | 300 | | | | 306 |
Merrill Lynch & Co., Inc.
6.110% due 1/29/37 | | | 270 | | | | 238 |
Merrill Lynch & Co., Inc. (Brazil)
10.710% due 3/8/17 | | | 240 | (h) | | | 124 |
Morgan Stanley 144A (Brazil)
10.090% due 5/3/17(b) | | | 600 | (h) | | | 307 |
| | | | | | | |
| | | | | | | 1,284 |
| | | | | | | |
Leisure Products—0.1% | | | | | | | |
Hasbro, Inc.
6.300% due 9/15/17 | | | 200 | | | | 205 |
| | | | | | | |
Movies & Entertainment—0.1% | | | | | | | |
Time Warner, Inc.
6.875% due 5/1/12 | | | 200 | | | | 211 |
| | | | | | | |
Multi-line Insurance—0.1% | | | | | | | |
Assurant, Inc.
5.625% due 2/15/14 | | | 250 | | | | 245 |
| | | | | | | |
Multi-Utilities—0.1% | | | | | | | |
Dominion Resources, Inc. Series D
5.000% due 3/15/13(m) | | | 175 | | | | 171 |
| | | | | | | |
Office Electronics—0.1% | | | | | | | |
Xerox Corp.
6.750% due 2/1/17 | | | 325 | | | | 339 |
| | | | | | | |
Office REITs—0.1% | | | | | | | |
HRPT Properties Trust
5.750% due 11/1/15 | | | 275 | | | | 257 |
| | | | | | | |
Office Services & Supplies—0.1% | | | | | | | |
Pitney Bowes, Inc.
4.750% due 5/15/18 | | | 375 | | | | 349 |
| | | | | | | |
Oil & Gas Equipment & Services—0.0% | | | | | | | |
Helix Energy Solutions 144A
9.500% due 1/15/16(b) | | | 50 | | | | 51 |
| | | | | | | |
Oil & Gas Exploration & Production—0.3% | | | | | | | |
Apache Corp.
6.000% due 1/15/37 | | | 365 | | | | 362 |
Plains Exploration & Production Co.
7.750% due 6/15/15 | | | 125 | | | | 126 |
XTO Energy, Inc.
6.250% due 8/1/17 | | | 190 | | | | 199 |
| | | | | | | |
| | | | | | | 687 |
| | | | | | | |
See Notes to Financial Statements
67
PHOENIX STRATEGIC ALLOCATION SERIES
| | | | | | | |
| | | PAR
VALUE
(000) | | | VALUE
(000) |
Oil & Gas Refining & Marketing—0.1% | | | | | | | |
Tesoro Corp.
6.500% due 6/1/17 | | $ | 255 | | | $ | 254 |
| | | | | | | |
Oil & Gas Storage & Transportation—0.4% | | | | | | | |
Kinder Morgan Management Co. ULC
5.700% due 1/5/16 | | | 725 | | | | 660 |
NGPL PipeCo. LLC 144A
6.514% due 12/15/12(b) | | | 250 | | | | 254 |
TEPPCO Partners LP
7.625% due 2/15/12 | | | 130 | | | | 143 |
| | | | | | | |
| | | | | | | 1,057 |
| | | | | | | |
Other Diversified Financial Services—0.4% | | | | | | | |
General Electric Capital Corp.
5.375% due 10/20/16 | | | 700 | | | | 709 |
JPMorgan Chase & Co.
5.250% due 5/1/15 | | | 250 | | | | 244 |
| | | | | | | |
| | | | | | | 953 |
| | | | | | | |
Paper Products—0.0% | | | | | | | |
Verso Paper Holdings LLC and Verso Paper, Inc. Series B
8.661% due 8/1/14(c) | | | 93 | | | | 91 |
| | | | | | | |
Regional Banks—0.4% | | | | | | | |
SunTrust Banks, Inc.
5.250% due 11/5/12 | | | 150 | | | | 151 |
Zions Bancorporation
5.650% due 5/15/14 | | | 1,000 | | | | 981 |
| | | | | | | |
| | | | | | | 1,132 |
| | | | | | | |
Specialized REITs—0.1% | | | | | | | |
Host Hotels & Resorts LP
6.875% due 11/1/14 | | | 200 | | | | 200 |
Realty Income Corp.
6.750% due 8/15/19 | | | 110 | | | | 113 |
| | | | | | | |
| | | | | | | 313 |
| | | | | | | |
Tobacco—0.2% | | | | | | | |
Reynolds American, Inc.
7.300% due 7/15/15 | | | 600 | | | | 623 |
| | | | | | | |
Total Domestic Corporate Bonds (Identified Cost $25,963) | | | | | | | 25,705 |
| | | | | | | |
NON-AGENCY MORTGAGE-BACKED SECURITIES—12.2% | | | | | | | |
Banc of America Alternative Loan Trust 06-9, A1
6.000% due 1/25/37 | | | 1,219 | | | | 1,202 |
Banc of America Funding Corp. 05-8, 1A1
5.500% due 1/25/36 | | | 584 | | | | 578 |
Bear Stearns Adjustable Rate Mortgage Trust 05-12, 13A1
5.444% due 2/25/36(c) | | | 613 | | | | 601 |
Bear Stearns Commercial Mortgage Securities 06-PW12, A4
5.711% due 9/11/38(c) | | | 720 | | | | 744 |
Bear Stearns Commercial Mortgage Securities 07-PW18, AM
6.084% due 6/11/50(c) | | | 550 | | | | 553 |
Citigroup Mortgage Loan Trust, Inc. 05-5, 2A3
5.000% due 8/25/35 | | | 553 | | | | 551 |
Citigroup/Deutsche Bank Commercial Mortgage Trust 06-CD2, A4
5.362% due 1/15/46(c) | | | 1,190 | | | | 1,196 |
Countrywide Home Loan Mortgage Pass-Through Trust 04-13, 1A1
5.500% due 8/25/34 | | | 716 | | | | 719 |
Credit Suisse First Boston Mortgage Securities Corp. 05-12, 6A1
6.000% due 1/25/36 | | | 962 | | | | 953 |
Credit Suisse Mortgage Capital Certificates 06-C1, A4
5.555% due 2/15/39(c) | | | 1,710 | | | | 1,736 |
Crown Castle Towers LLC 05-1A, AFX 144A
4.643% due 6/15/35(b) | | | 800 | | | | 800 |
DLJ Commercial Mortgage Corp. 98-CF2, A1B
6.240% due 11/12/31 | | | 2,651 | | | | 2,664 |
First Horizon Asset Securities, Inc. 05-AR1, 2A1
5.012% due 4/25/35(c) | | | 763 | | | | 768 |
GMAC Mortgage Corp. Loan Trust 05-HE2, A3
4.622% due 11/25/35(c) | | | 379 | | | | 375 |
GS Mortgage Securities Corp. II 05-GG4, AJ
4.782% due 7/10/39 | | | 800 | | | | 727 |
GS Mortgage Securities Corp. II 99-C1, A2
6.110% due 11/18/30(c) | | | 2,024 | | | | 2,029 |
Harborview Net Interest Margin Corp. 06-12, N1 144A
6.409% due 12/19/36(b) | | | 58 | | | | 57 |
IndyMac Index Mortgage Loan Trust 06-AR25, 3A1
6.368% due 9/25/36(c) | | | 612 | | | | 613 |
JPMorgan Chase Commercial Mortgage Securities Corp. 01-CIBC, A3
6.260% due 3/15/33 | | | 1,123 | | | | 1,165 |
JPMorgan Mortgage Acquisition Corp. 06-CW2, AF4
6.337% due 8/25/36(c) | | | 530 | | | | 516 |
JPMorgan Mortgage Trust 05-S3, 2A2
5.500% due 1/25/21 | | | 655 | | | | 659 |
Lehman Brothers—UBS Commercial Mortgage Trust 06-C6, A4
5.372% due 9/15/39 | | | 325 | | | | 326 |
Lehman Brothers – UBS Commercial Mortgage Trust 07-C2, A2
5.303% due 2/15/40 | | | 1,230 | | | | 1,234 |
Lehman Brothers – UBS Commercial Mortgage Trust 07-C6, A2
5.845% due 7/15/40 | | | 500 | | | | 510 |
MASTR Resecuritization Trust 05-1 144A
5.000% due 10/28/34(b) | | | 334 | | | | 317 |
Merrill Lynch Mortgage Trust 06-C1, AM
5.659% due 5/12/39(c) | | | 700 | | | | 705 |
Morgan Stanley Capital I 06-T23, A4
5.811% due 8/12/41(c) | | | 790 | | | | 822 |
Residential Accredit Loans, Inc. 06-QA1, A21
5.966% due 1/25/36(c) | | | 1,243 | | | | 1,239 |
Residential Funding Mortgage Securities I, Inc. 05-SA1, 2A
4.856% due 3/25/35(c) | | | 773 | | | | 764 |
Structured Asset Securities Corp. 03-32, 1A1
5.210% due 11/25/33(c) | | | 588 | | | | 576 |
Timberstar Trust 06-1A, A 144A
5.668% due 10/15/36(b) | | | 675 | | | | 655 |
Wells Fargo Mortgage Backed Securities Trust 04-EE, 2A3
3.989% due 12/25/34(c) | | | 561 | | | | 555 |
Wells Fargo Mortgage Backed Securities Trust 05-14, 2A1
5.500% due 12/25/35 | | | 1,325 | | | | 1,296 |
Wells Fargo Mortgage Backed Securities Trust 05-5, 1A1
5.000% due 5/25/20 | | | 1,176 | | | | 1,158 |
Wells Fargo Mortgage Backed Securities Trust 05-AR10, 2A16
4.109% due 6/25/35(c) | | | 1,000 | | | | 970 |
Wells Fargo Mortgage Backed Securities Trust 05-AR16, 6A3
5.000% due 10/25/35(c) | | | 546 | | | | 545 |
Wells Fargo Mortgage Backed Securities Trust 05-AR4, 2A1
4.524% due 4/25/35(c) | | | 1,343 | | | | 1,336 |
Wells Fargo Mortgage Backed Securities Trust 05-AR4, 2A2
4.524% due 4/25/35(c) | | | 202 | | | | 200 |
Wells Fargo Mortgage Backed Securities Trust 07-AR3, A4
6.067% due 4/25/37(c) | | | 576 | | | | 569 |
| | | | | | | |
Total Non-Agency Mortgage-Backed Securities (Identified Cost $33,074) | | | | | | | 32,983 |
| | | | | | | |
FOREIGN GOVERNMENT SECURITIES—0.9% | | | | | | | |
Australia—0.1% | | | | | | | |
Commonwealth of Australia Series 909
7.500% due 9/15/09 | | | 350 | (g) | | | 310 |
| | | | | | | |
Brazil—0.1% | | | | | | | |
Federative Republic of Brazil
11.000% due 8/17/40 | | | 165 | | | | 221 |
| | | | | | | |
Canada—0.1% | | | | | | | |
Commonwealth of Canada
4.250% due 9/1/09 | | | 295 | (i) | | | 301 |
| | | | | | | |
Germany—0.0% | | | | | | | |
Federal Republic of Germany 144A
3.250% due 4/17/09(b) | | | 55 | (j) | | | 80 |
| | | | | | | |
See Notes to Financial Statements
68
PHOENIX STRATEGIC ALLOCATION SERIES
| | | | | | | |
| | | PAR
VALUE
(000) | | | VALUE
(000) |
Norway—0.1% | | | | | | | |
Kingdom of Norway
5.500% due 5/15/09 | | | 1,900 | (k) | | $ | 354 |
| | | | | | | |
Philippines—0.1% | | | | | | | |
Republic of Philippines
10.625% due 3/16/25 | | $ | 70 | | | | 101 |
7.750% due 1/14/31 | | | 120 | | | | 139 |
| | | | | | | |
| | | | | | | 240 |
| | | | | | | |
Russia—0.1% | | | | | | | |
Russian Federation RegS
7.500% due 3/31/30(c) (e) | | | 297 | | | | 339 |
| | | | | | | |
Sweden—0.1% | | | | | | | |
Kingdom of Sweden Series 1043
5.000% due 1/28/09 | | | 980 | (l) | | | 153 |
| | | | | | | |
Trinidad and Tobago—0.0% | | | | | | | |
Republic of Trinidad and Tobago RegS
9.875% due 10/1/09(e) | | | 115 | | | | 126 |
| | | | | | | |
Turkey—0.1% | | | | | | | |
Republic of Turkey
7.000% due 6/5/20 | | | 190 | | | | 198 |
| | | | | | | |
Ukraine—0.1% | | | | | | | |
Republic of Ukraine 144A
6.580% due 11/21/16(b) | | | 275 | | | | 270 |
| | | | | | | |
Total Foreign Government Securities (Identified Cost $2,357) | | | | | | | 2,592 |
| | | | | | | |
FOREIGN CORPORATE BONDS (d) —3.6% | | | | | | | |
Aruba—0.1% | | | | | | | |
UFJ Finance AEC
6.750% due 7/15/13 | | | 275 | | | | 299 |
| | | | | | | |
Australia—0.3% | | | | | | | |
United Energy Distribution Holdings Property Ltd. 144A
5.450% due 4/15/16(b) | | | 500 | | | | 512 |
Westfield Capital Corp. Ltd./Westfield Finance Authority 144A
5.125% due 11/15/14(b) | | | 355 | | | | 332 |
| | | | | | | |
| | | | | | | 844 |
| | | | | | | |
Brazil—0.2% | | | | | | | |
GTL Trade Finance, Inc. 144A
7.250% due 10/20/17(b) | | | 143 | | | | 145 |
Vale Overseas Ltd.
6.250% due 1/11/16 | | | 230 | | | | 231 |
6.250% due 1/23/17 | | | 115 | | | | 115 |
| | | | | | | |
| | | | | | | 491 |
| | | | | | | |
Canada—0.3% | | | | | | | |
Catalyst Paper Corp .
7.375% due 3/1/14 | | | 180 | | | | 137 |
EnCana Corp.
5.900% due 12/1/17 | | | 135 | | | | 138 |
European Investment Bank 144A
4.600% due 1/30/37(b) | | | 325 | (i) | | | 322 |
Xstrata Canada Corp.
5.500% due 6/15/17 | | | 260 | | | | 252 |
| | | | | | | |
| | | | | | | 849 |
| | | | | | | |
Chile—0.3% | | | | | | | |
Banco Santander Chile 144A
5.375% due 12/9/14(b) | | | 300 | | | | 300 |
Petropower I Funding Trust 144A
7.360% due 2/15/14(b) | | | 418 | | | | 418 |
| | | | | | | |
| | | | | | | 718 |
| | | | | | | |
Germany—0.4% | | | | | | | |
Deutsche Bank AG NY Series GS
4.079% due 3/22/12(c) | | | 1,000 | | | | 999 |
| | | | | | | |
Kazakhstan—0.1% | | | | | | | |
Kazkommerts International BV 144A
7.000% due 11/3/09(b) | | | 175 | | | | 165 |
| | | | | | | |
Luxembourg—0.0% | | | | | | | |
Tyco Electronic Group SA 144A
6.000% due 10/1/12(b) | | | 100 | | | | 103 |
| | | | | | | |
Mexico—0.0% | | | | | | | |
Vitro S.A.B. de C.V.
8.625% due 2/1/12 | | | 55 | | | | 52 |
| | | | | | | |
Philippines—0.1% | | | | | | | |
National Power Corp.
9.625% due 5/15/28 | | | 230 | | | | 279 |
| | | | | | | |
Russia—0.3% | | | | | | | |
Gazprom OAO (Gaz Capital SA) 144A(b)
6.212% due 11/22/16 | | | 230 | | | | 220 |
6.510% due 3/7/22 | | | 125 | | | | 119 |
OJSC AK Transneft (TransCapitalInvest Ltd.) 144A
5.670% due 3/5/14(b) | | | 310 | | | | 297 |
TNK-BP Finance SA RegS
6.125% due 3/20/12(e) | | | 300 | | | | 288 |
| | | | | | | |
| | | | | | | 924 |
| | | | | | | |
Singapore—0.2% | | | | | | | |
DBS Bank Ltd. 144A
5.000% due 11/15/19(b) (c) | | | 525 | | | | 495 |
| | | | | | | |
South Korea—0.1% | | | | | | | |
Export-Import Bank of Korea
5.500% due 10/17/12 | | | 250 | | | | 251 |
| | | | | | | |
Switzerland—0.1% | | | | | | | |
Petroplus Finance Ltd. 144A
6.750% due 5/1/14(b) | | | 150 | | | | 140 |
| | | | | | | |
Turkey—0.1% | | | | | | | |
Bosphorus Financial Services Ltd. 144A
6.669% due 2/15/12(b) (c) | | | 400 | | | | 396 |
| | | | | | | |
United Arab Emirates—0.2% | | | | | | | |
Abu Dhabi National Energy Co. 144A(b)
5.620% due 10/25/12 | | | 180 | | | $ | 183 |
5.875% due 10/27/16 | | | 305 | | | | 298 |
| | | | | | | |
| | | | | | | 481 |
| | | | | | | |
United Kingdom—0.6% | | | | | | | |
Diageo Capital plc
5.500% due 9/30/16 | | | 250 | | | | 248 |
HBOS plc 144A
5.375% due 11/29/49(b) (c) | | | 1,000 | | | | 912 |
Tate & Lyle International Finance plc 144A
6.625% due 6/15/16(b) | | | 275 | | | | 292 |
Vodafone Group plc
5.000% due 9/15/15 | | | 150 | | | | 145 |
6.150% due 2/27/37 | | | 145 | | | | 143 |
| | | | | | | |
| | | | | | | 1,740 |
| | | | | | | |
United States—0.1% | | | | | | | |
Nova Chemicals Corp.
7.863% due 11/15/13(c) | | | 195 | | | | 183 |
| | | | | | | |
Venezuela—0.1% | | | | | | | |
Petroleos de Venezuela S.A. RegS
5.250% due 4/12/17(e) | | | 375 | | | | 267 |
| | | | | | | |
Total Foreign Corporate Bonds (Identified Cost $9,865) | | | | | | | 9,676 |
| | | | | | | |
DOMESTIC LOAN AGREEMENTS(c) —1.2% | | | | | | | |
Advertising—0.0% | | | | | | | |
Lamar Media Corp. Tranche F
6.646% due 3/31/14 | | | 40 | | | | 40 |
| | | | | | | |
Alternative Carriers—0.0% | | | | | | | |
Level 3 Communications, Inc. Tranche B
7.493% due 3/13/14 | | | 18 | | | | 17 |
| | | | | | | |
Automobile Manufacturers—0.1% | | | | | | | |
Ford Motor Co. Tranche B
8.000% due 12/15/13 | | | 298 | | | | 277 |
| | | | | | | |
Automotive Retail—0.1% | | | | | | | |
Hertz Corp. Letter of Credit
7.110% due 12/21/12 | | | 45 | | | | 44 |
Hertz Corp. Tranche B
7.110% due 12/21/12 | | | 254 | | | | 249 |
| | | | | | | |
| | | | | | | 293 |
| | | | | | | |
Broadcasting & Cable TV—0.1% | | | | | | | |
Charter Communications Operating LLC Tranche B
7.060% due 3/6/14 | | | 275 | | | | 257 |
| | | | | | | |
Data Processing & Outsourced Services—0.1% | | | | | | | |
First Data Corp. Tranche B3
7.710% due 9/24/14 | | | 400 | | | | 381 |
| | | | | | | |
Diversified Metals & Mining—0.1% | | | | | | | |
Compass Minerals Group, Inc. Tranche B
6.687% due 12/22/12 | | | 171 | | | | 167 |
| | | | | | | |
See Notes to Financial Statements
69
PHOENIX STRATEGIC ALLOCATION SERIES
| | | | | | | |
| | | PAR
VALUE
(000) | | | VALUE
(000) |
Electric Utilities—0.0% | | | | | | | |
Energy Future Holdings Tranche B2
8.645% due 10/10/14 | | $ | 73 | | | $ | 72 |
| | | | | | | |
Environmental & Facilities Services—0.1% | | | | | | | |
Allied Waste North America, Inc. Letter of Credit A
6.621% due 3/28/14 | | | 131 | | | | 126 |
Allied Waste North America, Inc. Tranche B
6.390% due 3/28/14 | | | 220 | | | | 211 |
| | | | | | | |
| | | | | | | 337 |
| | | | | | | |
Health Care Facilities—0.0% | | | | | | | |
Health Management Associates, Inc. Tranche B
6.800% due 2/28/14 | | | 40 | | | | 37 |
| | | | | | | |
Housewares & Specialties—0.1% | | | | | | | |
Yankee Candle Co., Inc. Tranche B
8.891% due 2/6/14 | | | 200 | | | | 188 |
| | | | | | | |
Oil & Gas Drilling—0.0% | | | | | | | |
Hercules Offshore, Inc. Tranche
7.110% due 7/11/13 | | | 60 | | | | 58 |
| | | | | | | |
Oil & Gas Equipment & Services—0.0% | | | | | | | |
Helix Energy Solutions Group, Inc. Tranche
8.360% due 7/1/13 | | | 67 | | | | 64 |
| | | | | | | |
Paper Products—0.1% | | | | | | | |
Georgia-Pacific Corp. Tranche B1
7.150% due 12/20/12 | | | 299 | | | | 286 |
| | | | | | | |
Publishing—0.1% | | | | | | | |
Idearc, Inc. Tranche B
7.360% due 11/17/14 | | | 299 | | | | 286 |
| | | | | | | |
Restaurants—0.1% | | | | | | | |
Burger King Corp. Tranche B1
6.750% due 6/30/12 | | | 121 | | | | 119 |
| | | | | | | |
Specialized Finance—0.1% | | | | | | | |
Solar Capital Corp. Tranche US
8.818% due 2/28/14 | | | 299 | | | | 290 |
| | | | | | | |
Wireless Telecommunication Services—0.1% | | | | | | | |
ALLTEL Communications, Inc. Tranche B3
9.029% due 5/15/15 | | | 160 | | | | 154 |
| | | | | | | |
Total Domestic Loan Agreements (Identified Cost $3,409) | | | | | | | 3,323 |
| | | | | | | |
FOREIGN LOAN AGREEMENTS(c) —0.0% | | | | | | | |
United States—0.0% | | | | | | | |
Bausch & Lomb, Inc. Tranche
8.127% due 10/26/15 | | | 24 | (j) | | | 35 |
| | | | | | | |
Total Foreign Loan Agreements (Identified Cost $34) | | | | | | | 35 |
| | | | | | | |
| | |
| | | SHARES | | | VALUE
(000) |
DOMESTIC COMMON STOCKS—56.8% | | | | | | | |
Aerospace & Defense—3.0% | | | | | | | |
Boeing Co. (The) | | | 20,100 | | | $ | 1,758 |
General Dynamics Corp. | | | 4,700 | | | | 418 |
Honeywell International, Inc. | | | 16,700 | | | | 1,028 |
Lockheed Martin Corp. | | | 12,900 | | | | 1,358 |
Northrop Grumman Corp. | | | 8,000 | | | | 629 |
Raytheon Co. | | | 8,900 | | | | 540 |
United Technologies Corp. | | | 30,700 | | | | 2,350 |
| | | | | | | |
| | | | | | | 8,081 |
| | | | | | | |
Air Freight & Logistics—0.1% | | | | | | | |
United Parcel Service, Inc. Class B | | | 5,100 | | | | 361 |
| | | | | | | |
Airlines—0.1% | | | | | | | |
AMR Corp.(f) | | | 10,500 | | | | 147 |
Continental Airlines, Inc. Class B(f) | | | 3,600 | | | | 80 |
| | | | | | | |
| | | | | | | 227 |
| | | | | | | |
Apparel Retail—0.3% | | | | | | | |
Aeropostale, Inc.(f) | | | 6,650 | | | | 177 |
Gap, Inc. (The) | | | 23,600 | | | | 502 |
Men’s Wearhouse, Inc. (The) | | | 4,300 | | | | 116 |
| | | | | | | |
| | | | | | | 795 |
| | | | | | | |
Apparel, Accessories & Luxury Goods—0.1% | | | | | | | |
VF Corp. | | | 5,000 | | | | 343 |
| | | | | | | |
Application Software—0.1% | | | | | | | |
Aspen Technology, Inc.(f) | | | 16,800 | | | | 273 |
| | | | | | | |
Asset Management & Custody Banks—2.0% | | | | | | | |
Ameriprise Financial, Inc. | | | 4,000 | | | | 221 |
Bank of New York Mellon Corp. (The) | | | 25,157 | | | | 1,227 |
Federated Investors, Inc. Class B | | | 8,600 | | | | 354 |
Franklin Resources, Inc. | | | 5,000 | | | | 572 |
Legg Mason, Inc. | | | 6,400 | | | | 468 |
Northern Trust Corp. | | | 10,500 | | | | 804 |
SEI Investments Co. | | | 12,600 | | | | 405 |
State Street Corp. | | | 15,100 | | | | 1,226 |
| | | | | | | |
| | | | | | | 5,277 |
| | | | | | | |
Auto Parts & Equipment—0.2% | | | | | | | |
American Axle & Manufacturing Holdings, Inc. | | | 5,300 | | | | 99 |
Lear Corp.(f) | | | 17,300 | | | | 478 |
| | | | | | | |
| | | | | | | 577 |
| | | | | | | |
Automobile Manufacturers—0.1% | | | | | | | |
Thor Industries, Inc. | | | 4,800 | | | | 183 |
| | | | | | | |
Biotechnology—0.4% | | | | | | | |
Cephalon, Inc.(f) | | | 2,000 | | | | 144 |
OSI Pharmaceuticals, Inc.(f) | | | 17,800 | | | | 863 |
| | | | | | | |
| | | | | | | 1,007 |
| | | | | | | |
Brewers—0.4% | | | | | | | |
Anheuser-Busch Cos., Inc. | | | 20,300 | | | | 1,063 |
| | | | | | | |
Broadcasting & Cable TV—0.4% | | | | | | | |
CBS Corp. Class B | | | 35,310 | | | | 962 |
| | | | | | | |
Building Products—0.1% | | | | | | | |
Masco Corp. | | | 15,600 | | | | 337 |
| | | | | | | |
Coal & Consumable Fuels—0.2% | | | | | | | |
Massey Energy Co. | | | 18,400 | | | | 658 |
| | | | | | | |
Commercial Printing—0.2% | | | | | | | |
RR Donnelley & Sons Co. | | | 12,700 | | | | 479 |
| | | | | | | |
Communications Equipment—1.0% | | | | | | | |
Cisco Systems, Inc.(f) | | | 101,700 | | | | 2,753 |
| | | | | | | |
Computer & Electronics Retail—0.1% | | | | | | | |
RadioShack Corp. | | | 11,900 | | | | 201 |
| | | | | | | |
Computer Hardware—2.3% | | | | | | | |
Hewlett-Packard Co. | | | 52,650 | | | | 2,658 |
International Business Machines Corp. | | | 32,300 | | | | 3,491 |
NCR Corp.(f) | | | 3,100 | | | | 78 |
| | | | | | | |
| | | | | | | 6,227 |
| | | | | | | |
Computer Storage & Peripherals—0.3% | | | | | | | |
Emulex Corp.(f) | | | 18,400 | | | | 300 |
Network Appliance, Inc.(f) | | | 10,100 | | | | 252 |
QLogic Corp.(f) | | | 10,100 | | | | 144 |
| | | | | | | |
| | | | | | | 696 |
| | | | | | | |
Construction & Engineering—0.0% | | | | | | | |
Perini Corp.(f) | | | 1,700 | | | | 70 |
| | | | | | | |
Construction & Farm Machinery & Heavy Trucks—0.4% | | | | | | | |
AGCO Corp.(f) | | | 7,200 | | | | 489 |
Cummins, Inc. | | | 1,200 | | | | 153 |
Toro Co. (The) | | | 6,700 | | | | 365 |
| | | | | | | |
| | | | | | | 1,007 |
| | | | | | | |
Data Processing & Outsourced Services—0.8% | | | | | | | |
Automatic Data Processing, Inc. | | | 15,000 | | | | 668 |
Computer Sciences Corp.(f) | | | 7,900 | | | | 391 |
Electronic Data Systems Corp. | | | 23,300 | | | | 483 |
Fiserv, Inc.(f) | | | 13,200 | | | | 732 |
| | | | | | | |
| | | | | | | 2,274 |
| | | | | | | |
Diversified Banks—0.7% | | | | | | | |
Comerica, Inc. | | | 6,100 | | | | 266 |
Wells Fargo & Co. | | | 55,400 | | | | 1,672 |
| | | | | | | |
| | | | | | | 1,938 |
| | | | | | | |
Diversified Chemicals—0.5% | | | | | | | |
Dow Chemical Co. (The) | | | 12,700 | | | | 501 |
du Pont (E.I.) de Nemours & Co. | | | 20,200 | | | | 890 |
| | | | | | | |
| | | | | | | 1,391 |
| | | | | | | |
See Notes to Financial Statements
70
PHOENIX STRATEGIC ALLOCATION SERIES
| | | | | |
| | | | | VALUE |
| | | SHARES | | (000) |
Diversified Commercial & Professional Services—0.2% | | | | | |
Dun & Bradstreet Corp. | | 4,500 | | $ | 399 |
| | | | | |
Diversified Metals & Mining—0.3% | | | | | |
Freeport-McMoRan Copper & Gold, Inc. (Indonesia)(d) | | 2,800 | | | 287 |
Southern Copper Corp. | | 4,300 | | | 452 |
| | | | | |
| | | | | 739 |
| | | | | |
Electric Utilities—0.7% | | | | | |
FirstEnergy Corp. | | 26,200 | | | 1,895 |
| | | | | |
Electrical Components & Equipment—0.6% | | | | | |
Emerson Electric Co. | | 27,600 | | | 1,564 |
GrafTech International Ltd.(f) | | 6,100 | | | 108 |
| | | | | |
| | | | | 1,672 |
| | | | | |
Electronic Equipment Manufacturers—0.3% | | | | | |
Agilent Technologies, Inc.(f) | | 18,300 | | | 672 |
| | | | | |
Electronic Manufacturing Services—0.2% | | | | | |
Tyco Electronics Ltd. | | 15,500 | | | 576 |
| | | | | |
Fertilizers & Agricultural Chemicals—0.0% | | | | | |
Terra Industries, Inc.(f) | | 2,400 | | | 115 |
| | | | | |
Food Retail—0.3% | | | | | |
Kroger Co. (The) | | 17,500 | | | 467 |
SUPERVALU, Inc. | | 6,500 | | | 244 |
| | | | | |
| | | | | 711 |
| | | | | |
Footwear—0.4% | | | | | |
NIKE, Inc. Class B | | 14,900 | | | 957 |
| | | | | |
General Merchandise Stores—0.1% | | | | | |
Big Lots, Inc.(f) | | 10,700 | | | 171 |
Family Dollar Stores, Inc. | | 10,100 | | | 194 |
| | | | | |
| | | | | 365 |
| | | | | |
Health Care Distributors—0.6% | | | | | |
Cardinal Health, Inc. | | 12,100 | | | 699 |
McKesson Corp. | | 15,500 | | | 1,015 |
| | | | | |
| | | | | 1,714 |
| | | | | |
Health Care Equipment—0.3% | | | | | |
Baxter International, Inc. | | 15,100 | | | 877 |
| | | | | |
Health Care Services—0.1% | | | | | |
Medco Health Solutions, Inc.(f) | | 3,800 | | | 385 |
| | | | | |
Home Improvement Retail—0.4% | | | | | |
Sherwin-Williams Co. (The) | | 17,000 | | | 987 |
| | | | | |
Household Appliances—0.2% | | | | | |
Stanley Works (The) | | 5,700 | | | 276 |
Whirlpool Corp. | | 3,100 | | | 253 |
| | | | | |
| | | | | 529 |
| | | | | |
Household Products—0.7% | | | | | |
Clorox Co. (The) | | 14,300 | | | 932 |
Kimberly-Clark Corp. | | 5,500 | | | 381 |
Procter & Gamble Co. (The) | | 8,700 | | | 639 |
| | | | | |
| | | | | 1,952 |
| | | | | |
Housewares & Specialties—0.2% | | | | | |
American Greetings Corp. Class A | | 6,000 | | | 122 |
Newell Rubbermaid, Inc. | | 12,600 | | | 326 |
| | | | | |
| | | | | 448 |
| | | | | |
Hypermarkets & Super Centers—0.4% | | | | | |
BJ’s Wholesale Club, Inc.(f) | | 8,200 | | | 277 |
Wal-Mart Stores, Inc. | | 17,900 | | | 851 |
| | | | | |
| | | | | 1,128 |
| | | | | |
Industrial Conglomerates—0.5% | | | | | |
Teleflex, Inc. | | 3,400 | | | 215 |
Tyco International Ltd. | | 28,000 | | | 1,110 |
| | | | | |
| | | | | 1,325 |
| | | | | |
Industrial Machinery—0.9% | | | | | |
Dover Corp. | | 3,900 | | | 180 |
Eaton Corp. | | 13,200 | | | 1,280 |
Gardner Denver, Inc.(f) | | 5,000 | | | 165 |
Parker Hannifin Corp. | | 8,950 | | | 674 |
| | | | | |
| | | | | 2,299 |
| | | | | |
Insurance Brokers—0.2% | | | | | |
AON Corp. | | 11,300 | | | 539 |
| | | | | |
Integrated Oil & Gas—5.3% | | | | | |
Chevron Corp. | | 14,200 | | | 1,325 |
ConocoPhillips | | 19,100 | | | 1,687 |
Exxon Mobil Corp. | | 75,800 | | | 7,102 |
Marathon Oil Corp. | | 8,500 | | | 517 |
Occidental Petroleum Corp. | | 49,400 | | | 3,803 |
| | | | | |
| | | | | 14,434 |
| | | | | |
Integrated Telecommunication Services—2.2% | | | | | |
AT&T, Inc. | | 100,457 | | | 4,175 |
Qwest Communications International, Inc.(f) | | 39,600 | | | 277 |
Verizon Communications, Inc. | | 21,100 | | | 922 |
Windstream Corp. | | 47,600 | | | 620 |
| | | | | |
| | | | | 5,994 |
| | | | | |
Internet Retail—0.2% | | | | | |
Expedia, Inc.(f) | | 4,700 | | | 148 |
IAC/InterActiveCorp.(f) | | 9,500 | | | 256 |
| | | | | |
| | | | | 404 |
| | | | | |
Internet Software & Services—0.4% | | | | | |
eBay, Inc.(f) | | 30,300 | | | 1,006 |
| | | | | |
Investment Banking & Brokerage—0.7% | | | | | |
Charles Schwab Corp. (The) | | 15,400 | | | 394 |
Goldman Sachs Group, Inc. (The) | | 5,600 | | | 1,204 |
TD Ameritrade Holding Corp.(f) | | 16,700 | | | 335 |
| | | | | |
| | | | | 1,933 |
| | | | | |
Leisure Products—0.0% | | | | | |
Hasbro, Inc. | | 5,000 | | | 128 |
| | | | | |
Life & Health Insurance—2.3% | | | | | |
AFLAC, Inc. | | 11,900 | | | 745 |
Lincoln National Corp. | | 15,100 | | | 879 |
MetLife, Inc. | | 33,500 | | | 2,064 |
Principal Financial Group, Inc. (The) | | 13,200 | | | 909 |
Prudential Financial, Inc. | | 15,300 | | | 1,424 |
StanCorp Financial Group, Inc. | | 2,800 | | | 141 |
Unum Group | | 4,900 | | | 117 |
| | | | | |
| | | | | 6,279 |
| | | | | |
Life Sciences Tools & Services—0.1% | | | | | |
Invitrogen Corp.(f) | | 3,800 | | | 355 |
| | | | | |
Managed Health Care—1.7% | | | | | |
Aetna, Inc. | | 18,400 | | | 1,062 |
CIGNA Corp. | | 11,900 | | | 639 |
Coventry Health Care, Inc.(f) | | 2,900 | | | 172 |
UnitedHealth Group, Inc. | | 29,650 | | | 1,726 |
WellPoint, Inc.(f) | | 11,900 | | | 1,044 |
| | | | | |
| | | | | 4,643 |
| | | | | |
Metal & Glass Containers—0.1% | | | | | |
Ball Corp. | | 3,200 | | | 144 |
Owens-Illinois, Inc.(f) | | 4,500 | | | 223 |
| | | | | |
| | | | | 367 |
| | | | | |
Mortgage REITs—0.3% | | | | | |
Annaly Capital Management, Inc. | | 39,900 | | | 725 |
CapitalSource, Inc. | | 5,200 | | | 92 |
| | | | | |
| | | | | 817 |
| | | | | |
Movies & Entertainment—1.6% | | | | | |
Time Warner, Inc. | | 76,200 | | | 1,258 |
Viacom, Inc. Class B(f) | | 34,400 | | | 1,511 |
Walt Disney Co. (The) | | 52,100 | | | 1,682 |
| | | | | |
| | | | | 4,451 |
| | | | | |
Multi-line Insurance—1.1% | | | | | |
American International Group, Inc. | | 45,700 | | | 2,664 |
Hartford Financial Services Group, Inc. (The) | | 2,500 | | | 218 |
| | | | | |
| | | | | 2,882 |
| | | | | |
See Notes to Financial Statements
71
PHOENIX STRATEGIC ALLOCATION SERIES
| | | | | |
| | | | | VALUE |
| | | SHARES | | (000) |
Multi-Utilities—0.5% | | | | | |
Public Service Enterprise Group, Inc. | | 13,500 | | $ | 1,326 |
| | | | | |
| | | | | |
Office Electronics—0.0% | | | | | |
Xerox Corp. | | 7,500 | | | 121 |
| | | | | |
Oil & Gas Drilling—0.5% | | | | | |
ENSCO International, Inc. | | 3,200 | | | 191 |
Transocean, Inc. | | 7,500 | | | 1,073 |
| | | | | |
| | | | | 1,264 |
| | | | | |
Oil & Gas Equipment & Services—0.7% | | | | | |
Dresser-Rand Group, Inc.(f) | | 6,800 | | | 266 |
National Oilwell Varco, Inc.(f) | | 15,300 | | | 1,124 |
Tidewater, Inc. | | 7,200 | | | 395 |
| | | | | |
| | | | | 1,785 |
| | | | | |
Oil & Gas Exploration & Production—0.2% | | | | | |
Devon Energy Corp. | | 1,500 | | | 133 |
Noble Energy, Inc. | | 1,800 | | | 143 |
W&T Offshore, Inc. | | 10,700 | | | 321 |
| | | | | |
| | | | | 597 |
| | | | | |
Oil & Gas Refining & Marketing—0.3% | | | | | |
Holly Corp. | | 3,300 | | | 168 |
Valero Energy Corp. | | 8,400 | | | 588 |
| | | | | |
| | | | | 756 |
| | | | | |
Other Diversified Financial Services—2.9% | | | | | |
Bank of America Corp. | | 93,600 | | | 3,862 |
Citigroup, Inc. | | 9,600 | | | 283 |
JPMorgan Chase & Co. | | 84,800 | | | 3,701 |
| | | | | |
| | | | | 7,846 |
| | | | | |
Packaged Foods & Meats—0.2% | | | | | |
General Mills, Inc. | | 9,600 | | | 547 |
| | | | | |
Paper Packaging—0.1% | | | | | |
Packaging Corporation of America | | 13,100 | | | 369 |
| | | | | |
Personal Products—0.2% | | | | | |
NBTY, Inc.(f) | | 17,800 | | | 488 |
| | | | | |
Pharmaceuticals—4.0% | | | | | |
Abbott Laboratories | | 7,000 | | | 393 |
Bristol-Myers Squibb Co. | | 13,300 | | | 353 |
Endo Pharmaceuticals Holdings, Inc.(f) | | 8,300 | | | 221 |
Forest Laboratories, Inc.(f) | | 13,200 | | | 481 |
Johnson & Johnson | | 52,100 | | | 3,475 |
Merck & Co., Inc. | | 52,300 | | | 3,039 |
Pfizer, Inc. | | 115,900 | | | 2,634 |
Wyeth | | 8,000 | | | 354 |
| | | | | |
| | | | | 10,950 |
| | | | | |
Photographic Products—0.1% | | | | | |
Eastman Kodak Co. | | 9,700 | | | 212 |
| | | | | |
Property & Casualty Insurance—0.8% | | | | | |
Chubb Corp. (The) | | 5,900 | | | 322 |
Cincinnati Financial Corp. | | 5,400 | | | 214 |
Philadelphia Consolidated Holding Co.(f) | | 3,200 | | | 126 |
Travelers Cos., Inc. (The) | | 27,400 | | | 1,474 |
| | | | | |
| | | | | 2,136 |
| | | | | |
Railroads—0.1% | | | | | |
Norfolk Southern Corp. | | 7,100 | | | 358 |
| | | | | |
Real Estate Management & Development—0.0% | | | | | |
Jones Lang LaSalle, Inc. | | 1,000 | | | 71 |
| | | | | |
Regional Banks—0.3% | | | | | |
Bank of Hawaii Corp. | | 1,900 | | | 97 |
KeyCorp | | 12,200 | | | 286 |
Regions Financial Corp. | | 14,500 | | | 343 |
SunTrust Banks, Inc. | | 3,100 | | | 194 |
| | | | | |
| | | | | 920 |
| | | | | |
Restaurants—1.1% | | | | | |
McDonald’s Corp. | | 36,000 | | | 2,121 |
Yum! Brands, Inc. | | 22,900 | | | 876 |
| | | | | |
| | | | | 2,997 |
| | | | | |
Semiconductor Equipment—0.6% | | | | | |
Applied Materials, Inc. | | 43,400 | | | 771 |
Lam Research Corp.(f) | | 4,600 | | | 199 |
MEMC Electronic Materials, Inc.(f) | | 3,600 | | | 319 |
Novellus Systems, Inc.(f) | | 13,000 | | | 358 |
| | | | | |
| | | | | 1,647 |
| | | | | |
Semiconductors—1.2% | | | | | |
Amkor Technology, Inc.(f) | | 15,400 | | | 131 |
Integrated Device Technology, Inc.(f) | | 21,800 | | | 246 |
Intel Corp. | | 48,000 | | | 1,280 |
NVIDIA Corp.(f) | | 16,950 | | | 577 |
Texas Instruments, Inc. | | 29,300 | | | 979 |
| | | | | |
| | | | | 3,213 |
| | | | | |
Soft Drinks—0.9% | | | | | |
Coca-Cola Co. (The) | | 22,500 | | | 1,381 |
Pepsi Bottling Group, Inc. (The) | | 28,900 | | | 1,140 |
| | | | | |
| | | | | 2,521 |
| | | | | |
Specialized REITs—0.2% | | | | | |
FelCor Lodging Trust, Inc. | | 14,600 | | | 228 |
Host Hotels & Resorts, Inc. | | 12,300 | | | 209 |
| | | | | |
| | | | | 437 |
| | | | | |
Specialty Chemicals—0.1% | | | | | |
H.B. Fuller Co. | | 7,800 | | | 175 |
| | | | | |
Steel—0.2% | | | | | |
AK Steel Holding Corp.(f) | | 11,000 | | | 509 |
| | | | | |
Systems Software—3.0% | | | | | |
BMC Software, Inc.(f) | | 8,800 | | | 314 |
McAfee, Inc.(f) | | 4,100 | | | 154 |
Microsoft Corp. | | 147,700 | | | 5,258 |
Oracle Corp.(f) | | 75,800 | | | 1,711 |
Symantec Corp.(f) | | 39,200 | | | 633 |
| | | | | |
| | | | | 8,070 |
| | | | | |
Technology Distributors—0.0% | | | | | |
Arrow Electronics, Inc.(f) | | 2,600 | | | 102 |
| | | | | |
Tobacco—1.0% | | | | | |
Altria Group, Inc. | | 15,060 | | | 1,138 |
Loews Corp. – Carolina Group | | 14,500 | | | 1,237 |
Reynolds American, Inc. | | 2,400 | | | 158 |
Universal Corp. | | 4,700 | | | 241 |
| | | | | |
| | | | | 2,774 |
| | | | | |
Wireless Telecommunication Services—0.2% | | | | | |
Sprint Nextel Corp. | | 40,900 | | | 537 |
| | | | | |
Total Domestic Common Stocks (Identified Cost $125,883) | | | | | 153,885 |
| | | | | |
FOREIGN COMMON STOCKS(d) —0.6% | | | | | |
Computer Storage & Peripherals—0.1% | | | | | |
Seagate Technology (Singapore) | | 15,100 | | | 385 |
| | | | | |
Industrial Machinery—0.1% | | | | | |
Ingersoll-Rand Co., Ltd. Class A (United States) | | 3,400 | | | 158 |
| | | | | |
IT Consulting & Other Services—0.3% | | | | | |
Accenture Ltd. Class A (United States) | | 23,300 | | | 840 |
| | | | | |
Property & Casualty Insurance—0.1% | | | | | |
XL Capital Ltd. Class A (United States) | | 6,600 | | | 332 |
| | | | | |
Total Foreign Common Stocks (Identified Cost $1,980) | | | | | 1,715 |
| | | | | |
TOTAL LONG TERM INVESTMENTS—98.5% (Identified cost $239,195) | | | | | 266,656 |
| | | | | |
SHORT-TERM INVESTMENTS—1.3% | | | | | |
Money Market Mutual Funds—0.1% | | | | | |
State Street Navigator Prime Plus (4.88% seven-day effective yield)(n) | | 174 | | | 174 |
| | | | | |
See Notes to Financial Statements
72
PHOENIX STRATEGIC ALLOCATION SERIES
| | | | | | | |
| | | PAR | | | |
| | | VALUE | | VALUE | |
| | | (000) | | (000) | |
Commercial Paper(o)—1.2% | | | | | | | |
Eaton Corp.
4.250% due 1/2/08 | | $ | 2,420 | | $ | 2,420 | |
Archer-Daniels-Midland Co.
4.380% due 1/31/08 | | | 1,000 | | | 996 | |
| | | | | | | |
| | | | | | 3,416 | |
| | | | | | | |
Total Short-Term Investments (Identified Cost $3,590) | | | | | | 3,590 | |
| | | | | | | |
TOTAL INVESTMENTS—99.8% (Identified Cost $242,785) | | | | | | 270,246 | (a) |
Other assets and liabilities, net—0.2% | | | | | | 407 | |
| | | | | | | |
NET ASSETS—100.0% | | | | | $ | 270,653 | |
| | | | | | | |
(a) | Federal Income Tax Information (reported in 000’s): Net unrealized appreciation of investment securities is comprised of gross appreciation of $34,305 and gross depreciation of $7,128 for federal income tax purposes. At December 31, 2007, the aggregate cost of securities for federal income tax purposes was $243,069. |
(b) | Security exempt from registration under Rule 144A of the Securities Act of 1933. These securities may be resold in transactions exempt from registration, normally to qualified institutional buyers. At December 31, 2007, these securities amounted to a value of $13,178 (reported in 000’s) or 4.9% of net assets. |
(c) | Variable or step coupon security; interest rate shown reflects the rate currently in effect. |
(d) | A security is considered to be foreign if the security is issued in a foreign country. The country of risk, noted in the header, or parenthetically, is determined based on criteria described in Note 2G, “Foreign security country determination” in the Notes to Financial Statements. |
(e) | Regulation S security. Security is offered and sold outside of the United States, therefore, it is exempt from registration with the SEC under rules 903 and 904 of the Securities Act of 1933. |
(g) | Par value represents Australian Dollar. |
(h) | Par value represents Brazilian Real. |
(i) | Par value represents Canadian Dollar. |
(j) | Par value represents Euro. |
(k) | Par value represents Norwegian Krone. |
(l) | Par value represents Swedish Krona. |
(m) | All or a portion of security is on loan. |
(n) | Represents security purchased with cash collateral received for securities on loan. |
(o) | The rate shown is the discount rate. |
See Notes to Financial Statements
73
PHOENIX-ABERDEEN INTERNATIONAL SERIES
SCHEDULE OF INVESTMENTS
DECEMBER 31 2007
| | | | | |
| | | | | VALUE |
| | | SHARES | | (000) |
FOREIGN COMMON STOCKS(b) —94.5% | | | | | |
Argentina—2.0% | | | | | |
Tenaris S.A. ADR (Oil & Gas Equipment & Services) | | 227,500 | | $ | 10,176 |
| | | | | |
Belgium—3.5% | | | | | |
Belgacom SA (Integrated Telecommunication Services) | | 351,000 | | | 17,294 |
| | | | | |
Brazil—4.3% | | | | | |
Petroleo Brasileiro S.A. ADR (Integrated Oil & Gas) | | 224,900 | | | 21,640 |
| | | | | |
France—1.3% | | | | | |
PSA Peugeot Citroen SA (Automobile Manufacturers)(c) | | 88,300 | | | 6,691 |
| | | | | |
Germany—12.3% | | | | | |
adidas AG (Apparel, Accessories & Luxury Goods) | | 148,100 | | | 11,012 |
Commerzbank AG (Diversified Banks) | | 260,900 | | | 9,926 |
Deutsche Post AG Registered Shares (Air Freight & Logistics) | | 189,100 | | | 6,493 |
Deutsche Postbank AG (Diversified Banks) | | 144,800 | | | 12,883 |
E.ON AG (Electric Utilities) | | 100,300 | | | 21,323 |
| | | | | |
| | | | | 61,637 |
| | | | | |
Hong Kong—5.3% | | | | | |
CLP Holdings Ltd. (Electric Utilities) | | 1,485,000 | | | 10,089 |
Swire Pacific Ltd. Class B (Multi-Sector Holdings) | | 6,305,000 | | | 16,658 |
| | | | | |
| | | | | 26,747 |
| | | | | |
India—1.0% | | | | | |
ICICI Bank Ltd. Sponsored ADR (Diversified Banks) | | 82,700 | | | 5,086 |
| | | | | |
Italy—5.5% | | | | | |
ENI S.p.A. (Integrated Oil & Gas) | | 405,600 | | | 14,803 |
Intesa Sanpaolo S.p.A. (Diversified Banks) | | 1,618,000 | | | 12,733 |
| | | | | |
| | | | | 27,536 |
| | | | | |
Japan—16.8% | | | | | |
Bank of Kyoto Ltd. (The) (Regional Banks)(c) | | 372,000 | | | 4,401 |
Canon, Inc. (Office Electronics) | | 299,250 | | | 13,696 |
Daito Trust Construction Co. Ltd. (Homebuilding) | | 288,500 | | | 15,828 |
Mitsubishi UFJ Financial Group, Inc. (Diversified Banks) | | 1,036,900 | | | 9,778 |
ORIX Corp. (Consumer Finance) | | 47,800 | | | 8,039 |
Seven and I Holdings Co., Ltd. (Food Retail) | | 267,000 | | | 7,757 |
Takeda Pharmaceutical Co., Ltd. (Pharmaceuticals) | | 214,600 | | | 12,537 |
Toyota Motor Corp. (Automobile Manufacturers) | | 229,300 | | | 12,212 |
| | | | | |
| | | | | 84,248 |
| | | | | |
Mexico—2.4% | | | | | |
Grupo Aeroportuario del Sureste S.A. de C.V. ADR (Airport Services) | | 194,500 | | | 11,907 |
| | | | | |
Netherlands—1.5% | | | | | |
Koninklijke Philips Electronics N.V. (Industrial Conglomerates) | | 176,700 | | | 7,572 |
| | | | | |
Portugal—2.5% | | | | | |
Portugal Telecom SGPS S.A. (Integrated Telecommunication Services) | | 949,000 | | | 12,447 |
| | | | | |
Singapore—2.4% | | | | | |
Oversea-Chinese Banking Corp., Ltd. (Diversified Banks) | | 2,127,800 | | | 12,127 |
| | | | | |
Spain—2.0% | | | | | |
Corporacion Mapfre SA (Multi-line Insurance) | | 2,246,600 | | | 9,857 |
| | | | | |
Sweden—3.9% | | | | | |
Nordea Bank AB (Diversified Banks) | | 613,200 | | | 10,276 |
Telefonaktiebolaget LM Ericsson Class B (Communications Equipment) | | 3,888,700 | | | 9,102 |
| | | | | |
| | | | | 19,378 |
| | | | | |
Switzerland—5.6% | | | | | |
Nestle S.A. Registered Shares (Packaged Foods & Meats) | | 17,675 | | | 8,116 |
Zurich Financial Services AG Registered Shares (Multi-line Insurance) | | 68,050 | | | 19,972 |
| | | | | |
| | | | | 28,088 |
| | | | | |
Taiwan—2.5% | | | | | |
Taiwan Semiconductor Manufacturing Co., Ltd. Sponsored ADR (Semiconductors) | | 1,269,432 | | | 12,644 |
| | | | | |
United Kingdom—19.7% | | | | | |
AstraZeneca plc (Pharmaceuticals) | | 219,500 | | | 9,448 |
British American Tobacco plc (Tobacco) | | 248,400 | | | 9,711 |
Centrica plc (Multi-Utilities) | | 2,017,500 | | | 14,371 |
Morrison (WM) Supermarkets plc (Food Retail) | | 1,267,600 | | | 8,099 |
Premier Foods plc (Packaged Foods & Meats) | | 3,512,100 | | | 14,348 |
Resolution plc (Life & Health Insurance) | | 695,300 | | | 9,842 |
Vodafone Group plc (Wireless Telecommunication Services) | | 4,116,430 | | | 15,453 |
Weir Group plc (The) (Industrial Machinery) | | 621,200 | | | 9,986 |
Wolseley plc (Trading Companies & Distributors) | | 524,300 | | | 7,708 |
| | | | | |
| | | | | 98,966 |
| | | | | |
Total Foreign Common Stocks (Identified Cost $367,739) | | | | | 474,041 |
| | | | | |
FOREIGN PREFERRED STOCKS(b)—2.9% | | | | | |
South Korea—2.9% | | | | | |
Samsung Electronics Co., Ltd. Pfd. 1.10% (Semiconductors) | | 32,300 | | | 14,655 |
| | | | | |
Total Foreign Preferred Stocks (Identified Cost $ 11,881) | | | | | 14,655 |
| | | | | |
TOTAL LONG TERM INVESTMENTS—97.4% (Identified cost $379,620) | | | | | 488,696 |
| | | | | |
SHORT-TERM INVESTMENTS—3.2% | | | | | |
Money Market Mutual Funds—0.3% | | | | | |
State Street Navigator Prime Plus (4.88% seven-day effective yield)(d) | | 1,385,870 | | | 1,386 |
| | | | | |
See Notes to Financial Statements
74
PHOENIX-ABERDEEN INTERNATIONAL SERIES
| | | | | | | |
| | | PAR | | | |
| | | VALUE | | VALUE | |
| | | (000) | | (000) | |
Commercial Paper(e)—2.9% | | | | | | | |
Nicor, Inc.
4.000 % due 1/2/08 | | $ | 3,845 | | $ | 3,844 | |
Praxair, Inc.
3.600% due 1/2/08 | | | 10,985 | | | 10,984 | |
| | | | | | | |
| | | | | | 14,828 | |
| | | | | | | |
Total Short-Term Investments (Identified Cost $16,214) | | | | | | 16,214 | |
| | | | | | | |
TOTAL INVESTMENTS—100.6% (Identified Cost $395,834) | | | | | | 504,910 | (a) |
Other assets and liabilities, net—(0.6)% | | | | | | (2,997 | ) |
| | | | | | | |
NET ASSETS—100.0% | | | | | $ | 501,913 | |
| | | | | | | |
(a) | Federal Income Tax Information (reported in 000’s): Net unrealized appreciation of investment securities is comprised of gross appreciation of $123,054 and gross depreciation of $14,936 for federal income tax purposes. At December 31, 2007, the aggregate cost of securities for federal income tax purposes was $396,792. |
(b) | A security is considered to be foreign if the security is issued in a foreign country. The country of risk, noted in the header, is determined based on criteria described in Note 2G, “Foreign security country determination” in the Notes to Financial Statements. |
(c) | All or a portion of security is on loan. |
(d) | Represents security purchased with cash collateral received for securities on loan. |
(e) | The rate shown is the discount rate. |
See Notes to Financial Statements
75
PHOENIX-ALGER SMALL-CAP GROWTH SERIES
SCHEDULE OF INVESTMENTS
DECEMBER 31, 2007
| | | | | |
| | | SHARES | | VALUE
(000) |
DOMESTIC COMMON STOCKS—94.8% | | | | | |
Aerospace & Defense—2.7% | | | | | |
BE Aerospace, Inc.(b) | | 14,880 | | $ | 787 |
Esterline Technologies
Corp.(b) | | 13,690 | | | 709 |
| | | | | |
| | | | | 1,496 |
| | | | | |
Air Freight & Logistics—0.2% | | | | | |
Pacer International, Inc. | | 6,500 | | | 95 |
| | | | | |
Airlines—0.5% | | | | | |
AirTran Holdings, Inc.(b) | | 42,270 | | | 303 |
| | | | | |
Alternative Carriers—0.5% | | | | | |
Time Warner Telecom, Inc.
Class A(b) | | 13,275 | | | 269 |
| | | | | |
Apparel Retail—1.6% | | | | | |
AnnTaylor Stores Corp.(b) | | 12,070 | | | 309 |
Bebe Stores, Inc. | | 26,850 | | | 345 |
DSW, Inc. Class A(b) | | 11,740 | | | 220 |
| | | | | |
| | | | | 874 |
| | | | | |
Apparel, Accessories & Luxury Goods—1.3% | | | | | |
Carter’s, Inc.(b) | | 16,915 | | | 327 |
Phillips-Van Heusen Corp. | | 10,730 | | | 396 |
| | | | | |
| | | | | 723 |
| | | | | |
Application Software—5.8% | | | | | |
ANSYS, Inc.(b) | | 20,220 | | | 838 |
Concur Technologies,
Inc.(b) | | 12,670 | | | 459 |
Solera Holdings, Inc.(b) | | 32,725 | | | 811 |
Synchronoss Technologies,
Inc.(b) | | 15,240 | | | 540 |
Taleo Corp. Class A(b) | | 11,265 | | | 335 |
TIBCO Software, Inc.(b) | | 32,065 | | | 259 |
| | | | | |
| | | | | 3,242 |
| | | | | |
Asset Management & Custody Banks—0.8% | | | | | |
American Capital Strategies
Ltd. | | 2,985 | | | 98 |
Cohen & Steers, Inc. | | 10,875 | | | 326 |
| | | | | |
| | | | | 424 |
| | | | | |
Auto Parts & Equipment—0.6% | | | | | |
Tenneco, Inc.(b) | | 13,530 | | | 353 |
| | | | | |
Biotechnology—7.6% | | | | | |
Acorda Therapeutics, Inc.(b) | | 23,030 | | | 506 |
BioMarin Pharmaceutical,
Inc.(b) | | 14,695 | | | 520 |
Cubist Pharmaceuticals,
Inc.(b) | | 13,645 | | | 280 |
InterMune, Inc.(b) | | 14,110 | | | 188 |
Omrix Biopharmaceuticals,
Inc.(b) | | 17,050 | | | 592 |
Onyx Pharmaceuticals,
Inc.(b) | | 10,670 | | | 593 |
Progenics Pharmaceuticals,
Inc.(b) | | 19,445 | | $ | 351 |
Savient Pharmaceuticals,
Inc.(b) | | 24,360 | | | 560 |
United Therapeutics
Corp.(b) | | 6,765 | | | 661 |
| | | | | |
| | | | | 4,251 |
| | | | | |
Casinos & Gaming—1.3% | | | | | |
Bally Technologies, Inc.(b) | | 14,530 | | | 722 |
| | | | | |
Communications Equipment—3.7% | | | | | |
Acme Packet, Inc.(b) | | 33,400 | | | 420 |
Foundry Networks, Inc.(b) | | 26,860 | | | 471 |
Polycom, Inc.(b) | | 24,835 | | | 690 |
Sonus Networks, Inc. | | 83,455 | | | 486 |
| | | | | |
| | | | | 2,067 |
| | | | | |
Computer Hardware—0.2% | | | | | |
Avid Technology, Inc.(b) | | 4,790 | | | 136 |
| | | | | |
Computer Storage & Peripherals—1.5% | | | | | |
Novatel Wireless, Inc.(b) | | 23,955 | | | 388 |
Synaptics, Inc.(b) | | 11,335 | | | 467 |
| | | | | |
| | | | | 855 |
| | | | | |
Construction & Engineering—2.3% | | | | | |
Aecom Technology Corp.(b) | | 22,835 | | | 652 |
URS Corp.(b) | | 12,015 | | | 653 |
| | | | | |
| | | | | 1,305 |
| | | | | |
Construction & Farm Machinery & Heavy | | | | | |
Trucks—1.4% | | | | | |
Bucyrus International, Inc.
Class A | | 7,750 | | | 770 |
| | | | | |
Data Processing & Outsourced Services—3.4% | | | | | |
Heartland Payment Systems,
Inc. | | 18,085 | | | 485 |
NeuStar, Inc. Class A(b) | | 17,475 | | | 501 |
VeriFone Holdings, Inc.(b) | | 14,920 | | | 347 |
Wright Express Corp.(b) | | 16,015 | | | 568 |
| | | | | |
| | | | | 1,901 |
| | | | | |
Distillers & Vintners—0.8% | | | | | |
Central European Distribution
Corp.(b) | | 7,285 | | | 423 |
| | | | | |
Distributors—1.3% | | | | | |
LKQ Corp.(b) | | 35,090 | | | 738 |
| | | | | |
Diversified Commercial & Professional | | | | | |
Services—3.9% | | | | | |
Corporate Executive Board Co.
(The) | | 2,875 | | | 173 |
FTI Consulting, Inc.(b) | | 14,305 | | | 882 |
GEO Group, Inc. (The)(b) | | 25,865 | | | 724 |
TeleTech Holdings, Inc.(b) | | 19,195 | | $ | 408 |
| | | | | |
| | | | | 2,187 |
| | | | | |
Diversified Metals & Mining—1.5% | | | | | |
RTI International Metals,
Inc.(b) | | 4,925 | | | 339 |
Thompson Creek Metals Co.,
Inc.(b) | | 30,015 | | | 514 |
| | | | | |
| | | | | 853 |
| | | | | |
Electric Utilities—1.6% | | | | | |
ITC Holdings Corp. | | 15,470 | | | 873 |
| | | | | |
Electrical Components & Equipment—1.1% | | | | | |
JA Solar Holdings Co. Ltd.
ADR(b) | | 8,520 | | | 595 |
| | | | | |
Footwear—2.4% | | | | | |
Deckers Outdoor Corp.(b) | | 4,510 | | | 699 |
Iconix Brand Group, Inc.(b) | | 33,605 | | | 661 |
| | | | | |
| | | | | 1,360 |
| | | | | |
Health Care Equipment—3.3% | | | | | |
ArthroCare Corp.(b) | | 10,070 | | | 484 |
DexCom, Inc.(b) | | 14,785 | | | 130 |
Hologic, Inc.(b) | | 10,980 | | | 754 |
Thoratec Corp.(b) | | 27,173 | | | 494 |
| | | | | |
| | | | | 1,862 |
| | | | | |
Health Care Facilities—0.8% | | | | | |
Psychiatric Solutions,
Inc.(b) | | 14,340 | | | 466 |
| | | | | |
Health Care Services—0.9% | | | | | |
Landauer, Inc. | | 9,500 | | | 493 |
| | | | | |
Health Care Supplies—1.4% | | | | | |
Immucor, Inc.(b) | | 5,545 | | | 188 |
Inverness Medical Innovations,
Inc.(b) | | 10,245 | | | 576 |
| | | | | |
| | | | | 764 |
| | | | | |
Health Care Technology—0.6% | | | | | |
Allscripts Healthcare Solutions,
Inc. | | 17,265 | | | 335 |
| | | | | |
Human Resources & Employment Services—0.3% | | | | | |
Resources Connection,
Inc. | | 10,000 | | | 182 |
| | | | | |
Industrial Machinery—3.6% | | | | | |
Actuant Corp. Class A | | 19,320 | | | 657 |
CLARCOR, Inc. | | 15,770 | | | 599 |
RBC Bearings, Inc.(b) | | 17,040 | | | 740 |
| | | | | |
| | | | | 1,996 |
| | | | | |
See Notes to Financial Statements
76
PHOENIX-ALGER SMALL-CAP GROWTH SERIES
| | | | | | | |
| | | SHARES | | VALUE
(000) | |
| | |
Internet Retail—2.4% | | | | | | | |
GSI Commerce, ® Inc.(b) | | | 29,044 | | $ | 567 | |
priceline.com, Inc.(b) | | | 6,550 | | | 752 | |
| | | | | | | |
| | | | | | 1,319 | |
| | | | | | | |
Internet Software & Services—3.9% | | | | | | | |
Autobytel, Inc.(b) | | | 60,530 | | | 167 | |
Autobytel, Inc.(b)(d) | | | 3,757 | | | 10 | |
DealerTrack Holdings, Inc.(b) | | | 15,460 | | | 517 | |
Digital River, Inc.(b) | | | 8,045 | | | 266 | |
Internap Network Services Corp. | | | 25,080 | | | 209 | |
j2 Global Communications, Inc.(b) | | | 4,785 | | | 101 | |
Omniture, Inc.(b) | | | 12,935 | | | 431 | |
VistaPrint Ltd.(b) | | | 11,175 | | | 479 | |
| | | | | | | |
| | | | | | 2,180 | |
| | | | | | | |
Investment Banking & Brokerage—1.6% | | | | | | | |
GFI Group, Inc.(b) | | | 2,875 | | | 275 | |
Greenhill & Co., Inc. | | | 9,020 | | | 600 | |
| | | | | | | |
| | | | | | 875 | |
| | | | | | | |
IT Consulting & Other Services—0.5% | | | | | | | |
SI International, Inc.(b) | | | 9,010 | | | 247 | |
| | | | | | | |
Leisure Facilities—1.2% | | | | | | | |
Life Time Fitness, Inc.(b) | | | 12,920 | | | 642 | |
| | | | | | | |
Life Sciences Tools & Services—3.0% | | | | | | | |
Illumina, Inc.(b) | | | 11,915 | | | 706 | |
Nektar Therapeutics(b) | | | 29,690 | | | 199 | |
Parexel International Corp.(b) | | | 15,805 | | | 764 | |
| | | | | | | |
| | | | | | 1,669 | |
| | | | | | | |
Metal & Glass Containers—1.2% | | | | | | | |
Silgan Holdings, Inc. | | | 12,800 | | | 665 | |
| | | | | | | |
Oil & Gas Equipment & Services—2.4% | | | | | | | |
Cal Dive International, Inc.(b) | | | 27,316 | | | 362 | |
Dril-Quip, Inc.(b) | | | 11,475 | | | 639 | |
T-3 Energy Services, Inc.(b) | | | 7,050 | | | 331 | |
| | | | | | | |
| | | | | | 1,332 | |
| | | | | | | |
Oil & Gas Exploration & Production—2.9% | | | | | | | |
Carrizo Oil & Gas, Inc.(b) | | | 8,915 | | | 488 | |
Concho Resources, Inc.(b) | | | 27,685 | | | 571 | |
Mariner Energy, Inc.(b) | | | 23,475 | | | 537 | |
| | | | | | | |
| | | | | | 1,596 | |
| | | | | | | |
Oil & Gas Refining & Marketing—0.8% | | | | | | | |
CVR Energy, Inc.(b) | | | 18,035 | | | 450 | |
| | | | | | | |
Packaged Foods & Meats—1.3% | | | | | | | |
Hain Celestial Group, Inc. (The)(b) | | | 22,310 | | | 714 | |
| | | | | | | |
Pharmaceuticals—1.1% | | | | | | | |
Adams Respiratory Therapeutics, Inc.(b) | | | 10,650 | | | 636 | |
| | | | | | | |
Property & Casualty Insurance—1.1% | | | | | | | |
First Mercury Financial Corp.(b) | | | 26,130 | | | 637 | |
| | | | | | | |
Regional Banks—2.6% | | | | | | | |
Boston Private Financial | | | | | | | |
Holdings, Inc. | | | 18,515 | | | 502 | |
First Midwest Bancorp, Inc. | | | 12,820 | | | 392 | |
Signature Bank(b) | | | 9,545 | | | 322 | |
Wintrust Financial Corp. | | | 7,060 | | | 234 | |
| | | | | | | |
| | | | | | 1,450 | |
| | | | | | | |
Restaurants—0.4% | | | | | | | |
McCormick & Schmick’s Seafood Restaurants, Inc.(b) | | | 20,225 | | | 241 | |
| | | | | | | |
Semiconductor Equipment—2.0% | | | | | | | |
FormFactor, Inc.(b) | | | 12,390 | | | 410 | |
Tessera Technologies, Inc.(b) | | | 17,085 | | | 711 | |
| | | | | | | |
| | | | | | 1,121 | |
| | | | | | | |
Semiconductors—2.9% | | | | | | | |
Atheros Communications, Inc.(b) | | | 19,375 | | | 592 | |
ON Semiconductor Corp.(b) | | | 62,740 | | | 557 | |
SiRF Technology Holdings, Inc. | | | 19,545 | | | 491 | |
| | | | | | | |
| | | | | | 1,640 | |
| | | | | | | |
Specialized Consumer Services—0.7% | | | | | | | |
Matthews International Corp. Class A | | | 7,700 | | | 361 | |
| | | | | | | |
Specialty Chemicals—1.6% | | | | | | | |
Balchem Corp. | | | 14,100 | | | 315 | |
Zoltek Cos., Inc.(b) | | | 13,125 | | | 563 | |
| | | | | | | |
| | | | | | 878 | |
| | | | | | | |
Thrifts & Mortgage Finance—1.0% | | | | | | | |
FirstFed Financial Corp.(b) | | | 6,270 | | $ | 225 | |
Washington Federal, Inc. | | | 16,550 | | | 349 | |
| | | | | | | |
| | | | | | 574 | |
| | | | | | | |
Wireless Telecommunication Services—1.3% | | | | | | | |
SBA Communications Corp. Class A(b) | | | 20,905 | | | 707 | |
| | | | | | | |
Total Domestic Common Stocks (Identified Cost $41,730) | | | | | | 52,847 | |
| | | | | | | |
FOREIGN COMMON STOCKS(c)—4.7% | | | | | | | |
Coal & Consumable Fuels—0.5% | | | | | | | |
Uranium One, Inc. (Canada)(b) | | | 31,380 | | | 277 | |
| | | | | | | |
Communications Equipment—1.2% | | | | | | | |
NICE Systems Ltd. – Sponsored ADR (Israel)(b) | | | 19,285 | | | 662 | |
| | | | | | | |
Hotels, Resorts & Cruise Lines—0.6% | | | | | | | |
Orient-Express Hotel Ltd. Class A (Bermuda) | | | 5,554 | | | 319 | |
| | | | | | | |
Oil & Gas Exploration & Production—1.4% | | | | | | | |
Petrobank Energy & Resources Ltd. (Canada)(b) | | | 13,490 | | | 796 | |
| | | | | | | |
Technology Distributors—1.0% | | | | | | | |
Mellanox Technologies Ltd. (Israel)(b) | | | 31,726 | | | 578 | |
| | | | | | | |
Total Foreign Common Stocks (Identified Cost $1,869) | | | | | | 2,632 | |
| | | | | | | |
TOTAL LONG TERM INVESTMENTS—99.5% (Identified cost $43,599) | | | | | | 55,479 | |
| | | | | | | |
SHORT-TERM INVESTMENTS—0.7% | | | | | | | |
| | |
| | | PAR
VALUE
(000) | | | |
| | |
| | |
Federal Agency Securities(e) —0.7% | | | | | | | |
FHLB | | | | | | | |
3.900% due 1/3/08 | | $ | 300 | | | 300 | |
3.900% due 1/11/08 | | | 100 | | | 100 | |
| | | | | | | |
Total Short-Term Investments (Identified Cost $400) | | | | | | 400 | |
| | | | | | | |
TOTAL INVESTMENTS—100.2% (Identified Cost $43,999) | | | | | | 55,879 | (a) |
Other assets and liabilities, net—(0.2)% | | | | | | (111 | ) |
| | | | | | | |
NET ASSETS—100.0% | | | | | $ | 55,768 | |
| | | | | | | |
(a) | Federal Income Tax Information (reported in 000’s): Net unrealized appreciation of investment securities is comprised of gross appreciation of $14,562 and gross depreciation of $2,867 for federal income tax purposes. At December 31, 2007, the aggregate cost of securities for federal income tax purposes was $44,184. |
(c) | A security is considered to be foreign if the security is issued in a foreign country. The country of risk, noted parenthetically, is determined based on criteria described in Note 2G, “Foreign security country determination” in the Notes to Financial Statements. |
(d) | Illiquid and restricted security. At December 31, 2007, this security amounted to a value of $10 (reported in 000’s) or 0.0% of net assets. For acquisition information, see Note 6 “Illiquid and Restricted Securities” in the Notes to Financial Statements. |
(e) | The rate shown is the discount rate. |
See Notes to Financial Statements
77
PHOENIX-DUFF & PHELPS REAL ESTATE SECURITIES SERIES
SCHEDULE OF INVESTMENTS
DECEMBER 31, 2007
| | | | | | | |
| | | SHARES | | VALUE
(000) | |
| | |
DOMESTIC COMMON STOCKS—96.4% | | | | | | | |
REAL ESTATE INVESTMENT TRUSTS—96.4% | | | | | | | |
DIVERSIFIED—4.7% | | | | | | | |
Vornado Realty Trust | | | 72,093 | | $ | 6,341 | |
| | | | | | | |
HEALTH CARE—11.5% | | | | | | | |
HCP, Inc. | | | 120,399 | | | 4,187 | |
Health Care REIT, Inc. | | | 91,775 | | | 4,101 | |
Nationwide Health Properties, Inc. | | | 54,411 | | | 1,707 | |
Ventas, Inc. | | | 121,674 | | | 5,506 | |
| | | | | | | |
| | | | | | 15,501 | |
| | | | | | | |
INDUSTRIAL/OFFICE—30.6% | | | | | | | |
Industrial—9.6% | | | | | | | |
AMB Property Corp. | | | 56,178 | | | 3,234 | |
DCT Industrial Trust, Inc. | | | 60,747 | | | 565 | |
Prologis | | | 145,563 | | | 9,226 | |
| | | | | | | |
| | | | | | 13,025 | |
| | | | | | | |
Mixed—1.6% | | | | | | | |
Duke Realty Corp. | | | 70,743 | | | 1,845 | |
PS Business Parks, Inc. | | | 7,094 | | | 373 | |
| | | | | | | |
| | | | | | 2,218 | |
| | | | | | | |
Office—15.3% | | | | | | | |
Alexandria Real Estate Equities, Inc. | | | 59,559 | | | 6,055 | |
Boston Properties, Inc. | | | 52,343 | | | 4,806 | |
Corporate Office Properties Trust | | | 129,681 | | | 4,085 | |
Douglas Emmett, Inc. | | | 18,165 | | | 411 | |
Kilroy Realty Corp. | | | 15,253 | | | 838 | |
SL Green Realty Corp. | | | 47,810 | | | 4,468 | |
| | | | | | | |
| | | | | | 20,663 | |
| | | | | | | |
SPECIALTY—4.1% | | | | | | | |
Digital Realty Trust, Inc. | | | 143,432 | | | 5,503 | |
| | | | | | | |
| | | | | | 41,409 | |
| | | | | | | |
LODGING/RESORTS—6.9% | | | | | | | |
DiamondRock Hospitality Co. | | | 110,897 | | | 1,661 | |
Host Hotels & Resorts, Inc. | | | 290,473 | | | 4,950 | |
LaSalle Hotel Properties | | | 48,500 | | | 1,547 | |
Sunstone Hotel Investors, Inc. | | | 66,975 | | | 1,225 | |
| | | | | | | |
| | | | | | 9,383 | |
| | | | | | | |
RESIDENTIAL—10.0% | | | | | | | |
Apartments—10.0% | | | | | | | |
AvalonBay Communities, Inc. | | | 35,663 | | | 3,357 | |
BRE Properties, Inc. | | | 35,746 | | | 1,449 | |
Equity Residential | | | 94,669 | | | 3,453 | |
Essex Property Trust, Inc. | | | 36,470 | | | 3,555 | |
UDR, Inc. | | | 86,434 | | | 1,716 | |
| | | | | | | |
| | | | | | 13,530 | |
| | | | | | | |
RETAIL—28.1% | | | | | | | |
Regional Malls—15.9% | | | | | | | |
General Growth Properties, Inc. | | | 132,880 | | | 5,472 | |
Macerich Co. (The) | | | 64,582 | | | 4,589 | |
Simon Property Group, Inc. | | | 130,939 | | | 11,374 | |
| | | | | | | |
| | | | | | 21,435 | |
| | | | | | | |
Shopping Centers—12.2% | | | | | | | |
Developers Diversified Realty Corp. | | | 79,410 | | | 3,040 | |
Federal Realty Investment Trust | | | 35,980 | | | 2,956 | |
Kimco Realty Corp. | | | 132,307 | | | 4,816 | |
Regency Centers Corp. | | | 50,330 | | | 3,246 | |
Tanger Factory Outlet Centers, Inc. | | | 66,461 | | | 2,506 | |
| | | | | | | |
| | | | | | 16,564 | |
| | | | | | | |
| | | | | | 37,999 | |
| | | | | | | |
SELF STORAGE—4.6% | | | | | | | |
Extra Space Storage, Inc. | | | 148,224 | | | 2,118 | |
Public Storage, Inc. | | | 55,225 | | | 4,054 | |
| | | | | | | |
| | | | | | 6,172 | |
| | | | | | | |
Total Domestic Common Stocks (Identified cost $88,134) | | | | | | 130,335 | |
| | | | | | | |
TOTAL LONG TERM INVESTMENTS—96.4% (Identified cost $87,810) | | | | | | 130,335 | |
| | | | | | | |
SHORT-TERM INVESTMENTS—2.5% | | | | | | | |
| | |
| | | PAR
VALUE
(000) | | | |
| | |
| | |
Federal Agency Securities(b)—2.5% | | | | | | | |
FHLB | | | | | | | |
3.200% due 1/2/08 | | $ | 2,190 | | | 2,190 | |
4.240% due 1/2/08 | | | 1,175 | | | 1,175 | |
| | | | | | | |
Total Short-Term Investments (Identified cost $3,365) | | | | | | 3,365 | |
| | | | | | | |
TOTAL INVESTMENTS—98.9% (Identified cost $91,176) | | | | | | 133,700 | (a) |
Other assets and liabilities, net—1.1% | | | | | | 1,440 | |
| | | | | | | |
NET ASSETS—100.0% | | | | | $ | 135,140 | |
| | | | | | | |
(a) | Federal Income Tax Information (reported in 000’s): Net unrealized appreciation of investment securities is comprised of gross appreciation of $44,644 and gross depreciation of $2,279 for federal income tax purposes. At December 31, 2007, the aggregate cost of securities for federal income tax purposes was $91,335. |
(b) | The rate shown is the discount rate. |
See Notes to Financial Statements
78
PHOENIX-S&P DYNAMIC ASSET ALLOCATION SERIES: AGGRESSIVE GROWTH
SCHEDULE OF INVESTMENTS
DECEMBER 31, 2007
| | | | | |
| | | SHARES | | VALUE
(000) |
EXCHANGE TRADED FUNDS—98.2% | | | | | |
Consumer Discretionary Select Sector SPDR Fund | | $ | 21,180 | | 693 |
Consumer Staples Select Sector SPDR Fund | | | 63,850 | | 1,839 |
Energy Select Sector SPDR Fund | | | 23,060 | | 1,830 |
Financial Select Sector SPDR Fund | | | 80,079 | | 2,317 |
Health Care Select Sector SPDR Fund | | | 52,320 | | 1,847 |
Industrial Select Sector SPDR Fund | | | 52,970 | | 2,074 |
iShares Dow Jones US Telecommunications Sector Index Fund | | | 31,060 | | 917 |
iShares Lehman Short Treasury Bond Fund | | | 10,575 | | 1,159 |
iShares MSCI Emerging Markets Index Fund | | | 12,210 | | 1,835 |
iShares MSCI Japan Index Fund | | | 52,510 | | 695 |
iShares S&P Europe 350 Index Fund | | | 20,025 | | 2,297 |
iShares S&P Latin America 40 Index Fund | | | 3,665 | | 912 |
Materials Select Sector SPDR Fund | | | 16,570 | | 691 |
Technology Select Sector SPDR Fund | | | 112,165 | | 2,990 |
Utilities Select Sector SPDR Fund | | | 21,570 | | 913 |
| | | | | |
Total Exchange Traded Funds (Identified Cost $21,158) | | | | | 23,009 |
| | | | | |
TOTAL LONG TERM INVESTMENTS—98.2% (Identified cost $21,158) | | | | | 23,009 |
| | | | | |
| | | | | | | |
| | | PAR
VALUE
(000) | | VALUE
(000) | |
SHORT-TERM INVESTMENTS—1.2% | | | | | | | |
Commercial Paper(b)—1.2% | | | | | | | |
Eaton Corp.
4.250% due 1/2/08 | | $ | 270 | | $ | 270 | |
| | | | | | | |
Total Short-Term Investments (Identified Cost $270) | | | | | | 270 | |
| | | | | | | |
TOTAL INVESTMENTS—99.4% (Identified Cost $21,428) | | | | | | 23,279 | (a) |
Other assets and liabilities, net—0.6% | | | | | | 147 | |
| | | | | | | |
NET ASSETS—100.0% | | | | | $ | 23,426 | |
| | | | | | | |
(a) | Federal Income Tax Information (reported in 000’s): Net unrealized appreciation of investment securities is comprised of gross appreciation of $1,745 and gross depreciation of $325 for federal income tax purposes. At December 31, 2007, the aggregate cost of securities for federal income tax purposes was $21,859. |
(b) | The rate shown is the discount rate. |
See Notes to Financial Statements
79
PHOENIX-S&P DYNAMIC ASSET ALLOCATION SERIES: GROWTH
SCHEDULE OF INVESTMENTS
DECEMBER 31, 2007
| | | | | | | |
| | | SHARES | | VALUE
(000) | |
EXCHANGE TRADED FUNDS—99.8% | | | | | | | |
Consumer Discretionary Select Sector SPDR Fund | | | 22,138 | | $ | 724 | |
Consumer Staples Select Sector SPDR Fund | | | 75,056 | | | 2,162 | |
Energy Select Sector SPDR Fund | | | 27,124 | | | 2,152 | |
Financial Select Sector SPDR Fund | | | 75,316 | | | 2,179 | |
Health Care Select Sector SPDR Fund | | | 51,250 | | | 1,810 | |
Industrial Select Sector SPDR Fund | | | 55,345 | | | 2,167 | |
iShares Dow Jones US Telecommunications Sector Index Fund | | | 36,510 | | | 1,078 | |
iShares iBoxx $ Investment Grade Corporate Bond Fund | | | 3,463 | | | 363 | |
iShares Lehman 1-3 Year Treasury Bond Fund | | | 53,125 | | | 4,364 | |
iShares Lehman 3-7 Year Treasury Bond Fund | | | 3,455 | | | 364 | |
iShares Lehman 7-10 Year Treasury Bond Fund | | | 4,200 | | | 365 | |
iShares Lehman Short Treasury Bond Fund | | | 49,705 | | | 5,450 | |
iShares MSCI Emerging Markets Index Fund | | | 16,740 | | | 2,516 | |
iShares MSCI Japan Index Fund | | | 54,870 | | | 726 | |
iShares S&P Europe 350 Index Fund | | | 25,110 | | | 2,881 | |
iShares S&P Latin America 40 Index Fund | | | 4,305 | | | 1,071 | |
Materials Select Sector SPDR Fund | | | 25,980 | | | 1,083 | |
Technology Select Sector SPDR Fund | | | 135,239 | | | 3,605 | |
Utilities Select Sector SPDR Fund | | | 25,360 | | | 1,073 | |
| | | | | | | |
Total Exchange Traded Funds (Identified Cost $33,890) | | | | | | 36,133 | |
| | | | | | | |
TOTAL LONG TERM INVESTMENTS—99.8% (Identified cost $33,890) | | | | | | 36,133 | |
| | | | | | | |
SHORT-TERM INVESTMENTS—0.4% | | | | | | | |
| | |
| | | PAR
VALUE
(000) | | | |
Commercial Paper(b)—0.4% | | | | | | | |
Nicor, Inc.
4.000% due 1/2/08 | | $ | 145 | | | 145 | |
| | | | | | | |
Total Short-Term Investments (Identified Cost $145) | | | | | | 145 | |
| | | | | | | |
TOTAL INVESTMENTS—100.2% (Identified Cost $34,035) | | | | | | 36,278 | (a) |
Other assets and liabilities, net—(0.2)% | | | | | | (89 | ) |
| | | | | | | |
NET ASSETS—100.0% | | | | | $ | 36,189 | |
| | | | | | | |
(a) | Federal Income Tax Information (reported in 000’s): Net unrealized appreciation of investment securities is comprised of gross appreciation of $1,977 and gross depreciation of $287 for federal income tax purposes. At December 31, 2007, the aggregate cost of securities for federal income tax purposes was $34,588. |
(b) | The rate shown is the discount rate. |
See Notes to Financial Statements
80
PHOENIX-S&P DYNAMIC ASSET ALLOCATION SERIES: MODERATE
SCHEDULE OF INVESTMENTS
DECEMBER 31, 2007
| | | | | | |
| | | SHARES | | VALUE
(000) | |
EXCHANGE TRADED FUNDS—100.0% | | | | | | |
Consumer Staples Select Sector SPDR Fund | | 7,590 | | $ | 219 | |
Energy Select Sector SPDR Fund | | 1,815 | | | 144 | |
Financial Select Sector SPDR Fund | | 2,560 | | | 74 | |
Health Care Select Sector SPDR Fund | | 2,100 | | | 74 | |
Industrial Select Sector SPDR Fund | | 5,600 | | | 219 | |
iShares Dow Jones US Telecommunications Sector Index Fund | | 4,930 | | | 146 | |
iShares iBoxx $ Investment Grade Corporate Bond Fund | | 1,395 | | | 146 | |
iShares Lehman 1-3 Year Treasury Bond Fund | | 19,700 | | | 1,618 | |
iShares Lehman 10-20 Year Treasury Bond Fund | | 2,810 | | | 295 | |
iShares Lehman 20+ Year Treasury Bond Fund | | 2,380 | | | 222 | |
iShares Lehman 3-7 Year Treasury Bond Fund | | 4,180 | | | 440 | |
iShares Lehman 7-10 Year Treasury Bond Fund | | 4,240 | | | 368 | |
iShares Lehman Short Treasury Bond Fund | | 18,765 | | | 2,057 | |
iShares MSCI Emerging Markets Index Fund | | 1,945 | | | 292 | |
iShares S&P Europe 350 Index Fund | | 2,570 | | | 295 | |
iShares S&P Latin America 40 Index Fund | | 580 | | | 144 | |
Materials Select Sector SPDR Fund | | 3,520 | | | 147 | |
Technology Select Sector SPDR Fund | | 10,940 | | | 292 | |
Utilities Select Sector SPDR Fund | | 3,440 | | | 146 | |
| | | | | | |
Total Exchange Traded Funds (Identified Cost $7,016) | | | | | 7,338 | |
| | | | | | |
TOTAL INVESTMENTS—100.0% (Identified Cost $7,016) | | | | | 7,338 | (a) |
Other assets and liabilities, net—0.0% | | | | | (1 | ) |
| | | | | | |
NET ASSETS—100.0% | | | | $ | 7,337 | |
| | | | | | |
(a) | Federal Income Tax Information (reported in 000’s): Net unrealized appreciation of investment securities is comprised of gross appreciation of $300 and gross depreciation of $8 for federal income tax purposes. At December 31, 2007, the aggregate cost of securities for federal income tax purposes was $7,046. |
See Notes to Financial Statements
81
PHOENIX-S&P DYNAMIC ASSET ALLOCATION SERIES: MODERATE GROWTH
SCHEDULE OF INVESTMENTS
DECEMBER 31, 2007
| | | | | | | |
| | | SHARES | | VALUE
(000) | |
EXCHANGE TRADED FUNDS—99.7% | | | | | | | |
Consumer Discretionary Select Sector SPDR Fund | | | 6,000 | | $ | 196 | |
Consumer Staples Select Sector SPDR Fund | | | 33,910 | | | 977 | |
Energy Select Sector SPDR Fund | | | 12,245 | | | 972 | |
Financial Select Sector SPDR Fund | | | 27,230 | | | 788 | |
Health Care Select Sector SPDR Fund | | | 16,670 | | | 589 | |
Industrial Select Sector SPDR Fund | | | 30,010 | | | 1,175 | |
iShares Dow Jones US Telecommunications Sector Index Fund | | | 19,810 | | | 585 | |
iShares iBoxx $ Investment Grade Corporate Bond Fund | | | 1,875 | | | 196 | |
iShares Lehman 1-3 Year Treasury Bond Fund | | | 33,620 | | | 2,762 | |
iShares Lehman 10-20 Year Treasury Bond Fund | | | 3,760 | | | 395 | |
iShares Lehman 20+ Year Treasury Bond Fund | | | 4,250 | | | 395 | |
iShares Lehman 3-7 Year Treasury Bond Fund | | | 7,490 | | | 789 | |
iShares Lehman 7-10 Year Treasury Bond Fund | | | 6,825 | | | 592 | |
iShares Lehman Short Treasury Bond Fund | | | 34,135 | | | 3,742 | |
iShares MSCI Emerging Markets Index Fund | | | 6,485 | | | 975 | |
iShares MSCI Japan Index Fund | | | 14,870 | | | 197 | |
iShares S&P Europe 350 Index Fund | | | 10,205 | | | 1,171 | |
iShares S&P Latin America 40 Index Fund | | | 2,340 | | | 582 | |
Materials Select Sector SPDR Fund | | | 9,390 | | | 391 | |
Technology Select Sector SPDR Fund | | | 58,675 | | | 1,564 | |
Utilities Select Sector SPDR Fund | | | 13,740 | | | 582 | |
| | | | | | | |
Total Exchange Traded Funds (Identified cost $18,310) | | | | | | 19,615 | |
| | | | | | | |
TOTAL LONG TERM INVESTMENTS—99.7% (Identified cost $ 18,310) | | | | | | 19,615 | |
| | | | | | | |
SHORT-TERM INVESTMENTS—0.6% | | | | | | | |
| | |
| | | PAR
VALUE
(000) | | | |
Commercial Paper(b)—0.6% | | | | | | | |
Nicor, Inc.
4.000% due 1/2/08 | | $ | 125 | | | 125 | |
| | | | | | | |
Total Short-Term Investments (Identified cost $125) | | | | | | 125 | |
| | | | | | | |
TOTAL INVESTMENTS—100.3% (Identified Cost $18,435) | | | | | | 19,740 | (a) |
Other assets and liabilities, net—(0.3)% | | | | | | (55 | ) |
| | | | | | | |
NET ASSETS—100.0% | | | | | $ | 19,685 | |
| | | | | | | |
(a) | Federal Income Tax Information (reported in 000’s): Net unrealized appreciation of investment securities is comprised of gross appreciation of $1,138 and gross depreciation of $70 for federal income tax purposes. At December 31, 2007, the aggregate cost of securities for federal income tax purposes was $18,672. |
(b) | The rate shown is the discount rate. |
See Notes to Financial Statements
82
PHOENIX-SANFORD BERNSTEIN MID-CAP VALUE SERIES
SCHEDULE OF INVESTMENTS
DECEMBER 31, 2007
| | | | | |
| | | SHARES | | VALUE
(000) |
DOMESTIC COMMON STOCKS—90.0% | | | | | |
| | |
Aerospace & Defense—0.9% | | | | | |
Goodrich Corp. | | 18,000 | | $ | 1,271 |
| | | | | |
Agricultural Products—0.3% | | | | | |
Corn Products International, Inc. | | 10,600 | | | 390 |
| | | | | |
Airlines—1.7% | | | | | |
Alaska Air Group, Inc.(b) | | 34,100 | | | 853 |
Continental Airlines, Inc. Class B(b) | | 30,100 | | | 669 |
SkyWest, Inc. | | 30,200 | | | 811 |
| | | | | |
| | | | | 2,333 |
| | | | | |
Apparel, Accessories & Luxury Goods—1.2% | | | | | |
Jones Apparel Group, Inc. | | 37,000 | | | 592 |
VF Corp. | | 14,900 | | | 1,023 |
| | | | | |
| | | | | 1,615 |
| | | | | |
Auto Parts & Equipment—1.9% | | | | | |
ArvinMeritor, Inc. | | 93,500 | | | 1,097 |
TRW Automotive Holdings Corp.(b) | | 70,800 | | | 1,479 |
| | | | | |
| | | | | 2,576 |
| | | | | |
Automotive Retail—0.8% | | | | | |
AutoNation, Inc.(b) | | 66,961 | | | 1,049 |
| | | | | |
Brewers—1.6% | | | | | |
Molson Coors Brewing Co. Class B | | 43,000 | | | 2,220 |
| | | | | |
Commodity Chemicals—1.3% | | | | | |
Celanese Corp. Series A | | 40,800 | | | 1,727 |
| | | | | |
Communications Equipment—1.2% | | | | | |
CommScope, Inc.(b) | | 34,500 | | | 1,698 |
| | | | | |
Construction & Farm Machinery & Heavy Trucks—2.2% | | | | | |
AGCO Corp.(b) | | 23,600 | | | 1,604 |
Terex Corp.(b) | | 22,800 | | | 1,495 |
| | | | | |
| | | | | 3,099 |
| | | | | |
Department Stores—0.3% | | | | | |
Dillard’s, Inc. Class A | | 23,000 | | | 432 |
| | | | | |
Diversified Chemicals—1.2% | | | | | |
Ashland, Inc. | | 35,900 | | | 1,703 |
| | | | | |
Electric Utilities—3.8% | | | | | |
Allegheny Energy, Inc. | | 14,400 | | | 916 |
Northeast Utilities | | 61,800 | | | 1,935 |
Reliant Energy, Inc.(b) | | 94,000 | | | 2,466 |
| | | | | |
| | | | | 5,317 |
| | | | | |
Electrical Components & Equipment—4.8% | | | | | |
Acuity Brands, Inc. | | 25,100 | | | 1,129 |
Cooper Industries Ltd. Class A | | 34,300 | | | 1,814 |
EnerSys(b) | | 72,800 | | | 1,817 |
Regal-Beloit Corp. | | 41,800 | | | 1,879 |
| | | | | |
| | | | | 6,639 |
| | | | | |
Electronic Equipment Manufacturers—2.0% | | | | | |
AVX Corp. | | 22,400 | | | 301 |
Checkpoint Systems, Inc.(b) | | 43,800 | | | 1,138 |
Vishay Intertechnology, Inc.(b) | | 112,400 | | | 1,282 |
| | | | | |
| | | | | 2,721 |
| | | | | |
Electronic Manufacturing Services—0.2% | | | | | |
Sanmina-SCI Corp.(b) | | 167,000 | | | 304 |
| | | | | |
Food Distributors—1.4% | | | | | |
Performance Food Group Co.(b) | | 70,200 | | | 1,886 |
| | | | | |
Food Retail—2.8% | | | | | |
Ruddick Corp. | | 64,300 | | | 2,229 |
SUPERVALU, Inc. | | 41,800 | | | 1,569 |
| | | | | |
| | | | | 3,798 |
| | | | | |
Gas Utilities—0.7% | | | | | |
Atmos Energy Corp. | | 32,500 | | | 911 |
| | | | | |
Health Care Distributors—0.2% | | | | | |
PharMerica Corp.(b) | | 16,105 | | | 224 |
| | | | | |
Health Care Facilities—1.9% | | | | | |
Kindred Healthcare, Inc.(b) | | 44,000 | | | 1,099 |
LifePoint Hospitals, Inc.(b) | | 32,800 | | | 976 |
Universal Health Services, Inc. Class B | | 12,000 | | | 614 |
| | | | | |
| | | | | 2,689 |
| | | | | |
Health Care Services—0.8% | | | | | |
Apria Healthcare Group, Inc.(b) | | 29,600 | | | 638 |
Omnicare, Inc. | | 22,400 | | | 511 |
| | | | | |
| | | | | 1,149 |
| | | | | |
Home Furnishings—0.4% | | | | | |
Furniture Brands International, Inc. | | 59,700 | | | 601 |
| | | | | |
Homebuilding—0.3% | | | | | |
KB Home | | 17,500 | | | 378 |
| | | | | |
Human Resources & Employment Services—0.5% | | | | | |
Kelly Services, Inc. Class A | | 35,000 | | | 653 |
| | | | | |
Independent Power Producers & Energy Traders—0.9% | | | | | |
Constellation Energy Group, Inc. | | 12,400 | | | 1,271 |
| | | | | |
Industrial Machinery—4.9% | | | | | |
Briggs & Stratton Corp. | | 55,600 | | | 1,260 |
Kennametal, Inc. | | 53,000 | | | 2,007 |
Mueller Industries, Inc. | | 41,800 | | | 1,212 |
SPX Corp. | | 22,900 | | | 2,355 |
| | | | | |
| | | | | 6,834 |
| | | | | |
Integrated Oil & Gas—2.6% | | | | | |
Hess Corp. | | 36,100 | | | 3,641 |
| | | | | |
Leisure Products—0.4% | | | | | |
Brunswick Corp. | | 35,100 | | | 598 |
| | | | | |
Life & Health Insurance—1.3% | | | | | |
StanCorp Financial Group, Inc. | | 36,200 | | | 1,824 |
| | | | | |
Life Sciences Tools & Services—1.5% | | | | | |
PerkinElmer, Inc. | | 82,000 | | | 2,134 |
| | | | | |
Managed Health Care—1.4% | | | | | |
Molina Healthcare, Inc.(b) | | 48,800 | | | 1,889 |
| | | | | |
Metal & Glass Containers—1.6% | | | | | |
AptarGroup, Inc. | | 22,200 | | | 908 |
Owens-Illinois, Inc.(b) | | 4,500 | | | 223 |
Silgan Holdings, Inc. | | 20,700 | | | 1,075 |
| | | | | |
| | | | | 2,206 |
| | | | | |
Multi-Utilities—1.6% | | | | | |
Puget Energy, Inc. | | 25,300 | | | 694 |
Wisconsin Energy Corp. | | 29,800 | | | 1,452 |
| | | | | |
| | | | | 2,146 |
| | | | | |
Office REITs—0.9% | | | | | |
Digital Realty Trust, Inc. | | 31,500 | | | 1,209 |
| | | | | |
Office Services & Supplies—2.2% | | | | | |
IKON Office Solutions, Inc. | | 125,300 | | | 1,632 |
United Stationers, Inc.(b) | | 30,000 | | | 1,386 |
| | | | | |
| | | | | 3,018 |
| | | | | |
Oil & Gas Drilling—0.4% | | | | | |
Rowan Cos., Inc. | | 14,800 | | | 584 |
| | | | | |
Oil & Gas Equipment & Services—2.0% | | | | | |
Exterran Holdings, Inc.(b) | | 16,800 | | | 1,374 |
Oil States International, Inc.(b) | | 41,500 | | | 1,416 |
| | | | | |
| | | | | 2,790 |
| | | | | |
Packaged Foods & Meats—0.5% | | | | | |
Smithfield Foods, Inc.(b) | | 22,800 | | | 659 |
| | | | | |
Paper Packaging—0.5% | | | | | |
Sonoco Products Co. | | 20,500 | | | 670 |
| | | | | |
See Notes to Financial Statements
83
PHOENIX-SANFORD BERNSTEIN MID-CAP VALUE SERIES
| | | | | | |
| | | SHARES | | VALUE
(000) | |
Property & Casualty Insurance—1.8% | | | | | | |
Fidelity National Financial, Inc. Class A | | 75,900 | | $ | 1,109 | |
Old Republic International Corp. | | 92,500 | | | 1,425 | |
| | | | | | |
| | | | | 2,534 | |
| | | | | | |
Regional Banks—5.6% | | | | | | |
Central Pacific Financial Corp. | | 53,800 | | | 993 | |
South Financial Group, Inc. (The) | | 60,900 | | | 952 | |
Susquehanna Bancshares, Inc. | | 70,600 | | | 1,302 | |
Trustmark Corp. | | 54,834 | | | 1,390 | |
UnionBanCal Corp. | | 14,500 | | | 709 | |
Webster Financial Corp. | | 44,100 | | | 1,410 | |
Whitney Holding Corp. | | 38,500 | | | 1,007 | |
| | | | | | |
| | | | | 7,763 | |
| | | | | | |
Residential REITs—0.5% | | | | | | |
Mid-America Apartment Communities, Inc. | | 16,000 | | | 684 | |
| | | | | | |
Restaurants—0.6% | | | | | | |
Jack in the Box, Inc.(b) | | 12,900 | | | 332 | |
Papa John’s International, Inc.(b) | | 19,500 | | | 443 | |
| | | | | | |
| | | | | 775 | |
| | | | | | |
Retail REITs—1.0% | | | | | | |
Tanger Factory Outlet Centers | | 17,800 | | | 671 | |
Taubman Centers, Inc. | | 13,400 | | | 659 | |
| | | | | | |
| | | | | 1,330 | |
| | | | | | |
Semiconductor Equipment—0.3% | | | | | | |
Teradyne, Inc.(b) | | 45,000 | | | 465 | |
| | | | | | |
Semiconductors—1.9% | | | | | | |
Amkor Technology, Inc.(b) | | 79,400 | | | 677 | |
Spansion, Inc. Class A(b) | | 78,000 | | | 307 | |
Zoran Corp.(b) | | 72,900 | | | 1,641 | |
| | | | | | |
| | | | | 2,625 | |
| | | | | | |
Specialized REITs—1.4% | | | | | | |
Ashford Hospitality Trust, Inc. | | 68,000 | | | 489 | |
FelCor Lodging Trust, Inc. | | 60,700 | | | 946 | |
Strategic Hotels & Resorts, Inc. | | 30,500 | | | 510 | |
| | | | | | |
| | | | | 1,945 | |
| | | | | | |
Specialty Chemicals—4.2% | | | | | | |
Cytec Industries, Inc. | | 32,600 | | | 2,008 | |
Lubrizol Corp. (The) | | 27,000 | | | 1,462 | |
Rockwood Holdings, Inc.(b) | | 64,900 | | | 2,156 | |
Zep, Inc.(b) | | 12,550 | | | 174 | |
| | | | | 5,800 | |
Specialty Stores—0.1% | | | | | | |
Office Depot, Inc. (b) | | 9,000 | | | 125 | |
| | | | | | |
Steel—5.0% | | | | | | |
Cleveland-Cliffs, Inc. | | 3,000 | | | 302 | |
Commercial Metals Co. | | 49,900 | | | 1,470 | |
Metal Management, Inc. | | 21,700 | | | 988 | |
Quanex Corp. | | 33,200 | | | 1,723 | |
Steel Dynamics, Inc. | | 40,200 | | | 2,395 | |
| | | | | | |
| | | | | 6,878 | |
| | | | | | |
Technology Distributors—1.5% | | | | | | |
Arrow Electronics, Inc.(b) | | 40,500 | | | 1,591 | |
Tech Data Corp.(b) | | 13,500 | | | 509 | |
| | | | | | |
| | | | | 2,100 | |
| | | | | | |
Thrifts & Mortgage Finance—1.8% | | | | | | |
Astoria Financial Corp. | | 51,750 | | | 1,204 | |
Provident Financial Services, Inc. | | 87,500 | | | 1,262 | |
| | | | | | |
| | | | | 2,466 | |
| | | | | | |
Tobacco—1.5% | | | | | | |
Universal Corp. | | 41,300 | | | 2,115 | |
| | | | | | |
Trading Companies & Distributors—1.3% | | | | | | |
GATX Corp. | | 49,100 | | | 1,801 | |
| | | | | | |
Trucking—4.4% | | | | | | |
Arkansas Best Corp. | | 41,000 | | | 900 | |
Avis Budget Group, Inc.(b) | | 84,800 | | | 1,102 | |
Con-Way, Inc. | | 35,000 | | | 1,454 | |
Ryder System, Inc. | | 29,100 | | | 1,368 | |
Werner Enterprises, Inc. | | 76,500 | | | 1,303 | |
| | | | | | |
| | | | | 6,127 | |
| | | | | | |
Total Domestic Common Stocks (Identified Cost $ 116,046) | | | | | 124,389 | |
| | | | | | |
FOREIGN COMMON STOCKS(c)—7.4% | | | | | | |
| | |
Auto Parts & Equipment—0.4% | | | | | | |
Autoliv, Inc. (Sweden) | | 12,000 | | | 633 | |
| | | | | | |
Commercial Printing—0.1% | | | | | | |
Quebecor World, Inc. (Canada)(b) | | 53,000 | | | 95 | |
| | | | | | |
Commodity Chemicals—0.6% | | | | | | |
Methanex Corp. (Canada) | | 29,800 | | | 823 | |
| | | | | | |
Electronic Manufacturing Services—0.4% | | | | | | |
Flextronics International Ltd. (Singapore)(b) | | 47,229 | | | 570 | |
| | | | | | |
Property & Casualty Insurance—1.4% | | | | | | |
Aspen Insurance Holdings Ltd. (United States) | | 66,100 | | | 1,906 | |
| | | | | | |
Reinsurance—4.5% | | | | | | |
Arch Capital Group Ltd. (United States)(b) | | 37,500 | | | 2,638 | |
PartnerRe Ltd. (United States) | | 6,700 | | | 553 | |
Platinum Underwriters Holdings Ltd. (United States) | | 64,000 | | | 2,276 | |
RenaissanceRe Holdings Ltd. (United States) | | 13,500 | | | 813 | |
| | | | | | |
| | | | | 6,280 | |
| | | | | | |
Total Foreign Common Stocks (Identified Cost $9,844) | | | | | 10,307 | |
| | | | | | |
TOTAL LONG TERM INVESTMENTS—97.4% (Identified cost $125,890) | | | | | 134,696 | |
| | | | | | |
SHORT-TERM INVESTMENTS—2.4% | | | | | | |
| | |
Money Market Mutual Funds—2.4% | | | | | | |
SSgA Money Market Fund
(4.96% seven-day effective yield) | | 3,316,443 | | | 3,316 | |
| | | | | | |
Total Short-Term Investments (Identified Cost $3,316) | | | | | 3,316 | |
| | | | | | |
TOTAL INVESTMENTS—99.8% (Identified Cost $129,206) | | | | | 138,012 | (a) |
Other assets and liabilities, net—0.2% | | | | | 242 | |
| | | | | | |
NET ASSETS—100.0% | | | | $ | 138,254 | |
| | | | | | |
(a) | Federal Income Tax Information (reported in 000’s): Net unrealized appreciation of investment securities is comprised of gross appreciation of $26,013 and gross depreciation of $17,207 for federal income tax purposes. At December 31, 2007, the aggregate cost of securities for federal income tax purposes was $129,206. |
(c) | A security is considered to be foreign if the security is issued in a foreign country. The country of risk, noted parenthetically, is determined based on criteria described in Note 2G, “Foreign security country determination” in the Notes to Financial Statements. |
See Notes to Financial Statements
84
PHOENIX-SANFORD BERNSTEIN SMALL-CAP VALUE SERIES
SCHEDULE OF INVESTMENTS
DECEMBER 31, 2007
| | | | | |
| | | SHARES | | VALUE
(000) |
DOMESTIC COMMON STOCKS—91.8% | | | | | |
| | |
Airlines—1.7% | | | | | |
Alaska Air Group, Inc.(b) | | 19,100 | | $ | 478 |
Continental Airlines, Inc. Class B(b) | | 14,500 | | | 322 |
SkyWest, Inc. | | 16,500 | | | 443 |
| | | | | |
| | | | | 1,243 |
| | | | | |
Apparel Retail—1.0% | | | | | |
Shoe Carnival, Inc.(b) | | 53,800 | | | 759 |
| | | | | |
Apparel, Accessories & Luxury Goods—0.3% | | | | | |
Jones Apparel Group, Inc. | | 11,600 | | | 186 |
| | | | | |
Auto Parts & Equipment—1.9% | | | | | |
ArvinMeritor, Inc. | | 56,800 | | | 666 |
TRW Automotive Holdings Corp.(b) | | 33,400 | | | 698 |
| | | | | |
| | | | | 1,364 |
| | | | | |
Automobile Manufacturers—0.5% | | | | | |
Monaco Coach Corp. | | 39,800 | | | 353 |
| | | | | |
Automotive Retail—1.0% | | | | | |
Sonic Automotive, Inc. Class A | | 36,250 | | | 702 |
| | | | | |
Communications Equipment—1.5% | | | | | |
CommScope, Inc.(b) | | 22,100 | | | 1,088 |
| | | | | |
Construction & Farm Machinery & Heavy Trucks—3.6% | | | | | |
Accuride Corp.(b) | | 94,875 | | | 746 |
Commercial Vehicle Group, Inc.(b) | | 65,500 | | | 950 |
Terex Corp.(b) | | 14,300 | | | 937 |
| | | | | |
| | | | | 2,633 |
| | | | | |
Department Stores—0.3% | | | | | |
Dillard’s, Inc. Class A | | 13,200 | | | 248 |
| | | | | |
Diversified Commercial & Professional Services—0.5% | | | | | |
Angelica Corp. | | 20,575 | | | 393 |
| | | | | |
Electric Utilities—1.4% | | | | | |
Northeast Utilities | | 33,150 | | | 1,038 |
| | | | | |
Electrical Components & Equipment—3.7% | | | | | |
Acuity Brands, Inc. | | 14,100 | | | 635 |
EnerSys(b) | | 55,300 | | | 1,380 |
Regal-Beloit Corp. | | 16,000 | | | 719 |
| | | | | |
| | | | | 2,734 |
| | | | | |
Electronic Equipment Manufacturers—2.0% | | | | | |
AVX Corp. | | 13,600 | | | 183 |
Checkpoint Systems, Inc.(b) | | 22,600 | | | 587 |
Vishay Intertechnology, Inc.(b) | | 63,400 | | | 723 |
| | | | | |
| | | | | 1,493 |
| | | | | |
Electronic Manufacturing Services—1.3% | | | | | |
CTS Corp. | | 76,100 | | | 756 |
Sanmina-SCI Corp.(b) | | 85,500 | | | 155 |
| | | | | |
| | | | | 911 |
| | | | | |
Food Distributors—1.2% | | | | | |
Performance Food Group Co.(b) | | 33,900 | | | 911 |
| | | | | |
Food Retail—1.8% | | | | | |
Ruddick Corp. | | 37,500 | | | 1,300 |
| | | | | |
Gas Utilities—0.5% | | | | | |
Atmos Energy Corp. | | 14,200 | | | 398 |
| | | | | |
Health Care Distributors—0.2% | | | | | |
PharMerica Corp.(b) | | 9,626 | | | 134 |
| | | | | |
Health Care Equipment—2.0% | | | | | |
CONMED Corp.(b) | | 23,100 | | | 534 |
Datascope Corp. | | 25,600 | | | 932 |
| | | | | |
| | | | | 1,466 |
| | | | | |
Health Care Facilities—2.7% | | | | | |
Five Star Quality Care, Inc. | | 58,000 | | | 482 |
Kindred Healthcare, Inc.(b) | | 26,300 | | | 657 |
LifePoint Hospitals, Inc.(b) | | 15,200 | | | 452 |
Universal Health Services, Inc. Class B | | 7,600 | | | 389 |
| | | | | |
| | | | | 1,980 |
| | | | | |
Health Care Services—1.3% | | | | | |
Apria Healthcare Group, Inc.(b) | | 15,800 | | | 341 |
Gentiva Health Services, Inc.(b) | | 31,700 | | | 603 |
| | | | | |
| | | | | 944 |
| | | | | |
Home Furnishings—0.5% | | | | | |
Furniture Brands International, Inc. | | 36,300 | | | 365 |
| | | | | |
Homebuilding—0.3% | | | | | |
KB Home | | 10,200 | | | 220 |
| | | | | |
Human Resources & Employment Services—0.5% | | | | | |
Kelly Services, Inc. Class A | | 19,900 | | | 371 |
| | | | | |
Industrial Machinery—7.4% | | | | | |
Briggs & Stratton Corp. | | 31,900 | | | 723 |
Columbus McKinnon Corp.(b) | | 44,700 | | | 1,458 |
Hurco Cos., Inc.(b) | | 3,000 | | | 131 |
Kennametal, Inc. | | 26,000 | | | 984 |
Lydall, Inc.(b) | | 35,900 | | | 378 |
Mueller Industries, Inc. | | 22,200 | | | 644 |
Robbins & Myers, Inc. | | 14,400 | | | 1,089 |
| | | | | |
| | | | | 5,407 |
| | | | | |
Leisure Products—0.6% | | | | | |
Brunswick Corp. | | 14,300 | | | 244 |
Steinway Musical Instruments, Inc. | | 7,200 | | | 198 |
| | | | | |
| | | | | 442 |
| | | | | |
Life & Health Insurance—1.4% | | | | | |
StanCorp Financial Group, Inc. | | 20,100 | | | 1,013 |
| | | | | |
Life Sciences Tools & Services—1.4% | | | | | |
PerkinElmer, Inc. | | 40,500 | | | 1,054 |
| | | | | |
Managed Health Care—1.6% | | | | | |
Molina Healthcare, Inc.(b) | | 29,600 | | | 1,146 |
| | | | | |
Metal & Glass Containers—2.6% | | | | | |
AptarGroup, Inc. | | 12,600 | | | 515 |
Myers Industries, Inc. | | 29,900 | | | 433 |
Silgan Holdings, Inc. | | 18,600 | | | 966 |
| | | | | |
| | | | | 1,914 |
| | | | | |
Multi-line Insurance—0.5% | | | | | |
American National Insurance Co. | | 2,700 | | | 327 |
| | | | | |
Multi-Utilities—0.5% | | | | | |
Puget Energy, Inc. | | 13,600 | | | 373 |
| | | | | |
Office REITs—0.9% | | | | | |
Digital Realty Trust, Inc. | | 17,100 | | | 656 |
| | | | | |
Office Services & Supplies—1.3% | | | | | |
IKON Office Solutions, Inc. | | 75,200 | | | 979 |
| | | | | |
Oil & Gas Equipment & Services—2.4% | | | | | |
Bristow Group, Inc.(b) | | 5,400 | | | 306 |
Exterran Holdings, Inc.(b) | | 8,900 | | | 728 |
Oil States International, Inc.(b) | | 21,600 | | | 737 |
| | | | | |
| | | | | 1,771 |
| | | | | |
Packaged Foods & Meats—2.6% | | | | | |
J & J Snack Foods Corp. | | 14,000 | | | 438 |
Sanderson Farms, Inc. | | 11,000 | | | 372 |
Smithfield Foods, Inc.(b) | | 37,561 | | | 1,086 |
| | | | | |
| | | | | 1,896 |
| | | | | |
Paper Packaging—0.6% | | | | | |
Rock-Tenn Co. Class A | | 18,300 | | | 465 |
| | | | | |
Paper Products—1.0% | | | | | |
Schweitzer-Mauduit | | | | | |
International, Inc. | | 27,525 | | | 713 |
| | | | | |
See Notes to Financial Statements
85
PHOENIX-SANFORD BERNSTEIN SMALL-CAP VALUE SERIES
| | | | | | |
| | | SHARES | | VALUE
(000) | |
Property & Casualty Insurance—2.1% | | | | | | |
American Physicians Capital, Inc. | | 28,950 | | $ | 1,200 | |
Harleysville Group, Inc. | | 9,500 | | | 336 | |
| | | | | | |
| | | | | 1,536 | |
| | | | | | |
Regional Banks—6.7% | | | | | | |
AmericanWest Bancorp | | 10,500 | | | 185 | |
Banner Corp. | | 18,600 | | | 535 | |
Central Pacific Financial Corp. | | 31,000 | | | 572 | |
Community Bank System, Inc. | | 17,600 | | | 350 | |
South Financial Group, Inc. (The) | | 38,400 | | | 600 | |
Susquehanna Bancshares, Inc. | | 33,900 | | | 625 | |
Trustmark Corp. | | 34,900 | | | 885 | |
Webster Financial Corp. | | 24,500 | | | 783 | |
Whitney Holding Corp. | | 12,800 | | | 335 | |
| | | | | | |
| | | | | 4,870 | |
| | | | | | |
Residential REITs—0.7% | | | | | | |
Mid-America Apartment Communities, Inc. | | 12,400 | | | 530 | |
| | | | | | |
Restaurants—1.0% | | | | | | |
Jack in the Box, Inc.(b) | | 7,000 | | | 180 | |
Papa John’s International, Inc.(b) | | 23,600 | | | 536 | |
| | | | | | |
| | | | | 716 | |
| | | | | | |
Retail REITs—1.0% | | | | | | |
Tanger Factory Outlet Centers | | 10,300 | | | 388 | |
Taubman Centers, Inc. | | 7,600 | | | 374 | |
| | | | | | |
| | | | | 762 | |
| | | | | | |
Semiconductors—1.8% | | | | | | |
Amkor Technology, Inc.(b) | | 30,100 | | | 257 | |
Spansion, Inc. Class A(b) | | 44,400 | | | 175 | |
Zoran Corp.(b) | | 37,600 | | | 846 | |
| | | | | | |
| | | | | 1,278 | |
| | | | | | |
Specialized Consumer Services—0.5% | | | | | | |
Steiner Leisure Ltd.(b) | | 9,000 | | | 397 | |
| | | | | | |
Specialized REITs—1.7% | | | | | | |
Ashford Hospitality Trust, Inc. | | 38,000 | | | 273 | |
FelCor Lodging Trust, Inc. | | 40,100 | | | 625 | |
Strategic Hotels & Resorts, Inc. | | 18,500 | | | 310 | |
| | | | | | |
| | | | | 1,208 | |
| | | | | | |
Specialty Chemicals—4.5% | | | | | | |
Cytec Industries, Inc. | | 18,700 | | | 1,151 | |
PolyOne Corp.(b) | | 120,300 | | | 792 | |
Rockwood Holdings, Inc.(b) | | 38,600 | | | 1,282 | |
Zep, Inc.(b) | | 7,050 | | | 98 | |
| | | | | | |
| | | | | 3,323 | |
| | | | | | |
Steel—5.2% | | | | | | |
Commercial Metals Co. | | 35,100 | | | 1,034 | |
Metal Management, Inc. | | 11,800 | | | 537 | |
Quanex Corp. | | 18,000 | | | 934 | |
Steel Dynamics, Inc. | | 21,500 | | | 1,281 | |
| | | | | | |
| | | | | 3,786 | |
| | | | | | |
Technology Distributors—0.8% | | | | | | |
PC Connection, Inc.(b) | | 51,200 | | | 581 | |
| | | | | | |
Thrifts & Mortgage Finance—1.7% | | | | | | |
Astoria Financial Corp. | | 26,450 | | | 615 | |
Provident Financial Services, Inc. | | 45,400 | | | 655 | |
| | | | | | |
| | | | | 1,270 | |
| | | | | | |
Tobacco—1.5% | | | | | | |
Universal Corp. | | 21,200 | | | 1,086 | |
| | | | | | |
Trading Companies & Distributors—2.7% | | | | | | |
GATX Corp. | | 25,200 | | | 925 | |
Kaman Corp. | | 29,100 | | | 1,071 | |
| | | | | | |
| | | | | 1,996 | |
| | | | | | |
Trucking—3.4% | | | | | | |
Arkansas Best Corp. | | 20,000 | | | 439 | |
Avis Budget Group, Inc.(b) | | 36,100 | | | 469 | |
Con-Way, Inc. | | 15,900 | | | 661 | |
Dollar Thrifty Automotive Group, Inc.(b) | | 15,200 | | | 360 | |
Werner Enterprises, Inc. | | 34,200 | | | 582 | |
| | | | | | |
| | | | | 2,511 | |
| | | | | | |
Total Domestic Common Stocks (Identified Cost $65,084) | | | | | 67,240 | |
| | | | | | |
FOREIGN COMMON STOCKS(c)—6.7% | | | | | | |
| | |
Broadcasting & Cable TV—0.2% | | | | | | |
Corus Entertainment, Inc. Class B (Canada) | | 2,900 | | | 143 | |
| | | | | | |
Commercial Printing—0.1% | | | | | | |
Quebecor World, Inc. (Canada)(b) | | 33,500 | | | 60 | |
| | | | | | |
Commodity Chemicals—0.7% | | | | | | |
Methanex Corp. (Canada) | | 17,800 | | | 491 | |
| | | | | | |
Property & Casualty Insurance—1.6% | | | | | | |
Aspen Insurance Holdings Ltd. (United States) | | 40,700 | | | 1,174 | |
| | | | | | |
Reinsurance—4.1% | | | | | | |
Arch Capital Group Ltd. (United States)(b) | | 20,000 | | | 1,407 | |
PartnerRe Ltd. (United States) | | 2,900 | | | 239 | |
Platinum Underwriters Holdings Ltd. (United States) | | 38,400 | | | 1,366 | |
| | | | | | |
| | | | | 3,012 | |
| | | | | | |
Total Foreign Common Stocks (Identified Cost $4,452) | | | | | 4,880 | |
| | | | | | |
TOTAL LONG TERM INVESTMENTS—98.5% (Identified cost $69,536) | | | | | 72,120 | |
| | | | | | |
SHORT-TERM INVESTMENTS—1.3% | | | | | | |
| | |
Money Market Mutual Funds—1.3% | | | | | | |
SSgA Money Market Fund
(4.96% seven-day effective yield) | | 971,359 | | | 971 | |
| | | | | | |
Total Short-Term Investments (Identified Cost $971) | | | | | 971 | |
| | | | | | |
TOTAL INVESTMENTS—99.8% (Identified Cost $70,507) | | | | | 73,091 | (a) |
Other assets and liabilities, net—0.2% | | | | | 151 | |
| | | | | | |
NET ASSETS—100.0% | | | | $ | 73,242 | |
| | | | | | |
(a) | Federal Income Tax Information (reported in 000’s): Net unrealized appreciation of investment securities is comprised of gross appreciation of $11,932 and gross depreciation of $9,348 for federal income tax purposes. At December 31, 2007, the aggregate cost of securities for federal income tax purposes was $70,507. |
(c) | A security is considered to be foreign if the security is issued in a foreign country. The country of risk, noted parenthetically, is determined based on criteria described in Note 2G, “Foreign security country determination” in the Notes to Financial Statements. |
See Notes to Financial Statements
86
PHOENIX-VAN KAMPEN COMSTOCK SERIES
SCHEDULE OF INVESTMENTS
DECEMBER 31, 2007
| | | | | |
| | | SHARES | | VALUE
(000) |
DOMESTIC COMMON STOCKS—87.9% | | | | | |
| | |
Airlines—0.6% | | | | | |
Southwest Airlines Co. | | 45,000 | | $ | 549 |
| | | | | |
Aluminum—0.8% | | | | | |
Alcoa, Inc. | | 19,000 | | | 694 |
| | | | | |
Asset Management & Custody Banks—1.9% | | | | | |
Bank of New York Mellon Corp. (The) | | 34,245 | | | 1,670 |
| | | | | |
Brewers—0.9% | | | | | |
Anheuser-Busch Cos., Inc. | | 14,300 | | | 748 |
| | | | | |
Broadcasting & Cable TV—3.5% | | | | | |
Comcast Corp. Class A(b) | | 116,050 | | | 2,119 |
Liberty Media Corp. – Capital Class A(b) | | 8,395 | | | 978 |
| | | | | |
| | | | | 3,097 |
Catalog Retail—0.9% | | | | | |
Liberty Media Corp. – Interactive Class A(b) | | 40,975 | | | 782 |
| | | | | |
Computer Hardware—2.6% | | | | | |
Dell, Inc.(b) | | 32,700 | | | 802 |
Hewlett-Packard Co. | | 10,700 | | | 540 |
International Business Machines Corp. | | 8,200 | | | 886 |
| | | | | |
| | | | | 2,228 |
| | | | | |
Data Processing & Outsourced Services—0.8% | | | | | |
Computer Sciences Corp.(b) | | 5,700 | | | 282 |
Western Union Co. (The) | | 17,700 | | | 430 |
| | | | | |
| | | | | 712 |
| | | | | |
Diversified Banks—4.9% | | | | | |
U.S. Bancorp | | 16,700 | | | 530 |
Wachovia Corp. | | 58,800 | | | 2,236 |
Wells Fargo & Co. | | 48,600 | | | 1,467 |
| | | | | |
| | | | | 4,233 |
| | | | | |
Diversified Chemicals—2.5% | | | | | |
E.I. du Pont de Nemours & Co. | | 48,900 | | | 2,156 |
| | | | | |
Drug Retail—1.9% | | | | | |
CVS Caremark Corp. | | 41,300 | | | 1,642 |
| | | | | |
Gold—0.2% | | | | | |
Newmont Mining Corp. | | 3,000 | | | 147 |
| | | | | |
Health Care Distributors—1.4% | | | | | |
Cardinal Health, Inc. | | 20,800 | | | 1,201 |
| | | | | |
Health Care Equipment—0.6% | | | | | |
Boston Scientific Corp. | | 46,400 | | | 540 |
| | | | | |
Home Improvement Retail—0.6% | | | | | |
Home Depot, Inc. (The) | | 9,600 | | | 259 |
Lowe’s Cos., Inc. | | 12,200 | | | 276 |
| | | | | |
| | | | | 535 |
| | | | | |
Household Products—2.5% | | | | | |
Kimberly-Clark Corp. | | 20,100 | | | 1,394 |
Procter & Gamble Co. (The) | | 11,300 | | | 829 |
| | | | | |
| | | | | 2,223 |
| | | | | |
Hypermarkets & Super Centers—2.9% | | | | | |
Wal-Mart Stores, Inc. | | 53,300 | | | 2,533 |
| | | | | |
Industrial Conglomerates—1.3% | | | | | |
General Electric Co. | | 31,200 | | | 1,157 |
| | | | | |
Integrated Telecommunication Services—4.8% | | | | | |
AT&T, Inc. | | 31,600 | | | 1,313 |
Verizon Communications, Inc. | | 66,400 | | | 2,901 |
| | | | | |
| | | | | 4,214 |
| | | | | |
Investment Banking & Brokerage—1.5% | | | | | |
Bear Stearns Cos., Inc. (The) | | 4,600 | | | 406 |
Merrill Lynch & Co., Inc. | | 17,100 | | | 918 |
| | | | | |
| | | | | 1,324 |
| | | | | |
Life & Health Insurance—2.1% | | | | | |
AFLAC, Inc. | | 6,900 | | | 432 |
MetLife, Inc. | | 13,500 | | | 832 |
Torchmark Corp. | | 9,800 | | | 593 |
| | | | | |
| | | | | 1,857 |
| | | | | |
Managed Health Care—0.8% | | | | | |
UnitedHealth Group, Inc. | | 6,100 | | | 355 |
WellPoint, Inc.(b) | | 3,400 | | | 298 |
| | | | | |
| | | | | 653 |
| | | | | |
Movies & Entertainment—6.5% | | | | | |
News Corp. Class B | | 44,600 | | | 948 |
Time Warner, Inc. | | 124,800 | | | 2,061 |
Viacom, Inc. Class B(b) | | 59,800 | | | 2,626 |
| | | | | |
| | | | | 5,635 |
| | | | | |
Multi-line Insurance—1.8% | | | | | |
American International Group, Inc. | | 15,100 | | | 880 |
Genworth Financial, Inc. Class A | | 12,000 | | | 306 |
Hartford Financial Services Group, Inc. (The) | | 3,900 | | | 340 |
| | | | | |
| | | | | 1,526 |
| | | | | |
Other Diversified Financial Services—7.4% | | | | | |
Bank of America Corp. | | 71,500 | | | 2,950 |
Citigroup, Inc. | | 75,900 | | | 2,235 |
JPMorgan Chase & Co. | | 29,700 | | | 1,296 |
| | | | | |
| | | | | 6,481 |
| | | | | |
Packaged Foods & Meats—2.4% | | | | | |
Kraft Foods, Inc. Class A | | 54,924 | | | 1,792 |
Sara Lee Corp. | | 17,800 | | | 286 |
| | | | | |
| | | | | 2,078 |
| | | | | |
Paper Products—3.9% | | | | | |
International Paper Co. | | 104,400 | | | 3,380 |
| | | | | |
Pharmaceuticals—13.0% | | | | | |
Abbott Laboratories | | 26,100 | | | 1,465 |
Bristol-Myers Squibb Co. | | 105,400 | | | 2,795 |
Lilly (Eli) & Co. | | 26,900 | | | 1,436 |
Pfizer, Inc. | | 68,000 | | | 1,546 |
Schering-Plough Corp. | | 77,400 | | | 2,062 |
Wyeth | | 47,200 | | | 2,086 |
| | | | | |
| | | | | 11,390 |
| | | | | |
Property & Casualty Insurance—4.0% | | | | | |
Berkshire Hathaway, Inc. Class B(b) | | 100 | | | 474 |
Chubb Corp. (The) | | 39,700 | | | 2,167 |
MBIA, Inc. | | 5,700 | | | 106 |
Travelers Cos., Inc. (The) | | 13,200 | | | 710 |
| | | | | |
| | | | | 3,457 |
| | | | | |
Regional Banks—1.0% | | | | | |
PNC Financial Services Group, Inc. (The) | | 13,500 | | | 886 |
| | | | | |
Semiconductor Equipment—0.3% | | | | | |
KLA-Tencor Corp. | | 6,100 | | | 294 |
| | | | | |
Semiconductors—1.0% | | | | | |
Intel Corp. | | 21,400 | | | 570 |
Texas Instruments, Inc. | | 9,300 | | | 311 |
| | | | | |
| | | | | 881 |
| | | | | |
See Notes to Financial Statements
87
PHOENIX-VAN KAMPEN COMSTOCK SERIES
| | | | | | |
| | | SHARES | | VALUE
(000) | |
Soft Drinks—2.2% | | | | | | |
Coca-Cola Co. (The) | | 31,400 | | $ | 1,927 | |
| | | | | | |
Specialty Chemicals—0.9% | | | | | | |
Rohm & Haas Co. | | 15,000 | | | 796 | |
| | | | | | |
Systems Software—0.6% | | | | | | |
Microsoft Corp. | | 15,800 | | | 563 | |
| | | | | | |
Thrifts & Mortgage Finance—1.2% | | | | | | |
Fannie Mae | | 6,800 | | | 272 | |
Freddie Mac | | 23,600 | | | 804 | |
| | | | | | |
| | | | | 1,076 | |
| | | | | | |
Tobacco—1.7% | | | | | | |
Altria Group, Inc. | | 19,900 | | | 1,504 | |
| | | | | | |
Total Domestic Common Stocks (Identified Cost $73,164) | | | | | 76,769 | |
| | | | | | |
| | |
FOREIGN COMMON STOCKS(c) —6.7% | | | | | | |
| | |
Communications Equipment—0.3% | | | | | | |
Alcatel SA Sponsored ADR (France) | | 6,000 | | | 44 | |
Telefonaktiebolaget LM Ericsson Sponsored ADR (Sweden) | | 9,000 | | | 210 | |
| | | | | | |
| | | | | 254 | |
| | | | | | |
Diversified Banks—0.1% | | | | | | |
Barclays plc Sponsored ADR (United Kingdom) | | 3,300 | | | 133 | |
| | | | | | |
Packaged Foods & Meats—4.9% | | | | | | |
Cadbury Schweppes plc Sponsored ADR (United Kingdom) | | 40,800 | | | 2,014 | |
Unilever N.V. NY Registered Shares (Netherlands) | | 61,600 | | | 2,246 | |
| | | | | | |
| | | | | 4,260 | |
| | | | | | |
Pharmaceuticals—1.4% | | | | | | |
GlaxoSmithKline plc Sponsored ADR (United Kingdom) | | 16,800 | | | 846 | |
Roche Holding AG Sponsored ADR (Switzerland) | | 4,600 | | | 393 | |
| | | | | | |
| | | | | 1,239 | |
| | | | | | |
Total Foreign Common Stocks (Identified Cost $4,912) | | | | | 5,886 | |
| | | | | | |
TOTAL LONG TERM INVESTMENTS—94.6% (Identified cost $78,076) | | | | | 82,655 | |
| | | | | | |
| | |
SHORT-TERM INVESTMENTS—5.3% | | | | | | |
Federal Agency Securities(d) —5.3% | | | | | | |
FHLB
3.250% due 1/2/08 | | 4,600 | | | 4,600 | |
| | | | | | |
Total Short-Term Investments (Identified Cost $4,600) | | | | | 4,600 | |
| | | | | | |
TOTAL INVESTMENTS—99.9% (Identified Cost$ 82,676) | | | | | 87,255 | (a) |
Other assets and liabilities, net—0.1% | | | | | 117 | |
| | | | | | |
NET ASSETS—100.0% | | | | $ | 87,372 | |
| | | | | | |
(a) | Federal Income Tax Information (reported in 000’s): Net unrealized appreciation of investment securities is comprised of gross appreciation of $9,948 and gross depreciation of $5,650 for federal income tax purposes. At December 31, 2007, the aggregate cost of securities for federal income tax purposes was $82,957. |
(c) | A security is considered to be foreign if the security is issued in a foreign country. The country of risk, noted parenthetically, is determined based on criteria described in Note 2G, “Foreign Security Country Determination” in the Notes to Financial Statements. |
(d) | The rate shown is the discount rate. |
See Notes to Financial Statements
88
PHOENIX-VAN KAMPEN EQUITY 500 INDEX SERIES
SCHEDULE OF INVESTMENTS
DECEMBER 31, 2007
| | | | | | |
| | | SHARES | | VALUE
(000) | |
DOMESTIC COMMON STOCKS—97.5% | | | | | | |
| | |
Advertising—0.1% | | | | | | |
Interpublic Group of Cos., Inc. (The)(b) | | 4,463 | | $ | 36 | |
Omnicom Group, Inc. | | 3,108 | | | 148 | |
| | | | | | |
| | | | | 184 | |
| | | | | | |
Aerospace & Defense—2.8% | | | | | | |
Boeing Co. (The) | | 7,360 | | | 644 | |
General Dynamics Corp. | | 3,840 | | | 342 | |
Goodrich Corp. | | 1,185 | | | 84 | |
Honeywell International, Inc. | | 7,083 | | | 436 | |
L-3 Communications Holdings, Inc. | | 1,193 | | | 126 | |
Lockheed Martin Corp. | | 3,287 | | | 346 | |
Northrop Grumman Corp. | | 3,210 | | | 252 | |
Precision Castparts Corp. | | 1,302 | | | 181 | |
Raytheon Co. | | 4,080 | | | 248 | |
Rockwell Collins, Inc. | | 1,550 | | | 111 | |
United Technologies Corp. | | 9,387 | | | 718 | |
| | | | | | |
| | | | | 3,488 | |
| | | | | | |
Agricultural Products—0.2% | | | | | | |
Archer-Daniels-Midland Co. | | 6,092 | | | 283 | |
| | | | | | |
Air Freight & Logistics—0.9% | | | | | | |
Expeditors International of Washington, Inc. | | 2,020 | | | 90 | |
FedEx Corp. | | 2,923 | | | 261 | |
Robinson (C.H.) Worldwide, Inc. | | 1,634 | | | 88 | |
United Parcel Service, Inc. Class B | | 9,980 | | | 706 | |
| | | | | | |
| | | | | 1,145 | |
| | | | | | |
Airlines—0.1% | | | | | | |
Southwest Airlines Co. | | 6,970 | | | 85 | |
| | | | | | |
Aluminum—0.2% | | | | | | |
Alcoa, Inc. | | 8,050 | | | 294 | |
| | | | | | |
Apparel Retail—0.3% | | | | | | |
Abercrombie & Fitch Co. Class A | | 821 | | | 66 | |
Gap, Inc. (The) | | 4,420 | | | 94 | |
Limited Brands, Inc. | | 2,950 | | | 56 | |
TJX Cos., Inc. (The) | | 4,150 | | | 119 | |
| | | | | | |
| | | | | 335 | |
| | | | | | |
Apparel, Accessories & Luxury Goods—0.2% | | | | | | |
Coach, Inc.(b) | | 3,500 | | | 107 | |
Jones Apparel Group, Inc. | | 810 | | | 13 | |
Liz Claiborne, Inc. | | 940 | | | 19 | |
Polo Ralph Lauren Corp. | | 567 | | | 35 | |
VF Corp. | | 844 | | | 58 | |
| | | | | | |
| | | | | 232 | |
| | | | | | |
Application Software—0.4% | | | | | | |
Adobe Systems, Inc.(b) | | 5,450 | | | 233 | |
Autodesk, Inc.(b) | | 2,178 | | | 108 | |
Citrix Systems, Inc.(b) | | 1,800 | | | 69 | |
Compuware Corp.(b) | | 2,720 | | | 24 | |
Intuit, Inc.(b) | | 3,160 | | | 100 | |
| | | | | | |
| | | | | 534 | |
| | | | | | |
Asset Management & Custody Banks—1.3% | | | | | | |
American Capital Strategies Ltd. | | 1,820 | | | 60 | |
Ameriprise Financial, Inc. | | 2,200 | | | 121 | |
Bank of New York Mellon Corp. (The) | | 10,810 | | | 527 | |
Federated Investors, Inc. Class B | | 829 | | | 34 | |
Franklin Resources, Inc. | | 1,536 | | | 176 | |
Janus Capital Group, Inc. | | 1,460 | �� | | 48 | |
Legg Mason, Inc. | | 1,257 | | | 92 | |
Northern Trust Corp. | | 1,813 | | | 139 | |
State Street Corp. | | 3,687 | | | 299 | |
T. Rowe Price Group, Inc. | | 2,513 | | | 153 | |
| | | | | | |
| | | | | 1,649 | |
| | | | | | |
Auto Parts & Equipment—0.2% | | | | | | |
Johnson Controls, Inc. | | 5,640 | | | 203 | |
WABCO Holdings, Inc. | | 1 | | | — | (f) |
| | | | | | |
| | | | | 203 | |
| | | | | | |
Automobile Manufacturers—0.2% | | | | | | |
Ford Motor Co.(b) | | 20,040 | | | 135 | |
General Motors Corp. | | 5,353 | | | 133 | |
| | | | | | |
| | | | | 268 | |
| | | | | | |
Automotive Retail—0.1% | | | | | | |
AutoNation, Inc.(b) | | 1,330 | | | 21 | |
AutoZone, Inc.(b) | | 434 | | | 52 | |
| | | | | | |
| | | | | 73 | |
| | | | | | |
Biotechnology—1.1% | | | | | | |
Amgen, Inc.(b) | | 10,330 | | | 480 | |
Biogen Idec, Inc.(b) | | 2,790 | | | 159 | |
Celgene Corp.(b) | | 3,660 | | | 169 | |
Genzyme Corp.(b) | | 2,530 | | | 188 | |
Gilead Sciences, Inc.(b) | | 8,840 | | | 407 | |
| | | | | | |
| | | | | 1,403 | |
| | | | | | |
Brewers—0.3% | | | | | | |
Anheuser-Busch Cos., Inc. | | 6,970 | | | 365 | |
Molson Coors Brewing Co. Class B | | 1,291 | | | 66 | |
| | | | | | |
| | | | | 431 | |
| | | | | | |
Broadcasting & Cable TV—0.9% | | | | | | |
CBS Corp. Class B | | 6,510 | | | 177 | |
Clear Channel Communications, Inc. | | 4,713 | | | 163 | |
Comcast Corp. Class A(b) | | 29,180 | | | 533 | |
DIRECTV Group, Inc. (The)(b) | | 6,820 | | | 158 | |
Scripps (E.W.) Co. (The) Class A | | 849 | | | 38 | |
| | | | | | |
| | | | | 1,069 | |
| | | | | | |
Building Products—0.1% | | | | | | |
Masco Corp. | | 3,500 | | | 76 | |
Trane, Inc. | | 1,630 | | | 76 | |
| | | | | | |
| | | | | 152 | |
| | | | | | |
Casinos & Gaming—0.2% | | | | | | |
Harrah’s Entertainment, Inc. | | 1,767 | | | 157 | |
International Game Technology | | 2,990 | | | 131 | |
| | | | | | |
| | | | | 288 | |
| | | | | | |
Coal & Consumable Fuels—0.2% | | | | | | |
Consol Energy, Inc. | | 1,723 | | | 123 | |
Peabody Energy Corp. | | 2,507 | | | 155 | |
| | | | | | |
| | | | | 278 | |
| | | | | | |
Commercial Printing—0.1% | | | | | | |
RR Donnelley & Sons Co. | | 2,040 | | | 77 | |
| | | | | | |
Communications Equipment—2.5% | | | | | | |
Ciena Corp.(b) | | 808 | | | 28 | |
Cisco Systems, Inc.(b) | | 57,610 | | | 1,560 | |
Corning, Inc. | | 14,960 | | | 359 | |
JDS Uniphase Corp.(b) | | 2,080 | | | 28 | |
Juniper Networks, Inc.(b) | | 4,950 | | | 164 | |
Motorola, Inc. | | 21,690 | | | 348 | |
QUALCOMM, Inc. | | 15,540 | | | 611 | |
Tellabs, Inc. | | 4,170 | | | 27 | |
| | | | | | |
| | | | | 3,125 | |
| | | | | | |
Computer & Electronics Retail—0.2% | | | | | | |
Best Buy Co., Inc. | | 3,330 | | | 175 | |
Circuit City Stores, Inc. | | 1,595 | | | 7 | |
GameStop Corp. Class A(b) | | 1,510 | | | 94 | |
RadioShack Corp. | | 1,240 | | | 21 | |
| | | | | | |
| | | | | 297 | |
| | | | | | |
Computer Hardware—4.0% | | | | | | |
Apple, Inc.(b) | | 8,310 | | | 1,646 | |
Dell, Inc.(b) | | 21,280 | | | 521 | |
Hewlett-Packard Co. | | 24,480 | | | 1,236 | |
International Business Machines Corp. | | 13,080 | | | 1,414 | |
Sun Microsystems, Inc.(b) | | 7,870 | | | 143 | |
Teradata Corp.(b) | | 1,702 | | | 47 | |
| | | | | | |
| | | | | 5,007 | |
| | | | | | |
See Notes to Financial Statements
89
PHOENIX-VAN KAMPEN EQUITY 500 INDEX SERIES
| | | | | |
| | | SHARES | | VALUE
(000) |
Computer Storage & Peripherals—0.5% | | | | | |
EMC Corp.(b) | | 19,920 | | $ | 369 |
Lexmark International, Inc. Class A(b) | | 895 | | | 31 |
Network Appliance, Inc.(b) | | 3,270 | | | 82 |
QLogic Corp.(b) | | 1,300 | | | 18 |
SanDisk Corp.(b) | | 2,160 | | | 72 |
| | | | | |
| | | | | 572 |
| | | | | |
Construction & Engineering—0.2% | | | | | |
Fluor Corp. | | 835 | | | 122 |
Jacobs Engineering Group, Inc.(b) | | 1,128 | | | 108 |
| | | | | |
| | | | | 230 |
| | | | | |
Construction & Farm Machinery & Heavy Trucks—1.0% | | | | | |
Caterpillar, Inc. | | 6,050 | | | 439 |
Cummins, Inc. | | 987 | | | 126 |
Deere & Co. | | 4,200 | | | 391 |
Manitowoc Co., Inc. (The) | | 1,230 | | | 60 |
PACCAR, Inc. | | 3,523 | | | 192 |
Terex Corp.(b) | | 965 | | | 63 |
| | | | | |
| | | | | 1,271 |
| | | | | |
Construction Materials—0.1% | | | | | |
Vulcan Materials Co. | | 1,030 | | | 81 |
| | | | | |
Consumer Electronics—0.0% | | | | | |
Harman International Industries, Inc. | | 570 | | | 42 |
| | | | | |
Consumer Finance—0.7% | | | | | |
American Express Co. | | 11,100 | | | 578 |
Capital One Financial Corp. | | 3,710 | | | 175 |
Discover Financial Services | | 4,518 | | | 68 |
SLM Corp. | | 5,106 | | | 103 |
| | | | | |
| | | | | 924 |
| | | | | |
Data Processing & Outsourced Services—0.8% | | | | | |
Affiliated Computer Services, Inc. Class A(b) | | 938 | | | 42 |
Automatic Data Processing, Inc. | | 5,000 | | | 223 |
Computer Sciences Corp.(b) | | 1,639 | | | 81 |
Convergys Corp.(b) | | 1,240 | | | 20 |
Electronic Data Systems Corp. | | 4,860 | | | 101 |
Fidelity National Information Services, Inc. | | 1,609 | | | 67 |
Fiserv, Inc.(b) | | 1,579 | | | 88 |
Metavante Technologies, Inc.(b) | | 861 | | | 20 |
Paychex, Inc. | | 3,170 | | | 115 |
Western Union Co. (The) | | 7,130 | | | 173 |
| | | | | |
| | | | | 930 |
| | | | | |
Department Stores—0.4% | | | | | |
Dillard’s, Inc. Class A | | 540 | | | 10 |
Kohl’s Corp.(b) | | 2,980 | | | 137 |
Macy’s, Inc. | | 4,104 | | | 106 |
Nordstrom, Inc. | | 1,790 | | | 66 |
Penney (J.C.) Co., Inc. | | 2,099 | | | 92 |
Sears Holdings Corp.(b) | | 690 | | | 70 |
| | | | | |
| | | | | 481 |
| | | | | |
Distillers & Vintners—0.1% | | | | | |
Brown-Forman Corp. Class B | | 819 | | | 61 |
Constellation Brands, Inc. Class A(b) | | 1,828 | | | 43 |
| | | | | |
| | | | | 104 |
| | | | | |
Distributors—0.1% | | | | | |
Genuine Parts Co. | | 1,613 | | | 75 |
| | | | | |
Diversified Banks—1.8% | | | | | |
Comerica, Inc. | | 1,449 | | | 63 |
U.S. Bancorp | | 16,400 | | | 521 |
Wachovia Corp. | | 18,760 | | | 713 |
Wells Fargo & Co. | | 32,040 | | | 967 |
| | | | | |
| | | | | 2,264 |
| | | | | |
Diversified Chemicals—0.8% | | | | | |
Ashland, Inc. | | 529 | | | 25 |
Dow Chemical Co. (The) | | 8,992 | | | 355 |
E.I. du Pont de Nemours & Co. | | 8,540 | | | 377 |
Eastman Chemical Co. | | 770 | | | 47 |
Hercules, Inc. | | 1,103 | | | 21 |
PPG Industries, Inc. | | 1,554 | | | 109 |
| | | | | |
| | | | | 934 |
| | | | | |
Diversified Commercial & Professional Services—0.1% | | | | | |
Cintas Corp. | | 1,276 | | | 43 |
Equifax, Inc. | | 1,250 | | | 45 |
| | | | | |
| | | | | 88 |
| | | | | |
Diversified Metals & Mining—0.3% | | | | | |
Freeport-McMoRan Copper & Gold, Inc. (Indonesia)(c) | | 3,613 | | | 370 |
Titanium Metals Corp. | | 830 | | | 22 |
| | | | | |
| | | | | 392 |
| | | | | |
Diversified REITs—0.1% | | | | | |
Vornado Realty Trust | | 1,266 | | | 111 |
| | | | | |
Drug Retail—0.7% | | | | | |
CVS Caremark Corp. | | 14,016 | | | 557 |
Walgreen Co. | | 9,404 | | | 358 |
| | | | | |
| | | | | 915 |
| | | | | |
Education Services—0.1% | | | | | |
Apollo Group, Inc. Class A(b) | | 1,300 | | | 91 |
| | | | | |
Electric Utilities—2.1% | | | | | |
Allegheny Energy, Inc. | | 1,569 | | | 100 |
American Electric Power Co., Inc. | | 3,800 | | | 177 |
Duke Energy Corp. | | 11,970 | | | 241 |
Edison International | | 3,083 | | | 165 |
Entergy Corp. | | 1,853 | | | 221 |
Exelon Corp. | | 6,270 | | | 512 |
FirstEnergy Corp. | | 2,884 | | | 209 |
FPL Group, Inc. | | 3,870 | | | 262 |
Pepco Holdings, Inc. | | 1,900 | | | 56 |
Pinnacle West Capital Corp. | | 949 | | | 40 |
PPL Corp. | | 3,530 | | | 184 |
Progress Energy, Inc. | | 2,451 | | | 119 |
Southern Co. (The) | | 7,210 | | | 279 |
| | | | | |
| | | | | 2,565 |
| | | | | |
Electrical Components & Equipment—0.5% | | | | | |
Cooper Industries Ltd. Class A | | 1,733 | | | 91 |
Emerson Electric Co. | | 7,497 | | | 425 |
Rockwell Automation, Inc. | | 1,420 | | | 98 |
| | | | | |
| | | | | 614 |
| | | | | |
Electronic Equipment Manufacturers—0.1% | | | | | |
Agilent Technologies, Inc.(b) | | 3,659 | | | 134 |
| | | | | |
Electronic Manufacturing Services—0.2% | | | | | |
Jabil Circuit, Inc. | | 1,965 | | | 30 |
Molex, Inc. | | 1,360 | | | 37 |
Tyco Electronics Ltd. | | 4,706 | | | 175 |
| | | | | |
| | | | | 242 |
| | | | | |
Environmental & Facilities Services—0.2% | | | | | |
Allied Waste Industries, Inc.(b) | | 2,730 | | | 30 |
Waste Management, Inc. | | 4,830 | | | 158 |
| | | | | |
| | | | | 188 |
| | | | | |
Fertilizers & Agricultural Chemicals—0.5% | | | | | |
Monsanto Co. | | 5,190 | | | 580 |
| | | | | |
Food Distributors—0.1% | | | | | |
SYSCO Corp. | | 5,773 | | | 180 |
| | | | | |
Food Retail—0.4% | | | | | |
Kroger Co. (The) | | 6,470 | | | 173 |
Safeway, Inc. | | 4,200 | | | 144 |
SUPERVALU, Inc. | | 1,989 | | | 74 |
Whole Foods Market, Inc. | | 1,316 | | | 54 |
| | | | | |
| | | | | 445 |
| | | | | |
Footwear—0.2% | | | | | |
NIKE, Inc. Class B | | 3,660 | | | 235 |
| | | | | |
Forest Products—0.1% | | | | | |
Weyerhaeuser Co. | | 1,990 | | | 147 |
| | | | | |
Gas Utilities—0.1% | | | | | |
Nicor, Inc. | | 427 | | | 18 |
Questar Corp. | | 1,632 | | | 88 |
| | | | | |
| | | | | 106 |
| | | | | |
General Merchandise Stores—0.4% | | | | | |
Big Lots, Inc.(b) | | 860 | | | 14 |
Family Dollar Stores, Inc. | | 1,330 | | | 26 |
Target Corp. | | 7,890 | | | 394 |
| | | | | |
| | | | | 434 |
| | | | | |
Gold—0.2% | | | | | |
Newmont Mining Corp. | | 4,269 | | | 208 |
| | | | | |
See Notes to Financial Statements
90
PHOENIX-VAN KAMPEN EQUITY 500 INDEX SERIES
| | | | | |
| | | SHARES | | VALUE
(000) |
Health Care Distributors—0.4% | | | | | |
AmerisourceBergen Corp. | | 1,590 | | $ | 71 |
Cardinal Health, Inc. | | 3,450 | | | 199 |
McKesson Corp. | | 2,750 | | | 180 |
Patterson Cos., Inc.(b) | | 1,317 | | | 45 |
| | | | | |
| | | | | 495 |
| | | | | |
Health Care Equipment—1.7% | | | | | |
Bard (C.R.), Inc. | | 977 | | | 93 |
Baxter International, Inc. | | 6,020 | | | 350 |
Becton, Dickinson & Co. | | 2,304 | | | 193 |
Boston Scientific Corp. | | 12,740 | | | 148 |
Covidien Ltd. | | 4,706 | | | 208 |
Hospira, Inc.(b) | | 1,488 | | | 63 |
Medtronic, Inc. | | 10,734 | | | 540 |
St. Jude Medical, Inc.(b) | | 3,227 | | | 131 |
Stryker Corp. | | 2,246 | | | 168 |
Varian Medical Systems, Inc.(b) | | 1,197 | | | 62 |
Zimmer Holdings, Inc.(b) | | 2,241 | | | 148 |
| | | | | |
| | | | | 2,104 |
| | | | | |
Health Care Facilities—0.0% | | | | | |
Tenet Healthcare Corp.(b) | | 4,485 | | | 23 |
| | | | | |
Health Care Services—0.5% | | | | | |
Express Scripts, Inc.(b) | | 2,390 | | | 175 |
Laboratory Corp. of America Holdings(b) | | 1,113 | | | 84 |
Medco Health Solutions, Inc.(b) | | 2,563 | | | 260 |
Quest Diagnostics, Inc. | | 1,480 | | | 78 |
| | | | | |
| | | | | 597 |
| | | | | |
Health Care Technology—0.0% | | | | | |
IMS Health, Inc. | | 1,846 | | | 43 |
| | | | | |
Home Entertainment Software—0.1% | | | | | |
Electronic Arts, Inc.(b) | | 2,990 | | | 175 |
| | | | | |
Home Furnishings—0.0% | | | | | |
Leggett & Platt, Inc. | | 1,620 | | | 28 |
| | | | | |
Home Improvement Retail—0.7% | | | | | |
Home Depot, Inc. (The) | | 16,030 | | | 432 |
Lowe’s Cos., Inc. | | 13,890 | | | 314 |
Sherwin-Williams Co. (The) | | 990 | | | 58 |
| | | | | |
| | | | | 804 |
| | | | | |
Homebuilding—0.1% | | | | | |
Centex Corp. | | 1,131 | | | 28 |
Horton (D.R.), Inc. | | 2,630 | | | 35 |
KB Home | | 727 | | | 16 |
Lennar Corp. Class A | | 1,318 | | | 24 |
Pulte Homes, Inc. | | 2,011 | | | 21 |
| | | | | |
| | | | | 124 |
| | | | | |
Homefurnishing Retail—0.1% | | | | | |
Bed Bath & Beyond, Inc.(b) | | 2,510 | | | 74 |
| | | | | |
Hotels, Resorts & Cruise Lines—0.3% | | | | | |
Carnival Corp. | | 4,130 | | | 184 |
Marriott International, Inc. Class A | | 2,970 | | | 101 |
Starwood Hotels & Resorts Worldwide, Inc. | | 1,890 | | | 83 |
Wyndham Worldwide Corp. | | 1,691 | | | 40 |
| | | | | |
| | | | | 408 |
| | | | | |
Household Appliances—0.1% | | | | | |
Black & Decker Corp. (The) | | 590 | | | 41 |
Snap-On, Inc. | | 549 | | | 26 |
Stanley Works (The) | | 777 | | | 38 |
Whirlpool Corp. | | 747 | | | 61 |
| | | | | |
| | | | | 166 |
| | | | | |
Household Products—2.4% | | | | | |
Clorox Co. (The) | | 1,310 | | | 86 |
Colgate-Palmolive Co. | | 4,827 | | | 376 |
Kimberly-Clark Corp. | | 4,036 | | | 280 |
Procter & Gamble Co. (The) | | 29,490 | | | 2,165 |
| | | | | |
| | | | | 2,907 |
| | | | | |
Housewares & Specialties—0.1% | | | | | |
Fortune Brands, Inc. | | 1,446 | | | 105 |
Newell Rubbermaid, Inc. | | 2,650 | | | 68 |
| | | | | |
| | | | | 173 |
| | | | | |
Human Resources & Employment Services—0.1% | | | | | |
Monster Worldwide, Inc.(b) | | 1,210 | | | 39 |
Robert Half International, Inc. | | 1,552 | | | 42 |
| | | | | |
| | | | | 81 |
| | | | | |
Hypermarkets & Super Centers—1.1% | | | | | |
Costco Wholesale Corp. | | 4,120 | | | 287 |
Wal-Mart Stores, Inc. | | 22,440 | | | 1,067 |
| | | | | |
| | | | | 1,354 |
| | | | | |
Independent Power Producers & Energy Traders—0.3% | | | | | |
AES Corp. (The) | | 6,360 | | | 136 |
Constellation Energy Group, Inc. | | 1,710 | | | 175 |
Dynegy, Inc. Class A(b) | | 4,690 | | | 34 |
| | | | | |
| | | | | 345 |
| | | | | |
Industrial Conglomerates—3.6% | | | | | |
3M Co. | | 6,775 | | | 571 |
General Electric Co.(d) | | 95,970 | | | 3,558 |
Textron, Inc. | | 2,364 | | | 168 |
Tyco International Ltd. | | 4,706 | | | 187 |
| | | | | |
| | | | | 4,484 |
| | | | | |
Industrial Gases—0.4% | | | | | |
Air Products and Chemicals, Inc. | | 2,050 | | | 202 |
Praxair, Inc. | | 3,000 | | | 266 |
| | | | | |
| | | | | 468 |
| | | | | |
Industrial Machinery—0.7% | | | | | |
Danaher Corp. | | 2,400 | | | 211 |
Dover Corp. | | 1,890 | | | 87 |
Eaton Corp. | | 1,386 | | | 134 |
Illinois Tool Works, Inc. | | 3,930 | | | 210 |
ITT Corp. | | 1,720 | | | 114 |
Pall Corp. | | 1,161 | | | 47 |
Parker Hannifin Corp. | | 1,600 | | | 120 |
| | | | | |
| | | | | 923 |
| | | | | |
Industrial REITs—0.1% | | | | | |
ProLogis | | 2,428 | | | 154 |
| | | | | |
Insurance Brokers—0.2% | | | | | |
AON Corp. | | 2,779 | | | 132 |
Marsh & McLennan Cos., Inc. | | 4,940 | | | 131 |
| | | | | |
| | | | | 263 |
| | | | | |
Integrated Oil & Gas—7.7% | | | | | |
Chevron Corp. | | 20,050 | | | 1,871 |
ConocoPhillips | | 15,190 | | | 1,341 |
Exxon Mobil Corp.(d) | | 51,880 | | | 4,861 |
Hess Corp. | | 2,619 | | | 264 |
Marathon Oil Corp. | | 6,740 | | | 410 |
Murphy Oil Corp. | | 1,780 | | | 151 |
Occidental Petroleum Corp. | | 7,863 | | | 606 |
| | | | | |
| | | | | 9,504 |
| | | | | |
Integrated Telecommunication Services—3.2% | | | | | |
AT&T, Inc. | | 57,590 | | | 2,393 |
CenturyTel, Inc. | | 1,059 | | | 44 |
Citizens Communications Co. | | 3,110 | | | 40 |
Embarq Corp. | | 1,445 | | | 72 |
Qwest Communications International, Inc.(b) | | 14,910 | | | 104 |
Verizon Communications, Inc. | | 27,469 | | | 1,200 |
Windstream Corp. | | 4,511 | | | 59 |
| | | | | |
| | | | | 3,912 |
| | | | | |
Internet Retail—0.3% | | | | | |
Amazon.com, Inc.(b) | | 2,920 | | | 271 |
Expedia, Inc.(b) | | 1,970 | | | 62 |
IAC/InterActiveCorp.(b) | | 1,750 | | | 47 |
| | | | | |
| | | | | 380 |
| | | | | |
Internet Software & Services—1.9% | | | | | |
Akamai Technologies, Inc.(b) | | 1,561 | | | 54 |
eBay, Inc.(b) | | 10,798 | | | 358 |
Google, Inc. Class A(b) | | 2,186 | | | 1,512 |
VeriSign, Inc.(b) | | 2,100 | | | 79 |
Yahoo!, Inc.(b) | | 12,690 | | | 295 |
| | | | | |
| | | | | 2,298 |
| | | | | |
Investment Banking & Brokerage—2.0% | | | | | |
Bear Stearns Cos., Inc. (The) | | 1,099 | | | 97 |
Charles Schwab Corp. (The) | | 8,890 | | | 227 |
E*TRADE Financial Corp.(b) | | 4,025 | | | 14 |
Goldman Sachs Group, Inc. (The) | | 3,780 | | | 813 |
Lehman Brothers Holdings, Inc. | | 5,024 | | | 329 |
Merrill Lynch & Co., Inc. | | 8,130 | | | 437 |
Morgan Stanley | | 10,080 | | | 535 |
| | | | | |
| | | | | 2,452 |
| | | | | |
See Notes to Financial Statements
91
PHOENIX-VAN KAMPEN EQUITY 500 INDEX SERIES
| | | | | |
| | | SHARES | | VALUE
(000) |
IT Consulting & Other Services—0.1% | | | | | |
Cognizant Technology Solutions Corp. Class A(b) | | 2,760 | | $ | 94 |
Unisys Corp.(b) | | 3,312 | | | 15 |
| | | | | |
| | | | | 109 |
| | | | | |
Leisure Products—0.1% | | | | | |
Brunswick Corp. | | 842 | | | 14 |
Hasbro, Inc. | | 1,400 | | | 36 |
Mattel, Inc. | | 3,480 | | | 66 |
| | | | | |
| | | | | 116 |
| | | | | |
Life & Health Insurance—1.3% | | | | | |
AFLAC, Inc. | | 4,628 | | | 290 |
Lincoln National Corp. | | 2,562 | | | 149 |
MetLife, Inc. | | 7,031 | | | 433 |
Principal Financial Group, Inc. (The) | | 2,480 | | | 171 |
Prudential Financial, Inc. | | 4,310 | | | 401 |
Torchmark Corp. | | 904 | | | 55 |
Unum Group | | 3,415 | | | 81 |
| | | | | |
| | | | | 1,580 |
| | | | | |
Life Sciences Tools & Services—0.3% | | | | | |
Applera Corp. – Applied Biosystems Group | | 1,600 | | | 54 |
Millipore Corp.(b) | | 511 | | | 38 |
PerkinElmer, Inc. | | 1,148 | | | 30 |
Thermo Fisher Scientific, Inc.(b) | | 4,010 | | | 231 |
Waters Corp.(b) | | 945 | | | 75 |
| | | | | |
| | | | | 428 |
| | | | | |
Managed Health Care—1.5% | | | | | |
Aetna, Inc. | | 4,750 | | | 274 |
CIGNA Corp. | | 2,650 | | | 142 |
Coventry Health Care, Inc.(b) | | 1,480 | | | 88 |
Humana, Inc.(b) | | 1,590 | | | 120 |
UnitedHealth Group, Inc. | | 12,270 | | | 714 |
WellPoint, Inc.(b) | | 5,415 | | | 475 |
| | | | | |
| | | | | 1,813 |
| | | | | |
Metal & Glass Containers—0.1% | | | | | |
Ball Corp. | | 967 | | | 43 |
Pactiv Corp.(b) | | 1,234 | | | 33 |
| | | | | |
| | | | | 76 |
| | | | | |
Motorcycle Manufacturers—0.1% | | | | | |
Harley-Davidson, Inc. | | 2,290 | | | 107 |
| | | | | |
Movies & Entertainment—1.5% | | | | | |
News Corp. Class A | | 21,970 | | | 450 |
Time Warner, Inc. | | 34,320 | | | 567 |
Viacom, Inc. Class B(b) | | 6,230 | | | 273 |
Walt Disney Co. (The) | | 18,080 | | | 584 |
| | | | | |
| | | | | 1,874 |
| | | | | |
Multi-line Insurance—1.7% | | | | | |
American International Group, Inc. | | 24,080 | | | 1,404 |
Assurant, Inc. | | 914 | | | 61 |
Genworth Financial, Inc. Class A | | 4,190 | | | 106 |
Hartford Financial Services Group, Inc. (The) | | 2,980 | | | 260 |
Loews Corp. | | 4,170 | | | 210 |
| | | | | |
| | | | | 2,041 |
| | | | | |
Multi-Sector Holdings—0.1% | | | | | |
Leucadia National Corp. | | 1,610 | | | 76 |
| | | | | |
Multi-Utilities—1.1% | | | | | |
Ameren Corp. | | 1,965 | | | 107 |
CenterPoint Energy, Inc. | | 3,035 | | | 52 |
CMS Energy Corp. | | 2,125 | | | 37 |
Consolidated Edison, Inc. | | 2,557 | | | 125 |
Dominion Resources, Inc. | | 5,550 | | | 263 |
DTE Energy Co. | | 1,550 | | | 68 |
Integrys Energy Group, Inc. | | 717 | | | 37 |
NiSource, Inc. | | 2,593 | | | 49 |
PG&E Corp. | | 3,345 | | | 144 |
Public Service Enterprise Group, Inc. | | 2,407 | | | 236 |
Sempra Energy | | 2,497 | | | 155 |
TECO Energy, Inc. | | 1,993 | | | 34 |
Xcel Energy, Inc. | | 3,974 | | | 90 |
| | | | | |
| | | | | 1,397 |
| | | | | |
Office Electronics—0.1% | | | | | |
Xerox Corp. | | 8,780 | | | 142 |
| | | | | |
Office REITs—0.1% | | | | | |
Boston Properties, Inc. | | 1,127 | | | 103 |
| | | | | |
Office Services & Supplies—0.1% | | | | | |
Avery Dennison Corp. | | 1,009 | | | 54 |
Pitney Bowes, Inc. | | 2,079 | | | 79 |
| | | | | |
| | | | | 133 |
| | | | | |
Oil & Gas Drilling—0.6% | | | | | |
ENSCO International, Inc. | | 1,401 | | | 84 |
Noble Corp. | | 2,536 | | | 143 |
Rowan Cos., Inc. | | 1,048 | | | 42 |
Transocean, Inc. | | 3,020 | | | 432 |
| | | | | |
| | | | | 701 |
| | | | | |
Oil & Gas Equipment & Services—1.0% | | | | | |
Baker Hughes, Inc. | | 3,031 | | | 246 |
BJ Services Co. | | 2,760 | | | 67 |
Halliburton Co. | | 8,370 | | | 317 |
National Oilwell Varco, Inc.(b) | | 3,390 | | | 249 |
Smith International, Inc. | | 1,897 | | | 140 |
Weatherford International Ltd.(b) | | 3,191 | | | 219 |
| | | | | |
| | | | | 1,238 |
| | | | | |
Oil & Gas Exploration & Production—1.5% | | | | | |
Anadarko Petroleum Corp. | | 4,430 | | | 291 |
Apache Corp. | | 3,134 | | | 337 |
Chesapeake Energy Corp. | | 4,310 | | | 169 |
Devon Energy Corp. | | 4,222 | | | 375 |
EOG Resources, Inc. | | 2,340 | | | 209 |
Noble Energy, Inc. | | 1,630 | | | 130 |
Range Resources Corp. | | 1,420 | | | 73 |
XTO Energy, Inc. | | 4,590 | | | 236 |
| | | | | |
| | | | | 1,820 |
| | | | | |
Oil & Gas Refining & Marketing—0.4% | | | | | |
Sunoco, Inc. | | 1,139 | | | 83 |
Tesoro Corp. | | 1,300 | | | 62 |
Valero Energy Corp. | | 5,242 | | | 367 |
| | | | | |
| | | | | 512 |
| | | | | |
Oil & Gas Storage & Transportation—0.4% | | | | | |
El Paso Corp. | | 6,650 | | | 115 |
Spectra Energy Corp. | | 5,978 | | | 154 |
Williams Cos., Inc. (The) | | 5,640 | | | 202 |
| | | | | |
| | | | | 471 |
| | | | | |
Other Diversified Financial Services—3.7% | | | | | |
Bank of America Corp. | | 42,150 | | | 1,739 |
Citigroup, Inc. | | 47,410 | | | 1,396 |
JPMorgan Chase & Co. | | 31,900 | | | 1,392 |
| | | | | |
| | | | | 4,527 |
| | | | | |
Packaged Foods & Meats—1.2% | | | | | |
Campbell Soup Co. | | 2,127 | | | 76 |
ConAgra Foods, Inc. | | 4,636 | | | 110 |
Dean Foods Co. | | 1,230 | | | 32 |
General Mills, Inc. | | 3,210 | | | 183 |
Heinz (H.J.) Co. | | 3,021 | | | 141 |
Hershey Co. (The) | | 1,601 | | | 63 |
Kellogg Co. | | 2,511 | | | 132 |
Kraft Foods, Inc. Class A | | 14,690 | | | 479 |
McCormick & Co., Inc. | | 1,232 | | | 47 |
Sara Lee Corp. | | 6,858 | | | 110 |
Tyson Foods, Inc. Class A | | 2,604 | | | 40 |
Wrigley (Wm.) Jr. Co. | | 2,057 | | | 120 |
| | | | | |
| | | | | 1,533 |
| | | | | |
Paper Packaging—0.0% | | | | | |
Bemis Co., Inc. | | 950 | | | 26 |
Sealed Air Corp. | | 1,529 | | | 35 |
| | | | | |
| | | | | 61 |
| | | | | |
Paper Products—0.2% | | | | | |
International Paper Co. | | 4,067 | | | 132 |
MeadWestvaco Corp. | | 1,745 | | | 54 |
| | | | | |
| | | | | 186 |
| | | | | |
Personal Products—0.2% | | | | | |
Avon Products, Inc. | | 4,070 | | | 161 |
Estee Lauder Cos., Inc. (The) Class A | | 1,086 | | | 47 |
| | | | | |
| | | | | 208 |
| | | | | |
Pharmaceuticals—6.2% | | | | | |
Abbott Laboratories | | 14,670 | | | 824 |
Allergan, Inc. | | 2,909 | | | 187 |
Barr Pharmaceuticals, Inc.(b) | | 1,015 | | | 54 |
Bristol-Myers Squibb Co. | | 18,790 | | | 498 |
Forest Laboratories, Inc.(b) | | 2,960 | | | 108 |
Johnson & Johnson | | 27,170 | | | 1,812 |
See Notes to Financial Statements
92
PHOENIX-VAN KAMPEN EQUITY 500 INDEX SERIES
| | | | | |
| | | SHARES | | VALUE
(000) |
Pharmaceuticals—continued | | | | | |
King Pharmaceuticals, Inc.(b) | | 2,305 | | $ | 24 |
Lilly (Eli) & Co. | | 9,370 | | | 500 |
Merck & Co., Inc. | | 20,670 | | | 1,201 |
Mylan, Inc. | | 2,870 | | | 40 |
Pfizer, Inc. | | 64,850 | | | 1,474 |
Schering-Plough Corp. | | 15,380 | | | 410 |
Watson Pharmaceuticals, Inc.(b) | | 970 | | | 26 |
Wyeth | | 12,727 | | | 563 |
| | | | | |
| | | | | 7,721 |
| | | | | |
Photographic Products—0.0% | | | | | |
Eastman Kodak Co. | | 2,722 | | | 60 |
| | | | | |
Property & Casualty Insurance—0.9% | | | | | |
Allstate Corp. (The) | | 5,420 | | | 283 |
AMBAC Financial Group, Inc. | | 965 | | | 25 |
Chubb Corp. (The) | | 3,640 | | | 199 |
Cincinnati Financial Corp. | | 1,580 | | | 63 |
MBIA, Inc. | | 1,198 | | | 22 |
Progressive Corp. (The) | | 6,630 | | | 127 |
Safeco Corp. | | 900 | | | 50 |
Travelers Cos., Inc. (The) | | 6,120 | | | 329 |
| | | | | |
| | | | | 1,098 |
| | | | | |
Publishing—0.3% | | | | | |
Gannett Co., Inc. | | 2,205 | | | 86 |
Gemstar-TV Guide International, Inc.(b) | | 247 | | | 1 |
McGraw-Hill Cos., Inc. (The) | | 3,120 | | | 137 |
Meredith Corp. | | 369 | | | 20 |
New York Times Co. (The) Class A | | 1,362 | | | 24 |
Washington Post Co. (The) Class B | | 100 | | | 79 |
| | | | | |
| | | | | 347 |
| | | | | |
Railroads—0.7% | | | | | |
Burlington Northern Santa Fe Corp. | | 2,844 | | | 237 |
CSX Corp. | | 3,990 | | | 175 |
Norfolk Southern Corp. | | 3,680 | | | 186 |
Union Pacific Corp. | | 2,490 | | | 313 |
| | | | | |
| | | | | 911 |
| | | | | |
Real Estate Management & Development—0.0% | | | | | |
CB Richard Ellis Group, Inc. Class A(b) | | 1,866 | | | 40 |
| | | | | |
Regional Banks—1.1% | | | | | |
BB&T Corp. | | 5,224 | | | 160 |
Commerce Bancorp, Inc. | | 1,850 | | | 71 |
Fifth Third Bancorp | | 5,071 | | | 127 |
First Horizon National Corp. | | 1,190 | | | 22 |
Huntington Bancshares, Inc. | | 3,464 | | | 51 |
KeyCorp | | 3,685 | | | 86 |
M&T Bank Corp. | | 718 | | | 59 |
Marshall & Ilsley Corp. | | 2,440 | | | 65 |
National City Corp. | | 6,020 | | | 99 |
PNC Financial Services Group, Inc. (The) | | 3,320 | | | 218 |
Regions Financial Corp. | | 6,600 | | | 156 |
SunTrust Banks, Inc. | | 3,304 | | | 206 |
Zions Bancorp | | 1,018 | | | 48 |
| | | | | |
| | | | | 1,368 |
| | | | | |
Residential REITs—0.2% | | | | | |
Apartment Investment
& Management Co. Class A | | 920 | | | 32 |
AvalonBay Communities, Inc. | | 755 | | | 71 |
Equity Residential | | 2,570 | | | 94 |
| | | | | |
| | | | | 197 |
| | | | | |
Restaurants—0.8% | | | | | |
Darden Restaurants, Inc. | | 1,338 | | | 37 |
McDonald’s Corp. | | 11,230 | | | 662 |
Starbucks Corp.(b) | | 6,940 | | | 142 |
Wendy’s International, Inc. | | 826 | | | 21 |
Yum! Brands, Inc. | | 4,830 | | | 185 |
| | | | | |
| | | | | 1,047 |
| | | | | |
Retail REITs—0.3% | | | | | |
Developers Diversified Realty Corp. | | 1,182 | | | 45 |
General Growth Properties, Inc. | | 2,325 | | | 96 |
Kimco Realty Corp. | | 2,387 | | | 87 |
Simon Property Group, Inc. | | 2,114 | | | 184 |
| | | | | |
| | | | | 412 |
| | | | | |
Semiconductor Equipment—0.5% | | | | | |
Applied Materials, Inc. | | 13,090 | | | 233 |
KLA-Tencor Corp. | | 1,730 | | | 83 |
MEMC Electronic Materials, Inc.(b) | | 2,180 | | | 193 |
Novellus Systems, Inc.(b) | | 1,100 | | | 30 |
Teradyne, Inc.(b) | | 1,650 | | | 17 |
| | | | | |
| | | | | 556 |
| | | | | |
Semiconductors—2.2% | | | | | |
Advanced Micro Devices, Inc.(b) | | 5,730 | | | 43 |
Altera Corp. | | 3,190 | | | 62 |
Analog Devices, Inc. | | 2,880 | | | 91 |
Broadcom Corp. Class A(b) | | 4,470 | | | 117 |
Intel Corp. | | 55,520 | | | 1,480 |
Linear Technology Corp. | | 2,101 | | | 67 |
LSI Corp. | | 6,700 | | | 36 |
Microchip Technology, Inc. | | 2,030 | | | 64 |
Micron Technology, Inc.(b) | | 7,220 | | | 52 |
National Semiconductor Corp. | | 2,230 | | | 50 |
NVIDIA Corp.(b) | | 5,280 | | | 180 |
Texas Instruments, Inc. | | 13,280 | | | 443 |
Xilinx, Inc. | | 2,801 | | | 61 |
| | | | | |
| | | | | 2,746 |
| | | | | |
Soft Drinks—2.0% | | | | | |
Coca-Cola Co. (The) | | 18,870 | | | 1,158 |
Coca-Cola Enterprises, Inc. | | 2,699 | | | 70 |
Pepsi Bottling Group, Inc. (The) | | 1,327 | | | 52 |
PepsiCo, Inc. | | 15,293 | | | 1,161 |
| | | | | |
| | | | | 2,441 |
| | | | | |
Specialized Consumer Services—0.0% | | | | | |
Block (H&R), Inc. | | 3,073 | | | 57 |
| | | | | |
Specialized Finance—0.7% | | | | | |
CIT Group, Inc. | | 1,815 | | | 44 |
CME Group, Inc. | | 503 | | | 345 |
IntercontinentalExchange, Inc.(b) | | 660 | | | 127 |
Moody’s Corp. | | 2,040 | | | 73 |
NYSE Euronext | | 2,520 | | | 221 |
| | | | | |
| | | | | 810 |
| | | | | |
Specialized REITs—0.2% | | | | | |
Host Hotels & Resorts, Inc. | | 4,939 | | | 84 |
Plum Creek Timber Co., Inc. | | 1,653 | | | 76 |
Public Storage, Inc. | | 1,162 | | | 86 |
| | | | | |
| | | | | 246 |
| | | | | |
Specialty Chemicals—0.2% | | | | | |
Ecolab, Inc. | | 1,649 | | | 85 |
International Flavors & Fragrances, Inc. | | 770 | | | 37 |
Rohm & Haas Co. | | 1,190 | | | 63 |
Sigma-Aldrich Corp. | | 1,243 | | | 68 |
| | | | | |
| | | | | 253 |
| | | | | |
Specialty Stores—0.2% | | | | | |
Office Depot, Inc.(b) | | 2,582 | | | 36 |
OfficeMax, Inc. | | 713 | | | 15 |
Staples, Inc. | | 6,710 | | | 155 |
Tiffany & Co. | | 1,294 | | | 59 |
| | | | | |
| | | | | 265 |
| | | | | |
Steel—0.3% | | | | | |
Allegheny Technologies, Inc. | | 967 | | | 84 |
Nucor Corp. | | 2,725 | | | 161 |
United States Steel Corp. | | 1,120 | | | 135 |
| | | | | |
| | | | | 380 |
| | | | | |
Systems Software—3.1% | | | | | |
BMC Software, Inc.(b) | | 1,860 | | | 66 |
CA, Inc. | | 3,720 | | | 93 |
Microsoft Corp. | | 76,400 | | | 2,720 |
Novell, Inc.(b) | | 3,311 | | | 23 |
Oracle Corp.(b) | | 37,450 | | | 845 |
Symantec Corp.(b) | | 8,240 | | | 133 |
| | | | | |
| | | | | 3,880 |
| | | | | |
Thrifts & Mortgage Finance—0.7% | | | | | |
Countrywide Financial Corp. | | 5,500 | | | 49 |
Fannie Mae | | 9,290 | | | 372 |
Freddie Mac | | 6,280 | | | 214 |
Hudson City Bancorp, Inc. | | 4,940 | | | 74 |
MGIC Investment Corp. | | 776 | | | 17 |
Sovereign Bancorp, Inc. | | 3,401 | | | 39 |
Washington Mutual, Inc. | | 8,250 | | | 112 |
| | | | | |
| | | | | 877 |
| | | | | |
Tires & Rubber—0.1% | | | | | |
Goodyear Tire & Rubber Co. (The)(b) | | 2,280 | | | 64 |
| | | | | |
See Notes to Financial Statements
93
PHOENIX-VAN KAMPEN EQUITY 500 INDEX SERIES
| | | | | |
| | | SHARES | | VALUE
(000) |
Tobacco—1.4% | | | | | |
Altria Group, Inc. | | 20,000 | | $ | 1,511 |
Reynolds American, Inc. | | 1,619 | | | 107 |
UST, Inc. | | 1,490 | | | 82 |
| | | | | |
| | | | | 1,700 |
| | | | | |
Trading Companies & Distributors—0.0% | | | | | |
Grainger (W.W.), Inc. | | 640 | | | 56 |
| | | | | |
Trucking—0.0% | | | | | |
Ryder System, Inc. | | 566 | | | 27 |
| | | | | |
Wireless Telecommunication Services—0.4% | | | | | |
American Tower Corp. Class A | | 3,840 | | | 163 |
Sprint Nextel Corp. | | 27,010 | | | 355 |
| | | | | |
| | | | | 518 |
| | | | | |
Total Domestic Common Stocks (Identified Cost $89,506) | | | | | 120,551 |
| | | | | |
FOREIGN COMMON STOCKS(c) —1.3% | | | | | |
Industrial Machinery—0.1% | | | | | |
Ingersoll-Rand Co., Ltd. Class A (United States) | | 2,590 | | | 120 |
| | | | | |
Oil & Gas Drilling—0.1% | | | | | |
Nabors Industries Ltd. (United States)(b) | | 2,690 | | | 74 |
| | | | | |
Oil & Gas Equipment & Services—0.9% | | | | | |
Schlumberger Ltd. (Netherlands) | | 11,360 | | | 1,118 |
| | | | | |
Property & Casualty Insurance—0.2% | | | | | |
ACE Ltd. (United States) | | 3,114 | | | 192 |
XL Capital Ltd. Class A (United States) | | 1,690 | | | 85 |
| | | | | |
| | | | | 277 |
| | | | | |
Total Foreign Common Stocks (Identified Cost $773) | | | | | 1,589 |
| | | | | |
RIGHTS—0.0% | | | | | |
Computer Storage & Peripherals—0.0% | | | | | |
Seagate Technology Tax Refund Rights(b)(e) | | 7,900 | | | 0 |
| | | | | |
Total Rights (Identified Cost $0) | | | | | 0 |
| | | | | |
TOTAL LONG TERM INVESTMENTS—98.8% (Identified cost $90,279) | | | | | 122,140 |
| | | | | |
| | | | | | |
| | | PAR
VALUE
(000) | | | |
SHORT-TERM INVESTMENTS—1.2% | | | | | | |
| | |
Repurchase Agreements—1.2% | | | | | | |
State Street Bank and Trust Co. repurchas eagreement 1.10% dated 12/31/07, due 1/2/08, repurchase price$ 1,520 collateralized by U.S. Treasury Bond 5%, 5/15/37 market value $1,551 | | $1,520 | | | 1,520 | |
| | | | | | |
Total Short-Term Investments (Identified Cost $1,520) | | | | | 1,520 | |
| | | | | | |
TOTAL INVESTMENTS—100.0% (Identified Cost $91,799) | | | | | 123,660 | (a) |
Other assets and liabilities, net—0.0% | | | | | (16 | ) |
| | | | | | |
NET ASSETS—100.0% | | | | $ | 123,644 | |
| | | | | | |
At December 31, 2007, the Fund had entered into futures contracts as follows (reported in 000’s):
| | | | | | | | | | | | | | |
| | | Expiration
Date | | Number of
Contracts | | Value of
Contracts
When Opened | | Market
Value of
Contracts | | Unrealized
Appreciation
(Depreciation) | |
S&P 500® Index | | March-08 | | 23 | | $ | 1,700 | | $ | 1,699 | | $ | (1 | ) |
(a) | Federal Income Tax Information (reported in 000’s): Net unrealized appreciation of investment securities is comprised of gross appreciation of $33,799 and gross depreciation of $4,865 for federal income tax purposes. At December 31, 2007, the aggregate cost of securities for federal income tax purposes was $94,726. |
(c) | A security is considered to be foreign if the security is issued in a foreign country. The country of risk, noted parenthetically, is determined based on criteria described in Note 2G, “Foreign security country determination” in the Notes to Financial Statements. |
(d) | All or a portion segregated as collateral for futures contracts. |
(e) | Illiquid and restricted security. Security valued at fair value as determined in good faith by or under the direction of the Trustees. At December 31, 2007, this security amounted to a value of $0 or 0% of (reported in 000’s) net assets. For acquisition information, see Note 6 “Illiquid and Restricted Securities” in the Notes to Financial Statements. |
(f) | Value less than $1,000. |
See Notes to Financial Statements
94
THIS PAGE INTENTIONALLY BLANK.
THE PHOENIX EDGE SERIES FUND
Statements of Assets and Liabilities
December 31, 2007
(Reported in thousands except per share amounts)
| | | | | | | | | | | |
| | | Capital
Growth
Series | | | Growth
and
Income
Series | | Mid-Cap
Growth
Series | |
Assets | | | | | | | | | | | |
Investment securities at value+@ | | $ | 426,798 | | | $ | 158,490 | | $ | 87,509 | |
Foreign currency at value* | | | — | | | | — | | | — | |
Cash | | | 1 | | | | — | | | — | # |
Receivables | | | | | | | | | | | |
Investment securities sold | | | — | | | | 354 | | | 363 | |
Fund shares sold | | | — | # | | | 173 | | | — | # |
Dividends | | | 324 | | | | 186 | | | 28 | |
Interest | | | — | | | | — | | | — | # |
Tax reclaims | | | 9 | | | | — | | | — | |
Prepaid expenses | | | 38 | | | | 16 | | | 8 | |
Other assets | | | 31 | | | | 12 | | | 7 | |
| | | | | | | | | | | |
Total assets | | | 427,201 | | | | 159,231 | | | 87,915 | |
| | | | | | | | | | | |
Liabilities | | | | | | | | | | | |
Cash overdraft | | | — | | | | 1 | | | — | |
Payables | | | | | | | | | | | |
Fund shares repurchased | | | 221 | | | | — | | | 106 | |
Investment securities purchased | | | — | | | | — | | | 444 | |
Upon return of securities loaned | | | 25,980 | | | | — | | | — | |
Investment advisory fee | | | 234 | | | | 79 | | | 60 | |
Administration fee | | | 29 | | | | 11 | | | 6 | |
Service fee | | | 23 | | | | 9 | | | 5 | |
Trustees’ fee | | | 9 | | | | 4 | | | 2 | |
Trustee deferred compensation plan | | | 31 | | | | 12 | | | 7 | |
Professional fee | | | 28 | | | | 26 | | | 25 | |
Unrealized depreciation on forward currency contracts | | | — | | | | — | | | — | |
Other accrued expenses | | | 34 | | | | 15 | | | 7 | |
| | | | | | | | | | | |
Total liabilities | | | 26,589 | | | | 157 | | | 662 | |
| | | | | | | | | | | |
Net Assets | | $ | 400,612 | | | $ | 159,074 | | $ | 87,253 | |
| | | | | | | | | | | |
Net Assets Consist of: | | | | | | | | | | | |
Capital paid in on shares of beneficial interest | | $ | 617,818 | | | $ | 121,941 | | $ | 173,269 | |
Undistributed net investment income (accumulated net investment loss) | | | 57 | | | | 198 | | | (8 | ) |
Accumulated net realized gain (loss) | | | (287,829 | ) | | | 964 | | | (94,817 | ) |
Net unrealized appreciation (depreciation) | | | 70,566 | | | | 35,971 | | | 8,809 | |
| | | | | | | | | | | |
Net Assets | | $ | 400,612 | | | $ | 159,074 | | $ | 87,253 | |
| | | | | | | | | | | |
Net asset value and offering price per share | | $ | 16.81 | | | $ | 14.94 | | $ | 16.40 | |
| | | | | | | | | | | |
Shares of beneficial interest outstanding, $1 par value, unlimited authorization | | | 23,838 | | | | 10,647 | | | 5,321 | |
| | | | | | | | | | | |
+Investment securities at cost | | | 356,232 | | | | 122,519 | | | 78,700 | |
*Foreign currency at cost | | | — | | | | — | | | — | |
@ Including market value of securities on loan | | | 33,609 | | | | — | | | — | |
#Amount is less than $1,000. | | | | | | | | | | | |
See Notes to Financial Statements
96
| | | | | | | | | | | | | | | | | | | | |
Money Market Series | | Multi-Sector
Fixed Income
Series | | | Multi-Sector
Short Term Bond
Series | | | Strategic Allocation
Series | | | Aberdeen
International
Series | | Alger
Small-Cap Growth
Series | |
| $ | 167,856 | | $ | 282,212 | | | $ | 43,985 | | | $ | 270,246 | | | $ | 504,910 | | $ | 55,879 | |
| | — | | | 3 | | | | 46 | | | | — | # | | | 1,154 | | | — | |
| | 13 | | | 961 | | | | 164 | | | | 21 | | | | 2 | | | 38 | |
| | 3 | | | 456 | | | | 169 | | | | 40 | | | | — | | | 404 | |
| | 1,317 | | | 77 | | | | — | | | | — | | | | — | | | 18 | |
| | — | | | 67 | | | | 3 | | | | 188 | | | | 984 | | | 18 | |
| | 435 | | | 3,540 | | | | 380 | | | | 918 | | | | — | | | — | |
| | — | | | — | | | | — | | | | — | | | | 198 | | | — | |
| | 14 | | | 22 | | | | 4 | | | | 26 | | | | 42 | | | 5 | |
| | 13 | | | 19 | | | | 3 | | | | 21 | | | | 38 | | | 4 | |
| | | | | | | | | | | | | | | | | | | | | |
| | 169,651 | | | 287,357 | | | | 44,754 | | | | 271,460 | | | | 507,328 | | | 56,366 | |
| | | | | | | | | | | | | | | | | | | | |
| | — | | | — | | | | — | | | | — | | | | — | | | — | |
| | 88 | | | 488 | | | | 91 | | | | 152 | | | | 1,147 | | | 71 | |
| | — | | | 2,654 | | | | 415 | | | | 212 | | | | 2,378 | | | 450 | |
| | — | | | 33,024 | | | | — | | | | 174 | | | | 1,386 | | | — | |
| | 58 | | | 106 | | | | 12 | | | | 138 | | | | 308 | | | 31 | |
| | 5 | | | 17 | | | | 3 | | | | 19 | | | | 34 | | | 4 | |
| | 9 | | | 14 | | | | 2 | | | | 15 | | | | 28 | | | 3 | |
| | 4 | | | 6 | | | | 1 | | | | 6 | | | | 11 | | | 1 | |
| | 13 | | | 19 | | | | 3 | | | | 21 | | | | 38 | | | 4 | |
| | 23 | | | 28 | | | | 29 | | | | 29 | | | | 27 | | | 28 | |
| | — | | | 101 | | | | 18 | | | | — | | | | — | | | — | |
| | 14 | | | 33 | | | | 12 | | | | 41 | | | | 58 | | | 6 | |
| | | | | | | | | | | | | | | | | | | | | |
| | 214 | | | 36,490 | | | | 586 | | | | 807 | | | | 5,415 | | | 598 | |
| | | | | | | | | | | | | | | | | | | | |
| $ | 169,437 | | $ | 250,867 | | | $ | 44,168 | | | $ | 270,653 | | | $ | 501,913 | | $ | 55,768 | |
| | | | | | | | | | | | | | | | | | | | | |
| $ | 169,444 | | $ | 269,703 | | | $ | 44,934 | | | $ | 240,321 | | | $ | 373,992 | | $ | 42,738 | |
| | — # | | | 2,144 | | | | 363 | | | | 962 | | | | 428 | | | (7 | ) |
| | (7) | | | (19,026 | ) | | | (502 | ) | | | 1,907 | | | | 18,424 | | | 1,157 | |
| | — | | | (1,954 | ) | | | (627 | ) | | | 27,463 | | | | 109,069 | | | 11,880 | |
| | | | | | | | | | | | | | | | | | | | | |
| $ | 169,437 | | $ | 250,867 | | | $ | 44,168 | | | $ | 270,653 | | | $ | 501,913 | | $ | 55,768 | |
| | | | | | | | | | | | | | | | | | | | | |
| $ | 10.00 | | $ | 9.09 | | | $ | 9.87 | | | $ | 12.95 | | | $ | 19.14 | | $ | 17.85 | |
| | | | | | | | | | | | | | | | | | | | | |
| | 16,944 | | | 27,613 | | | | 4,477 | | | | 20,894 | | | | 26,219 | | | 3,124 | |
| | | | | | | | | | | | | | | | | | | | | |
| | 167,856 | | | 284,076 | | | | 44,594 | | | | 242,785 | | | | 395,834 | | | 43,999 | |
| | — | | | 3 | | | | 46 | | | | — | | | | 1,154 | | | — | |
| | — | | | 31,536 | | | | — | | | | 169 | | | | 1,300 | | | — | |
See Notes to Financial Statements
97
THE PHOENIX EDGE SERIES FUND
Statements of Assets and Liabilities (Continued)
December 31, 2007
(Reported in thousands except per share amounts)
| | | | | | | | | | | |
| | | Duff & Phelps
Real Estate Securities
Series | | S&P
Dynamic Asset
Allocation Series:
Aggressive Growth | | | S&P
Dynamic Asset
Allocation Series:
Growth | |
Assets | | | | | | | | | | | |
Investment securities at value+ | | $ | 133,700 | | $ | 23,279 | | | $ | 36,278 | |
Cash | | | — | | | 26 | | | | 4 | |
Receivables | | | | | | | | | | | |
Investment securities sold | | | 140 | | | 21 | | | | 41 | |
Fund shares sold | | | 1,038 | | | 164 | | | | 10 | |
Receivable from adviser | | | — | | | — | | | | — | |
Dividends | | | 983 | | | 198 | | | | 268 | |
Interest | | | — | | | — | | | | — | |
Prepaid expenses | | | 14 | | | 2 | | | | 2 | |
Other assets | | | 10 | | | 2 | | | | 3 | |
| | | | | | | | | | | |
Total assets | | | 135,885 | | | 23,692 | | | | 36,606 | |
| | | | | | | | | | | |
Liabilities | | | | | | | | | | | |
Payables | | | | | | | | | | | |
Fund shares repurchased | | | — | | | 2 | | | | 3 | |
Investment securities purchased | | | 589 | | | 232 | | | | 372 | |
Investment advisory fee | | | 87 | | | 2 | | | | 2 | |
Administration fee | | | 10 | | | 2 | | | | 2 | |
Service fee | | | 8 | | | 1 | | | | 2 | |
Trustees’ fee | | | 4 | | | 1 | | | | 1 | |
Trustee deferred compensation plan | | | 10 | | | 2 | | | | 3 | |
Professional fee | | | 25 | | | 17 | | | | 17 | |
Distribution and service fee | | | — | | | 5 | | | | 8 | |
Variation margin for futures contracts | | | — | | | — | | | | — | |
Other accrued expenses | | | 12 | | | 2 | | | | 7 | |
| | | | | | | | | | | |
Total liabilities | | | 745 | | | 266 | | | | 417 | |
| | | | | | | | | | | |
Net Assets | | $ | 135,140 | | $ | 23,426 | | | $ | 36,189 | |
| | | | | | | | | | | |
Net Assets Consist of: | | | | | | | | | | | |
Capital paid in on shares of beneficial interest | | $ | 89,452 | | $ | 21,986 | | | $ | 34,554 | |
Undistributed net investment income (accumulated net investment loss) | | | 550 | | | — | # | | | — | |
Accumulated net realized gain (loss) | | | 2,614 | | | (411 | ) | | | (608 | ) |
Net unrealized appreciation (depreciation) | | | 42,524 | | | 1,851 | | | | 2,243 | |
| | | | | | | | | | | |
Net Assets | | $ | 135,140 | | $ | 23,426 | | | $ | 36,189 | |
| | | | | | | | | | | |
Net asset value and offering price per share | | $ | 26.82 | | $ | 11.86 | | | $ | 11.54 | |
| | | | | | | | | | | |
Shares of beneficial interest outstanding, $1 par value, unlimited authorization | | | 5,038 | | | 1,975 | | | | 3,136 | |
| | | | | | | | | | | |
| | | 91,176 | | | 21,428 | | | | 34,035 | |
| + | Investment securities at cost |
# | Amount is less than $1,000. |
See Notes to Financial Statements
98
| | | | | | | | | | | | | | | | | | |
S&P
Dynamic Asset
Allocation Series:
Moderate | | S&P
Dynamic Asset
Allocation Series:
Moderate Growth | | | Sanford Bernstein
Mid-Cap Value
Series | | Sanford Bernstein
Small-Cap Value
Series | | Van Kampen
Comstock
Series | | Van Kampen
Equity 500 Index
Series | |
| | | | | |
| $ | 7,338 | | $ | 19,740 | | | $ | 138,012 | | $ | 73,091 | | $ | 87,255 | | $ | 123,660 | |
| | 22 | | | 7 | | | | — | | | — | | | 90 | | | — | # |
| | 32 | | | 35 | | | | — | | | 250 | | | — | | | 105 | |
| | — | | | — | | | | 596 | | | 340 | | | 129 | | | 12 | |
| | 6 | | | 2 | | | | — | | | — | | | — | | | — | |
| | 40 | | | 133 | | | | 139 | | | 89 | | | 93 | | | 179 | |
| | — | | | — | | | | 9 | | | 2 | | | — | | | — | # |
| | — | | | 1 | | | | 14 | | | 8 | | | 9 | | | 12 | |
| | 1 | | | 2 | | | | 11 | | | 6 | | | 7 | | | 10 | |
| | | | | | | | | | | | | | | | | | |
| | 7,439 | | | 19,920 | | | | 138,781 | | | 73,786 | | | 87,583 | | | 123,978 | |
| | | | | | | | | | | | | | | | | | |
| | | | | |
| | 8 | | | 3 | | | | 10 | | | — | | | 52 | | | 115 | |
| | 68 | | | 199 | | | | 325 | | | 434 | | | 52 | | | 104 | |
| | — | | | — | | | | 123 | | | 60 | | | 51 | | | 14 | |
| | — | | | 2 | | | | 10 | | | 5 | | | 7 | | | 9 | |
| | — | | | 1 | | | | 8 | | | 4 | | | 5 | | | 7 | |
| | — | | | 1 | | | | 3 | | | 2 | | | 2 | | | 3 | |
| | 1 | | | 2 | | | | 11 | | | 6 | | | 7 | | | 10 | |
| | 17 | | | 17 | | | | 25 | | | 25 | | | 25 | | | 26 | |
| | 2 | | | 4 | | | | — | | | — | | | — | | | — | |
| | — | | | — | | | | — | | | — | | | — | | | 9 | |
| | 6 | | | 6 | | | | 12 | | | 8 | | | 10 | | | 37 | |
| | | | | | | | | | | | | | | | | | |
| | 102 | | | 235 | | | | 527 | | | 544 | | | 211 | | | 334 | |
| | | | | | | | | | | | | | | | | | |
| $ | 7,337 | | $ | 19,685 | | | $ | 138,254 | | $ | 73,242 | | $ | 87,372 | | $ | 123,644 | |
| | | | | | | | | | | | | | | | | | |
| | | | | |
| $ | 7,057 | | $ | 18,659 | | | $ | 127,073 | | $ | 69,217 | | $ | 81,621 | | $ | 111,861 | |
| | (1) | | | (1 | ) | | | 113 | | | — | | | 89 | | | 209 | |
| | (41) | | | (278 | ) | | | 2,262 | | | 1,441 | | | 1,083 | | | (20,286 | ) |
| | 322 | | | 1,305 | | | | 8,806 | | | 2,584 | | | 4,579 | | | 31,860 | |
| | | | | | | | | | | | | | | | | | |
| $ | 7,337 | | $ | 19,685 | | | $ | 138,254 | | $ | 73,242 | | $ | 87,372 | | $ | 123,644 | |
| | | | | | | | | | | | | | | | | | |
| $ | 10.86 | | $ | 11.30 | | | $ | 12.68 | | $ | 14.46 | | $ | 12.49 | | $ | 13.21 | |
| | | | | | | | | | | | | | | | | | |
| | 676 | | | 1,743 | | | | 10,899 | | | 5,064 | | | 6,994 | | | 9,362 | |
| | | | | | | | | | | | | | | | | | |
| | 7,016 | | | 18,435 | | | | 129,206 | | | 70,507 | | | 82,676 | | | 91,798 | |
See Notes to Financial Statements
99
THE PHOENIX EDGE SERIES FUND
Statements of Operations
December 31, 2007
| | | | | | | | | | | | |
| (Reported in thousands) | | | | | | | | | |
| | | Capital Growth
Series | | | Growth and Income
Series | | | Mid-Cap Growth
Series | |
Investment Income | | | | | | | | | | | | |
Dividends | | $ | 4,333 | | | $ | 3,084 | | | $ | 158 | |
Interest | | | 348 | | | | 85 | | | | 119 | |
Security lending | | | 68 | | | | — | | | | — | |
Foreign taxes withheld | | | — | | | | — | | | | — | |
| | | | | | | | | | | | |
Total investment income | | | 4,749 | | | | 3,169 | | | | 277 | |
| | | | | | | | | | | | |
Expenses | | | | | | | | | | | | |
Investment advisory fee | | | 2,869 | | | | 1,177 | | | | 703 | |
Service fees | | | 279 | | | | 111 | | | | 58 | |
Administration fee | | | 352 | | | | 142 | | | | 73 | |
Custodian | | | 49 | | | | 41 | | | | 10 | |
Printing | | | 46 | | | | 17 | | | | 7 | |
Professional | | | 42 | | | | 36 | | | | 31 | |
Trustees | | | 75 | | | | 30 | | | | 16 | |
Miscellaneous | | | 118 | | | | 45 | | | | 20 | |
| | | | | | | | | | | | |
Total expenses | | | 3,830 | | | | 1,599 | | | | 918 | |
Less expenses reimbursed by investment adviser | | | — | | | | (170 | ) | | | — | |
Custodian fees paid indirectly | | | (1 | ) | | | — | # | | | — | # |
| | | | | | | | | | | | |
Net expenses | | | 3,829 | | | | 1,429 | | | | 918 | |
| | | | | | | | | | | | |
Net investment income (loss) | | | 920 | | | | 1,740 | | | | (641 | ) |
| | | | | | | | | | | | |
Net Realized and Unrealized Gain (Loss) on Investments | | | | | | | | | | | | |
Net realized gain (loss) on investments | | | 19,216 | | | | 12,928 | | | | 22,137 | |
Net realized gain (loss) on foreign currency transactions | | | — | | | | — | | | | 19 | |
Net change in unrealized appreciation (depreciation) on investments | | | 23,698 | | | | (3,858 | ) | | | (4,767 | ) |
Net change in unrealized appreciation (depreciation) on foreign currency translations | | | — | # | | | — | | | | — | |
| | | | | | | | | | | | |
Net gain (loss) on investments | | | 42,914 | | | | 9,070 | | | | 17,389 | |
| | | | | | | | | | | | |
Net increase (decrease) in net assets resulting from operations | | $ | 43,834 | | | $ | 10,810 | | | $ | 16,748 | |
| | | | | | | | | | | | |
# | Amount is less than $1,000. |
See Notes to Financial Statements
100
| | | | | | | | | | | | | | | | | | | | | | |
Money Market
Series | | | Multi-Sector
Fixed Income
Series | | | Multi-Sector
Short Term Bond
Series | | | Strategic Allocation
Series | | | Aberdeen
International
Series | | | Alger
Small-Cap Growth
Series | |
| $ | — | | | $ | 120 | | | $ | 3 | | | $ | 3,108 | | | $ | 15,215 | | | $ | 205 | |
| | 8,707 | | | | 15,564 | | | | 2,674 | | | | 7,031 | | | | 502 | | | | 15 | |
| | — | | | | 39 | | | | — | | | | 7 | | | | 160 | | | | — | |
| | — | | | | — | | | | (1 | ) | | | — | | | | (1,705 | ) | | | — | # |
| | | | | | | | | | | | | | | | | | | | | | | |
| | 8,707 | | | | 15,723 | | | | 2,676 | | | | 10,146 | | | | 14,172 | | | | 220 | |
| | | | | | | | | | | | | | | | | | | | | | | |
| | 655 | | | | 1,231 | | | | 226 | | | | 1,736 | | | | 3,348 | | | | 491 | |
| | 108 | | | | 162 | | | | 30 | | | | 193 | | | | 304 | | | | 38 | |
| | 57 | | | | 205 | | | | 37 | | | | 244 | | | | 397 | | | | 48 | |
| | 22 | | | | 28 | | | | 23 | | | | 71 | | | | 160 | | | | 19 | |
| | — | | | | 28 | | | | — | | | | 33 | | | | 58 | | | | 3 | |
| | 31 | | | | 38 | | | | 31 | | | | 40 | | | | 45 | | | | 30 | |
| | 28 | | | | 44 | | | | 8 | | | | 52 | | | | 80 | | | | 10 | |
| | 35 | | | | 78 | | | | 16 | | | | 97 | | | | 102 | | | | 13 | |
| | | | | | | | | | | | | | | | | | | | | | | |
| | 936 | | | | 1,814 | | | | 371 | | | | 2,466 | | | | 4,494 | | | | 652 | |
| | — | | | | — | | | | (53 | ) | | | — | | | | — | | | | (72 | ) |
| | (2 | ) | | | — | | | | (2 | ) | | | (2 | ) | | | — | | | | (2 | ) |
| | | | | | | | | | | | | | | | | | | | | | | |
| | 934 | | | | 1,814 | | | | 316 | | | | 2,464 | | | | 4,494 | | | | 578 | |
| | | | | | | | | | | | | | | | | | | | | | | |
| | 7,773 | | | | 13,909 | | | | 2,360 | | | | 7,682 | | | | 9,678 | | | | (358 | ) |
| | | | | | | | | | | | | | | | | | | | | | | |
| | (7 | ) | | | 1,376 | | | | 176 | | | | 13,581 | | | | 50,862 | | | | 6,995 | |
| | — | | | | (55 | ) | | | (14 | ) | | | (25 | ) | | | 195 | | | | — | |
| | — | | | | (6,255 | ) | | | (766 | ) | | | (3,863 | ) | | | 3,299 | | | | 2,036 | |
| | — | | | | (68 | ) | | | (7 | ) | | | 10 | | | | (20 | ) | | | — | |
| | | | | | | | | | | | | | | | | | | | | | | |
| | (7 | ) | | | (5,002 | ) | | | (611 | ) | | | 9,703 | | | | 54,336 | | | | 9,031 | |
| | | | | | | | | | | | | | | | | | | | | | | |
| $ | 7,766 | | | $ | 8,907 | | | $ | 1,749 | | | $ | 17,385 | | | $ | 64,014 | | | $ | 8,673 | |
| | | | | | | | | | | | | | | | | | | | | | | |
See Notes to Financial Statements
101
THE PHOENIX EDGE SERIES FUND
Statements of Operations (Continued)
December 31, 2007
| | | | | | | | | | | | |
| (Reported in thousands) | | | | | | | | | |
| | | Duff & Phelps
Real Estate Securities
Series | | | S&P
Dynamic Asset
Allocation Series:
Aggressive Growth | | | S&P
Dynamic Asset
Allocation Series:
Growth | |
Investment Income | | | | | | | | | | | | |
Dividends | | $ | 4,031 | | | $ | 357 | | | $ | 620 | |
Interest | | | 139 | | | | 9 | | | | 17 | |
Foreign taxes withheld | | | — | | | | — | | | | — | |
| | | | | | | | | | | | |
Total investment income | | | 4,170 | | | | 366 | | | | 637 | |
| | | | | | | | | | | | |
Expenses | | | | | | | | | | | | |
Investment advisory fee | | | 1,260 | | | | 71 | | | | 99 | |
Service fees | | | 111 | | | | 12 | | | | 16 | |
Administration fee | | | 142 | | | | 15 | | | | 21 | |
Distribution and service fees | | | — | | | | 44 | | | | 62 | |
Custodian | | | 27 | | | | 14 | | | | 25 | |
Printing | | | 3 | | | | 3 | | | | 5 | |
Professional | | | 33 | | | | 21 | | | | 21 | |
Trustees | | | 31 | | | | 3 | | | | 4 | |
Miscellaneous | | | 46 | | | | 3 | | | | 4 | |
| | | | | | | | | | | | |
Total expenses | | | 1,653 | | | | 186 | | | | 257 | |
Less expenses reimbursed by investment advisor | | | — | | | | (60 | ) | | | (82 | ) |
Custodian fees paid indirectly | | | (1 | ) | | | (2 | ) | | | (2 | ) |
| | | | | | | | | | | | |
Net expenses | | | 1,652 | | | | 124 | | | | 173 | |
| | | | | | | | | | | | |
Net investment income (loss) | | | 2,518 | | | | 242 | | | | 464 | |
| | | | | | | | | | | | |
Net Realized and Unrealized Gain (Loss) on Investments | | | | | | | | | | | | |
Net realized gain (loss) on investments | | | 12,272 | | | | (135 | ) | | | (246 | ) |
Net realized gain (loss) on futures | | | — | | | | — | | | | — | |
Net change in unrealized appreciation (depreciation) on investments | | | (40,714 | ) | | | 1,007 | | | | 1,395 | |
Net change in unrealized appreciation (depreciation) on futures | | | — | | | | — | | | | — | |
| | | | | | | | | | | | |
Net gain (loss) on investments | | | (28,442 | ) | | | 872 | | | | 1,149 | |
| | | | | | | | | | | | |
Net increase (decrease) in net assets resulting from operations | | $ | (25,924 | ) | | $ | 1,114 | | | $ | 1,613 | |
| | | | | | | | | | | | |
# | Amount is less than $1,000. |
See Notes to Financial Statements
102
| | | | | | | | | | | | | | | | | | | | | | |
S&P Dynamic Asset Allocation Series:
Moderate | | | S&P
Dynamic Asset
Allocation Series:
Moderate Growth | | | Sanford Bernstein
Mid-Cap Value
Series | | | Sanford Bernstein
Small-Cap Value
Series | | | Van Kampen
Comstock
Series | | | Van Kampen
Equity 500 Index
Series | |
| $ | 181 | | | $ | 429 | | | $ | 1,911 | | | $ | 1,007 | | | $ | 2,365 | | | $ | 2,529 | |
| | 2 | | | | 8 | | | | 139 | | | | 67 | | | | 273 | | | | 57 | |
| | — | | | | — | | | | (1 | ) | | | (1 | ) | | | (25 | ) | | | — | |
| | | | | | | | | | | | | | | | | | | | | | | |
| | 183 | | | | 437 | | | | 2,049 | | | | 1,073 | | | | 2,613 | | | | 2,586 | |
| | | | | | | | | | | | | | | | | | | | | | | |
| | 21 | | | | 62 | | | | 1,527 | | | | 885 | | | | 715 | | | | 574 | |
| | 3 | | | | 10 | | | | 96 | | | | 56 | | | | 67 | | | | 89 | |
| | 4 | | | | 13 | | | | 122 | | | | 71 | | | | 86 | | | | 113 | |
| | 13 | | | | 38 | | | | — | | | | — | | | | — | | | | — | |
| | 10 | | | | 19 | | | | 21 | | | | 17 | | | | 29 | | | | 98 | |
| | 5 | | | | 5 | | | | 17 | | | | 5 | | | | 10 | | | | 15 | |
| | 20 | | | | 20 | | | | 33 | | | | 31 | | | | 32 | | | | 32 | |
| | 1 | | | | 3 | | | | 26 | | | | 15 | | | | 18 | | | | 24 | |
| | 1 | | | | 3 | | | | 41 | | | | 24 | | | | 30 | | | | 34 | |
| | | | | | | | | | | | | | | | | | | | | | | |
| | 78 | | | | 173 | | | | 1,883 | | | | 1,104 | | | | 987 | | | | 979 | |
| | (41 | ) | | | (63 | ) | | | — | | | | (8 | ) | | | (13 | ) | | | (203 | ) |
| | (1 | ) | | | (2 | ) | | | — | # | | | (1 | ) | | | (3 | ) | | | — | # |
| | | | | | | | | | | | | | | | | | | | | | | |
| | 36 | | | | 108 | | | | 1,883 | | | | 1,095 | | | | 971 | | | | 776 | |
| | | | | | | | | | | | | | | | | | | | | | | |
| | 147 | | | | 329 | | | | 166 | | | | (22 | ) | | | 1,642 | | | | 1,810 | |
| | | | | | | | | | | | | | | | | | | | | | | |
| | 68 | | | | (4 | ) | | | 15,998 | | | | 10,114 | | | | 4,950 | | | | 3,026 | |
| | — | | | | — | | | | — | | | | — | | | | — | | | | 168 | |
| | 202 | | | | 821 | | | | (13,080 | ) | | | (11,201 | ) | | | (8,000 | ) | | | 1,662 | |
| | — | | | | — | | | | — | | | | — | | | | — | | | | (2 | ) |
| | | | | | | | | | | | | | | | | | | | | | | |
| | 270 | | | | 817 | | | | 2,918 | | | | (1,087 | ) | | | (3,050 | ) | | | 4,854 | |
| | | | | | | | | | | | | | | | | | | | | | | |
| $ | 417 | | | $ | 1,146 | | | $ | 3,084 | | | $ | (1,109 | ) | | $ | (1,408 | ) | | $ | 6,664 | |
| | | | | | | | | | | | | | | | | | | | | | | |
See Notes to Financial Statements
103
THE PHOENIX EDGE SERIES FUND
Statements of Changes in Net Assets
| | | | | | | | | | | | | | | | |
| (Reported in thousands) | | | | | | |
| | | Capital Growth Series | | | Growth and Income Series | |
| | | Year Ended
December 31, 2007 | | | Year Ended
December 31, 2006 | | | Year Ended
December 31, 2007 | | | Year Ended
December 31, 2006 | |
From Operations | | | | | | | | | | | | | | | | |
Net investment income (loss) | | $ | 920 | | | $ | 1,067 | | | $ | 1,740 | | | $ | 1,725 | |
Net realized gain (loss) | | | 19,216 | | | | 49,361 | | | | 12,928 | | | | 3,645 | |
Net change in unrealized appreciation (depreciation) | | | 23,698 | | | | (39,918 | ) | | | (3,858 | ) | | | 18,508 | |
| | | | | | | | | | | | | | | | |
Increase (decrease) in net assets resulting from operations | | | 43,834 | | | | 10,510 | | | | 10,810 | | | | 23,878 | |
| | | | | | | | | | | | | | | | |
From Distributions to Shareholders | | | | | | | | | | | | | | | | |
Net investment income | | | (1,079 | ) | | | (859 | ) | | | (1,583 | ) | | | (1,683 | ) |
Net realized short-term gains | | | — | | | | — | | | | — | | | | — | |
Net realized long-term gains | | | — | | | | — | | | | (4,017 | ) | | | — | |
| | | | | | | | | | | | | | | | |
Decrease in net assets from distributions to shareholders | | | (1,079 | ) | | | (859 | ) | | | (5,600 | ) | | | (1,683 | ) |
| | | | | | | | | | | | | | | | |
From Share Transactions | | | | | | | | | | | | | | | | |
Sales of shares | | | 11,405 | | | | 9,731 | | | | 8,108 | | | | 8,364 | |
Reinvestment of distributions | | | 1,079 | | | | 859 | | | | 5,600 | | | | 1,683 | |
Proceeds in conjunction with Plan of Reorganization (Note 11) | | | — | | | | 61,017 | | | | — | | | | 11,722 | |
Shares repurchased | | | (89,753 | ) | | | (108,534 | ) | | | (27,373 | ) | | | (17,473 | ) |
| | | | | | | | | | | | | | | | |
Increase (decrease) in net assets from share transactions | | | (77,269 | ) | | | (36,927 | ) | | | (13,665 | ) | | | 4,296 | |
| | | | | | | | | | | | | | | | |
Net increase (decrease) in net assets | | | (34,514 | ) | | | (27,276 | ) | | | (8,455 | ) | | | 26,491 | |
Net Assets | | | | | | | | | | | | | | | | |
Beginning of period | | | 435,126 | | | | 462,402 | | | | 167,529 | | | | 141,038 | |
| | | | | | | | | | | | | | | | |
End of period | | $ | 400,612 | | | $ | 435,126 | | | $ | 159,074 | | | $ | 167,529 | |
| | | | | | | | | | | | | | | | |
Undistributed net investment income and (accumulated net investment loss) | | $ | 57 | | | $ | 218 | | | $ | 198 | | | $ | 42 | |
| | | | |
Shares | | | | | | | | | | | | | | | | |
Sales of shares | | | 709 | | | | 665 | | | | 528 | | | | 631 | |
Reinvestment of distributions | | | 64 | | | | 56 | | | | 371 | | | | 122 | |
Plan of Reorganization (Note 11) | | | — | | | | 3,996 | | | | — | | | | 836 | |
Shares repurchased | | | (5,536 | ) | | | (7,426 | ) | | | (1,794 | ) | | | (1,313 | ) |
| | | | | | | | | | | | | | | | |
Net Increase / (Decrease) | | | (4,763 | ) | | | (2,709 | ) | | | (895 | ) | | | 276 | |
| | | | | | | | | | | | | | | | |
See Notes to Financial Statements
104
| | | | | | | | | | | | | | | | | | | | | | | | | | | | | | |
| Mid-Cap Growth Series | | | Money Market Series | | | Multi-Sector Fixed Income Series | | | Multi-Sector Short Term Bond Series | |
Year Ended
December 31, 2007 | | | Year Ended
December 31, 2006 | | | Year Ended
December 31, 2007 | | | Year Ended
December 31, 2006 | | | Year Ended
December 31, 2007 | | | Year Ended
December 31, 2006 | | | Year Ended
December 31, 2007 | | | Year Ended
December 31, 2006 | |
| $ | (641 | ) | | $ | (384 | ) | | $ | 7,773 | | | $ | 6,995 | | | $ | 13,909 | | | $ | 13,723 | | | $ | 2,360 | | | $ | 2,305 | |
| | 22,156 | | | | 387 | | | | (7 | ) | | | — | | | | 1,321 | | | | 494 | | | | 162 | | | | (180 | ) |
| | (4,767 | ) | | | 1,144 | | | | — | | | | — | | | | (6,323 | ) | | | 1,964 | | | | (773 | ) | | | 491 | |
| | | | | | | | | | | | | | | | | | | | | | | | | | | | | | | |
| | 16,748 | | | | 1,147 | | | | 7,766 | | | | 6,995 | | | | 8,907 | | | | 16,181 | | | | 1,749 | | | | 2,616 | |
| | | | | | | | | | | | | | | | | | | | | | | | | | | | | | | |
| | — | | | | — | | | | (7,773 | ) | | | (6,995 | ) | | | (13,201 | ) | | | (13,054 | ) | | | (2,336 | ) | | | (2,137 | ) |
| | — | | | | — | | | | — | | | | — | | | | — | | | | — | | | | — | | | | — | |
| | — | | | | — | | | | — | | | | — | | | | — | | | | — | | | | — | | | | — | |
| | | | | | | | | | | | | | | | | | | | | | | | | | | | | | | |
| | — | | | | — | | | | (7,773 | ) | | | (6,995 | ) | | | (13,201 | ) | | | (13,054 | ) | | | (2,336 | ) | | | (2,137 | ) |
| | | | | | | | | | | | | | | | | | | | | | | | | | | | | | | |
| | 10,181 | | | | 11,584 | | | | 118,903 | | | | 106,260 | | | | 23,800 | | | | 26,788 | | | | 7,395 | | | | 7,878 | |
| | — | | | | — | | | | 7,773 | | | | 6,995 | | | | 13,201 | | | | 13,054 | | | | 2,336 | | | | 2,137 | |
| | — | | | | 53,114 | | | | — | | | | — | | | | — | | | | — | | | | — | | | | — | |
| | (29,188 | ) | | | (23,495 | ) | | | (114,390 | ) | | | (102,528 | ) | | | (27,590 | ) | | | (36,316 | ) | | | (11,639 | ) | | | (11,365 | ) |
| | | | | | | | | | | | | | | | | | | | | | | | | | | | | | | |
| | (19,007 | ) | | | 41,203 | | | | 12,286 | | | | 10,727 | | | | 9,411 | | | | 3,526 | | | | (1,908 | ) | | | (1,350 | ) |
| | | | | | | | | | | | | | | | | | | | | | | | | | | | | | | |
| | (2,259 | ) | | | 42,350 | | | | 12,279 | | | | 10,727 | | | | 5,117 | | | | 6,653 | | | | (2,495 | ) | | | (871 | ) |
| | | | | | | |
| | 89,512 | | | | 47,162 | | | | 157,158 | | | | 146,431 | | | | 245,750 | | | | 239,097 | | | | 46,663 | | | | 47,534 | |
| | | | | | | | | | | | | | | | | | | | | | | | | | | | | | | |
| $ | 87,253 | | | $ | 89,512 | | | $ | 169,437 | | | $ | 157,158 | | | $ | 250,867 | | | $ | 245,750 | | | $ | 44,168 | | | $ | 46,663 | |
| | | | | | | | | | | | | | | | | | | | | | | | | | | | | | | |
| $ | (8 | ) | | $ | (2 | ) | | $ | — | | | $ | — | | | $ | 2,144 | | | $ | 811 | | | $ | 363 | | | $ | 209 | |
| | | | | | | |
| | 658 | | | | 849 | | | | 11,890 | | | | 10,626 | | | | 2,542 | | | | 2,900 | | | | 729 | | | | 790 | |
| | — | | | | — | | | | 777 | | | | 699 | | | | 1,452 | | | | 1,438 | | | | 236 | | | | 216 | |
| | — | | | | 3,950 | | | | — | | | | — | | | | — | | | | — | | | | — | | | | — | |
| | (1,986 | ) | | | (1,799 | ) | | | (11,439 | ) | | | (10,253 | ) | | | (2,944 | ) | | | (3,936 | ) | | | (1,148 | ) | | | (1,133 | ) |
| | | | | | | | | | | | | | | | | | | | | | | | | | | | | | | |
| | (1,328 | ) | | | 3,000 | | | | 1,228 | | | | 1,072 | | | | 1,050 | | | | 402 | | | | (183 | ) | | | (127 | ) |
| | | | | | | | | | | | | | | | | | | | | | | | | | | | | | | |
See Notes to Financial Statements
105
THE PHOENIX EDGE SERIES FUND
Statements of Changes in Net Assets (Continued)
| | | | | | | | | | | | | | | | |
| (Reported in thousands) | | | | | | |
| | | Strategic Allocation Series | | | Aberdeen International Series | |
| | | Year Ended
December 31, 2007 | | | Year Ended
December 31, 2006 | | | Year Ended
December 31, 2007 | | | Year Ended
December 31, 2006 | |
From Operations | | | | | | | | | | | | | | | | |
Net investment income (loss) | | $ | 7,682 | | | $ | 8,740 | | | $ | 9,678 | | | $ | 5,009 | |
Net realized gain (loss) | | | 13,556 | | | | 33,332 | | | | 51,057 | | | | 28,638 | |
Net change in unrealized appreciation (depreciation) | | | (3,853 | ) | | | (3,049 | ) | | | 3,279 | | | | 28,384 | |
| | | | | | | | | | | | | | | | |
Increase (decrease) in net assets resulting from operations | | | 17,385 | | | | 39,023 | | | | 64,014 | | | | 62,031 | |
| | | | | | | | | | | | | | | | |
From Distributions to Shareholders | | | | | | | | | | | | | | | | |
Net investment income | | | (7,465 | ) | | | (8,344 | ) | | | (7,352 | ) | | | (5,769 | ) |
Net realized short-term gains | | | (4,382 | ) | | | (8,381 | ) | | | (939 | ) | | | — | |
Net realized long-term gains | | | (10,976 | ) | | | (30,264 | ) | | | (23,958 | ) | | | — | |
| | | | | | | | | | | | | | | | |
Decrease in net assets from distributions to shareholders | | | (22,823 | ) | | | (46,989 | ) | | | (32,249 | ) | | | (5,769 | ) |
| | | | | | | | | | | | | | | | |
From Share Transactions | | | | | | | | | | | | | | | | |
Sales of shares | | | 4,074 | | | | 3,042 | | | | 59,091 | | | | 38,545 | |
Reinvestment of distributions | | | 22,823 | | | | 46,989 | | | | 32,249 | | | | 5,769 | |
Proceeds in conjunction with Plan of Reorganization (Note 11) | | | — | | | | — | | | | — | | | | 175,010 | |
Proceeds in conjunction with Plan of Reorganization (Note 11) | | | — | | | | — | | | | — | | | | — | |
Shares repurchased | | | (66,951 | ) | | | (78,662 | ) | | | (42,473 | ) | | | (44,939 | ) |
| | | | | | | | | | | | | | | | |
Increase (decrease) in net assets from share transactions | | | (40,054 | ) | | | (28,631 | ) | | | 48,867 | | | | 174,385 | |
| | | | | | | | | | | | | | | | |
Net increase (decrease) in net assets | | | (45,492 | ) | | | (36,597 | ) | | | 80,632 | | | | 230,647 | |
| | | | | | | | | | | | | | | | |
Net Assets | | | | | | | | | | | | | | | | |
Beginning of period | | | 316,145 | | | | 352,742 | | | | 421,281 | | | | 190,634 | |
| | | | | | | | | | | | | | | | |
End of period | | $ | 270,653 | | | $ | 316,145 | | | $ | 501,913 | | | $ | 421,281 | |
| | | | | | | | | | | | | | | | |
Undistributed net investment income and (accumulated net investment loss) | | $ | 962 | | | $ | 680 | | | $ | 428 | | | $ | (2,090 | ) |
| | | | |
Shares | | | | | | | | | | | | | | | | |
Sales of shares | | | 298 | | | | 213 | | | | 3,115 | | | | 2,384 | |
Reinvestment of distributions | | | 1,738 | | | | 3,519 | | | | 1,688 | | | | 358 | |
Plan of Reorganization (Note 11) | | | — | | | | — | | | | — | | | | 10,427 | |
Plan of Reorganization (Note 11) | | | — | | | | — | | | | — | | | | — | |
Shares repurchased | | | (4,914 | ) | | | (5,565 | ) | | | (2,253 | ) | | | (2,843 | ) |
| | | | | | | | | | | | | | | | |
Net Increase / (Decrease) | | | (2,878 | ) | | | (1,833 | ) | | | 2,550 | | | | 10,326 | |
| | | | | | | | | | | | | | | | |
| †† | Amount less than 1,000 shares. |
See Notes to Financial Statements
106
| | | | | | | | | | | | | | | | | | | | | | | | | | | | | | |
| Alger Small-Cap Growth Series | | | Duff & Phelps
Real Estate Securities Series | | | S&P Dynamic Asset Allocation
Series: Aggressive Growth | | | S&P Dynamic Asset Allocation
Series: Growth | |
Year Ended
December 31, 2007 | | | Year Ended
December 31, 2006 | | | Year Ended
December 31, 2007 | | | Year Ended
December 31, 2006 | | | Year Ended
December 31, 2007 | | | From Inception
February 3, 2006 to
December 31, 2006 | | | Year Ended
December 31, 2007 | | | From Inception
February 3, 2006 to
December 31, 2006 | |
| $ | (358 | ) | | $ | (188 | ) | | $ | 2,518 | | | $ | 2,226 | | | $ | 242 | | | $ | 112 | | | $ | 464 | | | $ | 153 | |
| | 6,995 | | | | 7,999 | | | | 12,272 | | | | 14,452 | | | | (135 | ) | | | (80 | ) | | | (246 | ) | | | (131 | ) |
| | 2,036 | | | | (2,384 | ) | | | (40,714 | ) | | | 34,308 | | | | 1,007 | | | | 844 | | | | 1,395 | | | | 848 | |
| | | | | | | | | | | | | | | | | | | | | | | | | | | | | | | |
| | 8,673 | | | | 5,427 | | | | (25,924 | ) | | | 50,986 | | | | 1,114 | | | | 876 | | | | 1,613 | | | | 870 | |
| | | | | | | | | | | | | | | | | | | | | | | | | | | | | | | |
| | — | | | | — | | | | (2,063 | ) | | | (2,131 | ) | | | (241 | ) | | | (112 | ) | | | (464 | ) | | | (155 | ) |
| | (1,502 | ) | | | — | | | | (2,116 | ) | | | (1,532 | ) | | | (196 | ) | | | — | | | | (230 | ) | | | — | |
| | (9,086 | ) | | | (6 | ) | | | (11,157 | ) | | | (11,648 | ) | | | — | | | | — | | | | — | | | | — | |
| | | | | | | | | | | | | | | | | | | | | | | | | | | | | | | |
| | (10,588 | ) | | | (6 | ) | | | (15,336 | ) | | | (15,311 | ) | | | (437 | ) | | | (112 | ) | | | (694 | ) | | | (155 | ) |
| | | | | | | | | | | | | | | | | | | | | | | | | | | | | | | |
| | 2,733 | | | | 5,975 | | | | 13,438 | | | | 25,505 | | | | 14,860 | | | | 10,903 | | | | 23,599 | | | | 14,179 | |
| | 10,588 | | | | 6 | | | | 15,336 | | | | 15,311 | | | | 437 | | | | 112 | | | | 694 | | | | 155 | |
| | — | | | | 16,831 | | | | — | | | | — | | | | — | | | | — | | | | — | | | | — | |
| | — | | | | 17,716 | | | | — | | | | — | | | | — | | | | — | | | | — | | | | — | |
| | (13,291 | ) | | | (11,474 | ) | | | (40,296 | ) | | | (25,850 | ) | | | (3,845 | ) | | | (482 | ) | | | (2,086 | ) | | | (1,986 | ) |
| | | | | | | | | | | | | | | | | | | | | | | | | | | | | | | |
| | 30 | | | | 29,054 | | | | (11,522 | ) | | | 14,966 | | | | 11,452 | | | | 10,533 | | | | 22,207 | | | | 12,348 | |
| | | | | | | | | | | | | | | | | | | | | | | | | | | | | | | |
| | (1,885 | ) | | | 34,475 | | | | (52,782 | ) | | | 50,641 | | | | 12,129 | | | | 11,297 | | | | 23,126 | | | | 13,063 | |
| | | | | | | | | | | | | | | | | | | | | | | | | | | | | | | |
| | 57,653 | | | | 23,178 | | | | 187,922 | | | | 137,281 | | | | 11,297 | | | | — | | | | 13,063 | | | | — | |
| | | | | | | | | | | | | | | | | | | | | | | | | | | | | | | |
| $ | 55,768 | | | $ | 57,653 | | | $ | 135,140 | | | $ | 187,922 | | | $ | 23,426 | | | $ | 11,297 | | | $ | 36,189 | | | $ | 13,063 | |
| | | | | | | | | | | | | | | | | | | | | | | | | | | | | | | |
| $ | (7 | ) | | $ | (3 | ) | | $ | 550 | | | $ | 95 | | | $ | — | | | $ | (1 | ) | | $ | — | | | $ | (1 | ) |
| | | | | | | |
| | 140 | | | | 346 | | | | 398 | | | | 776 | | | | 1,241 | | | | 1,049 | | | | 2,057 | | | | 1,386 | |
| | 572 | | | | — | †† | | | 542 | | | | 446 | | | | 37 | | | | 10 | | | | 60 | | | | 14 | |
| | — | | | | 932 | | | | — | | | | — | | | | — | | | | — | | | | — | | | | — | |
| | — | | | | 981 | | | | — | | | | — | | | | — | | | | — | | | | — | | | | — | |
| | (679 | ) | | | (652 | ) | | | (1,180 | ) | | | (780 | ) | | | (316 | ) | | | (45 | ) | | | (183 | ) | | | (198 | ) |
| | | | | | | | | | | | | | | | | | | | | | | | | | | | | | | |
| | 33 | | | | 1,607 | | | | (240 | ) | | | 442 | | | | 962 | | | | 1,014 | | | | 1,934 | | | | 1,202 | |
| | | | | | | | | | | | | | | | | | | | | | | | | | | | | | | |
See Notes to Financial Statements
107
THE PHOENIX EDGE SERIES FUND
Statements of Changes in Net Assets (Continued)
| | | | | | | | | | | | | | | | |
| (Reported in thousands) | | | | | | |
| | | S&P Dynamic Asset Allocation
Series: Moderate | | | S&P Dynamic Asset Allocation
Series: Moderate Growth | |
| | | Year Ended
December 31, 2007 | | | From Inception
February 3, 2006 to
December 31, 2006 | | | Year Ended
December 31, 2007 | | | From Inception
February 3, 2006 to
December 31, 2006 | |
From Operations | | | | | | | | | | | | | | | | |
Net investment income (loss) | | $ | 147 | | | $ | 55 | | | $ | 329 | | | $ | 116 | |
Net realized gain (loss) | | | 68 | | | | (12 | ) | | | (4 | ) | | | (27 | ) |
Net change in unrealized appreciation (depreciation) | | | 202 | | | | 120 | | | | 821 | | | | 484 | |
| | | | | | | | | | | | | | | | |
Increase (decrease) in net assets resulting from operations | | | 417 | | | | 163 | | | | 1,146 | | | | 573 | |
| | | | | | | | | | | | | | | | |
From Distributions to Shareholders | | | | | | | | | | | | | | | | |
Net investment income | | | (147 | ) | | | (57 | ) | | | (331 | ) | | | (117 | ) |
Net realized short-term gains | | | (91 | ) | | | — | | | | (198 | ) | | | (18 | ) |
Net realized long-term gains | | | (6 | ) | | | — | | | | (29 | ) | | | — | |
| | | | | | | | | | | | | | | | |
Decrease in net assets from distributions to shareholders | | | (244 | ) | | | (57 | ) | | | (558 | ) | | | (135 | ) |
| | | | | | | | | | | | | | | | |
From Share Transactions | | | | | | | | | | | | | | | | |
Sales of shares | | | 4,747 | | | | 3,949 | | | | 12,628 | | | | 9,318 | |
Reinvestment of distributions | | | 244 | | | | 57 | | | | 558 | | | | 135 | |
Proceeds in conjunction with Plan of Reorganization (Note 11) | | | — | | | | — | | | | — | | | | — | |
Proceeds in conjunction with Plan of Reorganization (Note 11) | | | — | | | | — | | | | — | | | | — | |
Shares repurchased | | | (1,688 | ) | | | (251 | ) | | | (3,453 | ) | | | (527 | ) |
| | | | | | | | | | | | | | | | |
Increase (decrease) in net assets from share transactions | | | 3,303 | | | | 3,755 | | | | 9,733 | | | | 8,926 | |
| | | | | | | | | | | | | | | | |
Net increase (decrease) in net assets | | | 3,476 | | | | 3,861 | | | | 10,321 | | | | 9,364 | |
Net Assets | | | | | | | | | | | | | | | | |
Beginning of period | | | 3,861 | | | | — | | | | 9,364 | | | | — | |
| | | | | | | | | | | | | | | | |
End of period | | $ | 7,337 | | | $ | 3,861 | | | $ | 19,685 | | | $ | 9,364 | |
| | | | | | | | | | | | | | | | |
Undistributed net investment income and (accumulated net investment loss) | | $ | (1 | ) | | $ | (1 | ) | | $ | (1 | ) | | $ | (1 | ) |
| | | | |
Shares | | | | | | | | | | | | | | | | |
Sales of shares | | | 439 | | | | 390 | | | | 1,123 | | | | 913 | |
Reinvestment of distributions | | | 23 | | | | 5 | | | | 49 | | | | 13 | |
Plan of Reorganization (Note 11) | | | — | | | | — | | | | — | | | | — | |
Plan of Reorganization (Note 11) | | | — | | | | — | | | | — | | | | — | |
Shares repurchased | | | (157 | ) | | | (25 | ) | | | (302 | ) | | | (52 | ) |
| | | | | | | | | | | | | | | | |
Net Increase / (Decrease) | | | 305 | | | | 370 | | | | 870 | | | | 874 | |
| | | | | | | | | | | | | | | | |
See Notes to Financial Statements
108
| | | | | | | | | | | | | | | | | | | | | | | | | | | | | | |
Sanford Bernstein
Mid-Cap Value Series | | | Sanford Bernstein
Small-Cap Value Series | | | Van Kampen Comstock Series | | | Van Kampen
Equity 500 Index Series | |
Year Ended
December 31, 2007 | | | Year Ended
December 31, 2006 | | | Year Ended
December 31, 2007 | | | Year Ended
December 31, 2006 | | | Year Ended
December 31, 2007 | | | Year Ended
December 31, 2006 | | | Year Ended
December 31, 2007 | | | Year Ended
December 31, 2006 | |
| $ | 166 | | | $ | 584 | | | $ | (22 | ) | | $ | 163 | | | $ | 1,642 | | | $ | 1,586 | | | $ | 1,810 | | | $ | 1,471 | |
| | 15,998 | | | | 15,189 | | | | 10,114 | | | | 11,140 | | | | 4,950 | | | | 20,003 | | | | 3,194 | | | | 10,145 | |
| | (13,080 | ) | | | 1,664 | | | | (11,201 | ) | | | 468 | | | | (8,000 | ) | | | (1,469 | ) | | | 1,660 | | | | 3,194 | |
| | | | | | | | | | | | | | | | | | | | | | | | | | | | | | | |
| | 3,084 | | | | 17,437 | | | | (1,109 | ) | | | 11,771 | | | | (1,408 | ) | | | 20,120 | | | | 6,664 | | | | 14,810 | |
| | | | | | | | | | | | | | | | | | | | | | | | | | | | | | | |
| | (199 | ) | | | (525 | ) | | | — | | | | (171 | ) | | | (1,559 | ) | | | (1,756 | ) | | | (1,711 | ) | | | (1,455 | ) |
| | (2,655 | ) | | | (539 | ) | | | (1,697 | ) | | | (675 | ) | | | (1,830 | ) | | | (3,621 | ) | | | — | | | | — | |
| | (14,497 | ) | | | (15,382 | ) | | | (8,502 | ) | | | (11,125 | ) | | | (2,988 | ) | | | (13,694 | ) | | | — | | | | — | |
| | | | | | | | | | | | | | | | | | | | | | | | | | | | | | | |
| | (17,351 | ) | | | (16,446 | ) | | | (10,199 | ) | | | (11,971 | ) | | | (6,377 | ) | | | (19,071 | ) | | | (1,711 | ) | | | (1,455 | ) |
| | | | | | | | | | | | | | | | | | | | | | | | | | | | | | | |
| | 24,315 | | | | 12,846 | | | | 6,306 | | | | 10,538 | | | | 7,056 | | | | 5,309 | | | | 5,311 | | | | 2,065 | |
| | 17,351 | | | | 16,446 | | | | 10,199 | | | | 11,971 | | | | 6,377 | | | | 19,071 | | | | 1,711 | | | | 1,455 | |
| | — | | | | — | | | | — | | | | — | | | | — | | | | — | | | | — | | | | 21,818 | |
| | — | | | | — | | | | — | | | | — | | | | — | | | | — | | | | — | | | | 22,250 | |
| | (20,862 | ) | | | (20,421 | ) | | | (14,726 | ) | | | (11,960 | ) | | | (26,485 | ) | | | (23,936 | ) | | | (30,677 | ) | | | (23,655 | ) |
| | | | | | | | | | | | | | | | | | | | | | | | | | | | | | | |
| | 20,804 | | | | 8,871 | | | | 1,779 | | | | 10,549 | | | | (13,052 | ) | | | 444 | | | | (23,655 | ) | | | 23,933 | |
| | | | | | | | | | | | | | | | | | | | | | | | | | | | | | | |
| | 6,537 | | | | 9,862 | | | | (9,529 | ) | | | 10,349 | | | | (20,837 | ) | | | 1,493 | | | | (18,702 | ) | | | 37,288 | |
| | | | | | | |
| | 131,717 | | | | 121,855 | | | | 82,771 | | | | 72,422 | | | | 108,209 | | | | 106,716 | | | | 142,346 | | | | 105,058 | |
| | | | | | | | | | | | | | | | | | | | | | | | | | | | | | | |
| $ | 138,254 | | | $ | 131,717 | | | $ | 73,242 | | | $ | 82,771 | | | $ | 87,372 | | | $ | 108,209 | | | $ | 123,644 | | | $ | 142,346 | |
| | | | | | | | | | | | | | | | | | | | | | | | | | | | | | | |
| $ | 113 | | | $ | 146 | | | $ | — | | | $ | 3 | | | $ | 89 | | | $ | 6 | | | $ | 209 | | | $ | 113 | |
| | | | | | | |
| | 1,619 | | | | 872 | | | | 360 | | | | 579 | | | | 509 | | | | 353 | | | | 398 | | | | 175 | |
| | 1,304 | | | | 1,157 | | | | 677 | | | | 694 | | | | 491 | | | | 1,382 | | | | 128 | | | | 121 | |
| | — | | | | — | | | | — | | | | — | | | | — | | | | — | | | | — | | | | 1,758 | |
| | — | | | | — | | | | — | | | | — | | | | — | | | | — | | | | — | | | | 1,793 | |
| | (1,351 | ) | | | (1,398 | ) | | | (832 | ) | | | (668 | ) | | | (1,896 | ) | | | (1,614 | ) | | | (2,315 | ) | | | (1,979 | ) |
| | | | | | | | | | | | | | | | | | | | | | | | | | | | | | | |
| | 1,572 | | | | 631 | | | | 205 | | | | 605 | | | | (896 | ) | | | 121 | | | | (1,789 | ) | | | 1,868 | |
| | | | | | | | | | | | | | | | | | | | | | | | | | | | | | | |
See Notes to Financial Statements
109
THE PHOENIX EDGE SERIES FUND
Financial Highlights
Selected Data For a Share Outstanding Throughout Each Period
| | | | | | | | | | | | | | | | | | | | | | | | | | |
| | | Net | | | | | Net | | | | | Dividends | | | Distributions | | | | |
| | | Asset | | Net | | | Realized | | | Total | | from | | | from | | | | |
| | | Value | | Investment | | | and | | | from | | Net | | | Net | | | | |
| | | Beginning | | Income | | | Unrealized | | | Investment | | Investment | | | Realized | | | Total | |
| | | of Period | | (Loss) | | | Gain/(Loss) | | | Operations | | Income | | | Gains | | | Distributions | |
Capital Growth Series | | | | | | | | | | | | | | | | | | | | | | | | | | |
12/31/07 | | $ | 15.21 | | $ | 0.04 | (1) | | $ | 1.60 | | | $ | 1.64 | | $ | (0.04 | ) | | $ | — | | | $ | (0.04 | ) |
12/31/06 | | | 14.77 | | | 0.04 | (1) | | | 0.43 | | | | 0.47 | | | (0.03 | ) | | | — | | | | (0.03 | ) |
12/31/05 | | | 14.25 | | | 0.01 | (1) | | | 0.52 | | | | 0.53 | | | (0.01 | ) | | | — | | | | (0.01 | ) |
12/31/04 | | | 13.69 | | | 0.11 | | | | 0.57 | | | | 0.68 | | | (0.12 | ) | | | — | | | | (0.12 | ) |
12/31/03 | | | 10.84 | | | 0.01 | | | | 2.85 | | | | 2.86 | | | (0.01 | ) | | | — | | | | (0.01 | ) |
| | | | | | | |
Growth and Income Series | | | | | | | | | | | | | | | | | | | | | | | | | | |
12/31/07 | | $ | 14.51 | | $ | 0.16 | (1) | | $ | 0.81 | | | $ | 0.97 | | $ | (0.15 | ) | | $ | (0.39 | ) | | $ | (0.54 | ) |
12/31/06 | | | 12.52 | | | 0.16 | (1) | | | 1.98 | | | | 2.14 | | | (0.15 | ) | | | — | | | | (0.15 | ) |
12/31/05 | | | 12.07 | | | 0.13 | (1) | | | 0.45 | | | | 0.58 | | | (0.13 | ) | | | — | | | | (0.13 | ) |
12/31/04 | | | 11.06 | | | 0.13 | (1) | | | 1.02 | | | | 1.15 | | | (0.14 | ) | | | — | | | | (0.14 | ) |
12/31/03 | | | 8.77 | | | 0.11 | | | | 2.29 | | | | 2.40 | | | (0.11 | ) | | | — | | | | (0.11 | ) |
| | | | | | | |
Mid-Cap Growth Series | | | | | | | | | | | | | | | | | | | | | | | | | | |
12/31/07 | | $ | 13.46 | | $ | (0.11 | )(1) | | $ | 3.05 | | | $ | 2.94 | | $ | — | | | $ | — | | | $ | — | |
12/31/06 | | | 12.93 | | | (0.09 | )(1) | | | 0.62 | | | | 0.53 | | | — | | | | — | | | | — | |
12/31/05 | | | 12.41 | | | (0.09 | )(1) | | | 0.61 | | | | 0.52 | | | — | | | | — | | | | — | |
12/31/04 | | | 11.63 | | | (0.06 | )(1) | | | 0.84 | | | | 0.78 | | | — | | | | — | | | | — | |
12/31/03 | | | 9.03 | | | (0.07 | )(1) | | | 2.67 | | | | 2.60 | | | — | | | | — | | | | — | |
| | | | | | | |
Money Market Series | | | | | | | | | | | | | | | | | | | | | | | | | | |
12/31/07 | | $ | 10.00 | | $ | 0.47 | (1) | | $ | — | | | $ | 0.47 | | $ | (0.47 | ) | | $ | — | | | $ | (0.47 | ) |
12/31/06 | | | 10.00 | | | 0.43 | | | | — | | | | 0.43 | | | (0.43 | ) | | | — | | | | (0.43 | ) |
12/31/05 | | | 10.00 | | | 0.26 | | | | — | | | | 0.26 | | | (0.26 | ) | | | — | | | | (0.26 | ) |
12/31/04 | | | 10.00 | | | 0.08 | | | | — | | | | 0.08 | | | (0.08 | ) | | | — | | | | (0.08 | ) |
12/31/03 | | | 10.00 | | | 0.07 | | | | — | | | | 0.07 | | | (0.07 | ) | | | — | | | | (0.07 | ) |
| | | | | | | |
Multi-Sector Fixed Income Series | | | | | | | | | | | | | | | | | | | | | | | | | | |
12/31/07 | | $ | 9.25 | | $ | 0.53 | (1) | | $ | (0.19 | ) | | $ | 0.34 | | $ | (0.50 | ) | | $ | — | | | $ | (0.50 | ) |
12/31/06 | | | 9.14 | | | 0.52 | (1) | | | 0.09 | | | | 0.61 | | | (0.50 | ) | | | — | | | | (0.50 | ) |
12/31/05 | | | 9.43 | | | 0.50 | (1) | | | (0.34 | ) | | | 0.16 | | | (0.45 | ) | | | — | | | | (0.45 | ) |
12/31/04 | | | 9.39 | | | 0.55 | | | | 0.07 | | | | 0.62 | | | (0.58 | ) | | | — | | | | (0.58 | ) |
12/31/03(5) | | | 8.76 | | | 0.58 | | | | 0.66 | | | | 1.24 | | | (0.61 | ) | | | — | | | | (0.61 | ) |
| | | | | | |
Multi-Sector Short Term Bond Series | | | | | | | | | | | | | | | | | | | | | | | |
12/31/07 | | $ | 10.01 | | $ | 0.53 | (1) | | $ | (0.13 | ) | | $ | 0.40 | | $ | (0.54 | ) | | $ | — | | | $ | (0.54 | ) |
12/31/06 | | | 9.93 | | | 0.49 | (1) | | | 0.06 | | | | 0.55 | | | (0.47 | ) | | | — | | | | (0.47 | ) |
12/31/05 | | | 10.16 | | | 0.45 | (1) | | | (0.31 | ) | | | 0.14 | | | (0.37 | ) | | | — | | | | (0.37 | ) |
12/31/04 | | | 10.05 | | | 0.42 | | | | 0.11 | | | | 0.53 | | | (0.42 | ) | | | — | | | | (0.42 | ) |
From Inception 6/2/03 – 12/31/03 | | | 10.00 | | | 0.24 | | | | 0.05 | | | | 0.29 | | | (0.24 | ) | | | — | | | | (0.24 | ) |
See Notes to Financial Statements
110
| | | | | | | | | | | | | | | | | | | | | | | |
Change
in
Net Asset
Value | | | Net
Asset
Value
End of
Period | | Total
Return | | | Net
Assets
End of
Period
(000) | | Net
Operating
Expenses | | | Gross
Operating
Expenses | | | Net
Investment
Income
(Loss) | | | Portfolio
Turnover | |
| $ | 1.60 | | | $ | 16.81 | | 10.75 | % | | $ | 400,612 | | 0.91 | % | | 0.91 | % | | 0.22 | % | | 88 | % |
| | 0.44 | | | | 15.21 | | 3.22 | | | | 435,126 | | 0.92 | | | 0.92 | | | 0.25 | | | 182 | |
| | 0.52 | | | | 14.77 | | 3.71 | | | | 462,402 | | 0.89 | | | 0.89 | | | 0.06 | | | 73 | |
| | 0.56 | | | | 14.25 | | 4.97 | | | | 565,515 | | 0.87 | | | 0.87 | | | 0.72 | | | 50 | |
| | 2.85 | | | | 13.69 | | 26.49 | | | | 632,025 | | 0.85 | | | 0.85 | | | 0.07 | | | 41 | |
| | | | | | | |
| $ | 0.43 | | | $ | 14.94 | | 6.66 | % | | $ | 159,074 | | 0.85 | % | | 0.95 | % | | 1.03 | % | | 44 | % |
| | 1.99 | | | | 14.51 | | 17.18 | | | | 167,529 | | 0.91 | (4) | | 0.97 | | | 1.17 | | | 37 | |
| | 0.45 | | | | 12.52 | | 4.80 | | | | 141,038 | | 0.95 | | | 0.99 | | | 1.04 | | | 44 | |
| | 1.01 | | | | 12.07 | | 10.48 | | | | 149,609 | | 0.95 | | | 0.98 | | | 1.13 | | | 58 | |
| | 2.29 | | | | 11.06 | | 27.46 | | | | 107,718 | | 0.95 | | | 1.01 | | | 1.18 | | | 55 | |
| | | | | | | |
| $ | 2.94 | | | $ | 16.40 | | 21.80 | % | | $ | 87,253 | | 1.05 | % | | 1.05 | % | | (0.73 | )% | | 149 | % |
| | 0.53 | | | | 13.46 | | 4.13 | | | | 89,512 | | 1.13 | (4) | | 1.14 | | | (0.72 | ) | | 80 | |
| | 0.52 | | | | 12.93 | | 4.18 | | | | 47,162 | | 1.15 | | | 1.21 | | | (0.76 | ) | | 178 | |
| | 0.78 | | | | 12.41 | | 6.72 | | | | 62,681 | | 1.15 | | | 1.18 | | | (0.53 | ) | | 175 | |
| | 2.60 | | | | 11.63 | | 28.83 | | | | 61,294 | | 1.15 | | | 1.16 | | | (0.67 | ) | | 174 | |
| | | | | | | |
| $ | — | | | $ | 10.00 | | 4.88 | % | | $ | 169,437 | | 0.57 | % | | 0.57 | % | | 4.74 | % | | N/A | |
| | — | | | | 10.00 | | 4.41 | | | | 157,158 | | 0.65 | | | 0.66 | | | 4.35 | | | N/A | |
| | — | | | | 10.00 | | 2.58 | | | | 146,431 | | 0.65 | | | 0.66 | | | 2.54 | | | N/A | |
| | — | | | | 10.00 | | 0.79 | | | | 156,996 | | 0.64 | | | 0.64 | | | 0.77 | | | N/A | |
| | — | | | | 10.00 | | 0.68 | | | | 202,644 | | 0.59 | | | 0.59 | | | 0.69 | | | N/A | |
| | | | | | | |
| $ | (0.16 | ) | | $ | 9.09 | | 3.71 | % | | $ | 250,867 | | 0.74 | % | | 0.74 | % | | 5.65 | % | | 94 | % |
| | 0.11 | | | | 9.25 | | 6.84 | | | | 245,750 | | 0.74 | | | 0.74 | | | 5.60 | | | 90 | |
| | (0.29 | ) | | | 9.14 | | 1.78 | | | | 239,097 | | 0.75 | | | 0.75 | | | 5.37 | | | 91 | |
| | 0.04 | | | | 9.43 | | 6.84 | | | | 249,885 | | 0.73 | | | 0.73 | | | 5.68 | | | 100 | |
| | 0.63 | | | | 9.39 | | 14.58 | | | | 198,502 | | 0.74 | | | 0.74 | | | 6.35 | | | 156 | |
| | | | | | | |
| $ | (0.14 | ) | | $ | 9.87 | | 3.99 | % | | $ | 44,168 | | 0.70 | % | | 0.82 | % | | 5.23 | % | | 73 | % |
| | 0.08 | | | | 10.01 | | 5.71 | | | | 46,663 | | 0.70 | | | 0.88 | | | 4.92 | | | 87 | |
| | (0.23 | ) | | | 9.93 | | 1.36 | | | | 47,534 | | 0.70 | | | 0.98 | | | 4.45 | | | 91 | |
| | 0.11 | | | | 10.16 | | 5.34 | | | | 36,136 | | 0.51 | (4) | | 1.08 | | | 4.37 | | | 79 | |
| | 0.05 | | | | 10.05 | | 2.96 | (3) | | | 21,348 | | 0.20 | (2)(4) | | 1.54 | (2) | | 4.90 | (2) | | 50 | (3) |
The footnote legend is at the end of the financial highlights.
See Notes to Financial Statements
111
THE PHOENIX EDGE SERIES FUND
Financial Highlights
Selected Data For a Share Outstanding Throughout Each Period
| | | | | | | | | | | | | | | | | | | | | | | | | | | |
| | | Net | | | | | Net | | | | | | Dividends | | | Distributions | | | | |
| | | Asset | | Net | | | Realized | | | Total | | | from | | | from | | | | |
| | | Value | | Investment | | | and | | | from | | | Net | | | Net | | | | |
| | | Beginning | | Income | | | Unrealized | | | Investment | | | Investment | | | Realized | | | Total | |
| | | of Period | | (Loss) | | | Gain/(Loss) | | | Operations | | | Income | | | Gains | | | Distributions | |
Strategic Allocation Series | | | | | | | | | | | | | | | | | | | | | | | | | | | |
12/31/07 | | $ | 13.30 | | $ | 0.36 | (1) | | $ | 0.43 | | | $ | 0.79 | | | $ | (0.37 | ) | | $ | (0.77 | ) | | $ | (1.14 | ) |
12/31/06 | | | 13.78 | | | 0.38 | (1) | | | 1.31 | | | | 1.69 | | | | (0.38 | ) | | | (1.79 | ) | | | (2.17 | ) |
12/31/05 | | | 14.24 | | | 0.34 | (1) | | | (0.08 | ) | | | 0.26 | | | | (0.33 | ) | | | (0.39 | ) | | | (0.72 | ) |
12/31/04 | | | 13.96 | | | 0.37 | | | | 0.65 | | | | 1.02 | | | | (0.37 | ) | | | (0.37 | ) | | | (0.74 | ) |
12/31/03(6) | | | 11.95 | | | 0.33 | | | | 2.02 | | | | 2.35 | | | | (0.34 | ) | | | — | | | | (0.34 | ) |
| | | | | | | |
Aberdeen International Series | | | | | | | | | | | | | | | | | | | | | | | | | | | |
12/31/07 | | $ | 17.80 | | $ | 0.40 | (1) | | $ | 2.25 | | | $ | 2.65 | | | $ | (0.30 | ) | | $ | (1.01 | ) | | $ | (1.31 | ) |
12/31/06 | | | 14.29 | | | 0.33 | (1) | | | 3.53 | | | | 3.86 | | | | (0.35 | ) | | | — | | | | (0.35 | ) |
12/31/05 | | | 12.54 | | | 0.46 | (1) | | | 1.86 | | | | 2.32 | | | | (0.57 | ) | | | — | | | | (0.57 | ) |
12/31/04 | | | 10.66 | | | 0.23 | | | | 1.96 | | | | 2.19 | | | | (0.31 | ) | | | — | | | | (0.31 | ) |
12/31/03 | | | 8.24 | | | 0.18 | | | | 2.41 | | | | 2.59 | | | | (0.17 | ) | | | — | | | | (0.17 | ) |
| | | | | | | |
Alger Small-Cap Growth Series | | | | | | | | | | | | | | | | | | | | | | | | | | | |
12/31/07 | | $ | 18.65 | | $ | (0.12 | )(1) | | $ | 3.07 | | | $ | 2.95 | | | $ | — | | | $ | (3.75 | ) | | $ | (3.75 | ) |
12/31/06 | | | 15.61 | | | (0.10 | )(1) | | | 3.14 | | | | 3.04 | | | | — | | | | — | | | | — | |
12/31/05 | | | 14.72 | | | (0.08 | )(1) | | | 2.38 | | | | 2.30 | | | | — | | | | (1.41 | ) | | | (1.41 | ) |
12/31/04 | | | 14.64 | | | (0.11 | )(1) | | | 0.42 | | | | 0.31 | | | | — | | | | (0.23 | ) | | | (0.23 | ) |
12/31/03 | | | 10.08 | | | (0.10 | )(1) | | | 5.49 | | | | 5.39 | | | | — | | | | (0.83 | ) | | | (0.83 | ) |
| | | | | |
Duff & Phelps Real Estate Securities Series | | | | | | | | | | | | | | | | | | | | | |
12/31/07 | | $ | 35.60 | | $ | 0.51 | (1) | | $ | (6.00 | ) | | $ | (5.49 | ) | | $ | (0.44 | ) | | $ | (2.85 | ) | | $ | (3.29 | ) |
12/31/06 | | | 28.38 | | | 0.45 | (1) | | | 9.90 | | | | 10.35 | | | | (0.44 | ) | | | (2.69 | ) | | | (3.13 | ) |
12/31/05 | | | 26.39 | | | 0.44 | (1) | | | 3.46 | | | | 3.90 | | | | (0.44 | ) | | | (1.47 | ) | | | (1.91 | ) |
12/31/04 | | | 21.85 | | | 0.56 | | | | 6.87 | | | | 7.43 | | | | (0.59 | ) | | | (2.30 | ) | | | (2.89 | ) |
12/31/03 | | | 16.85 | | | 0.64 | | | | 5.67 | | | | 6.31 | | | | (0.66 | ) | | | (0.65 | ) | | | (1.31 | ) |
| | | | |
S&P Dynamic Asset Allocation Series: Aggressive Growth | | | | | | | | | | | | | | | | | |
12/31/07 | | $ | 11.15 | | $ | 0.16 | (1) | | $ | 0.78 | | | $ | 0.94 | | | $ | (0.13 | ) | | $ | (0.10 | ) | | $ | (0.23 | ) |
From Inception 2/3/06 – 12/31/06 | | | 10.00 | | | 0.11 | | | | 1.15 | | | | 1.26 | | | | (0.11 | ) | | | — | | | | (0.11 | ) |
| | | | | |
S&P Dynamic Asset Allocation Series: Growth | | | | | | | | | | | | | | | | | | | | | |
12/31/07 | | $ | 10.87 | | $ | 0.22 | (1) | | $ | 0.69 | | | $ | 0.91 | | | $ | (0.16 | ) | | $ | (0.08 | ) | | $ | (0.24 | ) |
From Inception 2/3/06 – 12/31/06 | | | 10.00 | | | 0.13 | | | | 0.87 | | | | 1.00 | | | | (0.13 | ) | | | — | | | | (0.13 | ) |
| | | | | |
S&P Dynamic Asset Allocation Series: Moderate | | | | | | | | | | | | | | | | | | | | | |
12/31/07 | | $ | 10.41 | | $ | 0.30 | (1) | | $ | 0.54 | | | $ | 0.84 | | | $ | (0.24 | ) | | $ | (0.15 | ) | | $ | (0.39 | ) |
From Inception 2/3/06 – 12/31/06 | | | 10.00 | | | 0.15 | | | | 0.42 | | | | 0.57 | | | | (0.16 | ) | | | — | | | | (0.16 | ) |
| | | | | |
S&P Dynamic Asset Allocation Series: Moderate Growth | | | | | | | | | | | | | | | | | | | | | |
12/31/07 | | $ | 10.72 | | $ | 0.24 | (1) | | $ | 0.67 | | | $ | 0.91 | | | $ | (0.20 | ) | | $ | (0.13 | ) | | $ | (0.33 | ) |
From Inception 2/3/06 – 12/31/06 | | | 10.00 | | | 0.14 | | | | 0.74 | | | | 0.88 | | | | (0.14 | ) | | | (0.02 | ) | | | (0.16 | ) |
See Notes to Financial Statements
112
| | | | | | | | | | | | | | | | | | | | | | | |
Change
in
Net Asset
Value | | | Net
Asset
Value
End of
Period | | Total
Return | | | Net
Assets
End of
Period
(000) | | Net
Operating
Expenses | | | Gross
Operating
Expenses | | | Net
Investment
Income
(Loss) | | | Portfolio
Turnover | |
| $ | (0.35 | ) | | $ | 12.95 | | 5.98 | % | | $ | 270,653 | | 0.84 | % | | 0.84 | % | | 2.62 | % | | 52 | % |
| | (0.48 | ) | | | 13.30 | | 12.69 | | | | 316,145 | | 0.83 | | | 0.84 | | | 2.66 | | | 86 | |
| | (0.46 | ) | | | 13.78 | | 1.79 | | | | 352,742 | | 0.79 | | | 0.79 | | | 2.39 | | | 62 | |
| | 0.28 | | | | 14.24 | | 7.46 | | | | 427,843 | | 0.78 | | | 0.78 | | | 2.44 | | | 65 | |
| | 2.01 | | | | 13.96 | | 19.87 | | | | 468,630 | | 0.77 | | | 0.77 | | | 2.54 | | | 87 | |
| | | | | | | |
| $ | 1.34 | | | $ | 19.14 | | 14.94 | % | | $ | 501,913 | | 0.98 | % | | 0.98 | % | | 2.10 | % | | 34 | % |
| | 3.51 | | | | 17.80 | | 27.37 | | | | 421,281 | | 1.01 | | | 1.01 | | | 2.06 | | | 56 | |
| | 1.75 | | | | 14.29 | | 18.57 | | | | 190,634 | | 1.06 | | | 1.06 | | | 3.56 | | | 44 | |
| | 1.88 | | | | 12.54 | | 20.78 | | | | 180,668 | | 1.05 | | | 1.05 | | | 2.12 | | | 48 | |
| | 2.42 | | | | 10.66 | | 31.86 | | | | 145,580 | | 1.07 | | | 1.07 | | | 1.99 | | | 39 | |
| | | | | | | |
| $ | (0.80 | ) | | $ | 17.85 | | 16.10 | % | | $ | 55,768 | | 1.00 | % | | 1.12 | % | | (0.62 | )% | | 59 | % |
| | 3.04 | | | | 18.65 | | 19.45 | | | | 57,653 | | 1.00 | | | 1.27 | | | (0.59 | ) | | 147 | |
| | 0.89 | | | | 15.61 | | 15.64 | | | | 23,178 | | 1.00 | | | 1.65 | | | (0.54 | ) | | 182 | |
| | 0.08 | | | | 14.72 | | 2.12 | | | | 19,561 | | 1.00 | | | 1.74 | | | (0.75 | ) | | 200 | |
| | 4.56 | | | | 14.64 | | 53.38 | | | | 13,026 | | 1.00 | | | 3.49 | | | (0.75 | ) | | 180 | |
| | | | | | | |
| $ | (8.78 | ) | | $ | 26.82 | | (15.71 | )% | | $ | 135,140 | | 0.98 | % | | 0.98 | % | | 1.50 | % | | 23 | % |
| | 7.22 | | | | 35.60 | | 37.07 | | | | 187,922 | | 1.02 | | | 1.02 | | | 1.37 | | | 28 | |
| | 1.99 | | | | 28.38 | | 15.10 | | | | 137,281 | | 1.03 | | | 1.03 | | | 1.62 | | | 26 | |
| | 4.54 | | | | 26.39 | | 34.69 | | | | 121,985 | | 1.04 | | | 1.04 | | | 2.39 | | | 27 | |
| | 5.00 | | | | 21.85 | | 38.27 | | | | 87,376 | | 1.07 | | | 1.12 | | | 4.72 | | | 27 | |
| | | | | | | |
| $ | 0.71 | | | $ | 11.86 | | 8.45 | % | | $ | 23,426 | | 0.70 | % | | 1.04 | % | | 1.37 | % | | 105 | % |
| | 1.15 | | | | 11.15 | | 12.61 | (3) | | | 11,297 | | 0.70 | (2) | | 1.67 | (2) | | 2.26 | (2) | | 110 | (3) |
| | | | | | | |
| $ | 0.67 | | | $ | 11.54 | | 8.33 | % | | $ | 36,189 | | 0.70 | % | | 1.03 | % | | 1.88 | % | | 127 | % |
| | 0.87 | | | | 10.87 | | 9.98 | (3) | | | 13,063 | | 0.70 | (2) | | 1.58 | (2) | | 2.61 | (2) | | 125 | (3) |
| | | | | | | |
| $ | 0.45 | | | $ | 10.86 | | 7.98 | % | | $ | 7,337 | | 0.70 | % | | 1.49 | % | | 2.80 | % | | 140 | % |
| | 0.41 | | | | 10.41 | | 5.69 | (3) | | | 3,861 | | 0.70 | (2) | | 3.10 | (2) | | 3.58 | (2) | | 81 | (3) |
| | | | | | | |
| $ | 0.58 | | | $ | 11.30 | | 8.50 | % | | $ | 19,685 | | 0.70 | % | | 1.11 | % | | 2.14 | % | | 146 | % |
| | 0.72 | | | | 10.72 | | 8.78 | (3) | | | 9,364 | | 0.70 | (2) | | 1.99 | (2) | | 3.20 | (2) | | 106 | (3) |
The footnote legend is at the end of the financial highlights.
See Notes to Financial Statements
113
THE PHOENIX EDGE SERIES FUND
Financial Highlights
Selected Data For a Share Outstanding Throughout Each Period
| | | | | | | | | | | | | | | | | | | | | | | | | | | |
| | | Net | | | | | Net | | | | | | Dividends | | | Distributions | | | | |
| | | Asset | | Net | | | Realized | | | Total | | | from | | | from | | | | |
| | | Value | | Investment | | | and | | | from | | | Net | | | Net | | | | |
| | | Beginning | | Income | | | Unrealized | | | Investment | | | Investment | | | Realized | | | Total | |
| | | of Period | | (Loss) | | | Gain/(Loss) | | | Operations | | | Income | | | Gains | | | Distributions | |
Sanford Bernstein Mid-Cap Value Series | | | | | | | | | | | | | | | | | | | | | | | | | | | |
12/31/07 | | $ | 14.12 | | $ | 0.02 | (1) | | $ | 0.31 | | | $ | 0.33 | | | $ | (0.02 | ) | | $ | (1.75 | ) | | $ | (1.77 | ) |
12/31/06 | | | 14.01 | | | 0.07 | (1) | | | 1.98 | | | | 2.05 | | | | (0.06 | ) | | | (1.88 | ) | | | (1.94 | ) |
12/31/05 | | | 14.02 | | | 0.01 | (1) | | | 1.08 | | | | 1.09 | | | | (0.02 | ) | | | (1.08 | ) | | | (1.10 | ) |
12/31/04 | | | 12.54 | | | 0.02 | | | | 2.51 | | | | 2.53 | | | | (0.02 | ) | | | (1.03 | ) | | | (1.05 | ) |
12/31/03 | | | 9.20 | | | 0.03 | | | | 3.72 | | | | 3.75 | | | | (0.02 | ) | | | (0.39 | ) | | | (0.41 | ) |
| | | | | | | |
Sanford Bernstein Small-Cap Value Series | | | | | | | | | | | | | | | | | | | | | | | | | | | |
12/31/07 | | $ | 17.03 | | $ | — | (7) | | $ | (0.30 | ) | | $ | (0.30 | ) | | $ | — | | | $ | (2.27 | ) | | $ | (2.27 | ) |
12/31/06 | | | 17.02 | | | 0.04 | (1) | | | 2.77 | | | | 2.81 | | | | (0.04 | ) | | | (2.76 | ) | | | (2.80 | ) |
12/31/05 | | | 16.74 | | | (0.03 | )(1) | | | 1.28 | | | | 1.25 | | | | — | | | | (0.97 | ) | | | (0.97 | ) |
12/31/04 | | | 14.84 | | | (0.03 | )(1) | | | 3.39 | | | | 3.36 | | | | — | | | | (1.46 | ) | | | (1.46 | ) |
12/31/03 | | | 10.50 | | | 0.02 | (1) | | | 4.57 | | | | 4.59 | | | | — | | | | (0.25 | ) | | | (0.25 | ) |
| | | | | | | |
Van Kampen Comstock Series | | | | | | | | | | | | | | | | | | | | | | | | | | | |
12/31/07 | | $ | 13.71 | | $ | 0.23 | (1) | | $ | (0.51 | ) | | $ | (0.28 | ) | | $ | (0.23 | ) | | $ | (0.71 | ) | | $ | (0.94 | ) |
12/31/06 | | | 13.73 | | | 0.22 | (1) | | | 2.65 | | | | 2.87 | | | | (0.26 | ) | | | (2.63 | ) | | | (2.89 | ) |
12/31/05 | | | 13.18 | | | 0.16 | (1) | | | 0.55 | | | | 0.71 | | | | (0.16 | ) | | | — | | | | (0.16 | ) |
12/31/04 | | | 11.77 | | | 0.11 | (1) | | | 1.41 | | | | 1.52 | | | | (0.11 | ) | | | — | | | | (0.11 | ) |
12/31/03 | | | 9.59 | | | 0.09 | | | | 2.19 | | | | 2.28 | | | | (0.10 | ) | | | — | | | | (0.10 | ) |
| | | | | | | |
Van Kampen Equity 500 Index Series | | | | | | | | | | | | | | | | | | | | | | | | | | | |
12/31/07 | | $ | 12.77 | | $ | 0.18 | (1) | | $ | 0.44 | | | $ | 0.62 | | | $ | (0.18 | ) | | $ | — | | | $ | (0.18 | ) |
12/31/06 | | | 11.32 | | | 0.16 | | | | 1.44 | | | | 1.60 | | | | (0.15 | ) | | | — | | | | (0.15 | ) |
12/31/05 | | | 11.05 | | | 0.13 | | | | 0.28 | | | | 0.41 | | | | (0.14 | ) | | | — | | | | (0.14 | ) |
12/31/04 | | | 10.21 | | | 0.15 | | | | 0.84 | | | | 0.99 | | | | (0.15 | ) | | | — | | | | (0.15 | ) |
12/31/03 | | | 8.17 | | | 0.10 | | | | 2.04 | | | | 2.14 | | | | (0.10 | ) | | | — | | | | (0.10 | ) |
(1) | Computed using average shares outstanding. |
(4) | Represents a blended net operating expense ratio. |
(5) | As a result of changes in generally accepted accounting principles, the Multi-Sector Fixed Income Series reclassified periodic payments made under interest rate swap agreements, previously included within interest income, as a component of realized gain (loss) in the statement of operations. The effect of this reclassification was a decrease of $0.01 to net investment income per share and an increase to net realized and unrealized gain (loss) by $0.01 per share for the period ended December 31, 2003. The net investment ratio for the period ended December 31, 2003, changed by 0.06%. |
(6) | As a result of changes in generally accepted accounting principles, the Strategic Allocation Series reclassified periodic payments made under interest rate swap agreements, previously included within interest income, as a component of realized gain (loss) in the statement of operations. There was no change to net investment income per share, net realized and unrealized gain (loss) per share and the net investment income ratio for the period ended December 31, 2003. |
(7) | Amount is less than $0.01. |
See Notes to Financial Statements
114
| | | | | | | | | | | | | | | | | | | | | | | |
Change
in
Net Asset
Value | | | Net
Asset
Value
End of
Period | | Total
Return | | | Net
Assets
End of
Period
(000) | | Net
Operating
Expenses | | | Gross
Operating
Expenses | | | Net
Investment
Income
(Loss) | | | Portfolio
Turnover | |
| $ | (1.44 | ) | | $ | 12.68 | | 2.00 | % | | $ | 138,254 | | 1.29 | % | | 1.29 | % | | 0.11 | % | | 33 | % |
| | 0.11 | | | | 14.12 | | 14.91 | | | | 131,717 | | 1.30 | | | 1.32 | | | 0.46 | | | 52 | |
| | (0.01 | ) | | | 14.01 | | 7.73 | | | | 121,855 | | 1.30 | | | 1.33 | | | 0.07 | | | 37 | |
| | 1.48 | | | | 14.02 | | 20.41 | | | | 116,014 | | 1.30 | | | 1.34 | | | 0.25 | | | 36 | |
| | 3.34 | | | | 12.54 | | 40.97 | | | | 85,868 | | 1.30 | | | 1.37 | | | 0.46 | | | 29 | |
| | | | | | | |
| $ | (2.57 | ) | | $ | 14.46 | | (2.10 | )% | | $ | 73,242 | | 1.30 | % | | 1.31 | % | | (0.03 | )% | | 32 | % |
| | 0.01 | | | | 17.03 | | 16.75 | | | | 82,771 | | 1.30 | | | 1.35 | | | 0.21 | | | 55 | |
| | 0.28 | | | | 17.02 | | 7.46 | | | | 72,422 | | 1.30 | | | 1.40 | | | (0.19 | ) | | 32 | |
| | 1.90 | | | | 16.74 | | 22.67 | | | | 67,785 | | 1.30 | | | 1.43 | | | (0.22 | ) | | 44 | |
| | 4.34 | | | | 14.84 | | 43.86 | | | | 48,756 | | 1.30 | | | 1.52 | | | 0.14 | | | 36 | |
| | | | | | | |
| $ | (1.22 | ) | | $ | 12.49 | | (2.22 | )% | | $ | 87,372 | | 0.95 | % | | 0.96 | % | | 1.61 | % | | 15 | % |
| | (0.02 | ) | | | 13.71 | | 20.90 | | | | 108,209 | | 0.95 | | | 1.00 | | | 1.50 | | | 105 | |
| | 0.55 | | | | 13.73 | | 5.43 | | | | 106,716 | | 0.95 | | | 0.99 | | | 1.25 | | | 58 | |
| | 1.41 | | | | 13.18 | | 12.91 | | | | 134,224 | | 0.95 | | | 0.98 | | | 0.92 | | | 91 | |
| | 2.18 | | | | 11.77 | | 23.87 | | | | 92,805 | | 0.95 | | | 1.02 | | | 0.88 | | | 393 | |
| | | | | | | |
| $ | 0.44 | | | $ | 13.21 | | 4.87 | % | | $ | 123,644 | | 0.58 | % | | 0.73 | % | | 1.34 | % | | 3 | % |
| | 1.45 | | | | 12.77 | | 14.21 | | | | 142,346 | | 0.63 | (4) | | 0.77 | | | 1.36 | | | 74 | |
| | 0.27 | | | | 11.32 | | 3.69 | | | | 105,058 | | 0.65 | | | 0.72 | | | 1.22 | | | 14 | |
| | 0.84 | | | | 11.05 | | 9.84 | | | | 119,629 | | 0.65 | | | 0.72 | | | 1.44 | | | 22 | |
| | 2.04 | | | | 10.21 | | 26.23 | | | | 110,334 | | 0.65 | | | 0.72 | | | 1.18 | | | 52 | |
See Notes to Financial Statements
115
THE PHOENIX EDGE SERIES FUND
NOTES TO FINANCIAL STATEMENTS
December 31, 2007
Note 1—Organization
The Phoenix Edge Series Fund (the “Fund”) is organized as a Massachusetts business trust and is registered under the Investment Company Act of 1940, as amended (“1940 Act”), as an open-end management investment company. The Fund is organized with series, which are available only to the following separate accounts: Phoenix Life Variable Accumulation Account, Phoenix Life Variable Universal Life Account, PHL Variable Accumulation Account, PHLVIC Variable Universal Life Account, Phoenix Life and Annuity Variable Universal Life Account, and Phoenix Life Separate Accounts B, C, and D.
The Fund is comprised of 18 series (each a “series”).
Note 2—Significant Accounting Policies
The following is a summary of significant accounting policies consistently followed by the Fund in the preparation of its financial statements. The preparation of financial statements in conformity with accounting principles generally accepted in the United States of America requires management to make estimates and assumptions that affect the reported amounts of assets and liabilities, and disclosure of contingent assets and liabilities at the date of the financial statements and the reported amounts of increases and decreases in net assets from operations during the reporting period. Actual results could differ from those estimates.
Equity securities are valued at the official closing price (typically last sale) on the exchange on which the securities are primarily traded, or if no closing price is available, at the last bid price.
Debt securities are valued on the basis of broker quotations or valuations provided by a pricing service, which utilizes information with respect to recent sales, market transactions in comparable securities, quotations from dealers, and various relationships between securities in determining value.
As required, some securities and assets may be valued at fair value as determined in good faith by or under the direction of the Trustees.
Certain foreign common stocks may be fair valued in cases where closing prices are not readily available or are deemed not reflective of readily available market prices. For example, significant events (such as movement in the U.S. securities market, or other regional and local developments) may occur between the time that foreign markets close (where the security is principally traded) and the time that the series calculates its net asset value (generally, the close of the NYSE) that may impact the value of securities traded in these foreign markets. In these cases, information from an external vendor may be utilized to adjust closing market prices of certain foreign common stocks to reflect their fair value. Because the frequency of significant events is not predictable, fair valuation of certain foreign common stocks may occur on a frequent basis.
On December 31, 2007, The Aberdeen International utilized fair value pricing for its foreign common stocks.
Certain securities held by the Fund were valued on the basis of a price provided by a principal market maker. The prices provided by the principal market makers may differ from the value that would be realized if the securities were sold. At December 31, 2007, the total value of these securities represented the following approximate percentage of net assets:
| | | |
Series | | Percentage of
Net Assets | |
Multi-Sector Short Term Bond | | 3.65 | % |
Short-term investments having a remaining maturity of 60 days or less are valued at amortized cost, which approximates market.
Money Market uses the amortized cost method of security valuation absent extraordinary or unusual market conditions. In the opinion of the Trustees, this represents the fair value of the securities. The deviations between the net asset value per share are monitored by using available market quotations and Money Market’s net asset value per share using amortized cost. If the deviation exceeds 1/2 of 1%, the Board of Trustees will consider what action, if any, should be initiated to provide fair valuation. Using this method, the series attempts to maintain a constant net asset value of $10 per share.
In September 2006, Statement of Financial Accounting Standards No. 157, “Fair Value Measurements” (“SFAS 157”), was issued and is effective for fiscal years beginning after November 15, 2007. SFAS 157 defines fair value, establishes a framework for measuring fair value and expands disclosures about fair value measurements. Management is currently evaluating the impact the adoption of SFAS 157 will have on the Fund’s financial statement disclosures. The Fund will be adopting effective with 3/31/08 on the financial statements.
| B. | Security transactions and related income |
Security transactions are recorded on the trade date. Dividend income is recorded on the ex-dividend date, or in the case of certain foreign securities, as soon as the series is notified. Interest income is recorded on the accrual basis. Each series amortizes premiums and accretes discounts using the effective interest method. Realized gains and losses are determined on the identified cost basis.
Each series is treated as a separate taxable entity. It is the policy of each series in the Fund to comply with the requirements of the Internal Revenue Code and to distribute substantially all of its taxable income to its shareholders. Therefore, no provision for federal income taxes or excise taxes has been made.
Certain series may be subject to foreign taxes on income, gains on investments or currency repatriation, a portion of which may be recoverable. Each series will accrue such taxes and recoveries as applicable based upon current interpretations of the tax rules and regulations that exist in the markets in which they invest.
In June 2006, the Financial Accounting Standards Board (FASB) issued FASB Interpretation 48 (“FIN 48”), “Accounting for Uncertainty in Income Taxes.” This standard defines the threshold for recognizing the benefits of tax-return positions in the financial statements as “more-likely-than-not” to be sustained by the taxing authority and requires measurement of a tax position meeting the more-likely-than-not criterion, based on the largest benefit that is more than 50 percent likely to be realized. Management has analyzed the series’ tax positions taken on federal income tax returns for all open tax years (tax years ended December 31, 2004 – 2007) for purposes of implementing FIN 48, and has concluded that no provision for income tax is required in the series’ financial statements. Management is not aware of any events that are reasonably possible to occur in the next twelve months that would result in the amount of any unrecognized tax benefits significantly increasing or decreasing for any of the Series.
| D. | Distributions to shareholders |
Distributions are recorded by each series on the ex-dividend date. For Money Market, income distributions are recorded daily. Income and capital gain distributions are determined in accordance with income tax regulations which may differ from accounting principles generally
116
THE PHOENIX EDGE SERIES FUND
NOTES TO FINANCIAL STATEMENTS (Continued)
December 31, 2007
accepted in the United States of America. These differences may include the treatment of non-taxable dividends, market premium and discount, non-deductible expenses, expiring capital loss carryovers, foreign currency gain or loss, gain or loss on futures contracts, partnerships, operating losses and losses deferred due to wash sales. Permanent book and tax basis differences relating to shareholder distributions will result in reclassifications to capital paid in on shares of beneficial interest.
Expenses incurred by the Fund with respect to more than one series are allocated in proportion to the net assets of each series, except where allocation of direct expense to each series or an alternative allocation method can be more appropriately made. In addition to the net operating expenses that the Phoenix-S&P Asset Allocation series’ bear directly, the contract owners, as investors in the series, indirectly bear the series’ pro-rata expenses of the underlying funds in which each series invests.
| F. | Foreign currency translation |
Foreign securities and other assets and liabilities are valued using the foreign currency exchange rate effective at the end of the reporting period. Cost of investments is translated at the currency exchange rate effective at the trade date. The gain or loss resulting from a change in currency exchange rates between the trade and settlement date of a portfolio transaction is treated as a gain or loss on foreign currency. Likewise, the gain or loss resulting from a change in currency exchange rates between the date income is accrued and paid, is treated as a gain or loss on foreign currency. The Fund does not isolate that portion of the results of operations arising from either changes in exchange rates or in the market prices of securities.
| G. | Foreign security country determination |
A combination of the following criteria is used to assign the countries of risk listed in the schedules of investments: country of incorporation, actual building address, primary exchange on which the security is traded and country in which the greatest percentage of company revenue is generated.
| H. | Forward currency contracts |
Certain series may enter into forward currency contracts in conjunction with the planned purchase or sale of foreign denominated securities in order to hedge the U.S. dollar cost or proceeds. Forward currency contracts involve, to varying degrees, elements of market risk in excess of the amount recognized in the Statements of Assets and Liabilities. Risks arise from the possible movements in foreign exchange rates or if a counterparty does not perform under the contract.
A forward currency contract involves an obligation to purchase or sell a specific currency at a future date, which may be any number of days from the date of the contract agreed upon by the parties, at a price set at the time of the contract. These contracts are traded directly between currency traders and their customers. The contract is marked-to-market daily and the change in market value is recorded by each series as unrealized gain or loss. When the contract is closed or offset with the same counterparty, the series records a realized gain or loss equal to the change in the value of the contract when it was opened and the value at the time it was closed or offset.
A futures contract is an agreement between two parties to buy and sell a security at a set price on a future date. Certain series may enter into financial futures contracts as a hedge against anticipated changes in the market value of their portfolio securities. Upon entering into a futures contract, the series is required to pledge to the broker an amount of cash and/or securities equal to the “initial margin” requirements of the futures exchange on which the contract is traded. Pursuant to the contract, the series agrees to receive from or pay to the broker an amount of cash equal to the daily fluctuation in value of the contract. Such receipts or payments are known as variation margin and are recorded by the series as unrealized gains or losses. When the contract is closed, the series records a realized gain or loss equal to the difference between the value of the contract at the time it was opened and the value at the time it was closed. The potential risk to the series is that the change in value of the futures contract may not correspond to the change in value of the hedged instruments.
For Duff & Phelps Real Estate Securities, dividend income is recorded using management’s estimate of the income included in distributions received from the REIT investments. Distributions received in excess of this estimated amount are recorded as a reduction of the cost of investments or reclassified to capital gains. The actual amounts of income, return of capital, and capital gains are only determined by each REIT after its fiscal year-end, and may differ from the estimated amounts.
Certain series may loan securities to qualified brokers through an agreement with State Street Bank and Trust Company (the “Custodian”). Under the terms of agreement, the series is required to maintain collateral with a market value not less than 100% of the market value of loaned securities. Collateral is adjusted daily in connection with changes in the market value of securities on loan. Collateral may consist of cash, securities issued or guaranteed by the U.S. Government or its agencies, sovereign debt of foreign countries, and/or irrevocable letters of credit issued by banks. Cash collateral is invested in a short-term money market fund. Dividends earned on the collateral and premiums paid by the broker are recorded as income by the series net of fees and rebates charged by the Custodian for its services in connection with this securities lending program. Lending portfolio securities involves a risk of delay in the recovery of the loaned securities or in the foreclosure on collateral.
At December 31, 2007, the following series had securities on loan (reported in 000’s):
| | | | | | | | | |
Series | | Market
Value | | U.S.
Government
Securities
Collateral | | Cash
Collateral |
Capital Growth | | $ | 33,609 | | $ | 8,254 | | $ | 25,980 |
Multi-Sector Fixed Income | | | 31,356 | | | — | | | 33,024 |
Strategic Allocation | | | 169 | | | — | | | 174 |
Aberdeen International | | | 1,300 | | | — | | | 1,386 |
Certain series may invest in direct debt instruments, which are interests in amounts owed by a corporate, governmental, or other borrower to lenders or lending syndicates. The series’ investments in loans may be in the form of participations in loans or assignments of all or a portion of loans from third parties. A loan is often administered by a bank or other financial institution (the lender) that acts as agent for all holders. The agent administers the terms of the loan, as specified in the loan agreement. When investing in a loan participation, the series has the right to receive payments of principal, interest and any fees to which it is entitled only from the lender selling the loan agreement and only upon receipt by the lender of payments from the borrower. The series
117
THE PHOENIX EDGE SERIES FUND
NOTES TO FINANCIAL STATEMENTS (Continued)
December 31, 2007
generally has no right to enforce compliance with the terms of the loan agreement with the borrower. As a result, the series may be subject to the credit risk of both the borrower and the lender that is selling the loan agreement. When the series purchases assignments from lenders it acquires direct rights against the borrower on the loan. Direct indebtedness of emerging countries involves a risk that the government entities responsible for the repayment of the debt may be unable, or unwilling to pay the principal and interest when due. Currently, the series only hold assignment loans.
| M. | When-issued and delayed delivery transactions |
Certain series may engage in when-issued or delayed delivery transactions. Each series records when-issued and delayed delivery securities on the trade date. Each series maintains collateral for the securities purchased. Securities purchased on a when-issued or delayed delivery basis begin earning interest on the settlement date.
A repurchase agreement is a transaction where a series acquires a security for cash and obtains a simultaneous commitment from the seller to repurchase the security at an agreed upon price and date. Each series, through its custodian, takes possession of securities collateralizing the repurchase agreement. The collateral is marked-to-market daily to ensure that the market value of the underlying assets remains sufficient to protect the series in the event of default by the seller. If the seller defaults and the value of the collateral declines, or if the seller enters insolvency proceedings, realization of collateral may be delayed or limited.
Certain series may invest in credit linked notes, which are usually issued by a special purpose vehicle that is selling credit protection through a credit default swap. The performance of the notes is linked to the performance of the underlying reference obligation. The special purpose vehicle invests the proceeds from the notes to cover its contingent obligation. Credit linked notes may also have risks with default by the referenced obligation, currency and/or interest rates.
| Note | 3—Investment Advisory Fees and Related Party Transactions |
The advisor to the Fund is Phoenix Variable Advisors, Inc. (“PVA”) (the “Advisor”). PVA is a wholly-owned subsidiary of PM Holdings, Inc. PVA is an indirect, wholly-owned subsidiary of Phoenix Life Insurance Company (“PLIC”).
As compensation for their service to the Fund, the advisor is entitled to a fee based upon the following annual rates as a percentage of the average daily net assets of each separate series listed below:
| | | | | | | | | |
Series | | Rate
for first
$250
million | | | Rate
for next
$250
million | | | Rate
for over
$500
million | |
Capital Growth | | 0.70 | % | | 0.65 | % | | 0.60 | % |
Growth and Income | | 0.70 | | | 0.65 | | | 0.60 | |
Mid-Cap Growth | | 0.80 | | | 0.80 | | | 0.80 | |
Money Market | | 0.40 | | | 0.35 | | | 0.30 | |
Multi-Sector Fixed Income | | 0.50 | | | 0.45 | | | 0.40 | |
Multi-Sector Short Term Bond | | 0.50 | | | 0.45 | | | 0.40 | |
Strategic Allocation | | 0.60 | | | 0.55 | | | 0.50 | |
Aberdeen International | | 0.75 | | | 0.70 | | | 0.65 | |
Alger Small-Cap Growth | | 0.85 | | | 0.85 | | | 0.85 | |
S&P Aggressive Growth | | 0.40 | | | 0.40 | | | 0.40 | |
S&P Growth | | 0.40 | | | 0.40 | | | 0.40 | |
S&P Moderate | | 0.40 | | | 0.40 | | | 0.40 | |
S&P Moderate Growth | | 0.40 | | | 0.40 | | | 0.40 | |
Sanford Bernstein Mid-Cap Value | | 1.05 | | | 1.05 | | | 1.05 | |
Sanford Bernstein Small-Cap Value | | 1.05 | | | 1.05 | | | 1.05 | |
Van Kampen Comstock | | 0.70 | | | 0.65 | | | 0.60 | |
Van Kampen Equity 500 Index* | | 0.35 | | | 0.35 | | | 0.35 | |
| | | | | | | | | | | |
| | | Advisor | | Rate
for first
$1 Billion | | | Rate
for next
$1 Billion | | | Rate
for over
$2 Billion | |
Duff & Phelps Real Estate Securities | | PVA | | 0.75 | % | | 0.70 | % | | 0.65 | % |
| * | Prior to October 1, 2007, the rate was 0.45%. |
Pursuant to subadvisory agreements, PVA delegates, certain investment decisions and/or research functions with respect to the following series to the subadvisor indicated, for which each is paid a fee by the advisor.
| | |
Series | | Subadvisor |
Capital Growth | | Harris Investment Management, Inc. |
Growth and Income | | PIC(2)* |
Mid-Cap Growth | | Neuberger Berman Management, Inc. |
Money Market | | Goodwin(5)* |
Multi-Sector Fixed Income | | Goodwin(5)* |
Multi-Sector Short Term Bond | | Goodwin(5)* |
Strategic Allocation (equity portion) | | PIC(2)* |
Strategic Allocation (fixed income portion) | | Goodwin(5)* |
Aberdeen International | | Aberdeen(1) |
Alger Small-Cap Growth | | Fred Alger Management, Inc. |
Duff & Phelps Real Estate Securities | | DPIM(6)* |
S&P Aggressive Growth | | SPIAS(3) |
S&P Growth | | SPIAS(3) |
S&P Moderate | | SPIAS(3) |
S&P Moderate Growth | | SPIAS(3) |
Sanford Bernstein Mid-Cap Value | | AllianceBernstein, L.P. |
Sanford Bernstein Small-Cap Value | | AllianceBernstein, L.P. |
Van Kampen Comstock | | Van Kampen(4) |
Van Kampen Equity 500 Index | | Van Kampen(4) |
(1) | Aberdeen Asset Management Inc. |
(2) | Phoenix Investment Counsel, Inc. |
(3) | Standard & Poor’s Investment Advisory Services LLC |
(4) | Morgan Stanley Investment Management Inc. dba Van Kampen |
(5) | Goodwin Capital Advisers, Inc. |
(6) | Duff & Phelps Investment Management Co. |
118
THE PHOENIX EDGE SERIES FUND
NOTES TO FINANCIAL STATEMENTS (Continued)
December 31, 2007
The advisor has contractually agreed to reimburse expenses of the Fund (excluding management and distribution fees, interest, taxes, brokerage fees and commissions), to the extent that such expenses exceed the operating expenses of the series’ average net assets (the “expense caps”) until April 30, 2008 as listed in the chart below.
| | | |
| | | Maximum
Operating
Expense | |
Capital Growth | | 0.25 | % |
Growth and Income | | 0.15 | |
Mid-Cap Growth | | 0.30 | |
Money Market | | 0.25 | |
Multi-Sector Fixed Income | | 0.25 | |
Multi-Sector Short Term Bond | | 0.20 | |
Strategic Allocation | | 0.25 | |
Aberdeen International | | 0.30 | |
Alger Small-Cap Growth | | 0.15 | |
Duff & Phelps Real Estate Securities | | 0.35 | |
S&P Aggressive Growth | | 0.05 | |
S&P Growth | | 0.05 | |
S&P Moderate | | 0.05 | |
S&P Moderate Growth | | 0.05 | |
Sanford Bernstein Mid-Cap Value | | 0.25 | |
Sanford Bernstein Small-Cap Value | | 0.25 | |
Van Kampen Comstock | | 0.25 | |
Van Kampen Equity 500 Index | | 0.15 | |
Phoenix Equity Planning Corporation (“PEPCO”), is an indirect wholly-owned subsidiary of Phoenix Investment Partners, Ltd. (“PXP”) and serves as the Administrator to the Fund. PEPCO receives an administration fee at an annual rate of 0.09% of the first $5 billion, 0.08% on the next $10 billion, and 0.07% over $15 billion of the average net assets across all non-money market funds in the Phoenix Funds and The Phoenix Edge Series Fund. For the money market funds, the fee is 0.035% of the average net assets across all Phoenix money market funds within the Phoenix Funds Family.
For the fiscal year (the “period”) ended December 31, 2007, the Fund incurred administration fees totaling $2,142 (reported in 000’s).
Pursuant to a Service Agreement, PLIC a wholly-owned subsidiary of The Phoenix Companies (“PNX”), receives a service fee at the annual rate of 0.066% of the average daily net assets of each series for providing certain stock transfer and accounting services for each series. For the period ended December 31, 2007, the Fund paid PLIC $1,743 (reported in 000’s).
PEPCO serves as the distributor to the Phoenix-S&P Series’ shares. For its services each Phoenix-S&P Series pays PEPCO distribution and/or service fees at an annual rate not to exceed 0.25% of the average daily net assets of each respective Phoenix-S&P Dynamic Asset Allocation Series.
At December 31, 2007, PLIC and its affiliates held shares in the Fund which aggregate the following:
| | | | | |
| | | Shares | | Aggregate
Net Asset
Value
(reported
in 000’s) |
S&P Aggressive Growth | | 20,000 | | $ | 244 |
S&P Growth | | 21,000 | | | 238 |
S&P Moderate | | 21,000 | | | 236 |
S&P Moderate Growth | | 21,000 | | | 228 |
The Fund provides a deferred compensation plan for its disinterested trustees. Under the deferred compensation plan, disinterested trustees may elect to defer all or a portion of their compensation. Amounts deferred are retained by the Fund, and to the extent permitted by the 1940 Act, and then, in turn, may be invested in the shares of unaffiliated mutual funds selected by the disinterested trustees. Investments in such unaffiliated mutual funds are included in “Other Assets” on the Statement of Assets and Liabilities at December 31, 2007. As of December 31, 2007, the aggregate value of such investments is $197 (reported in 000’s).
Note 4—Purchases and Sales of Securities
Purchases and sales of securities (excluding U.S. Government and agency securities, short-term securities, futures contracts, and forward currency contracts) during the period ended December 31, 2007, were as follows:
| | | | | | |
| | | Purchases
(reported
in 000’s) | | Sales
(reported
in 000’s) |
Capital Growth | | $ | 365,426 | | $ | 438,252 |
Growth and Income | | | 73,484 | | | 90,383 |
Mid-Cap Growth | | | 126,818 | | | 145,411 |
Multi-Sector Fixed Income | | | 168,771 | | | 152,471 |
Multi-Sector Short Term Bond | | | 19,081 | | | 21,072 |
Strategic Allocation | | | 115,624 | | | 161,207 |
Aberdeen International | | | 174,226 | | | 155,801 |
Alger Small-Cap Growth | | | 34,031 | | | 44,038 |
Duff & Phelps Real Estate Securities | | | 37,348 | | | 52,585 |
S&P Dynamic Asset Allocation-Aggressive Growth | | | 29,397 | | | 18,552 |
S&P Dynamic Asset Allocation-Growth | | | 53,154 | | | 31,222 |
S&P Dynamic Asset Allocation-Moderate | | | 10,602 | | | 7,397 |
S&P Dynamic Asset Allocation-Moderate Growth | | | 31,600 | | | 22,159 |
Sanford Bernstein Mid-Cap Value | | | 50,546 | | | 46,407 |
Sanford Bernstein Small-Cap Value | | | 26,737 | | | 31,085 |
Van Kampen Comstock | | | 14,840 | | | 29,313 |
Van Kampen Equity 500 Index | | | 4,308 | | | 23,982 |
Purchases and sales of long-term U.S. Government and agency securities during the period ended December 31, 2007, were as follows:
| | | | | | |
| | | Purchases
(reported
in 000’s) | | Sales
(reported
in 000’s) |
Multi-Sector Fixed Income | | $ | 71,912 | | $ | 73,660 |
Multi-Sector Short Term Bond | | | 13,329 | | | 12,898 |
Strategic Allocation | | | 33,346 | | | 40,161 |
Note 5—Credit Risk and Asset Concentrations
In countries with limited or developing markets, investments may present greater risks than in more developed markets and the prices of such investments may be volatile. The consequences of political, social or economic changes in these markets may have disruptive
119
THE PHOENIX EDGE SERIES FUND
NOTES TO FINANCIAL STATEMENTS (Continued)
December 31, 2007
effects on the market prices of these investments and the income they generate, as well as a series’ ability to repatriate such amounts.
High yield/high risk securities typically entail greater price volatility and/or principal and interest rate risk. There is a greater chance that an issuer will not be able to make principal and interest payments on time. Analysis of the creditworthiness of issuers of high yield securities may be complex, and as a result, it may be more difficult for the advisors and/or subadvisors to accurately predict risk.
Certain series may invest a high percentage of their assets in specific sectors of the market in their pursuit of a greater investment return. Fluctuations in these sectors of concentration may have a greater impact on a series, positive or negative, than if a series did not concentrate its investments in such sectors.
At December 31, 2007, the series held securities in specific sectors as detailed below:
| | | | | |
Series | | Sector | | Percentage
of Total
Net Assets | |
Capital Growth | | Information Technology | | 31 | % |
Alger Small-Cap Growth | | Information Technology | | 26 | % |
Sanford Bernstein Small-Cap Value | | Industrials | | 25 | % |
Van Kampen Comstock | | Financials | | 26 | % |
Note 6—Illiquid and Restricted Securities
Investments shall be considered illiquid if they cannot be disposed of in seven days in the ordinary course of business at the approximate amount at which such securities have been valued by the series. Additionally, the following information is also considered in determining illiquidity: the frequency of trades and quotes for the investment, whether the investment is listed for trading on a recognized domestic exchange and/or whether two or more brokers are willing to purchase or sell the security at a comparable price, the extent of market making activity in the investment and the nature of the market for investment. Illiquid securities are noted as such at the end of each series’ Schedule of Investments where applicable.
Restricted securities are illiquid securities, as defined above, not registered under the Securities Act of 1933. Generally, 144A securities are excluded from this category, except where defined as illiquid.
At December 31, 2007, the Fund held the following restricted securities:
| | | | | | | |
| | | Acquisition
Date and
Cost
(reported
in 000’s) | | Market
Value and
% of
Net Assets
(reported
in 000’s) | |
Multi-Sector Fixed Income | | | | | | | |
MASTR Alternative Net Interest Margin 06-6, N1 144A 6.129% due 9/26/46 | | | 8/3/06 | | $ | 11 | |
| | $ | 493 | | | 0.0 | % |
Multi-Sector Short Term Bond | | | | | | | |
MASTR Alternative Net Interest Margin Trust 05-CW1A, N1 144A 6.750% due 12/26/35 | | | 11/18/08 | | $ | 19 | |
| | $ | 129 | | | 0.04 | % |
MASTR Resecuritization Trust 05-4CI, N2 144A 7.865% due 4/26/45 | | | 1/12/06 | | $ | 59 | |
| | $ | 120 | | | 0.1 | % |
MASTR Alternative Net Interest Margin 06-6, N1 144A 6.129% due 9/26/46 | | | 8/3/06 | | $ | 2 | |
| | $ | 89 | | | 0.2 | % |
| | |
Alger Small-Cap Growth Autobytel, Inc. | | | 6/20/03 | | $ | 10 | |
| | $ | 20 | | | 0.02 | % |
| | |
Van Kampen Equity 500 Index Seagate Technology Tax Refund Rights | | | 11/22/00 | | $ | 0 | |
| | $ | 0 | | | 0 | % |
Each series will bear any costs, including those involved in registration under the Securities Act of 1933, in connection with the disposition of such securities.
Note 7—Indemnifications
Under the series’ organizational documents, its trustees and officers are indemnified against certain liabilities arising out of the performance of their duties to the series. In addition, the series enter into contracts that contain a variety of indemnifications. The series’ maximum exposure under these arrangements is unknown. However, the Fund has not had prior claims or losses pursuant to these arrangements.
Note 8—Regulatory Exams
Federal and state regulatory authorities from time to time make inquiries and conduct examinations regarding compliance by The Phoenix Companies, Inc. and its subsidiaries (collectively “the Company”) with securities and other laws and regulations affecting their registered products.
In February 2005, the NASD notified PNX that it was asserting violations of trade reporting rules by a subsidiary. PNX responded to the NASD allegations in May 2005. Thereafter, in January 2007, the NASD notified PNX that the matter is being referred for potential violations and possible action. On May 3, 2007, the NASD accepted a letter of acceptance, waiver and consent submitted by the PXP subsidiary to resolve this matter. Without admitting or denying the NASD’s findings, in accordance with the terms of the letter, the PXP subsidiary agreed to a censure, to pay a fine of $8,000 and to revise its supervisory procedures.
The Company does not believe that the outcome of these matters will be material to these financial statements.
120
THE PHOENIX EDGE SERIES FUND
NOTES TO FINANCIAL STATEMENTS (Continued)
December 31, 2007
Note 9—Manager of Managers
The Fund and PVA have received an exemptive order from the Securities and Exchange Commission (“SEC”) granting exemptions from certain provisions of the Investment Company Act of 1940, as amended, pursuant to which PVA will, subject to review and approval of the Fund’s Board of Trustees, be permitted to enter into and materially amend subadvisory agreements without such agreements being approved by the shareholders of the applicable series of the Fund. PVA will continue to have the ultimate responsibility to oversee the subadvisors and recommend their hiring, termination and replacement.
Note 10—Mixed and Shared Funding
Shares of the Fund are not directly offered to the public. Shares of the Fund are currently offered through separate accounts to fund variable accumulation annuity contracts and variable universal life insurance policies issued by Phoenix Life Insurance Company, PHL Variable Insurance Company, and Phoenix Life and Annuity Company and could be offered to separate accounts of other insurance companies in the future.
The interests of variable annuity contract owners and variable life policy owners could diverge based on differences in federal and state regulatory requirements, tax laws, investment management or other unanticipated developments. The Fund’s Trustees do not foresee any such differences or disadvantages at this time. However, the Fund’s Trustees intend to monitor for any material conflicts and will determine what action, if any, should be taken in response to such conflicts. If such a conflict should occur, one or more separate accounts may be required to withdraw its investment in the Fund or shares of another fund may be substituted.
Note 11—Mergers (reported in 000’s)
On October 27, 2006, the Capital Growth Series acquired all of the net assets of the Phoenix-AIM Growth Series (“AIM Growth”) pursuant to an Agreement and Plan of Reorganization approved by the AIM Growth shareholders on October 5, 2006. The acquisition was accomplished by a tax-free exchange of 3,996,273 shares of Capital Growth outstanding on October 27, 2006 and valued at $61,017 for 8,399,603 shares of AIM Growth outstanding on October 27, 2006. AIM Growth’s net assets of $61,017, including $8,256 of net unrealized appreciation were combined with those of Capital Growth. The aggregate net assets of Capital Growth immediately after the merger were $452,686. The shareholders of AIM Growth received for each share owned approximately 0.48 share of Capital Growth.
On October 27, 2006, the Mid-Cap Growth Series acquired all of the net assets of the Phoenix Strategic Theme Series (“Strategic Theme”) pursuant to an Agreement and Plan of Reorganization approved by the Strategic Theme shareholders on October 5, 2006. The acquisition was accomplished by a tax-free exchange of 3,950,319 shares of Mid-Cap Growth outstanding on October 27, 2006 and valued at $53,114 for 4,883,118 shares of Strategic Theme outstanding on October 27, 2006. Strategic Theme’s net assets of $53,114, including $7,455 of net unrealized appreciation were combined with those of Mid-Cap Growth. The aggregate net assets of Mid-Cap Growth immediately after the merger were $98,522. The shareholders of Strategic Theme received for each share owned approximately 0.81 share of Mid-Cap Growth.
On October 27, 2006, the Alger Small-Cap Growth Series acquired all of the net assets of the Phoenix-Engemann Small-Cap Growth Series (“Engemann Small-Cap Growth”) and the Phoenix-Kayne Small-Cap Quality Value Series (“Kayne Small-Cap Quality Value”) pursuant to Agreements and Plans of Reorganization approved by the Engemann Small-Cap Growth and Kayne Small-Cap Quality Value shareholders on October 26, 2006. The acquisition was accomplished by a tax-free exchange of 1,912,431 shares of Alger Small-Cap Growth outstanding on October 27, 2006 and valued at $34,547 for 2,108,424 shares of Engemann Small-Cap Growth valued at $16,831 and 1,054,130 shares of Kayne Small-Cap Quality Value valued at $17,716. Engemann Small-Cap Growth’s net assets of $16,831, including $4,239 of net unrealized appreciation and Kayne Small-Cap Quality Value’s net assets of $17,716, including $4,213 of net unrealized appreciation were combined with those of Alger Small-Cap Growth. The aggregate net assets of Alger Small-Cap Growth immediately after the merger were $59,092. The shareholders of Engemann Small-Cap Growth received for each share owned approximately 0.44 share of Alger Small-Cap Growth. The shareholders of Kayne Small-Cap Quality Value received for each share owned approximately 0.93 share of Alger Small-Cap Growth.
On October 27, 2006, the Van Kampen Equity 500 Index Series acquired all of the net assets of the Phoenix-Northern Dow 30 Series (“Northern Dow 30”) and the Phoenix-Northern Nasdaq-100 Index® Series (“Northern Nasdaq-100 Index®”) pursuant to Agreements and Plans of Reorganization approved by the Northern Dow 30 and Northern Nasdaq-100 Index® shareholders on October 26, 2006. The acquisition was accomplished by a tax-free exchange of 3,550,335 shares of Van Kampen Equity 500 Index outstanding on October 27, 2006 and valued at $44,067 for 2,100,979 shares of Northern Dow 30 valued at $21,818 and 4,901,410 shares of Northern Nasdaq-100 Index® valued at $22,249. Northern Dow 30’s net assets of $21,818, including $4,937 of net unrealized appreciation and Northern Nasdaq-100 Index®’s net assets of $22,249, including $5,784 of net unrealized appreciation were combined with those of Van Kampen Equity 500 Index. The aggregate net assets of Van Kampen Equity 500 Index immediately after the merger were $145,083. The shareholders of Northern Dow 30 received for each share owned approximately 0.84 share of Van Kampen Equity 500 Index. The shareholders of Northern Nasdaq-100 Index® received for each share owned approximately 0.37 share of Van Kampen Equity 500 Index.
On October 20, 2006, the Growth and Income Series acquired all of the net assets of the Phoenix-Kayne Rising Dividends Series (“Kayne Rising Dividends”) pursuant to an Agreement and Plan of Reorganization approved by the Kayne Rising Dividends shareholders on October 5, 2006. The acquisition was accomplished by a tax-free exchange of 835,783 shares of Growth and Income outstanding on October 20, 2006 and valued at $11,722 for 1,002,388 shares of Kayne Rising Dividends outstanding on October 20, 2006. Kayne Rising Dividend’s net assets of $11,722, including $1,655 of net unrealized appreciation were combined with those of Growth and Income. The aggregate net assets of Growth and Income immediately after the merger were $163,685. The shareholders of Kayne Rising Dividends received for each share owned approximately 0.83 share of Growth and Income.
On October 20, 2006, the Aberdeen International Series acquired all of the net assets of the Phoenix-Lazard International Equity Select Series (“Lazard International Equity Select”) pursuant to an Agreement and Plan of Reorganization approved by the Lazard International Equity Select shareholders on October 5, 2006. The acquisition was accomplished by a tax-free exchange of 10,426,631 shares of Aberdeen International outstanding on October 20, 2006 and valued at $175,010 for 10,514,476 shares of Lazard International Equity Select outstanding on October 20, 2006. Lazard International Equity Select’s net assets of $175,010, including $33,022 of net unrealized appreciation were combined with those of Aberdeen International. The aggregate net assets of Aberdeen International
121
THE PHOENIX EDGE SERIES FUND
NOTES TO FINANCIAL STATEMENTS (Continued)
December 31, 2007
immediately after the merger were $389,209. The shareholders of Lazard International Equity Select received for each share owned approximately 0.99 share of Aberdeen International.
Note 12—Exemptive Order
On June 5, 2006, the SEC issued an order under Section 12(d)(1)(J) of the Investment Company Act (“1940 Act”) granting an exemption from Sections 12(d)(1)(A) and (B) of the 1940 Act and under Sections 6(c) and 17(b) of the 1940 Act granting an exemption from Section 17(a) of the 1940 Act, which permits the Phoenix-S&P Series to invest in other affiliated and unaffiliated funds, including exchange traded funds. Before the order was granted, the Series could invest in affiliated funds only or exchange traded funds only, but not in unaffiliated funds or a combination of affiliated funds, exchange traded funds, and unaffiliated funds.
Note 13—Other
The insurance company affiliates of the Fund distribute the Fund as investment options in variable annuity and life insurance products (“Variable Products”) through non-affiliated advisors, broker-dealers and other financial intermediaries. There is substantial competition for business within most of these distributors. One of the most significant distributors of the Variable Products (and the Fund) includes a subsidiary of State Farm Mutual Automobile Insurance Company, or State Farm. The insurance company affiliates of the Fund have had distribution arrangements with State Farm since 2001. In 2007, the agreement with State Farm to provide life and annuity products and related services to State Farm’s affluent and high-net-worth customers through qualified State Farm agents was extended until 2016.
Note 14—Federal Income Tax Information (Reported in 000’s)
The following series have capital loss carryovers which may be used to offset future capital gains.
| | | | | | | | | | | | | | | | | | | | | | | | | | | |
| | | Expiration Year |
| | | 2008 | | 2009 | | 2010 | | 2011 | | 2012 | | 2013 | | 2014 | | 2015 | | Total |
Capital Growth | | | — | | $ | 192,231 | | $ | 84,342 | | $ | 5,973 | | $ | 2,820 | | | — | | | — | | | — | | $ | 285,366 |
Mid-Cap Growth | | $ | 38,041 | | | 39,730 | | | 16,035 | | | — | | | — | | $ | 981 | | | — | | | — | | | 94,787 |
Money Market | | | — | | | — | | | — | | | — | | | — | | | — | | | — | | $ | 7 | | | 7 |
Multi-Sector Fixed Income | | | 5,548 | | | 4,981 | | | 7,850 | | | — | | | — | | | — | | | — | | | — | | | 18,379 |
Multi-Sector Short Term Bond | | | — | | | — | | | — | | | — | | | 137 | | | 159 | | $ | 167 | | | — | | | 463 |
Van Kampen Equity 500 Index | | | — | | | — | | | 7,004 | | | 8,593 | | | 575 | | | 1,188 | | | — | | | — | | | 17,360 |
The Fund may not realize the benefit of these losses to the extent each series does not realize gains on investments prior to the expiration of the capital loss carryovers. The Capital Growth Series, the Mid-Cap Growth Series and the Van Kampen Equity 500 Index Series amounts include losses acquired in connection with prior years mergers.
The following series utilized losses deferred in prior years against current year capital gains as follows:
| | | |
Capital Growth | | $ | 19,021 |
Growth and Income | | | 7,338 |
Mid-Cap Growth | | | 22,009 |
Multi-Sector Fixed Income | | | 1,247 |
Multi-Sector Short Term Bond | | | 54 |
Aberdeen International | | | 7,445 |
S&P Dynamic Asset Allocation: Aggressive Growth | | | 10 |
S&P Dynamic Asset Allocation: Growth | | | 24 |
S&P Dynamic Asset Allocation: Moderate | | | 2 |
Van Kampen Equity 500 Index | | | 2,707 |
122
THE PHOENIX EDGE SERIES FUND
NOTES TO FINANCIAL STATEMENTS (Continued)
December 31, 2007
Under current tax law, foreign currency and capital losses realized after October 31 may be deferred and treated as occurring on the first day of the following tax year. For the period ended December 31, 2007, the following series deferred and/or recognized post October losses as follows:
| | | | | | | | | |
Series | | Capital
Deferred | | Capital
Recognized | | Currency
Recognized |
Capital Growth | | $ | 232 | | | — | | | — |
Mid-Cap Growth | | | — | | $ | 18 | | | — |
Multi-Sector Fixed Income | | | 103 | | | — | | $ | 111 |
Multi-Sector Short Term Bond | | | 5 | | | 5 | | | — |
Strategic Allocation | | | — | | | — | | | 17 |
Aberdeen International | | | — | | | — | | | 7 |
Duff & Phelps Real Estate Securities | | | — | | | — | | | — |
S&P Dynamic Asset Allocation: Aggressive Growth | | | 13 | | | — | | | — |
S&P Dynamic Asset Allocation: Growth | | | 57 | | | — | | | — |
S&P Dynamic Asset Allocation: Moderate | | | 12 | | | — | | | — |
S&P Dynamic Asset Allocation: Moderate Growth | | | 48 | | | — | | | — |
The components of distributable earnings on a tax basis, (excluding unrealized appreciation (depreciation), which are disclosed in the respective schedule of investments), consist of undistributed ordinary income and undistributed long-term capital gains as follows:
| | | | | | | |
| | | Undistributed
Ordinary
Income | | Undistributed
Long-Term
Capital Gains | |
Capital Growth | | $ | 86 | | | — | |
Growth and Income | | | 210 | | $ | 1,561 | |
Money Market | | | 10 | | | — | |
Multi-Sector Fixed Income | | | 2,059 | | | — | |
Multi-Sector Short Term Bond | | | 349 | | | — | |
Strategic Allocation | | | 1,371 | | | 1,800 | |
Aberdeen International | | | 1,350 | | | 18,488 | |
Alger Small-Cap Growth | | | 163 | | | 1,179 | |
Duff & Phelps Real Estate Securities | | | 1,308 | | | 2,026 | |
S&P Dynamic Asset Allocation: Aggressive Growth | | | 34 | | | — | |
S&P Dynamic Asset Allocation: Growth | | | 4 | | | — | |
S&P Dynamic Asset Allocation: Moderate | | | 1 | | | — | (#) |
S&P Dynamic Asset Allocation: Moderate Growth | | | 2 | | | — | |
Sanford Bernstein Mid-Cap Value | | | 749 | | | 1,634 | |
Sanford Bernstein Small-Cap Value | | | 346 | | | 1,101 | |
Van Kampen Commstock | | | 435 | | | 1,025 | |
Van Kampen Equity 500 Index | | | 221 | | | — | |
The differences between the book and tax basis components of distributable earnings relate principally to the timing of recognition of income and gains for federal tax purposes. Short-term gains distributions reported in the Statements of Changes in Net Assets, if any, are reported as ordinary income for federal tax purposes.
Note 15—Reclassification of Capital Accounts
For financial reporting purposes, book basis capital accounts are adjusted to reflect the tax character of permanent book/tax differences. Permanent reclassifications can arise from differing treatment of certain income and gain transactions, nondeductible current year net operating losses, expiring capital loss carryovers and investments in passive foreign investment companies. The reclassifications have no impact on the net assets or net asset values of the Series. As of December 31, 2007, the following series recorded reclassifications to increase (decrease) the accounts listed below:
| | | | | | | | | | | | |
| | | Undistributed
Net Investment
Income (Loss) | | | Accumulated
Net Realized
Gain (Loss) | | | Capital Paid In
on Shares of
Beneficial Interest | |
Capital Growth | | $ | (2 | ) | | | — | (#) | | $ | 2 | |
Growth and Income | | | (1 | ) | | | — | | | | 1 | |
Mid-Cap Growth | | | 635 | | | $ | (18 | ) | | | (617 | ) |
Multi-Sector Fixed Income | | | 625 | | | | (625 | ) | | | — | |
Multi-Sector Short Term Bond | | | 130 | | | | (130 | ) | | | — | |
Strategic Allocation | | | 64 | | | | (64 | ) | | | — | |
Aberdeen International | | | 192 | | | | (194 | ) | | | 2 | |
Alger Small-Cap Growth | | | 354 | | | | (362 | ) | | | 8 | |
Duff & Phelps Real Estate Securities | | | — | | | | — | | | | — | |
S&P Dynamic Asset Allocation: Aggressive Growth | | | — | (#) | | | — | (#) | | | — | |
S&P Dynamic Asset Allocation: Growth | | | 1 | | | | (1 | ) | | | — | |
S&P Dynamic Asset Allocation: Moderate | | | — | (#) | | | — | (#) | | | — | |
S&P Dynamic Asset Allocation: Moderate Growth | | | 1 | | | | (1 | ) | | | — | |
Sanford Bernstein Small-Cap Value | | | 19 | | | | (19 | ) | | | — | |
Van Kampen Equity 500 Index | | | (3 | ) | | | — | | | | 3 | |
# | Amount is less than $1,000. |
123
THE PHOENIX EDGE SERIES FUND
NOTES TO FINANCIAL STATEMENTS (Continued)
December 31, 2007
Note 16—Subadvisor Change
On December 10, 2007, Standard & Poor’s Investment Advisory Services LLC provided written notice that it was terminating its subadvisory relationship with the four S&P – Phoenix Dynamic Asset Allocation Series as of February 29, 2008. PVA advised the Board of Trustees that it would be recommending a new subadvisor for the four Series at the February 25-26, 2008 quarterly meeting for its consideration and approval.
Note 17—Subsequent Event
On February 7, 2008, PNX announced that it intends to spin off its asset management subsidiary (“spin-off”), Phoenix Investment Partners (“PXP”), to PNX’ shareholders. The Fund’s Administrator and Transfer Agent, Phoenix Equity Planning Corporation, a subsidiary of PXP, Phoenix Investment Counsel, Inc., a subsidiary of PXP, which is the subadvisor to the Phoenix Growth and Income Series, the Phoenix Strategic Allocation Series, and Duff & Phelps Investment Management Company, a subsidiary of PXP, the subadvisor to the Phoenix-Duff & Phelps Real Estate Securities Series, are also intended to be part of the spin-off. Goodwin Capital Advisors, Inc., a subsidiary of PXP, which is a subadvisor to Phoenix Money Market Series, Phoenix Multi-Sector Fixed Income Series, Phoenix Multi-Sector Short-Term Bond Series, and the Phoenix Strategic Allocation Series, is intended to be distributed to PNX or a PNX affiliate as part of the spin-off.
124
REPORT OF INDEPENDENT REGISTERED PUBLIC ACCOUNTING FIRM

To the Board of Trustees and Shareholders of
The Phoenix Edge Series Fund
In our opinion, the accompanying statements of assets and liabilities, including the schedules of investments, and the related statements of operations and of changes in net assets and the financial highlights present fairly, in all material respects, the financial position of each of the 18 series (constituting The Phoenix Edge Series Fund, hereafter referred to as the “Fund”) at December 31, 2007 and the results of their operations, the changes in their net assets and their financial highlights for each of the periods indicated, in conformity with accounting principles generally accepted in the United States of America. These financial statements and financial highlights (hereafter referred to as “financial statements”) are the responsibility of the Fund’s management; our responsibility is to express an opinion on these financial statements based on our audits. We conducted our audits of these financial statements in accordance with the standards of the Public Company Accounting Oversight Board (United States). Those standards require that we plan and perform the audit to obtain reasonable assurance about whether the financial statements are free of material misstatement. An audit includes examining, on a test basis, evidence supporting the amounts and disclosures in the financial statements, assessing the accounting principles used and significant estimates made by management, and evaluating the overall financial statement presentation. We believe that our audits, which included confirmation of securities at December 31, 2007 by correspondence with the custodian and brokers, provide a reasonable basis for our opinion.

Boston, Massachusetts
February 19, 2008
125
THE PHOENIX EDGE SERIES FUND
TAX INFORMATION NOTICE (UNAUDITED)
December 31, 2007
Tax Information Notice (Unaudited)
For the fiscal year ended December 31, 2007, the series listed designated long-term capital gains dividends as follows:
| | | |
| |
Growth and Income | | $ | 5,578 |
Strategic Allocation | | | 10,678 |
Aberdeen International | | | 42,455 |
Alger Small-Cap Growth | | | 4,892 |
Duff & Phelps Real Estate Securities | | | 10,546 |
S&P Dynamic Asset Allocation: Moderate Growth | | | 29 |
Sanford Bernstein Mid-Cap Value | | | 13,768 |
Sanford Bernstein Small-Cap Value | | | 8,484 |
Van Kampen Comstock | | | 3,236 |
126
THE PHOENIX EDGE SERIES FUND
BOARD OF TRUSTEES’ CONSIDERATION OF INVESTMENT ADVISORY AND
SUBADVISORY AGREEMENTS FOR PHOENIX CAPITAL GROWTH SERIES (the “Series”)
The Board of Trustees is responsible for determining whether to approve the Fund’s advisory and subadvisory agreements. At a meeting held on November 12, 2007, the Board of Trustees, first by a majority of the Trustees who are “disinterested” trustees of the Fund (as that term is defined in section 2(a)(19) of the Investment Company Act of 1940, (the “1940 Act”), and then by a majority of the entire Board, approved the renewal of the investment advisory agreement (the “Advisory Agreement”) between Phoenix Variable Advisors, Inc. (“PVA”) and the Fund and the investment subadvisory agreement (the “Subadvisory Agreement”) between PVA and Harris Investment Management, Inc. (the “Subadvisor”). Pursuant to the Advisory Agreement between PVA and the Fund, PVA provides advisory services to the Series. Pursuant to the Subadvisory Agreement between PVA and the Subadvisor, the Subadvisor provides the day to day investment management for the Series.
During the review process, the Board received assistance and advice from, and met separately with, independent legal counsel. In approving each agreement, the Board, including a majority of disinterested Trustees, determined that the fee structure was reasonable and approving the renewals was in the best interests of the Series and its shareholders. While attention was given to all information furnished, the following discusses the primary factors relevant to the Board’s decision.
ADVISORY AGREEMENT CONSIDERATIONS
Nature, Extent and Quality of Services. The Board concluded that the nature, extent and quality of the overall services to be provided by PVA and its affiliates to the Series and its shareholders were reasonable. The Board received and reviewed substantial written information from PVA as requested. The Board’s conclusion was based, in part, upon services provided by PVA to other series of The Phoenix Edge Series Fund such as quarterly reports provided by PVA 1) comparing performance with a peer group and benchmark, 2) showing that the investment policies and restrictions were followed and 3) covering matters such as the compliance of investment personnel and other access persons with the Code of Ethics of PVA, the adherence to fair value pricing procedures established by the Board, the monitoring of portfolio compliance, information on illiquid securities and derivatives, brokerage commissions and presentations regarding the economic environment and general investment outlook. The Board noted that PVA was responsible for the general oversight of investment programs and the monitoring of subadvisor’s investment performance and their compliance with applicable laws, regulations, policies and procedures. With respect to compliance monitoring, the Board noted that PVA will require quarterly compliance certifications from the Subadvisor and will conduct compliance due diligence visits at the Subadvisor. The Board also considered the experience of PVA having acted as an investment adviser to mutual funds for 8 years, its current experience in acting as an investment adviser to 18 mutual funds, and its role under the Fund’s “manager of managers” exemptive relief under the 1940 Act. The Board also considered the transfer agent and shareholder services that are provided to Series shareholders by an affiliate of PVA, noting continuing improvements by management in the scope and quality of services and favorable reports on such service conducted by third parties.
Investment Performance. The Board placed emphasis on the investment performance of the Series in view of its importance to shareholders. In this regard, the Board considered the detailed performance review process of the Investment Performance Committee. While consideration was given to performance reports and discussions at Board meetings throughout the year, particular attention in assessing such performance was given to a report for the Series prepared by Lipper Financial Services (“Lipper”), which was furnished for the contract renewal process. The Lipper report showed the investment performance of the Series’ shares for the 1, 3, 5 and 10 year periods ended September 30, 2007, and the year-to-date period ended September 30, 2007. The Board reviewed the investment performance of the Series, along with comparative performance information given for a peer group of funds and a relevant market index. The Board noted that the Series performed below the index for the 1, 3, 5, and 10 year and year-to-date periods as of September 30, 2007. The Series was ranked 134th out of 199 for its peer group for the year-to-date period ended September 30, 2007. The Board noted that the Subadvisor has been managing the Series for approximately eighteen months in its consideration of the quality of the Subadvisor’s investment performance. The Board further noted that it would review the Subadvisor’s investment performance each quarter in 2008.
Profitability. The Board reviewed the profitability analysis that addressed the overall profitability of PVA for its management of The Phoenix Edge Series Fund family, as well as its profits and that of its affiliates, for managing the Series. Specific attention was given to the methodology followed in allocating costs to the Series, since allocation methodologies are inherently subjective and various allocation methodologies may each be reasonable while producing different results. In this regard, the Board noted that the allocation methodology appeared reasonable. The Board also noted the contractual reimbursements provided to the Series. The Board concluded that the expected profitability to PVA from the Series was reasonable.
Management Fee and Total Expenses. The Board also placed emphasis on the review of Series expenses. Consideration was given to the comparative analysis of the management fees and total expense ratios of the Series compared with those of a group of funds selected by Lipper as its appropriate Lipper expense peer group as of September 30, 2007. The Board noted that the total expenses of the Series were higher than the average total expenses for comparable funds, and, however, the contractual management fee was slightly above the median for the peer group. The Board considered the management fee and total expenses of the Series in comparison to its peer group as shown in the Lipper report and concluded that such fee and expenses were reasonable.
Economies of Scale. The Board noted that the management fee included breakpoints based on the amount of assets under management. The Board noted that it was likely that PVA and the Series would achieve certain economies of scale with respect to covering certain fixed costs as the assets grew. The Board concluded that shareholders would have an opportunity to benefit from these economies of scale.
127
THE PHOENIX EDGE SERIES FUND
BOARD OF TRUSTEES’ CONSIDERATION OF INVESTMENT ADVISORY AND
SUBADVISORY AGREEMENTS FOR PHOENIX CAPITAL GROWTH SERIES (the “Series”)
(Continued)
SUBADVISORY AGREEMENT CONSIDERATIONS
Nature, Extent and Quality of Services. The Board concluded that the nature, extent and quality of the overall services to be provided by the Subadvisor to the Series and its shareholders were reasonable. In addition, the Board received from the Subadvisor and reviewed substantial written information as requested. In the course of their deliberations and evaluation of materials, the Trustees considered, among other things the following factors: the Subadvisor, its current personnel (including particularly those personnel with responsibilities for providing investment and compliance services to the Series), and its financial condition, resources and investment process; the terms of the Subadvisory Agreement, including the standard of care and termination provisions; the scope and quality of the services that Subadvisor would provide to the Series; the structure and rate of advisory fees payable to the Subadvisor by PVA, the methodology used by the Subadvisor in determining the compensation payable to portfolio managers and the competition for investment management talent; and the Subadvisor’s compliance record. The Board’s opinion was based upon the extensive experience of the Subadvisor and the portfolio managers. With respect to portfolio manager compensation, the Board noted that a primary factor in the Subadvisor’s determination of the amount of bonus compensation to portfolio managers was the relative investment performance of the funds that they managed which would align their interests with those of the Series’ shareholders. The Board also considered the adequacy of the Subadvisor’s compliance program, based on the information provided by the Subadvisor.
Investment Performance. The Board placed emphasis on the investment performance of the Series in view of its importance to the shareholders. While consideration was given to performance reports and discussions at Board meetings throughout the year, particular attention in assessing such performance was given to a report for the Series prepared by Lipper Financial Services (“Lipper”), which was furnished for the contract renewal process. The Lipper report showed the investment performance of the Series’ shares for the 1, 3, 5 and 10 year periods ended September 30, 2007 and the year-to-date period ended September 30, 2007. The Board reviewed the investment performance of the Series, along with comparative performance information given for a peer group of funds and a relevant market index. The Board noted that the Series had performed below the index for the 1, 3, 5 and 10 year and year-to-date periods as of September 30, 2007. The Series was ranked 134th out of 199 for its peer group for the year-to-date period ended September 30, 2007. The Board noted that the Subadvisor has been managing the Series for approximately eighteen months in its consideration of the quality of the Subadvisor’s investment performance. The Board further noted that it would review the Subadvisor’s investment performance each quarter in 2008.
Profitability. The Board noted that the subadvisory fee is paid by PVA and not by the Series and that the profitability of the Subadvisor was not a material consideration.
Subadvisory Fee. The Board did not consider comparative fee information of subadvisory fees but noted that the subadvisory fee is paid by PVA and not by the Series.
Economies of Scale. The Board also considered the existence of any economies of scale and whether those economies would be passed along to the Series’ shareholders, but noted that any economies would most likely be generated at the advisor level and not necessarily at the subadvisor level.
128
THE PHOENIX EDGE SERIES FUND
BOARD OF TRUSTEES’ CONSIDERATION OF INVESTMENT ADVISORY AND
SUBADVISORY AGREEMENTS FOR PHOENIX GROWTH AND INCOME SERIES (the “Series”)
The Board of Trustees is responsible for determining whether to approve the Fund’s advisory and subadvisory agreements. At a meeting held on November 12, 2007, the Board, including a majority of disinterested Trustees, approved the renewal of the investment advisory agreement (the “Advisory Agreement”) between Phoenix Variable Advisors, Inc. (“PVA”) and the Fund and the investment subadvisory agreement (the “Subadvisory Agreement”) between PVA and Phoenix Investment Counsel, Inc. (the “Subadvisor”). Pursuant to the Advisory Agreement between PVA and the Fund, PVA provides advisory services to the Series. Pursuant to the Subadvisory Agreement between PVA and the Subadvisor, the Subadvisor provides the day to day investment management for the Series.
During the review process, the Board received assistance and advice from, and met separately with, independent legal counsel. In approving each agreement, the Board, including a majority of disinterested Trustees, determined that the fee structure was reasonable and approving the renewals was in the best interests of the Series and its shareholders. While attention was given to all information furnished, the following discusses the primary factors relevant to the Board’s decision.
ADVISORY AGREEMENT CONSIDERATIONS
Nature, Extent and Quality of Services. The Board concluded that the nature, extent and quality of the overall services to be provided by PVA and its affiliates to the Series and its shareholders were reasonable. The Board received and reviewed substantial written information from PVA as requested. The Board’s conclusion was based, in part, upon services provided by PVA to other series of The Phoenix Edge Series Fund such as quarterly reports provided by PVA 1) comparing performance with a peer group and benchmark, 2) showing that the investment policies and restrictions were followed and 3) covering matters such as the compliance of investment personnel and other access persons with the Code of Ethics of PVA, the adherence to fair value pricing procedures established by the Board, the monitoring of portfolio compliance, information on illiquid securities and derivatives, brokerage commissions and presentations regarding the economic environment and general investment outlook. The Board noted that PVA was responsible for the general oversight of investment programs and the monitoring of subadvisor’s investment performance and their compliance with applicable laws, regulations, policies and procedures. With respect to compliance monitoring, the Board noted that PVA will require quarterly compliance certifications from the Subadvisor and will conduct compliance due diligence visits at the Subadvisor. The Board also considered the experience of PVA having acted as an investment adviser to mutual funds for 8 years, its current experience in acting as an investment adviser to 18 mutual funds, and its role under the Fund’s “manager of managers” exemptive relief under the 1940 Act. The Board also considered the transfer agent and shareholder services that are provided to Series shareholders by an affiliate of PVA, noting continuing improvements by management in the scope and quality of services and favorable reports on such service conducted by third parties.
Investment Performance. The Board placed emphasis on the investment performance of the Series in view of its importance to shareholders. In this regard, the Board considered the detailed performance review process of the Investment Performance Committee. While consideration was given to performance reports and discussions at Board meetings throughout the year, particular attention in assessing such performance was given to a report for the Series prepared by Lipper Financial Services (“Lipper”), which was furnished for the contract renewal process. The Lipper report showed the investment performance of the Series’ shares for 1, 3 and 5 year periods ended September 30, 2007 and the year-to-date period ended September 30, 2007. The Board reviewed the investment performance of the Series, along with comparative performance information given for a peer group of funds and a relevant market index. The Board noted that the Series had performed above the index for the 3 year period ended September 30, 2007. The Board noted that the Series performed below its benchmark for the 1 and 5 year period and the year-to-date periods ended September 30, 2007. The Series was ranked 126th out of 208 for its peer group for the year-to-date period ended September 30, 2007.
Profitability. The Board reviewed the profitability analysis that addressed the overall profitability of PVA for its management of The Phoenix Edge Series Fund family, as well as its profits and that of its affiliates, for managing the Series. Specific attention was given to the methodology followed in allocating costs to the Series, since allocation methodologies are inherently subjective and various allocation methodologies may each be reasonable while producing different results. In this regard, the Board noted that the allocation methodology appeared reasonable. The Board also noted the contractual reimbursements provided to the Series. The Board concluded that the expected profitability to PVA from the Series was reasonable.
Management Fee and Total Expenses. The Board also placed emphasis on the review of Series expenses. Consideration was given to a comparative analysis of the management fees and total expense ratios of the Series compared with those of a group of funds selected by Lipper as the Series’ appropriate Lipper expense peer group as of September 30, 2007. The Board noted that the total expenses of the Series were higher than the average total expenses for comparable funds and that the contractual management fee was higher than the median for the peer group. Due to the size of the Series, the Board considered the management fee and total expenses of the Series in comparison to its expense peer group as shown in the Lipper report and concluded that such fee and expenses were reasonable.
Economies of Scale. The Board noted that the management fee included breakpoints based on the amount of assets under management. The Board also noted that it was likely that PVA and the Series would achieve certain economies of scale with respect to covering certain fixed costs as the assets grew. The Board concluded that shareholders would have an opportunity to benefit from these economies of scale.
129
THE PHOENIX EDGE SERIES FUND
BOARD OF TRUSTEES’ CONSIDERATION OF INVESTMENT ADVISORY AND
SUBADVISORY AGREEMENTS FOR PHOENIX GROWTH AND INCOME SERIES (the “Series”)
(Continued)
SUBADVISORY AGREEMENT CONSIDERATIONS
Nature, Extent and Quality of Services. The Board concluded that the nature, extent and quality of the overall services to be provided by the Subadvisor to the Series and its shareholders were reasonable. In addition, the Board received from the Subadvisor and reviewed substantial written information as requested. In the course of their deliberations and evaluation of materials, the Trustees considered, among other things the following factors: the Subadvisor, its current personnel (including particularly those personnel with responsibilities for providing investment and compliance services to the Series), and its financial condition, resources and investment process; the terms of the Subadvisory Agreement, including the standard of care and termination provisions; the scope and quality of the services that Subadvisor would provide to the Series; the structure and rate of advisory fees payable to the Subadvisor by PVA, the methodology used by the Subadvisor in determining the compensation payable to portfolio managers and the competition for investment management talent; and the Subadvisor’s compliance record. The Board’s opinion was based upon the extensive experience of the Subadvisor and the portfolio managers and the experience the Subadvisor had as the previous advisor for the Series. With respect to portfolio manager compensation, the Board noted that a primary factor in the Subadvisor’s determination of the amount of bonus compensation to portfolio managers was the relative investment performance of the funds that they managed which would align their interests with those of the Series’ shareholders. The Board also considered the adequacy of the Subadvisor’s compliance program, based on the information provided by the Subadvisor.
Investment Performance. The Board placed emphasis on the investment performance of the Series in view of its importance to the shareholders. While consideration was given to performance reports and discussions at Board meetings throughout the year, particular attention in assessing such performance was given to a report for the Series prepared by Lipper Financial Services (“Lipper”), which was furnished for the contract renewal process. The Lipper report showed the investment performance of the Series’ shares for the 1, 3 and 5 year periods ended September 30, 2007 and the year-to-date period ended September 30, 2007. The Board reviewed the investment performance of the Series, along with comparative performance information given for a peer group of funds and a relevant market index. The Board noted that the Series had performed above the index for the 3 year period ended September 30, 2007. The Board noted that the Series performed below its benchmark for the 1 and 5 year period and the year-to-date periods ended September 30, 2007. The Series was ranked 126th out of 208 for its peer group for the year ended September 30, 2007.
Profitability. The Board noted that the subadvisory fee is paid by PVA and not by the Series and that the profitability of the Subadvisor was not a material consideration.
Subadvisory Fee. The Board did not receive comparative fee information of subadvisory fees but noted that the subadvisory fee is paid by PVA and not by the Series.
Economies of Scale. The Board also considered the existence of any economies of scale and whether those economies would be passed along the Series’ shareholders, but noted that any economies would most likely be generated at the advisor level and not necessarily at the subadvisor level.
130
THE PHOENIX EDGE SERIES FUND
BOARD OF TRUSTEES’ CONSIDERATION OF INVESTMENT ADVISORY AND
SUBADVISORY AGREEMENTS FOR PHOENIX MID-CAP GROWTH SERIES (the “Series”)
The Board of Trustees is responsible for determining whether to approve the Fund’s advisory and subadvisory agreements. At a special meeting of the Series’ Board of Trustees on September 26, 2007, the Board approved the Advisor’s recommendation to terminate the prior subadvisor, Bennett Lawrence Management LLC (“Bennett Lawrence”) to be effective on November 26, 2007. At the special meeting, the Advisor advised the Board that it would recommend a new subadvisor for the Series to the Board for its consideration at the November 12 and 13, 2007 Board Meeting. At a meeting held on November 13, 2007 the Advisor recommended that Neuberger Berman Management LLC (“Neuberger Berman”) manage the Series. The Board, including a majority of disinterested Trustees, approved the renewal of the investment advisory agreement (the “Advisory Agreement”) between Phoenix Variable Advisors, Inc. (“PVA”) and the Fund and approved the investment subadvisory agreement (the “Subadvisory Agreement”) between PVA and Neuberger Berman (the “Subadvisor”). Pursuant to the Advisory Agreement between PVA and the Fund, PVA provides advisory services to the Series. Pursuant to the Subadvisory Agreement between PVA and the Subadvisor, the Subadvisor provides the day to day investment management for the Series.
During the review process, the Board received assistance and advice from, and met separately with, independent legal counsel. In approving each agreement, the Board, including a majority of disinterested Trustees, determined that the fee structure was fair and reasonable and that approval of each agreement was in the best interests of the Series and its shareholders. While attention was given to all information furnished, the following discusses the primary factors relevant to the Board’s decision.
ADVISORY AGREEMENT CONSIDERATIONS
Nature, Extent and Quality of Services. The Board concluded that the nature, extent and quality of the overall services provided by PVA and its affiliates to the Series and its shareholders were reasonable. The Board’s conclusion was based, in part, upon services provided to the Series such as quarterly reports provided by PVA 1) comparing the performance of the Series with a peer group and benchmark, 2) showing that the investment policies and restrictions for the Series were followed and 3) covering matters such as the compliance of investment personnel and other access persons with the Code of Ethics of PVA and the Series, the adherence to fair value pricing procedures established by the Board, the monitoring of portfolio compliance, information on illiquid securities and derivatives, brokerage commissions and presentations regarding the economic environment and general investment outlook. The Board noted that PVA was responsible for the general oversight of the investment programs of the Series and the monitoring of the Subadvisor’s investment performance and its compliance with applicable laws, regulations, policies and procedures. In this regard, the Board considered the detailed performance review process of the Investment Performance Committee. With respect to compliance monitoring, the Board noted that PVA required quarterly compliance certifications from the former subadvisor and conducted compliance due diligence visits at the former subadvisor and would continue this compliance process with the new Subadvisor. The Board also considered the experience of PVA having acted as an investment adviser to mutual funds for 8 years, its current experience in acting as an investment adviser to 18 mutual funds, and its role under the Fund’s “manager of managers” exemptive relief under the Investment Company Act of 1940, as amended. The Board also considered the transfer agent and shareholder services that are provided to Series shareholders by an affiliate of PVA, noting continuing improvements by management in the scope and quality of services and favorable reports on such service conducted by third parties.
Investment Performance. Since the Board placed emphasis on the investment performance of the Series in view of its importance to shareholders, it considered the new Subadvisor’s prior performance in managing mid-cap securities. Neuberger Berman had outperformed the Russell Mid-Cap Growth Index by 300 bps for the 1 year period ended August 31, 2007. The 3 and 5 year performance for similar funds was strong.
Profitability. The Board also considered the level of profits realized by PVA and its affiliates in connection with the operation of the Series. In this regard, the Board reviewed the Series profitability analysis that addressed the overall profitability of PVA for its management of The Phoenix Edge Series Fund family, as well as its profits and that of its affiliates, for managing the Series. Specific attention was given to the methodology followed in allocating costs to the Series, since allocation methodologies are inherently subjective and various allocation methodologies may each be reasonable while producing different results. In this regard, the Board noted that the allocation appeared reasonable. The Board also noted the voluntary reimbursements provided to the Series. The Board concluded that the profitability to PVA from the Fund was reasonable.
Management Fee and Total Expenses. The Board also placed emphasis on the review of Series expenses. Consideration was given to a comparative analysis of the management fees and total expense ratios of the Series compared with those of a group of funds selected by Lipper as the Series’ appropriate Lipper expense peer group. The Board noted that the total expenses of the Series were above the average total expenses for comparable funds; however the contractual management fee was below the median for the peer group. The Board was satisfied with the management fee and total expenses of the Series in comparison to its peer group as shown in the Lipper report and concluded that such fee and expenses were reasonable.
Economies of Scale. The Board noted that it was likely that PVA and the Series would achieve certain economies of scale as the assets grew in order to cover certain fixed costs. The Board concluded that shareholders would have an opportunity to benefit from these economies of scale.
131
THE PHOENIX EDGE SERIES FUND
BOARD OF TRUSTEES’ CONSIDERATION OF INVESTMENT ADVISORY AND
SUBADVISORY AGREEMENTS FOR PHOENIX MID-CAP GROWTH SERIES (the “Series”)
(Continued)
SUBADVISORY AGREEMENT CONSIDERATIONS
Nature, Extent, Quality of Services and Investment Performance. In connection with the consideration of PVA’s proposal to replace Bennett Lawrence with Neuberger Berman as Subadvisor to the Series, the Board received in advance of the meeting, certain information in the form of an extensive questionnaire completed by Neuberger Berman concerning a number of issues, including its investment philosophy, resources, operations and compliance structure. The Board had further benefit of a presentation made by Neuberger Berman’s senior management personnel where a number of issues, including Neuberger Berman’s history, investment approach, investment strategies, portfolio turnover rates, assets under management, personnel, compliance procedures and the firm’s overall performance, were reviewed and discussed. The Board was satisfied that the financial statements of Neuberger Berman indicated it was sufficiently capitalized, and that its 1, 3 and 5 year performance for funds similar to the Series was strong. The Board also took note of Neuberger Berman’s consistent investment style.
The Board also reviewed performance information for the Series and noted that as a result of disappointing performance, the recommendation of a new subadvisor was appropriate. In this context, the Trustees considered PVA’s quantitative and qualitative evaluation of Neuberger Berman’s skills and abilities in managing assets pursuant to specific investment styles similar to the styles of the Series. In addition, the Trustees also considered the overall nature, extent, and quality of the services to be provided by the Subadvisor, whether the cost to PVA of these services would be reasonable, and the economic viability of Neuberger Berman.
After considering all the information presented, based on the qualifications of Neuberger Berman’s personnel and the performance of assets managed by the subadvisor in a similar manner and the performance of assets managed by the subadvisor in a similar manner as the Series would be managed, the Board concluded that the nature, quality and cost of services to be provided to the Series by the subadvisor were reasonable and in the best interest of the Series and their shareholders and approved the proposal.
Profitability. The Board noted that the subadvisory fee is paid by PVA and not by the Series.
Subadvisory Fee. The Board did not receive comparative fee information of subadvisory fees but noted that the subadvisory fee is paid by PVA and not by the Series.
Economies of Scale. The Board also considered the existence of any economies of scale and whether those economies would be passed along to the Series’ shareholders but noted that any economies would most likely be generated at the advisor level and not necessarily at the subadvisor level.
132
THE PHOENIX EDGE SERIES FUND
BOARD OF TRUSTEES’ CONSIDERATION OF INVESTMENT ADVISORY AND
SUBADVISORY AGREEMENTS FOR PHOENIX MONEY MARKET SERIES (the “Series”)
The Board of Trustees is responsible for determining whether to approve the Fund’s advisory and subadvisory agreements. At a meeting held on November 12, 2007, the Board, including a majority of disinterested Trustees, approved the renewal of the investment advisory agreement (the “Advisory Agreement”) between Phoenix Variable Advisors, Inc. (“PVA”) and the Fund and the investment subadvisory agreement (the “Subadvisory Agreement”) between PVA and Goodwin Capital Advisers, Inc. (the “Subadvisor”). Pursuant to the Advisory Agreement between PVA and the Fund, PVA provides advisory services to the Series. Pursuant to the Subadvisory Agreement between PVA and the Subadvisor, the Subadvisor provides the day to day investment management for the Series.
During the review process, the Board received assistance and advice from, and met separately with, independent legal counsel. In approving each agreement, the Board, including a majority of disinterested Trustees, determined that the fee structure was reasonable and approving the renewals was in the best interests of the Series and its shareholders. While attention was given to all information furnished, the following discusses the primary factors relevant to the Board’s decision.
ADVISORY AGREEMENT CONSIDERATIONS
Nature, Extent and Quality of Services. The Board concluded that the nature, extent and quality of the overall services to be provided by PVA and its affiliates to the Series and its shareholders were reasonable. The Board received and reviewed substantial written information from PVA as requested. The Board’s conclusion was based, in part, upon services provided by PVA to other series of The Phoenix Edge Series Fund such as quarterly reports provided by PVA 1) comparing performance with a peer group and benchmark, 2) showing that the investment policies and restrictions were followed and 3) covering matters such as the compliance of investment personnel and other access persons with the Code of Ethics of PVA, the adherence to fair value pricing procedures established by the Board, the monitoring of portfolio compliance, information on illiquid securities and derivatives, brokerage commissions and presentations regarding the economic environment and general investment outlook. The Board noted that PVA was responsible for the general oversight of investment programs and the monitoring of subadvisor’s investment performance and their compliance with applicable laws, regulations, policies and procedures. With respect to compliance monitoring, the Board noted that PVA will require quarterly compliance certifications from the Subadvisor and will conduct compliance due diligence visits at the Subadvisor. The Board also considered the experience of PVA having acted as an investment adviser to mutual funds for 8 years, its current experience in acting as an investment adviser to 18 mutual funds, and its role under the Fund’s “manager of managers” exemptive relief under the 1940 Act. The Board also considered the transfer agent and shareholder services that are provided to Series shareholders by an affiliate of PVA, noting continuing improvements by management in the scope and quality of services and favorable reports on such service conducted by third parties.
Investment Performance. The Board placed emphasis on the investment performance of the Series in view of its importance to shareholders. In this regard, the Board considered the detailed performance review process of the Investment Performance Committee. While consideration was given to performance reports and discussions at Board meetings throughout the year, particular attention in assessing such performance was given to a report for the Series prepared by Lipper Financial Services (“Lipper”), which was furnished for the contract renewal process. The Lipper report showed the investment performance of the Series’ shares for the 1, 3, 5 and 10 year periods ended September 30, 2007 and the year-to-date period ended September 30, 2007. The Board reviewed the investment performance of the Series, along with comparative performance information given for a peer group of funds and a relevant market index. The Board noted that the performance of the Series was slightly below the index for all periods. The Series was ranked 52nd out of 108 for its peer group for the year-to-date period ended September 30, 2007.
Profitability. The Board reviewed the profitability analysis that addressed the overall profitability of PVA for its management of The Phoenix Edge Series Fund family, as well as its profits and that of its affiliates, for managing the Series. Specific attention was given to the methodology followed in allocating costs to the Series since allocation methodologies are inherently subjective and various allocation methodologies may each be reasonable while producing different results. In this regard, the Board noted that the allocation methodology appeared reasonable. The Board also noted the contractual reimbursements provided to the Series. The Board concluded that the expected profitability to PVA from the Series was reasonable.
Management Fee and Total Expenses. The Board also placed emphasis on the review of Series expenses. Consideration was given to a comparative analysis of the management fees and total expense ratios of the Series compared with those of a group of funds selected by Lipper as the Series’ appropriate Lipper expense peer group as of September 30, 2007. The Board noted that the total expenses of the Series were higher than average total expenses for comparable funds and that the contractual management fee was below the median for the peer group. The Board considered the management fee and total expenses of the Series in comparison to its expense peer group as shown in the Lipper report and concluded that such fee and expenses were reasonable.
Economies of Scale. The Board noted that the management fee included breakpoints based on the amount of assets under management. The Board noted that it was likely that PVA and the Series would achieve certain economies of scale with respect to covering certain fixed costs as the assets grew. The Board concluded that shareholders would have an opportunity to benefit from these economies of scale.
133
THE PHOENIX EDGE SERIES FUND
BOARD OF TRUSTEES’ CONSIDERATION OF INVESTMENT ADVISORY AND
SUBADVISORY AGREEMENTS FOR PHOENIX MONEY MARKET SERIES (the “Series”)
(Continued)
SUBADVISORY AGREEMENT CONSIDERATIONS
Nature, Extent and Quality of Services. The Board concluded that the nature, extent and quality of the overall services to be provided by the Subadvisor to the Series and its shareholders were reasonable. In addition, the Board received from the Subadvisor and reviewed substantial written information as requested. In the course of their deliberations and evaluation of materials, the Trustees considered, among other things the following factors: the Subadvisor, its current personnel (including particularly those personnel with responsibilities for providing investment and compliance services to the Series), and its financial condition, resources and investment process; the terms of the Subadvisory Agreement, including the standard of care and termination provisions; the scope and quality of the services that the Subadvisor would provide to the Series; the structure and rate of advisory fees payable to the Subadvisor by PVA, the methodology used by the Subadvisor in determining the compensation payable to portfolio managers and the competition for investment management talent; and the Subadvisor’s compliance record. The Board’s opinion was based, in part, upon the extensive experience of the portfolio managers and, in particular, their experience in managing the Series as employees of Phoenix Investment Counsel, Inc., the previous advisor for the Series. With respect to portfolio manager compensation, the Board noted that a primary factor in the Subadvisor’s determination of the amount of bonus compensation to portfolio managers was the relative investment performance of the funds that they managed, which would align their interests with those of the Series’ shareholders. The Board also considered the adequacy of the Subadvisor’s compliance program, based on the information provided by the Subadvisor.
Investment Performance. The Board placed emphasis on the investment performance of the Series in view of its importance to the shareholders. While consideration was given to performance reports and discussions at Board meetings throughout the year, particular attention in assessing such performance was given to a report for the Series prepared by Lipper Financial Services (“Lipper”), which was furnished for the contract renewal process. The Lipper report showed the investment performance of the Series’ shares for the 1, 3, 5 and 10 year periods ended September 30, 2007 and the year-to-date period ended September 30, 2007. The Board reviewed the investment performance of the Series, along with comparative performance information given for a peer group of funds and a relevant market index. The Board noted that the performance of the Series was slightly below the index for all periods. The Series was ranked 52nd out of 108 for its peer group for the year-to-date period ended September 30, 2007.
Profitability. The Board noted that the subadvisory fee is paid by PVA and not by the Series and that the profitability of the Subadvisor was not a material consideration.
Subadvisory Fee. The Board did not receive comparative fee information of subadvisory fees but noted that the subadvisory fee is paid by PVA and not by the Series.
Economies of Scale. The Board also considered the existence of any economies of scale and whether those economies would be passed along to the Series’ shareholders, but noted that any economies would most likely be generated at the adviser level and not necessarily at the subadvisor level.
134
THE PHOENIX EDGE SERIES FUND
BOARD OF TRUSTEES’ CONSIDERATION OF INVESTMENT ADVISORY AND
SUBADVISORY AGREEMENTS FOR PHOENIX MULTI-SECTOR FIXED INCOME SERIES
(the “Series”)
The Board of Trustees is responsible for determining whether to approve the Fund’s advisory and subadvisory agreements. At a meeting held on November 12, 2007, the Board, including a majority of disinterested Trustees, approved the renewal of the investment advisory agreement (the “Advisory Agreement”) between Phoenix Variable Advisors, Inc. (“PVA”) and the Fund and the investment subadvisory agreement (the “Subadvisory Agreement”) between PVA and Goodwin Capital Advisers, Inc. (the “Subadvisor”). Pursuant to the Advisory Agreement between PVA and the Fund, PVA provides advisory services to the Series. Pursuant to the Subadvisory Agreement between PVA and the Subadvisor, the Subadvisor provides the day to day investment management for the Series.
During the review process, the Board received assistance and advice from, and met separately with, independent legal counsel. In approving each agreement, the Board, including a majority of disinterested Trustees, determined that the fee structure was reasonable and approving the renewals was in the best interests of the Series and its shareholders. While attention was given to all information furnished, the following discusses the primary factors relevant to the Board’s decision.
ADVISORY AGREEMENT CONSIDERATIONS
Nature, Extent and Quality of Services. The Board concluded that the nature, extent and quality of the overall services to be provided by PVA and its affiliates to the Series and its shareholders were reasonable. The Board received and reviewed substantial written information from PVA as requested. The Board’s conclusion was based, in part, upon services provided by PVA to other series of The Phoenix Edge Series Fund such as quarterly reports provided by PVA 1) comparing performance with a peer group and benchmark, 2) showing that the investment policies and restrictions were followed and 3) covering matters such as the compliance of investment personnel and other access persons with the Code of Ethics of PVA, the adherence to fair value pricing procedures established by the Board, the monitoring of portfolio compliance, information on illiquid securities and derivatives, brokerage commissions and presentations regarding the economic environment and general investment outlook. The Board noted that PVA was responsible for the general oversight of investment programs and the monitoring of the subadvisor’s investment performance and their compliance with applicable laws, regulations, policies and procedures. With respect to compliance monitoring, the Board noted that PVA will require quarterly compliance certifications from the Subadvisor and will conduct compliance due diligence visits at the Subadvisor. The Board also considered the experience of PVA having acted as an investment adviser to mutual funds for 8 years, its current experience in acting as an investment adviser to 18 mutual funds, and its role under the Fund’s “manager of managers” exemptive relief under the 1940 Act. The Board also considered the transfer agent and shareholder services that are provided to Series shareholders by an affiliate of PVA, noting continuing improvements by management in the scope and quality of services and favorable reports on such service conducted by third parties.
Investment Performance. The Board placed emphasis on the investment performance of the Series in view of its importance to shareholders. In this regard, the Board considered the detailed performance review process of the Investment Performance Committee. While consideration was given to performance reports and discussions at Board meetings throughout the year, particular attention in assessing such performance was given to a report for the Series prepared by Lipper Financial Services (“Lipper”), which was furnished for the contract renewal process. The Lipper report showed the investment performance of the Series’ shares for the 1, 3, 5 and 10 year periods ended September 30, 2007 and the year-to-date period ended September 30, 2007. The Board reviewed the investment performance of the Series, along with comparative performance information given for a peer group of funds and a relevant market index. The Series had performed above the index for the 1, 3, and 5 year periods ended September 30, 2007 and performed below the index for the 10 year and year-to-date periods ended September 30, 2007. The Series was ranked 33rd out of 49 for its peer group for the year-to-date period ended September 30, 2007.
Profitability. The Board reviewed the profitability analysis that addressed the overall profitability of PVA for its management of The Phoenix Edge Series Fund family, as well as its profits and that of its affiliates, for managing the Series. Specific attention was given to the methodology followed in allocating costs to the Series, since allocation methodologies are inherently subjective and various allocation methodologies may each be reasonable while producing different results. In this regard, the Board noted that the allocation methodology appeared reasonable. The Board also noted the contractual reimbursements provided to the Series. The Board concluded that the expected profitability to PVA from the Series was reasonable.
Management Fee and Total Expenses. The Board also placed emphasis on the review of Series expenses. Consideration was given to a comparative analysis of the management fees and total expense ratios of the Series compared with those of a group of funds selected by Lipper as the Series’ appropriate Lipper expense peer group as of September 30, 2007. The Board noted that the total expenses of the Series were slightly lower than the average total expenses for comparable funds and that the contractual management fee was below the median for the peer group. The Board considered the management fee and total expenses of the Series in comparison to its expense group as shown in the Lipper report and concluded that such fee and expenses were reasonable.
Economies of Scale. The Board noted that the management fee included breakpoints based on the amount of assets under management. The Board also noted that it was likely that PVA and the Series would achieve certain economies of scale with respect to covering certain fixed costs as the assets grew. The Board concluded that shareholders would have an opportunity to benefit from these economies of scale.
135
THE PHOENIX EDGE SERIES FUND
BOARD OF TRUSTEES’ CONSIDERATION OF INVESTMENT ADVISORY AND
SUBADVISORY AGREEMENTS FOR PHOENIX MULTI-SECTOR FIXED INCOME SERIES
(the “Series”) (Continued)
SUBADVISORY AGREEMENT CONSIDERATIONS
Nature, Extent and Quality of Services. The Board concluded that the nature, extent and quality of the overall services to be provided by the Subadvisor to the Series and its shareholders were reasonable. In addition, the Board received from the Subadvisor and reviewed substantial written information as requested. In the course of their deliberations and evaluation of materials, the Trustees considered among other things the following factors: the Subadvisor, its current personnel (including particularly those personnel with responsibilities for providing investment and compliance services to the Series), and its financial condition, resources and investment process; the terms of the Subadvisory Agreement, including the standard of care and termination provisions; the scope and quality of the services that Subadvisor would provide to the Series; the structure and rate of advisory fees payable to the Subadvisor by PVA, the methodology used by the Subadvisor in determining the compensation payable to portfolio managers and the competition for investment management talent; and the Subadvisor’s compliance record. The Board’s opinion was based upon the extensive experience of the portfolio managers and, in particular, their experience in managing the Series as employees of Phoenix Investment Counsel, Inc., the previous advisor for the Series. With respect to portfolio manager compensation, the Board noted that a primary factor in the Subadvisor’s determination of the amount of bonus compensation to portfolio managers was the relative investment performance of the funds that they managed which would align their interests with those of the Series’ shareholders. The Board also considered the adequacy of the Subadvisor’s compliance program, based on the information provided by the Subadvisor.
Investment Performance. The Board placed emphasis on the investment performance of the Series in view of its importance to the shareholders. While consideration was given to performance reports and discussions at Board meetings throughout the year, particular attention in assessing such performance was given to a report for the Series prepared by Lipper Financial Services (“Lipper”), which was furnished for the contract renewal process. The Lipper report showed the investment performance of the Series’ shares for the 1, 3, 5 and 10 year periods ended September 30, 2007 and the year-to-date period ended September 30, 2007. The Board reviewed the investment performance of the Series, along with comparative performance information given for a peer group of funds and a relevant market index. The Board noted that the Series had performed above the index for the 1, 3, and 5 year periods ended September 30, 2007 and performed below the index for the 10 year and year-to-date periods ended September 30, 2007. The Series was ranked 33rd out of 49 for its peer group for the year-to-date period ended September 30, 2006.
Profitability. The Board noted that the subadvisory fee is paid by PVA and not by the Series and that the profitability of the Subadvisor was not a material consideration.
Subadvisory Fee. The Board did not receive comparative fee information of subadvisory fees but noted that the subadvisory fee is paid by PVA and not by the Series.
Economies of Scale. The Board also considered the existence of any economies of scale and whether those economies would be passed along to the Series’ shareholders, but noted that any economies would most likely be generated at the advisor level and not necessarily at the subadvisor level.
136
THE PHOENIX EDGE SERIES FUND
BOARD OF TRUSTEES’ CONSIDERATION OF INVESTMENT ADVISORY AND
SUBADVISORY AGREEMENTS FOR PHOENIX MULTI-SECTOR SHORT TERM BOND SERIES
(the “Series”)
The Board of Trustees is responsible for determining whether to approve the Fund’s advisory and subadvisory agreements. At a meeting held on November 12, 2007, the Board, including a majority of disinterested Trustees, approved the renewal of the investment advisory agreement (the “Advisory Agreement”) between Phoenix Variable Advisors, Inc. (“PVA”) and the Fund and the investment subadvisory agreement (the “Subadvisory Agreement”) between PVA and Goodwin Capital Advisers, Inc. (the “Subadvisor”). Pursuant to the Advisory Agreement between PVA and the Fund, PVA provides advisory services to the Series. Pursuant to the Subadvisory Agreement between PVA and the Subadvisor, the Subadvisor provides the day to day investment management for the Series.
During the review process, the Board received assistance and advice from, and met separately with, independent legal counsel. In approving each agreement, the Board, including a majority of disinterested Trustees, determined that the fee structure was reasonable and approving the renewals was in the best interests of the Series and its shareholders. While attention was given to all information furnished, the following discusses the primary factors relevant to the Board’s decision.
ADVISORY AGREEMENT CONSIDERATIONS
Nature, Extent and Quality of Services. The Board concluded that the nature, extent and quality of the overall services to be provided by PVA and its affiliates to the Series and its shareholders were reasonable. The Board received and reviewed substantial written information from PVA as requested. The Board’s conclusion was based, in part, upon services provided by PVA to other series of The Phoenix Edge Series Fund such as quarterly reports provided by PVA 1) comparing performance with a peer group and benchmark, 2) showing that the investment policies and restrictions were followed and 3) covering matters such as the compliance of investment personnel and other access persons with the Code of Ethics of PVA, the adherence to fair value pricing procedures established by the Board, the monitoring of portfolio compliance, information on illiquid securities and derivatives, brokerage commissions and presentations regarding the economic environment and general investment outlook. The Board noted that PVA was responsible for the general oversight of investment programs and the monitoring of subadvisor’s investment performance and their compliance with applicable laws, regulations, policies and procedures. With respect to compliance monitoring, the Board noted that PVA will require quarterly compliance certifications from the Subadvisor and will conduct compliance due diligence visits at the Subadvisor. The Board also considered the experience of PVA having acted as an investment adviser to mutual funds for 8 years, its current experience in acting as an investment adviser to 18 mutual funds, and its role under the Fund’s “manager of managers” exemptive relief under the 1940 Act. The Board also considered the transfer agent and shareholder services that are provided to Series shareholders by an affiliate of PVA, noting continuing improvements by management in the scope and quality of services and favorable reports on such service conducted by third parties.
Investment Performance. The Board placed emphasis on the investment performance of the Series in view of its importance to shareholders. In this regard, the Board considered the detailed performance review process of the Investment Performance Committee. While consideration was given to performance reports and discussions at Board meetings throughout the year, particular attention in assessing such performance was given to a report for the Series prepared by Lipper Financial Services (“Lipper”), which was furnished for the contract renewal process. The Lipper report showed the investment performance of the Series’ shares for the 1 and 3 year periods ended September 30, 2007 and the year-to-date period ended September 30, 2007. The Board reviewed the investment performance of the Series, along with comparative performance information given for a peer group of funds and a relevant market index. The Board noted that the Series had performed below the index for the year-to-date period ended September 30, 2007 and had performed above the index for the 1 and 3 year periods ended September 30, 2007. The Board noted that the Series had the best performance among its peer group for the 3 year period ended September 30, 2007. The Series was ranked 27th out of 35 for its peer group for the year-to-date period ended September 30, 2007.
Profitability. The Board reviewed the profitability analysis that addressed the overall profitability of PVA for its management of The Phoenix Edge Series Fund family, as well as its profits and that of its affiliates, for managing the Series. Specific attention was given to the methodology followed in allocating costs to the Series since allocation methodologies are inherently subjective and various allocation methodologies may each be reasonable while producing different results. In this regard, the Board noted that the allocation methodology appeared reasonable. The Board also noted the contractual reimbursements provided to the Series. The Board concluded that the expected profitability to PVA from the Series was reasonable.
Management Fee and Total Expenses. The Board also placed emphasis on the review of Series expenses. Consideration was given to a comparative analysis of the management fees and total expense ratios of the Series compared with those of a group of funds selected by Lipper as the Series’ appropriate Lipper expense peer group as of September 30, 2007. The Board noted that the total expenses of the Series were higher than the average total expenses for comparable funds and that the contractual management fee was above the median for the peer group. The Board considered the management fee and total expenses of the Series in comparison to its expense peer group as shown in the Lipper report and concluded that such fee and expenses were reasonable.
Economies of Scale. The Board noted that the management fee breakpoints based on the amount of assets under management. The Board also noted that it was likely that PVA and the Series would achieve certain economies of scale with respect to covering certain fixed costs as the assets grew. The Board concluded that shareholders would have an opportunity to benefit from these economies of scale.
137
THE PHOENIX EDGE SERIES FUND
BOARD OF TRUSTEES’ CONSIDERATION OF INVESTMENT ADVISORY AND
SUBADVISORY AGREEMENTS FOR PHOENIX MULTI-SECTOR SHORT TERM BOND SERIES
(the “Series”) (Continued)
SUBADVISORY AGREEMENT CONSIDERATIONS
Nature, Extent and Quality of Services. The Board concluded that the nature, extent and quality of the overall services to be provided by the Subadvisor to the Series and its shareholders were reasonable. In addition, the Board received from the Subadvisor and reviewed substantial written information as requested. In the course of their deliberations and evaluation of materials, the Trustees considered, among other things the following factors: the Subadvisor, its current personnel (including particularly those personnel with responsibilities for providing investment and compliance services to the Series), and its financial condition, resources and investment process; the terms of the Subadvisory Agreement, including the standard of care and termination provisions; the scope and quality of the services that Subadvisor would provide to the Series; the structure and rate of advisory fees payable to the Subadvisor by PVA, the methodology used by the Subadvisor in determining the compensation payable to portfolio managers and the competition for investment management talent; and the Subadvisor’s compliance record. The Board’s opinion was based upon the extensive experience of the portfolio managers and, in particular, their experience in managing the Series as employees of Phoenix Investment Counsel, Inc., the previous advisor for the Series. With respect to portfolio manager compensation, the Board noted that a primary factor in the Subadvisor’s determination of the amount of bonus compensation to portfolio managers was the relative investment performance of the funds that they managed which would align their interest with those of the Series’ shareholders. The Board also considered the adequacy of the Subadvisor’s compliance program, based on the information provided by the Subadvisor.
Investment Performance. The Board placed emphasis on the investment performance of the Series in view of its importance to the shareholders. While consideration was given to performance reports and discussions at Board meetings throughout the year, particular attention in assessing such performance was given to a report for the Series prepared by Lipper Financial Services (“Lipper”), which was furnished for the contract renewal process. The Lipper report showed the investment performance of the Series’ shares for the 1 and 3 year periods ended September 30, 2007 and the year-to-date period ended September 30, 2007. The Board reviewed the investment performance of the Series, along with comparative performance information for a peer group of funds and a relevant market index. The Board noted that the Series had performed below the index for the year-to-date period ended September 30, 2007 and had performed above the index for the 1 and 3 year periods ended September 30, 2007. The Board noted that the Series had the best performance among its peer group for the 3 year period ended September 30, 2007. The Series was ranked 27th out of 35 for its peer group for the year-to-date period ended September 30, 2007.
Profitability. The Board noted that the subadvisory fee is paid by PVA and not by the Series and that the profitability of the Subadvisor was not a material consideration.
Subadvisory Fee. The Board did not receive comparative fee information of subadvisory fees but noted that the subadvisory fee is paid by PVA and not by the Series.
Economies of Scale. The Board also considered the existence of any economies of scale and whether those economies would be passed along to the Series’ shareholders, but noted that any economies would most likely be generated at the advisor level and not necessarily at the subadvisor level.
138
THE PHOENIX EDGE SERIES FUND
BOARD OF TRUSTEES’ CONSIDERATION OF INVESTMENT ADVISORY AND
SUBADVISORY AGREEMENTS FOR PHOENIX STRATEGIC ALLOCATION SERIES
(the “Series”)
The Board of Trustees is responsible for determining whether to approve the Fund’s advisory and subadvisory agreements. At a meeting held on November 12, 2007, the Board, including a majority of disinterested Trustees, approved the renewal of the investment advisory agreement (the “Advisory Agreement”) between Phoenix Variable Advisors, Inc. (“PVA”) and the Fund and the investment subadvisory agreements (the “Subadvisory Agreements”) between PVA and Phoenix Investment Counsel, Inc. (“PIC”) and between PVA and Goodwin Capital Advisers, Inc. (“Goodwin” and collectively with PIC the “Subadvisors”). Pursuant to the Advisory Agreement between PVA and the Fund, PVA provides advisory services to the Series. Pursuant to the Subadvisory Agreements between PVA and the Subadvisors, the Subadvisors provide the day to day investment management for the Series.
During the review process, the Board received assistance and advice from, and met separately with, independent legal counsel. In approving each agreement, the Board, including a majority of disinterested Trustees, determined that the fee structure was reasonable and approving the renewals was in the best interests of the Series and its shareholders. While attention was given to all information furnished, the following discusses the primary factors relevant to the Board’s decision.
ADVISORY AGREEMENT CONSIDERATIONS
Nature, Extent and Quality of Services. The Board concluded that the nature, extent and quality of the overall services to be provided by PVA and its affiliates to the Series and its shareholders were reasonable. The Board received and reviewed substantial written information from PVA as requested. The Board’s conclusion was based, in part, upon services provided by PVA to other series of The Phoenix Edge Series Fund such as quarterly reports provided by PVA 1) comparing performance with a peer group and benchmark, 2) showing that the investment policies and restrictions were followed and 3) covering matters such as the compliance of investment personnel and other access persons with the Code of Ethics of PVA, the adherence to fair value pricing procedures established by the Board, the monitoring of portfolio compliance, information on illiquid securities and derivatives, brokerage commissions and presentations regarding the economic environment and general investment outlook. The Board noted that PVA was responsible for the general oversight of investment programs and the monitoring of subadvisors’ investment performance and their compliance with applicable laws, regulations, policies and procedures. With respect to compliance monitoring, the Board noted that PVA will require quarterly compliance certifications from the Subadvisors and will conduct compliance due diligence visits at the Subadvisors. The Board also considered the experience of PVA having acted as an investment adviser to mutual funds for 8 years, its current experience in acting as an investment adviser to 18 mutual funds, and its role under the Fund’s “manager of managers” exemptive relief under the 1940 Act. The Board also considered the transfer agent and shareholder services that are provided to Series shareholders by an affiliate of PVA, noting continuing improvements by management in the scope and quality of services and favorable reports on such service conducted by third parties.
Investment Performance. The Board placed emphasis on the investment performance of the Series in view of its importance to shareholders. In this regard, the Board considered the detailed performance review process of the Investment Performance Committee. While consideration was given to performance reports and discussions at Board meetings throughout the year, particular attention in assessing such performance was given to a report for the Series prepared by Lipper Financial Services (“Lipper”), which was furnished for the contract renewal process. The Lipper report showed the investment performance of the Series’ shares for the 1, 3, 5 and 10 year periods ended September 30, 2007 and the year-to-date period ended September 30, 2007. The Board reviewed the investment performance of the Series, along with comparative performance information given for a peer group of funds and a relevant market index. The Board noted that the Series performed above the index for the 10 year period ended September 30, 2007 and had performed below the index for the 1, 3, and 5 year and year-to-date periods ended September 30, 2007. The Series ranked 79th out of 131 for its peer group for the year-to-date period ended September 30, 2007.
Profitability. The Board reviewed the profitability analysis that addressed the overall profitability of PVA for its management of The Phoenix Edge Series Fund family, as well as its profits and that of its affiliates, for managing the Series. Specific attention was given to the methodology followed in allocating costs to the Series since allocation methodologies are inherently subjective and various allocation methodologies may each be reasonable while producing different results. In this regard, the Board noted that the allocation methodology appeared reasonable. The Board also noted the contractual reimbursements provided to the Series. The Board concluded that the expected profitability to PVA from the Series was reasonable.
Management Fee and Total Expenses. The Board also placed emphasis on the review of Series expenses. Consideration was given to a comparative analysis of the management fees and total expense ratios of the Series compared with those of a group of funds selected by Lipper as its appropriate Lipper expense peer group as of September 30, 2007. The Board noted that the total expenses of the Series were above the average total expenses for comparable funds, but at the median for total expenses for comparable funds. The Board noted that the contractual management fee was at the median for the peer group. The Board considered the management fee and total expenses of the Series in comparison to its peer group as shown in the Lipper report and concluded that such fee and expenses were reasonable.
Economies of Scale. The Board also noted that it was likely that PVA and the Series would achieve certain economies of scale with respect to covering certain fixed costs as the assets grew. The Board concluded that shareholders would have an opportunity to benefit from these economies of scale.
139
THE PHOENIX EDGE SERIES FUND
BOARD OF TRUSTEES’ CONSIDERATION OF INVESTMENT ADVISORY AND
SUBADVISORY AGREEMENTS FOR PHOENIX STRATEGIC ALLOCATION SERIES
(the “Series”) (Continued)
SUBADVISORY AGREEMENT CONSIDERATIONS
Nature, Extent and Quality of Services. The Board concluded that the nature, extent and quality of the overall services to be provided by the Subadvisors to the Series and its shareholders were reasonable. The Board considered the division of the Series assets to be managed by the Subadvisors. Specifically, PIC will manage the equity assets, and Goodwin will manage the fixed assets. In addition, the Board received from the Subadvisors and reviewed substantial written information as requested. In the course of their deliberations and evaluation of materials, the Trustees considered, among other things the following factors: the Subadvisors, their current personnel (including particularly those personnel with responsibilities for providing investment and compliance services to the Series), and their financial condition, resources and investment process; the terms of the Subadvisory Agreements, including the standard of care and termination provisions; the scope and quality of the services that the Subadvisors would provide to the Series; the structure and rate of advisory fees payable to the Subadvisors by PVA, the methodology used by the Subadvisors in determining the compensation payable to portfolio managers and the competition for investment management talent; and the Subadvisors’ compliance record. The Board’s opinion was based upon the extensive experience of the Subadvisors and the portfolio managers. The Board also considered PIC’s experience as the previous advisor for the Series. With respect to portfolio manager compensation, the Board noted that a primary factor in the Subadvisors’ determination of the amount of bonus compensation to portfolio managers was the relative investment performance of the funds that they managed which would align their interests with those of the Series’ shareholders. The Board also considered the adequacy of the Subadvisors’ compliance program, based on the information provided by the Subadvisors.
Investment Performance. The Board placed emphasis on the investment performance of the Series in view of its importance to the shareholders. While consideration was given to performance reports and discussions at Board meetings throughout the year, particular attention in assessing such performance was given to a report for the Series prepared by Lipper Financial Services (“Lipper”), which was furnished for the contract renewal process. The Lipper report showed the investment performance of the Series’ shares for the 1, 3, 5 and 10 year periods ended September 30, 2007 and the year-to-date period ended September 30, 2007. The Board reviewed the investment performance of the Series, along with comparative performance information given for a peer group of funds and a relevant market index. The Board noted that the Series performed above the index for the 10 year period ended September 30, 2007 and had performed below the index for the 1, 3, and 5 year and year-to-date periods ended September 30, 2007. The Series was ranked 79th out of 131 for its peer group for the year-to-date period ended September 30, 2007.
Profitability. The Board noted that the subadvisory fee is paid by PVA and not by the Series and that the profitability of the Subadvisor was not a material consideration.
Subadvisory Fee. The Board did not receive comparative fee information of subadvisory fees but noted that the subadvisory fee is paid by PVA and not by the Series.
Economies of Scale. The Board also considered the existence of any economies of scale and whether those economies would be passed along to the Series’ shareholders, but noted that any economies would most likely be generated at the advisor level and not necessarily at the subadvisor level.
140
THE PHOENIX EDGE SERIES FUND
BOARD OF TRUSTEES’ CONSIDERATION OF INVESTMENT ADVISORY AND
SUBADVISORY AGREEMENTS FOR PHOENIX-ABERDEEN INTERNATIONAL SERIES
(the “Series”)
The Board of Trustees is responsible for determining whether to approve the Fund’s advisory and subadvisory agreements. At a meeting held on November 12, 2007, the Board, including a majority of disinterested Trustees, approved the renewal of the investment advisory agreement (the “Advisory Agreement”) between Phoenix Variable Advisors, Inc. (“PVA”) and the Fund and the investment subadvisory agreement (the “Subadvisory Agreement”) between PVA and Aberdeen Asset Management Inc. (the “Subadvisor”). Pursuant to the Advisory Agreement between PVA and the Fund, PVA provides advisory services to the Series. Pursuant to the Subadvisory Agreement between PVA and the Subadvisor, the Subadvisor provides the day to day investment management for the Series.
During the review process, the Board received assistance and advice from, and met separately with, independent legal counsel. In approving each agreement, the Board, including a majority of disinterested Trustees, determined that the fee structure was reasonable and approving the renewals was in the best interests of the Series and its shareholders. While attention was given to all information furnished, the following discusses the primary factors relevant to the Board’s decision.
ADVISORY AGREEMENT CONSIDERATIONS
Nature, Extent and Quality of Services. The Board concluded that the nature, extent and quality of the overall services to be provided by PVA and its affiliates to the Series and its shareholders were reasonable. The Board received and reviewed substantial written information from PVA as requested. The Board’s conclusion was based, in part, upon services provided by PVA to other series of The Phoenix Edge Series Fund such as quarterly reports provided by PVA 1) comparing performance with a peer group and benchmark, 2) showing that the investment policies and restrictions were followed and 3) covering matters such as the compliance of investment personnel and other access persons with the Code of Ethics of PVA, the adherence to fair value pricing procedures established by the Board, the monitoring of portfolio compliance, information on illiquid securities and derivatives, brokerage commissions and presentations regarding the economic environment and general investment outlook. The Board noted that PVA was responsible for the general oversight of investment programs and the monitoring of subadvisor’s investment performance and their compliance with applicable laws, regulations, policies and procedures. With respect to compliance monitoring, the Board noted that PVA will require quarterly compliance certifications from the Subadvisor and will conduct compliance due diligence visits at the Subadvisor. The Board also considered the experience of PVA having acted as an investment adviser to mutual funds for 8 years, its current experience in acting as an investment adviser to 18 mutual funds, and its role under the Fund’s “manager of managers” exemptive relief under the 1940 Act. The Board also considered the transfer agent and shareholder services that are provided to Series shareholders by an affiliate of PVA, noting continuing improvements by management in the scope and quality of services and favorable reports on such service conducted by third parties.
Investment Performance. The Board placed emphasis on the investment performance of the Series in view of its importance to shareholders. In this regard, the Board considered the detailed performance review process of the Investment Performance Committee. While consideration was given to performance reports and discussions at Board meetings throughout the year, particular attention in assessing such performance was given to a report for the Series prepared by Lipper Financial Services (“Lipper”), which was furnished for the contract renewal process. The Lipper report showed the investment performance of the Series’ shares for the 1, 3, 5 and 10 year periods ended September 30, 2007 and the year-to-date period ended September 30, 2007. The Board reviewed the investment performance of the Series, along with comparative performance information given for a peer group of funds and a relevant market index. The Board noted that the Series had performed above the index for the 3 and 10 year periods ended September 30, 2007 and had performed below the index for the 1 and 5 year and year-to-date periods ended September 30, 2007. The Series was ranked 96th out of 136 for its peer group for the year-to-date period ended September 30, 2007.
Profitability. The Board reviewed the profitability analysis that addressed the overall profitability of PVA for its management of The Phoenix Edge Series Fund family, as well as its profits and that of its affiliates, for managing the Series. Specific attention was given to the methodology followed in allocating costs to the Series, since allocation methodologies are inherently subjective and various allocation methodologies may each be reasonable while producing different results. In this regard, the Board noted that the allocation methodology appeared reasonable. The Board also noted the contractual reimbursements provided to the Series. The Board concluded that the expected profitability to PVA from the Series was reasonable.
Management Fee and Total Expenses. The Board also placed emphasis on the review of Series expenses. Consideration was given to a comparative analysis of the management fees and total expense ratios of the Series compared with those of a group of funds selected by Lipper as the Series’ appropriate Lipper expense peer group as of September 30, 2007. The Board noted that the actual total expenses of the Series were below the median average total expenses for comparable funds and that the contractual management fee was below the median for the peer group. The Board considered the management fee and total expenses of the Series in comparison to its peer group as shown in the Lipper report and concluded that such fee and expenses were reasonable.
Economies of Scale. The Board noted that it was likely that PVA and the Series would achieve certain economies of scale with respect to covering certain fixed costs as the assets grew. The Board concluded that shareholders would have an opportunity to benefit from these economies of scale.
141
THE PHOENIX EDGE SERIES FUND
BOARD OF TRUSTEES’ CONSIDERATION OF INVESTMENT ADVISORY AND
SUBADVISORY AGREEMENTS FOR PHOENIX-ABERDEEN INTERNATIONAL SERIES
(the “Series”) (Continued)
SUBADVISORY AGREEMENT CONSIDERATIONS
Nature, Extent and Quality of Services. The Board concluded that the nature, extent and quality of the overall services to be provided by the Subadvisor to the Series and its shareholders were reasonable. In addition, the Board received from the Subadvisor and reviewed substantial written information as requested. In the course of their deliberations and evaluation of materials, the Trustees considered, among other things the following factors: the Subadvisor, its current personnel (including particularly those personnel with responsibilities for providing investment and compliance services to the Series), and its financial condition, resources and investment process; the terms of the subadvisory agreement, including the standard of care and termination provisions; the scope and quality of the services that Subadvisor would provide to the Series; the structure and rate of advisory fees payable to the Subadvisor by PVA, the methodology used by the Subadvisor in determining the compensation payable to portfolio managers and the competition for investment management talent; and the Subadvisor’s compliance record. The Board’s opinion was based, in part, upon the extensive experience of the Subadvisor and the portfolio managers. In this regard, the Board noted that the portfolio management team has many years of experience in the investment management business. With respect to portfolio manager compensation, the Board noted that a primary factor in the Subadvisor’s determination of the amount of bonus compensation to portfolio managers was the relative investment performance of the funds that they managed, which would align their interests with those of the Series’ shareholders. The Board also considered the adequacy of the Subadvisor’s compliance program, based on the information provided by the Subadvisor.
Investment Performance. The Board placed emphasis on the investment performance of the Series in view of its importance to the shareholders. While consideration was given to performance reports and discussions at Board meetings throughout the year, particular attention in assessing such performance was given to a report for the Series prepared by Lipper Financial Services (“Lipper”), which was furnished for the contract renewal process. The Lipper report showed the investment performance of the Series’ shares for the 1, 3, 5 and 10 year periods ended September 30, 2007 and the year-to-date period ended September 30, 2007. The Board reviewed the investment performance of the Series, along with comparative performance information given for a peer group of funds and a relevant market index. The Board noted that the Series had performed above the index for the 3 and 10 year periods ended September 30, 2007 and had performed below the index for the 1 and 5 year and year-to-date periods ended September 30, 2007. The Series was ranked 96th out of 136 for its peer group for the year-to-date ended September 30, 2007.
Profitability. The Board noted that the subadvisory fee is paid by PVA and not by the Series and that the profitability of the Subadvisor was not a material consideration.
Subadvisory Fee. The Board did not receive comparative fee information of subadvisory fees but noted that the subadvisory fee is paid by PVA and not by the Series.
Economies of Scale. The Board also considered the existence of any economies of scale and whether those economies would be passed along to the Series’ shareholders, but noted that any economies would most likely be generated at the advisor level and not necessarily at the subadvisor level.
142
THE PHOENIX EDGE SERIES FUND
BOARD OF TRUSTEES’ CONSIDERATION OF INVESTMENT ADVISORY AND
SUBADVISORY AGREEMENTS FOR PHOENIX-ALGER SMALL-CAP GROWTH SERIES
(the “Series”)
The Board of Trustees is responsible for determining whether to approve the Fund’s advisory and subadvisory agreements. At a meeting held on November 12, 2007, the Board, including a majority of disinterested Trustees, approved the renewal of the investment advisory agreement (the “Advisory Agreement”) between Phoenix Variable Advisors, Inc. (“PVA”) and the Fund and the investment subadvisory agreement (the “Subadvisory Agreement”) between PVA and Fred Alger Management, Inc. (the “Subadvisor”). Pursuant to the Advisory Agreement between PVA and the Fund, PVA provides advisory services to the Series. Pursuant to the Subadvisory Agreement between PVA and the Subadvisor, the Subadvisor provides the day to day investment management for the Series.
During the review process, the Board received assistance and advice from, and met separately with, independent legal counsel. In approving each agreement, the Board, including a majority of disinterested Trustees, determined that the fee structure was reasonable and approving the renewals was in the best interests of the Series and its shareholders. While attention was given to all information furnished, the following discusses the primary factors relevant to the Board’s decision.
ADVISORY AGREEMENT CONSIDERATIONS
Nature, Extent and Quality of Services. The Board concluded that the nature, extent and quality of the overall services to be provided by PVA and its affiliates to the Series and its shareholders were reasonable. The Board received and reviewed substantial written information from PVA as requested. The Board’s conclusion was based, in part, upon services provided by PVA to other Series of The Phoenix Edge Series Fund such as quarterly reports provided by PVA 1) comparing performance with a peer group and benchmark, 2) showing that the investment policies and restrictions were followed and 3) covering matters such as the compliance of investment personnel and other access persons with the Code of Ethics of PVA, the adherence to fair value pricing procedures established by the Board, the monitoring of portfolio compliance, information on illiquid securities and derivatives, brokerage commissions and presentations regarding the economic environment and general investment outlook. The Board noted that PVA was responsible for the general oversight of investment programs and the monitoring of subadvisor’s investment performance and their compliance with applicable laws, regulations, policies and procedures. With respect to compliance monitoring, the Board noted that PVA will require quarterly compliance certifications from the Subadvisor and will conduct compliance due diligence visits at the Subadvisor. The Board also considered the experience of PVA having acted as an investment adviser to mutual funds for 8 years, its current experience in acting as an investment adviser to over 18 mutual funds, and its role under the Fund’s “manager of managers” exemptive relief under the 1940 Act. The Board also considered the transfer agent and shareholder services that are provided to Series shareholders by an affiliate of PVA, noting continuing improvements by management in the scope and quality of services and favorable reports on such service conducted by third parties.
Investment Performance. The Board placed emphasis on the investment performance of the Series in view of its importance to shareholders. In this regard, the Board considered the detailed performance review process of the Investment Performance Committee. While consideration was given to performance reports and discussions at Board meetings throughout the year, particular attention in assessing such performance was given to a report for the Series prepared by Lipper Financial Services (“Lipper”), which was furnished for the contract renewal process. The Lipper report showed the investment performance of the Series’ shares for the 1, 3, and 5 year periods ended September 30, 2007 and the year-to-date period ended September 30, 2007. The Board reviewed the investment performance of the Series, along with the comparative performance information given for a peer group of funds and a relevant market index. The Board noted that the Series had performed above the index for all periods. The Board also noted that it placed 20th among 103 in its peer group for the year-to-date period ended September 30, 2007.
Profitability. The Board reviewed the profitability analysis that addressed the overall profitability of PVA for its management of The Phoenix Edge Series Fund family, as well as its profits and that of its affiliates, for managing the Series. Specific attention was given to the methodology followed in allocating costs to the Series, since allocation methodologies are inherently subjective and various allocation methodologies may each be reasonable while producing different results. In this regard, the Board noted that the allocation appeared reasonable. The Board also noted the voluntary reimbursements provided to the Fund. The Board concluded that the profitability to PVA from the Series was reasonable.
Management Fee and Total Expenses. The Board also placed emphasis on the review of Series expenses. Consideration was given to a comparative analysis of the management fees and total expense ratios of the Series compared with those of a group of funds selected by Lipper as the Series’ appropriate Lipper expense peer group as of September 30, 2007. The Board noted that the actual total expenses of the Series were below the average total expenses for comparable funds and the contractual management fee was slightly higher compared to the median for the peer group. The Board was satisfied with the management fee and total expenses for the Series in comparison to its peer group as shown in the Lipper report and concluded that such fee and expenses were reasonable.
Economies of Scale. The Board noted that it was likely that PVA and the Series would achieve certain economies of scale in order to cover certain fixed costs as the assets grew. The Board concluded that shareholders would have an opportunity to benefit from these economies of scale.
143
THE PHOENIX EDGE SERIES FUND
BOARD OF TRUSTEES’ CONSIDERATION OF INVESTMENT ADVISORY AND
SUBADVISORY AGREEMENTS FOR PHOENIX-ALGER SMALL-CAP GROWTH SERIES
(the “Series”) (Continued)
SUBADVISORY AGREEMENT CONSIDERATIONS
Nature, Extent and Quality of Services. The Board concluded that the nature, extent and quality of the overall services that are provided by the Subadvisor to the Series and its shareholders were reasonable. In addition, the Board received from the Subadvisor and reviewed substantial written information as requested. In the course of their deliberations and evaluation of materials, the Trustees considered, among other things the following factors: the Subadvisor, its current personnel (including particularly those personnel with responsibilities for providing investment and compliance services to the Series), and its financial condition, resources and investment process; the terms of the subadvisory agreement, including the standard of care and termination provisions; the scope and quality of the services that Subadvisor would provide to the Series; the structure and rate of advisory fees payable to Subadvisor by PVA, the methodology used by Subadvisor in determining the compensation payable to portfolio managers and the competition for investment management talent; and the Subadvisor’s compliance record. The Board’s opinion was based, in part, upon the extensive experience of the Subadvisor and the portfolio managers. In this regard, the Board noted that the portfolio management team has many years of experience in the investment management business. With respect to portfolio manager compensation, the Board noted that a primary factor in the Subadvisor’s determination of the amount of bonus compensation to portfolio managers was the relative investment performance of the funds that they managed which would align their interests with those of the Series’ shareholders. The Board also considered the adequacy of the Subadvisor’s compliance program, based on the information provided by the Subadvisor.
Investment Performance. The Board placed emphasis on the investment performance of the Series in view of its importance to shareholders. In this regard, the Board considered the detailed performance review process of the Investment Performance Committee. While consideration was given to performance reports and discussions at Board meetings throughout the year, particular attention in assessing such performance was given to a report of the Series prepared by Lipper Financial Services (“Lipper”), which was furnished for the contract renewal process. The Lipper report showed the investment performance of the Series’ shares for the 1, 3, and 5 year periods ended September 30, 2007 and the year-to-date period ended September 30, 2007. The Board reviewed the investment performance of the Series, along with comparative performance information given for a peer group of funds and a relevant market index. The Board noted that the Series had performed above the index for all periods. The Board also noted that it placed 20th among 103 in its peer group for the year-to-date period.
Profitability. The Board noted that the subadvisory fee is paid by PVA and not the Series.
Subadvisory Fee. The Board did not receive comparative fee information of subadvisory fees but noted that the subadvisory fee is paid by PVA and not by the Series.
Economies of Scale. The Board also considered the existence of any economies of scale and whether those economies would be passed along to the Series’ shareholders but noted that any economies would most likely be generated at the advisor level and not necessarily at the subadvisor level.
144
THE PHOENIX EDGE SERIES FUND
BOARD OF TRUSTEES’ CONSIDERATION OF INVESTMENT ADVISORY AND
SUBADVISORY AGREEMENTS FOR PHOENIX-DUFF & PHELPS REAL ESTATE SECURITIES
SERIES (the “Series”)
The Board of Trustees is responsible for determining whether to approve the Fund’s advisory and subadvisory agreements. At a meeting held on November 12, 2007, the Board, including a majority of disinterested Trustees, approved the renewal of the investment advisory agreement (the “Advisory Agreement”) between Phoenix Variable Advisors, Inc. (“PVA”) and the Fund and the investment subadvisory agreement (the “Subadvisory Agreement”) between PVA and Duff & Phelps Investment Management Company (the “Subadvisor”). Pursuant to the Advisory Agreement between PVA and the Fund, PVA provides advisory services to the Series. Pursuant to the Subadvisory Agreement between PVA and the Subadvisor, the Subadvisor provides the day to day investment management for the Series.
During the review process, the Board received assistance and advice from, and met separately with, independent legal counsel. In approving each agreement, the Board, including a majority of disinterested Trustees, determined that the fee structure was reasonable and approving the renewals was in the best interests of the Series and its shareholders. While attention was given to all information furnished, the following discusses the primary factors relevant to the Board’s decision.
ADVISORY AGREEMENT CONSIDERATIONS
Nature, Extent and Quality of Services. The Board concluded that the nature, extent and quality of the overall services to be provided by PVA and its affiliates to the Series and its shareholders were reasonable. The Board received and reviewed substantial written information from PVA as requested. The Board’s conclusion was based, in part, upon services provided by PVA to other series of The Phoenix Edge Series Fund such as quarterly reports provided by PVA 1) comparing performance with a peer group and benchmark, 2) showing that the investment policies and restrictions were followed and 3) covering matters such as the compliance of investment personnel and other access persons with the Code of Ethics of PVA, the adherence to fair value pricing procedures established by the Board, the monitoring of portfolio compliance, information on illiquid securities and derivatives, brokerage commissions and presentations regarding the economic environment and general investment outlook. The Board noted that PVA was responsible for the general oversight of investment programs and the monitoring of subadvisor’s investment performance and their compliance with applicable laws, regulations, policies and procedures. With respect to compliance monitoring, the Board noted that PVA will require quarterly compliance certifications from the Subadvisor and will conduct compliance due diligence visits at the Subadvisor. The Board also considered the experience of PVA having acted as an investment adviser to mutual funds for 8 years, its current experience in acting as an investment adviser to 18 mutual funds, and its role under the Fund’s “manager of managers” exemptive relief under the 1940 Act. The Board also considered the transfer agent and shareholder services that are provided to Series shareholders by an affiliate of PVA, noting continuing improvements by management in the scope and quality of services and favorable reports on such service conducted by third parties.
Investment Performance. The Board placed emphasis on the investment performance of the Series in view of its importance to shareholders. In this regard, the Board considered the detailed performance review process of the Investment Performance Committee. While consideration was given to performance reports and discussions at Board meetings throughout the year, particular attention in assessing such performance was given to a report for the Series prepared by Lipper Financial Services (“Lipper”), which was furnished for the contract renewal process. The Lipper report showed the investment performance of the Series’ shares for the 1, 3, 5 and 10 year periods ended September 30, 2007 and the year-to-date period ended September 30, 2007. The Board reviewed the investment performance of the Series, along with the comparative performance information given for a peer group of funds and a relevant market index. The Board noted that the Series had performed above the index and the Lipper peer group average for the 3, 5, and 10 year periods ended September 30, 2007 and was just slightly below the index for the 1 year period ended September 30, 2007. The Series was ranked 33rd out of 60 for its peer group for the year-to-date period ended September 30, 2007.
Profitability. The Board reviewed the profitability analysis that addressed the overall profitability of PVA for its management of The Phoenix Edge Series Fund family, as well as its profits and that of its affiliates, for managing the Series. Specific attention was given to the methodology followed in allocating costs to the Series, since allocation methodologies are inherently subjective and various allocation methodologies may each be reasonable while producing different results. In this regard, the Board noted that the allocation methodology appeared reasonable. The Board also noted the contractual reimbursements provided to the Series. The Board concluded that the expected profitability to PVA from the Series was reasonable.
Management Fee and Total Expenses. The Board also placed emphasis on the review of Series expenses. Consideration was given to a comparative analysis of the management fees and total expense ratios of the Series compared with those of a group of funds selected by Lipper as the Series’ appropriate Lipper expense peer group as of September 30, 2007. The Board noted that the total expenses of the Series were higher than the average total expenses for comparable funds, and the contractual management fee was slightly higher than the median for the peer group. The Board considered the management fee and total expenses of the Series in comparison to its peer group as shown in the Lipper report and concluded that such fee and expenses were reasonable.
Economies of Scale. The Board noted that it was likely that PVA and the Series would achieve certain economies of scale with respect to covering certain fixed costs as the assets grew. The Board concluded that shareholders would have an opportunity to benefit from these economies of scale.
145
THE PHOENIX EDGE SERIES FUND
BOARD OF TRUSTEES’ CONSIDERATION OF INVESTMENT ADVISORY AND
SUBADVISORY AGREEMENTS FOR PHOENIX-DUFF & PHELPS REAL ESTATE SECURITIES
SERIES (the “Series”) (Continued)
SUBADVISORY AGREEMENT CONSIDERATIONS
Nature, Extent and Quality of Services. The Board concluded that the nature, extent and quality of the overall services to be provided by the Subadvisor to the Series and its shareholders were reasonable. In addition, the Board received from the Subadvisor and reviewed substantial written information as requested. In the course of their deliberations and evaluation of materials, the Trustees considered, among other things the following factors: the Subadvisor, its current personnel (including particularly those personnel with responsibilities for providing investment and compliance services to the Series), and its financial condition, resources and investment process; the terms of the subadvisory agreement, including the standard of care and termination provisions; the scope and quality of the services that the Subadvisor would provide to the Series; the structure and rate of advisory fees payable to the Subadvisor by PVA, the methodology used by the Subadvisor in determining the compensation payable to portfolio managers and the competition for investment management talent; and the Subadvisor’s compliance records. The Board’s opinion was based upon the extensive experience of the Subadvisor and the portfolio managers and the experience the Subadvisor had as the previous advisor for the Series. With respect to portfolio manager compensation, the Board noted that a primary factor in the Subadvisor’s determination of the amount of bonus compensation to portfolio managers was the relative investment performance of the funds that they managed which would align their interests with those of the Series’ shareholders. The Board also considered the adequacy of the Subadvisor’s compliance program, based on the information provided by the Subadvisor.
Investment Performance. The Board placed emphasis on the investment performance of the Series in view of its importance to the shareholders. While consideration was given to performance reports and discussions at Board meetings throughout the year, particular attention in assessing such performance was given to a report for the Series prepared by Lipper Financial Services (“Lipper”), which was furnished for the contract renewal process. The Lipper report showed the investment performance of the Series’ shares for 1, 3, 5 and 10 year periods ended September 30, 2007 and the year-to-date period ended September 30, 2007. The Board reviewed the investment performance of the Series, along with comparative performance information given for a peer group of funds and a relevant market index. The Board noted that the Series had performed above the index and the Lipper peer group average for the 3, 5, and 10 year periods ended September 30, 2007 and was just slightly below the index for the 1 year period and year-to-date period ended September 30, 2007. The Series was ranked 33rd out of 60 for its peer group for the year-to-date period ended September 30, 2007.
Profitability. The Board noted that the subadvisory fee is paid by PVA and not by the Series and that the profitability of the Subadvisor was not a material consideration.
Subadvisory Fee. The Board did not receive comparative fee information of subadvisory fees but noted that the subadvisory fee is paid by PVA and not by the Series.
Economies of Scale. The Board also considered the existence of any economies of scale and whether those economies would be passed along to the Series’ shareholders, but noted that any economies would most likely be generated at the advisor level and not necessarily at the subadvisor level.
146
THE PHOENIX EDGE SERIES FUND
BOARD OF TRUSTEES’ CONSIDERATION OF INVESTMENT ADVISORY AND
SUBADVISORY AGREEMENTS FOR PHOENIX-S&P DYNAMIC ALLOCATION SERIES:
AGGRESSIVE GROWTH (the “Series”)
The Board of Trustees is responsible for determining whether to approve the Series’ advisory and subadvisory agreements. At a meeting held on November 12, 2007, the Board, including a majority of the independent Trustees, approved the renewal of the investment advisory agreement (the “Advisory Agreement”) between Phoenix Variable Advisors, Inc. (“PVA”) and the Fund and the investment subadvisory agreement (the “Subadvisory Agreement”) between PVA and Standard & Poor’s Investment Advisory Services LLC (“SPIAS”) (the “Subadvisor”). Pursuant to the Advisory Agreement, PVA and the Fund, PVA provides advisory services to the Series. Pursuant to the Subadvisory Agreement between PVA and Subadvisor, the Subadvisor provides the day-to-day investment management for the Series.
During the review process, the Board received assistance and advice from, and met separately with, independent legal counsel. In approving each agreement, the Board, including a majority of the Independent Trustees, determined that the fee structure was reasonable and that approval of each agreement was in the best interests of the Series and its shareholders. While attention was given to all information furnished, the following discusses the primary factors relevant to the Board’s decision.
Nature, Extent and Quality of Services. The Board concluded that the nature, extent and quality of the overall services to be provided by PVA and its affiliates to the Series and its shareholders were reasonable. The Board’s conclusion was based, in part, upon services provided to the series such as quarterly reports provided by PVA 1) comparing performance with a peer group and benchmark, 2) showing that the investment policies and restrictions were followed and 3) covering matters such as the compliance of investment personnel and other access persons with the Code of Ethics of PVA, the adherence to fair value pricing procedures established by the Board, the monitoring of portfolio compliance, information on illiquid securities and derivatives, brokerage commissions and presentations regarding the economic environment and general investment outlook. The Board noted that PVA was responsible for the general oversight of investment programs and the monitoring of the Subadvisor’s investment performance and their compliance with applicable laws, regulations, policies and procedures. With respect to compliance monitoring, the Board noted that PVA required quarterly compliance certifications from the Subadvisor and conducted compliance due diligence visits at the Subadvisor. The Board also considered the experience of PVA having acted as an investment adviser to mutual funds for 8 years, its current experience in acting as an investment adviser to 18 mutual funds, and its role under the Fund’s “manager of managers” exemptive relief under the 1940 Act. The Board also considered the transfer agent and shareholder services that are provided to Series’ shareholders by an affiliate of PVA, noting continuing improvements by management in the scope and quality of services and favorable reports on such service conducted by third parties.
Investment Performance. The Board placed emphasis on the investment performance of the Series in view of its importance to shareholders. While consideration was given to performance reports and discussions at Board meetings throughout the year, particular attention in assessing such performance was given to a report for the Series prepared by Lipper Financial Services (“Lipper”), which was furnished for the contract renewal process. The Lipper report showed the investment performance for the Series’ shares for the one year period ended September 30, 2007 and the year-to-date period ended September 30, 2007. The Board reviewed the investment performance of the Series, along with comparative performance information given for a peer group of funds and a relevant market index. The Board noted that the Series had performed above the index for all periods. The Series was ranked 27th out of 176 for its peer group for the year-to-date period ended September 30, 2007.
Profitability. The Board also considered the level of profits realized by PVA and its affiliates in connection with the operation of the Series. In this regard, the Board reviewed the Series profitability analysis that addressed the overall profitability of PVA for its management of The Phoenix Edge Series Fund family, as well as its profits and that of its affiliates, for managing the Series. Specific attention was given to the methodology followed in allocating costs to the Series, since allocation methodologies are inherently subjective and various allocation methodologies may each be reasonable while producing different results. In this result, the Board noted that the allocation profitability to PVA from the Series was reasonable.
Management Fee and Total Expenses. The Board also placed emphasis on the review of Series expenses. Consideration was given to a comparative analysis of the management fees and total expense ratios of the Series compared with those of a group of funds selected by Lipper as the Series’ appropriate Lipper expense peer group as of September 30, 2007. The Board noted that the total expenses of the Series were below the average total expenses for comparable funds and the contractual management fee was slightly lower than the median for the peer group. The Board was satisfied with the management fee and total expenses of the Series in comparison to its peer group as shown in the Lipper report and concluded that the profitability to PVA from the Series was reasonable.
Economies of Scale. The Board noted that it was likely that PVA and the Series would achieve certain economies of scale as the assets grow covering certain fixed costs. The Board concluded that shareholders would have an opportunity to benefit from these economies of scale.
147
THE PHOENIX EDGE SERIES FUND
BOARD OF TRUSTEES’ CONSIDERATION OF INVESTMENT ADVISORY AND
SUBADVISORY AGREEMENTS FOR PHOENIX-S&P DYNAMIC ALLOCATION SERIES:
AGGRESSIVE GROWTH (the “Series”) (Continued)
SUBADVISORY AGREEMENT CONSIDERATIONS
Nature, Extent and Quality of Services. The Board concluded that the nature, extent and quality of the overall services that were to be provided by the Subadvisor to the Series and its shareholders were reasonable. In addition, they received from Subadvisor and reviewed substantial written information as requested. In the course of deliberations and evaluations of materials, the Trustees considered, among other things the following factors: the Subadvisor, its current personnel (including particularly those personnel with responsibilities for providing investment and compliance services to the Series), and its financial condition, resources and investment process; the terms of the subadvisory agreement, including the standard of care and termination and provisions; the scope and quality of the services that Subadvisor would provide to the Series; the structure and rate of advisory fees payable to Subadvisor to PVA, the methodology used by Subadvisor in determining the compensation payable to portfolio managers and the competition for investment management talent; and the Subadvisor’s compliance record. The Board’s opinion was based, in part, upon the experience of the Subadvisor and the portfolio managers. With respect to portfolio manager compensation, the Board noted that a primary factor in the Subadvisor’s determination of the amount of bonus compensation to portfolio managers was the relative investment performance of the funds that they managed which would align their interests with those of the Series’ shareholders. The Board also considered the adequacy of the Subadvisor’s compliance program, based on the information provided by the Subadvisor.
Investment Performance. The Board placed emphasis on the investment performance of the Series in view of its importance to shareholders. While consideration was given to performance reports and discussions at Board meetings throughout the year, particular attention in assessing such performance was given to a report for the Series prepared by Lipper Financial Services (“Lipper”), which was furnished for the contract renewal process. The Lipper report showed the investment performance of the Series’ shares for the one year period ended September 30, 2007 and year-to-date period ended September 30, 2007. The Board reviewed the investment performance of the Series, along with comparative performance information given for a peer group of funds and a relevant market index. The Board noted that the Series had performed above the index for all the periods. The Series was ranked 27th out of 176 for its peer group for the year-to-date period ended September 30, 2007.
Profitability. The Board did not consider profitability information for the Subadvisor noting that the subadvisory fee is pay by PVA and not the Series.
Subadvisory Fee. The Board considered that the subadvisory fee is paid by PVA and not by the Series.
Economies of Scale. The Board also considered the existence of any economies of scale and whether those economies would be passed along to the Series’ shareholders but noted that any economies would most likely be generated at the series level and not necessarily at the subadvisor level.
148
THE PHOENIX EDGE SERIES FUND
BOARD OF TRUSTEES’ CONSIDERATION OF INVESTMENT ADVISORY AND
SUBADVISORY AGREEMENTS FOR PHOENIX-S&P DYNAMIC ALLOCATION SERIES: GROWTH
(the “Series”)
The Board of Trustees is responsible for determining whether to approve the Series’ advisory and subadvisory agreements. At a meeting held on November 12, 2007, the Board, including a majority of the independent Trustees, approved the renewal of the investment advisory agreement (the “Advisory Agreement”) between Phoenix Variable Advisors, Inc. (“PVA”) and the Fund and the investment subadvisory agreement (the “Subadvisory Agreement”) between PVA and Standard & Poor’s Investment Advisory Services LLC (“SPIAS”) (the “Subadvisor”). Pursuant to the Advisory Agreement, PVA and the Fund, PVA provides advisory services to the Series. Pursuant to the Subadvisory Agreement between PVA and Subadvisor, the Subadvisor provides the day-to-day investment management for the Series.
During the review process, the Board received assistance and advice from, and met separately with, independent legal counsel. In approving each agreement, the Board, including a majority of the Independent Trustees, determined that the fee structure was reasonable and that approval of each agreement was in the best interests of the Series and its shareholders. While attention was given to all information furnished, the following discusses the primary factors relevant to the Board’s decision.
Nature, Extent and Quality of Services. The Board concluded that the nature, extent and quality of the overall services to be provided by PVA and its affiliates to the Series and its shareholders were reasonable. The Board’s conclusion was based, in part, upon services provided to the series such as quarterly reports provided by PVA 1) comparing performance with a peer group and benchmark, 2) showing that the investment policies and restrictions were followed and 3) covering matters such as the compliance of investment personnel and other access persons with the Code of Ethics of PVA, the adherence to fair value pricing procedures established by the Board, the monitoring of portfolio compliance, information on illiquid securities and derivatives, brokerage commissions and presentations regarding the economic environment and general investment outlook. The Board noted that PVA was responsible for the general oversight of investment programs and the monitoring of the Subadvisor’s investment performance and their compliance with applicable laws, regulations, policies and procedures. With respect to compliance monitoring, the Board noted that PVA required quarterly compliance certifications from the Subadvisor and conducted compliance due diligence visits at the Subadvisor. The Board also considered the experience of PVA having acted as an investment adviser to mutual funds for 8 years, its current experience in acting as an investment adviser to 18 mutual funds, and its role under the Fund’s “manager of managers” exemptive relief under the 1940 Act. The Board also considered the transfer agent and shareholder services that are provided to Series’ shareholders by an affiliate of PVA, noting continuing improvements by management in the scope and quality of services and favorable reports on such service conducted by third parties.
Investment Performance. The Board placed emphasis on the investment performance of the Series in view of its importance to shareholders. While consideration was given to performance reports and discussions at Board meetings throughout the year, particular attention in assessing such performance was given to a report for the Series prepared by Lipper Financial Services (“Lipper”), which was furnished for the contract renewal process. The Lipper report showed the investment performance for the Series’ shares for the one year period ended September 30, 2007 and the year-to-date period ended September 30, 2007. The Board reviewed the investment performance of the Series, along with comparative performance information given for a peer group of funds and a relevant market index. The Board noted that the Series had performed above the index for both periods. The Series was ranked 86th out of 216 for its peer group for the year-to-date period ended September 30, 2007.
Profitability. The Board also considered the level of profits realized by PVA and its affiliates in connection with the operation of the Series. In this regard, the Board reviewed the Series profitability analysis that addressed the overall profitability of PVA for its management of The Phoenix Edge Series Fund family, as well as its profits and that of its affiliates, for managing the Series. Specific attention was given to the methodology followed in allocating costs to the Series, since allocation methodologies are inherently subjective and various allocation methodologies may each be reasonable while producing different results. In this result, the Board noted that the allocation profitability to PVA from the Series was reasonable.
Management Fee and Total Expenses. The Board also placed emphasis on the review of Series expenses. Consideration was given to a comparative analysis of the management fees and total expense ratios of the Series compared with those of a group of funds selected by Lipper as the Series’ appropriate Lipper expense peer group as of September 30, 2007. The Board noted that the total expenses of the Series were below the average of total expenses for comparable funds and the contractual management fee was slightly lower than the median for the peer group. The Board was satisfied with the management fee and total expenses of the Series in comparison to its peer group as shown in the Lipper report and concluded that the profitability to PVA from the Series was reasonable.
Economies of Scale. The Board noted that it was likely that PVA and the Series would achieve certain economies of scale as the assets grow covering certain fixed costs. The Board concluded that shareholders would have an opportunity to benefit from these economies of scale.
149
THE PHOENIX EDGE SERIES FUND
BOARD OF TRUSTEES’ CONSIDERATION OF INVESTMENT ADVISORY AND
SUBADVISORY AGREEMENTS FOR PHOENIX-S&P DYNAMIC ALLOCATION SERIES: GROWTH
(the “Series”) (Continued)
SUBADVISORY AGREEMENT CONSIDERATIONS
Nature, Extent and Quality of Services. The Board concluded that the nature, extent and quality of the overall services that were to be provided by the Subadvisor to the Series and its shareholders were reasonable. In addition, they received from Subadvisor and reviewed substantial written information as requested. In the course of deliberations and evaluations of materials, the Trustees considered, among other things the following factors: the Subadvisor, its current personnel (including particularly those personnel with responsibilities for providing investment and compliance services to the Series), and its financial condition, resources and investment process; the terms of the subadvisory agreement, including the standard of care and termination and provisions; the scope and quality of the services that Subadvisor would provide to the Series; the structure and rate of advisory fees payable to Subadvisor to PVA, the methodology used by Subadvisor in determining the compensation payable to portfolio managers and the competition for investment management talent; and the Subadvisor’s compliance record. The Board’s opinion was based, in part, upon the experience of the Subadvisor and the portfolio managers. With respect to portfolio manager compensation, the Board noted that a primary factor in the Subadvisor’s determination of the amount of bonus compensation to portfolio managers was the relative investment performance of the funds that they managed which would align their interests with those of the Series’ shareholders. The Board also considered the adequacy of the Subadvisor’s compliance program, based on the information provided by the Subadvisor.
Investment Performance. The Board placed emphasis on the investment performance of the Series in view of its importance to shareholders. While consideration was given to performance reports and discussions at Board meetings throughout the year, particular attention in assessing such performance was given to a report for the Series prepared by Lipper Financial Services (“Lipper”), which was furnished for the contract renewal process. The Lipper report showed the investment performance of the Series’ shares for the one year period ended September 30, 2007 and year-to-date period ended September 30, 2007. The Board reviewed the investment performance of the Series, along with comparative performance information given for a peer group of funds and a relevant market index. The Board noted that the Series had performed above the index for both periods. The Series was ranked 86th out of 216 for its peer group for the year-to-date period ended September 30, 2007.
Profitability. The Board did not consider profitability information for the Subadvisor noting that the subadvisory fee is pay by PVA and not the Series.
Subadvisory Fee. The Board considered that the subadvisory fee is paid by PVA and not by the Series.
Economies of Scale. The Board also considered the existence of any economies of scale and whether those economies would be passed along to the Series’ shareholders but noted that any economies would most likely be generated at the series level and not necessarily at the subadvisor level.
150
THE PHOENIX EDGE SERIES FUND
BOARD OF TRUSTEES’ CONSIDERATION OF INVESTMENT ADVISORY AND
SUBADVISORY AGREEMENTS FOR PHOENIX-S&P DYNAMIC ALLOCATION SERIES:
MODERATE (the “Series”)
The Board of Trustees is responsible for determining whether to approve the Series’ advisory and subadvisory agreements. At a meeting held on November 13, 2007, the Board, including a majority of the independent Trustees, approved the renewal of the investment advisory agreement (the “Advisory Agreement”) between Phoenix Variable Advisors, Inc. (“PVA”) and the Fund and the investment subadvisory agreement (the “Subadvisory Agreement”) between PVA and Standard & Poor’s Investment Advisory Services LLC (“SPIAS”) (the “Subadvisor”). Pursuant to the Advisory Agreement, PVA and the Fund, PVA provides advisory services to the Series. Pursuant to the Subadvisory Agreement between PVA and Subadvisor, the Subadvisor provides the day-to-day investment management for the Series.
During the review process, the Board received assistance and advice from, and met separately with, independent legal counsel. In approving each agreement, the Board, including a majority of the Independent Trustees, determined that the fee structure was reasonable and that approval of each agreement was in the best interests of the Series and its shareholders. While attention was given to all information furnished, the following discusses the primary factors relevant to the Board’s decision.
Nature, Extent and Quality of Services. The Board concluded that the nature, extent and quality of the overall services to be provided by PVA and its affiliates to the Series and its shareholders were reasonable. The Board’s conclusion was based, in part, upon services provided to the series such as quarterly reports provided by PVA 1) comparing performance with a peer group and benchmark, 2) showing that the investment policies and restrictions were followed and 3) covering matters such as the compliance of investment personnel and other access persons with the Code of Ethics of PVA, the adherence to fair value pricing procedures established by the Board, the monitoring of portfolio compliance, information on illiquid securities and derivatives, brokerage commissions and presentations regarding the economic environment and general investment outlook. The Board noted that PVA was responsible for the general oversight of investment programs and the monitoring of the Subadvisor’s investment performance and their compliance with applicable laws, regulations, policies and procedures. With respect to compliance monitoring, the Board noted that PVA required quarterly compliance certifications from the Subadvisor and conducted compliance due diligence visits at the Subadvisor. The Board also considered the experience of PVA having acted as an investment adviser to mutual funds for 8 years, its current experience in acting as an investment adviser to 18 mutual funds, and its role under the Fund’s “manager of managers” exemptive relief under the 1940 Act. The Board also considered the transfer agent and shareholder services that are provided to Series’ shareholders by an affiliate of PVA, noting continuing improvements by management in the scope and quality of services and favorable reports on such service conducted by third parties.
Investment Performance. The Board placed emphasis on the investment performance of the Series in view of its importance to shareholders. While consideration was given to performance reports and discussions at Board meetings throughout the year, particular attention in assessing such performance was given to a report for the Series prepared by Lipper Financial Services (“Lipper”), which was furnished for the contract renewal process. The Lipper report showed the investment performance of the Series’ shares for the one year period ended September 30, 2007 and the year-to-date period ended September 30, 2007. The Board reviewed the investment performance of the Series, along with comparative performance information given for a peer group of funds and a relevant market index. The Board noted that the Series had performed above the index for both periods. The Series was ranked 24th out of 131 for its peer group for the year-to-date period ended September 30, 2007.
Profitability. The Board also considered the level of profits realized by PVA and its affiliates in connection with the operation of the Series. In this regard, the Board reviewed the Series profitability analysis that addressed the overall profitability of PVA for its management of The Phoenix Edge Series Fund family, as well as its profits and that of its affiliates, for managing the Series. Specific attention was given to the methodology followed in allocating costs to the Series, since allocation methodologies are inherently subjective and various allocation methodologies may each be reasonable while producing different results. In this result, the Board noted that the allocation profitability to PVA from the Series was reasonable.
Management Fee and Total Expenses. The Board also placed emphasis on the review of Series expenses. Consideration was given to a comparative analysis of the management fees and total expense ratios of the Series compared with those of a group of funds selected by Lipper as the Series’ appropriate Lipper expense peer group as of September 30, 2007. The Board noted that the total expenses of the Series were below the average of total expenses for comparable funds and the contractual management fee was slightly lower than the median for the peer group. The Board was satisfied with the management fee and total expenses of the Series in comparison to its peer group as shown in the Lipper report and concluded that the profitability to PVA from the Series was reasonable.
Economies of Scale. The Board noted that it was likely that PVA and the Series would achieve certain economies of scale as the assets grow covering certain fixed costs. The Board concluded that shareholders would have an opportunity to benefit from these economies of scale.
151
THE PHOENIX EDGE SERIES FUND
BOARD OF TRUSTEES’ CONSIDERATION OF INVESTMENT ADVISORY AND
SUBADVISORY AGREEMENTS FOR PHOENIX-S&P DYNAMIC ALLOCATION SERIES:
MODERATE (the “Series”) (Continued)
SUBADVISORY AGREEMENT CONSIDERATIONS
Nature, Extent and Quality of Services. The Board concluded that the nature, extent and quality of the overall services that were to be provided by the Subadvisor to the Series and its shareholders were reasonable. In addition, they received from Subadvisor and reviewed substantial written information as requested. In the course of deliberations and evaluations of materials, the Trustees considered, among other things the following factors: the Subadvisor, its current personnel (including particularly those personnel with responsibilities for providing investment and compliance services to the Series), and its financial condition, resources and investment process; the terms of the subadvisory agreement, including the standard of care and termination and provisions; the scope and quality of the services that Subadvisor would provide to the Series; the structure and rate of advisory fees payable to Subadvisor to PVA, the methodology used by Subadvisor in determining the compensation payable to portfolio managers and the competition for investment management talent; and the Subadvisor’s compliance record. The Board’s opinion was based, in part, upon the experience of the Subadvisor and the portfolio managers. With respect to portfolio manager compensation, the Board noted that a primary factor in the Subadvisor’s determination of the amount of bonus compensation to portfolio managers was the relative investment performance of the funds that they managed which would align their interests with those of the Series’ shareholders. The Board also considered the adequacy of the Subadvisor’s compliance program, based on the information provided by the Subadvisor.
Investment Performance. The Board placed emphasis on the investment performance of the Series in view of its importance to shareholders. While consideration was given to performance reports and discussions at Board meetings throughout the year, particular attention in assessing such performance was given to a report for the Series prepared by Lipper Financial Services (“Lipper”), which was furnished for the contract renewal process. The Lipper report showed the investment performance of the Series’ shares for the one year period ended September 30, 2007 and year-to-date period ended September 30, 2007. The Board reviewed the investment performance of the Series, along with comparative performance information given for a peer group of funds and a relevant market index. The Board noted that the Series had performed above the index for both periods. The Series was ranked 24th out of 131 for its peer group for the year-to-date period ended September 30, 2007.
Profitability. The Board did not consider profitability information for the Subadvisor noting that the subadvisory fee is pay by PVA and not the Series.
Subadvisory Fee. The Board considered that the subadvisory fee is paid by PVA and not by the Series.
Economies of Scale. The Board also considered the existence of any economies of scale and whether those economies would be passed along to the Series’ shareholders but noted that any economies would most likely be generated at the series level and not necessarily at the subadvisor level.
152
THE PHOENIX EDGE SERIES FUND
BOARD OF TRUSTEES’ CONSIDERATION OF INVESTMENT ADVISORY AND
SUBADVISORY AGREEMENTS FOR PHOENIX-S&P DYNAMIC ALLOCATION SERIES:
MODERATE GROWTH (the “Series”)
The Board of Trustees is responsible for determining whether to approve the Series’ advisory and subadvisory agreements. At a meeting held on November 13, 2007, the Board, including a majority of the independent Trustees, approved the renewal of the investment advisory agreement (the “Advisory Agreement”) between Phoenix Variable Advisors, Inc. (“PVA”) and the Fund and the investment subadvisory agreement (the “Subadvisory Agreement”) between PVA and Standard & Poor’s Investment Advisory Services LLC (“SPIAS”) (the “Subadvisor”). Pursuant to the Advisory Agreement, PVA and the Fund, PVA provides advisory services to the Series. Pursuant to the Subadvisory Agreement between PVA and Subadvisor, the Subadvisor provides the day-to-day investment management for the Series.
During the review process, the Board received assistance and advice from, and met separately with, independent legal counsel. In approving each agreement, the Board, including a majority of the Independent Trustees, determined that the fee structure was reasonable and that approval of each agreement was in the best interests of the Series and its shareholders. While attention was given to all information furnished, the following discusses the primary factors relevant to the Board’s decision.
Nature, Extent and Quality of Services. The Board concluded that the nature, extent and quality of the overall services to be provided by PVA and its affiliates to the Series and its shareholders were reasonable. The Board’s conclusion was based, in part, upon services provided to the series such as quarterly reports provided by PVA 1) comparing performance with a peer group and benchmark, 2) showing that the investment policies and restrictions were followed and 3) covering matters such as the compliance of investment personnel and other access persons with the Code of Ethics of PVA, the adherence to fair value pricing procedures established by the Board, the monitoring of portfolio compliance, information on illiquid securities and derivatives, brokerage commissions and presentations regarding the economic environment and general investment outlook. The Board noted that PVA was responsible for the general oversight of investment programs and the monitoring of the Subadvisor’s investment performance and their compliance with applicable laws, regulations, policies and procedures. With respect to compliance monitoring, the Board noted that PVA required quarterly compliance certifications from the Subadvisor and conducted compliance due diligence visits at the Subadvisor. The Board also considered the experience of PVA having acted as an investment adviser to mutual funds for 8 years, its current experience in acting as an investment adviser to 18 mutual funds, and its role under the Fund’s “manager of managers” exemptive relief under the 1940 Act. The Board also considered the transfer agent and shareholder services that are provided to Series’ shareholders by an affiliate of PVA, noting continuing improvements by management in the scope and quality of services and favorable reports on such service conducted by third parties.
Investment Performance. The Board placed emphasis on the investment performance of the Series in view of its importance to shareholders. While consideration was given to performance reports and discussions at Board meetings throughout the year, particular attention in assessing such performance was given to a report for the Series prepared by Lipper Financial Services (“Lipper”), which was furnished for the contract renewal process. The Lipper report showed the investment performance of the Series’ shares for the one year period ended September 30, 2007 and the year-to-date period ended September 30, 2007. The Board reviewed the investment performance of the Series, along with comparative performance information given for a peer group of funds and a relevant market index. The Board noted that the Series had performed above the index for both periods. The Series was ranked 15th out of 72 for its peer group for the year-to-date period ended September 30, 2007.
Profitability. The Board also considered the level of profits realized by PVA and its affiliates in connection with the operation of the Series. In this regard, the Board reviewed the Series profitability analysis that addressed the overall profitability of PVA for its management of The Phoenix Edge Series Fund family, as well as its profits and that of its affiliates, for managing the Series. Specific attention was given to the methodology followed in allocating costs to the Series, since allocation methodologies are inherently subjective and various allocation methodologies may each be reasonable while producing different results. In this result, the Board noted that the allocation profitability to PVA from the Series was reasonable.
Management Fee and Total Expenses. The Board also placed emphasis on the review of Series expenses. Consideration was given to a comparative analysis of the management fees and total expense ratios of the Series compared with those of a group of funds selected by Lipper as the Series’ appropriate Lipper expense peer group as of September 30, 2007. The Board noted that the total expenses were below the average of the total expenses for comparable funds and the contractual management fee was the same as than the median for the peer group. The Board was satisfied with the management fee and total expenses of the Series in comparison to its peer group as shown in the Lipper report and concluded that the profitability to PVA from the Series was reasonable.
Economies of Scale. The Board noted that it was likely that PVA and the Series would achieve certain economies of scale as the assets grow covering certain fixed costs. The Board concluded that shareholders would have an opportunity to benefit from these economies of scale.
153
THE PHOENIX EDGE SERIES FUND
BOARD OF TRUSTEES’ CONSIDERATION OF INVESTMENT ADVISORY AND
SUBADVISORY AGREEMENTS FOR PHOENIX-S&P DYNAMIC ALLOCATION SERIES:
MODERATE GROWTH (the “Series”) (Continued)
SUBADVISORY AGREEMENT CONSIDERATIONS
Nature, Extent and Quality of Services. The Board concluded that the nature, extent and quality of the overall services that were to be provided by the Subadvisor to the Series and its shareholders were reasonable. In addition, they received from Subadvisor and reviewed substantial written information as requested. In the course of deliberations and evaluations of materials, the Trustees considered, among other things the following factors: the Subadvisor, its current personnel (including particularly those personnel with responsibilities for providing investment and compliance services to the Series), and its financial condition, resources and investment process; the terms of the subadvisory agreement, including the standard of care and termination and provisions; the scope and quality of the services that Subadvisor would provide to the Series; the structure and rate of advisory fees payable to Subadvisor to PVA, the methodology used by Subadvisor in determining the compensation payable to portfolio managers and the competition for investment management talent; and the Subadvisor’s compliance record. The Board’s opinion was based, in part, upon the experience of the Subadvisor and the portfolio managers. With respect to portfolio manager compensation, the Board noted that a primary factor in the Subadvisor’s determination of the amount of bonus compensation to portfolio managers was the relative investment performance of the funds that they managed which would align their interests with those of the Series’ shareholders. The Board also considered the adequacy of the Subadvisor’s compliance program, based on the information provided by the Subadvisor.
Investment Performance. The Board placed emphasis on the investment performance of the Series in view of its importance to shareholders. While consideration was given to performance reports and discussions at Board meetings throughout the year, particular attention in assessing such performance was given to a report for the Series prepared by Lipper Financial Services (“Lipper”), which was furnished for the contract renewal process. The Lipper report showed the investment performance of the Series’ shares for the one year period ended September 30, 2007 and year-to-date period ended September 30, 2007. The Board reviewed the investment performance of the Series, along with comparative performance information given for a peer group of funds and a relevant market index. The Board noted that the Series had performed above the index for both periods. The Series was ranked 15th out of 72 for its peer group for the year-to-date period ended September 30, 2007.
Profitability. The Board did not consider profitability information for the Subadvisor noting that the subadvisory fee is pay by PVA and not the Series.
Subadvisory Fee. The Board considered that the subadvisory fee is paid by PVA and not by the Series.
Economies of Scale. The Board also considered the existence of any economies of scale and whether those economies would be passed along to the Series’ shareholders but noted that any economies would most likely be generated at the series level and not necessarily at the subadvisor level.
154
THE PHOENIX EDGE SERIES FUND
BOARD OF TRUSTEES’ CONSIDERATION OF INVESTMENT ADVISORY AND
SUBADVISORY AGREEMENTS FOR PHOENIX-SANFORD BERNSTEIN MID-CAP VALUE SERIES
(the “Series”)
The Board of Trustees is responsible for determining whether to approve the Fund’s advisory and subadvisory agreements. At a meeting held on November 12, 2007, the Board, including a majority of disinterested Trustees, approved the renewal of the investment advisory agreement (the “Advisory Agreement”) between Phoenix Variable Advisors, Inc. (“PVA”) and the Fund and the investment subadvisory agreement (the “Subadvisory Agreement”) between PVA and Alliance/Bernstein L.P. (the “Subadvisor”). Pursuant to the Advisory Agreement between PVA and the Fund, PVA provides advisory services to the Series. Pursuant to the Subadvisory Agreement between PVA and the Subadvisor, the Subadvisor provides the day to day investment management for the Series.
During the review process, the Board received assistance and advice from, and met separately with, independent legal counsel. In approving each agreement, the Board, including a majority of disinterested Trustees, determined that the fee structure was reasonable and approving the renewals was in the best interests of the Series and its shareholders. While attention was given to all information furnished, the following discusses the primary factors relevant to the Board’s decision.
ADVISORY AGREEMENT CONSIDERATIONS
Nature, Extent and Quality of Services. The Board concluded that the nature, extent and quality of the overall services to be provided by PVA and its affiliates to the Series and its shareholders were reasonable. The Board received and reviewed substantial written information from PVA as requested. The Board’s conclusion was based, in part, upon services provided by PVA to other Series of The Phoenix Edge Series Fund such as quarterly reports provided by PVA 1) comparing performance with a peer group and benchmark, 2) showing that the investment policies and restrictions were followed and 3) covering matters such as the compliance of investment personnel and other access persons with the Code of Ethics of PVA, the adherence to fair value pricing procedures established by the Board, the monitoring of portfolio compliance, information on illiquid securities and derivatives, brokerage commissions and presentations regarding the economic environment and general investment outlook. The Board noted that PVA was responsible for the general oversight of investment programs and the monitoring of subadvisor’s investment performance and their compliance with applicable laws, regulations, policies and procedures. With respect to compliance monitoring, the Board noted that PVA will require quarterly compliance certifications from the Subadvisor and will conduct compliance due diligence visits at the Subadvisor. The Board also considered the experience of PVA having acted as an investment adviser to mutual funds for 8 years, its current experience in acting as an investment adviser to over 18 mutual funds, and its role under the Fund’s “manager of managers” exemptive relief under the 1940 Act. The Board also considered the transfer agent and shareholder services that are provided to Series shareholders by an affiliate of PVA, noting continuing improvements by management in the scope and quality of services and favorable reports on such service conducted by third parties.
Investment Performance. The Board placed emphasis on the investment performance of the Series in view of its importance to shareholders. In this regard, the Board considered the detailed performance review process of the Investment Performance Committee. While consideration was given to performance reports and discussions at Board meetings throughout the year, particular attention in assessing such performance was given to a report for the Series prepared by Lipper Financial Services (“Lipper”), which was furnished for the contract renewal process. The Lipper report showed the investment performance of the Series’ shares for the 1, 3 and 5 year periods ended September 30, 2007 and the year-to-date period ended September 30, 2007. The Board reviewed the investment performance of the Series, along with the comparative performance information given for a peer group of funds and a relevant market index. The Board noted that the Series had performed above the index for all periods. The Series was ranked 25th out of 65 for its peer group for the year-to-date period ended September 30, 2007.
Profitability. The Board reviewed the profitability analysis that addressed the overall profitability of PVA for its management of The Phoenix Edge Series Fund family, as well as its profits and that of its affiliates, for managing the Series. Specific attention was given to the methodology followed in allocating costs to the Series, since allocation methodologies are inherently subjective and various allocation methodologies may each be reasonable while producing different results. In this regard, the Board noted that the allocation appeared reasonable. The Board also noted the voluntary reimbursements provided to the Fund. The Board concluded that the profitability to PVA from the Series was reasonable.
Management Fee and Total Expenses. The Board also placed emphasis on the review of Series expenses. Consideration was given to a comparative analysis of the management fees and total expense ratios of the Series compared with those of a group of funds selected by Lipper as the Series’ appropriate Lipper expense peer group as of September 30, 2007. The Board noted that the total expenses of the Series were above the total expenses for comparable funds and the contractual management fee was above the median for the peer group. The Board was satisfied with the management fee and total expenses for the Series in comparison to its peer group as shown in the Lipper report and concluded that such fee and expenses were reasonable.
Economies of Scale. The Board noted that it was likely that PVA and the Series would achieve certain economies of scale in order to cover certain fixed costs as the assets grew. The Board concluded that shareholders would have an opportunity to benefit from these economies of scale.
155
THE PHOENIX EDGE SERIES FUND
BOARD OF TRUSTEES’ CONSIDERATION OF INVESTMENT ADVISORY AND
SUBADVISORY AGREEMENTS FOR PHOENIX-SANFORD BERNSTEIN MID-CAP VALUE SERIES
(the “Series”) (Continued)
SUBADVISORY AGREEMENT CONSIDERATIONS
Nature, Extent and Quality of Services. The Board concluded that the nature, extent and quality of the overall services that are provided by the Subadvisor to the Series and its shareholders were reasonable. In addition, the Board received from the Subadvisor and reviewed substantial written information as requested. In the course of their deliberations and evaluation of materials, the Trustees considered, among other things the following factors: the Subadvisor, its current personnel (including particularly those personnel with responsibilities for providing investment and compliance services to the Series), and its financial condition, resources and investment process; the terms of the subadvisory agreement, including the standard of care and termination provisions; the scope and quality of the services that Subadvisor would provide to the Series; the structure and rate of advisory fees payable to Subadvisor by PVA, the methodology used by Subadvisor in determining the compensation payable to portfolio managers and the competition for investment management talent; and the Subadvisor’s compliance record. The Board’s opinion was based, in part, upon the extensive experience of the Subadvisor and the portfolio managers. In this regard, the Board noted that the portfolio management team has many years of experience in the investment management business. With respect to portfolio manager compensation, the Board noted that a primary factor in the Subadvisor’s determination of the amount of bonus compensation to portfolio managers was the relative investment performance of the funds that they managed which would align their interests with those of the Series’ shareholders. The Board also considered the adequacy of the Subadvisor’s compliance program, based on the information provided by the Subadvisor.
Investment Performance. The Board placed emphasis on the investment performance of the Series in view of its importance to shareholders. In this regard, the Board considered the detailed performance review process of the Investment Performance Committee. While consideration was given to performance reports and discussions at Board meetings throughout the year, particular attention in assessing such performance was given to a report of the Series prepared by Lipper Financial Services (“Lipper”), which was furnished for the contract renewal process. The Lipper report showed the investment performance of the Series’ shares for the 1, 3 and 5 year periods ended September 30, 2007 and the year-to-date period ended September 30, 2007. The Board reviewed the investment performance of the Series, along with comparative performance information given for a peer group of funds and a relevant market index. The Board noted that the Series had performed above the index for all periods. The Series was ranked 25th out of 65 for its peer group for the year-to-date period ended September 30, 2007.
Profitability. The Board noted that the subadvisory fee is paid by PVA and not the Series.
Subadvisory Fee. The Board did not receive comparative fee information of subadvisory fees but noted that the subadvisory fee is paid by PVA and not by the Series.
Economies of Scale. The Board also considered the existence of any economies of scale and whether those economies would be passed along to the Series’ shareholders but noted that any economies would most likely be generated at the advisor level and not necessarily at the subadvisor level.
156
THE PHOENIX EDGE SERIES FUND
BOARD OF TRUSTEES’ CONSIDERATION OF INVESTMENT ADVISORY AND
SUBADVISORY AGREEMENTS FOR PHOENIX-SANFORD BERNSTEIN SMALL-CAP VALUE
SERIES (the “Series”)
The Board of Trustees is responsible for determining whether to approve the Fund’s advisory and subadvisory agreements. At a meeting held on November 12, 2007, the Board, including a majority of disinterested Trustees, approved the renewal of the investment advisory agreement (the “Advisory Agreement”) between Phoenix Variable Advisors, Inc. (“PVA”) and the Fund and the investment subadvisory agreement (the “Subadvisory Agreement”) between PVA and Alliance/Bernstein L.P. (the “Subadvisor”). Pursuant to the Advisory Agreement between PVA and the Fund, PVA provides advisory services to the Series. Pursuant to the Subadvisory Agreement between PVA and the Subadvisor, the Subadvisor provides the day to day investment management for the Series.
During the review process, the Board received assistance and advice from, and met separately with, independent legal counsel. In approving each agreement, the Board, including a majority of disinterested Trustees, determined that the fee structure was reasonable and approving the renewals was in the best interests of the Series and its shareholders. While attention was given to all information furnished, the following discusses the primary factors relevant to the Board’s decision.
ADVISORY AGREEMENT CONSIDERATIONS
Nature, Extent and Quality of Services. The Board concluded that the nature, extent and quality of the overall services to be provided by PVA and its affiliates to the Series and its shareholders were reasonable. The Board received and reviewed substantial written information from PVA as requested. The Board’s conclusion was based, in part, upon services provided by PVA to other Series of The Phoenix Edge Series Fund such as quarterly reports provided by PVA 1) comparing performance with a peer group and benchmark, 2) showing that the investment policies and restrictions were followed and 3) covering matters such as the compliance of investment personnel and other access persons with the Code of Ethics of PVA, the adherence to fair value pricing procedures established by the Board, the monitoring of portfolio compliance, information on illiquid securities and derivatives, brokerage commissions and presentations regarding the economic environment and general investment outlook. The Board noted that PVA was responsible for the general oversight of investment programs and the monitoring of subadvisor’s investment performance and their compliance with applicable laws, regulations, policies and procedures. With respect to compliance monitoring, the Board noted that PVA will require quarterly compliance certifications from the Subadvisor and will conduct compliance due diligence visits at the Subadvisor. The Board also considered the experience of PVA having acted as an investment adviser to mutual funds for 8 years, its current experience in acting as an investment adviser to over 18 mutual funds, and its role under the Fund’s “manager of managers” exemptive relief under the 1940 Act. The Board also considered the transfer agent and shareholder services that are provided to Series shareholders by an affiliate of PVA, noting continuing improvements by management in the scope and quality of services and favorable reports on such service conducted by third parties.
Investment Performance. The Board placed emphasis on the investment performance of the Series in view of its importance to shareholders. In this regard, the Board considered the detailed performance review process of the Investment Performance Committee. While consideration was given to performance reports and discussions at Board meetings throughout the year, particular attention in assessing such performance was given to a report for the Series prepared by Lipper Financial Services (“Lipper”), which was furnished for the contract renewal process. The Lipper report showed the investment performance of the Series’ shares for the 1, 3 and 5 year periods ended September 30, 2007 and the year-to-date period ended September 30, 2007. The Board reviewed the investment performance of the Series, along with the comparative performance information given for a peer group of funds and a relevant market index. The Board noted that the Series had performed above the index for all the periods. The Series was ranked 4th out of 42 for its peer group for the year-to-date period ended September 30, 2007.
Profitability. The Board reviewed the profitability analysis that addressed the overall profitability of PVA for its management of The Phoenix Edge Series Fund family, as well as its profits and that of its affiliates, for managing the Series. Specific attention was given to the methodology followed in allocating costs to the Series, since allocation methodologies are inherently subjective and various allocation methodologies may each be reasonable while producing different results. In this regard, the Board noted that the allocation appeared reasonable. The Board also noted the voluntary reimbursements provided to the Fund. The Board concluded that the profitability to PVA from the Series was reasonable.
Management Fee and Total Expenses. The Board also placed emphasis on the review of Series expenses. Consideration was given to a comparative analysis of the management fees and total expense ratios of the Series compared with those of a group of funds selected by Lipper as the Series’ appropriate Lipper expense peer group as of September 30, 2007. The Board noted that the total expenses of the Series were above the average total expenses for comparable funds and that the contractual management fee was above the median for the peer group. The Board was satisfied with the management fee and total expenses for the Series in comparison to its peer group as shown in the Lipper report and concluded that such fee and expenses were reasonable.
Economies of Scale. The Board noted that it was likely that PVA and the Series would achieve certain economies of scale in order to cover certain fixed costs as the assets grew. The Board concluded that shareholders would have an opportunity to benefit from these economies of scale.
157
THE PHOENIX EDGE SERIES FUND
BOARD OF TRUSTEES’ CONSIDERATION OF INVESTMENT ADVISORY AND
SUBADVISORY AGREEMENTS FOR PHOENIX-SANFORD BERNSTEIN SMALL-CAP VALUE
SERIES (the “Series”) (Continued)
SUBADVISORY AGREEMENT CONSIDERATIONS
Nature, Extent and Quality of Services. The Board concluded that the nature, extent and quality of the overall services that are provided by the Subadvisor to the Series and its shareholders were reasonable. In addition, the Board received from the Subadvisor and reviewed substantial written information as requested. In the course of their deliberations and evaluation of materials, the Trustees considered, among other things the following factors: the Subadvisor, its current personnel (including particularly those personnel with responsibilities for providing investment and compliance services to the Series), and its financial condition, resources and investment process; the terms of the subadvisory agreement, including the standard of care and termination provisions; the scope and quality of the services that Subadvisor would provide to the Series; the structure and rate of advisory fees payable to Subadvisor by PVA, the methodology used by Subadvisor in determining the compensation payable to portfolio managers and the competition for investment management talent; and the Subadvisor’s compliance record. The Board’s opinion was based, in part, upon the extensive experience of the Subadvisor and the portfolio managers. In this regard, the Board noted that the portfolio management team has many years of experience in the investment management business. With respect to portfolio manager compensation, the Board noted that a primary factor in the Subadvisor’s determination of the amount of bonus compensation to portfolio managers was the relative investment performance of the funds that they managed which would align their interests with those of the Series’ shareholders. The Board also considered the adequacy of the Subadvisor’s compliance program, based on the information provided by the Subadvisor.
Investment Performance. The Board placed emphasis on the investment performance of the Series in view of its importance to shareholders. In this regard, the Board considered the detailed performance review process of the Investment Performance Committee. While consideration was given to performance reports and discussions at Board meetings throughout the year, particular attention in assessing such performance was given to a report of the Series prepared by Lipper Financial Services (“Lipper”), which was furnished for the contract renewal process. The Lipper report showed the investment performance of the Series’ shares for the 1, 3 and 5 year periods ended September 30, 2007 and the year-to-date period ended September 30, 2007. The Board reviewed the investment performance of the Series, along with comparative performance information given for a peer group of funds and a relevant market index. The Board noted that the Series had performed above the index for all the periods. The Series was ranked 4th out of 42 for its peer group for the year-to-date period ended September 30, 2007.
Profitability. The Board noted that the subadvisory fee is paid by PVA and not the Series.
Subadvisory Fee. The Board did not receive comparative fee information of subadvisory fees but noted that the subadvisory fee is paid by PVA and not by the Series.
Economies of Scale. The Board also considered the existence of any economies of scale and whether those economies would be passed along to the Series’ shareholders but noted that any economies would most likely be generated at the advisor level and not necessarily at the subadvisor level.
158
THE PHOENIX EDGE SERIES FUND
BOARD OF TRUSTEES’ CONSIDERATION OF INVESTMENT ADVISORY AND
SUBADVISORY AGREEMENTS FOR PHOENIX-VAN KAMPEN COMSTOCK SERIES
(the “Series”)
The Board of Trustees is responsible for determining whether to approve the Series’ advisory and subadvisory agreements. At a meeting held on November 13, 2007, the Board, including a majority of the independent Trustees, approved the renewal of the investment advisory agreement (the “Advisory Agreement”) between Phoenix Variable Advisors, Inc. (“PVA”) and the Fund and the investment subadvisory agreement (the “Subadvisory Agreement”) between PVA and Morgan Stanley Investment Management, Inc. d/b/a Van Kampen (“Van Kampen”) (the “Subadvisor”). Pursuant to the Advisory Agreement, PVA and the Fund, PVA provides advisory services to the Series. Pursuant to the Subadvisory Agreement between PVA and Subadvisor, the Subadvisor provides the day-to-day investment management for the Series.
During the review process, the Board received assistance and advice from, and met separately with, independent legal counsel. In approving each agreement, the Board, including a majority of the Independent Trustees, determined that the fee structure was reasonable and that approval of each agreement was in the best interests of the Series and its shareholders. While attention was given to all information furnished, the following discusses the primary factors relevant to the Board’s decision.
ADVISORY AGREEMENT CONSIDERATIONS
Nature, Extent and Quality of Services. The Board concluded that the nature, extent and quality of the overall services to be provided by PVA and its affiliates to the Series and its shareholders were reasonable. The Board’s conclusion was based, in part, upon services provided to the Series such as quarterly reports provided by PVA 1) comparing the performance of the Series with a peer group and benchmark, 2) showing that the investment policies and restrictions for the Series were followed and 3) covering matters such as the compliance of investment personnel and other access persons with the Code of Ethics of PVA and the Series, the adherence to fair value pricing procedures established by the Board, the monitoring of portfolio compliance, information on illiquid securities and derivatives, brokerage commissions and presentations regarding the economic environment and general investment outlook. The Board noted that PVA was responsible for the general oversight of the investment programs of the Series and the monitoring of the Subadvisor’s investment performance and its compliance with applicable laws, regulations, policies and procedures. With respect to compliance monitoring, the Board noted that PVA required quarterly compliance certifications from the Subadvisor and conducted compliance due diligence visits at the Subadvisor. The Board also considered the experience of PVA having acted as an investment adviser to mutual funds for 8 years, its current experience in acting as an investment adviser to 18 mutual funds, and its role under the Fund’s “manager of managers” exemptive relief under the Investment Company Act of 1940. The Board also considered the transfer agent and shareholder services that are provided to Series’ shareholders by an affiliate of PVA, noting continuing improvements by management in the scope and quality of services and favorable reports on such service conducted by third parties.
Investment Performance. The Board placed emphasis on the investment performance of the Series in view of its importance to shareholders. While consideration was given to performance reports and discussions at Board meetings throughout the year, particular attention in assessing such performance was given to a report for the Series prepared by Lipper Financial Services (“Lipper”) furnished for the contract renewal process. The Lipper report showed the investment performance of the Series’ shares for the 1, 3, and 5 year periods ended September 30, 2007 and the year-to-date period September 30, 2007. The Board reviewed the investment performance of the Series, along with comparative performance information with a peer group of funds and a relevant market index. The Board noted that the Series had underperformed its benchmark for all periods ended September 30, 2007. The Series was ranked 74th out of 87 for its peer group for the year-to-date period ended September 30, 2007. The Board noted that the Subadvisor had been managing the Series for less than twenty-four months in its consideration of the quality of the Subadvisor’s investment performance. The Board further noted that it would review the Subadvisor’s investment performance each quarter in 2008.
Profitability. The Board also considered the level of profits realized by PVA and its affiliates in connection with the operation of the Series. In this regard, the Board reviewed the Series profitability analysis that addressed the overall profitably of PVA for its management of The Phoenix Edge Series Fund family, as well as its profits and that of its affiliates, for managing the Series. Specific attention was given to the methodology followed in allocating costs to the Series, it being recognized that allocation methodologies are inherently subjective and various allocation methodologies may each be reasonable while producing different results. In this regard, the Board noted that the allocation appeared reasonable. The Board also noted that the voluntary reimbursements provided to the Series. The Board concluded that the profitability to PVA from the Series were reasonable.
Management Fee and Total Expenses. The Board also considered the expenses of the Series. Consideration was given to a comparative analysis of the management fees and total expense ratios of the Series compared with those of a group of other funds selected by Lipper as its appropriate Lipper expense group under the Lipper report. The Board noted that the total expenses of the Series were above the average total expenses for comparable funds and that the management fee was above the median for the peer group. The Board was satisfied with the management fee and total expenses of the Series in comparison to its expense group as shown in the Lipper report and concluded that such fee and expenses were reasonable.
Economies of Scale. The Board also noted that it was likely that PVA and the Series would achieve certain economies of scale as the assets grew covering certain fixed costs. The Board concluded that shareholders would have an opportunity to benefit from these economies of scale.
159
THE PHOENIX EDGE SERIES FUND
BOARD OF TRUSTEES’ CONSIDERATION OF INVESTMENT ADVISORY AND
SUBADVISORY AGREEMENTS FOR PHOENIX-VAN KAMPEN COMSTOCK SERIES
(the “Series”) (Continued)
SUBADVISORY AGREEMENT CONSIDERATIONS
Nature, Extent and Quality of Services. The Board concluded that the nature, extent and quality of the overall services that are to be provided by the Subadvisor to the Series and its shareholders were reasonable. In addition, the Board received from the Subadvisor and reviewed substantial written information as requested. In the course of their deliberations and evaluation of materials, the Trustees considered, among other things the following factors: the Subadvisor, its current personnel (including particularly those personnel with responsibilities for providing investment and compliance services to the Series), and its financial condition, resources and investment process; the terms of the Subadvisory Agreement, including the standard of care and termination provisions; the scope and quality of the services that Subadvisor would provide to the Series; the structure and rate of advisory fees payable to the Subadvisor by PVA, the methodology used by the Subadvisor in determining the compensation payable to portfolio managers and the competition for investment management talent; and the Subadvisor’s compliance record. The Board’s opinion was based upon the extensive experience of the Subadvisor and the portfolio managers. With respect to portfolio manager compensation, the Board noted that a primary factor in the Subadvisor’s determination of the amount of bonus compensation to portfolio managers was the relative investment performance of the funds that they managed which would align their interests with those of the Series’ shareholders. The Board also considered the adequacy of the Subadvisor’s compliance program, based on the information provided by the Subadvisor.
Investment Performance. The Board placed emphasis on the investment performance of the Series in view of its importance to shareholders. While consideration was given to performance reports and discussions at Board meetings throughout the year, particular attention in assessing such performance was given to a report for the Series prepared by Lipper Financial Services (“Lipper”) furnished for the contract renewal process. The Lipper report showed the investment performance of the Series’ shares for the 1, 3, and 5 year periods ended September 30, 2007 and the year-to-date period September 30, 2007. The Board reviewed the investment performance of the Series, along with comparative performance information with a peer group of funds and a relevant market index. The Board noted that the Series had underperformed its benchmark for all periods ended September 30, 2007. The Series was ranked 74th out of 87 for its peer group for the year-to-date period ended September 30, 2007. The Board noted that the Subadvisor had been managing the Series for less than twenty-four months in its consideration of the quality of the Subadvisor’s investment performance. The Board further noted that it would review the Subadvisor’s investment performance each quarter in 2008.
Profitability. The Board did not consider profitability information for the Subadvisor noting that the subadvisory fee is paid by PVA and not by the Series.
Subadvisory Fee. The Board did not consider comparative fee information of subadvisory fees but noted that the subadvisory fee is paid by PVA and not by the Series.
Economies of Scale. The Board also considered the existence of any economies of scale and whether those economies would be passed along to the Series’ shareholders but noted that any economies would most likely be generated at the fund level and not necessarily at the subadvisor level.
160
THE PHOENIX EDGE SERIES FUND
BOARD OF TRUSTEES’ CONSIDERATION OF INVESTMENT ADVISORY AND
SUBADVISORY AGREEMENTS FOR PHOENIX-VAN KAMPEN EQUITY 500 INDEX SERIES
(the “Series”)
The Board of Trustees is responsible for determining whether to approve the Series’ advisory and subadvisory agreements. At a meeting held on November 13, 2007, the Board, including a majority of the independent Trustees, approved the renewal of the investment advisory agreement (the “Advisory Agreement”) between Phoenix Variable Advisors, Inc. (“PVA”) and the Fund and the investment subadvisory agreement (the “Subadvisory Agreement”) between PVA and Morgan Stanley Investment Management, Inc. d/b/a Van Kampen (“Van Kampen”) (the “Subadvisor”). Pursuant to the Advisory Agreement, PVA and the Fund, PVA provides advisory services to the Series. Pursuant to the Subadvisory Agreement between PVA and Subadvisor, the Subadvisor provides the day-to-day investment management for the Series.
During the review process, the Board received assistance and advice from, and met separately with, independent legal counsel. In approving each agreement, the Board, including a majority of the Independent Trustees, determined that the fee structure was reasonable and that approval of each agreement was in the best interests of the Series and its shareholders. While attention was given to all information furnished, the following discusses the primary factors relevant to the Board’s decision.
ADVISORY AGREEMENT CONSIDERATIONS
Nature, Extent and Quality of Services. The Board concluded that the nature, extent and quality of the overall services to be provided by PVA and its affiliates to the Series and its shareholders were reasonable. The Board’s conclusion was based, in part, upon services provided to the Series such as quarterly reports provided by PVA 1) comparing the performance of the Series with a peer group and benchmark, 2) showing that the investment policies and restrictions for the Series were followed and 3) covering matters such as the compliance of investment personnel and other access persons with the Code of Ethics of PVA and the Series, the adherence to fair value pricing procedures established by the Board, the monitoring of portfolio compliance, information on illiquid securities and derivatives, brokerage commissions and presentations regarding the economic environment and general investment outlook. The Board noted that PVA was responsible for the general oversight of the investment programs of the Series and the monitoring of the Subadvisor’s investment performance and its compliance with applicable laws, regulations, policies and procedures. With respect to compliance monitoring, the Board noted that PVA required quarterly compliance certifications from the Subadvisor and conducted compliance due diligence visits at the Subadvisor. The Board also considered the experience of PVA having acted as an investment adviser to mutual funds for 8 years, its current experience in acting as an investment adviser to 18 mutual funds, and its role under the Fund’s “manager of managers” exemptive relief under the Investment Company Act of 1940. The Board also considered the transfer agent and shareholder services that are provided to Series’ shareholders by an affiliate of PVA, noting continuing improvements by management in the scope and quality of services and favorable reports on such service conducted by third parties.
Investment Performance. The Board placed significant emphasis on the investment performance of the Series in view of its importance to shareholders. While consideration was given to performance reports and discussions at Board meetings throughout the year, particular attention in assessing such performance was given to a report for the Series prepared by Lipper Financial Services (“Lipper”) furnished for the contract renewal process. The Lipper report showed the investment performance of the Series’ shares for the 1, 3, 5 and 10 year periods ended September 30, 2007 and the year-to-date period ended September 30, 2007. The Board reviewed the investment performance of the Series, along with comparative performance information with a peer group of funds and a relevant market index. The Board noted that the Series had performed below its benchmark for all the periods ended September 30, 2007. The Series was ranked 125th out of 208 for its peer group for the year-to-date period ended September 30, 2007. The Board noted that the Subadvisor had been managing the Series for less than twenty-four months in its consideration of the quality of the Subadvisor’s investment performance. The Board further noted that it would review the Subadvisor’s investment performance each quarter in 2008.
Profitability. The Board also considered the level of profits realized by PVA and its affiliates in connection with the operation of the Series. In this regard, the Board reviewed the Series profitability analysis that addressed the overall profitably of PVA for its management of The Phoenix Edge Series Fund family, as well as its profits and that of its affiliates, for managing the Series. Specific attention was given to the methodology followed in allocating costs to the Series, it being recognized that allocation methodologies are inherently subjective and various allocation methodologies may each be reasonable while producing different results. In this regard, the Board noted that the allocation appeared reasonable. The Board also noted that the voluntary reimbursements provided to the Series. The Board concluded that the profitability to PVA from the Series were reasonable.
Management Fee and Total Expenses. The Board also placed significant emphasis on the review of expenses of the Series. Consideration was given to a comparative analysis of the management fees and total expense ratios of the Series compared with those of a group of other funds selected by Lipper as its appropriate Lipper expense group under the Lipper report. The Board noted that the total expenses of the Series were slightly above the average total expenses for comparable funds and the contractual management fee was above the median for the peer group. The Board was satisfied with the management fee and total expenses of the Series in comparison to its expense group as shown in the Lipper report and concluded that such fee and expenses were reasonable.
Economies of Scale. The Board noted that it was likely that PVA and the Series would achieve certain economies of scale as the assets grew covering certain fixed costs. The Board concluded that shareholders would have an opportunity to benefit from these economies of scale.
161
THE PHOENIX EDGE SERIES FUND
BOARD OF TRUSTEES’ CONSIDERATION OF INVESTMENT ADVISORY AND
SUBADVISORY AGREEMENTS FOR PHOENIX-VAN KAMPEN EQUITY 500 INDEX SERIES
(the “Series”) (Continued)
SUBADVISORY AGREEMENT CONSIDERATIONS
Nature, Extent and Quality of Services. The Board concluded that the nature, extent and quality of the overall services that are to be provided by the Subadvisor to the Series and its shareholders were reasonable. In addition, the Board received from the Subadvisor and reviewed substantial written information as requested. In the course of their deliberations and evaluation of materials, the Trustees considered, among other things the following factors: the Subadvisor, its current personnel (including particularly those personnel with responsibilities for providing investment and compliance services to the Series), and its financial condition, resources and investment process; the terms of the Subadvisory Agreement, including the standard of care and termination provisions; the scope and quality of the services that Subadvisor would provide to the Series; the structure and rate of advisory fees payable to the Subadvisor by PVA, the methodology used by the Subadvisor in determining the compensation payable to portfolio managers and the competition for investment management talent; and the Subadvisor’s compliance record. The Board’s opinion was based upon the extensive experience of the Subadvisor and the portfolio managers. With respect to portfolio manager compensation, the Board noted that a primary factor in the Subadvisor’s determination of the amount of bonus compensation to portfolio managers was the relative investment performance of the funds that they managed which would align their interests with those of the Series’ shareholders. The Board also considered the adequacy of the Subadvisor’s compliance program, based on the information provided by the Subadvisor.
Investment Performance. The Board placed significant emphasis on the investment performance of the Series in view of its importance to shareholders. While consideration was given to performance reports and discussions at Board meetings throughout the year, particular attention in assessing such performance was given to a report for the Series prepared by Lipper Financial Services (“Lipper”) furnished for the contract renewal process. The Lipper report showed the investment performance of the Series’ shares for the 1, 3, 5 and 10 year periods ended September 30, 2007 and the year-to-date period ended September 30, 2007. The Board reviewed the investment performance of the Series, along with comparative performance information with a peer group of funds and a relevant market index. The Board noted that the Series had performed below its benchmark for all the periods ended September 30, 2007. The Series was ranked 125th out of 208 for its peer group for the year-to-date period ended September 30, 2007. The Board noted that the Subadvisor had been managing the Series for less than twenty-four months in its consideration of the quality of the Subadvisor’s investment performance. The Board further noted that it would review the Subadvisor’s investment performance each quarter in 2008.
Profitability. The Board considered the profitability information for the Subadvisor noting that the subadvisory fee is paid by PVA and not by the Series.
Subadvisory Fee. The Board did not consider comparative fee information of subadvisory fees but noted that the subadvisory fee is paid by PVA and not by the Series.
Economies of Scale. The Board also considered the existence of any economies of scale and whether those economies would be passed along to the Series’ shareholders but noted that any economies would most likely be generated at the fund level and not necessarily at the subadvisor level.
162
FUND MANAGEMENT TABLES
Information pertaining to the Trustees and officers of the Trust as of December 31, 2007, is set forth below. The statement of additional information (SAI) includes additional information about the Trustees and is available without charge, upon request, by calling (800) 541-0171.
The address of each individual, unless otherwise noted, is 101 Munson Street, Greenfield, MA 01301-9668.
Disinterested Trustees
| | |
Name Year of Birth Year Elected
# of Portfolios in Fund Complex
Overseen by Trustee | | Principal Occupation(s) During Past 5 Years and Other Directorships Held by Trustee |
Frank M. Ellmer, CPA YOB: 1940 Elected: 1999 18 Portfolios | | Retired. |
| |
John A. Fabian* YOB: 1934 Elected: 1999 18 Portfolios | | Retired. |
| |
Roger A. Gelfenbien YOB: 1943 Elected: 2000 18 Portfolios | | Retired. Director, Webster Bank (2003-present). Director USAllianz Variable Insurance Product Trust, 23 funds (1999-present). Chairman/Trustee, The University of Connecticut (1997-2003). |
| |
Eunice S. Groark YOB: 1938 Elected: 1999 18 Portfolios | | Attorney. Director, Peoples’ Bank (1995-present). |
| |
Frank E. Grzelecki YOB: 1937 Elected: 2000 18 Portfolios | | Retired. Director, Barnes Group Inc. (1997-present). |
| |
John R. Mallin YOB: 1950 Elected: 1999 18 Portfolios | | Partner/Attorney, McCarter & English, LLP (2003-present); Principal/Attorney, Cummings & Lockwood, LLC (1996- 2003). |
| * | Retired from Phoenix Edge Series Fund (“PESF”) on December 31, 2007. |
163
FUND MANAGEMENT TABLES
Each of the individuals listed below is an “interested person” of the Fund, as defined in Section 2(a)(19) of the Investment Company Act of 1940, as amended, and the rules and regulations thereunder.
Interested Trustees
| | |
Name Year of Birth Year Elected # of Portfolios in Fund Complex
Overseen by Trustee | | Principal Occupation(s) During Past 5 Years and Other Directorships Held by Trustee |
**Philip R. McLoughlin YOB: 1946 Elected 2003 Chairman 80 Portfolios | | Partner, Cross Pond Partners, LLC, (2006-present). Director, PXRE Corporation (Reinsurance) (1985-present), World Trust Fund (1991-present). Director/Trustee, Phoenix Funds Complex (1989-present). Management Consultant (2002-2004), Chairman (1997-2002), Chief Executive Officer (1995-2002) and Director (1995-2002), Phoenix Investment Partners, Ltd. Director and Executive Vice President, The Phoenix Companies, Inc. (2000-2002). Director (1994-2002) and Executive Vice President, Investments (1987-2002), Phoenix Life Insurance Company. Director (1983-2002) and Chairman (1995-2002), Phoenix Investment Counsel, Inc. Director (1982-2002), and Chairman (2000-2002), Phoenix Equity Planning Corporation. Chairman and President, Phoenix/Zweig Advisers LLC (2001-2002). Director (2001-2002) and President (April 2002-September 2002), Phoenix Investment Management Company. Director and Executive Vice President, Phoenix Life and Annuity Company (1996-2002). Executive Vice President (1994-2002) and Chief Investment Counsel (1994-2002), PHL Variable Insurance Company. Director, Phoenix National Trust Holding Company (2001-2002). Director (1985-2002) and Vice President (1986-2002) and Executive Vice President (April 2002-September 2002), PM Holdings, Inc. Director, WS Griffith Associates, Inc. (1995-2002). Director, WS Griffith Securities, Inc. (1992-2002) |
| |
***Philip K. Polkinghorn One American Row Hartford, CT 06102 YOB: 1957 Elected 2004 President 18 Portfolios | | Executive Vice President, The Phoenix Companies, Inc. (2004-present). Vice President, Sun Life Financial Company (2001-2004). |
| ** | Mr. McLoughlin is an “interested person” as defined in the Investment Company Act of 1940, by reason of his former relationship with Phoenix Investment Partners, Ltd. and its affiliates. |
| *** | Mr. Polkinghorn is an “interested person” as defined under the Investment Company Act of 1940, by reason of his position with the Trust’s advisors and/or their affiliates. |
164
FUND MANAGEMENT TABLES
| | | | |
Name, Address, Year of Birth and Position(s) with Trust | | Length of Time Served | | Principal Occupation(s) During Past 5 Years |
OFFICERS WHO ARE NOT TRUSTEES |
Gina Collopy O’Connell One American Row Hartford, CT 06102 YOB: 1962 Senior Vice President | | Served since 2004 | | Senior Vice President, Life and Annuity Planning (2004-present); Senior Vice President, Life and Annuity Manufacturing (2003-2004); Senior Vice President, Life and Annuity Operations (2002- 2003); Vice President, various marketing and product development departments (1998-2002), Phoenix Life Insurance Company. Senior Vice President, PHL Variable Insurance Company (2003- present). Director, Phoenix Distribution Holding Company (2003-present). Senior Vice President, Phoenix Life and Annuity Company, (2004-present). Director and Senior Vice President, Phoenix Variable Advisors, Inc. (2005-present). |
| | |
Nancy G. Curtiss 56 Prospect Street Hartford, CT 06115 YOB: 1952 Senior Vice President | | Served since 1994 | | Vice President, Fund Accounting (1994-2000), Treasurer (1996-2000), Assistant Treasurer (2001- present), Phoenix Equity Planning Corporation. Vice President, Phoenix Investment Partners, Ltd. (2003-present). Chief Financial Officer and Treasurer or Assistant Treasurer, certain Funds within the Phoenix Fund Complex (1994-present). |
| | |
Marc Baltuch 900 Third Avenue New York, NY 10022 YOB: 1945 Chief Compliance Officer | | Served since 2004 | | Chief Compliance Officer, Zweig-DiMenna Associates LLC (1989-present); Vice President and Compliance Officer, certain of the Funds within the Phoenix Fund Complex; Vice President, The Zweig Total Return Fund, Inc. (2004-present); Vice President, The Zweig Fund, Inc. (2004- present); President and Director of Watermark Securities, Inc. (1991-present); Assistant Secretary of Gotham Advisors Inc. (1990-present); Secretary, Phoenix-Zweig Trust (1969-2003); Secretary, Phoenix-Euclid Market Neutral Fund (1999-2002). |
| | |
W. Patrick Bradley 56 Prospect Street Hartford, CT 06115 YOB: 1972 Vice President, Chief Financial Officer, Treasurer and Principal Accounting Officer | | Served since 2006 | | Vice President, Mutual Fund Administration, Phoenix Investment Partners, Ltd. (2004-present). Chief Financial Officer and Treasurer (2005-present), certain funds within the Phoenix Fund Family. Assistant Treasurer, certain funds within the Phoenix Fund Complex (2004-present). Senior Manager (2002-2004), Manager (2000-2002), Audit Services, Deloitte & Touche, LLP. |
| | |
Kathleen A. McGah One American Row Hartford, CT 06102 YOB: 1950 Vice President, Chief Legal Officer, Counsel and Secretary | | Served since 2005 | | Vice President and Counsel, Phoenix Life Insurance Company (2005-present); Vice President and Assistant Secretary, PHL Variable Insurance Company (2005-present); Vice President and Assistant Secretary, American Phoenix Life and Reassurance Company (2005-present); Vice President and Assistant Secretary, Phoenix Life and Annuity Company (2005-present); Vice President and Assistant Secretary, Phoenix Variable Advisors, Inc. (2005-present); and Vice President and Assistant Secretary, Phoenix Investment Counsel, Inc. (2006-present). Chief Legal Officer and Secretary of five mutual funds and six variable annuity separate accounts within the Travelers Life & Annuity complex (2004-2005), Assistant Secretary (1995-2004) of five mutual funds and six variable annuity separate accounts within the Travelers Life & Annuity complex. Deputy General Counsel (1999-2005), The Travelers Insurance Company. |
165
THE PHOENIX EDGE SERIES FUND
101 Munson Street
Greenfield, MA 01301
| | | | |
| Board of Trustees | | Investment Advisor | | |
| Frank M. Ellmer, CPA | | Phoenix Variable Advisors, Inc. | |
| John A. Fabian* | | One American Row | |
| Roger A. Gelfenbien | | Hartford, CT 06102-5056 | |
| Eunice S. Groark | | | |
| Frank E. Grzelecki | | Custodian | |
| John R. Mallin | | State Street Bank and Trust Company | |
| Philip R. McLoughlin | | 225 Franklin Street | |
| Philip K. Polkinghorn | | Boston, MA 02110 | |
| | | |
| Executive Officers | | Independent Registered Public Accounting Firm | |
Philip R. McLoughlin, Chairman | | PricewaterhouseCoopers LLP | |
Philip K. Polkinghorn, President | | 125 High Street | |
Gina Collopy O’Connell, Senior Vice President | | Boston, MA 02110-1707 | |
Nancy G. Curtiss, Senior Vice President | | | |
Marc Baltuch, Chief Compliance Officer | | | |
W. Patrick Bradley, Vice President, Chief Financial Officer, Treasurer and Principal Accounting Officer | | | |
Kathleen A. McGah, Vice President, Chief Legal Officer, Counsel and Secretary | | | |
THIS PAGE INTENTIONALLY BLANK.
THIS PAGE INTENTIONALLY BLANK.
| | | | | | | | |

Phoenix Life Insurance Company PO Box 22012 Albany, NY 12201-2012 | | | | | | | | PRSRT STD U.S. Postage P A I D Andrew Associates |
| | |
Not insured by FDIC/NCUSIF or any federal government agency. | | |
No bank guarantee. Not a deposit. May lose value. | | |
| |
Phoenix Life Insurance Company | | |
A member of The Phoenix Companies, Inc. phoenixwm.com | | |
| |
BPDXXXXX | | |
G0144A © 2007 The Phoenix Companies, Inc. | | 2-08 |
FRANKLIN TEMPLETON VARIABLE INSURANCE PRODUCTS TRUSTANNUAL REPORT
TABLEOF CONTENTS
| | |
Important Notes to Performance Information | | i |
Fund Summaries | | |
Templeton Developing Markets Securities Fund | | TD-1 |
Templeton Foreign Securities Fund | | TF-1 |
Templeton Global Asset Allocation Fund | | TGA-1 |
Templeton Global Income Securities Fund | | TGI-1 |
Templeton Growth Securities Fund | | TG-1 |
* Prospectus Supplement | | TG-8 |
Index Descriptions | | I-1 |
Board Members and Officers | | BOD-1 |
Shareholder Information | | SI-1 |
*Not part of the annual report
NOT FDIC INSURED | MAY LOSE VALUE | NO BANK GUARANTEE
PHOENIXTIP A07 02/08
IMPORTANT NOTESTOPERFORMANCE INFORMATION
Performance data is historical and cannot predict or guarantee future results. Principal value and investment return will fluctuate with market conditions, and you may have a gain or loss when you withdraw your money. Inception dates of the funds may have preceded the effective dates of the subaccounts, contracts, or their availability in all states.
When reviewing the index comparisons, please keep in mind that indexes have a number of inherent performance differentials over the funds. First, unlike the funds, which must hold a minimum amount of cash to maintain liquidity, indexes do not have a cash component. Second, the funds are actively managed and, thus, are subject to management fees to cover salaries of securities analysts or portfolio managers in addition to other expenses. Indexes are unmanaged and do not include any commissions or other expenses typically associated with investing in securities. Third, indexes often contain a different mix of securities than the fund to which they are compared. Additionally, please remember that indexes are simply a measure of performance and cannot be invested in directly.
i
TEMPLETON DEVELOPING MARKETS SECURITIES FUND
This annual report for Templeton Developing Markets Securities Fund covers the fiscal year ended December 31, 2007.
Performance Summary as of 12/31/07
Average annual total return of Class 1 shares* represents the average annual change in value, assuming reinvestment of dividends and capital gains. Average returns smooth out variations in returns, which can be significant; they are not the same as year-by-year results.
Periods ended 12/31/07
| | | | | | |
| | | 1-Year | | 5-Year | | 10-Year |
Average Annual Total Return | | +29.09% | | +32.38% | | +11.99% |
*Performance prior to the 5/1/00 merger reflects historical performance of Templeton Developing Markets Fund.
Total Return Index Comparison for Hypothetical $10,000 Investment (1/1/98–12/31/07)
The graph below shows the change in value of a hypothetical $10,000 investment in the Fund over the indicated period and includes reinvestment of any income or distributions. The Fund’s performance* is compared to the performance of the Morgan Stanley Capital International (MSCI) Emerging Markets (EM) Index and the Standard & Poor’s/International Finance Corporation Investable (S&P/IFCI) Composite Index. One cannot invest directly in an index, nor is an index representative of the Fund’s portfolio. Please see Important Notes to Performance Information preceding the Fund Summaries.
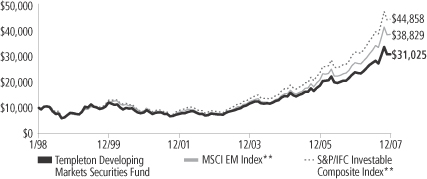
**Source: Standard & Poor’s Micropal. Please see Index Descriptions following the Fund Summaries.
Templeton Developing Markets Securities Fund Class 1
Performance reflects the Fund’s Class 1 operating expenses, but does not include any contract fees, expenses or sales charges. If they had been included, performance would be lower. These charges and deductions, particularly for variable life policies, can have a significant effect on contract values and insurance benefits. See the contract prospectus for a complete description of these expenses, including sales charges.
Performance data represent past performance, which does not guarantee future results. Investment return and principal value will fluctuate, and you may have a gain or loss when you sell your shares.
Current performance may differ from figures shown.
TD-1
Fund Goal and Main Investments: Templeton Developing Markets Securities Fund seeks long-term capital appreciation. The Fund normally invests at least 80% of its net assets in emerging market investments and normally invests primarily to predominantly in equity securities.
Performance Overview
You can find the Fund’s one-year total return in the Performance Summary. The Fund underperformed the MSCI EM Index’s +39.78% return, and the S&P/IFCI Composite Index’s +40.28% return for the same period.1 Please note that index performance numbers are purely for reference and that we do not attempt to track an index, but rather undertake investments on the basis of fundamental research.
Economic and Market Overview
In 2007, emerging markets equities had another positive year. Despite problems brought on by the U.S. subprime lending crisis, emerging markets registered a +39.78% gain for the year, bringing cumulative return for the past five years to +390.79% in U.S. dollar terms, as measured by the MSCI EM Index.2 Most stock markets were supported by a robust macroeconomic environment, surging money supply, rising commodity prices, stronger emerging market currencies, improved corporate earnings and significant investment inflows. Periods of increased volatility, however, occurred during the year as nervous investors reacted to subprime concerns and their impact on the global economy as well as overheating concerns in China.
In Asia, India and China were among the top performing markets as both economies continued to benefit from strong economic growth, a large consumer base and vast foreign reserves. Moreover, Chinese stocks listed in Hong Kong were key beneficiaries of the expansion of China’s Qualified Domestic Institutional Investor (QDII) program, which allowed domestic fund managers and brokerages to invest in foreign securities. Neighboring markets in Indonesia, Thailand and South Korea also recorded respectable gains.
Market returns in Latin America benefited from high commodity prices and stronger regional currencies. Accelerating economic growth, high
1. Source: Standard & Poor’s Micropal. One cannot invest directly in an index, nor is an index representative of the Fund’s portfolio. Please see Index Descriptions following the Fund Summaries.
2. Source: Standard & Poor’s Micropal. Please see Index Descriptions following the Fund Summaries.
Fund Risks: The Fund’s investments in stocks offer the potential for long-term gains but can be subject to short-term price fluctuations. Investing in emerging markets is subject to all the risks of foreign investing generally as well as additional, heightened risks, including currency fluctuations, economic instability, market volatility, political and social instability, the relatively smaller size and lesser liquidity of these markets, and less effective or irregular government supervision and regulation of business and industry practices. The Fund’s prospectus also includes a description of the main investment risks.
TD-2
foreign investment flows and lower interest rates pushed the Brazilian stock market to end the year at record high levels. However, Mexico underperformed its regional peers as concerns of slowing growth in the U.S. led investors to stay on the sidelines.
Despite recording double-digit returns, European and African markets underperformed their emerging market counterparts during the year. Turkey, however, significantly outperformed global markets as investors responded favorably to the central bank’s adoption of a loosening monetary policy, improvement in the country’s public finances, as well as the completion of parliamentary and presidential elections. A stronger lira also boosted stock returns in U.S. dollar terms.
Investment Strategy
Our investment philosophy is bottom-up, value-oriented and long-term. In choosing investments, we may make onsite visits to companies to assess critical factors such as management strength and local conditions. In addition, we focus on the market price of a company’s securities relative to our evaluation of the company’s potential long-term (typically five years) earnings, asset value and cash flow potential. Among factors we consider are a company’s historical value measures, including price/earnings ratio, profit margins and liquidation value. We perform in-depth research to construct an action list from which we make our investment decisions.
Manager’s Discussion
For the 12 months under review, the Fund’s exposure to the materials, energy, telecommunication services and bank sectors contributed significantly to absolute performance.3 Within the materials and energy sectors, holdings in Chalco (Aluminum Corp. of China), CVRD (Companhia Vale do Rio Doce), Petrobras (Petroleo Brasileiro) and Tupras (Tupras-Turkiye Petrol Rafinerileri) were among the largest contributors to performance. Rising oil and commodity prices coupled with growing demand for oil, coal and metals in China as well as other emerging markets benefited these companies.
Additional key contributors included Turkcell (Turkcell Iletisim Hizmetleri) and America Movil in the telecommunication services
3. The materials sector comprises chemicals, construction materials, metals and mining, and paper and forest products and in the SOI. The energy sector comprises energy equipment and services; and oil, gas and consumable fuels in the SOI. The telecommunication services sector comprises diversified telecommunication services and wireless telecommunication services in the SOI. The bank sector comprises commercial banks in the SOI.
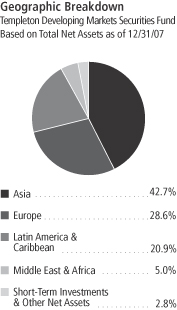
TD-3
sector. Turkish and Brazilian banks, Akbank, Vakifbank (Turkiye Vakiflar Bankasi), Unibanco (Unibanco-Uniao de Bancos Brasileiros) and Banco Bradesco, also boosted Fund performance during the period.
Sectors that detracted from Fund performance included retail and real estate.4 South African stocks Foschini and JD Group declined in value and were the largest detractors in the retail sector during the period. In the real estate sector, Emaar Properties was a major detractor, and we sold it during the period.
Geographically, investments in Brazil, Turkey and China made noteworthy contributions to Fund performance. In addition to stocks discussed earlier, THY (Turk Hava Yollari Anonim Ortakligi), Turkey’s national airline; Souza Cruz, Brazil’s leading major tobacco company; Sinopec (China Petroleum and Chemical), the largest integrated energy company in China; and PetroChina, a dominant player in the upstream oil and gas sector, also supported performance.
It is important to recognize the effect of currency movements on the Fund’s performance. In general, if the value of the U.S. dollar goes up compared with a foreign currency, an investment traded in that foreign currency will go down in value because it will be worth fewer U.S. dollars. This can have a negative effect on Fund performance. Conversely, when the U.S. dollar weakens in relation to a foreign currency, an investment traded in that foreign currency will increase in value, which can contribute to Fund performance. For the 12 months ended December 31, 2007, the U.S. dollar declined in value relative to most non-U.S. currencies. As a result, the Fund’s performance was positively affected by the portfolio’s investments predominantly in securities with non-U.S. currency exposure. However, one cannot expect the same result in future periods.
During the reporting period, we made significant purchases in Russia, India, Mexico and China (via Hong Kong-listed China H shares).5 Major investments included shares of America Movil, UES (Unified Energy Systems), China Telecom and Sberbank (Savings Bank of Russia).
4. The retail sector comprises specialty retail in the SOI. The real estate sector comprises real estate management and development in the SOI.
5. “China H” denotes shares of China-incorporated, Hong Kong-listed companies with most businesses in China.
Top 10 Holdings
Templeton Developing Markets Securities Fund
12/31/07
| | |
Company
Sector/Industry,
Country | | % of Total
Net Assets |
| |
CVRD (Companhia Vale do Rio Doce), ADR,
pfd., A | | 5.4% |
| Metals & Mining, Brazil | | |
| |
| Petrobras (Petroleo Brasileiro SA), ADR, pfd. | | 4.9% |
| Oil, Gas & Consumable Fuels, Brazil | | |
| |
| Chalco (Aluminum Corp. of China Ltd.), H & 144A | | 3.8% |
| Metals & Mining, China | | |
| |
| Akbank TAS | | 3.5% |
| Commercial Banks, Turkey | | |
| |
| UES (Unified Energy Systems) | | 3.4% |
| Electric Utilities, Russia | | |
| |
| Gazprom OAO, ord. & ADR | | 3.3% |
| Oil, Gas & Consumable Fuels, Russia | | |
| |
| SK Energy Co. Ltd. | | 3.1% |
| Oil, Gas & Consumable Fuels, South Korea | | |
| |
| Norilsk Nickel (Mining and Metallurgical Co. Norilsk Nickel) | | 3.1% |
| Metals & Mining, Russia | | |
| |
| PetroChina Co. Ltd., H | | 2.7% |
| Oil, Gas & Consumable Fuels, China | | |
| |
| America Movil SAB de CV, L, ADR | | 2.5% |
| Wireless Telecommunication Services, Mexico | | |
The dollar value, number of shares or principal amount, and names of all portfolio holdings are listed in the Fund’s Statement of Investments (SOI).
TD-4
We also made select additions in Pakistan, Peru and Chile as we continued to search for undervalued stocks trading at attractive valuations.
From a sector perspective, we increased the Fund’s allocations to several sectors based on what we considered favorable market trends. We expected commodity prices to stay at relatively high levels amid growing global energy demand, so we increased our investments in coal and diversified metals and mining companies.6 Greater global demand for consumer products and services also led us to increase our allocation to integrated telecommunication services, home furnishings and automobile manufacturing companies.7 We also increased the Fund’s exposure to the information technology (IT) consulting industry because of strong demand for outsourcing services.8 We initiated a position in Tata Consultancy Services, India’s leading IT consulting and outsourcing services provider.
To raise funds for redemptions during the reporting period, we sold a number of holdings. These sales also allowed the Fund to focus on stocks we considered relatively more attractively valued within our investment universe. We sold select positions as stocks reached sale price targets. As a result, the Fund’s exposure to the tobacco, semiconductors, diversified banking, and life and health insurance industries fell.9 Major sales included all or part of Remgro, Old Mutual, Samsung Electronics and Hana Financial Group.
Thank you for your participation in Templeton Developing Markets Securities Fund. We look forward to serving your future investment needs.
6. The coal industry is part of oil, gas and consumable fuels in the SOI. The diversified metals and mining industry is part of metals and mining in the SOI.
7. The integrated telecommunication services industry is part of diversified telecommunication services in the SOI. The home furnishings industry is part of household durables in the SOI. The automobile manufacturing industry is part of automobiles in the SOI.
8. The IT consulting industry is part of IT services in the SOI.
9. The semiconductors industry is part of semiconductors and semiconductor equipment in the SOI. The diversified banking industry is part of commercial banks in the SOI. The life and health insurance industry is part of insurance in the SOI.
The foregoing information reflects our analysis, opinions and portfolio holdings as of December 31, 2007, the end of the reporting period. The way we implement our main investment strategies and the resulting portfolio holdings may change depending on factors such as market and economic conditions. These opinions may not be relied upon as investment advice or an offer for a particular security. The information is not a complete analysis of every aspect of any market, country, industry, security or the Fund. Statements of fact are from sources considered reliable, but the investment manager makes no representation or warranty as to their completeness or accuracy. Although historical performance is no guarantee of future results, these insights may help you understand our investment management philosophy.
Top 10 Countries
Templeton Developing Markets Securities Fund 12/31/07
| | |
| | | % of Total
Net Assets |
| |
| China | | 19.7% |
| |
| Brazil | | 15.9% |
| |
| Russia | | 13.0% |
| |
| Turkey | | 9.4% |
| |
| South Korea | | 8.0% |
| |
| India | | 5.5% |
| |
| South Africa | | 4.6% |
| |
| Mexico | | 4.5% |
| |
| Taiwan | | 2.9% |
| |
| Thailand | | 2.5% |
TD-5
Fund Expenses
As an investor in a variable insurance contract (Contract) that indirectly provides for investment in an underlying mutual fund, you can incur transaction and/or ongoing expenses at both the Fund level and the Contract level.
| • | | Transaction expenses can include sales charges (loads) on purchases, redemption fees, surrender fees, transfer fees and premium taxes. |
| • | | Ongoing expenses can include management fees, distribution and service (12b-1) fees, contract fees, annual maintenance fees, mortality and expense risk fees and other fees and expenses. All mutual funds and Contracts have some types of ongoing expenses. |
The expenses shown in the table are meant to highlight ongoing expenses at the Fund level only and do not include ongoing expenses at the Contract level, or transaction expenses at either the Fund or Contract level. While the Fund does not have transaction expenses, if the transaction and ongoing expenses at the Contract level were included, the expenses shown below would be higher. You should consult your Contract prospectus or disclosure document for more information.
The table shows Fund-level ongoing expenses and can help you understand these expenses and compare them with those of other mutual funds offered through the Contract. The table assumes a $1,000 investment held for the six months indicated. Please refer to the Fund prospectus for additional information on operating expenses.
Actual Fund Expenses
The first line (Actual) of the table provides actual account values and expenses. The “Ending Account Value” is derived from the Fund’s actual return, which includes the effect of ongoing Fund expenses, but does not include the effect of ongoing Contract expenses.
You can estimate the Fund-level expenses you incurred during the period by following these steps. Of course, your account value and expenses will differ from those in this illustration:
| 1. | Divide your account value by $1,000. |
If an account had an $8,600 value, then $8,600 ÷ $1,000 = 8.6.
| 2. | Multiply the result by the number under the heading “Fund-Level Expenses Incurred During Period.” |
If Fund-Level Expenses Incurred During Period were $7.50, then 8.6 x $7.50 = $64.50.
In this illustration, the estimated expenses incurred this period at the Fund level are $64.50.
Templeton Developing Markets Securities Fund Class 1
TD-6
Hypothetical Example for Comparison with Other Mutual Funds
Information in the second line (Hypothetical) of the table can help you compare ongoing expenses of the Fund with those of other mutual funds offered through the Contract. This information may not be used to estimate the actual ending account balance or expenses you incurred during the period. The hypothetical “Ending Account Value” is based on the Fund’s actual expense ratio and an assumed 5% annual rate of return before expenses, which does not represent the Fund’s actual return. The figure under the heading “Fund-Level Expenses Incurred During Period” shows the hypothetical expenses your account would have incurred under this scenario. You can compare this figure with the 5% hypothetical examples that appear in shareholder reports of other funds offered through a Contract.
| | | | | | | | | |
| Class 1 | | Beginning
Account Value 7/1/07 | | Ending Account Value 12/31/07 | | Fund-Level
Expenses Incurred
During Period*
7/1/07–12/31/07 |
Actual | | $ | 1,000 | | $ | 1,120.60 | | $ | 7.96 |
Hypothetical (5% return before expenses) | | $ | 1,000 | | $ | 1,017.69 | | $ | 7.58 |
*Expenses are calculated using the most recent six-month annualized expense ratio for the Fund’s Class 1 shares (1.49%), which does not include any ongoing expenses of the Contract for which the Fund is an investment option, multiplied by the average account value over the period, multiplied by 184/365 to reflect the one-half year period.
TD-7
Franklin Templeton Variable Insurance Products Trust
Financial Highlights
Templeton Developing Markets Securities Fund
| | | | | | | | | | | | | | | | | | | | |
| | | Year Ended December 31, | |
| Class 1 | | 2007 | | | 2006 | | | 2005 | | | 2004 | | | 2003 | |
| | | | |
Per share operating performance | | | | | | | | | | | | | | | | | | | | |
(for a share outstanding throughout the year) | | | | | | | | | | | | | | | | | | | | |
Net asset value, beginning of year | | $ | 13.92 | | | $ | 10.99 | | | $ | 8.73 | | | $ | 7.14 | | | $ | 4.71 | |
| | | | |
Income from investment operationsa: | | | | | | | | | | | | | | | | | | | | |
Net investment incomeb | | | 0.32 | | | | 0.24 | | | | 0.17 | | | | 0.11 | | | | 0.13 | |
Net realized and unrealized gains (losses) | | | 3.51 | | | | 2.84 | | | | 2.23 | | | | 1.62 | | | | 2.38 | |
| | | | |
Total from investment operations | | | 3.83 | | | | 3.08 | | | | 2.40 | | | | 1.73 | | | | 2.51 | |
| | | | |
Less distributions from: | | | | | | | | | | | | | | | | | | | | |
Net investment income | | | (0.38 | ) | | | (0.15 | ) | | | (0.14 | ) | | | (0.14 | ) | | | (0.08 | ) |
Net realized gains | | | (1.21 | ) | | | — | | | | — | | | | — | | | | — | |
| | | | |
Total distributions | | | (1.59 | ) | | | (0.15 | ) | | | (0.14 | ) | | | (0.14 | ) | | | (0.08 | ) |
| | | | |
Redemption fees | | | — | d | | | — | d | | | — | d | | | — | | | | — | |
| | | | |
Net asset value, end of year | | $ | 16.16 | | | $ | 13.92 | | | $ | 10.99 | | | $ | 8.73 | | | $ | 7.14 | |
| | | | |
| | | | | |
Total returnc | | | 29.09% | | | | 28.43% | | | | 27.76% | | | | 24.83% | | | | 53.74% | |
Ratios to average net assets | | | | | | | | | | | | | | | | | | | | |
Expenses | | | 1.48% | e | | | 1.47% | e | | | 1.53% | e | | | 1.54% | e | | | 1.55% | |
Net investment income | | | 2.07% | | | | 1.93% | | | | 1.77% | | | | 1.52% | | | | 2.35% | |
| | | | | |
Supplemental data | | | | | | | | | | | | | | | | | | | | |
Net assets, end of year (000’s) | | $ | 753,843 | | | $ | 749,120 | | | $ | 651,826 | | | $ | 477,290 | | | $ | 359,299 | |
Portfolio turnover rate | | | 98.32% | | | | 53.65% | | | | 31.24% | | | | 55.67% | | | | 46.20% | |
a The amount shown for a share outstanding throughout the period may not correlate with the Statement of Operations for the period due to the timing of sales and repurchases of the Fund shares in relation to income earned and/or fluctuating market value of the investments of the Fund.
b Based on average daily shares outstanding.
c Total return does not include any fees, charges or expenses imposed by the variable annuity and life insurance contracts for which the Franklin Templeton Variable Insurance Products Trust serves as an underlying investment vehicle.
d Amount rounds to less than $0.01 per share.
e Benefit of expense reduction rounds to less than 0.01%.
The accompanying notes are an integral part of these financial statements.
TD-8
Franklin Templeton Variable Insurance Products Trust
Financial Highlights (continued)
Templeton Developing Markets Securities Fund
| | | | | | | | | | | | | | | | | | | | |
| | | Year Ended December 31, | |
| Class 2 | | 2007 | | | 2006 | | | 2005 | | | 2004 | | | 2003 | |
| | | | |
Per share operating performance | | | | | | | | | | | | | | | | | | | | |
(for a share outstanding throughout the year) | | | | | | | | | | | | | | | | | | | | |
Net asset value, beginning of year | | $ | 13.79 | | | $ | 10.90 | | | $ | 8.67 | | | $ | 7.09 | | | $ | 4.69 | |
| | | | |
Income from investment operationsa: | | | | | | | | | | | | | | | | | | | | |
Net investment incomeb | | | 0.27 | | | | 0.20 | | | | 0.14 | | | | 0.09 | | | | 0.11 | |
Net realized and unrealized gains (losses) | | | 3.49 | | | | 2.82 | | | | 2.21 | | | | 1.63 | | | | 2.35 | |
| | | | |
Total from investment operations | | | 3.76 | | | | 3.02 | | | | 2.35 | | | | 1.72 | | | | 2.46 | |
| | | | |
Less distributions from: | | | | | | | | | | | | | | | | | | | | |
Net investment income | | | (0.35 | ) | | | (0.13 | ) | | | (0.12 | ) | | | (0.14 | ) | | | (0.06 | ) |
Net realized gains | | | (1.21 | ) | | | — | | | | — | | | | — | | | | — | |
| | | | |
Total distributions | | | (1.56 | ) | | | (0.13 | ) | | | (0.12 | ) | | | (0.14 | ) | | | (0.06 | ) |
| | | | |
Redemption fees | | | — | d | | | — | d | | | — | d | | | — | | | | — | |
| | | | |
Net asset value, end of year | | $ | 15.99 | | | $ | 13.79 | | | $ | 10.90 | | | $ | 8.67 | | | $ | 7.09 | |
| | | | |
| | | | | |
Total returnc | | | 28.78% | | | | 28.09% | | | | 27.43% | | | | 24.71% | | | | 52.99% | |
Ratios to average net assets | | | | | | | | | | | | | | | | | | | | |
Expenses | | | 1.73% | e | | | 1.72% | e | | | 1.78% | e | | | 1.79% | e | | | 1.80% | |
Net investment income | | | 1.82% | | | | 1.68% | | | | 1.52% | | | | 1.27% | | | | 2.10% | |
| | | | | |
Supplemental data | | | | | | | | | | | | | | | | | | | | |
Net assets, end of year (000’s) | | $ | 1,090,549 | | | $ | 857,514 | | | $ | 650,646 | | | $ | 327,569 | | | $ | 170,953 | |
Portfolio turnover rate | | | 98.32% | | | | 53.65% | | | | 31.24% | | | | 55.67% | | | | 46.20% | |
a The amount shown for a share outstanding throughout the period may not correlate with the Statement of Operations for the period due to the timing of sales and repurchases of the Fund shares in relation to income earned and/or fluctuating market value of the investments of the Fund.
b Based on average daily shares outstanding.
c Total return does not include any fees, charges or expenses imposed by the variable annuity and life insurance contracts for which the Franklin Templeton Variable Insurance Products Trust serves as an underlying investment vehicle.
d Amount rounds to less than $0.01 per share.
e Benefit of expense reduction rounds to less than 0.01%.
The accompanying notes are an integral part of these financial statements.
TD-9
Franklin Templeton Variable Insurance Products Trust
Financial Highlights (continued)
Templeton Developing Markets Securities Fund
| | | | | | | | | | | | | | | | |
| | | Year Ended December 31, | |
| Class 3 | | 2007 | | | 2006 | | | 2005 | | | 2004g | |
| | | | |
Per share operating performance | | | | | | | | | | | | | | | | |
(for a share outstanding throughout the year) | | | | | | | | | | | | | | | | |
Net asset value, beginning of year | | $ | 13.78 | | | $ | 10.90 | | | $ | 8.68 | | | $ | 7.13 | |
| | | | |
Income from investment operationsa: | | | | | | | | | | | | | | | | |
Net investment incomeb | | | 0.24 | | | | 0.20 | | | | 0.04 | | | | 0.08 | |
Net realized and unrealized gains (losses) | | | 3.52 | | | | 2.83 | | | | 2.32 | | | | 1.61 | |
| | | | |
Total from investment operations | | | 3.76 | | | | 3.03 | | | | 2.36 | | | | 1.69 | |
| | | | |
Less distributions from: | | | | | | | | | | | | | | | | |
Net investment income | | | (0.37 | ) | | | (0.15 | ) | | | (0.14 | ) | | | (0.14 | ) |
Net realized gains | | | (1.21 | ) | | | — | | | | — | | | | — | |
| | | | |
Total distributions | | | (1.58 | ) | | | (0.15 | ) | | | (0.14 | ) | | | (0.14 | ) |
| | | | |
Redemption fees | | | — | e | | | — | e | | | — | e | | | — | |
| | | | |
Net asset value, end of year | | $ | 15.96 | | | $ | 13.78 | | | $ | 10.90 | | | $ | 8.68 | |
| | | | |
| | | | |
Total returnc | | | 28.70% | | | | 28.17% | | | | 27.45% | | | | 24.15% | |
Ratios to average net assetsd | | | | | | | | | | | | | | | | |
Expenses | | | 1.73% | f | | | 1.72% | f | | | 1.78% | f | | | 1.54% | f |
Net investment income | | | 1.82% | | | | 1.68% | | | | 1.52% | | | | 1.52% | |
| | | | |
Supplemental data | | | | | | | | | | | | | | | | |
Net assets, end of year (000’s) | | $ | 100,961 | | | $ | 43,372 | | | $ | 11,521 | | | $ | 12 | |
Portfolio turnover rate | | | 98.32% | | | | 53.65% | | | | 31.24% | | | | 55.67% | |
aThe amount shown for a share outstanding throughout the period may not correlate with the Statement of Operations for the period due to the timing of sales and repurchases of the Fund shares in relation to income earned and/or fluctuating market value of the investments of the Fund.
bBased on average daily shares outstanding.
cTotal return does not include any fees, charges or expenses imposed by the variable annuity and life insurance contracts for which the Franklin Templeton Variable Insurance Products Trust serves as an underlying investment vehicle. Total return is not annualized for periods less than one year.
dRatios are annualized for periods less than one year.
eAmount rounds to less than $0.01 per share.
fBenefit of expense reduction rounds to less than 0.01%.
gFor the period May 1, 2004 (effective date) to December 31, 2004.
The accompanying notes are an integral part of these financial statements.
TD-10
Franklin Templeton Variable Insurance Products Trust
Statement of Investments, December 31, 2007
| | | | | | | |
| Templeton Developing Markets Securities Fund | | Industry | | Shares/
Rights | | Value |
Long Term Investments 97.2% | | | |
Common Stocks and Rights 82.9% | | | |
Austria 1.0% | | | | | | | |
Erste Bank der oesterreichischen Sparkassen AG | | Commercial Banks | | 41,280 | | $ | 2,921,736 |
aIMMOEAST AG | | Real Estate Management &
Development | | 93,380 | | | 1,004,340 |
aMeinl European Land Ltd. | | Real Estate Management &
Development | | 91,625 | | | 1,260,913 |
OMV AG | | Oil, Gas & Consumable Fuels | | 136,419 | | | 11,033,183 |
Wienerberger AG | | Building Products | | 65,200 | | | 3,609,025 |
| | | | | | | |
| | | | | | | 19,829,197 |
| | | | | | | |
Brazil 1.8% | | | | | | | |
AES Tiete SA | | Independent Power Producers &
Energy Traders | | 155,680,382 | | | 6,909,410 |
Companhia de Bebidas das Americas (AmBev) | | Beverages | | 29,645 | | | 2,081,812 |
bCompanhia Energetica de Minas Gerais | | Electric Utilities | | 36,432 | | | 691,594 |
Energias do Brasil SA | | Electrical Equipment | | 133,775 | | | 2,171,965 |
cMarfrig Frigorificos e Comercio De Alimentos SA, 144A | | Food Products | | 396,359 | | | 3,395,772 |
Natura Cosmeticos SA | | Personal Products | | 252,304 | | | 2,409,645 |
Porto Seguro SA | | Insurance | | 83,300 | | | 3,088,652 |
Souza Cruz SA | | Tobacco | | 506,617 | | | 13,718,505 |
| | | | | | | |
| | | | | | | 34,467,355 |
| | | | | | | |
China 19.7% | | | | | | | |
Air China Ltd., H | | Airlines | | 5,102,000 | | | 7,602,524 |
Aluminum Corp. of China Ltd., H | | Metals & Mining | | 33,453,000 | | | 69,067,247 |
cAluminum Corp. of China Ltd., H, 144A | | Metals & Mining | | 1,954,000 | | | 4,034,239 |
Beijing Capital Land Ltd., H | | Real Estate Management &
Development | | 3,840,000 | | | 2,334,107 |
China Construction Bank Corp., H | | Commercial Banks | | 7,486,000 | | | 6,345,451 |
China International Marine Containers (Group) Co. Ltd., B | | Machinery | | 1,778,449 | | | 3,300,055 |
China Mobile Ltd. | | Wireless Telecommunication Services | | 2,230,500 | | | 39,443,704 |
China Netcom Group Corp. (Hong Kong) Ltd. | | Diversified Telecommunication Services | | 3,791,000 | | | 11,400,078 |
China Petroleum and Chemical Corp., H | | Oil, Gas & Consumable Fuels | | 30,418,000 | | | 45,950,172 |
China Shenhua Energy Co. Ltd., H | | Oil, Gas & Consumable Fuels | | 1,298,000 | | | 7,756,607 |
China Telecom Corp. Ltd., H | | Diversified Telecommunication Services | | 47,082,000 | | | 37,433,272 |
CNOOC Ltd. | | Oil, Gas & Consumable Fuels | | 17,006,000 | | | 28,960,860 |
Denway Motors Ltd. | | Automobiles | | 27,738,234 | | | 17,820,822 |
Dongfeng Motor Corp., H | | Automobiles | | 13,846,000 | | | 9,765,584 |
aHidili Industry International Development | | Metals & Mining | | 5,172,000 | | | 7,945,597 |
a,cHidili Industry International Development, 144A | | Metals & Mining | | 940,000 | | | 1,444,095 |
Huaneng Power International Inc., H | | Independent Power Producers &
Energy Traders | | 2,286,000 | | | 2,406,748 |
Industrial and Commercial Bank of China, H | | Commercial Banks | | 1,363,000 | | | 978,803 |
Jiangxi Copper Co. Ltd., H | | Metals & Mining | | 3,230,000 | | | 7,927,854 |
Nine Dragons Paper Holdings Ltd. | | Paper & Forest Products | | 894,000 | | | 2,260,766 |
PetroChina Co. Ltd., H | | Oil, Gas & Consumable Fuels | | 29,290,000 | | | 52,209,000 |
Shanghai Industrial Holdings Ltd. | | Industrial Conglomerates | | 2,797,000 | | | 12,195,022 |
aSoho China Ltd. | | Real Estate Management &
Development | | 3,231,500 | | | 3,335,886 |
a,cSoho China Ltd., 144A | | Real Estate Management &
Development | | 1,094,000 | | | 1,129,339 |
Travelsky Technology Ltd., H | | IT Services | | 788,000 | | | 837,707 |
| | | | | | | |
| | | | | | | 383,885,539 |
| | | | | | | |
TD-11
Franklin Templeton Variable Insurance Products Trust
Statement of Investments, December 31, 2007 (continued)
| | | | | | | |
| Templeton Developing Markets Securities Fund | | Industry | | Shares/
Rights | | Value |
Long Term Investments (continued) | | | |
Common Stocks and Rights (continued) | | | |
Egypt 0.2% | | | | | | | |
Orascom Construction Industries | | Construction & Engineering | | 28,719 | | $ | 2,988,338 |
Telecom Egypt | | Diversified Telecommunication
Services | | 344,639 | | | 1,307,644 |
| | | | | | | |
| | | | | | | 4,295,982 |
| | | | | | | |
Hong Kong 1.4% | | | | | | | |
Citic Pacific Ltd. | | Industrial Conglomerates | | 1,012,000 | | | 5,651,710 |
Dairy Farm International Holdings Ltd. | | Food & Staples Retailing | | 958,033 | | | 4,177,024 |
GOME Electrical Appliances Holdings Ltd. | | Specialty Retail | | 3,925,000 | | | 9,965,889 |
Hopson Development Holdings Ltd. | | Real Estate Management &
Development | | 814,000 | | | 2,249,484 |
Hutchison Whampoa Ltd. | | Industrial Conglomerates | | 381,000 | | | 4,321,495 |
VTech Holdings Ltd. | | Communications Equipment | | 220,000 | | | 1,579,872 |
| | | | | | | |
| | | | | | | 27,945,474 |
| | | | | | | |
Hungary 1.3% | | | | | | | |
Magyar Telekom PLC | | Diversified Telecommunication
Services | | 260,980 | | | 1,354,880 |
MOL Hungarian Oil and Gas Nyrt. | | Oil, Gas & Consumable Fuels | | 155,903 | | | 22,028,403 |
OTP Bank Ltd. | | Commercial Banks | | 48,284 | | | 2,448,179 |
| | | | | | | |
| | | | | | | 25,831,462 |
| | | | | | | |
India 5.5% | | | | | | | |
Ashok Leyland Ltd. | | Machinery | | 2,441,613 | | | 3,222,024 |
aBharti Airtel Ltd. | | Wireless Telecommunication Services | | 174,350 | | | 4,400,452 |
Dr. Reddy’s Laboratories Ltd. | | Pharmaceuticals | | 102,515 | | | 1,913,067 |
Gail India Ltd. | | Gas Utilities | | 741,937 | | | 10,205,988 |
Grasim Industries Ltd. | | Construction Materials | | 975 | | | 90,352 |
Hindalco Industries Ltd. | | Metals & Mining | | 1,474,292 | | | 8,038,362 |
Hindustan Unilever Ltd. | | Household Products | | 890,042 | | | 4,831,366 |
Maruti Suzuki India Ltd. | | Automobiles | | 69,329 | | | 1,741,890 |
National Aluminium Co. Ltd. | | Metals & Mining | | 531,656 | | | 6,640,134 |
Oil & Natural Gas Corp. Ltd. | | Oil, Gas & Consumable Fuels | | 880,633 | | | 27,633,618 |
Reliance Industries Ltd. | | Oil, Gas & Consumable Fuels | | 105,798 | | | 7,735,296 |
Satyam Computer Services Ltd. | | IT Services | | 180,985 | | | 2,062,921 |
Tata Chemicals Ltd. | | Chemicals | | 288,562 | | | 3,021,461 |
Tata Consultancy Services Ltd. | | IT Services | | 585,450 | | | 16,095,604 |
Tata Motors Ltd. | | Machinery | | 74,900 | | | 1,410,564 |
Tata Steel Ltd. | | Metals & Mining | | 326,300 | | | 7,740,775 |
| | | | | | | |
| | | | | | | 106,783,874 |
| | | | | | | |
Indonesia 0.4% | | | | | | | |
PT Bank Central Asia Tbk | | Commercial Banks | | 3,686,500 | | | 2,865,206 |
PT Telekomunikasi Indonesia, B | | Diversified Telecommunication
Services | | 5,136,000 | | | 5,550,216 |
| | | | | | | |
| | | | | | | 8,415,422 |
| | | | | | | |
Israel 0.2% | | | | | | | |
aTaro Pharmaceutical Industries Ltd. | | Pharmaceuticals | | 421,589 | | | 3,246,235 |
| | | | | | | |
Mexico 4.5% | | | | | | | |
Alfa SAB de CV | | Industrial Conglomerates | | 314,900 | | | 2,033,567 |
America Movil SAB de CV, L, ADR | | Wireless Telecommunication Services | | 785,958 | | | 48,249,961 |
Cemex SAB de CV, CPO, ADR | | Construction Materials | | 72,810 | | | 1,882,138 |
TD-12
Franklin Templeton Variable Insurance Products Trust
Statement of Investments, December 31, 2007 (continued)
| | | | | | | |
| Templeton Developing Markets Securities Fund | | Industry | | Shares/
Rights | | Value |
Long Term Investments (continued) | | | | | | | |
Common Stocks and Rights (continued) | | | | | | | |
Mexico (continued) | | | | | | | |
Consorcio ARA SAB de CV | | Household Durables | | 608,239 | | $ | 679,721 |
Fomento Economico Mexicano SAB de CV, ADR | | Beverages | | 59,900 | | | 2,286,383 |
Grupo Televisa SA | | Media | | 1,758,426 | | | 8,390,255 |
Kimberly Clark de Mexico SAB de CV, A | | Household Products | | 3,444,116 | | | 15,035,868 |
Telefonos de Mexico SAB de CV, L, ADR | | Diversified Telecommunication
Services | | 217,164 | | | 8,000,322 |
| | | | | | | |
| | | | | | | 86,558,215 |
| | | | | | | |
Pakistan 1.0% | | | | | | | |
MCB Bank Ltd. | | Commercial Banks | | 1,347,758 | | | 8,743,484 |
Oil & Gas Development Co. Ltd. | | Oil, Gas & Consumable Fuels | | 1,471,000 | | | 2,850,137 |
Pakistan Telecommunications Corp., A | | Diversified Telecommunication
Services | | 10,629,808 | | | 7,250,340 |
| | | | | | | |
| | | | | | | 18,843,961 |
| | | | | | | |
Peru 0.4% | | | | | | | |
Compania de Minas Buenaventura SA, ADR | | Metals & Mining | | 130,510 | | | 7,386,866 |
| | | | | | | |
Philippines 0.4% | | | | | | | |
San Miguel Corp., B | | Beverages | | 5,635,093 | | | 8,132,138 |
| | | | | | | |
Poland 0.6% | | | | | | | |
aPolski Koncern Naftowy Orlen SA | | Oil, Gas & Consumable Fuels | | 572,544 | | | 12,035,738 |
| | | | | | | |
Russia 13.0% | | | | | | | |
Bank Of Moscow | | Commercial Banks | | 24,838 | | | 1,297,786 |
Fifth Power Generation Co. | | Electric Utilities | | 1,192,148 | | | 208,864 |
Gazprom, ADR | | Oil, Gas & Consumable Fuels | | 564,100 | | | 31,674,215 |
Gazprom OAO | | Oil, Gas & Consumable Fuels | | 872,000 | | | 12,286,480 |
Gazprom OAO, ADR | | Oil, Gas & Consumable Fuels | | 358,500 | | | 20,326,950 |
LUKOIL, ADR | | Oil, Gas & Consumable Fuels | | 195,908 | | | 16,857,883 |
LUKOIL, ADR | | Oil, Gas & Consumable Fuels | | 93,368 | | | 8,066,995 |
Mining and Metallurgical Co. Norilsk Nickel | | Metals & Mining | | 226,087 | | | 59,913,055 |
OAO TMK, GDR | | Energy Equipment & Services | | 46,000 | | | 2,047,000 |
Sberbank RF | | Commercial Banks | | 4,750,220 | | | 20,045,928 |
TGC-5 JSC | | Independent Power Producers
& Energy Traders | | 39,352,044 | | | 35,614 |
TNK-BP | | Oil, Gas & Consumable Fuels | | 6,726,760 | | | 15,000,675 |
aUnified Energy Systems | | Electric Utilities | | 49,702,100 | | | 65,308,560 |
| | | | | | | |
| | | | | | | 253,070,005 |
| | | | | | | |
Singapore 0.8% | | | | | | | |
ComfortDelGro Corp. Ltd. | | Road & Rail | | 3,250,654 | | | 4,126,884 |
Fraser and Neave Ltd. | | Industrial Conglomerates | | 2,473,005 | | | 10,122,258 |
Keppel Corp. Ltd. | | Industrial Conglomerates | | 143,000 | | | 1,289,674 |
| | | | | | | |
| | | | | | | 15,538,816 |
| | | | | | | |
South Africa 4.6% | | | | | | | |
Barloworld Ltd. | | Industrial Conglomerates | | 160,000 | | | 2,510,124 |
Foschini Ltd. | | Specialty Retail | | 1,324,826 | | | 9,321,063 |
aFreeworld Coatings Ltd. | | Specialty Retail | | 160,000 | | | 245,885 |
Imperial Holdings Ltd. | | Air Freight & Logistics | | 387,779 | | | 5,896,048 |
JD Group Ltd. | | Specialty Retail | | 858,339 | | | 6,376,590 |
Lewis Group Ltd. | | Specialty Retail | | 1,182,661 | | | 7,915,990 |
TD-13
Franklin Templeton Variable Insurance Products Trust
Statement of Investments, December 31, 2007 (continued)
| | | | | | | |
| Templeton Developing Markets Securities Fund | | Industry | | Shares/
Rights | | Value |
Long Term Investments (continued) | | | |
Common Stocks and Rights (continued) | | | |
South Africa (continued) | | | | | | | |
MTN Group Ltd. | | Wireless Telecommunication
Services | | 1,228,460 | | $ | 22,915,745 |
Remgro Ltd. | | Diversified Financial Services | | 715,439 | | | 20,694,060 |
Standard Bank Group Ltd. | | Commercial Banks | | 434,688 | | | 6,337,010 |
Tiger Brands Ltd. | | Food Products | | 294,700 | | | 7,211,886 |
| | | | | | | |
| | | | | | | 89,424,401 |
| | | | | | | |
South Korea 8.0% | | | | | | | |
aDaewoo Shipbuilding & Marine Engineering Co. Ltd. | | Machinery | | 97,330 | | | 5,365,342 |
aGS Holdings Corp. | | Oil, Gas & Consumable Fuels | | 179,110 | | | 11,117,238 |
aKangwon Land Inc. | | Hotels Restaurants & Leisure | | 471,405 | | | 12,388,829 |
bPOSCO | | Metals & Mining | | 15,750 | | | 9,674,964 |
Samsung Electronics Co. Ltd. | | Semiconductors & Semiconductor
Equipment | | 21,974 | | | 13,052,234 |
a,bSamsung Heavy Industries Co. Ltd. | | Machinery | | 194,290 | | | 8,344,061 |
a,bSK Energy Co. Ltd. | | Oil, Gas & Consumable Fuels | | 313,791 | | | 60,676,429 |
aSK Holdings Co. Ltd. | | Industrial Conglomerates | | 120,935 | | | 25,581,037 |
aSKC Co. Ltd. | | Household Durables | | 29,380 | | | 878,842 |
a,bWoori Finance Holdings Co. Ltd. | | Commercial Banks | | 426,000 | | | 8,578,708 |
| | | | | | | |
| | | | | | | 155,657,684 |
| | | | | | | |
Sweden 1.2% | | | | | | | |
Oriflame Cosmetics SA, SDR | | Personal Products | | 349,538 | | | 22,326,924 |
| | | | | | | |
Taiwan 2.9% | | | | | | | |
Compal Communications Inc. | | Communications Equipment | | 1,207,000 | | | 2,996,099 |
MediaTek Inc. | | Semiconductors & Semiconductor
Equipment | | 348,000 | | | 4,517,669 |
Novatek Microelectronics Corp. Ltd. | | Semiconductors & Semiconductor
Equipment | | 2,219,574 | | | 8,486,808 |
President Chain Store Corp. | | Food & Staples Retailing | | 6,552,144 | | | 17,213,773 |
Siliconware Precision Industries Co. | | Semiconductors & Semiconductor
Equipment | | 6,282,666 | | | 11,294,463 |
Sunplus Technology Co. Ltd. | | Semiconductors & Semiconductor
Equipment | | 3,226,485 | | | 4,835,251 |
Taiwan Semiconductor Manufacturing Co. Ltd. | | Semiconductors & Semiconductor
Equipment | | 3,855,414 | | | 7,370,819 |
| | | | | | | |
| | | | | | | 56,714,882 |
| | | | | | | |
Thailand 2.5% | | | | | | | |
Kasikornbank Public Co. Ltd., fgn. | | Commercial Banks | | 4,150,367 | | | 10,780,974 |
aPTT Aromatics & Refining Public Co. Ltd., fgn. | | Oil, Gas & Consumable Fuels | | 1,675,803 | | | 2,139,217 |
PTT Public Co. Ltd., fgn. | | Oil, Gas & Consumable Fuels | | 1,088,000 | | | 12,144,515 |
Siam Cement Public Co. Ltd., fgn. | | Construction Materials | | 2,082,014 | | | 14,463,152 |
Siam Commercial Bank Public Co. Ltd., fgn. | | Commercial Banks | | 1,165,957 | | | 3,011,378 |
Thai Beverages Co. Ltd.,fgn. | | Beverages | | 36,319,000 | | | 6,425,020 |
aTrue Corp. Public Co. Ltd., fgn., rts., 3/28/08 | | Diversified Telecommunication
Services | | 344,616 | | | — |
| | | | | | | |
| | | | | | | 48,964,256 |
| | | | | | | |
Turkey 9.4% | | | | | | | |
Akbank TAS | | Commercial Banks | | 9,133,220 | | | 68,044,542 |
Anadolu Efes Biracilik Ve Malt Sanayii AS | | Beverages | | 615,365 | | | 7,324,833 |
TD-14
Franklin Templeton Variable Insurance Products Trust
Statement of Investments, December 31, 2007 (continued)
| | | | | | | | |
| Templeton Developing Markets Securities Fund | | Industry | | Shares/
Rights | | Value | |
Long Term Investments (continued) | | | | |
Common Stocks and Rights (continued) | | | | |
Turkey (continued) | | | | | | | | |
Arcelik AS, Br. | | Household Durables | | 2,505,906 | | $ | 17,489,303 | |
Tupras-Turkiye Petrol Rafineleri AS | | Oil, Gas & Consumable Fuels | | 1,072,929 | | | 31,468,909 | |
aTurk Hava Yollari Anonim Ortakligi | | Airlines | | 307,000 | | | 2,260,929 | |
a,cTurk Hava Yollari Anonim Ortakligi, 144A | | Airlines | | 1,467,000 | | | 10,803,854 | |
Turkcell Iletisim Hizmetleri AS | | Wireless Telecommunication Services | | 2,388,856 | | | 26,184,848 | |
Turkiye Vakiflar Bankasi T.A.O., D | | Commercial Banks | | 5,243,624 | | | 18,590,112 | |
| | | | | | | | |
| | | | | | | 182,167,330 | |
| | | | | | | | |
United Kingdom 2.1% | | | | | | | | |
Anglo American PLC | | Metals & Mining | | 619,738 | | | 37,465,938 | |
HSBC Holdings PLC | | Commercial Banks | | 224,400 | | | 3,789,831 | |
| | | | | | | | |
| | | | | | | 41,255,769 | |
| | | | | | | | |
Total Common Stocks and Rights
(Cost $1,110,779,407) | | | | | | | 1,612,777,525 | |
| | | | | | | | |
Preferred Stocks 14.3% | | | | | | | | |
Brazil 14.1% | | | | | | | | |
Banco Bradesco SA, ADR, pfd. | | Commercial Banks | | 957,944 | | | 30,654,208 | |
Companhia Vale do Rio Doce, ADR, pfd., A | | Metals & Mining | | 3,725,875 | | | 104,249,982 | |
Itausa - Investimentos Itau SA, pfd. | | Commercial Banks | | 333,100 | | | 2,198,834 | |
Metalurgica Gerdau SA, pfd. | | Metals & Mining | | 167,002 | | | 6,661,316 | |
Petroleo Brasileiro SA, ADR, pfd. | | Oil, Gas & Consumable Fuels | | 1,000,344 | | | 96,253,100 | |
Unibanco - Uniao de Bancos Brasileiros SA, GDR, pfd. | | Commercial Banks | | 159,100 | | | 22,216,724 | |
Usinas Siderurgicas de Minas Gerais SA, pfd., A | | Metals & Mining | | 254,879 | | | 11,669,999 | |
| | | | | | | | |
| | | | | | | 273,904,163 | |
| | | | | | | | |
Chile 0.2% | | | | | | | | |
Embotelladora Andina SA, pfd., A | | Beverages | | 1,409,151 | | | 3,792,072 | |
| | | | | | | | |
Total Preferred Stocks (Cost $117,139,210) | | | | | | | 277,696,235 | |
| | | | | | | | |
Total Long Term Investments (Cost $1,227,918,617) | | | | | | | 1,890,473,760 | |
| | | | | | | | |
| | | |
| | | | | Principal
Amount | | | |
Short Term Investments 3.1% | | | | | | | | |
U.S. Government and Agency Securities 3.1% | | | | | | | | |
dFHLB, 1/02/08 - 4/16/08 | | | | $48,994,000 | | | 48,646,881 | |
dFNMA, 3/28/08 | | | | 11,411,000 | | | 11,299,640 | |
| | | | | | | | |
Total U.S. Government and Agency Securities
(Cost$ 59,914,779) | | | | | | | 59,946,521 | |
| | | | | | | | |
Total Investments (Cost $1,287,833,396) 100.3% | | | | | | | 1,950,420,281 | |
Other Assets, less Liabilities (0.3)% | | | | | | | (5,066,932 | ) |
| | | | | | | | |
Net Assets 100.0% | | | | | | $ | 1,945,353,349 | |
| | | | | | | | |
TD-15
Franklin Templeton Variable Insurance Products Trust
Statement of Investments, December 31, 2007 (continued)
Selected Portfolio Abbreviations
ADR - American Depository Receipt
CPO - Certificates of Ordinary Participation [(usually Mexico)]
FHLB - Federal Home Loan Bank
FNMA - Federal National Mortgage Association
GDR - Global Depository Receipt
SDR - Swedish Depository Receipt
a Non-income producing for the twelve months ended December 31, 2007.
b A portion or all of the securities purchased on a when-issued or delayed delivery basis. See Note 1(c).
c Security was purchased pursuant to Rule 144A under the Securities Act of 1933 and may be sold in transactions exempt from registration only to qualified institutional buyers or in a public offering registered under the Securities Act of 1933. These securities have been deemed liquid under guidelines approved by the Trust’s Board of Trustees. At December 31, 2007, the aggregate value of these securities was $20,807,299, representing 1.07% of net assets.
d The security is traded on a discount basis with no stated coupon rate.
The accompanying notes are an integral part of these financial statements.
TD-16
Franklin Templeton Variable Insurance Products Trust
Financial Statements
Statement of Assets and Liabilities
December 31, 2007
| | | |
| | | Templeton
Developing Markets
Securities Fund |
Assets: | | | |
Investments in securities: | | | |
Cost | | $ | 1,287,833,396 |
| | | |
Value | | $ | 1,950,420,281 |
Foreign currency, at value (cost $4,254,193) | | | 4,308,609 |
Receivables: | | | |
Investment securities sold | | | 9,467,571 |
Capital shares sold | | | 958,184 |
Dividends | | | 3,611,026 |
Other assets | | | 292,069 |
| | | |
Total assets | | | 1,969,057,740 |
| | | |
Liabilities: | | | |
Payables: | | | |
Investment securities purchased | | | 17,008,973 |
Capital shares redeemed | | | 1,798,240 |
Affiliates | | | 2,695,654 |
Funds advanced by custodian | | | 626,251 |
Deferred taxes | | | 714,983 |
Accrued expenses and other liabilities | | | 860,290 |
| | | |
Total liabilities | | | 23,704,391 |
| | | |
Net assets, at value | | $ | 1,945,353,349 |
| | | |
Net assets consist of: | | | |
Paid-in capital | | $ | 1,020,585,189 |
Undistributed net investment income | | | 18,501,125 |
Net unrealized appreciation (depreciation) | | | 661,943,163 |
Accumulated net realized gain (loss) | | | 244,323,872 |
| | | |
Net assets, at value | | $ | 1,945,353,349 |
| | | |
Class 1: | | | |
Net assets, at value | | $ | 753,843,041 |
| | | |
Shares outstanding | | | 46,635,825 |
| | | |
Net asset value and maximum offering price per share | | $ | 16.16 |
| | | |
Class 2: | | | |
Net assets, at value | | $ | 1,090,549,048 |
| | | |
Shares outstanding | | | 68,185,986 |
| | | |
Net asset value and maximum offering price per share | | $ | 15.99 |
| | | |
Class 3: | | | |
Net assets, at value | | $ | 100,961,260 |
| | | |
Shares outstanding | | | 6,325,771 |
| | | |
Net asset value and maximum offering price per sharea | | $ | 15.96 |
| | | |
a | Redemption price is equal to net asset value less any redemption fees retained by the Fund. |
The accompanying notes are an integral part of these financial statements.
TD-17
Franklin Templeton Variable Insurance Products Trust
Financial Statements (continued)
Statement of Operations
for the year ended December 31, 2007
| | | | |
| | | Templeton
Developing Markets
Securities Fund | |
Investment income: | | | | |
Dividends (net of foreign taxes of $3,899,118) | | $ | 58,535,649 | |
Interest | | | 4,409,555 | |
| | | | |
Total investment income | | | 62,945,204 | |
| | | | |
Expenses: | | | | |
Management fees (Note 3a) | | | 21,755,769 | |
Administrative fees (Note 3b) | | | 1,903,487 | |
Distribution fees: (Note 3c) | | | | |
Class 2 | | | 2,373,558 | |
Class 3 | | | 169,148 | |
Unaffiliated transfer agent fees | | | 30,176 | |
Custodian fees (Note 4) | | | 1,835,113 | |
Reports to shareholders | | | 456,417 | |
Professional fees | | | 170,780 | |
Trustees’ fees and expenses | | | 7,219 | |
Other | | | 48,472 | |
| | | | |
Total expenses | | | 28,750,139 | |
Expense reductions (Note 4) | | | (27,725 | ) |
| | | | |
Net expenses | | | 28,722,414 | |
| | | | |
Net investment income | | | 34,222,790 | |
| | | | |
Realized and unrealized gains (losses): | | | | |
Net realized gain (loss) from: | | | | |
Investments | | | 259,937,730 | |
Foreign currency transactions | | | (953,749 | ) |
Swap agreements | | | 958 | |
| | | | |
Net realized gain (loss) | | | 258,984,939 | |
| | | | |
Net change in unrealized appreciation (depreciation) on: | | | | |
Investments | | | 151,070,273 | |
Translation of assets and liabilities denominated in foreign currencies | | | 16,448 | |
Change in deferred taxes on unrealized appreciation (depreciation) | | | (495,514 | ) |
| | | | |
Net change in unrealized appreciation (depreciation) | | | 150,591,207 | |
| | | | |
Net realized and unrealized gain (loss) | | | 409,576,146 | |
| | | | |
Net increase (decrease) in net assets resulting from operations | | $ | 443,798,936 | |
| | | | |
The accompanying notes are an integral part of these financial statements.
TD-18
Franklin Templeton Variable Insurance Products Trust
Financial Statements (continued)
Statements of Changes in Net Assets
| | | | | | | | |
| | | Templeton Developing
Markets Securities Fund | |
| | | Year Ended December 31, | |
| | | 2007 | | | 2006 | |
| | | | |
Increase (decrease) in net assets: | | | | | | | | |
Operations: | | | | | | | | |
Net investment income | | $ | 34,222,790 | | | $ | 27,347,665 | |
Net realized gain (loss) from investments and foreign currency transactions | | | 258,984,939 | | | | 178,863,896 | |
Net change in unrealized appreciation (depreciation) on investments, translation of assets and liabilities denominated in foreign currencies, and deferred taxes | | | 150,591,207 | | | | 155,105,624 | |
| | | | |
Net increase (decrease) in net assets resulting from operations | | | 443,798,936 | | | | 361,317,185 | |
| | | | |
Distributions to shareholders from: | | | | | | | | |
Net investment income: | | | | | | | | |
Class 1 | | | (18,593,912 | ) | | | (8,939,497 | ) |
Class 2 | | | (20,981,252 | ) | | | (8,560,133 | ) |
Class 3 | | | (1,312,631 | ) | | | (315,203 | ) |
Net realized gains: | | | | | | | | |
Class 1 | | | (58,468,438 | ) | | | — | |
Class 2 | | | (72,094,329 | ) | | | — | |
Class 3 | | | (4,338,794 | ) | | | — | |
| | | | |
Total distributions to shareholders | | | (175,789,356 | ) | | | (17,814,833 | ) |
| | | | |
Capital share transactions: (Note 2) | | | | | | | | |
Class 1 | | | (114,240,767 | ) | | | (65,550,558 | ) |
Class 2 | | | 94,364,085 | | | | 32,574,378 | |
Class 3 | | | 47,175,082 | | | | 25,467,947 | |
| | | | |
Total capital share transactions | | | 27,298,400 | | | | (7,508,233 | ) |
| | | | |
Redemption fees | | | 39,617 | | | | 19,233 | |
| | | | |
Net increase (decrease) in net assets | | | 295,347,597 | | | | 336,013,352 | |
Net assets: | | | | | | | | |
Beginning of year | | | 1,650,005,752 | | | | 1,313,992,400 | |
| | | | |
End of year | | $ | 1,945,353,349 | | | $ | 1,650,005,752 | |
| | | | |
Undistributed net investment income included in net assets: | | | | | | | | |
End of year | | $ | 18,501,125 | | | $ | 14,021,116 | |
| | | | |
The accompanying notes are an integral part of these financial statements.
TD-19
Franklin Templeton Variable Insurance Products Trust
Notes to Financial Statements
Templeton Developing Markets Securities Fund
1. ORGANIZATION AND SIGNIFICANT ACCOUNTING POLICIES
Franklin Templeton Variable Insurance Products Trust (Trust) is registered under the Investment Company Act of 1940, as amended, (1940 Act) as an open-end investment company, consisting of twenty-three separate funds. The Templeton Developing Markets Securities Fund (Fund) included in this report is diversified. The financial statements of the remaining funds in the Trust are presented separately. Shares of the Fund are sold only to insurance company separate accounts to fund the benefits of variable life insurance policies or variable annuity contracts. The Fund offers three classes of shares: Class 1, Class 2, and Class 3. Each class of shares differs by its distribution fees, voting rights on matters affecting a single class and its exchange privilege.
The following summarizes the Fund’s significant accounting policies.
a. Security Valuation
Securities listed on a securities exchange or on the NASDAQ National Market System are valued at the last quoted sale price or the official closing price of the day, respectively. Over-the-counter securities and listed securities for which there is no reported sale are valued within the range of the most recent quoted bid and ask prices. Securities that trade in multiple markets or on multiple exchanges are valued according to the broadest and most representative market.
Government securities generally trade in the over-the-counter market rather than on a securities exchange. The Trust may utilize independent pricing services, quotations from bond dealers, and information with respect to bond and note transactions, to assist in determining a current market value for each security. The Trust’s pricing services may use valuation models or matrix pricing which considers information with respect to comparable bond and note transactions, quotations from bond dealers, or by reference to other securities that are considered comparable in such characteristics as rating, interest rate and maturity date, option adjusted spread models, prepayment projections, interest rate spreads and yield curves, to determine current value.
Foreign securities are valued as of the close of trading on the foreign stock exchange on which the security is primarily traded, or the NYSE, whichever is earlier. If no sale is reported at that time, the foreign security will be valued within the range of the most recent quoted bid and ask prices. The value is then converted into its U.S. dollar equivalent at the foreign exchange rate in effect at the close of the NYSE on the day that the value of the foreign security is determined.
The Trust has procedures to determine the fair value of individual securities and other assets for which market prices are not readily available or which may not be reliably priced. Methods for valuing these securities may include: fundamental analysis, matrix pricing, discounts from market prices of similar securities, or discounts applied due to the nature and duration of restrictions on the disposition of the securities. Due to the inherent uncertainty of valuations of such securities, the fair values may differ significantly from the values that would have been used had a ready market for such investments existed. Occasionally, events occur between the time at which trading in a security is completed and the close of the NYSE that might call into question the availability (including the reliability) of the value of a portfolio security held by the Fund. The investment manager monitors price movements following the close of trading in foreign stock markets through a series of country specific market proxies (such as baskets of American Depository Receipts, futures contracts and exchange traded funds). These price movements are measured against established trigger thresholds for each specific market proxy to assist in determining if an event has occurred. If such an event occurs, the securities may be valued using fair value procedures, which may include the use of independent pricing services. All security valuation procedures are approved by the Trust’s Board of Trustees.
b. Foreign Currency Translation
Portfolio securities and other assets and liabilities denominated in foreign currencies are translated into U.S. dollars based on the exchange rate of such currencies against U.S. dollars on the date of valuation. Purchases and sales of securities, income and expense items denominated in foreign currencies are translated into U.S. dollars at the exchange rate in effect on the transaction date. Occasionally, events may impact the availability or reliability of foreign exchange rates used to convert the U.S. dollar equivalent value. If such an event occurs, the foreign exchange rate will be valued at fair value using procedures established and approved by the Trust’s Board of Trustees.
TD-20
Franklin Templeton Variable Insurance Products Trust
Notes to Financial Statements (continued)
Templeton Developing Markets Securities Fund
1. ORGANIZATION AND SIGNIFICANT ACCOUNTING POLICIES (continued)
b. Foreign Currency Translation (continued)
The Fund does not separately report the effect of changes in foreign exchange rates from changes in market prices on securities held. Such changes are included in net realized and unrealized gain or loss from investments on the Statement of Operations.
Realized foreign exchange gains or losses arise from sales of foreign currencies, currency gains or losses realized between the trade and settlement dates on securities transactions and the difference between the recorded amounts of dividends, interest, and foreign withholding taxes and the U.S. dollar equivalent of the amounts actually received or paid. Net unrealized foreign exchange gains and losses arise from changes in foreign exchange rates on foreign denominated assets and liabilities other than investments in securities held at the end of the reporting period.
c. Securities Purchased on a When-Issued or Delayed Delivery Basis
The Fund may purchase securities on a when-issued or delayed delivery basis, with payment and delivery scheduled for a future date. These transactions are subject to market fluctuations and are subject to the risk that the value at delivery may be more or less than the trade date purchase price. Although the Fund will generally purchase these securities with the intention of holding the securities, it may sell the securities before the settlement date. Sufficient assets have been segregated for these securities.
d. Foreign Currency Contracts
When the Fund purchases or sells foreign securities it may enter into foreign exchange contracts to minimize foreign exchange risk from the trade date to the settlement date of the transactions. A foreign exchange contract is an agreement between two parties to exchange different currencies at an agreed upon exchange rate at a future date. Realized and unrealized gains and losses on these contracts are included in the Statement of Operations.
The risks of these contracts include movement in the values of the foreign currencies relative to the U.S. dollar and the possible inability of the counterparties to fulfill their obligations under the contracts, which may be in excess of the amount reflected in the Statement of Assets and Liabilities.
e. Total Return Swaps
The Fund may enter into total return swaps. A total return swap is an agreement between the Fund and a counterparty to exchange a market linked return for a floating rate payment, both based on a notional principal amount. Total return swaps are marked to market daily based upon quotations from the market makers and the change in value, if any, is recorded as an unrealized gain or loss in the Statement of Operations. Payments received or paid are recorded as a realized gain or loss. The risks of entering into a total return swap include the unfavorable fluctuation of interest rates or the price of the underlying security or index, as well as the potential inability of the counterparty to fulfill their obligations under the swap agreement.
f. Income and Deferred Taxes
No provision has been made for U.S. income taxes because it is the Fund’s policy to qualify as a regulated investment company under the Internal Revenue Code and to distribute to shareholders substantially all of its taxable income and net realized gains.
Foreign securities held by the Fund may be subject to foreign taxation on dividend income received. Foreign taxes, if any, are recorded based on the tax regulations and rates that exist in the foreign markets in which the Fund invests.
The Fund may be subject to a tax imposed on net realized gains on securities of certain foreign countries. The Fund records an estimated deferred tax liability for net unrealized gains on these securities in an amount that would be payable if the securities were disposed of on the valuation date.
TD-21
Franklin Templeton Variable Insurance Products Trust
Notes to Financial Statements (continued)
Templeton Developing Markets Securities Fund
1. ORGANIZATION AND SIGNIFICANT ACCOUNTING POLICIES (continued)
g. Security Transactions, Investment Income, Expenses and Distributions
Security transactions are accounted for on trade date. Realized gains and losses on security transactions are determined on a specific identification basis. Interest income and estimated expenses are accrued daily. Dividend income is recorded on the ex-dividend date except that certain dividends from foreign securities are recognized as soon as the Fund is notified of the ex-dividend date. Distributions to shareholders are recorded on the ex-dividend date and are determined according to income tax regulations (tax basis). Distributable earnings determined on a tax basis may differ from earnings recorded in accordance with accounting principles generally accepted in the United States of America. These differences may be permanent or temporary. Permanent differences are reclassified among capital accounts to reflect their tax character. These reclassifications have no impact on net assets or the results of operations. Temporary differences are not reclassified, as they may reverse in subsequent periods.
Common expenses incurred by the Trust are allocated among the funds based on the ratio of net assets of each fund to the combined net assets of the Trust. Fund specific expenses are charged directly to the fund that incurred the expense.
Realized and unrealized gains and losses and net investment income, other than class specific expenses, are allocated daily to each class of shares based upon the relative proportion of net assets of each class. Differences in per share distributions, by class, are generally due to differences in class specific expenses.
h. Accounting Estimates
The preparation of financial statements in accordance with accounting principles generally accepted in the United States of America requires management to make estimates and assumptions that affect the reported amounts of assets and liabilities at the date of the financial statements and the amounts of income and expenses during the reporting period. Actual results could differ from those estimates.
i. Redemption Fees
Redemptions and exchanges of Class 3 shares held 60 days or less may be subject to the Fund’s redemption fee, which is 1% of the amount redeemed. Such fees are retained by the Fund and accounted for as an addition to paid-in capital.
j. Guarantees and Indemnifications
Under the Trust’s organizational documents, its officers and trustees are indemnified by the Trust against certain liabilities arising out of the performance of their duties to the Trust. Additionally, in the normal course of business, the Trust, on behalf of the Fund, enters into contracts with service providers that contain general indemnification clauses. The Trust’s maximum exposure under these arrangements is unknown as this would involve future claims that may be made against the Trust that have not yet occurred. Currently, the Trust expects the risk of loss to be remote.
TD-22
Franklin Templeton Variable Insurance Products Trust
Notes to Financial Statements (continued)
Templeton Developing Markets Securities Fund
2. SHARES OF BENEFICIAL INTEREST
At December 31, 2007, there were an unlimited number of shares authorized (without par value). Transactions in the Fund’s shares were as follows:
| | | | | | | | | | | | | | |
| | | Year Ended December 31, | |
| | | 2007 | | | 2006 | |
| Class 1 Shares: | | Shares | | | Amount | | | Shares | | | Amount | |
Shares sold | | 4,490,443 | | | $ | 69,191,583 | | | 8,227,856 | | | $ | 99,913,441 | |
Shares issued in reinvestment of distributions | | 5,385,210 | | | | 77,062,349 | | | 823,158 | | | | 8,939,497 | |
Shares redeemed | | (17,058,565 | ) | | | (260,494,699 | ) | | (14,545,716 | ) | | | (174,403,496 | ) |
| | | | |
Net increase (decrease) | | (7,182,912 | ) | | $ | (114,240,767 | ) | | (5,494,702 | ) | | $ | (65,550,558 | ) |
| | | | |
| Class 2 Shares: | | | | | | | | | | | | |
Shares sold | | 16,188,250 | | | $ | 242,521,079 | | | 18,145,883 | | | $ | 219,369,554 | |
Shares issued in reinvestment of distributions | | 6,563,863 | | | | 93,075,581 | | | 794,812 | | | | 8,560,133 | |
Shares redeemed | | (16,746,979 | ) | | | (241,232,575 | ) | | (16,460,489 | ) | | | (195,355,309 | ) |
| | | | |
Net increase (decrease) | | 6,005,134 | | | $ | 94,364,085 | | | 2,480,206 | | | $ | 32,574,378 | |
| | | | |
| Class 3 Shares: | | | | | | | | | | | | |
Shares sold | | 4,138,936 | | | $ | 61,021,476 | | | 2,626,549 | | | $ | 31,906,146 | |
Shares issued in reinvestment of distributions | | 399,394 | | | | 5,651,425 | | | 29,294 | | | | 315,203 | |
Shares redeemed | | (1,360,665 | ) | | | (19,497,819 | ) | | (564,285 | ) | | | (6,753,402 | ) |
| | | | |
Net increase (decrease) | | 3,177,665 | | | $ | 47,175,082 | | | 2,091,558 | | | $ | 25,467,947 | |
| | | | |
3. TRANSACTIONS WITH AFFILIATES
Franklin Resources, Inc. is the holding company for various subsidiaries that together are referred to as Franklin Templeton Investments. Certain officers and trustees of the Trust are also officers and/or directors of the following subsidiaries:
| | |
| Subsidiary | | Affiliation |
Templeton Asset Management Ltd. (TAML) | | Investment manager |
Franklin Templeton Services, LLC (FT Services) | | Administrative manager |
Franklin Templeton Distributors, Inc. (Distributors) | | Principal underwriter |
Franklin Templeton Investor Services, LLC (Investor Services) | | Transfer agent |
a. Management Fees
The Fund pays an investment management fee to TAML based on the average daily net assets of the Fund as follows:
| | |
| Annualized Fee Rate | | Net Assets |
| 1.250% | | Up to and including $1 billion |
| 1.200% | | Over $1 billion, up to and including $5 billion |
| 1.150% | | Over $5 billion, up to and including $10 billion |
| 1.100% | | Over $10 billion, up to and including $15 billion |
| 1.050% | | Over $15 billion, up to and including $20 billion |
| 1.000% | | In excess of $20 billion |
TD-23
Franklin Templeton Variable Insurance Products Trust
Notes to Financial Statements (continued)
Templeton Developing Markets Securities Fund
3. TRANSACTIONS WITH AFFILIATES (continued)
b. Administrative Fees
The Fund pays an administrative fee to FT Services based on the Fund’s average daily net assets as follows:
| | |
| Annualized Fee Rate | | Net Assets |
| 0.150% | | Up to and including $200 million |
| 0.135% | | Over $200 million, up to and including $700 million |
| 0.100% | | Over $700 million, up to and including $1.2 billion |
| 0.075% | | In excess of $1.2 billion |
c. Distribution Fees
The Fund’s Board of Trustees has adopted distribution plans for Class 2 and Class 3 shares pursuant to Rule 12b-1 under the 1940 Act. Under the Fund’s compensation distribution plans, the Fund pays Distributors for costs incurred in connection with the servicing, sale and distribution of the Fund’s shares up to 0.25% and 0.35% per year of its average daily net assets of Class 2 and Class 3, respectively. The Board of Trustees has agreed to limit the current rate to 0.25% per year for Class 3.
d. Transfer Agent Fees
Investor Services, under terms of an agreement, performs shareholder servicing for the Fund and is not paid by the Fund for the services.
4. EXPENSE OFFSET ARRANGEMENT
The Fund has entered into an arrangement with its custodian whereby credits realized as a result of uninvested cash balances are used to reduce a portion of the Fund’s custodian expenses. During the year ended December 31, 2007, the custodian fees were reduced as noted in the Statement of Operations.
5. INCOME TAXES
The Fund has reviewed the tax positions taken on federal income tax returns, for each of the three open tax years and as of December 31, 2007 and has determined that no provision for income tax is required in the Fund’s financial statements.
For tax purposes, realized currency losses occurring subsequent to October 31, may be deferred and treated as occurring on the first day of the following fiscal year. At December 31, 2007, the Fund deferred realized currency losses of $1,080,193.
The tax character of distributions paid during the years ended December 31, 2007 and 2006, was as follows:
| | | | | | |
| | | 2007 | | 2006 |
Distributions paid from: | | | | | | |
Ordinary income | | $ | 46,036,795 | | $ | 17,814,833 |
Long term capital gain | | | 129,752,561 | | | — |
| | | |
| | | 175,789,356 | | | 17,814,833 |
| | | |
TD-24
Franklin Templeton Variable Insurance Products Trust
Notes to Financial Statements (continued)
Templeton Developing Markets Securities Fund
5. INCOME TAXES (continued)
At December 31, 2007, the cost of investments, net unrealized appreciation (depreciation), undistributed ordinary income and undistributed long term capital gains for income tax purposes were as follows:
| | | | |
Cost of investments | | $ | 1,310,370,388 | |
| | | | |
| |
Unrealized appreciation | | $ | 676,242,874 | |
Unrealized depreciation | | | (36,192,981 | ) |
| | | | |
Net unrealized appreciation (depreciation) | | $ | 640,049,893 | |
| | | | |
Undistributed ordinary income | | $ | 54,789,462 | |
Undistributed long term capital gains | | | 231,690,488 | |
| | | | |
Distributable earnings | | $ | 286,479,950 | |
| | | | |
Net investment income differs for financial statement and tax purposes primarily due to differing treatments of foreign currency transactions, passive foreign investment company shares, and foreign capital gain taxes.
Net realized gains (losses) differ for financial statement and tax purposes primarily due to differing treatments of wash sales, foreign currency transactions, passive foreign investment company shares, and foreign capital gain taxes.
6. INVESTMENT TRANSACTIONS
Purchases and sales of investments (excluding short term securities) for the year ended December 31, 2007, aggregated $1,671,935,243 and $1,811,445,079, respectively.
7. CONCENTRATION OF RISK
Investing in foreign securities may include certain risks and considerations not typically associated with investing in U.S. securities, such as fluctuating currency values and changing local and regional economic, political and social conditions, which may result in greater market volatility. In addition, certain foreign securities may not be as liquid as U.S. securities.
8. REGULATORY AND LITIGATION MATTERS
As part of various investigations by a number of federal, state, and foreign regulators and governmental entities, including the Securities and Exchange Commission (“SEC”), relating to certain practices in the mutual fund industry, including late trading, market timing and marketing support payments to securities dealers who sell fund shares (“marketing support”), Franklin Resources, Inc. and certain of its subsidiaries (collectively, the “Company”), entered into settlements with certain of those regulators and governmental entities. Specifically, the Company entered into settlements with the SEC, among others, concerning market timing and marketing support.
On June 6, 2007, the SEC posted for public comment the proposed plan of distribution for the market timing settlement. Once the SEC approves the final plan of distribution, disbursements of settlement monies will be made promptly to individuals who were shareholders of the designated funds during the relevant period, in accordance with the terms and conditions of the settlement and plan.
TD-25
Franklin Templeton Variable Insurance Products Trust
Notes to Financial Statements (continued)
Templeton Developing Markets Securities Fund
8. REGULATORY AND LITIGATION MATTERS (continued)
In addition, the Company, as well as most of the mutual funds within Franklin Templeton Investments and certain current or former officers, Company directors, fund directors, and employees, have been named in private lawsuits (styled as shareholder class actions, or as derivative actions on behalf of either the named funds or Franklin Resources, Inc.). The lawsuits relate to the industry practices referenced above.
The Company and fund management believe that the claims made in each of the private lawsuits referenced above are without merit and intend to defend against them vigorously. The Company cannot predict with certainty the eventual outcome of these lawsuits, nor whether they will have a material negative impact on the Company. If it is determined that the Company bears responsibility for any unlawful or inappropriate conduct that caused losses to the Fund, it is committed to making the Fund or its shareholders whole, as appropriate.
9. NEW ACCOUNTING PRONOUNCEMENT
In September 2006, the Financial Accounting Standards Board (FASB) issued FASB Statement No. 157, “Fair Value Measurement” (SFAS 157), which defines fair value, establishes a framework for measuring fair value, and expands disclosures about fair value measurements. SFAS 157 is effective for fiscal years beginning after November 15, 2007, and interim periods within those fiscal years. The Trust believes the adoption of SFAS 157 will have no material impact on its financial statements.
TD-26
Franklin Templeton Variable Insurance Products Trust
Templeton Developing Markets Securities Fund
Report of Independent Registered Public Accounting Firm
To the Board of Trustees and Shareholders of
Franklin Templeton Variable Insurance Products Trust
In our opinion, the accompanying statement of assets and liabilities, including the statement of investments, and the related statements of operations and of changes in net assets and the financial highlights present fairly, in all material respects, the financial position of Templeton Developing Markets Securities Fund (one of the funds constituting Franklin Templeton Variable Insurance Products Trust, hereafter referred to as the “Fund”) at December 31, 2007, the results of its operations for the year then ended, the changes in its net assets for each of the two years in the period then ended and the financial highlights for each of the periods presented, in conformity with accounting principles generally accepted in the United States of America. These financial statements and financial highlights (hereafter referred to as “financial statements”) are the responsibility of the Fund’s management. Our responsibility is to express an opinion on these financial statements based on our audits. We conducted our audits of these financial statements in accordance with the standards of the Public Company Accounting Oversight Board (United States). Those standards require that we plan and perform the audit to obtain reasonable assurance about whether the financial statements are free of material misstatement. An audit includes examining, on a test basis, evidence supporting the amounts and disclosures in the financial statements, assessing the accounting principles used and significant estimates made by management, and evaluating the overall financial statement presentation. We believe that our audits, which included confirmation of securities at December 31, 2007 by correspondence with the custodian and brokers, provide a reasonable basis for our opinion.
PricewaterhouseCoopers LLP
San Francisco, California
February 14, 2008
TD-27
Franklin Templeton Variable Insurance Products Trust
Tax Designation (unaudited)
Templeton Developing Markets Securities Fund
Under Section 852(b)(3)(C) of the Internal Revenue Code (Code), the Fund designates the maximum amount allowable but no less than $231,696,782 as a long term capital gain dividend for the fiscal year ended December 31, 2007.
At December 31, 2007, more than 50% of the Fund’s total assets were invested in securities of foreign issuers. In most instances, foreign taxes were withheld from income paid to the Fund on these investments. The Fund elects to treat foreign taxes paid as allowed under Section 853 of the Code. This election will allow shareholders of record as of the 2008 distribution date, to treat their proportionate share of foreign taxes paid by the Fund as having been paid directly by them. The shareholder shall consider these amounts as foreign taxes paid in the tax year in which they receive the Fund distribution.
TD-28
TEMPLETON FOREIGN SECURITIES FUND
We are pleased to bring you Templeton Foreign Securities Fund’s annual report for the fiscal year ended December 31, 2007.
Performance Summary as of 12/31/07
Average annual total return of Class 1 shares* represents the average annual change in value, assuming reinvestment of dividends and capital gains. Average returns smooth out variations in returns, which can be significant; they are not the same as year-by-year results.
Periods ended 12/31/07
| | | | | | |
| | | 1-Year | | 5-Year | | 10-Year |
Average Annual Total Return | | +15.79% | | +19.66% | | +8.35% |
*Performance prior to the 5/1/00 merger reflects historical performance of Templeton International Fund.
Total Return Index Comparison
for Hypothetical $10,000 Investment (1/1/98–12/31/07)
The graph below shows the change in value of a hypothetical $10,000 investment in the Fund over the indicated period and includes reinvestment of any income or distributions. The Fund’s performance* is compared to the performance of the Morgan Stanley Capital International (MSCI) Europe, Australasia, Far East (EAFE) Index. One cannot invest directly in an index, nor is an index representative of the Fund’s portfolio. Please see Important Notes to Performance Information preceding the Fund Summaries.
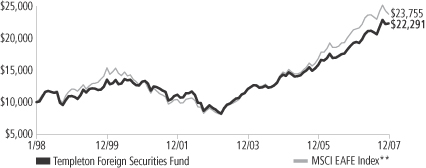
**Source: Standard & Poor’s Micropal. Please see Index Descriptions following the Fund Summaries.
Templeton Foreign Securities Fund – Class 1
Performance reflects the Fund’s Class 1 operating expenses, but does not include any contract fees, expenses or sales charges. If they had been included, performance would be lower. These charges and deductions, particularly for variable life policies, can have a significant effect on contract values and insurance benefits. See the contract prospectus for a complete description of these expenses, including sales charges.
Performance data represent past performance, which does not guarantee future results. Investment return and principal value will fluctuate, and you may have a gain or loss when you sell your shares.
Current performance may differ from figures shown.
TF-1
Fund Goal and Main Investments: Templeton Foreign Securities Fund seeks long-term capital growth. The Fund normally invests at least 80% of its net assets in investments of issuers located outside the U.S., including those in emerging markets, and normally invests predominantly in equity securities.
Performance Overview
You can find the Fund’s one-year total return in the Performance Summary. The Fund outperformed its benchmark, the MSCI EAFE Index, which returned +11.63% for the same period.1 Please note that index performance information is provided for reference and that we do not attempt to track the index but rather undertake investments on the basis of fundamental research.
Economic and Market Overview
In spite of elevated energy prices and widespread fears of contagion from the deteriorating U.S. housing situation, the global economy remained resilient in 2007. Consumer and corporate demand strength, particularly in China and other developing economies, generally favorable employment and accommodative monetary policies continued to underpin the current expansionary period that began in 2002.
These factors also contributed to the strength of global equity markets during 2007. However, concerns about slower growth and declining asset quality surfaced in the first quarter. These were initially centered on the U.S. subprime mortgage market but spread in August to global capital markets. Difficulties in assessing risk and the value of collateral in the structured finance industry contributed to declining risk appetite among lenders and investors. The private equity industry, which relies on the availability of cheap credit, played a pivotal role in several large and high-profile acquisitions and helped boost merger and acquisition activity in the first half of the year. This was an important driver of equity performance, but as liquidity dried up in the second half of the year, significantly slower money flows from private equity weighed on market performance. However, global merger and acquisition activity still reached record levels. The staggering $4.5 trillion of deals announced in 2007 eclipsed the previous record from 2006 by 24%.2
1. Source: Standard & Poor’s Micropal. One cannot invest directly in an index, nor is an index representative of the Fund’s portfolio. Please see Index Descriptions following the Fund Summaries.
2. Source: “For Deal Makers, Tale of Two Halves,” The Wall Street Journal, 1/2/08.
Fund Risks: The Fund’s investments in stocks offer the potential for long-term gains but can be subject to short-term price fluctuations. Foreign investing, especially in emerging markets, involves additional risks, including currency fluctuations, economic instability, market volatility, and political and social instability. By having significant investments in one or more countries or in particular sectors from time to time, the Fund may carry greater risk of adverse developments in a country or sector than a fund that invests more broadly. The Fund’s prospectus also includes a description of the main investment risks.
TF-2
To alleviate the credit crunch and restore investor confidence, the world’s major central banks infused capital into the system, and the U.S. Federal Reserve Board reduced its target interest rate by a full percentage point. However, credit and equity markets continued to face headwinds as write-downs and losses from subprime mortgage financing affected many large financial institutions toward the end of the year, and equity prices remained volatile.
For the year, however, global and non-U.S. equity markets registered the fifth consecutive year of double-digit total returns, making this an exceptionally strong period for investors in global equities. Broad-based stock performance by European and Asian shares at least doubled that of U.S. stocks, while emerging market equity returns more than tripled those in developed markets. Led by the BRIC countries, Brazil, Russia, India and China, emerging market economies continued to grow at accelerated rates, supporting elevated prices for oil and other commodities. At the same time, investment inflows from developed economies continued to underpin equity prices in emerging markets. In addition, U.S. dollar weakness versus the currencies of many major trading partners enhanced equity returns for U.S.-based investors holding stocks denominated in these currencies.
Investment Strategy
Our investment philosophy is bottom-up, value-oriented and long-term. In choosing investments, we generally focus on the market price of a company’s securities relative to our evaluation of the company’s potential long-term earnings, asset value and cash flow. Among factors we consider are a company’s historical value measures, including price/earnings ratio, profit margins and liquidation value. We do in-depth research to construct a bargain list from which we buy.
Manager’s Discussion
The Fund’s performance relative to the benchmark index was positively affected by its overweighted exposure to the consumer discretionary sector.3 The best performing stocks in the sector included French satellite operator Eutelsat Communications, U.K.-based British Sky Broadcasting Group, Dutch publisher Reed Elsevier and Japanese consumer electronics firm Sony (sold by period-end).
3. The consumer discretionary sector comprises auto components; hotels, restaurants and leisure; household durables; media; specialty retail; and textiles, apparel and luxury goods in the SOI.

TF-3
The Fund’s overweighting in the energy sector also boosted relative performance for the year.4 Top performers included Indian energy companies Reliance Industries, Hindustan Petroleum and Indian Oil. In the industrials sector, German conglomerate Siemens as well as wind turbine manufacturers Vestas Wind Systems (Denmark) and Gamesa (Spain) also benefited the Fund.5
Additionally, our overweighted telecommunications services sector exposure also aided relative returns.6 Standout performers included European wireless operators Vodafone Group (U.K.), Turkcell Iletism Hizmetleri (Turkey) and Mobile Telesystems (Russia), European fixed-line operators Telefonica (Spain), Telenor (Norway) and France Telecom, and Asian operators Singapore Telecommunications and China Telecom.
It is important to recognize the effect of currency movements on the Fund’s performance. In general, if the value of the U.S. dollar goes up compared with a foreign currency, an investment traded in that foreign currency will go down in value because it will be worth fewer U.S. dollars. This can have a negative effect on Fund performance. Conversely, when the U.S. dollar weakens in relation to a foreign currency, an investment traded in that foreign currency will increase in value, which can contribute to Fund performance. For the 12 months ended December 31, 2007, the U.S. dollar fell in value relative to most non-U.S. currencies. As a result, the Fund’s performance was positively affected by the portfolio’s investment predominantly in securities with non-U.S. currency exposure. However, one cannot expect the same result in future periods.
In contrast, returns relative to the benchmark suffered from the Fund’s overweighted position in the information technology sector, which underperformed the index.7 Stocks that lost value in this sector included German semiconductor companies Qimonda and Infineon
4. The energy sector comprises oil, gas and consumable fuels in the SOI.
5. The industrials sector comprises aerospace and defense, air freight and logistics, commercial services and supplies, electrical equipment, and industrial conglomerates in the SOI.
6. The telecommunication services sector comprises diversified telecommunication services and wireless telecommunication services in the SOI.
7. The information technology sector comprises computers and peripherals, electronic equipment and instruments, semiconductors and semiconductor equipment, and software in the SOI.
Top 10 Holdings
Templeton Foreign Securities Fund
12/31/07
| | |
Company
Sector/Industry,
Country | | % of Total
Net Assets |
| |
| Siemens AG | | 2.6% |
| Industrial Conglomerates, Germany | | |
| |
Cheung Kong
(Holdings) Ltd. | | 2.5% |
| Real Estate Management & Development, Hong Kong | | |
| |
| Reliance Industries Ltd. | | 2.5% |
| Oil, Gas & Consumable Fuels, India | | |
| |
| Sanofi-Aventis | | 2.4% |
| Pharmaceuticals, France | | |
| |
| Royal Dutch Shell PLC, B | | 2.4% |
| Oil, Gas & Consumable Fuels, U.K. | | |
| |
| GlaxoSmithKline PLC | | 2.2% |
| Pharmaceuticals, U.K. | | |
| |
| France Telecom SA | | 2.1% |
| Diversified Telecommunication Services, France | | |
| |
| BP PLC | | 2.0% |
| Oil, Gas & Consumable Fuels, U.K. | | |
| |
| Telefonica SA, ADR | | 2.0% |
| Diversified Telecommunication Services, Spain | | |
| |
| ING Groep NV | | 2.0% |
| Diversified Financial Services, Netherlands | | |
The dollar value, number of shares or principal amount, and names of all portfolio holdings are listed in the Fund’s Statement of Investments (SOI).
TF-4
Technologies, Asian semiconductor manufacturers Samsung Electronics and Taiwan Semiconductor Manufacturing, and Japanese companies NEC (sold by period-end) and FUJIFILM Holdings.
The Fund’s relative performance was also negatively impacted by its underweighting in the materials sector, which outperformed the index.8 Specifically, limited exposure to the outperforming metals and mining industry and holdings in European paper companies Stora Enso (Finland), Norske Skogindustrier (Norway) and UPM-Kymmene (Finland) hampered the Fund.
Although the Fund was slightly underweighted in the underperforming financials sector, a number of individual financial holdings declined sharply in value and hurt Fund performance.9 These included U.K.-based Royal Bank of Scotland Group as well as Japan’s Shinsei Bank and Sumitomo Mitsui Financial Group.
Thank you for your participation in Templeton Foreign Securities Fund. We look forward to serving your future investment needs.
8. The materials sector comprises chemicals, containers and packaging, metals and mining, and paper and forest products in the SOI.
9. The financials sector comprises capital markets, commercial banks, diversified financial services, insurance, and real estate management and development in the SOI.
The foregoing information reflects our analysis, opinions and portfolio holdings as of December 31, 2007, the end of the reporting period. The way we implement our main investment strategies and the resulting portfolio holdings may change depending on factors such as market and economic conditions. These opinions may not be relied upon as investment advice or an offer for a particular security. The information is not a complete analysis of every aspect of any market, country, industry, security or the Fund. Statements of fact are from sources considered reliable, but the investment manager makes no representation or warranty as to their completeness or accuracy. Although historical performance is no guarantee of future results, these insights may help you understand our investment management philosophy.
TF-5
Fund Expenses
As an investor in a variable insurance contract (Contract) that indirectly provides for investment in an underlying mutual fund, you can incur transaction and/or ongoing expenses at both the Fund level and the Contract level.
| • | | Transaction expenses can include sales charges (loads) on purchases, redemption fees, surrender fees, transfer fees and premium taxes. |
| • | | Ongoing expenses can include management fees, distribution and service (12b-1) fees, contract fees, annual maintenance fees, mortality and expense risk fees and other fees and expenses. All mutual funds and Contracts have some types of ongoing expenses. |
The expenses shown in the table are meant to highlight ongoing expenses at the Fund level only and do not include ongoing expenses at the Contract level, or transaction expenses at either the Fund or Contract level. While the Fund does not have transaction expenses, if the transaction and ongoing expenses at the Contract level were included, the expenses shown below would be higher. You should consult your Contract prospectus or disclosure document for more information.
The table shows Fund-level ongoing expenses and can help you understand these expenses and compare them with those of other mutual funds offered through the Contract. The table assumes a $1,000 investment held for the six months indicated. Please refer to the Fund prospectus for additional information on operating expenses.
Actual Fund Expenses
The first line (Actual) of the table provides actual account values and expenses. The “Ending Account Value” is derived from the Fund’s actual return, which includes the effect of ongoing Fund expenses, but does not include the effect of ongoing Contract expenses.
You can estimate the Fund-level expenses you incurred during the period by following these steps. Of course, your account value and expenses will differ from those in this illustration:
| 1. | Divide your account value by $1,000. |
If an account had an $8,600 value, then $8,600 ÷ $1,000 = 8.6.
| 2. | Multiply the result by the number under the heading “Fund-Level Expenses Incurred During Period.” |
If Fund-Level Expenses Incurred During Period were $7.50, then
8.6 x $7.50 = $64.50.
In this illustration, the estimated expenses incurred this period at the Fund level are $64.50.
Templeton Foreign Securities Fund – Class 1
TF-6
Hypothetical Example for Comparison with Other Mutual Funds
Information in the second line (Hypothetical) of the table can help you compare ongoing expenses of the Fund with those of other mutual funds offered through the Contract. This information may not be used to estimate the actual ending account balance or expenses you incurred during the period. The hypothetical “Ending Account Value” is based on the Fund’s actual expense ratio and an assumed 5% annual rate of return before expenses, which does not represent the Fund’s actual return. The figure under the heading “Fund-Level Expenses Incurred During Period” shows the hypothetical expenses your account would have incurred under this scenario. You can compare this figure with the 5% hypothetical examples that appear in shareholder reports of other funds offered through a Contract.
| | | | | | | | | |
| Class 1 | | Beginning
Account Value 7/1/07 | | Ending Account Value 12/31/07 | | Fund-Level
Expenses Incurred
During Period*
7/1/07–12/31/07 |
Actual | | $ | 1,000 | | $ | 1,157.90 | | $ | 4.13 |
Hypothetical (5% return before expenses) | | $ | 1,000 | | $ | 1,021.37 | | $ | 3.87 |
*Expenses are calculated using the most recent six-month annualized expense ratio for the Fund’s Class 1 shares (0.76%), which does not include any ongoing expenses of the Contract for which the Fund is an investment option, multiplied by the average account value over the period, multiplied by 184/365 to reflect the one-half year period.
TF-7
Franklin Templeton Variable Insurance Products Trust
Financial Highlights
Templeton Foreign Securities Fund
| | | | | | | | | | | | | | | | | | | | |
| | | Year Ended December 31, | |
| Class 1 | | 2007 | | | 2006 | | | 2005 | | | 2004 | | | 2003 | |
| | | | |
Per share operating performance | | | | | | | | | | | | | | | | | | | | |
(for a share outstanding throughout the year) | | | | | | | | | | | | | | | | | | | | |
Net asset value, beginning of year | | $ | 19.00 | | | $ | 15.84 | | | $ | 14.53 | | | $ | 12.37 | | | $ | 9.51 | |
| | | | |
Income from investment operationsa: | | | | | | | | | | | | | | | | | | | | |
Net investment incomeb | | | 0.45 | | | | 0.46 | | | | 0.30 | | | | 0.26 | | | | 0.19 | |
Net realized and unrealized gains (losses) | | | 2.46 | | | | 2.94 | | | | 1.20 | | | | 2.05 | | | | 2.87 | |
| | | | |
Total from investment operations | | | 2.91 | | | | 3.40 | | | | 1.50 | | | | 2.31 | | | | 3.06 | |
| | | | |
Less distributions from: | | | | | | | | | | | | | | | | | | | | |
Net investment income | | | (0.44 | ) | | | (0.24 | ) | | | (0.19 | ) | | | (0.15 | ) | | | (0.20 | ) |
Net realized gains | | | (0.90 | ) | | | — | | | | — | | | | — | | | | — | |
| | | | |
Total distributions | | | (1.34 | ) | | | (0.24 | ) | | | (0.19 | ) | | | (0.15 | ) | | | (0.20 | ) |
| | | | |
Redemption fees | | | — | d | | | — | d | | | — | d | | | — | d | | | — | |
| | | | |
Net asset value, end of year | | $ | 20.57 | | | $ | 19.00 | | | $ | 15.84 | | | $ | 14.53 | | | $ | 12.37 | |
| | | | |
| | | | | |
Total returnc | | | 15.79% | | | | 21.70% | | | | 10.48% | | | | 18.87% | | | | 32.55% | |
Ratios to average net assets | | | | | | | | | | | | | | | | | | | | |
Expenses | | | 0.75% | e | | | 0.75% | e | | | 0.77% | e | | | 0.82% | e | | | 0.87% | |
Net investment income | | | 2.22% | | | | 2.63% | | | | 2.03% | | | | 1.95% | | | | 1.81% | |
| | | | | |
Supplemental data | | | | | | | | | | | | | | | | | | | | |
Net assets, end of year (000’s) | | $ | 531,377 | | | $ | 594,991 | | | $ | 531,775 | | | $ | 506,456 | | | $ | 472,665 | |
Portfolio turnover rate | | | 26.74% | | | | 18.97% | f | | | 14.61% | | | | 10.91% | | | | 18.01% | |
a The amount shown for a share outstanding throughout the period may not correlate with the Statement of Operations for the period due to the timing of sales and repurchases of the Fund shares in relation to income earned and/or fluctuating market value of the investments of the Fund.
b Based on average daily shares outstanding.
c Total return does not include any fees, charges or expenses imposed by the variable annuity and life insurance contracts for which the Franklin Templeton Variable Insurance Products Trust serves as an underlying investment vehicle.
d Amount rounds to less than $0.01 per share.
e Benefit of expense reduction rounds to less than 0.01%.
f Excludes the value of portfolio securities delivered as a result of a redemption in-kind. See Note 9.
The accompanying notes are an integral part of these financial statements.
TF-8
Franklin Templeton Variable Insurance Products Trust
Financial Highlights (continued)
Templeton Foreign Securities Fund
| | | | | | | | | | | | | | | | | | | | |
| | | Year Ended December 31, | |
| Class 2 | | 2007 | | | 2006 | | | 2005 | | | 2004 | | | 2003 | |
| | | | |
Per share operating performance | | | | | | | | | | | | | | | | | | | | |
(for a share outstanding throughout the year) | | | | | | | | | | | | | | | | | | | | |
Net asset value, beginning of year | | $ | 18.73 | | | $ | 15.63 | | | $ | 14.35 | | | $ | 12.24 | | | $ | 9.42 | |
| | | | |
Income from investment operationsa: | | | | | | | | | | | | | | | | | | | | |
Net investment incomeb | | | 0.38 | | | | 0.40 | | | | 0.26 | | | | 0.22 | | | | 0.15 | |
Net realized and unrealized gains (losses) | | | 2.44 | | | | 2.91 | | | | 1.19 | | | | 2.03 | | | | 2.85 | |
| | | | |
Total from investment operations | | | 2.82 | | | | 3.31 | | | | 1.45 | | | | 2.25 | | | | 3.00 | |
| | | | |
Less distributions from: | | | | | | | | | | | | | | | | | | | | |
Net investment income | | | (0.40 | ) | | | (0.21 | ) | | | (0.17 | ) | | | (0.14 | ) | | | (0.18 | ) |
Net realized gains | | | (0.90 | ) | | | — | | | | — | | | | — | | | | — | |
| | | | |
Total distributions | | | (1.30 | ) | | | (0.21 | ) | | | (0.17 | ) | | | (0.14 | ) | | | (0.18 | ) |
| | | | |
Redemption fees | | | — | d | | | — | d | | | — | d | | | — | d | | | — | |
| | | | |
Net asset value, end of year | | $ | 20.25 | | | $ | 18.73 | | | $ | 15.63 | | | $ | 14.35 | | | $ | 12.24 | |
| | | | |
| | | | | |
Total returnc | | | 15.46% | | | | 21.44% | | | | 10.17% | | | | 18.53% | | | | 32.21% | |
Ratios to average net assets | | | | | | | | | | | | | | | | | | | | |
Expenses | | | 1.00% | e | | | 1.00% | e | | | 1.02% | e | | | 1.07% | e | | | 1.12% | |
Net investment income | | | 1.97% | | | | 2.38% | | | | 1.78% | | | | 1.70% | | | | 1.56% | |
| | | | | |
Supplemental data | | | | | | | | | | | | | | | | | | | | |
Net assets, end of year (000’s) | | $ | 3,255,154 | | | $ | 2,941,374 | | | $ | 2,232,990 | | | $ | 1,445,928 | | | $ | 653,594 | |
Portfolio turnover rate | | | 26.74% | | | | 18.97% | f | | | 14.61% | | | | 10.91% | | | | 18.01% | |
a The amount shown for a share outstanding throughout the period may not correlate with the Statement of Operations for the period due to the timing of sales and repurchases of the Fund shares in relation to income earned and/or fluctuating market value of the investments of the Fund.
b Based on average daily shares outstanding.
c Total return does not include any fees, charges or expenses imposed by the variable annuity and life insurance contracts for which the Franklin Templeton Variable Insurance Products Trust serves as an underlying investment vehicle.
d Amount rounds to less than $0.01 per share.
e Benefit of expense reduction rounds to less than 0.01%.
f Excludes the value of portfolio securities delivered as a result of a redemption in-kind. See Note 9.
The accompanying notes are an integral part of these financial statements.
TF-9
Franklin Templeton Variable Insurance Products Trust
Financial Highlights (continued)
Templeton Foreign Securities Fund
| | | | | | | | | | | | | | | | |
| | | Year Ended December 31, | |
| Class 3 | | 2007 | | | 2006 | | | 2005 | | | 2004h | |
| | | | |
Per share operating performance | | | | | | | | | | | | | | | | |
(for a share outstanding throughout the year) | | | | | | | | | | | | | | | | |
Net asset value, beginning of year | | $ | 18.68 | | | $ | 15.60 | | | $ | 14.35 | | | $ | 12.48 | |
| | | | |
Income from investment operationsa: | | | | | | | | | | | | | | | | |
Net investment incomeb | | | 0.37 | | | | 0.37 | | | | 0.25 | | | | 0.09 | |
Net realized and unrealized gains (losses) | | | 2.45 | | | | 2.94 | | | | 1.18 | | | | 1.92 | |
| | | | |
Total from investment operations | | | 2.82 | | | | 3.31 | | | | 1.43 | | | | 2.01 | |
| | | | |
Less distributions from: | | | | | | | | | | | | | | | | |
Net investment income | | | (0.42 | ) | | | (0.23 | ) | | | (0.18 | ) | | | (0.14 | ) |
Net realized gains | | | (0.90 | ) | | | — | | | | — | | | | — | |
| | | | |
Total distributions | | | (1.32 | ) | | | (0.23 | ) | | | (0.18 | ) | | | (0.14 | ) |
| | | | |
Redemption fees | | | — | e | | | — | e | | | — | e | | | — | e |
| | | | |
Net asset value, end of year | | $ | 20.18 | | | $ | 18.68 | | | $ | 15.60 | | | $ | 14.35 | |
| | | | |
| | | | |
Total returnc | | | 15.45% | | | | 21.46% | | | | 10.13% | | | | 16.25% | |
Ratios to average net assetsd | | | | | | | | | | | | | | | | |
Expenses | | | 1.00% | f | | | 1.00% | f | | | 1.02% | f | | | 1.07% | f |
Net investment income | | | 1.97% | | | | 2.38% | | | | 1.78% | | | | 1.70% | |
| | | | |
Supplemental data | | | | | | | | | | | | | | | | |
Net assets, end of year (000’s) | | $ | 313,505 | | | $ | 150,417 | | | $ | 47,462 | | | $ | 16,559 | |
Portfolio turnover rate | | | 26.74% | | | | 18.97%g | | | | 14.61% | | | | 10.91% | |
aThe amount shown for a share outstanding throughout the period may not correlate with the Statement of Operations for the period due to the timing of sales and repurchases of the Fund shares in relation to income earned and/or fluctuating market value of the investments of the Fund.
bBased on average daily shares outstanding.
cTotal return does not include any fees, charges or expenses imposed by the variable annuity and life insurance contracts for which the Franklin Templeton Variable Insurance Products Trust serves as an underlying investment vehicle. Total return is not annualized for periods less than one year.
dRatios are annualized for periods less than one year.
eAmount rounds to less than $0.01 per share.
fBenefit of expense reduction rounds to less than 0.01%.
gExcludes the value of portfolio securities delivered as a result of a redemption in-kind. See Note 9.
hFor the period May 1, 2004 (effective date) to December 31, 2004.
The accompanying notes are an integral part of these financial statements.
TF-10
Franklin Templeton Variable Insurance Products Trust
Statement of Investments, December 31, 2007
| | | | | | | |
| Templeton Foreign Securities Fund | | Country | | Shares | | Value |
Long Term Investments 95.9% | | | | | | | |
Common Stocks 95.0% | | | | | | | |
Aerospace & Defense 1.9% | | | | | | | |
BAE Systems PLC | | United Kingdom | | 4,494,870 | | $ | 44,476,790 |
Embraer-Empresa Brasileira de Aeronautica SA, ADR | | Brazil | | 700,030 | | | 31,914,368 |
| | | | | | | |
| | | | | | | 76,391,158 |
| | | | | | | |
Air Freight & Logistics 0.9% | | | | | | | |
Deutsche Post AG | | Germany | | 1,087,912 | | | 37,007,990 |
| | | | | | | |
Auto Components 1.1% | | | | | | | |
NOK Corp. | | Japan | | 2,198,155 | | | 46,815,389 |
| | | | | | | |
Capital Markets 2.4% | | | | | | | |
Invesco Ltd. | | Bermuda | | 2,403,147 | | | 75,410,753 |
aKKR Private Equity Investors LP, 144A | | United States | | 1,155,000 | | | 20,974,800 |
| | | | | | | |
| | | | | | | 96,385,553 |
| | | | | | | |
Chemicals 0.6% | | | | | | | |
Ciba Specialty Chemicals AG | | Switzerland | | 550,500 | | | 25,504,103 |
| | | | | | | |
Commercial Banks 10.2% | | | | | | | |
DBS Group Holdings Ltd. | | Singapore | | 1,240,347 | | | 17,812,052 |
Hana Financial Group Inc. | | South Korea | | 672,040 | | | 36,184,836 |
Kookmin Bank, ADR | | South Korea | | 295,869 | | | 21,693,115 |
Mega Financial Holding Co. Ltd. | | Taiwan | | 34,084,000 | | | 20,967,493 |
Mitsubishi UFJ Financial Group Inc. | | Japan | | 7,454,000 | | | 69,984,648 |
Royal Bank of Scotland Group PLC | | United Kingdom | | 4,311,704 | | | 38,038,105 |
Shinhan Financial Group Co. Ltd. | | South Korea | | 762,930 | | | 43,605,315 |
Shinsei Bank Ltd. | | Japan | | 8,731,478 | | | 31,945,864 |
Sumitomo Mitsui Financial Group Inc. | | Japan | | 9,191 | | | 68,985,042 |
UniCredito Italiano SpA | | Italy | | 8,344,507 | | | 69,168,518 |
| | | | | | | |
| | | | | | | 418,384,988 |
| | | | | | | |
Commercial Services & Supplies 1.2% | | | | | | | |
Adecco SA | | Switzerland | | 527,850 | | | 28,530,544 |
Securitas AB, B | | Sweden | | 1,278,238 | | | 17,792,570 |
Securitas Systems AB, B | | Sweden | | 1,103,738 | | | 3,926,253 |
| | | | | | | |
| | | | | | | 50,249,367 |
| | | | | | | |
Computers & Peripherals 1.3% | | | | | | | |
Compal Electronics Inc. | | Taiwan | | 12,852,983 | | | 14,069,716 |
Lite-On Technology Corp. | | Taiwan | | 22,703,166 | | | 39,623,780 |
| | | | | | | |
| | | | | | | 53,693,496 |
| | | | | | | |
Containers & Packaging 0.9% | | | | | | | |
Amcor Ltd. | | Australia | | 5,968,788 | | | 36,136,215 |
| | | | | | | |
Diversified Financial Services 2.0% | | | | | | | |
ING Groep NV | | Netherlands | | 2,046,888 | | | 79,905,618 |
| | | | | | | |
Diversified Telecommunication Services 10.3% | | | | | | | |
China Telecom Corp. Ltd., H | | China | | 76,952,357 | | | 61,182,161 |
Chunghwa Telecom Co. Ltd., ADR | | Taiwan | | 2,589,183 | | | 54,657,647 |
France Telecom SA | | France | | 2,431,453 | | | 87,360,151 |
KT Corp., ADR | | South Korea | | 397,895 | | | 10,265,691 |
Singapore Telecommunications Ltd. | | Singapore | | 20,278,000 | | | 56,271,116 |
Telefonica SA, ADR | | Spain | | 829,094 | | | 80,911,283 |
TF-11
Franklin Templeton Variable Insurance Products Trust
Statement of Investments, December 31, 2007 (continued)
| | | | | | | |
| Templeton Foreign Securities Fund | | Country | | Shares | | Value |
Long Term Investments (continued) | | | | | | | |
Common Stocks (continued) | | | | | | | |
Diversified Telecommunication Services (continued) | | | | | | | |
Telekom Austria AG | | Austria | | 727,240 | | $ | 20,196,495 |
Telenor ASA | | Norway | | 2,169,354 | | | 51,793,851 |
| | | | | | | |
| | | | | | | 422,638,395 |
| | | | | | | |
Electric Utilities 2.0% | | | | | | | |
British Energy Group PLC | | United Kingdom | | 5,766,390 | | | 62,729,972 |
Hong Kong Electric Holdings Ltd. | | Hong Kong | | 3,453,969 | | | 19,865,161 |
| | | | | | | |
| | | | | | | 82,595,133 |
| | | | | | | |
Electrical Equipment 1.5% | | | | | | | |
Gamesa Corp. Tecnologica SA | | Spain | | 606,877 | | | 28,322,957 |
bVestas Wind Systems AS | | Denmark | | 298,648 | | | 32,264,154 |
| | | | | | | |
| | | | | | | 60,587,111 |
| | | | | | | |
Electronic Equipment & Instruments 2.5% | | | | | | | |
bFlextronics International Ltd. | | Singapore | | 2,282,540 | | | 27,527,432 |
FUJIFILM Holdings Corp. | | Japan | | 921,374 | | | 39,080,832 |
Hitachi Ltd. | | Japan | | 3,178,263 | | | 23,741,139 |
Venture Corp. Ltd. | | Singapore | | 1,339,613 | | | 11,895,693 |
| | | | | | | |
| | | | | | | 102,245,096 |
| | | | | | | |
Food Products 2.2% | | | | | | | |
Nestle SA | | Switzerland | | 103,509 | | | 47,497,953 |
Unilever PLC | | United Kingdom | | 1,170,483 | | | 43,955,566 |
| | | | | | | |
| | | | | | | 91,453,519 |
| | | | | | | |
Health Care Providers & Services 0.7% | | | | | | | |
Celesio AG | | Germany | | 440,310 | | | 27,283,368 |
| | | | | | | |
Hotels Restaurants & Leisure 2.0% | | | | | | | |
Compass Group PLC | | United Kingdom | | 9,792,178 | | | 60,023,516 |
bTUI AG | | Germany | | 792,560 | | | 22,172,451 |
| | | | | | | |
| | | | | | | 82,195,967 |
| | | | | | | |
Household Durables 0.3% | | | | | | | |
Husqvarna AB, A | | Sweden | | 235,727 | | | 2,798,157 |
Husqvarna AB, B | | Sweden | | 785,757 | | | 9,327,196 |
| | | | | | | |
| | | | | | | 12,125,353 |
| | | | | | | |
Industrial Conglomerates 4.4% | | | | | | | |
Hutchison Whampoa Ltd. | | Hong Kong | | 3,276,709 | | | 37,166,093 |
Koninklijke Philips Electronics NV | | Netherlands | | 899,289 | | | 38,741,380 |
Siemens AG | | Germany | | 661,824 | | | 104,715,595 |
| | | | | | | |
| | | | | | | 180,623,068 |
| | | | | | | |
Insurance 4.1% | | | | | | | |
ACE Ltd. | | Bermuda | | 729,799 | | | 45,086,982 |
Aviva PLC | | United Kingdom | | 2,795,400 | | | 37,380,576 |
AXA SA | | France | | 453,589 | | | 18,130,676 |
aAXA SA, 144A | | France | | 38,270 | | | 1,529,713 |
Old Mutual PLC | | United Kingdom | | 19,529,314 | | | 65,035,123 |
| | | | | | | |
| | | | | | | 167,163,070 |
| | | | | | | |
TF-12
Franklin Templeton Variable Insurance Products Trust
Statement of Investments, December 31, 2007 (continued)
| | | | | | | |
| Templeton Foreign Securities Fund | | Country | | Shares | | Value |
Long Term Investments (continued) | | | | | | | |
Common Stocks (continued) | | | | | | | |
Life Sciences Tools & Services 1.1% | | | | | | | |
Lonza Group AG | | Switzerland | | 367,800 | | $ | 44,595,588 |
| | | | | | | |
Media 5.1% | | | | | | | |
British Sky Broadcasting Group PLC | | United Kingdom | | 2,941,216 | | | 36,174,666 |
Eutelsat Communications | | France | | 2,081,860 | | | 61,826,603 |
Pearson PLC | | United Kingdom | | 3,409,246 | | | 49,585,692 |
Reed Elsevier NV | | Netherlands | | 2,012,869 | | | 40,096,606 |
Vivendi SA | | France | | 444,350 | | | 20,348,742 |
| | | | | | | |
| | | | | | | 208,032,309 |
| | | | | | | |
Metals & Mining 1.6% | | | | | | | |
Barrick Gold Corp. | | Canada | | 663,561 | | | 27,897,941 |
POSCO, ADR | | South Korea | | 255,230 | | | 38,389,144 |
| | | | | | | |
| | | | | | | 66,287,085 |
| | | | | | | |
Multi-Utilities 1.5% | | | | | | | |
Centrica PLC | | United Kingdom | | 2,772,071 | | | 19,759,831 |
Suez SA | | France | | 630,996 | | | 42,883,704 |
| | | | | | | |
| | | | | | | 62,643,535 |
| | | | | | | |
Oil, Gas & Consumable Fuels 12.8% | | | | | | | |
BP PLC | | United Kingdom | | 6,622,666 | | | 80,927,278 |
Eni SpA | | Italy | | 1,275,111 | | | 46,613,871 |
Gazprom, ADR | | Russia | | 643,700 | | | 36,143,755 |
Hindustan Petroleum Corp. Ltd. | | India | | 2,415,168 | | | 22,628,601 |
Indian Oil Corp. Ltd. | | India | | 1,194,026 | | | 24,066,874 |
Reliance Industries Ltd. | | India | | 1,374,378 | | | 100,486,023 |
Royal Dutch Shell PLC, B | | United Kingdom | | 2,327,407 | | | 96,650,829 |
Sasol, ADR | | South Africa | | 971,480 | | | 48,059,116 |
Total SA, B | | France | | 846,266 | | | 70,184,950 |
| | | | | | | |
| | | | | | | 525,761,297 |
| | | | | | | |
Paper & Forest Products 2.3% | | | | | | | |
Norske Skogindustrier ASA | | Norway | | 1,362,151 | | | 11,329,327 |
Stora Enso OYJ, R | | Finland | | 2,665,971 | | | 40,098,625 |
UPM-Kymmene OYJ | | Finland | | 2,066,829 | | | 41,684,254 |
| | | | | | | |
| | | | | | | 93,112,206 |
| | | | | | | |
Pharmaceuticals 6.7% | | | | | | | |
GlaxoSmithKline PLC | | United Kingdom | | 3,611,345 | | | 91,775,442 |
Novartis AG | | Switzerland | | 1,093,760 | | | 59,938,666 |
Sanofi-Aventis | | France | | 1,066,665 | | | 98,037,031 |
Takeda Pharmaceutical Co. Ltd. | | Japan | | 421,454 | | | 24,830,317 |
| | | | | | | |
| | | | | | | 274,581,456 |
| | | | | | | |
Real Estate Management & Development 2.5% | | | | | | | |
Cheung Kong (Holdings) Ltd. | | Hong Kong | | 5,503,922 | | | 101,776,786 |
| | | | | | | |
Semiconductors & Semiconductor Equipment 4.1% | | | | | | | |
bInfineon Technologies AG | | Germany | | 3,757,123 | | | 44,521,613 |
bQimonda AG, ADR | | Germany | | 1,849,390 | | | 13,223,139 |
Samsung Electronics Co. Ltd. | | South Korea | | 98,969 | | | 58,786,137 |
Taiwan Semiconductor Manufacturing Co. Ltd. | | Taiwan | | 26,887,711 | | | 51,404,196 |
| | | | | | | |
| | | | | | | 167,935,085 |
| | | | | | | |
TF-13
Franklin Templeton Variable Insurance Products Trust
Statement of Investments, December 31, 2007 (continued)
| | | | | | | | |
| Templeton Foreign Securities Fund | | Country | | Shares | | Value | |
Long Term Investments (continued) | | | | | | | | |
Common Stocks (continued) | | | | | | | | |
Software 0.8% | | | | | | | | |
bCheck Point Software Technologies Ltd. | | Israel | | 1,448,281 | | $ | 31,804,251 | |
| | | | | | | | |
Specialty Retail 0.4% | | | | | | | | |
Kingfisher PLC | | United Kingdom | | 5,676,856 | | | 16,423,141 | |
| | | | | | | | |
Textiles, Apparel & Luxury Goods 0.4% | | | | | | | | |
Burberry Group PLC | | United Kingdom | | 1,512,618 | | | 17,116,303 | |
| | | | | | | | |
Wireless Telecommunication Services 3.2% | | | | | | | | |
Mobile TeleSystems, ADR | | Russia | | 434,900 | | | 44,268,471 | |
Turkcell Iletisim Hizmetleri AS, ADR | | Turkey | | 823,650 | | | 22,708,031 | |
Vodafone Group PLC, ADR | | United Kingdom | | 1,773,520 | | | 66,187,765 | |
| | | | | | | | |
| | | | | | | 133,164,267 | |
| | | | | | | | |
Total Common Stocks (Cost $2,922,550,906) | | | | | | | 3,892,617,266 | |
| | | | | | | | |
Preferred Stock (Cost $2,340,943) 0.9% | | | | | | | | |
Metals & Mining 0.9% | | | | | | | | |
Companhia Vale do Rio Doce, ADR, pfd., A | | Brazil | | 1,296,112 | | | 36,265,214 | |
| | | | | | | | |
Total Long Term Investments (Cost $2,924,891,849) | | | | | | | 3,928,882,480 | |
| | | | | | | | |
Short Term Investment (Cost $177,468,579) 4.3% | | | | | | | | |
Money Market Fund 4.3% | | | | | | | | |
cFranklin Institutional Fiduciary Trust Money Market Portfolio, 4.58% | | United States | | 177,468,579 | | | 177,468,579 | |
| | | | | | | | |
Total Investments (Cost $3,102,360,428) 100.2% | | | | | | | 4,106,351,059 | |
Other Assets, less Liabilities (0.2)% | | | | | | | (6,315,408 | ) |
| | | | | | | | |
Net Assets 100.0% | | | | | | $ | 4,100,035,651 | |
| | | | | | | | |
Selected Portfolio Abbreviation
ADR - American Depository Receipt
aSecurity was purchased pursuant to Rule 144A under the Securities Act of 1933 and may be sold in transactions exempt from registration only to qualified institutional buyers or in a public offering registered under the Securities Act of 1933. These securities have been deemed liquid under guidelines approved by the Trust’s Board of Trustees. At December 31, 2007, the aggregate value of these securities was $22,504,513, representing 0.55% of net assets.
bNon-income producing for the twelve months ended December 31, 2007.
cSee Note 7 regarding investments in the Franklin Institutional Fiduciary Trust Money Market Portfolio. The rate shown is the annualized seven-day yield at period end.
The accompanying notes are an integral part of these financial statements.
TF-14
Franklin Templeton Variable Insurance Products Trust
Financial Statements
Statement of Assets and Liabilities
December 31, 2007
| | | |
| | | Templeton
Foreign
Securities Fund |
Assets: | | | |
Investments in securities: | | | |
Cost - Unaffiliated issuers | | $ | 2,924,891,849 |
Cost - Sweep Money Fund (Note 7) | | | 177,468,579 |
| | | |
Total cost of investments | | $ | 3,102,360,428 |
| | | |
Value - Unaffiliated issuers | | $ | 3,928,882,480 |
Value - Sweep Money Fund (Note 7) | | | 177,468,579 |
| | | |
Total value of investments | | | 4,106,351,059 |
Foreign currency, at value (cost $61,607) | | | 61,451 |
Receivables: | | | |
Capital shares sold | | | 2,021,896 |
Dividends | | | 4,658,756 |
| | | |
Total assets | | | 4,113,093,162 |
| | | |
Liabilities: | | | |
Payables: | | | |
Capital shares redeemed | | | 7,263,709 |
Affiliates | | | 3,927,375 |
Deferred taxes | | | 997,091 |
Accrued expenses and other liabilities | | | 869,336 |
| | | |
Total liabilities | | | 13,057,511 |
| | | |
Net assets, at value | | $ | 4,100,035,651 |
| | | |
Net assets consist of: | | | |
Paid-in capital | | $ | 2,699,600,752 |
Undistributed net investment income | | | 79,657,780 |
Net unrealized appreciation (depreciation) | | | 1,003,049,810 |
Accumulated net realized gain (loss) | | | 317,727,309 |
| | | |
Net assets, at value | | $ | 4,100,035,651 |
| | | |
Class 1: | | | |
Net assets, at value | | $ | 531,376,696 |
| | | |
Shares outstanding | | | 25,827,290 |
| | | |
Net asset value and maximum offering price per share | | $ | 20.57 |
| | | |
Class 2: | | | |
Net assets, at value | | $ | 3,255,154,238 |
| | | |
Shares outstanding | | | 160,727,412 |
| | | |
Net asset value and maximum offering price per share | | $ | 20.25 |
| | | |
Class 3: | | | |
Net assets, at value | | $ | 313,504,717 |
| | | |
Shares outstanding | | | 15,535,675 |
| | | |
Net asset value and maximum offering price per sharea | | $ | 20.18 |
| | | |
a | Redemption price is equal to net asset value less any redemption fees retained by the Fund. |
The accompanying notes are an integral part of these financial statements.
TF-15
Franklin Templeton Variable Insurance Products Trust
Financial Statements (continued)
Statement of Operations
for the year ended December 31, 2007
| | | | |
| | | Templeton
Foreign
Securities Fund | |
Investment income: | | | | |
Dividends (net of foreign taxes of $8,216,242) | | | | |
Unaffiliated issuers | | $ | 105,905,206 | |
Sweep Money Fund (Note 7) | | | 12,133,090 | |
Interest (net of foreign taxes of $199) | | | 929 | |
| | | | |
Total investment income | | | 118,039,225 | |
| | | | |
Expenses: | | | | |
Management fees (Note 3a) | | | 24,092,917 | |
Administrative fees (Note 3b) | | | 3,553,533 | |
Distribution fees: (Note 3c) | | | | |
Class 2 | | | 7,886,342 | |
Class 3 | | | 576,111 | |
Unaffiliated transfer agent fees | | | 65,714 | |
Custodian fees (Note 4) | | | 1,034,043 | |
Reports to shareholders | | | 891,521 | |
Professional fees | | | 167,113 | |
Trustees’ fees and expenses | | | 16,559 | |
Other | | | 88,114 | |
| | | | |
Total expenses | | | 38,371,967 | |
Expense reductions (Note 4) | | | (11,975 | ) |
| | | | |
Net expenses | | | 38,359,992 | |
| | | | |
Net investment income | | | 79,679,233 | |
| | | | |
Realized and unrealized gains (losses): | | | | |
Net realized gain (loss) from: | | | | |
Investments | | | 318,979,414 | |
Foreign currency transactions | | | 688,164 | |
| | | | |
Net realized gain (loss) | | | 319,667,578 | |
| | | | |
Net change in unrealized appreciation (depreciation) on: | | | | |
Investments | | | 172,139,703 | |
Translation of assets and liabilities denominated in foreign currencies | | | (19,932 | ) |
Change in deferred taxes on unrealized appreciation (depreciation) | | | (96,863 | ) |
| | | | |
Net change in unrealized appreciation (depreciation) | | | 172,022,908 | |
| | | | |
Net realized and unrealized gain (loss) | | | 491,690,486 | |
| | | | |
Net increase (decrease) in net assets resulting from operations | | $ | 571,369,719 | |
| | | | |
The accompanying notes are an integral part of these financial statements.
TF-16
Franklin Templeton Variable Insurance Products Trust
Financial Statements (continued)
Statements of Changes in Net Assets
| | | | | | | | |
| | | Templeton Foreign
Securities Fund | |
| | | Year Ended December 31, | |
| | | 2007 | | | 2006 | |
| | | | |
Increase (decrease) in net assets: | | | | | | | | |
Operations: | | | | | | | | |
Net investment income | | $ | 79,679,233 | | | $ | 77,320,581 | |
Net realized gain (loss) from investments, foreign currency transactions and redemption in-kind (Note 9) | | | 319,667,578 | | | | 216,717,127 | |
Net change in unrealized appreciation (depreciation) on investments and translation of assets and liabilities denominated in foreign currencies, and deferred taxes | | | 172,022,908 | | | | 342,405,989 | |
| | | | |
Net increase (decrease) in net assets resulting from operations | | | 571,369,719 | | | | 636,443,697 | |
| | | | |
Distributions to shareholders from: | | | | | | | | |
Net investment income: | | | | | | | | |
Class 1 | | | (13,007,672 | ) | | | (7,899,286 | ) |
Class 2 | | | (62,378,038 | ) | | | (30,532,245 | ) |
Class 3 | | | (4,668,468 | ) | | | (1,067,001 | ) |
Net realized gains: | | | | | | | | |
Class 1 | | | (26,934,025 | ) | | | — | |
Class 2 | | | (142,276,757 | ) | | | — | |
Class 3 | | | (10,123,984 | ) | | | — | |
| | | | |
Total distributions to shareholders | | | (259,388,944 | ) | | | (39,498,532 | ) |
| | | | |
Capital share transactions: (Note 2) | | | | | | | | |
Class 1 | | | (110,488,366 | ) | | | (39,662,208 | ) |
Class 2 | | | 66,307,351 | | | | 232,018,498 | |
Class 3 | | | 145,429,492 | | | | 85,243,717 | |
| | | | |
Total capital share transactions | | | 101,248,477 | | | | 277,600,007 | |
| | | | |
Redemption fees | | | 24,688 | | | | 9,162 | |
| | | | |
Net increase (decrease) in net assets | | | 413,253,940 | | | | 874,554,334 | |
Net assets: | | | | | | | | |
Beginning of year | | | 3,686,781,711 | | | | 2,812,227,377 | |
| | | | |
End of year | | $ | 4,100,035,651 | | | $ | 3,686,781,711 | |
| | | | |
Undistributed net investment income included in net assets: | | | | | | | | |
End of year | | $ | 79,657,780 | | | $ | 79,126,854 | |
| | | | |
The accompanying notes are an integral part of these financial statements.
TF-17
Franklin Templeton Variable Insurance Products Trust
Notes to Financial Statements
Templeton Foreign Securities Fund
1. ORGANIZATION AND SIGNIFICANT ACCOUNTING POLICIES
Franklin Templeton Variable Insurance Products Trust (Trust) is registered under the Investment Company Act of 1940, as amended, (1940 Act) as an open-end investment company, consisting of twenty-three separate funds. The Templeton Foreign Securities Fund (Fund) included in this report is diversified. The financial statements of the remaining funds in the Trust are presented separately. Shares of the Fund are sold only to insurance company separate accounts to fund the benefits of variable life insurance policies or variable annuity contracts. The Fund offers three classes of shares: Class 1, Class 2, and Class 3. Each class of shares differs by its distribution fees, voting rights on matters affecting a single class and its exchange privilege.
The following summarizes the Fund’s significant accounting policies.
a. Security Valuation
Securities listed on a securities exchange or on the NASDAQ National Market System are valued at the last quoted sale price or the official closing price of the day, respectively. Over-the-counter securities and listed securities for which there is no reported sale are valued within the range of the most recent quoted bid and ask prices. Securities that trade in multiple markets or on multiple exchanges are valued according to the broadest and most representative market. Investments in open-end mutual funds are valued at the closing net asset value.
Foreign securities are valued as of the close of trading on the foreign stock exchange on which the security is primarily traded, or the NYSE, whichever is earlier. If no sale is reported at that time, the foreign security will be valued within the range of the most recent quoted bid and ask prices. The value is then converted into its U.S. dollar equivalent at the foreign exchange rate in effect at the close of the NYSE on the day that the value of the foreign security is determined.
The Trust has procedures to determine the fair value of individual securities and other assets for which market prices are not readily available or which may not be reliably priced. Methods for valuing these securities may include: fundamental analysis, matrix pricing, discounts from market prices of similar securities, or discounts applied due to the nature and duration of restrictions on the disposition of the securities. Due to the inherent uncertainty of valuations of such securities, the fair values may differ significantly from the values that would have been used had a ready market for such investments existed. Occasionally, events occur between the time at which trading in a security is completed and the close of the NYSE that might call into question the availability (including the reliability) of the value of a portfolio security held by the Fund. The investment manager monitors price movements following the close of trading in foreign stock markets through a series of country specific market proxies (such as baskets of American Depository Receipts, futures contracts and exchange traded funds). These price movements are measured against established trigger thresholds for each specific market proxy to assist in determining if an event has occurred. If such an event occurs, the securities may be valued using fair value procedures, which may include the use of independent pricing services. All security valuation procedures are approved by the Trust’s Board of Trustees.
b. Foreign Currency Translation
Portfolio securities and other assets and liabilities denominated in foreign currencies are translated into U.S. dollars based on the exchange rate of such currencies against U.S. dollars on the date of valuation. Purchases and sales of securities, income and expense items denominated in foreign currencies are translated into U.S. dollars at the exchange rate in effect on the transaction date. Occasionally, events may impact the availability or reliability of foreign exchange rates used to convert the U.S. dollar equivalent value. If such an event occurs, the foreign exchange rate will be valued at fair value using procedures established and approved by the Trust’s Board of Trustees.
The Fund does not separately report the effect of changes in foreign exchange rates from changes in market prices on securities held. Such changes are included in net realized and unrealized gain or loss from investments on the Statement of Operations.
TF-18
Franklin Templeton Variable Insurance Products Trust
Notes to Financial Statements (continued)
Templeton Foreign Securities Fund
1. ORGANIZATION AND SIGNIFICANT ACCOUNTING POLICIES (continued)
b. Foreign Currency Translation (continued)
Realized foreign exchange gains or losses arise from sales of foreign currencies, currency gains or losses realized between the trade and settlement dates on securities transactions and the difference between the recorded amounts of dividends, interest, and foreign withholding taxes and the U.S. dollar equivalent of the amounts actually received or paid. Net unrealized foreign exchange gains and losses arise from changes in foreign exchange rates on foreign denominated assets and liabilities other than investments in securities held at the end of the reporting period.
c. Foreign Currency Contracts
When the Fund purchases or sells foreign securities it may enter into foreign exchange contracts to minimize foreign exchange risk from the trade date to the settlement date of the transactions. A foreign exchange contract is an agreement between two parties to exchange different currencies at an agreed upon exchange rate at a future date. Realized and unrealized gains and losses on these contracts are included in the Statement of Operations.
The risks of these contracts include movement in the values of the foreign currencies relative to the U.S. dollar and the possible inability of the counterparties to fulfill their obligations under the contracts, which may be in excess of the amount reflected in the Statement of Assets and Liabilities.
d. Income and Deferred Taxes
No provision has been made for U.S. income taxes because it is the Fund’s policy to qualify as a regulated investment company under the Internal Revenue Code and to distribute to shareholders substantially all of its taxable income and net realized gains.
Foreign securities held by the Fund may be subject to foreign taxation on dividend income received. Foreign taxes, if any, are recorded based on the tax regulations and rates that exist in the foreign markets in which the Fund invests.
The Fund may be subject to a tax imposed on net realized gains on securities of certain foreign countries. The Fund records an estimated deferred tax liability for net unrealized gains on these securities in an amount that would be payable if the securities were disposed of on the valuation date.
e. Security Transactions, Investment Income, Expenses and Distributions
Security transactions are accounted for on trade date. Realized gains and losses on security transactions are determined on a specific identification basis. Interest income and estimated expenses are accrued daily. Dividend income is recorded on the ex-dividend date except that certain dividends from foreign securities are recognized as soon as the Fund is notified of the ex-dividend date. Distributions to shareholders are recorded on the ex-dividend date and are determined according to income tax regulations (tax basis). Distributable earnings determined on a tax basis may differ from earnings recorded in accordance with accounting principles generally accepted in the United States of America. These differences may be permanent or temporary. Permanent differences are reclassified among capital accounts to reflect their tax character. These reclassifications have no impact on net assets or the results of operations. Temporary differences are not reclassified, as they may reverse in subsequent periods.
Common expenses incurred by the Trust are allocated among the funds based on the ratio of net assets of each fund to the combined net assets of the Trust. Fund specific expenses are charged directly to the fund that incurred the expense.
Realized and unrealized gains and losses and net investment income, other than class specific expenses, are allocated daily to each class of shares based upon the relative proportion of net assets of each class. Differences in per share distributions, by class, are generally due to differences in class specific expenses.
TF-19
Franklin Templeton Variable Insurance Products Trust
Notes to Financial Statements (continued)
Templeton Foreign Securities Fund
1. ORGANIZATION AND SIGNIFICANT ACCOUNTING POLICIES (continued)
f. Accounting Estimates
The preparation of financial statements in accordance with accounting principles generally accepted in the United States of America requires management to make estimates and assumptions that affect the reported amounts of assets and liabilities at the date of the financial statements and the amounts of income and expenses during the reporting period. Actual results could differ from those estimates.
g. Redemption Fees
Redemptions and exchanges of Class 3 shares held 60 days or less may be subject to the fund’s redemption fee, which is 1% of the amount redeemed. Such fees are retained by the fund and accounted for as an addition to paid-in capital.
h. Guarantees and Indemnifications
Under the Trust’s organizational documents, its officers and trustees are indemnified by the Trust against certain liabilities arising out of the performance of their duties to the Trust. Additionally, in the normal course of business, the Trust, on behalf of the Fund, enters into contracts with service providers that contain general indemnification clauses. The Trust’s maximum exposure under these arrangements is unknown as this would involve future claims that may be made against the Trust that have not yet occurred. Currently, the Trust expects the risk of loss to be remote.
2. SHARES OF BENEFICIAL INTEREST
At December 31, 2007, there were an unlimited number of shares authorized (without par value). Transactions in the Fund’s shares were as follows:
| | | | | | | | | | | | | | |
| | | Year Ended December 31, | |
| | | 2007 | | | 2006 | |
| Class 1 Shares: | | Shares | | | Amount | | | Shares | | | Amount | |
Shares sold | | 1,232,157 | | | $ | 24,254,763 | | | 2,328,810 | | | $ | 39,073,549 | |
Shares issued in reinvestment of distributions | | 2,040,966 | | | | 39,941,697 | | | 492,781 | | | | 7,899,286 | |
Shares redeemed | | (8,769,318 | ) | | | (174,684,826 | ) | | (5,075,580 | ) | | | (86,635,043 | ) |
| | | | |
Net increase (decrease) | | (5,496,195 | ) | | $ | (110,488,366 | ) | | (2,253,989 | ) | | $ | (39,662,208 | ) |
| | | | |
| Class 2 Shares: | | | | | | | | | | | | |
Shares sold | | 20,015,006 | | | $ | 388,403,751 | | | 43,227,824 | | | $ | 728,731,224 | |
Shares issued in reinvestment of distributions | | 10,576,152 | | | | 204,013,968 | | | 1,925,158 | | | | 30,455,999 | |
Shares redeemed in-kind (Note 10) | | — | | | | — | | | (8,720,489 | ) | | | (151,213,281 | ) |
Shares redeemed | | (26,940,536 | ) | | | (526,110,368 | ) | | (22,264,085 | ) | | | (375,955,444 | ) |
| | | | |
Net increase (decrease) | | 3,650,622 | | | $ | 66,307,351 | | | 14,168,408 | | | $ | 232,018,498 | |
| | | | |
| Class 3 Shares: | | | | | | | | | | | | |
Shares sold | | 7,292,215 | | | $ | 141,648,697 | | | 5,176,865 | | | $ | 88,136,330 | |
Shares issued in reinvestment of distributions | | 769,639 | | | | 14,792,452 | | | 67,617 | | | | 1,067,001 | |
Shares redeemed | | (578,013 | ) | | | (11,011,657 | ) | | (234,367 | ) | | | (3,959,614 | ) |
| | | | |
Net increase (decrease) | | 7,483,841 | | | $ | 145,429,492 | | | 5,010,115 | | | $ | 85,243,717 | |
| | | | |
TF-20
Franklin Templeton Variable Insurance Products Trust
Notes to Financial Statements (continued)
Templeton Foreign Securities Fund
3. TRANSACTIONS WITH AFFILIATES
Franklin Resources, Inc. is the holding company for various subsidiaries that together are referred to as Franklin Templeton Investments. Certain officers and trustees of the Trust are also officers and/or directors of the following subsidiaries:
| | |
| Subsidiary | | Affiliation |
Templeton Investment Counsel, LLC (TIC) | | Investment manager |
Franklin Templeton Services, LLC (FT Services) | | Administrative manager |
Franklin Templeton Distributors, Inc. (Distributors) | | Principal underwriter |
Franklin Templeton Investor Services, LLC (Investor Services) | | Transfer agent |
a. Management Fees
The Fund pays an investment management fee to TIC based on the average daily net assets of the Fund as follows:
| | |
| Annualized Fee Rate | | Net Assets |
| 0.750% | | Up to and including $200 million |
| 0.675% | | Over $200 million, up to and including $1.3 billion |
| 0.600% | | Over $1.3 billion, up to and including $10 billion |
| 0.580% | | Over $10 billion, up to and including $ 15 billion |
| 0.560% | | Over $15 billion, up to and including $ 20 billion |
| 0.540% | | In excess of $20 billion |
b. Administrative Fees
The Fund pays an administrative fee to FT Services based on the average daily net assets as follows:
| | |
| Annualized Fee Rate | | Net Assets |
| 0.150% | | Up to and including $200 million |
| 0.135% | | Over $200 million, up to and including $700 million |
| 0.100% | | Over $700 million, up to and including $1.2 billion |
| 0.075% | | In excess of $1.2 billion |
c. Distribution Fees
The Fund’s Board of Trustees has adopted distribution plans for Class 2 and Class 3 shares pursuant to Rule 12b-1 under the 1940 Act. Under the Fund’s compensation distribution plans, the Fund pays Distributors for costs incurred in connection with the servicing, sale and distribution of the Fund’s shares up to 0.25% and 0.35% per year of its average daily net assets of Class 2 and Class 3, respectively. The Board of Trustees has agreed to limit the current rate to 0.25% per year for Class 3.
d. Transfer Agent Fees
Investor Services, under terms of an agreement, performs shareholder servicing for the Fund and is not paid by the Fund for the services.
4. EXPENSE OFFSET ARRANGEMENT
The Fund has entered into an arrangement with its custodian whereby credits realized as a result of uninvested cash balances are used to reduce a portion of the Fund’s custodian expenses. During the year ended December 31, 2007, the custodian fees were reduced as noted in the Statement of Operations.
TF-21
Franklin Templeton Variable Insurance Products Trust
Notes to Financial Statements (continued)
Templeton Foreign Securities Fund
5. INCOME TAXES
The Fund has reviewed the tax positions taken on federal income tax returns, for each of the three open tax years and as of December 31, 2007 and has determined that no provision for income tax is required in the Fund’s financial statements.
The tax character of distributions paid during the years ended December 31, 2007 and 2006, was as follows:
| | | | | | |
| | | 2007 | | 2006 |
Distributions paid from: | | | | | | |
Ordinary income | | $ | 89,150,006 | | $ | 39,498,532 |
Long term capital gain | | | 170,238,938 | | | — |
| | | |
| | $ | 259,388,944 | | $ | 39,498,532 |
| | | |
At December 31, 2007, the cost of investments, net unrealized appreciation (depreciation), undistributed ordinary income and undistributed long term capital gains for income tax purposes were as follows:
| | | | |
Cost of investments | | $ | 3,102,347,243 | |
| | | | |
| |
Unrealized appreciation | | $ | 1,125,280,198 | |
Unrealized depreciation | | | (121,276,382 | ) |
| | | | |
Net unrealized appreciation (depreciation) | | $ | 1,004,003,816 | |
| | | | |
Undistributed ordinary income | | $ | 108,967,521 | |
Undistributed long term capital gains | | | 288,404,384 | |
| | | | |
Distributable earnings | | $ | 397,371,905 | |
| | | | |
Net investment income differs for financial statement and tax purposes primarily due to differing treatments of foreign currency transactions and pass-through entity income.
Net realized gains (losses) differ for financial statement and tax purposes primarily due to differing treatments of wash sales, foreign currency transactions and pass-through entity income.
6. INVESTMENT TRANSACTIONS
Purchases and sales of investments (excluding short term securities) for the year ended December 31, 2007, aggregated $997,801,739 and $1,004,038,466, respectively.
7. INVESTMENTS IN FRANKLIN INSTITUTIONAL FIDUCIARY TRUST MONEY MARKET PORTFOLIO
The Fund may invest in the Franklin Institutional Fiduciary Trust Money Market Portfolio (Sweep Money Fund), an open-end investment company managed by Franklin Advisers, Inc. (an affiliate of the investment manager. Management fees paid by the Fund are reduced on assets invested in the Sweep Money Fund, in an amount not to exceed the management and administrative fees paid by the Sweep Money Fund.
8. CONCENTRATION OF RISK
Investing in foreign securities may include certain risks and considerations not typically associated with investing in U.S. securities, such as fluctuating currency values and changing local and regional economic, political and social conditions, which may result in greater market volatility. In addition, certain foreign securities may not be as liquid as U.S. securities.
TF-22
Franklin Templeton Variable Insurance Products Trust
Notes to Financial Statements (continued)
Templeton Foreign Securities Fund
9. REDEMPTION IN-KIND
During the year ended December 31, 2006, the Fund realized $34,808,242 of net gains resulting from a redemption in-kind in which a shareholder redeemed fund shares for securities held by the Fund rather than for cash. Because such gains are not taxable to the Fund, and are not distributed to shareholders, they have been reclassified from accumulated net realized gains to paid-in capital.
10. REGULATORY AND LITIGATION MATTERS
As part of various investigations by a number of federal, state, and foreign regulators and governmental entities, including the Securities and Exchange Commission (“SEC”), relating to certain practices in the mutual fund industry, including late trading, market timing and marketing support payments to securities dealers who sell fund shares (“marketing support”), Franklin Resources, Inc. and certain of its subsidiaries (collectively, the “Company”), entered into settlements with certain of those regulators and governmental entities. Specifically, the Company entered into settlements with the SEC, among others, concerning market timing and marketing support.
On June 6, 2007, the SEC posted for public comment the proposed plan of distribution for the market timing settlement. Once the SEC approves the final plan of distribution, disbursements of settlement monies will be made promptly to individuals who were shareholders of the designated funds during the relevant period, in accordance with the terms and conditions of the settlement and plan.
In addition, the Company, as well as most of the mutual funds within Franklin Templeton Investments and certain current or former officers, Company directors, fund directors, and employees, have been named in private lawsuits (styled as shareholder class actions, or as derivative actions on behalf of either the named funds or Franklin Resources, Inc.). The lawsuits relate to the industry practices referenced above.
The Company and fund management believe that the claims made in each of the private lawsuits referenced above are without merit and intend to defend against them vigorously. The Company cannot predict with certainty the eventual outcome of these lawsuits, nor whether they will have a material negative impact on the Company. If it is determined that the Company bears responsibility for any unlawful or inappropriate conduct that caused losses to the Fund, it is committed to making the Trust or its shareholders whole, as appropriate.
11. NEW ACCOUNTING PRONOUNCEMENT
In September 2006, the Financial Accounting Standards Board (FASB) issued FASB Statement No. 157, “Fair Value Measurement” (SFAS 157), which defines fair value, establishes a framework for measuring fair value, and expands disclosures about fair value measurements. SFAS 157 is effective for fiscal years beginning after November 15, 2007, and interim periods within those fiscal years. The Trust believes the adoption of SFAS 157 will have no material impact on its financial statements.
TF-23
Franklin Templeton Variable Insurance Products Trust
Templeton Foreign Securities Fund
Report of Independent Registered Public Accounting Firm
To the Board of Trustees and Shareholders of
Franklin Templeton Variable Insurance Products Trust
In our opinion, the accompanying statement of assets and liabilities, including the statement of investments, and the related statements of operations and of changes in net assets and the financial highlights present fairly, in all material respects, the financial position of Templeton Foreign Securities Fund (one of the funds constituting Franklin Templeton Variable Insurance Products Trust, hereafter referred to as the “Fund”) at December 31, 2007, the results of its operations for the year then ended, the changes in its net assets for each of the two years in the period then ended and the financial highlights for each of the periods presented, in conformity with accounting principles generally accepted in the United States of America. These financial statements and financial highlights (hereafter referred to as “financial statements”) are the responsibility of the Fund’s management. Our responsibility is to express an opinion on these financial statements based on our audits. We conducted our audits of these financial statements in accordance with the standards of the Public Company Accounting Oversight Board (United States). Those standards require that we plan and perform the audit to obtain reasonable assurance about whether the financial statements are free of material misstatement. An audit includes examining, on a test basis, evidence supporting the amounts and disclosures in the financial statements, assessing the accounting principles used and significant estimates made by management, and evaluating the overall financial statement presentation. We believe that our audits, which included confirmation of securities at December 31, 2007 by correspondence with the custodian, provide a reasonable basis for our opinion.
PricewaterhouseCoopers LLP
San Francisco, California
February 14, 2008
TF-24
Franklin Templeton Variable Insurance Products Trust
Tax Designation (unaudited)
Templeton Foreign Securities Fund
Under Section 852(b)(3)(C) of the Internal Revenue Code (Code), the Fund designates the maximum amount allowable but no less than $288,404,747 as a long term capital gain dividend for the fiscal year ended December 31, 2007.
At December 31, 2007, more than 50% of the Fund’s total assets were invested in securities of foreign issuers. In most instances, foreign taxes were withheld from income paid to the Fund on these investments. The Fund elects to treat foreign taxes paid as allowed under Section 853 of the Code. This election will allow shareholders of record as of the 2008 distribution date, to treat their proportionate share of foreign taxes paid by the Fund as having been paid directly by them. The shareholder shall consider these amounts as foreign taxes paid in the tax year in which they receive the Fund distribution.
TF-25
TEMPLETON GLOBAL ASSET ALLOCATION FUND
This annual report for Templeton Global Asset Allocation Fund covers the fiscal year ended December 31, 2007.
Performance Summary as of 12/31/07
Average annual total return of Class 1 shares* represents the average annual change in value, assuming reinvestment of dividends and capital gains. Average returns smooth out variations in returns, which can be significant; they are not the same as year-by-year results.
Periods ended 12/31/07
| | | | | | | | |
| | | | | 1-Year | | 5-Year | | 10-Year |
Average Annual Total Return | | | | +10.32% | | +16.36% | | +9.24% |
*Performance prior to the 5/1/00 merger reflects historical performance of Templeton Asset Allocation Fund. The manager and administrator have contractually agreed to waive or limit their respective fees so that total annual Fund operating expenses for Class 1 shares do not exceed 0.83% (other than (i) acquired fund fees and expenses and (ii) certain non-routine expenses) until 4/30/09. If the manager and administrator had not waived fees, the Fund’s total returns would have been lower.
Total Return Index Comparison
for Hypothetical $10,000 Investment (1/1/98–12/31/07)
The graph below shows the change in value of a hypothetical $10,000 investment in the Fund over the indicated period and includes reinvestment of any income or distributions. The Fund’s performance* is compared to the performance of the Morgan Stanley Capital International (MSCI) All Country (AC) World Index and the J.P. Morgan (JPM) Government Bond Index (GBI) Global. One cannot invest directly in an index, nor is an index representative of the Fund’s portfolio. Please see Important Notes to Performance Information preceding the Fund Summaries.
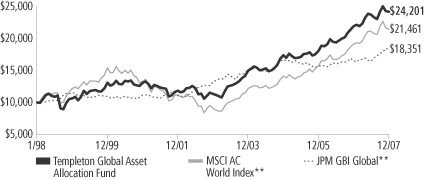
**Sources: Standard & Poor’s Micropal; J.P. Morgan. Please see Index Descriptions following the Fund Summaries.
Templeton Global Asset Allocation Fund – Class 1
Performance reflects the Fund’s Class 1 operating expenses, but does not include any contract fees, expenses or sales charges. If they had been included, performance would be lower. These charges and deductions, particularly for variable life policies, can have a significant effect on contract values and insurance benefits. See the contract prospectus for a complete description of these expenses, including sales charges.
Performance data represent past performance, which does not guarantee future results. Investment return and principal value will fluctuate, and you may have a gain or loss when you sell your shares.
Current performance may differ from figures shown.
TGA-1
Fund Goal and Main Investments: Templeton Global Asset Allocation Fund seeks high total return. The Fund normally invests in equity securities of companies of any country, debt securities of companies and governments of any country, and in money market securities. The Fund normally invests substantially to primarily in equity securities.
Performance Overview
You can find the Fund’s one-year total return in the Performance Summary. The Fund underperformed its broad equity benchmark, the MSCI AC World Index, which returned +12.18% for the period under review, and underperformed its fixed income benchmark, the JPM GBI Global, which had a +10.81% total return for the same period.1
Economic and Market Overview
In spite of elevated energy prices and widespread fears of contagion from the deteriorating U.S. housing situation, the global economy remained resilient in 2007. Consumer and corporate demand strength, particularly in China and other developing economies, generally favorable employment and accommodative monetary policies continued to underpin the current expansionary period that began in 2002.
These factors also contributed to the strength of global equity markets during 2007. However, concerns about slower growth and declining asset quality surfaced in the first quarter. These were initially centered on the U.S. subprime mortgage market but spread in August to global capital markets. Difficulties in assessing risk and the value of collateral in the structured finance industry contributed to declining risk appetite among lenders and investors. The private equity industry, which relies on the availability of cheap credit, played a pivotal role in several large and high-profile acquisitions and helped boost merger and acquisition activity in the first half of the year. This was an important driver of equity performance, but as liquidity dried up in the second half of the year, significantly slower money flows from private equity weighed on market performance. However, global merger and acquisition activity still reached record levels. The staggering $4.5 trillion of deals announced in 2007 eclipsed the previous record from 2006 by 24%.2
1. Sources: Standard & Poor’s Micropal; J.P. Morgan. One cannot invest directly in an index, nor is an index representative of the Fund’s portfolio. Please see Index Descriptions following the Fund Summaries.
2. Source: “For Deal Makers, Tale of Two Halves,” The Wall Street Journal, 1/2/08.
Fund Risks: The Fund’s investments in stocks offer the potential for long-term gains but can be subject to short-term price fluctuations. Foreign investing, especially in emerging markets, involves additional risks, including currency fluctuations, economic instability, market volatility, and political and social instability. Because the Fund invests in bonds and other debt obligations, its share price and yield will be affected by interest rate movements. Bond prices generally move in the opposite direction of interest rates. Thus, as prices of bonds in the Fund adjust to a rise in interest rates, the Fund’s share price may decline. The Fund’s prospectus also includes a description of the main investment risks.
TGA-2
To alleviate the credit crunch and restore investor confidence, the world’s major central banks infused capital into the system, and the U.S. Federal Reserve Board reduced its target interest rate by a full percentage point. However, credit and equity markets continued to face headwinds as write-downs and losses from subprime mortgage financing affected many large financial institutions toward the end of the year, and equity prices remained volatile.
For the year, however, global and non-U.S. equity markets registered the fifth consecutive year of double-digit total returns, making this an exceptionally strong period for investors in global equities. Broad-based stock performance by European and Asian shares at least doubled that of U.S. stocks, while emerging market equity returns more than tripled those in developed markets. Led by the BRIC countries, Brazil, Russia, India and China, emerging market economies continued to grow at accelerated rates, supporting elevated prices for oil and other commodities. At the same time, investment inflows from developed economies continued to underpin equity prices in emerging markets. In addition, U.S. dollar weakness versus the currencies of many major trading partners enhanced equity returns for U.S.-based investors holding stocks denominated in these currencies.
China continued to lead the Asian region’s economic expansion, where the country’s surging domestic demand became an increasingly important growth source for other Asian economies through trade. Continued rapid expansion led to fears China’s economy was overheating as inflation picked up during the year. Thus, monetary authorities increased interest rates and even allowed the yuan to appreciate slightly. India encountered similar conditions, and Indian monetary authorities responded by increasing the target interest rate. However, this had little effect on slowing private investment growth. Japan’s economy continued to lag. Consequently, the Japanese central bank kept rates on hold for the second half of the year after raising them 25 basis points (one-quarter percentage point) earlier. Low growth levels and interest rates by international standards led to continued weakness in the yen until risk aversion rose at the end of the year, prompting carry trades to unwind.
European economic growth remained quite strong in 2007, although fears regarding the U.K.’s and eurozone’s future growth paths emerged following the credit crunch. Labor markets strengthened across the region and monetary conditions tightened. The European Central Bank raised rates 50 basis points during the period as growth was strong in
What is a carry trade?
Carry trade is a strategy in which an investor sells a certain currency with a relatively low interest rate and uses the funds to purchase a different currency yielding a higher interest rate. A trader using this strategy attempts to capture the difference between the rates, which can often be substantial, depending on the amount of leverage the investor chooses to use.
TGA-3
the first half of the year, particularly in Germany. Much of non-euro Europe enjoyed even stronger growth, although some economies were hurt as negative sentiment spread from the U.S. housing market across the Atlantic. In the U.K., housing market weakness combined with financial market troubles caused enough worries for the Bank of England to cut interest rates 25 basis points in December after just raising them in July.
Investment Strategy
Our investment philosophy is bottom-up, value-oriented and long-term. In choosing equity investments, we will focus on the market price of a company’s securities relative to our evaluation of the company’s potential long-term earnings, asset value and cash flow. Among factors we may consider are a company’s historical value measures, including price/earnings ratio, profit margins and liquidation value.
In choosing debt investments, we allocate our assets among issuers, geographic regions and currencies based upon our assessment of relative interest rates among currencies, our outlook for changes in interest rates among currencies, and credit risks. With respect to debt securities, we may also from time to time make use of forward currency exchange contracts (hedging instruments) to protect against currency risk.
Manager’s Discussion
Equity
The Fund’s performance relative to its equity benchmark index benefited from its overweighting in the industrials sector, which outperformed the index.3 The Fund’s best performing stocks in the sector included wind turbine manufacturers Gamesa (Spain) and Vestas Wind Systems (Denmark), as well as U.K. aerospace operators BAE Systems and Rolls-Royce Group, and German conglomerate Siemens.
The Fund’s overweighted exposure to the telecommunication services sector also aided relative performance.4 Top performers in the Fund included Telefonica (Spain), Singapore Telecommunications, France Telecom, Vodafone Group (U.K.), Telenor (Norway) and Telefonos de Mexico (sold by period-end).
3. The industrials sector comprises aerospace and defense, air freight and logistics, commercial services and supplies, electrical equipment, and industrial conglomerates in the SOI.
4. The telecommunication services sector comprises diversified telecommunication services and wireless telecommunication services in the SOI.
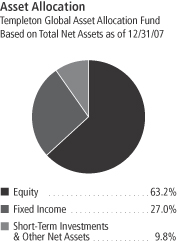
TGA-4
Additionally, our overweighted information technology sector exposure contributed to relative Fund results.5 Standout performers included Japanese software maker Nintendo, U.S. software companies Oracle and Microsoft, and Japanese industrial electronics company Hitachi.
It is important to recognize the effect of currency movements on the Fund’s performance. In general, if the value of the U.S. dollar goes up compared with a foreign currency, an investment traded in that foreign currency will go down in value because it will be worth fewer U.S. dollars. This can have a negative effect on Fund performance. Conversely, when the U.S. dollar weakens in relation to a foreign currency, an investment traded in that foreign currency will increase in value, which can contribute to Fund performance. For the 12 months ended December 31, 2007, the U.S. dollar declined in value relative to most non-U.S. currencies. As a result, the Fund’s performance (equity portion) was positively affected by the portfolio’s investment primarily in securities with non-U.S. currency exposure. However, one cannot expect the same result in future periods.
In contrast, performance relative to the equity benchmark was hurt by the Fund’s overweighted exposure to the consumer discretionary sector, which underperformed the index.6 The Fund’s stocks that lost value in this sector included U.S. retailers Chico’s FAS and Target as well as U.S. media companies Comcast, The DIRECTV Group and Time Warner.
Overweighted exposure to the lagging health care sector was also detrimental.7 Within this sector, the Fund suffered from weak U.S. holdings such as medical products company Boston Scientific, hospital operator Tenet Healthcare, pharmaceutical manufacturer Pfizer and biotechnology firm Amgen.
The Fund’s relative performance was also negatively impacted by its underweighting in the materials sector, which outperformed the equity index.8 Specifically, limited exposure to the outperforming metals and
5. The information technology sector comprises computers and peripherals, electronic equipment and instruments, semiconductors and semiconductor equipment, and software in the SOI.
6. The consumer discretionary sector comprises automobiles; hotels, restaurants and leisure; household durables; media; multiline retail; and specialty retail in the SOI.
7. The health care sector comprises biotechnology, health care equipment and supplies, health care providers and services, and pharmaceuticals in the SOI.
8. The materials sector comprises chemicals, metals and mining, and paper and forest products in the SOI.
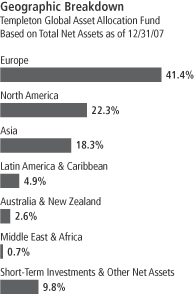
TGA-5
mining industry and holdings in Finnish paper companies Stora Enso and UPM-Kymmene hampered the Fund.
Fixed Income
Interest Rate Strategy
For most of the 12-month reporting period, the Fund maintained its overall short duration positioning seeking to take advantage of global interest rate tightening resulting from strong economic growth in most economies. However, we found some opportunities to take advantage of local interest rate reductions. For example, the Indonesian central bank reduced interest rates 175 basis points over the period, continuing its interest rate normalization process as inflation remained under control. Indonesia returned +11.07% in local currency terms over the period, as measured by the JPM GBI–Emerging Markets.9 Another positive local market was Brazil, where its central bank reduced interest rates 200 basis points during the period to 11.25%, which supported local bond market returns of +9.81% in local currency terms.9 The central bank held interest rates constant throughout the fourth quarter as the economy accelerated, inflation picked up, and the large monetary action’s impact began to be felt. As global growth concerns surfaced later in the year, the Fund selectively increased its interest rate exposure, which lengthened the portfolio’s duration.
Currency Strategy
Our currency strategy remained relatively unchanged over the period, predicated on our medium-term view on the gradual unwinding of global imbalances, which began during the period. These imbalances centered on strong U.S. consumption growth and, consequently, a large U.S. current account deficit, versus low domestic demand in most Asian countries and corresponding Asian current account surpluses. As a result, the Fund benefited from its significantly underweighted U.S. dollar exposure relative to the JPM GBI Global, as the dollar depreciated 10.00% against the U.S.’s major trading partners.10 The imbalance began unwinding as the U.S. trade deficit contracted toward year-end because of U.S. exports’ improved competitiveness due to a weaker dollar. However, the deficit was still quite large on a historical basis. The U.S. dollar weakened further when the Federal Reserve Board cut interest rates during the period, well ahead of other central banks, as the credit crunch affected the U.S. economy more than other countries.
9. Source: J.P. Morgan. Please see Index Descriptions following the Fund Summaries.
10. Source: Federal Reserve H10 Report.
What is a current account?
A current account is that part of the balance of payments where all of one country’s international transactions in goods and services are recorded.
What is balance of payments?
Balance of payments is a record of all of a country’s exports and imports of goods and services, borrowing and lending with the rest of the world during a particular time period. It helps a country evaluate its competitive strengths and weaknesses and forecast the strength of its currency.
What is duration?
Duration is a measure of a bond’s price sensitivity to interest rate changes. In general, a portfolio of securities with a lower duration can be expected to be less sensitive to interest rate changes than a portfolio with a higher duration.
TGA-6
One currency that appreciated strongly against the U.S. dollar was the Canadian dollar, which rose 17.91% against the U.S. dollar during the period and contributed to relative performance because of the Fund’s overweighted exposure.11 The Canadian dollar benefited from high prices for many of the country’s natural resource exports and a strong domestic economy. Toward period-end, the weak U.S. economy began to negatively impact Canada’s growth prospects and led us to reduce the Fund’s Canadian dollar allocation prior to the Canadian dollar’s poor performance during the last quarter of 2007. The Fund’s overweighted exposure to the Brazilian real boosted the Fund’s relative performance even more as the currency appreciated 19.94% against the U.S. dollar during the year.11, 12 The real benefited from very strong inflows from trade and investment.
European currencies also appreciated against the U.S. dollar over the period. The Fund had limited direct exposure to the euro, and was instead positioned to capture the benefit of euro appreciation through exposure to non-euro European currencies that are closely linked to the euro region. The euro appreciated 10.87% versus the U.S. dollar during the period as growth remained strong and the interest rate differential with the U.S. shrank significantly.11 Although our limited exposure to the euro’s strong return hurt relative performance, the Fund benefited from its overweighted exposures to the Polish zloty and Norwegian krone.12 Similar to the Scandinavian economies, the Polish economy also exhibited tightening labor market conditions given strong GDP growth of more than 6% in the third quarter of 2007 compared with the same period in 2006.13 Strong economic growth created jobs at the same time that there was significant emigration from Poland. Prospects for wage pressures prompted the central bank to raise interest rates during the period, supporting currency performance. The Swedish krona detracted from relative performance as it appreciated only 5.88% against the U.S. dollar over the period.11 The Fund’s biggest allocation change during the period was the addition of the Swiss franc, which appreciated 3.18% during the fourth quarter benefiting from increased risk aversion.11
Asian currency performance was mixed during the year. The currency that comprised the largest portion of the Fund was the Japanese yen, though our exposure was still substantially below the benchmark’s. The yen, which appreciated 6.66% against the U.S. dollar over the period,
11. Source: Exshare (via Compustat via FactSet).
12. These countries are not components of the JPM GBI Global.
13. Source: National Bank of Poland.
Top 5 Country Holdings
Templeton Global Asset Allocation Fund 12/31/07
| | |
| | | % of Total
Net Assets |
| |
| U.S. | | 19.0% |
| |
| U.K. | | 12.3% |
| |
| Germany | | 5.9% |
| |
| South Korea | | 5.5% |
| |
| France | | 4.3% |
Top 5 Sectors/Industries
Templeton Global Asset Allocation Fund Based on Equity Securities 12/31/07
| | |
| | | % of Total
Net Assets |
| |
| Media | | 6.6% |
| |
| Diversified Telecommunication Services | | 5.9% |
| |
| Pharmaceuticals | | 5.6% |
| |
| Oil, Gas & Consumable Fuels | | 5.0% |
| |
| Insurance | | 4.0% |
The dollar value, number of shares or principal amount, and names of all portfolio holdings are listed in the Fund’s Statement of Investments (SOI).
TGA-7
lagged other major currencies until risk aversion increased in the second half of the year leading to the unwinding of carry trades.11 Among other Asian currencies, the Malaysian ringgit appreciated 6.68% against the U.S. dollar, the South Korean won depreciated 0.65%, and the Indonesian rupiah depreciated 4.25%.11 Our overweighted allocations in these currencies hurt the Fund’s relative performance.12
Global Sovereign Debt Strategy
The Fund purchased investment-grade and subinvestment-grade sovereign debt that typically compensates for greater credit risk by offering higher yields relative to U.S. and European benchmark Treasury securities. Tighter credit conditions resulted in wider sovereign credit spreads despite improving fundamentals in most economies. Sovereign interest rate credit spreads increased from 171 basis points at the beginning of the reporting period to 255 basis points by period-end. However, declining U.S. interest rates benefited the performance of these dollar-denominated bonds. Largely as a result, U.S. dollar-denominated emerging market debt returned +6.28% over the period, as measured by the JPM Emerging Markets Bond Index (EMBI) Global.9 Regionally, Latin American sovereign debt returned +5.15%, Asian +6.14%, and central and eastern European +7.91%.9 Euro-denominated markets underperformed the index, returning 1.22% in euro terms, as measured by the JPM Euro EMBI Global.9 The Fund maintained limited exposure to sovereign debt during the period.
Thank you for your participation in Templeton Global Asset Allocation Fund. We look forward to serving your future investment needs.
The foregoing information reflects our analysis, opinions and portfolio holdings as of December 31, 2007, the end of the reporting period. The way we implement our main investment strategies and the resulting portfolio holdings may change depending on factors such as market and economic conditions. These opinions may not be relied upon as investment advice or an offer for a particular security. The information is not a complete analysis of every aspect of any market, country, industry, security or the Fund. Statements of fact are from sources considered reliable, but the investment manager makes no representation or warranty as to their completeness or accuracy. Although historical performance is no guarantee of future results, these insights may help you understand our investment management philosophy.
TGA-8
Fund Expenses
As an investor in a variable insurance contract (Contract) that indirectly provides for investment in an underlying mutual fund, you can incur transaction and/or ongoing expenses at both the Fund level and the Contract level.
| • | | Transaction expenses can include sales charges (loads) on purchases, redemption fees, surrender fees, transfer fees and premium taxes. |
| • | | Ongoing expenses can include management fees, distribution and service (12b-1) fees, contract fees, annual maintenance fees, mortality and expense risk fees and other fees and expenses. All mutual funds and Contracts have some types of ongoing expenses. |
The expenses shown in the table are meant to highlight ongoing expenses at the Fund level only and do not include ongoing expenses at the Contract level, or transaction expenses at either the Fund or Contract level. While the Fund does not have transaction expenses, if the transaction and ongoing expenses at the Contract level were included, the expenses shown below would be higher. You should consult your Contract prospectus or disclosure document for more information.
The table shows Fund-level ongoing expenses and can help you understand these expenses and compare them with those of other mutual funds offered through the Contract. The table assumes a $1,000 investment held for the six months indicated. Please refer to the Fund prospectus for additional information on operating expenses.
Actual Fund Expenses
The first line (Actual) of the table provides actual account values and expenses. The “Ending Account Value” is derived from the Fund’s actual return, which includes the effect of ongoing Fund expenses, but does not include the effect of ongoing Contract expenses.
You can estimate the Fund-level expenses you incurred during the period by following these steps. Of course, your account value and expenses will differ from those in this illustration:
| 1. | Divide your account value by $1,000. |
If an account had an $8,600 value, then $8,600 ÷ $1,000 = 8.6.
| 2. | Multiply the result by the number under the heading “Fund-Level Expenses Incurred During Period.” |
If Fund-Level Expenses Incurred During Period were $7.50, then 8.6 x $7.50 = $64.50.
In this illustration, the estimated expenses incurred this period at the Fund level are $64.50.
Templeton Global Asset Allocation Fund – Class 1
TGA-9
Hypothetical Example for Comparison with Other Mutual Funds
Information in the second line (Hypothetical) of the table can help you compare ongoing expenses of the Fund with those of other mutual funds offered through the Contract. This information may not be used to estimate the actual ending account balance or expenses you incurred during the period. The hypothetical “Ending Account Value” is based on the Fund’s actual expense ratio and an assumed 5% annual rate of return before expenses, which does not represent the Fund’s actual return. The figure under the heading “Fund-Level Expenses Incurred During Period” shows the hypothetical expenses your account would have incurred under this scenario. You can compare this figure with the 5% hypothetical examples that appear in shareholder reports of other funds offered through a Contract.
| | | | | | | | | |
| Class 1 | | Beginning
Account Value 7/1/07 | | Ending Account Value 12/31/07 | | Fund-Level
Expenses Incurred
During Period*
7/1/07–12/31/07 |
Actual | | $ | 1,000 | | $ | 1,022.20 | | $ | 4.28 |
Hypothetical (5% return before expenses) | | $ | 1,000 | | $ | 1,020.97 | | $ | 4.28 |
*Expenses are calculated using the most recent six-month annualized expense ratio, net of expense waiver, for the Fund’s Class 1 shares (0.84%), which does not include any ongoing expenses of the Contract for which the Fund is an investment option, multiplied by the average account value over the period, multiplied by 184/365 to reflect the one-half year period.
TGA-10
Franklin Templeton Variable Insurance Products Trust
Financial Highlights
Templeton Global Asset Allocation Fund
| | | | | | | | | | | | | | | | | | | | |
| | | Year Ended December 31, | |
| Class 1 | | 2007 | | | 2006 | | | 2005 | | | 2004 | | | 2003 | |
| | | | |
Per share operating performance | | | | | | | | | | | | | | | | | | | | |
(for a share outstanding throughout the year) | | | | | | | | | | | | | | | | | | | | |
Net asset value, beginning of year | | $ | 21.96 | | | $ | 21.06 | | | $ | 21.11 | | | $ | 18.78 | | | $ | 14.59 | |
| | | | |
Income from investment operationsa: | | | | | | | | | | | | | | | | | | | | |
Net investment incomeb | | | 0.53 | | | | 0.64 | | | | 0.49 | | | | 0.48 | | | | 0.41 | |
Net realized and unrealized gains (losses) | | | 1.58 | | | | 3.36 | | | | 0.28 | | | | 2.42 | | | | 4.23 | |
| | | | |
Total from investment operations | | | 2.11 | | | | 4.00 | | | | 0.77 | | | | 2.90 | | | | 4.64 | |
| | | | |
Less distributions from: | | | | | | | | | | | | | | | | | | | | |
Net investment income and net foreign currency gains | | | (4.06 | ) | | | (1.66 | ) | | | (0.82 | ) | | | (0.57 | ) | | | (0.45 | ) |
Net realized gains | | | (5.26 | ) | | | (1.44 | ) | | | — | | | | — | | | | — | |
| | | | |
Total distributions | | | (9.32 | ) | | | (3.10 | ) | | | (0.82 | ) | | | (0.57 | ) | | | (0.45 | ) |
| | | | |
Net asset value, end of year | | $ | 14.75 | | | $ | 21.96 | | | $ | 21.06 | | | $ | 21.11 | | | $ | 18.78 | |
| | | | |
| | | | | |
Total returnc | | | 10.32% | | | | 21.39% | | | | 3.85% | | | | 15.94% | | | | 32.31% | |
Ratios to average net assets | | | | | | | | | | | | | | | | | | | | |
Expenses before waiver and payments by affiliates | | | 0.88% | | | | 0.84% | | | | 0.85% | | | | 0.84% | | | | 0.81% | |
Expenses net of waiver and payments by affiliates | | | 0.85% | d | | | 0.84% | d | | | 0.85% | d | | | 0.84% | d | | | 0.81% | |
Net investment income | | | 2.77% | | | | 2.91% | | | | 2.36% | | | | 2.52% | | | | 2.54% | |
| | | | | |
Supplemental data | | | | | | | | | | | | | | | | | | | | |
Net assets, end of year (000’s) | | $ | 63,316 | | | $ | 276,790 | | | $ | 638,006 | | | $ | 625,728 | | | $ | 572,798 | |
Portfolio turnover rate | | | 30.08% | e | | | 23.74% | e | | | 26.23% | | | | 27.43% | | | | 34.25% | |
aThe amount shown for a share outstanding throughout the period may not correlate with the Statement of Operations for the period due to the timing of sales and repurchases of the Fund shares in relation to income earned and/or fluctuating market value of the investments of the Fund.
bBased on average daily shares outstanding.
cTotal return does not include any fees, charges or expenses imposed by the variable annuity and life insurance contracts for which the Franklin Templeton Variable Insurance Products Trust serves as an underlying investment vehicle.
dBenefit of expense reduction rounds to less than 0.01%.
eExcludes the value of portfolio securities delivered as a result of a redemption in-kind. See Note 10.
The accompanying notes are an integral part of these financial statements.
TGA-11
Franklin Templeton Variable Insurance Products Trust
Financial Highlights (continued)
Templeton Global Asset Allocation Fund
| | | | | | | | | | | | | | | | | | | | |
| | | Year Ended December 31, | |
| Class 2 | | 2007 | | | 2006 | | | 2005 | | | 2004 | | | 2003 | |
| | | | |
Per share operating performance | | | | | | | | | | | | | | | | | | | | |
(for a share outstanding throughout the year) | | | | | | | | | | | | | | | | | | | | |
Net asset value, beginning of year | | $ | 21.75 | | | $ | 20.88 | | | $ | 20.94 | | | $ | 18.64 | | | $ | 14.49 | |
| | | | |
Income from investment operationsa: | | | | | | | | | | | | | | | | | | | | |
Net investment incomeb | | | 0.46 | | | | 0.52 | | | | 0.43 | | | | 0.43 | | | | 0.36 | |
Net realized and unrealized gains (losses) | | | 1.58 | | | | 3.40 | | | | 0.29 | | | | 2.41 | | | | 4.20 | |
| | | | |
Total from investment operations | | | 2.04 | | | | 3.92 | | | | 0.72 | | | | 2.84 | | | | 4.56 | |
| | | | |
Less distributions from: | | | | | | | | | | | | | | | | | | | | |
Net investment income and net foreign currency gains | | | (4.01 | ) | | | (1.61 | ) | | | (0.78 | ) | | | (0.54 | ) | | | (0.41 | ) |
Net realized gains | | | (5.26 | ) | | | (1.44 | ) | | | — | | | | — | | | | — | |
| | | | |
Total distributions | | | (9.27 | ) | | | (3.05 | ) | | | (0.78 | ) | | | (0.54 | ) | | | (0.41 | ) |
| | | | |
Net asset value, end of year | | $ | 14.52 | | | $ | 21.75 | | | $ | 20.88 | | | $ | 20.94 | | | $ | 18.64 | |
| | | | |
| | | | | |
Total returnc | | | 10.01% | | | | 21.11% | | | | 3.55% | | | | 15.72% | | | | 31.95% | |
Ratios to average net assets | | | | | | | | | | | | | | | | | | | | |
Expenses before waiver and payments by affiliates | | | 1.13% | | | | 1.09% | | | | 1.10% | | | | 1.09% | | | | 1.06% | |
Expenses net of waiver and payments by affiliates | | | 1.10% | d | | | 1.09% | d | | | 1.10% | d | | | 1.09% | d | | | 1.06% | |
Net investment income | | | 2.52% | | | | 2.66% | | | | 2.11% | | | | 2.27% | | | | 2.29% | |
| | | | | |
Supplemental data | | | | | | | | | | | | | | | | | | | | |
Net assets, end of year (000’s) | | $ | 78,613 | | | $ | 78,021 | | | $ | 68,385 | | | $ | 65,806 | | | $ | 55,754 | |
Portfolio turnover rate | | | 30.08% | e | | | 23.74% | e | | | 26.23% | | | | 27.43% | | | | 34.25% | |
aThe amount shown for a share outstanding throughout the period may not correlate with the Statement of Operations for the period due to the timing of sales and repurchases of the Fund shares in relation to income earned and/or fluctuating market value of the investments of the Fund.
bBased on average daily shares outstanding.
cTotal return does not include any fees, charges or expenses imposed by the variable annuity and life insurance contracts for which the Franklin Templeton Variable Insurance Products Trust serves as an underlying investment vehicle.
dBenefit of expense reduction rounds to less than 0.01%.
eExcludes the value of portfolio securities delivered as a result of a redemption in-kind. See Note 10.
The accompanying notes are an integral part of these financial statements.
TGA-12
Franklin Templeton Variable Insurance Products Trust
Statement of Investments, December 31, 2007
| | | | | | | |
| Templeton Global Asset Allocation Fund | | Country | | Shares/
Warrants | | Value |
Long Term Investments 90.2% | | | | | | | |
Common Stocks and Warrants 62.5% | | | | | | | |
Aerospace & Defense 1.4% | | | | | | | |
BAE Systems PLC | | United Kingdom | | 117,072 | | $ | 1,158,429 |
aRaytheon Co., wts., 6/16/11 | | United States | | 63 | | | 1,588 |
aRolls-Royce Group PLC | | United Kingdom | | 81,424 | | | 883,348 |
aRolls-Royce Group PLC, B | | United Kingdom | | 3,289,529 | | | 7,190 |
| | | | | | | |
| | | | | | | 2,050,555 |
| | | | | | | |
Air Freight & Logistics 1.5% | | | | | | | |
Deutsche Post AG | | Germany | | 44,767 | | | 1,522,859 |
United Parcel Service Inc., B | | United States | | 9,570 | | | 676,790 |
| | | | | | | |
| | | | | | | 2,199,649 |
| | | | | | | |
Automobiles 0.7% | | | | | | | |
Bayerische Motoren Werke AG | | Germany | | 17,098 | | | 1,066,197 |
| | | | | | | |
Biotechnology 0.7% | | | | | | | |
aAmgen Inc. | | United States | | 20,510 | | | 952,484 |
| | | | | | | |
Capital Markets 1.0% | | | | | | | |
Invesco Ltd. | | Bermuda | | 38,489 | | | 1,207,769 |
Morgan Stanley | | United States | | 5,420 | | | 287,856 |
Nomura Holdings Inc. | | Japan | | 6 | | | 102 |
| | | | | | | |
| | | | | | | 1,495,727 |
| | | | | | | |
Chemicals 0.6% | | | | | | | |
The Dow Chemical Co. | | United States | | 20,486 | | | 807,558 |
| | | | | | | |
Commercial Banks 3.2% | | | | | | | |
DBS Group Holdings Ltd. | | Singapore | | 59,486 | | | 854,251 |
HSBC Holdings PLC | | United Kingdom | | 77,523 | | | 1,309,265 |
Intesa Sanpaolo SpA | | Italy | | 111,770 | | | 882,434 |
Kookmin Bank, ADR | | South Korea | | 10,329 | | | 757,322 |
Mitsubishi UFJ Financial Group Inc. | | Japan | | 36,000 | | | 337,999 |
Sumitomo Mitsui Financial Group Inc. | | Japan | | 48 | | | 360,275 |
| | | | | | | |
| | | | | | | 4,501,546 |
| | | | | | | |
Commercial Services & Supplies 0.9% | | | | | | | |
G4S PLC | | United Kingdom | | 264,658 | | | 1,287,048 |
| | | | | | | |
Computers & Peripherals 1.7% | | | | | | | |
aLexmark International Inc., A | | United States | | 11,370 | | | 396,358 |
Lite-On Technology Corp. | | Taiwan | | 421,822 | | | 736,205 |
Seagate Technology | | United States | | 50,128 | | | 1,278,264 |
| | | | | | | |
| | | | | | | 2,410,827 |
| | | | | | | |
Consumer Finance 0.5% | | | | | | | |
Aiful Corp. | | Japan | | 16,449 | | | 294,419 |
Discover Financial Services | | United States | | 2,710 | | | 40,867 |
Promise Co. Ltd. | | Japan | | 14,250 | | | 355,244 |
| | | | | | | |
| | | | | | | 690,530 |
| | | | | | | |
Diversified Financial Services 1.6% | | | | | | | |
ING Groep NV | | Netherlands | | 36,961 | | | 1,442,869 |
JPMorgan Chase & Co. | | United States | | 19,993 | | | 872,695 |
| | | | | | | |
| | | | | | | 2,315,564 |
| | | | | | | |
TGA-13
Franklin Templeton Variable Insurance Products Trust
Statement of Investments, December 31, 2007 (continued)
| | | | | | | |
| Templeton Global Asset Allocation Fund | | Country | | Shares/
Warrants | | Value |
Long Term Investments (continued) | | | | | | | |
Common Stocks and Warrants (continued) | | | | | | | |
Diversified Telecommunication Services 5.9% | | | | | | | |
Chunghwa Telecom Co. Ltd., ADR | | Taiwan | | 25,260 | | $ | 533,239 |
France Telecom SA, ADR | | France | | 47,413 | | | 1,689,325 |
Singapore Telecommunications Ltd. | | Singapore | | 721,525 | | | 2,002,220 |
Telefonica SA, ADR | | Spain | | 17,573 | | | 1,714,949 |
Telekom Austria AG, ADR | | Austria | | 12,980 | | | 720,714 |
Telenor ASA | | Norway | | 74,594 | | | 1,780,950 |
| | | | | | | |
| | | | | | | 8,441,397 |
| | | | | | | |
Electric Utilities 0.9% | | | | | | | |
E.ON AG | | Germany | | 5,710 | | | 1,213,352 |
| | | | | | | |
Electrical Equipment 1.0% | | | | | | | |
Gamesa Corp. Tecnologica SA | | Spain | | 11,275 | | | 526,205 |
aVestas Wind Systems AS | | Denmark | | 7,702 | | | 832,078 |
| | | | | | | |
| | | | | | | 1,358,283 |
| | | | | | | |
Electronic Equipment & Instruments 1.7% | | | | | | | |
FUJIFILM Holdings Corp. | | Japan | | 15,011 | | | 636,704 |
Hitachi Ltd. | | Japan | | 118,330 | | | 883,914 |
Tyco Electronics Ltd. | | United States | | 8,326 | | | 309,144 |
Venture Corp. Ltd. | | Singapore | | 60,159 | | | 534,209 |
| | | | | | | |
| | | | | | | 2,363,971 |
| | | | | | | |
Food Products 0.8% | | | | | | | |
Unilever PLC | | United Kingdom | | 30,710 | | | 1,153,264 |
| | | | | | | |
Health Care Equipment & Supplies 0.7% | | | | | | | |
aBoston Scientific Corp. | | United States | | 56,897 | | | 661,712 |
Covidien Ltd. | | United States | | 8,326 | | | 368,759 |
| | | | | | | |
| | | | | | | 1,030,471 |
| | | | | | | |
Health Care Providers & Services 1.0% | | | | | | | |
Quest Diagnostics Inc. | | United States | | 17,660 | | | 934,214 |
aTenet Healthcare Corp. | | United States | | 103,385 | | | 525,196 |
| | | | | | | |
| | | | | | | 1,459,410 |
| | | | | | | |
Hotels, Restaurants & Leisure 1.0% | | | | | | | |
Compass Group PLC | | United Kingdom | | 226,518 | | | 1,388,497 |
| | | | | | | |
Household Durables 0.5% | | | | | | | |
Sony Corp., ADR | | Japan | | 11,955 | | | 649,157 |
| | | | | | | |
Industrial Conglomerates 3.2% | | | | | | | |
General Electric Co. | | United States | | 23,450 | | | 869,291 |
Koninklijke Philips Electronics NV | | Netherlands | | 31,730 | | | 1,366,929 |
Siemens AG, ADR | | Germany | | 12,220 | | | 1,922,939 |
Tyco International Ltd. | | United States | | 8,326 | | | 330,126 |
| | | | | | | |
| | | | | | | 4,489,285 |
| | | | | | | |
Insurance 4.0% | | | | | | | |
ACE Ltd. | | Bermuda | | 17,838 | | | 1,102,032 |
American International Group Inc. | | United States | | 14,068 | | | 820,164 |
Aviva PLC | | United Kingdom | | 55,739 | | | 745,352 |
AXA SA | | France | | 36,961 | | | 1,477,390 |
TGA-14
Franklin Templeton Variable Insurance Products Trust
Statement of Investments, December 31, 2007 (continued)
| | | | | | | |
| Templeton Global Asset Allocation Fund | | Country | | Shares/
Warrants | | Value |
Long Term Investments (continued) | | | | | | | |
Common Stocks and Warrants (continued) | | | | | | | |
Insurance (continued) | | | | | | | |
Old Mutual PLC | | United Kingdom | | 259,095 | | $ | 862,820 |
Torchmark Corp. | | United States | | 10,120 | | | 612,563 |
| | | | | | | |
| | | | | | | 5,620,321 |
| | | | | | | |
Media 6.6% | | | | | | | |
British Sky Broadcasting Group PLC | | United Kingdom | | 68,871 | | | 847,060 |
aComcast Corp., A | | United States | | 53,133 | | | 962,770 |
aThe DIRECTV Group Inc. | | United States | | 38,637 | | | 893,287 |
Mediaset SpA | | Italy | | 67,250 | | | 677,666 |
News Corp., A | | United States | | 64,570 | | | 1,323,039 |
Pearson PLC | | United Kingdom | | 63,912 | | | 929,566 |
Reed Elsevier NV | | Netherlands | | 43,836 | | | 873,219 |
Time Warner Inc. | | United States | | 60,448 | | | 997,996 |
aViacom Inc., B | | United States | | 28,204 | | | 1,238,720 |
Vivendi SA | | France | | 14,980 | | | 686,000 |
| | | | | | | |
| | | | | | | 9,429,323 |
| | | | | | | |
Multi-Utilities & Unregulated Power 0.4% | | | | | | | |
Centrica PLC | | United Kingdom | | 84,222 | | | 600,350 |
| | | | | | | |
Multiline Retail 0.7% | | | | | | | |
Target Corp. | | United States | | 18,767 | | | 938,350 |
| | | | | | | |
Oil, Gas & Consumable Fuels 5.0% | | | | | | | |
BP PLC | | United Kingdom | | 121,707 | | | 1,487,228 |
El Paso Corp. | | United States | | 90,472 | | | 1,559,737 |
Eni SpA | | Italy | | 39,292 | | | 1,436,386 |
Royal Dutch Shell PLC, B | | United Kingdom | | 38,104 | | | 1,582,355 |
Total SA, B | | France | | 12,240 | | | 1,015,123 |
| | | | | | | |
| | | | | | | 7,080,829 |
| | | | | | | |
Paper & Forest Products 1.4% | | | | | | | |
Stora Enso OYJ, R | | Finland | | 60,927 | | | 910,477 |
UPM-Kymmene OYJ | | Finland | | 52,175 | | | 1,052,277 |
| | | | | | | |
| | | | | | | 1,962,754 |
| | | | | | | |
Pharmaceuticals 5.6% | | | | | | | |
Abbott Laboratories | | United States | | 15,877 | | | 891,493 |
Bristol-Myers Squibb Co. | | United States | | 23,584 | | | 625,448 |
GlaxoSmithKline PLC | | United Kingdom | | 50,997 | | | 1,295,991 |
Novartis AG | | Switzerland | | 11,760 | | | 644,455 |
Pfizer Inc. | | United States | | 60,304 | | | 1,370,710 |
Sanofi-Aventis | | France | | 13,311 | | | 1,223,412 |
Takeda Pharmaceutical Co. Ltd. | | Japan | | 14,786 | | | 871,130 |
aWatson Pharmaceuticals Inc. | | United States | | 40,492 | | | 1,098,953 |
| | | | | | | |
| | | | | | | 8,021,592 |
| | | | | | | |
Real Estate Management & Development 1.0% | | | | | | | |
Cheung Kong (Holdings) Ltd. | | Hong Kong | | 75,748 | | | 1,400,708 |
| | | | | | | |
Semiconductors & Semiconductor Equipment 1.3% | | | | | | | |
aInfineon Technologies AG, ADR | | Germany | | 51,804 | | | 602,998 |
Samsung Electronics Co. Ltd. | | South Korea | | 2,200 | | | 1,306,768 |
| | | | | | | |
| | | | | | | 1,909,766 |
| | | | | | | |
TGA-15
Franklin Templeton Variable Insurance Products Trust
Statement of Investments, December 31, 2007 (continued)
| | | | | | | | |
| Templeton Global Asset Allocation Fund | | Country | | Shares/
Warrants | | | Value |
Long Term Investments (continued) | | | | | | | | |
Common Stocks and Warrants (continued) | | | | | | | | |
Software 3.9% | | | | | | | | |
aCheck Point Software Technologies Ltd. | | Israel | | 37,146 | | | $ | 815,726 |
Microsoft Corp. | | United States | | 39,012 | | | | 1,388,827 |
Nintendo Co. Ltd. | | Japan | | 2,341 | | | | 1,404,411 |
aOracle Corp. | | United States | | 82,887 | | | | 1,871,589 |
| | | | | | | | |
| | | | | | | | 5,480,553 |
| | | | | | | | |
Specialty Retail 0.8% | | | | | | | | |
aChico’s FAS Inc. | | United States | | 36,461 | | | | 329,243 |
The Gap Inc. | | United States | | 36,569 | | | | 778,188 |
| | | | | | | | |
| | | | | | | | 1,107,431 |
| | | | | | | | |
Wireless Telecommunication Services 1.3% | | | | | | | | |
Vodafone Group PLC, ADR | | United Kingdom | | 50,593 | | | | 1,888,130 |
| | | | | | | | |
Total Common Stocks and Warrants (Cost $63,418,544) | | | | | | | | 88,764,879 |
| | | | | | | | |
Preferred Stock (Cost $73,607) 0.7% | | | | | | | | |
Metals & Mining 0.7% | | | | | | | | |
Companhia Vale do Rio Doce, ADR, pfd., A | | Brazil | | 33,728 | | | | 943,709 |
| | | | | | | | |
| | | |
| | | | | Principal
Amountb | | | |
Foreign Government and Agency Securities 27.0% | | | | | | | | |
c,dGovernment of Argentina, FRN, 5.389%, 8/03/12 | | Argentina | | 1,334,000 | | | | 725,359 |
Government of Canada, | | | | | | | | |
6.00%, 6/01/08 | | Canada | | 389,000 | CAD | | | 394,610 |
4.25%, 12/01/08 | | Canada | | 690,000 | CAD | | | 696,592 |
6.00%, 6/01/11 | | Canada | | 1,202,000 | CAD | | | 1,292,369 |
Government of Indonesia, | | | | | | | | |
11.00%, 11/15/20 | | Indonesia | | 12,000,000,000 | IDR | | | 1,329,385 |
11.00%, 9/15/25 | | Indonesia | | 9,900,000,000 | IDR | | | 1,078,514 |
12.00%, 9/15/26 | | Indonesia | | 8,540,000,000 | IDR | | | 1,022,890 |
eGovernment of Iraq, 144A, 5.80%, 1/15/28 | | Iraq | | 239,000 | | | | 158,935 |
Government of Malaysia, | | | | | | | | |
6.45%, 7/01/08 | | Malaysia | | 5,885,000 | MYR | | | 1,805,444 |
3.756%, 4/28/11 | | Malaysia | | 980,000 | MYR | | | 297,988 |
Government of Mexico, 10.00%, 12/05/24 | | Mexico | | 133,000 | f MXN | | | 1,418,326 |
Government of New Zealand, 7.00%, 7/15/09 | | New Zealand | | 3,204,000 | NZD | | | 2,442,913 |
Government of Norway, 5.50%, 5/15/09 | | Norway | | 5,740,000 | NOK | | | 1,067,730 |
Government of Poland, | | | | | | | | |
6.00%, 5/24/09 | | Poland | | 9,900,000 | PLN | | | 3,997,725 |
5.75%, 9/23/22 | | Poland | | 4,075,000 | PLN | | | 1,640,134 |
Government of Singapore, | | | | | | | | |
1.50%, 4/01/08 | | Singapore | | 80,000 | SGD | | | 55,452 |
5.625%, 7/01/08 | | Singapore | | 777,000 | SGD | | | 548,869 |
4.375%, 1/15/09 | | Singapore | | 200,000 | SGD | | | 142,290 |
Government of Sweden, | | | | | | | | |
6.50%, 5/05/08 | | Sweden | | 7,170,000 | SEK | | | 1,116,849 |
5.00%, 1/28/09 | | Sweden | | 14,200,000 | SEK | | | 2,214,723 |
5.50%, 10/08/12 | | Sweden | | 8,620,000 | SEK | | | 1,406,445 |
gStrip, 9/17/08 | | Sweden | | 3,000,000 | SEK | | | 450,666 |
cKfW Bankengruppe, FRN, 0.658%, 8/08/11 | | Germany | | 235,000,000 | JPY | | | 2,108,461 |
TGA-16
Franklin Templeton Variable Insurance Products Trust
Statement of Investments, December 31, 2007 (continued)
| | | | | | | | |
| Templeton Global Asset Allocation Fund | | Country | | Principal
Amountb | | | Value |
Long Term Investments (continued) | | | | | | | | |
Foreign Government and Agency Securities (continued) | | | | | | | | |
Korea Treasury Bond, | | | | | | | | |
5.25%, 9/10/12 | | South Korea | | 1,840,000,000 | KRW | | $ | 1,924,579 |
5.50%, 9/10/17 | | South Korea | | 1,800,000,000 | KRW | | | 1,895,197 |
5.25%, 3/10/27 | | South Korea | | 1,895,000,000 | KRW | | | 1,931,911 |
New South Wales Treasury Corp., 8.00%, 3/01/08 | | Australia | | 985,000 | AUD | | | 864,216 |
Nota Do Tesouro Nacional, | | | | | | | | |
9.762%, 1/01/12 | | Brazil | | 3,450 | h BRL | | | 1,771,596 |
iIndex Linked, 6.00%, 5/15/15 | | Brazil | | 1,000 | h BRL | | | 869,536 |
iIndex Linked, 6.00%, 5/15/45 | | Brazil | | 1,430 | h BRL | | | 1,242,787 |
Queensland Treasury Corp., 6.00%, 7/14/09 | | Australia | | 540,000 | AUD | | | 465,971 |
| | | | | | | | |
Total Foreign Government and Agency Securities (Cost $33,486,261) | | | | | | | | 38,378,462 |
| | | | | | | | |
Total Long Term Investments (Cost $96,978,412) | | | | | | | | 128,087,050 |
| | | | | | | | |
Short Term Investments 6.6% | | | | | | | | |
Foreign Government and Agency Securities 4.6% | | | | | | | | |
gEgypt Treasury Bill, | | | | | | | | |
7/01/08 | | Egypt | | 1,150,000 | EGP | | | 201,425 |
8/05/08 | | Egypt | | 4,500,000 | EGP | | | 783,183 |
9/16/08 | | Egypt | | 1,700,000 | EGP | | | 293,622 |
9/30/08 | | Egypt | | 2,650,000 | EGP | | | 454,816 |
12/16/08 | | Egypt | | 25,000 | EGP | | | 4,228 |
Government of Malaysia, | | | | | | | | |
3.546%, 1/11/08 | | Malaysia | | 5,360,000 | MYR | | | 1,620,869 |
3.569%, 2/14/08 | | Malaysia | | 2,800,000 | MYR | | | 846,689 |
gGovernment of Sweden, Strip, 6/18/08 | | Sweden | | 3,000,000 | SEK | | | 455,273 |
gMalaysia Treasury Bill, | | | | | | | | |
2/28/08 | | Malaysia | | 5,220,000 | MYR | | | 1,570,023 |
4/03/08 | | Malaysia | | 100,000 | MYR | | | 29,962 |
4/10/08 | | Malaysia | | 95,000 | MYR | | | 28,445 |
5/08/08 | | Malaysia | | 40,000 | MYR | | | 11,943 |
5/15/08 | | Malaysia | | 285,000 | MYR | | | 85,038 |
6/17/08 | | Malaysia | | 130,000 | MYR | | | 38,667 |
gNorway Treasury Bill, | | | | | | | | |
6/18/08 | | Norway | | 100,000 | NOK | | | 17,987 |
9/17/08 | | Norway | | 430,000 | NOK | | | 76,387 |
| | | | | | | | |
Total Foreign Government and Agency Securities
(Cost $6,269,065) | | | | | | | | 6,518,557 |
| | | | | | | | |
Total Investments before Money Market Fund
(Cost $103,247,477) | | | | | | | | 134,605,607 |
| | | | | | | | |
| | | |
| | | | | Shares | | | |
Money Market Fund (Cost $2,779,999) 2.0% | | | | | | | | |
jFranklin Institutional Fiduciary Trust Money Market Portfolio, 4.58% | | United States | | 2,779,999 | | | | 2,779,999 |
| | | | | | | | |
Total Investments (Cost $106,027,476) 96.8% | | | | | | | | 137,385,606 |
Net Unrealized Gain on Forward Exchange Contracts 0.1% | | | | | | | | 65,918 |
Other Assets, less Liabilities 3.1% | | | | | | | | 4,477,176 |
| | | | | | | | |
Net Assets 100.0% | | | | | | | $ | 141,928,700 |
| | | | | | | | |
TGA-17
Franklin Templeton Variable Insurance Products Trust
Statement of Investments, December 31, 2007 (continued)
Currency Abbreviations
AUD - Australian Dollar
BRL - Brazilian Real
CAD - Canadian Dollar
EGP - Egyptian Pound
IDR - Indonesian Rupiah
JPY - Japanese Yen
KRW - South Korean Won
MXN - Mexican Peso
MYR - Malaysian Ringgit
NOK - Norwegian Krone
NZD - New Zealand Dollar
PLN - Polish Zloty
SEK - Swedish Krona
SGD - Singapore Dollar
Selected Portfolio Abbreviations
ADR - American Depository Receipt
FRN - Floating Rate Note
aNon-income producing for the twelve months ended December 31, 2007.
bThe principal amount is stated in U.S. dollars unless otherwise indicated.
cThe coupon rate shown represents the rate at period end.
dThe principal amount is stated in original face, and scheduled paydowns are reflected in the market price on ex-date.
eSecurity was purchased pursuant to Rule 144A under the Securities Act of 1933 and may be sold in transactions exempt from registration only to qualified institutional buyers or in a public offering registered under the Securities Act of 1933. This security has been deemed liquid under guidelines approved by the Trust’s Board of Trustees. At December 31, 2007, the value of this security was $158,935, representing 0.11% of net assets.
fPrincipal amount is stated in 100 Mexican Peso Units.
gThe security is traded on a discount basis with no stated coupon rate.
hPrincipal amount is stated in 1,000 Brazilian Real Units.
iRedemption price at maturity is adjusted for inflation. See Note 1(e).
jSee Note 7 regarding investments in the Franklin Institutional Fiduciary Trust Money Market Portfolio. The rate shown is the annualized seven-day yield at period end.
The accompanying notes are an integral part of these financial statements.
TGA-18
Franklin Templeton Variable Insurance Products Trust
Financial Statements
Statement of Assets and Liabilities
December 31, 2007
| | | |
| | | Templeton
Global Asset
Allocation Fund |
Assets: | | | |
Investments in securities: | | | |
Cost - Unaffiliated issuers | | $ | 103,247,477 |
Cost - Sweep Money Fund (Note 7) | | | 2,779,999 |
| | | |
Total cost of investments | | $ | 106,027,476 |
| | | |
Value - Unaffiliated issuers | | $ | 134,605,607 |
Value - Sweep Money Fund (Note 7) | | | 2,779,999 |
| | | |
Total value of investments | | | 137,385,606 |
Foreign currency, at value (cost $3,718,758) | | | 3,793,847 |
Receivables: | | | |
Capital shares sold | | | 30,467 |
Dividends and interest | | | 1,141,775 |
Unrealized gain on forward exchange contracts (Note 8) | | | 226,643 |
| | | |
Total assets | | | 142,578,338 |
| | | |
Liabilities: | | | |
Payables: | | | |
Capital shares redeemed | | | 320,334 |
Affiliates | | | 113,275 |
Reports to shareholders | | | 34,250 |
Unrealized loss on forward exchange contracts (Note 8) | | | 160,725 |
Accrued expenses and other liabilities | | | 21,054 |
| | | |
Total liabilities | | | 649,638 |
| | | |
Net assets, at value | | $ | 141,928,700 |
| | | |
Net assets consist of: | | | |
Paid-in capital | | $ | 82,594,462 |
Undistributed net investment income | | | 12,217,627 |
Net unrealized appreciation (depreciation) | | | 31,546,108 |
Accumulated net realized gain (loss) | | | 15,570,503 |
| | | |
Net assets, at value | | $ | 141,928,700 |
| | | |
Class 1: | | | |
Net assets, at value | | $ | 63,315,738 |
| | | |
Shares outstanding | | | 4,292,824 |
| | | |
Net asset value and maximum offering price per share | | $ | 14.75 |
| | | |
Class 2: | | | |
Net assets, at value | | $ | 78,612,962 |
| | | |
Shares outstanding | | | 5,412,792 |
| | | |
Net asset value and maximum offering price per share | | $ | 14.52 |
| | | |
The accompanying notes are an integral part of these financial statements.
TGA-19
Franklin Templeton Variable Insurance Products Trust
Financial Statements (continued)
Statement of Operations
for the year ended December 31, 2007
| | | | |
| | | Templeton
Global Asset
Allocation Fund | |
Investment income: | | | | |
Dividends: (net of foreign taxes of $240,366) | | | | |
Unaffiliated issuers | | $ | 3,729,943 | |
Sweep Money Fund (Note 7) | | | 272,177 | |
Interest (net of foreign taxes of $121,322) | | | 3,778,712 | |
| | | | |
Total investment income | | | 7,780,832 | |
| | | | |
Expenses: | | | | |
Management fees (Note 3a) | | | 1,347,712 | |
Administrative fees (Note 3b) | | | 315,415 | |
Distribution fees - Class 2 (Note 3c) | | | 199,699 | |
Unaffiliated transfer agent fees | | | 6,814 | |
Custodian fees (Note 4) | | | 119,942 | |
Reports to shareholders | | | 55,180 | |
Professional fees | | | 41,401 | |
Trustees’ fees and expenses | | | 1,085 | |
Other | | | 16,987 | |
| | | | |
Total expenses | | | 2,104,235 | |
Expense reductions (Note 4) | | | (4,929 | ) |
Expenses waived/paid by affiliates (Note 3e) | | | (82,157 | ) |
| | | | |
Net expenses | | | 2,017,149 | |
| | | | |
Net investment income | | | 5,763,683 | |
| | | | |
Realized and unrealized gains (losses): | | | | |
Net realized gain (loss) from: | | | | |
Investments (includes gains from a redemption in-kind of $51,446,118) (Note 10) | | | 67,870,166 | |
Foreign currency transactions | | | 7,114,102 | |
| | | | |
Net realized gain (loss) | | | 74,984,268 | |
| | | | |
Net change in unrealized appreciation (depreciation) on: | | | | |
Investments | | | (53,256,260 | ) |
Translation of assets and liabilities denominated in foreign currencies | | | 71,548 | |
| | | | |
Net change in unrealized appreciation (depreciation) | | | (53,184,712 | ) |
| | | | |
Net realized and unrealized gain (loss) | | | 21,799,556 | |
| | | | |
Net increase (decrease) in net assets resulting from operations | | $ | 27,563,239 | |
| | | | |
The accompanying notes are an integral part of these financial statements.
TGA-20
Franklin Templeton Variable Insurance Products Trust
Financial Statements (continued)
Statements of Changes in Net Assets
| | | | | | | | |
| | | Templeton Global Asset
Allocation Fund | |
| | | Year Ended December 31, | |
| | | 2007 | | | 2006 | |
| | | | |
Increase (decrease) in net assets: | | | | | | | | |
Operations: | | | | | | | | |
Net investment income | | $ | 5,763,683 | | | $ | 14,103,670 | |
Net realized gain (loss) from investments, foreign currency transactions and redemption in-kind | | | 74,984,268 | | | | 111,939,026 | |
Net change in unrealized appreciation (depreciation) on investments and translation of assets and liabilities denominated in foreign currencies | | | (53,184,712 | ) | | | (29,884,803 | ) |
| | | | |
Net increase (decrease) in net assets resulting from operations | | | 27,563,239 | | | | 96,157,893 | |
| | | | |
Distributions to shareholders from: | | | | | | | | |
Net investment income and net foreign currency gains: | | | | | | | | |
Class 1 | | | (11,357,897 | ) | | | (18,191,422 | ) |
Class 2 | | | (14,016,851 | ) | | | (5,009,742 | ) |
Net realized gains: | | | | | | | | |
Class 1 | | | (14,706,218 | ) | | | (15,734,572 | ) |
Class 2 | | | (18,379,776 | ) | | | (4,478,496 | ) |
| | | | |
Total distributions to shareholders | | | (58,460,742 | ) | | | (43,414,232 | ) |
| | | | |
Capital share transactions: (Note 2) | | | | | | | | |
Class 1 | | | (207,311,609 | ) | | | (409,674,691 | ) |
Class 2 | | | 25,326,890 | | | | 5,351,089 | |
| | | | |
Total capital share transactions | | | (181,984,719 | ) | | | (404,323,602 | ) |
| | | | |
Net increase (decrease) in net assets | | | (212,882,222 | ) | | | (351,579,941 | ) |
Net assets: | | | | | | | | |
Beginning of year | | | 354,810,922 | | | | 706,390,863 | |
| | | | |
End of year | | $ | 141,928,700 | | | $ | 354,810,922 | |
| | | | |
Undistributed net investment income included in net assets: | | | | | | | | |
End of year | | $ | 12,217,627 | | | $ | 23,255,087 | |
| | | | |
The accompanying notes are an integral part of these financial statements.
TGA-21
Franklin Templeton Variable Insurance Products Trust
Notes to Financial Statements (continued)
Templeton Global Asset Allocation Fund
1. ORGANIZATION AND SIGNIFICANT ACCOUNTING POLICIES
Franklin Templeton Variable Insurance Products Trust (Trust) is registered under the Investment Company Act of 1940, as amended, (1940 Act) as an open-end investment company, consisting of twenty-three separate funds. The Templeton Global Asset Allocation Fund (Fund) included in this report is diversified. The financial statements of the remaining funds in the Trust are presented separately. Shares of the Fund are sold only to insurance company separate accounts to fund the benefits of variable life insurance policies or variable annuity contracts. The Fund offers two classes of shares: Class 1 and Class 2. Each class of shares differs by its distribution fees, voting rights on matters affecting a single class and its exchange privilege.
The following summarizes the Fund’s significant accounting policies.
a. Security Valuation
Securities listed on a securities exchange or on the NASDAQ National Market System are valued at the last quoted sale price or the official closing price of the day, respectively. Over-the-counter securities and listed securities for which there is no reported sale are valued within the range of the most recent quoted bid and ask prices. Securities that trade in multiple markets or on multiple exchanges are valued according to the broadest and most representative market. Investments in open-end mutual funds are valued at the closing net asset value.
Government securities generally trade in the over-the-counter market rather than on a securities exchange. The Trust may utilize independent pricing services, quotations from bond dealers, and information with respect to bond and note transactions, to assist in determining a current market value for each security. The Trust’s pricing services may use valuation models or matrix pricing which considers information with respect to comparable bond and note transactions, quotations from bond dealers, or by reference to other securities that are considered comparable in such characteristics as rating, interest rate and maturity date, option adjusted spread models, prepayment projections, interest rate spreads and yield curves, to determine current value.
Foreign securities are valued as of the close of trading on the foreign stock exchange on which the security is primarily traded, or the NYSE, whichever is earlier. If no sale is reported at that time, the foreign security will be valued within the range of the most recent quoted bid and ask prices. The value is then converted into its U.S. dollar equivalent at the foreign exchange rate in effect at the close of the NYSE on the day that the value of the foreign security is determined.
The Trust has procedures to determine the fair value of individual securities and other assets for which market prices are not readily available or which may not be reliably priced. Methods for valuing these securities may include: fundamental analysis, matrix pricing, discounts from market prices of similar securities, or discounts applied due to the nature and duration of restrictions on the disposition of the securities. Due to the inherent uncertainty of valuations of such securities, the fair values may differ significantly from the values that would have been used had a ready market for such investments existed. Occasionally, events occur between the time at which trading in a security is completed and the close of the NYSE that might call into question the availability (including the reliability) of the value of a portfolio security held by the Fund. The investment manager monitors price movements following the close of trading in foreign stock markets through a series of country specific market proxies (such as baskets of American Depository Receipts, futures contracts and exchange traded funds). These price movements are measured against established trigger thresholds for each specific market proxy to assist in determining if an event has occurred. If such an event occurs, the securities may be valued using fair value procedures, which may include the use of independent pricing services. All security valuation procedures are approved by the Trust’s Board of Trustees.
b. Foreign Currency Translation
Portfolio securities and other assets and liabilities denominated in foreign currencies are translated into U.S. dollars based on the exchange rate of such currencies against U.S. dollars on the date of valuation. Purchases and sales of securities, income and expense items denominated in foreign currencies are translated into U.S. dollars at the exchange rate in effect on the transaction
TGA-22
Franklin Templeton Variable Insurance Products Trust
Notes to Financial Statements (continued)
Templeton Global Asset Allocation Fund
1. ORGANIZATION AND SIGNIFICANT ACCOUNTING POLICIES (continued)
b. Foreign Currency Translation (continued)
date. Occasionally, events may impact the availability or reliability of foreign exchange rates used to convert the U.S. dollar equivalent value. If such an event occurs, the foreign exchange rate will be valued at fair value using procedures established and approved by the Trust’s Board of Trustees.
The Fund does not separately report the effect of changes in foreign exchange rates from changes in market prices on securities held. Such changes are included in net realized and unrealized gain or loss from investments on the Statement of Operations.
Realized foreign exchange gains or losses arise from sales of foreign currencies, currency gains or losses realized between the trade and settlement dates on securities transactions and the difference between the recorded amounts of dividends, interest, and foreign withholding taxes and the U.S. dollar equivalent of the amounts actually received or paid. Net unrealized foreign exchange gains and losses arise from changes in foreign exchange rates on foreign denominated assets and liabilities other than investments in securities held at the end of the reporting period.
c. Foreign Currency Contracts
When the Fund purchases or sells foreign securities it may enter into foreign exchange contracts to minimize foreign exchange risk from the trade date to the settlement date of the transactions. A foreign exchange contract is an agreement between two parties to exchange different currencies at an agreed upon exchange rate at a future date. Realized and unrealized gains and losses on these contracts are included in the Statement of Operations.
The Fund may also enter into forward exchange contracts to hedge against fluctuations in foreign exchange rates. These contracts are valued daily by the Fund and the unrealized gains or losses on the contracts, as measured by the difference between the contractual forward foreign exchange rates and the forward rates at the reporting date, are included in the Statement of Assets and Liabilities. Realized and unrealized gains and losses on these contracts are included in the Statement of Operations.
The risks of these contracts include movement in the values of the foreign currencies relative to the U.S. dollar and the possible inability of the counterparties to fulfill their obligations under the contracts, which may be in excess of the amount reflected in the Statement of Assets and Liabilities.
d. Income Taxes
No provision has been made for U.S. income taxes because it is the Fund’s policy to qualify as a regulated investment company under the Internal Revenue Code and to distribute to shareholders substantially all of its taxable income and net realized gains.
Foreign securities held by the Fund may be subject to foreign taxation on dividend and interest income received. Foreign taxes, if any, are recorded based on the tax regulations and rates that exist in the foreign markets in which the Fund invests.
e. Security Transactions, Investment Income, Expenses and Distributions
Security transactions are accounted for on trade date. Realized gains and losses on security transactions are determined on a specific identification basis. Interest income and estimated expenses are accrued daily. Amortization of premium and accretion of discount on debt securities are included in interest income. Dividend income is recorded on the ex-dividend date except that certain dividends from foreign securities are recognized as soon as the Fund is notified of the ex-dividend date. Distributions to shareholders are recorded on the ex-dividend date and are determined according to income tax regulations (tax basis). Distributable earnings determined on a tax basis may differ from earnings recorded in accordance with accounting principles generally accepted in the United States of America. These differences may be permanent or temporary. Permanent differences are reclassified among capital accounts to reflect their tax character.
TGA-23
Franklin Templeton Variable Insurance Products Trust
Notes to Financial Statements (continued)
Templeton Global Asset Allocation Fund
1. ORGANIZATION AND SIGNIFICANT ACCOUNTING POLICIES (continued)
e. Security Transactions, Investment Income, Expenses and Distributions (continued)
These reclassifications have no impact on net assets or the results of operations. Temporary differences are not reclassified, as they may reverse in subsequent periods.
Common expenses incurred by the Trust are allocated among the funds based on the ratio of net assets of each fund to the combined net assets of the Trust. Fund specific expenses are charged directly to the fund that incurred the expense.
Realized and unrealized gains and losses and net investment income, other than class specific expenses, are allocated daily to each class of shares based upon the relative proportion of net assets of each class. Differences in per share distributions, by class, are generally due to differences in class specific expenses.
Inflation-indexed bonds provide an inflation hedge through periodic increases in the security’s interest accruals and principal redemption value, by amounts corresponding to the current rate of inflation. Any such adjustments, including adjustments to principal redemption value, are recorded as interest income.
f. Accounting Estimates
The preparation of financial statements in accordance with accounting principles generally accepted in the United States of America requires management to make estimates and assumptions that affect the reported amounts of assets and liabilities at the date of the financial statements and the amounts of income and expenses during the reporting period. Actual results could differ from those estimates.
g. Guarantees and Indemnifications
Under the Trust’s organizational documents, its officers and trustees are indemnified by the Trust against certain liabilities arising out of the performance of their duties to the Trust. Additionally, in the normal course of business, the Trust, on behalf of the Fund, enters into contracts with service providers that contain general indemnification clauses. The Trust’s maximum exposure under these arrangements is unknown as this would involve future claims that may be made against the Trust that have not yet occurred. Currently, the Trust expects the risk of loss to be remote.
2. SHARES OF BENEFICIAL INTEREST
At December 31, 2007, there were an unlimited number of shares authorized (without par value). Transactions in the Fund’s shares were as follows:
| | | | | | | | | | | | | | |
| | | Year Ended December 31, | |
| | | 2007 | | | 2006 | |
| Class 1 Shares: | | Shares | | | Amount | | | Shares | | | Amount | |
Shares sold | | 345,235 | | | $ | 6,915,166 | | | 671,163 | | | $ | 14,177,128 | |
Shares issued in reinvestment of distributions | | 1,796,286 | | | | 26,064,115 | | | 1,797,880 | | | | 33,925,994 | |
Shares redeemed in-kind (Note 10) | | (7,596,834 | ) | | | (177,462,049 | ) | | (14,967,877 | ) | | | (342,015,981 | ) |
Shares redeemed | | (2,857,358 | ) | | | (62,828,841 | ) | | (5,187,026 | ) | | | (115,761,832 | ) |
| | | | |
Net increase (decrease) | | (8,312,671 | ) | | $ | (207,311,609 | ) | | (17,685,860 | ) | | $ | (409,674,691 | ) |
| | | | |
| Class 2 Shares: | | | | | | | | | | | | |
Shares sold | | 547,052 | | | $ | 9,586,666 | | | 978,403 | | | $ | 19,484,840 | |
Shares issued in reinvestment of distributions | | 2,263,915 | | | | 32,396,627 | | | 507,121 | | | | 9,488,238 | |
Shares redeemed | | (985,730 | ) | | | (16,656,403 | ) | | (1,172,793 | ) | | | (23,621,989 | ) |
| | | | |
Net increase (decrease) | | 1,825,237 | | | $ | 25,326,890 | | | 312,731 | | | $ | 5,351,089 | |
| | | | |
TGA-24
Franklin Templeton Variable Insurance Products Trust
Notes to Financial Statements (continued)
Templeton Global Asset Allocation Fund
3. TRANSACTIONS WITH AFFILIATES
Franklin Resources, Inc. is the holding company for various subsidiaries that together are referred to as Franklin Templeton Investments. Certain officers and trustees of the Trust are also officers and/or directors of the following subsidiaries:
| | |
| Subsidiary | | Affiliation |
Templeton Investment Counsel, LLC (TIC) | | Investment manager |
Franklin Advisers, Inc. (Advisers) | | Investment manager |
Franklin Templeton Services, LLC (FT Services) | | Administrative manager |
Franklin Templeton Distributors, Inc. (Distributors) | | Principal underwriter |
Franklin Templeton Investor Services, LLC (Investor Services) | | Transfer agent |
a. Management Fees
The Fund pays an investment management fee to TIC based on the average daily net assets of the Fund as follows:
| | |
| Annualized Fee Rate | | Net Assets |
| 0.650% | | Up to and including $200 million |
| 0.585% | | Over $200 million, up to and including $1.3 billion |
| 0.520% | | In excess of $1.3 billion |
Under a subadvisory agreement, Advisers, an affiliate of TIC, provides subadvisory services to the Fund and receives from TIC fees based on the average daily net assets of the Fund.
b. Administrative Fees
The Fund pays an administrative fee to FT Services based on the Fund’s average daily net assets as follows:
| | |
| Annualized Fee Rate | | Net Assets |
| 0.150% | | Up to and including $200 million |
| 0.135% | | Over $200 million, up to and including $700 million |
| 0.100% | | Over $700 million, up to and including $1.2 billion |
| 0.075% | | In excess of $1.2 billion |
c. Distribution Fees
The Fund’s Board of Trustees has adopted a distribution plan for Class 2 shares pursuant to Rule 12b-1 under the 1940 Act. Under the Fund’s compensation distribution plan, the Fund pays Distributors for costs incurred in connection with the servicing, sale and distribution of the Fund’s shares up to 0.25% per year of its average daily net assets.
d. Transfer Agent Fees
Investor Services, under terms of an agreement, performs shareholder servicing for the Fund and is not paid by the Fund for the services.
e. Waiver and Expense Reimbursements
FT Services and TIC have agreed in advance to waive all or a portion of their respective fees and to assume payment of other expenses through April 30, 2009. Total expenses waived are not subject to reimbursement by the Fund subsequent to the Fund’s fiscal year end. After April 30, 2009, FT Services and TIC may discontinue this waiver at any time upon notice to the Fund’s Board of Trustees.
TGA-25
Franklin Templeton Variable Insurance Products Trust
Notes to Financial Statements (continued)
Templeton Global Asset Allocation Fund
4. EXPENSE OFFSET ARRANGEMENT
The Fund has entered into an arrangement with its custodian whereby credits realized as a result of uninvested cash balances are used to reduce a portion of the Fund’s custodian expenses. During the year ended December 31, 2007, the custodian fees were reduced as noted in the Statement of Operations.
5. INCOME TAXES
The Fund has reviewed the tax positions taken on federal income tax returns, for each of the three open tax years and as of December 31, 2007 and has determined that no provision for income tax is required in the Fund’s financial statements.
The tax character of distributions paid during the years ended December 31, 2007 and 2006, was as follows:
| | | | | | |
| | | 2007 | | 2006 |
Distributions paid from: | | | | | | |
Ordinary income | | $ | 26,602,578 | | $ | 23,239,156 |
Long term capital gain | | | 31,858,164 | | | 20,175,076 |
| | | |
| | $ | 58,460,742 | | | 43,414,232 |
| | | |
At December 31, 2007, the cost of investments, net unrealized appreciation (depreciation), undistributed ordinary income and undistributed long term capital gains for income tax purposes were as follows:
| | | | |
Cost of investments | | $ | 106,349,558 | |
| | | | |
| |
Unrealized appreciation | | $ | 34,462,892 | |
Unrealized depreciation | | | (3,426,844 | ) |
| | | | |
Net unrealized appreciation (depreciation) | | $ | 31,036,048 | |
| | | | |
Undistributed ordinary income | | $ | 13,668,350 | |
Undistributed long term capital gains | | | 14,502,473 | |
| | | | |
Distributable earnings | | $ | 28,170,823 | |
| | | | |
Net investment income (loss) differs for financial statement and tax purposes primarily due to differing treatments of foreign currency transactions, bond discounts and premiums and inflation related adjustments on foreign securities.
Net realized gains (losses) differ for financial statement and tax purposes primarily due to differing treatments of foreign currency transactions, bond discounts and premiums, gains realized on in-kind shareholder redemptions and inflation related adjustments on foreign securities.
6. INVESTMENT TRANSACTIONS
Purchases and sales of investments (excluding short term securities) for the year ended December 31, 2007, aggregated $57,972,807 and $102,681,048, respectively. Sales of investments excludes $177,462,049 of an in-kind redemption.
7. INVESTMENTS IN FRANKLIN INSTITUTIONAL FIDUCIARY TRUST MONEY MARKET PORTFOLIO
The Fund may invest in the Franklin Institutional Fiduciary Trust Money Market Portfolio (Sweep Money Fund), an open-end investment company managed by Advisers. Management fees paid by the Fund are reduced on assets invested in the Sweep Money Fund, in an amount not to exceed the management and administrative fees paid by the Sweep Money Fund.
TGA-26
Franklin Templeton Variable Insurance Products Trust
Notes to Financial Statements (continued)
Templeton Global Asset Allocation Fund
8. FORWARD EXCHANGE CONTRACTS
At December 31, 2007, the Fund had the following forward exchange contracts outstanding:
| | | | | | | | | | | | | | |
| | | Contract Amounta | | | Settlement
Date | | Unrealized
Gain | | Unrealized
Loss | |
| Contracts to Buy | | | | | | | | |
| 250,565,000 | | Japanese Yen | | 1,639,609 | EUR | | 1/04/08 | | $ | — | | $ | (145,000 | ) |
| 127,176,500 | | Kazakhstan Tenge | | 1,045,000 | | | 1/16/08 | | | 5,212 | | | — | |
| 121,800,000 | | Kazakhstan Tenge | | 1,000,000 | | | 1/18/08 | | | 5,382 | | | — | |
| 121,450,000 | | Kazakhstan Tenge | | 1,000,000 | | | 1/18/08 | | | 2,493 | | | — | |
| 9,000,000 | | Norwegian Krone | | 1,609,500 | | | 1/28/08 | | | 45,268 | | | — | |
| 81,000,000 | | Indian Rupee | | 2,710,208 | NZD | | 2/29/08 | | | — | | | (13,375 | ) |
| 13,756,216 | | Mexican Peso | | 2,510,509,398 | COP | | 4/22/08 | | | 25,589 | | | — | |
| 22,282,800 | | Japanese Yen | | 200,000 | | | 8/20/08 | | | 4,371 | | | — | |
| 22,358,000 | | Japanese Yen | | 200,000 | | | 8/20/08 | | | 5,061 | | | — | |
| 22,139,600 | | Japanese Yen | | 200,000 | | | 8/25/08 | | | 3,140 | | | — | |
| 825,000 | | Swiss Franc | | 712,054 | | | 10/20/08 | | | 24,457 | | | — | |
| | | | |
| Contracts to Sell | | | | | | | | | | |
| 22,656,216 | | Mexican Peso | | 4,426,571,459 | COP | | 4/22/08 | | | 100,071 | | | — | |
| 4,002,526 | | Mexican Peso | | 183,615,857 | CLP | | 6/12/08 | | | 5,599 | | | — | |
| 642,600 | | Euro | | 100,848,359 | JPY | | 12/08/08 | | | — | | | (2,350 | ) |
| | | | | | | | | | | | | | |
| Unrealized gain (loss) on forward exchange contracts | | | | | | | | 226,643 | | | (160,725 | ) |
| | | | | | | | | | | | |
| Net unrealized gain (loss) on forward exchange contracts | | | | | | | $ | 65,918 | | | | |
| | | | | | | | | | | | |
a | In U.S. dollars unless otherwise indicated. |
Currency Abbreviations
CLP - Chilean Peso
COP - Columbian Peso
EUR - Euro
JPY - Japanese Yen
NZD - New Zealand Dollar
9. CONCENTRATION OF RISK
Investing in foreign securities may include certain risks and considerations not typically associated with investing in U.S. securities, such as fluctuating currency values and changing local and regional economic, political and social conditions, which may result in greater market volatility. In addition, certain foreign securities may not be as liquid as U.S. securities.
10. REDEMPTION IN-KIND
During the years ended December 31, 2007 and 2006, the Fund realized $51,446,118 and $67,648,833, respectively, of net gains resulting from redemptions in-kind in which a shareholder redeemed fund shares for securities held by the Fund rather
TGA-27
Franklin Templeton Variable Insurance Products Trust
Notes to Financial Statements (continued)
Templeton Global Asset Allocation Fund
10. REDEMPTION IN-KIND (continued)
than for cash. Because such gains are not taxable to the Fund, and are not distributed to shareholders, they have been reclassified from accumulated net realized gains to paid-in capital.
11. REGULATORY AND LITIGATION MATTERS
As part of various investigations by a number of federal, state, and foreign regulators and governmental entities, including the Securities and Exchange Commission (“SEC”), relating to certain practices in the mutual fund industry, including late trading, market timing and marketing support payments to securities dealers who sell fund shares (“marketing support”), Franklin Resources, Inc. and certain of its subsidiaries (collectively, the “Company”), entered into settlements with certain of those regulators and governmental entities. Specifically, the Company entered into settlements with the SEC, among others, concerning market timing and marketing support.
On June 6, 2007, the SEC posted for public comment the proposed plan of distribution for the market timing settlement. Once the SEC approves the final plan of distribution, disbursements of settlement monies will be made promptly to individuals who were shareholders of the designated funds during the relevant period, in accordance with the terms and conditions of the settlement and plan.
In addition, the Company, as well as most of the mutual funds within Franklin Templeton Investments and certain current or former officers, Company directors, fund directors, and employees, have been named in private lawsuits (styled as shareholder class actions, or as derivative actions on behalf of either the named funds or Franklin Resources, Inc.). The lawsuits relate to the industry practices referenced above.
The Company and fund management believe that the claims made in each of the private lawsuits referenced above are without merit and intend to defend against them vigorously. The Company cannot predict with certainty the eventual outcome of these lawsuits, nor whether they will have a material negative impact on the Company. If it is determined that the Company bears responsibility for any unlawful or inappropriate conduct that caused losses to the Trust, it is committed to making the Trust or its shareholders whole, as appropriate.
12. NEW ACCOUNTING PRONOUNCEMENT
In September 2006, the Financial Accounting Standards Board (FASB) issued FASB Statement No. 157, “Fair Value Measurement” (SFAS 157), which defines fair value, establishes a framework for measuring fair value, and expands disclosures about fair value measurements. SFAS 157 is effective for fiscal years beginning after November 15, 2007, and interim periods within those fiscal years. The Trust believes the adoption of SFAS 157 will have no material impact on its financial statements.
TGA-28
Franklin Templeton Variable Insurance Products Trust
Templeton Global Asset Allocation Fund
Report of Independent Registered Public Accounting Firm
To the Board of Trustees and Shareholders of
Franklin Templeton Variable Insurance Products Trust
In our opinion, the accompanying statement of assets and liabilities, including the statement of investments, and the related statements of operations and of changes in net assets and the financial highlights present fairly, in all material respects, the financial position of Templeton Global Asset Allocation Fund (one of the funds constituting Franklin Templeton Variable Insurance Products Trust, hereafter referred to as the “Fund”) at December 31, 2007, the results of its operations for the year then ended, the changes in its net assets for each of the two years in the period then ended and the financial highlights for each of the five years in the period then ended, in conformity with accounting principles generally accepted in the United States of America. These financial statements and financial highlights (hereafter referred to as “financial statements”) are the responsibility of the Fund’s management. Our responsibility is to express an opinion on these financial statements based on our audits. We conducted our audits of these financial statements in accordance with the standards of the Public Company Accounting Oversight Board (United States). Those standards require that we plan and perform the audit to obtain reasonable assurance about whether the financial statements are free of material misstatement. An audit includes examining, on a test basis, evidence supporting the amounts and disclosures in the financial statements, assessing the accounting principles used and significant estimates made by management, and evaluating the overall financial statement presentation. We believe that our audits, which included confirmation of securities at December 31, 2007 by correspondence with the custodian, provide a reasonable basis for our opinion.
PricewaterhouseCoopers LLP
San Francisco, California
February 14, 2008
TGA-29
Franklin Templeton Variable Insurance Products Trust
Notes to Financial Statements (continued)
Templeton Global Asset Allocation Fund
Under Section 852(b)(3)(C) of the Internal Revenue Code (Code), the Fund designates the maximum amount allowable but no less than $14,502,614 as a long term capital gain dividend for the fiscal year ended December 31, 2007.
Under Section 854(b)(2) of the Code, the Fund designates 2.08% of the ordinary income dividends as income qualifying for the dividends received deduction for the fiscal year ended December 31, 2007.
At December 31, 2007, more than 50% of the Fund’s total assets were invested in securities of foreign issuers. In most instances, foreign taxes were withheld from income paid to the Fund on these investments. The Fund elects to treat foreign taxes paid as allowed under Section 853 of the Code. This election will allow shareholders of record as of the 2008 distribution date, to treat their proportionate share of foreign taxes paid by the Fund as having been paid directly by them. The shareholder shall consider these amounts as foreign taxes paid in the tax year in which they receive the Fund distribution.
TGA-30
TEMPLETON GLOBAL INCOME SECURITIES FUND
We are pleased to bring you Templeton Global Income Securities Fund’s annual report for the fiscal year ended December 31, 2007.
Performance Summary as of 12/31/07
Average annual total return of Class 1 shares represents the average annual change in value, assuming reinvestment of dividends and capital gains. Average returns smooth out variations in returns, which can be significant; they are not the same as year-by-year results.
Periods ended 12/31/07
| | | | | | | | |
| | | | | 1-Year | | 5-Year | | 10-Year |
Average Annual Total Return | | | | +11.27% | | +11.54% | | +8.51% |
Total Return Index Comparison
for Hypothetical $10,000 Investment (1/1/98–12/31/07)
The graph below shows the change in value of a hypothetical $10,000 investment in the Fund over the indicated period and includes reinvestment of any income or distributions. The Fund’s performance is compared to the performance of the J.P. Morgan (JPM) Government Bond Index (GBI) Global, as well as the Consumer Price Index (CPI). One cannot invest directly in an index, nor is an index representative of the Fund’s portfolio. Please see Important Notes to Performance Information preceding the Fund Summaries.
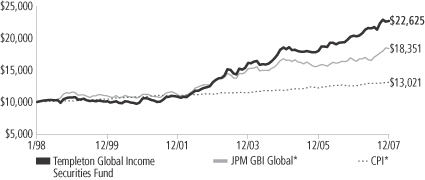
*Sources: J.P. Morgan; Standard & Poor’s Micropal. Please see Index Descriptions following the Fund Summaries.
Templeton Global Income Securities Fund – Class 1
Performance reflects the Fund’s Class 1 operating expenses, but does not include any contract fees, expenses or sales charges. If they had been included, performance would be lower. These charges and deductions, particularly for variable life policies, can have a significant effect on contract values and insurance benefits. See the contract prospectus for a complete description of these expenses, including sales charges.
Performance data represent past performance, which does not guarantee future results. Investment return and principal value will fluctuate, and you may have a gain or loss when you sell your shares.
Current performance may differ from figures shown.
TGI-1
Fund Goal and Main Investments: Templeton Global Income Securities Fund seeks high current income, consistent with preservation of capital, with capital appreciation as a secondary consideration. The Fund normally invests mainly in debt securities of governments and their political subdivisions and agencies, supranational organizations and companies located anywhere in the world, including emerging markets.
Performance Overview
You can find the Fund’s one-year total return in the Performance Summary. The Fund performed comparably to its benchmark, the JPM GBI Global, which had a +10.81% total return in U.S. dollar terms for the year under review.1
Economic and Market Overview
Global economic growth remained strong during the reporting period despite a credit crunch in the second half of the year prompted by the deteriorating U.S. housing sector. Robust economic growth in many emerging markets contrasted with more moderate growth in developed markets where lack of financial liquidity had a larger impact. The rapid rise among developing economies resulted in increased demand from local consumers. Increased food and energy consumption led to high commodity prices throughout the year, benefiting countries exporting these goods. High prices also contributed to inflationary pressures already present in several economies after years of continued above-trend growth. Strong economic growth and rising interest rates in many economies contrasted with the U.S.’s weak growth and falling interest rates, which caused significant U.S. dollar depreciation during the year.
China continued to lead the Asian region’s economic expansion, posting greater than 11% increases in gross domestic product (GDP) in the first three quarters of 2007 compared with the same period in 2006 (year-over-year).2 China’s surging domestic demand became an increasingly important growth source for other Asian economies through trade. For example, Chinese imports from Asia increased 18% in the first 11 months of 2007 year-over-year.2 Continued rapid expansion led to fears China’s economy was overheating as inflation picked up. The potential repercussions of allowing the expansion to continue unchecked were compounded by the local equity markets’ solid performance. Thus, monetary authorities increased interest rates and even allowed the yuan
1. Source: J.P. Morgan. One cannot invest directly in an index, nor is an index representative of the Fund’s portfolio. Please see Index Descriptions following the Fund Summaries.
2. Source: EcoWin.
Fund Risks: Because the Fund invests in bonds and other debt obligations, its share price and yield will be affected by interest rate movements. Bond prices generally move in the opposite direction of interest rates. Thus, as prices of bonds in the Fund adjust to a rise in interest rates, the Fund’s share price may decline. High yield, lower-rated (junk) bonds generally have greater price swings and higher default risks than investment-grade bonds. Foreign investing, especially in emerging markets, involves additional risks including currency fluctuations, economic instability, market volatility, and political and social instability. The Fund’s prospectus also includes a description of the main investment risks.
TGI-2
to appreciate slightly. India encountered similar conditions as it posted around 9% GDP growth in the first three quarters of 2007 year-over-year.2 Indian monetary authorities responded by raising the target interest rate 50 basis points (half a percentage point) during the year. However, this had little effect on private investment growth. Japan continued to fall behind as the country registered GDP growth below 2% in the second and third quarters of 2007 year-over-year.3 Consequently, the Japanese central bank kept rates on hold for the second half of the year after raising them 25 basis points earlier. Low growth levels and interest rates by international standards led to continued yen weakness until risk aversion rose at the end of the year, prompting carry trades to unwind.
European economic growth remained quite strong in 2007, although fears regarding the U.K.’s and eurozone’s future growth paths emerged following the credit crunch. Labor markets strengthened across the region and monetary conditions tightened. The European Central Bank raised rates 50 basis points during the period as growth was strong in the first half of the year, particularly in Germany. Non-euro Europe enjoyed even stronger growth. Norway grew 6.6% in the third quarter year-over-year, prompting the central bank to raise interest rates 25 basis points in December despite financial market volatility.2 The labor market underpinned the nation’s growth as the unemployment rate fell to 1.6% in December from 2.1% a year earlier.4 Some European economies expanded more modestly, particularly where the housing market slowed, such as in Spain and the U.K. These residential markets, after recently showing some of the strongest growth, were hurt as negative sentiment spread from the U.S. housing market across the Atlantic. In the U.K., housing market weakness combined with financial market troubles caused enough worries for the Bank of England to cut interest rates 25 basis points in December after just raising them in July.
3. Source: Economic & Social Research Institute.
4. Source: Norway Ministry of Labour.
What is a carry trade?
Carry trade is a strategy in which an investor sells a certain currency with a relatively low interest rate and uses the funds to purchase a different currency yielding a higher interest rate. A trader using this strategy attempts to capture the difference between the rates, which can often be substantial, depending on the amount of leverage the investor chooses to use.
TGI-3
Investment Strategy
We allocate the Fund’s assets among issuers, geographic regions, and currencies based upon our assessment of relative interest rates among currencies, our outlook for changes in interest rates and currencies, and credit risks. In considering these factors, we may evaluate a country’s changing market, economic and political conditions, such as inflation rate, growth prospects, global trade patterns and government policies. We seek to manage the Fund’s exposure to various currencies, and may from time to time seek to hedge (protect) against currency risk by using forward currency exchange contracts.
Manager’s Discussion
The Fund’s total return was influenced by various factors, including interest rate developments, currency movements, and exposure to sovereign debt markets.
Interest Rate Strategy
For most of the 12-month reporting period, the Fund maintained its overall short duration positioning seeking to take advantage of global interest rate tightening resulting from strong economic growth in most economies. However, we found some opportunities to take advantage of local interest rate reductions. For example, the Indonesian central bank reduced interest rates 175 basis points over the period, continuing its interest rate normalization process as inflation remained under control. Indonesia returned +11.07% in local currency terms over the period, as measured by the JPM GBI–Emerging Markets.5 Another positive local market was Brazil, where its central bank reduced interest rates 200 basis points during the period to 11.25%, which supported local bond market returns of +9.81% in local currency terms.5 The central bank held interest rates constant throughout the fourth quarter as the economy accelerated, inflation picked up, and the large monetary action’s impact began to be felt. As global growth concerns surfaced later in the year, the Fund selectively increased its interest rate exposure, which lengthened the portfolio’s duration.
Currency Strategy
Our currency strategy remained relatively unchanged over the period, predicated on our medium-term view on the gradual unwinding of global imbalances, which began during the period. These imbalances centered on strong U.S. consumption growth and, consequently, a large
5. Source: J.P. Morgan. Please see Index Descriptions following the Fund Summaries.
Currency Breakdown
Templeton Global Income Securities Fund 12/31/07
| | |
| | | % of Total
Net Assets |
| |
| Asia Pacific | | 49.4% |
| Japanese Yen | | 16.2% |
| Malaysian Ringgit | | 11.2% |
| Indonesian Rupiah | | 5.2% |
| South Korean Won | | 4.3% |
| Kazakhstan Tenge | | 4.3% |
| Singapore Dollar | | 4.1% |
| Indian Rupee | | 3.0% |
| Australian Dollar | | 1.2% |
| New Zealand Dollar* | | -0.1% |
| |
| Europe | | 33.5% |
| Swedish Krona | | 13.8% |
| Swiss Franc | | 9.6% |
| Norwegian Krone | | 6.1% |
| Polish Zloty | | 5.4% |
| Euro | | 1.0% |
| Iceland Krona | | 0.1% |
| Romanian Lei* | | -2.5% |
| |
| Americas | | 13.0% |
| Brazilian Real | | 5.7% |
| Canadian Dollar | | 2.9% |
| Chilean Peso | | 1.8% |
| U.S. Dollar | | 1.1% |
| Colombian Peso | | 0.9% |
| Peruvian Nuevo Sol | | 0.9% |
| Mexican Peso* | | -0.3% |
| |
| Middle East & Africa | | 4.1% |
| Egyptian Pound | | 4.1% |
*The Mexican peso = -0.3%, New Zealand dollar = -0.1%, and the Romanian lei = -2.5% due to forward currency exchange contracts.
The dollar value, number of shares or principal amount, and names of all portfolio holdings are listed in the Fund’s Statement of Investments.
TGI-4
U.S. current account deficit, versus low domestic demand in most Asian countries and corresponding Asian current account surpluses. As a result, the Fund benefited from its significantly underweighted U.S. dollar exposure relative to the JPM GBI Global, as the dollar depreciated 10.00% against the U.S.’s major trading partners.6 The imbalance began unwinding as the U.S. trade deficit contracted toward year-end because of U.S. exports’ improved competitiveness due to a weaker dollar. However, the deficit was still quite large on a historical basis. The U.S. dollar weakened further when the Federal Reserve Board cut interest rates during the period, well ahead of other central banks, as the credit crunch affected the U.S. economy more than other countries. One currency that appreciated strongly against the U.S. dollar was the Canadian dollar, which rose 17.91% against the U.S. dollar during the period and contributed to relative performance because of the Fund’s overweighted exposure.7 The Canadian dollar benefited from high prices for many of the country’s natural resource exports and a strong domestic economy. Toward period-end, the weak U.S. economy began to negatively impact Canada’s growth prospects and led us to reduce the Fund’s Canadian dollar allocation prior to the Canadian dollar’s poor performance during the last quarter of 2007. The Fund’s overweighted exposure to the Brazilian real boosted the Fund’s relative performance even more as the currency appreciated 19.94% against the U.S. dollar during the year.7, 8 The real benefited from very strong inflows from trade and investment.
European currencies also appreciated against the U.S. dollar over the period. The Fund had limited direct exposure to the euro, and was instead positioned to capture the benefit of euro appreciation through exposure to non-euro European currencies that are closely linked to the euro region. The euro appreciated 10.87% versus the U.S. dollar during the period as growth remained strong and the interest rate differential with the U.S. shrank significantly.7 Although our limited exposure to the euro’s strong return hurt relative performance, the Fund benefited from its overweighted exposures to the Polish zloty and Norwegian krone.8 Similar to the Scandinavian economies, the Polish economy also exhibited tightening labor market conditions given strong GDP growth
6. Source: Federal Reserve H10 Report.
7. Source: Exshare (via Compustat via FactSet).
8. These countries are not components of the JPM GBI Global.
What is a current account?
A current account is that part of the balance of payments where all of one country’s international transactions in goods and services are recorded.
What is balance of payments?
Balance of payments is a record of all of a country’s exports and imports of goods and services, borrowing and lending with the rest of the world during a particular time period. It helps a country evaluate its competitive strengths and weaknesses and forecast the strength of its currency.
What is duration?
Duration is a measure of a bond’s price sensitivity to interest rate changes. In general, a portfolio of securities with a lower duration can be expected to be less sensitive to interest rate changes than a portfolio with a higher duration.
TGI-5
of more than 6% year-over-year in the third quarter of 2007.9 Strong economic growth created jobs at the same time that there was significant emigration from Poland. Prospects for wage pressures prompted the central bank to raise interest rates during the period, supporting currency performance. The Swedish krona detracted from relative performance as it appreciated only 5.88% against the U.S. dollar over the period.7 The Fund’s biggest allocation change during the period was the addition of the Swiss franc, which appreciated 3.18% during the fourth quarter benefiting from increased risk aversion.7
Asian currency performance was mixed during the year. The currency that comprised the largest portion of the Fund was the Japanese yen, though our exposure was still substantially below the benchmark’s. The yen, which appreciated 6.66% against the U.S. dollar over the period, lagged other major currencies until risk aversion increased in the second half of the year leading to the unwinding of carry trades.7 Among other Asian currencies, the Malaysian ringgit appreciated 6.68% against the U.S. dollar, the South Korean won depreciated 0.65%, and the Indonesian rupiah depreciated 4.25%.7 Our overweighted allocations in these currencies hurt the Fund’s relative performance.8
Global Sovereign Debt Strategy
The Fund purchased investment-grade and subinvestment-grade sovereign debt that typically compensates for greater credit risk by offering higher yields relative to U.S. and European benchmark Treasury securities. Tighter credit conditions resulted in wider sovereign credit spreads despite improving fundamentals in most economies. Sovereign interest rate credit spreads increased from 171 basis points at the beginning of the reporting period to 255 basis points by period-end. However, declining U.S. interest rates benefited the performance of these dollar-denominated bonds. Largely as a result, U.S. dollar-denominated emerging market debt returned +6.28% over the period, as measured by the JPM Emerging Markets Bond Index (EMBI) Global.5 Regionally, Latin American sovereign debt returned +5.15%, Asian +6.14%, and central and eastern European +7.91%.5
9. Source: National Bank of Poland.
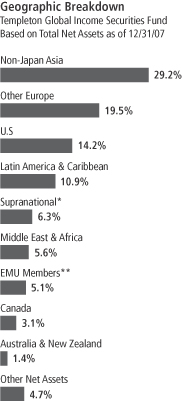
*The Fund’s supranational investments were denominated in the Japanese yen, Mexican peso, New Zealand dollar and Polish zloty.
**The Fund’s EMU investments were in Austria, Belgium, Finland, France, Germany and Spain.
TGI-6
Euro-denominated markets underperformed the index, returning 1.22% in euro terms, as measured by the JPM Euro EMBI Global.5 The Fund maintained limited exposure to sovereign debt during the period.
Thank you for your participation in Templeton Global Income Securities Fund. We look forward to serving your future investment needs.
The foregoing information reflects our analysis, opinions and portfolio holdings as of December 31, 2007, the end of the reporting period. The way we implement our main investment strategies and the resulting portfolio holdings may change depending on factors such as market and economic conditions. These opinions may not be relied upon as investment advice or an offer for a particular security. The information is not a complete analysis of every aspect of any market, country, industry, security or the Fund. Statements of fact are from sources considered reliable, but the investment manager makes no representation or warranty as to their completeness or accuracy. Although historical performance is no guarantee of future results, these insights may help you understand our investment management philosophy.
TGI-7
Fund Expenses
As an investor in a variable insurance contract (Contract) that indirectly provides for investment in an underlying mutual fund, you can incur transaction and/or ongoing expenses at both the Fund level and the Contract level.
| • | | Transaction expenses can include sales charges (loads) on purchases, redemption fees, surrender fees, transfer fees and premium taxes. |
| • | | Ongoing expenses can include management fees, distribution and service (12b-1) fees, contract fees, annual maintenance fees, mortality and expense risk fees and other fees and expenses. All mutual funds and Contracts have some types of ongoing expenses. |
The expenses shown in the table are meant to highlight ongoing expenses at the Fund level only and do not include ongoing expenses at the Contract level, or transaction expenses at either the Fund or Contract level. While the Fund does not have transaction expenses, if the transaction and ongoing expenses at the Contract level were included, the expenses shown would be higher. You should consult your Contract prospectus or disclosure document for more information.
The table shows Fund-level ongoing expenses and can help you understand these expenses and compare them with those of other mutual funds offered through the Contract. The table assumes a $1,000 investment held for the six months indicated. Please refer to the Fund prospectus for additional information on operating expenses.
Actual Fund Expenses
The first line (Actual) of the table provides actual account values and expenses. The “Ending Account Value” is derived from the Fund’s actual return, which includes the effect of ongoing Fund expenses, but does not include the effect of ongoing Contract expenses.
You can estimate the Fund-level expenses you incurred during the period by following these steps. Of course, your account value and expenses will differ from those in this illustration:
| 1. | Divide your account value by $1,000. |
If an account had an $8,600 value, then $8,600 ÷ $1,000 = 8.6.
| 2. | Multiply the result by the number under the heading “Fund-Level Expenses Incurred During Period.” |
If Fund-Level Expenses Incurred During Period were $7.50, then 8.6 x $7.50 = $64.50.
In this illustration, the estimated expenses incurred this period at the Fund level are $64.50.
Templeton Global Income Securities Fund – Class 1
TGI-8
Hypothetical Example for Comparison with Other Mutual Funds
Information in the second line (Hypothetical) of the table can help you compare ongoing expenses of the Fund with those of other mutual funds offered through the Contract. This information may not be used to estimate the actual ending account balance or expenses you incurred during the period. The hypothetical “Ending Account Value” is based on the Fund’s actual expense ratio for each class and an assumed 5% annual rate of return before expenses, which does not represent the Fund’s actual return. The figure under the heading “Fund-Level Expenses Incurred During Period” shows the hypothetical expenses your account would have incurred under this scenario. You can compare this figure with the 5% hypothetical examples that appear in shareholder reports of other funds offered through a Contract.
| | | | | | | | | |
| Class 1 | | Beginning
Account
Value 7/1/07 | | Ending
Account
Value 12/31/07 | | Fund-Level
Expenses Incurred
During Period*
7/1/07–12/31/07 |
Actual | | $ | 1,000 | | $ | 1,052.60 | | $ | 3.21 |
Hypothetical (5% return before expenses) | | $ | 1,000 | | $ | 1,022.08 | | $ | 3.16 |
*Expenses are calculated using the most recent six-month annualized expense ratio, for the Fund’s Class 1 shares (0.62%), which does not include any ongoing expenses of the Contract for which the Fund is an investment option, multiplied by the average account value over the period, multiplied by 184/365 to reflect the one-half year period.
TGI-9
Franklin Templeton Variable Insurance Products Trust
Financial Highlights
Templeton Global Income Securities Fund
| | | | | | | | | | | | | | | | | | | | |
| | | Year Ended December 31, | |
| Class 1 | | 2007 | | | 2006 | | | 2005 | | | 2004 | | | 2003 | |
| | | | |
Per share operating performance | | | | | | | | | | | | | | | | | | | | |
(for a share outstanding throughout the year) | | | | | | | | | | | | | | | | | | | | |
Net asset value, beginning of year | | $ | 15.73 | | | $ | 14.36 | | | $ | 15.80 | | | $ | 15.54 | | | $ | 13.67 | |
| | | | |
Income from investment operationsa: | | | | | | | | | | | | | | | | | | | | |
Net investment incomeb | | | 0.77 | | | | 0.61 | | | | 0.57 | | | | 0.66 | | | | 0.69 | |
Net realized and unrealized gains (losses) | | | 0.97 | | | | 1.24 | | | | (1.03 | ) | | | 1.37 | | | | 2.35 | |
| | | | |
Total from investment operations | | | 1.74 | | | | 1.85 | | | | (0.46 | ) | | | 2.03 | | | | 3.04 | |
| | | | |
Less distributions from net investment income | | | (0.47 | ) | | | (0.48 | ) | | | (0.98 | ) | | | (1.77 | ) | | | (1.17 | ) |
| | | | |
Redemption fees | | | — | d | | | — | d | | | — | d | | | — | | | | — | |
| | | | |
Net asset value, end of year | | $ | 17.00 | | | $ | 15.73 | | | $ | 14.36 | | | $ | 15.80 | | | $ | 15.54 | |
| | | | |
| | | | | |
Total returnc | | | 11.27% | | | | 13.14% | | | | (2.91)% | | | | 15.09% | | | | 22.72% | |
Ratios to average net assets | | | | | | | | | | | | | | | | | | | | |
Expenses before expense reduction | | | 0.64% | | | | 0.80% | | | | 0.78% | | | | 0.79% | | | | 0.76% | |
Expenses net of expense reduction | | | 0.64% | | | | 0.72% | | | | 0.74% | | | | 0.78% | | | | 0.76% | |
Net investment income | | | 4.70% | | | | 4.09% | | | | 3.81% | | | | 4.40% | | | | 4.72% | |
| | | | | |
Supplemental data | | | | | | | | | | | | | | | | | | | | |
Net assets, end of year (000’s) | | $ | 137,700 | | | $ | 75,843 | | | $ | 53,115 | | | $ | 49,845 | | | $ | 52,842 | |
Portfolio turnover rate | | | 47.33% | | | | 30.65% | | | | 30.28% | | | | 37.39% | | | | 53.01% | |
aThe amount shown for a share outstanding throughout the period may not correlate with the Statement of Operations for the period due to the timing of sales and repurchases of the Fund shares in relation to income earned and/or fluctuating market value of the investments of the Fund.
bBased on average daily shares outstanding.
cTotal return does not include any fees, charges or expenses imposed by the variable annuity and life insurance contracts for which the Franklin Templeton Variable Insurance Products Trust serves as an underlying investment vehicle.
dAmount rounds to less than $0.01 per share.
The accompanying notes are an integral part of these financial statements.
TGI-10
Franklin Templeton Variable Insurance Products Trust
Financial Highlights (continued)
Templeton Global Income Securities Fund
| | | | | | | | | | | | | | | | | | | | |
| | | Year Ended December 31, | |
| Class 2 | | 2007 | | | 2006 | | | 2005 | | | 2004 | | | 2003 | |
| | | | |
Per share operating performance | | | | | | | | | | | | | | | | | | | | |
(for a share outstanding throughout the year) | | | | | | | | | | | | | | | | | | | | |
Net asset value, beginning of year | | $ | 15.50 | | | $ | 14.19 | | | $ | 15.64 | | | $ | 15.42 | | | $ | 13.59 | |
| | | | |
Income from investment operationsa: | | | | | | | | | | | | | | | | | | | | |
Net investment incomeb | | | 0.72 | | | | 0.57 | | | | 0.52 | | | | 0.60 | | | | 0.65 | |
Net realized and unrealized gains (losses) | | | 0.96 | | | | 1.21 | | | | (1.00 | ) | | | 1.36 | | | | 2.33 | |
| | | | |
Total from investment operations | | | 1.68 | | | | 1.78 | | | | (0.48 | ) | | | 1.96 | | | | 2.98 | |
| | | | |
Less distributions from net investment income | | | (0.46 | ) | | | (0.47 | ) | | | (0.97 | ) | | | (1.74 | ) | | | (1.15 | ) |
| | | | |
Redemption fees | | | — | d | | | — | d | | | — | d | | | — | | | | — | |
| | | | |
Net asset value, end of year | | $ | 16.72 | | | $ | 15.50 | | | $ | 14.19 | | | $ | 15.64 | | | $ | 15.42 | |
| | | | |
| | | | | |
Total returnc | | | 11.00% | | | | 12.77% | | | | (3.08)% | | | | 14.74% | | | | 22.44% | |
Ratios to average net assets | | | | | | | | | | | | | | | | | | | | |
Expenses before expense reduction | | | 0.89% | | | | 1.05% | | | | 1.03% | | | | 1.04% | | | | 1.01% | |
Expenses net of expense reduction | | | 0.89% | | | | 0.97% | | | | 0.99% | | | | 1.03% | | | | 1.01% | |
Net investment income | | | 4.45% | | | | 3.84% | | | | 3.56% | | | | 4.15% | | | | 4.47% | |
| | | | | |
Supplemental data | | | | | | | | | | | | | | | | | | | | |
Net assets, end of year (000’s) | | $ | 480,649 | | | $ | 205,768 | | | $ | 61,255 | | | $ | 19,779 | | | $ | 5,181 | |
Portfolio turnover rate | | | 47.33% | | | | 30.65% | | | | 30.28% | | | | 37.39% | | | | 53.01% | |
aThe amount shown for a share outstanding throughout the period may not correlate with the Statement of Operations for the period due to the timing of sales and repurchases of the Fund shares in relation to income earned and/or fluctuating market value of the investments of the Fund.
bBased on average daily shares outstanding.
cTotal return does not include any fees, charges or expenses imposed by the variable annuity and life insurance contracts for which the Franklin Templeton Variable Insurance Products Trust serves as an underlying investment vehicle.
dAmount rounds to less than $0.01 per share.
The accompanying notes are an integral part of these financial statements.
TGI-11
Franklin Templeton Variable Insurance Products Trust
Financial Highlights (continued)
Templeton Global Income Securities Fund
| | | | | | | | | | | | |
| | | Year Ended December 31, | |
| Class 3 | | 2007 | | | 2006 | | | 2005f | |
| | | | |
Per share operating performance | | | | | | | | | | | | |
(for a share outstanding throughout the year) | | | | | | | | | | | | |
Net asset value, beginning of year | | $ | 15.49 | | | $ | 14.18 | | | $ | 15.27 | |
| | | | |
Income from investment operationsa: | | | | | | | | | | | | |
Net investment incomeb | | | 0.72 | | | | 0.58 | | | | 0.38 | |
Net realized and unrealized gains (losses) | | | 0.95 | | | | 1.21 | | | | (0.50 | ) |
| | | | |
Total from investment operations | | | 1.67 | | | | 1.79 | | | | (0.12 | ) |
| | | | |
Less distributions from net investment income | | | (0.46 | ) | | | (0.48 | ) | | | (0.97 | ) |
| | | | |
Redemption fees | | | — | e | | | — | e | | | — | e |
| | | | |
Net asset value, end of year | | $ | 16.70 | | | $ | 15.49 | | | $ | 14.18 | |
| | | | |
| | | |
Total returnc | | | 11.03% | | | | 12.84% | | | | (0.80)% | |
Ratios to average net assetsd | | | | | | | | | | | | |
Expenses before expense reduction | | | 0.89% | | | | 1.05% | | | | 1.03% | |
Expenses net of expense reduction | | | 0.89% | | | | 0.97% | | | | 0.99% | |
Net investment income | | | 4.45% | | | | 3.84% | | | | 3.56% | |
Supplemental data | | | | | | | | | | | | |
Net assets, end of year (000’s) | | $ | 91,162 | | | $ | 35,572 | | | $ | 5,769 | |
Portfolio turnover rate | | | 47.33% | | | | 30.65% | | | | 30.28% | |
aThe amount shown for a share outstanding throughout the period may not correlate with the Statement of Operations for the period due to the timing of sales and repurchases of the Fund shares in relation to income earned and/or fluctuating market value of the investments of the Fund.
bBased on average daily shares outstanding.
cTotal return does not include any fees, charges or expenses imposed by the variable annuity and life insurance contracts for which the Franklin Templeton Variable Insurance Products Trust serves as an underlying investment vehicle. Total return is not annualized for periods less than one year.
dRatios are annualized for periods less than one year.
eAmount rounds to less than $0.01 per share.
fFor the period April 1, 2005 (effective date) to December 31, 2005.
The accompanying notes are an integral part of these financial statements.
TGI-12
Franklin Templeton Variable Insurance Products Trust
Statement of Investments, December 31, 2007
| | | | | | |
| Templeton Global Income Securities Fund | | Principal
Amounta | | | Value |
Government and Agency Securities 68.6% | | | | | | |
Argentina 1.7% | | | | | | |
b,cGovernment of Argentina, FRN, 5.389%, 8/03/12 | | 21,792,000 | | | $ | 11,849,340 |
| | | | | | |
Australia 1.1% | | | | | | |
New South Wales Treasury Corp., 8.00%, 3/01/08 | | 5,990,000 | AUD | | | 5,255,486 |
Queensland Treasury Corp., 6.00%, 7/14/09 | | 3,195,000 | AUD | | | 2,756,996 |
| | | | | | |
| | | | | | 8,012,482 |
| | | | | | |
Austria 0.1% | | | | | | |
Government of Austria, 5.00%, 7/15/12 | | 400,000 | EUR | | | 602,618 |
| | | | | | |
Belgium 0.2% | | | | | | |
Government of Belgium, 7.50%, 7/29/08 | | 686,000 | EUR | | | 1,019,949 |
| | | | | | |
Brazil 5.1% | | | | | | |
Nota Do Tesouro Nacional, | | | | | | |
9.762%, 1/01/12 | | 20,470 | d BRL | | | 10,511,467 |
9.762%, 1/01/14 | | 7,100 | d BRL | | | 3,506,031 |
9.762%, 1/01/17 | | 22,490 | d BRL | | | 10,654,128 |
eIndex Linked, 6.00%, 5/15/15 | | 2,750 | d BRL | | | 2,391,221 |
eIndex Linked, 6.00%, 5/15/45 | | 10,825 | d BRL | | | 9,407,813 |
| | | | | | |
| | | | | | 36,470,660 |
| | | | | | |
Canada 3.1% | | | | | | |
Government of Canada, 4.25%, 12/01/08 | | 14,500,000 | CAD | | | 14,638,527 |
Province of Alberta, 5.00%, 12/16/08 | | 1,405,000 | CAD | | | 1,426,435 |
Province of Manitoba, 6.375%, 9/01/15 | | 1,638,000 | NZD | | | 1,154,776 |
Province of Ontario, | | | | | | |
3.875%, 3/08/08 | | 1,925,000 | CAD | | | 1,936,312 |
5.70%, 12/01/08 | | 2,200,000 | CAD | | | 2,246,422 |
6.25%, 6/16/15 | | 925,000 | NZD | | | 645,202 |
| | | | | | |
| | | | | | 22,047,674 |
| | | | | | |
France 0.0%f | | | | | | |
Government of France, 4.00%, 10/25/09 | | 195,000 | EUR | | | 284,124 |
| | | | | | |
Germany 4.7% | | | | | | |
bKfW Bankengruppe, FRN, 0.658%, 8/08/11 | | 3,725,000,000 | JPY | | | 33,421,349 |
| | | | | | |
Indonesia 5.1% | | | | | | |
Government of Indonesia, | | | | | | |
14.275%, 12/15/13 | | 14,267,000,000 | IDR | | | 1,834,165 |
11.50%, 9/15/19 | | 30,075,000,000 | IDR | | | 3,484,105 |
11.00%, 11/15/20 | | 31,230,000,000 | IDR | | | 3,459,725 |
12.80%, 6/15/21 | | 74,215,000,000 | IDR | | | 9,201,435 |
12.90%, 6/15/22 | | 10,710,000,000 | IDR | | | 1,331,812 |
10.25%, 7/15/22 | | 52,500,000,000 | IDR | | | 5,519,698 |
11.75%, 8/15/23 | | 5,491,000,000 | IDR | | | 629,893 |
10.00%, 9/15/24 | | 5,000,000,000 | IDR | | | 502,416 |
11.00%, 9/15/25 | | 39,400,000,000 | IDR | | | 4,292,267 |
12.00%, 9/15/26 | | 8,230,000,000 | IDR | | | 985,760 |
10.25%, 7/15/27 | | 48,220,000,000 | IDR | | | 5,005,535 |
| | | | | | |
| | | | | | 36,246,811 |
| | | | | | |
Iraq 0.9% | | | | | | |
gGovernment of Iraq, Reg S, 5.80%, 1/15/28 | | 9,300,000 | | | | 6,184,500 |
| | | | | | |
TGI-13
Franklin Templeton Variable Insurance Products Trust
Statement of Investments, December 31, 2007 (continued)
| | | | | | |
| Templeton Global Income Securities Fund | | Principal
Amounta | | | Value |
Government and Agency Securities (continued) | | | | | | |
Malaysia 4.0% | | | | | | |
Government of Malaysia, | | | | | | |
6.45%, 7/01/08 | | 14,772,000 | MYR | | $ | 4,531,864 |
3.917%, 9/30/08 | | 400,000 | MYR | | | 121,211 |
4.305%, 2/27/09 | | 4,210,000 | MYR | | | 1,284,705 |
7.00%, 3/15/09 | | 12,234,000 | MYR | | | 3,851,174 |
6.844%, 10/01/09 | | 2,800,000 | MYR | | | 894,663 |
3.756%, 4/28/11 | | 57,160,000 | MYR | | | 17,380,607 |
| | | | | | |
| | | | | | 28,064,224 |
| | | | | | |
Mexico 3.5% | | | | | | |
Government of Mexico, | | | | | | |
h144A, 7.50%, 3/08/10 | | 450,000 | EUR | | | 695,322 |
8.00%, 12/17/15 | | 726,000i | MXN | | | 6,586,004 |
10.00%, 12/05/24 | | 1,655,000i | MXN | | | 17,649,089 |
| | | | | | |
| | | | | | 24,930,415 |
| | | | | | |
New Zealand 0.3% | | | | | | |
Government of New Zealand, 7.00%, 7/15/09 | | 2,435,000 | NZD | | | 1,856,583 |
| | | | | | |
Norway 2.0% | | | | | | |
Government of Norway, 5.50%, 5/15/09 | | 76,360,000 | NOK | | | 14,204,154 |
| | | | | | |
Peru 0.6% | | | | | | |
Government of Peru, | | | | | | |
7, 8.60%, 8/12/17 | | 6,185,000 | PEN | | | 2,397,085 |
7.84%, 8/12/20 | | 4,945,000 | PEN | | | 1,856,671 |
| | | | | | |
| | | | | | 4,253,756 |
| | | | | | |
Philippines 0.1% | | | | | | |
gGovernment of the Philippines, Reg S, 9.125%, 2/22/10 | | 330,000 | EUR | | | 513,635 |
| | | | | | |
Poland 3.0% | | | | | | |
Government of Poland, | | | | | | |
6.00%, 5/24/09 | | 4,045,000 | PLN | | | 1,633,414 |
5.75%, 9/23/22 | | 48,750,000 | PLN | | | 19,621,238 |
| | | | | | |
| | | | | | 21,254,652 |
| | | | | | |
Singapore 3.6% | | | | | | |
Government of Singapore, | | | | | | |
1.50%, 4/01/08 | | 350,000 | SGD | | | 242,605 |
5.625%, 7/01/08 | | 8,370,000 | SGD | | | 5,912,529 |
4.375%, 1/15/09 | | 27,640,000 | SGD | | | 19,664,495 |
| | | | | | |
| | | | | | 25,819,629 |
| | | | | | |
South Africa 0.1% | | | | | | |
Government of South Africa, 5.25%, 5/16/13 | | 200,000 | EUR | | | 288,951 |
| | | | | | |
South Korea 10.9% | | | | | | |
Korea Treasury Bond, | | | | | | |
4.75%, 3/10/12 | | 2,184,000,000 | KRW | | | 2,247,021 |
5.25%, 9/10/12 | | 14,139,000,000 | KRW | | | 14,788,929 |
5.00%, 9/10/16 | | 2,806,000,000 | KRW | | | 2,853,143 |
5.50%, 9/10/17 | | 39,555,600,000 | KRW | | | 41,647,581 |
5.25%, 3/10/27 | | 9,463,500,000 | KRW | | | 9,647,831 |
Korea Treasury Note, 4.75%, 6/10/09 | | 5,925,000,000 | KRW | | | 6,240,303 |
| | | | | | |
| | | | | | 77,424,808 |
| | | | | | |
TGI-14
Franklin Templeton Variable Insurance Products Trust
Statement of Investments, December 31, 2007 (continued)
| | | | | | |
| Templeton Global Income Securities Fund | | Principal
Amounta | | | Value |
Government and Agency Securities (continued) | | | | | | |
Spain 0.1% | | | | | | |
Government of Spain, 6.00%, 1/31/08 | | 390,000 | EUR | | $ | 569,976 |
| | | | | | |
jSupranational 6.3% | | | | | | |
European Bank For Reconstruction & Development, senior note, 5.10%, 6/12/09 | | 40,000,000 | PLN | | | 16,111,143 |
bEuropean Investment Bank, senior note, FRN, 0.75%, 9/21/11 | | 1,340,000,000 | JPY | | | 12,019,673 |
Inter-American Development Bank,
6.00%, 12/15/17 | | 575,000 | NZD | | | 395,615 |
senior note, 7.50%, 12/05/24 | | 200,000,000 | MXN | | | 16,268,205 |
| | | | | | |
| | | | | | 44,794,636 |
| | | | | | |
Sweden 11.9% | | | | | | |
Government of Sweden,
6.50%, 5/05/08 | | 151,000,000 | SEK | | | 23,520,801 |
5.00%, 1/28/09 | | 363,050,000 | SEK | | | 56,623,604 |
kStrip, 9/17/08 | | 30,000,000 | SEK | | | 4,506,658 |
| | | | | | |
| | | | | | 84,651,063 |
| | | | | | |
United States 0.2% | | | | | | |
FNMA, 1.75%, 3/26/08 | | 180,000,000 | JPY | | | 1,617,241 |
| | | | | | |
Total Government and Agency Securities (Cost $470,307,729) | | | | | | 486,383,230 |
| | | | | | |
Short Term Investments 26.7% | | | | | | |
Government and Agency Securities 12.7% | | | | | | |
Egypt 4.6% | | | | | | |
k,lEgypt Treasury Bills, 1/01/08 – 12/30/08 | | 185,275,000 | EGP | | | 32,231,090 |
| | | | | | |
Malaysia 5.5% | | | | | | |
Government of Malaysia,
3.546%, 1/11/08 | | 8,890,000 | MYR | | | 2,688,345 |
3.569%, 2/14/08 | | 17,280,000 | MYR | | | 5,225,280 |
7.60%, 3/15/08 | | 5,000,000 | MYR | | | 1,524,493 |
3.17%, 5/15/08 | | 16,610,000 | MYR | | | 5,016,521 |
3.541%, 7/08/08 | | 6,100,000 | MYR | | | 1,844,572 |
3.562%, 7/15/08 | | 10,550,000 | MYR | | | 3,190,439 |
kMalaysia Treasury Bills, 1/04/08 – 9/23/08 | | 66,235,000 | MYR | | | 19,796,132 |
| | | | | | |
| | | | | | 39,285,782 |
| | | | | | |
Norway 2.0% | | | | | | |
kNorway Treasury Bills, 3/19/08 – 6/18/08 | | 77,955,000 | NOK | | | 14,113,514 |
| | | | | | |
Sweden 0.6% | | | | | | |
kGovernment of Sweden, Strip, 6/18/08 | | 30,000,000 | SEK | | | 4,552,732 |
| | | | | | |
Total Government and Agency Securities (Cost $86,747,759) | | | | | | 90,183,118 |
| | | | | | |
Total Investment before Repurchase Agreement (Cost $557,055,488) | | | | | | 576,566,348 |
| | | | | | |
United States 14.0% | | | | | | |
Repurchase Agreement (Cost $99,770,604) 14.0% | | | | | | |
mJoint Repurchase Agreement, 3.773%, 1/02/08 (Maturity Value $99,791,515) | | 99,770,604 | | | | 99,770,604 |
ABN AMRO Bank NV, New York Branch (Maturity Value $9,819,485) | | | | | | |
Banc of America Securities LLC (Maturity Value $9,819,485) | | | | | | |
TGI-15
Franklin Templeton Variable Insurance Products Trust
Statement of Investments, December 31, 2007 (continued)
| | | |
| Templeton Global Income Securities Fund | | Value |
United States (continued) | | | |
Repurchase Agreement (continued) | | | |
Barclays Capital Inc. (Maturity Value $4,522,551) | | | |
BNP Paribas Securities Corp. (Maturity Value $9,819,485) | | | |
Credit Suisse Securities (USA) LLC (Maturity Value $2,583,602) | | | |
Deutsche Bank Securities Inc. (Maturity Value $9,819,485) | | | |
Dresdner Kleinwort Wasserstein Securities LLC (Maturity Value $9,819,485) | | | |
Goldman, Sachs & Co. (Maturity Value $11,886,167) | | | |
Greenwich Capital Markets Inc. (Maturity Value $9,819,485) | | | |
Lehman Brothers Inc. (Maturity Value $12,062,800) | | | |
Merrill Lynch Government Securities Inc. (Maturity Value $9,819,485) | | | |
Collateralized by U.S. Government Agency Securities, 3.00% - 6.25%, 1/15/08 - 11/14/12;
kU.S. Government Agency Discount Notes, 1/02/08 - 8/01/12; kU.S. Treasury Bill, 6/12/08;
and U.S. Treasury Notes, 3.25% - 4.625%, 3/31/08 - 8/15/10 | | | |
| | | |
Total Investments (Cost $656,826,092) 95.3% | | | 676,336,952 |
Net Unrealized Gain on Forward Exchange Contracts 0.5% | | | 3,595,078 |
Other Assets, less Liabilities 4.2% | | | 29,579,498 |
| | | |
Net Assets 100.0% | | $ | 709,511,528 |
| | | |
Currency Abbreviations
AUD - Australian Dollar
BRL - Brazilian Real
CAD - Canadian Dollar
EGP - Egyptian Pound
EUR - Euro
IDR - Indonesian Rupiah
JPY - Japanese Yen
KRW - South Korean Won
MXN - Mexican Peso
MYR - Malaysian Ringgit
NOK - Norwegian Krone
NZD - New Zealand Dollar
PEN - Peruvian Nuevo Sol
PLN - Polish Zloty
SEK - Swedish Krona
SGD - Singapore Dollar
Selected Portfolio Abbreviations
FNMA - Federal National Mortgage Association
FRN - Floating Rate Note
aThe principal amount is stated in U.S. dollars unless otherwise indicated.
bThe coupon rate shown represents the rate at period end.
cThe principal amount is stated in original face, and scheduled paydowns are reflected in the market price on ex-date.
dPrincipal amount is stated in 1,000 Brazilian Real units.
ePrincipal amount of security is adjusted for inflation. See Note 1(g).
fRounds to less than 0.1% of net assets.
gSecurity was purchased pursuant to Regulation S under the Securities Act of 1933, which exempts from registration securities offered and sold outside of the United States. Such a security cannot be sold in the United States without either an effective registration statement filed pursuant to the Securities Act of 1933, or pursuant to an exemption from registration. These securities have been deemed liquid under guidelines approved by the Trust’s Board of Trustees. At December 31, 2007, the aggregate value of these securities was $6,698,135, representing 0.94% of net assets.
hSecurity was purchased pursuant to Rule 144A under the Securities Act of 1933 and may be sold in transactions exempt from registration only to qualified institutional buyers or in a public offering registered under the Securities Act of 1933. This security has been deemed liquid under guidelines approved by the Trust’s Board of Trustees. At December 31, 2007, the value of this security was $695,322, representing 0.10% of net assets.
iPrincipal amount is stated in 100 Mexican Peso units.
jA supranational organization is an entity formed by two or more central governments through international treaties.
kThe security is traded on a discount basis with no stated coupon rate.
lA portion or all of the securities purchased on a when-issued or delayed delivery basis. See Note 1(d).
mSee Note 1(c) regarding joint repurchase agreement.
The accompanying notes are an integral part of these financial statements.
TGI-16
Franklin Templeton Variable Insurance Products Trust
Financial Statements
Statement of Assets and Liabilities
December 31, 2007
| | | | |
| | | Templeton
Global Income
Securities Fund | |
Assets: | | | | |
Investments in securities: | | | | |
Cost - Unaffiliated issuers | | $ | 557,055,488 | |
Cost - Repurchase agreement | | | 99,770,604 | |
| | | | |
Total cost of investments | | $ | 656,826,092 | |
| | | | |
Value - Unaffiliated issuers | | $ | 576,566,348 | |
Value - Repurchase agreement | | | 99,770,604 | |
| | | | |
Total value of investments | | | 676,336,952 | |
Foreign currency, at value (cost $21,899,060) | | | 23,012,645 | |
Receivables: | | | | |
Capital shares sold | | | 1,309,564 | |
Interest | | | 11,108,000 | |
Unrealized gain on forward exchange contracts (Note 7) | | | 5,049,276 | |
| | | | |
Total assets | | | 716,816,437 | |
| | | | |
Liabilities: | | | | |
Payables: | | | | |
Investment securities purchased | | | 4,969,036 | |
Capital shares redeemed | | | 92,398 | |
Affiliates | | | 515,344 | |
Unrealized loss on forward exchange contracts (Note 7) | | | 1,454,198 | |
Accrued expenses and other liabilities | | | 273,933 | |
| | | | |
Total liabilities | | | 7,304,909 | |
| | | | |
Net assets, at value | | $ | 709,511,528 | |
| | | | |
Net assets consist of: | | | | |
Paid-in capital | | $ | 653,607,990 | |
Undistributed net investment income | | | 35,686,615 | |
Net unrealized appreciation (depreciation) | | | 24,416,313 | |
Accumulated net realized gain (loss) | | | (4,199,390 | ) |
| | | | |
Net assets, at value | | $ | 709,511,528 | |
| | | | |
Class 1: | | | | |
Net assets, at value | | $ | 137,700,254 | |
| | | | |
Shares outstanding | | | 8,102,207 | |
| | | | |
Net asset value and maximum offering price per share | | $ | 17.00 | |
| | | | |
Class 2: | | | | |
Net assets, at value | | $ | 480,648,788 | |
| | | | |
Shares outstanding | | | 28,745,875 | |
| | | | |
Net asset value and maximum offering price per share | | $ | 16.72 | |
| | | | |
Class 3: | | | | |
Net assets, at value | | $ | 91,162,486 | |
| | | | |
Shares outstanding | | | 5,457,279 | |
| | | | |
Net asset value and maximum offering price per sharea | | $ | 16.70 | |
| | | | |
aRedemption | price is equal to net asset value less any redemption fees retained by the Fund. |
The accompanying notes are an integral part of these financial statements.
TGI-17
Franklin Templeton Variable Insurance Products Trust
Financial Statements (continued)
Statement of Operations
for the year ended December 31, 2007
| | | | |
| | | Templeton
Global Income
Securities Fund | |
Investment income: | | | | |
Interest (net of foreign taxes of $688,223) | | $ | 25,268,490 | |
| | | | |
Expenses: | | | | |
Management fees (Note 3a) | | | 2,376,316 | |
Distribution fees: (Note 3c) | | | | |
Class 2 | | | 802,153 | |
Class 3 | | | 154,518 | |
Unaffiliated transfer agent fees | | | 6,765 | |
Custodian fees (Note 4) | | | 459,998 | |
Reports to shareholders | | | 132,349 | |
Professional fees | | | 36,546 | |
Trustees’ fees and expenses | | | 1,697 | |
Other | | | 21,230 | |
| | | | |
Total expenses | | | 3,991,572 | |
Expense reductions (Note 4) | | | (5,199 | ) |
| | | | |
Net expenses | | | 3,986,373 | |
| | | | |
Net investment income | | | 21,282,117 | |
| | | | |
Realized and unrealized gains (losses): | | | | |
Net realized gain (loss) from: | | | | |
Investments | | | 18,145,387 | |
Foreign currency transactions | | | (262,750 | ) |
| | | | |
Net realized gain (loss) | | | 17,882,637 | |
| | | | |
Net change in unrealized appreciation (depreciation) on:
Investments | | | 7,705,155 | |
Translation of assets and liabilities denominated in foreign currencies | | | 1,209,672 | |
| | | | |
Net change in unrealized appreciation (depreciation) | | | 8,914,827 | |
| | | | |
Net realized and unrealized gain (loss) | | | 26,797,464 | |
| | | | |
Net increase (decrease) in net assets resulting from operations | | $ | 48,079,581 | |
| | | | |
The accompanying notes are an integral part of these financial statements.
TGI-18
Franklin Templeton Variable Insurance Products Trust
Financial Statements (continued)
Statements of Changes in Net Assets
| | | | | | | | |
| | | Templeton Global Income
Securities Fund | |
| | Year Ended December 31, | |
| | 2007 | | | 2006 | |
| | | | |
Increase (decrease) in net assets: | | | | | | | | |
Operations: | | | | | | | | |
Net investment income | | $ | 21,282,117 | | | $ | 7,811,021 | |
Net realized gain (loss) from investments and foreign currency transactions | | | 17,882,637 | | | | 4,248,556 | |
Net change in unrealized appreciation (depreciation) on investments and translation of assets and
liabilities denominated in foreign currencies | | | 8,914,827 | | | | 12,273,367 | |
| | | | |
Net increase (decrease) in net assets resulting from operations | | | 48,079,581 | | | | 24,332,944 | |
| | | | |
Distributions to shareholders from net investment income: | | | | | | | | |
Class 1 | | | (2,456,235 | ) | | | (2,013,759 | ) |
Class 2 | | | (8,266,690 | ) | | | (3,259,404 | ) |
Class 3 | | | (1,628,484 | ) | | | (431,514 | ) |
| | | | |
Total distributions to shareholders | | | (12,351,409 | ) | | | (5,704,677 | ) |
| | | | |
Capital share transactions: (Note 2) | | | | | | | | |
Class 1 | | | 55,559,172 | | | | 16,986,934 | |
Class 2 | | | 250,108,969 | | | | 133,487,737 | |
Class 3 | | | 50,922,791 | | | | 27,934,695 | |
| | | | |
Total capital share transactions | | | 356,590,932 | | | | 178,409,366 | |
| | | | |
Redemption fees | | | 9,428 | | | | 6,342 | |
| | | | |
Net increase (decrease) in net assets | | | 392,328,532 | | | | 197,043,975 | |
Net assets: | | | | | | | | |
Beginning of year | | | 317,182,996 | | | | 120,139,021 | |
| | | | |
End of year | | $ | 709,511,528 | | | $ | 317,182,996 | |
| | | | |
Undistributed net investment income included in net assets: | | | | | | | | |
End of year | | $ | 35,686,615 | | | $ | 9,842,829 | |
| | | | |
The accompanying notes are an integral part of these financial statements.
TGI-19
Franklin Templeton Variable Insurance Products Trust
Notes to Financial Statements
Templeton Global Income Securities Fund
1. ORGANIZATION AND SIGNIFICANT ACCOUNTING POLICIES
Franklin Templeton Variable Insurance Products Trust (Trust) is registered under the Investment Company Act of 1940, as amended, (1940 Act) as an open-end investment company, consisting of twenty-three separate funds. The Templeton Global Income Securities Fund (Fund) included in this report is non-diversified. The financial statements of the remaining funds in the Trust are presented separately. Shares of the Fund are sold only to insurance company separate accounts to fund the benefits of variable life insurance policies or variable annuity contracts. The Fund offers three classes of shares: Class 1, Class 2, and Class 3. Each class of shares differs by its distribution fees, voting rights on matters affecting a single class and its exchange privilege.
The following summarizes the Fund’s significant accounting policies.
a. Security Valuation
Securities listed on a securities exchange or on the NASDAQ National Market System are valued at the last quoted sale price or the official closing price of the day, respectively. Over-the-counter securities and listed securities for which there is no reported sale are valued within the range of the most recent quoted bid and ask prices. Securities that trade in multiple markets or on multiple exchanges are valued according to the broadest and most representative market.
Corporate debt securities and government securities generally trade in the over-the-counter market rather than on a securities exchange. The Trust may utilize independent pricing services, quotations from bond dealers, and information with respect to bond and note transactions, to assist in determining a current market value for each security. The Trust’s pricing services may use valuation models or matrix pricing which considers information with respect to comparable bond and note transactions, quotations from bond dealers, or by reference to other securities that are considered comparable in such characteristics as rating, interest rate and maturity date, option adjusted spread models, prepayment projections, interest rate spreads and yield curves, to determine current value.
Foreign securities are valued as of the close of trading on the foreign stock exchange on which the security is primarily traded, or the NYSE, whichever is earlier. If no sale is reported at that time, the foreign security will be valued within the range of the most recent quoted bid and ask prices. The value is then converted into its U.S. dollar equivalent at the foreign exchange rate in effect at the close of the NYSE on the day that the value of the foreign security is determined.
The Trust has procedures to determine the fair value of individual securities and other assets for which market prices are not readily available or which may not be reliably priced. Methods for valuing these securities may include: fundamental analysis, matrix pricing, discounts from market prices of similar securities, or discounts applied due to the nature and duration of restrictions on the disposition of the securities. Due to the inherent uncertainty of valuations of such securities, the fair values may differ significantly from the values that would have been used had a ready market for such investments existed. Occasionally, events occur between the time at which trading in a security is completed and the close of the NYSE that might call into question the availability (including the reliability) of the value of a portfolio security held by the Fund. The investment manager monitors price movements following the close of trading in foreign stock markets through a series of country specific market proxies (such as baskets of American Depository Receipts, futures contracts and exchange traded funds). These price movements are measured against established trigger thresholds for each specific market proxy to assist in determining if an event has occurred. If such an event occurs, the securities may be valued using fair value procedures, which may include the use of independent pricing services. All security valuation procedures are approved by the Trust’s Board of Trustees.
b. Foreign Currency Translation
Portfolio securities and other assets and liabilities denominated in foreign currencies are translated into U.S. dollars based on the exchange rate of such currencies against U.S. dollars on the date of valuation. Purchases and sales of securities, income and expense items denominated in foreign currencies are translated into U.S. dollars at the exchange rate in effect on the transaction
TGI-20
Franklin Templeton Variable Insurance Products Trust
Notes to Financial Statements (continued)
Templeton Global Income Securities Fund
1. ORGANIZATION AND SIGNIFICANT ACCOUNTING POLICIES (continued)
b. Foreign Currency Translation (continued)
date. Occasionally, events may impact the availability or reliability of foreign exchange rates used to convert the U.S. dollar equivalent value. If such an event occurs, the foreign exchange rate will be valued at fair value using procedures established and approved by the Trust’s Board of Trustees.
The Fund does not separately report the effect of changes in foreign exchange rates from changes in market prices on securities held. Such changes are included in net realized and unrealized gain or loss from investments on the Statement of Operations.
Realized foreign exchange gains or losses arise from sales of foreign currencies, currency gains or losses realized between the trade and settlement dates on securities transactions and the difference between the recorded amounts of dividends, interest, and foreign withholding taxes and the U.S. dollar equivalent of the amounts actually received or paid. Net unrealized foreign exchange gains and losses arise from changes in foreign exchange rates on foreign denominated assets and liabilities other than investments in securities held at the end of the reporting period.
c. Joint Repurchase Agreement
The Fund may enter into a joint repurchase agreement whereby its uninvested cash balance is deposited into a joint cash account with other funds managed by the investment manager or an affiliate of the investment manager and is used to invest in one or more repurchase agreements. The value and face amount of the joint repurchase agreement are allocated to the funds based on their pro-rata interest. A repurchase agreement is accounted for as a loan by the fund to the seller, collateralized by securities which are delivered to the fund’s custodian. The market value, including accrued interest, of the initial collateralization is required to be at least 102% of the dollar amount invested by the funds, with the value of the underlying securities marked to market daily to maintain coverage of at least 100%. The joint repurchase agreement held by the Fund at year end had been entered into on December 31, 2007. The joint repurchase agreement is valued at cost.
d. Securities Purchased on a When-Issued or Delayed Delivery Basis
The Fund may purchase securities on a when-issued or delayed delivery basis, with payment and delivery scheduled for a future date. These transactions are subject to market fluctuations and are subject to the risk that the value at delivery may be more or less than the trade date purchase price. Although the Fund will generally purchase these securities with the intention of holding the securities, it may sell the securities before the settlement date. Sufficient assets have been segregated for these securities.
e. Foreign Currency Contracts
When the Fund purchases or sells foreign securities it may enter into foreign exchange contracts to minimize foreign exchange risk from the trade date to the settlement date of the transactions. A foreign exchange contract is an agreement between two parties to exchange different currencies at an agreed upon exchange rate at a future date. Realized and unrealized gains and losses on these contracts are included in the Statement of Operations.
The Fund may also enter into forward exchange contracts to hedge against fluctuations in foreign exchange rates. These contracts are valued daily by the Fund and the unrealized gains or losses on the contracts, as measured by the difference between the contractual forward foreign exchange rates and the forward rates at the reporting date, are included in the Statement of Assets and Liabilities. Realized and unrealized gains and losses on these contracts are included in the Statement of Operations.
The risks of these contracts include movement in the values of the foreign currencies relative to the U.S. dollar and the possible inability of the counterparties to fulfill their obligations under the contracts, which may be in excess of the amount reflected in the Statement of Assets and Liabilities.
TGI-21
Franklin Templeton Variable Insurance Products Trust
Notes to Financial Statements (continued)
Templeton Global Income Securities Fund
1. ORGANIZATION AND SIGNIFICANT ACCOUNTING POLICIES (continued)
f. Income Taxes
No provision has been made for U.S. income taxes because it is the Fund’s policy to qualify as a regulated investment company under the Internal Revenue Code and to distribute to shareholders substantially all of its taxable income and net realized gains.
Foreign securities held by the Fund may be subject to foreign taxation on dividend and interest income received. Foreign taxes, if any, are recorded based on the tax regulations and rates that exist in the foreign markets in which the Fund invests.
g. Security Transactions, Investment Income, Expenses and Distributions
Security transactions are accounted for on trade date. Realized gains and losses on security transactions are determined on a specific identification basis. Interest income and estimated expenses are accrued daily. Amortization of premium and accretion of discount on debt securities are included in interest income. Distributions to shareholders are recorded on the ex-dividend date and are determined according to income tax regulations (tax basis). Distributable earnings determined on a tax basis may differ from earnings recorded in accordance with accounting principles generally accepted in the United States of America. These differences may be permanent or temporary. Permanent differences are reclassified among capital accounts to reflect their tax character. These reclassifications have no impact on net assets or the results of operations. Temporary differences are not reclassified, as they may reverse in subsequent periods.
Common expenses incurred by the Trust are allocated among the funds based on the ratio of net assets of each fund to the combined net assets of the Trust. Fund specific expenses are charged directly to the fund that incurred the expense.
Realized and unrealized gains and losses and net investment income, other than class specific expenses, are allocated daily to each class of shares based upon the relative proportion of net assets of each class. Differences in per share distributions, by class, are generally due to differences in class specific expenses.
Inflation-indexed bonds provide an inflation hedge through periodic increases in the security’s interest accruals and principal redemption value, by amounts corresponding to the current rate of inflation. Any such adjustments, including adjustments to principal redemption value, are recorded as interest income.
h. Accounting Estimates
The preparation of financial statements in accordance with accounting principles generally accepted in the United States of America requires management to make estimates and assumptions that affect the reported amounts of assets and liabilities at the date of the financial statements and the amounts of income and expenses during the reporting period. Actual results could differ from those estimates.
i. Redemption Fees
Redemptions and exchanges of Class 3 shares held 60 days or less may be subject to the fund’s redemption fee, which is 1% of the amount redeemed. Such fees are retained by the fund and accounted for as an addition to paid-in capital.
j. Guarantees and Indemnifications
Under the Trust’s organizational documents, its officers and trustees are indemnified by the Trust against certain liabilities arising out of the performance of their duties to the Trust. Additionally, in the normal course of business, the Trust, on behalf of the Fund, enters into contracts with service providers that contain general indemnification clauses. The Trust’s maximum exposure under these arrangements is unknown as this would involve future claims that may be made against the Trust that have not yet occurred. Currently, the Trust expects the risk of loss to be remote.
TGI-22
Franklin Templeton Variable Insurance Products Trust
Notes to Financial Statements (continued)
Templeton Global Income Securities Fund
2. SHARES OF BENEFICIAL INTEREST
At December 31, 2007, there were an unlimited number of shares authorized (without par value). Transactions in the Fund’s shares were as follows:
| | | | | | | | | | | | | | |
| | | Year Ended December 31, | |
| | | 2007 | | | 2006 | |
| Class 1 Shares: | | Shares | | | Amount | | | Shares | | | Amount | |
Shares sold | | 5,103,718 | | | $ | 85,032,506 | | | 2,027,528 | | | $ | 30,612,502 | |
Shares issued in reinvestment of distributions | | 153,227 | | | | 2,456,235 | | | 137,929 | | | | 2,013,759 | |
Shares redeemed | | (1,977,376 | ) | | | (31,929,569 | ) | | (1,040,680 | ) | | | (15,639,327 | ) |
| | | | |
Net increase (decrease) | | 3,279,569 | | | $ | 55,559,172 | | | 1,124,777 | | | $ | 16,986,934 | |
| | | | |
Class 2 Shares: | | | | | | | | | | | | | | |
Shares sold | | 16,336,797 | | | $ | 264,154,676 | | | 8,960,584 | | | $ | 133,647,009 | |
Shares issued in reinvestment of distributions | | 523,540 | | | | 8,266,690 | | | 226,190 | | | | 3,259,404 | |
Shares redeemed | | (1,388,223 | ) | | | (22,312,397 | ) | | (230,816 | ) | | | (3,418,676 | ) |
| | | | |
Net increase (decrease) | | 15,472,114 | | | $ | 250,108,969 | | | 8,955,958 | | | $ | 133,487,737 | |
| | | | |
Class 3 Shares: | | | | | | | | | | | | | | |
Shares sold | | 3,533,597 | | | $ | 56,987,401 | | | 2,255,932 | | | $ | 33,481,415 | |
Shares issued in reinvestment of distributions | | 103,199 | | | | 1,628,484 | | | 29,966 | | | | 431,514 | |
Shares redeemed | | (475,906 | ) | | | (7,693,094 | ) | | (396,229 | ) | | | (5,978,234 | ) |
| | | | |
Net increase (decrease) | | 3,160,890 | | | $ | 50,922,791 | | | 1,889,669 | | | $ | 27,934,695 | |
| | | | |
3. TRANSACTIONS WITH AFFILIATES
Franklin Resources, Inc. is the holding company for various subsidiaries that together are referred to as Franklin Templeton Investments. Certain officers and trustees of the Trust are also officers and/or directors of the following subsidiaries:
| | |
| Subsidiary | | Affiliation |
Franklin Advisers, Inc. (Advisers) | | Investment manager |
Franklin Templeton Services, LLC (FT Services) | | Administrative manager |
Franklin Templeton Distributors, Inc. (Distributors) | | Principal underwriter |
Franklin Templeton Investor Services, LLC (Investor Services) | | Transfer agent |
a. Management Fees
The Fund pays an investment management fee to Advisers based on the average daily net assets of the Fund as follows:
| | |
| Annualized Fee Rate | | Net Assets |
| 0.625% | | Up to and including $100 million |
| 0.500% | | Over $100 million, up to and including $250 million |
| 0.450% | | Over $250 million, up to and including $10 billion |
| 0.440% | | Over $10 billion, up to and including $12.5 billion |
| 0.420% | | Over $12.5 billion, up to and including $15 billion |
| 0.400% | | In excess of $15 billion |
TGI-23
Franklin Templeton Variable Insurance Products Trust
Notes to Financial Statements (continued)
Templeton Global Income Securities Fund
3. TRANSACTIONS WITH AFFILIATES (continued)
Effective January 1, 2008, the Fund will pay fees based on the average daily net assets of the Fund as follows:
| | |
| Annualized Fee Rate | | Net Assets |
| 0.625% | | Up to and including $100 million |
| 0.500% | | Over $100 million, up to and including $250 million |
| 0.450% | | Over $250 million, up to and including $7.5 billion |
| 0.440% | | Over $7.5 billion, up to and including $10 billion |
| 0.430% | | Over $10 billion, up to and including $12.5 billion |
| 0.420% | | Over $12.5 billion, up to and including $15 billion |
| 0.400% | | In excess of $15 billion |
b. Administrative Fees
Under an agreement with Advisers, FT Services provides administrative services to the Fund. The fee is paid by Advisers based on average daily net assets, and is not an additional expense of the Fund.
c. Distribution Fees
The Fund’s Board of Trustees has adopted distribution plans for Class 2 and Class 3 shares pursuant to Rule 12b-1 under the 1940 Act. Under the Fund’s compensation distribution plans, the Fund pays Distributors for costs incurred in connection with the servicing, sale and distribution of the Fund’s shares up to 0.25% and 0.35% per year of its average daily net assets of Class 2 and Class 3, respectively. The Board of Trustees has agreed to limit the current rate to 0.25% per year for Class 3.
d. Transfer Agent Fees
Investor Services, under terms of an agreement, performs shareholder servicing for the Fund and is not paid by the Fund for the services.
4. EXPENSE OFFSET ARRANGEMENT
The Fund has entered into an arrangement with its custodian whereby credits realized as a result of uninvested cash balances are used to reduce a portion of the Fund’s custodian expenses. During the year ended December 31, 2007, the custodian fees were reduced as noted in the Statement of Operations.
5. INCOME TAXES
The Fund has reviewed the tax positions taken on federal income tax returns, for each of the three open tax years and as of December 31, 2007 and has determined that no provision for income tax is required in the Fund’s financial statements.
For tax purposes, capital losses may be carried over to offset future capital gains, if any. At December 31, 2007, the capital loss carryforwards were as follows:
| | | |
| Capital loss carryforwards expiring in: | | |
2008 | | $ | 2,370,518 |
2009 | | | 1,649,033 |
2010 | | | 177,731 |
| | | |
| | $ | 4,197,282 |
| | | |
During the year ended December 31, 2007, the Fund utilized $969,560 of capital loss carryforwards.
On December 31, 2007, the Fund had expired capital loss carryforwards of $1,600,297, which were reclassified to paid-in capital.
TGI-24
Franklin Templeton Variable Insurance Products Trust
Notes to Financial Statements (continued)
Templeton Global Income Securities Fund
5. INCOME TAXES (continued)
The tax character of distributions paid during the years ended December 31, 2007 and 2006, was as follows:
| | | | | | |
| | | 2007 | | 2006 |
Distributions paid from ordinary income | | $ | 12,351,409 | | $ | 5,704,677 |
| | | | | | |
At December 31, 2007, the cost of investments, net unrealized appreciation (depreciation) and undistributed ordinary income for income tax purposes were as follows:
| | | | |
Cost of investments | | $ | 658,663,346 | |
| | | | |
| |
Unrealized appreciation | | $ | 24,152,942 | |
Unrealized depreciation | | | (6,479,336 | ) |
| | | | |
Net unrealized appreciation (depreciation) | | $ | 17,673,606 | |
| | | | |
Distributable earnings – undistributed ordinary income | | $ | 39,667,569 | |
| | | | |
Net investment income differs for financial statement and tax purposes primarily due to differing treatments of foreign currency transactions, bond discounts and premiums and inflation related adjustments on foreign securities.
Net realized gains (losses) differ for financial statement and tax purposes primarily due to differing treatments of wash sales, foreign currency transactions, bond discounts and premiums and inflation related adjustments on foreign securities.
6. INVESTMENT TRANSACTIONS
Purchases and sales of investments (excluding short term securities) for the year ended December 31, 2007, aggregated $401,340,329 and $163,318,439, respectively.
7. FORWARD EXCHANGE CONTRACTS
At December 31, 2007, the Fund had the following forward exchange contracts outstanding:
| | | | | | | | | | | | | | |
| | | Contract
Amounta | | | Settlement
Date | | Unrealized
Gain | | Unrealized
(Loss) | |
| Contracts to Buy | | | | | | | | | | | | |
| 33,600,000 | | Japanese Yen | | 292,601 | | | 1/22/08 | | | 9,461 | | | — | |
| 64,500,000 | | Iceland Krona | | 1,000,698 | | | 1/28/08 | | $ | 18,959 | | $ | — | |
| 45,000,000 | | Norwegian Krone | | 8,047,498 | | | 1/28/08 | | | 226,339 | | | — | |
| 34,696,800 | | Japanese Yen | | 220,102 | EUR | | 1/31/08 | | | — | | | (9,148 | ) |
| 57,427,500 | | Kazakhstan Tenge | | 465,000 | | | 2/06/08 | | | 7,320 | | | — | |
| 49,956,750 | | Kazakhstan Tenge | | 405,000 | | | 2/06/08 | | | 5,876 | | | — | |
| 28,395,800 | | Kazakhstan Tenge | | 230,000 | | | 2/07/08 | | | 3,510 | | | — | |
| 88,025,000 | | Indian Rupee | | 2,945,260 | NZD | | 2/29/08 | | | — | | | (14,535 | ) |
| 773,199,000 | | Kazakhstan Tenge | | 6,300,000 | | | 3/25/08 | | | 4,752 | | | — | |
| 101,142,000 | | Japanese Yen | | 869,956 | | | 5/27/08 | | | 50,956 | | | — | |
| 531,699,750 | | Japanese Yen | | 4,500,000 | | | 6/30/08 | | | 356,576 | | | — | |
| 426,288,750 | | Japanese Yen | | 3,640,631 | | | 7/07/08 | | | 255,310 | | | — | |
| 433,331,250 | | Japanese Yen | | 3,698,786 | | | 7/17/08 | | | 264,709 | | | — | |
| 175,000,000 | | Japanese Yen | | 1,502,339 | | | 7/18/08 | | | 98,440 | | | — | |
| 293,932,800 | | Kazakhstan Tenge | | 2,400,000 | | | 7/25/08 | | | — | | | (66,153 | ) |
| 125,841,100 | | Japanese Yen | | 1,100,000 | | | 8/07/08 | | | 52,966 | | | — | |
TGI-25
Franklin Templeton Variable Insurance Products Trust
Notes to Financial Statements (continued)
Templeton Global Income Securities Fund
7. FORWARD EXCHANGE CONTRACTS (continued)
| | | | | | | | | | | | | | |
| | | Contract
Amounta | | | Settlement
Date | | Unrealized
Gain | | Unrealized
(Loss) | |
| Contracts to Buy | | | | | | | | | | |
| 154,044,450 | | Japanese Yen | | 1,350,000 | | | 8/08/08 | | $ | 61,481 | | $ | — | |
| 154,325,250 | | Japanese Yen | | 1,350,000 | | | 8/11/08 | | | 64,397 | | | — | |
| 144,838,200 | | Japanese Yen | | 1,300,000 | | | 8/20/08 | | | 28,413 | | | — | |
| 145,327,000 | | Japanese Yen | | 1,300,000 | | | 8/20/08 | | | 32,896 | | | — | |
| 143,907,400 | | Japanese Yen | | 1,300,000 | | | 8/25/08 | | | 20,409 | | | — | |
| 27,917,500 | | Japanese Yen | | 251,283 | | | 9/04/08 | | | 5,079 | | | — | |
| 422,114,000 | | Japanese Yen | | 2,800,000 | EUR | | 9/12/08 | | | — | | | (202,974 | ) |
| 25,000,000 | | Indian Rupee | | 868,538 | NZD | | 9/24/08 | | | — | | | (15,860 | ) |
| 167,701,600 | | Japanese Yen | | 1,520,000 | | | 9/25/08 | | | 22,597 | | | — | |
| 167,587,600 | | Japanese Yen | | 1,520,000 | | | 9/25/08 | | | 21,548 | | | — | |
| 334,510,300 | | Japanese Yen | | 3,020,000 | | | 9/26/08 | | | 57,230 | | | — | |
| 167,957,300 | | Japanese Yen | | 1,510,000 | | | 9/26/08 | | | 35,074 | | | — | |
| 361,308,750 | | Kazakhstan Tenge | | 2,850,000 | | | 10/10/08 | | | — | | | (21,766 | ) |
| 724,140,625 | | Chilean Peso | | 1,437,500 | | | 10/20/08 | | | 5,634 | | | — | |
| 724,284,375 | | Chilean Peso | | 1,437,500 | | | 10/20/08 | | | 5,921 | | | — | |
| 6,050,000 | | Swiss Franc | | 5,221,729 | | | 10/20/08 | | | 179,349 | | | — | |
| 646,280,000 | | Chilean Peso | | 1,280,000 | | | 10/22/08 | | | 7,895 | | | — | |
| 882,350,000 | | Chilean Peso | | 1,750,000 | | | 10/23/08 | | | 8,282 | | | — | |
| 6,729,255 | | Swiss Franc | | 5,850,000 | | | 10/23/08 | | | 157,794 | | | — | |
| 1,703,596 | | Swiss Franc | | 1,475,000 | | | 10/24/08 | | | 45,975 | | | — | |
| 1,699,532 | | Swiss Franc | | 1,475,000 | | | 10/27/08 | | | 42,428 | | | — | |
| 192,000,000 | | Kazakhstan Tenge | | 1,500,000 | | | 11/03/08 | | | — | | | (4,611 | ) |
| 3,423,150 | | Swiss Franc | | 3,000,000 | | | 11/03/08 | | | 56,737 | | | — | |
| 1,342,374,000 | | Japanese Yen | | 12,100,000 | | | 11/04/08 | | | 284,720 | | | — | |
| 5,200,000 | | Swiss Franc | | 4,705,137 | | | 11/06/08 | | | — | | | (61,498 | ) |
| 144,407,250 | | Japanese Yen | | 1,362,076 | | | 11/14/08 | | | — | | | (28,782 | ) |
| 2,670,000 | | Euro | | 9,865,650 | RON | | 12/03/08 | | | — | | | (47,260 | ) |
| 2,225,000 | | Euro | | 8,068,963 | RON | | 12/04/08 | | | 21,531 | | | — | |
| 345,000,000 | | Japanese Yen | | 3,124,123 | | | 12/04/08 | | | 65,984 | | | — | |
| 38,027,500 | | Japanese Yen | | 355,790 | | | 12/05/08 | | | — | | | (4,135 | ) |
| 186,512,000 | | Japanese Yen | | 1,745,027 | | | 12/05/08 | | | — | | | (20,281 | ) |
| 673,264,800 | | Kazakhstan Tenge | | 5,200,000 | | | 12/12/08 | | | 1,319 | | | — | |
| 280,943,000 | | Japanese Yen | | 2,600,000 | | | 12/15/08 | | | — | | | (69 | ) |
| 281,190,000 | | Japanese Yen | | 2,600,000 | | | 12/17/08 | | | 2,606 | | | — | |
| 142,890,000 | | Kazakhstan Tenge | | 1,100,000 | | | 12/22/08 | | | 1,616 | | | — | |
| | | | |
| Contracts to Sell | | | | | | | | | | |
| 35,571,270 | | Mexican Peso | | 143,000,063 | INR | | 1/22/08 | | | 370,549 | | | — | |
| 30,321,722 | | Mexican Peso | | 121,514,299 | INR | | 1/25/08 | | | 306,174 | | | — | |
| 19,609,025 | | Mexican Peso | | 78,255,696 | INR | | 2/27/08 | | | 191,227 | | | — | |
| 39,305,785 | | Mexican Peso | | 155,595,882 | INR | | 2/28/08 | | | 351,393 | | | — | |
| 10,166,171 | | Mexican Peso | | 40,344,448 | INR | | 3/03/08 | | | 93,598 | | | — | |
| 10,703,553 | | Mexican Peso | | 2,035,283 | BRL | | 4/22/08 | | | 153,032 | | | — | |
| 22,656,216 | | Mexican Peso | | 4,426,571,459 | COP | | 4/22/08 | | | 100,071 | | | — | |
| 2,329,569 | | New Zealand Dollar | | 74,243,350 | INR | | 4/28/08 | | | 114,116 | | | — | |
| 12,477,832 | | Mexican Peso | | 2,353,693,412 | COP | | 5/06/08 | | | 13,222 | | | — | |
| 12,494,827 | | Mexican Peso | | 2,368,373 | BRL | | 5/07/08 | | | 173,027 | | | — | |
| 9,640,135 | | Mexican Peso | | 447,379,362 | CLP | | 5/16/08 | | | 22,095 | | | — | |
| 6,597,015 | | Mexican Peso | | 302,613,010 | CLP | | 5/20/08 | | | 8,202 | | | — | |
TGI-26
Franklin Templeton Variable Insurance Products Trust
Notes to Financial Statements (continued)
Templeton Global Income Securities Fund
7. FORWARD EXCHANGE CONTRACTS (continued)
| | | | | | | | | | | | | | |
| | | Contract
Amounta | | | Settlement
Date | | Unrealized
Gain | | Unrealized
(Loss) | |
| Contracts to Sell | | | | | | | | | | |
| 7,962,312 | | Mexican Peso | | 365,240,813 | CLP | | 5/20/08 | | $ | 9,900 | | $ | — | |
| 30,000,000 | | Mexican Peso | | 113,235,000 | INR | | 5/21/08 | | | 139,020 | | | — | |
| 46,737,959 | | Mexican Peso | | 507,359,240 | KZT | | 5/27/08 | | | — | | | (152,042 | ) |
| 40,184,041 | | Mexican Peso | | 435,289,606 | KZT | | 5/29/08 | | | — | | | (139,067 | ) |
| 5,422,023 | | Mexican Peso | | 248,735,300 | CLP | | 6/12/08 | | | 7,585 | | | — | |
| 11,184,356 | | Mexican Peso | | 123,232,028 | KZT | | 6/25/08 | | | — | | | (25,521 | ) |
| 6,853,159 | | Mexican Peso | | 75,609,535 | KZT | | 6/25/08 | | | — | | | (14,842 | ) |
| 10,925,894 | | Mexican Peso | | 120,542,108 | KZT | | 6/25/08 | | | — | | | (23,671 | ) |
| 31,357,983 | | Mexican Peso | | 5,629,698,616 | COP | | 6/27/08 | | | — | | | (112,277 | ) |
| 23,073,608 | | Mexican Peso | | 6,530,985 | PEN | | 6/30/08 | | | 111,579 | | | — | |
| 2,017,928 | | Mexican Peso | | 91,755,188 | CLP | | 9/15/08 | | | 2,580 | | | — | |
| 22,711,151 | | Mexican Peso | | 1,037,699,748 | CLP | | 10/01/08 | | | 41,848 | | | — | |
| 23,225,918 | | Mexican Peso | | 1,057,613,091 | CLP | | 10/02/08 | | | 35,800 | | | — | |
| 2,888,971,900 | | South Korean Won | | 3,505,821 | CHF | | 11/13/08 | | | 17,945 | | | — | |
| 14,750,000 | | Romanian Lei | | 32,712,353 | NOK | | 11/17/08 | | | 53,822 | | | — | |
| 2,722,612,000 | | South Korean Won | | 3,359,632 | CHF | | 11/17/08 | | | 66,822 | | | — | |
| 5,797,680,000 | | South Korean Won | | 6,831,892 | CHF | | 11/25/08 | | | — | | | (144,886 | ) |
| 6,526,957,500 | | South Korean Won | | 7,700,789 | CHF | | 11/25/08 | | | — | | | (154,599 | ) |
| 2,307,240,000 | | South Korean Won | | 2,746,093 | CHF | | 11/26/08 | | | — | | | (33,255 | ) |
| 4,575,729,600 | | South Korean Won | | 5,432,165 | CHF | | 11/28/08 | | | — | | | (78,234 | ) |
| 1,819,958,400 | | South Korean Won | | 2,184,404 | CHF | | 11/28/08 | | | — | | | (9,849 | ) |
| 2,435,035,200 | | South Korean Won | | 2,944,527 | CHF | | 12/02/08 | | | 6,514 | | | — | |
| 7,728,240,000 | | South Korean Won | | 9,251,942 | CHF | | 12/03/08 | | | — | | | (62,570 | ) |
| 357,000 | | Euro | | 56,026,866 | JPY | | 12/08/08 | | | — | | | (1,305 | ) |
| 3,734,309,600 | | South Korean Won | | 4,513,743 | CHF | | 12/09/08 | | | 8,683 | | | — | |
| 2,671,578,000 | | South Korean Won | | 4,119,944 | SGD | | 12/10/08 | | | 27,503 | | | — | |
| 12,319,825 | | Romanian Lei | | 31,800,179 | SEK | | 12/15/08 | | | — | | | (5,008 | ) |
| 2,136,044,750 | | South Korean Won | | 2,610,663 | CHF | | 12/15/08 | | | 30,880 | | | — | |
| | | | | | | | | | | | | | |
| Unrealized gain (loss) on forward exchange contracts | | | | | | | | 5,049,276 | | | (1,454,198 | ) |
| | | | | | | | | | | | | | |
| Net unrealized gain (loss) on forward exchange contracts | | | | | | | $ | 3,595,078 | | | | |
| | | | | | | | | | | | | | |
aIn | U.S. dollars unless otherwise indicated. |
Currency Abbreviations
BRL - Brazilian Real
CHF - Swiss Franc
CLP - Chiliean Peso
COP - Colombian Peso
EUR - Euro
INR - Indian Rupee
JPY - Japanese Yen
KZT - Kazakhstan Tenge
MXN - Mexican Peso
NOK - Norwegian Krone
NZD - New Zealand Dollar
PEN - Peruvian Nuevo Sol
RON - Romanian Lei
SEK - Swedish Krona
SGD - Singapore Dollar
TGI-27
Franklin Templeton Variable Insurance Products Trust
Notes to Financial Statements (continued)
Templeton Global Income Securities Fund
8. CREDIT RISK
The Fund has 13.98% of its portfolio invested in below investment grade and comparable quality unrated high yield securities, which tend to be more sensitive to economic conditions than higher rated securities. The risk of loss due to default by the issuer may be significantly greater for the holders of high yielding securities because such securities are generally unsecured and are often subordinated to other creditors of the issuer.
9. CONCENTRATION OF RISK
Investing in foreign securities may include certain risks and considerations not typically associated with investing in U.S. securities, such as fluctuating currency values and changing local and regional economic, political and social conditions, which may result in greater market volatility. In addition, certain foreign securities may not be as liquid as U.S. securities.
10. REGULATORY AND LITIGATION MATTERS
As part of various investigations by a number of federal, state, and foreign regulators and governmental entities, including the Securities and Exchange Commission (“SEC”), relating to certain practices in the mutual fund industry, including late trading, market timing and marketing support payments to securities dealers who sell fund shares (“marketing support”), Franklin Resources, Inc. and certain of its subsidiaries (collectively, the “Company”), entered into settlements with certain of those regulators and governmental entities. Specifically, the Company entered into settlements with the SEC, among others, concerning market timing and marketing support.
On June 6, 2007, the SEC posted for public comment the proposed plan of distribution for the market timing settlement. Once the SEC approves the final plan of distribution, disbursements of settlement monies will be made promptly to individuals who were shareholders of the designated funds during the relevant period, in accordance with the terms and conditions of the settlement and plan.
In addition, the Company, as well as most of the mutual funds within Franklin Templeton Investments and certain current or former officers, Company directors, fund directors, and employees, have been named in private lawsuits (styled as shareholder class actions, or as derivative actions on behalf of either the named funds or Franklin Resources, Inc.). The lawsuits relate to the industry practices referenced above.
The Company and fund management believe that the claims made in each of the private lawsuits referenced above are without merit and intend to defend against them vigorously. The Company cannot predict with certainty the eventual outcome of these lawsuits, nor whether they will have a material negative impact on the Company. If it is determined that the Company bears responsibility for any unlawful or inappropriate conduct that caused losses to the Fund, it is committed to making the Trust or its shareholders whole, as appropriate.
11. NEW ACCOUNTING PRONOUNCEMENT
In September 2006, the Financial Accounting Standards Board (FASB) issued FASB Statement No. 157, “Fair Value Measurement” (SFAS 157), which defines fair value, establishes a framework for measuring fair value, and expands disclosures about fair value measurements. SFAS 157 is effective for fiscal years beginning after November 15, 2007, and interim periods within those fiscal years. The Trust believes the adoption of SFAS 157 will have no material impact on its financial statements.
TGI-28
Franklin Templeton Variable Insurance Products Trust
Templeton Global Income Securities Fund
Report of Independent Registered Public Accounting Firm
To the Board of Trustees and Shareholders of
Franklin Templeton Variable Insurance Products Trust
In our opinion, the accompanying statement of assets and liabilities, including the statement of investments, and the related statements of operations and of changes in net assets and the financial highlights present fairly, in all material respects, the financial position of Templeton Global Income Securities Fund (one of the funds constituting Franklin Templeton Variable Insurance Products Trust, hereafter referred to as the “Fund”) at December 31, 2007, the results of its operations for the year then ended, the changes in its net assets for each of the two years in the period then ended and the financial highlights for each of the periods presented, in conformity with accounting principles generally accepted in the United States of America. These financial statements and financial highlights (hereafter referred to as “financial statements”) are the responsibility of the Fund’s management. Our responsibility is to express an opinion on these financial statements based on our audits. We conducted our audits of these financial statements in accordance with the standards of the Public Company Accounting Oversight Board (United States). Those standards require that we plan and perform the audit to obtain reasonable assurance about whether the financial statements are free of material misstatement. An audit includes examining, on a test basis, evidence supporting the amounts and disclosures in the financial statements, assessing the accounting principles used and significant estimates made by management, and evaluating the overall financial statement presentation. We believe that our audits, which included confirmation of securities at December 31, 2007 by correspondence with the custodian and brokers, provide a reasonable basis for our opinion.
PricewaterhouseCoopers LLP
San Francisco, California
February 14, 2008
TGI-29
Franklin Templeton Variable Insurance Products Trust
Tax Designation (unaudited)
Templeton Global Income Securities Fund
At December 31, 2007, more than 50% of the Fund’s total assets were invested in securities of foreign issuers. In most instances, foreign taxes were withheld from income paid to the Fund on these investments. The Fund elects to treat foreign taxes paid as allowed under Section 853 of the Internal Revenue Code. This election will allow shareholders of record as of the 2008 distribution date, to treat their proportionate share of foreign taxes paid by the Fund as having been paid directly by them. The shareholder shall consider these amounts as foreign taxes paid in the tax year in which they receive the Fund distribution.
TGI-30
TEMPLETON GROWTH SECURITIES FUND
This annual report for Templeton Growth Securities Fund covers the fiscal year ended December 31, 2007.
Performance Summary as of 12/31/07
Average annual total return of Class 1 shares represents the average annual change in value, assuming reinvestment of dividends and capital gains. Average returns smooth out variations in returns, which can be significant; they are not the same as year-by-year results.
Periods ended 12/31/07
| | | | | | |
| | | 1-Year | | 5-Year | | 10-Year |
Average Annual Total Return | | +2.55% | | +16.07% | | +8.62% |
Total Return Index Comparison for Hypothetical $10,000 Investment (1/1/98–12/31/07)
The graph below shows the change in value of a hypothetical $10,000 investment in the Fund over the indicated period and includes reinvestment of any income or distributions. The Fund’s performance is compared to the performance of the Morgan Stanley Capital International (MSCI) World Index. One cannot invest directly in an index, nor is an index representative of the Fund’s portfolio. Please see Important Notes to Performance Information preceding the Fund Summaries.
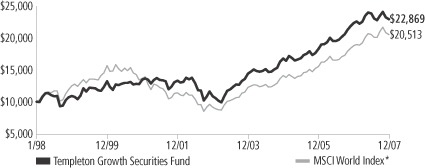
*Source: Standard & Poor’s Micropal. Please see Index Descriptions following the Fund Summaries.
Templeton Growth Securities Fund – Class 1
Performance reflects the Fund’s Class 1 operating expenses, but does not include any contract fees, expenses or sales charges. If they had been included, performance would be lower. These charges and deductions, particularly for variable life policies, can have a significant effect on contract values and insurance benefits. See the contract prospectus for a complete description of these expenses, including sales charges.
Performance data represent past performance, which does not guarantee future results. Investment return and principal value will fluctuate, and you may have a gain or loss when you sell your shares.
Current performance may differ from figures shown.
TG-1
Fund Goal and Main Investments: Templeton Growth Securities Fund seeks long-term capital growth. The Fund normally invests primarily in equity securities of companies located anywhere in the world, including those in the U.S. and in emerging markets.
Performance Overview
You can find the Fund’s one-year total return in the Performance Summary. The Fund underperformed the +9.57% return of the MSCI World Index for the period under review.1
Economic and Market Overview
In spite of elevated energy prices and widespread fears of contagion from the deteriorating U.S. housing situation, the global economy remained resilient in 2007. Consumer and corporate demand strength, particularly in China and other developing economies, generally favorable employment and accommodative monetary policies continued to underpin the current expansionary period that began in 2002.
These factors also contributed to the strength of global equity markets during 2007. However, concerns about slower growth and declining asset quality surfaced in the first quarter. These were initially centered on the U.S. subprime mortgage market but spread in August to global capital markets. Difficulties in assessing risk and the value of collateral in the structured finance industry contributed to declining risk appetite among lenders and investors. The private equity industry, which relies on the availability of cheap credit, played a pivotal role in several large and high-profile acquisitions and helped boost merger and acquisition activity in the first half of the year. This was an important driver of equity performance, but as liquidity dried up in the second half of the year, significantly slower money flows from private equity weighed on market performance. However, global merger and acquisition activity still reached record levels. The staggering $4.5 trillion of deals announced in 2007 eclipsed the previous record from 2006 by 24%.2
To alleviate the credit crunch and restore investor confidence, the world’s major central banks infused capital into the system, and the U.S. Federal Reserve Board reduced its target interest rate by a full
1. Source: Standard & Poor’s Micropal. One cannot invest directly in an index, nor is an index representative of the Fund’s portfolio. Please see Index Descriptions following the Fund Summaries.
2. Source: “For Deal Makers, Tale of Two Halves,” The Wall Street Journal, 1/2/08.
Fund Risks: The Fund’s investments in stocks offer the potential for long-term gains but can be subject to short-term price fluctuations. Foreign investing, especially in emerging markets, involves additional risks, including currency fluctuations, economic instability, market volatility, and political and social instability. By having significant investments in one or more countries or in particular sectors from time to time, the Fund may be at greater risk of adverse developments in a country or sector than a fund that invests more broadly. The Fund’s prospectus also includes a description of the main investment risks.
TG-2
percentage point. However, credit and equity markets continued to face headwinds as write-downs and losses from subprime mortgage financing affected many large financial institutions toward the end of the year, and equity prices remained volatile.
For the year, however, global and non-U.S. equity markets registered the fifth consecutive year of double-digit total returns, making this an exceptionally strong period for investors in global equities. Broad-based stock performance by European and Asian shares at least doubled that of U.S. stocks, while emerging market equity returns more than tripled those in developed markets. Led by the BRIC countries, Brazil, Russia, India and China, emerging market economies continued to grow at accelerated rates, supporting elevated prices for oil and other commodities. At the same time, investment inflows from developed economies continued to underpin equity prices in emerging markets. In addition, U.S. dollar weakness versus the currencies of many major trading partners enhanced equity returns for U.S.-based investors holding stocks denominated in these currencies.
Investment Strategy
Our investment philosophy is bottom-up, value-oriented and long-term. In choosing investments, we will focus on the market price of a company’s securities relative to our evaluation of the company’s potential long-term earnings, asset value and cash flow. Among factors we may consider are a company’s historical value measures, including price/earnings ratio, profit margins and liquidation value. We do in-depth research to construct a bargain list from which we buy.
Manager’s Discussion
Among the most significant contributors to the Fund’s performance relative to the MSCI World Index for the year under review were German electronics and industrial engineering conglomerate Siemens, U.S. enterprise software giant Oracle and U.K. wireless phone services carrier Vodafone Group. However, the Fund also had some major detractors from relative performance during the period including U.S. medical device supplier Boston Scientific, U.S. wireless telecommunications service provider Sprint Nextel and U.K-based Royal Bank of Scotland Group.
From a sector perspective, the financials sector was the largest contributor to relative performance for the reporting period.3 Although stock
3. The financials sector comprises capital markets, commercial banks, diversified financial services, insurance, and real estate management and development in the SOI.
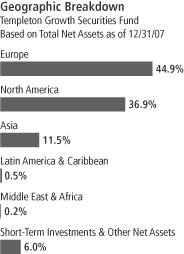
TG-3
selection detracted, our underweighted position benefited the Fund’s performance overall. Within the sector, Hong Kong-based real estate development firm Cheung Kong (Holdings) and Italian bank Intesa Sanpaolo were among the best performers. Our overweighted allocation relative to the index in the telecommunication services sector also boosted Fund performance.4 Significant contributors within the sector were France Telecom and Singapore Telecommunications. Driven by stock selection, the industrials sector, which includes Siemens, also positively affected relative performance for the period.5
On the other hand, some sectors weighed on the Fund’s relative performance for the year. Our underweighted allocation and stock selection in the materials sector hampered Fund returns relative to the index.6 Within the sector, our holding in Finnish paper and forest products manufacturer UPM-Kymmene was a notable detractor. Our overweighted allocation in the consumer discretionary sector also impaired relative performance.7 Within the sector, U.S. companies Time Warner, Chico’s FAS and Comcast detracted from Fund returns. Additionally, overweighting and stock selection in the health care sector weighed on the Fund’s relative results.8 Most detractors within the sector were U.S. based and included pharmaceutical company Pfizer and biotechnology firm Amgen.
From a geographic perspective, our holdings in France, underweighting in Japan and position in Mexico (not part of the index) contributed the most to relative Fund performance. Conversely, stock selection in the U.S. and Finland, and underweighting in Canada detracted.
It is important to recognize the effect of currency movements on the Fund’s performance. In general, if the value of the U.S. dollar goes up
4. The telecommunication services sector comprises diversified telecommunication services and wireless telecommunication services in the SOI.
5. The industrials sector comprises aerospace and defense, air freight and logistics, building products, commercial services and supplies, electrical equipment, and industrial conglomerates in the SOI.
6. The materials sector comprises paper and forest products in the SOI.
7. The consumer discretionary sector comprises auto components; automobiles; hotels, restaurants and leisure; Internet and catalog retail; leisure equipment and products; media; and specialty retail in the SOI.
8. The health care sector comprises biotechnology, health care equipment and supplies, health care providers and services, and pharmaceuticals in the SOI.
Top 10 Holdings
Templeton Growth Securities Fund
12/31/07
| | |
Company
Sector/Industry,
Country | | % of Total
Net Assets |
| |
| Microsoft Corp. | | 3.0% |
| Software, U.S. | | |
| |
| Siemens AG | | 2.7% |
| Industrial Conglomerates, Germany | | |
| |
| Oracle Corp. | | 2.2% |
| Software, U.S. | | |
| |
| General Electric Co. | | 2.2% |
| Industrial Conglomerates, U.S. | | |
| |
| Seagate Technology | | 2.2% |
| Computers & Peripherals, U.S. | | |
| |
| News Corp., A | | 2.1% |
| Media, U.S. | | |
| |
| Pfizer Inc. | | 2.0% |
| Pharmaceuticals, U.S. | | |
| |
| Vodafone Group PLC | | 1.9% |
| Wireless Telecommunication Services, U.K. | | |
| |
| Intesa Sanpaolo SpA | | 1.9% |
| Commercial Banks, Italy | | |
| |
| BP PLC | | 1.8% |
| Oil, Gas & Consumable Fuels, U.K. | | |
The dollar value, number of shares or principal amount, and names of portfolio holdings are listed in the Fund’s Statement of Investments (SOI).
TG-4
compared with a foreign currency, an investment traded in that foreign currency will go down in value because it will be worth fewer U.S. dollars. This can have a negative effect on Fund performance. Conversely, when the U.S. dollar weakens in relation to a foreign currency, an investment traded in that foreign currency will increase in value, which can contribute to Fund performance. For the 12 months ended December 31, 2007, the U.S. dollar fell in value relative to most non-U.S. currencies. As a result, the Fund’s performance was positively affected by the Fund’s substantial investment in securities with non-U.S. currency exposure. However, one cannot expect the same result in future periods.
Thank you for your participation in Templeton Growth Securities Fund. We look forward to serving your future investment needs.
The foregoing information reflects our analysis, opinions and portfolio holdings as of December 31, 2007, the end of the reporting period. The way we implement our main investment strategies and the resulting portfolio holdings may change depending on factors such as market and economic conditions. These opinions may not be relied upon as investment advice or an offer for a particular security. The information is not a complete analysis of every aspect of any market, country, industry, security or the Fund. Statements of fact are from sources considered reliable, but the investment manager makes no representation or warranty as to their completeness or accuracy. Although historical performance is no guarantee of future results, these insights may help you understand our investment management philosophy.
TG-5
Fund Expenses
As an investor in a variable insurance contract (Contract) that indirectly provides for investment in an underlying mutual fund, you can incur transaction and/or ongoing expenses at both the Fund level and the Contract level.
| • | | Transaction expenses can include sales charges (loads) on purchases, redemption fees, surrender fees, transfer fees and premium taxes. |
| • | | Ongoing expenses can include management fees, distribution and service (12b-1) fees, contract fees, annual maintenance fees, mortality and expense risk fees and other fees and expenses. All mutual funds and Contracts have some types of ongoing expenses. |
The expenses shown in the table are meant to highlight ongoing expenses at the Fund level only and do not include ongoing expenses at the Contract level, or transaction expenses at either the Fund or Contract level. While the Fund does not have transaction expenses, if the transaction and ongoing expenses at the Contract level were included, the expenses shown below would be higher. You should consult your Contract prospectus or disclosure document for more information.
The table shows Fund-level ongoing expenses and can help you understand these expenses and compare them with those of other mutual funds offered through the Contract. The table assumes a $1,000 investment held for the six months indicated. Please refer to the Fund prospectus for additional information on operating expenses.
Actual Fund Expenses
The first line (Actual) of the table provides actual account values and expenses. The “Ending Account Value” is derived from the Fund’s actual return, which includes the effect of ongoing Fund expenses, but does not include the effect of ongoing Contract expenses.
You can estimate the Fund-level expenses you incurred during the period by following these steps. Of course, your account value and expenses will differ from those in this illustration:
| 1. | Divide your account value by $1,000. |
If an account had an $8,600 value, then $8,600 ÷ $1,000 = 8.6.
| 2. | Multiply the result by the number under the heading “Fund-Level Expenses Incurred During Period.” |
If Fund-Level Expenses Incurred During Period were $7.50, then 8.6 x $7.50 = $64.50.
In this illustration, the estimated expenses incurred this period at the Fund level are $64.50.
Templeton Growth Securities Fund – Class 1
TG-6
Hypothetical Example for Comparison with Other Mutual Funds
Information in the second line (Hypothetical) of the table can help you compare ongoing expenses of the Fund with those of other mutual funds offered through the Contract. This information may not be used to estimate the actual ending account balance or expenses you incurred during the period. The hypothetical “Ending Account Value” is based on the Fund’s actual expense ratio and an assumed 5% annual rate of return before expenses, which does not represent the Fund’s actual return. The figure under the heading “Fund-Level Expenses Incurred During Period” shows the hypothetical expenses your account would have incurred under this scenario. You can compare this figure with the 5% hypothetical examples that appear in shareholder reports of other funds offered through a Contract.
| | | | | | | | | |
| Class 1 | | Beginning
Account Value 7/1/07 | | Ending Account Value 12/31/07 | | Fund-Level
Expenses Incurred
During Period*
7/1/07–12/31/07 |
Actual | | $ | 1,000 | | $ | 960.80 | | $ | 3.76 |
Hypothetical (5% return before expenses) | | $ | 1,000 | | $ | 1,021.37 | | $ | 3.87 |
*Expenses are calculated using the most recent six-month annualized expense ratio for the Fund’s Class 1 shares (0.76%), which does not include any ongoing expenses of the Contract for which the Fund is an investment option, multiplied by the average account value over the period, multiplied by 184/365 to reflect the one-half year period.
TG-7
SUPPLEMENT DATED DECEMBER 10, 2007
TOTHE PROSPECTUSES DATED MAY 1, 2007
OF
TEMPLETON GROWTH SECURITIES FUND (FUND)
A SERIESOF FRANKLIN TEMPLETON VARIABLE INSURANCE PRODUCTS TRUST
The Fund’s Class 1 and Class 2 prospectuses are amended by replacing the portfolio management line-up in the “Management” section on page TG-6 with the following:
The Fund is managed by a team of dedicated professionals focused on investments in equity securities of companies anywhere in the world. The portfolio managers of the team are as follows:
Alan Chua CFA®¹
PORTFOLIO MANAGER OF ASSET MANAGEMENT
Mr. Chua has been a manager of the Fund since 2003. He has primary responsibility for the investments of the Fund. Mr. Chua has final authority over all aspects of the Fund’s investment portfolio, including but not limited to, purchases and sales of individual securities, portfolio risk assessment, and the management of daily cash balances in accordance with anticipated investment management requirements. The degree to which he may perform these functions, and the nature of these functions, may change from time to time. He joined Franklin Templeton Investments in 1995.
Cindy L. Sweeting CFA®¹
PRESIDENT OF GLOBAL ADVISORS
Ms. Sweeting has been a manager of the Fund since December 2007, providing research and advice on the purchases and sales of individual securities, and portfolio risk assessment. She joined Franklin Templeton Investments in 1997.
The Fund’s SAI provides additional information about the portfolio managers’ compensation, other accounts that they manage and their ownership of Fund shares.
1. | CFA® and Chartered Financial Analyst® are trademarks owned by CFA Institute. |
Please keep this supplement for future reference.
TG-8
Franklin Templeton Variable Insurance Products Trust
Financial Highlights
Templeton Growth Securities Fund
| | | | | | | | | | | | | | | | | | | | |
| | | Year Ended December 31, | |
| Class 1 | | 2007 | | | 2006 | | | 2005 | | | 2004 | | | 2003 | |
| | | | |
Per share operating performance | | | | | | | | | | | | | | | | | | | | |
(for a share outstanding throughout the year) | | | | | | | | | | | | | | | | | | | | |
Net asset value, beginning of year | | $ | 16.16 | | | $ | 13.98 | | | $ | 12.98 | | | $ | 11.31 | | | $ | 8.67 | |
| | | | |
Income from investment operationsa: | | | | | | | | | | | | | | | | | | | | |
Net investment incomeb | | | 0.27 | | | | 0.29 | | | | 0.24 | | | | 0.21 | | | | 0.17 | |
Net realized and unrealized gains (losses) | | | 0.19 | | | | 2.67 | | | | 0.92 | | | | 1.61 | | | | 2.63 | |
| | | | |
Total from investment operations | | | 0.46 | | | | 2.96 | | | | 1.16 | | | | 1.82 | | | | 2.80 | |
| | | | |
Less distributions from: | | | | | | | | | | | | | | | | | | | | |
Net investment income | | | (0.25 | ) | | | (0.23 | ) | | | (0.16 | ) | | | (0.15 | ) | | | (0.16 | ) |
Net realized gains | | | (0.69 | ) | | | (0.55 | ) | | | — | | | | — | | | | — | |
| | | | |
Total distributions | | | (0.94 | ) | | | (0.78 | ) | | | (0.16 | ) | | | (0.15 | ) | | | (0.16 | ) |
| | | | |
Net asset value, end of year | | $ | 15.68 | | | $ | 16.16 | | | $ | 13.98 | | | $ | 12.98 | | | $ | 11.31 | |
| | | | |
| | | | | |
Total returnc | | | 2.55% | | | | 22.20% | | | | 9.06% | | | | 16.25% | | | | 32.62% | |
Ratios to average net assets | | | | | | | | | | | | | | | | | | | | |
Expenses before expense reduction | | | 0.77% | | | | 0.78% | | | | 0.82% | | | | 0.86% | | | | 0.88% | |
Expenses net of expense reduction | | | 0.76% | | | | 0.78% | d | | | 0.82% | d | | | 0.86% | d | | | 0.88% | |
Net investment income | | | 1.64% | | | | 1.93% | | | | 1.81% | | | | 1.75% | | | | 1.74% | |
| | | | | |
Supplemental data | | | | | | | | | | | | | | | | | | | | |
Net assets, end of year (000’s) | | $ | 406,538 | | | $ | 413,871 | | | $ | 779,347 | | | $ | 800,118 | | | $ | 769,339 | |
Portfolio turnover rate | | | 20.45% | | | | 20.29% | e | | | 22.16% | | | | 19.13% | | | | 37.43% | |
a The amount shown for a share outstanding throughout the period may not correlate with the Statement of Operations for the period due to the timing of sales and repurchases of the Fund shares in relation to income earned and/or fluctuating market value of the investments of the Fund.
b Based on average daily shares outstanding.
c Total return does not include any fees, charges or expenses imposed by the variable annuity and life insurance contracts for which the Franklin Templeton Variable Insurance Products Trust serves as an underlying investment vehicle.
d Benefit of expense reduction rounds to less than 0.01%.
e Excludes the value of portfolio securities delivered as a result of a redemption in-kind. See Note 8.
The accompanying notes are an integral part of these financial statements.
TG-9
Franklin Templeton Variable Insurance Products Trust
Financial Highlights (continued)
Templeton Growth Securities Fund
| | | | | | | | | | | | | | | | | | | | |
| | | Year Ended December 31, | |
| Class 2 | | 2007 | | | 2006 | | | 2005 | | | 2004 | | | 2003 | |
| | | | |
Per share operating performance | | | | | | | | | | | | | | | | | | | | |
(for a share outstanding throughout the year) | | | | | | | | | | | | | | | | | | | | |
Net asset value, beginning of year | | $ | 15.93 | | | $ | 13.81 | | | $ | 12.83 | | | $ | 11.19 | | | $ | 8.59 | |
| | | | |
Income from investment operationsa: | | | | | | | | | | | | | | | | | | | | |
Net investment incomeb | | | 0.22 | | | | 0.24 | | | | 0.20 | | | | 0.17 | | | | 0.13 | |
Net realized and unrealized gains (losses) | | | 0.20 | | | | 2.63 | | | | 0.93 | | | | 1.61 | | | | 2.62 | |
| | | | |
Total from investment operations | | | 0.42 | | | | 2.87 | | | | 1.13 | | | | 1.78 | | | | 2.75 | |
| | | | |
Less distributions from: | | | | | | | | | | | | | | | | | | | | |
Net investment income | | | (0.22 | ) | | | (0.20 | ) | | | (0.15 | ) | | | (0.14 | ) | | | (0.15 | ) |
Net realized gains | | | (0.69 | ) | | | (0.55 | ) | | | — | | | | — | | | | — | |
| | | | |
Total distributions | | | (0.91 | ) | | | (0.75 | ) | | | (0.15 | ) | | | (0.14 | ) | | | (0.15 | ) |
| | | | |
Net asset value, end of year | | $ | 15.44 | | | $ | 15.93 | | | $ | 13.81 | | | $ | 12.83 | | | $ | 11.19 | |
| | | | |
| | | | | |
Total returnc | | | 2.35% | | | | 21.81% | | | | 8.86% | | | | 16.03% | | | | 32.13% | |
Ratios to average net assets | | | | | | | | | | | | | | | | | | | | |
Expenses before expense reduction | | | 1.02% | | | | 1.03% | | | | 1.07% | | | | 1.11% | | | | 1.13% | |
Expenses net of expense reduction | | | 1.01% | | | | 1.03% | d | | | 1.07% | d | | | 1.11% | d | | | 1.13% | |
Net investment income | | | 1.39% | | | | 1.68% | | | | 1.56% | | | | 1.50% | | | | 1.49% | |
| | | | | |
Supplemental data | | | | | | | | | | | | | | | | | | | | |
Net assets, end of year (000’s) | | $ | 3,182,203 | | | $ | 2,821,818 | | | $ | 1,912,825 | | | $ | 1,189,112 | | | $ | 511,659 | |
Portfolio turnover rate | | | 20.45% | | | | 20.29% | e | | | 22.16% | | | | 19.13% | | | | 37.43% | |
a The amount shown for a share outstanding throughout the period may not correlate with the Statement of Operations for the period due to the timing of sales and repurchases of the Fund shares in relation to income earned and/or fluctuating market value of the investments of the Fund.
b Based on average daily shares outstanding.
c Total return does not include any fees, charges or expenses imposed by the variable annuity and life insurance contracts for which the Franklin Templeton Variable Insurance Products Trust serves as an underlying investment vehicle.
d Benefit of expense reduction rounds to less than 0.01%.
e Excludes the value of portfolio securities delivered as a result of a redemption in-kind. See Note 8.
The accompanying notes are an integral part of these financial statements.
TG-10
Franklin Templeton Variable Insurance Products Trust
Statement of Investments, December 31, 2007
| | | | | | | |
| Templeton Growth Securities Fund | | Country | | Shares | | Value |
Common Stocks 94.0% | | | | | | | |
Aerospace & Defense 0.7% | | | | | | | |
aBAE Systems PLC, 144A | | United Kingdom | | 369 | | $ | 3,651 |
Raytheon Co. | | United States | | 186,177 | | | 11,300,944 |
bRolls-Royce Group PLC | | United Kingdom | | 1,349,842 | | | 14,644,095 |
bRolls-Royce Group PLC, B | | United Kingdom | | 54,533,616 | | | 119,192 |
| | | | | | | |
| | | | | | | 26,067,882 |
| | | | | | | |
Air Freight & Logistics 2.6% | | | | | | | |
Deutsche Post AG | | Germany | | 1,373,042 | | | 46,707,384 |
United Parcel Service Inc., B | | United States | | 657,270 | | | 46,482,134 |
| | | | | | | |
| | | | | | | 93,189,518 |
| | | | | | | |
Auto Components 0.4% | | | | | | | |
bLear Corp. | | United States | | 240,108 | | | 6,641,387 |
Valeo SA | | France | | 202,767 | | | 8,344,606 |
| | | | | | | |
| | | | | | | 14,985,993 |
| | | | | | | |
Automobiles 3.3% | | | | | | | |
Bayerische Motoren Werke AG | | Germany | | 859,457 | | | 53,594,040 |
Harley-Davidson Inc. | | United States | | 299,480 | | | 13,988,711 |
bHyundai Motor Co. Ltd. | | South Korea | | 268,950 | | | 20,572,426 |
Peugeot SA | | France | | 416,122 | | | 31,486,826 |
| | | | | | | |
| | | | | | | 119,642,003 |
| | | | | | | |
Biotechnology 1.3% | | | | | | | |
bAmgen Inc. | | United States | | 1,032,850 | | | 47,965,554 |
| | | | | | | |
Building Products 0.5% | | | | | | | |
Assa Abloy AB, B | | Sweden | | 886,200 | | | 17,783,759 |
| | | | | | | |
Capital Markets 1.3% | | | | | | | |
Nomura Holdings Inc. | | Japan | | 433,174 | | | 7,361,025 |
UBS AG | | Switzerland | | 822,844 | | | 38,048,911 |
| | | | | | | |
| | | | | | | 45,409,936 |
| | | | | | | |
Commercial Banks 9.2% | | | | | | | |
HSBC Holdings PLC | | United Kingdom | | 2,959,079 | | | 49,975,084 |
Intesa Sanpaolo SpA | | Italy | | 8,424,310 | | | 66,510,629 |
bKookmin Bank | | South Korea | | 426,140 | | | 31,412,489 |
Mitsubishi UFJ Financial Group Inc. | | Japan | | 3,810,370 | | | 35,775,074 |
Royal Bank of Scotland Group PLC | | United Kingdom | | 4,925,001 | | | 43,448,647 |
Shinsei Bank Ltd. | | Japan | | 6,411,000 | | | 23,455,930 |
Sumitomo Mitsui Financial Group Inc. | | Japan | | 3,814 | | | 28,626,803 |
UniCredito Italiano SpA | | Italy | | 6,063,647 | | | 50,262,223 |
| | | | | | | |
| | | | | | | 329,466,879 |
| | | | | | | |
Commercial Services & Supplies 0.3% | | | | | | | |
Pitney Bowes Inc. | | United States | | 288,990 | | | 10,993,180 |
| | | | | | | |
Computers & Peripherals 2.2% | | | | | | | |
Seagate Technology | | United States | | 3,071,238 | | | 78,316,569 |
| | | | | | | |
Diversified Financial Services 1.6% | | | | | | | |
ING Groep NV | | Netherlands | | 1,483,770 | | | 57,922,836 |
| | | | | | | |
Diversified Telecommunication Services 5.3% | | | | | | | |
BCE Inc. | | Canada | | 374,423 | | | 14,939,242 |
Belgacom | | Belgium | | 233,162 | | | 11,480,540 |
TG-11
Franklin Templeton Variable Insurance Products Trust
Statement of Investments, December 31, 2007 (continued)
| | | | | | | |
| Templeton Growth Securities Fund | | Country | | Shares | | Value |
Common Stocks (continued) | | | | | | | |
Diversified Telecommunication Services (continued) | | | | | | | |
France Telecom SA | | France | | 1,428,670 | | $ | 51,330,964 |
KT Corp., ADR | | South Korea | | 862,201 | | | 22,244,786 |
Singapore Telecommunications Ltd. | | Singapore | | 12,064,000 | | | 33,477,401 |
Telefonos de Mexico SAB de CV (Telmex), L, ADR | | Mexico | | 471,465 | | | 17,368,771 |
Telekom Austria AG | | Austria | | 122,140 | | | 3,392,002 |
Telenor ASA | | Norway | | 1,478,027 | | | 35,288,252 |
| | | | | | | |
| | | | | | | 189,521,958 |
| | | | | | | |
Electric Utilities 0.3% | | | | | | | |
Hong Kong Electric Holdings Ltd. | | Hong Kong | | 1,821,181 | | | 10,474,342 |
| | | | | | | |
Electronic Equipment & Instruments 2.3% | | | | | | | |
bCelestica Inc. | | Canada | | 343,812 | | | 1,994,110 |
bFlextronics International Ltd. | | Singapore | | 641,110 | | | 7,731,787 |
FUJIFILM Holdings Corp. | | Japan | | 643,837 | | | 27,308,873 |
Hitachi Ltd. | | Japan | | 1,996,278 | | | 14,911,891 |
Tyco Electronics Ltd. | | United States | | 847,788 | | | 31,478,368 |
| | | | | | | |
| | | | | | | 83,425,029 |
| | | | | | | |
Food Products 1.1% | | | | | | | |
Nestle SA | | Switzerland | | 86,034 | | | 39,479,068 |
| | | | | | | |
Health Care Equipment & Supplies 1.7% | | | | | | | |
bBoston Scientific Corp. | | United States | | 3,115,270 | | | 36,230,590 |
Covidien Ltd. | | United States | | 594,418 | | | 26,326,773 |
Olympus Corp. | | Japan | | 800 | | | 33,144 |
| | | | | | | |
| | | | | | | 62,590,507 |
| | | | | | | |
Health Care Providers & Services 0.4% | | | | | | | |
bTenet Healthcare Corp. | | United States | | 2,881,768 | | | 14,639,381 |
| | | | | | | |
Hotels Restaurants & Leisure 1.4% | | | | | | | |
Accor SA | | France | | 184,940 | | | 14,763,102 |
Compass Group PLC | | United Kingdom | | 5,578,849 | | | 34,196,900 |
| | | | | | | |
| | | | | | | 48,960,002 |
| | | | | | | |
Industrial Conglomerates 6.6% | | | | | | | |
General Electric Co. | | United States | | 2,123,410 | | | 78,714,809 |
Koninklijke Philips Electronics NV | | Netherlands | | 912,198 | | | 39,297,499 |
Siemens AG | | Germany | | 602,004 | | | 95,250,711 |
Tyco International Ltd. | | United States | | 594,418 | | | 23,568,674 |
| | | | | | | |
| | | | | | | 236,831,693 |
| | | | | | | |
Insurance 5.7% | | | | | | | |
American International Group Inc. | | United States | | 1,023,745 | | | 59,684,334 |
Aviva PLC | | United Kingdom | | 3,808,161 | | | 50,923,392 |
Muenchener Rueckversicherungs-Gesellschaft AG | | Germany | | 95,260 | | | 18,468,498 |
Old Mutual PLC | | United Kingdom | | 7,445,420 | | | 24,794,205 |
Standard Life PLC | | United Kingdom | | 2,504,813 | | | 12,579,212 |
Torchmark Corp. | | United States | | 253,277 | | | 15,330,857 |
Willis Group Holdings Ltd. | | United States | | 586,490 | | | 22,269,025 |
| | | | | | | |
| | | | | | | 204,049,523 |
| | | | | | | |
Internet & Catalog Retail 0.6% | | | | | | | |
bExpedia Inc. | | United States | | 694,780 | | | 21,968,944 |
| | | | | | | |
TG-12
Franklin Templeton Variable Insurance Products Trust
Statement of Investments, December 31, 2007 (continued)
| | | | | | | |
| Templeton Growth Securities Fund | | Country | | Shares | | Value |
Common Stocks (continued) | | | | | | | |
IT Services 2.2% | | | | | | | |
Accenture Ltd., A | | United States | | 1,143,107 | | $ | 41,186,145 |
Electronic Data Systems Corp. | | United States | | 1,762,290 | | | 36,532,272 |
| | | | | | | |
| | | | | | | 77,718,417 |
| | | | | | | |
Leisure Equipment & Products 0.9% | | | | | | | |
Eastman Kodak Co. | | United States | | 1,484,649 | | | 32,469,274 |
| | | | | | | |
Media 10.7% | | | | | | | |
bComcast Corp., A | | United States | | 1,293,102 | | | 23,431,008 |
bThe Interpublic Group of Cos. Inc. | | United States | | 2,797,188 | | | 22,685,195 |
Mediaset SpA | | Italy | | 1,867,440 | | | 18,817,841 |
News Corp., A | | United States | | 3,701,922 | | | 75,852,382 |
Pearson PLC | | United Kingdom | | 1,864,688 | | | 27,120,907 |
Reed Elsevier NV | | Netherlands | | 2,518,906 | | | 50,176,927 |
Time Warner Inc. | | United States | | 3,275,372 | | | 54,076,392 |
bViacom Inc., B | | United States | | 1,325,938 | | | 58,235,197 |
Vivendi SA | | France | | 1,126,740 | | | 51,598,384 |
| | | | | | | |
| | | | | | | 381,994,233 |
| | | | | | | |
Office Electronics 0.9% | | | | | | | |
Konica Minolta Holdings Ltd. | | Japan | | 1,733,800 | | | 30,768,867 |
| | | | | | | |
Oil, Gas & Consumable Fuels 7.4% | | | | | | | |
BP PLC | | United Kingdom | | 5,341,037 | | | 65,266,101 |
El Paso Corp. | | United States | | 2,309,384 | | | 39,813,780 |
Eni SpA | | Italy | | 863,977 | | | 31,584,162 |
Gazprom, ADR | | Russia | | 330,460 | | | 18,555,329 |
Royal Dutch Shell PLC, B | | United Kingdom | | 1,489,450 | | | 61,852,773 |
Total SA, B | | France | | 600,930 | | | 49,838,044 |
| | | | | | | |
| | | | | | | 266,910,189 |
| | | | | | | |
Paper & Forest Products 2.4% | | | | | | | |
International Paper Co. | | United States | | 465,453 | | | 15,071,368 |
Sappi Ltd. | | South Africa | | 539,361 | | | 7,644,548 |
Stora Enso OYJ, R | | Finland | | 1,117,082 | | | 16,693,387 |
Svenska Cellulosa AB, B | | Sweden | | 1,357,173 | | | 24,033,950 |
UPM-Kymmene OYJ | | Finland | | 1,087,262 | | | 21,928,135 |
| | | | | | | |
| | | | | | | 85,371,388 |
| | | | | | | |
Pharmaceuticals 7.6% | | | | | | | |
Bristol-Myers Squibb Co. | | United States | | 238,151 | | | 6,315,765 |
GlaxoSmithKline PLC | | United Kingdom | | 2,245,569 | | | 57,066,851 |
Merck & Co. Inc. | | United States | | 647,601 | | | 37,632,094 |
Novartis AG | | Switzerland | | 762,074 | | | 41,762,086 |
Pfizer Inc. | | United States | | 3,182,513 | | | 72,338,520 |
Sanofi-Aventis | | France | | 640,537 | | | 58,871,666 |
| | | | | | | |
| | | | | | | 273,986,982 |
| | | | | | | |
Real Estate Management & Development 1.2% | | | | | | | |
Cheung Kong (Holdings) Ltd. | | Hong Kong | | 1,199,833 | | | 22,186,933 |
Swire Pacific Ltd., A | | Hong Kong | | 1,408,516 | | | 19,416,969 |
| | | | | | | |
| | | | | | | 41,603,902 |
| | | | | | | |
Semiconductors & Semiconductor Equipment 2.2% | | | | | | | |
bInfineon Technologies AG | | Germany | | 2,227,809 | | | 26,399,362 |
Samsung Electronics Co. Ltd. | | South Korea | | 87,480 | | | 51,961,840 |
| | | | | | | |
| | | | | | | 78,361,202 |
| | | | | | | |
TG-13
Franklin Templeton Variable Insurance Products Trust
Statement of Investments, December 31, 2007 (continued)
| | | | | | | | |
| Templeton Growth Securities Fund | | Country | | Shares | | Value |
Common Stocks (continued) | | | | | | | | |
Software 5.5% | | | | | | | | |
bCadence Design Systems Inc. | | United States | | | 789,718 | | $ | 13,433,103 |
Microsoft Corp. | | United States | | | 2,981,829 | | | 106,153,113 |
bOracle Corp. | | United States | | | 3,491,900 | | | 78,847,102 |
| | | | | | | | |
| | | | | | | | 198,433,318 |
| | | | | | | | |
Specialty Retail 0.6% | | | | | | | | |
bChico’s FAS Inc. | | United States | | | 1,293,800 | | | 11,683,014 |
Kingfisher PLC | | United Kingdom | | | 3,744,140 | | | 10,831,795 |
| | | | | | | | |
| | | | | | | | 22,514,809 |
| | | | | | | | |
Wireless Telecommunication Services 3.6% | | | | | | | | |
SK Telecom Co. Ltd. | | South Korea | | | 80,853 | | | 21,507,822 |
SK Telecom Co. Ltd., ADR | | South Korea | | | 108,491 | | | 3,237,372 |
Sprint Nextel Corp. | | United States | | | 2,792,710 | | | 36,668,282 |
Vodafone Group PLC | | United Kingdom | | | 18,210,261 | | | 67,951,449 |
| | | | | | | | |
| | | | | | | | 129,364,925 |
| | | | | | | | |
Total Common Stocks (Cost $2,873,084,467) | | | | | | | | 3,373,182,062 |
| | | | | | | | |
| | | |
| | | | | Principal
Amount | | |
Short Term Investments 6.0% | | | | | | | | |
U.S. Government and Agency Securities 6.0% | | | | | | | | |
cFFCB, 8/25/08 | | United States | | $ | 25,000,000 | | | 24,379,675 |
cFHLB,
1/02/08 | | United States | | | 1,502,000 | | | 1,502,000 |
3/12/08 | | United States | | | 23,985,000 | | | 23,794,487 |
4/04/08 | | United States | | | 80,000,000 | | | 79,157,840 |
4/14/08 | | United States | | | 6,000,000 | | | 5,930,046 |
4/16/08 | | United States | | | 50,000,000 | | | 49,405,750 |
cFNMA,
1/02/08 | | United States | | | 130,000 | | | 130,000 |
1/04/08 | | United States | | | 15,000,000 | | | 15,000,000 |
2/28/08 | | United States | | | 15,000,000 | | | 14,902,740 |
| | | | | | | | |
Total U.S. Government and Agency Securities (Cost $213,997,809) | | | | | | | | 214,202,538 |
| | | | | | | | |
Total Investments (Cost $3,087,082,276) 100.0% | | | | | | | | 3,587,384,600 |
Other Assets, less Liabilities 0.0%d | | | | | | | | 1,356,297 |
| | | | | | | | |
Net Assets 100.0% | | | | | | | $ | 3,588,740,897 |
| | | | | | | | |
Selected Portfolio Abbreviations
ADR - American Depository Receipt
FFCB - Federal Farm Credit Bank
FHLB - Federal Home Loan Bank
FNMA - Federal National Mortgage Association
a Security was purchased pursuant to Rule 144A under the Securities Act of 1933 and may be sold in transactions exempt from registration only to qualified institutional buyers or in a public offering registered under the Securities Act of 1933. These securities have been deemed liquid under guidelines approved by the Trust’s Board of Trustees. At December 31, 2007, the value of this security was $3,651, representing less than 0.01% of net assets.
b Non-income producing for the twelve months ended December 31, 2007.
c The security is traded on a discount basis with no stated coupon rate.
d Rounds to less than 0.1% of net assets.
The accompanying notes are an integral part of these financial statements.
TG-14
Franklin Templeton Variable Insurance Products Trust
Financial Statements
Statement of Assets and Liabilities
December 31, 2007
| | | |
| | | Templeton
Growth
Securities Fund |
Assets: | | | |
Investments in securities: | | | |
Cost | | $ | 3,087,082,276 |
| | | |
Value | | $ | 3,587,384,600 |
Cash | | | 1,539 |
Receivables: | | | |
Capital shares sold | | | 1,604,221 |
Dividends | | | 5,202,583 |
| | | |
Total assets | | | 3,594,192,943 |
| | | |
Liabilities: | | | |
Payables: | | | |
Capital shares redeemed | | | 1,274,971 |
Affiliates | | | 3,588,740 |
Accrued expenses and other liabilities | | | 588,335 |
| | | |
Total liabilities | | | 5,452,046 |
| | | |
Net assets, at value | | $ | 3,588,740,897 |
| | | |
Net assets consist of: | | | |
Paid-in capital | | $ | 2,845,394,013 |
Undistributed net investment income | | | 50,572,388 |
Net unrealized appreciation (depreciation) | | | 500,314,974 |
Accumulated net realized gain (loss) | | | 192,459,522 |
| | | |
Net assets, at value | | $ | 3,588,740,897 |
| | | |
Class 1: | | | |
Net assets, at value | | $ | 406,537,913 |
| | | |
Shares outstanding | | | 25,927,374 |
| | | |
Net asset value and maximum offering price per share | | $ | 15.68 |
| | | |
Class 2: | | | |
Net assets, at value | | $ | 3,182,202,984 |
| | | |
Shares outstanding | | | 206,123,519 |
| | | |
Net asset value and maximum offering price per share | | $ | 15.44 |
| | | |
The accompanying notes are an integral part of these financial statements.
TG-15
Franklin Templeton Variable Insurance Products Trust
Financial Statements (continued)
Statement of Operations
for the year ended December 31, 2007
| | | | |
| | | Templeton
Growth
Securities Fund | |
Investment income: | | | | |
Dividends (net of foreign taxes of $5,071,854) | | $ | 75,567,119 | |
Interest | | | 9,990,667 | |
| | | | |
Total investment income | | | 85,557,786 | |
| | | | |
Expenses: | | | | |
Management fees (Note 3a) | | | 25,986,128 | |
Distribution fees - Class 2 (Note 3c) | | | 7,884,754 | |
Unaffiliated transfer agent fees | | | 55,033 | |
Custodian fees (Note 4) | | | 545,858 | |
Reports to shareholders | | | 391,150 | |
Professional fees | | | 145,433 | |
Trustees’ fees and expenses | | | 14,790 | |
Other | | | 77,308 | |
| | | | |
Total expenses | | | 35,100,454 | |
Expense reductions (Note 4) | | | (22,993 | ) |
| | | | |
Net expenses | | | 35,077,461 | |
| | | | |
Net investment income | | | 50,480,325 | |
| | | | |
Realized and unrealized gains (losses): | | | | |
Net realized gain (loss) from: | | | | |
Investments | | | 193,121,773 | |
Foreign currency transactions | | | 154,081 | |
| | | | |
Net realized gain (loss) | | | 193,275,854 | |
| | | | |
Net change in unrealized appreciation (depreciation) on: | | | | |
Investments | | | (172,679,431 | ) |
Translation of assets and liabilities denominated in foreign currencies | | | (57,163 | ) |
| | | | |
Net change in unrealized appreciation (depreciation) | | | (172,736,594 | ) |
| | | | |
Net realized and unrealized gain (loss) | | | 20,539,260 | |
| | | | |
Net increase (decrease) in net assets resulting from operations | | $ | 71,019,585 | |
| | | | |
The accompanying notes are an integral part of these financial statements.
TG-16
Franklin Templeton Variable Insurance Products Trust
Financial Statements (continued)
Statements of Changes in Net Assets
| | | | | | | | |
| | | Templeton Growth
Securities Fund | |
| | | Year Ended December 31, | |
| | | 2007 | | | 2006 | |
| | | | |
Increase (decrease) in net assets: | | | | | | | | |
Operations: | | | | | | | | |
Net investment income | | $ | 50,480,325 | | | $ | 48,615,354 | |
Net realized gain (loss) from investments and foreign currency transactions and redemption in-kind (Note 8) | | | 193,275,854 | | | | 220,506,727 | |
Net change in unrealized appreciation (depreciation) on investments and translation of assets and liabilities denominated in foreign currencies | | | (172,736,594 | ) | | | 311,063,570 | |
| | | | |
Net increase (decrease) in net assets resulting from operations | | | 71,019,585 | | | | 580,185,651 | |
| | | | |
Distributions to shareholders from: | | | | | | | | |
Net investment income: | | | | | | | | |
Class 1 | | | (5,889,701 | ) | | | (6,338,891 | ) |
Class 2 | | | (42,446,708 | ) | | | (29,026,054 | ) |
Net realized gains: | | | | | | | | |
Class 1 | | | (16,577,798 | ) | | | (15,619,027 | ) |
Class 2 | | | (135,434,521 | ) | | | (80,864,543 | ) |
| | | | |
Total distributions to shareholders | | | (200,348,728 | ) | | | (131,848,515 | ) |
| | | | |
Capital share transactions: (Note 2) | | | | | | | | |
Class 1 | | | 4,489,795 | | | | (460,756,992 | ) |
Class 2 | | | 477,890,822 | | | | 555,937,357 | |
| | | | |
Total capital share transactions | | | 482,380,617 | | | | 95,180,365 | |
| | | | |
Net increase (decrease) in net assets | | | 353,051,474 | | | | 543,517,501 | |
Net assets: | | | | | | | | |
Beginning of year | | | 3,235,689,423 | | | | 2,692,171,922 | |
| | | | |
End of year | | $ | 3,588,740,897 | | | $ | 3,235,689,423 | |
| | | | |
Undistributed net investment income included in net assets: | | | | | | | | |
End of year | | $ | 50,572,388 | | | $ | 48,319,480 | |
| | | | |
The accompanying notes are an integral part of these financial statements.
TG-17
Franklin Templeton Variable Insurance Products Trust
Notes to Financial Statements
Templeton Growth Securities Fund
1. ORGANIZATION AND SIGNIFICANT ACCOUNTING POLICIES
Franklin Templeton Variable Insurance Products Trust (Trust) is registered under the Investment Company Act of 1940, as amended, (1940 Act) as an open-end investment company, consisting of twenty-three separate funds. The Templeton Growth Securities Fund (Fund) included in this report is diversified. The financial statements of the remaining funds in the Trust are presented separately. Shares of the Fund are sold only to insurance company separate accounts to fund the benefits of variable life insurance policies or variable annuity contracts. As of December 31, 2007, 50.96% of the Fund’s shares were held through one insurance company. The Fund offers two classes of shares: Class 1 and Class 2. Each class of shares differs by its distribution fees, voting rights on matters affecting a single class and its exchange privilege.
The following summarizes the Fund’s significant accounting policies.
a. Security Valuation
Securities listed on a securities exchange or on the NASDAQ National Market System are valued at the last quoted sale price or the official closing price of the day, respectively. Over-the-counter securities and listed securities for which there is no reported sale are valued within the range of the most recent quoted bid and ask prices. Securities that trade in multiple markets or on multiple exchanges are valued according to the broadest and most representative market.
Government securities generally trade in the over-the-counter market rather than on a securities exchange. The Trust may utilize independent pricing services, quotations from bond dealers, and information with respect to bond and note transactions, to assist in determining a current market value for each security. The Trust’s pricing services may use valuation models or matrix pricing which considers information with respect to comparable bond and note transactions, quotations from bond dealers, or by reference to other securities that are considered comparable in such characteristics as rating, interest rate and maturity date, option adjusted spread models, prepayment projections, interest rate spreads and yield curves, to determine current value.
Foreign securities are valued as of the close of trading on the foreign stock exchange on which the security is primarily traded, or the NYSE, whichever is earlier. If no sale is reported at that time, the foreign security will be valued within the range of the most recent quoted bid and ask prices. The value is then converted into its U.S. dollar equivalent at the foreign exchange rate in effect at the close of the NYSE on the day that the value of the foreign security is determined.
The Trust has procedures to determine the fair value of individual securities and other assets for which market prices are not readily available or which may not be reliably priced. Methods for valuing these securities may include: fundamental analysis, matrix pricing, discounts from market prices of similar securities, or discounts applied due to the nature and duration of restrictions on the disposition of the securities. Due to the inherent uncertainty of valuations of such securities, the fair values may differ significantly from the values that would have been used had a ready market for such investments existed. Occasionally, events occur between the time at which trading in a security is completed and the close of the NYSE that might call into question the availability (including the reliability) of the value of a portfolio security held by the Fund. The investment manager monitors price movements following the close of trading in foreign stock markets through a series of country specific market proxies (such as baskets of American Depository Receipts, futures contracts and exchange traded funds). These price movements are measured against established trigger thresholds for each specific market proxy to assist in determining if an event has occurred. If such an event occurs, the securities may be valued using fair value procedures, which may include the use of independent pricing services. All security valuation procedures are approved by the Trust’s Board of Trustees.
b. Foreign Currency Translation
Portfolio securities and other assets and liabilities denominated in foreign currencies are translated into U.S. dollars based on the exchange rate of such currencies against U.S. dollars on the date of valuation. Purchases and sales of securities, income and expense items denominated in foreign currencies are translated into U.S. dollars at the exchange rate in effect on the transaction date. Occasionally, events may impact the availability or reliability of foreign exchange rates used to convert the U.S. dollar equivalent value. If such an event occurs, the foreign exchange rate will be valued at fair value using procedures established and approved by the Trust’s Board of Trustees.
TG-18
Franklin Templeton Variable Insurance Products Trust
Notes to Financial Statements (continued)
Templeton Growth Securities Fund
1. ORGANIZATION AND SIGNIFICANT ACCOUNTING POLICIES (continued)
b. Foreign Currency Translation (continued)
The Fund does not separately report the effect of changes in foreign exchange rates from changes in market prices on securities held. Such changes are included in net realized and unrealized gain or loss from investments on the Statement of Operations.
Realized foreign exchange gains or losses arise from sales of foreign currencies, currency gains or losses realized between the trade and settlement dates on securities transactions and the difference between the recorded amounts of dividends, interest, and foreign withholding taxes and the U.S. dollar equivalent of the amounts actually received or paid. Net unrealized foreign exchange gains and losses arise from changes in foreign exchange rates on foreign denominated assets and liabilities other than investments in securities held at the end of the reporting period.
c. Foreign Currency Contracts
When the Fund purchases or sells foreign securities it may enter into foreign exchange contracts to minimize foreign exchange risk from the trade date to the settlement date of the transactions. A foreign exchange contract is an agreement between two parties to exchange different currencies at an agreed upon exchange rate at a future date. Realized and unrealized gains and losses on these contracts are included in the Statement of Operations.
The risks of these contracts include movement in the values of the foreign currencies relative to the U.S. dollar and the possible inability of the counterparties to fulfill their obligations under the contracts, which may be in excess of the amount reflected in the Statement of Assets and Liabilities.
d. Income Taxes
No provision has been made for U.S. income taxes because it is the Fund’s policy to qualify as a regulated investment company under the Internal Revenue Code and to distribute to shareholders substantially all of its taxable income and net realized gains.
Foreign securities held by the Fund may be subject to foreign taxation on dividend income received. Foreign taxes, if any, are recorded based on the tax regulations and rates that exist in the foreign markets in which the Fund invests.
e. Security Transactions, Investment Income, Expenses and Distributions
Security transactions are accounted for on trade date. Realized gains and losses on security transactions are determined on a specific identification basis. Interest income and estimated expenses are accrued daily. Amortization of premium and accretion of discount on debt securities are included in interest income. Dividend income is recorded on the ex-dividend date except that certain dividends from foreign securities are recognized as soon as the Fund is notified of the ex-dividend date. Distributions to shareholders are recorded on the ex-dividend date and are determined according to income tax regulations (tax basis). Distributable earnings determined on a tax basis may differ from earnings recorded in accordance with accounting principles generally accepted in the United States of America. These differences may be permanent or temporary. Permanent differences are reclassified among capital accounts to reflect their tax character. These reclassifications have no impact on net assets or the results of operations. Temporary differences are not reclassified, as they may reverse in subsequent periods.
Common expenses incurred by the Trust are allocated among the funds based on the ratio of net assets of each fund to the combined net assets of the Trust. Fund specific expenses are charged directly to the fund that incurred the expense.
Realized and unrealized gains and losses and net investment income, other than class specific expenses, are allocated daily to each class of shares based upon the relative proportion of net assets of each class. Differences in per share distributions, by class, are generally due to differences in class specific expenses.
TG-19
Franklin Templeton Variable Insurance Products Trust
Notes to Financial Statements (continued)
Templeton Growth Securities Fund
1. ORGANIZATION AND SIGNIFICANT ACCOUNTING POLICIES (continued)
f. Accounting Estimates
The preparation of financial statements in accordance with accounting principles generally accepted in the United States of America requires management to make estimates and assumptions that affect the reported amounts of assets and liabilities at the date of the financial statements and the amounts of income and expenses during the reporting period. Actual results could differ from those estimates.
g. Guarantees and Indemnifications
Under the Trust’s organizational documents, its officers and trustees are indemnified by the Trust against certain liabilities arising out of the performance of their duties to the Trust. Additionally, in the normal course of business, the Trust, on behalf of the Fund, enters into contracts with service providers that contain general indemnification clauses. The Trust’s maximum exposure under these arrangements is unknown as this would involve future claims that may be made against the Trust that have not yet occurred. Currently, the Trust expects the risk of loss to be remote.
2. SHARES OF BENEFICIAL INTEREST
At December 31, 2007, there were an unlimited number of shares authorized (without par value). Transactions in the Fund’s shares were as follows:
| | | | | | | | | | | | | | |
| | | Year Ended December 31, | |
| | | 2007 | | | 2006 | |
| Class 1 Shares: | | Shares | | | Amount | | | Shares | | | Amount | |
Shares sold | | 3,270,092 | | | $ | 52,030,675 | | | 816,455 | | | $ | 12,140,817 | |
Shares issued in reinvestment of distributions | | 1,362,492 | | | | 22,467,499 | | | 1,610,999 | | | | 21,957,918 | |
Shares redeemed in-kind (Note 8) | | — | | | | — | | | (24,637,081 | ) | | | (376,956,857 | ) |
Shares redeemed | | (4,322,603 | ) | | | (70,008,379 | ) | | (7,904,739 | ) | | | (117,898,870 | ) |
| | | | |
Net increase (decrease) | | 309,981 | | | $ | 4,489,795 | | | (30,114,366 | ) | | $ | (460,756,992 | ) |
| | | | |
| Class 2 Shares: | | | | | | | | | | | | |
Shares sold | | 40,286,926 | | | $ | 647,823,344 | | | 44,417,686 | | | $ | 652,914,455 | |
Shares issued in reinvestment of distributions | | 10,921,155 | | | | 177,577,983 | | | 8,154,097 | | | | 109,754,141 | |
Shares redeemed in-kind (Note 8) | | — | | | | — | | | (1,903,026 | ) | | | (28,650,852 | ) |
Shares redeemed | | (22,199,545 | ) | | | (347,510,505 | ) | | (12,095,685 | ) | | | (178,080,387 | ) |
| | | | |
Net increase (decrease) | | 29,008,536 | | | $ | 477,890,822 | | | 38,573,072 | | | $ | 555,937,357 | |
| | | | |
3. TRANSACTIONS WITH AFFILIATES
Franklin Resources, Inc. is the holding company for various subsidiaries that together are referred to as Franklin Templeton Investments. Certain officers and trustees of the Trust are also officers and/or directors of the following subsidiaries:
| | |
| Subsidiary | | Affiliation |
Templeton Global Advisors Limited (TGAL) | | Investment manager |
Templeton Asset Management Ltd. (TAML) | | Investment manager |
Franklin Templeton Services, LLC (FT Services) | | Administrative manager |
Franklin Templeton Distributors, Inc. (Distributors) | | Principal underwriter |
Franklin Templeton Investor Services, LLC (Investor Services) | | Transfer agent |
TG-20
Franklin Templeton Variable Insurance Products Trust
Notes to Financial Statements (continued)
Templeton Growth Securities Fund
3. TRANSACTIONS WITH AFFILIATES (continued)
a. Management Fees
The Fund pays an investment management fee to TGAL based on the average daily net assets of the Fund as follows:
| | |
| Annualized Fee Rate | | Net Assets |
| 1.000% | | Up to and including $100 million |
| 0.900% | | Over $100 million, up to and including $250 million |
| 0.800% | | Over $250 million, up to and including $500 million |
| 0.750% | | Over $500 million, up to and including $1 billion |
| 0.700% | | Over $1 billion, up to and including $5 billion |
| 0.675% | | Over $5 billion, up to and including $10 billion |
| 0.655% | | Over $10 billion, up to and including $15 billion |
| 0.635% | | Over $15 billion, up to and including $20 billion |
| 0.615% | | In excess of $20 billion |
Under a subadvisory agreement, TAML, an affiliate of TGAL, provides subadvisory services to the Fund and receives from TGAL fees based on the average daily net assets of the Fund.
b. Administrative Fees
Under an agreement with TGAL, FT Services provides administrative services to the Fund. The fee is paid by TGAL based on average daily net assets, and is not an additional expense of the Fund
c. Distribution Fees
The Fund’s Board of Trustees has adopted a distribution plan for Class 2 shares pursuant to Rule 12b-1 under the 1940 Act. Under the Fund’s compensation distribution plan, the Fund pays Distributors for costs incurred in connection with the servicing, sale and distribution of the Fund’s shares up to 0.35% per year of its average daily net assets. The Board of Trustees has agreed to limit the current rate to 0.25% per year.
d. Transfer Agent Fees
Investor Services, under terms of an agreement, performs shareholder servicing for the Fund and is not paid by the Fund for the services.
4. EXPENSE OFFSET ARRANGEMENT
The Fund has entered into an arrangement with its custodian whereby credits realized as a result of uninvested cash balances are used to reduce a portion of the Fund’s custodian expenses. During the year ended December 31, 2007, the custodian fees were reduced as noted in the Statement of Operations.
5. INCOME TAXES
The Fund has reviewed the tax positions taken on federal income tax returns, for each of the three open tax years and as of December 31, 2007 and has determined that no provision for income tax is required in the Fund’s financial statements.
For tax purposes, realized capital losses occurring subsequent to October 31, may be deferred and treated as occurring on the first day of the following fiscal year. At December 31, 2007, the Fund deferred realized capital losses of $1,891,663.
TG-21
Franklin Templeton Variable Insurance Products Trust
Notes to Financial Statements (continued)
Templeton Growth Securities Fund
5. INCOME TAXES (continued)
The tax character of distributions paid during the years ended December 31, 2007 and 2006, was as follows:
| | | | | | |
| | | 2007 | | 2006 |
Distributions paid from: | | | | | | |
Ordinary income | | $ | 60,581,663 | | $ | 35,364,945 |
Long term capital gain | | | 139,767,065 | | | 96,483,570 |
| | | |
| | $ | 200,348,728 | | $ | 131,848,515 |
| | | |
At December 31, 2007, the cost of investments, net unrealized appreciation (depreciation), undistributed ordinary income and undistributed long term capital gains for income tax purposes were as follows:
| | | | |
Cost of investments | | $ | 3,087,082,276 | |
| | | | |
| |
Unrealized appreciation | | $ | 680,441,553 | |
Unrealized depreciation | | | (180,139,229 | ) |
| | | | |
Net unrealized appreciation (depreciation) | | $ | 500,302,324 | |
| | | | |
Undistributed ordinary income | | $ | 58,637,144 | |
Undistributed long term capital gains | | | 186,286,427 | |
| | | | |
Distributable earnings | | $ | 244,923,571 | |
| | | | |
Net investment income differs for financial statement and tax purposes primarily due to differing treatment of foreign currency transactions.
Net realized gains (losses) differ for financial statement and tax purposes primarily due to differing treatments of wash sales and foreign currency transactions.
6. INVESTMENT TRANSACTIONS
Purchases and sales of investments (excluding short term securities) for the year ended December 31, 2007, aggregated $1,108,601,380 and $683,685,656, respectively.
7. CONCENTRATION OF RISK
Investing in foreign securities may include certain risks and considerations not typically associated with investing in U.S. securities, such as fluctuating currency values and changing local and regional economic, political and social conditions, which may result in greater market volatility. In addition, certain foreign securities may not be as liquid as U.S. securities.
8. REDEMPTION IN-KIND
During the year ended December 31, 2006, the Fund realized $68,398,083 of net gains resulting from a redemption in-kind in which a shareholder redeemed fund shares for securities held by the Fund rather than for cash. Because such gains are not taxable to the Fund, and are not distributed to shareholders, they have been reclassified from accumulated net realized gains to paid-in capital.
9. REGULATORY AND LITIGATION MATTERS
As part of various investigations by a number of federal, state, and foreign regulators and governmental entities, including the Securities and Exchange Commission (“SEC”), relating to certain practices in the mutual fund industry, including late trading,
TG-22
Franklin Templeton Variable Insurance Products Trust
Notes to Financial Statements (continued)
Templeton Growth Securities Fund
9. REGULATORY AND LITIGATION MATTERS (continued)
market timing and marketing support payments to securities dealers who sell fund shares (“marketing support”), Franklin Resources, Inc. and certain of its subsidiaries (collectively, the “Company”), entered into settlements with certain of those regulators and governmental entities. Specifically, the Company entered into settlements with the SEC, among others, concerning market timing and marketing support.
On June 6, 2007, the SEC posted for public comment the proposed plan of distribution for the market timing settlement. Once the SEC approves the final plan of distribution, disbursements of settlement monies will be made promptly to individuals who were shareholders of the designated funds during the relevant period, in accordance with the terms and conditions of the settlement and plan.
In addition, the Company, as well as most of the mutual funds within Franklin Templeton Investments and certain current or former officers, Company directors, fund directors, and employees, have been named in private lawsuits (styled as shareholder class actions, or as derivative actions on behalf of either the named funds or Franklin Resources, Inc.). The lawsuits relate to the industry practices referenced above.
The Company and fund management believe that the claims made in each of the private lawsuits referenced above are without merit and intend to defend against them vigorously. The Company cannot predict with certainty the eventual outcome of these lawsuits, nor whether they will have a material negative impact on the Company. If it is determined that the Company bears responsibility for any unlawful or inappropriate conduct that caused losses to the Fund, it is committed to making the Trust or its shareholders whole, as appropriate.
10. NEW ACCOUNTING PRONOUNCEMENT
In September 2006, the Financial Accounting Standards Board (FASB) issued FASB Statement No. 157, “Fair Value Measurement” (SFAS 157), which defines fair value, establishes a framework for measuring fair value, and expands disclosures about fair value measurements. SFAS 157 is effective for fiscal years beginning after November 15, 2007, and interim periods within those fiscal years. The Trust believes the adoption of SFAS 157 will have no material impact on its financial statements.
TG-23
Franklin Templeton Variable Insurance Products Trust
Templeton Growth Securities Fund
Report of Independent Registered Public Accounting Firm
To the Board of Trustees and Shareholders of
Franklin Templeton Variable Insurance Products Trust
In our opinion, the accompanying statement of assets and liabilities, including the statement of investments, and the related statements of operations and of changes in net assets and the financial highlights present fairly, in all material respects, the financial position of Templeton Growth Securities Fund (one of the funds constituting Franklin Templeton Variable Insurance Products Trust, hereafter referred to as the “Fund”) at December 31, 2007, the results of its operations for the year then ended, the changes in its net assets for each of the two years in the period then ended and the financial highlights for each of the five years in the period then ended, in conformity with accounting principles generally accepted in the United States of America. These financial statements and financial highlights (hereafter referred to as “financial statements”) are the responsibility of the Fund’s management. Our responsibility is to express an opinion on these financial statements based on our audits. We conducted our audits of these financial statements in accordance with the standards of the Public Company Accounting Oversight Board (United States). Those standards require that we plan and perform the audit to obtain reasonable assurance about whether the financial statements are free of material misstatement. An audit includes examining, on a test basis, evidence supporting the amounts and disclosures in the financial statements, assessing the accounting principles used and significant estimates made by management, and evaluating the overall financial statement presentation. We believe that our audits, which included confirmation of securities at December 31, 2007 by correspondence with the custodian and brokers, provide a reasonable basis for our opinion.
PricewaterhouseCoopers LLP
San Francisco, California
February 14, 2008
TG-24
Franklin Templeton Variable Insurance Products Trust
Tax Designation (unaudited)
Templeton Growth Securities Fund
Under Section 852(b)(3)(C) of the Internal Revenue Code (Code), the Fund designates the maximum amount allowable but no less than $186,296,390 as a long term capital gain dividend for the fiscal year ended December 31, 2007.
Under Section 854(b)(2) of the Code, the Fund designates 29.51% of the ordinary income dividends as income qualifying for the dividends received deduction for the fiscal year ended December 31, 2007.
At December 31, 2007, more than 50% of the Fund’s total assets were invested in securities of foreign issuers. In most instances, foreign taxes were withheld from income paid to the Fund on these investments. The Fund elects to treat foreign taxes paid as allowed under Section 853 of the Code. This election will allow shareholders of record as of the 2008 distribution date, to treat their proportionate share of foreign taxes paid by the Fund as having been paid directly by them. The shareholder shall consider these amounts as foreign taxes paid in the tax year in which they receive the Fund distribution.
TG-25
| | |
 | | One Franklin Parkway San Mateo, CA 94403-1906 |
Annual Report
Insurance Issuer
Phoenix Life Insurance Company
Service Center
Variable Annuity Operations
800/243-4840
Investment Managers
Franklin Advisers, Inc.
Templeton Investment Counsel, LLC
Templeton Asset Management Ltd.
Templeton Global Advisors Limited
Phoenix Investment Counsel, Inc.
FTVIP Trust Distributor
Franklin Templeton Distributors, Inc.
This report must be preceded or accompanied by the current Templeton Investment Plus (TIP) prospectus which includes the Franklin Templeton Variable Insurance Products Trust (FTVIP Trust) and The Phoenix Edge Series Fund prospectuses, which contain more detailed information, including sales charges and risks of an investment in TIP. Please read the prospectuses carefully before investing or sending your money. These reports and prospectuses do not constitute an offering in any jurisdiction in which such offering may not lawfully be made.
To ensure the highest quality of service, telephone calls to or from our service departments may be monitored, recorded and accessed. These calls can be determined by the presence of a regular beeping tone.
Phoenix Life Insurance Company
P.O. Box 22012
Albany, NY 12201-2012
INDEX DESCRIPTIONS
The indexes are unmanaged and include reinvested distributions.
Bloomberg World Communications Index is a market capitalization-weighted index designed to measure equity performance of the communications sector of the Bloomberg World Index.
Consumer Price Index (CPI), calculated by the U.S. Bureau of Labor Statistics, is a commonly used measure of the inflation rate.
CS High Yield Index is designed to mirror the investible universe of the U.S. dollar-denominated high yield debt market.
Dow Jones Industrial Average (the Dow) is price weighted based on the average market price of 30 blue chip stocks of companies that are generally industry leaders.
Dow Jones Wilshire Real Estate Securities Index is a broad measure of the performance of publicly traded real estate securities, such as real estate investment trusts and real estate operating companies. The index is float adjusted, capitalization weighted and rebalanced monthly, and returns are calculated on a buy-and-hold basis.
J.P. Morgan (JPM) Emerging Markets Bond Index (EMBI) Global tracks total returns for U.S. dollar-denominated debt instruments issued by emerging market sovereign and quasi-sovereign entities: Brady bonds, loans and Eurobonds. Regional market returns are from subindexes of the JPM EMBI Global.
J.P. Morgan (JPM) Euro Emerging Markets Bond Index (EMBI) Global tracks total returns for euro-denominated, straight fixed coupon instruments issued by emerging market sovereign and quasi-sovereign entities.
J.P. Morgan (JPM) Government Bond Index (GBI)-Emerging Markets (EM) tracks total returns for liquid, fixed-rate, local currency emerging market government bonds. Local bond market returns are from country subindexes of the JPM GBI-EM.
J.P. Morgan (JPM) Government Bond Index (GBI) Global tracks total returns for liquid, fixed-rate, domestic government bonds with maturities greater than one year issued by developed countries globally.
Lehman Brothers (LB) U.S. Aggregate Index represents securities that are SEC-registered, taxable and dollar denominated. The index covers the U.S. investment grade fixed-rate bond market, with index components for government and corporate securities, mortgage pass-through securities and asset-backed securities. All issues included must have at least one year to final maturity and must be rated investment grade (Baa3 or better) by Moody’s Investors Service. They must also be dollar denominated and nonconvertible. Total return includes price appreciation/depreciation and income as a percentage of the original investment. The index is rebalanced monthly by market capitalization.
Lehman Brothers (LB) U.S. Government: Intermediate Index is the intermediate component of the LB U.S. Government Index. The index includes securities issued by the U.S. government or agency. These include obligations of the U.S. Treasury with remaining maturity of one year or more and publicly issued debt of U.S. governmental agencies, quasi-federal corporations, and corporate or foreign debt guaranteed by the U.S. government.
Lipper High Current Yield Funds Classification Average is an equally weighted average calculation of performance figures for all funds within the Lipper High Current Yield Funds classification in the Lipper Open-End underlying funds universe. Lipper High Current Yield Funds aim at high (relative) current yield from fixed income securities, have no quality or maturity restrictions, and tend to invest in lower grade debt issues. For the 12-month period ended 12/31/07, there were 455 funds in this category. Lipper calculations do not include contract fees, expenses or sales charges, and may have been different if such charges had been considered.
Lipper Multi-Sector Income Funds Classification Average is an equally weighted average calculation of performance figures for all funds within the Lipper Multi-Sector Income Funds classification in the Lipper Open-End underlying funds universe. Lipper Multi-Sector Income Funds are defined as funds that seek current income by allocating assets among different fixed income securities sectors (not primarily in one sector except for defensive purposes), including U.S. and foreign governments, with a significant portion rated below investment grade. For the 12-month period ended 12/31/07, there were 124 funds in this category. Lipper calculations do not include contract fees, expenses or sales charges, and may have been different if such charges had been considered.
Lipper VIP Equity Income Funds Classification Average is an equally weighted average calculation of performance figures for all funds within the Lipper Equity Income Funds classification in the Lipper VIP underlying funds universe. Lipper Equity Income Funds seek relatively high current income and growth of income through investing 65% or more of their portfolios in equities. For the 12-month period ended 12/31/07, there were 58 funds in this category. Lipper calculations do not include contract fees, expenses or sales charges, and may have been different if such charges had been considered.
I-1
Lipper VIP General U.S. Government Funds Classification Average is an equally weighted average calculation of performance figures for all funds within the Lipper U.S. Government Funds classification in the Lipper VIP underlying funds universe. Lipper U.S. Government Funds invest primarily in U.S. government and agency issues. For the 12-month period ended 12/31/07, there were 69 funds in this category. Lipper calculations do not include contract fees, expenses or sales charges, and may have been different if such charges had been considered.
Lipper VIP High Current Yield Funds Classification Average is an equally weighted average calculation of performance figures for all funds within the Lipper High Current Yield Funds in the Lipper VIP underlying funds universe. Lipper High Current Yield Funds aim at high (relative) current yield from fixed income securities, have no quality or maturity restrictions, and tend to invest in lower grade debt issues. For the 12-month period ended 12/31/07, there were 108 funds in this category. Lipper calculations do not include contract fees, expenses or sales charges, and may have been different if such charges had been considered.
Merrill Lynch 2- and 5-Year Zero Coupon Bond Indexes include zero coupon bonds that pay no interest and are issued at a discount from redemption price.
Morgan Stanley Capital International (MSCI) All Country (AC) World Index is a free float-adjusted, market capitalization-weighted index designed to measure equity market performance in global developed and emerging markets.
Morgan Stanley Capital International (MSCI) Emerging Markets (EM) Index is a free float-adjusted, market capitalization-weighted index designed to measure equity market performance in global emerging markets.
Morgan Stanley Capital International (MSCI) Europe, Australasia, Far East (EAFE) Index is a free float-adjusted, market capitalization-weighted index designed to measure equity market performance in global developed markets excluding the U.S. and Canada.
Morgan Stanley Capital International (MSCI) World Index is a free float-adjusted, market capitalization-weighted index designed to measure equity market performance in global developed markets.
NASDAQ Composite Index measures all NASDAQ domestic and international based common type stocks listed on The NASDAQ Stock Market. The index is market value weighted and includes more than 3,000 companies.
Russell 1000® Growth Index is market capitalization weighted and measures performance of those Russell 1000 Index companies with higher price-to-book ratios and higher forecasted growth values.
Russell 1000 Index is market capitalization weighted and measures performance of the 1,000 largest companies in the Russell 3000 Index, which represent approximately 92% of total market capitalization of the Russell 3000 Index.
Russell 1000 Value Index is market capitalization weighted and measures performance of those Russell 1000 Index companies with lower price-to-book ratios and lower forecasted growth values.
Russell 2500™ Index is market capitalization weighted and measures performance of the 2,500 smallest companies in the Russell 3000 Index, which represent approximately 17% of total market capitalization of the Russell 3000 Index.
Russell 2500 Value Index is market capitalization weighted and measures performance of those Russell 2500 Index companies with lower price-to-book ratios and lower forecasted growth values.
Russell 3000® Growth Index is market capitalization weighted and measures performance of those Russell 3000 Index companies with higher price-to-book ratios and higher forecasted growth values.
Russell 3000 Index is market capitalization weighted and measures performance of the 3,000 largest U.S. companies based on total market capitalization, which represent approximately 98% of the investible U.S. equity market.
Russell Midcap® Growth Index is market capitalization weighted and measures performance of those Russell Midcap Index companies with higher price-to-book ratios and higher forecasted growth values.
Russell Midcap Index is market capitalization weighted and measures performance of the 800 smallest companies in the Russell 1000 Index, which represent approximately 26% of total market capitalization of the Russell 1000 Index.
Standard & Poor’s 500 Index (S&P 500) consists of 500 stocks chosen for market size, liquidity and industry group representation. Each stock’s weight in the index is proportionate to its market value. The S&P 500 is one of the most widely used benchmarks of U.S. equity performance.
I-2
Standard & Poor’s/Citigroup BMI Global REIT Index is designed to measure performance of the investible universe of publicly traded real estate investment trusts. Index constituents generally derive more than 60% of revenue from real estate development, management, rental, and/or direct investment in physical property and with local REIT or property trust tax status.
Standard & Poor’s/International Finance Corporation Investable (S&P/IFCI) Composite Index is a free float-adjusted, market capitalization-weighted index designed to measure equity performance in global emerging markets.
I-3
Board Members and Officers
The name, year of birth and address of the officers and board members, as well as their affiliations, positions held with the Trust, principal occupation during the past five years and number of portfolios overseen in the Franklin Templeton Investments fund complex are shown below. Generally, each board member serves until that person’s successor is elected and qualified.
Independent Board Members
| | | | | | | | |
| Name, Year of Birth and Address | | Position | | Length of
Time Served | | Number of
Portfolios in Fund
Complex Overseen
by Board Member* | | Other Directorships Held |
HARRIS J. ASHTON (1932) One Franklin Parkway San Mateo, CA 94403-1906 | | Trustee | | Since 1988 | | 141 | | Bar-S Foods (meat packing company). |
|
Principal Occupation During Past 5 Years: Director of various companies; and formerly, Director, RBC Holdings, Inc. (bank holding company) (until 2002); and President, Chief Executive Officer and Chairman of the Board, General Host Corporation (nursery and craft centers) (until 1998). |
ROBERT F. CARLSON (1928) One Franklin Parkway San Mateo, CA 94403-1906 | | Trustee | | Since 1998 | | 121 | | None |
|
Principal Occupation During Past 5 Years: Vice President, senior member and past President, Board of Administration, California Public Employees Retirement Systems (CALPERS); and formerly, member and Chairman of the Board, Sutter Community Hospitals; member, Corporate Board, Blue Shield of California; and Chief Counsel, California Department of Transportation. |
SAM GINN (1937) One Franklin Parkway San Mateo, CA 94403-1906 | | Trustee | | Since March 2007 | | 121 | | Chevron Corporation (global energy company) and ICO Global Communications (Holdings) Limited (satellite company). |
|
Principal Occupation During Past 5 Years: Private investor; and formerly, Chairman of the Board, Vodafone AirTouch, PLC (wireless company); Chairman of the Board and Chief Executive Officer, AirTouch Communications (cellular communications) (1993-1998) and Pacific Telesis Groups (telephone holding company) (1988-1994). |
EDITH E. HOLIDAY (1952) One Franklin Parkway San Mateo, CA 94403-1906 | | Trustee | | Since 2005 | | 141 | | Hess Corporation (exploration and refining of oil and gas), H.J. Heinz Company (processed foods and allied products), RTI International Metals, Inc. (manufacture and distribution of titanium), Canadian National Railway (railroad) and White Mountains Insurance Group, Ltd. (holding company). |
|
Principal Occupation During Past 5 Years: Director or Trustee of various companies and trusts; and formerly, Assistant to the President of the United States and Secretary of the Cabinet (1990-1993); General Counsel to the United States Treasury Department (1989-1990); and Counselor to the Secretary and Assistant Secretary for Public Affairs and Public Liaison-United States Treasury Department (1988-1989). |
FRANK W.T. LAHAYE (1929) One Franklin Parkway San Mateo, CA 94403-1906 | | Trustee | | Since 1988 | | 121 | | Center for Creative Land Recycling (brownfield redevelopment). |
|
Principal Occupation During Past 5 Years: General Partner, Las Olas L.P. (Asset Management); and formerly, Chairman, Peregrine Venture Management Company (venture capital). |
BOD-1
| | | | | | | | |
| Name, Year of Birth and Address | | Position | | Length of
Time Served | | Number of
Portfolios in Fund
Complex Overseen
by Board Member* | | Other Directorships Held |
FRANK A. OLSON (1932) One Franklin Parkway San Mateo, CA 94403-1906 | | Trustee | | Since 2005 | | 141 | | Hess Corporation (exploration and refining of oil and gas) and Sentient Jet (private jet service). |
|
Principal Occupation During Past 5 Years: Chairman Emeritus, The Hertz Corporation (car rental) (since 2000) (Chairman of the Board (1980-2000) and Chief Executive Officer (1977-1999)); and formerly, Chairman of the Board, President and Chief Executive Officer, UAL Corporation (airlines). |
LARRY D. THOMPSON (1945) One Franklin Parkway San Mateo, CA 94403-1906 | | Trustee | | Since March 2007 | | 141 | | None |
Principal Occupation During Past 5 Years: Senior Vice President—Government Affairs, General Counsel and Secretary, PepsiCo, Inc. (consumer products); and formerly, Director, Delta Airlines (aviation) (2003-2005) and Providian Financial Corp. (credit card provider) (1997-2001); Senior Fellow of The Brookings Institution (2003-2004); Visiting Professor, University of Georgia School of Law (2004); and Deputy Attorney General, U.S. Department of Justice (2001-2003). |
JOHN B. WILSON (1959) One Franklin Parkway San Mateo, CA 94403-1906 | | Lead Independent Trustee | | Trustee since March 2007 and Lead Independent Trustee since January 2008 | | 121 | | None |
Principal Occupation During Past 5 Years: President and Founder, Hyannis Port Capital, Inc. (real estate and private equity investing); serves on private and non-profit boards; and formerly, Chief Operating Officer and Executive Vice President, Gap, Inc. (retail) (1996-2000); Chief Financial Officer and Executive Vice President—Finance and Strategy, Staples, Inc. (office supplies) (1992-1996); Executive vice President—Corporate Planning, Northwest Airlines, Inc. (airlines) (1990-1992); and Vice President and Partner, Bain & Company (consulting firm) (1986-1990). |
Interested Board Members and Officers
| | | | | | | | |
| Name, Year of Birth and Address | | Position | | Length of
Time Served | | Number of
Portfolios in Fund
Complex Overseen
by Board Member* | | Other Directorships Held |
**CHARLES B. JOHNSON (1933) One Franklin Parkway San Mateo, CA 94403-1906 | | Trustee and Chairman of the Board | | Since 1988 | | 142 | | None |
Principal Occupation During Past 5 Years: Chairman of the Board, Member—Office of the Chairman and Director, Franklin Resources, Inc.; Director, Templeton Worldwide, Inc.; and officer and/or director or trustee, as the case may be, of some of the other subsidiaries of Franklin Resources, Inc. and of 42 of the investment companies in Franklin Templeton Investments. |
**RUPERT H. JOHNSON, JR. (1940) One Franklin Parkway San Mateo, CA 94403-1906 | | Trustee, President and Chief Executive Officer—Investment Management | | Trustee since 1988 and President and Chief Executive Officer—Investment Management since 2002 | | 126 | | None |
Principal Occupation During Past 5 Years: Vice Chairman, Member—Office of the Chairman and Director, Franklin Resources, Inc.; Director, Franklin Advisers, Inc. and Templeton Worldwide, Inc.; Senior Vice President, Franklin Advisory Services, LLC; and officer and/or director or trustee, as the case may be, of some of the other subsidiaries of Franklin Resources, Inc. and of 44 of the investment companies in Franklin Templeton Investments. |
BOD-2
| | | | | | | | |
| Name, Year of Birth and Address | | Position | | Length of
Time Served | | Number of
Portfolios in Fund
Complex Overseen
by Board Member* | | Other Directorships Held |
JAMES M. DAVIS (1952) One Franklin Parkway San Mateo, CA 94403-1906 | | Chief Compliance Officer and Vice President—AML Compliance | | Chief Compliance Officer since 2004 and Vice President—AML Compliance since 2006 | | Not
Applicable | | Not Applicable |
Principal Occupation During Past 5 Years: Director, Global Compliance, Franklin Resources, Inc.; officer of some of the other subsidiaries of Franklin Resources, Inc. and of 46 of the investment companies in Franklin Templeton Investments; and formerly, Director of Compliance, Franklin Resources, Inc. (1994-2001). |
LAURA FERGERSON (1962) One Franklin Parkway San Mateo, CA 94403-1906 | | Treasurer | | Since 2004 | | Not
Applicable | | Not Applicable |
|
Principal Occupation During Past 5 Years: Vice President, Franklin Templeton Services, LLC; officer of 28 of the investment companies in Franklin Templeton Investments; and formerly, Director and member of Audit and Valuation Committees, Runkel Funds, Inc. (2003-2004); Assistant Treasurer of most of the investment companies in Franklin Templeton Investments (1997-2003); and Vice President, Franklin Templeton Services, LLC (1997-2003). |
JIMMY D. GAMBILL (1947) 500 East Broward Blvd. Suite 2100 Fort Lauderdale, FL 33394-3091 | | Senior Vice President and Chief Executive Officer—Finance and Administration | | Since 2002 | | Not
Applicable | | Not Applicable |
|
Principal Occupation During Past 5 Years: President, Franklin Templeton Services, LLC; Senior Vice President, Templeton Worldwide, Inc.; and officer of some of the other subsidiaries of Franklin Resources, Inc. and of 46 of the investment companies in Franklin Templeton Investments. |
DAVID P. GOSS (1947) One Franklin Parkway San Mateo, CA 94403-1906 | | Vice President | | Since 2000 | | Not
Applicable | | Not Applicable |
|
Principal Occupation During Past 5 Years: Senior Associate General Counsel, Franklin Templeton Investments; officer and director of one of the subsidiaries of Franklin Resources, Inc.; and officer of 46 of the investment companies in Franklin Templeton Investments. |
KAREN L. SKIDMORE (1952) One Franklin Parkway San Mateo, CA 94403-1906 | | Vice President
and Secretary | | Since 2006 | | Not
Applicable | | Not Applicable |
|
Principal Occupation During Past 5 Years: Senior Associate General Counsel, Franklin Templeton Investments; and officer of 30 of the investment companies in Franklin Templeton Investments. |
BOD-3
| | | | | | | | |
| Name, Year of Birth and Address | | Position | | Length of
Time Served | | Number of
Portfolios in Fund
Complex Overseen
by Board Member* | | Other Directorships Held |
CRAIG S. TYLE (1960) One Franklin Parkway San Mateo, CA 94403-1906 | | Vice President | | Since 2005 | | Not
Applicable | | Not Applicable |
|
Principal Occupation During Past 5 Years: General Counsel and Executive Vice President, Franklin Resources, Inc.; officer of some of the other subsidiaries of Franklin Resources, Inc. and of 46 of the investment companies in Franklin Templeton Investments; and formerly, Partner, Shearman & Sterling, LLP (2004-2005); and General Counsel, Investment Company Institute (ICI) (1997-2004). |
GALEN G. VETTER (1951) 500 East Broward Blvd. Suite 2100 Fort Lauderdale, FL 33394-3091 | | Chief Financial Officer and Chief Accounting Officer | | Since 2004 | | Not
Applicable | | Not Applicable |
|
Principal Occupation During Past 5 Years: Senior Vice President, Franklin Templeton Services, LLC; officer of some of the other subsidiaries of Franklin Resources, Inc. and of 46 of the investment companies in Franklin Templeton Investments; and formerly, Managing Director, RSM McGladrey, Inc. (1999-2004); and Partner, McGladrey & Pullen, LLP (1979-1987 and 1991-2004). |
| *We | base the number of portfolios on each separate series of the U.S. registered investment companies within the Franklin Templeton Investments fund complex. These portfolios have a common investment manager or affiliated investment managers. |
| **Charles | B. Johnson and Rupert H. Johnson, Jr. are considered to be interested persons of the Fund under the federal securities laws due to their positions as officers and directors and major shareholders of Franklin Resources, Inc., which is the parent company of the Trust’s manager and distributor. |
Note 1: Charles B. Johnson and Rupert H. Johnson, Jr. are brothers.
Note 2: Officer information is current as of the date of this report. It is possible that after this date, information about officers may change.
The Sarbanes-Oxley Act of 2002 and Rules adopted by the Securities and Exchange Commission require the Fund to disclose whether the Fund’s Audit Committee includes at least one member who is an audit committee financial expert within the meaning of such Act and Rules. The Fund’s Board has determined that there is at least one such financial expert on the Audit Committee and has designated John B. Wilson as its audit committee financial expert. The Board believes that Mr. Wilson qualifies as such an expert in view of his extensive business background and experience, including service as chief financial officer of Staples, Inc. from 1992 to 1996. Mr. Wilson has been a Member and Chairman of the Fund’s Audit Committee since 2006. As a result of such background and experience, the Board believes that Mr. Wilson has acquired an understanding of generally accepted accounting principles and financial statements, the general application of such principles in connection with the accounting estimates, accruals and reserves, and analyzing and evaluating financial statements that present a breadth and level of complexity of accounting issues generally comparable to those of the Fund, as well as an understanding of internal controls and procedures for financial reporting and an understanding of audit committee functions. Mr. Wilson is an independent Board member as that term is defined under the relevant Securities and Exchange Commission Rules and Releases.
The Statement of Additional Information (SAI) includes additional information about the board members and is available, without charge, upon request. Shareholders may call 1-800/321-8563 or their insurance companies to request the SAI.
BOD-4
Franklin Templeton Variable Insurance Products Trust
Shareholder Information
Proxy Voting Policies and Procedures
The Trust has established Proxy Voting Policies and Procedures (Policies) that the Trust uses to determine how to vote proxies relating to portfolio securities. Shareholders may view the Trust’s complete Policies online at franklintempleton.com. Alternatively, shareholders may request copies of the Policies free of charge by calling the Proxy Group collect at 1-954/527-7678 or by sending a written request to: Franklin Templeton Companies, LLC, 500 East Broward Boulevard, Suite 1500, Fort Lauderdale, FL 33394, Attention: Proxy Group. Copies of the Trust’s proxy voting records are also made available online at franklintempleton.com and posted on the U.S. Securities and Exchange Commission’s website at sec.gov and reflect the most recent 12-month period ended June 30.
Quarterly Statement of Investments
The Trust files a complete statement of investments with the U.S. Securities and Exchange Commission for the first and third quarters for each fiscal year on Form N-Q. Shareholders may view the filed Form N-Q by visiting the Commission’s website at sec.gov. The filed form may also be viewed and copied at the Commission’s Public Reference Room in Washington, DC. Information regarding the operations of the Public Reference Room may be obtained by calling 1-800/SEC-0330.
SI-1
| | |
 | | One Franklin Parkway San Mateo, CA 94403-1906 |
Annual Report
FRANKLIN TEMPLETON
VARIABLE INSURANCE PRODUCTS TRUST
Investment Managers
Franklin Advisers, Inc.
Franklin Advisory Services, LLC
Franklin Mutual Advisers, LLC
Franklin Templeton Institutional, LLC
Templeton Asset Management, Ltd., Singapore
Templeton Global Advisors Limited
Templeton Investment Counsel, LLC
Distributor
Franklin Templeton Distributors, Inc.
Franklin Templeton Variable Insurance Products Trust (FTVIP) shares are sold only to insurance company separate accounts (Separate Account) to serve as the investment vehicles for both variable annuity and variable life insurance contracts.
Authorized for distribution to investors in Separate Accounts only when accompanied or preceded by the current prospectus for the applicable contract, which includes the Separate Account and the FTVIP prospectuses. Investors should carefully consider a fund’s investment goals, risks, charges and expenses before investing. The prospectus contains this and other information; please read it carefully before investing.
To ensure the highest quality of service, telephone calls to or from our service departments may be monitored, recorded and accessed. These calls can be identified by the presence of a regular beeping tone.
FTVIP A2007 02/08
| (a) | The Registrant has adopted a code of ethics that applies to its principal executive officers and principal financial and accounting officer. |
| (f) | Pursuant to Item 12(a)(1), the Registrant is attaching as an exhibit a copy of its code of ethics that applies to its principal executive officers and principal financial and accounting officer. |
| Item 3. | Audit Committee Financial Expert. |
| (a) | (1) The Registrant has an audit committee financial expert serving on its audit committee. |
| | |
| (2) | | The audit committee financial expert is John B. Wilson and he is “independent” as defined under the relevant Securities and Exchange Commission Rules and Releases. |
| Item 4. | Principal Accountant Fees and Services. |
(a) Audit Fees
The aggregate fees paid to the principal accountant for professional services rendered by the principal accountant for the audit of the registrant’s annual financial statements or for services that are normally provided by the principal accountant in connection with statutory and regulatory filings or engagements were $851,956 for the fiscal year ended December 31, 2007 and $771,869 for the fiscal year ended December 31, 2006.
(b) Audit-Related Fees
There were no fees paid to the principal accountant for assurance and related services rendered by the principal accountant to the registrant that are reasonably related to the performance of the audit of the registrant’s financial statements and are not reported under paragraph (a) of Item 4.
There were no fees paid to the principal accountant for assurance and related services rendered by the principal accountant to the registrant’s investment adviser and any entity controlling, controlled by or under common control with the investment adviser that provides ongoing services to the registrant that are reasonably related to the performance of the audit of their financial statements.
(c) Tax Fees
There were no fees paid to the principal accountant for professional services rendered by the principal accountant to the registrant for tax compliance, tax advice and tax planning.
The aggregate fees paid to the principal accountant for professional services rendered by the principal accountant to the registrant’s investment adviser and any entity controlling, controlled by or under common control with the investment adviser that provides ongoing services to the registrant for tax compliance, tax advice and tax planning were $46,000 for the fiscal year ended December 31, 2007 and $3,961 for the fiscal year ended December 31, 2006. The services for which these fees were paid included tax compliance and advice.
(d) All Other Fees
The aggregate fees paid to the principal accountant for products and services rendered by the principal accountant to the registrant not reported in paragraphs (a)-(c) of Item 4 were $0 for the fiscal year ended December 31, 2007 and $14,799 for the fiscal year ended December 31, 2006. The services for which these fees were paid included review of materials provided to the fund Board in connection with the investment management contract renewal process.
The aggregate fees paid to the principal accountant for products and services rendered by the principal accountant to the registrant’s investment adviser and any entity controlling, controlled by or under common control with the investment adviser that provides ongoing
services to the registrant other than services reported in paragraphs (a)-(c) of Item 4 were $0 for the fiscal year ended December 31, 2007 and $161,062 for the fiscal year ended December 31, 2006. The services for which these fees were paid included review of materials provided to the fund Board in connect with the investment management contract renewal process.
(e) (1) The registrant’s audit committee is directly responsible for approving the services to be provided by the auditors, including:
(i) pre-approval of all audit and audit related services;
(ii) pre-approval of all non-audit related services to be provided to the Fund by the auditors;
(iii) pre-approval of all non-audit related services to be provided to the registrant by the auditors to the registrant’s investment adviser or to any entity that controls, is controlled by or is under common control with the registrant’s investment adviser and that provides ongoing services to the registrant where the non-audit services relate directly to the operations or financial reporting of the registrant; and
(iv) establishment by the audit committee, if deemed necessary or appropriate, as an alternative to committee pre-approval of services to be provided by the auditors, as required by paragraphs (ii) and (iii) above, of policies and procedures to permit such services to be pre-approved by other means, such as through establishment of guidelines or by action of a designated member or members of the committee; provided the policies and procedures are detailed as to the particular service and the committee is informed of each service and such policies and procedures do not include delegation of audit committee responsibilities, as contemplated under the Securities Exchange Act of 1934, to management; subject, in the case of (ii) through (iv), to any waivers, exceptions or exemptions that may be available under applicable law or rules.
(e) (2) None of the services provided to the registrant described in paragraphs (b)-(d) of Item 4 were approved by the audit committee pursuant to paragraph (c)(7)(i)(C) of Rule 2-01 of regulation S-X.
(f) No disclosures are required by this Item 4(f).
(g) The aggregate non-audit fees paid to the principal accountant for services rendered by the principal accountant to the registrant and the registrant’s investment adviser and any entity controlling, controlled by or under common control with the investment adviser that provides ongoing services to the registrant were $46,000 for the fiscal year ended December 31, 2007 and $179,822 for the fiscal year ended December 31, 2006.
(h) The registrant’s audit committee of the board has considered whether the provision of non-audit services that were rendered to the registrant’s investment adviser (not including any sub-adviser whose role is primarily portfolio management and is subcontracted with or overseen by another investment adviser), and any entity controlling, controlled by, or under common control with the investment adviser that
provides ongoing services to the registrant that were not pre-approved pursuant to paragraph (c)(7)(ii) of Rule 2-01 of Regulation S-X is compatible with maintaining the principal accountant’s independence.
| Item 5. | Audit Committee of Listed Registrants. |
N/A
| Item 6. | Schedule of Investments. |
N/A
| Item 7. | Disclosure of Proxy Voting Policies and Procedures for Closed-End Management Investment Companies. |
N/A
| Item 8. | Portfolio Managers of Closed-End Management Investment Companies. |
N/A
| Item 9. | Purchases of Equity Securities by Closed-End Management Investment Companies and Affiliated Purchases. |
N/A
| Item 10. | Submission of Matters to a vote of Security Holders. |
There have been no changes to the procedures by which shareholders may recommend nominees to the Registrant’s Board of Trustees that would require disclosure herein.
| Item 11. | Controls and Procedures. |
(a) Evaluation of Disclosure Controls and Procedures. The Registrant maintains disclosure controls and procedures that are designed to ensure that information required to be disclosed in the Registrant’s filings under the Securities Exchange Act of 1934 and the Investment Company Act of 1940 is recorded, processed, summarized and reported within the periods specified in the rules and forms of the Securities and Exchange Commission. Such information is accumulated and communicated to the Registrant’s management, including its principal executive officer and principal financial officer, as appropriate, to allow timely decisions regarding required disclosure. The Registrant’s management, including the principal executive officer and the principal financial officer, recognizes that any set of controls and procedures, no matter how well designed and operated, can provide only reasonable assurance of achieving the desired control objectives.
Within 90 days prior to the filing date of this Shareholder Report on Form N-CSR, the Registrant had carried out an evaluation, under the supervision and with the participation of the Registrant’s management, including the Registrant’s principal executive officer and the Registrant’s principal financial officer, of the effectiveness of the design and operation of the Registrant’s disclosure controls and procedures. Based on such evaluation, the Registrant’s principal executive officer and principal financial officer concluded that the Registrant’s disclosure controls and procedures are effective.
(b) Changes in Internal Controls. There have been no significant changes in the Registrant’s internal controls or in other factors that
could significantly affect the internal controls subsequent to the date of their evaluation in connection with the preparation of this Shareholder Report on Form N-CSR.
(a) (1) Code of Ethics
(a) (2) Certifications pursuant to Section 302 of the Sarbanes-Oxley Act of 2002 of Galen G. Vetter, Chief Executive Officer—Finance and Administration, and Laura Fergerson, Chief Financial Officer and Chief Accounting Officer
(b) Certifications pursuant to Section 906 of the Sarbanes-Oxley Act of 2002 of Galen G. Vetter, Chief Executive Officer—Finance and Administration, and Laura Fergerson, Chief Financial Officer and Chief Accounting Officer
SIGNATURES
Pursuant to the requirements of the Securities Exchange Act of 1934 and the Investment Company Act of 1940, the registrant has duly caused this report to be signed on its behalf by the undersigned, thereunto duly authorized.
FRANKLIN TEMPLETON VARIABLE INSURANCE PRODUCTS TRUST
| | |
| By: | | /s/ GALEN G. VETTER |
| | Galen G. Vetter |
| | Chief Executive Officer – Finance and Administration |
| | Date February 27, 2008 |
Pursuant to the requirements of the Securities Exchange Act of 1934 and the Investment Company Act of 1940, this report has been signed below by the following persons on behalf of the registrant and in the capacities and on the dates indicated.
| | |
| By: | | /s/ GALEN G. VETTER |
| | Galen G. Vetter |
| | Chief Executive Officer – Finance and Administration |
| | Date February 27, 2008 |
| |
| By: | | /s/ LAURA FERGERSON |
| | Laura Fergerson |
| | Chief Financial Officer and Chief Accounting Officer |
| | Date February 27, 2008 |