UNITED STATES
SECURITIES AND EXCHANGE COMMISSION
Washington, D.C. 20549
FORM N-CSR
CERTIFIED SHAREHOLDER REPORT OF REGISTERED MANAGEMENT INVESTMENT COMPANIES
Investment Company Act file number 811-05583
Franklin Templeton Variable Insurance Products Trust
(Exact name of registrant as specified in charter)
One Franklin Parkway, San Mateo, CA 94403-1906
(Address of principal executive offices) (Zip code)
Craig S. Tyle, One Franklin Parkway, San Mateo, CA 94403-1906
(Name and address of agent for service)
Registrant’s telephone number, including area code: (650) 312-2000
Date of fiscal year end: 12/31
Date of reporting period: 12/31/06
| Item 1. | Reports to Stockholders. |

DECEMBER 31, 2006
TEMPLETON RETIREMENT ANNUITY
ANNUAL REPORT
· TRA SEPARATE ACCOUNT
· FRANKLIN TEMPLETON VARIABLE INSURANCE PRODUCTS TRUST
TEMPLETON GROWTH SECURITIES FUND - CLASS 1

TEMPLETON RETIREMENT ANNUITY
ANNUAL REPORT
TABLEOF CONTENTS
| | |
Important Notes to Performance Information | | i |
*Prospectus Supplement for All Funds | | SUPP-1 |
Performance | | TG-1 |
Manager’s Discussion | | TG-3 |
Financial Highlights | | TG-7 |
Statement of Investments | | TG-9 |
Financial Statements | | TG-14 |
Notes to Financial Statements | | TG-17 |
Templeton Retirement Annuity
Separate Account Financials | | SA-1 |
Index Descriptions | | I-1 |
Board Members and Officers | | BOD-1 |
Proxy Voting Policies and Procedures | | PV-1 |
*Not part of the annual report
Statement on Current Industry Issues
In our efforts to fulfill our ongoing commitment to provide you with timely and accurate information, we have prepared a statement on current industry issues as they pertain to Franklin Resources, Inc., and our subsidiary companies (Franklin Templeton Investments). You can find the most updated “Statement on Current Industry Issues” and a detailed Q&A at franklintempleton.com, or call us at 1-800/632-2301.
NOT FDIC INSURED | MAY LOSE VALUE | NO BANK GUARANTEE
MOUTON TRA 02/07
IMPORTANT NOTESTOPERFORMANCE INFORMATION
Performance data is historical and cannot predict or guarantee future results. Principal value and investment return will fluctuate with market conditions, and you may have a gain or loss when you withdraw your money. Inception dates of the funds may have preceded the effective dates of the subaccounts, contracts, or their availability in all states.
When reviewing the index comparisons, please keep in mind that indexes have a number of inherent performance differentials over the funds. First, unlike the funds, which must hold a minimum amount of cash to maintain liquidity, indexes do not have a cash component. Second, the funds are actively managed and, thus, are subject to management fees to cover salaries of securities analysts or portfolio managers in addition to other expenses. Indexes are unmanaged and do not include any commissions or other expenses typically associated with investing in securities. Third, indexes often contain a different mix of securities than the fund to which they are compared. Additionally, please remember that indexes are simply a measure of performance and cannot be invested in directly.
i
SUPPLEMENT DATED FEBRUARY 16, 2007
TOTHE PROSPECTUSES DATED MAY 1, 2006OF
FRANKLIN TEMPLETON VARIABLE INSURANCE PRODUCTS TRUST
FRANKLIN FLEX CAP GROWTH SECURITIES FUND
FRANKLIN GLOBAL COMMUNICATIONS SECURITIES FUND
FRANKLIN GROWTHAND INCOME SECURITIES FUND
FRANKLIN HIGH INCOME SECURITIES FUND
FRANKLIN INCOME SECURITIES FUND
FRANKLIN LARGE CAP GROWTH SECURITIES FUND
FRANKLIN LARGE CAP VALUE SECURITIES FUND
FRANKLIN MONEY MARKET FUND
FRANKLIN REAL ESTATE FUND
FRANKLIN RISING DIVIDENDS SECURITIES FUND
FRANKLIN SMALL CAP VALUE SECURITIES FUND
FRANKLIN SMALL-MID CAP GROWTH SECURITIES FUND
FRANKLIN STRATEGIC INCOME SECURITIES FUND
FRANKLIN U.S. GOVERNMENT FUND
FRANKLIN ZERO COUPON FUND —MATURINGIN DECEMBER 2010
MUTUAL DISCOVERY SECURITIES FUND
MUTUAL SHARES SECURITIES FUND
TEMPLETON DEVELOPING MARKETS SECURITIES FUND
TEMPLETON FOREIGN SECURITIES FUND
TEMPLETON GLOBAL ASSET ALLOCATION FUND
TEMPLETON GLOBAL INCOME SECURITIES FUND
TEMPLETON GROWTH SECURITIES FUND (THE “FUNDS”)
The prospectuses of the Funds are amended by adding the following after the first paragraph in the section titled “Overview”:
Shares of the Funds may also be offered to and purchased by other investment companies. Throughout this prospectus and the Statement of Additional Information, references to “Contracts,” “Contract Owners,” and “Insurers,” each defined below, may also include such investment company purchasers where appropriate.
Please keep this supplement for future reference.
SUPP-1
TEMPLETON GROWTH SECURITIES FUND
We are pleased to bring you Templeton Growth Securities Fund’s annual report for the fiscal year ended December 31, 2006.
Performance Summary as of 12/31/06
Average annual total return of Class 1 shares represents the average annual change in value, assuming reinvestment of dividends and capital gains. Average returns smooth out variations in returns, which can be significant; they are not the same as year-by-year results.
Periods ended 12/31/06
| | | | | | |
| | | 1-Year | | 5-Year | | 10-Year |
Average Annual Total Return | | +22.20% | | +10.91% | | +9.73% |
Total Return Index Comparison for Hypothetical $10,000 Investment (1/1/97–12/31/06)
The graph below shows the change in value of a hypothetical $10,000 investment in the Fund over the indicated period and includes reinvestment of any income or distributions. The Fund’s performance is compared to the performance of the Morgan Stanley Capital International (MSCI) World Index. One cannot invest directly in an index, nor is an index representative of the Fund’s portfolio. Please see Important Notes to Performance Information preceding the Fund Summaries.
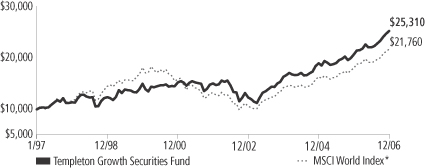
*Source: Standard & Poor’s Micropal. Please see Index Descriptions following the Fund Summaries.
Templeton Growth Securities Fund – Class 1
Performance reflects the Fund’s Class 1 operating expenses, but does not include any contract fees, expenses or sales charges. If they had been included, performance would be lower. These charges and deductions, particularly for variable life policies, can have a significant effect on contract values and insurance benefits. See the contract prospectus for a complete description of these expenses, including sales charges.
Performance data represent past performance, which does not guarantee future results. Investment return and principal value will fluctuate, and you may have a gain or loss when you sell your shares.
Current performance may differ from figures shown.
TG-1
Fund Goal and Main Investments: Templeton Growth Securities Fund seeks long-term capital growth. The Fund normally invests primarily in equity securities of companies located anywhere in the world, including those in the U.S. and in emerging markets.
Performance Overview
You can find the Fund’s one-year total return in the Performance Summary. The Fund outperformed the +20.65% return of the MSCI World Index for the period under review.1
Economic and Market Overview
The global economy grew in 2006, although gross domestic product growth slowed in the U.S. while it accelerated in Europe. The economic drivers remained consistent over the past four years: strong corporate and consumer demand, reasonably low inflation, a tight or improving labor market, and a relatively moderate interest rate environment, despite recent interest rate hikes by many of the world’s central banks. However, the economy also faced headwinds from elevated energy prices, higher global interest rates and a weaker U.S. housing market. These factors dampened investor confidence mid-year, when many equity markets declined before rebounding later in the year.
Despite such challenges, global economic activity was healthy. Strong global liquidity — whether petrodollars, corporate cash, private equity, household savings or central banks’ reserves — continued to search for a home. Largely as a result, bond yield spreads over U.S. Treasuries narrowed, and equity and commodity markets rose in the latter part of the year. The shift from risk aversion to risk tolerance was concurrent with the U.S. Federal Reserve Board’s decisions since June to hold the federal funds target rate at 5.25%, as well as with lower oil prices in the second half of the year.
Narrowing corporate credit spreads globally reflected greater risk tolerance, while abundant cash supplies in the capital markets contributed to record global merger and acquisition activity in 2006. The total value of deals announced as a result of hostile takeovers, private equity buyouts and broad corporate consolidation was $3.8 trillion.2 This figure surpassed the $3.4 trillion mark set in 2000.2 Announced deals from
1. Source: Standard & Poor’s Micropal. One cannot invest directly in an index, nor is an index representative of the Fund’s portfolio. Please see Index Descriptions following the Fund Summaries.
2. Source: “Can M&A’s ‘Best of Times’ Get Better?,” The Wall Street Journal, 1/2/07.
Fund Risks: The Fund’s investments in stocks offer the potential for long-term gains but can be subject to short-term price fluctuation. Foreign investing, especially in emerging markets, involves additional risks including currency fluctuations, economic instability, and social and political developments. By focusing on particular countries or sectors from time to time, the Fund may carry greater risk of adverse developments in a country or sector than a fund that invests in a wide variety of countries or sectors. Because the Fund invests in bonds and other debt obligations, the Fund’s share price and yield will be affected by interest rate movements. Bond prices generally move in the opposite direction from interest rates. Thus, as prices of bonds in the Fund adjust to a rise in interest rates, the Fund’s share price may decline. High yield, lower-rated (junk) bonds generally have greater price swings and higher default risks. The Fund’s prospectus also includes a description of the main investment risks.
TG-2
private equity alone reached a record $700 billion, more than double the record set in 2005 and 20 times greater than a decade ago.3
With this economic backdrop, the non-U.S. equity markets — including emerging markets that remained a major magnet for global fund flows — led global equity markets to end 2006 on a strong note, and all major regions delivered double-digit total returns for the year. Stock market indexes in the U.S. and most European countries reached six-year highs in the fourth quarter, and many emerging market indexes in Asia, Europe and Latin America neared or reached all-time highs.
Investment Strategy
Our investment philosophy is bottom-up, value-oriented and long-term. In choosing investments, we will focus on the market price of a company’s securities relative to our evaluation of the company’s potential long-term earnings, asset value and cash flow. Among factors we may consider are a company’s historical value measures, including price/earnings ratio, profit margins and liquidation value. We do in-depth research to construct a bargain list from which we buy.
Manager’s Discussion
During the reporting period, our stock selection in the consumer discretionary, health care and information technology (IT) sectors contributed to Fund performance relative to the MSCI World Index.4 U.S. media stocks within the consumer discretionary sector such as satellite broadcast service provider The DIRECTV Group, media conglomerate News Corp. and cable operator Comcast were among the best performers. Pharmaceuticals company Merck was a notable performer in the health care sector, while video game company Nintendo and software giant Microsoft led the IT sector. In addition, our overweighting in the consumer discretionary sector and underweighting in the energy sector relative to the benchmark index helped Fund performance.5
3. Source: “TPG tops buy-out league with $101bn,” The Wall Street Journal, 12/27/06.
4. The consumer discretionary sector comprises auto components; automobiles; diversified consumer services; hotels, restaurants and leisure; household durables; Internet and catalog retail; leisure equipment and products; media; and specialty retail in the SOI. The health care sector comprises health care equipment and supplies, health care providers and services, and pharmaceuticals in the SOI. The IT sector comprises computers and peripherals, electronic equipment and instruments, IT services, office electronics, semiconductors and semiconductor equipment, and software in the SOI.
5. The energy sector comprises oil, gas and consumable fuels in the SOI.
TG-3
On the other hand, our stock selection and underweighted position in the financials sector hurt relative Fund performance the most in the 12 months under review.6 Detractors included Japan’s banking conglomerate Mitsubishi UFJ Financial Group, South Korea’s Kookmin Bank, insurer American International Group (AIG) and Japan’s leading brokerage house Nomura Holdings. Furthermore, our underweighting in the utilities sector had a negative impact on the Fund.7
From a geographic perspective, our holdings in the U.S. and Japan contributed the most to relative Fund performance, while positions in France and Spain detracted. Cash was also a drag on relative performance.
It is important to recognize the effect of currency movements on the Fund’s performance. In general, if the value of the U.S. dollar goes up compared with a foreign currency, an investment traded in that foreign currency will go down in value because it will be worth fewer U.S. dollars. This can have a negative effect on Fund performance. Conversely, when the U.S. dollar weakens in relation to a foreign currency, an investment traded in that foreign currency will increase in value, which can contribute to Fund performance. For the 12 months ended December 31, 2006, the U.S. dollar declined in value relative to most non-U.S. currencies. As a result, the Fund’s performance was positively affected by the portfolio’s significant investment in securities with non-U.S. currency exposure. However, one cannot expect the same result in future periods.
Thank you for your participation in Templeton Growth Securities Fund. We look forward to serving your future investment needs.
6. The financials sector comprises capital markets, commercial banks, diversified financial services, insurance, and real estate management and development in the SOI.
7. The utilities sector comprises electric utilities and multi-utilities in the SOI.
The foregoing information reflects our analysis, opinions and portfolio holdings as of December 31, 2006, the end of the reporting period. The way we implement our main investment strategies and the resulting portfolio holdings may change depending on factors such as market and economic conditions. These opinions may not be relied upon as investment advice or an offer for a particular security. The information is not a complete analysis of every aspect of any market, country, industry, security or the Fund. Statements of fact are from sources considered reliable, but the investment manager makes no representation or warranty as to their completeness or accuracy. Although historical performance is no guarantee of future results, these insights may help you understand our investment management philosophy.
Top 10 Holdings
Templeton Growth Securities Fund
12/31/06
| | |
Company
Sector/Industry,
Country | | % of Total
Net Assets |
| Microsoft Corp. | | 2.2% |
| Software, U.S. | | |
| Tyco International Ltd. | | 2.1% |
| Industrial Conglomerates, U.S. | | |
| News Corp., A | | 2.0% |
| Media, U.S. | | |
| American International Group Inc. | | 1.9% |
| Insurance, U.S. | | |
| Royal Bank of Scotland Group PLC | | 1.9% |
| Commercial Banks, U.K. | | |
| Siemens AG | | 1.9% |
| Industrial Conglomerates, Germany | | |
| Merck & Co. Inc. | | 1.7% |
| Pharmaceuticals, U.S. | | |
| Viacom Inc., B | | 1.7% |
| Media, U.S. | | |
| Pfizer Inc. | | 1.6% |
| Pharmaceuticals, U.S. | | |
| HSBC Holdings PLC | | 1.6% |
| Commercial Banks, U.K. | | |
The dollar value, number of shares or principal amount, and names of portfolio holdings are listed in the Fund’s Statement of Investments (SOI).
TG-4
Templeton Growth Securities Fund – Class 1
Fund Expenses
As an investor in a variable insurance contract (“Contract”) that indirectly provides for investment in an underlying mutual fund, you can incur transaction and/or ongoing expenses at both the Fund level and the Contract level.
| • | | Transaction expenses can include sales charges (loads) on purchases, redemption fees, surrender fees, transfer fees and premium taxes. |
| • | | Ongoing expenses can include management fees, distribution and service (12b-1) fees, contract fees, annual maintenance fees, mortality and expense risk fees and other fees and expenses. All mutual funds and Contracts have some types of ongoing expenses. |
The expenses shown in the table are meant to highlight ongoing expenses at the Fund level only and do not include ongoing expenses at the Contract level, or transaction expenses at either the Fund or Contract level. While the Fund does not have transaction expenses, if the transaction and ongoing expenses at the Contract level were included, the expenses shown would be higher. You should consult your Contract prospectus or disclosure document for more information.
The table shows Fund-level ongoing expenses and can help you understand these expenses and compare them with those of other mutual funds offered through the Contract. The table assumes a $1,000 investment held for the six months indicated. Please refer to the Fund prospectus for additional information on operating expenses.
Actual Fund Expenses
The first line (Actual) of the table provides actual account values and expenses. The “Ending Account Value” is derived from the Fund’s actual return, which includes the effect of ongoing Fund expenses, but does not include the effect of ongoing Contract expenses.
You can estimate the Fund-level expenses you incurred during the period by following these steps. Of course, your account value and expenses will differ from those in this illustration:
| 1. | Divide your account value by $1,000. |
If an account had an $8,600 value, then $8,600 ÷ $1,000 = 8.6.
| 2. | Multiply the result by the number under the heading “Fund-Level Expenses Incurred During Period.” |
If Fund-Level Expenses Incurred During Period were $7.50, then 8.6 x $7.50 = $64.50.
In this illustration, the estimated expenses incurred this period at the Fund level are $64.50.
TG-5
Hypothetical Example for Comparison with Other Mutual Funds
Information in the second line (Hypothetical) of the table can help you compare ongoing expenses of the Fund with those of other mutual funds offered through the Contract. This information may not be used to estimate the actual ending account balance or expenses you incurred during the period. The hypothetical “Ending Account Value” is based on the Fund’s actual expense ratio and an assumed 5% annual rate of return before expenses, which does not represent the Fund’s actual return. The figure under the heading “Fund-Level Expenses Incurred During Period” shows the hypothetical expenses your account would have incurred under this scenario. You can compare this figure with the 5% hypothetical examples that appear in shareholder reports of other funds offered through a Contract.
| | | | | | | | | |
| Class 1 | | Beginning
Account
Value 7/1/06 | | Ending
Account
Value 12/31/06 | | Fund-Level
Expenses Incurred
During Period*
7/1/06–12/31/06 |
Actual | | $ | 1,000 | | $ | 1,145.30 | | $ | 4.11 |
Hypothetical (5% return before expenses) | | $ | 1,000 | | $ | 1,021.37 | | $ | 3.87 |
*Expenses are equal to the annualized expense ratio for the Fund’s Class 1 shares (0.76%), which does not include any ongoing expenses of the Contract for which the Fund is an investment option, multiplied by the average account value over the period, multiplied by 184/365 to reflect the one-half year period.
TG-6
Franklin Templeton Variable Insurance Products Trust
Financial Highlights
Templeton Growth Securities Fund
| | | | | | | | | | | | | | | | | | | | |
| | | Year Ended December 31, | |
| Class 1 | | 2006 | | | 2005 | | | 2004 | | | 2003 | | | 2002 | |
| | | | |
Per share operating performance | | | | | | | | | | | | | | | | | | | | |
(for a share outstanding throughout the year) | | | | | | | | | | | | | | | | | | | | |
Net asset value, beginning of year | | $ | 13.98 | | | $ | 12.98 | | | $ | 11.31 | | | $ | 8.67 | | | $ | 11.09 | |
| | | | |
Income from investment operationsa: | | | | | | | | | | | | | | | | | | | | |
Net investment incomeb | | | 0.29 | | | | 0.24 | | | | 0.21 | | | | 0.17 | | | | 0.17 | |
Net realized and unrealized gains (losses) | | | 2.67 | | | | 0.92 | | | | 1.61 | | | | 2.63 | | | | (2.13 | ) |
| | | | |
Total from investment operations | | | 2.96 | | | | 1.16 | | | | 1.82 | | | | 2.80 | | | | (1.96 | ) |
| | | | |
Less distributions from: | | | | | | | | | | | | | | | | | | | | |
Net investment income | | | (0.23 | ) | | | (0.16 | ) | | | (0.15 | ) | | | (0.16 | ) | | | (0.24 | ) |
Net realized gains | | | (0.55 | ) | | | — | | | | — | | | | — | | | | (0.22 | ) |
| | | | |
Total distributions | | | (0.78 | ) | | | (0.16 | ) | | | (0.15 | ) | | | (0.16 | ) | | | (0.46 | ) |
| | | | |
Net asset value, end of year | | $ | 16.16 | | | $ | 13.98 | | | $ | 12.98 | | | $ | 11.31 | | | $ | 8.67 | |
| | | | |
| | | | | |
Total returnc | | | 22.20% | | | | 9.06% | | | | 16.25% | | | | 32.62% | | | | (18.32)% | |
Ratios/supplemental data | | | | | | | | | | | | | | | | | | | | |
Net assets, end of year (000’s) | | $ | 413,871 | | | $ | 779,347 | | | $ | 800,118 | | | $ | 769,339 | | | $ | 665,537 | |
Ratios to average net assets: | | | | | | | | | | | | | | | | | | | | |
Expenses | | | 0.78% | d | | | 0.82% | d | | | 0.86% | d | | | 0.88% | | | | 0.87% | |
Net investment income | | | 1.93% | | | | 1.81% | | | | 1.75% | | | | 1.74% | | | | 1.69% | |
Portfolio turnover rate | | | 20.29% | e | | | 22.16% | | | | 19.13% | | | | 37.43% | | | | 30.67% | |
| a | The amount shown for a share outstanding throughout the period may not correlate with the Statement of Operations for the period due to the timing of sales and repurchase of the Fund shares in relation to income earned and/or fluctuating market value of the investments of the Fund. |
| b | Based on average daily shares outstanding. |
| c | Total return does not include any fees, charges or expenses imposed by the variable annuity and life insurance contracts for which the Franklin Templeton Variable Insurance Products Trust serves as an underlying investment vehicle. |
| d | Benefit of expense reduction rounds to less than 0.01%. |
| e | Excludes the value of portfolio securities delivered as a result of a redemption in-kind. See Note 8. |
The accompanying notes are an integral part of these financial statements.
TG-7
Franklin Templeton Variable Insurance Products Trust
Financial Highlights (continued)
Templeton Growth Securities Fund
| | | | | | | | | | | | | | | | | | | | |
| | | Year Ended December 31, | |
| Class 2 | | 2006 | | | 2005 | | | 2004 | | | 2003 | | | 2002 | |
| | | | |
Per share operating performance | | | | | | | | | | | | | | | | | | | | |
(for a share outstanding throughout the year) | | | | | | | | | | | | | | | | | | | | |
Net asset value, beginning of year | | $ | 13.81 | | | $ | 12.83 | | | $ | 11.19 | | | $ | 8.59 | | | $ | 11.01 | |
| | | | |
Income from investment operationsa: | | | | | | | | | | | | | | | | | | | | |
Net investment incomeb | | | 0.24 | | | | 0.20 | | | | 0.17 | | | | 0.13 | | | | 0.13 | |
Net realized and unrealized gains (losses) | | | 2.63 | | | | 0.93 | | | | 1.61 | | | | 2.62 | | | | (2.10 | ) |
| | | | |
Total from investment operations | | | 2.87 | | | | 1.13 | | | | 1.78 | | | | 2.75 | | | | (1.97 | ) |
| | | | |
Less distributions from: | | | | | | | | | | | | | | | | | | | | |
Net investment income | | | (0.20 | ) | | | (0.15 | ) | | | (0.14 | ) | | | (0.15 | ) | | | (0.23 | ) |
Net realized gains | | | (0.55 | ) | | | — | | | | — | | | | — | | | | (0.22 | ) |
| | | | |
Total distributions | | | (0.75 | ) | | | (0.15 | ) | | | (0.14 | ) | | | (0.15 | ) | | | (0.45 | ) |
| | | | |
Net asset value, end of year | | $ | 15.93 | | | $ | 13.81 | | | $ | 12.83 | | | $ | 11.19 | | | $ | 8.59 | |
| | | | |
| | | | | |
Total returnc | | | 21.81% | | | | 8.86% | | | | 16.03% | | | | 32.13% | | | | (18.49)% | |
Ratios/supplemental data | | | | | | | | | | | | | | | | | | | | |
Net assets, end of year (000’s) | | $ | 2,821,818 | | | $ | 1,912,825 | | | $ | 1,189,112 | | | $ | 511,659 | | | $ | 190,054 | |
Ratios to average net assets: | | | | | | | | | | | | | | | | | | | | |
Expenses | | | 1.03% | d | | | 1.07% | d | | | 1.11% | d | | | 1.13% | | | | 1.12% | |
Net investment income | | | 1.68% | | | | 1.56% | | | | 1.50% | | | | 1.49% | | | | 1.44% | |
Portfolio turnover rate | | | 20.29% | e | | | 22.16% | | | | 19.13% | | | | 37.43% | | | | 30.67% | |
| a | The amount shown for a share outstanding throughout the period may not correlate with the Statement of Operations for the period due to the timing of sales and repurchase of the Fund shares in relation to income earned and/or fluctuating market value of the investments of the Fund. |
| b | Based on average daily shares outstanding. |
| c | Total return does not include any fees, charges or expenses imposed by the variable annuity and life insurance contracts for which the Franklin Templeton Variable Insurance Products Trust serves as an underlying investment vehicle. |
| d | Benefit of expense reduction rounds to less than 0.01%. |
| e | Excludes the value of portfolio securities delivered as a result of a redemption in-kind. See Note 8. |
The accompanying notes are an integral part of these financial statements.
TG-8
Franklin Templeton Variable Insurance Products Trust
Statement of Investments, December 31, 2006
| | | | | | | |
| Templeton Growth Securities Fund | | Country | | Shares | | Value |
Common Stocks 90.5% | | | | | | | |
Aerospace & Defense 1.6% | | | | | | | |
BAE Systems PLC | | United Kingdom | | 1,366,792 | | $ | 11,395,867 |
aBAE Systems PLC, 144A | | United Kingdom | | 364 | | | 3,035 |
Raytheon Co. | | United States | | 552,687 | | | 29,181,874 |
bRolls-Royce Group PLC | | United Kingdom | | 1,349,842 | | | 11,836,105 |
bRolls-Royce Group PLC, B | | United Kingdom | | 49,539,201 | | | 98,470 |
| | | | | | | |
| | | | | | | 52,515,351 |
| | | | | | | |
Air Freight & Logistics 1.0% | | | | | | | |
Deutsche Post AG | | Germany | | 1,080,888 | | | 32,674,319 |
| | | | | | | |
Auto Components 0.5% | | | | | | | |
Lear Corp. | | United States | | 240,108 | | | 7,090,389 |
Valeo SA | | France | | 202,767 | | | 8,439,401 |
| | | | | | | |
| | | | | | | 15,529,790 |
| | | | | | | |
Automobiles 3.3% | | | | | | | |
Bayerische Motoren Werke AG | | Germany | | 859,457 | | | 49,465,340 |
Harley-Davidson Inc. | | United States | | 299,480 | | | 21,104,356 |
Peugeot SA | | France | | 529,892 | | | 35,114,092 |
| | | | | | | |
| | | | | | | 105,683,788 |
| | | | | | | |
Building Products 1.2% | | | | | | | |
American Standard Cos. Inc. | | United States | | 394,750 | | | 18,099,287 |
Assa Abloy AB, B | | Sweden | | 886,200 | | | 19,273,091 |
| | | | | | | |
| | | | | | | 37,372,378 |
| | | | | | | |
Capital Markets 1.9% | | | | | | | |
The Bank of New York Co. Inc. | | United States | | 831,996 | | | 32,755,682 |
Nomura Holdings Inc. | | Japan | | 433,174 | | | 8,169,661 |
UBS AG | | Switzerland | | 364,684 | | | 22,161,463 |
| | | | | | | |
| | | | | | | 63,086,806 |
| | | | | | | |
Commercial Banks 8.0% | | | | | | | |
Banco Santander Central Hispano SA | | Spain | | 605,923 | | | 11,309,859 |
Hana Financial Group Inc. | | South Korea | | 161,640 | | | 8,499,135 |
HSBC Holdings PLC | | United Kingdom | | 2,755,409 | | | 50,509,545 |
Kookmin Bank | | South Korea | | 349,400 | | | 28,139,849 |
Mitsubishi UFJ Financial Group Inc. | | Japan | | 3,886 | | | 47,989,415 |
Royal Bank of Scotland Group PLC | | United Kingdom | | 1,560,360 | | | 60,900,713 |
cShinsei Bank Ltd. | | Japan | | 3,431,000 | | | 20,176,419 |
UniCredito Italiano SpA | | Italy | | 3,502,597 | | | 30,700,724 |
| | | | | | | |
| | | | | | | 258,225,659 |
| | | | | | | |
Commercial Services & Supplies 0.2% | | | | | | | |
Rentokil Initial PLC | | United Kingdom | | 1,889,475 | | | 6,142,420 |
| | | | | | | |
Computers & Peripherals 1.4% | | | | | | | |
Seagate Technology | | United States | | 1,741,718 | | | 46,155,527 |
| | | | | | | |
Diversified Consumer Services 0.8% | | | | | | | |
H&R Block Inc. | | United States | | 1,080,479 | | | 24,894,236 |
| | | | | | | |
Diversified Financial Services 0.6% | | | | | | | |
ING Groep NV | | Netherlands | | 415,250 | | | 18,412,383 |
| | | | | | | |
Diversified Telecommunication Services 4.3% | | | | | | | |
BCE Inc. | | Canada | | 610,643 | | | 16,455,001 |
Belgacom | | Belgium | | 233,162 | | | 10,270,801 |
TG-9
Franklin Templeton Variable Insurance Products Trust
Statement of Investments, December 31, 2006 (continued)
| | | | | | | |
| Templeton Growth Securities Fund | | Country | | Shares | | Value |
Common Stocks (continued) | | | | | | | |
Diversified Telecommunication Services (continued) | | | | | | | |
France Telecom SA | | France | | 1,428,670 | | $ | 39,509,935 |
KT Corp., ADR | | South Korea | | 862,201 | | | 21,856,795 |
Singapore Telecommunications Ltd. | | Singapore | | 5,541,000 | | | 11,852,020 |
Telefonos de Mexico SA de CV, L, ADR | | Mexico | | 604,945 | | | 17,095,746 |
Telenor ASA | | Norway | | 1,194,827 | | | 22,466,718 |
| | | | | | | |
| | | | | | | 139,507,016 |
| | | | | | | |
Electric Utilities 0.4% | | | | | | | |
Hong Kong Electric Holdings Ltd. | | Hong Kong | | 2,443,681 | | | 11,968,434 |
| | | | | | | |
Electronic Equipment & Instruments 0.7% | | | | | | | |
bCelestica Inc. | | Canada | | 343,812 | | | 2,685,172 |
bFlextronics International Ltd. | | Singapore | | 641,110 | | | 7,359,943 |
Hitachi Ltd. | | Japan | | 1,996,278 | | | 12,443,720 |
| | | | | | | |
| | | | | | | 22,488,835 |
| | | | | | | |
Food Products 2.2% | | | | | | | |
Nestle SA | | Switzerland | | 112,864 | | | 40,105,135 |
Unilever NV | | Netherlands | | 1,157,441 | | | 31,627,114 |
| | | | | | | |
| | | | | | | 71,732,249 |
| | | | | | | |
Health Care Equipment & Supplies 1.4% | | | | | | | |
bBoston Scientific Corp. | | United States | | 2,707,060 | | | 46,507,291 |
Olympus Corp. | | Japan | | 800 | | | 25,135 |
| | | | | | | |
| | | | | | | 46,532,426 |
| | | | | | | |
Health Care Providers & Services 0.6% | | | | | | | |
bTenet Healthcare Corp. | | United States | | 2,881,768 | | | 20,085,923 |
| | | | | | | |
Hotels, Restaurants & Leisure 1.9% | | | | | | | |
Accor SA | | France | | 369,590 | | | 28,638,395 |
Compass Group PLC | | United Kingdom | | 5,578,849 | | | 31,683,480 |
| | | | | | | |
| | | | | | | 60,321,875 |
| | | | | | | |
Household Durables 1.4% | | | | | | | |
Koninklijke Philips Electronics NV | | Netherlands | | 912,198 | | | 34,402,477 |
Sony Corp. | | Japan | | 263,169 | | | 11,275,355 |
| | | | | | | |
| | | | | | | 45,677,832 |
| | | | | | | |
Industrial Conglomerates 4.2% | | | | | | | |
Siemens AG | | Germany | | 602,004 | | | 60,077,456 |
Smiths Group PLC | | United Kingdom | | 429,459 | | | 8,338,822 |
Tyco International Ltd. | | United States | | 2,268,472 | | | 68,961,549 |
| | | | | | | |
| | | | | | | 137,377,827 |
| | | | | | | |
Insurance 7.6% | | | | | | | |
ACE Ltd. | | Bermuda | | 253,274 | | | 15,340,806 |
American International Group Inc. | | United States | | 860,005 | | | 61,627,958 |
Aviva PLC | | United Kingdom | | 2,227,806 | | | 35,862,409 |
Muenchener Rueckversicherungs-Gesellschaft AG | | Germany | | 175,630 | | | 30,371,088 |
Swiss Reinsurance Co. | | Switzerland | | 367,341 | | | 31,230,994 |
Torchmark Corp. | | United States | | 253,277 | | | 16,148,942 |
Willis Group Holdings Ltd. | | United States | | 755,250 | | | 29,990,977 |
XL Capital Ltd., A | | Bermuda | | 338,433 | | | 24,373,945 |
| | | | | | | |
| | | | | | | 244,947,119 |
| | | | | | | |
TG-10
Franklin Templeton Variable Insurance Products Trust
Statement of Investments, December 31, 2006 (continued)
| | | | | | | |
| Templeton Growth Securities Fund | | Country | | Shares | | Value |
Common Stocks (continued) | | | | | | | |
Internet & Catalog Retail 0.6% | | | | | | | |
bExpedia Inc. | | United States | | 864,020 | | $ | 18,127,140 |
| | | | | | | |
IT Services 1.9% | | | | | | | |
Accenture Ltd., A | | United States | | 969,457 | | | 35,802,047 |
Electronic Data Systems Corp. | | United States | | 988,270 | | | 27,226,839 |
| | | | | | | |
| | | | | | | 63,028,886 |
| | | | | | | |
Leisure Equipment & Products 2.0% | | | | | | | |
Eastman Kodak Co. | | United States | | 1,484,649 | | | 38,303,944 |
FUJIFILM Holdings Corp. | | Japan | | 643,837 | | | 26,449,053 |
Mattel Inc. | | United States | | 7,329 | | | 166,075 |
| | | | | | | |
| | | | | | | 64,919,072 |
| | | | | | | |
Media 12.0% | | | | | | | |
British Sky Broadcasting Group PLC | | United Kingdom | | 2,318,893 | | | 23,705,083 |
bComcast Corp., A | | United States | | 862,068 | | | 36,103,408 |
bThe DIRECTV Group Inc. | | United States | | 1,645,844 | | | 41,047,349 |
bInterpublic Group of Cos. Inc. | | United States | | 2,797,188 | | | 34,237,581 |
Mediaset SpA | | Italy | | 1,237,070 | | | 14,680,618 |
News Corp., A | | United States | | 3,066,692 | | | 65,872,544 |
Pearson PLC | | United Kingdom | | 1,800,148 | | | 27,197,840 |
Reed Elsevier NV | | Netherlands | | 2,518,906 | | | 42,960,056 |
Time Warner Inc. | | United States | | 2,169,122 | | | 47,243,477 |
bViacom Inc., B | | United States | | 1,325,938 | | | 54,403,236 |
| | | | | | | |
| | | | | | | 387,451,192 |
| | | | | | | |
Multi-Utilities 1.5% | | | | | | | |
DTE Energy Co. | | United States | | 514,252 | | | 24,894,940 |
National Grid PLC | | United Kingdom | | 1,745,761 | | | 25,213,729 |
| | | | | | | |
| | | | | | | 50,108,669 |
| | | | | | | |
Office Electronics 0.8% | | | | | | | |
bKonica Minolta Holdings Ltd. | | Japan | | 1,733,800 | | | 24,469,979 |
| | | | | | | |
Oil, Gas & Consumable Fuels 5.0% | | | | | | | |
BP PLC | | United Kingdom | | 2,926,978 | | | 32,529,366 |
El Paso Corp. | | United States | | 2,309,384 | | | 35,287,387 |
Eni SpA | | Italy | | 647,787 | | | 21,788,233 |
Repsol YPF SA | | Spain | | 901,858 | | | 31,191,037 |
Royal Dutch Shell PLC, B | | United Kingdom | | 1,145,483 | | | 40,154,290 |
| | | | | | | |
| | | | | | | 160,950,313 |
| | | | | | | |
Paper & Forest Products 3.8% | | | | | | | |
International Paper Co. | | United States | | 855,873 | | | 29,185,269 |
Sappi Ltd. | | South Africa | | 1,108,320 | | | 18,580,717 |
Stora Enso OYJ, R | | Finland | | 1,589,082 | | | 25,172,011 |
Svenska Cellulosa AB, B | | Sweden | | 452,391 | | | 23,606,052 |
UPM-Kymmene OYJ | | Finland | | 1,087,262 | | | 27,441,792 |
| | | | | | | |
| | | | | | | 123,985,841 |
| | | | | | | |
Pharmaceuticals 8.0% | | | | | | | |
Abbott Laboratories | | United States | | 266,915 | | | 13,001,430 |
Bristol-Myers Squibb Co. | | United States | | 1,093,151 | | | 28,771,734 |
GlaxoSmithKline PLC | | United Kingdom | | 1,604,908 | | | 42,241,534 |
Merck & Co. Inc. | | United States | | 1,275,321 | | | 55,603,996 |
Novartis AG | | Switzerland | | 351,524 | | | 20,265,529 |
TG-11
Franklin Templeton Variable Insurance Products Trust
Statement of Investments, December 31, 2006 (continued)
| | | | | | | |
| Templeton Growth Securities Fund | | Country | | Shares | | Value |
Common Stocks (continued) | | | | | | | |
Pharmaceuticals (continued) | | | | | | | |
Pfizer Inc. | | United States | | 1,988,323 | | $ | 51,497,566 |
Sanofi-Aventis | | France | | 278,917 | | | 25,754,496 |
Takeda Pharmaceutical Co. Ltd. | | Japan | | 304,236 | | | 20,881,322 |
| | | | | | | |
| | | | | | | 258,017,607 |
| | | | | | | |
Real Estate Management & Development 0.9% | | | | | | | |
Cheung Kong (Holdings) Ltd. | | Hong Kong | | 1,199,833 | | | 14,768,196 |
Swire Pacific Ltd., A | | Hong Kong | | 1,408,516 | | | 15,127,811 |
| | | | | | | |
| | | | | | | 29,896,007 |
| | | | | | | |
Semiconductors & Semiconductor Equipment 1.6% | | | | | | | |
bInfineon Technologies AG | | Germany | | 2,227,809 | | | 31,349,132 |
Samsung Electronics Co. Ltd. | | South Korea | | 33,440 | | | 22,041,634 |
| | | | | | | |
| | | | | | | 53,390,766 |
| | | | | | | |
Software 4.2% | | | | | | | |
bCadence Design Systems Inc. | | United States | | 789,718 | | | 14,143,849 |
Microsoft Corp. | | United States | | 2,376,979 | | | 70,976,593 |
Nintendo Co. Ltd. | | Japan | | 39,297 | | | 10,201,011 |
bOracle Corp. | | United States | | 2,348,500 | | | 40,253,290 |
| | | | | | | |
| | | | | | | 135,574,743 |
| | | | | | | |
Specialty Retail 0.7% | | | | | | | |
bChico’s FAS Inc. | | United States | | 1,053,390 | | | 21,794,639 |
| | | | | | | |
Wireless Telecommunication Services 2.3% | | | | | | | |
Advanced Info Service Public Co. Ltd., fgn. | | Thailand | | 1,708,800 | | | 3,759,842 |
SK Telecom Co. Ltd. | | South Korea | | 80,853 | | | 19,343,863 |
SK Telecom Co. Ltd., ADR | | South Korea | | 108,491 | | | 2,872,842 |
Vodafone Group PLC | | United Kingdom | | 17,441,861 | | | 48,332,530 |
| | | | | | | |
| | | | | | | 74,309,077 |
| | | | | | | |
Total Common Stocks (Cost $2,254,499,848) | | | | | | | 2,927,356,124 |
| | | | | | | |
TG-12
Franklin Templeton Variable Insurance Products Trust
Statement of Investments, December 31, 2006 (continued)
| | | | | | | | |
| Templeton Growth Securities Fund | | | | Principal
Amount | | Value |
Short Term Investments (Cost $307,272,235) 9.5% | | | | | | | | |
U.S. Government and Agency Securities 9.5% | | | | | | | | |
dFederal Home Loan Bank, 1/02/07 | | | | $ | 49,518,000 | | $ | 49,518,000 |
dFHLMC, 1/05/07 | | | | | 25,000,000 | | | 24,992,900 |
dFHLMC, 1/23/07 | | | | | 35,000,000 | | | 34,900,530 |
dFHLMC, 2/16/07 | | | | | 25,000,000 | | | 24,844,025 |
dFHLMC, 3/30/07 | | | | | 15,000,000 | | | 14,817,435 |
dFHLMC, 4/30/07 | | | | | 75,000,000 | | | 73,760,550 |
dFNMA, 1/19/07 | | | | | 40,000,000 | | | 39,909,080 |
dFNMA, 1/22/07 | | | | | 30,000,000 | | | 29,919,000 |
dFNMA, 5/08/07 | | | | | 15,000,000 | | | 14,736,195 |
| | | | | | | | |
| | | | | | | | 307,397,715 |
| | | | | | | | |
Total Investments (Cost $2,561,772,083) 100.0% | | | | | | | | 3,234,753,839 |
Other Assets, less Liabilities 0.0%e | | | | | | | | 935,584 |
| | | | | | | | |
Net Assets 100.0% | | | | | | | $ | 3,235,689,423 |
| | | | | | | | |
Selected Portfolio Abbreviations
ADR - American Depository Receipt
FHLMC - Federal Home Loan Mortgage Corp.
FNMA - Federal National Mortgage Association
| a | Security was purchased pursuant to Rule 144A under the Securities Act of 1933 and may be sold in transactions exempt from registration only to qualified institutional buyers or in a public offering registered under the Securities Act of 1933. These securities have been deemed liquid under guidelines approved by the Trust’s Board of Trustees. At December 31, 2006, the value of this security was $3,035, representing less than 0.1% of net assets. |
| b | Non-income producing for the twelve months ended December 31, 2006. |
| c | See Note 1(c) regarding securities purchased on a when-issued or delayed delivery basis. |
| d | The security is traded on a discount basis with no stated coupon rate. |
| e | Rounds to less than 0.1% of net assets. |
The accompanying notes are an integral part of these financial statements.
TG-13
Franklin Templeton Variable Insurance Products Trust
Financial Statements
Statement of Assets and Liabilities
December 31, 2006
| | | |
| | | Templeton
Growth
Securities Fund |
Assets: | | | |
Investments in securities: | | | |
Cost | | $ | 2,561,772,083 |
| | | |
Value | | $ | 3,234,753,839 |
Cash | | | 135,731 |
Receivables: | | | |
Capital shares sold | | | 4,296,706 |
Dividends | | | 4,739,415 |
| | | |
Total assets | | | 3,243,925,691 |
| | | |
Liabilities: | | | |
Payables: | | | |
Investment securities purchased | | | 1,373,581 |
Capital shares redeemed | | | 3,306,086 |
Affiliates | | | 3,118,503 |
Accrued expenses and other liabilities | | | 438,098 |
| | | |
Total liabilities | | | 8,236,268 |
| | | |
Net assets, at value | | $ | 3,235,689,423 |
| | | |
Net assets consist of: | | | |
Paid-in capital | | $ | 2,363,086,960 |
Undistributed net investment income | | | 48,319,480 |
Net unrealized appreciation (depreciation) | | | 673,051,568 |
Accumulated net realized gain (loss) | | | 151,231,415 |
| | | |
Net assets, at value | | $ | 3,235,689,423 |
| | | |
Class 1: | | | |
Net assets, at value | | $ | 413,871,386 |
| | | |
Shares outstanding | | | 25,617,393 |
| | | |
Net asset value and maximum offering price per share | | $ | 16.16 |
| | | |
Class 2: | | | |
Net assets, at value | | $ | 2,821,818,037 |
| | | |
Shares outstanding | | | 177,114,983 |
| | | |
Net asset value and maximum offering price per share | | $ | 15.93 |
| | | |
The accompanying notes are an integral part of these financial statements.
TG-14
Franklin Templeton Variable Insurance Products Trust
Financial Statements (continued)
Statement of Operations
for the year ended December 31, 2006
| | | | |
| | | Templeton
Growth
Securities Fund | |
Investment income: | | | | |
Dividends (net of foreign taxes of $3,681,980) | | $ | 65,878,317 | |
Interest | | | 10,165,600 | |
Other income (Note 9) | | | 141,632 | |
| | | | |
Total investment income | | | 76,185,549 | |
| | | | |
Expenses: | | | | |
Management fees (Note 3a) | | | 20,781,515 | |
Distribution fees - Class 2 (Note 3c) | | | 5,676,318 | |
Custodian fees (Note 4) | | | 547,571 | |
Reports to shareholders | | | 401,006 | |
Professional fees | | | 103,461 | |
Trustees’ fees and expenses | | | 13,532 | |
Other | | | 65,105 | |
| | | | |
Total expenses | | | 27,588,508 | |
Expense reductions (Note 4) | | | (18,313 | ) |
| | | | |
Net expenses | | | 27,570,195 | |
| | | | |
Net investment income | | | 48,615,354 | |
| | | | |
Realized and unrealized gains (losses): | | | | |
Net realized gain (loss) from: | | | | |
Investments (Includes gains from a redemption in-kind of $68,398,083) (Note 8) | | | 220,549,333 | |
Foreign currency transactions | | | (42,606 | ) |
| | | | |
Net realized gain (loss) | | | 220,506,727 | |
| | | | |
Net change in unrealized appreciation (depreciation) on: | | | | |
Investments | | | 310,920,742 | |
Translation of assets and liabilities denominated in foreign currencies | | | 142,828 | |
| | | | |
Net change in unrealized appreciation (depreciation) | | | 311,063,570 | |
| | | | |
Net realized and unrealized gain (loss) | | | 531,570,297 | |
| | | | |
Net increase (decrease) in net assets resulting from operations | | $ | 580,185,651 | |
| | | | |
The accompanying notes are an integral part of these financial statements.
TG-15
Franklin Templeton Variable Insurance Products Trust
Financial Statements (continued)
Statements of Changes in Net Assets
| | | | | | | | |
| | | Templeton Growth
Securities Fund | |
| | | Year Ended December 31, | |
| | | 2006 | | | 2005 | |
| | | | |
Increase (decrease) in net assets: | | | | | | | | |
Operations: | | | | | | | | |
Net investment income | | $ | 48,615,354 | | | $ | 37,640,984 | |
Net realized gain (loss) from investments and foreign currency transactions | | | 220,506,727 | | | | 106,724,452 | |
Net change in unrealized appreciation (depreciation) on investments and translation of assets and liabilities denominated in foreign currencies | | | 311,063,570 | | | | 64,432,128 | |
| | | | |
Net increase (decrease) in net assets resulting from operations | | | 580,185,651 | | | | 208,797,564 | |
| | | | |
Distributions to shareholders from: | | | | | | | | |
Net investment income: | | | | | | | | |
Class 1 | | | (6,338,891 | ) | | | (9,572,633 | ) |
Class 2 | | | (29,026,054 | ) | | | (16,496,404 | ) |
Net realized gains: | | | | | | | | |
Class 1 | | | (15,619,027 | ) | | | — | |
Class 2 | | | (80,864,543 | ) | | | — | |
| | | | |
Total distributions to shareholders | | | (131,848,515 | ) | | | (26,069,037 | ) |
| | | | |
Capital share transactions: (Note 2) | | | | | | | | |
Class 1 | | | (460,756,992 | ) | | | (78,704,685 | ) |
Class 2 | | | 555,937,357 | | | | 598,918,011 | |
| | | | |
Total capital share transactions | | | 95,180,365 | | | | 520,213,326 | |
| | | | |
Net increase (decrease) in net assets | | | 543,517,501 | | | | 702,941,853 | |
Net assets: | | | | | | | | |
Beginning of year | | | 2,692,171,922 | | | | 1,989,230,069 | |
| | | | |
End of year | | $ | 3,235,689,423 | | | $ | 2,692,171,922 | |
| | | | |
Undistributed net investment income included in net assets: | | | | | | | | |
End of year | | $ | 48,319,480 | | | $ | 35,116,077 | |
| | | | |
The accompanying notes are an integral part of these financial statements.
TG-16
Franklin Templeton Variable Insurance Products Trust
Notes to Financial Statements
Templeton Growth Securities Fund
1. ORGANIZATION AND SIGNIFICANT ACCOUNTING POLICIES
Franklin Templeton Variable Insurance Products Trust (the Trust) is registered under the Investment Company Act of 1940, as amended, (the 1940 Act) as an open-end investment company, consisting of twenty-two separate funds. The Templeton Growth Securities Fund (the Fund) included in this report is diversified. The financial statements of the remaining funds in the Trust are presented separately. Shares of the Fund are sold only to insurance company separate accounts to fund the benefits of variable life insurance policies or variable annuity contracts. The Fund offers two classes of shares: Class 1 and Class 2. Each class of shares differs by its distribution fees, voting rights on matters affecting a single class and its exchange privilege.
The following summarizes the Fund’s significant accounting policies.
a. Security Valuation
Securities listed on a securities exchange or on the NASDAQ National Market System are valued at the last quoted sale price or the official closing price of the day, respectively. Over-the-counter securities and listed securities for which there is no reported sale are valued within the range of the most recent quoted bid and ask prices. Securities that trade in multiple markets or on multiple exchanges are valued according to the broadest and most representative market.
Government securities generally trade in the over-the-counter market rather than on a securities exchange. The Trust may utilize independent pricing services, quotations from bond dealers, and information with respect to bond and note transactions, to assist in determining a current market value for each security. The Trust’s pricing services may use valuation models or matrix pricing which considers information with respect to comparable bond and note transactions, quotations from bond dealers, or by reference to other securities that are considered comparable in such characteristics as rating, interest rate and maturity date, option adjusted spread models, prepayment projections, interest rate spreads and yield curves, to determine current value.
Foreign securities are valued as of the close of trading on the foreign stock exchange on which the security is primarily traded, or the NYSE, whichever is earlier. If no sale is reported at that time, the foreign security will be valued within the range of the most recent quoted bid and ask prices. The value is then converted into its U.S. dollar equivalent at the foreign exchange rate in effect at the close of the NYSE on the day that the value of the foreign security is determined.
The Trust has procedures to determine the fair value of individual securities and other assets for which market prices are not readily available or which may not be reliably priced. Methods for valuing these securities may include: fundamental analysis, matrix pricing, discounts from market prices of similar securities, or discounts applied due to the nature and duration of restrictions on the disposition of the securities. Due to the inherent uncertainty of valuations of such securities, the fair values may differ significantly from the values that would have been used had a ready market for such investments existed. Occasionally, events occur between the time at which trading in a security is completed and the close of the NYSE that might call into question the availability (including the reliability) of the value of a portfolio security held by the Fund. The investment manager monitors price movements following the close of trading in foreign stock markets through a series of country specific market proxies (such as baskets of American Depository Receipts, futures contracts and exchange traded funds). These price movements are measured against established trigger thresholds for each specific market proxy to assist in determining if an event has occurred. If such an event occurs, the securities may be valued using fair value procedures, which may include the use of independent pricing services. All security valuation procedures are approved by the Trust’s Board of Trustees.
b. Foreign Currency Translation
Portfolio securities and other assets and liabilities denominated in foreign currencies are translated into U.S. dollars based on the exchange rate of such currencies against U.S. dollars on the date of valuation. Purchases and sales of securities, income and expense items denominated in foreign currencies are translated into U.S. dollars at the exchange rate in effect on the transaction date. Occasionally, events may impact the availability or reliability of foreign exchange rates used to convert the U.S. dollar equivalent value. If such an event occurs, the foreign exchange rate will be valued at fair value using procedures established and approved by the Trust’s Board of Trustees.
TG-17
Franklin Templeton Variable Insurance Products Trust
Notes to Financial Statements (continued)
Templeton Growth Securities Fund
1. ORGANIZATION AND SIGNIFICANT ACCOUNTING POLICIES (continued)
b. Foreign Currency Translation (continued)
The Fund does not separately report the effect of changes in foreign exchange rates from changes in market prices on securities held. Such changes are included in net realized and unrealized gain or loss from investments on the Statement of Operations.
Realized foreign exchange gains or losses arise from sales of foreign currencies, currency gains or losses realized between the trade and settlement dates on securities transactions and the difference between the recorded amounts of dividends, interest, and foreign withholding taxes and the U.S. dollar equivalent of the amounts actually received or paid. Net unrealized foreign exchange gains and losses arise from changes in foreign exchange rates on foreign denominated assets and liabilities other than investments in securities held at the end of the reporting period.
c. Securities Purchased on a When-Issued or Delayed Delivery Basis
The Fund may purchase securities on a when-issued or delayed delivery basis, with payment and delivery scheduled for a future date. These transactions are subject to market fluctuations and are subject to the risk that the value at delivery may be more or less than the trade date purchase price. Although the Fund will generally purchase these securities with the intention of holding the securities, it may sell the securities before the settlement date. Sufficient assets have been segregated for these securities.
d. Foreign Currency Contracts
When the Fund purchases or sells foreign securities it may enter into foreign exchange contracts to minimize foreign exchange risk from the trade date to the settlement date of the transactions. A foreign exchange contract is an agreement between two parties to exchange different currencies at an agreed upon exchange rate on a specified date. Realized and unrealized gains and losses on these contracts are included in the Statement of Operations.
The risks of these contracts include movement in the values of the foreign currencies relative to the U.S. dollar and the possible inability of the counterparties to fulfill their obligations under the contracts, which may be in excess of the amount reflected in the Statement of Assets and Liabilities.
e. Income Taxes
No provision has been made for U.S. income taxes because the Fund intends to qualify as a regulated investment company under the Internal Revenue Code and to distribute to shareholders substantially all of its taxable income and net realized gains.
Foreign securities held by the Fund may be subject to foreign taxation on dividend income received. Foreign taxes, if any, are recorded based on the tax regulations and rates that exist in the foreign markets in which the Fund invests.
f. Security Transactions, Investment Income, Expenses and Distributions
Security transactions are accounted for on trade date. Realized gains and losses on security transactions are determined on a specific identification basis. Interest income and estimated expenses are accrued daily. Amortization of premium and accretion of discount on debt securities are included in interest income. Dividend income is recorded on the ex-dividend date except that certain dividends from foreign securities are recognized as soon as the Fund is notified of the ex-dividend date. Distributions to shareholders are recorded on the ex-dividend date and are determined according to income tax regulations (tax basis). Distributable earnings determined on a tax basis may differ from earnings recorded in accordance with accounting principles generally accepted in the United States. These differences may be permanent or temporary. Permanent differences are reclassified among capital accounts to reflect their tax character. These reclassifications have no impact on net assets or the results of operations. Temporary differences are not reclassified, as they may reverse in subsequent periods.
TG-18
Franklin Templeton Variable Insurance Products Trust
Notes to Financial Statements (continued)
Templeton Growth Securities Fund
1. ORGANIZATION AND SIGNIFICANT ACCOUNTING POLICIES (continued)
f. Security Transactions, Investment Income, Expenses and Distributions (continued)
Common expenses incurred by the Trust are allocated among the funds based on the ratio of net assets of each fund to the combined net assets of the Trust. Fund specific expenses are charged directly to the fund that incurred the expense.
Realized and unrealized gains and losses and net investment income, other than class specific expenses, are allocated daily to each class of shares based upon the relative proportion of net assets of each class. Differences in class-level expenses may result in payment of different per share distributions by class.
g. Accounting Estimates
The preparation of financial statements in accordance with accounting principles generally accepted in the United States of America requires management to make estimates and assumptions that affect the reported amounts of assets and liabilities at the date of the financial statements and the amounts of income and expenses during the reporting period. Actual results could differ from those estimates.
h. Guarantees and Indemnifications
Under the Trust’s organizational documents, its officers and trustees are indemnified by the Trust against certain liabilities arising out of the performance of their duties to the Trust. Additionally, in the normal course of business, the Trust enters into contracts with service providers that contain general indemnification clauses. The Trust’s maximum exposure under these arrangements is unknown as this would involve future claims that may be made against the Trust that have not yet occurred. Currently, the Trust expects the risk of loss to be remote.
2. SHARES OF BENEFICIAL INTEREST
At December 31, 2006, there were an unlimited number of shares authorized ($0.01 par value). Transactions in the Fund’s shares were as follows:
| | | | | | | | | | | | | | |
| | | Year Ended December 31, | |
| | | 2006 | | | 2005 | |
| Class 1 Shares: | | Shares | | | Amount | | | Shares | | | Amount | |
Shares sold | | 816,455 | | | $ | 12,140,817 | | | 1,516,368 | | | $ | 19,918,799 | |
Shares issued in reinvestment of distributions | | 1,610,999 | | | | 21,957,918 | | | 740,916 | | | | 9,572,633 | |
Shares redeemed in-kind (Note 8) | | (24,637,081 | ) | | | (376,956,857 | ) | | — | | | | — | |
Shares redeemed | | (7,904,739 | ) | | | (117,898,870 | ) | | (8,179,119 | ) | | | (108,196,117 | ) |
| | | | |
Net increase (decrease) | | (30,114,366 | ) | | $ | (460,756,992 | ) | | (5,921,835 | ) | | $ | (78,704,685 | ) |
| | | | |
| Class 2 Shares: | | | | | | | | | | | | |
Shares sold | | 44,417,686 | | | $ | 652,914,455 | | | 53,621,660 | | | $ | 698,169,420 | |
Shares issued in reinvestment of distributions | | 8,154,097 | | | | 109,754,141 | | | 1,291,809 | | | | 16,496,404 | |
Shares redeemed in-kind (Note 8) | | (1,903,026 | ) | | | (28,650,852 | ) | | — | | | | — | |
Shares redeemed | | (12,095,685 | ) | | | (178,080,387 | ) | | (9,052,089 | ) | | | (115,747,813 | ) |
| | | | |
Net increase (decrease) | | 38,573,072 | | | $ | 555,937,357 | | | 45,861,380 | | | $ | 598,918,011 | |
| | | | |
TG-19
Franklin Templeton Variable Insurance Products Trust
Notes to Financial Statements (continued)
Templeton Growth Securities Fund
3. TRANSACTIONS WITH AFFILIATES
Franklin Resources, Inc. is the holding company for various subsidiaries that together are referred to as Franklin Templeton Investments. Certain officers and trustees of the Trust are also officers and/or directors of the following subsidiaries:
| | |
| Subsidiary | | Affiliation |
Templeton Global Advisors Limited (TGAL) | | Investment manager |
Templeton Asset Management Ltd. (TAML) | | Investment manager |
Franklin Templeton Services, LLC (FT Services) | | Administrative manager |
Franklin Templeton Distributors, Inc. (Distributors) | | Principal underwriter |
Franklin Templeton Investor Services, LLC (Investor Services) | | Transfer agent |
a. Management Fees
The Fund pays an investment management fee to TGAL based on the average daily net assets of the Fund as follows:
| | |
| Annualized Fee Rate | | Net Assets |
| 1.000% | | Up to and including $100 million |
| 0.900% | | Over $100 million, up to and including $250 million |
| 0.800% | | Over $250 million, up to and including $500 million |
| 0.750% | | Over $500 million, up to and including $1 billion |
| 0.700% | | Over $1 billion, up to and including $5 billion |
| 0.675% | | Over $5 billion, up to and including $10 billion |
| 0.655% | | Over $10 billion, up to and including $15 billion |
| 0.635% | | Over $15 billion, up to and including $20 billion |
| 0.615% | | In excess of $20 billion |
Under a subadvisory agreement, TAML, an affiliate of TGAL, provides subadvisory services to the Fund and receives from TGAL fees based on the average daily net assets of the Fund.
b. Administrative Fees
Under an agreement with TGAL, FT Services provides administrative services to the Fund. The fee is paid by TGAL based on average daily net assets, and is not an additional expense of the Fund.
c. Distribution Fees
The Fund’s Board of Trustees has adopted a distribution plan for Class 2 shares pursuant to Rule 12b-1 under the 1940 Act. Under the Fund’s compensation distribution plan, the Fund pays Distributors for costs incurred in connection with the servicing, sale and distribution of the Fund’s shares up to 0.35% per year of its average daily net assets. The Board of Trustees has agreed to limit the current rate to 0.25% per year.
d. Transfer Agent Fees
Investor Services, under terms of an agreement, performs shareholder servicing for the Fund and is not paid by the Fund for the services.
4. EXPENSE OFFSET ARRANGEMENT
The Fund has entered into an arrangement with its custodian whereby credits realized as a result of uninvested cash balances are used to reduce a portion of the Fund’s custodian expenses. During the year ended December 31, 2006, the custodian fees were reduced as noted in the Statement of Operations.
TG-20
Franklin Templeton Variable Insurance Products Trust
Notes to Financial Statements (continued)
Templeton Growth Securities Fund
5. INCOME TAXES
For tax purposes, realized currency losses, occurring subsequent to October 31, may be deferred and treated as occurring on the first day of the following fiscal year. At December 31, 2006, the Fund deferred realized currency losses of $45,089.
The tax character of distributions paid during the years ended December 31, 2006 and 2005, was as follows:
| | | | | | |
| | | 2006 | | 2005 |
Distributions paid from: | | | | | | |
Ordinary income | | $ | 35,364,945 | | $ | 26,069,037 |
Long term capital gain | | | 96,483,570 | | | — |
| | | |
| | $ | 131,848,515 | | $ | 26,069,037 |
| | | |
At December 31, 2006, the cost of investments, net unrealized appreciation (depreciation), undistributed ordinary income and undistributed long term capital gains for income tax purposes were as follows:
| | | | |
Cost of investments | | $ | 2,562,483,733 | |
| | | | |
| |
Unrealized appreciation | | $ | 695,298,544 | |
Unrealized depreciation | | | (23,028,438 | ) |
| | | | |
Net unrealized appreciation (depreciation) | | $ | 672,270,106 | |
| | | | |
Undistributed ordinary income | | $ | 60,550,530 | |
Undistributed long term capital gains | | | 139,757,102 | |
| | | | |
Distributable earnings | | $ | 200,307,632 | |
| | | | |
Net investment income differs for financial statement and tax purposes primarily due to differing treatment of foreign currency transactions.
Net realized gains (losses) differ for financial statement and tax purposes primarily due to differing treatments of wash sales, foreign currency transactions, and gains realized on in-kind shareholder redemptions.
6. INVESTMENT TRANSACTIONS
Purchases and sales of investments (excluding short term securities) for the year ended December 31, 2006, aggregated $923,899,844 and $533,760,642, respectively. Sales of investments excludes $405,607,709 of an in-kind redemption.
7. CONCENTRATION OF RISK
Investing in foreign securities may include certain risks and considerations not typically associated with investing in U.S. securities, such as fluctuating currency values and changing local and regional economic, political and social conditions, which may result in greater market volatility. In addition, certain foreign securities may not be as liquid as U.S. securities.
8. REDEMPTION IN-KIND
During the year ended December 31, 2006, the Fund realized $68,398,083 of net gains resulting from a redemption in-kind in which a shareholder redeemed fund shares for securities held by the Fund rather than for cash. Because such gains are not taxable to the Fund, and are not distributed to shareholders, they have been reclassified from accumulated net realized gains to paid-in capital.
TG-21
Franklin Templeton Variable Insurance Products Trust
Notes to Financial Statements (continued)
Templeton Growth Securities Fund
9. REGULATORY MATTERS
As part of various investigations by a number of federal, state, and foreign regulators and governmental entities, including the Securities and Exchange Commission (“SEC”), relating to certain practices in the mutual fund industry, including late trading, market timing and marketing support payments to securities dealers who sell fund shares (“marketing support”), Franklin Resources, Inc. and certain of its subsidiaries (collectively, the “Company”), entered into settlements with certain of those regulators. Specifically, the Company entered into settlements with the SEC, among others, concerning market timing and marketing support.
On June 23, 2006, the SEC approved the proposed plan of distribution for the marketing support settlement, and disbursement of the settlement monies to the designated funds, in accordance with the terms and conditions of that settlement and plan, was completed in September 2006 and is recorded as other income.
The plan of distribution for the market timing settlement is currently under review by the SEC staff. After publication of notice of the plan and a 30-day comment period, the proposed plan of distribution will be submitted to the SEC for approval. Following the SEC’s approval of the plan of distribution, with modifications as appropriate, distribution of the settlement monies will begin in accordance with the terms and conditions of the settlement and plan.
In addition, the Company, as well as most of the mutual funds within Franklin Templeton Investments and certain current or former officers, Company directors, fund directors, and employees, have been named in private lawsuits (styled as shareholder class actions, or as derivative actions on behalf of either the named funds or Franklin Resources, Inc.). The lawsuits relate to the industry practices referenced above, as well as to allegedly excessive commissions and advisory and distribution fees.
The Company and fund management believe that the claims made in each of the private lawsuits referenced above are without merit and intend to defend against them vigorously. The Company cannot predict with certainty the eventual outcome of these lawsuits, nor whether they will have a material negative impact on the Company. If it is determined that the Company bears responsibility for any unlawful or inappropriate conduct that caused losses to the Trust, it is committed to making the Trust or its shareholders whole, as appropriate.
10. NEW ACCOUNTING PRONOUNCEMENTS
In July 2006, the Financial Accounting Standards Board (FASB) issued FASB Interpretation No. 48, “Accounting for Uncertainty in Income Taxes – an Interpretation of FASB Statement No. 109” (“FIN 48”), which clarifies the accounting for uncertainty in tax positions taken or expected to be taken in a tax return. FIN 48 provides guidance on the measurement, recognition, classification and disclosure of tax positions, along with accounting for the related interest and penalties. FIN 48 is effective for fiscal years beginning after December 15, 2006, and is to be applied to all open tax years as of the date of effectiveness. On December 22, 2006, the Securities and Exchange Commission extended the implementation date to no later than the last net asset value calculation in the first semi-annual reporting period in 2007. The Fund is currently evaluating the impact, if any, of applying the various provisions of FIN 48.
In September 2006, FASB issued FASB Statement No. 157, “Fair Value Measurement” (“SFAS 157”), which defines fair value, establishes a framework for measuring fair value, and expands disclosures about fair value measurements. SFAS 157 is effective for fiscal years beginning after November 15, 2007, and interim periods within those fiscal years. The Trust believes the adoption of SFAS 157 will have no material impact on its financial statements.
TG-22
Franklin Templeton Variable Insurance Products Trust
Templeton Growth Securities Fund
Report of Independent Registered Public Accounting Firm
To the Board of Trustees and Shareholders of
Franklin Templeton Variable Insurance Products Trust
In our opinion, the accompanying statement of assets and liabilities, including the statement of investments, and the related statements of operations and of changes in net assets and the financial highlights present fairly, in all material respects, the financial position of Templeton Growth Securities Fund (one of the funds constituting the Franklin Templeton Variable Insurance Products Trust, hereafter referred to as the “Fund”) at December 31, 2006, the results of its operations for the year then ended, the changes in its net assets for each of the two years in the period then ended and the financial highlights for each of the five years in the period then ended, in conformity with accounting principles generally accepted in the United States of America. These financial statements and financial highlights (hereafter referred to as “financial statements”) are the responsibility of the Fund’s management; our responsibility is to express an opinion on these financial statements based on our audits. We conducted our audits of these financial statements in accordance with the standards of the Public Company Accounting Oversight Board (United States). Those standards require that we plan and perform the audit to obtain reasonable assurance about whether the financial statements are free of material misstatement. An audit includes examining, on a test basis, evidence supporting the amounts and disclosures in the financial statements, assessing the accounting principles used and significant estimates made by management, and evaluating the overall financial statement presentation. We believe that our audits, which included confirmation of securities at December 31, 2006 by correspondence with the custodian and brokers, provide a reasonable basis for our opinion.
PricewaterhouseCoopers LLP
San Francisco, California
February 16, 2007
TG-23
Franklin Templeton Variable Insurance Products Trust
Tax Designation (unaudited)
Templeton Growth Securities Fund
Under Section 852(b)(3)(C) of the Internal Revenue Code (Code), the Fund designates the maximum amount allowable but no less than $139,767,620 as a long term capital gain dividend for the fiscal year ended December 31, 2006.
Under Section 854(b)(2) of Code, the Fund designates 45.94% of the ordinary income dividends as income qualifying for the dividends received deduction for the fiscal year ended December 31, 2006.
At December 31, 2006, more than 50% of the Fund’s total assets were invested in securities of foreign issuers. In most instances, foreign taxes were withheld from dividends paid to the Fund on these investments. The Fund elects to treat foreign taxes paid as allowed under Section 853 of the Code. This election will allow shareholders of record in June 2007, to treat their proportionate share of foreign taxes paid by the Fund as having been paid directly by them. Shareholders shall consider these amounts as foreign taxes paid in the tax year in which they receive the Fund distribution.
The foreign tax information will be disclosed in the June 30, 2007, semi-annual report of the Fund.
TG-24
TEMPLETON FUNDS RETIREMENT ANNUITY SEPARATE ACCOUNT
Financial Statements
Statement of Assets and Liabilities
As of December 31, 2006
| | | |
Assets | | | |
Investment in Franklin Templeton Variable Insurance Products Trust (FTVIPT) - Templeton Growth Securities Fund - Class 1, at market value - (cost $5,150,069) | | $ | 7,025,169 |
Receivable from Templeton Funds Annuity Company | | | 30,724 |
| | |
|
|
Net assets | | $ | 7,055,893 |
| | |
|
|
Accumulation Units | | | |
Units outstanding | | | 434,726 |
| | |
|
|
Unit value (accumulation) | | | 16.23 |
| | |
|
|
The accompanying notes are an integral part of these financial statements.
SA-1
TEMPLETON FUNDS RETIREMENT ANNUITY SEPARATE ACCOUNT
Financial Statements (continued)
Statement of Operations
For the year ended December 31, 2006
| | | |
Investment Income: | | | |
Income: | | | |
Dividend distributions | | $ | 353,332 |
Expenses: | | | |
Periodic charge (Note 2) | | | 74,813 |
| | |
|
|
Net investment income | | | 278,519 |
| | |
|
|
Realized and unrealized gains and losses on investments: | | | |
Realized gain on investments | | | 87,409 |
Unrealized appreciation on investments | | | 929,674 |
| | |
|
|
Net gain on investments | | | 1,017,083 |
| | |
|
|
Increase in net assets | | $ | 1,295,602 |
| | |
|
|
The accompanying notes are an integral part of these financial statements.
SA-2
TEMPLETON FUNDS RETIREMENT ANNUITY SEPARATE ACCOUNT
Financial Statements (continued)
Statements of Changes in Net Assets
| | | | | | | | |
| | | Year ended
December 31, 2006 | | | Year ended
December 31, 2005 | |
| | |
| | |
| |
Increase (decrease) in net assets from operations: | | | | | | | | |
Net investment income | | $ | 278,519 | | | $ | 11,682 | |
Net realized gain/(loss) on investments | | | 87,409 | | | | (206,376 | ) |
Unrealized appreciation on investments | | | 929,674 | | | | 711,785 | |
| | |
| | |
| |
Net increase in net assets | | | 1,295,602 | | | | 517,092 | |
| | |
| | |
| |
Annuity unit transactions: | | | | | | | | |
Annuity payments | | | (1,135,734 | ) | | | (1,158,822 | ) |
| | |
| | |
| |
Increase/(Decrease) in annuity reserves for mortality experience (Note 1) | | | 103,497 | | | | (162,052 | ) |
| | |
| | |
| |
Net decrease in net assets derived from annuity unit transactions | | | (1,032,237 | ) | | | (1,320,874 | ) |
| | |
| | |
| |
Total increase (decrease) in net assets | | | 263,365 | | | | (803,782 | ) |
Net Assets: | | | | | | | | |
Beginning of period | | | 6,792,528 | | | | 7,596,310 | |
| | |
| | |
| |
End of period | | $ | 7,055,893 | | | $ | 6,792,528 | |
| | |
| | |
| |
The accompanying notes are an integral part of these financial statements.
SA-3
TEMPLETON FUNDS RETIREMENT ANNUITY SEPARATE ACCOUNT
Notes to Financial Statements
1. SUMMARY OF ACCOUNTING POLICIES
The Templeton Funds Retirement Annuity Separate Account (the “Separate Account”) was established on February 4, 1987 by resolution of the Board of Directors of Templeton Funds Annuity Company (the “Company”) and is registered under the Investment Company Act of 1940 as a unit investment trust. The Separate Account is sold exclusively for use with the Templeton Retirement Annuity, an immediate variable annuity designed for distributing the benefits of tax deferred retirement plans. As of December 31, 2006, all assets of the Separate Account are invested in the Franklin Templeton Variable Insurance Products Trust (“FTVIPT”) – Templeton Growth Securities Fund Class 1. The following is a summary of significant accounting policies followed by the Separate Account in the preparation of its financial statements.
Recent Accounting Pronouncements
In July 2006, the Financial Accounting Standards Board (“FASB”) released FASB Interpretation No. 48, Accounting for Uncertainty in Income Taxes (“FIN 48”), an interpretation of FASB Statement No. 109. FIN 48 provides guidance for how uncertain tax positions should be recognized, measured, presented and disclosed in the financial statements. FIN 48 requires the accounting and disclosure of tax positions taken or expected to be taken in the course of preparing the Fund’s tax returns to determine whether the tax positions are “more likely-than-not” of being sustained by the applicable tax authority. Tax positions not deemed to meet the more-likely-than-not threshold would be recorded as a tax benefit or expense in the current year. Adoption of FIN 48 is required for fiscal years beginning after December 15, 2006 and is to be applied to all open tax years as of the effective date. The Company is evaluating the application of FIN 48 to the Fund, and is not in a position at this time to estimate the significance of its impact, if any, on the financial statements.
In September 2006, FASB issued its new Standard No. 157, Fair Value Measurements (“FAS 157”). FAS 157 is designed to unify guidance for the measurement of fair value of all types of assets, including financial instruments, and certain liabilities, throughout a number of accounting standards. FAS 157 also establishes a hierarchy for measuring fair value in generally accepted accounting principles and expands financial statement disclosures about fair value measurements that are relevant to mutual funds. FAS 157 is effective for financial statements issued for fiscal years beginning after November 15, 2007, and earlier application is permitted. The Company is evaluating the application of FAS 157 to the Fund, and is not in a position at this time to estimate the significance of its impact, if any, the Fund’s financial statements.
Use of Estimates
The preparation of financial statements in conformity with accounting principles generally accepted in the United States of America requires management to make estimates and assumptions that affect the reported amounts of assets and liabilities and disclosure of contingent assets and liabilities at the date of the financial statements and the reported amounts of revenues and expenses during the reporting period. These estimates are based on management’s best knowledge of current events and actions the Company may undertake in the future. Actual results may ultimately differ from estimates and such differences could be material.
Valuation of Securities
Investments in shares of FTVIPT are carried in the Statement of Assets and Liabilities at net asset value (market value).
Dividends
Dividend income is recorded as income on the ex-dividend date and is reinvested in additional shares of the Fund.
SA-4
TEMPLETON FUNDS RETIREMENT ANNUITY SEPARATE ACCOUNT
Notes to Financial Statements (continued)
Income Taxes
Operations of the Separate Account form a part of the Company, which is taxed as a life insurance company under the Internal Revenue Code (the “Code”). Under current law, no federal income taxes are payable with respect to the Separate Account. Under the principles set forth in Internal Revenue Service Ruling 81-225 and Section 817(h) of the Code and regulations thereunder, the Company understands that it will be treated as owner of the assets invested in the Separate Account for federal income tax purposes, with the result that earnings and gains, if any, derived from those assets will not be included in an annuitant’s gross income until amounts are received pursuant to an annuity.
Annuity Reserves
Annuity reserves carried by the Company are computed according to the 1983a Blended Unisex Mortality Table, with a 50% male/female content. The assumed interest rates are 9%, 7% and 3%. Charges to annuity reserves for mortality experience are reimbursed to the Company if the reserves required are less than originally estimated. If additional reserves are required, the Company reimburses the Separate Account.
2. PERIODIC CHARGE
The Company assesses a periodic charge against the Separate Account, equal on an annual basis to 1.1% of Separate Account assets. The periodic charge, in the following amounts, compensates the Company for expenses of administering the Separate Account and for assuming the risks that mortality experience will be lower than the rate assumed and that expenses will be greater than what is assumed: 0.3% of average annual net assets to cover expenses, 0.3% to cover expense risk and 0.5% to cover the mortality risk. The periodic charge is guaranteed as to annuities issued prior to the effective date of any change in the periodic charge.
3. INVESTMENT TRANSACTIONS
During the year ended December 31, 2006, purchases and sales of Templeton Growth Securities Fund Class 1 shares aggregated $353,332 and $1,135,734, respectively. Realized gains and losses are reported on an identified cost basis.
4. UNIT VALUES
A summary of unit values and units outstanding for variable contracts, net investment income ratios and the expense ratios, excluding expenses of the underlying funds, for each of the five years in the period ended December 31, 2006, follows:
| | | | | | | | | | | | | | |
| | | Net Assets
| | Net Investment
income as a %
of average
net assets
| | Expenses as a
% of average
net assets
| | Total
Return
|
| | | Units | | Unit Value | | (000) | | | |
December 31, 2006 | | 434,726 | | $ | 16.23 | | $ | 7,056 | | 5.1% | | 1.1% | | 3.8% |
December 31, 2005 | | 485,729 | | | 13.98 | | | 6,790 | | 1.2% | | 1.1% | | 7.2% |
December 31, 2004 | | 584,843 | | | 12.98 | | | 7,596 | | 1.2% | | 1.1% | | 13.6% |
December 31, 2003 | | 633,415 | | | 11.31 | | | 7,611 | | 1.6% | | 1.0% | | 26.5% |
December 31, 2002 | | 758,256 | | | 8.67 | | | 6,555 | | 2.4% | | 1.1% | | (17.7)% |
December 31, 2001 | | 846,342 | | | 11.09 | | | 9,368 | | 2.1% | | 1.1% | | (2.1)% |
SA-5
TEMPLETON FUNDS RETIREMENT ANNUITY SEPARATE ACCOUNT
Notes to Financial Statements (continued)
5. CONCENTRATIONS OF CREDIT RISKS
Financial instruments which potentially subject the Separate Account to concentrations of credit risk consist of investments in FTVIPT - Templeton Growth Securities Fund Class 1. As of December 31, 2006, FTVIPT’s investment securities are managed by professional investment managers within established guidelines which, in management’s opinion, mitigates the Separate Account’s concentration of credit risk.
SA-6
TEMPLETON FUNDS RETIREMENT ANNUITY SEPARATE ACCOUNT
Report of Independent Certified Public Accountants
The Participants of
Templeton Funds Retirement Annuity Separate Account
In our opinion, the accompanying statement of assets and liabilities and the related statements of operations and of changes in net assets present fairly, in all material respects, the financial position of the Templeton Funds Retirement Annuity Separate Account (the “Separate Account”) at December 31, 2006, and the results of its operations for the year then ended and the changes in its net assets for each of the two years in the period ended December 31, 2006 in conformity with accounting principles generally accepted in the United States of America. These financial statements are the responsibility of the Separate Account’s management. Our responsibility is to express an opinion on these financial statements based on our audits. We conducted our audits of these statements in accordance with auditing standards generally accepted in the United States of America. Those standards require that we plan and perform the audit to obtain reasonable assurance about whether the financial statements are free of material misstatement. An audit includes examining, on a test basis, evidence supporting the amounts and disclosures in the financial statements, assessing the accounting principles used and significant estimates made by management, and evaluating the overall financial statement presentation. We believe that our audits provide a reasonable basis for our opinion.

February 21, 2007
SA-7
INDEX DESCRIPTIONS
The indexes are unmanaged and include reinvested distributions.
Consumer Price Index (CPI), calculated by the U.S. Bureau of Labor Statistics, is a commonly used measure of the inflation rate.
CS High Yield Index is designed to mirror the investible universe of the U.S. dollar-denominated high yield debt market.
Dow Jones Industrial Average (the Dow) is price weighted based on the average market price of 30 blue chip stocks of companies that are generally industry leaders.
Dow Jones Wilshire Real Estate Securities Index is a broad measure of the performance of publicly traded real estate securities, such as real estate investment trusts and real estate operating companies. The index is capitalization weighted and rebalanced monthly, and returns are calculated on a buy-and-hold basis.
HSBC Asian Local Bond Index (ALBI) tracks total return performance of a bond portfolio, which consists of local-currency denominated, high quality and liquid bonds in Asia ex-Japan. Local bond market returns are from country sub-indexes of the HSBC ALBI.
J.P. Morgan (JPM) Emerging Markets Bond Index (EMBI) Global tracks total returns for U.S. dollar-denominated debt instruments issued by emerging market sovereign and quasi-sovereign entities: Brady bonds, loans and Eurobonds.
J.P. Morgan (JPM) Government Bond Index (GBI) Global tracks total returns for liquid, fixed-rate, domestic government bonds with maturities greater than one year issued by developed countries globally.
Lehman Brothers (LB) U.S. Aggregate Index represents securities that are SEC-registered, taxable and dollar denominated. The index covers the U.S. investment grade fixed-rate bond market, with index components for government and corporate securities, mortgage pass-through securities and asset-backed securities. All issues included must have at least one year to final maturity and must be rated investment grade (Baa3 or better) by Moody’s Investors Service. They must also be dollar denominated and nonconvertible. Total return includes price appreciation/depreciation and income as a percentage of the original investment. The index is rebalanced monthly by market capitalization.
Lehman Brothers (LB) U.S. Government: Intermediate Index is the intermediate component of the LB U.S. Government Index. The index includes securities issued by the U.S. government or agency. These include obligations of the U.S. Treasury with remaining maturity of one year or more and publicly issued debt of U.S. governmental agencies, quasi-federal corporations, and corporate or foreign debt guaranteed by the U.S. government.
Lipper Multi-Sector Income Funds Classification Average is calculated by averaging the total returns of all funds within the Lipper Multi-Sector Income Funds classification in the Lipper Open-End underlying funds universe. Lipper Multi-Sector Income Funds are defined as funds that seek current income by allocating assets among different fixed income securities sectors (not primarily in one sector except for defensive purposes), including U.S. and foreign governments, with a significant portion rated below investment grade. For the 12-month period ended 12/31/06, there were 114 funds in this category. Lipper calculations do not include sales charges, but include reinvestment of any income or distributions. Fund performance relative to the average may have differed if these and other factors had been considered.
Lipper VIP Equity Income Funds Classification Average is an equally weighted average calculation of performance figures for all funds within the Lipper Equity Income Funds classification in the Lipper VIP underlying funds universe. Lipper Equity Income Funds seek relatively high current income and growth of income through investing 60% or more of their portfolios in equities. For the 12-month period ended 12/31/06, there were 61 funds in this category. Lipper calculations do not include contract fees, expenses or sales charges, and may have been different if such charges had been considered.
Lipper VIP General U.S. Government Funds Classification Average is an equally weighted average calculation of performance figures for all funds within the Lipper U.S. Government Funds classification in the Lipper VIP underlying fund universe. Lipper U.S. Government Funds invest primarily in U.S. government and agency issues. For the 12-month period ended 12/31/06, there were 63 funds in this category. Lipper calculations do not include contract fees, expenses or sales charges, and may have been different if such charges had been considered.
Lipper VIP High Current Yield Funds Classification Average is an equally weighted average calculation for performance figures for all funds within the Lipper High Current Yield Funds aim at high (relative) current yield from fixed income securities, have no quality or maturity restrictions, and tend to invest in lower grade debt issues. For the 12-month period ended 12/31/06, there were 100 funds in this category. Lipper calculations do not include contract fees, expenses or sales charges, and may have been different if such charges had been considered.
I-1
Merrill Lynch 2- and 5-Year Zero Coupon Bond Indexes include zero coupon bonds that pay no interest and are issued at a discount from redemption price.
Morgan Stanley Capital International (MSCI) All Country (AC) World Index is a free float-adjusted, market capitalization-weighted index designed to measure equity market performance in global developed and emerging markets.
Morgan Stanley Capital International (MSCI) Emerging Markets (EM) Index is a free float-adjusted, market capitalization-weighted index designed to measure equity market performance in global emerging markets.
Morgan Stanley Capital International (MSCI) Europe, Australasia, Far East (EAFE) Index is a free float-adjusted, market capitalization-weighted index designed to measure equity market performance in global developed markets excluding the U.S. and Canada.
Morgan Stanley Capital International (MSCI) World Index is a free float-adjusted, market capitalization-weighted index designed to measure equity market performance in global developed markets.
NASDAQ Composite Index measures all NASDAQ domestic and international based common type stocks listed on The NASDAQ Stock Market. The index is market value weighted and includes over 3,000 companies.
Russell 1000® Growth Index is market capitalization weighted and measures performance of those Russell 1000 Index companies with higher price-to-book ratios and higher forecasted growth values.
Russell 1000 Index is market capitalization weighted and measures performance of the 1,000 largest companies in the Russell 3000 Index, which represent approximately 92% of total market capitalization of the Russell 3000 Index.
Russell 1000 Value Index is market capitalization weighted and measures performance of those Russell 1000 Index companies with lower price-to-book ratios and lower forecasted growth values.
Russell 2500™ Index is market capitalization weighted and measures performance of the 2,500 smallest companies in the Russell 3000 Index, which represent approximately 17% of total market capitalization of the Russell 3000 Index.
Russell 2500 Value Index is market capitalization weighted and measures performance of those Russell 2500 Index companies with lower price-to-book ratios and lower forecasted growth values.
Russell 3000® Growth Index is market capitalization weighted and measures performance of those Russell 3000 Index companies with higher price-to-book ratios and higher forecasted growth values.
Russell 3000 Index is market capitalization weighted and measures performance of the 3,000 largest U.S. companies based on total market capitalization, which represent approximately 98% of the investible U.S. equity market.
Russell Midcap™ Growth Index is market capitalization weighted and measures performance of those Russell Midcap Index companies with higher price-to-book ratios and higher forecasted growth values.
Russell Midcap Index is market capitalization weighted and measures performance of the 800 smallest companies in the Russell 1000 Index, which represent approximately 26% of total market capitalization of the Russell 1000 Index.
Standard & Poor’s 500 Index (S&P 500) consists of 500 stocks chosen for market size, liquidity and industry group representation. Each stock’s weight in the index is proportionate to its market value. The S&P 500 is one of the most widely used benchmarks of U.S. equity performance.
Standard & Poor’s/International Finance Corporation Investable (S&P/IFCI) Composite Index is a free float-adjusted, market capitalization-weighted index designed to measure equity performance in global emerging markets.
I-2
Board Members and Officers
The name, year of birth and address of the officers and board members, as well as their affiliations, positions held with the Trust, principal occupation during the past five years and number of portfolios overseen in the Franklin Templeton Investments fund complex are shown below. Generally, each board member will serve until that person’s successor is elected and qualified.
Independent Board Members
| | | | | | | | |
| Name, Year of Birth and Address | | Position | | Length of
Time Served | | Number of
Portfolios in Fund
Complex Overseen
by Board Member* | | Other Directorships Held |
HARRIS J. ASHTON (1932) One Franklin Parkway San Mateo, CA 94403-1906 | | Trustee | | Since 1988 | | 142 | | Director, Bar-S Foods (meat packing company). |
|
Principal Occupation During Past 5 Years: Director of various companies; and formerly, Director, RBC Holdings, Inc. (bank holding company) (until 2002); and President, Chief Executive Officer and Chairman of the Board, General Host Corporation (nursery and craft centers) (until 1998). |
ROBERT F. CARLSON (1928) One Franklin Parkway San Mateo, CA 94403-1906 | | Trustee | | Since 1998 | | 57 | | None |
|
Principal Occupation During Past 5 Years: Vice President, senior member and past President, Board of Administration, California Public Employees Retirement Systems (CALPERS); and formerly, member and Chairman of the Board, Sutter Community Hospitals; member, Corporate Board, Blue Shield of California; and Chief Counsel, California Department of Transportation. |
EDITH E. HOLIDAY (1952) One Franklin Parkway San Mateo, CA 94403-1906 | | Trustee | | Since 2005 | | 143 | | Director, Hess Corporation (formerly Amerada Hess Corporation) (exploration and refining of oil and gas), H.J. Heinz Company (processed foods and allied products), RTI International Metals, Inc. (manufacture and distribution of titanium), Canadian National Railway (railroad) and White Mountains Insurance Group, Ltd. (holding company). |
|
Principal Occupation During Past 5 Years: Director or Trustee of various companies and trusts; and formerly, Assistant to the President of the United States and Secretary of the Cabinet (1990-1993); General Counsel to the United States Treasury Department (1989-1990); and Counselor to the Secretary and Assistant Secretary for Public Affairs and Public Liaison-United States Treasury Department (1988-1989). |
FRANK W.T. LAHAYE (1929) One Franklin Parkway San Mateo, CA 94403-1906 | | Trustee | | Since 1988 | | 116 | | Director, Center for Creative Land Recycling (redevelopment). |
|
Principal Occupation During Past 5 Years: General Partner, Las Olas L.P. (Asset Management); and formerly, Chairman, Peregrine Venture Management Company (venture capital). |
FRANK A. OLSON (1932) One Franklin Parkway San Mateo, CA 94403-1906 | | Trustee | | Since 2005 | | 103 | | Director, Hess Corporation (formerly Amerada Hess Corporation) (exploration and refining of oil and gas) and Sentient Jet (private jet service); and formerly, Director, Becton Dickinson and Company (medical technology), Cooper Industries, Inc. (electrical products and tools and hardware), Health Net, Inc. (formerly Foundation Health) (integrated managed care), The Hertz Corporation (car rental), Pacific Southwest Airlines, The RCA Corporation, Unicom (formerly Commonwealth Edison), UAL Corporation (airlines) and White Mountains Insurance Group, Ltd. (holding company). |
|
Principal Occupation During Past 5 Years: Chairman Emeritus, The Hertz Corporation (since 2000) (Chairman of the Board (1980-2000) and Chief Executive Officer (1977-1999)); and formerly, Chairman of the Board, President and Chief Executive Officer, UAL Corporation. |
BOD-1
Interested Board Members and Officers
| | | | | | | | |
| Name, Year of Birth and Address | | Position | | Length of
Time Served | | Number of
Portfolios in Fund
Complex Overseen
by Board Member* | | Other Directorships Held |
**CHARLES B. JOHNSON (1933) One Franklin Parkway San Mateo, CA 94403-1906 | | Trustee and Chairman of the Board | | Since 1988 | | 142 | | None |
|
Principal Occupation During Past 5 Years: Chairman of the Board, Member—Office of the Chairman and Director, Franklin Resources, Inc.; Director, Templeton Worldwide, Inc.; and officer and/or director or trustee, as the case may be, of some of the other subsidiaries of Franklin Resources, Inc. and of 41 of the investment companies in Franklin Templeton Investments. |
**RUPERT H. JOHNSON, JR. (1940) One Franklin Parkway San Mateo, CA 94403-1906 | | Trustee, President and Chief Executive Officer—Investment Management | | Trustee since 1988 and President and Chief Executive Officer—Investment Management since 2002 | | 126 | | None |
|
Principal Occupation During Past 5 Years: Vice Chairman, Member—Office of the Chairman and Director, Franklin Resources, Inc.; Director, Franklin Advisers, Inc. and Templeton Worldwide, Inc.; Senior Vice President, Franklin Advisory Services, LLC; and officer and/or director or trustee, as the case may be, of some of the other subsidiaries of Franklin Resources, Inc. and of 44 of the investment companies in Franklin Templeton Investments. |
JAMES M. DAVIS (1952) One Franklin Parkway San Mateo, CA 94403-1906 | | Chief Compliance Officer and Vice President—AML Compliance | | Chief Compliance Officer since 2004 and Vice President—AML Compliance since February 2006 | | Not
Applicable | | Not Applicable |
|
Principal Occupation During Past 5 Years: Director, Global Compliance, Franklin Resources, Inc.; officer of some of the other subsidiaries of Franklin Resources, Inc. and of 46 of the investment companies in Franklin Templeton Investments; and formerly, Director of Compliance, Franklin Resources, Inc. (1994-2001). |
LAURA FERGERSON (1962) One Franklin Parkway San Mateo, CA 94403-1906 | | Treasurer | | Since 2004 | | Not
Applicable | | Not Applicable |
|
Principal Occupation During Past 5 Years: Vice President, Franklin Templeton Services, LLC; officer of 30 of the investment companies in Franklin Templeton Investments; and formerly, Director and member of Audit and Valuation Committees, Runkel Funds, Inc. (2003-2004); Assistant Treasurer of most of the investment companies in Franklin Templeton Investments (1997-2003); and Vice President, Franklin Templeton Services, LLC (1997-2003). |
JIMMY D. GAMBILL (1947) 500 East Broward Blvd. Suite 2100 Fort Lauderdale, FL 33394-3091 | | Senior Vice President and Chief Executive Officer—Finance and Administration | | Since 2002 | | Not
Applicable | | Not Applicable |
|
Principal Occupation During Past 5 Years: President, Franklin Templeton Services, LLC; Senior Vice President, Templeton Worldwide, Inc.; and officer of some of the other subsidiaries of Franklin Resources, Inc. and of 46 of the investment companies in Franklin Templeton Investments. |
DAVID P. GOSS (1947) One Franklin Parkway San Mateo, CA 94403-1906 | | Vice President | | Since 2000 | | Not
Applicable | | Not Applicable |
|
Principal Occupation During Past 5 Years: Senior Associate General Counsel, Franklin Templeton Investments; officer and director of one of the subsidiaries of Franklin Resources, Inc.; and officer of 46 of the investment companies in Franklin Templeton Investments. |
BOD-2
| | | | | | | | |
| Name, Year of Birth and Address | | Position | | Length of
Time Served | | Number of
Portfolios in Fund
Complex Overseen
by Board Member* | | Other Directorships Held |
BARBARA J. GREEN (1947) One Franklin Parkway San Mateo, CA 94403-1906 | | Vice President | | Since 2000 | | Not
Applicable | | Not Applicable |
|
Principal Occupation During Past 5 Years: Vice President, Deputy General Counsel and Secretary, Franklin Resources, Inc.; Secretary and Senior Vice President, Templeton Worldwide, Inc.; Secretary, Franklin Advisers, Inc., Franklin Advisory Services, LLC, Franklin Investment Advisory Services, LLC, Franklin Mutual Advisers, LLC, Franklin Templeton Institutional, LLC, Franklin Templeton Investor Services, LLC, Franklin Templeton Services, LLC, Franklin Templeton Distributors, Inc., Templeton Investment Counsel, LLC, and Templeton/Franklin Investment Services, Inc.; Vice President, Templeton Global Advisers Limited; and officer of some of the other subsidiaries of Franklin Resources, Inc. and of 46 of the investment companies in Franklin Templeton Investments; and formerly, Deputy Director, Division of Investment Management, Executive Assistant and Senior Advisor to the Chairman, Counselor to the Chairman, Special Counsel and Attorney Fellow, U.S. Securities and Exchange Commission (1986-1995); Attorney, Rogers & Wells (until 1986); and Judicial Clerk, U.S. District Court (District of Massachusetts) (until 1979). |
KAREN L. SKIDMORE (1952) One Franklin Parkway San Mateo, CA 94403-1906 | | Vice President and Secretary | | Vice President since February 2006 Secretary since April 2006 | | Not
Applicable | | Not Applicable |
|
Principal Occupation During Past 5 Years: Senior Associate General Counsel, Franklin Templeton Investments; Vice President and Secretary, Templeton Funds Annuity Company; and officer of 30 of the investment companies in Franklin Templeton Investments. |
CRAIG S. TYLE (1960) One Franklin Parkway San Mateo, CA 94403-1906 | | Vice President | | Since 2005 | | Not
Applicable | | Not Applicable |
|
Principal Occupation During Past 5 Years: General Counsel and Executive Vice President, Franklin Resources, Inc.; officer of some of the other subsidiaries of Franklin Resources, Inc. and of 46 of the investment companies in Franklin Templeton Investments; and formerly, Partner, Shearman & Sterling, LLP (2004-2005); and General Counsel, Investment Company Institute (ICI) (1997-2004). |
BOD-3
| | | | | | | | |
| Name, Year of Birth and Address | | Position | | Length of
Time Served | | Number of
Portfolios in Fund
Complex Overseen
by Board Member* | | Other Directorships Held |
GALEN G. VETTER (1951) 500 East Broward Blvd. Suite 2100 Fort Lauderdale, FL 33394-3091 | | Chief Financial Officer and Chief Accounting Officer | | Since 2004 | | Not
Applicable | | Not Applicable |
|
Principal Occupation During Past 5 Years: Senior Vice President, Franklin Templeton Services, LLC; officer of 46 of the investment companies in Franklin Templeton Investments; and formerly, Managing Director, RSM McGladrey, Inc. (1999-2004); and Partner, McGladrey & Pullen, LLP (1979-1987 and 1991-2004). |
| *We | base the number of portfolios on each separate series of the U.S. registered investment companies within the Franklin Templeton Investments fund complex. These portfolios have a common investment manager or affiliated investment managers. |
| **Charles | B. Johnson and Rupert H. Johnson, Jr. are considered to be interested persons of the Fund under the federal securities laws due to their positions as officers and directors and major shareholders of Franklin Resources, Inc., which is the parent company of the Trust’s manager and distributor. |
Note 1: Charles B. Johnson and Rupert H. Johnson, Jr. are brothers.
Note 2: Prior to December 31, 2006, S. Joseph Fortunato and Gordon S. Macklin ceased to be a trustee of the Trust.
The Sarbanes-Oxley Act of 2002 and Rules adopted by the Securities and Exchange Commission require the Fund to disclose whether the Fund’s Audit Committee includes at least one member who is an audit committee financial expert within the meaning of such Act and Rules. The Fund’s Board of Trustees has determined that there is at least one such financial expert on the Audit Committee and has designated Frank W.T. LaHaye as its audit committee financial expert. The Board believes that Mr. LaHaye qualifies as such an expert in view of his extensive business background and experience, including service as President and Director of McCormick Selph Associates from 1954 through 1965; Director and Chairman of Teledyne Canada Ltd. from 1966 through 1971; Director and Chairman of Quarterdeck Corporation from 1982 through 1998; and services as a Director of various other public companies including U.S. Telephone Inc. (1981-1984), Fisher Imaging Inc. (1991-1998) and Digital Transmissions Systems (1995-1999). In addition, Mr. LaHaye served from 1981 to 2000 as a Director and Chairman of Peregrine Venture Management Co., a venture capital firm, and has been a Member and Chairman of the Fund’s Audit Committee since its inception. As a result of such background and experience, the Board of Trustees believes that Mr. LaHaye has acquired an understanding of generally accepted accounting principles and financial statements, the general application of such principles in connection with the accounting estimates, accruals and reserves, and analyzing and evaluating financial statements that present a breadth and level of complexity of accounting issues generally comparable to those of the Fund, as well as an understanding of internal controls and procedures for financial reporting and an understanding of audit committee functions. Mr. LaHaye is an independent Trustee as that term is defined under the relevant Securities and Exchange Commission Rules and Releases.
The Statement of Additional Information (SAI) includes additional information about the board members and is available, without charge, upon request. Shareholders may call 1-800/321-8563 or their insurance companies to request the SAI.
BOD-4
Franklin Templeton Variable Insurance Products Trust
Proxy Voting Policies and Procedures
The Trust has established Proxy Voting Policies and Procedures (“Policies”) that the Trust uses to determine how to vote proxies relating to portfolio securities. Shareholders may view the Trust’s complete Policies online at franklintempleton.com. Alternatively, shareholders may request copies of the Policies free of charge by calling the Proxy Group collect at 1-954/527-7678 or by sending a written request to: Franklin Templeton Companies, LLC, 500 East Broward Boulevard, Suite 1500, Fort Lauderdale, FL 33394, Attention: Proxy Group. Copies of the Trust’s proxy voting records are also made available online at franklintempleton.com and posted on the U.S. Securities and Exchange Commission’s website at sec.gov and reflect the most recent 12-month period ended June 30.
PV-1
| | |
 | | One Franklin Parkway San Mateo, CA 94403-1906 |
Annual Report
FRANKLIN TEMPLETON
VARIABLE INSURANCE PRODUCTS TRUST
Insurance Issuer
Templeton Funds Annuity Company
100 Fountain Parkway
St. Petersburg, FL 33716-1205
1-800/774-5001
Investment Manager
Templeton Global Advisers Limited
Lyford Cay
Nassau, N.P., Bahamas
Principal Underwriter
Franklin Templeton Distributors, Inc.
One Franklin Parkway
San Mateo, CA 94403
This report was prepared for contract owners who have previously received a prospectus for their annuity contract and for Templeton Growth Securities Fund, a series of Franklin Templeton Variable Insurance Products Trust.
To ensure the highest quality of service, telephone calls to or from our service departments may be monitored, recorded and accessed. These calls may be identified by the presence of a regular beeping tone.
TRA SA12/06
| (a) | The Registrant has adopted a code of ethics that applies to its principal executive officers and principal financial and accounting officer. |
| (f) | Pursuant to Item 12(a)(1), the Registrant is attaching as an exhibit a copy of its code of ethics that applies to its principal executive officers and principal financial and accounting officer. |
| Item 3. | Audit Committee Financial Expert. |
| | |
| (a) (1) | | The Registrant has an audit committee financial expert serving on its audit committee. |
| | |
| (2) | | The audit committee financial expert is Frank W.T. LaHaye and he is “Independent” as defined under the relevant Securities and Exchange Commission Rules And Releases. |
| Item 4. | Principal Accountant Fees and Services. |
(a) Audit Fees
The aggregate fees paid to the principal accountant for professional services rendered by the principal accountant for the audit of the registrant’s annual financial statements or for services that are normally provided by the principal accountant in connection with statutory and regulatory filings or engagements were $771,109 for the fiscal year ended December 31, 2006 and $729,089 for the fiscal year ended December 31, 2005.
(b) Audit-Related Fees
There were no fees paid to the principal accountant for assurance and related services rendered by the principal accountant to the registrant that are reasonably related to the performance of the audit of the registrant’s financial statements and are not reported under paragraph (a) of Item 4.
There were no fees paid to the principal accountant for assurance and related services rendered by the principal accountant to the registrant’s investment adviser and any entity controlling, controlled by or under common control with the investment adviser that provides ongoing services to the registrant that are reasonably related to the performance of the audit of their financial statements.
(c) Tax Fees
There were no fees paid to the principal accountant for professional services rendered by the principal accountant to the registrant for tax compliance, tax advice and tax planning.
The aggregate fees paid to the principal accountant for professional services rendered by the principal accountant to the registrant’s investment adviser and any entity controlling, controlled by or under common control with the investment adviser that provides ongoing services to the registrant for tax compliance, tax advice and tax planning were $3,961 for the fiscal year ended December 31, 2006 and $4,955 for the fiscal year ended December 31, 2005. The services for which these fees were paid included tax compliance and advice.
(d) All Other Fees
The aggregate fees paid to the principal accountant for products and services rendered by the principal accountant to the registrant not reported in paragraphs (a)-(c) of Item 4 were $14,799 for the fiscal year ended December 31, 2006 and $0 for the fiscal year ended December 31, 2005. The services for which these fees were paid included review of materials provided to the fund Board in connection with the investment management contract renewal process.
The aggregate fees paid to the principal accountant for products and services rendered by the principal accountant to the registrant’s investment adviser and any entity controlling, controlled by or under common control with the investment adviser that provides ongoing
services to the registrant not reported in paragraphs (a)-(c) of Item 4 were $161,062 for the fiscal year ended December 31, 2006 and $5,835 for the fiscal year ended December 31, 2005. The services for which these fees were paid included review of materials provided to the fund Board in connection with the investment management contract renewal process and the review of the ICI transfer agent survey.
(e) (1) The registrant’s audit committee is directly responsible for approving the services to be provided by the auditors, including:
(i) pre-approval of all audit and audit related services;
(ii) pre-approval of all non-audit related services to be provided to the Fund by the auditors;
(iii) pre-approval of all non-audit related services to be provided to the registrant by the auditors to the registrant’s investment adviser or to any entity that controls, is controlled by or is under common control with the registrant’s investment adviser and that provides ongoing services to the registrant where the non-audit services relate directly to the operations or financial reporting of the registrant; and
(iv) establishment by the audit committee, if deemed necessary or appropriate, as an alternative to committee pre-approval of services to be provided by the auditors, as required by paragraphs (ii) and (iii) above, of policies and procedures to permit such services to be pre-approved by other means, such as through establishment of guidelines or by action of a designated member or members of the committee; provided the policies and procedures are detailed as to the particular service and the committee is informed of each service and such policies and procedures do not include delegation of audit committee responsibilities, as contemplated under the Securities Exchange Act of 1934, to management; subject, in the case of (ii) through (iv), to any waivers, exceptions or exemptions that may be available under applicable law or rules.
(e) (2) None of the services provided to the registrant described in paragraphs (b)-(d) of Item 4 were approved by the audit committee pursuant to paragraph (c)(7)(i)(C) of Rule 2-01 of regulation S-X.
(f) No disclosures are required by this Item 4(f).
(g) The aggregate non-audit fees paid to the principal accountant for services rendered by the principal accountant to the registrant and the registrant’s investment adviser and any entity controlling, controlled by or under common control with the investment adviser that provides ongoing services to the registrant were $179,822 for the fiscal year ended December 31, 2006 and $10,790 for the fiscal year ended December 31, 2005.
(h) The registrant’s audit committee of the board has considered whether the provision of non-audit services that were rendered to the registrant’s investment adviser (not including any sub-adviser whose role is primarily portfolio management and is subcontracted with or overseen by another investment adviser), and any entity controlling, controlled by, or under common control with the investment adviser that
provides ongoing services to the registrant that were not pre-approved pursuant to paragraph (c)(7)(ii) of Rule 2-01 of Regulation S-X is compatible with maintaining the principal accountant’s independence.
| Item 5. | Audit Committee of Listed Registrants. N/A |
| Item 6. | Schedule of Investments. N/A |
| Item 7. | Disclosure of Proxy Voting Policies and Procedures for Closed-End Management Investment Companies. N/A |
| Item 8. | Portfolio Managers of Closed-End Management Investment Companies. N/A |
| Item 9. | Purchases of Equity Securities by Closed-End Management Investment Companies and Affiliated Purchases. N/A |
| Item 10. | Submission of Matters to a vote of Security Holders. |
There have been no changes to the procedures by which shareholders may recommend nominees to the Registrant’s Board of Trustees that would require disclosure herein.
| Item 11. | Controls and Procedures. |
(a) Evaluation of Disclosure Controls and Procedures. The Registrant maintains disclosure controls and procedures that are designed to ensure that information required to be disclosed in the Registrant’s filings under the Securities Exchange Act of 1934 and the Investment Company Act of 1940 is recorded, processed, summarized and reported within the periods specified in the rules and forms of the Securities and Exchange Commission. Such information is accumulated and communicated to the Registrant’s management, including its principal executive officer and principal financial officer, as appropriate, to allow timely decisions regarding required disclosure. The Registrant’s management, including the principal executive officer and the principal financial officer, recognizes that any set of controls and procedures, no matter how well designed and operated, can provide only reasonable assurance of achieving the desired control objectives.
Within 90 days prior to the filing date of this Shareholder Report on Form N-CSR, the Registrant had carried out an evaluation, under the supervision and with the participation of the Registrant’s management, including the Registrant’s principal executive officer and the Registrant’s principal financial officer, of the effectiveness of the design and operation of the Registrant’s disclosure controls and procedures. Based on such evaluation, the Registrant’s principal executive officer and principal financial officer concluded that the Registrant’s disclosure controls and procedures are effective.
(b) Changes in Internal Controls. There have been no significant changes in the Registrant’s internal controls or in other factors that
could significantly affect the internal controls subsequent to the date of their evaluation in connection with the preparation of this Shareholder Report on Form N-CSR.
(a) (1) Code of Ethics
(a) (2) Certifications pursuant to Section 302 of the Sarbanes-Oxley Act of 2002 of Jimmy D. Gambill, Chief Executive Officer - Finance and Administration, and Galen G. Vetter, Chief Financial Officer
(b) Certifications pursuant to Section 906 of the Sarbanes-Oxley Act of 2002 of Jimmy D. Gambill, Chief Executive Officer - Finance and Administration, and Galen G. Vetter, Chief Financial Officer
SIGNATURES
Pursuant to the requirements of the Securities Exchange Act of 1934 and the Investment Company Act of 1940, the registrant has duly caused this report to be signed on its behalf by the undersigned, thereunto duly authorized.
FRANKLIN TEMPLETON VARIABLE INSURANCE PRODUCTS TRUST
| | |
| |
| By | | /s/ Jimmy D. Gambill |
Jimmy D. Gambill |
Chief Executive Officer -Finance and Administration |
Date February 27, 2007 |
Pursuant to the requirements of the Securities Exchange Act of 1934 and the Investment Company Act of 1940, this report has been signed below by the following persons on behalf of the registrant and in the capacities and on the dates indicated.
| | |
| |
| By | | /s/ Jimmy D. Gambill |
Jimmy D. Gambill |
Chief Executive Officer -Finance and Administration |
Date February 27, 2007 |
| | |
| |
| By | | /s/ Galen G. Vetter |
Galen G. Vetter |
Chief Financial Officer |
Date February 27, 2007 |