UNITED STATES
SECURITIES AND EXCHANGE COMMISSION
Washington, D.C. 20549
FORM N-CSR
CERTIFIED SHAREHOLDER REPORT OF REGISTERED
MANAGEMENT INVESTMENT COMPANIES
Investment Company Act file number 811-05583
Franklin Templeton Variable Insurance Products Trust
(Exact name of registrant as specified in charter)
| | |
| One Franklin Parkway, San Mateo, CA | | 94403-1906 |
| |
| (Address of principal executive offices) | | (Zip code) |
Craig S. Tyle, One Franklin Parkway, San Mateo, CA 94403-1906
(Name and address of agent for service)
Registrant’s telephone number, including area code: (650) 312-2100
Date of fiscal year end: 12/31
Date of reporting period: 12/31/05
Item 1. Reports to Stockholders.

DECEMBER 31, 2005
FRANKLIN TEMPLETON
VARIABLE INSURANCE PRODUCTS TRUST
ANNUAL REPORT

FRANKLIN TEMPLETON VARIABLE INSURANCE PRODUCTS TRUST ANNUAL REPORT
TABLEOF CONTENTS
NOT FDIC INSURED | MAY LOSE VALUE | NO BANK GUARANTEE
MASTER CLASS – 1
IMPORTANT NOTESTO PERFORMANCE INFORMATION
Performance data is historical and cannot predict or guarantee future results. Principal value and investment return will fluctuate with market conditions, and you may have a gain or loss when you withdraw your money. Inception dates of the funds may have preceded the effective dates of the subaccounts, contracts, or their availability in all states.
When reviewing the index comparisons, please keep in mind that indexes have a number of inherent performance differentials over the funds. First, unlike the funds, which must hold a minimum amount of cash to maintain liquidity, indexes do not have a cash component. Second, the funds are actively managed and, thus, are subject to management fees to cover salaries of securities analysts or portfolio managers in addition to other expenses. Indexes are unmanaged and do not include any commissions or other expenses typically associated with investing in securities. Third, indexes often contain a different mix of securities than the fund to which they are compared. Additionally, please remember that indexes are simply a measure of performance and cannot be invested in directly.
i
FRANKLIN GLOBAL COMMUNICATIONS SECURITIES FUND
We are pleased to bring you Franklin Global Communications Securities Fund’s annual report for the fiscal year ended December 31, 2005.
Performance Summary as of 12/31/05
Average annual total return of Class 1 shares represents the average annual change in value, assuming reinvestment of dividends and capital gains. Average returns smooth out variations in returns, which can be significant; they are not the same as year-by-year results.
Periods ended 12/31/05
| | | | | | |
| | | 1-Year | | 5-Year | | 10-Year |
Average Annual Total Return | | +16.12% | | -2.46% | | +2.23% |
Total Return Index Comparison
for Hypothetical $10,000 Investment (1/1/96–12/31/05)
The graph below shows the change in value of a hypothetical $10,000 investment in the Fund over the indicated period and includes reinvestment of any income or distributions. The Fund’s performance is compared to the performance of the Standard & Poor’s 500 Index (S&P 500). One cannot invest directly in an index, nor is an index representative of the Fund’s portfolio. Please see Important Notes to Performance Information preceding the Fund Summaries.
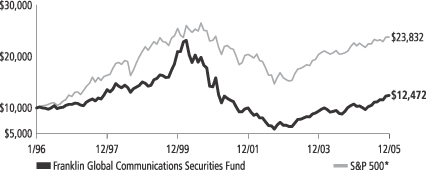
*Source: Standard & Poor’s Micropal. Please see Index Descriptions following the Fund Summaries.
Franklin Global Communications Securities Fund – Class 1
Performance reflects the Fund’s Class 1 operating expenses, but does not include any contract fees, expenses or sales charges. If they had been included, performance would be lower. These charges and deductions, particularly for variable life policies, can have a significant effect on contract values and insurance benefits. See the contract prospectus for a complete description of these expenses, including sales charges.
Performance data represent past performance, which does not guarantee future results. Investment return and principal value will fluctuate, and you may have a gain or loss when you sell your shares.
Current performance may differ from figures shown.
FGC-1
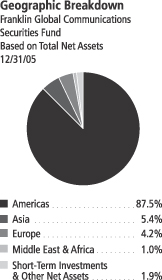
Fund Goals and Main Investments: Franklin Global Communications Securities Fund seeks capital appreciation and current income. The Fund normally invests at least 80% of its net assets in investments of communications companies anywhere in the world. Communications companies are those that are primarily engaged in providing the distribution, content and equipment related to the creation, transmission and processing of information.
Performance Overview
You can find the Fund’s one-year total return in the Performance Summary. The Fund outperformed its benchmark, the S&P 500, which returned +4.91% for the period under review.1 Given that the Fund invests in only a few sectors found within the S&P 500, the Fund’s results versus the S&P 500 are not directly comparable.
Economic and Market Overview
During the 12 months ended December 31, 2005, U.S. economic expansion was driven by strength across most industries, sectors and regions. Gross domestic product (GDP) rose during the period, benefiting from increased personal consumption, federal spending and business investment, which increased 24% in third quarter 2005 compared with the same quarter in 2004.2 Slower export growth combined with greater demand for imported goods and materials fueled a widening trade gap. The U.S. dollar rallied in 2005, supported by rising short-term domestic interest rates and strong economic growth in the U.S. relative to many of its major trading partners.
Many businesses enjoyed record profits, propelled largely by productivity gains. Earnings for companies in the S&P 500 were estimated to have increased 13% in 2005.3 The labor market firmed as employment increased and the unemployment rate dropped from 5.4% to 4.9% during the reporting period. Personal income rose, and hiring rebounded in many industries, bolstered by healthy business spending.
1. Source: Standard & Poor’s Micropal. One cannot invest directly in an index, nor is an index representative of the Fund’s portfolio. Please see Index Descriptions following the Fund Summaries.
2. Source: Thomson Financial. Based on companies in the S&P 500.
3. Source: Standard & Poor’s.
Fund Risks: The Fund’s investments in stocks offer potential for long-term gains but can be subject to short-term up-and-down price movements. By concentrating in the industries of the utilities sector and by investing predominantly in communications companies, the Fund carries much greater risk of adverse developments affecting that sector, and among those companies, than a fund that invests more broadly. Foreign investing, especially in emerging markets, involves additional risks including currency fluctuations, economic instability, and social and political developments. The Fund’s prospectus also includes a description of the main investment risks.
FGC-2
Oil prices remained high during the period largely due to potential long-term supply limitations and strong growth in global demand, especially from China and India. Natural gas prices rose during the second half of 2005 mainly because of expected rising demand with the onset of winter; however, near period-end prices retreated somewhat amid milder-than-expected weather conditions. Even with high commodity prices, inflation remained relatively contained for the 12 months ended December 31, 2005, as measured by the 2.2% rise for the core Consumer Price Index (CPI).4
Despite this inflation picture, the Federal Reserve Board raised the federal funds target rate from 2.25% to 4.25%. Compared with the rise in short-term interest rates, long-term rates remained relatively stable, supporting overall robust housing and commercial real estate activity, which contributed to economic growth. Throughout 2005, as short- and intermediate-term interest rates rose, the yield curve moved from a fairly normal steepness at the beginning of the period to relatively flat by the end of 2005.
In this environment, the blue chip stocks of the Dow Jones Industrial Average posted a one-year total return of +1.72%, while the broader S&P 500 and the technology-heavy NASDAQ Composite Index returned +4.91% and +2.12%.5
Investment Strategy
We are research-driven, fundamental investors. As bottom-up investors focusing primarily on individual securities, we seek companies that have identifiable drivers of future earnings growth and that present, in our opinion, the best trade-off between that potential earnings growth, business and financial risk and valuation. We rely on a team of analysts to help provide in-depth industry expertise within the communications industry and use both qualitative and quantitative analysis to evaluate companies for distinct, sustainable and competitive advantages likely to lead to growth in earnings and/or share price. Competitive advantages such as a particular marketing niche, proven technology, sound financial profits and records or strong management are all factors we believe may contribute to growth in earnings or share price.
4. Source: Bureau of Labor Statistics. Core CPI excludes food and energy costs.
5. Source: Standard & Poor’s Micropal. Please see Index Descriptions following the Fund Summaries.
What is the yield curve?
The yield curve is a graph illustrating the yields on bonds of the same credit quality with maturities ranging from the shortest to the longest available. The resulting curve shows if short-term interest rates are higher or lower than longer-term rates.
FGC-3
Manager’s Discussion
During the year under review, the wireless telecommunications industry provided the greatest contribution to the Fund’s return. We continued to favor wireless over wireline as we expected these growth trends to continue. Several factors supported these overall trends. For example, wireless access in less developed countries with low wireless service penetration rates, or number of users, grew more rapidly than many industry analysts expected. Many of these nascent markets continued to hold the potential for strong wireless growth. Relative global economic stability, combined with the rollout of prepaid wireless plans, also fueled the industry’s growth.
On a company-specific basis, three of the Fund’s top performers are outlined below. America Movil is the dominant wireless service provider in Mexico and operates wireless service businesses in Brazil, Argentina, Peru, Colombia, Ecuador, Guatemala and El Salvador. These countries’ markets had relatively low wireless penetration rates that experienced rapid growth driven by the introduction of prepaid wireless plans and stabilized economies. Wireless is a cost-effective solution for telecommunications services in these countries.
NII Holdings is the Nextel wireless service provider operating in Mexico, Brazil, Argentina and Peru. We purchased the stock because we thought the company had an attractive stock valuation, a capable management team and a tremendous growth opportunity in its markets. NII’s subscriber base grew faster than expected, translating into strong profitability. Recently the company acquired spectrum (the range of frequencies used by radio, TV, wireless, satellite and other technologies) that will allow Nextel’s push-to-talk service (centering on a new wireless telephone handset which functions like a walkie-talkie) to be offered nationwide in Mexico.
Rogers Communications is a diversified Canadian communications and media company engaged in three primary lines of business. In Canada, Rogers Wireless is the largest wireless voice and data communications services provider, Rogers Cable is the biggest cable television provider, and Rogers Media is the premier collection of category-leading media assets with businesses in radio and television broadcasting.
FGC-4
The media industry experienced particularly weak performance during the reporting period. Media companies faced threats to their core advertising businesses as new entrants, such as the Internet, competed for market share; and new technology allowing viewers to skip or avoid advertising proliferated. Additionally, the value of original content came into question as piracy threatened to change the economics of content creation.
Three media-related detractors to the Fund’s overall results are described below. Viacom (media conglomerates) operates worldwide as a diversified entertainment company through five segments: cable networks, television, radio, outdoor and entertainment. Although this holding negatively impacted the Fund, we continued to own Viacom because we believe it has a strong asset base of content creating entities.
Walt Disney (media conglomerates), a diversified entertainment company, operates worldwide in four segments: media networks, parks and resorts, studio entertainment and consumer products. We continued to hold this position also because we believe it has a strong asset base of content creating entities.
DreamWorks Animation (movies and entertainment) engages in the development, production and use of computer generated animated feature films in theaters, home video, pay and free broadcast television, and ancillary markets. We sold this stock by period-end.
Thank you for your participation in Franklin Global Communications Securities Fund. We look forward to serving your future investment needs.
The foregoing information reflects our analysis, opinions and portfolio holdings as of December 31, 2005, the end of the reporting period. The way we implement our main investment strategies and the resulting portfolio holdings may change depending on factors such as market and economic conditions. These opinions may not be relied upon as investment advice or an offer for a particular security. The information is not a complete analysis of every aspect of any market, country, industry, security or the Fund. Statements of fact are from sources considered reliable, but the adviser makes no representation or warranty as to their completeness or accuracy. Although historical performance is no guarantee of future results, these insights may help you understand our investment management philosophy.
Top 10 Holdings
Franklin Global Communications Securities Fund
12/31/05
| | |
Company Sector/Industry, Country | | % of Total
Net Assets |
| |
| America Movil SA de CV, L, ADR | | 7.1% |
| Wireless Communications, Mexico | | |
| |
| Rogers Communications Inc., B | | 5.4% |
| Wireless Communications, Canada | | |
| |
| American Tower Corp., A | | 5.1% |
| Specialty Telecommunications, U.S. | | |
| |
| NII Holdings Inc. | | 4.5% |
| Wireless Communications, U.S. | | |
| |
| Google Inc., A | | 4.0% |
| Internet Software & Services, U.S. | | |
| |
| QUALCOMM Inc. | | 3.9% |
| Telecommunications Equipment, U.S. | | |
| |
| Grupo Televisa SA, ADR | | 3.5% |
| Broadcasting, Mexico | | |
| |
| Pixar | | 3.5% |
| Movies & Entertainment, U.S. | | |
| |
| Nokia OYJ, ADR | | 3.3% |
| Telecommunications Equipment, Finland | | |
| |
| Yahoo! Inc. | | 3.2% |
| Internet Software & Services, U.S. | | |
The dollar value, number of shares or principal amount, and names of all portfolio holdings are listed in the Fund’s Statement of Investments.
FGC-5
Fund Expenses
As an investor in a variable insurance contract (“Contract”) that indirectly provides for investment in an underlying mutual fund, you can incur transaction and/or ongoing expenses at both the Fund level and the Contract level.
| • | | Transaction expenses can include sales charges (loads) on purchases, redemption fees, surrender fees, transfer fees and premium taxes. |
| • | | Ongoing expenses can include management fees, distribution and service (12b-1) fees, contract fees, annual maintenance fees, mortality and expense risk fees and other fees and expenses. All mutual funds and Contracts have some types of ongoing expenses. |
The expenses shown in the table below are meant to highlight ongoing expenses at the Fund level only and do not include ongoing expenses at the Contract level, or transaction expenses at either the Fund or Contract level. While the Fund does not have transaction expenses, if the transaction and ongoing expenses at the Contract level were included, the expenses shown below would be higher. You should consult your Contract prospectus or disclosure document for more information.
The table shows Fund-level ongoing expenses and can help you understand these expenses and compare them with those of other mutual funds offered through the Contract. The table assumes a $1,000 investment held for the six months indicated. Please refer to the Fund prospectus for additional information on operating expenses.
Actual Fund Expenses
The first line (Actual) of the table below provides actual account values and expenses. The “Ending Account Value” is derived from the Fund’s actual return, which includes the effect of ongoing Fund expenses, but does not include the effect of ongoing Contract expenses.
You can estimate the Fund-level expenses you incurred during the period by following these steps. Of course, your account value and expenses will differ from those in this illustration:
| 1. | Divide your account value by $1,000. |
If an account had an $8,600 value, then $8,600 ÷ $1,000 = 8.6.
| 2. | Multiply the result by the number under the heading “Fund-Level Expenses Incurred During Period.” |
If Fund-Level Expenses Incurred During Period were $7.50, then 8.6 × $7.50 = $64.50.
Franklin Global Communications Securities Fund – Class 1
FGC-6
In this illustration, the estimated expenses incurred this period at the Fund level are $64.50.
Hypothetical Example for Comparison with Other Mutual Funds
Information in the second line (Hypothetical) of the table can help you compare ongoing expenses of the Fund with those of other mutual funds offered through the Contract. This information may not be used to estimate the actual ending account balance or expenses you incurred during the period. The hypothetical “Ending Account Value” is based on the Fund’s actual expense ratio and an assumed 5% annual rate of return before expenses, which does not represent the Fund’s actual return. The figure under the heading “Fund-Level Expenses Incurred During Period” shows the hypothetical expenses your account would have incurred under this scenario. You can compare this figure with the 5% hypothetical examples that appear in shareholder reports of other funds offered through a Contract.
| | | | | | | | | |
| Class 1 | | Beginning
Account
Value 7/1/05 | | Ending
Account
Value 12/31/05 | | Fund-Level
Expenses Incurred
During Period* 7/1/05-12/31/05 |
Actual | | $ | 1,000 | | $ | 1,182.70 | | $ | 3.52 |
Hypothetical (5% return before expenses) | | $ | 1,000 | | $ | 1,021.98 | | $ | 3.26 |
*Expenses are equal to the annualized expense ratio for the Fund’s Class 1 shares (0.64%), which does not include any ongoing expenses of the Contract for which the Fund is an investment option, multiplied by the average account value over the period, multiplied by 184/365 to reflect the one-half year period.
FGC-7
Franklin Templeton Variable Insurance Products Trust
Financial Highlights
Franklin Global Communications Securities Fund
| | | | | | | | | | | | | | | | | | | | |
| | | Year Ended December 31,
| |
| Class 1 | | 2005 | | | 2004 | | | 2003 | | | 2002 | | | 2001 | |
| | |
|
|
|
Per share operating performance | | | | | | | | | | | | | | | | | | | | |
(for a share outstanding throughout the year) | | | | | | | | | | | | | | | | | | | | |
Net asset value, beginning of year | | $ | 7.17 | | | $ | 6.32 | | | $ | 4.53 | | | $ | 6.87 | | | $ | 12.88 | |
| | |
|
|
|
Income from investment operations: | | | | | | | | | | | | | | | | | | | | |
Net investment incomea | | | 0.04 | | | | 0.05 | | | | 0.06 | | | | 0.04 | | | | 0.04 | |
Net realized and unrealized gains (losses) | | | 1.08 | | | | 0.87 | | | | 1.78 | | | | (2.33 | ) | | | (3.55 | ) |
| | |
|
|
|
Total from investment operations | | | 1.12 | | | | 0.92 | | | | 1.84 | | | | (2.29 | ) | | | (3.51 | ) |
| | |
|
|
|
Less distributions from: | | | | | | | | | | | | | | | | | | | | |
Net investment income | | | (0.20 | ) | | | (0.07 | ) | | | (0.05 | ) | | | (0.05 | ) | | | (0.01 | ) |
Net realized gains | | | — | | | | — | | | | — | | | | — | | | | (2.49 | ) |
| | |
|
|
|
Total distributions | | | (0.20 | ) | | | (0.07 | ) | | | (0.05 | ) | | | (0.05 | ) | | | (2.50 | ) |
| | |
|
|
|
Net asset value, end of year | | $ | 8.09 | | | $ | 7.17 | | | $ | 6.32 | | | $ | 4.53 | | | $ | 6.87 | |
| | |
|
|
|
| | | | | |
Total returnb | | | 16.12% | | | | 14.66% | | | | 40.46% | | | | (33.28)% | | | | (29.24)% | |
Ratios/supplemental data | | | | | | | | | | | | | | | | | | | | |
Net assets, end of year (000’s) | | $ | 138,015 | | | $ | 142,898 | | | $ | 149,480 | | | $ | 130,255 | | | $ | 265,055 | |
Ratios to average net assets: | | | | | | | | | | | | | | | | | | | | |
Expenses | | | 0.65% | | | | 0.64% | | | | 0.64% | | | | 0.60% | | | | 0.55% | |
Net investment income | | | 0.63% | | | | 0.85% | | | | 1.08% | | | | 0.83% | | | | 0.46% | |
Portfolio turnover rate | | | 170.40% | | | | 178.52% | | | | 96.60% | | | | 97.75% | | | | 105.36% | |
| a | Based on average daily shares outstanding. |
| b | Total return does not include any fees, charges or expenses imposed by the variable annuity and life insurance contracts for which the Franklin Templeton Variable Insurance Products Trust serves as an underlying investment vehicle. |
See notes to financial statements.
FGC-8
Franklin Templeton Variable Insurance Products Trust
Financial Highlights (continued)
Franklin Global Communications Securities Fund (continued)
| | | | | | | | | | | | | | | | | | | | |
| | | Year Ended December 31,
| |
| Class 2 | | 2005 | | | 2004 | | | 2003 | | | 2002 | | | 2001 | |
| | |
|
|
|
Per share operating performance | | | | | | | | | | | | | | | | | | | | |
(for a share outstanding throughout the year) | | | | | | | | | | | | | | | | | | | | |
Net asset value, beginning of year | | $ | 7.10 | | | $ | 6.28 | | | $ | 4.51 | | | $ | 6.84 | | | $ | 12.86 | |
| | |
|
|
|
Income from investment operations: | | | | | | | | | | | | | | | | | | | | |
Net investment incomea | | | 0.03 | | | | 0.04 | | | | 0.05 | | | | 0.03 | | | | 0.02 | |
Net realized and unrealized gains (losses) | | | 1.06 | | | | 0.84 | | | | 1.77 | | | | (2.32 | ) | | | (3.54 | ) |
| | |
|
|
|
Total from investment operations | | | 1.09 | | | | 0.88 | | | | 1.82 | | | | (2.29 | ) | | | (3.52 | ) |
| | |
|
|
|
Less distributions from: | | | | | | | | | | | | | | | | | | | | |
Net investment income | | | (0.19 | ) | | | (0.06 | ) | | | (0.05 | ) | | | (0.04 | ) | | | (0.01 | ) |
Net realized gains | | | — | | | | — | | | | — | | | | — | | | | (2.49 | ) |
| | |
|
|
|
Total distributions | | | (0.19 | ) | | | (0.06 | ) | | | (0.05 | ) | | | (0.04 | ) | | | (2.50 | ) |
| | |
|
|
|
Net asset value, end of year | | $ | 8.00 | | | $ | 7.10 | | | $ | 6.28 | | | $ | 4.51 | | | $ | 6.84 | |
| | |
|
|
|
| | | | | |
Total returnb | | | 15.79% | | | | 14.18% | | | | 40.44% | | | | (33.52)% | | | | (29.40)% | |
Ratios/supplemental data | | | | | | | | | | | | | | | | | | | | |
Net assets, end of year (000’s) | | $ | 38,613 | | | $ | 23,704 | | | $ | 10,719 | | | $ | 1,490 | | | $ | 312 | |
Ratios to average net assets: | | | | | | | | | | | | | | | | | | | | |
Expenses | | | 0.90% | | | | 0.89% | | | | 0.89% | | | | 0.85% | | | | 0.80% | |
Net investment income | | | 0.38% | | | | 0.60% | | | | 0.83% | | | | 0.58% | | | | 0.21% | |
Portfolio turnover rate | | | 170.40% | | | | 178.52% | | | | 96.60% | | | | 97.75% | | | | 105.36% | |
| a | Based on average daily shares outstanding. |
| b | Total return does not include any fees, charges or expenses imposed by the variable annuity and life insurance contracts for which the Franklin Templeton Variable Insurance Products Trust serves as an underlying investment vehicle. |
See notes to financial statements.
FGC-9
Franklin Templeton Variable Insurance Products Trust
Statement of Investments, December 31, 2005
| | | | | | | |
| Franklin Global Communications Securities Fund | | Country | | Shares | | Value |
Common Stocks 98.1% | | | | | | | |
Advertising/Marketing Services 3.8% | | | | | | | |
aFocus Media Holding Ltd., ADR | | China | | 115,900 | | $ | 3,913,943 |
aGetty Images Inc. | | United States | | 31,100 | | | 2,776,297 |
| | | | | | |
|
|
| | | | | | | | 6,690,240 |
| | | | | | |
|
|
Broadcasting 6.9% | | | | | | | |
a,bCanadian Satellite Radio Holdings Inc., 144A | | Canada | | 116,300 | | | 1,471,886 |
aEntravision Communications Corp. | | United States | | 102,600 | | | 730,512 |
Grupo Televisa SA, ADR | | Mexico | | 77,100 | | | 6,206,550 |
aUnivision Communications Inc., A | | United States | | 42,200 | | | 1,240,258 |
aXM Satellite Radio Holdings Inc., A | | United States | | 94,100 | | | 2,567,048 |
| | | | | | |
|
|
| | | | | | | | 12,216,254 |
| | | | | | |
|
|
Cable/Satellite Television 3.0% | | | | | | | |
aEchoStar Communications Corp., A | | United States | | 133,700 | | | 3,632,629 |
Naspers Ltd., N | | South Africa | | 97,100 | | | 1,718,873 |
| | | | | | |
|
|
| | | | | | | | 5,351,502 |
| | | | | | |
|
|
Computer Communications 1.6% | | | | | | | |
aF5 Networks Inc. | | United States | | 24,400 | | | 1,395,436 |
aJuniper Networks Inc. | | United States | | 60,700 | | | 1,353,610 |
| | | | | | |
|
|
| | | | | | | | 2,749,046 |
| | | | | | |
|
|
Computer Peripherals 0.9% | | | | | | | |
aNetwork Appliance Inc. | | United States | | 61,400 | | | 1,657,800 |
| | | | | | |
|
|
Computer Processing Hardware 2.0% | | | | | | | |
aApple Computer Inc. | | United States | | 48,300 | | | 3,472,287 |
| | | | | | |
|
|
Data Processing Services 1.9% | | | | | | | |
aNeuStar Inc., A | | United States | | 110,400 | | | 3,366,096 |
| | | | | | |
|
|
Electronic Production Equipment 0.8% | | | | | | | |
a,bMiranda Technologies Inc., 144A | | Canada | | 114,800 | | | 1,343,268 |
| | | | | | |
|
|
Internet Software/Services 7.8% | | | | | | | |
aGoogle Inc., A | | United States | | 17,100 | | | 7,094,106 |
aLivePerson Inc. | | United States | | 166,600 | | | 934,626 |
aYahoo! Inc. | | United States | | 144,200 | | | 5,649,756 |
| | | | | | |
|
|
| | | | | | | | 13,678,488 |
| | | | | | |
|
|
Major Telecommunications 12.1% | | | | | | | |
ALLTEL Corp. | | United States | | 65,200 | | | 4,114,120 |
BellSouth Corp. | | United States | | 87,400 | | | 2,368,540 |
aBharti Tele-Ventures Ltd. | | India | | 508,000 | | | 3,903,003 |
PT Telekomunikasi Indonesia, B | | Indonesia | | 2,945,100 | | | 1,767,659 |
Sprint Nextel Corp. | | United States | | 193,377 | | | 4,517,287 |
Telus Corp. | | Canada | | 116,300 | | | 4,682,238 |
| | | | | | |
|
|
| | | | | | | | 21,352,847 |
| | | | | | |
|
|
Media Conglomerates 2.6% | | | | | | | |
News Corp., A | | United States | | 88,800 | | | 1,380,840 |
Viacom Inc., B | | United States | | 49,600 | | | 1,616,960 |
The Walt Disney Co. | | United States | | 69,600 | | | 1,668,312 |
| | | | | | |
|
|
| | | | | | | | 4,666,112 |
| | | | | | |
|
|
FGC-10
Franklin Templeton Variable Insurance Products Trust
Statement of Investments, December 31, 2005 (continued)
| | | | | | | |
| Franklin Global Communications Securities Fund | | Country | | Shares | | Value |
Common Stocks (cont.) | | | | | | | |
Movies/Entertainment 3.9% | | | | | | | |
aOutdoor Channel Holdings Inc. | | United States | | 54,800 | | $ | 739,800 |
aPixar | | United States | | 117,400 | | | 6,189,328 |
| | | | | | |
|
|
| | | | | | | | 6,929,128 |
| | | | | | |
|
|
Packaged Software 2.8% | | | | | | | |
Autodesk Inc. | | United States | | 30,500 | | | 1,309,975 |
aSalesforce.com Inc. | | United States | | 111,800 | | | 3,583,190 |
| | | | | | |
|
|
| | | | | | | | 4,893,165 |
| | | | | | |
|
|
Semiconductors 4.5% | | | | | | | |
aBroadcom Corp., A | | United States | | 72,800 | | | 3,432,520 |
aMarvell Technology Group Ltd. | | Bermuda | | 51,100 | | | 2,866,199 |
aSilicon Laboratories Inc. | | United States | | 46,700 | | | 1,712,022 |
| | | | | | |
|
|
| | | | | | | | 8,010,741 |
| | | | | | |
|
|
Specialty Telecommunications 8.2% | | | | | | | |
aAmerican Tower Corp., A | | United States | | 332,102 | | | 8,999,964 |
aCrown Castle International Corp. | | United States | | 167,190 | | | 4,499,083 |
aSyniverse Holdings Inc. | | United States | | 49,900 | | | 1,042,910 |
| | | | | | |
|
|
| | | | | | | | 14,541,957 |
| | | | | | |
|
|
Telecommunications Equipment 12.4% | | | | | | | |
aComverse Technology Inc. | | United States | | 62,100 | | | 1,651,239 |
aCorning Inc. | | United States | | 132,000 | | | 2,595,120 |
Harris Corp. | | United States | | 98,000 | | | 4,214,980 |
Nokia OYJ, ADR | | Finland | | 317,600 | | | 5,812,080 |
QUALCOMM Inc. | | United States | | 160,100 | | | 6,897,108 |
aResearch In Motion Ltd. | | Canada | | 11,600 | | | 765,716 |
| | | | | | |
|
|
| | | | | | | | 21,936,243 |
| | | | | | |
|
|
Wireless Communications 22.9% | | | | | | | |
America Movil SA de CV, L, ADR | | Mexico | | 426,000 | | | 12,464,760 |
aEuropolitan Vodafone AB | | Sweden | | 273,500 | | | 1,703,889 |
aNextel Partners Inc., A | | United States | | 191,800 | | | 5,358,892 |
aNII Holdings Inc. | | United States | | 183,500 | | | 8,015,280 |
Rogers Communications Inc., B | | Canada | | 225,600 | | | 9,549,617 |
aSBA Communications Corp. | | United States | | 189,700 | | | 3,395,630 |
| | | | | | |
|
|
| | | | | | | | 40,488,068 |
| | | | | | |
|
|
Total Common Stocks (Cost $133,733,845) | | | | | | | 173,343,242 |
| | | | | | |
|
|
See notes to financial statements.
FGC-11
Franklin Templeton Variable Insurance Products Trust
Statement of Investments, December 31, 2005 (continued)
| | | | | | | | |
| Franklin Global Communications Securities Fund | | Country | | Principal
Amount | | Value |
Short Term Investment (Cost $1,485,741) 0.9% | | | | | | | | |
Repurchase Agreement 0.9% | | | | | | | | |
cJoint Repurchase Agreement, 3.999%, 1/03/06 (Maturity Value $1,486,402) | | United States | | $ | 1,485,741 | | $ | 1,485,741 |
ABN AMRO Bank, N.V., New York Branch (Maturity Value $136,942) | | | | | | | | |
Banc of America Securities LLC (Maturity Value $139,915) | | | | | | | | |
Barclays Capital Inc. (Maturity Value $139,915) | | | | | | | | |
Bear, Stearns & Co. Inc. (Maturity Value $119,091) | | | | | | | | |
BNP Paribas Securities Corp. (Maturity Value $139,915) | | | | | | | | |
Deutsche Bank Securities Inc. (Maturity Value $59,560) | | | | | | | | |
Goldman, Sachs & Co. (Maturity Value $101,224) | | | | | | | | |
Greenwich Capital Markets Inc. (Maturity Value $139,915) | | | | | | | | |
Lehman Brothers Inc. (Maturity Value $93,153) | | | | | | | | |
Merrill Lynch Government Securities Inc. (Maturity Value $139,915) | | | | | | | | |
Morgan Stanley & Co. Inc. (Maturity Value $136,942) | | | | | | | | |
UBS Securities LLC (Maturity Value $139,915) | | | | | | | | |
Collateralized by U.S. Government Agency Securities, 1.875 - 7.25%, 2/15/06 - 11/15/10;
dU.S. Government Agency Discount Notes, 1/09/06 - 1/27/06; and U.S. Treasury Notes, 2.375 - 5.75%, 8/15/06 - 8/15/10 | | | | | | | | |
| | | | | | | |
|
|
Total Investments (Cost $135,219,586) 99.0% | | | | | | | | 174,828,983 |
Other Assets, less Liabilities 1.0% | | | | | | | | 1,799,104 |
| | | | | | | |
|
|
Net Assets 100.0% | | | | | | | $ | 176,628,087 |
| | | | | | | |
|
|
Selected Portfolio Abbreviations
ADR - American Depository Receipt
| b | Security was purchased pursuant to Rule 144A under the Securities Act of 1933 and may be sold in transactions exempt from registration only to qualified institutional buyers or in a public offering registered under the Securities Act of 1933. These securities have been deemed liquid under the guidelines approved by the Trust’s Board of Trustees. At December 31, 2005, the value of these securities was $2,815,154, representing 1.59% of net assets. |
| c | See Note 1(c) regarding joint repurchase agreement. |
| d | A portion or all of the security is traded on a discount basis with no stated coupon rate. |
See notes to financial statements.
FGC-12
Franklin Templeton Variable Insurance Products Trust
Financial Statements
Statement of Assets and Liabilities
December 31, 2005
| | | | |
| | | Franklin Global
Communications
Securities Fund
| |
Assets: | | | | |
Investments in securities: | | | | |
Cost - Unaffiliated issuers | | $ | 133,733,845 | |
Cost - Repurchase agreements | | | 1,485,741 | |
| | |
|
|
|
Total cost of investments | | $ | 135,219,586 | |
| | |
|
|
|
Value - Unaffiliated issuers | | $ | 173,343,242 | |
Value - Repurchase agreements | | | 1,485,741 | |
| | |
|
|
|
Total value of investments | | | 174,828,983 | |
Foreign currency, at value (cost $746,803) | | | 755,269 | |
Receivables: | | | | |
Investment securities sold | | | 932,134 | |
Dividends | | | 376,461 | |
| | |
|
|
|
Total assets | | | 176,892,847 | |
| | |
|
|
|
Liabilities: | | | | |
Payables: | | | | |
Capital shares redeemed | | | 128,506 | |
Affiliates | | | 101,450 | |
Reports to shareholders | | | 29,540 | |
Accrued expenses and other liabilities | | | 5,264 | |
| | |
|
|
|
Total liabilities | | | 264,760 | |
| | |
|
|
|
Net assets, at value | | $ | 176,628,087 | |
| | |
|
|
|
Net assets consist of: | | | | |
Paid-in capital | | $ | 381,482,531 | |
Undistributed net investment income | | | 141,906 | |
Net unrealized appreciation (depreciation) | | | 39,617,921 | |
Accumulated net realized gain (loss) | | | (244,614,271 | ) |
| | |
|
|
|
Net assets, at value | | $ | 176,628,087 | |
| | |
|
|
|
Class 1: | | | | |
Net assets, at value | | $ | 138,015,229 | |
| | |
|
|
|
Shares outstanding | | | 17,069,282 | |
| | |
|
|
|
Net asset value and offering price per share | | $ | 8.09 | |
| | |
|
|
|
Class 2: | | | | |
Net assets, at value | | $ | 38,612,858 | |
| | |
|
|
|
Shares outstanding | | | 4,824,952 | |
| | |
|
|
|
Net asset value and offering price per share | | $ | 8.00 | |
| | |
|
|
|
See notes to financial statements.
FGC-13
Franklin Templeton Variable Insurance Products Trust
Financial Statements (continued)
Statement of Operations
for the year ended December 31, 2005
| | | | |
| | | Franklin Global
Communications
Securities Fund
| |
Investment Income: | | | | |
Dividends (net of foreign taxes of $102,977) | | $ | 1,784,948 | |
Interest | | | 106,199 | |
Other income (Note 7) | | | 104,420 | |
| | |
|
|
|
Total investment income | | | 1,995,567 | |
| | |
|
|
|
Expenses: | | | | |
Management fees (Note 3a) | | | 908,864 | |
Distribution fees - Class 2 (Note 3c) | | | 62,578 | |
Unaffiliated transfer agent fees | | | 746 | |
Custodian fees (Note 4) | | | 9,289 | |
Reports to shareholders | | | 56,533 | |
Professional fees | | | 29,842 | |
Trustees’ fees and expenses | | | 849 | |
Other | | | 6,691 | |
| | |
|
|
|
Total expenses | | | 1,075,392 | |
Expense reductions (Note 4) | | | (178 | ) |
| | |
|
|
|
Net expenses | | | 1,075,214 | |
| | |
|
|
|
Net investment income | | | 920,353 | |
| | |
|
|
|
Realized and unrealized gains (losses): | | | | |
Net realized gain (loss) from: | | | | |
Investments | | | 19,804,673 | |
Foreign currency transactions | | | (97,630 | ) |
| | |
|
|
|
Net realized gain (loss) | | | 19,707,043 | |
| | |
|
|
|
Net change in unrealized appreciation (depreciation) on: | | | | |
Investments | | | 2,842,837 | |
Translation of assets and liabilities denominated in foreign currencies | | | 8,503 | |
| | |
|
|
|
Net change in unrealized appreciation (depreciation) | | | 2,851,340 | |
| | |
|
|
|
Net realized and unrealized gain (loss) | | | 22,558,383 | |
| | |
|
|
|
Net increase (decrease) in net assets resulting from operations | | $ | 23,478,736 | |
| | |
|
|
|
See notes to financial statements.
FGC-14
Franklin Templeton Variable Insurance Products Trust
Financial Statements (continued)
Statements of Changes in Net Assets
| | | | | | | | |
| | | Franklin Global
Communications
Securities Fund
| |
| | | Year Ended December 31,
| |
| | | 2005 | | | 2004 | |
| | |
| |
Increase (decrease) in net assets: | | | | | | | | |
Operations: | | | | | | | | |
Net investment income | | $ | 920,353 | | | $ | 1,286,801 | |
Net realized gain (loss) from investments and foreign currency transactions | | | 19,707,043 | | | | 3,605,895 | |
Net change in unrealized appreciation (depreciation) on investments and translation of assets and liabilities denominated in foreign currencies | | | 2,851,340 | | | | 16,198,793 | |
| | |
| |
Net increase (decrease) in net assets resulting from operations | | | 23,478,736 | | | | 21,091,489 | |
| | |
| |
Distributions to shareholders from: | | | | | | | | |
Net investment income: | | | | | | | | |
Class 1 | | | (3,621,935 | ) | | | (1,418,784 | ) |
Class 2 | | | (604,566 | ) | | | (135,885 | ) |
| | |
| |
Total distributions to shareholders | | | (4,226,501 | ) | | | (1,554,669 | ) |
| | |
| |
Capital share transactions: (Note 2) | | | | | | | | |
Class 1 | | | (20,610,682 | ) | | | (23,869,093 | ) |
Class 2 | | | 11,384,685 | | | | 10,735,851 | |
| | |
| |
Total capital share transactions | | | (9,225,997 | ) | | | (13,133,242 | ) |
| | |
| |
Net increase (decrease) in net assets | | | 10,026,238 | | | | 6,403,578 | |
Net assets: | | | | | | | | |
Beginning of year | | | 166,601,849 | | | | 160,198,271 | |
| | |
| |
End of year | | $ | 176,628,087 | | | $ | 166,601,849 | |
| | |
| |
Undistributed net investment income included in net assets: | | | | | | | | |
End of year | | $ | 141,906 | | | $ | 2,164,024 | |
| | |
| |
See notes to financial statements.
FGC-15
Franklin Templeton Variable Insurance Products Trust
Notes to Financial Statements
Franklin Global Communications Securities Fund
1. ORGANIZATION AND SIGNIFICANT ACCOUNTING POLICIES
Franklin Templeton Variable Insurance Products Trust (the Trust) is registered under the Investment Company Act of 1940 as an open-end investment company, consisting of twenty-two separate series. The Franklin Global Communications Securities Fund (the Fund) included in this report is diversified. The financial statements of the remaining funds in the series are presented separately. Shares of the Fund are sold only to insurance company separate accounts to fund the benefits of variable life insurance policies or variable annuity contracts. As of December 31, 2005, 99.94% of the Fund’s shares were sold through one insurance company.
The following summarizes the Fund’s significant accounting policies.
a. Security Valuation
Securities listed on a securities exchange or on the NASDAQ National Market System are valued at the last quoted sale price or the official closing price of the day, respectively. Over-the-counter securities and listed securities for which there is no reported sale are valued within the range of the most recent quoted bid and ask prices. Securities that trade in multiple markets or on multiple exchanges are valued according to the broadest and most representative market.
Foreign securities are valued as of the close of trading on the foreign stock exchange on which the security is primarily traded, or the NYSE, whichever is earlier. If no sale is reported at that time, the foreign security will be valued within the range of the most recent quoted bid and ask prices. The value is then converted into its U.S. dollar equivalent at the foreign exchange rate in effect at the close of the NYSE on the day that the value of the foreign security is determined.
The Trust has procedures to determine the fair value of individual securities and other assets for which market prices are not readily available or which may not be reliably priced. Methods for valuing these securities may include: fundamental analysis, matrix pricing, discounts from market prices of similar securities, or discounts applied due to the nature and duration of restrictions on the disposition of the securities. Due to the inherent uncertainty of valuations of such securities, the fair values may differ significantly from the values that would have been used had a ready market for such investments existed. Occasionally, events occur between the time at which trading in a security is completed and the close of the NYSE that might call into question the availability (including the reliability) of the value of a portfolio security held by the Fund. If such an event occurs, the securities may be valued using fair value procedures, which may include the use of independent pricing services. All security valuation procedures are approved by the Trust’s Board of Trustees.
b. Foreign Currency Translation
Portfolio securities and other assets and liabilities denominated in foreign currencies are translated into U.S. dollars based on the exchange rate of such currencies against U.S. dollars on the date of valuation. Purchases and sales of securities, income and expense items denominated in foreign currencies are translated into U.S. dollars at the exchange rate in effect on the transaction date. Occasionally, events may impact the availability or reliability of foreign exchange rates used to convert the U.S. dollar equivalent value. If such an event occurs, the foreign exchange rate will be valued at fair value using procedures established and approved by the Trust’s Board of Trustees.
The Fund does not separately report the effect of changes in foreign exchange rates from changes in market prices on securities held. Such changes are included in net realized and unrealized gain or loss from investments on the Statement of Operations.
Realized foreign exchange gains or losses arise from sales of foreign currencies, currency gains or losses realized between the trade and settlement dates on securities transactions and the difference between the recorded amounts of dividends, interest, and foreign withholding taxes and the U.S. dollar equivalent of the amounts actually received or paid. Net unrealized foreign exchange gains and losses arise from changes in foreign exchange rates on foreign denominated assets and liabilities other than investments in securities held at the end of the reporting period.
FGC-16
Franklin Templeton Variable Insurance Products Trust
Notes to Financial Statements (continued)
Franklin Global Communications Securities Fund
1. ORGANIZATION AND SIGNIFICANT ACCOUNTING POLICIES (continued)
c. Joint Repurchase Agreement
The Fund may enter into a joint repurchase agreement whereby its uninvested cash balance is deposited into a joint cash account with other funds managed by the investment manager or an affiliate of the investment manager and is used to invest in one or more repurchase agreements. The value and face amount of the joint repurchase agreement are allocated to the funds based on their pro-rata interest. A repurchase agreement is accounted for as a loan by the Fund to the seller, collateralized by securities which are delivered to the Fund’s custodian. The market value, including accrued interest, of the initial collateralization is required to be at least 102% of the dollar amount invested by the Fund, with the value of the underlying securities marked to market daily to maintain coverage of at least 100%. Repurchase agreements are valued at cost. At December 31, 2005, all repurchase agreements held by the Fund had been entered into on December 30, 2005.
d. Foreign Currency Contracts
When the Fund purchases or sells foreign securities it may enter into foreign exchange contracts to minimize foreign exchange risk from the trade date to the settlement date of the transactions. A foreign exchange contract is an agreement between two parties to exchange different currencies at an agreed upon exchange rate on a specified date. Realized and unrealized gains and losses on these contracts are included in the Statement of Operations.
The risks of these contracts include movement in the values of the foreign currencies relative to the U.S. dollar and the possible inability of the counterparties to fulfill their obligations under the contracts, which may be in excess of the amount reflected in the Statement of Assets and Liabilities.
e. Income Taxes
No provision has been made for U.S. income taxes because the Fund’s policy is to continue to qualify as a regulated investment company under the Internal Revenue Code and to distribute to shareholders substantially all of its taxable income and net realized gains.
Foreign securities held by the Fund may be subject to foreign taxation. Foreign taxes, if any, are recorded based on the tax regulations and rates that exist in the foreign markets in which the Fund invests.
f. Security Transactions, Investment Income, Expenses and Distributions
Security transactions are accounted for on trade date. Realized gains and losses on security transactions are determined on a specific identification basis. Interest income and estimated expenses are accrued daily. Dividend income is recorded on the ex-dividend date except that certain dividends from foreign securities are recognized as soon as the Fund is notified of the ex-dividend date. Distributions to shareholders are recorded on the ex-dividend date and are determined according to income tax regulations (tax basis). Such distributions are reinvested in additional shares of the Fund. Distributable earnings determined on a tax basis may differ from earnings recorded in accordance with generally accepted accounting principles. These differences may be permanent or temporary. Permanent differences are reclassified among capital accounts to reflect their tax character. These reclassifications have no impact on net assets or the results of operations. Temporary differences are not reclassified, as they may reverse in subsequent periods.
Common expenses incurred by the Trust are allocated among the funds based on the ratio of net assets of each Fund to the combined net assets of the Trust. Fund specific expenses are charged directly to the fund that incurred the expense.
Realized and unrealized gains and losses and net investment income, other than class specific expenses, are allocated daily to each class of shares based upon the relative proportion of net assets of each class.
g. Accounting Estimates
The preparation of financial statements in accordance with accounting principles generally accepted in the United States of America requires management to make estimates and assumptions that affect the reported amounts of assets and liabilities at the
FGC-17
Franklin Templeton Variable Insurance Products Trust
Notes to Financial Statements (continued)
Franklin Global Communications Securities Fund
1. ORGANIZATION AND SIGNIFICANT ACCOUNTING POLICIES (continued)
date of the financial statements and the amounts of income and expenses during the reporting period. Actual results could differ from those estimates.
h. Guarantees and Indemnifications
Under the Trust’s organizational documents, its officers and trustees are indemnified by the Trust against certain liabilities arising out of the performance of their duties to the Trust. Additionally, in the normal course of business, the Trust enters into contracts with service providers that contain general indemnification clauses. The Trust’s maximum exposure under these arrangements is unknown as this would involve future claims that may be made against the Trust that have not yet occurred. However, based on experience, the Trust expects the risk of loss to be remote.
2. SHARES OF BENEFICIAL INTEREST
The Fund offers two classes of shares: Class 1 and Class 2. Each class of shares differs by its distribution fees, voting rights on matters affecting a single class and its exchange privilege.
At December 31, 2005, there were an unlimited number of shares authorized ($0.01 par value). Transactions in the Fund’s shares were as follows:
| | | | | | | | | | | | | | |
| | | Year Ended December 31,
| |
| | | 2005
| | | 2004
| |
| Class 1 Shares: | | Shares
| | | Amount
| | | Shares
| | | Amount
| |
Shares sold | | 13,623 | | | $ | 98,643 | | | 36,176 | | | $ | 234,808 | |
Shares issued in reinvestment of distributions | | 531,855 | | | | 3,621,935 | | | 231,827 | | | | 1,418,784 | |
Shares redeemed | | (3,415,087 | ) | | | (24,331,260 | ) | | (3,966,244 | ) | | | (25,522,685 | ) |
| | |
| |
Net increase (decrease) | | (2,869,609 | ) | | $ | (20,610,682 | ) | | (3,698,241 | ) | | $ | (23,869,093 | ) |
| | |
| |
| Class 2 Shares: | | | | | | | | | | | | |
Shares sold | | 2,349,088 | | | $ | 17,384,328 | | | 2,205,007 | | | $ | 14,315,821 | |
Shares issued in reinvestment of distributions | | 89,565 | | | | 604,566 | | | 22,350 | | | | 135,885 | |
Shares redeemed | | (951,932 | ) | | | (6,604,209 | ) | | (596,789 | ) | | | (3,715,855 | ) |
| | |
| |
Net increase (decrease) | | 1,486,721 | | | $ | 11,384,685 | | | 1,630,568 | | | $ | 10,735,851 | |
| | |
| |
3. TRANSACTIONS WITH AFFILIATES
Franklin Resources, Inc. is the holding company for various subsidiaries that together are referred to as Franklin Templeton Investments. Certain officers and trustees of the Trust are also officers and/or directors of the following subsidiaries:
| | |
| Subsidiary | | Affiliation |
Franklin Advisers, Inc. (Advisers) | | Investment manager |
Franklin Templeton Services, LLC (FT Services) | | Administrative manager |
Franklin Templeton Distributors, Inc. (Distributors) | | Principal underwriter |
Franklin Templeton Investor Services, LLC (Investor Services) | | Transfer agent |
FGC-18
Franklin Templeton Variable Insurance Products Trust
Notes to Financial Statements (continued)
Franklin Global Communications Securities Fund
3. TRANSACTIONS WITH AFFILIATES (continued)
a. Management Fees
The Fund pays an investment management fee to Advisers based on the average daily net assets of the Fund as follows:
| | |
| Annualized Fee Rate | | Net Assets |
| 0.625% | | Up to and including $100 million |
| 0.500% | | Over $100 million, up to and including $250 million |
| 0.450% | | Over $250 million, up to and including $10 billion |
| 0.440% | | Over $10 billion, up to and including $12.5 billion |
| 0.420% | | Over $12.5 billion, up to and including $15 billion |
| 0.400% | | In excess of $15 billion |
b. Administrative Fees
Under an agreement with Advisers, FT Services provides administrative services to the Fund. The fee is paid by Advisers based on average daily net assets, and is not an additional expense of the Fund.
c. Distribution Fees
The Fund’s Board of Trustees has adopted distribution plans for Class 2 shares pursuant to Rule 12b-1 under the 1940 Act. Under the Fund’s compensation distribution plans, the Fund pays Distributions for costs incurred in connection with the sale and distribution of the Fund’s shares up to 0.35% per year of its average daily net assets. The Board of Trustees has set the current rate at 0.25% per year.
d. Transfer Agent Fees
Investor Services, under terms of an agreement, performs shareholder servicing for the Fund and is not paid by the Fund for the services.
4. EXPENSE OFFSET ARRANGEMENT
The Fund has entered into an arrangement with its custodian whereby credits realized as a result of uninvested cash balances are used to reduce a portion of the Fund’s custodian expenses. During the year ended December 31, 2005, the custodian fees were reduced as noted in the Statement of Operations.
5. INCOME TAXES
During the year ended December 31, 2005, the Fund utilized $18,886,385 of capital loss carryforwards.
At December 31, 2005, the Fund had tax basis capital losses which may be carried over to offset future capital gains, if any. At December 31, 2005, the capital loss carryforwards were as follows:
| | | |
Capital loss carryforwards expiring in: | | | |
2009 | | $ | 134,780,383 |
2010 | | | 108,979,162 |
| | |
|
|
| | | $ | 243,759,545 |
| | |
|
|
FGC-19
Franklin Templeton Variable Insurance Products Trust
Notes to Financial Statements (continued)
Franklin Global Communications Securities Fund
5. INCOME TAXES (continued)
For tax purposes, realized currency losses, occurring subsequent to October 31, may be deferred and treated as occurring on the first day of the following fiscal year. At December 31, 2005, the Fund deferred realized currency losses of $52,227.
The tax character of distributions paid during the years ended December 31, 2005 and 2004, was as follows:
| | | | | | |
| | | 2005
| | 2004
|
Distributions paid from ordinary Income | | $ | 4,226,501 | | $ | 1,554,669 |
| | |
|
At December 31, 2005, the cost of investments, net unrealized appreciation (depreciation) and undistributed ordinary income for income tax purposes were as follows:
| | | | |
Cost of investments | | $ | 136,485,342 | |
| | |
|
|
|
| |
Unrealized appreciation | | $ | 39,144,289 | |
Unrealized depreciation | | | (800,648 | ) |
| | |
|
|
|
Net unrealized appreciation (depreciation) | | $ | 38,343,641 | |
| | |
|
|
|
Distributable earnings - undistributed ordinary income | | $ | 605,162 | |
| | |
|
|
|
Net investment income differs for financial statements and tax purposes primarily due to differing treatments of foreign currency transactions and passive foreign investment company shares.
Net realized gains (losses) differ for financial statements and tax purposes primarily due to differing treatments of wash sales, foreign currency transactions and passive foreign investment company shares.
6. INVESTMENT TRANSACTIONS
Purchases and sales of investments (excluding short term securities) for the year ended December 31, 2005, aggregated $262,142,211 and $273,211,054, respectively.
7. REGULATORY MATTERS
As part of various investigations by a number of federal, state, and foreign regulators and governmental entities, relating to certain practices in the mutual fund industry, including late trading, market timing and marketing support payments to securities dealers who sell fund shares, Franklin Resources, Inc. and certain of its subsidiaries (collectively, the “Company”), entered into settlements with certain of those regulators.
Specifically, the Company entered into settlements with the Securities and Exchange Commission (“SEC”) concerning market timing (the “August 2, 2004 SEC Order”) and marketing support payments to securities dealers who sell fund shares (the “December 13, 2004 SEC Order”) and with the California Attorney General’s Office (“CAGO”) concerning marketing support payments to securities dealers who sell fund shares (the “CAGO Settlement”). Under the terms of the settlements with the SEC and the CAGO, the Company retained an Independent Distribution Consultant (“IDC”) to develop a plan for distribution of the respective settlement monies. The CAGO approved the distribution plan under the CAGO Settlement and, in accordance with the terms and conditions of that settlement, the monies were disbursed to the relevant funds and are recorded as other income in the current period. The SEC has not yet approved the distribution plan pertaining to the December 13, 2004 SEC Order. When approved, disbursements of settlement monies will be made promptly to the relevant funds, in accordance with the terms and conditions of that order. The IDC continues to develop the plan of distribution under the August 2, 2004 SEC Order that resolved the SEC’s market timing investigation.
FGC-20
Franklin Templeton Variable Insurance Products Trust
Notes to Financial Statements (continued)
Franklin Global Communications Securities Fund
7. REGULATORY MATTERS (continued)
In addition, the Company, as well as most of the mutual funds within Franklin Templeton Investments and certain current or former officers, directors, and/or employees, have been named in private lawsuits (styled as shareholder class actions, or as derivative actions on behalf of either the named funds or Franklin Resources, Inc.) relating to the industry practices referenced above, as well as to allegedly excessive advisory fees, commissions, and/or 12b-1 fees. The lawsuits were filed in different courts throughout the country. Many of those suits are now pending in a multi-district litigation in the United States District Court for the District of Maryland.
The Company and fund management strongly believe that the claims made in each of the private lawsuits referenced above are without merit and intend to defend against them vigorously. The Company cannot predict with certainty the eventual outcome of these lawsuits, nor whether they will have a material negative impact on the Company. If it is determined that the Company bears responsibility for any unlawful or inappropriate conduct that caused losses to the Trust, it is committed to making the Trust or their shareholders whole, as appropriate.
FGC-21
Franklin Templeton Variable Insurance Products Trust
Franklin Global Communications Securities Fund
Report of Independent Registered Public Accounting Firm
To the Board of Trustees and Shareholders of
Franklin Templeton Variable Insurance Products Trust
In our opinion, the accompanying statement of assets and liabilities, including the statement of investments, and the related statements of operations and of changes in net assets and the financial highlights present fairly, in all material respects, the financial position of Franklin Global Communications Securities Fund (one of the funds constituting Franklin Templeton Variable Insurance Products Trust, hereafter referred to as the “Fund”) at December 31, 2005, the results of its operations for the year then ended, the changes in its net assets for each of the two years in the period then ended and the financial highlights for each of the five years in the period then ended, in conformity with accounting principles generally accepted in the United States of America. These financial statements and financial highlights (hereafter referred to as “financial statements”) are the responsibility of the Fund’s management; our responsibility is to express an opinion on these financial statements based on our audits. We conducted our audits of these financial statements in accordance with the standards of the Public Company Accounting Oversight Board (United States). Those standards require that we plan and perform the audit to obtain reasonable assurance about whether the financial statements are free of material misstatement. An audit includes examining, on a test basis, evidence supporting the amounts and disclosures in the financial statements, assessing the accounting principles used and significant estimates made by management, and evaluating the overall financial statement presentation. We believe that our audits, which included confirmation of securities at December 31, 2005, by correspondence with the custodian, provide a reasonable basis for our opinion.
PricewaterhouseCoopers LLP
San Francisco, California
February 10, 2006
FGC-22
Franklin Templeton Variable Insurance Products Trust
Tax Designation (unaudited)
Franklin Global Communications Securities Fund
Under Section 854(b)(2) of the Internal Revenue Code, the Fund designates 13.67% of the ordinary income dividends as income qualifying for the dividends received deduction for the fiscal year ended December 31, 2005.
FGC-23
FRANKLIN GROWTHAND INCOME SECURITIES FUND
This annual report for Franklin Growth and Income Securities Fund covers the fiscal year ended December 31, 2005.
Performance Summary as of 12/31/05
Average annual total return of Class 1 shares represents the average annual change in value, assuming reinvestment of dividends and capital gains. Average returns smooth out variations in returns, which can be significant; they are not the same as year-by-year results.
Periods ended 12/31/05
| | | | | | |
| | | 1-Year | | 5-Year | | 10-Year |
Average Annual Total Return | | +3.71% | | +3.72% | | +8.51% |
Total Return Index Comparison for Hypothetical $10,000 Investment (1/1/96–12/31/05)
The graph below shows the change in value of a hypothetical $10,000 investment in the Fund over the indicated period and includes reinvestment of any income or distributions. The Fund’s performance is compared to the performance of the Standard & Poor’s 500 Index (S&P 500), the Russell 1000® Value Index and the Lipper VIP Equity Income Funds Classification Average, as well as the Consumer Price Index (CPI). One cannot invest directly in an index, nor is an index representative of the Fund’s portfolio. Please see Important Notes to Performance Information preceding the Fund Summaries.
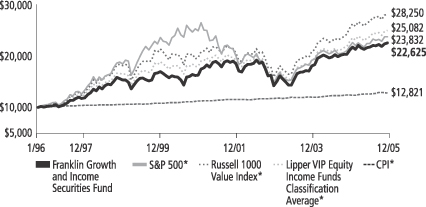
*Sources: Standard & Poor’s Micropal; Lipper Inc. Please see Index Descriptions following the Fund Summaries.
Franklin Growth and Income Securities Fund Class 1
Performance reflects the Fund’s Class 1 operating expenses, but does not include any contract fees, expenses or sales charges. If they had been included, performance would be lower. These charges and deductions, particularly for variable life policies, can have a significant effect on contract values and insurance benefits. See the contract prospectus for a complete description of these expenses, including sales charges.
Performance data represent past performance, which does not guarantee future results. Investment return and principal value will fluctuate, and you may have a gain or loss when you sell your shares.
Current performance may differ from figures shown.
FGI-1
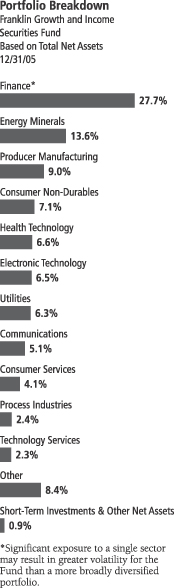
Fund Goals and Main Investments: Franklin Growth and Income Securities Fund seeks capital appreciation with current income as a secondary goal. The Fund normally invests primarily to predominantly in a broadly diversified portfolio of equity securities that the Fund’s manager considers to be financially strong but undervalued by the market.
Performance Overview
You can find the Fund’s one-year total return in the Performance Summary. The Fund underperformed its benchmark, the Russell 1000 Value Index, which returned +7.05%, and its peers, as measured by the Lipper VIP Equity Income Funds Classification Average, which returned +6.08% for the period under review.1 The Fund also underperformed the broad stock market, as measured by the S&P 500, which returned +4.91%.1 Please note that the Fund invests primarily in stocks with above average dividend yields. As a result, its holdings and returns may differ from those of the Russell benchmark, which is based largely on book value and earnings growth potential, rather than dividend yield.
Economic and Market Overview
During the 12 months ended December 31, 2005, U.S. economic expansion was driven by strength across most industries, sectors and regions. Gross domestic product (GDP) rose during the period, benefiting from increased personal consumption, federal spending and business investment, which increased 24% in third quarter 2005 compared with the same quarter in 2004.2 Slower export growth combined with greater demand for imported goods and materials fueled a widening trade gap. The U.S. dollar rallied in 2005, supported by rising short-term domestic interest rates and strong economic growth in the U.S. relative to many of its major trading partners.
Many businesses enjoyed record profits, propelled largely by productivity gains. Earnings for companies in the S&P 500 were estimated to have increased 13% in 2005.3 The labor market firmed as employment increased and the unemployment rate dropped from 5.4% to 4.9% during the reporting period. Personal income rose, and hiring rebounded in many industries, bolstered by healthy business spending.
1. Sources: Standard & Poor’s Micropal; Lipper Inc. One cannot invest directly in an index, nor is an index representative of the Fund’s portfolio. Please see Index Descriptions following the Fund Summaries.
2. Source: Thomson Financial. Based on companies in the S&P 500.
3. Source: Standard & Poor’s.
Fund Risks: The Fund’s investments in stocks offer the potential for long-term gains but can be subject to short-term up-and-down price movements. Foreign investing, especially in emerging markets, involves additional risks including currency fluctuations, economic instability, and social and political developments. The Fund’s prospectus also includes a description of the main investment risks.
FGI-2
Oil prices remained high during the period largely due to potential long-term supply limitations and strong growth in global demand, especially from China and India. Natural gas prices rose during the second half of 2005 mainly because of expected rising demand with the onset of winter; however, near period-end prices retreated somewhat amid milder-than-expected weather conditions. Even with high commodity prices, inflation remained relatively contained for the 12 months ended December 31, 2005, as measured by the 2.2% rise for the core Consumer Price Index (CPI).4
Despite this inflation picture, the Federal Reserve Board raised the federal funds target rate from 2.25% to 4.25%. Compared with the rise in short-term interest rates, long-term rates remained relatively stable, supporting overall robust housing and commercial real estate activity, which contributed to economic growth. Throughout 2005, as short- and intermediate-term interest rates rose, the yield curve moved from a fairly normal steepness at the beginning of the period to relatively flat by the end of 2005.
In this environment, the blue chip stocks of the Dow Jones Industrial Average posted a one-year total return of +1.72%, while the broader S&P 500 and the technology-heavy NASDAQ Composite Index returned +4.91% and +2.12%.5
Investment Strategy
We are research driven, fundamental investors, pursuing a disciplined value-oriented strategy. As bottom-up investors focusing primarily on individual securities, we seek companies that offer current dividend yields and present, in our opinion, the best trade-off between valuation, potential earnings growth and business risk. Special emphasis is placed upon dividend yield as we believe that high relative dividend yield can be a good indicator of value.
Manager’s Discussion
During the year under review, the Fund’s positive performance on an absolute basis was mostly the result of strategic sector positioning and favorable stock selection in selected industries. Among the Fund’s top contributing sectors were electronic technology, consumer non-durables and energy minerals. In the electronic technology sector, shares of
4. Source: Bureau of Labor Statistics. Core CPI excludes food and energy costs.
5. Source: Standard & Poor’s Micropal. Please see Index Descriptions following the Fund Summaries.
What is the yield curve?
The yield curve is a graph illustrating the yields on bonds of the same credit quality with maturities ranging from the shortest to the longest available. The resulting curve shows if short-term interest rates are higher or lower than longer-term rates.
FGI-3
Hewlett-Packard rose 38% in response to corporate restructuring, and Rockwell Automation’s stock price gained 21% due mainly to strong ongoing demand for its factory automation products. We sold our stake in Hewlett Packard and selectively reduced our holdings in Rockwell Automation during the period. We also realized long-term profits after selling our stake in ATM and voting machine manufacturer Diebold. During the period, we bought shares of Embraer-Empresa Brasileira de Aeronautica, a leading manufacturer of small commercial airplanes. At the time of purchase, the stock had a 3% dividend yield. From the time of purchase through year-end, Embraer-Empresa’s total return was 22%. Within the consumer non-durables sector, our investments in Altria Group (sold during the period) and British American Tobacco each returned more than 27% due to a combination of strong fundamentals and favorable court rulings related to their tobacco businesses.
In line with broader economic trends in rising energy and commodity prices, the energy minerals and utilities sectors also had a positive absolute impact on Fund performance. However, both sectors had a negative impact on the Fund’s relative performance versus the benchmark, the Russell 1000 Value Index. Although our energy minerals sector allocation was on par with the index, most of our sector holdings were high dividend-paying integrated energy companies, which is consistent with our income-oriented strategy. The companies that benefited most from rising oil and natural gas prices, however, were often low or non-dividend-paying oil and gas producing and refining companies. During the period, we sold our investment in exploration company Kerr-McGee and initiated new positions in ConocoPhillips and natural gas producer Chesapeake Energy. The shares of many utility companies with low cost structures appreciated significantly during the period shortly after the passage of the federal energy bill earlier in the year. As a result, the Fund’s underweighted sector exposure dragged on the Fund’s relative performance. We initiated and added to positions in companies we believed were well positioned to benefit from industry trends such as American Electric Power, Dominion Resources, FirstEnergy and Entergy.
Despite the Fund’s positive returns during the review period, several of the Fund’s holdings detracted from performance. For example, within the finance sector, our investment in reinsurer Montpelier Re Holdings was especially disappointing as the company suffered severe losses from Hurricanes Katrina and Rita. We sold the stock at a 33% loss and reinvested the proceeds into XL Capital, which we bought and sold dur - -
FGI-4
ing the period because we believed it was better positioned to benefit from higher reinsurance pricing. Our investment in regional bank Fifth Third Bancorp proved disappointing as well. We bought shares of credit card issuer MBNA and sold our entire position when the stock price gained 37% on an acquisition bid during the period, while our investment in St. Paul Travelers rose 23% in response to improving fundamentals.
Major changes to the Fund’s portfolio over the past 12 months included the sale of Johnson & Johnson, Abbott Laboratories and Merck & Co. and the purchase of Eli Lilly & Co. within our health technology investments. We realized profits as Abbott and Johnson & Johnson met price targets, but realized a 12% loss on the sale of our investment in Merck. We were concerned about Merck’s exposure to patent expirations. We reinvested proceeds into Eli Lilly, which we believed had little near-term patent exposure risk and a favorable new drug pipeline. Among our consumer non-durable holdings, we sold our investment in Sara Lee due to our evaluation of its poor fundamentals and initiated a position in Diageo, a leading manufacturer and distributor of alcoholic beverages. At the time of purchase, Diageo offered a 3.6% dividend yield and what we believed were attractive growth prospects. Among our producer manufacturing holdings, we initiated a new position in Autoliv during the year. Autoliv is a leading manufacturer of auto safety equipment and has been aggressively buying back its stock in addition to increasing its dividend payout in recent years. We added to our existing stake in 3M. 3M has the reputation as one of the world’s best-managed companies, and we acquired shares during a lull in its stock price. Within the communications sector, we sold our investment in Verizon while initiating a position in Sprint Nextel and bought back shares of SBC Communications. We believed Sprint Nextel was well positioned as a wireless carrier and that SBC maintained a superior business plan to Verizon in terms of its broadband product roll-out and anticipated merger with AT&T. At the end of October, SBC formally changed its name to AT&T. The company’s dividend yield of 5.4% was also very attractive in our opinion.
We believe attitudes toward dividends have experienced a positive change in recent years. According to Baseline data, annual dividends paid by S&P 500 companies increased 14% during the past year and 37% during the past 32 months following the Jobs and Growth Tax Relief Reconciliation Act of 2003. Also, as the ratio of dividends paid to earnings remains low from a historical perspective, we believe corpo - -
FGI-5
rations can continue to grow their dividends at above long-term average rates. Franklin Growth and Income Securities Fund specifically seeks to invest in well-established companies when they sell at attractive valuations and offer above-average dividend yields. We believe the Fund is well positioned to benefit from changing attitudes toward dividends and dividend paying stocks because of their favorable historical investment performance.
Thank you for your participation in Franklin Growth and Income Securities Fund. We look forward to serving your future investment needs.
The foregoing information reflects our analysis, opinions and portfolio holdings as of December 31, 2005, the end of the reporting period. The way we implement our main investment strategies and the resulting portfolio holdings may change depending on factors such as market and economic conditions. These opinions may not be relied upon as investment advice or an offer for a particular security. The information is not a complete analysis of every aspect of any market, country, industry, security or the Fund. Statements of fact are from sources considered reliable, but the adviser makes no representation or warranty as to their completeness or accuracy. Although historical performance is no guarantee of future results, these insights may help you understand our investment management philosophy.
Top 10 Holdings
Franklin Growth and Income Securities Fund 12/31/05
| | |
Company
Sector/Industry | | % of Total
Net Assets |
| |
| Citigroup Inc. | | 4.5% |
| Finance | | |
| |
| Exxon Mobil Corp. | | 3.9% |
| Energy Minerals | | |
| |
| Bank of America Corp. | | 3.6% |
| Finance | | |
| |
| Chevron Corp. | | 3.3% |
| Energy Minerals | | |
| |
| General Electric Co. | | 3.0% |
| Producer Manufacturing | | |
| |
| JPMorgan Chase & Co. | | 2.3% |
| Finance | | |
| |
| Royal Dutch Shell PLC, B, ADR | | 2.2% |
| Energy Minerals | | |
| |
| Wachovia Corp. | | 2.1% |
| Finance | | |
| |
| Raytheon Co. | | 1.9% |
| Electronic Technology | | |
| |
| The Dow Chemical Co. | | 1.8% |
| Process Industries | | |
The dollar value, number of shares or principal amount, and names of all portfolio holdings are listed in the Fund’s Statement of Investments.
FGI-6
Fund Expenses
As an investor in a variable insurance contract (“Contract”) that indirectly provides for investment in an underlying mutual fund, you can incur transaction and/or ongoing expenses at both the Fund level and the Contract level.
| • | | Transaction expenses can include sales charges (loads) on purchases, redemption fees, surrender fees, transfer fees and premium taxes. |
| • | | Ongoing expenses can include management fees, distribution and service (12b-1) fees, contract fees, annual maintenance fees, mortality and expense risk fees and other fees and expenses. All mutual funds and Contracts have some types of ongoing expenses. |
The expenses shown in the table below are meant to highlight ongoing expenses at the Fund level only and do not include ongoing expenses at the Contract level, or transaction expenses at either the Fund or Contract level. While the Fund does not have transaction expenses, if the transaction and ongoing expenses at the Contract level were included, the expenses shown below would be higher. You should consult your Contract prospectus or disclosure document for more information.
The table shows Fund-level ongoing expenses and can help you understand these expenses and compare them with those of other mutual funds offered through the Contract. The table assumes a $1,000 investment held for the six months indicated. Please refer to the Fund prospectus for additional information on operating expenses.
Actual Fund Expenses
The first line (Actual) of the table below provides actual account values and expenses. The “Ending Account Value” is derived from the Fund’s actual return, which includes the effect of ongoing Fund expenses, but does not include the effect of ongoing Contract expenses.
You can estimate the Fund-level expenses you incurred during the period by following these steps. Of course, your account value and expenses will differ from those in this illustration:
| 1. | Divide your account value by $1,000. |
If an account had an $8,600 value, then $8,600 ÷ $1,000 = 8.6.
| 2. | Multiply the result by the number under the heading “Fund-Level Expenses Incurred During Period.” |
If Fund-Level Expenses Incurred During Period were $7.50, then 8.6 × $7.50 = $64.50.
Franklin Growth and Income Securities Fund Class 1
FGI-7
In this illustration, the estimated expenses incurred this period at the Fund level are $64.50.
Hypothetical Example for Comparison with Other Mutual Funds
Information in the second line (Hypothetical) of the table can help you compare ongoing expenses of the Fund with those of other mutual funds offered through the Contract. This information may not be used to estimate the actual ending account balance or expenses you incurred during the period. The hypothetical “Ending Account Value” is based on the Fund’s actual expense ratio and an assumed 5% annual rate of return before expenses, which does not represent the Fund’s actual return. The figure under the heading “Fund-Level Expenses Incurred During Period” shows the hypothetical expenses your account would have incurred under this scenario. You can compare this figure with the 5% hypothetical examples that appear in shareholder reports of other funds offered through a Contract.
| | | | | | | | | |
| Class 1 | | Beginning
Account
Value 7/1/05 | | Ending
Account
Value 12/31/05 | | Fund-Level
Expenses Incurred
During Period*
7/1/05-12/31/05 |
Actual | | $ | 1,000 | | $ | 1,036.50 | | $ | 2.62 |
Hypothetical (5% return before expenses) | | $ | 1,000 | | $ | 1,022.63 | | $ | 2.60 |
*Expenses are equal to the annualized expense ratio for the Fund’s Class 1 shares (0.51%), which does not include any ongoing expenses of the Contract for which the Fund is an investment option, multiplied by the average account value over the period, multiplied by 184/365 to reflect the one-half year period.
FGI-8
Franklin Templeton Variable Insurance Products Trust
Financial Highlights
Franklin Growth and Income Securities Fund
| | | | | | | | | | | | | | | | | | | | |
| | | Year Ended December 31,
| |
| Class 1 | | 2005
| | | 2004
| | | 2003
| | | 2002
| | | 2001
| |
Per share operating performance | | | | | | | | | | | | | | | | | | | | |
(for a share outstanding throughout the year) | | | | | | | | | | | | | | | | | | | | |
Net asset value, beginning of year | | $ | 15.60 | | | $ | 14.44 | | | $ | 11.82 | | | $ | 15.27 | | | $ | 17.16 | |
| | |
|
|
|
Income from investment operations: | | | | | | | | | | | | | | | | | | | | |
Net investment incomea | | | 0.42 | | | | 0.40 | | | | 0.36 | | | | 0.39 | | | | 0.37 | c |
Net realized and unrealized gains (losses) | | | 0.15 | | | | 1.14 | | | | 2.66 | | | | (2.58 | ) | | | (0.70 | )c |
| | |
|
|
|
Total from investment operations | | | 0.57 | | | | 1.54 | | | | 3.02 | | | | (2.19 | ) | | | (0.33 | ) |
| | |
|
|
|
Less distributions from: | | | | | | | | | | | | | | | | | | | | |
Net investment income | | | (0.43 | ) | | | (0.38 | ) | | | (0.40 | ) | | | (0.42 | ) | | | (0.05 | ) |
Net realized gains | | | (0.14 | ) | | | — | | | | — | | | | (0.84 | ) | | | (1.51 | ) |
| | |
|
|
|
Total distributions | | | (0.57 | ) | | | (0.38 | ) | | | (0.40 | ) | | | (1.26 | ) | | | (1.56 | ) |
| | |
|
|
|
Net asset value, end of year | | $ | 15.60 | | | $ | 15.60 | | | $ | 14.44 | | | $ | 11.82 | | | $ | 15.27 | |
| | |
|
|
|
| | | | | |
Total returnb | | | 3.71% | | | | 10.91% | | | | 26.06% | | | | (15.53)% | | | | (2.02)% | |
Ratios/supplemental data | | | | | | | | | | | | | | | | | | | | |
Net assets, end of year (000’s) | | $ | 405,245 | | | $ | 471,596 | | | $ | 505,393 | | | $ | 455,680 | | | $ | 646,851 | |
Ratios to average net assets: | | | | | | | | | | | | | | | | | | | | |
Expenses | | | 0.51% | | | | 0.52% | | | | 0.53% | | | | 0.53% | | | | 0.51% | |
Net investment income | | | 2.74% | | | | 2.77% | | | | 2.92% | | | | 2.85% | | | | 2.31% | c |
Portfolio turnover rate | | | 43.89% | | | | 40.15% | | | | 43.18% | | | | 96.61% | | | | 119.78% | |
aBased on average daily shares outstanding.
bTotal return does not include any fees, charges or expenses imposed by the variable annuity and life insurance contracts for which the Franklin Templeton Variable Insurance Products Trust serves as an underlying investment vehicle.
cEffective January 1, 2001, the Fund adopted the provisions of the AICPA Audit and Accounting Guide for Investment Companies and began amortizing all premium and discount on fixed-income securities, as required. The effect of this change was as follows:
| | |
Net investment income per share | | $(0.026) |
Net realized and unrealized gains (losses) per share | | 0.026 |
Ratio of net investment income to average net assets | | (0.17)% |
See notes to financial statements.
FGI-9
Franklin Templeton Variable Insurance Products Trust
Financial Highlights (continued)
Franklin Growth and Income Securities Fund (continued)
| | | | | | | | | | | | | | | | | | | | |
| | | Year Ended December 31,
| |
| Class 2 | | 2005
| | | 2004
| | | 2003
| | | 2002
| | | 2001
| |
Per share operating performance | | | | | | | | | | | | | | | | | | | | |
(for a share outstanding throughout the year) | | | | | | | | | | | | | | | | | | | | |
Net asset value, beginning of year | | $ | 15.43 | | | $ | 14.31 | | | $ | 11.74 | | | $ | 15.20 | | | $ | 17.13 | |
| | |
|
|
|
Income from investment operations: | | | | | | | | | | | | | | | | | | | | |
Net investment incomea | | | 0.38 | | | | 0.37 | | | | 0.33 | | | | 0.34 | | | | 0.33 | c |
Net realized and unrealized gains (losses) | | | 0.15 | | | | 1.12 | | | | 2.63 | | | | (2.54 | ) | | | (0.70 | )c |
| | |
|
|
|
Total from investment operations | | | 0.53 | | | | 1.49 | | | | 2.96 | | | | (2.20 | ) | | | (0.37 | ) |
| | |
|
|
|
Less distributions from: | | | | | | | | | | | | | | | | | | | | |
Net investment income | | | (0.40 | ) | | | (0.37 | ) | | | (0.39 | ) | | | (0.42 | ) | | | (0.05 | ) |
Net realized gains | | | (0.14 | ) | | | — | | | | — | | | | (0.84 | ) | | | (1.51 | ) |
| | |
|
|
|
Total distributions | | | (0.54 | ) | | | (0.37 | ) | | | (0.39 | ) | | | (1.26 | ) | | | (1.56 | ) |
| | |
|
|
|
Net asset value, end of year | | $ | 15.42 | | | $ | 15.43 | | | $ | 14.31 | | | $ | 11.74 | | | $ | 15.20 | |
| | |
|
|
|
| | | | | |
Total returnb | | | 3.51% | | | | 10.61% | | | | 25.70% | | | | (15.72)% | | | | (2.28)% | |
Ratios/supplemental data | | | | | | | | | | | | | | | | | | | | |
Net assets, end of year (000’s) | | $ | 313,286 | | | $ | 263,146 | | | $ | 136,824 | | | $ | 38,379 | | | $ | 11,789 | |
Ratios to average net assets: | | | | | | | | | | | | | | | | | | | | |
Expenses | | | 0.76% | | | | 0.77% | | | | 0.78% | | | | 0.78% | | | | 0.76% | |
Net investment income | | | 2.49% | | | | 2.52% | | | | 2.67% | | | | 2.60% | | | | 2.13% | c |
Portfolio turnover rate | | | 43.89% | | | | 40.15% | | | | 43.18% | | | | 96.61% | | | | 119.78% | |
aBased on average daily shares outstanding.
bTotal return does not include any fees, charges or expenses imposed by the variable annuity and life insurance contracts for which the Franklin Templeton Variable Insurance Products Trust serves as an underlying investment vehicle.
cEffective January 1, 2001, the Fund adopted the provisions of the AICPA Audit and Accounting Guide for Investment Companies and began amortizing all premium and discount on fixed-income securities, as required. The effect of this change was as follows:
| | |
Net investment income per share | | $(0.026) |
Net realized and unrealized gains (losses) per share | | 0.026 |
Ratio of net investment income to average net assets | | (0.17)% |
See notes to financial statements.
FGI-10
Franklin Templeton Variable Insurance Products Trust
Statement of Investments, December 31, 2005
| | | | | | | |
| Franklin Growth and Income Securities Fund | | Country | | Shares | | Value |
Long Term Investments 99.1% | | | | | | | |
Common Stocks 95.3% | | | | | | | |
Commercial Services 1.6% | | | | | | | |
R. R. Donnelley & Sons Co. | | United States | | 333,800 | | $ | 11,419,298 |
| | | | | | |
|
|
Communications 5.1% | | | | | | | |
Alltel Corp. | | United States | | 131,100 | | | 8,272,410 |
AT&T Inc. | | United States | | 514,072 | | | 12,589,623 |
BellSouth Corp. | | United States | | 385,800 | | | 10,455,180 |
Sprint Nextel Corp. | | United States | | 238,300 | | | 5,566,688 |
| | | | | | |
|
|
| | | | | | | | 36,883,901 |
| | | | | | |
|
|
Consumer Non-Durables 7.1% | | | | | | | |
Anheuser-Busch Cos. Inc. | | United States | | 254,600 | | | 10,937,616 |
British American Tobacco PLC | | United Kingdom | | 325,400 | | | 7,277,847 |
The Coca-Cola Co. | | United States | | 259,700 | | | 10,468,507 |
Diageo PLC, ADR | | United Kingdom | | 95,900 | | | 5,590,970 |
General Mills Inc. | | United States | | 158,400 | | | 7,812,288 |
Unilever NV, N.Y. shs. | | Netherlands | | 128,300 | | | 8,807,795 |
| | | | | | |
|
|
| | | | | | | | 50,895,023 |
| | | | | | |
|
|
Consumer Services 4.1% | | | | | | | |
Carnival Corp. | | United States | | 160,900 | | | 8,603,323 |
aCCE Spinco Inc. | | United States | | 27,000 | | | 353,700 |
Clear Channel Communications Inc. | | United States | | 216,000 | | | 6,793,200 |
Dow Jones & Co. Inc. | | United States | | 96,300 | | | 3,417,687 |
Viacom Inc., B | | United States | | 308,100 | | | 10,044,060 |
| | | | | | |
|
|
| | | | | | | | 29,211,970 |
| | | | | | |
|
|
Electronic Technology 6.5% | | | | | | | |
Empresa Brasileira de Aeronautica SA, ADR | | Brazil | | 241,600 | | | 9,446,560 |
Microchip Technology Inc. | | United States | | 247,200 | | | 7,947,480 |
Nokia Corp., ADR | | Finland | | 487,800 | | | 8,926,740 |
Raytheon Co. | | United States | | 339,700 | | | 13,638,955 |
Rockwell Automation Inc. | | United States | | 110,100 | | | 6,513,516 |
| | | | | | |
|
|
| | | | | | | | 46,473,251 |
| | | | | | |
|
|
Energy Minerals 12.3% | | | | | | | |
BP PLC, ADR | | United Kingdom | | 125,600 | | | 8,066,032 |
Chevron Corp. | | United States | | 421,116 | | | 23,906,755 |
ConocoPhillips | | United States | | 218,600 | | | 12,718,148 |
Exxon Mobil Corp. | | United States | | 496,044 | | | 27,862,792 |
Royal Dutch Shell PLC, B, ADR | | United Kingdom | | 248,169 | | | 16,014,346 |
| | | | | | |
|
|
| | | | | | | | 88,568,073 |
| | | | | | |
|
|
Finance 26.6% | | | | | | | |
American International Group Inc. | | United States | | 91,700 | | | 6,256,691 |
Arthur J. Gallagher & Co. | | United States | | 275,900 | | | 8,519,792 |
Bank of America Corp. | | United States | | 556,912 | | | 25,701,489 |
Citigroup Inc. | | United States | | 673,000 | | | 32,660,690 |
Fannie Mae | | United States | | 229,700 | | | 11,211,657 |
Freddie Mac | | United States | | 171,700 | | | 11,220,595 |
JPMorgan Chase & Co. | | United States | | 413,970 | | | 16,430,469 |
Marsh & McLennan Cos. Inc. | | United States | | 334,500 | | | 10,623,720 |
Morgan Stanley | | United States | | 214,300 | | | 12,159,382 |
Old Republic International Corp. | | United States | | 264,500 | | | 6,945,770 |
The St. Paul Travelers Cos. Inc. | | United States | | 238,500 | | | 10,653,795 |
U.S. Bancorp | | United States | | 407,500 | | | 12,180,175 |
FGI-11
Franklin Templeton Variable Insurance Products Trust
Statement of Investments, December 31, 2005 (continued)
| | | | | | | |
| Franklin Growth and Income Securities Fund | | Country | | Shares | | Value |
Long Term Investments (cont.) | | | | | | | |
Common Stocks (cont.) | | | | | | | |
Finance (cont.) | | | | | | | |
Wachovia Corp. | | United States | | 280,300 | | $ | 14,816,658 |
Washington Mutual Inc. | | United States | | 262,800 | | | 11,431,800 |
| | | | | | |
|
|
| | | | | | | | 190,812,683 |
| | | | | | |
|
|
Health Technology 5.8% | | | | | | | |
Bristol-Myers Squibb Co. | | United States | | 290,800 | | | 6,682,584 |
Eli Lilly and Co. | | United States | | 100,800 | | | 5,704,272 |
GlaxoSmithKline PLC, ADR | | United Kingdom | | 197,400 | | | 9,964,752 |
Pall Corp. | | United States | | 161,900 | | | 4,348,634 |
Pfizer Inc. | | United States | | 528,600 | | | 12,326,952 |
Wyeth | | United States | | 64,600 | | | 2,976,122 |
| | | | | | |
|
|
| | | | | | | | 42,003,316 |
| | | | | | |
|
|
Industrial Services 1.1% | | | | | | | |
Waste Management Inc. | | United States | | 250,300 | | | 7,596,605 |
| | | | | | |
|
|
Non-Energy Minerals 1.3% | | | | | | | |
Alcoa Inc. | | United States | | 307,900 | | | 9,104,603 |
| | | | | | |
|
|
Process Industries 2.4% | | | | | | | |
Cabot Corp. | | United States | | 125,100 | | | 4,478,580 |
The Dow Chemical Co. | | United States | | 298,700 | | | 13,089,034 |
| | | | | | |
|
|
| | | | | | | | 17,567,614 |
| | | | | | |
|
|
Producer Manufacturing 9.0% | | | | | | | |
3M Co. | | United States | | 168,800 | | | 13,082,000 |
Autoliv Inc. | | Sweden | | 124,800 | | | 5,668,416 |
General Electric Co. | | United States | | 617,500 | | | 21,643,375 |
Honeywell International Inc. | | United States | | 271,900 | | | 10,128,275 |
PACCAR Inc. | | United States | | 40,600 | | | 2,810,738 |
Pitney Bowes Inc. | | United States | | 263,100 | | | 11,115,975 |
| | | | | | |
|
|
| | | | | | | | 64,448,779 |
| | | | | | |
|
|
Real Estate Investment Trusts 0.8% | | | | | | | |
iStar Financial Inc. | | United States | | 159,600 | | | 5,689,740 |
| | | | | | |
|
|
Retail Trade 2.0% | | | | | | | |
Gap Inc. | | United States | | 421,000 | | | 7,426,440 |
Wal-Mart Stores Inc. | | United States | | 154,300 | | | 7,221,240 |
| | | | | | |
|
|
| | | | | | | | 14,647,680 |
| | | | | | |
|
|
Technology Services 2.3% | | | | | | | |
Automatic Data Processing Inc. | | United States | | 124,100 | | | 5,694,949 |
Microsoft Corp. | | United States | | 426,700 | | | 11,158,205 |
| | | | | | |
|
|
| | | | | | | | 16,853,154 |
| | | | | | |
|
|
Transportation 1.0% | | | | | | | |
United Parcel Service Inc., B | | United States | | 95,000 | | | 7,139,250 |
| | | | | | |
|
|
Utilities 6.3% | | | | | | | |
American Electric Power Co. Inc. | | United States | | 203,100 | | | 7,532,979 |
Dominion Resources Inc. | | United States | | 142,800 | | | 11,024,160 |
Entergy Corp. | | United States | | 104,500 | | | 7,173,925 |
FirstEnergy Corp. | | United States | | 232,200 | | | 11,375,478 |
Scottish Power PLC | | United Kingdom | | 367,300 | | | 3,434,492 |
Xcel Energy Inc. | | United States | | 238,300 | | | 4,399,018 |
| | | | | | |
|
|
| | | | | | | | 44,940,052 |
| | | | | | |
|
|
Total Common Stocks (Cost $573,534,910) | | | | | | | 684,254,992 |
| | | | | | |
|
|
FGI-12
Franklin Templeton Variable Insurance Products Trust
Statement of Investments, December 31, 2005 (continued)
| | | | | | | | | |
| Franklin Growth and Income Securities Fund | | Country | | Shares | | Value | |
Long Term Investments (cont.) | | | | | | | | | |
Convertible Preferred Stocks 3.8% | | | | | | | | | |
Energy Minerals 1.3% | | | | | | | | | |
Chesapeake Energy Corp., 5.00%, cvt. pfd. | | United States | | | 66,700 | | $ | 9,162,913 | |
| | | | | | | |
|
|
|
Finance 1.1% | | | | | | | | | |
E*TRADE Financial Corp., 6.125%, cvt. pfd. | | United States | | | 280,000 | | | 7,930,160 | |
| | | | | | | �� |
|
|
|
Health Technology 0.8% | | | | | | | | | |
Schering-Plough Corp., 6.00%, cvt. pfd. | | United States | | | 107,600 | | | 5,787,804 | |
| | | | | | | |
|
|
|
Non-Energy Minerals 0.6% | | | | | | | | | |
Freeport-McMoRan Copper & Gold Inc., 5.50%, cvt. pfd. | | United States | | | 3,900 | | | 4,579,575 | |
| | | | | | | |
|
|
|
Total Convertible Preferred Stocks (Cost $25,885,427) | | | | | | | | 27,460,452 | |
| | | | | | | |
|
|
|
Total Long Term Investments (Cost $599,420,337) | | | | | | | | 711,715,444 | |
| | | | | | | |
|
|
|
| | | |
| | | | | Principal
Amount
| | | |
Short Term Investment (Cost $18,722,695) 2.6% | | | | | | | | | |
Repurchase Agreement 2.6% | | | | | | | | | |
bJoint Repurchase Agreement, 3.999%, 1/03/06 (Maturity Value $18,731,014) | | United States | | $ | 18,722,695 | | | 18,722,695 | |
ABN AMRO Bank, N.V., New York Branch (Maturity Value $1,725,688) | | | | | | | | | |
Banc of America Securities LLC (Maturity Value $1,763,150) | | | | | | | | | |
Barclays Capital Inc. (Maturity Value $1,763,150) | | | | | | | | | |
Bear, Stearns & Co. Inc. (Maturity Value $1,500,730) | | | | | | | | | |
BNP Paribas Securities Corp. (Maturity Value $1,763,150) | | | | | | | | | |
Deutsche Bank Securities Inc. (Maturity Value $750,553) | | | | | | | | | |
Goldman, Sachs & Co. (Maturity Value $1,275,582) | | | | | | | | | |
Greenwich Capital Markets Inc. (Maturity Value $1,763,150) | | | | | | | | | |
Lehman Brothers Inc. (Maturity Value $1,173,873) | | | | | | | | | |
Merrill Lynch Government Securities Inc. (Maturity Value $1,763,150) | | | | | | | | | |
Morgan Stanley & Co. Inc. (Maturity Value $1,725,688) | | | | | | | | | |
UBS Securities LLC (Maturity Value $1,763,150) | | | | | | | | | |
Collateralized by U.S. Government Agency Securities, 1.875 - 7.25%, 2/15/06 - 11/15/10;
cU.S. Government Agency Discount Notes, 1/09/06 - 1/27/06; and U.S. Treasury Notes, 2.375 - 5.75%, 8/15/06 - 8/15/10 | | | | | | | | | |
| | | | | | | |
|
|
|
Total Investments (Cost $618,143,032) 101.7% | | | | | | | | 730,438,139 | |
Other Assets, less Liabilities (1.7)% | | | | | | | | (11,906,681 | ) |
| | | | | | | |
|
|
|
Net Assets 100.0% | | | | | | | $ | 718,531,458 | |
| | | | | | | |
|
|
|
Selected Portfolio Abbreviations
ADR - American Depository Receipt
aNon-income producing.
bSee Note 1(c) regarding joint repurchase agreement.
cA portion or all of the security is traded on a discount basis with no stated coupon rate.
See notes to financial statements.
FGI-13
Franklin Templeton Variable Insurance Products Trust
Financial Statements
Statement of Assets and Liabilities
December 31, 2005
| | | |
| | | Franklin Growth
and Income
Securities Fund
|
Assets: | | | |
Investments in securities: | | | |
Cost - Unaffiliated issuers | | $ | 599,420,337 |
Cost - Repurchase agreement | | | 18,722,695 |
| | |
|
|
Total cost of investments | | $ | 618,143,032 |
| | |
|
|
Value - Unaffiliated issuers | | $ | 711,715,444 |
Value - Repurchase agreement | | | 18,722,695 |
| | |
|
|
Total value of investments | | | 730,438,139 |
Receivables: | | | |
Investment securities sold | | | 23,142 |
Capital shares sold | | | 158,110 |
Dividends | | | 1,104,794 |
Other assets | | | 7,203 |
| | |
|
|
Total assets | | | 731,731,388 |
| | |
|
|
Liabilities: | | | |
Payables: | | | |
Investment securities purchased | | | 12,222,680 |
Capital shares redeemed | | | 500,901 |
Affiliates | | | 429,885 |
Accrued expenses and other liabilities | | | 46,464 |
| | |
|
|
Total liabilities | | | 13,199,930 |
| | |
|
|
Net assets, at value | | $ | 718,531,458 |
| | |
|
|
Net assets consist of: | | | |
Paid-in capital | | $ | 555,675,621 |
Undistributed net investment income | | | 17,673,234 |
Net unrealized appreciation (depreciation) | | | 112,295,107 |
Accumulated net realized gain (loss) | | | 32,887,496 |
| | |
|
|
Net assets, at value | | $ | 718,531,458 |
| | |
|
|
Class 1: | | | |
Net assets, at value | | $ | 405,245,053 |
| | |
|
|
Shares outstanding | | | 25,973,344 |
| | |
|
|
Net asset value and offering price per share | | $ | 15.60 |
| | |
|
|
Class 2: | | | |
Net assets, at value | | $ | 313,286,405 |
| | |
|
|
Shares outstanding | | | 20,315,321 |
| | |
|
|
Net asset value and offering price per share | | $ | 15.42 |
| | |
|
|
See notes to financial statements.
FGI-14
Franklin Templeton Variable Insurance Products Trust
Financial Statements (continued)
Statement of Operations
for the year ended December 31, 2005
| | | | |
| | | Franklin Growth
and Income
Securities Fund
| |
Investment income: | | | | |
Dividends | | $ | 22,601,536 | |
Interest | | | 735,400 | |
Other income (Note 7) | | | 301,756 | |
| | |
|
|
|
Total investment income | | | 23,638,692 | |
| | |
|
|
|
Expenses: | | | | |
Management fees (Note 3a) | | | 3,525,366 | |
Distribution fees - Class 2 (Note 3c) | | | 736,507 | |
Unaffiliated transfer agent fees | | | 3,431 | |
Custodian fees (Note 4) | | | 17,012 | |
Reports to shareholders | | | 136,682 | |
Professional fees | | | 24,672 | |
Trustees’ fees and expenses | | | 4,013 | |
Other | | | 17,397 | |
| | |
|
|
|
Total expenses | | | 4,465,080 | |
Expense reductions (Note 4) | | | (234 | ) |
| | |
|
|
|
Net expenses | | | 4,464,846 | |
| | |
|
|
|
Net investment income | | | 19,173,846 | |
| | |
|
|
|
Realized and unrealized gains (losses): | | | | |
Net realized gain (loss) from: | | | | |
Investments | | | 37,566,093 | |
Written options (Note 6) | | | 115,904 | |
Foreign currency transactions | | | 22,796 | |
| | |
|
|
|
Net realized gain (loss) | | | 37,704,793 | |
| | |
|
|
|
Net change in unrealized appreciation (depreciation) on investments | | | (31,118,975 | ) |
| | |
|
|
|
Net realized and unrealized gain (loss) | | | 6,585,818 | |
| | |
|
|
|
Net increase (decrease) in net assets resulting from operations | | $ | 25,759,664 | |
| | |
|
|
|
See notes to financial statements.
FGI-15
Franklin Templeton Variable Insurance Products Trust
Financial Statements (continued)
Statements of Changes in Net Assets
| | | | | | | | |
| | | Franklin Growth and
Income Securities Fund
| |
| | | Year Ended December 31,
| |
| | | 2005 | | | 2004 | |
| | |
| |
Increase (decrease) in net assets: | | | | | | | | |
Operations: | | | | | | | | |
Net investment income | | $ | 19,173,846 | | | $ | 18,156,837 | |
Net realized gain (loss) from investments, written options and foreign currency transactions | | | 37,704,793 | | | | 35,568,635 | |
Net change in unrealized appreciation (depreciation) on investments and translation of assets and liabilities denominated in foreign currencies | | | (31,118,975 | ) | | | 16,807,039 | |
| | |
| |
Net increase (decrease) in net assets resulting from operations | | | 25,759,664 | | | | 70,532,511 | |
| | |
| |
Distributions to shareholders from: | | | | | | | | |
Net investment income: | | | | | | | | |
Class 1 | | | (11,924,016 | ) | | | (12,401,222 | ) |
Class 2 | | | (7,761,039 | ) | | | (4,840,001 | ) |
Net realized gains: | | | | | | | | |
Class 1 | | | (3,769,277 | ) | | | — | |
Class 2 | | | (2,607,494 | ) | | | — | |
| | |
| |
Total distributions to shareholders | | | (26,061,826 | ) | | | (17,241,223 | ) |
| | |
| |
Capital share transactions: (Note 2) | | | | | | | | |
Class 1 | | | (65,863,770 | ) | | | (70,034,212 | ) |
Class 2 | | | 49,956,179 | | | | 109,267,049 | |
| | |
| |
Total capital share transactions | | | (15,907,591 | ) | | | 39,232,837 | |
| | |
| |
Net increase (decrease) in net assets | | | (16,209,753 | ) | | | 92,524,125 | |
Net assets: | | | | | | | | |
Beginning of year | | | 734,741,211 | | | | 642,217,086 | |
| | |
| |
End of year | | $ | 718,531,458 | | | $ | 734,741,211 | |
| | |
| |
Undistributed net investment income included in net assets: | | | | | | | | |
End of year | | $ | 17,673,234 | | | $ | 17,939,158 | |
| | |
| |
See notes to financial statements.
FGI-16
Franklin Templeton Variable Insurance Products Trust
Notes to Financial Statements
Franklin Growth and Income Securities Fund
1. ORGANIZATION AND SIGNIFICANT ACCOUNTING POLICIES
Franklin Templeton Variable Insurance Products Trust (the Trust) is registered under the Investment Company Act of 1940 as an open-end investment company, consisting of twenty-two separate series. The Franklin Growth and Income Securities Fund (the Fund) included in this report is diversified. The financial statements of the remaining funds in the series are presented separately. Shares of the Fund are sold only to insurance company separate accounts to fund the benefits of variable life insurance policies or variable annuity contracts. As of December 31, 2005, 81.09% of the Fund’s shares were sold through one insurance company.
The following summarizes the Fund’s significant accounting policies.
a. Security Valuation
Securities listed on a securities exchange or on the NASDAQ National Market System are valued at the last quoted sale price or the official closing price of the day, respectively. Over-the-counter securities and listed securities for which there is no reported sale are valued within the range of the most recent quoted bid and ask prices. Securities that trade in multiple markets or on multiple exchanges are valued according to the broadest and most representative market.
Foreign securities are valued as of the close of trading on the foreign stock exchange on which the security is primarily traded, or the NYSE, whichever is earlier. If no sale is reported at that time, the foreign security will be valued within the range of the most recent quoted bid and ask prices. The value is then converted into its U.S. dollar equivalent at the foreign exchange rate in effect at the close of the NYSE on the day that the value of the foreign security is determined.
The Trust has procedures to determine the fair value of individual securities and other assets for which market prices are not readily available or which may not be reliably priced. Methods for valuing these securities may include: fundamental analysis, matrix pricing, discounts from market prices of similar securities, or discounts applied due to the nature and duration of restrictions on the disposition of the securities. Due to the inherent uncertainty of valuations of such securities, the fair values may differ significantly from the values that would have been used had a ready market for such investments existed. Occasionally, events occur between the time at which trading in a security is completed and the close of the NYSE that might call into question the availability (including the reliability) of the value of a portfolio security held by the Fund. If such an event occurs, the securities may be valued using fair value procedures, which may include the use of independent pricing services. All security valuation procedures are approved by the Trust’s Board of Trustees.
b. Foreign Currency Translation
Portfolio securities and other assets and liabilities denominated in foreign currencies are translated into U.S. dollars based on the exchange rate of such currencies against U.S. dollars on the date of valuation. Purchases and sales of securities, income and expense items denominated in foreign currencies are translated into U.S. dollars at the exchange rate in effect on the transaction date. Occasionally, events may impact the availability or reliability of foreign exchange rates used to convert the U.S. dollar equivalent value. If such an event occurs, the foreign exchange rate will be valued at fair value using procedures established and approved by the Trust’s Board of Trustees.
The Fund does not separately report the effect of changes in foreign exchange rates from changes in market prices on securities held. Such changes are included in net realized and unrealized gain or loss from investments on the Statement of Operations.
Realized foreign exchange gains or losses arise from sales of foreign currencies, currency gains or losses realized between the trade and settlement dates on securities transactions and the difference between the recorded amounts of dividends, interest, and foreign withholding taxes and the U.S. dollar equivalent of the amounts actually received or paid. Net unrealized foreign exchange gains and losses arise from changes in foreign exchange rates on foreign denominated assets and liabilities other than investments in securities held at the end of the reporting period.
FGI-17
Franklin Templeton Variable Insurance Products Trust
Notes to Financial Statements (continued)
Franklin Growth and Income Securities Fund
1. ORGANIZATION AND SIGNIFICANT ACCOUNTING POLICIES (continued)
c. Joint Repurchase Agreement
The Fund may enter into a joint repurchase agreement whereby its uninvested cash balance is deposited into a joint cash account with other funds managed by the investment manager or an affiliate of the investment manager and is used to invest in one or more repurchase agreements. The value and face amount of the joint repurchase agreement are allocated to the funds based on their pro-rata interest. A repurchase agreement is accounted for as a loan by the Fund to the seller, collateralized by securities which are delivered to the Fund’s custodian. The market value, including accrued interest, of the initial collateralization is required to be at least 102% of the dollar amount invested by the Funds, with the value of the underlying securities marked to market daily to maintain coverage of at least 100%. Repurchase agreements are valued at cost. At December 31, 2005, all repurchase agreements held by the Fund had been entered into on December 30, 2005.
d. Foreign Currency Contracts
When the Fund purchases or sells foreign securities it may enter into foreign exchange contracts to minimize foreign exchange risk from the trade date to the settlement date of the transactions. A foreign exchange contract is an agreement between two parties to exchange different currencies at an agreed upon exchange rate on a specified date. Realized and unrealized gains and losses on these contracts are included in the Statement of Operations.
The risks of these contracts include movement in the values of the foreign currencies relative to the U.S. dollar and the possible inability of the counterparties to fulfill their obligations under the contracts, which may be in excess of the amount reflected in the Statement of Assets and Liabilities.
e. Options
The Fund may purchase or write options. Options are contracts entitling the holder to purchase or sell a specified number of shares or units of a particular security at a specified price. Options purchased are recorded as investments; options written (sold) are recorded as liabilities. Upon closing of an option, other than by exercise, which results in a cash settlement, the difference between the premium (original option value) and the settlement proceeds is realized as a gain or loss. When securities are acquired or delivered upon exercise of an option, the acquisition cost or sale proceeds are adjusted by the amount of the premium. When an option is closed, the difference between the premium and the cost to close the position is realized as a gain or loss. When an option expires, the premium is realized as a gain for options written or as a loss for options purchased. The risks include the possibility there may be an illiquid options market or the inability of the counterparties to fulfill their obligations under the contract. Writing options involves, to varying degrees, elements of market risk in excess of the amount recognized in the Statement of Assets and Liabilities.
f. Income Taxes
No provision has been made for U.S. income taxes because the Fund’s policy is to continue to qualify as a regulated investment company under the Internal Revenue Code and to distribute to shareholders substantially all of its taxable income and net realized gains.
g. Security Transactions, Investment Income, Expenses and Distributions
Security transactions are accounted for on trade date. Realized gains and losses on security transactions are determined on a specific identification basis. Interest income and estimated expenses are accrued daily. Dividend income is recorded on the ex-dividend date except that certain dividends from foreign securities are recognized as soon as the Fund is notified of the ex-dividend date. Distributions to shareholders are recorded on the ex-dividend date and are determined according to income tax regulations (tax basis). Such distributions are reinvested in additional shares of the Fund. Distributable earnings determined
FGI-18
Franklin Templeton Variable Insurance Products Trust
Notes to Financial Statements (continued)
Franklin Growth and Income Securities Fund
1. ORGANIZATION AND SIGNIFICANT ACCOUNTING POLICIES (continued)
g. Security Transactions, Investment Income, Expenses and Distributions (continued)
on a tax basis may differ from earnings recorded in accordance with generally accepted accounting principles. These differences may be permanent or temporary. Permanent differences are reclassified among capital accounts to reflect their tax character. These reclassifications have no impact on net assets or the results of operations. Temporary differences are not reclassified, as they may reverse in subsequent periods.
Common expenses incurred by the Trust are allocated among the funds based on the ratio of net assets of each fund to the combined net assets of the Trust. Fund specific expenses are charged directly to the fund that incurred the expense.
Realized and unrealized gains and losses and net investment income, other than class specific expenses, are allocated daily to each class of shares based upon the relative proportion of net assets of each class.
h. Accounting Estimates
The preparation of financial statements in accordance with accounting principles generally accepted in the United States of America requires management to make estimates and assumptions that affect the reported amounts of assets and liabilities at the date of the financial statements and the amounts of income and expenses during the reporting period. Actual results could differ from those estimates.
i. Guarantees and Indemnifications
Under the Trust’s organizational documents, its officers and trustees are indemnified by the Trust against certain liabilities arising out of the performance of their duties to the Trust. Additionally, in the normal course of business, the Trust enters into contracts with service providers that contain general indemnification clauses. The Trust’s maximum exposure under these arrangements is unknown as this would involve future claims that may be made against the Trust that have not yet occurred. However, based on experience, the Trust expects the risk of loss to be remote.
2. SHARES OF BENEFICIAL INTEREST
The Fund offers two classes of shares: Class 1, and Class 2. Each class of shares differs by its distribution fees, voting rights on matters affecting a single class and its exchange privilege.
At December 31, 2005, there were an unlimited number of shares authorized ($0.01 par value). Transactions in the Fund’s shares were as follows:
| | | | | | | | | | | | | | |
| | | Year Ended December 31,
| |
| | | 2005
| | | 2004
| |
| Class 1 Shares: | | Shares
| | | Amount
| | | Shares
| | | Amount
| |
Shares sold | | 141,140 | | | $ | 2,160,279 | | | 65,089 | | | $ | 960,180 | |
Shares issued in reinvestment of distributions | | 1,029,744 | | | | 15,693,293 | | | 860,001 | | | | 12,401,222 | |
Shares redeemed | | (5,433,756 | ) | | | (83,717,342 | ) | | (5,688,684 | ) | | | (83,395,614 | ) |
| | |
| |
Net increase (decrease) | | (4,262,872 | ) | | $ | (65,863,770 | ) | | (4,763,594 | ) | | $ | (70,034,212 | ) |
| | |
| |
| Class 2 Shares: | | | | | | | | | | | | |
Shares sold | | 3,988,669 | | | $ | 60,891,872 | | | 7,972,875 | | | $ | 116,185,316 | |
Shares issued in reinvestment of distributions | | 687,569 | | | | 10,368,533 | | | 338,698 | | | | 4,840,001 | |
Shares redeemed | | (1,409,768 | ) | | | (21,304,226 | ) | | (820,856 | ) | | | (11,758,268 | ) |
| | |
| |
Net increase (decrease) | | 3,266,470 | | | $ | 49,956,179 | | | 7,490,717 | | | $ | 109,267,049 | |
| | |
| |
FGI-19
Franklin Templeton Variable Insurance Products Trust
Notes to Financial Statements (continued)
Franklin Growth and Income Securities Fund
3. TRANSACTIONS WITH AFFILIATES
Franklin Resources, Inc. is the holding company for various subsidiaries that together are referred to as Franklin Templeton Investments. Certain officers and trustees of the Trust are also officers and/or directors of the following subsidiaries:
| | |
| Subsidiary | | Affiliation |
Franklin Advisers, Inc. (Advisers) | | Investment manager |
Franklin Templeton Services, LLC (FT Services) | | Administrative manager |
Franklin Templeton Distributors, Inc. (Distributors) | | Principal underwriter |
Franklin Templeton Investor Services, LLC (Investor Services) | | Transfer agent |
a. Management Fees
The Fund pays an investment management fee to Advisers based on the average daily net assets of the Fund as follows:
| | |
| Annualized Fee Rate | | Net Assets |
| 0.625% | | Up to and including $100 million |
| 0.500% | | Over $100 million, up to and including $250 million |
| 0.450% | | Over $250 million, up to and including $10 billion |
| 0.440% | | Over $10 billion, up to and including $12.5 billion |
| 0.420% | | Over $12.5 billion, up to and including $15 billion |
| 0.400% | | In excess of $15 billion |
b. Administrative Fees
Under an agreement with Advisers, FT Services provides administrative services to the Fund. The fee is paid by Advisers based on average daily net assets, and is not an additional expense of the Fund.
c. Distribution Fees
The Fund’s Board of Trustees has adopted distribution plans for Class 2 shares pursuant to Rule 12b-1 under the 1940 Act. Under the Fund’s compensation distribution plans, the Fund pays Distributors for costs incurred in connection with the sale and distribution of the Fund’s shares up to 0.35% per year of its average daily net assets. The Board of Trustees has set the current rate at 0.25% per year.
d. Transfer Agent Fees
Investor Services, under terms of an agreement, performs shareholder servicing for the Fund and is not paid by the Fund for the services.
4. EXPENSE OFFSET ARRANGEMENT
The Fund has entered into an arrangement with its custodian whereby credits realized as a result of uninvested cash balances are used to reduce a portion of the Fund’s custodian expenses. During the year ended December 31, 2005, the custodian fees were reduced as noted in the Statement of Operations.
FGI-20
Franklin Templeton Variable Insurance Products Trust
Notes to Financial Statements (continued)
Franklin Growth and Income Securities Fund
5. INCOME TAXES
For tax purposes, realized currency losses occurring subsequent to October 31, may be deferred and treated as occurring on the first day of the following fiscal year. At December 31, 2005, the Fund deferred realized currency losses of $3,652.
The tax character of distributions paid during the years ended December 31, 2005 and 2004, was as follows:
| | | | | | |
| | | 2005
| | 2004
|
Distributions paid from: | | | | | | |
Ordinary income | | $ | 19,685,055 | | $ | 17,241,223 |
Long term capital gain | | | 6,376,771 | | | — |
| | |
|
| | | $ | 26,061,826 | | $ | 17,241,223 |
| | |
|
At December 31, 2005, the cost of investments, net unrealized appreciation (depreciation) undistributed ordinary income and undistributed long term capital gains for income tax purposes were as follows:
| | | | |
Cost of investments | | $ | 620,060,312 | |
| | |
|
|
|
| |
Unrealized appreciation | | $ | 119,491,611 | |
Unrealized depreciation | | | (9,113,784 | ) |
| | |
|
|
|
Net unrealized appreciation (depreciation) | | $ | 110,377,827 | |
| | |
|
|
|
Undistributed ordinary income | | $ | 19,876,084 | |
Undistributed long term capital gains | | | 32,605,577 | |
| | |
|
|
|
Distributable earnings | | $ | 52,481,661 | |
| | |
|
|
|
Net investment income differs for financial statement and tax purposes primarily due to differing treatments of foreign currency transactions and bond discounts and premiums.
Net realized gains (losses) differ for financial statement and tax purposes primarily due to differing treatments of wash sales, foreign currency transactions and bond discounts and premiums.
6. INVESTMENT TRANSACTIONS
Purchases and sales of investments (excluding short term securities) for the year ended December 31, 2005, aggregated $315,432,794 and $308,046,197, respectively.
Transactions in options written during the year ended December 31, 2005, were as follows:
| | | | | | | |
| | | Number of Contracts
| | | Premiums Received
| |
Options outstanding at December 31, 2004 | | — | | | $ | — | |
Options written | | 2,418 | | | | 178,932 | |
Options closed | | (2,418 | ) | | | (178,932 | ) |
| | |
| |
Options outstanding at December 31, 2005 | | — | | | $ | — | |
| | |
| |
FGI-21
Franklin Templeton Variable Insurance Products Trust
Notes to Financial Statements (continued)
Franklin Growth and Income Securities Fund
7. REGULATORY MATTERS
As part of various investigations by a number of federal, state, and foreign regulators and governmental entities, relating to certain practices in the mutual fund industry, including late trading, market timing and marketing support payments to securities dealers who sell fund shares, Franklin Resources, Inc. and certain of its subsidiaries (collectively, the “Company”), entered into settlements with certain of those regulators.
Specifically, the Company entered into settlements with the Securities and Exchange Commission (“SEC”) concerning market timing (the “August 2, 2004 SEC Order”) and marketing support payments to securities dealers who sell fund shares (the “December 13, 2004 SEC Order”) and with the California Attorney General’s Office (“CAGO”) concerning marketing support payments to securities dealers who sell fund shares (the “CAGO Settlement”). Under the terms of the settlements with the SEC and the CAGO, the Company retained an Independent Distribution Consultant (“IDC”) to develop a plan for distribution of the respective settlement monies. The CAGO approved the distribution plan under the CAGO Settlement and, in accordance with the terms and conditions of that settlement, the monies were disbursed to the relevant funds and are recorded as other income in the current period. The SEC has not yet approved the distribution plan pertaining to the December 13, 2004 SEC Order. When approved, disbursements of settlement monies will be made promptly to the relevant funds, in accordance with the terms and conditions of that order. The IDC continues to develop the plan of distribution under the August 2, 2004 SEC Order that resolved the SEC’s market timing investigation.
In addition, the Company, as well as most of the mutual funds within Franklin Templeton Investments and certain current or former officers, directors, and/or employees, have been named in private lawsuits (styled as shareholder class actions, or as derivative actions on behalf of either the named funds or Franklin Resources, Inc.) relating to the industry practices referenced above, as well as to allegedly excessive advisory fees, commissions, and/or 12b-1 fees. The lawsuits were filed in different courts throughout the country. Many of those suits are now pending in a multi-district litigation in the United States District Court for the District of Maryland.
The Company and fund management strongly believe that the claims made in each of the private lawsuits referenced above are without merit and intend to defend against them vigorously. The Company cannot predict with certainty the eventual outcome of these lawsuits, nor whether they will have a material negative impact on the Company. If it is determined that the Company bears responsibility for any unlawful or inappropriate conduct that caused losses to the Trust, it is committed to making the Trust or their shareholders whole, as appropriate.
FGI-22
Franklin Templeton Variable Insurance Products Trust
Franklin Growth and Income Securities Fund
Report of Independent Registered Public Accounting Firm
To the Board of Trustees and Shareholders of
Franklin Templeton Variable Insurance Products Trust
In our opinion, the accompanying statement of assets and liabilities, including the statement of investments, and the related statements of operations and of changes in net assets and the financial highlights present fairly, in all material respects, the financial position of Franklin Growth and Income Securities Fund (one of the funds constituting Franklin Templeton Variable Insurance Products Trust, hereafter referred to as the “Fund”) at December 31, 2005, the results of its operations for the year then ended, the changes in its net assets for each of the two years in the period then ended and the financial highlights for each of the five years in the period then ended, in conformity with accounting principles generally accepted in the United States of America. These financial statements and financial highlights (hereafter referred to as “financial statements”) are the responsibility of the Fund’s management; our responsibility is to express an opinion on these financial statements based on our audits. We conducted our audits of these financial statements in accordance with the standards of the Public Company Accounting Oversight Board (United States). Those standards require that we plan and perform the audit to obtain reasonable assurance about whether the financial statements are free of material misstatement. An audit includes examining, on a test basis, evidence supporting the amounts and disclosures in the financial statements, assessing the accounting principles used and significant estimates made by management, and evaluating the overall financial statement presentation. We believe that our audits, which included confirmation of securities at December 31, 2005, by correspondence with the custodian and brokers, provide a reasonable basis for our opinion.
PricewaterhouseCoopers LLP
San Francisco, California
February 10, 2006
FGI-23
Franklin Templeton Variable Insurance Products Trust
Tax Designation (unaudited)
Franklin Growth and Income Securities Fund
Under Section 852(b)(3)(C) of the Internal Revenue Code (Code), the Fund designates the maximum amount allowable but no less than $32,607,913 as a capital gain dividend for the fiscal year ended December 31, 2005.
Under Section 854(b)(2) of the Code, the Fund designates 94.28% of the ordinary income dividends as income qualifying for the dividends received deduction for the fiscal year ended December 31, 2005.
FGI-24
FRANKLIN HIGH INCOME FUND
We are pleased to bring you Franklin High Income Fund’s annual report for the fiscal year ended December 31, 2005.
Performance Summary as of 12/31/05
Average annual total return of Class 1 shares represents the average annual change in value, assuming reinvestment of dividends and capital gains. Average returns smooth out variations in returns, which can be significant; they are not the same as year-by-year results.
Periods ended 12/31/05
| | | | | | |
| | | 1-Year | | 5-Year | | 10-Year |
Average Annual Total Return | | +3.72% | | +7.19% | | +4.67% |
Total Return Index Comparison
for Hypothetical $10,000 Investment (1/1/96–12/31/05)
The graph below shows the change in value of a hypothetical $10,000 investment in the Fund over the indicated period and includes reinvestment of any income or distributions. The Fund’s performance is compared to the performance of the CSFB High Yield Index and the Lipper VIP High Current Yield Funds Classification Average. One cannot invest directly in an index, nor is an index representative of the Fund’s portfolio. Please see Important Notes to Performance Information preceding the Fund Summaries.
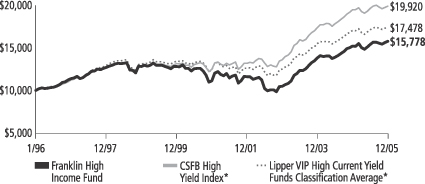
*Sources: CSFB; Lipper Inc. Please see Index Descriptions following the Fund Summaries.
Franklin High Income Fund – Class 1
Performance reflects the Fund’s Class 1 operating expenses, but does not include any contract fees, expenses or sales charges. If they had been included, performance would be lower. These charges and deductions, particularly for variable life policies, can have a significant effect on contract values and insurance benefits. See the contract prospectus for a complete description of these expenses, including sales charges.
Performance data represent past performance, which does not guarantee future results. Investment return and principal value will fluctuate, and you may have a gain or loss when you sell your shares.
Current performance may differ from figures shown.
FH-1
Fund Goals and Main Investments: Franklin High Income Fund seeks a high level of current income with capital appreciation as a secondary goal. The Fund normally invests primarily to predominantly in high yield, lower quality debt securities. The Fund may also invest in foreign securities, including a small portion in emerging markets.
Performance Overview
You can find the Fund’s one-year total return in the Performance Summary. The Fund outperformed its benchmark, the CSFB High Yield Index, which returned +2.26% for the period under review.1 The Fund also outperformed its peers, as measured by the +2.56% return of the Lipper VIP High Current Yield Funds Classification Average.1
Economic and Market Overview
The economy continued to grow at a healthy pace during the year under review. Over the reporting period, nonfarm payroll data, as well as other indexes, showed growing employment. This along with other factors helped consumer spending increase 6.25% (not adjusted for inflation) in December 2005 compared with the same month a year earlier, which supported U.S. economic growth.2
Business spending also rose during the reporting period, contributing to economic growth. Historically low interest rates continued to allow many companies easy access to capital, and ample cash also helped some companies to support their spending plans.
Oil prices increased substantially during the period amid concerns about potential long-term supply limitations in the face of expected strong growth in global demand, especially from China and India. Despite high commodity prices, inflation remained relatively contained for the 12 months ended December 31, 2005, as measured by the 2.2% rise for the core Consumer Price Index (CPI), which was the same as the core CPI’s 10-year average.3 The Federal Reserve Board (Fed) noted some economic effects due to the recent hurricanes. However, acknowledging the economy’s strength as well as potential inflationary pressure from high energy prices, the Fed raised the federal funds target rate to 4.25% from 2.25% during the 12-month period.
1. Sources: CSFB; Lipper Inc. One cannot invest directly in an index, nor is an index representative of the Fund’s portfolio. Please see Index Descriptions following the Fund Summaries.
2. Source: Bureau of Economic Analysis.
3. Source: Bureau of Labor Statistics. Core CPI excludes food and energy costs.
Fund Risks: Because the Fund invests in bonds and other debt obligations, the Fund’s share price and yield will be affected by interest rate movements. Bond prices generally move in the opposite direction from interest rates. Thus, as the prices of bonds in the Fund adjust to a rise in interest rates, the Fund’s share price may decline. High yield, lower-rated (junk) bonds generally have greater price swings and higher default risks. Foreign investing, especially in emerging markets, involves additional risks including currency fluctuations, economic instability, and social and political developments. The Fund’s prospectus also includes a description of the main investment risks.
FH-2
The 10-year Treasury note fluctuated considerably over the past year, but overall its yield rose from 4.24% at the beginning of the period to 4.39% on December 31, 2005. Although core inflationary pressures appeared relatively well contained, the U.S. economy’s resilience caused some concern about future pricing pressures. Some market participants also pointed to the upcoming change in the Fed chairman as another possible catalyst for the 10-year Treasury’s rise, as there is some market perception that Ben Bernanke, the next Fed chairman, may tolerate higher inflation risk. However, Mr. Bernanke is reported to share many of retiring chairman Alan Greenspan’s economic philosophies. Furthermore, it is likely to take some time before his approach to dealing with inflation is apparent.
The high yield bond market started 2005 with valuations that were somewhat rich compared to longer-term averages, but were supported by favorable fundamental credit trends. However, the prospect of credit ratings downgrades for automotive manufacturers General Motors (GM) and Ford to below investment-grade status put technical pressure on the market, and yield spreads widened in mid-March, erasing the then year-to-date gains. Once the downgrade of GM became a reality later in the year, the market actually rallied as GM’s transition from investment grade to high yield went relatively smoothly in the marketplace. The moderate rise in intermediate-term interest rates over the course of the year had a dampening impact on the high yield market’s returns. Overall, however, positive corporate earnings growth, strong corporate balance sheet liquidity and relatively low level of equity market volatility tended to support the high yield asset class, which posted a positive total return for the year. Consequently, valuations ended 2005 at levels still tight compared to longer-term averages, although a little cheaper than they stood at the beginning of 2005.
Investment Strategy
We are disciplined, fundamental investors who mainly rely on our analysts’ in-depth industry expertise to evaluate companies. We generally perform independent analysis of the corporate debt securities being considered for the Fund’s portfolio, rather than relying principally on the ratings assigned by rating agencies. In our analysis, we may consider a variety of factors: a security’s relative value based on such factors as anticipated cash flow, interest or dividend coverage, asset coverage and earnings prospects; the experience and strength of a company’s management; the company’s sensitivity to changes in interest rates and business conditions; the company’s debt maturity schedules and borrowing requirements; and the company’s changing financial condition and market recognition of the change.
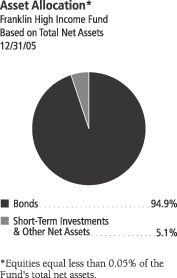
FH-3
Manager’s Discussion
During the fiscal year, the Fund maintained what we considered a fairly neutral risk positioning versus the CSFB High Yield Index based on our assessment of the market’s valuation, as we sought to drive performance through security selection and industry positioning.
Although security selection was a driver for the Fund’s relative performance, certain industry positioning also contributed to the Fund’s return. For example, the Fund held no airline positions and was underweighted in the automotive industry.4 These sectors struggled throughout the year and were the two worst performing within the CSFB High Yield Index, which helped the Fund’s absolute and relative performance. The wireless communications sector notably outperformed the overall benchmark’s return, driven by healthy operating performance and continued consolidation in the industry; therefore, the Fund’s overweighted position in the sector benefited the Fund’s relative return.
During the reporting period, certain industry weightings had a negative effect on performance. For example, the Fund’s positioning relative to the CSFB High Yield Index in the energy sector was a drag on performance. The energy sector was among the top performing in the market, and the Fund was slightly underweighted during the year, hindering relative performance.
Thank you for your participation in Franklin High Income Fund. We look forward to serving your future investment needs.
4. In the SOI, automotive holdings are in the consumer durables and producer manufacturing sectors.
The foregoing information reflects our analysis, opinions and portfolio holdings as of December 31, 2005, the end of the reporting period. The way we implement our main investment strategies and the resulting portfolio holdings may change depending on factors such as market and economic conditions. These opinions may not be relied upon as investment advice or an offer for a particular security. The information is not a complete analysis of every aspect of any market, country, industry, security or the Fund. Statements of fact are from sources considered reliable, but the adviser makes no representation or warranty as to their completeness or accuracy. Although historical performance is no guarantee of future results, these insights may help you understand our investment management philosophy.
Top 10 Sectors/Industries
Franklin High Income Fund
Based on Total Net Assets
12/31/05
| | |
| Consumer Services | | 17.9% |
| |
| Communications | | 11.9% |
| |
| Utilities | | 10.5% |
| |
| Process Industries | | 9.6% |
| |
| Producer Manufacturing | | 6.9% |
| |
| Health Services | | 6.7% |
| |
| Energy Minerals | | 5.7% |
| |
| Electronic Technology | | 4.8% |
| |
| Commercial Services | | 4.0% |
| |
| Consumer Durables | | 3.9% |
The dollar value, number of shares or principal amount, and names of all portfolio holdings are listed in the Fund’s Statement of Investments.
FH-4
Fund Expenses
As an investor in a variable insurance contract (“Contract”) that indirectly provides for investment in an underlying mutual fund, you can incur transaction and/or ongoing expenses at both the Fund level and the Contract level.
| • | | Transaction expenses can include sales charges (loads) on purchases, redemption fees, surrender fees, transfer fees and premium taxes. |
| • | | Ongoing expenses can include management fees, distribution and service (12b-1) fees, contract fees, annual maintenance fees, mortality and expense risk fees and other fees and expenses. All mutual funds and Contracts have some types of ongoing expenses. |
The expenses shown in the table below are meant to highlight ongoing expenses at the Fund level only and do not include ongoing expenses at the Contract level, or transaction expenses at either the Fund or Contract level. While the Fund does not have transaction expenses, if the transaction and ongoing expenses at the Contract level were included, the expenses shown below would be higher. You should consult your Contract prospectus or disclosure document for more information.
The table shows Fund-level ongoing expenses and can help you understand these expenses and compare them with those of other mutual funds offered through the Contract. The table assumes a $1,000 investment held for the six months indicated. Please refer to the Fund prospectus for additional information on operating expenses.
Actual Fund Expenses
The first line (Actual) of the table below provides actual account values and expenses. The “Ending Account Value” is derived from the Fund’s actual return, which includes the effect of ongoing Fund expenses, but does not include the effect of ongoing Contract expenses.
You can estimate the Fund-level expenses you incurred during the period by following these steps. Of course, your account value and expenses will differ from those in this illustration:
| 1. | Divide your account value by $1,000. |
If an account had an $8,600 value, then $8,600 ÷ $1,000 = 8.6.
| 2. | Multiply the result by the number under the heading “Fund-Level Expenses Incurred During Period.” |
If Fund-Level Expenses Incurred During Period were $7.50, then 8.6 × $7.50 = $64.50.
Franklin High Income Fund – Class 1
FH-5
In this illustration, the estimated expenses incurred this period at the Fund level are $64.50.
Hypothetical Example for Comparison with Other Mutual Funds
Information in the second line (Hypothetical) of the table can help you compare ongoing expenses of the Fund with those of other mutual funds offered through the Contract. This information may not be used to estimate the actual ending account balance or expenses you incurred during the period. The hypothetical “Ending Account Value” is based on the Fund’s actual expense ratio and an assumed 5% annual rate of return before expenses, which does not represent the Fund’s actual return. The figure under the heading “Fund-Level Expenses Incurred During Period” shows the hypothetical expenses your account would have incurred under this scenario. You can compare this figure with the 5% hypothetical examples that appear in shareholder reports of other funds offered through a Contract.
| | | | | | | | | |
| Class 1 | | Beginning
Account
Value 7/1/05 | | Ending
Account
Value 12/31/05 | | Fund-Level
Expenses Incurred
During Period*
7/1/05-12/31/05 |
Actual | | $ | 1,000 | | $ | 1,024.00 | | $ | 3.01 |
Hypothetical (5% return before expenses) | | $ | 1,000 | | $ | 1,022.23 | | $ | 3.01 |
*Expenses are equal to the annualized expense ratio for the Fund’s Class 1 shares (0.59%), which does not include any ongoing expenses of the Contract for which the Fund is an investment option, multiplied by the average account value over the period, multiplied by 184/365 to reflect the one-half year period.
FH-6
Franklin Templeton Variable Insurance Products Trust
Financial Highlights
Franklin High Income Fund
| | | | | | | | | | | | | | | | | | | | |
| | | Year Ended December 31,
| |
| Class 1 | | 2005 | | | 2004 | | | 2003 | | | 2002 | | | 2001 | |
| | |
|
|
|
Per share operating performance | | | | | | | | | | | | | | | | | | | | |
(for a share outstanding throughout the year) | | | | | | | | | | | | | | | | | | | | |
Net asset value, beginning of year | | $ | 6.99 | | | $ | 6.81 | | | $ | 5.67 | | | $ | 7.44 | | | $ | 8.54 | |
| | |
|
|
|
Income from investment operations: | | | | | | | | | | | | | | | | | | | | |
Net investment incomea | | | 0.48 | | | | 0.49 | | | | 0.51 | | | | 0.63 | | | | 0.87 | c |
Net realized and unrealized gains (losses) | | | (0.23 | ) | | | 0.15 | | | | 1.21 | | | | (1.30 | ) | | | (0.50 | )c |
| | |
|
|
|
Total from investment operations | | | 0.25 | | | | 0.64 | | | | 1.72 | | | | (0.67 | ) | | | 0.37 | |
| | |
|
|
|
Less distributions from net investment income | | | (0.42 | ) | | | (0.46 | ) | | | (0.58 | ) | | | (1.10 | ) | | | (1.47 | ) |
| | |
|
|
|
Net asset value, end of year | | $ | 6.82 | | | $ | 6.99 | | | $ | 6.81 | | | $ | 5.67 | | | $ | 7.44 | |
| | |
|
|
|
| | | | | |
Total returnb | | | 3.72% | | | | 10.04% | | | | 31.50% | | | | (9.55)% | | | | 4.26% | |
Ratios/supplemental data | | | | | | | | | | | | | | | | | | | | |
Net assets, end of year (000’s) | | $ | 87,814 | | | $ | 109,569 | | | $ | 136,218 | | | $ | 111,746 | | | $ | 151,924 | |
Ratios to average net assets: | | | | | | | | | | | | | | | | | | | | |
Expenses | | | 0.60% | | | | 0.62% | | | | 0.62% | | | | 0.63% | | | | 0.62% | |
Net investment income | | | 6.96% | | | | 7.17% | | | | 8.19% | | | | 9.92% | | | | 10.63% | c |
Portfolio turnover rate | | | 47.60% | | | | 59.87% | | | | 52.01% | | | | 56.01% | | | | 30.03% | |
aBased on average daily shares outstanding.
bTotal return does not include any fees, charges or expenses imposed by the variable annuity and life insurance contracts for which the Franklin Templeton Variable Insurance Products Trust serves as an underlying investment vehicle.
cEffective January 1, 2001, the Fund adopted the provisions of the AICPA Audit and Accounting Guide for Investment Companies and began amortizing all premium and discount on fixed-income securities, as required. The effect of this change was a follows:
| | |
Net investment income per share | | (0.004) |
New realized and unrealized gains (losses) per share | | 0.004 |
Ratio of net investment income to average net assets | | (0.05)% |
See notes to financial statements.
FH-7
Franklin Templeton Variable Insurance Products Trust
Financial Highlights (continued)
Franklin High Income Fund (continued)
| | | | | | | | | | | | | | | | | | | | |
| | | Year Ended December 31,
| |
| Class 2 | | 2005 | | | 2004 | | | 2003 | | | 2002 | | | 2001 | |
| | |
|
|
|
Per share operating performance | | | | | | | | | | | | | | | | | | | | |
(for a share outstanding throughout the year) | | | | | | | | | | | | | | | | | | | | |
Net asset value, beginning of year | | $ | 6.90 | | | $ | 6.73 | | | $ | 5.62 | | | $ | 7.41 | | | $ | 8.50 | |
| | |
|
|
|
Income from investment operations: | | | | | | | | | | | | | | | | | | | | |
Net investment incomea | | | 0.45 | | | | 0.46 | | | | 0.48 | | | | 0.56 | | | | 0.84 | c |
Net realized and unrealized gains (losses) | | | (0.23 | ) | | | 0.16 | | | | 1.21 | | | | (1.25 | ) | | | (0.48 | )c |
| | |
|
|
|
Total from investment operations | | | 0.22 | | | | 0.62 | | | | 1.69 | | | | (0.69 | ) | | | 0.36 | |
| | |
|
|
|
Less distributions from net investment income | | | (0.41 | ) | | | (0.45 | ) | | | (0.58 | ) | | | (1.10 | ) | | | (1.45 | ) |
| | |
|
|
|
Net asset value, end of year | | $ | 6.71 | | | $ | 6.90 | | | $ | 6.73 | | | $ | 5.62 | | | $ | 7.41 | |
| | |
|
|
|
| | | | | |
Total returnb | | | 3.31% | | | | 9.87% | | | | 31.18% | | | | (9.96)% | | | | 4.18% | |
Ratios/supplemental data | | | | | | | | | | | | | | | | | | | | |
Net assets, end of year (000’s) | | $ | 139,413 | | | $ | 122,579 | | | $ | 58,681 | | | $ | 7,326 | | | $ | 832 | |
Ratios to average net assets: | | | | | | | | | | | | | | | | | | | | |
Expenses | | | 0.85% | | | | 0.87% | | | | 0.87% | | | | 0.88% | | | | 0.87% | |
Net investment income | | | 6.71% | | | | 6.92% | | | | 7.94% | | | | 9.67% | | | | 10.39%c | |
Portfolio turnover rate | | | 47.60% | | | | 59.87% | | | | 52.01% | | | | 56.01% | | | | 30.03% | |
aBased on average daily shares outstanding.
bTotal return does not include any fees, charges or expenses imposed by the variable annuity and life insurance contracts for which the Franklin Templeton Variable Insurance Products Trust serves as an underlying investment vehicle.
cEffective January 1, 2001, the Fund adopted the provisions of the AICPA Audit and Accounting Guide for Investment Companies and began amortizing all premium and discount on fixed-income securities, as required. The effect of this change was a follows:
| | |
Net investment income per share | | (0.004) |
New realized and unrealized gains (losses) per share | | 0.004 |
Ratio of net investment income to average net assets | | (0.05)% |
See notes to financial statements.
FH-8
Franklin Templeton Variable Insurance Products Trust
Statement of Investments, December 31, 2005
| | | | | | | |
| Franklin High Income Fund | | Country | | Principal
AmountC | | Value |
Long Term Investments 94.9% | | | | | | | |
Corporate Bonds 94.9% | | | | | | | |
Commercial Services 4.0% | | | | | | | |
Corrections Corp. of America, senior note, 7.50%, 5/01/11 | | United States | | 2,000,000 | | $ | 2,080,000 |
Dex Media Inc., B, 8.00%, 11/15/13 | | United States | | 500,000 | | | 512,500 |
Dex Media West LLC, senior sub. note, 9.875%, 8/15/13 | | United States | | 1,500,000 | | | 1,672,500 |
JohnsonDiversey Holdings Inc., senior disc. note, zero cpn. to 5/17/07,
10.67% thereafter, 5/15/13 | | United States | | 3,000,000 | | | 2,400,000 |
Lamar Media Corp., senior sub. note, | | | | | | | |
7.25%, 1/01/13 | | United States | | 2,000,000 | | | 2,085,000 |
6.625%, 8/15/15 | | United States | | 300,000 | | | 302,625 |
| | | | | | |
|
|
| | | | | | | | 9,052,625 |
| | | | | | |
|
|
Communications 11.9% | | | | | | | |
aCentennial Communications Corp., senior note, 144A, 10.00%, 1/01/13 | | United States | | 2,500,000 | | | 2,537,500 |
Dobson Cellular Systems Inc., senior secured note, 9.875%, 11/01/12 | | United States | | 2,000,000 | | | 2,215,000 |
Inmarsat Finance PLC, senior note,
7.625%, 6/30/12 | | United Kingdom | | 1,496,000 | | | 1,550,230 |
zero cpn. to 11/15/08, 10.375% thereafter, 11/15/12 | | United Kingdom | | 600,000 | | | 503,250 |
aIntelsat Bermuda Ltd., senior note, 144A, 8.25%, 1/15/13 | | Bermuda | | 2,200,000 | | | 2,233,000 |
MCI Inc., senior note, 7.688%, 5/01/09 | | United States | | 2,500,000 | | | 2,587,500 |
Millicom International Cellular SA, senior note, 10.00%, 12/01/13 | | Luxembourg | | 2,200,000 | | | 2,282,500 |
Nextel Communications Inc., senior note, D, 7.375%, 8/01/15 | | United States | | 2,000,000 | | | 2,112,284 |
Qwest Communications International Inc., senior note,
7.50%, 2/15/14 | | United States | | 2,000,000 | | | 2,065,000 |
a144A, 7.50%, 2/15/14 | | United States | | 2,000,000 | | | 2,065,000 |
Rogers Wireless Inc., senior secured note, 7.25%, 12/15/12 | | Canada | | 2,200,000 | | | 2,323,750 |
Time Warner Telecom Holdings Inc., senior note, 9.25%, 2/15/14 | | United States | | 2,500,000 | | | 2,650,000 |
aWind Acquisition Fin SA, senior note, 144A, 10.75%, 12/01/15 | | Italy | | 1,800,000 | | | 1,867,500 |
| | | | | | |
|
|
| | | | | | | | 26,992,514 |
| | | | | | |
|
|
Consumer Durables 3.9% | | | | | | | |
D.R. Horton Inc., senior note, 8.50%, 4/15/12 | | United States | | 2,000,000 | | | 2,146,816 |
General Motors Acceptance Corp., 6.875%, 8/28/12 | | United States | | 2,500,000 | | | 2,256,235 |
General Motors Corp., senior deb., 8.25%, 7/15/23 | | United States | | 500,000 | | | 323,750 |
Simmons Co., senior sub. note, 7.875%, 1/15/14 | | United States | | 2,000,000 | | | 1,860,000 |
William Lyon Homes Inc., senior note, 7.625%, 12/15/12 | | United States | | 2,500,000 | | | 2,218,750 |
| | | | | | |
|
|
| | | | | | | | 8,805,551 |
| | | | | | |
|
|
Consumer Non-Durables 3.0% | | | | | | | |
Del Monte Corp., senior sub. note, 8.625%, 12/15/12 | | United States | | 2,000,000 | | | 2,135,000 |
Smithfield Foods Inc., senior note,
7.00%, 8/01/11 | | United States | | 800,000 | | | 820,000 |
7.75%, 5/15/13 | | United States | | 1,700,000 | | | 1,806,250 |
Spectrum Brands Inc., senior sub. note, 7.375%, 2/01/15 | | United States | | 2,500,000 | | | 2,100,000 |
| | | | | | |
|
|
| | | | | | | | 6,861,250 |
| | | | | | |
|
|
Consumer Services 17.9% | | | | | | | |
bAdelphia Communications Corp., senior note, 10.25%, 6/15/11 | | United States | | 1,700,000 | | | 1,028,500 |
Advanstar Communications Inc., senior secured note, 10.75%, 8/15/10 | | United States | | 2,000,000 | | | 2,202,500 |
AMC Entertainment Inc., senior sub. note, 9.875%, 2/01/12 | | United States | | 2,500,000 | | | 2,462,500 |
Boyd Gaming Corp., senior sub. note,
7.75%, 12/15/12 | | United States | | 300,000 | | | 315,750 |
6.75%, 4/15/14 | | United States | | 1,700,000 | | | 1,695,750 |
Cablevision Systems Corp., senior note, B, 8.00%, 4/15/12 | | United States | | 2,800,000 | | | 2,632,000 |
Caesars Entertainment Inc., senior sub. note, 7.875%, 3/15/10 | | United States | | 2,000,000 | | | 2,160,000 |
bCallahan NordRhein-Westfalen, senior note, 14.00%, 7/15/10 | | Germany | | 2,750,000 | | | 275 |
CCH II LLC, senior note, 10.25%, 9/15/10 | | United States | | 3,000,000 | | | 3,000,000 |
FH-9
Franklin Templeton Variable Insurance Products Trust
Statement of Investments, December 31, 2005 (continued)
| | | | | | | |
| Franklin High Income Fund | | Country | | Principal
AmountC | | Value |
Long Term Investments (cont.) | | | | | | | |
Corporate Bonds (cont.) | | | | | | | |
Consumer Services (cont.) | | | | | | | |
DIRECTV Holdings LLC, senior note,
8.375%, 3/15/13 | | United States | | 1,685,000 | | $ | 1,819,800 |
6.375%, 6/15/15 | | United States | | 1,000,000 | | | 982,500 |
EchoStar DBS Corp., senior note, 6.375%, 10/01/11 | | United States | | 2,000,000 | | | 1,935,000 |
Emmis Operating Co., senior sub. note, 6.875%, 5/15/12 | | United States | | 3,000,000 | | | 2,996,250 |
aGreektown Holdings, senior note, 144A, 10.75%, 12/01/13 | | United States | | 2,000,000 | | | 1,995,000 |
aHertz Corp., senior note, 144A, 8.875%, 1/01/14 | | United States | | 1,700,000 | | | 1,740,375 |
Liberty Media Corp., senior note, 5.70%, 5/15/13 | | United States | | 2,500,000 | | | 2,341,903 |
LIN Television Corp., senior sub. note, 6.50%, 5/15/13 | | United States | | 2,415,000 | | | 2,327,456 |
MGM MIRAGE Inc., senior note, 6.625%, 7/15/15 | | United States | | 1,500,000 | | | 1,503,750 |
Pinnacle Entertainment Inc., senior sub. note, 8.75%, 10/01/13 | | United States | | 2,000,000 | | | 2,140,000 |
Radio One Inc., senior sub. note, 6.375%, 2/15/13 | | United States | | 2,000,000 | | | 1,952,500 |
Royal Caribbean Cruises Ltd., senior note, 6.875%, 12/01/13 | | United States | | 1,200,000 | | | 1,276,968 |
Station Casinos Inc.,
senior note, 6.00%, 4/01/12 | | United States | | 300,000 | | | 300,750 |
senior sub. note, 6.50%, 2/01/14 | | United States | | 300,000 | | | 304,500 |
senior sub. note, 6.875%, 3/01/16 | | United States | | 1,400,000 | | | 1,438,500 |
| | | | | | |
|
|
| | | | | | | | 40,552,527 |
| | | | | | |
|
|
Electronic Technology 4.8% | | | | | | | |
Argo-Tech Corp., senior note, 9.25%, 6/01/11 | | United States | | 2,000,000 | | | 2,060,000 |
Flextronics International Ltd., senior sub. note, 6.50%, 5/15/13 | | Singapore | | 1,800,000 | | | 1,838,250 |
L-3 Communications Corp., senior sub. note,
5.875%, 1/15/15 | | United States | | 2,500,000 | | | 2,437,500 |
a144A, 6.375%, 10/15/15 | | United States | | 500,000 | | | 501,250 |
Sanmina-SCI Corp., senior sub. note, 6.75%, 3/01/13 | | United States | | 2,000,000 | | | 1,912,500 |
Xerox Corp., senior note, 7.125%, 6/15/10 | | United States | | 2,000,000 | | | 2,092,500 |
| | | | | | |
|
|
| | | | | | | | 10,842,000 |
| | | | | | |
|
|
Energy Minerals 5.7% | | | | | | | |
Chesapeake Energy Corp., senior note, 6.25%, 1/15/18 | | United States | | 2,500,000 | | | 2,462,500 |
aMarkwest Energy Partners LP, senior note, 144A, 6.875%, 11/01/14 | | United States | | 2,500,000 | | | 2,312,500 |
aMassey Energy Co., senior note, 144A, 6.875%, 12/15/13 | | United States | | 1,000,000 | | | 1,013,750 |
Peabody Energy Corp., senior note, B, 6.875%, 3/15/13 | | United States | | 2,500,000 | | | 2,612,500 |
Plains Exploration & Production Co., senior note, 7.125%, 6/15/14 | | United States | | 2,500,000 | | | 2,600,000 |
aPogo Producing Co., senior sub. note, 144A, 6.875%, 10/01/17 | | United States | | 2,000,000 | | | 1,960,000 |
| | | | | | |
|
|
| | | | | | | | 12,961,250 |
| | | | | | |
|
|
Health Services 6.7% | | | | | | | |
DaVita Inc., senior sub. note, 7.25%, 3/15/15 | | United States | | 2,700,000 | | | 2,747,250 |
Fresenius Medical Care Capital Trust II, 7.875%, 2/01/08 | | Germany | | 2,500,000 | | | 2,587,500 |
HCA Inc., senior note, 8.75%, 9/01/10 | | United States | | 2,000,000 | | | 2,221,994 |
Tenet Healthcare Corp., senior note, 7.375%, 2/01/13 | | United States | | 3,000,000 | | | 2,782,500 |
United Surgical Partners International Inc., senior sub. note, 10.00%, 12/15/11 | | United States | | 2,000,000 | | | 2,165,000 |
Vanguard Health Holding Co. II LLC, senior sub. note, 9.00%, 10/01/14 | | United States | | 2,500,000 | | | 2,668,750 |
| | | | | | |
|
|
| | | | | | | | 15,172,994 |
| | | | | | |
|
|
Industrial Services 2.2% | | | | | | | |
Allied Waste North America Inc., senior secured note,
6.50%, 11/15/10 | | United States | | 2,100,000 | | | 2,089,500 |
B, 5.75%, 2/15/11 | | United States | | 900,000 | | | 857,250 |
Hanover Equipment Trust 01, senior secured note, B, 8.75%, 9/01/11 | | United States | | 2,000,000 | | | 2,125,000 |
| | | | | | |
|
|
| | | | | | | | 5,071,750 |
| | | | | | |
|
|
Non-Energy Minerals 1.0% | | | | | | | |
aNovelis Inc., senior note, 144A, 7.25%, 2/15/15 | | Canada | | 2,500,000 | | | 2,343,750 |
| | | | | | |
|
|
FH-10
Franklin Templeton Variable Insurance Products Trust
Statement of Investments, December 31, 2005 (continued)
| | | | | | | |
| Franklin High Income Fund | | Country | | Principal
AmountC | | Value |
Long Term Investments (cont.) | | | | | | | |
Corporate Bonds (cont.) | | | | | | | |
Process Industries 9.6% | | | | | | | |
Abitibi-Consolidated Co. of Canada, senior note, 8.375%, 4/01/15 | | Canada | | 2,500,000 | | $ | 2,406,250 |
BCP Crystal Holdings Corp., senior sub. note, 9.625%, 6/15/14 | | United States | | 2,130,000 | | | 2,380,275 |
aCrown Americas Inc., senior note, 144A, 7.75%, 11/15/15 | | United States | | 2,500,000 | | | 2,600,000 |
Georgia-Pacific Corp., senior note, 8.125%, 5/15/11 | | United States | | 2,000,000 | | | 2,012,500 |
Graphic Packaging International Corp., senior note, 8.50%, 8/15/11 | | United States | | 900,000 | | | 906,750 |
Jefferson Smurfit Corp., senior note, 7.50%, 6/01/13 | | United States | | 1,000,000 | | | 925,000 |
JSG Funding PLC, senior sub. note, 7.75%, 4/01/15 | | Ireland | | 2,500,000 | | | 2,087,500 |
Nalco Co., senior sub. note, 8.875%, 11/15/13 | | United States | | 2,500,000 | | | 2,631,250 |
Owens-Illinois Inc., senior note, 7.80%, 5/15/18 | | United States | | 2,500,000 | | | 2,500,000 |
Rhodia SA, senior note, 10.25%, 6/01/10 | | France | | 2,500,000 | | | 2,750,000 |
d,e,fTjiwi Kimia Finance Mauritius, secured note, 144A,
gFRN, 5.248%, 4/29/15 | | Indonesia | | 296,174 | | | 87,431 |
gFRN, 5.248%, 4/29/18 | | Indonesia | | 762,312 | | | 225,034 |
zero cpn., 4/29/25 | | Indonesia | | 981,799 | | | 289,827 |
| | | | | | |
|
|
| | | | | | | | 21,801,817 |
| | | | | | |
|
|
Producer Manufacturing 6.9% | | | | | | | |
Case New Holland Inc., senior note, 9.25%, 8/01/11 | | United States | | 2,700,000 | | | 2,902,500 |
aCommercial Vehicle Group Inc., senior note, 144A, 8.00%, 7/01/13 | | United States | | 2,300,000 | | | 2,282,750 |
Fimep SA, senior note, 10.50%, 2/15/13 | | France | | 2,000,000 | | | 2,270,000 |
bGoss Graphic Systems Inc., senior sub. note, 12.25%, 11/19/05 | | United States | | 1,912,374 | | | — |
aInvensys PLC, senior note, 144A, 9.875%, 3/15/11 | | United Kingdom | | 2,500,000 | | | 2,487,500 |
Milacron Escrow Corp., senior secured note, 11.50%, 5/15/11 | | United States | | 1,050,000 | | | 903,000 |
aNell AF Sarl, senior note, 144A, 8.375%, 8/15/15 | | Luxembourg | | 2,000,000 | | | 1,990,000 |
TRW Automotive Inc., senior note, 9.375%, 2/15/13 | | United States | | 2,659,000 | | | 2,891,663 |
| | | | | | |
|
|
| | | | | | | | 15,727,413 |
| | | | | | |
|
|
Real Estate Development 0.9% | | | | | | | |
Forest City Enterprises Inc., senior note,
7.625%, 6/01/15 | | United States | | 1,700,000 | | | 1,810,500 |
6.50%, 2/01/17 | | United States | | 300,000 | | | 295,500 |
| | | | | | |
|
|
| | | | | | | | 2,106,000 |
| | | | | | |
|
|
Real Estate Investment Trusts 1.1% | | | | | | | |
Host Marriott LP, senior note,
M, 7.00%, 8/15/12 | | United States | | 2,000,000 | | | 2,060,000 |
O, 6.375%, 3/15/15 | | United States | | 500,000 | | | 501,250 |
| | | | | | |
|
|
| | | | | | | | 2,561,250 |
| | | | | | |
|
|
Retail Trade 2.1% | | | | | | | |
aGSC Holdings Corp., senior note, 144A, 8.00%, 10/01/12 | | United States | | 2,500,000 | | | 2,362,500 |
aRite Aid Corp., senior note, 144A, 6.125%, 12/15/08 | | United States | | 2,500,000 | | | 2,362,500 |
| | | | | | |
|
|
| | | | | | | | 4,725,000 |
| | | | | | |
|
|
Technology Services 1.8% | | | | | | | |
aSunGard Data Systems Inc.,
senior note, 144A, 9.125%, 8/15/13 | | United States | | 900,000 | | | 936,000 |
senior sub. note, 144A, 10.25%, 8/15/15 | | United States | | 900,000 | | | 904,500 |
UGS Corp., senior sub. note, 10.00%, 6/01/12 | | United States | | 2,000,000 | | | 2,190,000 |
| | | | | | |
|
|
| | | | | | | | 4,030,500 |
| | | | | | |
|
|
Transportation 0.9% | | | | | | | |
Great Lakes Dredge & Dock Co., senior sub. note, 7.75%, 12/15/13 | | United States | | 2,200,000 | | | 1,993,750 |
| | | | | | |
|
|
Utilities 10.5% | | | | | | | |
aAllegheny Energy Supply Co. LLC, 144A, 8.25%, 4/15/12 | | United States | | 3,000,000 | | | 3,397,500 |
Aquila Inc., senior note, 14.875%, 7/01/12 | | United States | | 2,000,000 | | | 2,690,000 |
a,b,eCalpine Corp., senior secured note, 144A, 8.50%, 7/15/10 | | United States | | 2,200,000 | | | 1,815,000 |
aDynegy Holdings Inc., senior secured note, 144A, 10.125%, 7/15/13 | | United States | | 3,000,000 | | | 3,405,000 |
El Paso Corp., senior note, 7.875%, 6/15/12 | | United States | | 2,000,000 | | | 2,070,000 |
FH-11
Franklin Templeton Variable Insurance Products Trust
Statement of Investments, December 31, 2005 (continued)
| | | | | | | | |
| Franklin High Income Fund | | Country | | Principal
AmountC | | Value |
Long Term Investments (cont.) | | | | | | | | |
Corporate Bonds (cont.) | | | | | | | | |
Utilities (cont.) | | | | | | | | |
El Paso Natural Gas Co., senior note, A, 7.625%, 8/01/10 | | United States | | | 2,500,000 | | $ | 2,641,447 |
Midwest Generation LLC, senior secured note, 8.75%, 5/01/34 | | United States | | | 2,300,000 | | | 2,544,375 |
aMirant North America LLC, senior note, 144A, 7.375%, 12/31/13 | | United States | | | 1,100,000 | | | 1,117,875 |
aTexas Genco LLC, senior note, 144A, 6.875%, 12/15/14 | | United States | | | 1,700,000 | | | 1,848,750 |
TXU Corp., senior note, 5.55%, 11/15/14 | | United States | | | 2,500,000 | | | 2,387,089 |
| | | | | | | |
|
|
| | | | | | | | | 23,917,036 |
| | | | | | | |
|
|
Total Corporate Bonds (Cost $217,380,969) | | | | | | | | 215,518,977 |
| | | | | | | |
|
|
| | | |
| | | | | Shares
| | |
Common Stock (Cost $89,208) 0.0%h | | | | | | | | |
Producer Manufacturing 0.0% | | | | | | | | |
d,fGoss Holdings Inc., B | | United States | | | 44,604 | | | — |
| | | | | | | |
|
|
Preferred Stock (Cost $4,500,000) 0.0%h | | | | | | | | |
Process Industries 0.0%h | | | | | | | | |
b,d,eAsia Pulp & Paper Co. Ltd., 12.00%, pfd., Perpetual | | Indonesia | | | 4,500,000 | | | 49,050 |
| | | | | | | |
|
|
Total Long Term Investments (Cost $221,970,177) | | | | | | | | 215,568,027 |
| | | | | | | |
|
|
| | | |
| | | | | Principal
AmountC
| | |
Short Term Investment (Cost $8,240,585) 3.6% | | | | | | | | |
Repurchase Agreement | | | | | | | | |
IJoint Repurchase Agreement, 3.999%, 1/03/06 (Maturity Value $8,244,246) | | United States | | $ | 8,240,585 | | | 8,240,585 |
ABN AMRO Bank, N.V., New York Branch (Maturity Value $759,542) | | | | | | | | |
Banc of America Securities LLC (Maturity Value $776,031) | | | | | | | | |
Barclays Capital Inc. (Maturity Value $776,031) | | | | | | | | |
Bear, Stearns & Co. Inc. (Maturity Value $660,529) | | | | | | | | |
BNP Paribas Securities Corp. (Maturity Value $776,031) | | | | | | | | |
Deutsche Bank Securities Inc. (Maturity Value $330,347) | | | | | | | | |
Goldman, Sachs & Co. (Maturity Value $561,433) | | | | | | | | |
Greenwich Capital Markets Inc. (Maturity Value $776,031) | | | | | | | | |
Lehman Brothers Inc. (Maturity Value $516,667) | | | | | | | | |
Merrill Lynch Government Securities Inc. (Maturity Value $776,031) | | | | | | | | |
Morgan Stanley & Co. Inc. (Maturity Value $759,542) | | | | | | | | |
UBS Securities LLC (Maturity Value $776,031) | | | | | | | | |
Collateralized by U.S. Government Agency Securities, 1.875% - 7.25%, 2/15/06 - 11/15/10; jU.S. Government Agency Discount Notes, 1/09/06 - 1/27/06; and U.S. Treasury Notes, 2.375 - 5.75%, 8/15/06 - 8/15/10 | | | | | | | | |
| | | | | | | |
|
|
Total Investments (Cost $230,210,762) 98.5% | | | | | | | | 223,808,612 |
Other Assets, less Liabilities 1.5% | | | | | | | | 3,417,859 |
| | | | | | | |
|
|
Net Assets 100.0% | | | | | | | $ | 227,226,471 |
| | | | | | | |
|
|
Selected Portfolio Abbreviations
FRN - Floating Rate Note
aSecurity was purchased pursuant to Rule 144A under the Securities Act of 1933 and may be sold in transactions exempt from registration only to qualified institutional buyers or in a public offering registered under the Securities Act of 1933. These securities have been deemed liquid under the guidelines approved by the Trust’s Board of Trustees. At December 31, 2005, the value of these securities was $48,079,500, representing 21.16% of net assets.
bSee Note 7 regarding defaulted securities.
cThe principal amount is stated in U.S. dollars unless otherwise indicated.
dSee Note 8 regarding restricted and illiquid securities.
eSee Note 9 regarding other considerations.
fNon-income producing.
gThe coupon rate shown represents the rate at period end.
hRounds to less than 0.05% of net assets.
iSee Note 1(c) regarding joint repurchase agreement.
jA portion or all of the security is traded on a discount basis with no stated coupon rate.
See notes to financial statements.
FH-12
Franklin Templeton Variable Insurance Products Trust
Financial Statements
Statement of Assets and Liabilities
December 31, 2005
| | | | |
| | | Franklin High
Income Fund
| |
Assets: | | | | |
Investments in securities: | | | | |
Cost - Unaffiliated issuers | | $ | 221,970,177 | |
Cost - Repurchase agreements | | | 8,240,585 | |
| | |
|
|
|
Total cost of investments | | $ | 230,210,762 | |
| | |
|
|
|
Value - Unaffiliated issuers | | $ | 215,568,027 | |
Value - Repurchase agreements | | | 8,240,585 | |
| | |
|
|
|
Total value of investments | | | 223,808,612 | |
Receivables: | | | | |
Capital shares sold | | | 54,951 | |
Interest | | | 4,007,582 | |
| | |
|
|
|
Total assets | | | 227,871,145 | |
| | |
|
|
|
Liabilities: | | | | |
Payables: | | | | |
Capital shares redeemed | | | 164,230 | |
Affiliates | | | 161,814 | |
Deferred sale proceeds (Note 9) | | | 291,090 | |
Accrued expenses and other liabilities | | | 27,540 | |
| | |
|
|
|
Total liabilities | | | 644,674 | |
| | |
|
|
|
Net assets, at value | | $ | 227,226,471 | |
| | |
|
|
|
Net assets consist of: | | | | |
Paid-in capital | | $ | 350,564,146 | |
Undistributed net investment income | | | 13,279,807 | |
Net unrealized appreciation (depreciation) | | | (6,402,150 | ) |
Accumulated net realized gain (loss) | | | (130,215,332 | ) |
| | |
|
|
|
Net assets, at value | | $ | 227,226,471 | |
| | |
|
|
|
Class 1: | | | | |
Net assets, at value | | $ | 87,813,580 | |
| | |
|
|
|
Shares outstanding | | | 12,877,028 | |
| | |
|
|
|
Net asset value and offering price per share | | $ | 6.82 | |
| | |
|
|
|
Class 2: | | | | |
Net assets, at value | | $ | 139,412,891 | |
| | |
|
|
|
Shares outstanding | | | 20,762,434 | |
| | |
|
|
|
Net asset value and offering price per share | | $ | 6.71 | |
| | |
|
|
|
See notes to financial statements.
FH-13
Franklin Templeton Variable Insurance Products Trust
Financial Statements (continued)
Statement of Operations
for the year ended December 31, 2005
| | | | |
| | | Franklin High
Income
Fund
| |
Investment Income: | | | | |
Dividends | | $ | 55,425 | |
Interest | | | 16,902,081 | |
| | |
|
|
|
Total investment income | | | 16,957,506 | |
| | |
|
|
|
Expenses: | | | | |
Management fees (Note 3a) | | | 1,246,444 | |
Distribution fees - Class 2 (Note 3c) | | | 320,503 | |
Unaffiliated transfer agent fees | | | 1,101 | |
Custodian fees (Note 4) | | | 5,493 | |
Reports to shareholders | | | 53,999 | |
Professional fees | | | 22,350 | |
Trustees’ fees and expenses | | | 1,221 | |
Other | | | 12,814 | |
| | |
|
|
|
Total expenses | | | 1,663,925 | |
Expense reductions (Note 4) | | | (273 | ) |
| | |
|
|
|
Net expenses | | | 1,663,652 | |
| | |
|
|
|
Net investment income | | | 15,293,854 | |
| | |
|
|
|
Realized and unrealized gains (losses): | | | | |
Net realized gain (loss) from: | | | | |
Investments | | | (6,300,290 | ) |
Foreign currency transactions | | | (10 | ) |
| | |
|
|
|
Net realized gain (loss) | | | (6,300,300 | ) |
| | |
|
|
|
Net change in unrealized appreciation (depreciation) on investments | | | (999,764 | ) |
| | |
|
|
|
Net realized and unrealized gain (loss) | | | (7,300,064 | ) |
| | |
|
|
|
Net increase (decrease) in net assets resulting from operations | | $ | 7,993,790 | |
| | |
|
|
|
See notes to financial statements.
FH-14
Franklin Templeton Variable Insurance Products Trust
Financial Statements (continued)
Statements of Changes in Net Assets
| | | | | | | | |
| | | Franklin High
Income Fund
| |
| | | Year Ended December 31,
| |
| | | 2005
| | | 2004
| |
Increase (decrease) in net assets: | | | | | | | | |
Operations: | | | | | | | | |
Net investment income | | $ | 15,293,854 | | | $ | 13,578,645 | |
Net realized gain (loss) from investments and foreign currency transactions | | | (6,300,300 | ) | | | (9,175,443 | ) |
Net change in unrealized appreciation (depreciation) on investments | | | (999,764 | ) | | | 14,134,775 | |
| | |
| |
Net increase (decrease) in net assets resulting from operations | | | 7,993,790 | | | | 18,537,977 | |
| | |
| |
Distributions to shareholders from: | | | | | | | | |
Net investment income: | | | | | | | | |
Class 1 | | | (5,777,829 | ) | | | (7,299,767 | ) |
Class 2 | | | (7,687,760 | ) | | | (4,002,774 | ) |
| | |
| |
Total distributions to shareholders | | | (13,465,589 | ) | | | (11,302,541 | ) |
| | |
| |
Capital share transactions: (Note 2) | | | | | | | | |
Class 1 | | | (19,370,691 | ) | | | (30,236,750 | ) |
Class 2 | | | 19,921,472 | | | | 60,249,257 | |
| | |
| |
Total capital share transactions | | | 550,781 | | | | 30,012,507 | |
| | |
| |
Net increase (decrease) in net assets | | | (4,921,018 | ) | | | 37,247,943 | |
Net assets: | | | | | | | | |
Beginning of year | | | 232,147,489 | | | | 194,899,546 | |
| | |
| |
End of year | | $ | 227,226,471 | | | $ | 232,147,489 | |
| | |
| |
Undistributed net investment income included in net assets: | | | | | | | | |
End of year | | $ | 13,279,807 | | | $ | 11,254,148 | |
| | |
| |
See notes to financial statements.
FH-15
Franklin Templeton Variable Insurance Products Trust
Notes to Financial Statements
Franklin High Income Fund
1. ORGANIZATION AND SIGNIFICANT ACCOUNTING POLICIES
Franklin Templeton Variable Insurance Products Trust (the Trust) is registered under the Investment Company Act of 1940 as an open-end investment company, consisting of twenty-two separate series. The Franklin High Income Fund (the Fund) included in this report is diversified. The financial statements of the remaining funds in the series are presented separately. Shares of the Fund are sold only to insurance company separate accounts to fund the benefits of variable life insurance policies or variable annuity contracts. As of December 31, 2005, 94.22% of the Fund’s shares were sold through one insurance company.
The following summarizes the Fund’s significant accounting policies.
a. Security Valuation
Securities listed on a securities exchange or on the NASDAQ National Market System are valued at the last quoted sale price or the official closing price of the day, respectively. Over-the-counter securities and listed securities for which there is no reported sale are valued within the range of the most recent quoted bid and ask prices. Securities that trade in multiple markets or on multiple exchanges are valued according to the broadest and most representative market.
Corporate debt securities generally trade in the over-the-counter market rather than on a securities exchange. The Trust may utilize independent pricing services, quotations from bond dealers, and information with respect to bond and note transactions, to assist in determining a current market value for each security. The Trust’s pricing services may use valuation models or matrix pricing which considers information with respect to comparable bond and note transactions, quotations from bond dealers, or by reference to other securities that are considered comparable in such characteristics as rating, interest rate and maturity date, option adjusted spread models, prepayment projections, interest rate spreads and yield curves, to determine current value.
Foreign securities are valued as of the close of trading on the foreign stock exchange on which the security is primarily traded, or the NYSE, whichever is earlier. If no sale is reported at that time, the foreign security will be valued within the range of the most recent quoted bid and ask prices. The value is then converted into its U.S. dollar equivalent at the foreign exchange rate in effect at the close of the NYSE on the day that the value of the foreign security is determined.
The Trust has procedures to determine the fair value of individual securities and other assets for which market prices are not readily available or which may not be reliably priced. Methods for valuing these securities may include: fundamental analysis, matrix pricing, discounts from market prices of similar securities, or discounts applied due to the nature and duration of restrictions on the disposition of the securities. Due to the inherent uncertainty of valuations of such securities, the fair values may differ significantly from the values that would have been used had a ready market for such investments existed. Occasionally, events occur between the time at which trading in a security is completed and the close of the NYSE that might call into question the availability (including the reliability) of the value of a portfolio security held by the Fund. If such an event occurs, the securities may be valued using fair value procedures, which may include the use of independent pricing services. All security valuation procedures are approved by the Trust’s Board of Trustees.
b. Foreign Currency Translation
Portfolio securities and other assets and liabilities denominated in foreign currencies are translated into U.S. dollars based on the exchange rate of such currencies against U.S. dollars on the date of valuation. Purchases and sales of securities, income and expense items denominated in foreign currencies are translated into U.S. dollars at the exchange rate in effect on the transaction date. Occasionally, events may impact the availability or reliability of foreign exchange rates used to convert the U.S. dollar equivalent value. If such an event occurs, the foreign exchange rate will be valued at fair value using procedures established and approved by the Trust’s Board of Trustees.
FH-16
Franklin Templeton Variable Insurance Products Trust
Notes to Financial Statements (continued)
Franklin High Income Fund
1. ORGANIZATION AND SIGNIFICANT ACCOUNTING POLICIES (continued)
b. Foreign Currency Translation (continued)
The Fund does not separately report the effect of changes in foreign exchange rates from changes in market prices on securities held. Such changes are included in net realized and unrealized gain or loss from investments on the Statement of Operations.
Realized foreign exchange gains or losses arise from sales of foreign currencies, currency gains or losses realized between the trade and settlement dates on securities transactions and the difference between the recorded amounts of dividends, interest, and foreign withholding taxes and the U.S. dollar equivalent of the amounts actually received or paid. Net unrealized foreign exchange gains and losses arise from changes in foreign exchange rates on foreign denominated assets and liabilities other than investments in securities held at the end of the reporting period.
c. Joint Repurchase Agreement
The Fund may enter into a joint repurchase agreement whereby its uninvested cash balance is deposited into a joint cash account with other funds managed by the investment manager or an affiliate of the investment manager and is used to invest in one or more repurchase agreements. The value and face amount of the joint repurchase agreement are allocated to the funds based on their pro-rata interest. A repurchase agreement is accounted for as a loan by the Fund to the seller, collateralized by securities which are delivered to the Fund’s custodian. The market value, including accrued interest, of the initial collateralization is required to be at least 102% of the dollar amount invested by the Funds, with the value of the underlying securities marked to market daily to maintain coverage of at least 100%. Repurchase agreements are valued at cost. At December 31, 2005, all repurchase agreements held by the Fund had been entered into on December 30, 2005.
d. Foreign Currency Contracts
When the Fund purchases or sells foreign securities it may enter into foreign exchange contracts to minimize foreign exchange risk from the trade date to the settlement date of the transactions. A foreign exchange contract is an agreement between two parties to exchange different currencies at an agreed upon exchange rate on a specified date. Realized and unrealized gains and losses on these contracts are included in the Statement of Operations.
The risks of these contracts include movement in the values of the foreign currencies relative to the U.S. dollar and the possible inability of the counterparties to fulfill their obligations under the contracts, which may be in excess of the amount reflected in the Statement of Assets and Liabilities.
e. Income Taxes
No provision has been made for U.S. income taxes because the Fund’s policy is to continue to qualify as a regulated investment company under the Internal Revenue Code and to distribute to shareholders substantially all of its taxable income and net realized gains.
f. Security Transactions, Investment Income, Expenses and Distributions
Security transactions are accounted for on trade date. Realized gains and losses on security transactions are determined on a specific identification basis. Interest income and estimated expenses are accrued daily. Amortization of premium and accretion of discount on debt securities are included in interest income. Dividend income is recorded on the ex-dividend date except that certain dividends from foreign securities are recognized as soon as the Fund is notified of the ex-dividend date. Distributions to shareholders are recorded on the ex-dividend date and are determined according to income tax regulations (tax basis). Such distributions are reinvested in additional shares of the Fund. Distributable earnings determined on a tax basis may differ from earnings recorded in accordance with generally accepted accounting principles. These differences may be permanent or temporary. Permanent differences are reclassified among capital accounts to reflect their tax character. These reclassifications
FH-17
Franklin Templeton Variable Insurance Products Trust
Notes to Financial Statements (continued)
Franklin High Income Fund
1. ORGANIZATION AND SIGNIFICANT ACCOUNTING POLICIES (continued)
f. Security Transactions, Investment Income, Expenses and Distributions (continued)
have no impact on net assets or the results of operations. Temporary differences are not reclassified, as they may reverse in subsequent periods.
Common expenses incurred by the Trust are allocated among the funds based on the ratio of net assets of each fund to the combined net assets of the Trust. Fund specific expenses are charged directly to the fund that incurred the expense.
Realized and unrealized gains and losses and net investment income, other than class specific expenses, are allocated daily to each class of shares based upon the relative proportion of net assets of each class.
g. Accounting Estimates
The preparation of financial statements in accordance with accounting principles generally accepted in the United States of America requires management to make estimates and assumptions that affect the reported amounts of assets and liabilities at the date of the financial statements and the amounts of income and expenses during the reporting period. Actual results could differ from those estimates.
h. Guarantees and Indemnifications
Under the Trust’s organizational documents, its officers and trustees are indemnified by the Trust against certain liabilities arising out of the performance of their duties to the Trust. Additionally, in the normal course of business, the Trust enters into contracts with service providers that contain general indemnification clauses. The Trust’s maximum exposure under these arrangements is unknown as this would involve future claims that may be made against the Trust that have not yet occurred. However, based on experience, the Trust expects the risk of loss to be remote.
2. SHARES OF BENEFICIAL INTEREST
The Fund offers two classes of shares: Class 1 and Class 2. Each class of shares differs by its distribution fees, voting rights on matters affecting a single class and its exchange privilege.
At December 31, 2005, there were an unlimited amount of shares authorized ($0.01 par value). Transactions in the Fund’s shares were as follows:
| | | | | | | | | | | | | | |
| | | Year Ended December 31,
| |
| | | 2005
| | | 2004
| |
| Class 1 Shares: | | Shares
| | | Amount
| | | Shares
| | | Amount
| |
Shares sold | | 2,210,590 | | | $ | 15,049,406 | | | 5,050,244 | | | $ | 34,436,752 | |
Shares issued in reinvestment of distributions | | 875,428 | | | | 5,777,829 | | | 1,149,570 | | | | 7,299,767 | |
Shares redeemed | | (5,875,701 | ) | | | (40,197,926 | ) | | (10,531,991 | ) | | | (71,973,269 | ) |
| | |
| |
Net increase (decrease) | | (2,789,683 | ) | | $ | (19,370,691 | ) | | (4,332,177 | ) | | $ | (30,236,750 | ) |
| | |
| |
| Class 2 Shares: | | | | | | | | | | | | |
Shares sold | | 11,482,203 | | | $ | 77,747,143 | | | 17,073,978 | | | $ | 113,972,411 | |
Shares issued in reinvestment of distributions | | 1,180,916 | | | | 7,687,760 | | | 637,384 | | | | 4,002,774 | |
Shares redeemed | | (9,666,289 | ) | | | (65,513,431 | ) | | (8,658,975 | ) | | | (57,725,928 | ) |
| | |
| |
Net increase (decrease) | | 2,996,830 | | | $ | 19,921,472 | | | 9,052,387 | | | $ | 60,249,257 | |
| | |
| |
FH-18
Franklin Templeton Variable Insurance Products Trust
Notes to Financial Statements (continued)
Franklin High Income Fund
3. TRANSACTIONS WITH AFFILIATES
Franklin Resources, Inc. is the holding company for various subsidiaries that together are referred to as Franklin Templeton Investments. Certain officers and trustees of the Trust are also officers and/or directors of the following subsidiaries:
| | |
| Subsidiary | | Affiliation |
Franklin Advisers, Inc. (Advisers) | | Investment manager |
Franklin Templeton Services, LLC (FT Services) | | Admistrative manager |
Franklin Templeton Distributors, Inc. (Distributors) | | Principal underwriter |
Franklin Templeton Investor Services, LLC (Investor Services) | | Transfer agent |
a. Management Fees
The Fund pays an investment management fee to Advisers based on the average daily net assets of the Fund as follows:
| | |
| Annualized Fee Rate | | Net Assets |
| 0.625% | | Up to and including $100 million |
| 0.500% | | Over $100 million, up to and including $250 million |
| 0.450% | | Over $250 million, up to and including $10 billion |
| 0.440% | | Over $10 billion, up to and including $12.5 billion |
| 0.420% | | Over $12.5 billion, up to and including $15 billion |
| 0.400% | | In excess of $15 billion |
b. Administrative Fees
Under an agreement with Advisers, FT Services provides administrative services to the Fund. The fee is paid by Advisers based on average daily net assets of the Fund, and is not an additional expense of the Fund.
c. Distribution Fees
The Fund’s Board of Trustees has adopted distribution plans for Class 2 shares pursuant to Rule 12b-1 under the 1940 Act. Under the Fund’s compensation distribution plans, the Fund pays Distributors for costs incurred in connection with the sale and distribution of the Fund’s shares up to 0.35% per year of its average daily net assets. The Board of Trustees has set the current rate at 0.25% per year.
d. Transfer Agent Fees
Investor Services, under terms of an agreement, performs shareholder servicing for the Fund and is not paid by the Fund for the services.
4. EXPENSE OFFSET ARRANGEMENT
The Fund has entered into an arrangement with its custodian whereby credits realized as a result of uninvested cash balances are used to reduce a portion of the Fund’s custodian expenses. During the year ended December 31, 2005, the custodian fees were reduced as noted in the Statement of Operations.
FH-19
Franklin Templeton Variable Insurance Products Trust
Notes to Financial Statements (continued)
Franklin High Income Fund
5. INCOME TAXES
At December 31, 2005, the Fund had tax basis capital losses which may be carried over to offset future capital gains, if any. At December 31, 2005, the capital loss carryforwards were as follows:
| | | |
Capital loss carryforwards expiring in: | | | |
| |
2007 | | $ | 2,294,320 |
2008 | | | 26,944,467 |
2009 | | | 14,152,532 |
2010 | | | 46,366,314 |
2011 | | | 24,711,916 |
2012 | | | 9,009,590 |
2013 | | | 6,321,190 |
| | |
|
| | | $ | 129,800,329 |
| | |
|
For tax purposes, realized capital losses occurring subsequent to October 31, may be deferred and treated as occurring on the first day of the following fiscal year. At December 31, 2005, the Fund deferred realized capital losses of $389,892.
The tax character of distributions paid during the years ended December 31, 2005 and 2004, was as follows:
| | | | | | |
| | | 2005
| | 2004
|
Distributions paid from ordinary income | | $ | 13,465,589 | | $ | 11,302,541 |
| | |
| |
|
At December 31, 2005, the cost of investments, net unrealized appreciation (depreciation), and undistributed ordinary income for income tax purposes were as follows:
| | | | |
Cost of investments | | $ | 231,108,506 | |
| | |
| |
| |
Unrealized appreciation | | $ | 5,633,820 | |
Unrealized depreciation | | | (12,933,714 | ) |
| | |
| |
Net unrealized appreciation (depreciation) | | $ | (7,299,894 | ) |
| | |
| |
Distributable earnings-undistributed ordinary income | | $ | 14,384,128 | |
| | |
| |
Net investment income differs for financial statement and tax purposes primarily due to differing treatments of defaulted securities, foreign currency transactions, and bond discounts and premiums.
Net realized gains (losses) differ for financial statement and tax purposes primarily due to differing treatments of wash sales, defaulted securities, foreign currency transactions, and bond discounts and premiums.
6. INVESTMENT TRANSACTIONS
Purchases and sales of investments (excluding short term securities) for the year ended December 31, 2005, aggregated $108,822,489 and $101,215,497, respectively.
7. CREDIT RISK AND DEFAULTED SECURITIES
The Fund has 95.37% of its portfolio invested in below investment grade and comparable quality unrated high yield securities, which tend to be more sensitive to economic conditions than higher rated securities. The risk of loss due to default by the issuer may be significantly greater for the holders of high yielding securities because such securities are generally unsecured and are often subordinated to other creditors of the issuer.
FH-20
Franklin Templeton Variable Insurance Products Trust
Notes to Financial Statements (continued)
Franklin High Income Fund
7. CREDIT RISK AND DEFAULTED SECURITIES (continued)
The Fund held defaulted securities and/or other securities for which the income has been deemed uncollectible. At December 31, 2005, the value of these securities was $2,892,825, representing 1.27% of the Fund’s net assets. The Fund discontinues accruing income on securities for which income has been deemed uncollectible and provides an estimate for losses on interest receivable. The securities have been identified on the accompanying Statement of Investments.
8. RESTRICTED AND ILLIQUID SECURITIES
At December 31, 2005, investments in securities included issues that are restricted and illiquid. Restricted securities are often purchased in private placement transactions, and cannot be sold without prior registration under the Securities Act of 1933, unless the sale is pursuant to an exemption under the 1933 Act. The Fund has registration rights for certain restricted securities held at period end. The issuer generally incurs all registration costs.
A security may be considered illiquid if it lacks a readily available market or if its valuation has not changed for a certain period of time. At December 31, 2005, the Fund held investments in restricted and illiquid securities, valued in accordance with procedures approved by the Trust’s Board of Trustees as reflecting fair value, as follows:
| | | | | | | | | | |
Principal
Amount/Shares | | Issuer | | Acquisition
Date | | Cost | | Value |
| 4,500,000 | | Asia Pulp & Paper Co. Ltd., 12.00%, pfd., Perpetual | | 2/21/97 | | $ | 4,500,000 | | $ | 49,050 |
| 44,604 | | aGoss Holdings Inc., B | | 11/17/99 | | | 89,208 | | | — |
| 296,174 | | Tjiwi Kimia Finance Mauritius, secured note, 144A, FRN, 5.248%, 4/29/15 | | 4/29/05 | | | 90,274 | | | 87,431 |
| 762,312 | | Tjiwi Kimia Finance Mauritius, secured note, 144A, FRN, 5.248%, 4/29/18 | | 4/29/05 | | | 232,353 | | | 225,034 |
| 981,799 | | Tjiwi Kimia Finance Mauritius, secured note, 144A, zero cpn., 4/29/25 | | 4/29/05 | | | 299,252 | | | 289,827 |
| | | | | | | | | |
|
|
| | | Total Restricted and Illiquid Securities (0.29% of Net Assets) | | | | | | | $ | 651,342 |
| | | | | | | | | |
|
|
| aThe | Fund also invests in unrestricted securities of the issuer, valued at $0 as of December 31, 2005. |
9. OTHER CONSIDERATIONS
Subject to certain terms and conditions, the Fund has agreed to sell its holdings in Asia Pulp & Paper Co. Ltd. and Tjiwi Kimia Finance Mauritius in November 2006. Until completion of the sale, the transaction is being accounted for as a secured borrowing with a pledge of collateral and any preliminary sales proceeds or other interest and cash distributions received are deferred until the completion of the transaction and are recorded as part of the net sales proceeds.
Directors or employees of Advisers, as the Fund’s Investment Manager, may serve as members of various bondholders’ steering committees, on credit committees, or may represent the Funds in certain corporate restructuring negotiations. At January 6, 2006, such individuals serve in one or more of these capacities for Calpine Corp. As a result of this involvement, such individuals may be in possession of certain material non-public information. If the Fund’s Investment Manager, while in possession of such information, seeks to sell any of its holdings in these securities it will comply with all applicable federal securities laws.
10. REGULATORY MATTERS
As part of various investigations by a number of federal, state, and foreign regulators and governmental entities, relating to certain practices in the mutual fund industry, including late trading, market timing and marketing support payments to securities dealers who sell fund shares, Franklin Resources, Inc. and certain of its subsidiaries (collectively, the “Company”), entered into settlements with certain of those regulators.
FH-21
Franklin Templeton Variable Insurance Products Trust
Notes to Financial Statements (continued)
Franklin High Income Fund
10. REGULATORY MATTERS (continued)
Specifically, the Company entered into settlements with the Securities and Exchange Commission (“SEC”) concerning market timing (the “August 2, 2004 SEC Order”) and marketing support payments to securities dealers who sell fund shares (the “December 13, 2004 SEC Order”) and with the California Attorney General’s Office (“CAGO”) concerning marketing support payments to securities dealers who sell fund shares (the “CAGO Settlement”). Under the terms of the settlements with the SEC and the CAGO, the Company retained an Independent Distribution Consultant (“IDC”) to develop a plan for distribution of the respective settlement monies. The CAGO approved the distribution plan under the CAGO Settlement and, in accordance with the terms and conditions of that settlement, the monies were disbursed to the relevant funds. The SEC has not yet approved the distribution plan pertaining to the December 13, 2004 SEC Order. When approved, disbursements of settlement monies will be made promptly to the relevant funds, in accordance with the terms and conditions of that order. The IDC continues to develop the plan of distribution under the August 2, 2004 SEC Order that resolved the SEC’s market timing investigation.
In addition, the Company, as well as most of the mutual funds within Franklin Templeton Investments and certain current or former officers, directors, and/or employees, have been named in private lawsuits (styled as shareholder class actions, or as derivative actions on behalf of either the named funds or Franklin Resources, Inc.) relating to the industry practices referenced above, as well as to allegedly excessive advisory fees, commissions, and/or 12b-1 fees. The lawsuits were filed in different courts throughout the country. Many of those suits are now pending in a multi-district litigation in the United States District Court for the District of Maryland.
The Company and fund management strongly believe that the claims made in each of the private lawsuits referenced above are without merit and intend to defend against them vigorously. The Company cannot predict with certainty the eventual outcome of these lawsuits, nor whether they will have a material negative impact on the Company. If it is determined that the Company bears responsibility for any unlawful or inappropriate conduct that caused losses to the Trust, it is committed to making the Trust or their shareholders whole, as appropriate.
FH-22
Franklin Templeton Variable Insurance Products Trust
Franklin High Income Fund
Report of Independent Registered Public Accounting Firm
To the Board of Trustees and Shareholders of
Franklin Templeton Variable Insurance Products Trust
In our opinion, the accompanying statement of assets and liabilities, including the statement of investments, and the related statements of operations and of changes in net assets and the financial highlights present fairly, in all material respects, the financial position of Franklin High Income Fund (one of the funds constituting Franklin Templeton Variable Insurance Products Trust, hereafter referred to as the “Fund”) at December 31, 2005, the results of its operations for the year then ended, the changes in its net assets for each of the two years in the period then ended and the financial highlights for each of the five years in the period then ended, in conformity with accounting principles generally accepted in the United States of America. These financial statements and financial highlights (hereafter referred to as “financial statements”) are the responsibility of the Fund’s management; our responsibility is to express an opinion on these financial statements based on our audits. We conducted our audits of these financial statements in accordance with the standards of the Public Company Accounting Oversight Board (United States). Those standards require that we plan and perform the audit to obtain reasonable assurance about whether the financial statements are free of material misstatement. An audit includes examining, on a test basis, evidence supporting the amounts and disclosures in the financial statements, assessing the accounting principles used and significant estimates made by management, and evaluating the overall financial statement presentation. We believe that our audits, which included confirmation of securities at December 31, 2005, by correspondence with the custodian, provide a reasonable basis for our opinion.
PricewaterhouseCoopers LLP
San Francisco, California
February 10, 2006
FH-23
FRANKLIN INCOME SECURITIES FUND
This annual report for Franklin Income Securities Fund covers the fiscal year ended December 31, 2005.
Performance Summary as of 12/31/05
Average annual total return of Class 1 shares represents the average annual change in value, assuming reinvestment of dividends and capital gains. Average returns smooth out variations in returns, which can be significant; they are not the same as year-by-year results.
Periods ended 12/31/05
| | | | | | |
| | | 1-Year | | 5-Year | | 10-Year |
Average Annual Total Return | | +1.83% | | +9.08% | | +9.17% |
Total Return Index Comparison
for Hypothetical $10,000 Investment (1/1/96–12/31/05)
The graph below shows the change in value of a hypothetical $10,000 investment in the Fund over the indicated period and includes reinvestment of any income or distributions. The Fund’s performance is compared to the performance of the Standard & Poor’s 500 Index (S&P 500), the Lehman Brothers (LB) U.S. Aggregate Index and the Lipper VIP Income Funds Classification Average. One cannot invest directly in an index, nor is an index representative of the Fund’s portfolio. Please see Important Notes to Performance Information preceding the Fund Summaries.
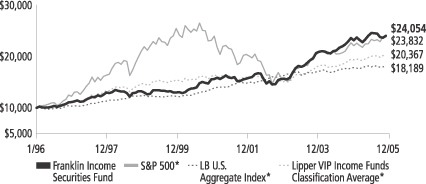
*Sources: Standard & Poor’s Micropal; Lipper Inc. Please see Index Descriptions following the Fund Summaries.
Franklin Income Securities Fund – Class 1
Performance reflects the Fund’s Class 1 operating expenses, but does not include any contract fees, expenses or sales charges. If they had been included, performance would be lower. These charges and deductions, particularly for variable life policies, can have a significant effect on contract values and insurance benefits. See the contract prospectus for a complete description of these expenses, including sales charges.
Performance data represent past performance, which does not guarantee future results. Investment return and principal value will fluctuate, and you may have a gain or loss when you sell your shares.
Current performance may differ from figures shown.
FI-1
Fund Goal and Main Investments: Franklin Income Securities Fund seeks to maximize income while maintaining prospects for capital appreciation. The Fund normally invests in both equity and debt securities. The Fund seeks income by investing in stocks with dividend yields the manager believes are attractive, and corporate, foreign and U.S. Treasury bonds, including high yield, lower quality bonds.
Performance Overview
You can find the Fund’s one-year total return in the Performance Summary. Compared with its benchmarks for the same period, the Fund underperformed the S&P 500, the LB U.S. Aggregate Index and the Lipper VIP Income Funds Classification Average, which had total returns of +4.91%, +2.43% and +4.13%, respectively.1
Economic and Market Overview
During the 12 months ended December 31, 2005, U.S. economic expansion was driven by strength across most industries, sectors and regions. Gross domestic product (GDP) rose during the period, benefiting from increased personal consumption, federal spending and business investment, which increased 24% in third quarter 2005 compared with the same quarter in 2004.2 Slower export growth combined with greater demand for imported goods and materials fueled a widening trade gap. The U.S. dollar rallied in 2005, supported by rising short-term domestic interest rates and strong economic growth in the U.S. relative to many of its major trading partners.
Many businesses enjoyed record profits, propelled largely by productivity gains. Earnings for companies in the S&P 500 were estimated to have increased 13% in 2005.3 The labor market firmed as employment increased and the unemployment rate dropped from 5.4% to 4.9% during the reporting period. Personal income rose, and hiring rebounded in many industries, bolstered by healthy business spending.
Oil prices remained high during the period largely due to potential long-term supply limitations and strong growth in global demand, especially from China and India. Natural gas prices rose during the
1. Sources: Standard & Poor’s Micropal; Lipper Inc. One cannot invest directly in an index, nor is an index representative of the Fund’s portfolio. Please see Index Descriptions following the Fund Summaries.
2. Source: Thomson Financial. Based on companies in the S&P 500.
3. Source: Standard & Poor’s.
Fund Risks: Because the Fund invests in bonds and other debt obligations, the Fund’s share price and yield will be affected by interest rate movements. Bond prices generally move in the opposite direction from interest rates. Thus, as the prices of bonds in the Fund adjust to a rise in interest rates, the Fund’s share price may decline. High yield, lower-rated (junk) bonds generally have greater price swings and higher default risks. Stocks offer the potential for long-term gains but can be subject to short-term up-and-down price movements. Foreign investing, especially in emerging markets, involves additional risks including currency fluctuations, economic instability, and social and political developments. The Fund’s prospectus also includes a description of the main investment risks.
FI-2
second half of 2005 mainly because of expected rising demand with the onset of winter; however, near period-end prices retreated somewhat amid milder-than-expected weather conditions. Even with high commodity prices, inflation remained relatively contained for the 12 months ended December 31, 2005, as measured by the 2.2% rise for the core Consumer Price Index (CPI).4
Despite this inflation picture, the Federal Reserve Board raised the federal funds target rate from 2.25% to 4.25%. Compared with the rise in short-term interest rates, long-term rates remained relatively stable, supporting overall robust housing and commercial real estate activity, which contributed to economic growth. Throughout 2005, as short- and intermediate-term interest rates rose, the yield curve moved from a fairly normal steepness at the beginning of the period to relatively flat by the end of 2005.
In this environment, the blue chip stocks of the Dow Jones Industrial Average posted a one-year total return of +1.72%, while the broader S&P 500 and the technology-heavy NASDAQ Composite Index returned +4.91% and +2.12%.5
Investment Strategy
We search for undervalued or out-of-favor securities we believe offer opportunities for income today and growth tomorrow. We generally perform independent analysis of the debt securities being considered for the Fund’s portfolio, rather than relying principally on ratings assigned by rating agencies. In analyzing debt and equity securities, we consider a variety of factors, including: a security’s relative value based on such factors as anticipated cash flow, interest or dividend coverage, asset coverage, and earnings prospects; the experience and strength of a company’s management; a company’s sensitivity to changes in interest rates and business conditions; a company’s debt maturity schedules and borrowing requirements; and a company’s changing financial condition and market recognition of the change.
4. Source: Bureau of Labor Statistics. Core CPI excludes food and energy costs.
5. Source: Standard & Poor’s Micropal. Please see Index Descriptions following the Fund Summaries.
What is the yield curve?
The yield curve is a graph illustrating the yields on bonds of the same credit quality with maturities ranging from the shortest to the longest available. The resulting curve shows if short-term interest rates are higher or lower than longer-term rates.
FI-3
Manager’s Discussion
During the fiscal year under review, interest rates remained generally low and we continued to emphasize opportunities in high-dividend paying common stocks, convertible securities and corporate bonds, both investment grade and non-investment grade. However, a gradual rise in interest rates and upward pressure on credit spreads offset improving company fundamentals, stable financial markets and the continued low interest rate environment, thus muting corporate bond sector returns and causing valuations to mildly deteriorate. The yield for the benchmark 10-year U.S. Treasury increased from 4.24% at the beginning of the period to 4.39% at the end of the year. The spread between U.S. Treasury securities and non-investment grade corporate bonds, as represented by the LB U.S. High Yield Index, increased during the year from 3.18 percentage points to 3.85 percentage points.4
Despite the challenges of higher interest rates and widening credit spreads, we added to and initiated new positions in several companies including Allied Waste North America, Cablevision Systems, DaVita, Ford Motor Credit Company, GMAC, and Tenet Healthcare. Consistent with our strategy, we took profits in securities that appreciated and that, in our opinion, no longer offered current yield and longer-term upside appreciation. Corporate bonds sold included Allegheny Energy Supply, Edison Mission Energy, Electronic Data Systems, Equistar Chemicals, Lyondell Chemical, and Pacific Gas & Electric. Government and government agency securities continued to play a lesser role in the portfolio relative to the recent past (2001-2002) as we felt concerns of increased inflationary pressures and subsequent higher interest rates posed greater risk to the potential for attractive total return from these securities. At the end of the reporting period, government and government agency securities comprised just 3.9% of the Fund’s total net assets.
4. Source: Lehman Brothers Inc. Please see Index Descriptions following the Fund Summaries.
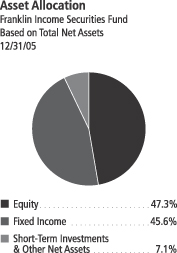
FI-4
During the past year, global energy prices were broadly supported by a combination of factors including solid economic growth in the U.S. and abroad, geopolitical turmoil in several major oil and natural gas producing regions, and weather-related disruptions to production. If these trends persist in conjunction with the industry’s continued dilemma of replacing depleted reserves, we believe the pricing environment for oil and related products should remain above historical averages. Portfolio positions in integrated oil companies that may benefit from this environment include Chevron, BP, Royal Dutch Shell and Canadian Oil Sands Trust. During the period, we added shares of Chesapeake Energy convertible preferred stock to the portfolio. Chesapeake is a leading producer of natural gas in North America with primary operations onshore. Its stock appreciated in value as natural gas prices surged due in part to supply fears following significant damage to the offshore infrastructure in the Gulf of Mexico.
During the year, electric utilities was one of the Fund’s top contributing sectors and was the largest sector weighting at period-end. We found electric utilities attractive due to our assessment of the sector’s appealing dividend yield and the stable earnings growth profiles of many regulated utility operations. Over the past several years, many electric utility companies adjusted their priorities and moved toward a back-to-basics operational philosophy, which has meant rebuilding core regulated businesses while reducing debt and repairing overstretched balance sheets. Recently, many electric utility companies found opportunities to invest in building additional infrastructure, further improving operational efficiency, and strengthening their environmental controls.
Another driving force behind the electric utilities sector’s remarkable performance over the past year has been its leverage to the commodity markets, in particular, natural gas. The amount and nature of exposure can vary tremendously between companies, but those that were able to generate low-cost power via coal or nuclear fuel, and sell that output in wholesale markets, generated significant gains. Pipeline and natural gas infrastructure utilities also benefited from greater asset utilization as well as from their ownership of natural gas production in most cases.
Over the past year, the Fund increased its electric utilities exposure by investing in companies that we believe provide commodity sensitivity and exposure to strong regulated utility franchises. Examples of such holdings include FirstEnergy and Dominion Resources.
Top Five Equity Holdings
Franklin Income Securities Fund 12/31/05
| | |
Company Sector/Industry | | % of Total
Net Assets |
| |
| Merck & Co. Inc. | | 2.9% |
| Health Technology | | |
| |
| Fannie Mae, 5.375% | | 2.2% |
| Finance, cvt. pfd. | | |
| |
| General Mills Inc. | | 2.1% |
| Consumer Non-Durables | | |
| |
| Pfizer Inc. | | 2.0% |
| Health Technology | | |
| |
| FirstEnergy Corp. | | 1.5% |
| Electric Utilities | | |
The dollar value, number of shares or principal amount, and names of all portfolio holdings are listed in the Fund’s Statement of Investments.
FI-5
The Fund had some detractors from performance. For example, many of the Fund’s health technology sector holdings negatively impacted Fund performance. In particular, shares of major pharmaceutical companies dragged on Fund performance. Despite the near-term challenges to existing products from generic manufacturers as well as overall pressures to keep control of health care costs including the possibility of legislation to boost drug importation, we continued to find the longer-term value compelling and the dividend yield attractive in the near term. Sector positions that suffered share price declines included Pfizer, Merck, Bristol Myers Squibb, Schering-Plough and Eli Lilly.
Several of the Fund’s fixed income investments also detracted from performance. For example, despite significant long-term asset value, independent power producer Calpine sought bankruptcy protection as its fundamental conditions did not improve quickly enough for the company to resolve its highly leveraged balance sheet. Although the default had a negative effect on Fund performance, the Fund’s investment loss from Calpine senior unsecured and convertible senior unsecured notes was partially offset by strength in second priority lien secured notes.
Thank you for your participation in Franklin Income Securities Fund. We look forward to serving your future investment needs.
The foregoing information reflects our analysis, opinions and portfolio holdings as of December 31, 2005, the end of the reporting period. The way we implement our main investment strategies and the resulting portfolio holdings may change depending on factors such as market and economic conditions. These opinions may not be relied upon as investment advice or an offer for a particular security. The information is not a complete analysis of every aspect of any market, country, industry, security or the Fund. Statements of fact are from sources considered reliable, but the adviser makes no representation or warranty as to their completeness or accuracy. Although historical performance is no guarantee of future results, these insights may help you understand our investment management philosophy.
Top Five Bond Holdings*
Franklin Income Securities Fund 12/31/05
| | |
Issuer Sector/Industry | | % of Total Net Assets |
| |
| General Motors Acceptance Corp. | | 3.5% |
| Consumer Durables | | |
| |
| Tenet Healthcare Corp. | | 3.1% |
| Health Services | | |
| |
| CCH I LLC | | 3.0% |
| Consumer Services | | |
| |
| Dynergy Holdings Inc. | | 2.1% |
| Gas Distributors | | |
| |
| Qwest | | 2.1% |
| Communications | | |
*Does not include convertible bonds.
FI-6
Fund Expenses
As an investor in a variable insurance contract (“Contract”) that indirectly provides for investment in an underlying mutual fund, you can incur transaction and/or ongoing expenses at both the Fund level and the Contract level.
| • | | Transaction expenses can include sales charges (loads) on purchases, redemption fees, surrender fees, transfer fees and premium taxes. |
| • | | Ongoing expenses can include management fees, distribution and service (12b-1) fees, contract fees, annual maintenance fees, mortality and expense risk fees and other fees and expenses. All mutual funds and Contracts have some types of ongoing expenses. |
The expenses shown in the table below are meant to highlight ongoing expenses at the Fund level only and do not include ongoing expenses at the Contract level, or transaction expenses at either the Fund or Contract level. While the Fund does not have transaction expenses, if the transaction and ongoing expenses at the Contract level were included, the expenses shown below would be higher. You should consult your Contract prospectus or disclosure document for more information.
The table shows Fund-level ongoing expenses and can help you understand these expenses and compare them with those of other mutual funds offered through the Contract. The table assumes a $1,000 investment held for the six months indicated. Please refer to the Fund prospectus for additional information on operating expenses.
Actual Fund Expenses
The first line (Actual) of the table below provides actual account values and expenses. The “Ending Account Value” is derived from the Fund’s actual return, which includes the effect of ongoing Fund expenses, but does not include the effect of ongoing Contract expenses.
You can estimate the Fund-level expenses you incurred during the period by following these steps. Of course, your account value and expenses will differ from those in this illustration:
| 1. | Divide your account value by $1,000. |
If an account had an $8,600 value, then $8,600 ÷ $1,000 = 8.6.
| 2. | Multiply the result by the number under the heading “Fund-Level Expenses Incurred During Period.” |
If Fund-Level Expenses Incurred During Period were $7.50, then 8.6 × $7.50 = $64.50.
Franklin Income Securities Fund – Class 1
FI-7
In this illustration, the estimated expenses incurred this period at the Fund level are $64.50.
Hypothetical Example for Comparison with Other Mutual Funds
Information in the second line (Hypothetical) of the table can help you compare ongoing expenses of the Fund with those of other mutual funds offered through the Contract. This information may not be used to estimate the actual ending account balance or expenses you incurred during the period. The hypothetical “Ending Account Value” is based on the Fund’s actual expense ratio and an assumed 5% annual rate of return before expenses, which does not represent the Fund’s actual return. The figure under the heading “Fund-Level Expenses Incurred During Period” shows the hypothetical expenses your account would have incurred under this scenario. You can compare this figure with the 5% hypothetical examples that appear in shareholder reports of other funds offered through a Contract.
| | | | | | | | | |
| Class 1 | | Beginning
Account
Value 7/1/05 | | Ending
Account
Value 12/31/05 | | Fund-Level
Expenses Incurred
During Period*
7/1/05–12/31/05 |
Actual | | $ | 1,000 | | $ | 998.10 | | $ | 2.42 |
Hypothetical (5% return before expenses) | | $ | 1,000 | | $ | 1,022.79 | | $ | 2.45 |
*Expenses are equal to the annualized expense ratio for the Fund’s Class 1 shares (0.48%), which does not include any ongoing expenses of the Contract for which the Fund is an investment option, multiplied by the average account value over the period, multiplied by 184/365 to reflect the one-half year period.
FI-8
Franklin Templeton Variable Insurance Products Trust
Financial Highlights
Franklin Income Securities Fund
| | | | | | | | | | | | | | | | | | | | |
| | | Year Ended December 31,
| |
| Class 1 | | 2005 | | | 2004 | | | 2003 | | | 2002 | | | 2001 | |
| | |
|
|
|
Per share operating performance | | | | | | | | | | | | | | | | | | | | |
(for a share outstanding throughout the year) | | | | | | | | | | | | | | | | | | | | |
Net asset value, beginning of year | | $ | 15.89 | | | $ | 14.40 | | | $ | 11.48 | | | $ | 12.96 | | | $ | 14.70 | |
| | |
|
|
|
Income from investment operations: | | | | | | | | | | | | | | | | | | | | |
Net investment incomea | | | 0.85 | | | | 0.83 | | | | 0.81 | | | | 0.90 | | | | 1.09 | c |
Net realized and unrealized gains (losses) | | | (0.56 | ) | | | 1.14 | | | | 2.79 | | | | (0.89 | ) | | | (0.92 | )c |
| | |
|
|
|
Total from investment operations | | | 0.29 | | | | 1.97 | | | | 3.60 | | | | 0.01 | | | | 0.17 | |
| | |
|
|
|
Less distributions from: | | | | | | | | | | | | | | | | | | | | |
Net investment income | | | (0.57 | ) | | | (0.48 | ) | | | (0.68 | ) | | | (1.23 | ) | | | (1.03 | ) |
Net realized gains | | | (0.05 | ) | | | — | | | | — | | | | (0.26 | ) | | | (0.88 | ) |
| | |
|
|
|
Total distributions | | | (0.62 | ) | | | (0.48 | ) | | | (0.68 | ) | | | (1.49 | ) | | | (1.91 | ) |
| | |
|
|
|
Net asset value, end of year | | $ | 15.56 | | | $ | 15.89 | | | $ | 14.40 | | | $ | 11.48 | | | $ | 12.96 | |
| | |
|
|
|
| | | | | |
Total returnb | | | 1.83% | | | | 14.13% | | | | 32.10% | | | | (0.37)% | | | | 0.98% | |
Ratios/supplemental data | | | | | | | | | | | | | | | | | | | | |
Net assets, end of year (000’s) | | $ | 457,625 | | | $ | 530,742 | | | $ | 537,950 | | | $ | 427,036 | | | $ | 527,047 | |
Ratios to average net assets: | | | | | | | | | | | | | | | | | | | | |
Expenses | | | 0.48% | | | | 0.49% | | | | 0.51% | | | | 0.53% | | | | 0.53% | |
Net investment income | | | 5.44% | | | | 5.71% | | | | 6.33% | | | | 7.40% | | | | 7.90% | c |
Portfolio turnover rate | | | 34.76% | | | | 44.02% | | | | 47.03% | | | | 62.00% | | | | 32.52% | |
aBased on average daily shares outstanding.
bTotal return does not include any fees, charges or expenses imposed by the variable annuity and life insurance contracts for which the Franklin Templeton Variable Insurance Products Trust serves as an underlying investment vehicle.
cEffective January 1, 2001, the Fund adopted the provisions of the AICPA Audit and Accounting Guide for Investment Companies and began recording all paydown gains and losses as part of investment income and amortizing all premium and discount on fixed-income securities, as required. The effect of this change was as follows:
| | |
Net investment income per share | | $0.008 |
Net realized and unrealized gains/losses per share | | (0.008) |
Ratio of net investment income to average net assets | | 0.06% |
See notes to financial statements.
FI-9
Franklin Templeton Variable Insurance Products Trust
Financial Highlights (continued)
Franklin Income Securities Fund (continued)
| | | | | | | | | | | | | | | | | | | | |
| | | Year Ended December 31,
| |
| Class 2 | | 2005 | | | 2004 | | | 2003 | | | 2002 | | | 2001 | |
| | |
|
|
|
Per share operating performance | | | | | | | | | | | | | | | | | | | | |
(for a share outstanding throughout the year) | | | | | | | | | | | | | | | | | | | | |
Net asset value, beginning of year | | $ | 15.67 | | | $ | 14.23 | | | $ | 11.38 | | | $ | 12.88 | | | $ | 14.66 | |
| | |
|
|
|
Income from investment operations: | | | | | | | | | | | | | | | | | | | | |
Net investment incomea | | | 0.80 | | | | 0.80 | | | | 0.76 | | | | 0.84 | | | | 1.03 | c |
Net realized and unrealized gains (losses) | | | (0.55 | ) | | | 1.11 | | | | 2.77 | | | | (0.86 | ) | | | (0.90 | )c |
| | |
|
|
|
Total from investment operations | | | 0.25 | | | | 1.91 | | | | 3.53 | | | | (0.02 | ) | | | 0.13 | |
| | |
|
|
|
Less distributions from: | | | | | | | | | | | | | | | | | | | | |
Net investment income | | | (0.55 | ) | | | (0.47 | ) | | | (0.68 | ) | | | (1.22 | ) | | | (1.03 | ) |
Net realized gains | | | (0.05 | ) | | | — | | | | — | | | | (0.26 | ) | | | (0.88 | ) |
| | |
|
|
|
Total distributions | | | (0.60 | ) | | | (0.47 | ) | | | (0.68 | ) | | | (1.48 | ) | | | (1.91 | ) |
| | |
|
|
|
Net asset value, end of year | | $ | 15.32 | | | $ | 15.67 | | | $ | 14.23 | | | $ | 11.38 | | | $ | 12.88 | |
| | |
|
|
|
| | | | | |
Total returnb | | | 1.60% | | | | 13.85% | | | | 31.72% | | | | (0.61)% | | | | 0.76% | |
Ratios/supplemental data | | | | | | | | | | | | | | | | | | | | |
Net assets, end of year (000’s) | | $ | 2,865,361 | | | $ | 1,631,184 | | | $ | 621,001 | | | $ | 70,130 | | | $ | 9,067 | |
Ratios to average net assets: | | | | | | | | | | | | | | | | | | | | |
Expenses | | | 0.73% | | | | 0.74% | | | | 0.76% | | | | 0.78% | | | | 0.78% | |
Net investment income | | | 5.19% | | | | 5.46% | | | | 6.08% | | | | 7.15% | | | | 7.68% | c |
Portfolio turnover rate | | | 34.76% | | | | 44.02% | | | | 47.03% | | | | 62.00% | | | | 32.52% | |
aBased on average daily shares outstanding.
bTotal return does not include any fees, charges or expenses imposed by the variable annuity and life insurance contracts for which the Franklin Templeton Variable Insurance Products Trust serves as an underlying investment vehicle.
cEffective January 1, 2001, the Fund adopted the provisions of the AICPA Audit and Accounting Guide for Investment Companies and began recording all paydown gains and losses as part of investment income and amortizing all premium and discount on fixed-income securities, as required. The effect of this change was as follows:
| | |
Net investment income per share | | $0.008 |
Net realized and unrealized gains/losses per share | | (0.008) |
Ratio of net investment income to average net assets | | 0.06% |
See notes to financial statements.
FI-10
Franklin Templeton Variable Insurance Products Trust
Statement of Investments, December 31, 2005
| | | | | | | |
| Franklin Income Securities Fund | | Country | | Shares | | Value |
Long Term Investments 92.9% | | | | | | | |
Common Stocks 36.6% | | | | | | | |
Communications 2.7% | | | | | | | |
AT&T Inc. | | United States | | 1,155,884 | | $ | 28,307,599 |
BellSouth Corp. | | United States | | 1,500,000 | | | 40,650,000 |
Verizon Communications Inc. | | United States | | 700,000 | | | 21,084,000 |
| | | | | | |
|
|
| | | | | | | | 90,041,599 |
| | | | | | |
|
|
Consumer Non-Durables 2.1% | | | | | | | |
General Mills Inc. | | United States | | 1,400,000 | | | 69,048,000 |
| | | | | | |
|
|
Electric Utilities 14.1% | | | | | | | |
Alliant Energy Corp. | | United States | | 400,000 | | | 11,216,000 |
Ameren Corp. | | United States | | 700,000 | | | 35,868,000 |
American Electric Power Co. Inc. | | United States | | 600,000 | | | 22,254,000 |
CenterPoint Energy Inc. | | United States | | 200,000 | | | 2,570,000 |
Cinergy Corp. | | United States | | 1,000,000 | | | 42,460,000 |
Consolidated Edison Inc. | | United States | | 200,000 | | | 9,266,000 |
Dominion Resources Inc. | | United States | | 500,000 | | | 38,600,000 |
DTE Energy Co. | | United States | | 260,000 | | | 11,229,400 |
Duke Energy Corp. | | United States | | 500,000 | | | 13,725,000 |
Energy East Corp. | | United States | | 300,000 | | | 6,840,000 |
Entergy Corp. | | United States | | 300,000 | | | 20,595,000 |
FirstEnergy Corp. | | United States | | 1,000,000 | | | 48,990,000 |
FPL Group Inc. | | United States | | 500,000 | | | 20,780,000 |
Hawaiian Electric Industries Inc. | | United States | | 120,000 | | | 3,108,000 |
Pepco Holdings Inc. | | United States | | 300,000 | | | 6,711,000 |
PG&E Corp. | | United States | | 600,000 | | | 22,272,000 |
Pinnacle West Capital Corp. | | United States | | 300,000 | | | 12,405,000 |
PPL Corp. | | United States | | 300,000 | | | 8,820,000 |
Progress Energy Inc. | | United States | | 350,000 | | | 15,372,000 |
Public Service Enterprise Group Inc. | | United States | | 443,200 | | | 28,794,704 |
Puget Energy Inc. | | United States | | 1,666,300 | | | 34,025,846 |
The Southern Co. | | United States | | 1,250,000 | | | 43,162,500 |
TECO Energy Inc. | | United States | | 200,000 | | | 3,436,000 |
Xcel Energy Inc. | | United States | | 260,000 | | | 4,799,600 |
| | | | | | |
|
|
| | | | | | | | 467,300,050 |
| | | | | | |
|
|
Energy Minerals 3.2% | | | | | | | |
BP PLC, ADR | | United Kingdom | | 225,000 | | | 14,449,500 |
Canadian Oil Sands Trust | | Canada | | 350,000 | | | 37,942,012 |
Chevron Corp. | | United States | | 600,000 | | | 34,062,000 |
Royal Dutch Shell PLC, A, ADR | | United Kingdom | | 313,800 | | | 19,295,562 |
| | | | | | |
|
|
| | | | | | | | 105,749,074 |
| | | | | | |
|
|
Finance 3.7% | | | | | | | |
Bank of America Corp. | | United States | | 1,000,000 | | | 46,150,000 |
Comerica Inc. | | United States | | 45,900 | | | 2,605,284 |
Fifth Third Bancorp | | United States | | 500,000 | | | 18,860,000 |
Freddie Mac | | United States | | 300,000 | | | 19,605,000 |
JPMorgan Chase & Co. | | United States | | 900,000 | | | 35,721,000 |
| | | | | | |
|
|
| | | | | | | | 122,941,284 |
| | | | | | |
|
|
Gas Distributors 2.1% | | | | | | | |
Atmos Energy Corp. | | United States | | 610,000 | | | 15,957,600 |
KeySpan Corp. | | United States | | 300,000 | | | 10,707,000 |
NiSource Inc. | | United States | | 700,000 | | | 14,602,000 |
ONEOK Inc. | | United States | | 650,000 | | | 17,309,500 |
Sempra Energy | | United States | | 250,000 | | | 11,210,000 |
| | | | | | |
|
|
| | | | | | | | 69,786,100 |
| | | | | | |
|
|
FI-11
Franklin Templeton Variable Insurance Products Trust
Statement of Investments, December 31, 2005 (continued)
| | | | | | | |
| Franklin Income Securities Fund | | Country | | Shares | | Value |
Long-Term Investments (cont.) | | | | | | | |
Common Stocks (cont.) | | | | | | | |
Health Technology 6.5% | | | | | | | |
Bristol-Myers Squibb Co. | | United States | | 1,250,000 | | $ | 28,725,000 |
Eli Lilly and Co. | | United States | | 400,000 | | | 22,636,000 |
Johnson & Johnson | | United States | | 24,100 | | | 1,448,410 |
Merck & Co. Inc. | | United States | | 3,000,000 | | | 95,430,000 |
Pfizer Inc. | | United States | | 2,850,000 | | | 66,462,000 |
| | | | | | |
|
|
| | | | | | | | 214,701,410 |
| | | | | | |
|
|
Non-Energy Minerals 0.6% | | | | | | | |
AngloGold Ashanti Ltd., ADR | | South Africa | | 100,000 | | | 4,933,000 |
Barrick Gold Corp. | | Canada | | 200,000 | | | 5,574,000 |
Southern Copper Corp. | | United States | | 127,700 | | | 8,553,346 |
| | | | | | |
|
|
| | | | | | | | 19,060,346 |
| | | | | | |
|
|
Process Industries 0.6% | | | | | | | |
The Dow Chemical Co. | | United States | | 89,000 | | | 3,899,980 |
Lyondell Chemical Co. | | United States | | 750,000 | | | 17,865,000 |
| | | | | | |
|
|
| | | | | | | | 21,764,980 |
| | | | | | |
|
|
Real Estate Investment Trusts 1.0% | | | | | | | |
Developers Diversified Realty Corp. | | United States | | 325,000 | | | 15,281,500 |
Glenborough Realty Trust Inc. | | United States | | 750,000 | | | 13,575,000 |
Host Marriott Corp. | | United States | | 103,835 | | | 1,967,679 |
iStar Financial Inc. | | United States | | 100,000 | | | 3,565,000 |
| | | | | | |
|
|
| | | | | | | | 34,389,179 |
| | | | | | |
|
|
Total Common Stocks (Cost $1,076,572,831) | | | | | | | 1,214,782,022 |
| | | | | | |
|
|
Preferred Stock (Cost $7,620,963) 0.0%a | | | | | | | |
Process Industries 0.0%a | | | | | | | |
b,c,dAsia Pulp & Paper Co. Ltd., 12.00%, pfd., Perpetual | | Indonesia | | 10,073,000 | | | 109,796 |
| | | | | | |
|
|
Convertible Preferred Stocks 10.7% | | | | | | | |
Consumer Durables 0.3% | | | | | | | |
Ford Motor Co. Capital Trust II, 6.50%, cvt. pfd. | | United States | | 400,000 | | | 11,040,000 |
| | | | | | |
|
|
Electric Utilities 0.6% | | | | | | | |
Entergy Corp., 7.625%, cvt. pfd. | | United States | | 400,000 | | | 19,878,000 |
| | | | | | |
|
|
Electronic Technology 0.7% | | | | | | | |
Goldman Sachs Group into Applied Materials Inc., 7.35%, cvt. pfd. | | United States | | 500,000 | | | 8,896,500 |
Morgan Stanley into Intel Corp., 6.50%, cvt. pfd. | | United States | | 500,000 | | | 11,897,500 |
Morgan Stanley into Network Appliance Inc., 7.25%, cvt. pfd. | | United States | | 100,000 | | | 2,411,500 |
| | | | | | |
|
|
| | | | | | | | 23,205,500 |
| | | | | | |
|
|
Energy Minerals 0.9% | | | | | | | |
eChesapeake Energy Corp., 5.00%, cvt. pfd., 144A | | United States | | 250,000 | | | 31,181,250 |
| | | | | | |
|
|
Finance 3.2% | | | | | | | |
Aspen Insurance Holdings Ltd., 5.625%, cvt. pfd. | | United States | | 200,000 | | | 9,884,800 |
E*TRADE Financial Corp., 6.125%, cvt. pfd. | | United States | | 500,000 | | | 14,161,000 |
Fannie Mae, 5.375%, cvt. pfd. | | United States | | 780 | | | 71,869,785 |
MetLife Inc., 6.375%, cvt. pfd. | | United States | | 400,000 | | | 11,150,000 |
| | | | | | |
|
|
| | | | | | | | 107,065,585 |
| | | | | | |
|
|
Health Technology 0.9% | | | | | | | |
Morgan Stanley into Biogen Idec Inc., 8.50%, cvt. pfd. | | United States | | 200,000 | | | 7,755,000 |
Schering-Plough Corp., 6.00%, cvt. pfd. | | United States | | 400,000 | | | 21,516,000 |
| | | | | | |
|
|
| | | | | | | | 29,271,000 |
| | | | | | |
|
|
FI-12
Franklin Templeton Variable Insurance Products Trust
Statement of Investments, December 31, 2005 (continued)
| | | | | | | | |
| Franklin Income Securities Fund | | Country | | Shares | | Value |
Long-Term Investments (cont.) | | | | | | | | |
Convertible Preferred Stocks (cont.) | | | | | | | | |
Industrial Services 2.2% | | | | | | | | |
Allied Waste Industries Inc., 6.25%, cvt. pfd. | | United States | | | 165,000 | | $ | 7,979,400 |
Allied Waste Industries Inc., 6.25%, cvt. pfd., D | | United States | | | 112,000 | | | 29,336,496 |
El Paso Corp., 4.99%, cvt. pfd. | | United States | | | 20,000 | | | 22,095,800 |
eMorgan Stanley into WMB, 8.50%, cvt. pfd., 144A | | United States | | | 600,000 | | | 13,515,000 |
| | | | | | | |
|
|
| | | | | | | | | 72,926,696 |
| | | | | | | |
|
|
Non-Energy Minerals 0.4% | | | | | | | | |
Lehman Brothers Holdings Inc. into Alcoa Inc., 6.50%, cvt. pfd. | | United States | | | 400,000 | | | 11,900,000 |
| | | | | | | |
|
|
Process Industries 0.3% | | | | | | | | |
Huntsman Corp., 5.00%, cvt. pfd. | | United States | | | 50,000 | | | 2,018,750 |
Lehman Brothers Holdings Inc. into Lyondell Chemical, 8.00%, cvt. pfd. | | United States | | | 350,000 | | | 8,669,500 |
| | | | | | | |
|
|
| | | | | | | | | 10,688,250 |
| | | | | | | |
|
|
Producer Manufacturing 0.4% | | | | | | | | |
Goldman Sachs Group into Tyco International Ltd., 7.00%, cvt. pfd. | | United States | | | 440,000 | | | 12,719,080 |
| | | | | | | |
|
|
Real Estate Investment Trusts 0.8% | | | | | | | | |
Felcor Lodging Trust Inc., 7.80%, cvt. pfd., A | | United States | | | 300,000 | | | 7,110,000 |
Glenborough Realty Trust Inc., 7.75%, cvt. pfd., A | | United States | | | 77,014 | | | 1,940,753 |
Host Marriott Corp., 6.75%, cvt. pfd. | | United States | | | 143,587 | | | 9,028,033 |
Lexington Corporate Properties Trust, 6.50%, cvt. pfd. | | United States | | | 200,000 | | | 9,400,000 |
| | | | | | | |
|
|
| | | | | | | | | 27,478,786 |
| | | | | | | |
|
|
Total Convertible Preferred Stocks (Cost $345,370,073) | | | | | | | | 357,354,147 |
| | | | | | | |
|
|
| | | |
| | | | | Principal
Amountf
| | |
Bonds 35.5% | | | | | | | | |
Alternative Power Generation 1.9% | | | | | | | | |
c,dCalpine Canada Energy Finance, senior note, 8.50%, 5/01/08 | | Canada | | $ | 10,000,000 | | | 3,775,000 |
c,dCalpine Corp., | | | | | | | | |
senior note, 7.875%, 4/01/08 | | United States | | | 1,000,000 | | | 435,000 |
senior note, 8.625%, 8/15/10 | | United States | | | 22,700,000 | | | 7,037,000 |
esenior secured note, 144A, 8.50%, 7/15/10 | | United States | | | 38,000,000 | | | 31,350,000 |
esenior secured note, 144A, 9.875%, 12/01/11 | | United States | | | 10,000,000 | | | 8,100,000 |
esenior secured note, 144A, 8.75%, 7/15/13 | | United States | | | 15,000,000 | | | 12,375,000 |
| | | | | | | |
|
|
| | | | | | | | | 63,072,000 |
| | | | | | | |
|
|
Commercial Services 1.1% | | | | | | | | |
Dex Media Inc., | | | | | | | | |
senior disc. note, zero cpn. to 11/15/08, 9.00% thereafter, 11/15/13 | | United States | | | 14,500,000 | | | 11,600,000 |
zero cpn. to 11/15/08, 9.00% thereafter, 11/15/13 | | United States | | | 10,000,000 | | | 8,000,000 |
JohnsonDiversey Holdings Inc., senior disc. note, zero cpn. to 5/17/07,
10.67% thereafter, 5/15/13 | | United States | | | 19,500,000 | | | 15,600,000 |
| | | | | | | |
|
|
| | | | | | | | | 35,200,000 |
| | | | | | | |
|
|
Communications 2.4% | | | | | | | | |
Qwest Capital Funding Inc., | | | | | | | | |
7.00%, 8/03/09 | | United States | | | 20,000,000 | | | 20,300,000 |
7.25%, 2/15/11 | | United States | | | 28,000,000 | | | 28,490,000 |
eQwest Communications International Inc., senior note, 144A, 7.50%, 2/15/14 | | United States | | | 20,000,000 | | | 20,650,000 |
Time Warner Telecom Holdings Inc., senior note, 9.25%, 2/15/14 | | United States | | | 11,000,000 | | | 11,660,000 |
| | | | | | | |
|
|
| | | | | | | | | 81,100,000 |
| | | | | | | |
|
|
FI-13
Franklin Templeton Variable Insurance Products Trust
Statement of Investments, December 31, 2005 (continued)
| | | | | | | | |
| Franklin Income Securities Fund | | Country | | Principal
Amountf | | Value |
Long-Term Investments (cont.) | | | | | | | | |
Bonds (cont.) | | | | | | | | |
Consumer Durables 6.7% | | | | | | | | |
Ford Motor Co., 7.45%, 7/16/31 | | United States | | $ | 30,000,000 | | $ | 20,550,000 |
Ford Motor Credit Co., | | | | | | | | |
7.875%, 6/15/10 | | United States | | | 20,000,000 | | | 18,014,060 |
7.375%, 2/01/11 | | United States | | | 50,000,000 | | | 43,870,300 |
7.00%, 10/01/13 | | United States | | | 8,000,000 | | | 6,845,368 |
General Motors Acceptance Corp., | | | | | | | | |
7.75%, 1/19/10 | | United States | | | 20,000,000 | | | 18,693,440 |
6.875%, 9/15/11 | | United States | | | 60,000,000 | | | 54,779,100 |
6.875%, 8/28/12 | | United States | | | 17,500,000 | | | 15,793,645 |
6.75%, 12/01/14 | | United States | | | 30,000,000 | | | 27,032,100 |
General Motors Corp., senior deb., 8.25%, 7/15/23 | | United States | | | 25,000,000 | | | 16,187,500 |
| | | | | | | |
|
|
| | | | | | | | | 221,765,513 |
| | | | | | | |
|
|
Consumer Services 4.8% | | | | | | | | |
Cablevision Systems Corp., senior note, B, 8.00%, 4/15/12 | | United States | | | 40,400,000 | | | 37,976,000 |
eCCH I Holdings LLC, senior note, 144A, | | | | | | | | |
9.92%, 4/01/14 | | United States | | | 5,419,000 | | | 3,115,925 |
zero cpn. to 1/15/06, 13.50% thereafter, 1/15/14 | | United States | | | 33,000,000 | | | 22,357,500 |
zero cpn. to 5/15/06, 11.75% thereafter, 5/15/14 | | United States | | | 17,000,000 | | | 9,520,000 |
eCCH I LLC, senior secured note, 144A, 11.00%, 10/01/15 | | United States | | | 75,000,000 | | | 63,375,000 |
CSC Holdings Inc., senior note, B, 7.625%, 4/01/11 | | United States | | | 10,000,000 | | | 10,000,000 |
Liberty Media Corp., senior note, 5.70%, 5/15/13 | | United States | | | 15,000,000 | | | 14,051,415 |
| | | | | | | |
|
|
| | | | | | | | | 160,395,840 |
| | | | | | | |
|
|
Electric Utilities 2.3% | | | | | | | | |
Aquila Inc., senior note, 14.875%, 7/01/12 | | United States | | | 17,000,000 | | | 22,865,000 |
TXU Corp., senior note, | | | | | | | | |
5.55%, 11/15/14 | | United States | | | 40,000,000 | | | 38,193,440 |
6.55%, 11/15/34 | | United States | | | 15,000,000 | | | 14,248,470 |
| | | | | | | |
|
|
| | | | | | | | | 75,306,910 |
| | | | | | | |
|
|
Electronic Technology 1.4% | | | | | | | | |
eL-3 Communications Corp., senior sub. note, 144A, 6.375%, 10/15/15 | | United States | | | 28,000,000 | | | 28,070,000 |
Lucent Technologies Inc., 6.45%, 3/15/29 | | United States | | | 10,400,000 | | | 8,970,000 |
Sanmina-SCI Corp., senior sub. note, 6.75%, 3/01/13 | | United States | | | 10,000,000 | | | 9,562,500 |
| | | | | | | |
|
|
| | | | | | | | | 46,602,500 |
| | | | | | | |
|
|
Energy Minerals 0.5% | | | | | | | | |
Chesapeake Energy Corp., senior note, 6.25%, 1/15/18 | | United States | | | 7,500,000 | | | 7,387,500 |
eMassey Energy Co., senior note, 144A, 6.875%, 12/15/13 | | United States | | | 10,000,000 | | | 10,137,500 |
| | | | | | | |
|
|
| | | | | | | | | 17,525,000 |
| | | | | | | |
|
|
Finance 1.8% | | | | | | | | |
eE*TRADE Financial Corp., senior note, 144A, 7.375%, 9/15/13 | | United States | | | 30,400,000 | | | 30,932,000 |
Nalco Finance Holdings, senior note, zero cpn. to 8/01/09, 9.00% thereafter, 2/01/14 | | United States | | | 37,500,000 | | | 28,312,500 |
| | | | | | | |
|
|
| | | | | | | | | 59,244,500 |
| | | | | | | |
|
|
Gas Distributors 2.1% | | | | | | | | |
Dynegy Holdings Inc., | | | | | | | | |
senior note, 6.875%, 4/01/11 | | United States | | | 30,000,000 | | | 29,700,000 |
senior note, 8.75%, 2/15/12 | | United States | | | 28,685,000 | | | 31,123,225 |
esenior secured note, 144A, 10.125%, 7/15/13 | | United States | | | 8,000,000 | | | 9,080,000 |
| | | | | | | |
|
|
| | | | | | | | | 69,903,225 |
| | | | | | | |
|
|
FI-14
Franklin Templeton Variable Insurance Products Trust
Statement of Investments, December 31, 2005 (continued)
| | | | | | | | |
| Franklin Income Securities Fund | | Country | | Principal
Amountf | | Value |
Long-Term Investments (cont.) | | | | | | | | |
Bonds (cont.) | | | | | | | | |
Health Services 3.9% | | | | | | | | |
DaVita Inc., senior sub. note, 7.25%, 3/15/15 | | United States | | $ | 6,500,000 | | $ | 6,613,750 |
HCA Inc., 6.375%, 1/15/15 | | United States | | | 5,000,000 | | | 5,079,170 |
HealthSouth Corp., senior note, 7.625%, 6/01/12 | | United States | | | 14,900,000 | | | 15,198,000 |
Tenet Healthcare Corp., senior note, | | | | | | | | |
6.375%, 12/01/11 | | United States | | | 60,000,000 | | | 55,050,000 |
6.50%, 6/01/12 | | United States | | | 10,000,000 | | | 9,200,000 |
7.375%, 2/01/13 | | United States | | | 30,000,000 | | | 27,825,000 |
e144A, 9.25%, 2/01/15 | | United States | | | 10,000,000 | | | 9,975,000 |
| | | | | | | |
|
|
| | | | | | | | | 128,940,920 |
| | | | | | | |
|
|
Industrial Services 2.7% | | | | | | | | |
Allied Waste North America Inc., | | | | | | | | |
senior note, B, 7.375%, 4/15/14 | | United States | | | 15,000,000 | | | 14,662,500 |
senior secured note, 6.50%, 11/15/10 | | United States | | | 7,500,000 | | | 7,462,500 |
senior secured note, 6.125%, 2/15/14 | | United States | | | 10,000,000 | | | 9,475,000 |
El Paso Corp., senior note, 7.75%, 1/15/32 | | United States | | | 17,000,000 | | | 17,127,500 |
El Paso Energy, senior note, | | | | | | | | |
6.75%, 5/15/09 | | United States | | | 23,000,000 | | | 22,942,500 |
7.375%, 12/15/12 | | United States | | | 4,000,000 | | | 4,040,000 |
EI Paso Production Holding Co., 7.75%, 6/01/13 | | United States | | | 10,000,000 | | | 10,425,000 |
Hanover Compressor Co., sub. note, zero cpn., 3/31/07 | | United States | | | 5,000,000 | | | 4,512,500 |
| | | | | | | |
|
|
| | | | | | | | | 90,647,500 |
| | | | | | | |
|
|
Non-Energy Minerals 0.5% | | | | | | | | |
eNovelis Inc., senior note, 144A, 7.25%, 2/15/15 | | Canada | | | 17,000,000 | | | 15,937,500 |
| | | | | | | |
|
|
Process Industries 1.5% | | | | | | | | |
Abitibi-Consolidated Co. of Canada, senior note, 8.375%, 4/01/15 | | Canada | | | 5,000,000 | | | 4,812,500 |
Jefferson Smurfit Corp., senior note, 8.25%, 10/01/12 | | United States | | | 5,000,000 | | | 4,825,000 |
Nalco Co., senior sub. note, 8.875%, 11/15/13 | | United States | | | 3,000,000 | | | 3,157,500 |
Rhodia SA, senior note, 10.25%, 6/01/10 | | France | | | 25,000,000 | | | 27,500,000 |
Stone Container Corp., senior note, 9.75%, 2/01/11 | | United States | | | 10,000,000 | | | 10,150,000 |
| | | | | | | |
|
|
| | | | | | | | | 50,445,000 |
| | | | | | | |
|
|
Producer Manufacturing 0.7% | | | | | | | | |
Case New Holland Inc., senior note, 6.00%, 6/01/09 | | United States | | | 15,000,000 | | | 14,625,000 |
eInvensys PLC, senior note, 144A, 9.875%, 3/15/11 | | United Kingdom | | | 9,000,000 | | | 8,955,000 |
| | | | | | | |
|
|
| | | | | | | | | 23,580,000 |
| | | | | | | |
|
|
Real Estate Investment Trusts 0.5% | | | | | | | | |
Host Marriott LP, senior note, K, 7.125%, 11/01/13 | | United States | | | 5,000,000 | | | 5,225,000 |
MeriStar Hospitality Corp., 9.125%, 1/15/11 | | United States | | | 10,000,000 | | | 10,950,000 |
| | | | | | | |
|
|
| | | | | | | | | 16,175,000 |
| | | | | | | |
|
|
Technology Services 0.6% | | | | | | | | |
eSunGard Data Systems Inc., | | | | | | | | |
senior note, 144A, 9.125%, 8/15/13 | | United States | | | 9,000,000 | | | 9,360,000 |
senior sub. note, 144A, 10.25%, 8/15/15 | | United States | | | 9,000,000 | | | 9,045,000 |
| | | | | | | |
|
|
| | | | | | | | | 18,405,000 |
| | | | | | | |
|
|
Transportation 0.1% | | | | | | | | |
American Airlines Inc., 9.71%, 1/02/07 | | United States | | | 4,463,304 | | | 4,323,445 |
| | | | | | | |
|
|
Total Bonds (Cost $1,185,773,720) | | | | | | | | 1,178,569,853 |
| | | | | | | |
|
|
FI-15
Franklin Templeton Variable Insurance Products Trust
Statement of Investments, December 31, 2005 (continued)
| | | | | | | | |
| Franklin Income Securities Fund | | Country | | Principal
Amountf | | Value |
Long-Term Investments (cont.) | | | | | | | | |
Convertible Bonds 5.9% | | | | | | | | |
Alternative Power Generation 0.3% | | | | | | | | |
cCalpine Corp., cvt., | | | | | | | | |
senior note, 6.00% to 9/30/06, zero cpn. to 9/30/09, 6.00% thereafter, 9/30/14 | | United States | | $ | 39,500,000 | | $ | 8,097,500 |
sub. note, 7.75%, 6/01/15 | | United States | | | 40,000,000 | | | 3,800,000 |
| | | | | | | |
|
|
| | | | | | | | | 11,897,500 |
| | | | | | | |
|
|
Communications 0.3% | | | | | | | | |
Qwest Communications International Inc., cvt., senior bond, 3.50%, 11/15/25 | | United States | | | 7,500,000 | | | 8,625,000 |
| | | | | | | |
|
|
Electronic Technology 2.9% | | | | | | | | |
Conexant Systems Inc., cvt., | | | | | | | | |
4.25%, 5/01/06 | | United States | | | 17,800,000 | | | 17,711,000 |
sub. note, 4.00%, 2/01/07 | | United States | | | 30,000,000 | | | 28,987,500 |
eL-3 Communications Corp., cvt., 144A, 3.00%, 8/01/35 | | United States | | | 16,000,000 | | | 15,900,000 |
Nortel Networks Corp., cvt., senior note, 4.25%, 9/01/08 | | Canada | | | 35,766,000 | | | 33,709,455 |
| | | | | | | |
|
|
| | | | | | | | | 96,307,955 |
| | | | | | | |
|
|
Finance 0.3% | | | | | | | | |
NCO Group Inc., cvt., sub. note, 4.75%, 4/15/06 | | United States | | | 10,000,000 | | | 9,950,000 |
| | | | | | | |
|
|
Health Technology 0.2% | | | | | | | | |
Enzon Pharmaceuticals Inc., cvt., sub. note, 4.50%, 7/01/08 | | United States | | | 8,000,000 | | | 7,220,000 |
| | | | | | | |
|
|
Industrial Services 0.4% | | | | | | | | |
Hanover Compressor Co., cvt., senior note, 4.75%, 3/15/08 | | United States | | | 14,000,000 | | | 13,370,000 |
| | | | | | | |
|
|
Real Estate Investment Trusts 1.1% | | | | | | | | |
eHost Marriott LP, cvt., senior deb., 144A, 3.25%, 3/15/24 | | United States | | | 700,000 | | | 823,704 |
MeriStar Hospitality Corp., cvt., sub. note, 9.50%, 4/01/10 | | United States | | | 29,500,000 | | | 35,547,500 |
| | | | | | | |
|
|
| | | | | | | | | 36,371,204 |
| | | | | | | |
|
|
Technology Services 0.4% | | | | | | | | |
eBearingPoint Inc., cvt., senior sub. note, 144A, 5.00%, 4/15/25 | | United States | | | 10,000,000 | | | 13,437,500 |
| | | | | | | |
|
|
Total Convertible Bonds (Cost $243,038,392) | | | | | | | | 197,179,159 |
| | | | | | | |
|
|
Mortgage-Backed Securities 3.9% | | | | | | | | |
Federal Home Loan Mortgage Corp. (FHLMC) Fixed Rate 1.1% | | | | | | | | |
FHLMC Gold 30 Year, 5.00%, 7/01/33 - 11/01/33 | | United States | | | 38,360,758 | | | 37,283,779 |
| | | | | | | |
|
|
Government National Mortgage Association (GNMA) Fixed Rate 0.4% | | | | | | | | |
GNMA I SF 30 Year, 5.00%, 3/15/34 | | United States | | | 12,012,952 | | | 11,873,199 |
| | | | | | | |
|
|
Federal National Mortgage Association (FNMA) Fixed Rate 2.4% | | | | | | | | |
FNMA 30 Year, 5.50%, 9/01/35 - 1/01/36 | | United States | | | 80,000,003 | | | 79,258,338 |
| | | | | | | |
|
|
Total Mortgage-Backed Securities (Cost $128,444,228) | | | | | | | | 128,415,316 |
| | | | | | | |
|
|
Municipal Bond Securities 0.3% | | | | | | | | |
California 0.3% | | | | | | | | |
California State GO, | | | | | | | | |
5.125%, 4/01/25 | | United States | | | 5,000,000 | | | 5,269,100 |
5.00%, 2/01/33 | | United States | | | 4,400,000 | | | 4,547,400 |
| | | | | | | |
|
|
Total Municipal Bond Securities (Cost $9,273,319) | | | | | | | | 9,816,500 |
| | | | | | | |
|
|
Total Long-Term Investments
(Cost $2,996,093,526) | | | | | | | | 3,086,226,793 |
| | | | | | | |
|
|
FI-16
Franklin Templeton Variable Insurance Products Trust
Statement of Investments, December 31, 2005 (continued)
| | | | | | | | |
| Franklin Income Securities Fund | | Country | | Principal
Amountf | | Value |
Short Term Investment (Cost $201,079,186) 6.0% | | | | | | | | |
Repurchase Agreement 6.0% | | | | | | | | |
gJoint Repurchase Agreement, 3.999%, 1/03/06 (Maturity Value $201,168,532) | | United States | | $ | 201,079,186 | | $ | 201,079,186 |
ABN AMRO Bank, N.V., New York Branch (Maturity Value $18,533,657) | | | | | | | | |
Banc of America Securities LLC (Maturity Value $18,935,994) | | | | | | | | |
Barclays Capital Inc. (Maturity Value $18,935,994) | | | | | | | | |
Bear, Stearns & Co. Inc. (Maturity Value $16,117,623) | | | | | | | | |
BNP Paribas Securities Corp. (Maturity Value $18,935,994) | | | | | | | | |
Deutsche Bank Securities Inc. (Maturity Value $8,060,823) | | | | | | | | |
Goldman, Sachs & Co. (Maturity Value $13,699,576) | | | | | | | | |
Greenwich Capital Markets Inc. (Maturity Value $18,935,994) | | | | | | | | |
Lehman Brothers Inc. (Maturity Value $12,607,232) | | | | | | | | |
Merrill Lynch Government Securities Inc. (Maturity Value $18,935,994) | | | | | | | | |
Morgan Stanley & Co. Inc. (Maturity Value $18,533,657) | | | | | | | | |
UBS Securities LLC (Maturity Value $18,935,994) | | | | | | | | |
Collateralized by U.S. Government Agency Securities, 1.875 - 7.25%, 2/15/06 - 11/15/10; | | | | | | | | |
hU.S. Government Agency Discount Notes, 1/09/06 - 1/27/06; and U.S. Treasury Notes, 2.375 - 5.75%, 8/15/06 - 8/15/10 | | | | | | | | |
| | | | | | | |
|
|
Total Investments (Cost $3,197,172,712) 98.9% | | | | | | | | 3,287,305,979 |
Other Assets, less Liabilities 1.1% | | | | | | | | 35,679,985 |
| | | | | | | |
|
|
Net Assets 100.0% | | | | | | | $ | 3,322,985,964 |
| | | | | | | |
|
|
Selected Portfolio Abbreviations
ADR - American Depository Receipt
FHLMC - Federal Home Loan Mortgage Corporation
FNMA - Federal National Mortgage Association
GNMA - Government National Mortgage Association
GO - General Obligation
SF - Single Family
aRounds to less than 0.05% of net assets.
bSee Note 7 regarding restricted and illiquid securities.
cSee Note 8 regarding defaulted securities.
dSee Note 9 regarding other considerations.
eSecurity was purchased pursuant to Rule 144A under the Securities Act of 1933 and may be sold in transactions exempt from registration only to qualified institutional buyers or in a public offering registered under the Securities Act of 1933. These securities have been deemed liquid under the guidelines approved by the Trust’s Board of Trustees. At December 31, 2005, the value of these securities was $377,192,879, representing 11.35% of net assets.
fThe principal amount is stated in U.S. dollars unless otherwise indicated.
gSee Note 1(c) regarding joint repurchase agreement.
hA portion or all of the security is traded on a discount basis with no stated coupon.
See notes to financial statements.
FI-17
Franklin Templeton Variable Insurance Products Trust
Financial Statements (continued)
Statement of Assets and Liabilities
December 31, 2005
| | |
| | | Franklin Income
Securities Fund
|
Assets: | | |
Investments in securities: | | |
Cost - Unaffiliated issuers | | $2,996,093,526 |
Cost - Repurchase agreements | | 201,079,186 |
| | |
|
Total cost of investments | | $3,197,172,712 |
| | |
|
Value - Unaffiliated issuers | | $3,086,226,793 |
Value - Repurchase agreements | | 201,079,186 |
| | |
|
Total value of investments | | 3,287,305,979 |
Receivables: | | |
Investment securities sold | | 1,383,843 |
Capital shares sold | | 5,837,775 |
Dividends and interest | | 31,536,922 |
| | |
|
Total assets | | 3,326,064,519 |
| | |
|
Liabilities: | | |
Payables: | | |
Capital shares redeemed | | 417,961 |
Affiliates | | 2,427,714 |
Reports to shareholders | | 165,000 |
Deferred sales proceeds (Note 9) | | 37,509 |
Accrued expenses and other liabilities | | 30,371 |
| | |
|
Total liabilities | | 3,078,555 |
| | |
|
Net assets, at value | | $3,322,985,964 |
| | |
|
Net assets consist of: | | |
Paid-in capital | | $3,076,151,465 |
Undistributed net investment income | | 140,978,411 |
Net unrealized appreciation (depreciation) | | 90,133,267 |
Accumulated net realized gain (loss) | | 15,722,821 |
| | |
|
Net assets, at value | | $3,322,985,964 |
| | |
|
Class 1: | | |
Net assets, at value | | $457,625,258 |
| | |
|
Shares outstanding | | 29,414,181 |
| | |
|
Net asset value and offering price per share | | $15.56 |
| | |
|
Class 2: | | |
Net assets, at value | | $2,865,360,706 |
| | |
|
Shares outstanding | | 187,020,231 |
| | |
|
Net asset value and offering price per share | | $15.32 |
| | |
|
See notes to financial statements.
FI-18
Franklin Templeton Variable Insurance Products Trust
Financial Statements (continued)
Statement of Operations
for the year ended December 31, 2005
| | | | |
| | | Franklin Income
Securities Fund
| |
Investment income: | | | | |
Dividends | | $ | 56,372,150 | |
Interest | | | 106,585,787 | |
Other income (Note 10) | | | 54,366 | |
| | |
|
|
|
Total investment income | | | 163,012,303 | |
| | |
|
|
|
Expenses: | | | | |
Management fees (Note 3a) | | | 12,626,675 | |
Distribution fees - Class 2 (Note 3c) | | | 5,652,323 | |
Unaffiliated transfer agent fees | | | 15,376 | |
Custodian fees (Note 4) | | | 60,101 | |
Reports to shareholders | | | 330,448 | |
Professional fees | | | 50,635 | |
Trustees’ fees and expenses | | | 13,750 | |
Other | | | 65,694 | |
| | |
|
|
|
Total expenses | | | 18,815,002 | |
Expense reductions (Note 4) | | | (1,595 | ) |
| | |
|
|
|
Net expenses | | | 18,813,407 | |
| | |
|
|
|
Net investment income | | | 144,198,896 | |
| | |
|
|
|
Realized and unrealized gains (losses): | | | | |
Net realized gain (loss) from: | | | | |
Investments | | | 31,941,147 | |
Realized gain distributions from REITS | | | 259,673 | |
Foreign currency transactions | | | (46,688 | ) |
| | |
|
|
|
Net realized gain (loss) | | | 32,154,132 | |
| | |
|
|
|
Net change in unrealized appreciation (depreciation) on: | | | | |
Investments | | | (129,982,557 | ) |
Translation of assets and liabilities denominated in foreign currencies | | | (214 | ) |
| | |
|
|
|
Net change in unrealized appreciation (depreciation) | | | (129,982,771 | ) |
| | |
|
|
|
Net realized and unrealized gain (loss) | | | (97,828,639 | ) |
| | |
|
|
|
Net increase (decrease) in net assets resulting from operations | | $ | 46,370,257 | |
| | |
|
|
|
See notes to financial statements.
FI-19
Franklin Templeton Variable Insurance Products Trust
Financial Statements (continued)
Statements of Changes in Net Assets
| | | | | | | | |
| | | Franklin Income Securities Fund
| |
| | | Year Ended December 31,
| |
| | | 2005 | | | 2004 | |
| | |
| |
Increase (decrease) in net assets: | | | | | | | | |
Operations: | | | | | | | | |
Net investment income | | $ | 144,198,896 | | | $ | 86,939,394 | |
Net realized gain (loss) from investments, realized gain distributions from REITS and
foreign currency transactions | | | 32,154,132 | | | | 40,772,833 | |
Net change in unrealized appreciation (depreciation) on investments and translation
of assets and liabilities denominated in foreign currencies | | | (129,982,771 | ) | | | 104,786,076 | |
| | |
| |
Net increase (decrease) in net assets resulting from operations | | | 46,370,257 | | | | 232,498,303 | |
| | |
| |
Distributions to shareholders from: | | | | | | | | |
Net investment income: | | | | | | | | |
Class 1 | | | (17,655,444 | ) | | | (16,732,026 | ) |
Class 2 | | | (77,344,567 | ) | | | (31,567,787 | ) |
Net realized gains: | | | | | | | | |
Class 1 | | | (1,482,117 | ) | | | — | |
Class 2 | | | (6,706,510 | ) | | | — | |
| | |
| |
Total distributions to shareholders | | | (103,188,638 | ) | | | (48,299,813 | ) |
| | |
| |
Capital share transactions: (Note 2) | | | | | | | | |
Class 1 | | | (62,746,016 | ) | | | (58,818,294 | ) |
Class 2 | | | 1,280,624,618 | | | | 877,594,642 | |
| | |
| |
Total capital share transactions | | | 1,217,878,602 | | | | 818,776,348 | |
| | |
| |
Net increase (decrease) in net assets | | | 1,161,060,221 | | | | 1,002,974,838 | |
Net assets: | | | | | | | | |
Beginning of year | | | 2,161,925,743 | | | | 1,158,950,905 | |
| | |
| |
End of year | | $ | 3,322,985,964 | | | $ | 2,161,925,743 | |
| | |
| |
Undistributed net investment income included in net assets: | | | | | | | | |
End of year | | $ | 140,978,411 | | | $ | 87,092,537 | |
| | |
| |
See notes to financial statements.
FI-20
Franklin Templeton Variable Insurance Products Trust
Notes to Financial Statements (continued)
Franklin Income Securities Fund
1. ORGANIZATION AND SIGNIFICANT ACCOUNTING POLICIES
Franklin Templeton Variable Insurance Products Trust (the Trust) is registered under the Investment Company Act of 1940 as an open-end investment company, consisting of twenty-two separate series. The Franklin Income Securities Fund (the Fund) included in this report is diversified. The financial statements of the remaining funds in the series are presented separately. Shares of the Fund are sold only to insurance company separate accounts to fund the benefits of variable life insurance policies or variable annuity contracts. As of December 31, 2005, 62.50% of the Fund’s shares were sold through one insurance company.
The following summarizes the Fund’s significant accounting policies.
a. Security Valuation
Securities listed on a securities exchange or on the NASDAQ National Market System are valued at the last quoted sale price or the official closing price of the day, respectively. Over-the-counter securities and listed securities for which there is no reported sale are valued within the range of the most recent quoted bid and ask prices. Securities that trade in multiple markets or on multiple exchanges are valued according to the broadest and most representative market.
Corporate debt securities, mortgage pass-through securities and other mortgage-backed securities generally trade in the over-the-counter market rather than on a securities exchange. The Trust may utilize independent pricing services, quotations from bond dealers, and information with respect to bond and note transactions, to assist in determining a current market value for each security. The Trust’s pricing services may use valuation models or matrix pricing which considers information with respect to comparable bond and note transactions, quotations from bond dealers, or by reference to other securities that are considered comparable in such characteristics as rating, interest rate and maturity date, option adjusted spread models, prepayment projections, interest rate spreads and yield curves, to determine current value.
Foreign securities are valued as of the close of trading on the foreign stock exchange on which the security is primarily traded, or the NYSE, whichever is earlier. If no sale is reported at that time, the foreign security will be valued within the range of the most recent quoted bid and ask prices. The value is then converted into its U.S. dollar equivalent at the foreign exchange rate in effect at the close of the NYSE on the day that the value of the foreign security is determined.
The Trust has procedures to determine the fair value of individual securities and other assets for which market prices are not readily available or which may not be reliably priced. Methods for valuing these securities may include: fundamental analysis, matrix pricing, discounts from market prices of similar securities, or discounts applied due to the nature and duration of restrictions on the disposition of the securities. Due to the inherent uncertainty of valuations of such securities, the fair values may differ significantly from the values that would have been used had a ready market for such investments existed. Occasionally, events occur between the time at which trading in a security is completed and the close of the NYSE that might call into question the availability (including the reliability) of the value of a portfolio security held by the Fund. If such an event occurs, the securities may be valued using fair value procedures, which may include the use of independent pricing services. All security valuation procedures are approved by the Trust’s Board of Trustees.
b. Foreign Currency Translation
Portfolio securities and other assets and liabilities denominated in foreign currencies are translated into U.S. dollars based on the exchange rate of such currencies against U.S. dollars on the date of valuation. Purchases and sales of securities, income and expense items denominated in foreign currencies are translated into U.S. dollars at the exchange rate in effect on the transaction date. Occasionally, events may impact the availability or reliability of foreign exchange rates used to convert the U.S. dollar equivalent value. If such an event occurs, the foreign exchange rate will be valued at fair value using procedures established and approved by the Trust’s Board of Trustees.
FI-21
Franklin Templeton Variable Insurance Products Trust
Notes to Financial Statements (continued)
Franklin Income Securities Fund
1. ORGANIZATION AND SIGNIFICANT ACCOUNTING POLICIES (continued)
b. Foreign Currency Translation (continued)
The Fund does not separately report the effect of changes in foreign exchange rates from changes in market prices on securities held. Such changes are included in net realized and unrealized gain or loss from investments on the Statement of Operations.
Realized foreign exchange gains or losses arise from sales of foreign currencies, currency gains or losses realized between the trade and settlement dates on securities transactions and the difference between the recorded amounts of dividends, interest, and foreign withholding taxes and the U.S. dollar equivalent of the amounts actually received or paid. Net unrealized foreign exchange gains and losses arise from changes in foreign exchange rates on foreign denominated assets and liabilities other than investments in securities held at the end of the reporting period.
c. Joint Repurchase Agreement
The Fund may enter into a joint repurchase agreement whereby its uninvested cash balance is deposited into a joint cash account with other funds managed by the investment manager or an affiliate of the investment manager and is used to invest in one or more repurchase agreements. The value and face amount of the joint repurchase agreement are allocated to the funds based on their pro-rata interest. A repurchase agreement is accounted for as a loan by the Fund to the seller, collateralized by securities which are delivered to the Fund’s custodian. The market value, including accrued interest, of the initial collateralization is required to be at least 102% of the dollar amount invested by the Funds, with the value of the underlying securities marked to market daily to maintain coverage of at least 100%. Repurchase agreements are valued at cost. At December 31, 2005, all repurchase agreements held by the Fund had been entered into on December 30, 2005.
d. Foreign Currency Contracts
When the Fund purchases or sells foreign securities it may enter into foreign exchange contracts to minimize foreign exchange risk from the trade date to the settlement date of the transactions. A foreign exchange contract is an agreement between two parties to exchange different currencies at an agreed upon exchange rate on a specified date. Realized and unrealized gains and losses on these contracts are included in the Statement of Operations.
The risks of these contracts include movement in the values of the foreign currencies relative to the U.S. dollar and the possible inability of the counterparties to fulfill their obligations under the contracts, which may be in excess of the amount reflected in the Statement of Assets and Liabilities.
e. Mortgage Dollar Rolls
The Fund enters into mortgage dollar rolls, typically on a to-be-announced basis. Dollar rolls are agreements between the Fund and a financial institution to simultaneously sell and repurchase mortgage-backed securities at a future date. Gains or losses are realized at the time of the sale and the difference between the repurchase price and sale price is recorded as an unrealized gain to the Fund. The risks of mortgage dollar roll transactions include the potential inability of the counterparty to fulfill its obligations.
f. Income Taxes
No provision has been made for U.S. income taxes because the Fund’s policy is to continue to qualify as a regulated investment company under the Internal Revenue Code and to distribute to shareholders substantially all of its taxable income and net realized gains.
FI-22
Franklin Templeton Variable Insurance Products Trust
Notes to Financial Statements (continued)
Franklin Income Securities Fund
1. ORGANIZATION AND SIGNIFICANT ACCOUNTING POLICIES (continued)
g. Security Transactions, Investment Income, Expenses and Distributions
Security transactions are accounted for on trade date. Realized gains and losses on security transactions are determined on a specific identification basis. Interest income and estimated expenses are accrued daily. Amortization of premium and accretion of discount on debt securities are included in interest income. Dividend income is recorded on the ex-dividend date. Distributions to shareholders are recorded on the ex-dividend date and are determined according to income tax regulations (tax basis). Such distributions are reinvested in additional shares of the Fund. Distributable earnings determined on a tax basis may differ from earnings recorded in accordance with generally accepted accounting principles. These differences may be permanent or temporary. Permanent differences are reclassified among capital accounts to reflect their tax character. These reclassifications have no impact on net assets or the results of operations. Temporary differences are not reclassified, as they may reverse in subsequent periods.
Common expenses incurred by the Trust are allocated among the funds based on the ratio of net assets of each fund to the combined net assets of the Trust. Fund specific expenses are charged directly to the fund that incurred the expense.
Distributions received by the Fund from securities may be a return of capital (ROC). Such distributions reduce the cost basis of the securities, and any distributions in excess of the cost basis are recognized as capital gains.
Realized and unrealized gains and losses and net investment income, other than class specific expenses, are allocated daily to each class of shares based upon the relative proportion of net assets of each class.
h. Accounting Estimates
The preparation of financial statements in accordance with accounting principles generally accepted in the United States of America requires management to make estimates and assumptions that affect the reported amounts of assets and liabilities at the date of the financial statements and the amounts of income and expenses during the reporting period. Actual results could differ from those estimates.
i. Guarantees and Indemnifications
Under the Trust’s organizational documents, its officers and trustees are indemnified by the Trust against certain liabilities arising out of the performance of their duties to the Trust. Additionally, in the normal course of business, the Trust enters into contracts with service providers that contain general indemnification clauses. The Trust’s maximum exposure under these arrangements is unknown as this would involve future claims that may be made against the Trust that have not yet occurred. However, based on experience, the Trust expects the risk of loss to be remote.
2. SHARES OF BENEFICIAL INTEREST
The Fund offers two classes of shares: Class 1 and Class 2. Each class of shares differs by its distribution fees, voting rights on matters affecting a single class and its exchange privilege.
FI-23
Franklin Templeton Variable Insurance Products Trust
Notes to Financial Statements (continued)
Franklin Income Securities Fund
2. SHARES OF BENEFICIAL INTEREST (continued)
At December 31, 2005, there were an unlimited number of shares authorized ($0.01 par value). Transactions in the Fund’s shares were as follows:
| | | | | | | | | | | | | | |
| | | Year Ended December 31,
| |
| | | 2005
| | | 2004
| |
| Class 1 Shares: | | Shares
| | | Amount
| | | Shares
| | | Amount
| |
Shares sold | | 214,928 | | | $ | 3,363,667 | | | 303,699 | | | $ | 4,435,674 | |
Shares issued in reinvestment of distributions | | 1,234,681 | | | | 19,137,561 | | | 1,195,145 | | | | 16,732,026 | |
Shares redeemed | | (5,443,525 | ) | | | (85,247,244 | ) | | (5,457,232 | ) | | | (79,985,994 | ) |
| | |
| |
Net increase (decrease) | | (3,993,916 | ) | | $ | (62,746,016 | ) | | (3,958,388 | ) | | $ | (58,818,294 | ) |
| | |
| |
| Class 2 Shares: | | | | | | | | | | | | |
Shares sold | | 81,419,386 | | | $ | 1,257,290,428 | | | 59,725,308 | | | $ | 868,489,933 | |
Shares issued in reinvestment of distributions | | 5,500,725 | | | | 84,051,077 | | | 2,282,559 | | | | 31,567,787 | |
Shares redeemed | | (3,971,475 | ) | | | (60,716,887 | ) | | (1,563,918 | ) | | | (22,463,078 | ) |
| | |
| |
Net increase (decrease) | | 82,948,636 | | | $ | 1,280,624,618 | | | 60,443,949 | | | $ | 877,594,642 | |
| | |
| |
3. TRANSACTIONS WITH AFFILIATES
Franklin Resources, Inc. is the holding company for various subsidiaries that together are referred to as Franklin Templeton Investments. Certain officers and trustees of the Trust are also officers and/or directors of the following subsidiaries:
| | |
| Subsidiary | | Affiliation |
Franklin Advisers, Inc. (Advisers) | | Investment manager |
Franklin Templeton Services, LLC (FT Services) | | Administrative manager |
Franklin Templeton Distributors, Inc. (Distributors) | | Principal underwriter |
Franklin Templeton Investor Services, LLC (Investor Services) | | Transfer agent |
a. Management Fees
The Fund pays an investment management fee to Advisers based on the average daily net assets of the Fund as follows:
| | |
| Annualized Fee Rate | | Net Assets |
| .625% | | Up to and including $100 million |
| .500% | | Over $100 million, up to and including $250 million |
| .450% | | Over $250 million, up to and including $10 billion |
| .440% | | Over $10 billion, up to and including $12.5 billion |
| .420% | | Over $12.5 billion, up to and including $15 billion |
| .400% | | In excess of $15 billion |
b. Administrative Fees
Under an agreement with Advisers, FT Services provides administrative services to the Fund. The fee is paid by Advisers based on average daily net assets and is not an additional expense of the Fund.
FI-24
Franklin Templeton Variable Insurance Products Trust
Notes to Financial Statements (continued)
Franklin Income Securities Fund
3. TRANSACTIONS WITH AFFILIATES (continued)
c. Distribution Fees
The Fund’s Board of Trustees has adopted distribution plans for Class 2 shares pursuant to Rule 12b-1 under the 1940 Act. Under the Fund’s compensation distribution plans, the Fund pays Distributors for costs incurred in connection with the sale and distribution of the Fund’s shares up to 0.35% per year of its average daily net assets. The Board of Trustees has set the current rate at 0.25% per year.
d. Transfer Agent Fees
Investor Services, under terms of an agreement, performs shareholder servicing for the Fund and is not paid by the Fund for the services.
4. EXPENSE OFFSET ARRANGEMENT
The Fund has entered into an arrangement with its custodian whereby credits realized as a result of uninvested cash balances are used to reduce a portion of the Fund’s custodian expenses. During the year ended December 31, 2005, the custodian fees were reduced as noted in the Statement of Operations.
5. INCOME TAXES
The tax character of distributions paid during the years ended December 31, 2005 and 2004, was as follows:
| | | | | | |
| | | 2005
| | 2004
|
Distributions paid from ordinary income | | $ | 103,188,638 | | $ | 48,299,813 |
At December 31, 2005, the cost of investments, net unrealized appreciation (depreciation) and undistributed ordinary income for income tax purposes were as follows:
| | | | |
Cost of investments | | $ | 3,201,041,821 | |
| | |
|
|
|
| |
Unrealized appreciation | | $ | 237,957,510 | |
Unrealized depreciation | | | (151,693,352 | ) |
| | |
|
|
|
Net unrealized appreciation (depreciation) | | $ | 86,264,158 | |
| | |
|
|
|
Undistributed ordinary income | | $ | 153,320,080 | |
Undistributed long term capital gains | | | 11,156,677 | |
| | |
|
|
|
Distributable earnings | | $ | 164,476,757 | |
| | |
|
|
|
Net investment income (loss) differs for financial statement and tax purposes primarily due to differing treatments of defaulted securities, foreign currency transactions, mortgage dollar rolls, paydown losses and bond discounts and premiums.
Net realized gains (losses) differ for financial statement and tax purposes primarily due to differing treatments of wash sales, foreign currency transactions, mortgage dollar rolls, paydown losses and bond discounts and premiums.
6. INVESTMENT TRANSACTIONS
Purchases and sales of investments (excluding short term securities) for the year ended December 31, 2005, aggregated $2,166,944,709 and $867,955,290, respectively.
FI-25
Franklin Templeton Variable Insurance Products Trust
Notes to Financial Statements (continued)
Franklin Income Securities Fund
7. CREDIT RISK AND DEFAULTED SECURITIES
The Fund has 30.00% of its portfolio invested in below investment grade and comparable quality unrated high yield securities, which tend to be more sensitive to economic conditions than higher rated securities. The risk of loss due to default by the issuer may be significantly greater for the holders of high yielding securities because such securities are generally unsecured and are often subordinated to other creditors of the issuer.
The Fund held defaulted securities and/or other securities for which the income has been deemed uncollectible. At December 31, 2005, the value of these securities was $75,079,296, representing 2.26% of the Fund’s net assets. The Fund discontinues accruing income on securities for which income has been deemed uncollectible and provides an estimate for losses on interest receivable. The securities have been identified on the accompanying Statement of Investments.
8. RESTRICTED AND ILLIQUID SECURITIES
At December 31, 2005, investments in securities included issues that are restricted and illiquid. Restricted securities are often purchased in private placement transactions, and cannot be sold without prior registration under the Securities Act of 1933, unless the sale is pursuant to an exemption under the 1933 Act. The Fund has registration rights for all restricted securities held at period end. The issuer generally incurs all registration costs.
A security may be considered illiquid if it lacks a readily available market or if its valuation has not changed for a certain period of time. At December 31, 2005, the Fund held investments in restricted and illiquid securities, valued in accordance with procedures approved by the Trust’s Board of Trustees as reflecting fair value, as follows:
| | | | | | | | | | |
| Shares | | Issuer | | Acquisition
Date | | Cost | | Value |
| 10,073,000 | | Asia Pulp & Paper Co. Ltd. 12.00%, pfd., Perpetual (0.00% of Net Assets)a | | 2/14/97 | | $ | 7,620,963 | | $ | 109,796 |
| a | Rounds to less than 0.005% of net assets. |
9. OTHER CONSIDERATIONS
Subject to certain terms and conditions, the Fund has agreed to sell its holdings of Asia Pulp & Paper Co. Ltd. in November 2006. Until the completion of the sale, the transaction is being accounted for as a secured borrowing with a pledge of collateral and any preliminary sales proceeds or other interest and cash distributions received are deferred until the completion of the transaction and are recorded as part of the net sales proceeds.
Directors or employees of Advisers, as the Fund’s Investment Manager, may serve as members of various bondholders’ steering committees, on credit committees, or may represent the Funds in certain corporate restructuring negotiations. At January 6, 2006, such individuals serve in one or more of these capacities for Calpine Corp. As a result of this involvement, such individuals may be in possession of certain material non-public information. If the Fund’s Investment Manager, while in possession of such information, seeks to sell any of its holdings in theses securities it will comply with all applicable federal securities laws.
10. REGULATORY MATTERS
As part of various investigations by a number of federal, state, and foreign regulators and governmental entities, relating to certain practices in the mutual fund industry, including late trading, market timing and marketing support payments to securities dealers who sell fund shares, Franklin Resources, Inc. and certain of its subsidiaries (collectively, the “Company”), entered into settlements with certain of those regulators.
FI-26
Franklin Templeton Variable Insurance Products Trust
Notes to Financial Statements (continued)
Franklin Income Securities Fund
10. REGULATORY MATTERS (continued)
Specifically, the Company entered into settlements with the Securities and Exchange Commission (“SEC”) concerning market timing (the “August 2, 2004 SEC Order”) and marketing support payments to securities dealers who sell fund shares (the “December 13, 2004 SEC Order”) and with the California Attorney General’s Office (“CAGO”) concerning marketing support payments to securities dealers who sell fund shares (the “CAGO Settlement”). Under the terms of the settlements with the SEC and the CAGO, the Company retained an Independent Distribution Consultant (“IDC”) to develop a plan for distribution of the respective settlement monies. The CAGO approved the distribution plan under the CAGO Settlement and, in accordance with the terms and conditions of that settlement, the monies were disbursed to the relevant funds and are recorded as other income in the current period. The SEC has not yet approved the distribution plan pertaining to the December 13, 2004 SEC Order. When approved, disbursements of settlement monies will be made promptly to the relevant funds, in accordance with the terms and conditions of that order. The IDC continues to develop the plan of distribution under the August 2, 2004 SEC Order that resolved the SEC’s market timing investigation.
In addition, the Company, as well as most of the mutual funds within Franklin Templeton Investments and certain current or former officers, directors, and/or employees, have been named in private lawsuits (styled as shareholder class actions, or as derivative actions on behalf of either the named funds or Franklin Resources, Inc.) relating to the industry practices referenced above, as well as to allegedly excessive advisory fees, commissions, and/or 12b-1 fees. The lawsuits were filed in different courts throughout the country. Many of those suits are now pending in a multi-district litigation in the United States District Court for the District of Maryland.
The Company and fund management strongly believe that the claims made in each of the private lawsuits referenced above are without merit and intend to defend against them vigorously. The Company cannot predict with certainty the eventual outcome of these lawsuits, nor whether they will have a material negative impact on the Company. If it is determined that the Company bears responsibility for any unlawful or inappropriate conduct that caused losses to the Trust, it is committed to making the Trust or their shareholders whole, as appropriate.
FI-27
Franklin Templeton Variable Insurance Products Trust
Franklin Income Securities Fund
Report of Independent Registered Public Accounting Firm
To the Board of Trustees and Shareholders of Franklin Templeton Variable Insurance Products Trust
In our opinion, the accompanying statement of assets and liabilities, including the statement of investments, and the related statements of operations and of changes in net assets and the financial highlights present fairly, in all material respects, the financial position of Franklin Income Securities Fund (one of the funds constituting Franklin Templeton Variable Insurance Products Trust, hereafter referred to as the “Fund”) at December 31, 2005, the results of its operations for the year then ended, the changes in its net assets for each of the two years in the period then ended and the financial highlights for each of the five years in the period then ended, in conformity with accounting principles generally accepted in the United States of America. These financial statements and financial highlights (hereafter referred to as “financial statements”) are the responsibility of the Fund’s management; our responsibility is to express an opinion on these financial statements based on our audits. We conducted our audits of these financial statements in accordance with the standards of the Public Company Accounting Oversight Board (United States). Those standards require that we plan and perform the audit to obtain reasonable assurance about whether the financial statements are free of material misstatement. An audit includes examining, on a test basis, evidence supporting the amounts and disclosures in the financial statements, assessing the accounting principles used and significant estimates made by management, and evaluating the overall financial statement presentation. We believe that our audits, which included confirmation of securities at December 31, 2005, by correspondence with the custodian, provide a reasonable basis for our opinion.
PricewaterhouseCoopers LLP
San Francisco, California
February 10, 2006
FI-28
Franklin Templeton Variable Insurance Products Trust
Tax Designation (unaudited)
Franklin Income Securities Fund
Under Section 852(b)(3)(C) of the Internal Revenue Code (Code), the Fund designates the maximum amount allowable but no less than $11,156,677 as a capital gain dividend for the fiscal year ended December 31, 2005.
Under Section 854(b)(2) of the Code, the Fund designates 42.29% of the ordinary income dividends as income qualifying for the dividends received deduction for the fiscal year ended December 31, 2005.
FI-29
FI-
FRANKLIN LARGE CAP GROWTH SECURITIES FUND
This annual report for Franklin Large Cap Growth Securities Fund covers the fiscal year ended December 31, 2005.
Performance Summary as of 12/31/05
Average annual total return of Class 1 shares represents the average annual change in value, assuming reinvestment of dividends and capital gains. Average returns smooth out variations in returns, which can be significant; they are not the same as year-by-year results.
Periods ended 12/31/05
| | | | | | |
| | | 1-Year | | 5-Year | | Since
Inception
(5/1/96) |
Average Annual Total Return | | +1.31% | | -0.95% | | +8.21% |
Total Return Index Comparison for Hypothetical $10,000 Investment (5/1/96–12/31/05)
The graph below shows the change in value of a hypothetical $10,000 investment in the Fund over the indicated period and includes reinvestment of any income or distributions. The Fund’s performance is compared to the performance of the Standard & Poor’s 500 Index (S&P 500) and the Russell 1000® Growth Index. One cannot invest directly in an index, nor is an index representative of the Fund’s portfolio. Please see Important Notes to Performance Information preceding the Fund Summaries.
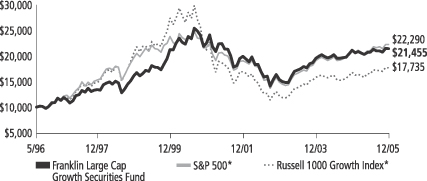
*Source: Standard & Poor’s Micropal. Please see Index Descriptions following the Fund Summaries.
Franklin Large Cap Growth Securities Fund Class 1
Performance reflects the Fund’s Class 1 operating expenses, but does not include any contract fees, expenses or sales charges. If they had been included, performance would be lower. These charges and deductions, particularly for variable life policies, can have a significant effect on contract values and insurance benefits. See the contract prospectus for a complete description of these expenses, including sales charges.
Performance data represent past performance, which does not guarantee future results. Investment return and principal value will fluctuate, and you may have a gain or loss when you sell your shares.
Current performance may differ from figures shown.
FLG-1
Fund Goal and Main Investments: Franklin Large Cap Growth Securities Fund seeks capital appreciation. The Fund normally invests at least 80% of its net assets in investments of large capitalization companies. Large capitalization companies are those with market capitalization values within those of the top 50% of companies in the Russell 1000 Index at the time of purchase.1 The Fund invests primarily to predominantly in equity securities and may also invest in foreign securities.
Performance Overview
You can find the Fund’s one-year total return in the Performance Summary. The Fund underperformed its benchmarks, the Russell 1000 Growth Index and the S&P 500, which returned +5.26% and +4.91% for the year under review.2
Economic and Market Overview
During the 12 months ended December 31, 2005, U.S. economic expansion was driven by strength across most industries, sectors and regions. Gross domestic product (GDP) rose during the period, benefiting from increased personal consumption, federal spending and business investment, which increased 24% in third quarter 2005 compared with the same quarter in 2004.3 Slower export growth combined with greater demand for imported goods and materials fueled a widening trade gap. The U.S. dollar rallied in 2005, supported by rising short-term domestic interest rates and strong economic growth in the U.S. relative to many of its major trading partners.
Many businesses enjoyed record profits, propelled largely by productivity gains. Earnings for companies in the S&P 500 were estimated to have increased 13% in 2005.4 The labor market firmed as employment increased and the unemployment rate dropped from 5.4% to 4.9% during the reporting period. Personal income rose, and hiring rebounded in many industries, bolstered by healthy business spending.
1. Please see Index Descriptions following the Fund Summaries.
2. Source: Standard & Poor’s Micropal. One cannot invest directly in an index, nor is an index representative of the Fund’s portfolio. Please see Index Descriptions following the Fund Summaries.
3. Source: Thomson Financial. Based on companies in the S&P 500.
4. Source: Standard & Poor’s.
Fund Risks: The Fund’s investments in stocks offer the potential for long-term gains but can be subject to short-term up-and-down price movements. Large-capitalization stocks tend to go through cycles of doing better – or worse – than the stock market in general, and, in the past, these periods have lasted for several years. By focusing on particular sectors from time to time, such as the technology sector, which has been among the market’s most volatile sectors, the Fund carries greater risk of adverse developments in a sector than a fund that always invests in a wide variety of sectors. Foreign investing involves special risks including currency fluctuations, economic instability, and social and political developments. The Fund’s prospectus also includes a description of the main investment risks.
FLG-2
Oil prices remained high during the period largely due to potential long-term supply limitations and strong growth in global demand, especially from China and India. Natural gas prices rose during the second half of 2005 mainly because of expected rising demand with the onset of winter; however, near period-end prices retreated somewhat amid milder-than-expected weather conditions. Even with high commodity prices, inflation remained relatively contained for the 12 months ended December 31, 2005, as measured by the 2.2% rise for the core Consumer Price Index (CPI).5
Despite this inflation picture, the Federal Reserve Board raised the federal funds target rate from 2.25% to 4.25%. Compared with the rise in short-term interest rates, long-term rates remained relatively stable, supporting overall robust housing and commercial real estate activity, which contributed to economic growth. Throughout 2005, as short- and intermediate-term interest rates rose, the yield curve moved from a fairly normal steepness at the beginning of the period to relatively flat by the end of 2005.
In this environment, the blue chip stocks of the Dow Jones Industrial Average posted a one-year total return of +1.72%, while the broader S&P 500 and the technology-heavy NASDAQ Composite Index returned +4.91% and +2.12%.6
Investment Strategy
We are research driven, fundamental investors pursuing a growth strategy. As bottom-up investors focusing primarily on individual securities, we seek companies that have identifiable drivers of future earnings growth and that present, in our opinion, the best trade-off between that potential earnings growth, business and financial risk and valuation. We rely on a team of analysts to help provide in-depth industry expertise and use both qualitative and quantitative analysis to evaluate companies for distinct, sustainable and competitive advantages likely to lead to growth in earnings and/or share price. Competitive advantages such as a particular product niche, proven technology, sound financial profits and records or strong management are all factors we believe may contribute to growth in earnings or share price.
5. Source: Bureau of Labor Statistics. Core CPI excludes food and energy costs.
6. Source: Standard & Poor’s Micropal. Please see Index Descriptions following the Fund Summaries.
What is the yield curve?
The yield curve is a graph illustrating the yields on bonds of the same credit quality with maturities ranging from the shortest to the longest available. The resulting curve shows if short-term interest rates are higher or lower than longer-term rates.
FLG-3
Manager’s Discussion
Looking back at the key factors impacting the Fund’s returns during the 12 months under review, we would like to remind shareholders that our investment strategy is primarily bottom-up and driven by individual stock selection. We recognize, however, that our investors have an interest in a top-down, sector-by-sector discussion of key performance drivers.
On a sector basis, the top contributor to performance in 2005 was the Fund’s position in the health services sector. Relative to an equally weighted blend of the S&P 500 and Russell 1000 Growth Indexes, our overweighted positions in managed health care provider Health Net and hospital operator HCA, as well as favorable stock selection in the sector, boosted performance. The Fund also benefited from exposure to the distribution services sector, with medical products distributors McKesson and AmerisourceBergen as notable contributors. In the finance sector, Fund performance gained from overweighted positions in investment management firm Federated Investors, insurer AFLAC and investment banking and brokerage firm Lehman Brothers Holdings. Other major contributors to the Fund’s performance relative to its benchmarks included overweighted positions in energy-related firms Devon Energy and Anadarko Petroleum, and energy services provider Schlumberger.
The Fund’s most significant detractor from performance on a sector basis during the reporting period was the health technology sector. Our health technology holdings Boston Scientific and Pfizer declined in value and hurt returns. The Fund’s lack of exposure to United Health Group and Genentech also had a negative effect on relative performance. In addition, overweighted positions in computer printer company Lexmark International, and media and newspaper publishing firm Gannett dragged on relative performance, as did an underweighted position in technology company Apple Computer and lack of exposure to consumer staples company Gillette.
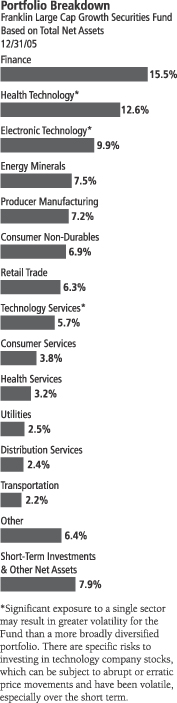
FLG-4
As we ended fiscal year 2005, the Fund was overweighted in the energy minerals sector, which comprised integrated oil, natural gas and coal related companies. We believe in the sector’s long-term secular growth potential with reasonable valuations. At period-end, the Fund’s finance sector allocation was overweighted relative to the Russell 1000 Growth Index and underweighted relative to the S&P 500. As we adhered to our investment strategy, this weighting reflected companies we believe have favorable risk-return characteristics based on our assessment of their future growth prospects and valuations.
Thank you for your participation in Franklin Large Cap Growth Securities Fund. We look forward to serving your future investment needs.
The foregoing information reflects our analysis, opinions and portfolio holdings as of December 31, 2005, the end of the reporting period. The way we implement our main investment strategies and the resulting portfolio holdings may change depending on factors such as market and economic conditions. These opinions may not be relied upon as investment advice or an offer for a particular security. The information is not a complete analysis of every aspect of any market, country, industry, security or the Fund. Statements of fact are from sources considered reliable, but the adviser makes no representation or warranty as to their completeness or accuracy. Although historical performance is no guarantee of future results, these insights may help you understand our investment management philosophy.
Top 10 Holdings
Franklin Large Cap Growth
Securities Fund
12/31/05
| | |
Company
Sector/Industry | | % of Total
Net Assets |
| |
| General Electric Co. | | 3.1% |
| Producer Manufacturing | | |
| |
| Johnson & Johnson | | 2.7% |
| Health Technology | | |
| |
| Exxon Mobil Corp. | | 2.6% |
| Energy Minerals | | |
| |
| Microsoft Corp. | | 1.8% |
| Technology Services | | |
| |
| Citigroup Inc. | | 1.8% |
| Finance | | |
| |
| Bank of America Corp. | | 1.7% |
| Finance | | |
| |
| Health Net Inc., A | | 1.7% |
| Health Services | | |
| |
| Boston Scientific Corp. | | 1.5% |
| Health Technology | | |
| |
| Pfizer Inc. | | 1.5% |
| Health Technology | | |
| |
| Intel Corp. | | 1.5% |
| Electronic Technology | | |
The dollar value, number of shares or principal amount, and names of all portfolio holdings are listed in the Fund’s Statement of Investments.
FLG-5
Fund Expenses
As an investor in a variable insurance contract (“Contract”) that indirectly provides for investment in an underlying mutual fund, you can incur transaction and/or ongoing expenses at both the Fund level and the Contract level.
| • | | Transaction expenses can include sales charges (loads) on purchases, redemption fees, surrender fees, transfer fees and premium taxes. |
| • | | Ongoing expenses can include management fees, distribution and service (12b-1) fees, contract fees, annual maintenance fees, mortality and expense risk fees and other fees and expenses. All mutual funds and Contracts have some types of ongoing expenses. |
The expenses shown in the table below are meant to highlight ongoing expenses at the Fund level only and do not include ongoing expenses at the Contract level, or transaction expenses at either the Fund or Contract level. While the Fund does not have transaction expenses, if the transaction and ongoing expenses at the Contract level were included, the expenses shown below would be higher. You should consult your Contract prospectus or disclosure document for more information.
The table shows Fund-level ongoing expenses and can help you understand these expenses and compare them with those of other mutual funds offered through the Contract. The table assumes a $1,000 investment held for the six months indicated. Please refer to the Fund prospectus for additional information on operating expenses.
Actual Fund Expenses
The first line (Actual) of the table below provides actual account values and expenses. The “Ending Account Value” is derived from the Fund’s actual return, which includes the effect of ongoing Fund expenses, but does not include the effect of ongoing Contract expenses.
You can estimate the Fund-level expenses you incurred during the period by following these steps. Of course, your account value and expenses will differ from those in this illustration:
| 1. | Divide your account value by $1,000. |
If an account had an $8,600 value, then $8,600 ÷ $1,000 = 8.6.
| 2. | Multiply the result by the number under the heading “Fund-Level Expenses Incurred During Period.” |
If Fund-Level Expenses Incurred During Period were $7.50, then 8.6 × $7.50 = $64.50.
Franklin Large Cap Growth Securities Fund Class 1
FLG-6
In this illustration, the estimated expenses incurred this period at the Fund level are $64.50.
Hypothetical Example for Comparison with Other Mutual Funds
Information in the second line (Hypothetical) of the table can help you compare ongoing expenses of the Fund with those of other mutual funds offered through the Contract. This information may not be used to estimate the actual ending account balance or expenses you incurred during the period. The hypothetical “Ending Account Value” is based on the Fund’s actual expense ratio and an assumed 5% annual rate of return before expenses, which does not represent the Fund’s actual return. The figure under the heading “Fund-Level Expenses Incurred During Period” shows the hypothetical expenses your account would have incurred under this scenario. You can compare this figure with the 5% hypothetical examples that appear in shareholder reports of other funds offered through a Contract.
| | | | | | | | | |
| Class 1 | | Beginning
Account
Value 7/1/05 | | Ending
Account
Value 12/31/05 | | Fund-Level
Expenses Incurred
During Period*
7/1/05-12/31/05 |
Actual | | $ | 1,000 | | $ | 1,032.00 | | $ | 3.84 |
Hypothetical (5% return before expenses) | | $ | 1,000 | | $ | 1,021.42 | | $ | 3.82 |
*Expenses are equal to the annualized expense ratio for the Fund’s Class 1 shares (0.75%), which does not include any ongoing expenses of the Contract for which the Fund is an investment option, multiplied by the average account value over the period, multiplied by 184/365 to reflect the one-half year period.
FLG-7
Franklin Templeton Variable Insurance Products Trust
Financial Highlights
Franklin Large Cap Growth Securities Fund
| | | | | | | | | | | | | | | | | | | | |
| | | Year Ended December 31,
| |
| Class 1 | | 2005 | | | 2004 | | | 2003 | | | 2002 | | | 2001 | |
| | |
|
|
|
Per share operating performance | | | | | | | | | | | | | | | | | | | | |
(for a share outstanding throughout the year) | | | | | | | | | | | | | | | | | | | | |
Net asset value, beginning of year | | $ | 15.08 | | | $ | 14.01 | | | $ | 11.10 | | | $ | 14.52 | | | $ | 21.03 | |
| | |
|
|
|
Income from investment operations: | | | | | | | | | | | | | | | | | | | | |
Net investment incomea | | | 0.17 | | | | 0.13 | | | | 0.10 | | | | 0.09 | | | | 0.10 | |
Net realized and unrealized gains (losses) | | | 0.02 | | | | 1.02 | | | | 2.90 | | | | (3.41 | ) | | | (2.13 | ) |
| | |
|
|
|
Total from investment operations | | | 0.19 | | | | 1.15 | | | | 3.00 | | | | (3.32 | ) | | | (2.03 | ) |
| | |
|
|
|
Less distributions from: | | | | | | | | | | | | | | | | | | | | |
Net investment income | | | (0.10 | ) | | | (0.08 | ) | | | (0.09 | ) | | | (0.10 | ) | | | (0.11 | ) |
Net realized gains | | | — | | | | — | | | | — | | | | — | | | | (4.37 | ) |
| | |
|
|
|
Total distributions | | | (0.10 | ) | | | (0.08 | ) | | | (0.09 | ) | | | (0.10 | ) | | | (4.48 | ) |
| | |
|
|
|
Net asset value, end of year | | $ | 15.17 | | | $ | 15.08 | | | $ | 14.01 | | | $ | 11.10 | | | $ | 14.52 | |
| | |
|
|
|
| | | | | |
Total returnb | | | 1.31% | | | | 8.23% | | | | 27.14% | | | | (22.94)% | | | | (11.26)% | |
Ratios/supplemental data | | | | | | | | | | | | | | | | | | | | |
Net assets, end of year (000’s) | | $ | 136,464 | | | $ | 169,107 | | | $ | 191,028 | | | $ | 175,917 | | | $ | 300,135 | |
Ratios to average net assets: | | | | | | | | | | | | | | | | | | | | |
Expenses | | | 0.76% | | | | 0.79% | | | | 0.79% | | | | 0.80% | | | | 0.78% | |
Net investment income | | | 1.14% | | | | 0.99% | | | | 0.86% | | | | 0.73% | | | | 0.56% | |
Portfolio turnover rate | | | 39.44% | | | | 38.48% | | | | 35.28% | | | | 59.65% | | | | 75.67% | |
aBased on average daily shares outstanding.
bTotal return does not include any fees, charges or expenses imposed by the variable annuity and life insurance contracts for which the Franklin Templeton Variable Insurance Products Trust serves as an underlying investment vehicle.
See notes to financial statements.
FLG-8
Franklin Templeton Variable Insurance Products Trust
Financial Highlights (continued)
Franklin Large Cap Growth Securities Fund (continued)
| | | | | | | | | | | | | | | | | | | | |
| | | Year Ended December 31,
| |
| Class 2 | | 2005 | | | 2004 | | | 2003 | | | 2002 | | | 2001 | |
| | |
|
|
|
Per share operating performance | | | | | | | | | | | | | | | | | | | | |
(for a share outstanding throughout the year) | | | | | | | | | | | | | | | | | | | | |
Net asset value, beginning of year | | $ | 14.90 | | | $ | 13.87 | | | $ | 11.00 | | | $ | 14.43 | | | $ | 20.93 | |
| | |
|
|
|
Income from investment operations: | | | | | | | | | | | | | | | | | | | | |
Net investment incomea | | | 0.13 | | | | 0.11 | | | | 0.08 | | | | 0.07 | | | | 0.05 | |
Net realized and unrealized gains (losses) | | | 0.03 | | | | 0.99 | | | | 2.87 | | | | (3.40 | ) | | | (2.12 | ) |
| | |
|
|
|
Total from investment operations | | | 0.16 | | | | 1.10 | | | | 2.95 | | | | (3.33 | ) | | | (2.07 | ) |
| | |
|
|
|
Less distributions from: | | | | | | | | | | | | | | | | | | | | |
Net investment income | | | (0.09 | ) | | | (0.07 | ) | | | (0.08 | ) | | | (0.10 | ) | | | (0.06 | ) |
Net realized gains | | | — | | | | — | | | | — | | | | — | | | | (4.37 | ) |
| | |
|
|
|
Total distributions | | | (0.09 | ) | | | (0.07 | ) | | | (0.08 | ) | | | (0.10 | ) | | | (4.43 | ) |
| | |
|
|
|
Net asset value, end of year | | $ | 14.97 | | | $ | 14.90 | | | $ | 13.87 | | | $ | 11.00 | | | $ | 14.43 | |
| | |
|
|
|
| | | | | |
Total returnb | | | 1.06% | | | | 7.93% | | | | 26.95% | | | | (23.19)% | | | | (11.43)% | |
Ratios/supplemental data | | | | | | | | | | | | | | | | | | | | |
Net assets, end of year (000’s) | | $ | 510,395 | | | $ | 340,465 | | | $ | 128,029 | | | $ | 30,289 | | | $ | 5,290 | |
Ratios to average net assets: | | | | | | | | | | | | | | | | | | | | |
Expenses | | | 1.01% | | | | 1.04% | | | | 1.04% | | | | 1.05% | | | | 1.03% | |
Net investment income | | | 0.89% | | | | 0.74% | | | | 0.61% | | | | 0.48% | | | | 0.30% | |
Portfolio turnover rate | | | 39.44% | | | | 38.48% | | | | 35.28% | | | | 59.65% | | | | 75.67% | |
aBased on average daily shares outstanding.
bTotal return does not include any fees, charges or expenses imposed by the variable annuity and life insurance contracts for which the Franklin Templeton Variable Insurance Products Trust serves as an underlying investment vehicle.
See notes to financial statements.
FLG-9
Franklin Templeton Variable Insurance Products Trust
Statement of Investments, December 31, 2005
| | | | | | | |
| Franklin Large Cap Growth Securities Fund | | Country | | Shares | | Value |
Common Stocks 92.1% | | | | | | | |
Communications 1.8% | | | | | | | |
Alltel Corp. | | United States | | 38,000 | | $ | 2,397,800 |
Sprint Nextel Corp. | | United States | | 253,725 | | | 5,927,016 |
Verizon Communications Inc. | | United States | | 108,200 | | | 3,258,984 |
| | | | | | |
|
|
| | | | | | | | 11,583,800 |
| | | | | | |
|
|
Consumer Durables 1.3% | | | | | | | |
aActivision Inc. | | United States | | 249,000 | | | 3,421,260 |
aElectronic Arts Inc. | | United States | | 98,300 | | | 5,142,073 |
| | | | | | |
|
|
| | | | | | | | 8,563,333 |
| | | | | | |
|
|
Consumer Non-Durables 6.9% | | | | | | | |
Altria Group Inc. | | United States | | 105,900 | | | 7,912,848 |
Anheuser-Busch Cos. Inc. | | United States | | 172,400 | | | 7,406,304 |
The Coca-Cola Co. | | United States | | 124,300 | | | 5,010,533 |
aDean Foods Co. | | United States | | 41,600 | | | 1,566,656 |
Molson Coors Brewing Co., B | | United States | | 48,900 | | | 3,275,811 |
PepsiCo Inc. | | United States | | 86,600 | | | 5,116,328 |
Procter & Gamble Co. | | United States | | 120,100 | | | 6,951,388 |
Sara Lee Corp. | | United States | | 232,200 | | | 4,388,580 |
Unilever PLC, ADR | | United Kingdom | | 77,000 | | | 3,089,240 |
| | | | | | |
|
|
| | | | | | | | 44,717,688 |
| | | | | | |
|
|
Consumer Services 3.8% | | | | | | | |
aeBay Inc. | | United States | | 37,100 | | | 1,604,575 |
Gannett Co. Inc. | | United States | | 124,900 | | | 7,565,193 |
aUnivision Communications Inc., A | | United States | | 140,283 | | | 4,122,917 |
Viacom Inc., B | | United States | | 193,000 | | | 6,291,800 |
The Walt Disney Co. | | United States | | 210,700 | | | 5,050,479 |
| | | | | | |
|
|
| | | | | | | | 24,634,964 |
| | | | | | |
|
|
Distribution Services 2.4% | | | | | | | |
AmerisourceBergen Corp. | | United States | | 77,200 | | | 3,196,080 |
Cardinal Health Inc. | | United States | | 44,300 | | | 3,045,625 |
McKesson Corp. | | United States | | 72,300 | | | 3,729,957 |
Sysco Corp. | | United States | | 185,100 | | | 5,747,355 |
| | | | | | |
|
|
| | | | | | | | 15,719,017 |
| | | | | | |
|
|
Electronic Technology 9.9% | | | | | | | |
aApple Computer Inc. | | United States | | 29,200 | | | 2,099,188 |
Applied Materials Inc. | | United States | | 181,000 | | | 3,247,140 |
The Boeing Co. | | United States | | 36,700 | | | 2,577,808 |
aCisco Systems Inc. | | United States | | 513,500 | | | 8,791,120 |
aDell Inc. | | United States | | 278,800 | | | 8,361,212 |
Diebold Inc. | | United States | | 76,600 | | | 2,910,800 |
Empresa Brasileira de Aeronautica SA, ADR | | Brazil | | 55,600 | | | 2,173,960 |
aFLIR Systems Inc. | | United States | | 51,900 | | | 1,158,927 |
Intel Corp. | | United States | | 389,900 | | | 9,731,904 |
aLexmark International Inc., A | | United States | | 93,100 | | | 4,173,673 |
Maxim Integrated Products Inc. | | United States | | 67,700 | | | 2,453,448 |
aNetwork Appliance Inc. | | United States | | 145,000 | | | 3,915,000 |
Nokia Corp., ADR | | Finland | | 445,600 | | | 8,154,480 |
QUALCOMM Inc. | | United States | | 93,000 | | | 4,006,440 |
| | | | | | |
|
|
| | | | | | | | 63,755,100 |
| | | | | | |
|
|
FLG-10
Franklin Templeton Variable Insurance Products Trust
Statement of Investments, December 31, 2005 (continued)
| | | | | | | |
| Franklin Large Cap Growth Securities Fund | | Country | | Shares | | Value |
Common Stocks (cont.) | | | | | | | |
Energy Minerals 7.5% | | | | | | | |
Anadarko Petroleum Corp. | | United States | | 55,000 | | $ | 5,211,250 |
Chesapeake Energy Corp. | | United States | | 105,000 | | | 3,331,650 |
Chevron Corp. | | United States | | 104,500 | | | 5,932,465 |
ConocoPhillips | | United States | | 84,700 | | | 4,927,846 |
Devon Energy Corp. | | United States | | 112,000 | | | 7,004,480 |
Exxon Mobil Corp. | | United States | | 300,000 | | | 16,851,000 |
Royal Dutch Shell PLC, A, ADR | | United Kingdom | | 84,000 | | | 5,165,160 |
| | | | | | |
|
|
| | | | | | | | 48,423,851 |
| | | | | | |
|
|
Finance 15.5% | | | | | | | |
AFLAC Inc. | | United States | | 81,300 | | | 3,773,946 |
The Allstate Corp. | | United States | | 78,600 | | | 4,249,902 |
American International Group Inc. | | United States | | 107,100 | | | 7,307,433 |
Bank of America Corp. | | United States | | 240,300 | | | 11,089,845 |
The Bank of New York Co. Inc. | | United States | | 166,400 | | | 5,299,840 |
aBerkshire Hathaway Inc., B | | United States | | 974 | | | 2,859,177 |
Citigroup Inc. | | United States | | 236,400 | | | 11,472,492 |
Fannie Mae | | United States | | 45,500 | | | 2,220,855 |
Federated Investors Inc., B | | United States | | 119,100 | | | 4,411,464 |
Fifth Third Bancorp | | United States | | 168,300 | | | 6,348,276 |
Freddie Mac | | United States | | 91,600 | | | 5,986,060 |
JPMorgan Chase & Co. | | United States | | 193,840 | | | 7,693,510 |
Lehman Brothers Holdings Inc. | | United States | | 19,800 | | | 2,537,766 |
Marsh & McLennan Cos. Inc. | | United States | | 141,000 | | | 4,478,160 |
MBNA Corp. | | United States | | 120,100 | | | 3,260,715 |
Morgan Stanley | | United States | | 76,800 | | | 4,357,632 |
Old Republic International Corp. | | United States | | 119,400 | | | 3,135,444 |
Wachovia Corp. | | United States | | 45,400 | | | 2,399,844 |
Wells Fargo & Co. | | United States | | 75,000 | | | 4,712,250 |
XL Capital Ltd., A | | Bermuda | | 37,900 | | | 2,553,702 |
| | | | | | |
|
|
| | | | | | | | 100,148,313 |
| | | | | | |
|
|
Health Services 3.2% | | | | | | | |
HCA Inc. | | United States | | 69,900 | | | 3,529,950 |
aHealth Net Inc., A | | United States | | 208,000 | | | 10,722,400 |
aLifePoint Hospitals Inc. | | United States | | 44,000 | | | 1,650,000 |
aWellPoint Inc. | | United States | | 60,000 | | | 4,787,400 |
| | | | | | |
|
|
| | | | | | | | 20,689,750 |
| | | | | | |
|
|
Health Technology 12.6% | | | | | | | |
Abbott Laboratories | | United States | | 68,800 | | | 2,712,784 |
aAmgen Inc. | | United States | | 99,400 | | | 7,838,684 |
Biomet Inc. | | United States | | 82,930 | | | 3,032,750 |
aBoston Scientific Corp. | | United States | | 399,300 | | | 9,778,857 |
aCharles River Laboratories International Inc. | | United States | | 148,400 | | | 6,287,708 |
Eli Lilly and Co. | | United States | | 73,300 | | | 4,148,047 |
aInvitrogen Corp. | | United States | | 35,100 | | | 2,339,064 |
Johnson & Johnson | | United States | | 294,200 | | | 17,681,420 |
Medtronic Inc. | | United States | | 103,300 | | | 5,946,981 |
Merck & Co. Inc. | | United States | | 118,500 | | | 3,769,485 |
Pfizer Inc. | | United States | | 418,600 | | | 9,761,752 |
Roche Holding AG, ADR | | Switzerland | | 45,800 | | | 3,462,480 |
aZimmer Holdings Inc. | | United States | | 74,500 | | | 5,024,280 |
| | | | | | |
|
|
| | | | | | | | 81,784,292 |
| | | | | | |
|
|
FLG-11
Franklin Templeton Variable Insurance Products Trust
Statement of Investments, December 31, 2005 (continued)
| | | | | | | |
| Franklin Large Cap Growth Securities Fund | | Country | | Shares | | Value |
Common Stocks (cont.) | | | | | | | |
Industrial Services 1.1% | | | | | | | |
Schlumberger Ltd. | | United States | | 50,000 | | $ | 4,857,500 |
The Williams Cos. Inc. | | United States | | 104,600 | | | 2,423,582 |
| | | | | | |
|
|
| | | | | | | | 7,281,082 |
| | | | | | |
|
|
Non-Energy Minerals 0.9% | | | | | | | |
Alcoa Inc. | | United States | | 187,500 | | | 5,544,375 |
| | | | | | |
|
|
Process Industries 1.3% | | | | | | | |
The Dow Chemical Co. | | United States | | 73,500 | | | 3,220,770 |
Lyondell Chemical Co. | | United States | | 213,600 | | | 5,087,952 |
| | | | | | |
|
|
| | | | | | | | 8,308,722 |
| | | | | | |
|
|
Producer Manufacturing 7.2% | | | | | | | |
3M Co. | | United States | | 103,100 | | | 7,990,250 |
General Electric Co. | | United States | | 579,000 | | | 20,293,950 |
Masco Corp. | | United States | | 169,200 | | | 5,108,148 |
Tyco International Ltd. | | United States | | 279,900 | | | 8,077,914 |
United Technologies Corp. | | United States | | 93,600 | | | 5,233,176 |
| | | | | | |
|
|
| | | | | | | | 46,703,438 |
| | | | | | |
|
|
Retail Trade 6.3% | | | | | | | |
aDollar Tree Stores Inc. | | United States | | 219,100 | | | 5,245,254 |
Family Dollar Stores Inc. | | United States | | 158,700 | | | 3,934,173 |
The Gap Inc. | | United States | | 295,700 | | | 5,216,148 |
The Home Depot Inc. | | United States | | 92,300 | | | 3,736,304 |
Lowe’s Cos. Inc. | | United States | | 48,300 | | | 3,219,678 |
RadioShack Corp. | | United States | | 110,100 | | | 2,315,403 |
Ross Stores Inc. | | United States | | 120,200 | | | 3,473,780 |
Target Corp. | | United States | | 49,300 | | | 2,710,021 |
Wal-Mart Stores Inc. | | United States | | 181,000 | | | 8,470,800 |
Walgreen Co. | | United States | | 53,400 | | | 2,363,484 |
| | | | | | |
|
|
| | | | | | | | 40,685,045 |
| | | | | | |
|
|
Technology Services 5.7% | | | | | | | |
Accenture Ltd., A | | Bermuda | | 161,700 | | | 4,668,279 |
aAffiliated Computer Services Inc., A | | United States | | 1,800 | | | 106,524 |
Automatic Data Processing Inc. | | United States | | 100,000 | | | 4,589,000 |
First Data Corp. | | United States | | 125,000 | | | 5,376,250 |
International Business Machines Corp. | | United States | | 51,000 | | | 4,192,200 |
Microsoft Corp. | | United States | | 454,300 | | | 11,879,945 |
Paychex Inc. | | United States | | 114,100 | | | 4,349,492 |
aSymantec Corp. | | United States | | 117,400 | | | 2,054,500 |
| | | | | | |
|
|
| | | | | | | | 37,216,190 |
| | | | | | |
|
|
Transportation 2.2% | | | | | | | |
Expeditors International of Washington Inc. | | United States | | 36,400 | | | 2,457,364 |
FedEx Corp. | | United States | | 46,600 | | | 4,817,974 |
Southwest Airlines Co. | | United States | | 437,000 | | | 7,179,910 |
| | | | | | |
|
|
| | | | | | | | 14,455,248 |
| | | | | | |
|
|
Utilities 2.5% | | | | | | | |
Dominion Resources Inc. | | United States | | 33,000 | | | 2,547,600 |
Exelon Corp. | | United States | | 58,700 | | | 3,119,318 |
FirstEnergy Corp. | | United States | | 110,200 | | | 5,398,698 |
NiSource Inc. | | United States | | 160,000 | | | 3,337,600 |
TXU Corp. | | United States | | 30,400 | | | 1,525,776 |
| | | | | | |
|
|
| | | | | | | | 15,928,992 |
| | | | | | |
|
|
Total Common Stocks (Cost $542,958,848) | | | | | | | 596,143,200 |
| | | | | | |
|
|
FLG-12
Franklin Templeton Variable Insurance Products Trust
Statement of Investments, December 31, 2005 (continued)
| | | | | | | | |
| Franklin Large Cap Growth Securities Fund | | Country | | Principal
Amount | | Value |
Short Term Investment (Cost $49,710,008) 7.7% | | | | | | | | |
bRepurchase Agreement 7.7% | | | | | | | | |
Joint Repurchase Agreement, 3.999%, 1/03/06 (Maturity Value $49,732,096) | | United States | | $ | 49,710,008 | | $ | 49,710,008 |
ABN AMRO Bank, N.V., New York Branch (Maturity Value $4,581,818) | | | | | | | | |
Banc of America Securities LLC (Maturity Value $4,681,282) | | | | | | | | |
Barclays Capital Inc. (Maturity Value $4,681,282) | | | | | | | | |
Bear, Stearns & Co. Inc. (Maturity Value $3,984,536) | | | | | | | | |
BNP Paribas Securities Corp. (Maturity Value $4,681,282) | | | | | | | | |
Deutsche Bank Securities Inc. (Maturity Value $1,992,765) | | | | | | | | |
Goldman, Sachs & Co. (Maturity Value $3,386,757) | | | | | | | | |
Greenwich Capital Markets Inc. (Maturity Value $4,681,282) | | | | | | | | |
Lehman Brothers Inc. (Maturity Value $3,116,710) | | | | | | | | |
Merrill Lynch Government Securities Inc. (Maturity Value $4,681,282) | | | | | | | | |
Morgan Stanley & Co. Inc. (Maturity Value $4,581,818) | | | | | | | | |
UBS Securities LLC (Maturity Value $4,681,282) | | | | | | | | |
Collateralized by U.S. Government Agency Securities, 1.875 - 7.25%,
2/15/06 - 11/15/10; cU.S. Government Agency Discount Notes, 1/09/06 - -
1/27/06; and U.S. Treasury Notes, 2.375 - 5.75%, 8/15/06 - 8/15/10 | | | | | | | | |
| | | | | | | |
|
|
Total Investments (Cost $592,668,856) 99.8% | | | | | | | | 645,853,208 |
Other Assets, less Liabilities 0.2% | | | | | | | | 1,005,577 |
| | | | | | | |
|
|
Net Assets 100.0% | | | | | | | $ | 646,858,785 |
| | | | | | | |
|
|
Selected Portfolio Abbreviations
ADR - American Depository Receipt
aNon-income producing.
bSee Note 1(c) regarding joint repurchase agreement.
cA portion or all of the security is traded on a discount basis with no stated coupon rate.
See notes to financial statements.
FLG-13
Franklin Templeton Variable Insurance Products Trust
Financial Statements
Statement of Assets and Liabilities
December 31, 2005
| | | | |
| | | Franklin Large
Cap Growth
Securities Fund
| |
Assets: | | | | |
Investments in securities: | | | | |
Cost - Unaffiliated issuers | | $ | 542,958,848 | |
Cost - Repurchase agreements | | | 49,710,008 | |
| | |
|
|
|
Total cost of investments | | $ | 592,668,856 | |
| | |
|
|
|
Value - Unaffiliated issuers | | $ | 596,143,200 | |
Value - Repurchase agreements | | | 49,710,008 | |
| | |
|
|
|
Total value of investments | | $ | 645,853,208 | |
Receivables: | | | | |
Investment securities sold | | | 4,308,259 | |
Capital shares sold | | | 531,143 | |
Dividends | | | 759,825 | |
| | |
|
|
|
Total assets | | | 651,452,435 | |
| | |
|
|
|
Liabilities: | | | | |
Payables: | | | | |
Investment securities purchased | | | 3,319,055 | |
Capital shares redeemed | | | 606,085 | |
Affiliates | | | 608,567 | |
Accrued expenses and other liabilities | | | 59,943 | |
| | |
|
|
|
Total liabilities | | | 4,593,650 | |
| | |
|
|
|
Net assets, at value | | $ | 646,858,785 | |
| | |
|
|
|
Net assets consist of: | | | | |
Paid-in capital | | $ | 611,706,824 | |
Undistributed net investment income | | | 5,330,502 | |
Net unrealized appreciation (depreciation) | | | 53,184,352 | |
Accumulated net realized gain (loss) | | | (23,362,893 | ) |
| | |
|
|
|
Net assets, at value | | $ | 646,858,785 | |
| | |
|
|
|
Class 1: | | | | |
Net assets, at value | | $ | 136,464,104 | |
| | |
|
|
|
Shares outstanding | | | 8,997,057 | |
| | |
|
|
|
Net asset value and offering price per share | | $ | 15.17 | |
| | |
|
|
|
Class 2: | | | | |
Net assets, at value | | $ | 510,394,681 | |
| | |
|
|
|
Shares outstanding | | | 34,102,268 | |
| | |
|
|
|
Net asset value and offering price per share | | $ | 14.97 | |
| | |
|
|
|
See notes to financial statements.
FLG-14
Franklin Templeton Variable Insurance Products Trust
Financial Statements (continued)
Statement of Operations
for the year ended December 31, 2005
| | | | |
| | | Franklin Large
Cap Growth
Securities Fund
| |
Investment income: | | | | |
Dividends | | $ | 9,091,647 | |
Interest | | | 1,803,852 | |
Other income (Note 7) | | | 95,837 | |
| | |
|
|
|
Total investment income | | | 10,991,336 | |
| | |
|
|
|
Expenses: | | | | |
Management fees (Note 3a) | | | 4,237,202 | |
Distribution fees - Class 2 (Note 3c) | | | 1,071,272 | |
Unaffiliated transfer agent fees | | | 3,131 | |
Custodian fees (Note 4) | | | 11,969 | |
Reports to shareholders | | | 95,386 | |
Professional fees | | | 24,308 | |
Trustees’ fees and expenses | | | 3,014 | |
Other | | | 16,798 | |
| | |
|
|
|
Total expenses | | | 5,463,080 | |
Expense reductions (Note 4) | | | (33 | ) |
| | |
|
|
|
Net expenses | | | 5,463,047 | |
| | |
|
|
|
Net investment income | | | 5,528,289 | |
| | |
|
|
|
Realized and unrealized gains (losses): | | | | |
Net realized gain (loss) from: | | | | |
Investments | | | 13,336,256 | |
Foreign currency transactions | | | 855 | |
| | |
|
|
|
Net realized gain (loss) | | | 13,337,111 | |
Net change in unrealized appreciation (depreciation) on investments | | | (10,119,865 | ) |
| | |
|
|
|
Net realized and unrealized gain (loss) | | | 3,217,246 | |
| | |
|
|
|
Net increase (decrease) in net assets resulting from operations | | $ | 8,745,535 | |
| | |
|
|
|
See notes to financial statements.
FLG-15
Franklin Templeton Variable Insurance Products Trust
Financial Statements (continued)
Statements of Changes in Net Assets
| | | | | | | | |
| | | Franklin Large Cap Growth
Securities Fund
| |
| | | Year Ended December 31,
| |
| | | 2005 | | | 2004 | |
| | |
|
|
|
Increase (decrease) in net assets: | | | | | | | | |
Operations: | | | | | | | | |
Net investment income | | $ | 5,528,289 | | | $ | 3,351,467 | |
Net realized gain (loss) from investments and foreign currency transactions | | | 13,337,111 | | | | 14,563,139 | |
Net change in unrealized appreciation (depreciation) on investments | | | (10,119,865 | ) | | | 16,039,304 | |
| | |
| |
Net increase (decrease) in net assets resulting from operations | | | 8,745,535 | | | | 33,953,910 | |
Distributions to shareholders from: | | | | | | | | |
Net investment income: | | | | | | | | |
Class 1 | | | (1,057,373 | ) | | | (963,792 | ) |
Class 2 | | | (2,491,747 | ) | | | (964,498 | ) |
| | |
| |
Total distributions to shareholders | | | (3,549,120 | ) | | | (1,928,290 | ) |
Capital share transactions: (Note 2) | | | | | | | | |
Class 1 | | | (32,930,473 | ) | | | (34,434,485 | ) |
Class 2 | | | 165,021,154 | | | | 192,923,391 | |
| | |
| |
Total capital share transactions | | | 132,090,681 | | | | 158,488,906 | |
| | |
| |
Net increase (decrease) in net assets | | | 137,287,096 | | | | 190,514,526 | |
Net assets: | | | | | | | | |
Beginning of year | | | 509,571,689 | | | | 319,057,163 | |
| | |
| |
End of year | | $ | 646,858,785 | | | $ | 509,571,689 | |
| | |
| |
Undistributed net investment income included in net assets: | | | | | | | | |
End of year | | $ | 5,330,502 | | | $ | 3,350,478 | |
| | |
| |
See notes to financial statements.
FLG-16
Franklin Templeton Variable Insurance Products Trust
Notes to Financial Statements
Franklin Large Cap Growth Securities Fund
1. ORGANIZATION AND SIGNIFICANT ACCOUNTING POLICIES
Franklin Templeton Variable Insurance Products Trust (the Trust) is registered under the Investment Company Act of 1940 as an open-end investment company, consisting of twenty-two separate series. The Franklin Large Cap Growth Securities Fund (the Fund) included in this report is diversified. The financial statements of the remaining funds in the series are presented separately. Shares of the Fund are sold only to insurance company separate accounts to fund the benefits of variable life insurance policies or variable annuity contracts. As of December 31, 2005, 56.15% of the Fund’s shares were sold through one insurance company.
The following summarizes the Fund’s significant accounting policies.
a. Security Valuation
Securities listed on a securities exchange or on the NASDAQ National Market System are valued at the last quoted sale price or the official closing price of the day, respectively. Over-the-counter securities and listed securities for which there is no reported sale are valued within the range of the most recent quoted bid and ask prices. Securities that trade in multiple markets or on multiple exchanges are valued according to the broadest and most representative market.
The Trust has procedures to determine the fair value of individual securities and other assets for which market prices are not readily available or which may not be reliably priced. Methods for valuing these securities may include: fundamental analysis, matrix pricing, discounts from market prices of similar securities, or discounts applied due to the nature and duration of restrictions on the disposition of the securities. Due to the inherent uncertainty of valuations of such securities, the fair values may differ significantly from the values that would have been used had a ready market for such investments existed. Occasionally, events occur between the time at which trading in a security is completed and the close of the NYSE that might call into question the availability (including the reliability) of the value of a portfolio security held by the Fund. If such an event occurs, the securities may be valued using fair value procedures, which may include the use of independent pricing services. All security valuation procedures are approved by the Trust’s Board of Trustees.
b. Foreign Currency Translation
Portfolio securities and other assets and liabilities denominated in foreign currencies are translated into U.S. dollars based on the exchange rate of such currencies against U.S. dollars on the date of valuation. Purchases and sales of securities, income and expense items denominated in foreign currencies are translated into U.S. dollars at the exchange rate in effect on the transaction date. Occasionally, events may impact the availability or reliability of foreign exchange rates used to convert the U.S. dollar equivalent value. If such an event occurs, the foreign exchange rate will be valued at fair value using procedures established and approved by the Trust’s Board of Trustees.
The Fund does not separately report the effect of changes in foreign exchange rates from changes in market prices on securities held. Such changes are included in net realized and unrealized gain or loss from investments on the Statement of Operations.
Realized foreign exchange gains or losses arise from sales of foreign currencies, currency gains or losses realized between the trade and settlement dates on securities transactions and the difference between the recorded amounts of dividends, interest, and foreign withholding taxes and the U.S. dollar equivalent of the amounts actually received or paid. Net unrealized foreign exchange gains and losses arise from changes in foreign exchange rates on foreign denominated assets and liabilities other than investments in securities held at the end of the reporting period.
c. Joint Repurchase Agreement
The Fund may enter into a joint repurchase agreement whereby its uninvested cash balance is deposited into a joint cash account with other funds managed by the investment manager or an affiliate of the investment manager and is used to invest in one or more repurchase agreements. The value and face amount of the joint repurchase agreement are allocated to the funds based on
FLG-17
Franklin Templeton Variable Insurance Products Trust
Notes to Financial Statements (continued)
Franklin Large Cap Growth Securities Fund
1. ORGANIZATION AND SIGNIFICANT ACCOUNTING POLICIES (continued)
c. Joint Repurchase Agreement (continued)
their pro-rata interest. A repurchase agreement is accounted for as a loan by the Fund to the seller, collateralized by securities which are delivered to the Fund’s custodian. The market value, including accrued interest, of the initial collateralization is required to be at least 102% of the dollar amount invested by the Fund, with the value of the underlying securities marked to market daily to maintain coverage of at least 100%. Repurchase agreements are valued at cost. At December 31, 2005, all repurchase agreements held by the Fund had been entered into on December 30, 2005.
d. Foreign Currency Contracts
When the Fund purchases or sells foreign securities it may enter into foreign exchange contracts to minimize foreign exchange risk from the trade date to the settlement date of the transactions. A foreign exchange contract is an agreement between two parties to exchange different currencies at an agreed upon exchange rate on a specified date. Realized and unrealized gains and losses on these contracts are included in the Statement of Operations.
The risks of these contracts include movement in the values of the foreign currencies relative to the U.S. dollar and the possible inability of the counterparties to fulfill their obligations under the contracts, which may be in excess of the amount reflected in the Statement of Assets and Liabilities.
e. Income Taxes
No provision has been made for U.S. income taxes because the Fund’s policy is to continue to qualify as a regulated investment company under the Internal Revenue Code and to distribute to shareholders substantially all of its taxable income and net realized gains.
f. Security Transactions, Investment Income, Expenses and Distributions
Security transactions are accounted for on trade date. Realized gains and losses on security transactions are determined on a specific identification basis. Interest income and estimated expenses are accrued daily. Dividend income is recorded on the ex-dividend date. Distributions to shareholders are recorded on the ex-dividend date and are determined according to income tax regulations (tax basis). Such distributions are reinvested in additional shares of the Fund. Distributable earnings determined on a tax basis may differ from earnings recorded in accordance with generally accepted accounting principles. These differences may be permanent or temporary. Permanent differences are reclassified among capital accounts to reflect their tax character. These reclassifications have no impact on net assets or the results of operations. Temporary differences are not reclassified, as they may reverse in subsequent periods.
Common expenses incurred by the Trust are allocated among the funds based on the ratio of net assets of each fund to the combined net assets of the Trust. Fund specific expenses are charged directly to the fund that incurred the expense.
Realized and unrealized gains and losses and net investment income, other than class specific expenses, are allocated daily to each class of shares based upon the relative proportion of net assets of each class.
g. Accounting Estimates
The preparation of financial statements in accordance with accounting principles generally accepted in the United States of America requires management to make estimates and assumptions that affect the reported amounts of assets and liabilities at the date of the financial statements and the amounts of income and expenses during the reporting period. Actual results could differ from those estimates.
FLG-18
Franklin Templeton Variable Insurance Products Trust
Notes to Financial Statements (continued)
Franklin Large Cap Growth Securities Fund
1. ORGANIZATION AND SIGNIFICANT ACCOUNTING POLICIES (continued)
h. Guarantees and Indemnifications
Under the Trust’s organizational documents, its officers and trustees are indemnified by the Trust against certain liabilities arising out of the performance of their duties to the Trust. Additionally, in the normal course of business, the Trust enters into contracts with service providers that contain general indemnification clauses. The Trust’s maximum exposure under these arrangements is unknown as this would involve future claims that may be made against the Trust that have not yet occurred. However, based on experience, the Trust expects the risk of loss to be remote.
2. SHARES OF BENEFICIAL INTEREST
The Fund offers two classes of shares: Class 1 and Class 2. Each class of shares differs by its distribution fees, voting rights on matters affecting a single class and its exchange privilege.
At December 31, 2005, there were an unlimited number of shares authorized ($0.01 par value). Transactions in the Fund’s shares were as follows:
| | | | | | | | | | | | | | |
| | | Year Ended December 31,
| |
| | | 2005
| | | 2004
| |
| Class 1 Shares: | | Shares
| | | Amount
| | | Shares
| | | Amount
| |
Shares sold | | 240,925 | | | $ | 3,539,235 | | | 241,760 | | | $ | 3,462,584 | |
Shares issued in reinvestment of distributions | | 71,252 | | | | 1,057,373 | | | 67,210 | | | | 963,792 | |
Shares redeemed | | (2,527,280 | ) | | | (37,527,081 | ) | | (2,728,506 | ) | | | (38,860,861 | ) |
| | |
| |
Net increase (decrease) | | (2,215,103 | ) | | $ | (32,930,473 | ) | | (2,419,536 | ) | | $ | (34,434,485 | ) |
| | |
| |
| Class 2 Shares: | | | | | | | | | | | | |
Shares sold | | 12,821,286 | | | $ | 187,844,237 | | | 15,438,375 | | | $ | 218,356,580 | |
Shares issued in reinvestment of distributions | | 169,969 | | | | 2,491,747 | | | 67,970 | | | | 964,498 | |
Shares redeemed | | (1,736,320 | ) | | | (25,314,830 | ) | | (1,890,421 | ) | | | (26,397,687 | ) |
| | |
| |
Net increase (decrease) | | 11,254,935 | | | $ | 165,021,154 | | | 13,615,924 | | | $ | 192,923,391 | |
| | |
| |
3. TRANSACTIONS WITH AFFILIATES
Franklin Resources, Inc. is the holding company for various subsidiaries that together are referred to as Franklin Templeton Investments. Certain officers and trustees of the Trust are also officers and/or directors of the following subsidiaries:
| | |
| Subsidiary | | Affiliation |
Franklin Advisers, Inc. (Advisers) | | Investment manager |
Franklin Templeton Services, LLC (FT Services) | | Administrative manager |
Franklin Templeton Distributors, Inc. (Distributors) | | Principal underwriter |
Franklin Templeton Investor Services, LLC (Investor Services) | | Transfer agent |
a. Management Fees
The Fund pays an investment management fee to Advisers based on the average daily net assets of the Fund as follows:
| | |
| Annualized Fee Rate | | Net Assets |
| 0.750% | | Up to and including $500 million |
| 0.625% | | Over $500 million, up to and including $1 billion |
| 0.500% | | In excess of $1 billion |
FLG-19
Franklin Templeton Variable Insurance Products Trust
Notes to Financial Statements (continued)
Franklin Large Cap Growth Securities Fund
3. TRANSACTIONS WITH AFFILIATES (continued)
b. Administrative Fees
Under an agreement with Advisers, FT Services provides administrative services to the Fund. The fee is paid by Advisers based on average daily net assets, and is not an additional expense of the Fund.
c. Distribution Fees
The Fund’s Board of Trustees has adopted distribution plans for Class 2 shares pursuant to Rule 12b-1 under the 1940 Act. Under the Fund’s compensation distribution plans, the Fund pays Distributors for costs incurred in connection with the sale and distribution of the Fund’s shares up to 0.35% per year of its average daily net assets. The Board of Trustees has set the current rate at 0.25% per year.
d. Transfer Agent Fees
Investor Services, under terms of an agreement, performs shareholder servicing for the Fund and is not paid by the Fund for the services.
4. EXPENSE OFFSET ARRANGEMENT
The Fund has entered into an arrangement with its custodian whereby credits realized as a result of uninvested cash balances are used to reduce a portion of the Fund’s custodian expenses. During the year ended December 31, 2005, the custodian fees were reduced as noted in the Statement of Operations.
5. INCOME TAXES
At December 31, 2005, the Fund had tax basis capital losses which may be carried over to offset future capital gains, if any. During the year ended December 31, 2005, the Fund utilized $13,367,898 of capital loss carryforwards. At December 31, 2005, the capital loss carryforwards were as follows:
| | | |
Capital loss carryforwards expiring in: | | | |
2010 | | $ | 18,349,969 |
2011 | | | 1,580,921 |
| | |
|
| | | $ | 19,930,890 |
| | |
|
The tax character of distributions paid during the years ended December 31, 2005 and 2004, was as follows:
| | | | | | |
| | | 2005
| | 2004
|
Distributions paid from ordinary income | | $ | 3,549,120 | | $ | 1,928,290 |
At December 31, 2005, the cost of investments, net unrealized appreciation (depreciation) and undistributed ordinary income for income tax purposes were as follows:
| | | | |
Cost of investments | | $ | 596,100,856 | |
| | |
| |
Unrealized appreciation | | $ | 77,284,032 | |
Unrealized depreciation | | | (27,531,680 | ) |
| | |
| |
Net unrealized appreciation (depreciation) | | $ | 49,752,352 | |
| | |
| |
Distributable earnings - undistributed ordinary income | | $ | 5,330,502 | |
| | |
| |
FLG-20
Franklin Templeton Variable Insurance Products Trust
Notes to Financial Statements (continued)
Franklin Large Cap Growth Securities Fund
5. INCOME TAXES (continued)
Net investment income differs for financial statements and tax purposes primarily due to differing treatments of foreign currency transactions.
Net realized gains (losses) differ for financial statements and tax purposes primarily due to differing treatments of wash sales and foreign currency transactions.
6. INVESTMENT TRANSACTIONS
Purchases and sales of investments (excluding short term securities) for the year ended December 31, 2005, aggregated $337,196,228 and $205,840,025, respectively.
7. REGULATORY MATTERS
As part of various investigations by a number of federal, state, and foreign regulators and governmental entities, relating to certain practices in the mutual fund industry, including late trading, market timing and marketing support payments to securities dealers who sell fund shares, Franklin Resources, Inc. and certain of its subsidiaries (collectively, the “Company”), entered into settlements with certain of those regulators.
Specifically, the Company entered into settlements with the Securities and Exchange Commission (“SEC”) concerning market timing (the “August 2, 2004 SEC Order”) and marketing support payments to securities dealers who sell fund shares (the “December 13, 2004 SEC Order”) and with the California Attorney General’s Office (“CAGO”) concerning marketing support payments to securities dealers who sell fund shares (the “CAGO Settlement”). Under the terms of the settlements with the SEC and the CAGO, the Company retained an Independent Distribution Consultant (“IDC”) to develop a plan for distribution of the respective settlement monies. The CAGO approved the distribution plan under the CAGO Settlement and, in accordance with the terms and conditions of that settlement, the monies were disbursed to the relevant funds and are recorded as other income in the current period. The SEC has not yet approved the distribution plan pertaining to the December 13, 2004 SEC Order. When approved, disbursements of settlement monies will be made promptly to the relevant funds, in accordance with the terms and conditions of that order. The IDC continues to develop the plan of distribution under the August 2, 2004 SEC Order that resolved the SEC’s market timing investigation.
In addition, the Company, as well as most of the mutual funds within Franklin Templeton Investments and certain current or former officers, directors, and/or employees, have been named in private lawsuits (styled as shareholder class actions, or as derivative actions on behalf of either the named funds or Franklin Resources, Inc.) relating to the industry practices referenced above, as well as to allegedly excessive advisory fees, commissions, and/or 12b-1 fees. The lawsuits were filed in different courts throughout the country. Many of those suits are now pending in a multi-district litigation in the United States District Court for the District of Maryland.
The Company and fund management strongly believe that the claims made in each of the private lawsuits referenced above are without merit and intend to defend against them vigorously. The Company cannot predict with certainty the eventual outcome of these lawsuits, nor whether they will have a material negative impact on the Company. If it is determined that the Company bears responsibility for any unlawful or inappropriate conduct that caused losses to the Trust, it is committed to making the Trust or their shareholders whole, as appropriate.
FLG-21
Franklin Templeton Variable Insurance Products Trust
Franklin Large Cap Growth Securities Fund
Report of Independent Registered Public Accounting Firm
To the Board of Trustees and Shareholders of
Franklin Templeton Variable Insurance Products Trust
In our opinion, the accompanying statement of assets and liabilities, including the statement of investments, and the related statements of operations and of changes in net assets and the financial highlights present fairly, in all material respects, the financial position of Franklin Large Cap Growth Securities Fund (one of the funds constituting Franklin Templeton Variable Insurance Products Trust, hereafter referred to as the “Fund”) at December 31, 2005, the results of its operations for the year ended, the changes in its net assets for each of the two years in the period then ended and the financial highlights for each of the five years in the period then ended, in conformity with accounting principles generally accepted in the United States of America. These financial statements and financial highlights (hereafter referred to as “financial statements”) are the responsibility of the Fund’s management; our responsibility is to express an opinion on these financial statements based on our audits. We conducted our audits of these financial statements in accordance with the standards of the Public Company Accounting Oversight Board (United States). Those standards require that we plan and perform the audit to obtain reasonable assurance about whether the financial statements are free of material misstatement. An audit includes examining, on a test basis, evidence supporting the amounts and disclosures in the financial statements, assessing the accounting principles used and significant estimates made by management, and evaluating the overall financial statement presentation. We believe that our audits, which included confirmation of securities at December 31, 2005, by correspondence with the custodian and brokers, provide a reasonable basis for our opinion.
PricewaterhouseCoopers LLP
San Francisco, California
February 10, 2006
FLG-22
Franklin Templeton Variable Insurance Products Trust
Tax Designation (unaudited)
Franklin Large Cap Growth Securities Fund
Under Section 854(b)(2) of the Internal Revenue Code, the Fund designates 100% of the ordinary income dividends as income qualifying for the dividends received deduction for the fiscal year ended December 31, 2005.
FLG-23
FRANKLIN MONEY MARKET FUND
Fund Goal and Main Investments: Franklin Money Market Fund seeks high current income, consistent with liquidity and capital preservation. The Fund invests exclusively in U.S. dollar denominated money market debt instruments issued by U.S. and foreign corporations and banks, and the U.S. government, its agencies and authorities. The Fund seeks to maintain a stable share price of $1.00 but there is no guarantee that it will be able to do so.
We are pleased to bring you Franklin Money Market Fund’s annual report for the fiscal year ended December 31, 2005.
Economic and Market Overview
The economy continued to grow at a healthy pace during the year under review. Over the reporting period, nonfarm payroll data, as well as other indexes, showed growing employment. This along with other factors helped consumer spending increase 6.25% (not adjusted for inflation) in December 2005 compared with the same month a year earlier, which supported U.S. economic growth.1
Business spending also rose during the reporting period, contributing to economic growth. Historically low interest rates continued to allow many companies easy access to capital, and ample cash also helped some companies to support their spending plans.
Oil prices increased substantially during the period amid concerns about potential long-term supply limitations in the face of expected strong growth in global demand, especially from China and India. Despite high commodity prices, inflation remained relatively contained for the 12 months ended December 31, 2005, as measured by the 2.2% rise for the core Consumer Price Index (CPI), which was the same as the core CPI’s 10-year average.2 The Federal Reserve Board (Fed) noted some economic effects due to the recent hurricanes. However, acknowledging the economy’s strength as well as potential inflationary pressure from high energy prices, the Fed raised the federal funds target rate to 4.25% from 2.25% during the 12-month period.
The 10-year Treasury note fluctuated considerably over the past year, but overall its yield rose from 4.24% at the beginning of the period to 4.39% on December 31, 2005. Although core inflationary pressures appeared relatively well contained, the U.S. economy’s resilience caused some concern about future pricing pressures. Some market participants also pointed to the upcoming change in the Fed chairman as another
1. Source: Bureau of Economic Analysis.
2. Source: Bureau of Labor Statistics. Core CPI excludes food and energy costs.
An investment in the Fund is not insured or guaranteed by the Federal Deposit Insurance Corporation or any other government agency or institution. Although the Fund seeks to preserve the value of your investment of $1.00 per share, it is possible to lose money by investing in the Fund.
FM-1
possible catalyst for the 10-year Treasury’s rise, as there is some market perception that Ben Bernanke, the next Fed chairman, may tolerate higher inflation risk. However, Mr. Bernanke is reported to share many of retiring chairman Alan Greenspan’s economic philosophies. Further-more, it is likely to take some time before his approach to dealing with inflation is apparent.
Investment Strategy
In selecting investments, we use a conservative investment approach, focusing on the highest quality and the most liquid of eligible money market securities. We assess the relative value of each security meeting our credit criteria to find the best combination of assets we believe will maximize the Fund’s yield relative to our expectations of the investment environment. We monitor short-term interest rates, economic conditions, and Federal Reserve Board monetary policy to determine the portfolio maturity we believe will provide high overall return.
Manager’s Discussion
Consistent with our strategy, we continued to invest mainly in high-quality money market securities. For example, on December 31, 2005, 85.9% of the portfolio was invested in securities with an AA or higher long-term credit rating by independent credit rating agencies Standard & Poor’s and Moody’s Investors Service, with the balance rated A.3
Thank you for your participation in Franklin Money Market Fund. We look forward to serving your future investment needs.
3. These do not indicate ratings of the Fund.
The foregoing information reflects our analysis, opinions and portfolio holdings as of December 31, 2005, the end of the reporting period. The way we implement our main investment strategies and the resulting portfolio holdings may change depending on factors such as market and economic conditions. These opinions may not be relied upon as investment advice or an offer for a particular security. The information is not a complete analysis of every aspect of any market, country, industry, security or the Fund. Statements of fact are from sources considered reliable, but the adviser makes no representation or warranty as to their completeness or accuracy. Although historical performance is no guarantee of future results, these insights may help you understand our investment management philosophy.
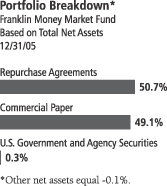
The dollar value, number of shares or principal amount, and names of all portfolio holdings are listed in the Fund’s Statement of Investments.
FM-2
Fund Expenses
As an investor in a variable insurance contract (“Contract”) that indirectly provides for investment in an underlying mutual fund, you can incur transaction and/or ongoing expenses at both the Fund level and the Contract level.
| • | | Transaction expenses can include sales charges (loads) on purchases, redemption fees, surrender fees, transfer fees and premium taxes. |
| • | | Ongoing expenses can include management fees, distribution and service (12b-1) fees, contract fees, annual maintenance fees, mortality and expense risk fees and other fees and expenses. All mutual funds and Contracts have some types of ongoing expenses. |
The expenses shown in the table below are meant to highlight ongoing expenses at the Fund level only and do not include ongoing expenses at the Contract level, or transaction expenses at either the Fund or Contract levels. While the Fund does not have transaction expenses, if the transaction and ongoing expenses at the Contract level were included, the expenses shown below would be higher. You should consult your Contract prospectus or disclosure document for more information.
The table shows Fund-level ongoing expenses and can help you understand these expenses and compare them with those of other mutual funds offered through the Contract. The table assumes a $1,000 investment held for the six months indicated. Please refer to the Fund prospectus for additional information on operating expenses.
Actual Fund Expenses
The first line (Actual) of the table below provides actual account values and expenses. The “Ending Account Value” is derived from the Fund’s actual return, which includes the effect of ongoing Fund expenses, but does not include the effect of ongoing Contract expenses.
You can estimate the Fund-level expenses you incurred during the period, by following these steps. Of course, your account value and expenses will differ from those in this illustration:
| 1. | Divide your account value by $1,000. |
If an account had an $8,600 value, then $8,600 ÷ $1,000 = 8.6.
| 2. | Multiply the result by the number under the heading “Fund-Level Expenses Incurred During Period.” |
If Fund-Level Expenses Incurred During Period were $7.50, then 8.6 × $7.50 = $64.50.
Franklin Money Market Fund – Class 1
FM-3
In this illustration, the estimated expenses incurred this period at the Fund level are $64.50.
Hypothetical Example for Comparison with Other Mutual Funds
Information in the second line (Hypothetical) of the table can help you compare ongoing expenses of the Fund with those of other mutual funds offered through the Contract. This information may not be used to estimate the actual ending account balance or expenses you incurred during the period. The hypothetical “Ending Account Value” is based on the Fund’s actual expense ratio and an assumed 5% annual rate of return before expenses, which does not represent the Fund’s actual return. The figure under the heading “Fund-Level Expenses Incurred During Period” shows the hypothetical expenses your account would have incurred under this scenario. You can compare this figure with the 5% hypothetical examples that appear in shareholder reports of other funds offered through a Contract.
| | | | | | | | | |
| Class 1 | | Beginning
Account
Value 7/1/05 | | Ending
Account
Value 12/31/05 | | Fund-Level
Expenses Incurred
During Period*
7/1/05-12/31/05 |
Actual | | $ | 1,000 | | $ | 1,015.40 | | $ | 3.51 |
Hypothetical (5% return before expenses) | | $ | 1,000 | | $ | 1,021.73 | | $ | 3.52 |
*Expenses are equal to the annualized expense ratio for the Fund’s Class 1 shares (0.69%), which does not include any ongoing expenses of the Contract for which the Fund is an investment option, multiplied by the average account value over the period, multiplied by 184/365 to reflect the one-half year period.
FM-4
Franklin Templeton Variable Insurance Products Trust
Financial Highlights
Franklin Money Market Fund
| | | | | | | | | | | | | | | | | | | | |
| | | Year Ended December 31,
| |
| Class 1 | | 2005
| | | 2004
| | | 2003
| | | 2002
| | | 2001
| |
Per share operating performance | | | | | | | | | | | | | | | | | | | | |
(for a share outstanding throughout the year) | | | | | | | | | | | | | | | | | | | | |
Net asset value, beginning of year | | $ | 1.00 | | | $ | 1.00 | | | $ | 1.00 | | | $ | 1.00 | | | $ | 1.00 | |
| | |
|
|
|
Income from investment operations - net investment income | | | 0.025 | | | | 0.007 | | | | 0.005 | | | | 0.013 | | | | 0.038 | |
Less distributions from net investment income | | | (0.025 | ) | | | (0.007 | ) | | | (0.005 | ) | | | (0.013 | ) | | | (0.038 | ) |
| | |
|
|
|
Net asset value, end of year | | $ | 1.00 | | | $ | 1.00 | | | $ | 1.00 | | | $ | 1.00 | | | $ | 1.00 | |
| | |
|
|
|
| | | | | |
Total returna | | | 2.55% | | | | 0.73% | | | | 0.52% | | | | 1.33% | | | | 3.91% | |
Ratios/supplemental data | | | | | | | | | | | | | | | | | | | | |
Net assets, end of year (000’s) | | $ | 46,750 | | | $ | 59,026 | | | $ | 81,734 | | | $ | 119,819 | | | $ | 200,911 | |
Ratios to average net assets: | | | | | | | | | | | | | | | | | | | | |
Expenses | | | 0.70% | | | | 0.68% | | | | 0.66% | | | | 0.63% | | | | 0.56% | |
Net investment income | | | 2.48% | | | | 0.67% | | | | 0.56% | | | | 1.37% | | | | 3.89% | |
| a | Total return does not include any fees, charges or expenses imposed by the variable annuity and life insurance contracts for which the Franklin Templeton Variable Insurance Products Trust serves as an underlying investment vehicle. |
See notes to financial statements.
FM-5
Franklin Templeton Variable Insurance Products Trust
Financial Highlights (continued)
Franklin Money Market Fund (continued)
| | | | | | | | | | | | | | | | | | | | |
| | | Year Ended December 31,
| |
| Class 2 | | 2005
| | | 2004
| | | 2003
| | | 2002
| | | 2001
| |
Per share operating performance | | | | | | | | | | | | | | | | | | | | |
(for a share outstanding throughout the year) | | | | | | | | | | | | | | | | | | | | |
Net asset value, beginning of year | | $ | 1.00 | | | $ | 1.00 | | | $ | 1.00 | | | $ | 1.00 | | | $ | 1.00 | |
| | |
|
|
|
Income from investment operations - net investment income | | | 0.023 | | | | 0.004 | | | | 0.003 | | | | 0.011 | | | | 0.036 | |
Less distributions from net investment income | | | (0.023 | ) | | | (0.004 | ) | | | (0.003 | ) | | | (0.011 | ) | | | (0.036 | ) |
| | |
|
|
|
Net asset value, end of year | | $ | 1.00 | | | $ | 1.00 | | | $ | 1.00 | | | $ | 1.00 | | | $ | 1.00 | |
| | |
|
|
|
| | | | | |
Total returna | | | 2.29% | | | | 0.44% | | | | 0.27% | | | | 1.08% | | | | 3.65% | |
Ratios/supplemental data | | | | | | | | | | | | | | | | | | | | |
Net assets, end of year (000’s) | | $ | 962 | | | $ | 887 | | | $ | 590 | | | $ | 479 | | | $ | 952 | |
Ratios to average net assets: | | | | | | | | | | | | | | | | | | | | |
Expenses | | | 0.95% | | | | 0.93% | | | | 0.91% | | | | 0.88% | | | | 0.81% | |
Net investment income | | | 2.23% | | | | 0.42% | | | | 0.31% | | | | 1.12% | | | | 3.52% | |
| a | Total return does not include any fees, charges or expenses imposed by the variable annuity and life insurance contracts for which the Franklin Templeton Variable Insurance Products Trust serves as an underlying investment vehicle. |
See notes to financial statements.
FM-6
Franklin Templeton Variable Insurance Products Trust
Statement of Investments, December 31, 2005
| | | | | | | | | |
| Franklin Money Market Fund | | Country | | Principal
Amountc | | Value | |
aCommercial Paper 49.1% | | | | | | | | | |
Anz (Delaware) Inc., 1/19/06 - 2/22/06 | | United States | | $ | 1,000,000 | | $ | 996,253 | |
Barclays U.S. Funding Corp., 2/06/06 - 2/10/06 | | United States | | | 450,000 | | | 448,023 | |
Canadian Wheat Board, 1/26/06 - 2/02/06 | | United States | | | 500,000 | | | 498,239 | |
Commonwealth Bank of Australia, 1/05/06 - 2/07/06 | | United States | | | 2,090,000 | | | 2,085,438 | |
Danske Corp., 1/17/06 | | United States | | | 200,000 | | | 199,594 | |
General Electric Capital Corp., 1/03/06 - 2/17/06 | | United States | | | 1,835,000 | | | 1,829,752 | |
Goldman Sachs Group Inc., 1/03/06 - 1/13/06 | | United States | | | 2,250,000 | | | 2,248,368 | |
HBOS Treasury Services, 1/26/06 - 2/21/06 | | United Kingdom | | | 2,225,000 | | | 2,214,968 | |
Merrill Lynch & Co. Inc., 1/03/06 | | United States | | | 2,250,000 | | | 2,249,214 | |
Morgan Stanley Group Inc., 1/04/06 | | United States | | | 2,250,000 | | | 2,248,945 | |
Royal Bank of Scotland PLC, 1/17/06 | | United States | | | 189,000 | | | 188,637 | |
Shell International Finance BV, 1/04/06 - 2/08/06 | | Netherlands | | | 1,000,000 | | | 998,093 | |
Siemens Capital Corp., 1/04/06 - 2/08/06 | | United States | | | 901,000 | | | 898,681 | |
Societe Generale North America Inc., 2/01/06 - 2/06/06 | | United States | | | 2,283,000 | | | 2,274,635 | |
Svenska Handelsbanken Inc., 1/09/06 - 1/20/06 | | United States | | | 684,000 | | | 682,962 | |
Toyota Motor Credit Corp., 1/03/06 - 2/09/06 | | United States | | | 1,250,000 | | | 1,246,915 | |
UBS AG Finance Delaware Inc., 1/03/06 - 2/13/06 | | United States | | | 2,115,000 | | | 2,110,142 | |
| | | | | | | |
|
|
|
Total Commercial Paper (Cost $23,418,859) | | | | | | | | 23,418,859 | |
| | | | | | | |
|
|
|
U.S. Government and Agency Securities (Cost $154,801) 0.3% | | | | | | | | | |
FHLB, 4.216%, 1/11/06 | | United States | | | 155,000 | | | 154,801 | |
| | | | | | | |
|
|
|
Total Investments before Repurchase Agreements (Cost $23,573,660) | | | | | | | | 23,573,660 | |
| | | | | | | |
|
|
|
bRepurchase Agreements 50.7% | | | | | | | | | |
ABN AMRO Bank, N.V., New York Branch, 4.00%, 1/03/06 (Maturity Value $12,090,371) Collateralized by U.S. Government Agency Securities, 4.625%, 1/15/08 | | United States | | | 12,085,000 | | | 12,085,000 | |
UBS Securities LLC, 4.00%, 1/03/06 (Maturity Value $12,095,373) Collateralized by U.S. Government Agency Securities, 2.875%, 12/15/06 | | United States | | | 12,090,000 | | | 12,090,000 | |
| | | | | | | |
|
|
|
Total Repurchase Agreements (Cost $24,175,000) | | | | | | | | 24,175,000 | |
| | | | | | | |
|
|
|
Total Investments (Cost $47,748,660) 100.1% | | | | | | | | 47,748,660 | |
Other Assets, less Liabilities (0.1)% | | | | | | | | (36,790 | ) |
| | | | | | | |
|
|
|
Net Assets 100.0% | | | | | | | $ | 47,711,870 | |
| | | | | | | |
|
|
|
Selected Portfolio Abbreviations
FHLB - Federal Home Loan Bank
aSecurity is traded on a discount basis with no stated coupon rate.
bSee Note 1(b) regarding repurchase agreements.
cThe principal amount is stated in U.S. dollars unless otherwise stated.
See notes to financial statements.
FM-7
Franklin Templeton Variable Insurance Products Trust
Financial Statements (continued)
Statement of Assets and Liabilities
December 31, 2005
| | | |
| | | Franklin Money
Market Fund
|
Assets: | | | |
Investments in securities, at amortized cost | | $ | 23,573,660 |
Repurchase agreements, at value and cost | | | 24,175,000 |
| | |
|
|
Total investments | | | 47,748,660 |
Cash | | | 2,766 |
Receivables: | | | |
Interest | | | 2,686 |
Affiliates | | | 65,901 |
| | |
|
|
Total assets | | | 47,820,013 |
| | |
|
|
Liabilities: | | | |
Payables: | | | |
Capital shares redeemed | | | 77,537 |
Affiliates | | | 25,105 |
Accrued expenses and other liabilities | | | 5,501 |
| | |
|
|
Total liabilities | | | 108,143 |
| | |
|
|
Net assets, at value | | $ | 47,711,870 |
| | |
|
|
Net assets consist of paid-in capital | | $ | 47,711,870 |
| | |
|
|
Class 1: | | | |
Net assets, at value | | $ | 46,750,370 |
| | |
|
|
Shares outstanding | | | 46,750,370 |
| | |
|
|
Net asset value per share | | $ | 1.00 |
| | |
|
|
Class 2: | | | |
Net assets, at value | | $ | 961,500 |
| | |
|
|
Shares outstanding | | | 961,500 |
| | |
|
|
Net asset value per share | | $ | 1.00 |
| | |
|
|
See notes to financial statements.
FM-8
Franklin Templeton Variable Insurance Products Trust
Financial Statements (continued)
Statement of Operations
for the year ended December 31, 2005
| | | | |
| | | Franklin Money
Market Fund
| |
Investment income: | | | | |
Interest | | $ | 1,679,728 | |
| | |
|
|
|
Expenses: | | | | |
Management fees (Note 3a) | | | 329,528 | |
Distribution fees - Class 2 (Note 3c) | | | 2,305 | |
Unaffiliated transfer agent fees | | | 304 | |
Custodian fees (Note 4) | | | 1,036 | |
Reports to shareholders | | | 25,108 | |
Professional fees | | | 10,933 | |
Trustees’ fees and expenses | | | 307 | |
Other | | | 3,850 | |
| | |
|
|
|
Total expenses | | | 373,371 | |
Expense reductions (Note 4) | | | (481 | ) |
| | |
|
|
|
Net expenses | | | 372,890 | |
| | |
|
|
|
Net investment income | | | 1,306,838 | |
| | |
|
|
|
Net increase (decrease) in net assets resulting from operations | | $ | 1,306,838 | |
| | |
|
|
|
See notes to financial statements.
FM-9
Franklin Templeton Variable Insurance Products Trust
Financial Statements (continued)
Statements of Changes in Net Assets
| | | | | | | | |
| | | Franklin Money Market Fund
| |
| | | Year Ended December 31,
| |
| | | 2005 | | | 2004 | |
| | |
| |
Increase (decrease) in net assets: | | | | | | | | |
Operations: | | | | | | | | |
Net investment income | | $ | 1,306,838 | | | $ | 484,567 | |
| | |
| |
Distributions to shareholders from: | | | | | | | | |
Net investment income: | | | | | | | | |
Class 1 | | | (1,285,610 | ) | | | (481,257 | ) |
Class 2 | | | (21,228 | ) | | | (3,310 | ) |
| | |
| |
Total distributions to shareholders | | | (1,306,838 | ) | | | (484,567 | ) |
Capital share transactions: (Note 2) | | | | | | | | |
Class 1 | | | (12,275,835 | ) | | | (22,708,015 | ) |
Class 2 | | | 74,930 | | | | 296,950 | |
| | |
| |
Total capital share transactions | | | (12,200,905 | ) | | | (22,411,065 | ) |
| | |
| |
Net increase (decrease) in net assets | | | (12,200,905 | ) | | | (22,411,065 | ) |
Net assets: (there is no undistributed income at beginning or end of year) | | | | | | | | |
Beginning of year | | | 59,912,775 | | | | 82,323,840 | |
| | |
| |
End of year | | $ | 47,711,870 | | | $ | 59,912,775 | |
| | |
| |
See notes to financial statements.
FM-10
Franklin Templeton Variable Insurance Products Trust
Notes to Financial Statements
Franklin Money Market Fund
1. ORGANIZATION AND SIGNIFICANT ACCOUNTING POLICIES
Franklin Templeton Variable Insurance Products Trust (the Trust) is registered under the Investment Company Act of 1940 as an open-end investment company, consisting of twenty-two separate series. The Franklin Money Market Fund (the Fund) included in this report is diversified. The financial statements of the remaining funds in the series are presented separately. Shares of the Fund are sold only to insurance company separate accounts to fund the benefits of variable life insurance policies or variable annuity contracts. As of December 31, 2005, 96.66% of the Fund’s shares were sold through one insurance company.
The following summarizes the Fund’s significant accounting policies.
a. Security Valuation
Securities are valued at amortized cost which approximates market value. This method involves valuing an instrument at its cost and thereafter assuming a constant amortization to maturity of any discount or premium. All security valuation procedures are approved by the Trust’s Board of Trustees.
b. Repurchase Agreements
The Fund may enter into repurchase agreements, which are accounted for as a loan by the Fund to the seller, collateralized by securities which are delivered to the Fund’s custodian. The market value, including accrued interest, of the initial collateralization is required to be at least 102% of the dollar amount invested by the Funds, with the value of the underlying securities marked to market daily to maintain coverage of at least 100%. Repurchase agreements are valued at cost. At December 31, 2005, all repurchase agreements held by the Fund had been entered into on December 30, 2005.
c. Income Taxes
No provision has been made for U.S. income taxes because the Fund’s policy is to continue to qualify as a regulated investment company under the Internal Revenue Code and to distribute to shareholders substantially all of its taxable income and net realized gains.
d. Security Transactions, Investment Income, Expenses and Distributions
Security transactions are accounted for on trade date. Realized gains and losses on security transactions are determined on a specific identification basis. Interest income and estimated expenses are accrued daily. Amortization of premium and accretion of discount on debt securities are included in interest income. Dividends from net investment income are normally declared daily. Such distributions are reinvested in additional shares of the Fund. Distributions from net realized capital gains are recorded on the ex-dividend date. Distributions to shareholders are determined according to income tax regulations (tax basis). Distributable earnings determined on a tax basis may differ from earnings recorded in accordance with generally accepted accounting principles. These differences may be permanent or temporary. Permanent differences are reclassified among capital accounts to reflect their tax character. These reclassifications have no impact on net assets or the results of operations. Temporary differences are not reclassified, as they may reverse in subsequent periods.
Common expenses incurred by the Trust are allocated among the funds based on the ratio of net assets of each fund to the combined net assets of the Trust. Fund specific expenses are charged directly to the fund that incurred the expense.
Net investment income, other than class specific expenses, is allocated daily to each class of shares based upon the relative value of the settled shares of each class. Realized and unrealized gains and losses are allocated daily to each class of shares based upon the relative proportion of net assets of each class.
FM-11
Franklin Templeton Variable Insurance Products Trust
Notes to Financial Statements (continued)
Franklin Money Market Fund
1. ORGANIZATION AND SIGNIFICANT ACCOUNTING POLICIES (continued)
e. Accounting Estimates
The preparation of financial statements in accordance with accounting principles generally accepted in the United States of America requires management to make estimates and assumptions that affect the reported amounts of assets and liabilities at the date of the financial statements and the amounts of income and expenses during the reporting period. Actual results could differ from those estimates.
f. Guarantees and Indemnifications
Under the Trust’s organizational documents, its officers and Trustees are indemnified by the Trust against certain liabilities arising out of the performance of their duties to the Trust. Additionally, in the normal course of business, the Trust enters into contracts with service providers that contain general indemnification clauses. The Trust’s maximum exposure under these arrangements is unknown as this would involve future claims that may be made against the Trust that have not yet occurred. However, based on experience, the Trust expects the risk of loss to be remote.
2. SHARES OF BENEFICIAL INTEREST
The Fund offers two classes of shares: Class 1 and Class 2. Each class of shares differs by its distribution fees, voting rights on matters affecting a single class and its exchange privilege.
At December 31, 2005, there were an unlimited number of shares authorized ($0.01 par value). Transactions in the Fund’s shares were as follows:
| | | | | | | | |
| | | Year Ended December 31,
| |
| | | 2005
| | | 2004
| |
| Class 1 Shares: | | Amount
| | | Amount
| |
Shares sold | | $ | 731,051 | | | $ | 6,053,803 | |
Shares issued in reinvestment of distributions | | | 1,285,602 | | | | 503,485 | |
Shares redeemed | | | (14,292,488 | ) | | | (29,265,303 | ) |
| | |
| | |
| |
Net increase (decrease) | | $ | (12,275,835 | ) | | $ | (22,708,015 | ) |
| | |
| | |
| |
| Class 2 Shares: | | | | | | |
Shares sold | | $ | 144,092 | | | $ | 324,223 | |
Shares issued in reinvestment of distributions | | | 21,228 | | | | 3,234 | |
Shares redeemed | | | (90,390 | ) | | | (30,507 | ) |
| | |
| | |
| |
Net increase (decrease) | | $ | 74,930 | | | $ | 296,950 | |
| | |
| | |
| |
3. TRANSACTIONS WITH AFFILIATES
Franklin Resources, Inc. is the holding company for various subsidiaries that together are referred to as Franklin Templeton Investments. Certain officers and trustees of the Trust are also officers and/or directors of the following subsidiaries:
| | |
| Subsidiary | | Affiliation |
Franklin Advisers, Inc. (Advisers) | | Investment manager |
Franklin Templeton Services, LLC (FT Services) | | Administrative manager |
Franklin Templeton Distributors, Inc. (Distributors) | | Principal underwriter |
Franklin Templeton Investor Services, LLC (Investor Services) | | Transfer agent |
FM-12
Franklin Templeton Variable Insurance Products Trust
Notes to Financial Statements (continued)
Franklin Money Market Fund
3. TRANSACTIONS WITH AFFILIATES (continued)
a. Management Fees
The Fund pays an investment management fee to Advisers based on the average daily net assets of the Fund as follows:
| | |
| Annualized Fee Rate | | Net Assets |
| 0.625% | | Up to and including $100 million |
| 0.500% | | Over $100 million, up to and including $250 million |
| 0.450% | | Over $250 million, up to and including $10 billion |
| 0.440% | | Over $10 billion, up to and including $12.5 billion |
| 0.420% | | Over $12.5 billion, up to and including $15 billion |
| 0.400% | | In excess of $15 billion |
b. Administrative Fees
Under an agreement with Advisers, FT Services provides administrative services to the Fund. The fee is paid by Advisers based on average daily net assets, and is not an additional expense of the Fund.
c. Distribution Fees
The Fund’s Board of Trustees has adopted distribution plans for Class 2 shares pursuant to Rule 12b-1 under the 1940 Act. Under the Fund’s compensation distribution plans, the Fund pays Distributors for costs incurred in connection with the sale and distribution of the Fund’s shares up to 0.35% per year of its average daily net assets. The Board of Trustees has set the current rate at 0.25% per year.
e. Transfer Agent Fees
Investor Services, under terms of an agreement, performs shareholder servicing for the Fund and is not paid by the Fund for the services.
4. EXPENSE OFFSET ARRANGEMENT
The Fund has entered into an arrangement with its custodian whereby credits realized as a result of uninvested cash balances are used to reduce a portion of the Fund’s custodian expenses. During the year ended December 31, 2005, the custodian fees were reduced as noted in the Statement of Operations.
5. INCOME TAXES
At December 31, 2005, the Fund had tax basis capital losses which may be carried over to offset future capital gains, if any. At December 31, 2005, the capital loss carryforwards were as follows:
| | | |
Capital loss carryforwards expiring in: | | | |
2008 | | $ | 280 |
2010 | | | 444 |
| | |
|
|
| | | $ | 724 |
| | |
|
|
FM-13
Franklin Templeton Variable Insurance Products Trust
Notes to Financial Statements (continued)
Franklin Money Market Fund
5. INCOME TAXES (continued)
The tax character of distributions paid during the years ended December 31, 2005 and 2004, was as follows:
| | | | | | |
| | | 2005
| | 2004
|
Distributions paid from ordinary income | | $ | 1,306,838 | | $ | 484,567 |
At December 31, 2005, the cost of investments and undistributed ordinary income for income tax purposes were as follows:
| | | |
Cost of investments | | $ | 47,748,660 |
Undistributed ordinary income | | $ | 7,876 |
6. REGULATORY MATTERS
As part of various investigations by a number of federal, state, and foreign regulators and governmental entities, relating to certain practices in the mutual fund industry, including late trading, market timing and marketing support payments to securities dealers who sell fund shares, Franklin Resources, Inc. and certain of its subsidiaries (collectively, the “Company”), entered into settlements with certain of those regulators.
Specifically, the Company entered into settlements with the Securities and Exchange Commission (“SEC”) concerning market timing (the “August 2, 2004 SEC Order”) and marketing support payments to securities dealers who sell fund shares (the “December 13, 2004 SEC Order”) and with the California Attorney General’s Office (“CAGO”) concerning marketing support payments to securities dealers who sell fund shares (the “CAGO Settlement”). Under the terms of the settlements with the SEC and the CAGO, the Company retained an Independent Distribution Consultant (“IDC”) to develop a plan for distribution of the respective settlement monies. The CAGO approved the distribution plan under the CAGO Settlement and, in accordance with the terms and conditions of that settlement, the monies were disbursed to the relevant funds. The SEC has not yet approved the distribution plan pertaining to the December 13, 2004 SEC Order. When approved, disbursements of settlement monies will be made promptly to the relevant funds, in accordance with the terms and conditions of that order. The IDC continues to develop the plan of distribution under the August 2, 2004 SEC Order that resolved the SEC’s market timing investigation.
In addition, the Company, as well as most of the mutual funds within Franklin Templeton Investments and certain current or former officers, directors, and/or employees, have been named in private lawsuits (styled as shareholder class actions, or as derivative actions on behalf of either the named funds or Franklin Resources, Inc.) relating to the industry practices referenced above, as well as to allegedly excessive advisory fees, commissions, and/or 12b-1 fees. The lawsuits were filed in different courts throughout the country. Many of those suits are now pending in a multi-district litigation in the United States District Court for the District of Maryland.
The Company and fund management strongly believe that the claims made in each of the private lawsuits referenced above are without merit and intend to defend against them vigorously. The Company cannot predict with certainty the eventual outcome of these lawsuits, nor whether they will have a material negative impact on the Company. If it is determined that the Company bears responsibility for any unlawful or inappropriate conduct that caused losses to the Trust, it is committed to making the Trust or their shareholders whole, as appropriate.
FM-14
Franklin Templeton Variable Insurance Products Trust
Franklin Money Market Fund
Report of Independent Registered Public Accounting Firm
To the Board of Trustees and Shareholders of Franklin Templeton Variable Insurance Products Trust
In our opinion, the accompanying statement of assets and liabilities, including the statement of investments, and the related statements of operations and of changes in net assets and the financial highlights present fairly, in all material respects, the financial position of Franklin Money Market Fund (one of the funds constituting Franklin Templeton Variable Insurance Products Trust, hereafter referred to as the “Fund”) at December 31, 2005, the results of its operations for the year then ended, the changes in its net assets for each of the two years in the period then ended and the financial highlights for each of the five years in period then ended, in conformity with accounting principles generally accepted in the United States of America. These financial statements and financial highlights (hereafter referred to as “financial statements”) are the responsibility of the Fund’s management; our responsibility is to express an opinion on these financial statements based on our audits. We conducted our audits of these financial statements in accordance with the standards of the Public Company Accounting Oversight Board (United States). Those standards require that we plan and perform the audit to obtain reasonable assurance about whether the financial statements are free of material misstatement. An audit includes examining, on a test basis, evidence supporting the amounts and disclosures in the financial statements, assessing the accounting principles used and significant estimates made by management, and evaluating the overall financial statement presentation. We believe that our audits, which included confirmation of securities at December 31, 2005 by correspondence with the custodian and brokers, provide a reasonable basis for our opinion.
PricewaterhouseCoopers LLP
San Francisco, California
February 10, 2006
FM-15
FRANKLIN REAL ESTATE FUND
This annual report for Franklin Real Estate Fund covers the fiscal year ended December 31, 2005.
Performance Summary as of 12/31/05
Average annual total return of Class 1 shares represents the average annual change in value, assuming reinvestment of dividends and capital gains. Average returns smooth out variations in returns, which can be significant; they are not the same as year-by-year results.
Periods ended 12/31/05
| | | | | | |
| | | 1-Year | | 5-Year | | 10-Year |
Average Annual Total Return | | +13.74% | | +17.75% | | +14.09% |
Total Return Index Comparison for Hypothetical $10,000 Investment (1/1/96–12/31/05)
The graph below shows the change in value of a hypothetical $10,000 investment in the Fund over the indicated period and includes reinvestment of any income or distributions. The Fund’s performance is compared to the performance of the Standard & Poor’s 500 Index (S&P 500) and the Dow Jones Wilshire Real Estate Securities Index. One cannot invest directly in an index, nor is an index representative of the Fund’s portfolio. Please see Important Notes to Performance Information preceding the Fund Summaries.
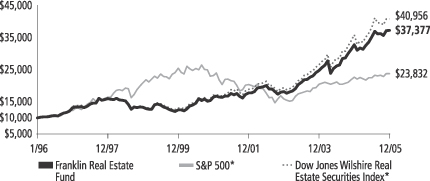
*Source: Standard & Poor’s Micropal. Please see Index Descriptions following the Fund Summaries.
Franklin Real Estate Fund – Class 1
Performance reflects the Fund’s Class 1 operating expenses, but does not include any contract fees, expenses or sales charges. If they had been included, performance would be lower. These charges and deductions, particularly for variable life policies, can have a significant effect on contract values and insurance benefits. See the contract prospectus for a complete description of these expenses, including sales charges.
Performance data represent past performance, which does not guarantee future results. Investment return and principal value will fluctuate, and you may have a gain or loss when you sell your shares.
Current performance may differ from figures shown.
FRE-1
Fund Goals and Main Investments: Franklin Real Estate Fund seeks capital appreciation, with current income as a secondary goal. The Fund normally invests at least 80% of its net assets in investments of companies operating in the real estate sector.
Performance Overview
You can find the Fund’s one-year total return in the Performance Summary. The Fund outperformed the +4.91% return of the benchmark S&P 500 but underperformed the Dow Jones Wilshire Real Estate Securities Index, which returned +14.06% for the period under review.1
Economic and Market Overview
During the 12 months ended December 31, 2005, U.S. economic expansion was driven by strength across most industries, sectors and regions. Gross domestic product (GDP) rose during the period, benefiting from increased personal consumption, federal spending and business investment, which increased 24% in third quarter 2005 compared with the same quarter in 2004.2 Slower export growth combined with greater demand for imported goods and materials fueled a widening trade gap. The U.S. dollar rallied in 2005, supported by rising short-term domestic interest rates and strong economic growth in the U.S. relative to many of its major trading partners.
Many businesses enjoyed record profits, propelled largely by productivity gains. Earnings for companies in the S&P 500 were estimated to have increased 13% in 2005.3 The labor market firmed as employment increased and the unemployment rate dropped from 5.4% to 4.9% during the reporting period. Personal income rose, and hiring rebounded in many industries, bolstered by healthy business spending.
Oil prices remained high during the period largely due to potential long-term supply limitations and strong growth in global demand, especially from China and India. Natural gas prices rose during the second half of 2005 mainly because of expected rising demand with the onset of winter; however, near period-end prices retreated somewhat amid milder-than-expected weather conditions. Even with high commodity prices, inflation remained relatively contained for the
1. Source: Standard & Poor’s Micropal. One cannot invest directly in an index, nor is an index representative of the Fund’s portfolio. Please see Index Descriptions following the Fund Summaries.
2. Source: Thomson Financial. Based on companies in the S&P 500.
3. Source: Standard & Poor’s.
Fund Risks: The Fund’s investments in stocks offer the potential for long-term gains but can be subject to short-term up-and-down price movements. By concentrating in the industries of the real estate sector, the Fund carries much greater risk of adverse developments affecting that sector than a fund that invests more broadly. Smaller and mid-size company securities can increase the risk of greater price fluctuation, particularly over the short term. The Fund’s prospectus also includes a description of the main investment risks.
FRE-2
12 months ended December 31, 2005, as measured by the 2.2% rise for the core Consumer Price Index (CPI).4
Despite this inflation picture, the Federal Reserve Board raised the federal funds target rate from 2.25% to 4.25%. Compared with the rise in short-term interest rates, long-term rates remained relatively stable, supporting overall robust housing and commercial real estate activity, which contributed to economic growth. Throughout 2005, as short- and intermediate-term interest rates rose, the yield curve moved from a fairly normal steepness at the beginning of the period to relatively flat by the end of 2005.
In this environment, the blue chip stocks of the Dow Jones Industrial Average posted a one-year total return of +1.72%, while the broader S&P 500 and the technology-heavy NASDAQ Composite Index returned +4.91% and +2.12%.5
Investment Strategy
We are research driven, fundamental investors. As bottom-up investors, we focus on selecting securities that present, in our opinion, the best trade-off between potential earnings growth, business and financial risk, and valuation. Using both qualitative and quantitative analysis, we evaluate security characteristics, the strength and quality of management, and underlying properties. In addition, we may consider other factors, such as the supply and demand outlook for various property types and regional markets.
Manager’s Discussion
During the fiscal year ended December 31, 2005, Fund performance benefited from industry consolidation as a flurry of mergers and acquisitions drove real estate investment trust (REIT) share prices higher. Among the notable transactions that occurred during the period and contributed to Fund performance were ProLogis’ acquisition of Catellus Development and Ventas’ purchase of Provident Senior Living. ProLogis is now considered the world’s largest network of distribution facilities and services, with more than 368 million square feet in over 2,305 facilities. The company was recently estimated to have more than 133 million square feet of development potential in international markets and should benefit from a growing global economy. We believe that Ventas is well-positioned to benefit from a
4. Source: Bureau of Labor Statistics. Core CPI excludes food and energy costs.
5. Source: Standard & Poor’s Micropal. Please see Index Descriptions following the Fund Summaries.
What is the yield curve?
The yield curve is a graph illustrating the yields on bonds of the same credit quality with maturities ranging from the shortest to the longest available. The resulting curve shows if short-term interest rates are higher or lower than longer-term rates.
Top 10 Holdings
Franklin Real Estate Fund
12/31/05
| | |
Company
Security Type | | % of Total
Net Assets |
| |
| M.D.C. Holdings Inc. | | 4.5% |
| Consumer Durables | | |
| |
| ProLogis | | 3.4% |
| Equity REIT – Industrial | | |
| |
| General Growth Properties Inc. | | 3.3% |
| Equity REIT – Retail | | |
| |
| Forest City Enterprises, A | | 3.2% |
| Real Estate Development | | |
| |
| Vornado Realty Trust | | 3.1% |
| Equity REIT – Diversified Property | | |
| |
| Simon Property Group Inc. | | 2.9% |
| Equity REIT – Retail | | |
| |
| The Macerich Co. | | 2.8% |
| Equity REIT – Retail | | |
| |
| iStar Financial Inc. | | 2.6% |
| Equity REIT – Other | | |
| |
| The St. Joe Co. | | 2.6% |
| Real Estate Development | | |
| |
| Digital Realty Trust Inc. | | 2.3% |
| Equity REIT – Office | | |
The dollar value, number of shares or principal amount, and names of all portfolio holdings are listed in the Fund’s Statement of Investments.
FRE-3
growing senior housing market as a result of the increasing number of workers reaching retirement age.
The Fund’s top contributor to performance was mall operator General Growth Properties. At the time of purchase, we believed that it had a high-quality portfolio of retail real estate that was attractively valued. During the year, shares of General Growth Properties appreciated more than 35% in value. The Fund also benefited from its investment in Digital Realty Trust, a leading owner and manager of corporate data centers and Internet gateways. We purchased the stock during its initial public offering, when we felt concerns regarding its non-traditional tenant base unduly drove the company’s valuation down to what we considered were attractive levels. Recently, the company announced its planned expansion into western Europe. Forest City Enterprises remained a large portfolio holding and was among the top contributors to performance as we felt it had a high-quality property portfolio, real estate development capabilities and a seasoned management team that were attractive.
The Fund also had some detractors from performance including its stake in mortgage finance operator Doral Financial. During the period, Doral’s shares came under pressure after the company announced it would have to restate its financial results for the past five years. Other holdings that negatively affected Fund performance were Fannie Mae and iStar Financial. Shares of Fannie Mae also declined amid allegations of questionable accounting practices and possible regulatory changes. The Fund’s investment in iStar Financial was hurt by its relatively slow growth rate. However, at period-end we continued to believe the company was well-positioned to benefit from the growth of real estate finance over the longer term. In line with our investment strategy, we also held Doral and Fannie Mae at year-end as we believed their fundamentals remained intact.
Thank you for your participation in Franklin Real Estate Fund. We look forward to serving your future investment needs.
The foregoing information reflects our analysis, opinions and portfolio holdings as of December 31, 2005, the end of the reporting period. The way we implement our main investment strategies and the resulting portfolio holdings may change depending on factors such as market and economic conditions. These opinions may not be relied upon as investment advice or an offer for a particular security. The information is not a complete analysis of every aspect of any market, country, industry, security or the Fund. Statements of fact are from sources considered reliable, but the adviser makes no representation or warranty as to their completeness or accuracy. Although historical performance is no guarantee of future results, these insights may help you understand our investment management philosophy.
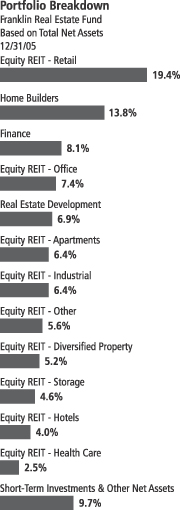
FRE-4
Fund Expenses
As an investor in a variable insurance contract (“Contract”) that indirectly provides for investment in an underlying mutual fund, you can incur transaction and/or ongoing expenses at both the Fund level and the Contract level.
| • | | Transaction expenses can include sales charges (loads) on purchases, redemption fees, surrender fees, transfer fees and premium taxes. |
| • | | Ongoing expenses can include management fees, distribution and service (12b-1) fees, contract fees, annual maintenance fees, mortality and expense risk fees and other fees and expenses. All mutual funds and Contracts have some types of ongoing expenses. |
The expenses shown in the table below are meant to highlight ongoing expenses at the Fund level only and do not include ongoing expenses at the Contract level, or transaction expenses at either the Fund or Contract level. While the Fund does not have transaction expenses, if the transaction and ongoing expenses at the Contract level were included, the expenses shown below would be higher. You should consult your Contract prospectus or disclosure document for more information.
The table shows Fund-level ongoing expenses and can help you understand these expenses and compare them with those of other mutual funds offered through the Contract. The table assumes a $1,000 investment held for the six months indicated. Please refer to the Fund prospectus for additional information on operating expenses.
Actual Fund Expenses
The first line (Actual) of the table below provides actual account values and expenses. The “Ending Account Value” is derived from the Fund’s actual return, which includes the effect of ongoing Fund expenses, but does not include the effect of ongoing Contract expenses.
You can estimate the Fund-level expenses you incurred during the period by following these steps. Of course, your account value and expenses will differ from those in this illustration:
| 1. | Divide your account value by $1,000. |
If an account had an $8,600 value, then $8,600 ÷ $1,000 = 8.6.
| 2. | Multiply the result by the number under the heading “Fund-Level Expenses Incurred During Period.” |
If Fund-Level Expenses Incurred During Period were $7.50, then 8.6 × $7.50 = $64.50.
Franklin Real Estate Fund – Class 1
FRE-5
In this illustration, the estimated expenses incurred this period at the Fund level are $64.50.
Hypothetical Example for Comparison with Other Mutual Funds
Information in the second line (Hypothetical) of the table can help you compare ongoing expenses of the Fund with those of other mutual funds offered through the Contract. This information may not be used to estimate the actual ending account balance or expenses you incurred during the period. The hypothetical “Ending Account Value” is based on the Fund’s actual expense ratio and an assumed 5% annual rate of return before expenses, which does not represent the Fund’s actual return. The figure under the heading “Fund-Level Expenses Incurred During Period” shows the hypothetical expenses your account would have incurred under this scenario. You can compare this figure with the 5% hypothetical examples that appear in shareholder reports of other funds offered through a Contract.
| | | | | | | | | |
| Class 1 | | Beginning
Account
Value 7/1/05 | | Ending
Account
Value 12/31/05 | | Fund-Level
Expenses Incurred
During Period*
7/1/05-12/31/05 |
Actual | | $ | 1,000 | | $ | 1,058.20 | | $ | 2.54 |
Hypothetical (5% return before expenses) | | $ | 1,000 | | $ | 1,022.74 | | $ | 2.50 |
*Expenses are equal to the annualized expense ratio for the Fund’s Class 1 shares (0.49%), which does not include any ongoing expenses of the Contract for which the Fund is an investment option, multiplied by the average account value over the period, multiplied by 184/365 to reflect the one-half year period.
FRE-6
Franklin Templeton Variable Insurance Products Trust
Financial Highlights
Franklin Real Estate Fund
| | | | | | | | | | | | | | | | | | | | |
| | | Year Ended December 31,
| |
| Class 1 | | 2005
| | | 2004
| | | 2003
| | | 2002
| | | 2001
| |
Per share operating performance | | | | | | | | | | | | | | | | | | | | |
(for a share outstanding throughout the year) | | | | | | | | | | | | | | | | | | | | |
Net asset value, beginning of year | | $ | 30.87 | | | $ | 23.91 | | | $ | 18.05 | | | $ | 18.14 | | | $ | 17.47 | |
| | |
|
|
|
Income from investment operations: | | | | | | | | | | | | | | | | | | | | |
Net investment incomea | | | 0.70 | | | | 0.75 | | | | 0.74 | | | | 0.75 | | | | 0.74 | |
Net realized and unrealized gains (losses) | | | 3.38 | | | | 6.78 | | | | 5.67 | | | | (0.30 | ) | | | 0.65 | |
| | |
|
|
|
Total from investment operations | | | 4.08 | | | | 7.53 | | | | 6.41 | | | | 0.45 | | | | 1.39 | |
| | |
|
|
|
Less distributions from: | | | | | | | | | | | | | | | | | | | | |
Net investment income | | | (0.49 | ) | | | (0.53 | ) | | | (0.55 | ) | | | (0.54 | ) | | | (0.72 | ) |
Net realized gains | | | (1.91 | ) | | | (0.04 | ) | | | — | | | | — | | | | — | |
| | |
|
|
|
Total distributions | | | (2.40 | ) | | | (0.57 | ) | | | (0.55 | ) | | | (0.54 | ) | | | (.72 | ) |
| | |
|
|
|
Net asset value, end of year | | $ | 32.55 | | | $ | 30.87 | | | $ | 23.91 | | | $ | 18.05 | | | $ | 18.14 | |
| | |
|
|
|
| | | | | |
Total returnb | | | 13.74% | | | | 32.19% | | | | 36.08% | | | | 2.25% | | | | 8.19% | |
Ratios/supplemental data | | | | | | | | | | | | | | | | | | | | |
Net assets, end of year (000’s) | | $ | 145,425 | | | $ | 152,451 | | | $ | 134,468 | | | $ | 112,991 | | | $ | 134,058 | |
Ratios to average net assets: | | | | | | | | | | | | | | | | | | | | |
Expenses | | | 0.49% | | | | 0.50% | | | | 0.53% | | | | 0.57% | | | | 0.59% | |
Net investment income | | | 2.32% | | | | 3.00% | | | | 3.62% | | | | 4.23% | | | | 4.25% | |
Portfolio turnover rate | | | 36.10% | | | | 39.42% | | | | 15.44% | | | | 18.13% | | | | 34.21% | |
aBased on average daily shares outstanding.
bTotal return does not include any fees, charges or expenses imposed by the variable annuity and life insurance contracts for which the Franklin Templeton Variable Insurance Products Trust serves as an underlying investment vehicle.
See notes to financial statements.
FRE-7
Franklin Templeton Variable Insurance Products Trust
Financial Highlights (continued)
Franklin Real Estate Fund (continued)
| | | | | | | | | | | | | | | | | | | | |
| | | Year Ended December 31,
| |
| Class 2 | | 2005
| | | 2004
| | | 2003
| | | 2002
| | | 2001
| |
Per share operating performance | | | | | | | | | | | | | | | | | | | | |
(for a share outstanding throughout the year) | | | | | | | | | | | | | | | | | | | | |
Net asset value, beginning of year | | $ | 30.49 | | | $ | 23.65 | | | $ | 17.88 | | | $ | 17.99 | | | $ | 17.38 | |
| | |
|
|
|
Income from investment operations: | | | | | | | | | | | | | | | | | | | | |
Net investment incomea | | | 0.64 | | | | 0.72 | | | | 0.74 | | | | 0.76 | | | | 0.80 | |
Net realized and unrealized gains (losses) | | | 3.30 | | | | 6.65 | | | | 5.55 | | | | (0.35 | ) | | | 0.52 | |
| | |
|
|
|
Total from investment operations | | | 3.94 | | | | 7.37 | | | | 6.29 | | | | 0.41 | | | | 1.32 | |
| | |
|
|
|
Less distributions from: | | | | | | | | | | | | | | | | | | | | |
Net investment income | | | (0.44 | ) | | | (0.49 | ) | | | (0.52 | ) | | | (0.52 | ) | | | (0.71 | ) |
Net realized gains | | | (1.91 | ) | | | (0.04 | ) | | | — | | | | — | | | | — | |
| | |
|
|
|
Total distributions | | | (2.35 | ) | | | (0.53 | ) | | | (0.52 | ) | | | (0.52 | ) | | | (0.71 | ) |
| | |
|
|
|
Net asset value, end of year | | $ | 32.08 | | | $ | 30.49 | | | $ | 23.65 | | | $ | 17.88 | | | $ | 17.99 | |
| | |
|
|
|
| | | | | |
Total returnb | | | 13.47% | | | | 31.80% | | | | 35.75% | | | | 2.07% | | | | 7.88% | |
Ratios/supplemental data | | | | | | | | | | | | | | | | | | | | |
Net assets, end of year (000’s) | | $ | 1,343,868 | | | $ | 1,005,647 | | | $ | 522,415 | | | $ | 249,116 | | | $ | 95,891 | |
Ratios to average net assets: | | | | | | | | | | | | | | | | | | | | |
Expenses | | | 0.74% | | | | 0.75% | | | | 0.78% | | | | 0.82% | | | | 0.84% | |
Net investment income | | | 2.07% | | | | 2.75% | | | | 3.37% | | | | 3.98% | | | | 4.60% | |
Portfolio turnover rate | | | 36.10% | | | | 39.42% | | | | 15.44% | | | | 18.13% | | | | 34.21% | |
aBased on average daily shares outstanding.
bTotal return does not include any fees, charges or expenses imposed by the variable annuity and life insurance contracts for which the Franklin Templeton Variable Insurance Products Trust serves as an underlying investment vehicle.
See notes to financial statements.
FRE-8
Franklin Templeton Variable Insurance Products Trust
Statement of Investments, December 31, 2005
| | | | | | | |
| Franklin Real Estate Fund | | Country | | Shares | | Value |
Common Stocks 90.3% | | | | | | | |
Equity REIT - Apartments 6.4% | | | | | | | |
AvalonBay Communities Inc. | | United States | | 137,000 | | $ | 12,227,250 |
Boardwalk REIT | | Canada | | 1,503,500 | | | 27,447,340 |
Education Realty Trust Inc. | | United States | | 383,600 | | | 4,944,604 |
Equity Residential | | United States | | 544,700 | | | 21,308,664 |
GMH Communities Trust | | United States | | 1,937,500 | | | 30,050,625 |
| | | | | | |
|
|
| | | | | | | | 95,978,483 |
| | | | | | |
|
|
Equity REIT - Diversified Property 5.2% | | | | | | | |
Duke Realty Corp. | | United States | | 116,248 | | | 3,882,683 |
Lexington Corporate Properties Trust | | United States | | 349,600 | | | 7,446,480 |
Liberty Property Trust | | United States | | 445,100 | | | 19,072,535 |
Vornado Realty Trust | | United States | | 555,200 | | | 46,342,544 |
| | | | | | |
|
|
| | | | | | | | 76,744,242 |
| | | | | | |
|
|
Equity REIT - Health Care 2.5% | | | | | | | |
Health Care Property Investors Inc. | | United States | | 162,500 | | | 4,153,500 |
Medical Properties Trust Inc. | | United States | | 645,800 | | | 6,315,924 |
Ventas Inc. | | United States | | 841,688 | | | 26,950,850 |
| | | | | | |
|
|
| | | | | | | | 37,420,274 |
| | | | | | |
|
|
Equity REIT - Hotels 4.0% | | | | | | | |
Eagle Hospitality Properties Trust Inc. | | United States | | 662,500 | | | 5,054,875 |
Host Marriott Corp. | | United States | | 1,528,800 | | | 28,970,760 |
LaSalle Hotel Properties | | United States | | 475,800 | | | 17,471,376 |
Sunstone Hotel Investors Inc. | | United States | | 311,700 | | | 8,281,869 |
| | | | | | |
|
|
| | | | | | | | 59,778,880 |
| | | | | | |
|
|
Equity REIT - Industrial 6.4% | | | | | | | |
First Potomac Realty Trust | | United States | | 528,900 | | | 14,068,740 |
ProLogis | | United States | | 1,093,647 | | | 51,095,188 |
PS Business Parks Inc. | | United States | | 614,700 | | | 30,243,240 |
| | | | | | |
|
|
| | | | | | | | 95,407,168 |
| | | | | | |
|
|
Equity REIT - Office 7.4% | | | | | | | |
BioMed Realty Trust Inc. | | United States | | 870,300 | | | 21,235,320 |
Brandywine Realty Trust | | United States | | 608,900 | | | 16,994,399 |
Corporate Office Properties Trust | | United States | | 661,300 | | | 23,502,602 |
Cousins Properties Inc. | | United States | | 191,400 | | | 5,416,620 |
bDigital Realty Trust Inc. | | United States | | 1,510,500 | | | 34,182,615 |
Parkway Properties Inc. | | United States | | 222,000 | | | 8,911,080 |
| | | | | | |
|
|
| | | | | | | | 110,242,636 |
| | | | | | |
|
|
Equity REIT - Other 5.6% | | | | | | | |
Capital Trust Inc., A | | United States | | 329,000 | | | 9,633,120 |
Entertainment Properties Trust | | United States | | 429,400 | | | 17,498,050 |
HomeBanc Corp. | | United States | | 445,800 | | | 3,334,584 |
iStar Financial Inc. | | United States | | 1,105,600 | | | 39,414,640 |
MortgageIT Holdings Inc. | | United States | | 336,100 | | | 4,591,126 |
Redwood Trust Inc. | | United States | | 87,500 | | | 3,610,250 |
Trustreet Properties Inc. | | United States | | 404,000 | | | 5,906,480 |
| | | | | | |
|
|
| | | | | | | | 83,988,250 |
| | | | | | |
|
|
FRE-9
Franklin Templeton Variable Insurance Products Trust
Statement of Investments, December 31, 2005 (continued)
| | | | | | | |
| Franklin Real Estate Fund | | Country | | Shares | | Value |
Common Stocks (cont.) | | | | | | | |
Equity REIT - Retail 19.4% | | | | | | | |
CBL & Associates Properties Inc. | | United States | | 100,000 | | $ | 3,951,000 |
bCedar Shopping Centers Inc. | | United States | | 1,756,900 | | | 24,719,583 |
Developers Diversified Realty Corp. | | United States | | 214,700 | | | 10,095,194 |
Federal Realty Investment Trust | | United States | | 87,500 | | | 5,306,875 |
General Growth Properties Inc. | | United States | | 1,033,000 | | | 48,540,670 |
Glimcher Realty Trust | | United States | | 418,600 | | | 10,180,352 |
Kimco Realty Corp. | | United States | | 642,100 | | | 20,598,568 |
Kite Realty Group Trust | | United States | | 1,385,600 | | | 21,435,232 |
The Macerich Co. | | United States | | 630,400 | | | 42,325,056 |
The Mills Corp. | | United States | | 481,600 | | | 20,198,304 |
Pennsylvania REIT | | United States | | 216,000 | | | 8,069,760 |
Ramco-Gershenson Properties Trust | | United States | | 211,800 | | | 5,644,470 |
Regency Centers Corp. | | United States | | 304,400 | | | 17,944,380 |
Simon Property Group Inc. | | United States | | 570,945 | | | 43,751,515 |
Tanger Factory Outlet Centers Inc. | | United States | | 213,600 | | | 6,138,864 |
| | | | | | |
|
|
| | | | | | | | 288,899,823 |
| | | | | | |
|
|
Equity REIT - Storage 4.6% | | | | | | | |
Extra Space Storage Inc. | | United States | | 1,200,000 | | | 18,480,000 |
Public Storage Inc. | | United States | | 281,200 | | | 19,042,864 |
U-Store-It Trust | | United States | | 1,467,300 | | | 30,886,665 |
| | | | | | |
|
|
| | | | | | | | 68,409,529 |
| | | | | | |
|
|
Finance 8.1% | | | | | | | |
Affordable Residential Communities | | United States | | 1,416,600 | | | 13,500,198 |
Brookfield Asset Management Inc., A | | Canada | | 461,000 | | | 23,204,144 |
CharterMac LP | | United States | | 843,000 | | | 17,854,740 |
Doral Financial Corp. | | Puerto Rico | | 1,431,300 | | | 15,171,780 |
Eurocastle Investment Ltd. | | United Kingdom | | 158,000 | | | 3,647,442 |
Fannie Mae | | United States | | 165,700 | | | 8,087,817 |
Newcastle Investment Corp. | | United States | | 1,011,000 | | | 25,123,350 |
cTaberna Realty Finance Trust, 144A | | United States | | 1,109,200 | | | 13,310,400 |
| | | | | | |
|
|
| | | | | | | | 119,899,871 |
| | | | | | |
|
|
Homebuilding 13.8% | | | | | | | |
Beazer Homes USA Inc. | | United States | | 147,000 | | | 10,707,480 |
Centex Corp. | | United States | | 54,800 | | | 3,917,652 |
D.R. Horton Inc. | | United States | | 738,400 | | | 26,383,032 |
aHovnanian Enterprises Inc., A | | United States | | 404,400 | | | 20,074,416 |
KB HOME | | United States | | 251,200 | | | 18,252,192 |
Lennar Corp., A | | United States | | 375,300 | | | 22,900,806 |
M.D.C. Holdings Inc. | | United States | | 1,071,400 | | | 66,405,372 |
aMeritage Homes Corp. | | United States | | 73,300 | | | 4,612,036 |
aNVR Inc. | | United States | | 3,220 | | | 2,260,440 |
The Ryland Group Inc. | | United States | | 94,300 | | | 6,801,859 |
Standard Pacific Corp. | | United States | | 201,100 | | | 7,400,480 |
Technical Olympic USA Inc. | | United States | | 18,300 | | | 385,947 |
aToll Brothers Inc. | | United States | | 447,900 | | | 15,515,256 |
| | | | | | |
|
|
| | | | | | | | 205,616,968 |
| | | | | | |
|
|
Real Estate Development 6.9% | | | | | | | |
Brookfield Properties Corp. | | Canada | | 353,340 | | | 10,395,263 |
Forest City Enterprises Inc., A | | United States | | 1,267,400 | | | 48,072,483 |
FRE-10
Franklin Templeton Variable Insurance Products Trust
Statement of Investments, December 31, 2005 (continued)
| | | | | | | | | |
| Franklin Real Estate Fund | | Country | | Shares | | Value | |
Common Stocks (cont.) | | | | | | | | | |
Real Estate Development (cont.) | | | | | | | | | |
aKillam Properties | | Canada | | | 93,800 | | $ | 232,422 | |
a,cKillam Properties Inc., 144A | | Canada | | | 2,258,500 | | | 5,596,214 | |
The St. Joe Co. | | United States | | | 574,800 | | | 38,638,056 | |
| | | | | | | |
|
|
|
| | | | | | | | | 102,934,438 | |
| | | | | | | |
|
|
|
Total Common Stocks (Cost $1,012,930,702) | | | | | | | | 1,345,320,562 | |
| | | | | | | |
|
|
|
| | | |
| | | | | Principal
Amount
| | | |
Short Term Investment (Cost $144,510,652) 9.7% | | | | | | | | | |
Repurchase Agreement 9.7% | | | | | | | | | |
dJoint Repurchase Agreement, 3.999%, 1/03/06 (Maturity Value $144,574,863) | | United States | | $ | 144,510,652 | | | 144,510,652 | |
ABN AMRO Bank, N.V., New York Branch (Maturity Value $13,319,682) | | | | | | | | | |
Banc of America Securities LLC (Maturity Value $13,608,832) | | | | | | | | | |
Barclays Capital Inc. (Maturity Value $13,608,832) | | | | | | | | | |
Bear, Stearns & Co. Inc. (Maturity Value $11,583,337) | | | | | | | | | |
BNP Paribas Securities Corp. (Maturity Value $13,608,832) | | | | | | | | | |
Deutsche Bank Securities Inc. (Maturity Value $5,793,115) | | | | | | | | | |
Goldman, Sachs & Co. (Maturity Value $9,845,548) | | | | | | | | | |
Greenwich Capital Markets Inc. (Maturity Value $13,608,832) | | | | | | | | | |
Lehman Brothers Inc. (Maturity Value $9,060,507) | | | | | | | | | |
Merrill Lynch Government Securities Inc. (Maturity Value $13,608,832) | | | | | | | | | |
Morgan Stanley & Co. Inc. (Maturity Value $13,319,682) | | | | | | | | | |
UBS Securities LLC (Maturity Value $13,608,832) | | | | | | | | | |
Collateralized by U.S. Government Agency Discount Notes,
1.875 - 7.25%, 2/15/06 - 11/15/10; eU.S. Government Agency Discount Notes,
1/09/06 - 1/27/06; and U.S. Treasury Notes, 2.375 - 5.75%, 8/15/06 - 8/15/10 | | | | | | | | | |
| | | | | | | |
|
|
|
Total Investments (Cost $1,157,441,354) 100.0% | | | | | | | | 1,489,831,214 | |
Other Assets, less Liabilities 0.0%f | | | | | | | | (537,527 | ) |
| | | | | | | |
|
|
|
Net Assets 100.0% | | | | | | | $ | 1,489,293,687 | |
| | | | | | | |
|
|
|
Selected Portfolio Abbreviation
REIT - Real Estate Investment Trust
aNon-income producing.
bSee Note 7 regarding holdings of 5% voting securities.
cSecurity was purchased pursuant to Rule 144A under the Securities Act of 1933 and may be sold in transactions exempt from registration only to qualified institutional buyers or in a public offering registered under the Securities Act of 1933. These securities have been deemed liquid under the guidelines approved by the Trust’s Board of Trustees. At December 31, 2005, the value of these securities was $18,906,614, representing 1.27% of net assets.
dSee Note 1(c) regarding joint repurchase agreement.
eA portion or all of the security is traded on a discount basis with no stated coupon rate.
fRounds to less than 0.05% of net assets.
See notes to financial statements.
FRE-11
Franklin Templeton Variable Insurance Products Trust
Financial Statements
Statement of Assets and Liabilities
December 31, 2005
| | | |
| | | Franklin Real
Estate Fund
|
Assets: | | | |
Investments in securities: | | | |
Cost - Unaffiliated issuers | | $ | 969,433,259 |
Cost - Non-controlled affiliated issuers (Note 7) | | | 43,497,443 |
Cost - Repurchase agreements | | | 144,510,652 |
| | |
|
|
Total cost of investments | | | 1,157,441,354 |
| | |
|
|
Value - Unaffiliated issuers | | | 1,286,418,364 |
Value - Non-controlled affiliated issuers (Note 7) | | | 58,902,198 |
Value - Repurchase agreements | | | 144,510,652 |
| | |
|
|
Total value of investments | | | 1,489,831,214 |
Cash | | | 54,061 |
Receivables: | | | |
Investment securities sold | | | 617,313 |
Capital shares sold | | | 481,234 |
Dividends and interest | | | 5,757,131 |
| | |
|
|
Total assets | | | 1,496,740,953 |
| | |
|
|
Liabilities: | | | |
Payables: | | | |
Investment securities purchased | | | 5,983,412 |
Capital shares redeemed | | | 236,575 |
Affiliates | | | 1,144,691 |
Accrued expenses and other liabilities | | | 82,588 |
| | |
|
|
Total liabilities | | | 7,447,266 |
| | |
|
|
Net assets, at value | | $ | 1,489,293,687 |
| | |
|
|
Net assets consist of: | | | |
Paid-in capital | | $ | 1,008,104,777 |
Undistributed net investment income | | | 36,236,055 |
Net unrealized appreciation (depreciation) | | | 332,393,959 |
Accumulated net realized gain (loss) | | | 112,558,896 |
| | |
|
|
Net assets, at value | | $ | 1,489,293,687 |
| | |
|
|
Class 1: | | | |
Net assets, at value | | $ | 145,425,226 |
| | |
|
|
Shares outstanding | | | 4,467,605 |
| | |
|
|
Net asset value and offering price per share | | $ | 32.55 |
| | |
|
|
Class 2: | | | |
Net assets, at value | | $ | 1,343,868,461 |
| | |
|
|
Shares outstanding | | | 41,893,738 |
| | |
|
|
Net asset value and offering price per share | | $ | 32.08 |
| | |
|
|
See notes to financial statements.
FRE-12
Franklin Templeton Variable Insurance Products Trust
Financial Statements (continued)
Statement of Operations
for the year ended December 31, 2005
| | | | |
| | | Franklin Real
Estate Fund
| |
Investment income: | | | | |
Dividends: | | | | |
Unaffiliated issuers | | $ | 26,997,023 | |
Non-controlled affiliated issuers (Note 7) | | | 2,941,857 | |
Interest | | | 7,051,309 | |
Other income (Note 8) | | | 19,742 | |
| | |
|
|
|
Total investment income | | | 37,009,931 | |
| | |
|
|
|
Expenses: | | | | |
Management fees (Note 3a) | | | 6,175,258 | |
Distribution fees - Class 2 (Note 3c) | | | 2,929,132 | |
Unaffiliated transfer agent fees | | | 7,701 | |
Custodian fees (Note 4) | | | 30,233 | |
Reports to shareholders | | | 115,874 | |
Professional fees | | | 43,837 | |
Trustees’ fees and expenses | | | 6,799 | |
Other | | | 39,778 | |
| | |
|
|
|
Total expenses | | | 9,348,612 | |
Expense reductions (Note 4) | | | (4,533 | ) |
| | |
|
|
|
Net expenses | | | 9,344,079 | |
| | |
|
|
|
Net investment income | | | 27,665,852 | |
| | |
|
|
|
Realized and unrealized gains (losses): | | | | |
Net realized gain (loss) from: | | | | |
Investments | | | | |
Unaffiliated issuers | | | 112,611,437 | |
Non-controlled affiliated issuers (Note 7) | | | 50,127 | |
Realized gain distribution from REITS | | | 7,668,850 | |
Foreign currency transactions | | | (20,761 | ) |
| | |
|
|
|
Net realized gain (loss) | | | 120,309,653 | |
| | |
|
|
|
Net change in unrealized appreciation (depreciation) on: | | | | |
Investments | | | 25,142,135 | |
Translation of assets and liabilities denominated in foreign currencies | | | 4,100 | |
| | |
|
|
|
Net change in unrealized appreciation (depreciation) | | | 25,146,235 | |
| | |
|
|
|
Net realized and unrealized gain (loss) | | | 145,455,888 | |
| | |
|
|
|
Net increase (decrease) in net assets resulting from operations | | $ | 173,121,740 | |
| | |
|
|
|
See notes to financial statements.
FRE-13
Franklin Templeton Variable Insurance Products Trust
Financial Statements (continued)
Statements of Changes in Net Assets
| | | | | | | | |
| | | Franklin Real
Estate Fund
| |
| | | Year Ended December 31,
| |
| | | 2005 | | | 2004 | |
| | |
| |
Increase (decrease) in net assets: | | | | | | | | |
Operations: | | | | | | | | |
Net investment income | | $ | 27,665,852 | | | $ | 23,598,983 | |
Net realized gain (loss) from investments, realized gain distributions from REITS and
foreign currency transactions | | | 120,309,653 | | | | 75,094,976 | |
Net change in unrealized appreciation (depreciation) on investments and translation
of assets and liabilities denominated in foreign currencies | | | 25,146,235 | | | | 153,300,436 | |
| | |
| |
Net increase (decrease) in net assets resulting from operations | | | 173,121,740 | | | | 251,994,395 | |
Distributions to shareholders from: | | | | | | | | |
Net investment income: | | | | | | | | |
Class 1 | | | (2,239,960 | ) | | | (2,724,809 | ) |
Class 2 | | | (16,328,995 | ) | | | (12,878,960 | ) |
Net realized gains: | | | | | | | | |
Class 1 | | | (8,692,625 | ) | | | (192,406 | ) |
Class 2 | | | (70,236,345 | ) | | | (972,343 | ) |
| | |
| |
Total distributions to shareholders | | | (97,497,925 | ) | | | (16,768,518 | ) |
Capital share transactions: (Note 2) | | | | | | | | |
Class 1 | | | (14,607,962 | ) | | | (17,653,568 | ) |
Class 2 | | | 270,179,736 | | | | 283,643,067 | |
| | |
| |
Total capital share transactions | | | 255,571,774 | | | | 265,989,499 | |
Net increase (decrease) in net assets | | | 331,195,589 | | | | 501,215,376 | |
Net assets: | | | | | | | | |
Beginning of year | | | 1,158,098,098 | | | | 656,882,722 | |
| | |
| |
End of year | | $ | 1,489,293,687 | | | $ | 1,158,098,098 | |
| | |
| |
Undistributed net investment income included in net assets: | | | | | | | | |
End of year | | $ | 36,236,055 | | | $ | 27,198,442 | |
| | |
| |
See notes to financial statements.
FRE-14
Franklin Templeton Variable Insurance Products Trust
Notes to Financial Statements
Franklin Real Estate Fund
1. ORGANIZATION AND SIGNIFICANT ACCOUNTING POLICIES
Franklin Templeton Variable Insurance Products Trust (the Trust) is registered under the Investment Company Act of 1940 as an open-end investment company, consisting of twenty-two separate series. The Franklin Real Estate Fund (the Fund) included in this report is diversified. The financial statements of the remaining funds in the series are presented separately. Shares of the Fund are sold only to insurance company separate accounts to fund the benefits of variable life insurance policies or variable annuity contracts. As of December 31, 2005, 56.57% of the Fund’s shares were sold through one insurance company.
The following summarizes the Fund’s significant accounting policies.
a. Security Valuation
Securities listed on a securities exchange or on the NASDAQ National Market System are valued at the last quoted sale price or the official closing price of the day, respectively. Over-the-counter securities and listed securities for which there is no reported sale are valued within the range of the most recent quoted bid and ask prices. Securities that trade in multiple markets or on multiple exchanges are valued according to the broadest and most representative market.
Foreign securities are valued as of the close of trading on the foreign stock exchange on which the security is primarily traded, or the NYSE, whichever is earlier. If no sale is reported at that time, the foreign security will be valued within the range of the most recent quoted bid and ask prices. The value is then converted into its U.S. dollar equivalent at the foreign exchange rate in effect at the close of the NYSE on the day that the value of the foreign security is determined.
The Trust has procedures to determine the fair value of individual securities and other assets for which market prices are not readily available or which may not be reliably priced. Methods for valuing these securities may include: fundamental analysis, matrix pricing, discounts from market prices of similar securities, or discounts applied due to the nature and duration of restrictions on the disposition of the securities. Due to the inherent uncertainty of valuations of such securities, the fair values may differ significantly from the values that would have been used had a ready market for such investments existed. Occasionally, events occur between the time at which trading in a security is completed and the close of the NYSE that might call into question the availability (including the reliability) of the value of a portfolio security held by the Fund. If such an event occurs, the securities may be valued using fair value procedures, which may include the use of independent pricing services. All security valuation procedures are approved by the Trust’s Board of Trustees.
b. Foreign Currency Translation
Portfolio securities and other assets and liabilities denominated in foreign currencies are translated into U.S. dollars based on the exchange rate of such currencies against U.S. dollars on the date of valuation. Purchases and sales of securities, income and expense items denominated in foreign currencies are translated into U.S. dollars at the exchange rate in effect on the transaction date. Occasionally, events may impact the availability or reliability of foreign exchange rates used to convert the U.S. dollar equivalent value. If such an event occurs, the foreign exchange rate will be valued at fair value using procedures established and approved by the Trust’s Board of Trustees.
The Fund does not separately report the effect of changes in foreign exchange rates from changes in market prices on securities held. Such changes are included in net realized and unrealized gain or loss from investments on the Statement of Operations.
Realized foreign exchange gains or losses arise from sales of foreign currencies, currency gains or losses realized between the trade and settlement dates on securities transactions and the difference between the recorded amounts of dividends, interest, and foreign withholding taxes and the U.S. dollar equivalent of the amounts actually received or paid. Net unrealized foreign exchange gains and losses arise from changes in foreign exchange rates on foreign denominated assets and liabilities other than investments in securities held at the end of the reporting period.
FRE-15
Franklin Templeton Variable Insurance Products Trust
Notes to Financial Statements (continued)
Franklin Real Estate Fund
1. ORGANIZATION AND SIGNIFICANT ACCOUNTING POLICIES (continued)
c. Joint Repurchase Agreement
The Fund may enter into a joint repurchase agreement whereby its uninvested cash balance is deposited into a joint cash account with other funds managed by the investment manager or an affiliate of the investment manager and is used to invest in one or more repurchase agreements. The value and face amount of the joint repurchase agreement are allocated to the funds based on their pro-rata interest. A repurchase agreement is accounted for as a loan by the Fund to the seller, collateralized by securities which are delivered to the Fund’s custodian. The market value, including accrued interest, of the initial collateralization is required to be at least 102% of the dollar amount invested by the Funds, with the value of the underlying securities marked to market daily to maintain coverage of at least 100%. Repurchase agreements are valued at cost. At December 31, 2005, all repurchase agreements held by the Fund had been entered into on December 30, 2005.
d. Foreign Currency Contracts
When the Fund purchases or sells foreign securities it may enter into foreign exchange contracts to minimize foreign exchange risk from the trade date to the settlement date of the transactions. A foreign exchange contract is an agreement between two parties to exchange different currencies at an agreed upon exchange rate on a specified date. Realized and unrealized gains and losses on these contracts are included in the Statement of Operations.
The risks of these contracts include movement in the values of the foreign currencies relative to the U.S. dollar and the possible inability of the counterparties to fulfill their obligations under the contracts, which may be in excess of the amount reflected in the Statement of Assets and Liabilities.
e. Income Taxes
No provision has been made for U.S. income taxes because the Fund’s policy is to continue to qualify as a regulated investment company under the Internal Revenue Code and to distribute to shareholders substantially all of its taxable income and net realized gains.
f. Security Transactions, Investment Income, Expenses and Distributions
Security transactions are accounted for on trade date. Realized gains and losses on security transactions are determined on a specific identification basis. Interest income and estimated expenses are accrued daily. Dividend income is recorded on the ex-dividend date. Distributions to shareholders are recorded on the ex-dividend date and are determined according to income tax regulations (tax basis). Such distributions are reinvested in additional shares of the Fund. Distributable earnings determined on a tax basis may differ from earnings recorded in accordance with generally accepted accounting principles. These differences may be permanent or temporary. Permanent differences are reclassified among capital accounts to reflect their tax character. These reclassifications have no impact on net assets or the results of operations. Temporary differences are not reclassified, as they may reverse in subsequent periods.
Common expenses incurred by the Trust are allocated among the funds based on the ratio of net assets of each fund to the combined net assets of the Trust. Fund specific expenses are charged directly to the fund that incurred the expense.
Distributions received by the Fund from securities may be a return of capital (ROC). Such distributions reduce the cost basis of the securities, and any distributions in excess of the cost basis are recognized as capital gains.
Realized and unrealized gains and losses and net investment income, other than class specific expenses, are allocated daily to each class of shares based upon the relative proportion of net assets of each class.
FRE-16
Franklin Templeton Variable Insurance Products Trust
Notes to Financial Statements (continued)
Franklin Real Estate Fund
1. ORGANIZATION AND SIGNIFICANT ACCOUNTING POLICIES (continued)
g. Accounting Estimates
The preparation of financial statements in accordance with accounting principles generally accepted in the United States of America requires management to make estimates and assumptions that affect the reported amounts of assets and liabilities at the date of the financial statements and the amounts of income and expenses during the reporting period. Actual results could differ from those estimates.
h. Guarantees and Indemnifications
Under the Trust’s organizational documents, its officers and trustees are indemnified by the Trust against certain liabilities arising out of the performance of their duties to the Trust. Additionally, in the normal course of business, the Trust enters into contracts with service providers that contain general indemnification clauses. The Trust’s maximum exposure under these arrangements is unknown as this would involve future claims that may be made against the Trust that have not yet occurred. However, based on experience, the Trust expects the risk of loss to be remote.
2. SHARES OF BENEFICIAL INTEREST
The Fund offers two classes of shares: Class 1 and Class 2. Each class of shares differs by its distribution fees, voting rights on matters affecting a single class and its exchange privilege.
At December 31, 2005, there were an unlimited number of shares authorized ($0.01 par value). Transactions in the Fund’s shares were as follows:
| | | | | | | | | | | | | | |
| | | Year Ended December 31,
| |
| | | 2005
| | | 2004
| |
| Class 1 Shares: | | Shares
| | | Amount
| | | Shares
| | | Amount
| |
Shares sold | | 66,974 | | | $ | 2,110,829 | | | 139,440 | | | $ | 3,663,084 | |
Shares issued in reinvestment of distributions | | 359,270 | | | | 10,932,585 | | | 121,906 | | | | 2,917,215 | |
Shares redeemed | | (896,385 | ) | | | (27,651,376 | ) | | (946,492 | ) | | | (24,233,867 | ) |
| | |
| |
Net increase (decrease) | | (470,141 | ) | | $ | (14,607,962 | ) | | (685,146 | ) | | $ | (17,653,568 | ) |
| | |
| |
| Class 2 Shares: | | | | | | | | | | | | |
Shares sold | | 7,617,433 | | | $ | 231,904,673 | | | 13,898,522 | | | $ | 362,200,904 | |
Shares issued in reinvestment of distributions | | 2,882,629 | | | | 86,565,340 | | | 585,431 | | | | 13,851,303 | |
Shares redeemed | | (1,594,165 | ) | | | (48,290,277 | ) | | (3,590,120 | ) | | | (92,409,140 | ) |
| | |
| |
Net increase (decrease) | | 8,905,897 | | | $ | 270,179,736 | | | 10,893,833 | | | $ | 283,643,067 | |
| | |
| |
3. TRANSACTIONS WITH AFFILIATES
Franklin Resources, Inc. is the holding company for various subsidiaries that together are referred to as Franklin Templeton Investments. Certain officers and trustees of the Trust are also officers and/or directors of the following subsidiaries:
| | |
| Subsidiary | | Affiliation |
Franklin Advisers, Inc. (Advisers) | | Investment manager |
Franklin Templeton Services, LLC (FT Services) | | Administrative manager |
Franklin Templeton Distributors, Inc. (Distributors) | | Principal underwriter |
Franklin Templeton Investor Services, LLC (Investor Services) | | Transfer agent |
FRE-17
Franklin Templeton Variable Insurance Products Trust
Notes to Financial Statements (continued)
Franklin Real Estate Fund
3. TRANSACTIONS WITH AFFILIATES (continued)
a. Management Fees
The Fund pays an investment management fee to Advisers based on the average daily net assets of the Fund as follows:
| | |
| Annualized Fee Rate | | Net Assets |
| 0.625% | | Up to and including $100 million |
| 0.500% | | Over $100 million, up to and including $250 million |
| 0.450% | | Over $250 million, up to and including $10 billion |
| 0.440% | | Over $10 billion, up to and including $12.5 billion |
| 0.420% | | Over $12.5 billion, up to and including $15 billion |
| 0.400% | | In excess of $15 billion |
b. Administrative Fees
Under an agreement with Advisers, FT Services provides administrative services to the Fund. The fee is paid by Advisers based on average daily net assets and is not an additional expense of the Fund.
c. Distribution Fees
The Fund’s Board of Trustees has adopted distribution plans for Class 2 shares pursuant to Rule 12b-1 under the 1940 Act. Under the Fund’s compensation distribution plans, the Fund pays Distributors for costs incurred in connection with the sale and distribution of the Fund’s shares up to 0.35% per year of its average daily net assets. The Board of Trustees has set the current rate at 0.25% per year.
d. Transfer Agent Fees
Investor Services, under terms of an agreement, performs shareholder servicing for the Fund and is not paid by the Fund for the services.
4. EXPENSE OFFSET ARRANGEMENT
The Fund has entered into an arrangement with its custodian whereby credits realized as a result of uninvested cash balances are used to reduce a portion of the Fund’s custodian expenses. During the year ended December 31, 2005, the custodian fees were reduced as noted in the Statement of Operations.
5. INCOME TAXES
For tax purposes, realized currency losses occurring subsequent to October 31, may be deferred and treated as occurring on the first day of the following fiscal year. At December 31, 2005, the Fund deferred realized currency losses of $8,617.
The tax character of distributions paid during the years ended December 31, 2005 and 2004, was as follows:
| | | | | | |
| | | 2005
| | 2004
|
Distributions paid from: | | | | | | |
Ordinary income | | $ | 40,021,889 | | $ | 16,084,110 |
Long term capital gain | | | 57,476,036 | | | 684,408 |
| | |
|
| | | $ | 97,497,925 | | $ | 16,768,518 |
| | |
|
FRE-18
Franklin Templeton Variable Insurance Products Trust
Notes to Financial Statements (continued)
Franklin Real Estate Fund
5. INCOME TAXES (continued)
At December 31, 2005, the cost of investments, net unrealized appreciation (depreciation), undistributed ordinary income and undistributed long term capital gains for income tax purposes were as follows:
| | | | |
Cost of investments | | $ | 1,157,441,354 | |
| | |
|
|
|
| |
Unrealized appreciation | | $ | 354,304,846 | |
Unrealized depreciation | | | (21,914,986 | ) |
| | |
|
|
|
Net unrealized appreciation (depreciation) | | $ | 332,389,860 | |
| | |
|
|
|
Undistributed ordinary income | | $ | 57,977,606 | |
Undistributed long term capital gains | | | 90,825,961 | |
| | |
|
|
|
Distributable earnings | | $ | 148,803,567 | |
| | |
|
|
|
Net investment income and net realized gains (losses) differ for financial statement and tax purposes primarily due to differing treatment of foreign currency transactions.
6. INVESTMENT TRANSACTIONS
Purchases and sales of investments (excluding short term securities) for the year ended December 31, 2005, aggregated $633,885,194 and $405,670,321, respectively.
7. HOLDINGS OF 5% VOTING SECURITIES OF PORTFOLIO COMPANIES
The Investment Company Act of 1940 defines “affiliated companies” to include investments in portfolio companies in which a fund owns 5% or more of the outstanding voting securities. Investments in “affiliated companies” for the Fund at December 31, 2005 were as shown below.
| | | | | | | | | | | | | | | | | | |
| Name of Issuer | | Number
of Shares
Held at
Beginning
of Year | | Gross
Additions | | Gross
Reductions | | Number
of Shares
Held at
End of
Year | | Value at
End of
Year | | | Investment
Income | | Realized
Capital
Gain
(Loss) |
Cedar Shopping Centers Inc. | | — | | 1,756,900 | | — | | 1,756,900 | | | 24,719,583 | | | | 395,303 | | | — |
Digital Realty Trust Inc. | | 1,535,500 | | — | | 25,000 | | 1,510,500 | | | 34,182,615 | | | | 1,510,929 | | | 50,127 |
GMH Communities Trust | | 1,700,000 | | 237,500 | | — | | 1,937,500 | | | | * | | | 1,035,625 | | | — |
| | | | | | | | | | |
|
|
Total Affiliated Securities (3.96% of Net Assets) | | | | | | | | | | $ | 58,902,198 | | | $ | 2,941,857 | | $ | 50,127 |
| | | | | | | | | | |
|
|
| *As | of December 31, 2005, no longer an affiliate. |
8. REGULATORY MATTERS
As part of various investigations by a number of federal, state, and foreign regulators and governmental entities, relating to certain practices in the mutual fund industry, including late trading, market timing and marketing support payments to securities dealers who sell fund shares, Franklin Resources, Inc. and certain of its subsidiaries (collectively, the “Company”), entered into settlements with certain of those regulators.
FRE-19
Franklin Templeton Variable Insurance Products Trust
Notes to Financial Statements (continued)
Franklin Real Estate Fund
8. REGULATORY MATTERS (continued)
Specifically, the Company entered into settlements with the Securities and Exchange Commission (“SEC”) concerning market timing (the “August 2, 2004 SEC Order”) and marketing support payments to securities dealers who sell fund shares (the “December 13, 2004 SEC Order”) and with the California Attorney General’s Office (“CAGO”) concerning marketing support payments to securities dealers who sell fund shares (the “CAGO Settlement”). Under the terms of the settlements with the SEC and the CAGO, the Company retained an Independent Distribution Consultant (“IDC”) to develop a plan for distribution of the respective settlement monies. The CAGO approved the distribution plan under the CAGO Settlement and, in accordance with the terms and conditions of that settlement, the monies were disbursed to the relevant funds and are recorded as other income in the current period. The SEC has not yet approved the distribution plan pertaining to the December 13, 2004 SEC Order. When approved, disbursements of settlement monies will be made promptly to the relevant funds, in accordance with the terms and conditions of that order. The IDC continues to develop the plan of distribution under the August 2, 2004 SEC Order that resolved the SEC’s market timing investigation.
In addition, the Company, as well as most of the mutual funds within Franklin Templeton Investments and certain current or former officers, directors, and/or employees, have been named in private lawsuits (styled as shareholder class actions, or as derivative actions on behalf of either the named funds or Franklin Resources, Inc.) relating to the industry practices referenced above, as well as to allegedly excessive advisory fees, commissions, and/or 12b-1 fees. The lawsuits were filed in different courts throughout the country. Many of those suits are now pending in a multi-district litigation in the United States District Court for the District of Maryland.
The Company and fund management strongly believe that the claims made in each of the private lawsuits referenced above are without merit and intend to defend against them vigorously. The Company cannot predict with certainty the eventual outcome of these lawsuits, nor whether they will have a material negative impact on the Company. If it is determined that the Company bears responsibility for any unlawful or inappropriate conduct that caused losses to the Trust, it is committed to making the Trust or their shareholders whole, as appropriate.
FRE-20
Franklin Templeton Variable Insurance Products Trust
Franklin Real Estate Fund
Report of Independent Registered Public Accounting Firm
To the Board of Trustees and Shareholders of
Franklin Templeton Variable Insurance Products Trust
In our opinion, the accompanying statement of assets and liabilities, including the statement of investments, and the related statements of operations and of changes in net assets and the financial highlights present fairly, in all material respects, the financial position of Franklin Real Estate Fund (one of the funds constituting Franklin Templeton Variable Insurance Products Trust, hereafter referred to as the “Fund”) at December 31, 2005, the results of its operations for the year then ended, the changes in its net assets for each of the two years in the period then ended and the financial highlights for each of the five years in the period then ended, in conformity with accounting principles generally accepted in the United States of America. These financial statements and financial highlights (hereafter referred to as “financial statements”) are the responsibility of the Fund’s management; our responsibility is to express an opinion on these financial statements based on our audits. We conducted our audits of these financial statements in accordance with the standards of the Public Company Accounting Oversight Board (United States). Those standards require that we plan and perform the audit to obtain reasonable assurance about whether the financial statements are free of material misstatement. An audit includes examining, on a test basis, evidence supporting the amounts and disclosures in the financial statements, assessing the accounting principles used and significant estimates made by management, and evaluating the overall financial statement presentation. We believe that our audits, which included confirmation of securities at December 31, 2005, by correspondence with the custodian and brokers, provide a reasonable basis for our opinion.
PricewaterhouseCoopers LLP
San Francisco, California
February 10, 2006
FRE-21
Franklin Templeton Variable Insurance Products Trust
Tax Designation (unaudited)
Franklin Real Estate Fund
Under Section 852(b)(3)(C) of the Internal Revenue Code (Code), the Fund designates the maximum amount allowable but no less than $90,831,789 as a capital gain dividend for the fiscal year ended December 31, 2005.
Under Section 854(b)(2) of the Code, the Fund designates 4.56% of the ordinary income dividends as income qualifying for the dividends received deduction for the fiscal year ended December 31, 2005.
FRE-22
FRANKLIN RISING DIVIDENDS SECURITIES FUND
This annual report for Franklin Rising Dividends Securities Fund covers the fiscal year ended December 31, 2005.
Performance Summary as of 12/31/05
Average annual total return of Class 1 shares represents the average annual change in value, assuming reinvestment of dividends and capital gains. Average returns smooth out variations in returns, which can be significant; they are not the same as year-by-year results.
Periods ended 12/31/05
| | | | | | |
| | | 1-Year | | 5-Year | | 10-Year |
Average Annual Total Return | | +3.68% | | +10.12% | | +12.07% |
Total Return Index Comparison
for Hypothetical $10,000 Investment (1/1/96–12/31/05)
The graph below shows the change in value of a hypothetical $10,000 investment in the Fund over the indicated period and includes reinvestment of any income or distributions. The Fund’s performance is compared to the performance of the Standard & Poor’s 500 Index (S&P 500) and the Russell Midcap® Value Index. The S&P 500 is replacing the Russell Midcap Value Index as the Fund’s benchmark. Since no index reflects the Fund’s strategy, comparison with a generally accepted market index such as the S&P 500 seems appropriate. One cannot invest directly in an index, nor is an index representative of the Fund’s portfolio. Please see Important Notes to Performance Information preceding the Fund Summaries.
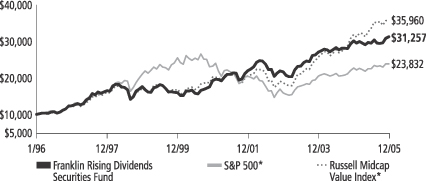
*Source: Standard & Poor’s Micropal. Please see Index Descriptions following the Fund Summaries.
Franklin Rising Dividends Securities Fund – Class 1
Performance reflects the Fund’s Class 1 operating expenses, but does not include any contract fees, expenses or sales charges. If they had been included, performance would be lower. These charges and deductions, particularly for variable life policies, can have a significant effect on contract values and insurance benefits. See the contract prospectus for a complete description of these expenses, including sales charges.
Performance data represent past performance, which does not guarantee future results. Investment return and principal value will fluctuate, and you may have a gain or loss when you sell your shares.
Current performance may differ from figures shown.
FRD-1
Fund Goal and Main Investments: Franklin Rising Dividends Securities Fund seeks long-term capital appreciation, with preservation of capital as an important consideration. The Fund normally invests at least 80% of its net assets in investments of companies that have paid rising dividends. The Fund invests predominantly in equity securities.
Performance Overview
You can find the Fund’s one-year total return in the Performance Summary. The Fund underperformed its benchmarks, the Russell Midcap Value Index, which returned +12.65%, and the S&P 500, which posted a +4.91% total return for the same period.1 The S&P 500 is replacing the Russell Midcap Value Index as the Fund’s benchmark. Since no index reflects the Fund’s strategy, comparison with a generally accepted market index such as the S&P 500 seems an appropriate benchmark.
Economic and Market Overview
During the 12 months ended December 31, 2005, U.S. economic expansion was driven by strength across most industries, sectors and regions. Gross domestic product (GDP) rose during the period, benefiting from increased personal consumption, federal spending and business investment, which increased 24% in third quarter 2005 compared with the same quarter in 2004.2 Slower export growth combined with greater demand for imported goods and materials fueled a widening trade gap. The U.S. dollar rallied in 2005, supported by rising short-term domestic interest rates and strong economic growth in the U.S. relative to many of its major trading partners.
Many businesses enjoyed record profits, propelled largely by productivity gains. Earnings for companies in the S&P 500 were estimated to have increased 13% in 2005.3 The labor market firmed as employment increased and the unemployment rate dropped from 5.4% to 4.9% during the reporting period. Personal income rose, and hiring rebounded in many industries, bolstered by healthy business spending.
1. Source: Standard & Poor’s Micropal. One cannot invest directly in an index, nor is an index representative of the Fund’s portfolio. Please see Index Descriptions following the Fund Summaries.
2. Source: Thomson Financial. Based on companies in the S&P 500.
3. Source: Standard & Poor’s.
Fund Risks: The Fund’s investments in stocks offer the potential for long-term gains but can be subject to short-term up-and-down price movements. Small and midsize company securities can increase the risk of greater price fluctuation, particularly over the short term. By having significant investments in particular sectors from time to time, the Fund may experience more volatility than a fund with a more broadly diversified portfolio. The Fund’s prospectus also includes a description of the main investment risks.
FRD-2
Oil prices remained high during the period largely due to potential long-term supply limitations and strong growth in global demand, especially from China and India. Natural gas prices rose during the second half of 2005 mainly because of expected rising demand with the onset of winter; however, near period-end prices retreated somewhat amid milder-than-expected weather conditions. Even with high commodity prices, inflation remained relatively contained for the 12 months ended December 31, 2005, as measured by the 2.2% rise for the core Consumer Price Index (CPI).4
Despite this inflation picture, the Federal Reserve Board raised the federal funds target rate from 2.25% to 4.25%. Compared with the rise in short-term interest rates, long-term rates remained relatively stable, supporting overall robust housing and commercial real estate activity, which contributed to economic growth. Throughout 2005, as short- and intermediate-term interest rates rose, the yield curve moved from a fairly normal steepness at the beginning of the period to relatively flat by the end of 2005.
In this environment, the blue chip stocks of the Dow Jones Industrial Average posted a one-year total return of +1.72%, while the broader S&P 500 and the technology-heavy NASDAQ Composite Index returned +4.91% and +2.12%.5
Investment Strategy
We are a research driven, fundamental investment adviser, pursuing a disciplined value-oriented strategy. As bottom-up investors concentrating primarily on individual securities, we seek fundamentally sound companies that we believe meet our screening criteria, which include consistent, substantial dividend increases; reinvested earnings; and strong balance sheets. We attempt to acquire such stocks at attractive prices, often when they are out of favor with other investors. In following these criteria, we do not necessarily focus on companies whose securities pay a high dividend but rather on companies that consistently raise their dividends.
4. Source: Bureau of Labor Statistics. Core CPI excludes food and energy costs.
5. Source: Standard & Poor’s Micropal. Please see Index Descriptions following the Fund Summaries.
What is the yield curve?
The yield curve is a graph illustrating the yields on bonds of the same credit quality with maturities ranging from the shortest to the longest available. The resulting curve shows if short-term interest rates are higher or lower than longer-term rates.
FRD-3
Manager’s Discussion
Significant positive contributors to the Fund’s return during the year ended December 31, 2005, included Roper Industries, Nucor and Praxair. Roper reported strong growth in sales and earnings as its recently acquired radio frequency technology segment performed well. Roper has increased its dividend 13 consecutive years. Nucor’s stock price reacted positively to industry reports that steel distributors increased orders after inventories hit a 15-month low in August. As a result, sheet steel prices rose in September. Nucor has increased its dividend for the last 32 years. High energy prices increased demand for the variety of industrial gases Praxair produces. Praxair has 12 years of dividend increases.
Fund holdings that negatively impacted our results this year included Fannie Mae, Family Dollar Stores, and Leggett & Platt. The stock of Fannie Mae, a public home mortgage company operating under federal charter, steadily declined over the year as concerns grew that the government might enact legislation related to its regulation that would reduce its overall value. Later in the period, Fannie Mae reported that it would not complete the restatement of its financials until the second half of 2006, disappointing many investors. Family Dollar’s relatively weak comparable store sales during its fiscal year (ended in August) caused company earnings to fall below expectations. Many of Family Dollar’s customers were hurt by high gasoline prices that likely reduced discretionary spending. Despite its recent slowdown, Family Dollar has increased its dividend for 29 years. Leggett & Platt’s operating results were hurt by higher-than-expected raw material costs and excess manufacturing capacity. Nonetheless, Leggett & Platt has 34 years of dividend increases.
The Fund initiated a significant new position in McCormick & Co. McCormick makes and distributes spices, seasonings and flavors to the food industry, including retail outlets, restaurants and food processors. McCormick has increased its dividend for 19 years. Existing Fund positions that were significantly increased include Freddie Mac, Dover, Family Dollar Stores and United Technologies.
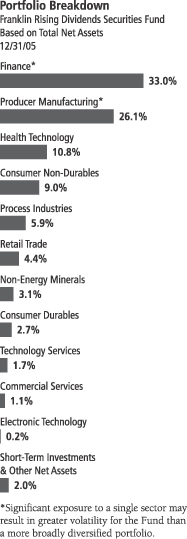
FRD-4
During the period, the Fund sold its position in Myers Industries. Myers, whose business segments provide a variety of industrial and consumer products ranging from tire supplies to storage containers, has faced particularly intense raw material cost pressures in the past couple of years. We also sold Wilmington Trust during the period, largely because its earnings growth and, as a result, its dividend growth have slowed in recent years. The Fund also completed its sale of Circor International, a designer, manufacturer and supplier of industrial fluid control devices, which had not increased its dividend since it was spun off from another company in 1999.
Our 10 largest positions on December 31, 2005, represented 41.3% of the Fund’s total net assets. It is interesting to note how these 10 companies would, in aggregate, respond to the Fund’s screening criteria based on a simple average of statistical measures. On average, these 10 companies have raised their dividends 22 years in a row and by 320% in the past 10 years. Their most recent year-over-year dividend increases averaged 21% with a yield of 1.9% and a dividend payout ratio of 31%, based on estimates of calendar 2005 operating earnings. The average price/earnings ratio was 17.8 times 2005 estimates versus 16.7 for that of the unmanaged S&P 500 on December 31, 2005.
Thank you for your participation in Franklin Rising Dividends Securities Fund. We look forward to serving your future investment needs.
The foregoing information reflects our analysis, opinions and portfolio holdings as of December 31, 2005, the end of the reporting period. The way we implement our main investment strategies and the resulting portfolio holdings may change depending on factors such as market and economic conditions. These opinions may not be relied upon as investment advice or an offer for a particular security. The information is not a complete analysis of every aspect of any market, country, industry, security or the Fund. Statements of fact are from sources considered reliable, but the adviser makes no representation or warranty as to their completeness or accuracy. Although historical performance is no guarantee of future results, these insights may help you understand our investment management philosophy.
Top 10 Holdings
Franklin Rising Dividends Securities Fund
12/31/05
| | |
Company Sector/Industry | | % of Total
Net Assets |
| |
| American International Group Inc. | | 4.5% |
| Finance | | |
| |
| Family Dollar Stores Inc. | | 4.3% |
| Retail Trade | | |
| |
| Roper Industries Inc. | | 4.3% |
| Producer Manufacturing | | |
| |
| Carlisle Cos. Inc. | | 4.3% |
| Producer Manufacturing | | |
| |
| United Technologies Corp. | | 4.2% |
| Producer Manufacturing | | |
| |
| Freddie Mac | | 4.1% |
| Finance | | |
| |
| General Electric Co. | | 4.1% |
| Producer Manufacturing | | |
| |
| Pfizer Inc. | | 4.0% |
| Health Technology | | |
| |
| Praxair Inc. | | 3.9% |
| Process Industries | | |
| |
| State Street Corp. | | 3.6% |
| Finance | | |
The dollar value, number of shares or principal amount, and names of all portfolio holdings are listed in the Fund’s Statement of Investments.
FRD-5
Fund Expenses
As an investor in a variable insurance contract (“Contract”) that indirectly provides for investment in an underlying mutual fund, you can incur transaction and/or ongoing expenses at both the Fund level and the Contract level.
| • | | Transaction expenses can include sales charges (loads) on purchases, redemption fees, surrender fees, transfer fees and premium taxes. |
| • | | Ongoing expenses can include management fees, distribution and service (12b-1) fees, contract fees, annual maintenance fees, mortality and expense risk fees and other fees and expenses. All mutual funds and Contracts have some types of ongoing expenses. |
The expenses shown in the table below are meant to highlight ongoing expenses at the Fund level only and do not include ongoing expenses at the Contract level, or transaction expenses at either the Fund or Contract level. While the Fund does not have transaction expenses, if the transaction and ongoing expenses at the Contract level were included, the expenses shown below would be higher. You should consult your Contract prospectus or disclosure document for more information.
The table shows Fund-level ongoing expenses and can help you understand these expenses and compare them with those of other mutual funds offered through the Contract. The table assumes a $1,000 investment held for the six months indicated. Please refer to the Fund prospectus for additional information on operating expenses.
Actual Fund Expenses
The first line (Actual) of the table below provides actual account values and expenses. The “Ending Account Value” is derived from the Fund’s actual return, which includes the effect of ongoing Fund expenses, but does not include the effect of ongoing Contract expenses.
You can estimate the Fund-level expenses you incurred during the period by following these steps. Of course, your account value and expenses will differ from those in this illustration:
| 1. | Divide your account value by $1,000. |
If an account had an $8,600 value, then $8,600 ÷ $1,000 = 8.6.
| 2. | Multiply the result by the number under the heading “Fund-Level Expenses Incurred During Period.” |
If Fund-Level Expenses Incurred During Period were $7.50, then 8.6 × $7.50 = $64.50.
Franklin Rising Dividends Securities Fund – Class 1
FRD-6
In this illustration, the estimated expenses incurred this period at the Fund level are $64.50.
Hypothetical Example for Comparison with Other Mutual Funds
Information in the second line (Hypothetical) of the table can help you compare ongoing expenses of the Fund with those of other mutual funds offered through the Contract. This information may not be used to estimate the actual ending account balance or expenses you incurred during the period. The hypothetical “Ending Account Value” is based on the Fund’s actual expense ratio and an assumed 5% annual rate of return before expenses, which does not represent the Fund’s actual return. The figure under the heading “Fund-Level Expenses Incurred During Period” shows the hypothetical expenses your account would have incurred under this scenario. You can compare this figure with the 5% hypothetical examples that appear in shareholder reports of other funds offered through a Contract.
| | | | | | | | | |
| Class 1 | | Beginning
Account
Value 7/1/05 | | Ending
Account
Value 12/31/05 | | Fund-Level
Expenses Incurred
During Period*
7/1/05-12/31/05 |
Actual | | $ | 1,000 | | $ | 1,057.20 | | $ | 3.21 |
Hypothetical (5% return before expenses) | | $ | 1,000 | | $ | 1,022.08 | | $ | 3.16 |
*Expenses are equal to the annualized expense ratio for the Fund’s Class 1 shares (0.62%), which does not include any ongoing expenses of the Contract for which the Fund is an investment option, multiplied by the average account value over the period, multiplied by 184/365 to reflect the one-half year period.
FRD-7
Franklin Templeton Variable Insurance Products Trust
Financial Highlights
Franklin Rising Dividends Securities Fund
| | | | | | | | | | | | | | | | | | | | |
| | | Year Ended December 31,
| |
| Class 1 | | 2005
| | | 2004
| | | 2003
| | | 2002
| | | 2001
| |
Per share operating performance | | | | | | | | | | | | | | | | | | | | |
(for a share outstanding throughout the year) | | | | | | | | | | | | | | | | | | | | |
Net asset value, beginning of year | | $ | 17.75 | | | $ | 16.28 | | | $ | 13.57 | | | $ | 14.19 | | | $ | 13.23 | |
| | |
|
|
|
Income from investment operations: | | | | | | | | | | | | | | | | | | | | |
Net investment incomea | | | 0.28 | | | | 0.26 | | | | 0.19 | | | | 0.16 | | | | 0.18 | |
Net realized and unrealized gains (losses) | | | 0.36 | | | | 1.55 | | | | 3.10 | | | | (0.30 | ) | | | 1.60 | |
| | |
|
|
|
Total from investment operations | | | 0.64 | | | | 1.81 | | | | 3.29 | | | | (0.14 | ) | | | 1.78 | |
| | |
|
|
|
Less distributions from: | | | | | | | | | | | | | | | | | | | | |
Net investment income | | | (0.18 | ) | | | (0.12 | ) | | | (0.14 | ) | | | (0.19 | ) | | | (0.01 | ) |
Net realized gains | | | (0.10 | ) | | | (0.22 | ) | | | (0.44 | ) | | | (0.29 | ) | | | (0.81 | ) |
| | |
|
|
|
Total distributions | | | (0.28 | ) | | | (0.34 | ) | | | (0.58 | ) | | | (0.48 | ) | | | (0.82 | ) |
| | |
|
|
|
Net asset value, end of year | | $ | 18.11 | | | $ | 17.75 | | | $ | 16.28 | | | $ | 13.57 | | | $ | 14.19 | |
| | |
|
|
|
| | | | | |
Total returnb | | | 3.68% | | | | 11.25% | | | | 24.88% | | | | (1.32)% | | | | 13.90% | |
Ratios/supplemental data | | | | | | | | | | | | | | | | | | | | |
Net assets, end of year (000’s) | | $ | 292,223 | | | $ | 326,883 | | | $ | 326,663 | | | $ | 292,881 | | | $ | 347,336 | |
Ratios to average net assets: | | | | | | | | | | | | | | | | | | | | |
Expenses | | | 0.62% | | | | 0.69% | | | | 0.76% | | | | 0.78% | | | | 0.76% | |
Net investment income | | | 1.65% | | | | 1.56% | | | | 1.39% | | | | 1.11% | | | | 1.36% | |
Portfolio turnover rate | | | 2.26% | | | | 2.78% | | | | 9.54% | | | | 14.06% | | | | 11.78% | |
aBased on average daily shares outstanding.
bTotal return does not include any fees, charges or expenses imposed by the variable annuity and life insurance contracts for which the Franklin Templeton Variable Insurance Products Trust serves as an underlying investment vehicle.
See notes to financial statements.
FRD-8
Franklin Templeton Variable Insurance Products Trust
Financial Highlights (continued)
Franklin Rising Dividends Securities Fund (continued)
| | | | | | | | | | | | | | | | | | | | |
| | | Year Ended December 31,
| |
| Class 2 | | 2005
| | | 2004
| | | 2003
| | | 2002
| | | 2001
| |
Per share operating performance | | | | | | | | | | | | | | | | | | | | |
(for a share outstanding throughout the year) | | | | | | | | | | | | | | | | | | | | |
Net asset value, beginning of year | | $ | 17.51 | | | $ | 16.09 | | | $ | 13.44 | | | $ | 14.09 | | | $ | 13.18 | |
| | |
|
|
|
Income from investment operations: | | | | | | | | | | | | | | | | | | | | |
Net investment incomea | | | 0.24 | | | | 0.22 | | | | 0.17 | | | | 0.13 | | | | 0.15 | |
Net realized and unrealized gains (losses) | | | 0.34 | | | | 1.53 | | | | 3.05 | | | | (0.31 | ) | | | 1.58 | |
| | |
|
|
|
Total from investment operations | | | 0.58 | | | | 1.75 | | | | 3.22 | | | | (0.18 | ) | | | 1.73 | |
| | |
|
|
|
Less distributions from: | | | | | | | | | | | | | | | | | | | | |
Net investment income | | | (0.15 | ) | | | (0.11 | ) | | | (0.13 | ) | | | (0.18 | ) | | | (0.01 | ) |
Net realized gains | | | (0.10 | ) | | | (0.22 | ) | | | (0.44 | ) | | | (0.29 | ) | | | (0.81 | ) |
| | |
|
|
|
Total distributions | | | (0.25 | ) | | | (0.33 | ) | | | (0.57 | ) | | | (0.47 | ) | | | (0.82 | ) |
| | |
|
|
|
Net asset value, end of year | | $ | 17.84 | | | $ | 17.51 | | | $ | 16.09 | | | $ | 13.44 | | | $ | 14.09 | |
| | |
|
|
|
| | | | | |
Total returnb | | | 3.43% | | | | 11.00% | | | | 24.59% | | | | (1.58)% | | | | 13.57% | |
Ratios/supplemental data | | | | | | | | | | | | | | | | | | | | |
Net assets, end of year (000’s) | | $ | 1,423,827 | | | $ | 997,800 | | | $ | 343,675 | | | $ | 63,879 | | | $ | 11,831 | |
Ratios to average net assets: | | | | | | | | | | | | | | | | | | | | |
Expenses | | | 0.87% | | | | 0.94% | | | | 1.01% | | | | 1.03% | | | | 1.01% | |
Net investment income | | | 1.40% | | | | 1.31% | | | | 1.14% | | | | 0.86% | | | | 1.13% | |
Portfolio turnover rate | | | 2.26% | | | | 2.78% | | | | 9.54% | | | | 14.06% | | | | 11.78% | |
aBased on average daily shares outstanding.
bTotal return does not include any fees, charges or expenses imposed by the variable annuity and life insurance contracts for which the Franklin Templeton Variable Insurance Products Trust serves as an underlying investment vehicle.
See notes to financial statements.
FRD-9
Franklin Templeton Variable Insurance Products Trust
Statement of Investments, December 31, 2005 (continued)
| | | | | |
| Franklin Rising Dividends Securities Fund | | Shares | | Value |
| | | | | | |
Common Stocks 98.0% | | | | | |
Commercial Services 1.1% | | | | | |
ABM Industries Inc. | | 963,740 | | $ | 18,841,117 |
| | | | |
|
|
Consumer Durables 2.7% | | | | | |
Leggett & Platt Inc. | | 1,837,700 | | | 42,193,592 |
Russ Berrie and Co. Inc. | | 362,400 | | | 4,138,608 |
| | | | |
|
|
| | | | | | 46,332,200 |
| | | | |
|
|
Consumer Non-Durables 9.0% | | | | | |
Alberto-Culver Co. | | 1,127,450 | | | 51,580,838 |
Lancaster Colony Corp. | | 117,800 | | | 4,364,490 |
McCormick & Co. Inc. | | 1,295,021 | | | 40,042,049 |
Procter & Gamble Co. | | 975,400 | | | 56,456,152 |
Superior Uniform Group Inc. | | 237,100 | | | 2,430,275 |
| | | | |
|
|
| | | | | | 154,873,804 |
| | | | |
|
|
Electronic Technology 0.2% | | | | | |
Cohu Inc. | | 50,300 | | | 1,150,361 |
Diebold Inc. | | 63,100 | | | 2,397,800 |
| | | | |
|
|
| | | | | | 3,548,161 |
| | | | |
|
|
Finance 33.0% | | | | | |
AFLAC Inc. | | 1,044,600 | | | 48,490,332 |
American International Group Inc. | | 1,134,055 | | | 77,376,573 |
Arthur J. Gallagher & Co. | | 627,500 | | | 19,377,200 |
Erie Indemnity Co., A | | 558,282 | | | 29,700,602 |
Fannie Mae | | 607,500 | | | 29,652,075 |
Freddie Mac | | 1,075,200 | | | 70,264,320 |
Mercantile Bankshares Corp. | | 220,525 | | | 12,446,431 |
Mercury General Corp. | | 154,200 | | | 8,977,524 |
Old Republic International Corp. | | 2,186,550 | | | 57,418,803 |
Peoples Bancorp Inc. | | 159,979 | | | 4,564,201 |
RLI Corp. | | 289,512 | | | 14,437,963 |
State Street Corp. | | 1,101,400 | | | 61,061,616 |
SunTrust Banks Inc. | | 442,104 | | | 32,167,487 |
TrustCo Bancorp NY | | 328,588 | | | 4,081,063 |
U.S. Bancorp | | 1,829,749 | | | 54,691,198 |
Washington Mutual Inc. | | 960,200 | | | 41,768,700 |
| | | | |
|
|
| | | | | | 566,476,088 |
| | | | |
|
|
Health Technology 10.8% | | | | | |
Becton, Dickinson and Co. | | 510,200 | | | 30,652,816 |
Hillenbrand Industries Inc. | | 1,174,800 | | | 58,046,868 |
Pfizer Inc. | | 2,944,300 | | | 68,661,076 |
West Pharmaceutical Services Inc. | | 1,125,600 | | | 28,173,768 |
| | | | |
|
|
| | | | | | 185,534,528 |
| | | | |
|
|
Non-Energy Minerals 3.1% | | | | | |
Nucor Corp. | | 793,600 | | | 52,948,992 |
| | | | |
|
|
Process Industries 5.9% | | | | | |
Bemis Co. Inc. | | 881,200 | | | 24,559,044 |
Donaldson Co. Inc. | | 289,800 | | | 9,215,640 |
Praxair Inc. | | 1,271,600 | | | 67,343,936 |
| | | | |
|
|
| | | | | | 101,118,620 |
| | | | |
|
|
FRD-10
Franklin Templeton Variable Insurance Products Trust
Statement of Investments, December 31, 2005 (continued)
| | | | | | |
| Franklin Rising Dividends Securities Fund | | Shares | | Value | |
| | | | | | | |
Common Stocks (cont.) | | | | | | |
Producer Manufacturing 26.1% | | | | | | |
Baldor Electric Co. | | 59,233 | | $ | 1,519,326 | |
Brady Corp., A | | 751,271 | | | 27,180,985 | |
Carlisle Cos. Inc. | | 1,064,200 | | | 73,589,430 | |
Dover Corp. | | 1,365,700 | | | 55,297,193 | |
General Electric Co. | | 1,986,600 | | | 69,630,330 | |
Graco Inc. | | 356,112 | | | 12,990,966 | |
Kaydon Corp. | | 109,600 | | | 3,522,544 | |
Nordson Corp. | | 141,800 | | | 5,744,318 | |
Roper Industries Inc. | | 1,870,000 | | | 73,883,700 | |
Superior Industries International Inc. | | 509,400 | | | 11,339,244 | |
Teleflex Inc. | | 617,800 | | | 40,144,644 | |
United Technologies Corp. | | 1,287,800 | | | 72,000,898 | |
| | | | |
|
|
|
| | | | | | 446,843,578 | |
| | | | |
|
|
|
Retail Trade 4.4% | | | | | | |
Family Dollar Stores Inc. | | 2,997,900 | | | 74,317,941 | |
| | | | |
|
|
|
Technology Services 1.7% | | | | | | |
The Reynolds and Reynolds Co., A | | 1,054,700 | | | 29,605,429 | |
| | | | |
|
|
|
Total Common Stocks (Cost $1,377,946,911) | | | | | 1,680,440,458 | |
| | | | |
|
|
|
Short Term Investment (Cost $38,496,029) 2.2% | | | | | | |
Money Fund 2.2% | | | | | | |
aFranklin Institutional Fiduciary Trust Money Market Portfolio | | 38,496,029 | | | 38,496,029 | |
| | | | |
|
|
|
Total Investments (Cost $1,416,442,940) 100.2% | | | | | 1,718,936,487 | |
Other Assets, less Liabilities (0.2)% | | | | | (2,887,111 | ) |
| | | | |
|
|
|
Net Assets 100.0% | | | | $ | 1,716,049,376 | |
| | | | |
|
|
|
aSee Note 7 regarding investments in the Franklin Institutional Fiduciary Trust Money Market Portfolio.
See notes to financial statements.
FRD-11
Franklin Templeton Variable Insurance Products Trust
Financial Statements
Statement of Assets and Liabilities
December 31, 2005
| | |
| | | Franklin Rising
Dividends
Securities Fund
|
Assets: | | |
Investments in securities: | | |
Cost - Unaffiliated issuers | | $1,377,946,911 |
Cost - Sweep Money Fund (Note 7) | | 38,496,029 |
| | |
|
Total cost of investments | | $1,416,442,940 |
| | |
|
Value - Unaffiliated issuers | | $1,680,440,458 |
Value - Sweep Money Fund (Note 7) | | 38,496,029 |
| | |
|
Total value of investments | | 1,718,936,487 |
Receivables: | | |
Capital shares sold | | 1,189,781 |
Dividends | | 3,215,411 |
| | |
|
Total assets | | 1,723,341,679 |
| | |
|
Liabilities: | | |
Payables: | | |
Investment securities purchased | | 4,764,061 |
Capital shares redeemed | | 960,662 |
Affiliates | | 1,453,795 |
Accrued expenses and other liabilities | | 113,785 |
| | |
|
Total liabilities | | 7,292,303 |
| | |
|
Net assets, at value | | $1,716,049,376 |
| | |
|
Net assets consist of: | | |
Paid-in capital | | $1,383,453,610 |
Undistributed net investment income | | 20,929,639 |
Net unrealized appreciation (depreciation) | | 302,493,547 |
Accumulated net realized gain (loss) | | 9,172,580 |
| | |
|
Net assets, at value | | $1,716,049,376 |
| | |
|
Class 1: | | |
Net assets, at value | | $ 292,222,680 |
| | |
|
Shares outstanding | | 16,133,007 |
| | |
|
Net asset value and offering price per share | | $18.11 |
| | |
|
Class 2: | | |
Net assets, at value | | $1,423,826,696 |
| | |
|
Shares outstanding | | 79,808,827 |
| | |
|
Net asset value and offering price per share | | $17.84 |
| | |
|
See notes to financial statements.
FRD-12
Franklin Templeton Variable Insurance Products Trust
Financial Statements (continued)
Statement of Operations
for the year ended December 31, 2005
| | | | |
| | | Franklin Rising
Dividends
Securities Fund
| |
Investment income: | | | | |
Dividends: | | | | |
Unaffiliated issuers | | $ | 32,307,629 | |
Sweep Money Fund (Note 7) | | | 2,302,390 | |
Other income (Note 8) | | | 17,230 | |
| | |
|
|
|
Total investment income | | | 34,627,249 | |
| | |
|
|
|
Expenses: | | | | |
Management fees (Note 3a) | | | 9,197,253 | |
Distribution fees - Class 2 (Note 3c) | | | 3,054,237 | |
Unaffiliated transfer agent fees | | | 8,650 | |
Custodian fees (Note 4) | | | 29,303 | |
Reports to shareholders | | | 194,872 | |
Professional fees | | | 48,367 | |
Trustees’ fees and expenses | | | 7,958 | |
Other | | | 34,994 | |
| | |
|
|
|
Total expenses | | | 12,575,634 | |
Expense reductions (Note 4) | | | (23 | ) |
| | |
|
|
|
Net expenses | | | 12,575,611 | |
| | |
|
|
|
Net investment income | | | 22,051,638 | |
| | |
|
|
|
Realized and unrealized gains (losses): | | | | |
Net realized gain (loss) from investments | | | 9,641,359 | |
Net change in unrealized appreciation (depreciation) on investments | | | 30,672,043 | |
| | |
|
|
|
Net realized and unrealized gain (loss) | | | 40,313,402 | |
| | |
|
|
|
Net increase (decrease) in net assets resulting from operations | | $ | 62,365,040 | |
| | |
|
|
|
See notes to financial statements.
FRD-13
Franklin Templeton Variable Insurance Products Trust
Financial Statements (continued)
Statements of Changes in Net Assets
| | | | | | | | |
| | | Franklin Rising
Dividends
Securities Fund
| |
| | | Year Ended December 31,
| |
| | | 2005 | | | 2004 | |
| | |
| |
Increase (decrease) in net assets: | | | | | | | | |
Operations: | | | | | | | | |
Net investment income | | $ | 22,051,638 | | | $ | 13,372,271 | |
Net realized gain (loss) from investments | | | 9,641,359 | | | | 9,288,374 | |
Net change in unrealized appreciation (depreciation) on investments | | | 30,672,043 | | | | 91,427,021 | |
| | |
| |
Net increase (decrease) in net assets resulting from operations | | | 62,365,040 | | | | 114,087,666 | |
| | |
| |
Distributions to shareholders from: | | | | | | | | |
Net investment income: | | | | | | | | |
Class 1 | | | (3,069,938 | ) | | | (2,310,932 | ) |
Class 2 | | | (10,934,889 | ) | | | (3,992,759 | ) |
Net realized gains: | | | | | | | | |
Class 1 | | | (1,827,676 | ) | | | (4,151,975 | ) |
Class 2 | | | (7,458,191 | ) | | | (7,861,547 | ) |
| | |
| |
Total distributions to shareholders | | | (23,290,694 | ) | | | (18,317,213 | ) |
| | |
| |
Capital share transactions: (Note 2) | | | | | | | | |
Class 1 | | | (39,815,762 | ) | | | (27,430,346 | ) |
Class 2 | | | 392,107,967 | | | | 586,005,320 | |
| | |
| |
Total capital share transactions | | | 352,292,205 | | | | 558,574,974 | |
| | |
| |
Net increase (decrease) in net assets | | | 391,366,551 | | | | 654,345,427 | |
Net assets: | | | | | | | | |
Beginning of year | | | 1,324,682,825 | | | | 670,337,398 | |
| | |
| |
End of year | | $ | 1,716,049,376 | | | $ | 1,324,682,825 | |
| | |
| |
Undistributed net investment income included in net assets: | | | | | | | | |
End of year | | $ | 20,929,639 | | | $ | 12,882,816 | |
| | |
| |
See notes to financial statements.
FRD-14
Franklin Templeton Variable Insurance Products Trust
Notes to Financial Statements
Franklin Rising Dividends Securities Fund
1. ORGANIZATION AND SIGNIFICANT ACCOUNTING POLICIES
Franklin Templeton Variable Insurance Products Trust (the Trust) is registered under the Investment Company Act of 1940 as an open-end investment company, consisting of twenty-two separate series. The Franklin Rising Dividends Securities Fund (the Fund) included in this report is diversified. The financial statements of the remaining funds in the series are presented separately. Shares of the Fund are sold only to insurance company separate accounts to fund the benefits of variable life insurance policies or variable annuity contracts.
The following summarizes the Fund’s significant accounting policies.
a. Security Valuation
Securities listed on a securities exchange or on the NASDAQ National Market System are valued at the last quoted sale price or the official closing price of the day, respectively. Over-the-counter securities and listed securities for which there is no reported sale are valued within the range of the most recent quoted bid and ask prices. Securities that trade in multiple markets or on multiple exchanges are valued according to the broadest and most representative market. Investments in open-end mutual funds are valued at the closing net asset value.
The Trust has procedures to determine the fair value of individual securities and other assets for which market prices are not readily available or which may not be reliably priced. Methods for valuing these securities may include: fundamental analysis, matrix pricing, discounts from market prices of similar securities, or discounts applied due to the nature and duration of restrictions on the disposition of the securities. Due to the inherent uncertainty of valuations of such securities, the fair values may differ significantly from the values that would have been used had a ready market for such investments existed. Occasionally, events occur between the time at which trading in a security is completed and the close of the NYSE that might call into question the availability (including the reliability) of the value of a portfolio security held by the Fund. If such an event occurs, the securities may be valued using fair value procedures, which may include the use of independent pricing services. All security valuation procedures are approved by the Trust’s Board of Trustees.
b. Income Taxes
No provision has been made for U.S. income taxes because the Fund’s policy is to continue to qualify as a regulated investment company under the Internal Revenue Code and to distribute to shareholders substantially all of its taxable income and net realized gains.
c. Security Transactions, Investment Income, Expenses and Distributions
Security transactions are accounted for on trade date. Realized gains and losses on security transactions are determined on a specific identification basis. Interest income and estimated expenses are accrued daily. Dividend income is recorded on the ex-dividend date. Distributions to shareholders are recorded on the ex-dividend date and are determined according to income tax regulations (tax basis). Such distributions are reinvested in additional shares of the Fund. Distributable earnings determined on a tax basis may differ from earnings recorded in accordance with generally accepted accounting principles. These differences may be permanent or temporary. Permanent differences are reclassified among capital accounts to reflect their tax character. These reclassifications have no impact on net assets or the results of operations. Temporary differences are not reclassified, as they may reverse in subsequent periods.
Common expenses incurred by the Trust are allocated among the funds based on the ratio of net assets of each fund to the combined net assets of the Trust. Fund specific expenses are charged directly to the fund that incurred the expense.
Realized and unrealized gains and losses and net investment income, other than class specific expenses, are allocated daily to each class of shares based upon the relative proportion of net assets of each class.
FRD-15
Franklin Templeton Variable Insurance Products Trust
Notes to Financial Statements (continued)
Franklin Rising Dividends Securities Fund
1. ORGANIZATION AND SIGNIFICANT ACCOUNTING POLICIES (continued)
d. Accounting Estimates
The preparation of financial statements in accordance with accounting principles generally accepted in the United States of America requires management to make estimates and assumptions that affect the reported amounts of assets and liabilities at the date of the financial statements and the amounts of income and expenses during the reporting period. Actual results could differ from those estimates.
e. Guarantees and Indemnifications
Under the Trust’s organizational documents, its officers and trustees are indemnified by the Trust against certain liabilities arising out of the performance of their duties to the Trust. Additionally, in the normal course of business, the Trust enters into contracts with service providers that contain general indemnification clauses. The Trust’s maximum exposure under these arrangements is unknown as this would involve future claims that may be made against the Trust that have not yet occurred. However, based on experience, the Trust expects the risk of loss to be remote.
2. SHARES OF BENEFICIAL INTEREST
The Fund offers two classes of shares: Class 1 and Class 2. Each class of shares differs by its distribution fees, voting rights on matters affecting a single class and its exchange privilege.
At December 31, 2005, there were an unlimited number of shares authorized ($0.01 par value). Transactions in the Fund’s shares were as follows:
| | | | | | | | | | | | | | |
| | | Year Ended December 31,
| |
| | | 2005
| | | 2004
| |
| Class 1 Shares: | | Shares
| | | Amount
| | | Shares
| | | Amount
| |
Shares sold | | 756,627 | | | $ | 13,148,749 | | | 912,042 | | | $ | 15,156,388 | |
Shares issued in reinvestment of distributions | | 282,446 | | | | 4,897,614 | | | 392,167 | | | | 6,462,907 | |
Shares redeemed | | (3,321,270 | ) | | | (57,862,125 | ) | | (2,956,896 | ) | | | (49,049,641 | ) |
| | |
| |
Net increase (decrease) | | (2,282,197 | ) | | $ | (39,815,762 | ) | | (1,652,687 | ) | | $ | (27,430,346 | ) |
| | |
| |
| Class 2 Shares: | | | | | | | | | | | | |
Shares sold | | 24,862,959 | | | $ | 426,796,314 | | | 35,974,710 | | | $ | 591,488,279 | |
Shares issued in reinvestment of distributions | | 1,075,619 | | | | 18,393,080 | | | 728,151 | | | | 11,854,306 | |
Shares redeemed | | (3,120,733 | ) | | | (53,081,427 | ) | | (1,073,616 | ) | | | (17,337,265 | ) |
| | |
| |
Net increase (decrease) | | 22,817,845 | | | $ | 392,107,967 | | | 35,629,245 | | | $ | 586,005,320 | |
| | |
| |
FRD-16
Franklin Templeton Variable Insurance Products Trust
Notes to Financial Statements (continued)
Franklin Rising Dividends Securities Fund
3. TRANSACTIONS WITH AFFILIATES
Franklin Resources, Inc. is the holding company for various subsidiaries that together are referred to as Franklin Templeton Investments. Certain officers and trustees of the Trust are also officers and/or directors of the following subsidiaries:
| | |
| Subsidiary | | Affiliation |
Franklin Advisory Services, LLC (Advisory Services) | | Investment manager |
Franklin Templeton Services, LLC (FT Services) | | Administrative manager |
Franklin Templeton Distributors, Inc. (Distributors) | | Principal underwriter |
Franklin Templeton Investor Services, LLC (Investor Services) | | Transfer agent |
a. Management Fees
The Fund pays an investment management fee to Advisory Services based on the average daily net assets of the Fund as follows:
| | |
| Annualized Fee Rate | | Net Assets |
| 0.750% | | Up to and including $500 million |
| 0.625% | | Over $500 million, up to and including $1 billion |
| 0.500% | | In excess of $1 billion |
b. Administrative Fees
Under an agreement with Advisory Services, FT Services provides administrative services to the Fund. The fee is paid by Advisory Services based on average daily net assets, and is not an additional expense of the Fund.
c. Distribution Fees
The Fund’s Board of Trustees has adopted distribution plans for Class 2 shares pursuant to Rule 12b-1 under the 1940 Act. Under the Fund’s compensation distribution plans, the Fund pays Distributors for costs incurred in connection with the sale and distribution of the Fund’s shares up to 0.35% per year of its average daily net assets. The Board of Trustees has set the current rate at 0.25% per year.
d. Transfer Agent Fees
Investor Services, under terms of an agreement, performs shareholder servicing for the Fund and is not paid by the Fund for the services.
4. EXPENSE OFFSET ARRANGEMENT
The Fund has entered into an arrangement with its custodian whereby credits realized as a result of uninvested cash balances are used to reduce a portion of the Fund’s custodian expenses. During the year ended December 31, 2005, the custodian fees were reduced as noted in the Statement of Operations.
FRD-17
Franklin Templeton Variable Insurance Products Trust
Notes to Financial Statements (continued)
Franklin Rising Dividends Securities Fund
5. INCOME TAXES
The tax character of distributions paid during the years ended December 31, 2005 and 2004, was as follows:
| | | | | | |
| | | 2005
| | 2004
|
Distributions paid from: | | | | | | |
Ordinary income | | $ | 14,004,827 | | $ | 6,303,691 |
Long term capital gain | | | 9,285,867 | | | 12,013,522 |
| | |
| |
|
| | | $ | 23,290,694 | | $ | 18,317,213 |
| | |
| |
|
At December 31, 2005, the cost of investments, net unrealized appreciation (depreciation), undistributed ordinary income and undistributed long term capital gains for income tax purposes were as follows:
| | | | |
Cost of investments | | $ | 1,416,910,984 | |
| | |
|
|
|
| |
Unrealized appreciation | | $ | 347,757,949 | |
Unrealized depreciation | | | (45,732,446 | ) |
| | |
|
|
|
Net unrealized appreciation (depreciation) | | $ | 302,025,503 | |
| | |
|
|
|
Undistributed ordinary income | | $ | 22,857,419 | |
Undistributed long term capital gains | | | 7,712,845 | |
| | |
|
|
|
Distributable earnings | | $ | 30,570,264 | |
| | |
|
|
|
Net realized gains (losses) differ for financial statement and tax purposes primarily due to differing treatment of wash sales.
6. INVESTMENT TRANSACTIONS
Purchases and sales of investments (excluding short term securities) for the year ended December 31, 2005 aggregated $491,957,111 and $32,611,469, respectively.
7. INVESTMENTS IN FRANKLIN INSTITUTIONAL FIDUCIARY TRUST MONEY MARKET PORTFOLIO
The Fund may invest in the Franklin Institutional Fiduciary Trust Money Market Portfolio (the Sweep Money Fund), an open-end investment company managed by Franklin Advisers Inc. (an affiliate of the investment manager). Management fees paid by the Fund are reduced on assets invested in the Sweep Money Fund, in an amount not to exceed the management and administrative fees paid by the Sweep Money Fund.
8. REGULATORY MATTERS
As part of various investigations by a number of federal, state, and foreign regulators and governmental entities, relating to certain practices in the mutual fund industry, including late trading, market timing and marketing support payments to securities dealers who sell fund shares, Franklin Resources, Inc. and certain of its subsidiaries (collectively, the “Company”), entered into settlements with certain of those regulators.
Specifically, the Company entered into settlements with the Securities and Exchange Commission (“SEC”) concerning market timing (the “August 2, 2004 SEC Order”) and marketing support payments to securities dealers who sell fund shares (the “December 13, 2004 SEC Order”) and with the California Attorney General’s Office (“CAGO”) concerning marketing support payments to securities dealers who sell fund shares (the “CAGO Settlement”). Under the terms of the settlements with the SEC and the CAGO, the Company retained an Independent Distribution Consultant (“IDC”) to develop a plan for distribution of the
FRD-18
Franklin Templeton Variable Insurance Products Trust
Notes to Financial Statements (continued)
Franklin Rising Dividends Securities Fund
8. REGULATORY MATTERS (continued)
respective settlement monies. The CAGO approved the distribution plan under the CAGO Settlement and, in accordance with the terms and conditions of that settlement, the monies were disbursed to the relevant funds and are recorded as other income in the current period. The SEC has not yet approved the distribution plan pertaining to the December 13, 2004 SEC Order. When approved, disbursements of settlement monies will be made promptly to the relevant funds, in accordance with the terms and conditions of that order. The IDC continues to develop the plan of distribution under the August 2, 2004 SEC Order that resolved the SEC’s market timing investigation.
In addition, the Company, as well as most of the mutual funds within Franklin Templeton Investments and certain current or former officers, directors, and/or employees, have been named in private lawsuits (styled as shareholder class actions, or as derivative actions on behalf of either the named funds or Franklin Resources, Inc.) relating to the industry practices referenced above, as well as to allegedly excessive advisory fees, commissions, and/or 12b-1 fees. The lawsuits were filed in different courts throughout the country. Many of those suits are now pending in a multi-district litigation in the United States District Court for the District of Maryland.
The Company and fund management strongly believe that the claims made in each of the private lawsuits referenced above are without merit and intend to defend against them vigorously. The Company cannot predict with certainty the eventual outcome of these lawsuits, nor whether they will have a material negative impact on the Company. If it is determined that the Company bears responsibility for any unlawful or inappropriate conduct that caused losses to the Trust, it is committed to making the Trust or their shareholders whole, as appropriate.
FRD-19
Franklin Templeton Variable Insurance Products Trust
Franklin Rising Dividends Securities Fund
Report of Independent Registered Public Accounting Firm
To the Board of Trustees and Shareholders of
Franklin Templeton Variable Insurance Products Trust
In our opinion, the accompanying statement of assets and liabilities, including the statement of investments, and the related statements of operations and of changes in net assets and the financial highlights present fairly, in all material respects, the financial position of Franklin Rising Dividends Securities Fund (one of the funds constituting Franklin Templeton Variable Insurance Products Trust, hereafter referred to as the “Fund”) at December 31, 2005, the results of its operations for the year then ended, the changes in its net assets for each of the two years in the period then ended and the financial highlights for each of the five years in the period then ended, in conformity with accounting principles generally accepted in the United States of America. These financial statements and financial highlights (hereafter referred to as “financial statements”) are the responsibility of the Fund’s management; our responsibility is to express an opinion on these financial statements based on our audits. We conducted our audits of these financial statements in accordance with the standards of the Public Company Accounting Oversight Board (United States). Those standards require that we plan and perform the audit to obtain reasonable assurance about whether the financial statements are free of material misstatement. An audit includes examining, on a test basis, evidence supporting the amounts and disclosures in the financial statements, assessing the accounting principles used and significant estimates made by management, and evaluating the overall financial statement presentation. We believe that our audits, which included confirmation of securities at December 31, 2005, by correspondence with the custodian and brokers, provide a reasonable basis for our opinion.
PricewaterhouseCoopers LLP
San Francisco, California
February 10, 2006
FRD-20
Franklin Templeton Variable Insurance Products Trust
Tax Designation (unaudited)
Notes to Financial Statements (continued)
Under Section 852(b)(3)(C) of the Internal Revenue Code (Code), the Fund designates the maximum amount allowable but no less than $7,713,580 as a capital gain dividend for the fiscal year ended December 31, 2005.
Under Section 854(b)(2) of the Code, the Fund designates 100% of the ordinary income dividends as income qualifying for the dividends received deduction for the fiscal year ended December 31, 2005.
FRD-21
FRANKLIN SMALL CAP VALUE SECURITIES FUND
We are pleased to bring you Franklin Small Cap Value Securities Fund’s annual report for the fiscal year ended December 31, 2005.
Performance Summary as of 12/31/05
Average annual total return of Class 1 shares represents the average annual change in value, assuming reinvestment of dividends and capital gains. Average returns smooth out variations in returns, which can be significant; they are not the same as year-by-year results.
Periods ended 12/31/05
| | | | | | |
| | | 1-Year | | 5-Year | | Since
Inception
(5/1/98) |
Average Annual Total Return | | +8.99% | | +13.23% | | +8.31% |
Total Return Index Comparison for Hypothetical $10,000 Investment (5/1/98–12/31/05)
The graph below shows the change in value of a hypothetical $10,000 investment in the Fund over the indicated period and includes reinvestment of any income or distributions. The Fund’s performance is compared to the performance of the Russell 2500™ Value Index and the Russell 2000® Value Index. We are replacing the Russell 2000 Value Index with the Russell 2500 Value Index because we believe the composition of the Russell 2500 Value Index better reflects the Fund’s investments. One cannot invest directly in an index, nor is an index representative of the Fund’s portfolio. Please see Important Notes to Performance Information preceding the Fund Summaries.
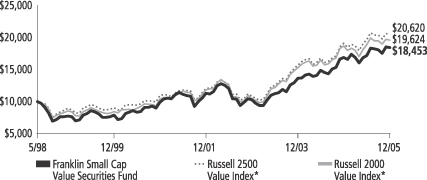
*Source: Standard & Poor’s Micropal. Please see Index Descriptions following the Fund Summaries.
Franklin Small Cap Value Securities Fund – Class 1
Performance reflects the Fund’s Class 1 operating expenses, but does not include any contract fees, expenses or sales charges. If they had been included, performance would be lower. These charges and deductions, particularly for variable life policies, can have a significant effect on contract values and insurance benefits. See the contract prospectus for a complete description of these expenses, including sales charges.
Performance data represent past performance, which does not guarantee future results. Investment return and principal value will fluctuate, and you may have a gain or loss when you sell your shares. Current performance may differ from figures shown.
FSV-1
Fund Goal and Main Investments: Franklin Small Cap Value Securities Fund seeks long-term total return. The Fund normally invests at least 80% of its net assets in investments of small capitalization companies, and invests predominantly in equity securities. For this Fund, small capitalization companies are those with market capitalization values not exceeding $2.5 billion at the time of purchase. The Fund invests mainly in equity securities of companies that the manager believes are undervalued.
Performance Overview
You can find the Fund’s one-year total return in the Performance Summary. The Fund outperformed its benchmarks, the Russell 2500 Value Index and the Russell 2000 Value Index, which returned +7.74% and +4.71%.1 Please note that the Fund employs a bottom-up stock selection process, and the managers invest in securities without regard to benchmark comparisons.
Economic and Market Overview
During the 12 months ended December 31, 2005, U.S. economic expansion was driven by strength across most industries, sectors and regions. Gross domestic product (GDP) rose during the period, benefiting from increased personal consumption, federal spending and business investment, which increased 24% in third quarter 2005 compared with the same quarter in 2004.2 Slower export growth combined with greater demand for imported goods and materials fueled a widening trade gap. The U.S. dollar rallied in 2005, supported by rising short-term domestic interest rates and strong economic growth in the U.S. relative to many of its major trading partners.
Many businesses enjoyed record profits, propelled largely by productivity gains. Earnings for companies in the Standard & Poor’s 500 Index (S&P 500) were estimated to have increased 13% in 2005.3 The labor market firmed as employment increased and the unemployment rate dropped from 5.4% to 4.9% during the reporting period. Personal income rose, and hiring rebounded in many industries, bolstered by healthy business spending.
1. Source: Standard & Poor’s Micropal. One cannot invest directly in an index, nor is an index representative of the Fund’s portfolio. Please see Index Descriptions following the Fund Summaries.
2. Source: Thomson Financial. Based on companies in the S&P 500.
3. Source: Standard & Poor’s.
Fund Risks: The Fund’s investments in stocks offer the potential for long-term gains but can be subject to short-term up-and-down price movements. Smaller companies can be particularly sensitive to changing economic conditions; their prospects for growth are less certain than those of larger, more established companies; and their securities are more volatile, especially over the short term. Foreign investing involves special risks including currency fluctuations, economic instability, and social and political developments. The Fund’s prospectus also includes a description of the main investment risks.
FSV-2
Oil prices remained high during the period largely due to potential long-term supply limitations and strong growth in global demand, especially from China and India. Natural gas prices rose during the second half of 2005 mainly because of expected rising demand with the onset of winter; however, near period-end prices retreated somewhat amid milder-than-expected weather conditions. Even with high commodity prices, inflation remained relatively contained for the 12 months ended December 31, 2005, as measured by the 2.2% rise for the core Consumer Price Index (CPI).4
Despite this inflation picture, the Federal Reserve Board raised the federal funds target rate from 2.25% to 4.25%. Compared with the rise in short-term interest rates, long-term rates remained relatively stable, supporting overall robust housing and commercial real estate activity, which contributed to economic growth. Throughout 2005, as short- and intermediate-term interest rates rose, the yield curve moved from a fairly normal steepness at the beginning of the period to relatively flat by the end of 2005.
In this environment, the blue chip stocks of the Dow Jones Industrial Average posted a one-year total return of +1.72%, while the broader S&P 500 and the technology-heavy NASDAQ Composite Index returned +4.91% and +2.12%.5
Investment Strategy
We are a research driven, fundamental investment adviser, pursuing a disciplined, value-oriented strategy for the Fund. As a bottom-up adviser concentrating primarily on individual securities, we focus on the market price of a company’s securities relative to our evaluation of the company’s potential long-term earnings, asset value or cash flow. We seek bargains among the “under-researched and unloved,” out-of-favor companies that offer, in our opinion, attractive long-term potential that might include current growth companies that are being ignored by the market, former growth companies that have stumbled recently, dropping sharply in price but that still have significant growth potential, in our opinion, or companies that are or may be potential turnaround or takeover targets.
4. Source: Bureau of Labor Statistics. Core CPI excludes food and energy costs.
5. Source: Standard & Poor’s Micropal. Please see Index Descriptions following the Fund Summaries.
What is the yield curve?
The yield curve is a graph illustrating the yields on bonds of the same credit quality with maturities ranging from the shortest to the longest available. The resulting curve shows if short-term interest rates are higher or lower than longer-term rates.
FSV-3
Manager’s Discussion
During the year under review, the Fund’s performance benefited from a variety of sectors. The energy minerals sector was the top contributor, mainly due to returns from our coal positions: Arch Coal (+125%), Peabody Energy (+105%) and Consol Energy (+60%). The Fund’s best performing stock was aerial work platforms manufacturer JLG Indus-tries, rising 133% during the period as a result of strong demand across product lines and higher sales guidance for fiscal year 2006.
Despite the Fund’s solid performance, several stocks negatively impacted the Fund’s return during the reporting period. The consumer durables sector underperformed, including gift designer and distributor Russ Berrie (-50%) and recreational vehicle manufacturer Monaco Coach (-34%). Lower earnings reports weakened Russ Berrie’s performance, while excess inventories hurt Monaco Coach’s results. In addition, the electronic technology sector detracted from the Fund’s performance. Of note was Avocent (-33%), whose rocky product launch and slower growth expectations caused the stock to tumble.
The Fund experienced significant net inflows during its fiscal year, and we used a portion of the proceeds to invest in 18 new positions. A recent addition was Bob Evans Farms, the owner and operator of Bob Evans Restaurants and Owens Family Restaurants. At period-end, Bob Evans traded at 1.3 times book value and its dividend yield was 2%. Another value-oriented addition was construction and maintenance products distributor Hughes Supply, which traded at 14 times 2006 earnings estimates and 1.7 times book value at period-end. In line with our strategy, we also initiated positions in Genesee & Wyoming, a freight railroad operator; Regis, a hair salon operator and franchiser; Airgas, a distributor of industrial, medical and specialty gases and equipment; and Nordson, an adhesives, sealants and coatings manufacturer. We also added significantly to several existing positions we believed were attractively valued, most notably Graco, a manufacturer of fluid materials systems; IPC Holdings and Montpelier Re Holdings, both global reinsurance providers.
During the year, we eliminated eight positions from the portfolio, four of which were due to takeovers. We decided to eliminate our Archipelago position as open-market prices were in line with our fair valuation of the shares. Our shares in OshKosh B’Gosh, Thomas Industries and York International were also sold as a result of buyouts. The other four sales were holdings that we believed reached full valuation: Holly, Myers Industries, Shaw Group and Stewart & Stevenson Services.
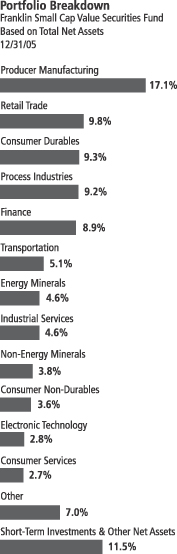
FSV-4
Thank you for your participation in Franklin Small Cap Value Securities Fund. We look forward to serving your future investment needs.
The foregoing information reflects our analysis, opinions and portfolio holdings as of December 31, 2005, the end of the reporting period. The way we implement our main investment strategies and the resulting portfolio holdings may change depending on factors such as market and economic conditions. These opinions may not be relied upon as investment advice or an offer for a particular security. The information is not a complete analysis of every aspect of any market, country, industry, security or the Fund. Statements of fact are from sources considered reliable, but the adviser makes no representation or warranty as to their completeness or accuracy. Although historical performance is no guarantee of future results, these insights may help you understand our investment management philosophy.
Top 10 Holdings
Franklin Small Cap Value Securities Fund 12/31/05
| | |
Company
Sector/Industry | | % of Total
Net Assets |
| |
| Thor Industries Inc. | | 2.1% |
| Consumer Durables | | |
| |
| Peabody Energy Corp. | | 2.1% |
| Energy Minerals | | |
| |
| Reliance Steel & Aluminum Co. | | 1.7% |
| Non-Energy Minerals | | |
| |
| Graco Inc. | | 1.6% |
| Producer Manufacturing | | |
| |
| Steel Dynamics Inc. | | 1.6% |
| Non-Energy Minerals | | |
| |
| Briggs & Stratton Corp. | | 1.6% |
| Consumer Durables | | |
| |
| Regis Corp. | | 1.5% |
| Retail Trade | | |
| |
| Aspen Insurance Holdings Ltd. | | 1.5% |
| Finance | | |
| |
| Mine Safety Appliances Co. | | 1.4% |
| Process Industries | | |
| |
| Wabash National Corp. | | 1.4% |
| Producer Manufacturing | | |
The dollar value, number of shares or principal amount, and names of all portfolio holdings are listed in the Fund’s Statement of Investments.
FSV-5
Fund Expenses
As an investor in a variable insurance contract (“Contract”) that indirectly provides for investment in an underlying mutual fund, you can incur transaction and/or ongoing expenses at both the Fund level and the Contract level.
| • | | Transaction expenses can include sales charges (loads) on purchases, redemption fees, surrender fees, transfer fees and premium taxes. |
| • | | Ongoing expenses can include management fees, distribution and service (12b-1) fees, contract fees, annual maintenance fees, mortality and expense risk fees and other fees and expenses. All mutual funds and Contracts have some types of ongoing expenses. |
The expenses shown in the table below are meant to highlight ongoing expenses at the Fund level only and do not include ongoing expenses at the Contract level, or transaction expenses at either the Fund or Contract level. While the Fund does not have transaction expenses, if the transaction and ongoing expenses at the Contract level were included, the expenses shown below would be higher. You should consult your Contract prospectus or disclosure document for more information.
The table shows Fund-level ongoing expenses and can help you understand these expenses and compare them with those of other mutual funds offered through the Contract. The table assumes a $1,000 investment held for the six months indicated. Please refer to the Fund prospectus for additional information on operating expenses.
Actual Fund Expenses
The first line (Actual) of the table below provides actual account values and expenses. The “Ending Account Value” is derived from the Fund’s actual return, which includes the effect of ongoing Fund expenses, but does not include the effect of ongoing Contract expenses.
You can estimate the Fund-level expenses you incurred during the period by following these steps. Of course, your account value and expenses will differ from those in this illustration:
| 1. | Divide your account value by $1,000. |
If an account had an $8,600 value, then $8,600 ÷ $1,000 = 8.6.
| 2. | Multiply the result by the number under the heading “Fund-Level Expenses Incurred During Period.” |
If Fund-Level Expenses Incurred During Period were $7.50, then 8.6 × $7.50 = $64.50.
Franklin Small Cap Value Securities Fund – Class 1
FSV-6
In this illustration, the estimated expenses incurred this period at the Fund level are $64.50.
Hypothetical Example for Comparison with Other Mutual Funds
Information in the second line (Hypothetical) of the table can help you compare ongoing expenses of the Fund with those of other mutual funds offered through the Contract. This information may not be used to estimate the actual ending account balance or expenses you incurred during the period. The hypothetical “Ending Account Value” is based on the Fund’s actual expense ratio and an assumed 5% annual rate of return before expenses, which does not represent the Fund’s actual return. The figure under the heading “Fund-Level Expenses Incurred During Period” shows the hypothetical expenses your account would have incurred under this scenario. You can compare this figure with the 5% hypothetical examples that appear in shareholder reports of other funds offered through a Contract.
| | | | | | | | | |
| Class 1 | | Beginning
Account
Value 7/1/05 | | Ending
Account
Value 12/31/05 | | Fund-Level
Expenses Incurred
During Period*
7/1/05-12/31/05 |
Actual | | $ | 1,000 | | $ | 1,071.10 | | $ | 3.39 |
Hypothetical (5% return before expenses) | | $ | 1,000 | | $ | 1,021.93 | | $ | 3.31 |
*Expenses are equal to the annualized expense ratio for the Fund’s Class 1 shares (0.65%), which does not include any ongoing expenses of the Contract for which the Fund is an investment option, multiplied by the average account value over the period, multiplied by 184/365 to reflect the one-half year period.
FSV-7
Franklin Templeton Variable Insurance Products Trust
Financial Highlights
Franklin Small Cap Value Securities Fund
| | | | | | | | | | | | | | | | | | | | |
| | | Year Ended December 31,
| |
| Class 1 | | 2005 | | | 2004 | | | 2003 | | | 2002 | | | 2001 | |
| | |
|
|
|
Per share operating performance | | | | | | | | | | | | | | | | | | | | |
(for a share outstanding throughout the year) | | | | | | | | | | | | | | | | | | | | |
Net asset value, beginning of year | | $ | 15.85 | | | $ | 12.81 | | | $ | 9.70 | | | $ | 10.97 | | | $ | 9.86 | |
| | |
|
|
|
Income from investment operations: | | | | | | | | | | | | | | | | | | | | |
Net investment incomea | | | 0.17 | | | | 0.21 | | | | 0.06 | | | | 0.07 | | | | 0.11 | |
Net realized and unrealized gains (losses) | | | 1.24 | | | | 2.87 | | | | 3.08 | | | | (1.01 | ) | | | 1.29 | |
| | |
|
|
|
Total from investment operations | | | 1.41 | | | | 3.08 | | | | 3.14 | | | | (0.94 | ) | | | 1.40 | |
| | |
|
|
|
Less distributions from: | | | | | | | | | | | | | | | | | | | | |
Net investment income | | | (0.14 | ) | | | (0.04 | ) | | | (0.03 | ) | | | (0.05 | ) | | | (0.05 | ) |
Net realized gains | | | (0.10 | ) | | | — | | | | — | | | | (0.28 | ) | | | (0.24 | ) |
| | |
|
|
|
Total distributions | | | (0.24 | ) | | | (0.04 | ) | | | (0.03 | ) | | | (0.33 | ) | | | (0.29 | ) |
| | |
|
|
|
Net asset value, end of year | | $ | 17.02 | | | $ | 15.85 | | | $ | 12.81 | | | $ | 9.70 | | | $ | 10.97 | |
| | |
|
|
|
| | | | | |
Total returnb | | | 8.99% | | | | 24.09% | | | | 32.47% | | | | (9.05)% | | | | 14.21% | |
Ratios/supplemental data | | | | | | | | | | | | | | | | | | | | |
Net assets, end of year (000’s) | | $ | 52,632 | | | $ | 50,401 | | | $ | 37,108 | | | $ | 28,720 | | | $ | 32,604 | |
Ratios to average net assets: | | | | | | | | | | | | | | | | | | | | |
Expenses | | | 0.64% | | | | 0.67% | | | | 0.74% | | | | 0.76% | | | | 0.77% | |
Net investment income | | | 1.05% | | | | 1.59% | | | | 0.63% | | | | 0.63% | | | | 1.07% | |
Portfolio turnover rate | | | 11.03% | | | | 9.50% | | | | 12.52% | | | | 5.11% | | | | 40.54% | |
aBased on average daily shares outstanding.
bTotal return does not include any fees, charges or expenses imposed by the variable annuity and life insurance contracts for which the Franklin Templeton Variable Insurance Products Trust serves as an underlying investment vehicle.
See notes to financial statements.
FSV-8
Franklin Templeton Variable Insurance Products Trust
Financial Highlights (continued)
Franklin Small Cap Value Securities Fund (continued)
| | | | | | | | | | | | | | | | | | | | |
| | | Year Ended December 31,
| |
| Class 2 | | 2005 | | | 2004 | | | 2003 | | | 2002 | | | 2001 | |
| | |
|
|
|
Per share operating performance | | | | | | | | | | | | | | | | | | | | |
(for a share outstanding throughout the year) | | | | | | | | | | | | | | | | | | | | |
Net asset value, beginning of year | | $ | 15.65 | | | $ | 12.67 | | | $ | 9.61 | | | $ | 10.89 | | | $ | 9.81 | |
| | |
|
|
|
Income from investment operations: | | | | | | | | | | | | | | | | | | | | |
Net investment incomea | | | 0.13 | | | | 0.18 | | | | 0.04 | | | | 0.04 | | | | 0.08 | |
Net realized and unrealized gains (losses) | | | 1.23 | | | | 2.82 | | | | 3.04 | | | | (1.00 | ) | | | 1.28 | |
| | |
|
|
|
Total from investment operations | | | 1.36 | | | | 3.00 | | | | 3.08 | | | | (0.96 | ) | | | 1.36 | |
| | |
|
|
|
Less distributions from: | | | | | | | | | | | | | | | | | | | | |
Net investment income | | | (0.12 | ) | | | (0.02 | ) | | | (0.02 | ) | | | (0.04 | ) | | | (0.04 | ) |
Net realized gains | | | (0.10 | ) | | | — | | | | — | | | | (0.28 | ) | | | (0.24 | ) |
| | |
|
|
|
Total distributions | | | (0.22 | ) | | | (0.02 | ) | | | (0.02 | ) | | | (0.32 | ) | | | (0.28 | ) |
| | |
|
|
|
Net asset value, end of year | | $ | 16.79 | | | $ | 15.65 | | | $ | 12.67 | | | $ | 9.61 | | | $ | 10.89 | |
| | |
|
|
|
| | | | | |
Total returnb | | | 8.77% | | | | 23.75% | | | | 32.12% | | | | (9.26)% | | | | 13.79% | |
Ratios/supplemental data | | | | | | | | | | | | | | | | | | | | |
Net assets, end of year (000’s) | | $ | 1,094,120 | | | $ | 748,762 | | | $ | 333,625 | | | $ | 125,302 | | | $ | 34,282 | |
Ratios to average net assets: | | | | | | | | | | | | | | | | | | | | |
Expenses | | | 0.89% | | | | 0.92% | | | | 0.99% | | | | 1.01% | | | | 1.02% | |
Net investment income | | | 0.80% | | | | 1.34% | | | | 0.38% | | | | 0.38% | | | | 0.81% | |
Portfolio turnover rate | | | 11.03% | | | | 9.50% | | | | 12.52% | | | | 5.11% | | | | 40.54% | |
aBased on average daily shares outstanding.
bTotal return does not include any fees, charges or expenses imposed by the variable annuity and life insurance contracts for which the Franklin Templeton Variable Insurance Products Trust serves as an underlying investment vehicle.
See notes to financial statements.
FSV-9
Franklin Templeton Variable Insurance Products Trust
Statement of Investments, December 31, 2005
| | | | | | | |
| Franklin Small Cap Value Securities Fund | | Country | | Shares | | Value |
Long Term Investments 88.5% | | | | | | | |
Common Stocks 88.4% | | | | | | | |
Commercial Services 0.2% | | | | | | | |
ABM Industries Inc. | | United States | | 120,000 | | $ | 2,346,000 |
| | | | | | |
|
|
Consumer Durables 9.3% | | | | | | | |
Bassett Furniture Industries Inc. | | United States | | 190,000 | | | 3,515,000 |
Briggs & Stratton Corp. | | United States | | 470,000 | | | 18,231,300 |
D.R. Horton Inc. | | United States | | 28,500 | | | 1,018,305 |
Ethan Allen Interiors Inc. | | United States | | 345,000 | | | 12,602,850 |
Hooker Furniture Corp. | | United States | | 383,671 | | | 6,579,958 |
aLa-Z-Boy Inc. | | United States | | 765,000 | | | 10,373,400 |
M/I Homes Inc. | | United States | | 352,700 | | | 14,326,674 |
Monaco Coach Corp. | | United States | | 782,000 | | | 10,400,600 |
Russ Berrie and Co. Inc. | | United States | | 510,200 | | | 5,826,484 |
Thor Industries Inc. | | United States | | 595,900 | | | 23,877,713 |
| | | | | | |
|
|
| | | | | | | | 106,752,284 |
| | | | | | |
|
|
Consumer Non-Durables 3.6% | | | | | | | |
Alliance One International Inc. | | United States | | 145,500 | | | 567,450 |
Brown Shoe Co. Inc. | | United States | | 380,000 | | | 16,123,400 |
Lancaster Colony Corp. | | United States | | 60,000 | | | 2,223,000 |
bNBTY Inc. | | United States | | 620,200 | | | 10,078,250 |
Russell Corp. | | United States | | 367,800 | | | 4,950,588 |
bThe Timberland Co., A | | United States | | 241,500 | | | 7,860,825 |
| | | | | | |
|
|
| | | | | | | | 41,803,513 |
| | | | | | |
|
|
Consumer Services 2.7% | | | | | | | |
bAztar Corp. | | United States | | 385,000 | | | 11,700,150 |
Bob Evans Farms Inc. | | United States | | 62,000 | | | 1,429,720 |
Intrawest Corp. | | Canada | | 285,000 | | | 8,250,750 |
bLa Quinta Corp. | | United States | | 905,000 | | | 10,081,700 |
| | | | | | |
|
|
| | | | | | | | 31,462,320 |
| | | | | | |
|
|
Distribution Services 1.4% | | | | | | | |
Hughes Supply Inc. | | United States | | 435,000 | | | 15,594,750 |
| | | | | | |
|
|
Electronic Technology 2.8% | | | | | | | |
bAvocent Corp. | | United States | | 352,000 | | | 9,570,880 |
Cohu Inc. | | United States | | 510,000 | | | 11,663,700 |
Diebold Inc. | | United States | | 70,000 | | | 2,660,000 |
bOmniVision Technologies Inc. | | United States | | 395,500 | | | 7,894,180 |
| | | | | | |
|
|
| | | | | | | | 31,788,760 |
| | | | | | |
|
|
Energy Minerals 4.6% | | | | | | | |
Arch Coal Inc. | | United States | | 194,000 | | | 15,423,000 |
CONSOL Energy Inc. | | United States | | 214,900 | | | 14,007,182 |
Peabody Energy Corp. | | United States | | 289,000 | | | 23,819,380 |
| | | | | | |
|
|
| | | | | | | | 53,249,562 |
| | | | | | |
|
|
Finance 8.9% | | | | | | | |
American National Insurance Co. | | United States | | 62,100 | | | 7,265,079 |
Arthur J. Gallagher & Co. | | United States | | 255,000 | | | 7,874,400 |
Aspen Insurance Holdings Ltd. | | United States | | 704,000 | | | 16,663,680 |
Chemical Financial Corp. | | United States | | 2,415 | | | 76,700 |
bDollar Thrifty Automotive Group Inc. | | United States | | 210,000 | | | 7,574,700 |
First Indiana Corp. | | United States | | 101,000 | | | 3,472,380 |
Hancock Holding Co. | | United States | | 28,600 | | | 1,081,366 |
Harleysville Group Inc. | | United States | | 19,500 | | | 516,750 |
FSV-10
Franklin Templeton Variable Insurance Products Trust
Statement of Investments, December 31, 2005 (continued)
| | | | | | | |
| Franklin Small Cap Value Securities Fund | | Country | | Shares | | Value |
Long Term Investments (cont.) | | | | | | | |
Common Stocks (cont.) | | | | | | | |
Finance (cont.) | | | | | | | |
IPC Holdings Ltd. | | United States | | 552,100 | | $ | 15,116,498 |
Montpelier Re Holdings Ltd. | | Bermuda | | 687,200 | | | 12,988,080 |
National Financial Partners Corp. | | United States | | 25,700 | | | 1,350,535 |
Peoples Bancorp Inc. | | United States | | 239,200 | | | 6,824,376 |
The PMI Group Inc. | | United States | | 65,000 | | | 2,669,550 |
Presidential Life Corp. | | United States | | 93,900 | | | 1,787,856 |
Protective Life Corp. | | United States | | 78,100 | | | 3,418,437 |
RLI Corp. | | United States | | 170,000 | | | 8,477,900 |
StanCorp Financial Group Inc. | | United States | | 90,000 | | | 4,495,500 |
| | | | | | |
|
|
| | | | | | | | 101,653,787 |
| | | | | | |
|
|
Health Services 1.1% | | | | | | | |
Pharmaceutical Product Development Inc. | | United States | | 204,500 | | | 12,668,775 |
| | | | | | |
|
|
Health Technology 1.9% | | | | | | | |
bAdams Respiratory Therapeutics Inc. | | United States | | 16,400 | | | 666,824 |
STERIS Corp. | | United States | | 544,400 | | | 13,620,888 |
West Pharmaceutical Services Inc. | | United States | | 303,900 | | | 7,606,617 |
| | | | | | |
|
|
| | | | | | | | 21,894,329 |
| | | | | | |
|
|
Industrial Services 4.6% | | | | | | | |
bAtwood Oceanics Inc. | | United States | | 66,000 | | | 5,149,980 |
bEMCOR Group Inc. | | United States | | 100,000 | | | 6,753,000 |
bGlobal Industries Ltd. | | United States | | 458,800 | | | 5,207,380 |
bLone Star Technologies Inc. | | United States | | 259,700 | | | 13,416,102 |
bOffshore Logistics Inc. | | United States | | 146,800 | | | 4,286,560 |
bOil States International Inc. | | United States | | 245,000 | | | 7,761,600 |
Rowan Cos. Inc. | | United States | | 269,100 | | | 9,590,724 |
| | | | | | |
|
|
| | | | | | | | 52,165,346 |
| | | | | | |
|
|
Non-Energy Minerals 3.8% | | | | | | | |
Reliance Steel & Aluminum Co. | | United States | | 310,000 | | | 18,947,200 |
Steel Dynamics Inc. | | United States | | 514,900 | | | 18,284,099 |
United States Steel Corp. | | United States | | 130,000 | | | 6,249,100 |
| | | | | | |
|
|
| | | | | | | | 43,480,399 |
| | | | | | |
|
|
Process Industries 9.2% | | | | | | | |
Airgas Inc. | | United States | | 423,000 | | | 13,916,700 |
AptarGroup Inc. | | United States | | 170,000 | | | 8,874,000 |
Bunge Ltd. | | United States | | 195,000 | | | 11,038,950 |
Cabot Corp. | | United States | | 419,300 | | | 15,010,940 |
Glatfelter | | United States | | 662,000 | | | 9,393,780 |
bMercer International Inc. | | Germany | | 750,000 | | | 5,895,000 |
Mine Safety Appliances Co. | | United States | | 455,400 | | | 16,490,034 |
RPM International Inc. | | United States | | 705,000 | | | 12,245,850 |
Westlake Chemical Corp. | | United States | | 433,400 | | | 12,486,254 |
| | | | | | |
|
|
| | | | | | | | 105,351,508 |
| | | | | | |
|
|
Producer Manufacturing 17.0% | | | | | | | |
A.O. Smith Corp. | | United States | | 145,900 | | | 5,121,090 |
American Woodmark Corp. | | United States | | 379,000 | | | 9,395,410 |
Apogee Enterprises Inc. | | United States | | 510,000 | | | 8,272,200 |
Baldor Electric Co. | | United States | | 700 | | | 17,955 |
Carlisle Cos. Inc. | | United States | | 131,100 | | | 9,065,565 |
CIRCOR International Inc. | | United States | | 320,000 | | | 8,211,200 |
FSV-11
Franklin Templeton Variable Insurance Products Trust
Statement of Investments, December 31, 2005 (continued)
| | | | | | | |
| Franklin Small Cap Value Securities Fund | | Country | | Shares | | Value |
Long Term Investments | | | | | | | |
Common Stocks (cont.) | | | | | | | |
Producer Manufacturing (cont.) | | | | | | | |
CNH Global NV | | Netherlands | | 160,000 | | $ | 2,966,400 |
bThe Genlyte Group Inc. | | United States | | 100,000 | | | 5,357,000 |
Gibraltar Industries Inc. | | United States | | 554,768 | | | 12,726,378 |
Graco Inc. | | United States | | 515,700 | | | 18,812,736 |
JLG Industries Inc. | | United States | | 191,000 | | | 8,721,060 |
Kennametal Inc. | | United States | | 315,000 | | | 16,077,600 |
bMettler-Toledo International Inc. | | Switzerland | | 210,000 | | | 11,592,000 |
Mueller Industries Inc. | | United States | | 595,000 | | | 16,314,900 |
Nordson Corp. | | United States | | 90,900 | | | 3,682,359 |
bPowell Industries Inc. | | United States | | 87,700 | | | 1,575,092 |
Roper Industries Inc. | | United States | | 271,000 | | | 10,707,210 |
Superior Industries International Inc. | | United States | | 390,000 | | | 8,681,400 |
Teleflex Inc. | | United States | | 175,000 | | | 11,371,500 |
The Timken Co. | | United States | | 44,800 | | | 1,434,496 |
Wabash National Corp. | | United States | | 864,000 | | | 16,459,200 |
Watts Water Technologies Inc., A | | United States | | 264,100 | | | 7,999,589 |
| | | | | | |
|
|
| | | | | | | | 194,562,340 |
| | | | | | |
|
|
Real Estate Investment Trusts 0.7% | | | | | | | |
Arbor Realty Trust Inc. | | United States | | 315,200 | | | 8,169,984 |
| | | | | | |
|
|
Retail Trade 9.8% | | | | | | | |
American Eagle Outfitters Inc. | | United States | | 75,000 | | | 1,723,500 |
Casey’s General Stores Inc. | | United States | | 485,000 | | | 12,028,000 |
Christopher & Banks Corp. | | United States | | 585,000 | | | 10,986,300 |
Dillard’s Inc., A | | United States | | 282,000 | | | 6,999,240 |
bThe Gymboree Corp. | | United States | | 655,000 | | | 15,327,000 |
bHot Topic Inc. | | United States | | 829,400 | | | 11,818,950 |
bLinens ‘n Things Inc. | | United States | | 310,000 | | | 8,246,000 |
bThe Men’s Wearhouse Inc. | | United States | | 299,300 | | | 8,811,392 |
Pier 1 Imports Inc. | | United States | | 767,000 | | | 6,695,910 |
Regis Corp. | | United States | | 437,200 | | | 16,862,804 |
bWest Marine Inc. | | United States | | 852,000 | | | 11,910,960 |
bZale Corp. | | United States | | 58,000 | | | 1,458,700 |
| | | | | | |
|
|
| | | | | | | | 112,868,756 |
| | | | | | |
|
|
Technology Services 1.0% | | | | | | | |
The Reynolds and Reynolds Co., A | | United States | | 413,000 | | | 11,592,910 |
| | | | | | |
|
|
Transportation 5.1% | | | | | | | |
bGenesee & Wyoming Inc. | | United States | | 257,100 | | | 9,654,105 |
bKansas City Southern | | United States | | 360,000 | | | 8,794,800 |
OMI Corp. | | United States | | 388,300 | | | 7,047,645 |
Overseas Shipholding Group Inc. | | United States | | 152,000 | | | 7,659,280 |
SkyWest Inc. | | United States | | 440,000 | | | 11,818,400 |
Teekay Shipping Corp. | | Bahamas | | 230,000 | | | 9,177,000 |
Tidewater Inc. | | United States | | 105,000 | | | 4,668,300 |
| | | | | | |
|
|
| | | | | | | | 58,819,530 |
| | | | | | |
|
|
Utilities 0.7% | | | | | | | |
bSierra Pacific Resources | | United States | | 586,500 | | | 7,647,960 |
| | | | | | |
|
|
Total Common Stocks (Cost $797,252,405) | | | | | | | 1,013,872,813 |
| | | | | | |
|
|
FSV-12
Franklin Templeton Variable Insurance Products Trust
Statement of Investments, December 31, 2005 (continued)
| | | | | | | | | |
| Franklin Small Cap Value Securities Fund | | Country | | Principal
Amount | | Value | |
Long Term Investments (cont.) | | | | | | | | | |
Bond (Cost $1,658,010) 0.1% | | | | | | | | | |
Producer Manufacturing 0.1% | | | | | | | | | |
Mueller Industries Inc., 6.00%, 11/01/14 | | United States | | $ | 1,681,000 | | $ | 1,622,165 | |
| | | | | | | |
|
|
|
Total Long Term Investments (Cost $798,910,415) | | | | | | | | 1,015,494,978 | |
| | | | | | | |
|
|
|
| | | |
| | | | | Shares
| | | |
Short Term Investments 12.6% | | | | | | | | | |
Money Fund (Cost $133,129,567) 11.6% | | | | | | | | | |
cFranklin Institutional Fiduciary Trust Money Market Portfolio | | United States | | | 133,129,567 | | | 133,129,567 | |
| | | | | | | |
|
|
|
| | | |
| | | | | Principal
Amount
| | | |
Repurchase Agreements 1.0% | | | | | | | | | |
d,eBanc of America Securities LLC, 4.32%, 1/03/06 (Maturity Value $2,000,960) | | | | | | | | | |
Collateralized by U.S. Government Agency Securities, 5.00 - 5.50%,
9/01/33 - 10/01/35 | | United States | | $ | 2,000,000 | | | 2,000,000 | |
d,eBear, Stearns & Co. Inc., 4.25%, 1/03/06 (Maturity Value $1,808,854) | | | | | | | | | |
Collateralized by U.S. Government Agency Securities, 3.277 - 7.155%, 3/01/17 - 9/01/45 | | United States | | | 1,808,000 | | | 1,808,000 | |
d,eCitigroup Global Markets Inc., 4.26%, 1/03/06 (Maturity Value $2,000,947) | | | | | | | | | |
Collateralized by U.S. Government Agency Securities, 0.875 - 14.00%, 1/15/06 - 8/06/38; fU.S. Government Agency Discount Notes, 1/03/06 - 5/15/30 | | United States | | | 2,000,000 | | | 2,000,000 | |
d,eJP Morgan Securities Corp., 4.31%, 1/03/06 (Maturity Value $1,809,866) | | | | | | | | | |
Collateralized by U.S. Government Agency Securities, 3.614 - 5.625%, 12/01/11 - 9/01/35 | | United States | | | 1,809,000 | | | 1,809,000 | |
d,eMerrill Lynch Government Securities Inc., 4.33%, 1/03/06 (Maturity Value $1,427,687) | | | | | | | | | |
Collateralized by U.S. Government Agency Securities, 1.875 - 8.00%, 2/24/06 - 8/06/38; fU.S. Government Agency Discount Notes, 1/03/06 - 12/11/25 | | United States | | | 1,427,000 | | | 1,427,000 | |
d,eMorgan Stanley & Co. Inc., 4.31%, 1/03/06 (Maturity Value $1,857,889) | | | | | | | | | |
Collateralized by U.S. Government Agency Securities, 5.00%, 6/01/35 - 7/01/35 | | United States | | | 1,857,000 | | | 1,857,000 | |
| | | | | | | |
|
|
|
Total Repurchase Agreements (Cost $10,901,000) | | | | | | | | 10,901,000 | |
| | | | | | | |
|
|
|
Total Investments (Cost $942,940,982) 101.1% | | | | | | | | 1,159,525,545 | |
Other Assets, less Liabilities (1.1)% | | | | | | | | (12,773,936 | ) |
| | | | | | | |
|
|
|
Net Assets 100.0% | | | | | | | $ | 1,146,751,609 | |
| | | | | | | |
|
|
|
aA portion or all of the security is on loan as of December 31, 2005. See Note 1(e).
bNon-income producing.
cSee Note 7 regarding investments in the Franklin Institutional Fiduciary Trust Money Market Portfolio.
dInvestments from cash collateral received for loaned securities. See Note 1(e).
eSee Note 1(c) regarding repurchase agreements.
fA portion or all of the security is traded on a discount basis with no stated coupon rate.
See notes to financial statements.
FSV-13
Franklin Templeton Variable Insurance Products Trust
Financial Statements
Statement of Assets and Liabilities
December 31, 2005
| | | |
| | | Franklin Small Cap Value
Securities Fund
|
Assets: | | | |
Investments in securities: | | | |
Cost - Unaffiliated issuers | | $ | 798,910,415 |
Cost - Sweep Money Fund (Note 7) | | | 133,129,567 |
Cost - Repurchase agreements | | | 10,901,000 |
| | |
|
|
Total cost of investments | | $ | 942,940,982 |
| | |
|
|
Value - Unaffiliated issuersa | | $ | 1,015,494,978 |
Value - Sweep Money Fund (Note 7) | | | 133,129,567 |
Value - Repurchase agreements | | | 10,901,000 |
| | |
|
|
Total value of investments | | | 1,159,525,545 |
Receivables: | | | |
Capital shares sold | | | 985,168 |
Dividends and interest | | | 776,629 |
| | |
|
|
Total assets | | | 1,161,287,342 |
| | |
|
|
Liabilities: | | | |
Payables: | | | |
Investment securities purchased | | | 1,685,072 |
Capital shares redeemed | | | 801,010 |
Affiliates | | | 1,040,689 |
Payable upon return of securities loaned | | | 10,901,000 |
Accrued expenses and other liabilities | | | 107,962 |
| | |
|
|
Total liabilities | | | 14,535,733 |
| | |
|
|
Net assets, at value | | $ | 1,146,751,609 |
| | |
|
|
Net assets consist of: | | | |
Paid-in capital | | $ | 881,125,389 |
Undistributed net investment income | | | 7,712,531 |
Net unrealized appreciation (depreciation) | | | 216,584,563 |
Accumulated net realized gain (loss) | | | 41,329,126 |
| | |
|
|
Net assets, at value | | $ | 1,146,751,609 |
| | |
|
|
Class 1: | | | |
Net assets, at value | | $ | 52,631,725 |
| | |
|
|
Shares outstanding | | | 3,092,733 |
| | |
|
|
Net asset value and offering price per share | | $ | 17.02 |
| | |
|
|
Class 2: | | | |
Net assets, at value | | $ | 1,094,119,884 |
| | |
|
|
Shares outstanding | | | 65,180,763 |
| | |
|
|
Net asset value and offering price per share | | $ | 16.79 |
| | |
|
|
aIncludes $10,373,400 of securities loaned.
See notes to financial statements.
FSV-14
Franklin Templeton Variable Insurance Products Trust
Financial Statements (continued)
Statement of Operations
for the year ended December 31, 2005
| | | | |
| | | Franklin Small Cap Value
Securities Fund
| |
Investment income: | | | | |
Dividends: | | | | |
Unaffiliated issuers | | $ | 12,792,010 | |
Sweep Money Fund (Note 7) | | | 3,604,555 | |
Interest | | | 103,038 | |
Income from securities loaned - net | | | 147,573 | |
Other income (Note 8) | | | 14,683 | |
| | |
|
|
|
Total investment income | | | 16,661,859 | |
| | |
|
|
|
Expenses: | | | | |
Management fees (Note 3a) | | | 4,673,418 | |
Administrative fees (Note 3b) | | | 1,258,848 | |
Distribution fees - Class 2 (Note 3c) | | | 2,329,946 | |
Unaffiliated transfer agent fees | | | 7,639 | |
Custodian fees (Note 4) | | | 17,261 | |
Reports to shareholders | | | 293,972 | |
Professional fees | | | 26,944 | |
Trustees’ fees and expenses | | | 5,033 | |
Other | | | 30,506 | |
| | |
|
|
|
Total expenses | | | 8,643,567 | |
Expense reductions (Note 4) | | | (809 | ) |
| | |
|
|
|
Net expenses | | | 8,642,758 | |
| | |
|
|
|
Net investment income | | | 8,019,101 | |
| | |
|
|
|
Realized and unrealized gains (losses): | | | | |
Net realized gain (loss) from: | | | | |
Investments | | | 41,472,634 | |
Foreign currency transactions | | | (500 | ) |
| | |
|
|
|
Net realized gain (loss) | | | 41,472,134 | |
| | |
|
|
|
Net change in unrealized appreciation (depreciation) on investments | | | 37,321,364 | |
| | |
|
|
|
Net realized and unrealized gain (loss) | | | 78,793,498 | |
| | |
|
|
|
Net increase (decrease) in net assets resulting from operations | | $ | 86,812,599 | |
| | |
|
|
|
See notes to financial statements.
FSV-15
Franklin Templeton Variable Insurance Products Trust
Financial Statements (continued)
Statements of Changes in Net Assets
| | | | | | | | |
| | | Franklin Small Cap Value
Securities Fund
| |
| | | Year Ended December 31,
| |
| | | 2005 | | | 2004 | |
| | |
| |
Increase (decrease) in net assets: | | | | | | | | |
Operations: | | | | | | | | |
Net investment income | | $ | 8,019,101 | | | $ | 7,213,472 | |
Net realized gain (loss) from investments and foreign currency transactions | | | 41,472,134 | | | | 10,187,119 | |
Net change in unrealized appreciation (depreciation) on investments | | | 37,321,364 | | | | 109,967,549 | |
| | |
|
|
|
Net increase (decrease) in net assets resulting from operations | | | 86,812,599 | | | | 127,368,140 | |
Distributions to shareholders from: | | | | | | | | |
Net investment income: | | | | | | | | |
Class 1 | | | (461,501 | ) | | | (113,146 | ) |
Class 2 | | | (7,061,244 | ) | | | (836,847 | ) |
Net realized gains: | | | | | | | | |
Class 1 | | | (318,031 | ) | | | — | |
Class 2 | | | (5,711,813 | ) | | | — | |
| | |
| |
Total distributions to shareholders | | | (13,552,589 | ) | | | (949,993 | ) |
Capital share transactions: (Note 2) | | | | | | | | |
Class 1 | | | (1,471,457 | ) | | | 4,172,805 | |
Class 2 | | | 275,800,371 | | | | 297,839,236 | |
| | |
| |
Total capital share transactions | | | 274,328,914 | | | | 302,012,041 | |
| | |
| |
Net increase (decrease) in net assets | | | 347,588,924 | | | | 428,430,188 | |
Net assets: | | | | | | | | |
Beginning of year | | | 799,162,685 | | | | 370,732,497 | |
| | |
| |
End of year | | $ | 1,146,751,609 | | | $ | 799,162,685 | |
| | |
| |
Undistributed net investment income included in net assets: | | | | | | | | |
End of year | | $ | 7,712,531 | | | $ | 7,216,675 | |
| | |
| |
See notes to financial statements.
FSV-16
Franklin Templeton Variable Insurance Products Trust
Notes to Financial Statements
Franklin Small Cap Value Securities Fund
1. ORGANIZATION AND SIGNIFICANT ACCOUNTING POLICIES
Franklin Templeton Variable Insurance Products Trust (the Trust) is registered under the Investment Company Act of 1940 as an open-end investment company, consisting of twenty-two separate series. The Franklin Small Cap Value Securities Fund (the Fund) included in this report is diversified. The financial statements of the remaining funds in the series are presented separately. Shares of the Fund are sold only to insurance company separate accounts to fund the benefits of variable life insurance policies or variable annuity contracts.
The following summarizes the Fund’s significant accounting policies.
a. Security Valuation
Securities listed on a securities exchange or on the NASDAQ National Market System are valued at the last quoted sale price or the official closing price of the day, respectively. Over-the-counter securities and listed securities for which there is no reported sale are valued within the range of the most recent quoted bid and ask prices. Securities that trade in multiple markets or on multiple exchanges are valued according to the broadest and most representative market. Investments in open-end mutual funds are valued at the closing net asset value.
Corporate debt securities generally trade in the over-the-counter market rather than on a securities exchange. The Trust may utilize independent pricing services, quotations from bond dealers, and information with respect to bond and note transactions, to assist in determining a current market value for each security. The Trust’s pricing services may use valuation models or matrix pricing which considers information with respect to comparable bond and note transactions, quotations from bond dealers, or by reference to other securities that are considered comparable in such characteristics as rating, interest rate and maturity date, option adjusted spread models, prepayment projections, interest rate spreads and yield curves, to determine current value.
Foreign securities are valued as of the close of trading on the foreign stock exchange on which the security is primarily traded, or the NYSE, whichever is earlier. If no sale is reported at that time, the foreign security will be valued within the range of the most recent quoted bid and ask prices. The value is then converted into its U.S. dollar equivalent at the foreign exchange rate in effect at the close of the NYSE on the day that the value of the foreign security is determined.
The Trust has procedures to determine the fair value of individual securities and other assets for which market prices are not readily available or which may not be reliably priced. Methods for valuing these securities may include: fundamental analysis, matrix pricing, discounts from market prices of similar securities, or discounts applied due to the nature and duration of restrictions on the disposition of the securities. Due to the inherent uncertainty of valuations of such securities, the fair values may differ significantly from the values that would have been used had a ready market for such investments existed. Occasionally, events occur between the time at which trading in a security is completed and the close of the NYSE that might call into question the availability (including the reliability) of the value of a portfolio security held by the Fund. If such an event occurs, the securities may be valued using fair value procedures, which may include the use of independent pricing services. All security valuation procedures are approved by the Trust’s Board of Trustees.
b. Foreign Currency Translation
Portfolio securities and other assets and liabilities denominated in foreign currencies are translated into U.S. dollars based on the exchange rate of such currencies against U.S. dollars on the date of valuation. Purchases and sales of securities, income and expense items denominated in foreign currencies are translated into U.S. dollars at the exchange rate in effect on the transaction date. Occasionally, events may impact the availability or reliability of foreign exchange rates used to convert the U.S. dollar equivalent value. If such an event occurs, the foreign exchange rate will be valued at fair value using procedures established and approved by the Trust’s Board of Trustees.
The Fund does not separately report the effect of changes in foreign exchange rates from changes in market prices on securities held. Such changes are included in net realized and unrealized gain or loss from investments on the Statement of Operations.
FSV-17
Franklin Templeton Variable Insurance Products Trust
Notes to Financial Statements (continued)
Franklin Small Cap Value Securities Fund
1. ORGANIZATION AND SIGNIFICANT ACCOUNTING POLICIES (continued)
b. Foreign Currency Translation (cont.)
Realized foreign exchange gains or losses arise from sales of foreign currencies, currency gains or losses realized between the trade and settlement dates on securities transactions and the difference between the recorded amounts of dividends, interest, and foreign withholding taxes and the U.S. dollar equivalent of the amounts actually received or paid. Net unrealized foreign exchange gains and losses arise from changes in foreign exchange rates on foreign denominated assets and liabilities other than investments in securities held at the end of the reporting period.
c. Repurchase Agreements
The Fund may enter into repurchase agreements, which are accounted for as a loan by the Fund to the seller, collateralized by securities which are delivered to the Fund’s custodian. The market value, including accrued interest, of the initial collateralization is required to be at least 102% of the dollar amount invested by the Fund, with the value of the underlying securities marked to market daily to maintain coverage of at least 100%. Repurchase agreements are valued at cost. At December 31, 2005, all repurchase agreements held by the Fund had been entered into on December 30, 2005.
d. Foreign Currency Contracts
When the Fund purchases or sells foreign securities it may enter into foreign exchange contracts to minimize foreign exchange risk from the trade date to the settlement date of the transactions. A foreign exchange contract is an agreement between two parties to exchange different currencies at an agreed upon exchange rate on a specified date. Realized and unrealized gains and losses on these contracts are included in the Statement of Operations.
The risks of these contracts include movement in the values of the foreign currencies relative to the U.S. dollar and the possible inability of the counterparties to fulfill their obligations under the contracts, which may be in excess of the amount reflected in the Statement of Assets and Liabilities.
e. Securities Lending
The Fund loans securities to certain brokers through a securities lending agent for which it received cash collateral against the loaned securities in an amount initially equal to at least 102% of the market value of the loaned securities. The collateral is invested in short term instruments as noted in the Statement of Investments. The Fund receives interest income from the investment of cash collateral, adjusted by lender fees and broker rebates. The Fund bears the risk of loss with respect to the investment of the collateral and the securities loaned. The securities lending agent has agreed to indemnify the Fund in the case of default of any securities borrower.
f. Income Taxes
No provision has been made for U.S. income taxes because the Fund’s policy is to continue to qualify as a regulated investment company under the Internal Revenue Code and to distribute to shareholders substantially all of its taxable income and net realized gains.
g. Security Transactions, Investment Income, Expenses and Distributions
Security transactions are accounted for on trade date. Realized gains and losses on security transactions are determined on a specific identification basis. Interest income and estimated expenses are accrued daily. Dividend income is recorded on the ex-dividend date. Distributions to shareholders are recorded on the ex-dividend date and are determined according to income
FSV-18
Franklin Templeton Variable Insurance Products Trust
Notes to Financial Statements (continued)
Franklin Small Cap Value Securities Fund
1. ORGANIZATION AND SIGNIFICANT ACCOUNTING POLICIES (continued)
g. Security Transactions, Investment Income, Expenses and Distributions (continued)
tax regulations (tax basis). Such distributions are reinvested in additional shares of the Fund. Distributable earnings determined on a tax basis may differ from earnings recorded in accordance with generally accepted accounting principles. These differences may be permanent or temporary. Permanent differences are reclassified among capital accounts to reflect their tax character. These reclassifications have no impact on net assets or the results of operations. Temporary differences are not reclassified, as they may reverse in subsequent periods.
Common expenses incurred by the Trust are allocated among the funds based on the ratio of net assets of each fund to the combined net assets of the Trust. Fund specific expenses are charged directly to the fund that incurred the expense.
Realized and unrealized gains and losses and net investment income, other than class specific expenses, are allocated daily to each class of shares based upon the relative proportion of net assets of each class.
h. Accounting Estimates
The preparation of financial statements in accordance with accounting principles generally accepted in the United States of America requires management to make estimates and assumptions that affect the reported amounts of assets and liabilities at the date of the financial statements and the amounts of income and expenses during the reporting period. Actual results could differ from those estimates.
i. Guarantees and Indemnifications
Under the Trust’s organizational documents, its officers and trustees are indemnified by the Trust against certain liabilities arising out of the performance of their duties to the Trust. Additionally, in the normal course of business, the Trust enters into contracts with service providers that contain general indemnification clauses. The Trust’s maximum exposure under these arrangements is unknown as this would involve future claims that may be made against the Trust that have not yet occurred. However, based on experience, the Trust expects the risk of loss to be remote.
2. SHARES OF BENEFICIAL INTEREST
The Fund offers two classes of shares: Class 1 and Class 2. Each class of shares differs by its distribution fees, voting rights on matters affecting a single class and its exchange privilege.
At December 31, 2005, there were an unlimited number of shares authorized ($0.01 par value). Transactions in the Fund’s shares were as follows:
| | | | | | | | | | | | | | |
| | | Year Ended December 31,
| |
| | | 2005
| | | 2004
| |
| Class 1 Shares: | | Shares
| | | Amount
| | | Shares
| | | Amount
| |
Shares sold | | 647,095 | | | $ | 10,409,131 | | | 846,922 | | | $ | 11,790,300 | |
Shares issued in reinvestment of distributions | | 48,418 | | | | 779,532 | | | 8,375 | | | | 113,146 | |
Shares redeemed | | (782,888 | ) | | | (12,660,120 | ) | | (571,134 | ) | | | (7,730,641 | ) |
| | |
| |
Net increase (decrease) | | (87,375 | ) | | $ | (1,471,457 | ) | | 284,163 | | | $ | 4,172,805 | |
| | |
| |
| Class 2 Shares: | | | | | | | | | | | | |
Shares sold | | 21,663,485 | | | $ | 344,423,642 | | | 25,921,172 | | | $ | 357,649,617 | |
Shares issued in reinvestment of distributions | | 803,337 | | | | 12,773,057 | | | 62,638 | | | | 836,847 | |
Shares redeemed | | (5,117,455 | ) | | | (81,396,328 | ) | | (4,475,396 | ) | | | (60,647,228 | ) |
| | |
| |
Net increase (decrease) | | 17,349,367 | | | $ | 275,800,371 | | | 21,508,414 | | | $ | 297,839,236 | |
| | |
| |
FSV-19
Franklin Templeton Variable Insurance Products Trust
Notes to Financial Statements (continued)
Franklin Small Cap Value Securities Fund
3. TRANSACTIONS WITH AFFILIATES
Franklin Resources, Inc. is the holding company for various subsidiaries that together are referred to as Franklin Templeton Investments. Certain officers and trustees of the Trust are also officers and/or directors of the following subsidiaries:
| | |
| Subsidiary | | Affiliation |
Franklin Advisory Services, LLC (Advisory Services) | | Investment manager |
Franklin Templeton Services, LLC (FT Services) | | Administrative manager |
Franklin Templeton Distributors, Inc. (Distributors) | | Principal underwriter |
Franklin Templeton Investor Services, LLC (Investor Services) | | Transfer agent |
a. Management Fees
The Fund pays an investment management fee to Advisory Services based on the average daily net assets of the Fund as follows:
| | |
| Annualized Fee Rate | | Net Assets |
| 0.600% | | Up to and including $200 million |
| 0.500% | | Over $200 million, up to and including $1.3 billion |
| 0.400% | | In excess of $1.3 billion |
b. Administrative Fees
The Fund pays an administrative fee to FT Services based on the average daily net assets of the Fund as follows:
| | |
| Annualized Fee Rate | | Net Assets |
| 0.150% | | Up to and including $200 million |
| 0.135% | | Over $200 million, up to and including $700 million |
| 0.100% | | Over $700 million, up to and including $1.2 billion |
| 0.075% | | In excess of $1.2 billion |
c. Distribution Fees
The Fund’s Board of Trustees has adopted distribution plans for Class 2 shares pursuant to Rule 12b-1 under the 1940 Act. Under the Fund’s compensation distribution plans, the Fund pays Distributors for costs incurred in connection with the sale and distribution of the Fund’s shares up to 0.35% per year of its average daily net assets. The Board of Trustees has set the current rate at 0.25% per year.
d. Transfer Agent Fees
Investor Services, under terms of an agreement, performs shareholder servicing for the Fund and is not paid by the Fund for the services.
4. EXPENSE OFFSET ARRANGEMENT
The Fund has entered into an arrangement with its custodian whereby credits realized as a result of uninvested cash balances are used to reduce a portion of the Fund’s custodian expenses. During the year ended December 31, 2005, the custodian fees were reduced as noted in the Statement of Operations.
FSV-20
Franklin Templeton Variable Insurance Products Trust
Notes to Financial Statements (continued)
Franklin Small Cap Value Securities Fund
5. INCOME TAXES
The tax character of distributions paid during the years ended December 31, 2005 and 2004, was as follows:
| | | | | | |
| | | 2005
| | 2004
|
Distributions paid from: | | | | | | |
Ordinary income | | $ | 7,522,745 | | $ | 949,993 |
Long term capital gain | | | 6,029,844 | | | — |
| | |
|
| | | $ | 13,552,589 | | $ | 949,993 |
| | |
|
At December 31, 2005, the cost of investments, net unrealized appreciation (depreciation), undistributed ordinary income and undistributed long term capital gains for income tax purposes were as follows:
| | | | |
Cost of investments | | $ | 942,973,335 | |
| | |
|
|
|
| |
Unrealized appreciation | | $ | 274,553,718 | |
Unrealized depreciation | | | (58,001,508 | ) |
| | |
|
|
|
Net unrealized appreciation (depreciation) | | $ | 216,552,210 | |
| | |
|
|
|
| |
Undistributed ordinary income | | $ | 19,670,776 | |
Undistributed long term capital gains | | | 29,403,233 | |
| | |
|
|
|
Distributable earnings | | $ | 49,074,009 | |
| | |
|
|
|
Net investment income differs for financial statements and tax purposes primarily due to differing treatments of foreign currency transactions and bond discounts.
Net realized gains (losses) differ for financial statements and tax purposes primarily due to differing treatments of wash sales, foreign currency transactions and bond discounts.
6. INVESTMENT TRANSACTIONS
Purchases and sales of investments (excluding short term securities) for the year ended December 31, 2005, aggregated $369,994,996 and $94,945,776, respectively.
7. INVESTMENTS IN FRANKLIN INSTITUTIONAL FIDUCIARY TRUST MONEY MARKET PORTFOLIO
The Fund may invest in the Franklin Institutional Fiduciary Trust Money Market Portfolio (the Sweep Money Fund), an open-end investment company managed by Franklin Advisers, Inc. (an affiliate of the investment manager). Management fees paid by the Fund are reduced on assets invested in the Sweep Money Fund, in an amount not to exceed the management and administrative fees paid by the Sweep Money Fund.
8. REGULATORY MATTERS
As part of various investigations by a number of federal, state, and foreign regulators and governmental entities, relating to certain practices in the mutual fund industry, including late trading, market timing and marketing support payments to securities dealers who sell fund shares, Franklin Resources, Inc. and certain of its subsidiaries (collectively, the “Company”), entered into settlements with certain of those regulators.
FSV-21
Franklin Templeton Variable Insurance Products Trust
Notes to Financial Statements (continued)
Franklin Small Cap Value Securities Fund
8. REGULATORY MATTERS (continued)
Specifically, the Company entered into settlements with the Securities and Exchange Commission (“SEC”) concerning market timing (the “August 2, 2004 SEC Order”) and marketing support payments to securities dealers who sell fund shares (the “December 13, 2004 SEC Order”) and with the California Attorney General’s Office (“CAGO”) concerning marketing support payments to securities dealers who sell fund shares (the “CAGO Settlement”). Under the terms of the settlements with the SEC and the CAGO, the Company retained an Independent Distribution Consultant (“IDC”) to develop a plan for distribution of the respective settlement monies. The CAGO approved the distribution plan under the CAGO Settlement and, in accordance with the terms and conditions of that settlement, the monies were disbursed to the relevant funds and are recorded as other income in the current period. The SEC has not yet approved the distribution plan pertaining to the December 13, 2004 SEC Order. When approved, disbursements of settlement monies will be made promptly to the relevant funds, in accordance with the terms and conditions of that order. The IDC continues to develop the plan of distribution under the August 2, 2004 SEC Order that resolved the SEC’s market timing investigation.
In addition, the Company, as well as most of the mutual funds within Franklin Templeton Investments and certain current or former officers, directors, and/or employees, have been named in private lawsuits (styled as shareholder class actions, or as derivative actions on behalf of either the named funds or Franklin Resources, Inc.) relating to the industry practices referenced above, as well as to allegedly excessive advisory fees, commissions, and/or 12b-1 fees. The lawsuits were filed in different courts throughout the country. Many of those suits are now pending in a multi-district litigation in the United States District Court for the District of Maryland.
The Company and fund management strongly believe that the claims made in each of the private lawsuits referenced above are without merit and intend to defend against them vigorously. The Company cannot predict with certainty the eventual outcome of these lawsuits, nor whether they will have a material negative impact on the Company. If it is determined that the Company bears responsibility for any unlawful or inappropriate conduct that caused losses to the Trust, it is committed to making the Trust or their shareholders whole, as appropriate.
FSV-22
Franklin Templeton Variable Insurance Products Trust
Franklin Small Cap Value Securities Fund
Report of Independent Registered Public Accounting Firm
To the Board of Trustees and Shareholders of
Franklin Templeton Variable Insurance Products Trust
In our opinion, the accompanying statement of assets and liabilities, including the statement of investments, and the related statements of operations and of changes in net assets and the financial highlights present fairly, in all material respects, the financial position of Franklin Small Cap Value Securities Fund (one of the funds constituting Franklin Templeton Variable Insurance Products Trust, hereafter referred to as the “Fund”) at December 31, 2005, the results of its operations for the year then ended, the changes in its net assets for each of the two years in the period then ended and the financial highlights for each of the five years in the period then ended, in conformity with accounting principles generally accepted in the United States of America. These financial statements and financial highlights (hereafter referred to as “financial statements”) are the responsibility of the Fund’s management; our responsibility is to express an opinion on these financial statements based on our audits. We conducted our audits of these financial statements in accordance with the standards of the Public Company Accounting Oversight Board (United States). Those standards require that we plan and perform the audit to obtain reasonable assurance about whether the financial statements are free of material misstatement. An audit includes examining, on a test basis, evidence supporting the amounts and disclosures in the financial statements, assessing the accounting principles used and significant estimates made by management, and evaluating the overall financial statement presentation. We believe that our audits, which included confirmation of securities at December 31, 2005, by correspondence with the custodian and brokers, provide a reasonable basis for our opinion.
PricewaterhouseCoopers LLP
San Francisco, California
February 10, 2006
FSV-23
Franklin Templeton Variable Insurance Products Trust
Tax Designation (unaudited)
Franklin Small Cap Value Securities Fund
Under Section 852(b)(3)(C) of the Internal Revenue Code (Code), the Fund designates the maximum amount allowable but no less than $29,405,660 as a capital gain dividend for the fiscal year ended December 31, 2005.
Under Section 854(b)(2) of the Code, the Fund designates 100.00% of the ordinary income dividends as income qualifying for the dividends received deduction for the fiscal year ended December 31, 2005.
FSV-24
FRANKLIN SMALL-MID CAP GROWTH SECURITIES FUND
This annual report for Franklin Small-Mid Cap Growth Securities Fund covers the fiscal year ended December 31, 2005.
Performance Summary as of 12/31/05
Average annual total return of Class 1 shares represents the average annual change in value, assuming reinvestment of dividends and capital gains. Average returns smooth out variations in returns, which can be significant; they are not the same as year-by-year results.
Periods ended 12/31/05
| | | | | | |
| | | 1-Year | | 5-Year | | 10-Year |
Average Annual Total Return | | +5.09% | | -0.38% | | +9.49% |
Total Return Index Comparison
for Hypothetical $10,000 Investment (1/1/96–12/31/05)
The graph below shows the change in value of a hypothetical $10,000 investment in the Fund over the indicated period and includes reinvestment of any income or distributions. The Fund’s performance is compared to the performance of the Standard & Poor’s 500 Index (S&P 500), the Russell Midcap® Growth Index and the Russell 2500™ Growth Index. The Russell Midcap Growth Index is replacing the Russell 2500 Growth Index as the Fund’s benchmark because the Fund’s manager believes the Russell Midcap Growth Index better reflects the Fund’s investments. One cannot invest directly in an index, nor is an index representative of the Fund’s portfolio. Please see Important Notes to Performance Information preceding the Fund Summaries.

*Source: Standard & Poor’s Micropal. Please see Index Descriptions following the Fund Summaries.
Franklin Small-Mid Cap Growth Securities Fund Class 1
Performance reflects the Fund’s Class 1 operating expenses, but does not include any contract fees, expenses or sales charges. If they had been included, performance would be lower. These charges and deductions, particularly for variable life policies, can have a significant effect on contract values and insurance benefits. See the contract prospectus for a complete description of these expenses, including sales charges.
Performance data represent past performance, which does not guarantee future results. Investment return and principal value will fluctuate, and you may have a gain or loss when you sell your shares.
Current performance may differ from figures shown.
FSC-1
Fund Goal and Main Investments: Franklin Small-Mid Cap Growth Securities Fund (formerly Franklin Small Cap Fund) seeks long-term capital growth. The Fund normally invests at least 80% of its net assets in investments of small capitalization (small cap) and mid capitalization (mid cap) companies. Small cap companies are those with market capitalization values not exceeding $1.5 billion or the highest market capitalization value in the Russell 2000® Index, whichever is greater, at the time of purchase; and mid cap companies are companies with market capitalization values not exceeding $8.5 billion at the time of purchase.1
Performance Overview
You can find the Fund’s one-year total return in the Performance Summary. The Fund’s return was comparable to the +4.91% return of the S&P 500, the Fund’s broad benchmark. The Fund underperformed its narrow benchmarks, the Russell Midcap Growth Index and the Russell 2500 Growth Index, which returned +12.10% and +8.17% for the same period.2 The Russell Midcap Growth Index is replacing the Russell 2500 Growth Index as the Fund’s narrow benchmark. The manager believes that the composition of the Russell Midcap Growth Index better reflects the Fund’s investments.
Economic and Market Overview
During the 12 months ended December 31, 2005, U.S. economic expansion was driven by strength across most industries, sectors and regions. Gross domestic product (GDP) rose during the period, benefiting from increased personal consumption, federal spending and business investment, which increased 24% in third quarter 2005 compared with the same quarter in 2004.3 Slower export growth combined with greater demand for imported goods and materials fueled a widening trade gap. The U.S. dollar rallied in 2005, supported by rising short-term domestic interest rates and strong economic growth in the U.S. relative to many of its major trading partners.
Many businesses enjoyed record profits, propelled largely by productivity gains. Earnings for companies in the S&P 500 were estimated to have
1. Please see Index Descriptions following the Fund Summaries.
2. Source: Standard & Poor’s Micropal. One cannot invest directly in an index, nor is an index representative of the Fund’s portfolio. Please see Index Descriptions following the Fund Summaries.
3. Source: Thomson Financial. Based on companies in the S&P 500.
Fund Risks: The Fund’s investments in stocks offer the potential for long-term gains but can be subject to short-term up-and-down price movements. Smaller and mid-size company securities can increase the risk of greater price fluctuation, particularly over the short term. By having significant investments in particular sectors from time to time, the Fund may experience more volatility than a fund with a more broadly diversified portfolio. The Fund’s significant exposure to the technology sector, which can be highly volatile, may result in the Fund experiencing greater volatility than a fund with a more broadly diversified portfolio. The Fund’s prospectus also includes a description of the main investment risks.
FSC-2
increased 13% in 2005.4 The labor market firmed as employment increased and the unemployment rate dropped from 5.0% to 4.9% during the reporting period. Personal income rose, and hiring rebounded in many industries, bolstered by healthy business spending.
Oil prices remained high during the period largely due to potential long-term supply limitations and strong growth in global demand, especially from China and India. Natural gas prices rose during the second half of 2005 mainly because of expected rising demand with the onset of winter; however, near period-end prices retreated somewhat amid milder-than-expected weather conditions. Even with high commodity prices, inflation remained relatively contained for the 12 months ended December 31, 2005, as measured by the 2.2% rise for the core Consumer Price Index (CPI).5
Despite this inflation picture, the Federal Reserve Board raised the federal funds target rate from 2.25% to 4.25%. Compared with the rise in short-term interest rates, long-term rates remained relatively stable, supporting overall robust housing and commercial real estate activity, which contributed to economic growth. Throughout 2005, as short- and intermediate-term interest rates rose, the yield curve moved from a fairly normal steepness at the beginning of the period to relatively flat by the end of 2005.
In this environment, the blue chip stocks of the Dow Jones Industrial Average posted a one-year total return of +1.72%, while the broader S&P 500 and the technology-heavy NASDAQ Composite Index returned +4.91% and +2.12%.6
Investment Strategy
We are research driven, fundamental investors, pursuing a growth strategy. As bottom-up investors focusing primarily on individual securities, we choose companies that have identifiable drivers of future earnings growth and that present, in our opinion, the best trade-off between that
4. Source: Standard & Poor’s.
5. Source: Bureau of Labor Statistics. Core CPI excludes food and energy costs.
6. Source: Standard & Poor’s Micropal. Please see Index Descriptions following the Fund Summaries.
What is the yield curve?
The yield curve is a graph illustrating the yields on bonds of the same credit quality with maturities ranging from the shortest to the longest available. The resulting curve shows if short-term interest rates are higher or lower than longer-term rates.
FSC-3
earnings growth, business and financial risk, and valuation. We rely on a team of analysts to provide in-depth industry expertise, and we use qualitative and quantitative analyses to evaluate companies for distinct and sustainable competitive advantages. Advantages, such as a particular marketing or product niche, proven technology and industry leadership, are all factors we believe may contribute to strong long-term growth potential.
Manager’s Discussion
During the year under review, positive contributions to Fund performance came from the producer manufacturing, transportation and energy minerals sectors. On the other hand, underperformance in our health technology, process industries and retail trade investments disappointed.
Our stock selection in the producer manufacturing sector contributed favorably to the Fund’s performance relative to the benchmark Russell Midcap Growth Index. One company that fared particularly well was Flowserve, which manufactures industrial pumps, valves and mechanical seals. Flowserve’s business benefited principally from increased spending in the energy sector. The company continued to distinguish itself by adding technology from internal development efforts, which we feel gives Flowserve advantages in what we see as otherwise a commodity business.
While specialty truck manufacturing is not typically considered an area of growth, recent innovations combined with decades of underinvestment and extremely strong end-market demand enabled certain manufacturers to enjoy impressive growth in unfilled orders during 2005. Oshkosh Truck, which manufactures fire and emergency apparatus as well as specialty commercial and military trucks, thrived within this strong fundamental backdrop and was a positive contributor to the Fund’s total returns.
Oil prices rose during the year, briefly piercing the $70 per barrel level in the summer, and while consumers felt the pinch, energy companies enjoyed record earnings. Consequently, our stock selection among energy minerals companies benefited the Fund’s results, driven primarily by security selection in the oil and gas industry. For example, Spinnaker Exploration (sold by period-end) was the top contributor on an individual security basis, and Chesapeake Energy was also a major contributor to our relative performance.
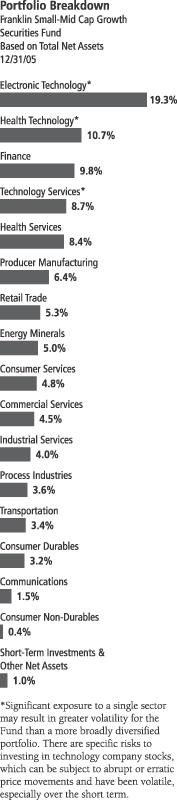
FSC-4
Another sector in which we found opportunities over the past year was transportation. Our investment in freight transport and logistics provider C.H. Robinson Worldwide was a leading contributor from this sector, as was JetBlue Airways, both of which experienced rapid revenue growth during 2005.
There were some factors that dampened Fund returns and hindered our performance versus the Russell Midcap Growth Index during the year. For example, our investments in the health technology sector detracted from relative performance. Our pharmaceutical and biotechnology industry holdings were particularly disappointing, including Impax Laboratories (sold by period-end), Pharmion (also sold), Angiotech Pharmaceuticals and The Medicines Company. In addition, the Fund did not have exposure to some of the sector’s better performing stocks during the period.
Within the process industries sector, our investments in chemical companies Cabot and NOVA Chemicals and the industrial specialty company GrafTech International were significant detractors. These companies faced challenges due to rising raw materials prices during the year. We sold our NOVA and GrafTech shares by period-end.
Finally, certain investments in the retail trade sector dampened relative returns. While we were underweighted relative to the benchmark in the specialty stores industry, investments in certain poor performing stocks, including retailers Tuesday Morning and Cost Plus, negatively affected relative performance. We sold our position in Cost Plus during the period. Our selections in the apparel and footwear retail industry also underperformed the benchmark.
Thank you for your participation in Franklin Small-Mid Cap Growth Securities Fund. We look forward to serving your future investment needs.
The foregoing information reflects our analysis, opinions and portfolio holdings as of December 31, 2005, the end of the reporting period. The way we implement our main investment strategies and the resulting portfolio holdings may change depending on factors such as market and economic conditions. These opinions may not be relied upon as investment advice or an offer for a particular security. The information is not a complete analysis of every aspect of any market, country, industry, security or the Fund. Statements of fact are from sources considered reliable, but the adviser makes no representation or warranty as to their completeness or accuracy. Although historical performance is no guarantee of future results, these insights may help you understand our investment management philosophy.
Top 10 Holdings
Franklin Small-Mid Cap Growth Securities Fund 12/31/05
| | |
Company Sector/Industry | | % of Total
Net Assets |
| |
| Chesapeake Energy Corp. | | 2.2% |
| Energy Minerals | | |
| |
| Cognizant Technology Solutions Corp., A | | 1.6% |
| Technology Services | | |
| |
| Tektronix Inc. | | 1.5% |
| Electronic Technology | | |
| |
| Flowserve Corp. | | 1.5% |
| Producer Manufacturing | | |
| |
| Intersil Corp., A | | 1.5% |
| Electronic Technology | | |
| |
| Bunge Ltd. | | 1.5% |
| Process Industries | | |
| |
| Dollar General Corp. | | 1.5% |
| Retail Trade | | |
| |
| NII Holdings Inc. | | 1.5% |
| Communications | | |
| |
| Federated Investors Inc., B | | 1.5% |
| Finance | | |
| |
| Trimble Navigation Ltd. | | 1.4% |
| Electronic Technology | | |
The dollar value, number of shares or principal amount, and names of all portfolio holdings are listed in the Fund’s Statement of Investments.
FSC-5
Fund Expenses
As an investor in a variable insurance contract (“Contract”) that indirectly provides for investment in an underlying mutual fund, you can incur transaction and/or ongoing expenses at both the Fund level and the Contract level.
| • | | Transaction expenses can include sales charges (loads) on purchases, redemption fees, surrender fees, transfer fees and premium taxes. |
| • | | Ongoing expenses can include management fees, distribution and service (12b-1) fees, contract fees, annual maintenance fees, mortality and expense risk fees and other fees and expenses. All mutual funds and Contracts have some types of ongoing expenses. |
The expenses shown in the table below are meant to highlight ongoing expenses at the Fund level only and do not include ongoing expenses at the Contract level, or transaction expenses at either the Fund or Contract level. While the Fund does not have transaction expenses, if the transaction and ongoing expenses at the Contract level were included, the expenses shown below would be higher. You should consult your Contract prospectus or disclosure document for more information.
The table shows Fund-level ongoing expenses and can help you understand these expenses and compare them with those of other mutual funds offered through the Contract. The table assumes a $1,000 investment held for the six months indicated. Please refer to the Fund prospectus for additional information on operating expenses.
Actual Fund Expenses
The first line (Actual) of the table below provides actual account values and expenses. The “Ending Account Value” is derived from the Fund’s actual return, which includes the effect of ongoing Fund expenses, but does not include the effect of ongoing Contract expenses.
You can estimate the Fund-level expenses you incurred during the period by following these steps. Of course, your account value and expenses will differ from those in this illustration:
| 1. | Divide your account value by $1,000. |
If an account had an $8,600 value, then $8,600 ÷ $1,000 = 8.6.
| 2. | Multiply the result by the number under the heading “Fund-Level Expenses Incurred During Period.” |
If Fund-Level Expenses Incurred During Period were $7.50, then 8.6 × $7.50 = $64.50.
Franklin Small Mid-Cap Growth Securities Fund Class 1
FSC-6
In this illustration, the estimated expenses incurred this period at the Fund level are $64.50.
Hypothetical Example for Comparison with Other Mutual Funds
Information in the second line (Hypothetical) of the table can help you compare ongoing expenses of the Fund with those of other mutual funds offered through the Contract. This information may not be used to estimate the actual ending account balance or expenses you incurred during the period. The hypothetical “Ending Account Value” is based on the Fund’s actual expense ratio and an assumed 5% annual rate of return before expenses, which does not represent the Fund’s actual return. The figure under the heading “Fund-Level Expenses Incurred During Period” shows the hypothetical expenses your account would have incurred under this scenario. You can compare this figure with the 5% hypothetical examples that appear in shareholder reports of other funds offered through a Contract.
| | | | | | | | | |
| Class 1 | | Beginning
Account
Value 7/1/05 | | Ending
Account
Value 12/31/05 | | Fund-Level
Expenses Incurred
During Period*
7/1/05-12/31/05 |
Actual | | $ | 1,000 | | $ | 1,082.80 | | $ | 3.94 |
Hypothetical (5% return before expenses) | | $ | 1,000 | | $ | 1,021.42 | | $ | 3.82 |
*Expenses are equal to the annualized expense ratio for the Fund’s Class 1 shares (0.75%), which does not include any ongoing expenses of the Contract for which the Fund is an investment option, multiplied by the average account value over the period, multiplied by 184/365 to reflect the one-half year period.
FSC-7
Franklin Templeton Variable Insurance Products Trust
Financial Highlights
Franklin Small-Mid Cap Growth Securities Fund
| | | | | | | | | | | | | | | | | | | | |
| | | Year Ended December 31,
| |
| Class 1 | | 2005 | | | 2004 | | | 2003 | | | 2002 | | | 2001 | |
| | |
|
|
|
Per share operating performance | | | | | | | | | | | | | | | | | | | | |
(for a share outstanding throughout the year) | | | | | | | | | | | | | | | | | | | | |
Net asset value, beginning of year | | $ | 19.66 | | | $ | 17.60 | | | $ | 12.79 | | | $ | 17.97 | | | $ | 21.25 | |
| | |
|
|
|
Income from investment operations: | | | | | | | | | | | | | | | | | | | | |
Net investment income (loss)a | | | (0.02 | ) | | | (0.06 | ) | | | (0.03 | ) | | | (0.02 | ) | | | 0.09 | |
Net realized and unrealized gains (losses) | | | 1.02 | | | | 2.12 | | | | 4.84 | | | | (5.09 | ) | | | (3.28 | ) |
| | |
|
|
|
Total from investment operations | | | 1.00 | | | | 2.06 | | | | 4.81 | | | | (5.11 | ) | | | (3.19 | ) |
| | |
|
|
|
Less distributions from net investment income | | | — | | | | — | | | | — | | | | (0.07 | ) | | | (0.09 | ) |
| | |
|
|
|
Net asset value, end of year | | $ | 20.66 | | | $ | 19.66 | | | $ | 17.60 | | | $ | 12.79 | | | $ | 17.97 | |
| | |
|
|
|
| | | | | |
Total returnb | | | 5.09% | | | | 11.70% | | | | 37.61% | | | | (28.52)% | | | | (15.02)% | |
Ratios/supplemental data | | | | | | | | | | | | | | | | | | | | |
Net assets, end of year (000’s) | | $ | 157,085 | | | $ | 184,513 | | | $ | 197,551 | | | $ | 164,350 | | | $ | 266,694 | |
Ratios to average net assets: | | | | | | | | | | | | | | | | | | | | |
Expenses | | | 0.74% | | | | 0.74% | | | | 0.76% | | | | 0.79% | | | | 0.76% | |
Net investment income (loss) | | | (0.09)% | | | | (0.33)% | | | | (0.24)% | | | | (0.16)% | | | | 0.50% | |
Portfolio turnover rate | | | 74.39% | | | | 32.55% | | | | 45.00% | | | | 29.59% | | | | 37.94% | |
aBased on average daily shares outstanding.
bTotal return does not include any fees, charges or expenses imposed by the variable annuity and life insurance contracts for which the Franklin Templeton Variable Insurance Products Trust serves as an underlying investment vehicle.
See notes to financial statements.
FSC-8
Franklin Templeton Variable Insurance Products Trust
Financial Highlights (continued)
Franklin Small-Mid Cap Growth Securities Fund (continued)
| | | | | | | | | | | | | | | | | | | | |
| | | Year Ended December 31,
| |
| Class 2 | | 2005 | | | 2004 | | | 2003 | | | 2002 | | | 2001 | |
| | |
|
|
|
Per share operating performance | | | | | | | | | | | | | | | | | | | | |
(for a share outstanding throughout the year) | | | | | | | | | | | | | | | | | | | | |
Net asset value, beginning of year | | $ | 19.43 | | | $ | 17.43 | | | $ | 12.70 | | | $ | 17.85 | | | $ | 21.14 | |
| | |
|
|
|
Income from investment operations: | | | | | | | | | | | | | | | | | | | | |
Net investment income (loss)a | | | (0.07 | ) | | | (0.10 | ) | | | (0.07 | ) | | | (0.06 | ) | | | 0.03 | |
Net realized and unrealized gains (losses) | | | 1.00 | | | | 2.10 | | | | 4.80 | | | | (5.05 | ) | | | (3.25 | ) |
| | |
|
|
|
Total from investment operations | | | 0.93 | | | | 2.00 | | | | 4.73 | | | | (5.11 | ) | | | (3.22 | ) |
| | |
|
|
|
Less distributions from net investment income | | | — | | | | — | | | | — | | | | (0.04 | ) | | | (0.07 | ) |
| | |
|
|
|
Net asset value, end of year | | $ | 20.36 | | | $ | 19.43 | | | $ | 17.43 | | | $ | 12.70 | | | $ | 17.85 | |
| | |
|
|
|
| | | | | |
Total returnb | | | 4.79% | | | | 11.47% | | | | 37.24% | | | | (28.68)% | | | | (15.25)% | |
Ratios/supplemental data | | | | | | | | | | | | | | | | | | | | |
Net assets, end of year (000’s) | | $ | 1,166,806 | | | $ | 1,142,048 | | | $ | 909,946 | | | $ | 415,952 | | | $ | 401,663 | |
Ratios to average net assets: | | | | | | | | | | | | | | | | | | | | |
Expenses | | | 0.99% | | | | 0.99% | | | | 1.01% | | | | 1.04% | | | | 1.01% | |
Net investment income (loss) | | | (0.34)% | | | | (0.58)% | | | | (0.49)% | | | | (0.41)% | | | | 0.19% | |
Portfolio turnover rate | | | 74.39% | | | | 32.55% | | | | 45.00% | | | | 29.59% | | | | 37.94% | |
aBased on average daily shares outstanding.
bTotal return does not include any fees, charges or expenses imposed by the variable annuity and life insurance contracts for which the Franklin Templeton Variable Insurance Products Trust serves as an underlying investment vehicle.
See notes to financial statements.
FSC-9
Franklin Templeton Variable Insurance Products Trust
Statement of Investments, December 31, 2005
| | | | | |
| Franklin Small-Mid Cap Growth Securities Fund | | Shares | | Value |
| | | | | | |
Common Stocks 99.0% | | | | | |
Commercial Services 4.5% | | | | | |
CDI Corp. | | 355,500 | | $ | 9,740,700 |
The Corporate Executive Board Co. | | 161,600 | | | 14,495,520 |
aGetty Images Inc. | | 145,900 | | | 13,024,493 |
aLaureate Education Inc. | | 238,300 | | | 12,513,133 |
Robert Half International Inc. | | 263,500 | | | 9,984,015 |
| | | | |
|
|
| | | | | | 59,757,861 |
| | | | |
|
|
Communications 1.5% | | | | | |
aNII Holdings Inc. | | 447,200 | | | 19,533,696 |
| | | | |
|
|
Consumer Durables 3.2% | | | | | |
aActivision Inc. | | 658,800 | | | 9,051,912 |
Harman International Industries Inc. | | 155,900 | | | 15,254,815 |
aNVR Inc. | | 12,300 | | | 8,634,600 |
The Ryland Group Inc. | | 126,000 | | | 9,088,380 |
| | | | |
|
|
| | | | | | 42,029,707 |
| | | | |
|
|
Consumer Non-Durables 0.4% | | | | | |
Alberto-Culver Co. | | 87,800 | | | 4,016,850 |
aDean Foods Co. | | 48,900 | | | 1,841,574 |
| | | | |
|
|
| | | | | | 5,858,424 |
| | | | |
|
|
Consumer Services 4.8% | | | | | |
Four Seasons Hotels Inc. (Canada) | | 98,100 | | | 4,880,475 |
Hilton Hotels Corp. | | 320,700 | | | 7,732,077 |
Orient-Express Hotels Ltd., A | | 241,400 | | | 7,608,928 |
aP.F. Chang’s China Bistro Inc. | | 113,900 | | | 5,652,857 |
aPixar | | 178,900 | | | 9,431,608 |
Station Casinos Inc. | | 217,800 | | | 14,766,840 |
aWeight Watchers International Inc. | | 122,400 | | | 6,050,232 |
aXM Satellite Radio Holdings Inc., A | | 279,800 | | | 7,632,944 |
| | | | |
|
|
| | | | | | 63,755,961 |
| | | | |
|
|
Electronic Technology 19.3% | | | | | |
aActel Corp. | | 591,000 | | | 7,523,430 |
aAvocent Corp. | | 346,200 | | | 9,413,178 |
aCoherent Inc. | | 212,200 | | | 6,298,096 |
aElectro Scientific Industries Inc. | | 671,533 | | | 16,217,522 |
aExar Corp. | | 162,532 | | | 2,034,901 |
aFLIR Systems Inc. | | 396,400 | | | 8,851,612 |
aFormFactor Inc. | | 266,700 | | | 6,515,481 |
Harris Corp. | | 437,800 | | | 18,829,778 |
aIntegrated Device Technology Inc. | | 823,810 | | | 10,857,816 |
Intersil Corp., A | | 810,900 | | | 20,175,192 |
aLam Research Corp. | | 310,900 | | | 11,092,912 |
aLogitech International SA, ADR (Switzerland) | | 338,200 | | | 15,817,614 |
Microchip Technology Inc. | | 447,700 | | | 14,393,555 |
aMicrosemi Corp. | | 388,100 | | | 10,734,846 |
aNetwork Appliance Inc. | | 384,300 | | | 10,376,100 |
aOrbital Sciences Corp. | | 671,700 | | | 8,624,628 |
aSemtech Corp. | | 94,600 | | | 1,727,396 |
aSilicon Laboratories Inc. | | 361,400 | | | 13,248,924 |
aSiRF Technology Holdings Inc. | | 113,900 | | | 3,394,220 |
Tektronix Inc. | | 723,200 | | | 20,401,472 |
aThermo Electron Corp. | | 415,800 | | | 12,528,054 |
FSC-10
Franklin Templeton Variable Insurance Products Trust
Statement of Investments, December 31, 2005 (continued)
| | | | | |
| Franklin Small-Mid Cap Growth Securities Fund | | Shares | | Value |
| | | | | | |
Common Stocks (cont.) | | | | | |
Electronic Technology (cont.) | | | | | |
aTrimble Navigation Ltd. | | 531,350 | | $ | 18,857,611 |
aVarian Inc. | | 116,500 | | | 4,635,535 |
aVarian Semiconductor Equipment Associates Inc. | | 70,800 | | | 3,110,244 |
| | | | |
|
|
| | | | | | 255,660,117 |
| | | | |
|
|
Energy Minerals 5.0% | | | | | |
aAlpha Natural Resources Inc. | | 245,700 | | | 4,719,897 |
Chesapeake Energy Corp. | | 925,200 | | | 29,356,596 |
aDenbury Resources Inc. | | 740,600 | | | 16,870,868 |
Murphy Oil Corp. | | 46,500 | | | 2,510,535 |
aNewfield Exploration Co. | | 268,200 | | | 13,428,774 |
| | | | |
|
|
| | | | | | 66,886,670 |
| | | | |
|
|
Finance 9.8% | | | | | |
aAmeritrade Holding Corp. | | 314,500 | | | 7,548,000 |
BlackRock Inc., A | | 80,200 | | | 8,700,096 |
Boston Private Financial Holdings Inc. | | 65,800 | | | 2,001,636 |
Brown & Brown Inc. | | 319,800 | | | 9,766,692 |
Calamos Asset Management Inc., A | | 115,600 | | | 3,635,620 |
CapitalSource Inc. | | 544,800 | | | 12,203,520 |
Chicago Mercantile Exchange Holdings Inc. | | 26,300 | | | 9,664,987 |
Commerce Bancorp Inc. | | 171,600 | | | 5,904,756 |
Cullen/Frost Bankers Inc. | | 104,200 | | | 5,593,456 |
Doral Financial Corp. (Puerto Rico) | | 571,000 | | | 6,052,600 |
aE*TRADE Financial Corp. | | 823,500 | | | 17,178,210 |
East West Bancorp Inc. | | 264,000 | | | 9,633,360 |
Federated Investors Inc., B | | 522,700 | | | 19,360,808 |
aGFI Group Inc. | | 157,000 | | | 7,446,510 |
aIntercontinentalExchange Inc. | | 30,800 | | | 1,119,580 |
UCBH Holdings Inc. | | 219,900 | | | 3,931,812 |
| | | | |
|
|
| | | | | | 129,741,643 |
| | | | |
|
|
Health Services 8.4% | | | | | |
aCommunity Health Systems Inc. | | 435,400 | | | 16,693,236 |
aCoventry Health Care Inc. | | 325,500 | | | 18,540,480 |
aExpress Scripts Inc. | | 147,900 | | | 12,394,020 |
aLifePoint Hospitals Inc. | | 306,200 | | | 11,482,500 |
Omnicare Inc. | | 284,000 | | | 16,250,480 |
Pharmaceutical Product Development Inc. | | 198,100 | | | 12,272,295 |
aSierra Health Services Inc. | | 169,300 | | | 13,537,228 |
aSymbion Inc. | | 114,400 | | | 2,631,200 |
aVCA Antech Inc. | | 258,000 | | | 7,275,600 |
| | | | |
|
|
| | | | | | 111,077,039 |
| | | | |
|
|
Health Technology 10.7% | | | | | |
aAdolor Corp. | | 487,200 | | | 7,113,120 |
aAmerican Medical Systems Holdings Inc. | | 195,000 | | | 3,476,850 |
aAngiotech Pharmaceuticals Inc. | | 514,700 | | | 6,768,305 |
Biomet Inc. | | 364,200 | | | 13,318,794 |
C.R. Bard Inc. | | 167,000 | | | 11,008,640 |
aCharles River Laboratories International Inc. | | 67,000 | | | 2,838,790 |
aCytyc Corp. | | 275,300 | | | 7,771,719 |
aDigene Corp. | | 384,700 | | | 11,221,699 |
aEndo Pharmaceuticals Holdings Inc. | | 330,000 | | | 9,985,800 |
aFirst Horizon Pharmaceutical Corp. | | 152,700 | | | 2,634,075 |
FSC-11
Franklin Templeton Variable Insurance Products Trust
Statement of Investments, December 31, 2005 (continued)
| | | | | |
| Franklin Small-Mid Cap Growth Securities Fund | | Shares | | Value |
| | | | | | |
Common Stocks (cont.) | | | | | |
Health Technology (cont.) | | | | | |
aFisher Scientific International Inc. | | 211,000 | | $ | 13,052,460 |
aKinetic Concepts Inc. | | 102,800 | | | 4,087,328 |
aThe Medicines Co. | | 195,000 | | | 3,402,750 |
aMGI Pharma Inc. | | 182,300 | | | 3,128,268 |
Pall Corp. | | 55,300 | | | 1,485,358 |
aSepracor Inc. | | 59,600 | | | 3,075,360 |
aTelik Inc. | | 339,700 | | | 5,771,503 |
aVarian Medical Systems Inc. | | 261,800 | | | 13,179,012 |
aWaters Corp. | | 396,800 | | | 14,999,040 |
aWright Medical Group Inc. | | 133,400 | | | 2,721,360 |
| | | | |
|
|
| | | | | | 141,040,231 |
| | | | |
|
|
Industrial Services 4.0% | | | | | |
GlobalSantaFe Corp. (Cayman Islands) | | 136,200 | | | 6,558,030 |
aOil States International Inc. | | 509,500 | | | 16,140,960 |
Rowan Cos. Inc. | | 373,300 | | | 13,304,412 |
aSuperior Energy Services Inc. | | 818,600 | | | 17,231,530 |
| | | | |
|
|
| | | | | | 53,234,932 |
| | | | |
|
|
Process Industries 3.6% | | | | | |
Ashland Inc. | | 56,000 | | | 3,242,400 |
Bunge Ltd. | | 351,100 | | | 19,875,771 |
Cabot Corp. | | 196,000 | | | 7,016,800 |
aHeadwaters Inc. | | 132,300 | | | 4,688,712 |
Lyondell Chemical Co. | | 387,700 | | | 9,235,014 |
aRockwood Holdings Inc. | | 171,800 | | | 3,389,614 |
| | | | |
|
|
| | | | | | 47,448,311 |
| | | | |
|
|
Producer Manufacturing 6.4% | | | | | |
BorgWarner Inc. | | 59,300 | | | 3,595,359 |
aFlowserve Corp. | | 513,600 | | | 20,318,016 |
Gentex Corp. | | 592,400 | | | 11,551,800 |
Kennametal Inc. | | 267,200 | | | 13,637,888 |
aMettler-Toledo International Inc. (Switzerland) | | 200,400 | | | 11,062,080 |
Oshkosh Truck Corp. | | 326,800 | | | 14,572,012 |
aTerex Corp. | | 166,600 | | | 9,896,040 |
| | | | |
|
|
| | | | | | 84,633,195 |
| | | | |
|
|
Retail Trade 5.3% | | | | | |
aAdvance Auto Parts Inc. | | 226,800 | | | 9,856,728 |
aChico’s FAS Inc. | | 339,300 | | | 14,905,449 |
Dollar General Corp. | | 1,025,900 | | | 19,563,913 |
Ross Stores Inc. | | 192,500 | | | 5,563,250 |
Tuesday Morning Corp. | | 265,300 | | | 5,550,076 |
aUrban Outfitters Inc. | | 209,300 | | | 5,297,383 |
Whole Foods Market Inc. | | 79,600 | | | 6,160,244 |
aZumiez Inc. | | 72,400 | | | 3,129,128 |
| | | | |
|
|
| | | | | | 70,026,171 |
| | | | |
|
|
Technology Services 8.7% | | | | | |
aAlliance Data Systems Corp. | | 252,400 | | | 8,985,440 |
aAmdocs Ltd. | | 478,800 | | | 13,167,000 |
Autodesk Inc. | | 97,400 | | | 4,183,330 |
aCNET Networks Inc. | | 482,700 | | | 7,090,863 |
aCognizant Technology Solutions Corp., A | | 422,700 | | | 21,282,945 |
FSC-12
Franklin Templeton Variable Insurance Products Trust
Statement of Investments, December 31, 2005 (continued)
| | | | | | |
| Franklin Small-Mid Cap Growth Securities Fund | | Shares | | Value | |
| | | | | | | |
Common Stocks (cont.) | | | | | | |
Technology Services (cont.) | | | | | | |
aEntrust Inc. | | 666,000 | | $ | 3,223,440 | |
Fair Isaac Corp. | | 152,800 | | | 6,749,176 | |
aFileNET Corp. | | 450,000 | | | 11,632,500 | |
aHewitt Associates Inc. | | 228,400 | | | 6,397,484 | |
aHyperion Solutions Corp. | | 396,900 | | | 14,216,958 | |
aMarchex Inc., B | | 330,200 | | | 7,426,198 | |
aNAVTEQ | | 164,200 | | | 7,203,454 | |
aSalesforce.com Inc. | | 121,300 | | | 3,887,665 | |
| | | | |
|
|
|
| | | | | | 115,446,453 | |
| | | | |
|
|
|
Transportation 3.4% | | | | | | |
C.H. Robinson Worldwide Inc. | | 350,200 | | | 12,967,906 | |
Expeditors International of Washington Inc. | | 144,700 | | | 9,768,697 | |
aJetBlue Airways Corp. | | 824,950 | | | 12,687,731 | |
Landstar System Inc. | | 235,400 | | | 9,825,596 | |
| | | | |
|
|
|
| | | | | | 45,249,930 | |
| | | | |
|
|
|
Total Common Stocks (Cost $1,033,887,912) | | | | | 1,311,380,341 | |
| | | | |
|
|
|
Short Term Investment (Cost $14,187,506) 1.1% | | | | | | |
Money Fund 1.1% | | | | | | |
bFranklin Institutional Fiduciary Trust Money Market Portfolio | | 14,187,506 | | | 14,187,506 | |
| | | | |
|
|
|
Total Investments (Cost $1,048,075,418) 100.1% | | | | | 1,325,567,847 | |
Other Assets, less Liabilities (0.1)% | | | | | (1,676,966 | ) |
| | | | |
|
|
|
Net Assets 100.0% | | | | $ | 1,323,890,881 | |
| | | | |
|
|
|
Selected Portfolio Abbreviations
ADR - American Depository Receipt
aNon-income producing.
bSee Note 7 regarding investments in the Franklin Institutional Fiduciary Trust Money Market Portfolio.
See notes to financial statements.
FSC-13
Franklin Templeton Variable Insurance Products Trust
Financial Statements
Statement of Assets and Liabilities
December 31, 2005
| | | | |
| | | Franklin Small-
Mid Cap Growth
Securities Fund
| |
Assets: | | | | |
Investments in securities: | | | | |
Cost - Unaffiliated issuers | | $ | 1,033,887,912 | |
Cost - Sweep Money Fund (Note 7) | | | 14,187,506 | |
| | |
|
|
|
Total cost of investments | | $ | 1,048,075,418 | |
| | |
|
|
|
Value - Unaffiliated issuers | | $ | 1,311,380,341 | |
Value - Sweep Money Fund (Note 7) | | | 14,187,506 | |
| | |
|
|
|
Total value of investments | | | 1,325,567,847 | |
Receivables: | | | | |
Investment securities sold | | | 3,849,221 | |
Capital shares sold | | | 167,772 | |
Dividends | | | 1,591,921 | |
| | |
|
|
|
Total assets | | | 1,331,176,761 | |
| | |
|
|
|
Liabilities: | | | | |
Payables: | | | | |
Investment securities purchased | | | 4,014,495 | |
Capital shares redeemed | | | 1,834,353 | |
Affiliates | | | 1,303,323 | |
Accrued expenses and other liabilities | | | 133,709 | |
| | |
|
|
|
Total liabilities | | | 7,285,880 | |
| | |
|
|
|
Net assets, at value | | $ | 1,323,890,881 | |
| | |
|
|
|
Net assets consist of: | | | | |
Paid-in capital | | $ | 1,065,651,318 | |
Net unrealized appreciation (depreciation) | | | 277,492,429 | |
Accumulated net realized gain (loss) | | | (19,252,866 | ) |
| | |
|
|
|
Net assets, at value | | $ | 1,323,890,881 | |
| | |
|
|
|
Class 1: | | | | |
Net assets, at value | | $ | 157,084,656 | |
| | |
|
|
|
Shares outstanding | | | 7,602,367 | |
| | |
|
|
|
Net asset value and offering price per share | | $ | 20.66 | |
| | |
|
|
|
Class 2: | | | | |
Net assets, at value | | $ | 1,166,806,225 | |
| | |
|
|
|
Shares outstanding | | | 57,299,348 | |
| | |
|
|
|
Net asset value and offering price per share | | $ | 20.36 | |
| | |
|
|
|
See notes to financial statements.
FSC-14
Franklin Templeton Variable Insurance Products Trust
Financial Statements (continued)
Statement of Operations
for the year ended December 31, 2005
| | | | |
| | | Franklin Small-
Mid Cap Growth
Securities Fund
| |
Investment Income: | | | | |
Dividends: | | | | |
Unaffiliated issuers | | $ | 6,817,539 | |
Sweep Money Fund (Note 7) | | | 1,494,765 | |
Other income (Note 9) | | | 46,388 | |
| | |
|
|
|
Total investment income | | | 8,358,692 | |
| | |
|
|
|
Expenses: | | | | |
Management fees (Note 3a) | | | 5,942,021 | |
Administrative fees (Note 3b) | | | 3,212,302 | |
Distribution fees - Class 2 (Note 3c) | | | 2,801,827 | |
Unaffiliated transfer agent fees | | | 7,844 | |
Custodian fees (Note 4) | | | 24,809 | |
Reports to shareholders | | | 282,408 | |
Professional fees | | | 48,136 | |
Trustees’ fees and expenses | | | 7,047 | |
Other | | | 27,153 | |
| | |
|
|
|
Total expenses | | | 12,353,547 | |
Expense reductions (Note 4) | | | (1,309 | ) |
| | |
|
|
|
Net expenses | | | 12,352,238 | |
| | |
|
|
|
Net investment income (loss) | | | (3,993,546 | ) |
| | |
|
|
|
Realized and unrealized gains (losses): | | | | |
Net realized gain (loss) from: | | | | |
Investments | | | 77,816,882 | |
Foreign currency transactions | | | (193 | ) |
| | |
|
|
|
Net realized gain (loss) | | | 77,816,689 | |
| | |
|
|
|
Net change in unrealized appreciation (depreciation) on investments | | | (13,157,541 | ) |
| | |
|
|
|
Net realized and unrealized gain (loss) | | | 64,659,148 | |
| | |
|
|
|
Net increase (decrease) in net assets resulting from operations | | $ | 60,665,602 | |
| | |
|
|
|
See notes to financial statements.
FSC-15
Franklin Templeton Variable Insurance Products Trust
Financial Statements (continued)
Statements of Changes in Net Assets
| | | | | | | | |
| | | Franklin Small-Mid Cap Growth
Securities Fund
| |
| | | Year Ended December 31,
| |
| | | 2005 | | | 2004 | |
| | |
| |
Increase (decrease) in net assets: | | | | | | | | |
Operations: | | | | | | | | |
Net investment income (loss) | | $ | (3,993,546 | ) | | $ | (6,387,915 | ) |
Net realized gain (loss) from investments and foreign currency transactions | | | 77,816,689 | | | | 48,595,678 | |
Net change in unrealized appreciation (depreciation) on investments | | | (13,157,541 | ) | | | 90,306,666 | |
| | |
| |
Net increase (decrease) in net assets resulting from operations | | | 60,665,602 | | | | 132,514,429 | |
Capital share transactions: (Note 2) | | | | | | | | |
Class 1 | | | (34,508,365 | ) | | | (33,128,594 | ) |
Class 2 | | | (28,826,485 | ) | | | 119,677,068 | |
| | |
| |
Total capital share transactions | | | (63,334,850 | ) | | | 86,548,474 | |
| | |
| |
Net increase (decrease) in net assets | | | (2,669,248 | ) | | | 219,062,903 | |
Net assets (there is no undistributed net investment income at beginning or end of year): | | | | | | | | |
Beginning of year | | | 1,326,560,129 | | | | 1,107,497,226 | |
| | |
| |
End of year | | $ | 1,323,890,881 | | | $ | 1,326,560,129 | |
| | |
| |
See notes to financial statements.
FSC-16
Franklin Templeton Variable Insurance Products Trust
Notes to Financial Statements
Franklin Small-Mid Cap Growth Securities Fund
1. ORGANIZATION AND SIGNIFICANT ACCOUNTING POLICIES
Franklin Templeton Variable Insurance Products Trust (the Trust) is registered under the Investment Company Act of 1940 as an open-end investment company, consisting of twenty-two separate series. The Franklin Small-Mid Cap Growth Securities Fund (the Fund) included in this report is diversified. The financial statements of the remaining funds in the series are presented separately. Shares of the Fund are sold only to insurance company separate accounts to fund the benefits of variable life insurance policies or variable annuity contracts.
Effective May 2, 2005, the Franklin Small Cap Fund was renamed the Franklin Small-Mid Cap Growth Securities Fund.
The following summarizes the Fund’s significant accounting policies.
a. Security Valuation
Securities listed on a securities exchange or on the NASDAQ National Market System are valued at the last quoted sale price or the official closing price of the day, respectively. Over-the-counter securities and listed securities for which there is no reported sale are valued within the range of the most recent quoted bid and ask prices. Securities that trade in multiple markets or on multiple exchanges are valued according to the broadest and most representative market. Investments in open-end mutual funds are valued at the closing net asset value.
Foreign securities are valued as of the close of trading on the foreign stock exchange on which the security is primarily traded, or the NYSE, whichever is earlier. If no sale is reported at that time, the foreign security will be valued within the range of the most recent quoted bid and ask prices. The value is then converted into its U.S. dollar equivalent at the foreign exchange rate in effect at the close of the NYSE on the day that the value of the foreign security is determined.
The Trust has procedures to determine the fair value of individual securities and other assets for which market prices are not readily available or which may not be reliably priced. Methods for valuing these securities may include: fundamental analysis, matrix pricing, discounts from market prices of similar securities, or discounts applied due to the nature and duration of restrictions on the disposition of the securities. Due to the inherent uncertainty of valuations of such securities, the fair values may differ significantly from the values that would have been used had a ready market for such investments existed. Occasionally, events occur between the time at which trading in a security is completed and the close of the NYSE that might call into question the availability (including the reliability) of the value of a portfolio security held by the Fund. If such an event occurs, the securities may be valued using fair value procedures, which may include the use of independent pricing services. All security valuation procedures are approved by the Trust’s Board of Trustees.
b. Foreign Currency Translation
Portfolio securities and other assets and liabilities denominated in foreign currencies are translated into U.S. dollars based on the exchange rate of such currencies against U.S. dollars on the date of valuation. Purchases and sales of securities, income and expense items denominated in foreign currencies are translated into U.S. dollars at the exchange rate in effect on the transaction date. Occasionally, events may impact the availability or reliability of foreign exchange rates used to convert the U.S. dollar equivalent value. If such an event occurs, the foreign exchange rate will be valued at fair value using procedures established and approved by the Trust’s Board of Trustees.
The Fund does not separately report the effect of changes in foreign exchange rates from changes in market prices on securities held. Such changes are included in net realized and unrealized gain or loss from investments on the Statement of Operations.
Realized foreign exchange gains or losses arise from sales of foreign currencies, currency gains or losses realized between the trade and settlement dates on securities transactions and the difference between the recorded amounts of dividends, interest, and foreign withholding taxes and the U.S. dollar equivalent of the amounts actually received or paid. Net unrealized foreign exchange gains and losses arise from changes in foreign exchange rates on foreign denominated assets and liabilities other than investments in securities held at the end of the reporting period.
FSC-17
Franklin Templeton Variable Insurance Products Trust
Notes to Financial Statements (continued)
Franklin Small-Mid Cap Growth Securities Fund
1. ORGANIZATION AND SIGNIFICANT ACCOUNTING POLICIES (continued)
c. Foreign Currency Contracts
When the Fund purchases or sells foreign securities it may enter into foreign exchange contracts to minimize foreign exchange risk from the trade date to the settlement date of the transactions. A foreign exchange contract is an agreement between two parties to exchange different currencies at an agreed upon exchange rate on a specified date. Realized and unrealized gains and losses on these contracts are included in the Statement of Operations.
The risks of these contracts include movement in the values of the foreign currencies relative to the U.S. dollar and the possible inability of the counterparties to fulfill their obligations under the contracts, which may be in excess of the amount reflected in the Statement of Assets and Liabilities.
d. Income Taxes
No provision has been made for U.S. income taxes because the Fund’s policy is to continue to qualify as a regulated investment company under the Internal Revenue Code and to distribute to shareholders substantially all of its taxable income and net realized gains.
e. Security Transactions, Investment Income, Expenses and Distributions
Security transactions are accounted for on trade date. Realized gains and losses on security transactions are determined on a specific identification basis. Interest income and estimated expenses are accrued daily. Dividend income is recorded on the ex-dividend date. Distributions to shareholders are recorded on the ex-dividend date and are determined according to income tax regulations (tax basis). Such distributions are reinvested in additional shares of the Fund. Distributable earnings determined on a tax basis may differ from earnings recorded in accordance with generally accepted accounting principles. These differences may be permanent or temporary. Permanent differences are reclassified among capital accounts to reflect their tax character. These reclassifications have no impact on net assets or the results of operations. Temporary differences are not reclassified, as they may reverse in subsequent periods.
Common expenses incurred by the Trust are allocated among the funds based on the ratio of net assets of each fund to the combined net assets of the Trust. Fund specific expenses are charged directly to the fund that incurred the expense.
Realized and unrealized gains and losses and net investment income, other than class specific expenses, are allocated daily to each class of shares based upon the relative proportion of net assets of each class.
f. Accounting Estimates
The preparation of financial statements in accordance with accounting principles generally accepted in the United States of America requires management to make estimates and assumptions that affect the reported amounts of assets and liabilities at the date of the financial statements and the amounts of income and expenses during the reporting period. Actual results could differ from those estimates.
g. Guarantees and Indemnifications
Under the Trust’s organizational documents, its officers and trustees are indemnified by the Trust against certain liabilities arising out of the performance of their duties to the Trust. Additionally, in the normal course of business, the Trust enters into contracts with service providers that contain general indemnification clauses. The Trust’s maximum exposure under these arrangements is unknown as this would involve future claims that may be made against the Trust that have not yet occurred. However, based on experience, the Trust expects the risk of loss to be remote.
FSC-18
Franklin Templeton Variable Insurance Products Trust
Notes to Financial Statements (continued)
Franklin Small-Mid Cap Growth Securities Fund
2. SHARES OF BENEFICIAL INTEREST
The Fund offers two classes of shares: Class 1 and Class 2. Each class of shares differs by its distribution fees, voting rights on matters affecting a single class and its exchange privilege.
At December 31, 2005, there were an unlimited number of shares authorized ($0.01 par value). Transactions in the Fund’s shares were as follows:
| | | | | | | | | | | | | | |
| | | Year Ended December 31,
| |
| | | 2005
| | | 2004
| |
| Class 1 Shares: | | Shares
| | | Amount
| | | Shares
| | | Amount
| |
Shares sold | | 360,941 | | | $ | 7,020,711 | | | 348,616 | | | $ | 6,338,379 | |
Shares issued on merger (Note 8) | | — | | | | — | | | 236,316 | | | | 4,196,977 | |
Shares redeemed | | (2,141,772 | ) | | | (41,529,076 | ) | | (2,428,515 | ) | | | (43,663,950 | ) |
| | |
| |
Net increase (decrease) | | (1,780,831 | ) | | $ | (34,508,365 | ) | | (1,843,583 | ) | | $ | (33,128,594 | ) |
| | |
| |
| Class 2 Shares: | | | | | | | | | | | | |
Shares sold | | 8,935,711 | | | $ | 170,125,159 | | | 15,698,216 | | | $ | 281,993,369 | |
Shares issued on merger (Note 8) | | — | | | | — | | | 130 | | | | 2,283 | |
Shares redeemed | | (10,420,552 | ) | | | (198,951,644 | ) | | (9,126,486 | ) | | | (162,318,584 | ) |
| | |
| |
Net increase (decrease) | | (1,484,841 | ) | | $ | (28,826,485 | ) | | 6,571,860 | | | $ | 119,677,068 | |
| | |
| |
3. TRANSACTIONS WITH AFFILIATES
Franklin Resources, Inc. is the holding company for various subsidiaries that together are referred to as Franklin Templeton Investments. Certain officers and trustees of the Trust are also officers and/or directors of the following subsidiaries:
| | |
| Subsidiary | | Affiliation |
Franklin Advisers, Inc. (Advisers) | | Investment manager |
Franklin Templeton Services, LLC (FT Services) | | Administrative manager |
Franklin Templeton Distributors, Inc. (Distributors) | | Principal underwriter |
Franklin Templeton Investor Services, LLC (Investor Services) | | Transfer agent |
a. Management Fees
The Fund pays an investment management fee to Advisers based on the average daily net assets of the Fund as follows:
| | |
| Annualized Fee Rate | | Net Assets |
| 0.550% | | Up to and including $500 million |
| 0.450% | | Over $500 million, up to and including $1 billion |
| 0.400% | | Over $1 billion, up to and including $1.5 billion |
| 0.350% | | Over $1.5 billion, up to and including $6.5 billion |
| 0.325% | | Over $6.5 billion, up to and including $11.5 billion |
| 0.300% | | Over $11.5 billion, up to and including $16.5 billion |
| 0.290% | | Over $16.5 billion, up to and including $19 billion |
| 0.280% | | Over $19 billion, up to and including $21.5 billion |
| 0.270% | | In excess of $21.5 billion |
FSC-19
Franklin Templeton Variable Insurance Products Trust
Notes to Financial Statements (continued)
Franklin Small-Mid Cap Growth Securities Fund
3. TRANSACTIONS WITH AFFILIATES (continued)
b. Administrative Fees
The Fund pays an administrative fee to FT Services of 0.25% per year of the Fund’s average daily net assets.
c. Distribution Fees
The Fund’s Board of Trustees has adopted distribution plans for Class 2 shares pursuant to Rule 12b-1 under the 1940 Act. Under the Fund’s compensation distribution plans, the Fund pays Distributors for costs incurred in connection with the sale and distribution of the Fund’s shares up to 0.35% per year of its average daily net assets. The Board of Trustees has set the current rate at 0.25% per year.
d. Transfer Agent Fees
Investor Services, under terms of an agreement, performs shareholder servicing for the Fund and is not paid by the Fund for the services.
4. EXPENSE OFFSET ARRANGEMENT
The Fund has entered into an arrangement with its custodian whereby credits realized as a result of uninvested cash balances are used to reduce a portion of the Fund’s custodian expenses. During the year ended December 31, 2005, the custodian fees were reduced as noted in the Statement of Operations.
5. INCOME TAXES
At December 31, 2005, the Fund had tax basis capital losses of $18,434,612 expiring on December 31, 2011, which may be carried over to offset future capital gains, if any. During the year ended December 31, 2005, the Fund utilized $78,451,886 of capital loss carryforwards.
At December 31, 2005, the cost of investments and net unrealized appreciation (depreciation) for income tax purposes were as follows:
| | | | |
Cost of investments | | $ | 1,048,893,672 | |
| | |
|
|
|
| |
Unrealized appreciation | | $ | 309,233,621 | |
Unrealized depreciation | | | (32,559,446 | ) |
| | �� |
|
|
|
Net unrealized appreciation (depreciation) | | $ | 276,674,175 | |
| | |
|
|
|
Net investment income (loss) differs for financial statements and tax purposes primarily due to differing treatments of foreign currency transactions.
Net realized gains (losses) differ for financial statements and tax purposes primarily due to differing treatments of wash sales and foreign currency transactions.
6. INVESTMENT TRANSACTIONS
Purchases and sales of investments (excluding short term securities) for the year ended December 31, 2005, aggregated $919,888,830 and $914,301,486, respectively.
FSC-20
Franklin Templeton Variable Insurance Products Trust
Notes to Financial Statements (continued)
Franklin Small-Mid Cap Growth Securities Fund
7. INVESTMENTS IN FRANKLIN INSTITUTIONAL FIDUCIARY TRUST MONEY MARKET PORTFOLIO
The Fund may invest in the Franklin Institutional Fiduciary Trust Money Market Portfolio (the Sweep Money Fund), an open-end investment company managed by Advisers. Management fees paid by the Fund are reduced on assets invested in the Sweep Money Fund, in an amount not to exceed the management and administrative fees paid by the Sweep Money Fund.
8. MERGER OF FRANKLIN AGGRESSIVE GROWTH SECURITIES FUND
On April 30, 2004, the Franklin Templeton Variable Insurance Products Trust (FTVIP) – Franklin Small Cap Fund (Small Cap) acquired the net assets of the FTVIP – Franklin Aggressive Growth Securities Fund (Growth) pursuant to a plan of reorganization. The merger was accomplished by a taxable exchange, and accounted for as a purchase.
The selected financial information and shares outstanding immediately before and after the acquisition were as follows:
| | | | | | | | | | | | | | | | |
| | | Class 1
| | Class 2
|
| Fund Name | | Net Assets | | NAV | | Shares | | Net Assets | | NAV | | Shares |
Growth | | $ | 4,196,977 | | $ | 5.45 | | 770,120 | | $ | 2,283 | | $ | 5.40 | | 423 |
Small Cap | | $ | 183,706,326 | | $ | 17.76 | | 10,344,058 | | $ | 965,432,629 | | $ | 17.58 | | 54,931,676 |
Small Cap – post merger | | $ | 187,903,903 | | $ | 17.76 | | 10,580,374 | | $ | 965,434,912 | | $ | 17.58 | | 54,931,806 |
9. REGULATORY MATTERS
As part of various investigations by a number of federal, state, and foreign regulators and governmental entities, relating to certain practices in the mutual fund industry, including late trading, market timing and marketing support payments to securities dealers who sell fund shares, Franklin Resources, Inc. and certain of its subsidiaries (collectively, the “Company”), entered into settlements with certain of those regulators.
Specifically, the Company entered into settlements with the Securities and Exchange Commission (“SEC”) concerning market timing (the “August 2, 2004 SEC Order”) and marketing support payments to securities dealers who sell fund shares (the “December 13, 2004 SEC Order”) and with the California Attorney General’s Office (“CAGO”) concerning marketing support payments to securities dealers who sell fund shares (the “CAGO Settlement”). Under the terms of the settlements with the SEC and the CAGO, the Company retained an Independent Distribution Consultant (“IDC”) to develop a plan for distribution of the respective settlement monies. The CAGO approved the distribution plan under the CAGO Settlement and, in accordance with the terms and conditions of that settlement, the monies were disbursed to the relevant funds and are recorded as other income in the current period. The SEC has not yet approved the distribution plan pertaining to the December 13, 2004 SEC Order. When approved, disbursements of settlement monies will be made promptly to the relevant funds, in accordance with the terms and conditions of that order. The IDC continues to develop the plan of distribution under the August 2, 2004 SEC Order that resolved the SEC’s market timing investigation.
In addition, the Company, as well as most of the mutual funds within Franklin Templeton Investments and certain current or former officers, directors, and/or employees, have been named in private lawsuits (styled as shareholder class actions, or as derivative actions on behalf of either the named funds or Franklin Resources, Inc.) relating to the industry practices referenced above, as well as to allegedly excessive advisory fees, commissions, and/or 12b-1 fees. The lawsuits were filed in different courts throughout the country. Many of those suits are now pending in a multi-district litigation in the United States District Court for the District of Maryland.
The Company and fund management strongly believe that the claims made in each of the private lawsuits referenced above are without merit and intend to defend against them vigorously. The Company cannot predict with certainty the eventual outcome of these lawsuits, nor whether they will have a material negative impact on the Company. If it is determined that the Company bears responsibility for any unlawful or inappropriate conduct that caused losses to the Trust, it is committed to making the Trust or their shareholders whole, as appropriate.
FSC-21
Franklin Templeton Variable Insurance Products Trust
Franklin Small-Mid Cap Growth Securities Fund
Report of Independent Registered Public Accounting Firm
To the Board of Trustees and Shareholders of
Franklin Templeton Variable Insurance Products Trust
In our opinion, the accompanying statement of assets and liabilities, including the statement of investments, and the related statements of operations and of changes in net assets and the financial highlights present fairly, in all material respects, the financial position of Franklin Small-Mid Cap Growth Securities Fund (one of the funds constituting Franklin Templeton Variable Insurance Products Trust, hereafter referred to as the “Fund”) at December 31, 2005, the results of its operations for the year then ended, the changes in its net assets for each of the two years in the period then ended and the financial highlights for each of the five years in the period then ended, in conformity with accounting principles generally accepted in the United States of America. These financial statements and financial highlights (hereafter referred to as “financial statements”) are the responsibility of the Fund’s management; our responsibility is to express an opinion on these financial statements based on our audits. We conducted our audits of these financial statements in accordance with the standards of the Public Company Accounting Oversight Board (United States). Those standards require that we plan and perform the audit to obtain reasonable assurance about whether the financial statements are free of material misstatement. An audit includes examining, on a test basis, evidence supporting the amounts and disclosures in the financial statements, assessing the accounting principles used and significant estimates made by management, and evaluating the overall financial statement presentation. We believe that our audits, which included confirmation of securities at December 31, 2005, by correspondence with the custodian and brokers, provide a reasonable basis for our opinion.
PricewaterhouseCoopers LLP
San Francisco, California
February 10, 2006
FSC-22
FRANKLIN STRATEGIC INCOME SECURITIES FUND
This annual report for Franklin Strategic Income Securities Fund covers the fiscal year ended December 31, 2005.
Performance Summary as of 12/31/05
Average annual total return of Class 1 shares represents the average annual change in value, assuming reinvestment of dividends and capital gains. Average returns smooth out variations in returns, which can be significant; they are not the same as year-by-year results.
Periods ended 12/31/05
| | | | | | |
| | | 1-Year | | 5-Year | | Since
Inception
(7/1/99) |
Average Annual Total Return | | +1.73% | | +8.15% | | +7.43% |
Total Return Index Comparison for Hypothetical $10,000 Investment (7/1/99–12/31/05)
The graph below shows the change in value of a hypothetical $10,000 investment in the Fund over the indicated period and includes reinvestment of any income or distributions. The Fund’s performance is compared to the performance of the Lehman Brothers (LB) U.S. Aggregate Index and the Lipper Multi-Sector Income Funds Classification Average. One cannot invest directly in an index, nor is an index representative of the Fund’s portfolio. Please see Important Notes to Performance Information preceding the Fund Summaries.
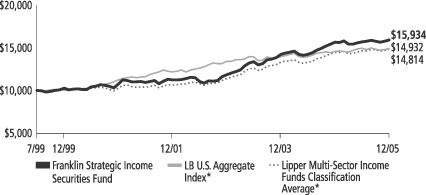
*Sources: Standard & Poor’s Micropal; Lipper Inc. Please see Index Descriptions following the Fund Summaries.
Franklin Strategic Income Securities Fund – Class 1
Performance reflects the Fund’s Class 1 operating expenses, but does not include any contract fees, expenses or sales charges. If they had been included, performance would be lower. These charges and deductions, particularly for variable life policies, can have a significant effect on contract values and insurance benefits. See the contract prospectus for a complete description of these expenses, including sales charges.
Performance data represent past performance, which does not guarantee future results. Investment return and principal value will fluctuate, and you may have a gain or loss when you sell your shares.
Current performance may differ from figures shown.
FSI-1
Fund Goals and Main Investments: Franklin Strategic Income Securities Fund seeks a high level of current income, with capital appreciation over the long term as a secondary goal. The Fund normally invests primarily to predominantly in U.S. and foreign debt securities, including investment grade and high yield corporate bonds, and U.S. and foreign government bonds, including emerging market bonds. The Fund also invests in mortgage securities and other asset-backed securities, floating and variable rate investments, convertible securities and preferred stock.
Performance Overview
You can find the Fund’s one-year total return in the Performance Summary. Compared with its benchmarks for the same period, the Fund underperformed the LB U.S. Aggregate Index’s +2.43% return, and the Lipper Multi-Sector Income Funds Classification Average’s +2.19% return.1
Economic and Market Overview
The economy continued to grow at a healthy pace during the year under review. Over the reporting period, nonfarm payroll data, as well as other indexes, showed growing employment. This along with other factors helped consumer spending increase 6.25% (not adjusted for inflation) in December 2005 compared with the same month a year earlier, which supported U.S. economic growth.2
Business spending also rose during the reporting period, contributing to economic growth. Historically low interest rates continued to allow many companies easy access to capital, and ample cash also helped some companies to support their spending plans.
Oil prices increased substantially during the period amid concerns about potential long-term supply limitations in the face of expected strong growth in global demand, especially from China and India. Despite high commodity prices, inflation remained relatively contained for the 12 months ended December 31, 2005, as measured by the 2.2% rise for the core Consumer Price Index (CPI), which was the same as the core CPI’s 10-year average.3 The Federal Reserve Board (Fed) noted some economic effects due to the recent hurricanes. However,
1. Sources: Standard & Poor’s Micropal; Lipper Inc. One cannot invest directly in an index, nor is an index representative of the Fund’s portfolio. Please see Index Descriptions following the Fund Summaries.
2. Source: Bureau of Economic Analysis.
3. Source: Bureau of Labor Statistics. Core CPI excludes food and energy costs.
Fund Risks: Because the Fund invests in bonds and other debt obligations, the Fund’s share price and yield will be affected by interest rate movements. Bond prices generally move in the opposite direction from interest rates. Thus, as the prices of bonds in the Fund adjust to a rise in interest rates, the Fund’s share price may decline. High yield, lower-rated (junk) bonds generally have greater price swings and higher default risks. Foreign investing especially in emerging markets, involves additional risks including currency fluctuations, economic instability, and social and political developments. The Fund’s prospectus also includes a description of the main investment risks.
FSI-2
acknowledging the economy’s strength as well as potential inflationary pressure from high energy prices, the Fed raised the federal funds target rate to 4.25% from 2.25% during the 12-month period.
The 10-year Treasury note fluctuated considerably over the past year, but overall its yield rose from 4.24% at the beginning of the period to 4.39% on December 31, 2005. Although core inflationary pressures appeared relatively well contained, the U.S. economy’s resilience caused some concern about future pricing pressures. Some market participants also pointed to the upcoming change in the Fed chairman as another possible catalyst for the 10-year Treasury’s rise, as there is some market perception that Ben Bernanke, the next Fed chairman, may tolerate higher inflation risk. However, Mr. Bernanke is reported to share many of retiring chairman Alan Greenspan’s economic philosophies. Furthermore, it is likely to take some time before his approach to dealing with inflation is apparent.
Consistent with strong economic growth and in particular solid consumption trends, U.S. imports exceeded exports, driving the U.S. trade balance to a $64 billion monthly deficit level by November 2005.4 Although higher oil prices negatively impacted the deficit, the underlying trade balance (not including oil) also deteriorated, largely as a result of a widening trade deficit with the Pacific Rim region. Furthermore, the U.S. current account deficit widened to 6.2% of gross domestic product (GDP) in third quarter 2005 versus 5.7% a year earlier.4
In contrast to the U.S., Asia generated trade and current account surpluses. These surpluses facilitated foreign reserve accumulation, most notably in China. This foreign reserve buildup combined with international political pressure prompted the Chinese government to revalue the yuan and move from its U.S. dollar peg to a managed float versus a basket of undisclosed global currencies. Overall, foreign and domestic demand among Asian economies rose over the Fund’s fiscal year. Asian economic growth accelerated during the period and some regional interest rates began to rise.
Following sluggish economic growth in the first half of the year, economic activity in the 12-country euro zone accelerated in the second half but was still more moderate than expansion in the U.S. or Asia. While underlying inflationary pressures remained well contained, higher energy prices and liquidity conditions prompted the European
4. Source: U.S. Department of Commerce.
FSI-3
Central Bank (ECB) to increase interest rates by 25 basis points to 2.25% after being on hold for 30 months. Central European economies also benefited from the euro zone’s firmer growth conditions.
Investment Strategy
We allocate our investments among the various types of debt available based on our assessment of changing economic, global market, industry, and issuer conditions. We use a top-down analysis of macroeconomic trends, combined with a bottom-up fundamental analysis of market sectors, industries and issuers, seeking to take advantage of varying sector reactions to economic events. For example, we may evaluate business cycles, yield curves, country risk, and the relative interest rates among currencies, and values between and within markets. In selecting debt securities, we generally conduct our own analysis of the security’s intrinsic value rather than simply relying on the coupon rate or rating.
Manager’s Discussion
Although the benchmark 10-year Treasury yield rose during the year under review, as described above, the 30-year Treasury yield actually declined from 4.83% to 4.54%. In the recent interest rate environment, most interest-rate sensitive sectors delivered modest total returns, with longer-dated bonds generally outperforming their shorter-term counterparts.
In terms of Fund weightings, Franklin Strategic Income Securities Fund held a relatively underweighted position in the more interest-rate sensitive fixed income sectors during the period, as we found investment opportunities we felt were more attractive in other sectors. Relative to U.S. government bonds, the Fund held a larger weighting in mortgages and other asset-backed securities, favoring the additional yield pickup offered from those assets in the recent market environment. Also, within the more interest-rate sensitive sectors, the Fund held a lower-duration position, which constrained the Fund’s relative performance given the aforementioned decline in long-term interest rates, although the Fund lengthened its duration profile in these sectors during the year. (Duration is a measure of a bond’s price sensitivity to interest rate changes. A lower duration portfolio is generally less interest-rate sensitive than a portfolio with a higher duration.)
One of the weakest performing fixed income categories over the past year was the non-U.S. dollar government bond market, which constrained the Fund’s performance given its exposure to this sector. The
FSI-4
Portfolio Breakdown
Franklin Strategic Income Securities Fund
Based on Total Net Assets
| | | | |
| | | 12/31/05 | | 12/31/04 |
High Yield Corporate Bonds & Preferred Stocks | | 33.2% | | 39.8% |
Other International Bonds (non-$US) | | 13.8% | | 8.7% |
Mortgages & Other Asset-backed Bonds | | 12.9% | | 12.0% |
International Developed Market Bonds (non-$US) | | 9.6% | | 13.0% |
U.S. Government Bonds | | 7.7% | | 4.8% |
Floating Rate Bank Loans | | 7.6% | | 1.8% |
Emerging Markets Bonds ($US) | | 7.4% | | 10.2% |
Investment Grade Corporate Bonds | | 5.4% | | 5.9% |
Convertible Securities | | 1.3% | | 1.5% |
Short-Term Investments & Other Net Assets | | 1.1% | | 2.3% |
The dollar value, number of shares or principal amount, and names of all portfolio holdings are listed in the Fund’s Statement of Investments.
increase in U.S. short-term rates combined with international purchases of U.S. debt securities buoyed the U.S. dollar against most major currencies during the period. However, some of the Fund’s non-dollar holdings outperformed the major Japanese and European bond markets given their stronger relative currency performance (in countries such as South Korea and Canada) as well as positive bond price performance (such as Poland) during 2005. Given the expectation that short-term interest rate increases are likely to become less predictable in 2006 and that the U.S. current account deficit will continue to pressure the U.S. dollar, we continued to hold our second-largest sector weighting in non-dollar government bonds at period-end.
Across the more economically sensitive fixed income sectors, U.S. dollar-denominated emerging market sovereign debt securities delivered some of the strongest total returns during the period, while high yield corporate bonds generally performed in line with the broad fixed income markets. For the third year in a row, the U.S. dollar-denominated emerging markets bond sector generated double-digit total returns as a result of ample liquidity, relative political stability, and overall improving credit quality for many issuers in this sector. However, yield spread valuations ended the period near all-time high levels. Consequently, at period-end, we held an underweighted position in this sector relative to our historical holdings.
In the high yield corporate bond market, companies continued to be supported by favorable economic conditions, low default rates, ample liquidity and issuer accessibility to the capital markets, and favorable
FSI-5
earnings trends. The high yield corporate bond market rebounded after a sell-off in early May following the downtrend triggered by ratings downgrades of General Motors and Ford debt earlier in the year. Although default rates rose from their recent lows, many defaults were centered on the automotive and airline industries and certain specific leveraged entities. Credit fundamentals for the remainder of the corporate bond market continued to be generally supportive. Despite modestly widening yield spreads during the year, the sector generated positive returns as a result of the higher yields. Although high yield bonds were the Fund’s largest sector weighting and we remained comfortable with the sector’s fundamental outlook, we reduced our exposure to high yield bonds over the course of the year given what we considered were their somewhat full valuations.
Finally, we continued to increase our holdings in floating rate debt securities during the period, given our expectation for continued income increases tied to rising U.S. short-term interest rates as well as these assets’ lesser interest-rate sensitivity (to rises in longer-term rates). Although floating rate senior secured bank loan valuations were somewhat expensive by historical standards, we remained comfortable with the fundamental credit trends for these issues, which represented the majority of our floating-rate holdings at period-end. Given the rise in short-term rates during 2005, floating rate loans provided some of the strongest total returns over the past year.
We thank you for your interest in Franklin Strategic Income Securities Fund and look forward to serving your investment needs.
The foregoing information reflects our analysis, opinions and portfolio holdings as of December 31, 2005, the end of the reporting period. The way we implement our main investment strategies and the resulting portfolio holdings may change depending on factors such as market and economic conditions. These opinions may not be relied upon as investment advice or an offer for a particular security. The information is not a complete analysis of every aspect of any market, country, industry, security or the Fund. Statements of fact are from sources considered reliable, but the adviser makes no representation or warranty as to their completeness or accuracy. Although historical performance is no guarantee of future results, these insights may help you understand our investment management philosophy.
FSI-6
Fund Expenses
As an investor in a variable insurance contract (“Contract”) that indirectly provides for investment in an underlying mutual fund, you can incur transaction and/or ongoing expenses at both the Fund level and the Contract level.
| • | | Transaction expenses can include sales charges (loads) on purchases, redemption fees, surrender fees, transfer fees and premium taxes. |
| • | | Ongoing expenses can include management fees, distribution and service (12b-1) fees, contract fees, annual maintenance fees, mortality and expense risk fees and other fees and expenses. All mutual funds and Contracts have some types of ongoing expenses. |
The expenses shown in the table below are meant to highlight ongoing expenses at the Fund level only and do not include ongoing expenses at the Contract level, or transaction expenses at either the Fund or Contract level. While the Fund does not have transaction expenses, if the transaction and ongoing expenses at the Contract level were included, the expenses shown below would be higher. You should consult your Contract prospectus or disclosure document for more information.
The table shows Fund-level ongoing expenses and can help you understand these expenses and compare them with those of other mutual funds offered through the Contract. The table assumes a $1,000 investment held for the six months indicated. Please refer to the Fund prospectus for additional information on operating expenses.
Actual Fund Expenses
The first line (Actual) of the table below provides actual account values and expenses. The “Ending Account Value” is derived from the Fund’s actual return, which includes the effect of ongoing Fund expenses, but does not include the effect of ongoing Contract expenses.
You can estimate the Fund-level expenses you incurred during the period by following these steps. Of course, your account value and expenses will differ from those in this illustration:
| 1. | Divide your account value by $1,000. |
If an account had an $8,600 value, then $8,600 ÷ $1,000 = 8.6.
| 2. | Multiply the result by the number under the heading “Fund-Level Expenses Incurred During Period.” |
If Fund-Level Expenses Incurred During Period were $7.50, then 8.6 × $7.50 = $64.50.
Franklin Strategic Income Securities Fund – Class 1
FSI-7
In this illustration, the estimated expenses incurred this period at the Fund level are $64.50.
Hypothetical Example for Comparison with Other Mutual Funds
Information in the second line (Hypothetical) of the table can help you compare ongoing expenses of the Fund with those of other mutual funds offered through the Contract. This information may not be used to estimate the actual ending account balance or expenses you incurred during the period. The hypothetical “Ending Account Value” is based on the Fund’s actual expense ratio and an assumed 5% annual rate of return before expenses, which does not represent the Fund’s actual return. The figure under the heading “Fund-Level Expenses Incurred During Period” shows the hypothetical expenses your account would have incurred under this scenario. You can compare this figure with the 5% hypothetical examples that appear in shareholder reports of other funds offered through a Contract.
| | | | | | | | | |
| Class 1 | | Beginning
Account
Value 7/1/05 | | Ending
Account
Value 12/31/05 | | Fund-Level
Expenses Incurred
During Period*
7/1/05-12/31/05 |
Actual | | $ | 1,000 | | $ | 1,015.50 | | $ | 3.40 |
Hypothetical (5% return before expenses) | | $ | 1,000 | | $ | 1,021.83 | | $ | 3.41 |
*Expenses are equal to the annualized expense ratio for the Fund’s Class 1 shares (0.67%), which does not include any ongoing expenses of the Contract for which the Fund is an investment option, multiplied by the average account value over the period, multiplied by 184/365 to reflect the one-half year period.
FSI-8
Franklin Templeton Variable Insurance Products Trust
Financial Highlights
Franklin Strategic Income Securities Fund
| | | | | | | | | | | | | | | | | | | | |
| | | Year Ended December 31,
| |
| Class 1 | | 2005 | | | 2004 | | | 2003 | | | 2002 | | | 2001 | |
| | |
|
|
|
Per share operating performance | | | | | | | | | | | | | | | | | | | | |
(for a share outstanding throughout the year) | | | | | | | | | | | | | | | | | | | | |
Net asset value, beginning of year | | $ | 12.92 | | | $ | 12.16 | | | $ | 10.37 | | | $ | 9.87 | | | $ | 9.89 | |
| | |
|
|
|
Income from investment operations: | | | | | | | | | | | | | | | | | | | | |
Net investment incomea | | | 0.65 | | | | 0.67 | | | | 0.65 | | | | 0.73 | | | | 0.76 | e |
Net realized and unrealized gains (losses) | | | (0.44 | ) | | | 0.51 | | | | 1.44 | | | | (0.23 | ) | | | (0.32 | )e |
| | |
|
|
|
Total from investment operations | | | 0.21 | | | | 1.18 | | | | 2.09 | | | | 0.50 | | | | 0.44 | |
| | |
|
|
|
Less distributions from: | | | | | | | | | | | | | | | | | | | | |
Net investment income | | | (0.60 | ) | | | (0.40 | ) | | | (0.30 | ) | | | — | d | | | (0.46 | ) |
Net realized gains | | | (0.10 | ) | | | (0.02 | ) | | | — | | | | — | | | | — | |
| | |
|
|
|
Total distributions | | | (0.70 | ) | | | (0.42 | ) | | | (0.30 | ) | | | — | | | | (0.46 | ) |
| | |
|
|
|
Net asset value, end of year | | $ | 12.43 | | | $ | 12.92 | | | $ | 12.16 | | | $ | 10.37 | | | $ | 9.87 | |
| | |
|
|
|
| | | | | |
Total returnb | | | 1.73% | | | | 10.01% | | | | 20.36% | | | | 5.12% | | | | 4.51% | |
Ratios/supplemental data | | | | | | | | | | | | | | | | | | | | |
Net assets, end of year (000’s) | | $ | 740,352 | | | $ | 571,067 | | | $ | 359,947 | | | $ | 102,751 | | | $ | 43,778 | |
Ratios to average net assets: | | | | | | | | | | | | | | | | | | | | |
Expenses | | | 0.66% | | | | 0.66% | | | | 0.65% | | | | 0.66% | | | | 0.71% | |
Net investment income | | | 5.21% | | | | 5.45% | | | | 5.69% | | | | 7.37% | | | | 7.48% | e |
Portfolio turnover rate | | | 40.56% | | | | 50.21% | | | | 49.87% | | | | 45.78% | | | | 35.21% | |
Portfolio turnover rate excluding mortgage dollar rollsc | | | 40.07% | | | | 38.39% | | | | 32.74% | | | | 40.50% | | | | 30.32% | |
aBased on average daily shares outstanding.
bTotal return does not include any fees, charges or expenses imposed by the variable annuity and life insurance contracts for which the Franklin Templeton Variable Insurance Products Trust serves as an underlying investment vehicle.
cSee Note 1(e) regarding mortgage dollar rolls.
dIncludes distributions of net investment income in the amount of $.005.
eEffective January 1, 2001, the Fund adopted the provisions of the AICPA Audit and Accounting Guide for Investment Companies and began recording all paydown gains and losses as part of investment income and amortizing all premium and discount on fixed-income securities, as required. The effect of this change was as follows:
| | |
Net investment income per share | | $(0.018) |
Net realized and unrealized losses per share | | 0.018 |
Ratio of net investment income to average net assets | | (0.18)% |
See notes to financial statements.
FSI-9
Franklin Templeton Variable Insurance Products Trust
Financial Highlights (continued)
Franklin Strategic Income Securities Fund (continued)
| | | | | | | | | | | | | | | | | | | | |
| | | Year Ended December 31,
| |
| Class 2 | | 2005 | | | 2004 | | | 2003 | | | 2002 | | | 2001e | |
| | |
|
|
|
Per share operating performance | | | | | | | | | | | | | | | | | | | | |
(for a share outstanding throughout the year) | | | | | | | | | | | | | | | | | | | | |
Net asset value, beginning of year | | $ | 12.78 | | | $ | 12.05 | | | $ | 10.29 | | | $ | 9.82 | | | $ | 10.14 | |
| | |
|
|
|
Income from investment operations: | | | | | | | | | | | | | | | | | | | | |
Net investment incomea | | | 0.61 | | | | 0.63 | | | | 0.62 | | | | 0.70 | | | | 0.45f | |
Net realized and unrealized gains (losses) | | | (0.44 | ) | | | 0.51 | | | | 1.43 | | | | (0.23 | ) | | | (0.31 | )f |
| | |
|
|
|
Total from investment operations | | | 0.17 | | | | 1.14 | | | | 2.05 | | | | 0.47 | | | | 0.14 | |
| | |
|
|
|
Less distributions from: | | | | | | | | | | | | | | | | | | | | |
Net investment income | | | (0.58 | ) | | | (0.39 | ) | | | (0.29 | ) | | | — | d | | | (0.46 | ) |
Net realized gains | | | (0.10 | ) | | | (0.02 | ) | | | — | | | | — | | | | — | |
| | |
|
|
|
Total distributions | | | (0.68 | ) | | | (0.41 | ) | | | (0.29 | ) | | | — | | | | (0.46 | ) |
| | |
|
|
|
Net asset value, end of year | | $ | 12.27 | | | $ | 12.78 | | | $ | 12.05 | | | $ | 10.29 | | | $ | 9.82 | |
| | |
|
|
|
| | | | | |
Total returnb | | | 1.46% | | | | 9.80% | | | | 20.10% | | | | 4.81% | | | | 1.38% | |
Ratios/supplemental data | | | | | | | | | | | | | | | | | | | | |
Net assets, end of year (000’s) | | $ | 19,514 | | | $ | 4,657 | | | $ | 1,841 | | | $ | 210 | | | $ | 48 | |
Ratios to average net assets: | | | | | | | | | | | | | | | | | | | | |
Expenses | | | 0.91% | | | | 0.91% | | | | 0.90% | | | | 0.91% | | | | 0.96% | g |
Net investment income | | | 4.96% | | | | 5.20% | | | | 5.44% | | | | 7.12% | | | | 7.05% | g,f |
Portfolio turnover rate | | | 40.56% | | | | 50.21% | | | | 49.87% | | | | 45.78% | | | | 35.21% | |
Portfolio turnover rate excluding mortgage dollar rollsc | | | 40.07% | | | | 38.39% | | | | 32.74% | | | | 40.50% | | | | 30.32% | |
aBased on average daily shares outstanding.
bTotal return does not include any fees, charges or expenses imposed by the variable annuity and life insurance contracts for which the Franklin Templeton Variable Insurance Products Trust serves as an underlying investment vehicle. Total return is not annualized for periods less than one year.
cSee Note 1(e) regarding mortgage dollar rolls.
dIncludes distributions of net investment income in the amount of $.003.
eFor the period May 15, 2001 (effective date) to December 31, 2001.
fEffective January1, 2001, the Fund adopted the provisions of the AICPA Audit and Accounting Guide for Investment Companies and began recording all paydown gains and losses as part of investment income and amortizing all premium and discount on fixed-income securities, as required. The effect of this change was as follows:
| | |
Net investment income per share | | $(0.018) |
Net realized and unrealized losses per share | | 0.018 |
Ratio of net investment income to average net assets | | (0.18)% |
gAnnualized.
See notes to financial statements.
FSI-10
Franklin Templeton Variable Insurance Products Trust
Statement of Investments, December 31, 2005
| | | | | | | |
| Franklin Strategic Income Securities Fund | | Country | | Shares | | Value |
Long Term Investments 96.7% | | | | | | | |
Convertible Preferred Stocks 0.9% | | | | | | | |
Finance 0.2% | | | | | | | |
Fannie Mae, 5.375%, cvt. pfd. | | United States | | 16 | | $ | 1,474,252 |
| | | | | | |
|
|
Health Technology 0.3% | | | | | | | |
Schering-Plough Corp., 6.00%, cvt. pfd. | | United States | | 44,500 | | | 2,393,655 |
| | | | | | |
|
|
Industrial Services 0.2% | | | | | | | |
Allied Waste Industries Inc., 6.25%, cvt. pfd., D | | United States | | 5,700 | | | 1,493,018 |
| | | | | | |
|
|
Process Industries 0.2% | | | | | | | |
Huntsman Corp., 5.00%, cvt. pfd. | | United States | | 36,900 | | | 1,489,838 |
| | | | | | |
|
|
Total Convertible Preferred Stocks (Cost $7,303,193) | | | | | | | 6,850,763 |
| | | | | | |
|
|
| | | |
| | | | | Principal
Amountd
| | |
a,bSenior Floating Rate Interests 7.6% | | | | | | | |
Communications 0.8% | | | | | | | |
Alaska Communications Systems Holdings Inc., | | | | | | | |
Incremental Term Loan, 6.53%, 2/01/12 | | United States | | 265,600 | | | 268,588 |
cTerm Loan, 6.53%, 2/01/12 | | United States | | 2,924,400 | | | 2,957,300 |
Hawaiian Telecom Communications Inc., Term Loan B, 6.78%, 10/31/12 | | United States | | 2,639,000 | | | 2,657,143 |
| | | | | | |
|
|
| | | | | | | | 5,883,031 |
| | | | | | |
|
|
Consumer Durables 0.6% | | | | | | | |
Sealy Mattress Co., Term Loan D, 6.12-6.16%, 4/06/12 | | United States | | 2,177,029 | | | 2,203,221 |
Stile Acquisition Corp. (Masonite), CAD Term Loan, 6.21-6.53%, 4/05/13 | | Canada | | 1,309,882 | | | 1,298,353 |
Stile U.S. Acquisition Corp. (Masonite), U.S. Term Loan, 6.21-6.53%, 4/05/13 | | United States | | 1,312,113 | | | 1,300,564 |
| | | | | | |
|
|
| | | | | | | | 4,802,138 |
| | | | | | |
|
|
Consumer Non-Durables 0.9% | | | | | | | |
Constellation Brands Inc., Term Loan B, 5.44-5.75%, 12/22/11 | | United States | | 2,167,517 | | | 2,193,935 |
Eastman Kodak Co., Term Loan B, 6.42-6.75%, 10/18/12 | | United States | | 2,248,235 | | | 2,254,011 |
cJarden Corp., Term Loan B2, 6.28%, 7/20/12 | | United States | | 2,493,279 | | | 2,502,628 |
| | | | | | |
|
|
| | | | | | | | 6,950,574 |
| | | | | | |
|
|
Consumer Services 1.9% | | | | | | | |
Hertz Corp., | | | | | | | |
cD Credit Link, 4.50%, 12/21/12 | | United States | | 277,778 | | | 281,576 |
cTerm Loan B, 8.50%, 12/21/12 | | United States | | 1,896,667 | | | 1,922,598 |
Mission Broadcasting Inc., Term Loan B, 6.28%, 10/01/12 | | United States | | 1,164,630 | | | 1,172,880 |
Nexstar Broadcasting Inc., Term Loan B, 6.28%, 10/01/12 | | United States | | 1,185,536 | | | 1,193,933 |
Penn National Gaming Inc., Term Loan B, 6.28%, 10/03/12 | | United States | | 1,902,574 | | | 1,927,694 |
R.H. Donnelley Inc., | | | | | | | |
Term Loan A3, 6.12-6.28%, 12/31/09 | | United States | | 123,478 | | | 124,053 |
Term Loan D, 5.81-6.28%, 6/30/11 | | United States | | 2,784,028 | | | 2,800,760 |
Regal Cinemas Inc., Term Loan B, 6.53%, 11/10/10 | | United States | | 2,266,070 | | | 2,294,081 |
UPC Financing Partnership, Term Loan H2, 6.80%, 9/30/12 | | Netherlands | | 2,570,000 | | | 2,596,389 |
| | | | | | |
|
|
| | | | | | | | 14,313,964 |
| | | | | | |
|
|
Energy Minerals 0.3% | | | | | | | |
Citgo Petroleum Corp., Term Loan B, 5.68%, 11/15/12 | | United States | | 2,273,000 | | | 2,292,180 |
| | | | | | |
|
|
Finance 1.2% | | | | | | | |
cCapital Automotive., Term Loan B, 6.50%, 12/05/10 | | United States | | 2,869,000 | | | 2,882,450 |
Fidelity National Information Services Inc., Term Loan B, 6.11%, 3/09/13 | | United States | | 3,075,572 | | | 3,091,463 |
Lion Gables Realty LP, Term Loan B, 6.09-6.15%, 9/30/06 | | United States | | 324,329 | | | 326,052 |
Nasdaq Stock Market Inc., Term Loan B, 6.00-6.19%, 12/08/11 | | United States | | 2,637,000 | | | 2,658,151 |
| | | | | | |
|
|
| | | | | | | | 8,958,116 |
| | | | | | |
|
|
FSI-11
Franklin Templeton Variable Insurance Products Trust
Statement of Investments, December 31, 2005 (continued)
| | | | | | | |
| Franklin Strategic Income Securities Fund | | Country | | Principal
Amountd | | Value |
Long Term Investments (cont.) | | | | | | | |
a,bSenior Floating Rate Interests (cont.) | | | | | | | |
Health Services 0.4% | | | | | | | |
cLifePoint Hospitals Inc., Term Loan B, 6.19%, 4/15/12 | | United States | | 2,774,589 | | $ | 2,794,241 |
| | | | | | |
|
|
Industrial Services 0.1% | | | | | | | |
Epco Holdings Inc., Term Loan B, 6.42-6.64%, 8/18/10 | | United States | | 690,030 | | | 700,542 |
| | | | | | |
|
|
Process Industries 0.3% | | | | | | | |
Brenntag, | | | | | | | |
cTerm Loan B2, 6.50%, 12/22/13 | | Germany | | 275,639 | | | 279,372 |
cTerm Loan B3, 6.50%, 12/22/12 | | Germany | | 67,361 | | | 68,273 |
Hexion Specialty Chemicals Inc., | | | | | | | |
Tranche B-1, 6.88%, 5/31/12 | | United States | | 764,172 | | | 773,143 |
Tranche B-3 CL, 3.76%, 5/31/12 | | United States | | 187,747 | | | 189,951 |
Resolution Europe BV (Hexion), Tranche B-2, 7.06%, 5/31/12 | | Netherlands | | 1,052,641 | | | 1,064,999 |
| | | | | | |
|
|
| | | | | | | | 2,375,738 |
| | | | | | |
|
|
Real Estate Development 0.3% | | | | | | | |
Macerich Co., | | | | | | | |
Interim Loan Facility, 6.04%, 3/31/06 | | United States | | 685,662 | | | 686,518 |
Term Loan B, 5.81%, 4/25/10 | | United States | | 1,842,000 | | | 1,853,896 |
| | | | | | |
|
|
| | | | | | | | 2,540,414 |
| | | | | | |
|
|
Retail Trade 0.5% | | | | | | | |
The Jean Coutu Group (PJC) Inc., Term Loan B, 6.50%, 7/30/11 | | Canada | | 2,143,237 | | | 2,166,307 |
Neiman Marcus Group Inc., Term Loan, 6.95%, 4/06/13 | | United States | | 730,000 | | | 736,704 |
The William Carter Co., Term Loan B, 5.65-5.81%, 7/14/12 | | United States | | 1,074,478 | | | 1,087,014 |
| | | | | | |
|
|
| | | | | | | | 3,990,025 |
| | | | | | |
|
|
Technology Services 0.3% | | | | | | | |
Sungard Data Systems Inc., Term Loan, 6.81%, 2/11/13 | | United States | | 2,221,835 | | | 2,248,681 |
| | | | | | |
|
|
Total Senior Floating Rate Interests (Cost $57,717,333) | | | | | | | 57,849,644 |
| | | | | | |
|
|
Bonds 38.6% | | | | | | | |
Commercial Services 1.6% | | | | | | | |
Dex Media East LLC, senior sub. note, B, 12.125%, 11/15/12 | | United States | | 668,000 | | | 784,900 |
Dex Media West LLC, senior sub. note, 9.875%, 8/15/13 | | United States | | 2,200,000 | | | 2,453,000 |
JohnsonDiversey Holdings Inc., senior disc. note, zero cpn. to 5/17/07,
10.67% thereafter, 5/15/13 | | United States | | 1,200,000 | | | 960,000 |
JohnsonDiversey Inc., senior sub. note, B, 9.625%, 5/15/12 | | United States | | 1,900,000 | | | 1,919,000 |
Lamar Media Corp., senior sub. note, 7.25%, 1/01/13 | | United States | | 2,900,000 | | | 3,023,250 |
R. R. Donnelley & Sons Co., 5.50%, 5/15/15 | | United States | | 2,900,000 | | | 2,796,050 |
| | | | | | |
|
|
| | | | | | | | 11,936,200 |
| | | | | | |
|
|
Communications 4.3% | | | | | | | |
Dobson Cellular Systems Inc., senior secured note, 9.875%, 11/01/12 | | United States | | 2,800,000 | | | 3,101,000 |
Inmarsat Finance PLC, senior note, | | | | | | | |
7.625%, 6/30/12 | | United Kingdom | | 1,610,000 | | | 1,668,362 |
zero cpn. to 11/15/08, 10.375% thereafter, 11/15/12 | | United Kingdom | | 600,000 | | | 503,250 |
eIntelsat Bermuda Ltd., senior note, 144A, 8.25%, 1/15/13 | | Bermuda | | 3,400,000 | | | 3,451,000 |
MCI Inc., senior note, | | | | | | | |
7.688%, 5/01/09 | | United States | | 1,900,000 | | | 1,966,500 |
8.735%, 5/01/14 | | United States | | 712,000 | | | 789,430 |
Millicom International Cellular SA, senior note, 10.00%, 12/01/13 | | Luxembourg | | 3,100,000 | | | 3,216,250 |
Nextel Communications Inc., senior note, D, 7.375%, 8/01/15 | | United States | | 2,500,000 | | | 2,640,355 |
FSI-12
Franklin Templeton Variable Insurance Products Trust
Statement of Investments, December 31, 2005 (continued)
| | | | | | | | |
| Franklin Strategic Income Securities Fund | | Country | | Principal
Amountd | | | Value |
Long Term Investments (cont.) | | | | | | | | |
Bonds (cont.) | | | | | | | | |
Communications (cont.) | | | | | | | | |
Qwest Communications International Inc., senior note, | | | | | | | | |
7.50%, 2/15/14 | | United States | | 3,300,000 | | | $ | 3,407,250 |
e144A, 7.50%, 2/15/14 | | United States | | 200,000 | | | | 206,500 |
Rogers Wireless Inc., senior secured note, 7.25%, 12/15/12 | | Canada | | 3,400,000 | | | | 3,591,250 |
Time Warner Telecom Holdings Inc., senior note, 9.25%, 2/15/14 | | United States | | 1,700,000 | | | | 1,802,000 |
Verizon New York Inc., | | | | | | | | |
7.375%, 4/01/32 | | United States | | 400,000 | | | | 421,775 |
senior deb., A, 6.875%, 4/01/12 | | United States | | 3,200,000 | | | | 3,339,994 |
eWind Acquisition Fin SA, senior note, 144A, 10.75%, 12/01/15 | | Italy | | 2,500,000 | | | | 2,593,750 |
| | | | | | | |
|
|
| | | | | | | | | 32,698,666 |
| | | | | | | |
|
|
Consumer Durables 1.6% | | | | | | | | |
D.R. Horton Inc., senior note, 8.50%, 4/15/12 | | United States | | 3,500,000 | | | | 3,756,928 |
General Motors Acceptance Corp., | | | | | | | | |
7.25%, 3/02/11 | | United States | | 2,500,000 | | | | 2,300,240 |
6.875%, 8/28/12 | | United States | | 1,300,000 | | | | 1,173,242 |
General Motors Corp., senior deb., 8.25%, 7/15/23 | | United States | | 1,200,000 | | | | 777,000 |
Simmons Co., senior sub. note, 7.875%, 1/15/14 | | United States | | 2,200,000 | | | | 2,046,000 |
William Lyon Homes Inc., senior note, 7.625%, 12/15/12 | | United States | | 2,600,000 | | | | 2,307,500 |
| | | | | | | |
|
|
| | | | | | | | | 12,360,910 |
| | | | | | | |
|
|
Consumer Non-Durables 1.2% | | | | | | | | |
Smithfield Foods Inc., senior note, | | | | | | | | |
7.00%, 8/01/11 | | United States | | 1,900,000 | | | | 1,947,500 |
7.75%, 5/15/13 | | United States | | 1,500,000 | | | | 1,593,750 |
Spectrum Brands Inc., senior sub. note, 7.375%, 2/01/15 | | United States | | 3,500,000 | | | | 2,940,000 |
Tyson Foods Inc., senior note, 8.25%, 10/01/11 | | United States | | 2,200,000 | | | | 2,486,807 |
| | | | | | | |
|
|
| | | | | | | | | 8,968,057 |
| | | | | | | |
|
|
Consumer Services 8.9% | | | | | | | | |
fAdelphia Communications Corp., senior note, 10.875%, 10/01/10 | | United States | | 2,200,000 | | | | 1,243,000 |
Advanstar Communications Inc., senior secured note, 10.75%, 8/15/10 | | United States | | 1,900,000 | | | | 2,092,375 |
AMC Entertainment Inc., senior sub. note, 9.875%, 2/01/12 | | United States | | 2,800,000 | | | | 2,758,000 |
Boyd Gaming Corp., senior sub. note, 6.75%, 4/15/14 | | United States | | 2,500,000 | | | | 2,493,750 |
Cablevision Systems Corp., senior note, B, 8.00%, 4/15/12 | | United States | | 1,500,000 | | | | 1,410,000 |
eCCH I Holdings LLC, senior note, 144A, 9.92%, 4/01/14 | | United States | | 400,000 | | | | 230,000 |
eCCH I LLC, senior secured note, 144A, 11.00%, 10/01/15 | | United States | | 400,000 | | | | 338,000 |
CCH II LLC, senior note, 10.25%, 9/15/10 | | United States | | 3,100,000 | | | | 3,100,000 |
Clear Channel Communications Inc., senior note, 5.75%, 1/15/13 | | United States | | 3,500,000 | | | | 3,436,416 |
Comcast Corp., 5.65%, 6/15/35 | | United States | | 3,400,000 | | | | 3,139,172 |
CSC Holdings Inc., senior deb., 7.625%, 7/15/18 | | United States | | 2,100,000 | | | | 2,005,500 |
DIRECTV Holdings LLC, senior note, | | | | | | | | |
8.375%, 3/15/13 | | United States | | 1,400,000 | | | | 1,512,000 |
6.375%, 6/15/15 | | United States | | 1,000,000 | | | | 982,500 |
EchoStar DBS Corp., senior note, 6.375%, 10/01/11 | | United States | | 3,400,000 | | | | 3,289,500 |
Emmis Operating Co., senior sub. note, 6.875%, 5/15/12 | | United States | | 2,800,000 | | | | 2,796,500 |
Harrah’s Operating Co. Inc., senior note, 5.50%, 7/01/10 | | United States | | 3,300,000 | | | | 3,301,921 |
eHertz Corp., senior note, 144A, 8.875%, 1/01/14 | | United States | | 2,100,000 | | | | 2,149,875 |
Interactive Corp., 7.00%, 1/15/13 | | United States | | 2,600,000 | | | | 2,678,780 |
Liberty Media Corp., senior note, 5.70%, 5/15/13 | | United States | | 3,400,000 | | | | 3,184,987 |
eLighthouse International Co. SA, senior note, 144A, 8.00%, 4/30/14 | | Italy | | 2,600,000 | EUR | | | 3,274,233 |
LIN Television Corp., senior sub. note, 6.50%, 5/15/13 | | United States | | 3,200,000 | | | | 3,084,000 |
MGM MIRAGE Inc., senior note, 6.625%, 7/15/15 | | United States | | 3,600,000 | | | | 3,609,000 |
News America Inc., 5.30%, 12/15/14 | | United States | | 3,300,000 | | | | 3,281,048 |
FSI-13
Franklin Templeton Variable Insurance Products Trust
Statement of Investments, December 31, 2005 (continued)
| | | | | | | |
| Franklin Strategic Income Securities Fund | | Country | | Principal
Amountd | | Value |
Long Term Investments (cont.) | | | | | | | |
Bonds (cont.) | | | | | | | |
Consumer Services (cont.) | | | | | | | |
Pinnacle Entertainment Inc., senior sub. note, 8.75%, 10/01/13 | | United States | | 2,900,000 | | $ | 3,103,000 |
Quebecor Media Inc., senior disc. note, zero cpn. to 7/15/06, 13.75% thereafter, 7/15/11 | | Canada | | 1,800,000 | | | 1,869,750 |
Royal Caribbean Cruises Ltd., senior deb., 7.25%, 3/15/18 | | United States | | 3,400,000 | | | 3,633,750 |
Station Casinos Inc., | | | | | | | |
senior note, 6.00%, 4/01/12 | | United States | | 800,000 | | | 802,000 |
senior sub. note, 6.50%, 2/01/14 | | United States | | 700,000 | | | 710,500 |
senior sub. note, 6.875%, 3/01/16 | | United States | | 1,800,000 | | | 1,849,500 |
| | | | | | |
|
|
| | | | | | | | 67,359,057 |
| | | | | | |
|
|
Electronic Technology 1.4% | | | | | | | |
Flextronics International Ltd., senior sub. note, | | | | | | | |
6.50%, 5/15/13 | | Singapore | | 600,000 | | | 612,750 |
6.25%, 11/15/14 | | Singapore | | 2,200,000 | | | 2,180,750 |
L-3 Communications Corp., senior sub. note, | | | | | | | |
5.875%, 1/15/15 | | United States | | 3,100,000 | | | 3,022,500 |
e144A, 6.375%, 10/15/15 | | United States | | 400,000 | | | 401,000 |
Sanmina-SCI Corp., senior sub. note, 6.75%, 3/01/13 | | United States | | 2,200,000 | | | 2,103,750 |
Xerox Corp., senior note, 7.125%, 6/15/10 | | United States | | 2,200,000 | | | 2,301,750 |
| | | | | | |
|
|
| | | | | | | | 10,622,500 |
| | | | | | |
|
|
Energy Minerals 2.4% | | | | | | | |
Chesapeake Energy Corp., senior note, 6.25%, 1/15/18 | | United States | | 3,500,000 | | | 3,447,500 |
Kerr-McGee Corp., 6.95%, 7/01/24 | | United States | | 2,500,000 | | | 2,664,205 |
eMarkwest Energy Partners LP, senior note, 144A, 6.875%, 11/01/14 | | United States | | 2,600,000 | | | 2,405,000 |
eMassey Energy Co., senior note, 144A, 6.875%, 12/15/13 | | United States | | 1,400,000 | | | 1,419,250 |
Peabody Energy Corp., senior note, B, 6.875%, 3/15/13 | | United States | | 2,200,000 | | | 2,299,000 |
Plains Exploration & Production Co., senior note, 7.125%, 6/15/14 | | United States | | 3,100,000 | | | 3,224,000 |
ePogo Producing Co., senior sub. note, 144A, 6.875%, 10/01/17 | | United States | | 2,500,000 | | | 2,450,000 |
| | | | | | |
|
|
| | | | | | | | 17,908,955 |
| | | | | | |
|
|
Finance 0.7% | | | | | | | |
JPMorgan Chase & Co., sub. note, 5.75%, 1/02/13 | | United States | | 2,800,000 | | | 2,891,734 |
Lazard Group LLC, 7.125%, 5/15/15 | | United States | | 2,300,000 | | | 2,419,340 |
| | | | | | |
|
|
| | | | | | | | 5,311,074 |
| | | | | | |
|
|
Health Services 2.1% | | | | | | | |
DaVita Inc., senior sub. note, 7.25%, 3/15/15 | | United States | | 3,200,000 | | | 3,256,000 |
Fresenius Medical Care Capital Trust II, 7.875%, 2/01/08 | | Germany | | 3,000,000 | | | 3,105,000 |
HCA Inc., senior note, 8.75%, 9/01/10 | | United States | | 2,200,000 | | | 2,444,193 |
Tenet Healthcare Corp., senior note, 6.375%, 12/01/11 | | United States | | 3,100,000 | | | 2,844,250 |
United Surgical Partners International Inc., senior sub. note, 10.00%, 12/15/11 | | United States | | 1,800,000 | | | 1,948,500 |
Vanguard Health Holding Co. II LLC, senior sub. note, 9.00%, 10/01/14 | | United States | | 2,500,000 | | | 2,668,750 |
| | | | | | |
|
|
| | | | | | | | 16,266,693 |
| | | | | | |
|
|
Industrial Services 0.9% | | | | | | | |
Allied Waste North America Inc., senior secured note, | | | | | | | |
6.50%, 11/15/10 | | United States | | 1,700,000 | | | 1,691,500 |
B, 5.75%, 2/15/11 | | United States | | 800,000 | | | 762,000 |
eGrant Prideco Inc., senior note, 144A, 6.125%, 8/15/15 | | United States | | 2,200,000 | | | 2,205,500 |
Hanover Equipment Trust 01, senior secured note, B, 8.75%, 9/01/11 | | United States | | 2,000,000 | | | 2,125,000 |
| | | | | | |
|
|
| | | | | | | | 6,784,000 |
| | | | | | |
|
|
FSI-14
s
Franklin Templeton Variable Insurance Products Trust
Statement of Investments, December 31, 2005 (continued)
| | | | | | | |
| Franklin Strategic Income Securities Fund | | Country | | Principal
Amountd | | Value |
Long Term Investments (cont.) | | | | | | | |
Bonds (cont.) | | | | | | | |
Non-Energy Minerals 0.7% | | | | | | | |
eGlencore Funding LLC, 144A, 6.00%, 4/15/14 | | Switzerland | | 2,200,000 | | $ | 2,072,488 |
eNovelis Inc., senior note, 144A, 7.25%, 2/15/15 | | Canada | | 3,300,000 | | | 3,093,750 |
| | | | | | |
|
|
| | | | | | | | 5,166,238 |
| | | | | | |
|
|
Process Industries 4.0% | | | | | | | |
Abitibi-Consolidated Co. of Canada, senior note, 8.375%, 4/01/15 | | Canada | | 3,100,000 | | | 2,983,750 |
BCP Crystal Holdings Corp., senior sub. note, 9.625%, 6/15/14 | | United States | | 3,300,000 | | | 3,687,750 |
Bunge Ltd. Finance Corp., senior note, 5.10%, 7/15/15 | | United States | | 2,800,000 | | | 2,714,096 |
eCrown Americas Inc., senior note, 144A, 7.75%, 11/15/15 | | United States | | 3,300,000 | | | 3,432,000 |
Graphic Packaging International Corp., senior note, 8.50%, 8/15/11 | | United States | | 800,000 | | | 806,000 |
JSG Funding PLC, senior sub. note, 7.75%, 4/01/15 | | Ireland | | 2,900,000 | | | 2,421,500 |
Nalco Co., senior sub. note, 8.875%, 11/15/13 | | United States | | 3,300,000 | | | 3,473,250 |
Owens-Brockway Glass Container Inc., senior note, 6.75%, 12/01/14 | | United States | | 3,300,000 | | | 3,217,500 |
Rhodia SA, senior note, 10.25%, 6/01/10 | | France | | 3,200,000 | | | 3,520,000 |
eRPM U.K. G.P., 144A, 6.70%, 11/01/15 | | United States | | 2,800,000 | | | 2,875,547 |
Stone Container Corp., senior note, 8.375%, 7/01/12 | | United States | | 1,600,000 | | | 1,556,000 |
| | | | | | |
|
|
| | | | | | | | 30,687,393 |
| | | | | | |
|
|
Producer Manufacturing 2.8% | | | | | | | |
Case New Holland Inc., senior note, 9.25%, 8/01/11 | | United States | | 3,400,000 | | | 3,655,000 |
eCommercial Vehicle Group Inc., senior note, 144A, 8.00%, 7/01/13 | | United States | | 2,500,000 | | | 2,481,250 |
Fimep SA, senior note, 10.50%, 2/15/13 | | France | | 2,600,000 | | | 2,951,000 |
eInvensys PLC, senior note, 144A, 9.875%, 3/15/11 | | United Kingdom | | 2,600,000 | | | 2,587,000 |
Milacron Escrow Corp., senior secured note, 11.50%, 5/15/11 | | United States | | 1,300,000 | | | 1,118,000 |
eNell AF Sarl, senior note, 144A, 8.375%, 8/15/15 | | Luxembourg | | 2,800,000 | | | 2,786,000 |
Nortek Inc., senior sub. note, 8.50%, 9/01/14 | | United States | | 2,800,000 | | | 2,716,000 |
TRW Automotive Inc., senior note, 9.375%, 2/15/13 | | United States | | 3,000,000 | | | 3,262,500 |
| | | | | | |
|
|
| | | | | | | | 21,556,750 |
| | | | | | |
|
|
Real Estate Development 0.7% | | | | | | | |
EOP Operating LP, 4.75%, 3/15/14 | | United States | | 2,800,000 | | | 2,650,376 |
Forest City Enterprises Inc., senior note, 7.625%, 6/01/15 | | United States | | 2,500,000 | | | 2,662,500 |
| | | | | | |
|
|
| | | | | | | | 5,312,876 |
| | | | | | |
|
|
Real Estate Investment Trusts 0.5% | | | | | | | |
Host Marriott LP, senior note, | | | | | | | |
K, 7.125%, 11/01/13 | | United States | | 2,200,000 | | | 2,299,000 |
M, 7.00%, 8/15/12 | | United States | | 1,200,000 | | | 1,236,000 |
| | | | | | |
|
|
| | | | | | | | 3,535,000 |
| | | | | | |
|
|
Retail Trade 0.7% | | | | | | | |
eGSC Holdings Corp., senior note, 144A, 8.00%, 10/01/12 | | United States | | 2,700,000 | | | 2,551,500 |
Rite Aid Corp., senior note, 9.25%, 6/01/13 | | United States | | 2,800,000 | | | 2,628,500 |
| | | | | | |
|
|
| | | | | | | | 5,180,000 |
| | | | | | |
|
|
Technology Services 0.7% | | | | | | | |
eSunGard Data Systems Inc., | | | | | | | |
senior note, 144A, 9.125%, 8/15/13 | | United States | | 1,600,000 | | | 1,664,000 |
senior sub. note, 144A, 10.25%, 8/15/15 | | United States | | 1,500,000 | | | 1,507,500 |
UGS Corp., senior sub. note, 10.00%, 6/01/12 | | United States | | 2,200,000 | | | 2,409,000 |
| | | | | | |
|
|
| | | | | | | | 5,580,500 |
| | | | | | |
|
|
FSI-15
Franklin Templeton Variable Insurance Products Trust
Statement of Investments, December 31, 2005 (continued)
| | | | | | | |
| Franklin Strategic Income Securities Fund | | Country | | Principal
Amountd | | Value |
Long Term Investments (cont.) | | | | | | | |
Bonds (cont.) | | | | | | | |
Utilities 3.4% | | | | | | | |
eAllegheny Energy Supply Co. LLC, 144A, 8.25%, 4/15/12 | | United States | | 2,300,000 | | $ | 2,604,750 |
Aquila Inc., senior note, 9.95%, 2/01/11 | | United States | | 2,300,000 | | | 2,547,250 |
e,f,gCalpine Corp., senior secured note, 144A, 8.50%, 7/15/10 | | United States | | 2,800,000 | | | 2,310,000 |
eDynegy Holdings Inc., senior secured note, 144A, 10.125%, 7/15/13 | | United States | | 2,800,000 | | | 3,178,000 |
El Paso Corp., senior note, 7.875%, 6/15/12 | | United States | | 1,900,000 | | | 1,966,500 |
El Paso Natural Gas Co., senior note, A, 7.625%, 8/01/10 | | United States | | 2,500,000 | | | 2,641,448 |
Midwest Generation LLC, senior secured note, 8.75%, 5/01/34 | | United States | | 2,200,000 | | | 2,433,750 |
eMirant North America LLC, senior note, 144A, 7.375%, 12/31/13 | | United States | | 1,200,000 | | | 1,219,500 |
eTexas Genco LLC, senior note, 144A, 6.875%, 12/15/14 | | United States | | 3,200,000 | | | 3,480,000 |
TXU Corp., senior note, 5.55%, 11/15/14 | | United States | | 3,400,000 | | | 3,246,442 |
| | | | | | |
|
|
| | | | | | | | 25,627,640 |
| | | | | | |
|
|
Total Bonds (Cost $291,858,503) | | | | | | | 292,862,509 |
| | | | | | |
|
|
Convertible Bonds 0.4% | | | | | | | |
Electronic Technology 0.4% | | | | | | | |
Fairchild Semiconductor Corp., cvt., 5.00%, 11/01/08 | | United States | | 1,300,000 | | | 1,274,000 |
Liberty Media Corp. into Motorola, cvt., senior deb., 3.50%, 1/15/31 | | United States | | 1,800,000 | | | 1,849,500 |
| | | | | | |
|
|
Total Convertible Bonds (Cost $2,641,673) | | | | | | | 3,123,500 |
| | | | | | |
|
|
Asset-Backed Securities and Commercial Mortgage-Backed Securities 2.5% | | | | | |
Finance 2.5% | | | | | | | |
Countrywide Asset-Backed Certificates, | | | | | | | |
2004-7, AF4, 4.774%, 8/25/32 | | United States | | 440,000 | | | 437,286 |
2005-11, AF4, 5.21%, 3/25/34 | | United States | | 1,275,000 | | | 1,255,981 |
2005-12, 2A5, 5.245%, 2/25/36 | | United States | | 2,750,000 | | | 2,699,744 |
GE Capital Commercial Mortgage Corp., 2003-CI, A4, 4.819%, 1/10/38 | | United States | | 934,225 | | | 917,926 |
JP Morgan Chase Commercial Mortgage Sec Corp., | | | | | | | |
2004-CB9, A4, 5.38%, 6/12/41 | | United States | | 5,096,445 | | | 5,222,577 |
2004-LN2, A2, 5.115%, 7/15/41 | | United States | | 412,616 | | | 410,765 |
eKeystone Owner Trust, 1997-P3, M2, 144A, 7.98%, 12/25/24 | | United States | | 41,890 | | | 41,759 |
eMorgan Stanley Auto Loan Trust, 2003-HB1, D, 144A, 5.50%, 4/15/11 | | United States | | 144,230 | | | 143,504 |
cMorgan Stanley Capital I, 2004-IQ7, A4, 5.43%, 6/15/38 | | United States | | 4,000,000 | | | 4,083,568 |
Popular ABS Mortgage Pass-Through Trust, 2005-3, AF6, 4.759%, 7/25/35 | | United States | | 1,000,000 | | | 971,088 |
Residential Asset Securities Corp., | | | | | | | |
2002-KS8, A4, 4.58%, 11/25/30 | | United States | | 529,124 | | | 526,555 |
2004-KS1, AI4, 4.213%, 4/25/32 | | United States | | 500,000 | | | 493,861 |
Residential Funding Mortgage Securities II, 2005-HI1, A4, 4.70%, 8/25/34 | | United States | | 1,000,000 | | | 978,517 |
Wells Fargo Home Equity Trust, 2004-2, AI5, 4.89%, 11/25/28 | | United States | | 1,070,000 | | | 1,055,873 |
| | | | | | |
|
|
Total Asset-Backed Securities and Commercial Mortgage-Backed Securities (Cost $19,610,785) | | | | | | | 19,239,004 |
| | | | | | |
|
|
Mortgage-Backed Securities 10.4% | | | | | | | |
bFederal Home Loan Mortgage Corp. (FHLMC) Adjustable Rate 0.1% | | | | | | | |
cFHLMC, 4.674%, 1/01/33 | | United States | | 451,551 | | | 450,389 |
| | | | | | |
|
|
Federal Home Loan Mortgage Corp. (FHLMC) Fixed Rate 4.1% | | | | | | | |
FHLMC Gold 15 Year, 4.50%, 10/01/18 - 9/01/19 | | United States | | 5,075,788 | | | 4,948,075 |
FHLMC Gold 15 Year, 5.00%, 12/01/17 - 9/01/19 | | United States | | 6,056,358 | | | 6,001,379 |
FHLMC Gold 15 Year, 5.50%, 7/01/17 - 7/01/19 | | United States | | 1,602,314 | | | 1,612,952 |
FHLMC Gold 15 Year, 6.00%, 5/01/17 | | United States | | 60,045 | | | 61,310 |
FHLMC Gold 15 Year, 6.50%, 5/01/16 | | United States | | 28,323 | | | 29,116 |
FHLMC Gold 30 Year, 5.00%, 4/01/34 - 8/01/35 | | United States | | 3,672,474 | | | 3,561,893 |
FHLMC Gold 30 Year, 5.50%, 3/01/33 - 10/01/35 | | United States | | 8,695,482 | | | 8,627,963 |
FSI-16
Franklin Templeton Variable Insurance Products Trust
Statement of Investments, December 31, 2005 (continued)
| | | | | | | |
| Franklin Strategic Income Securities Fund | | Country | | Principal
Amountd | | Value |
Long Term Investments (cont.) | | | | | | | |
Mortgage-Backed Securities (cont.) | | | | | | | |
Federal Home Loan Mortgage Corp. (FHLMC) Fixed Rate (cont.) | | | | | | | |
FHLMC Gold 30 Year, 6.00%, 4/01/33 - 8/01/34 | | United States | | 5,381,758 | | $ | 5,439,164 |
FHLMC Gold 30 Year, 6.50%, 12/01/23 - 7/01/32 | | United States | | 482,942 | | | 496,803 |
FHLMC Gold 30 Year, 7.00%, 9/01/21 - 6/01/32 | | United States | | 320,022 | | | 334,086 |
FHLMC Gold 30 Year, 7.50%, 3/01/30 - 7/01/31 | | United States | | 7,511 | | | 7,885 |
| | | | | | |
|
|
| | | | | | | | 31,120,626 |
| | | | | | |
|
|
bFederal National Mortgage Association (FNMA) Adjustable Rate 0.3% | | | | | | | |
FNMA, 4.494%, 4/01/20 | | United States | | 303,573 | | | 298,232 |
FNMA, 4.629%, 12/01/34 | | United States | | 1,885,902 | | | 1,862,425 |
| | | | | | |
|
|
| | | | | | | | 2,160,657 |
| | | | | | |
|
|
Federal National Mortgage Association (FNMA) Fixed Rate 4.7% | | | | | | | |
FNMA 15 Year, 4.50%, 6/01/19 - 3/01/20 | | United States | | 1,033,845 | | | 1,007,472 |
FNMA 15 Year, 5.00%, 10/01/17 - 6/01/18 | | United States | | 1,376,519 | | | 1,364,223 |
FNMA 15 Year, 5.50%, 10/01/16 - 1/01/18 | | United States | | 113,003 | | | 113,825 |
FNMA 15 Year, 6.00%, 4/01/16 - 7/01/16 | | United States | | 53,730 | | | 54,941 |
FNMA 15 Year, 7.00%, 5/01/12 | | United States | | 7,222 | | | 7,496 |
FNMA 30 Year, 5.00%, 4/01/34 - 10/01/35 | | United States | | 2,184,946 | | | 2,120,449 |
cFNMA 30 Year, 5.50%, 8/01/33 - 1/15/36 | | United States | | 21,528,973 | | | 21,334,437 |
cFNMA 30 Year, 6.00%, 1/01/29 - 10/01/34 | | United States | | 8,677,398 | | | 8,759,603 |
FNMA 30 Year, 6.50%, 6/01/28 - 9/01/32 | | United States | | 891,620 | | | 917,565 |
FNMA 30 Year, 7.00%, 2/01/29 - 1/01/32 | | United States | | 36,114 | | | 37,737 |
FNMA 30 Year, 7.50%, 9/01/31 | | United States | | 28,068 | | | 29,413 |
| | | | | | |
|
|
| | | | | | | | 35,747,161 |
| | | | | | |
|
|
Government National Mortgage Association (GNMA) Fixed Rate 1.2% | | | | | | | |
GNMA I SF 30 Year, 5.00%, 11/15/33 - 7/15/34 | | United States | | 2,776,859 | | | 2,744,717 |
GNMA I SF 30 Year, 5.50%, 12/15/32 - 9/15/34 | | United States | | 3,243,124 | | | 3,267,606 |
GNMA I SF 30 Year, 6.00%, 1/15/33 | | United States | | 287,441 | | | 294,740 |
GNMA I SF 30 Year, 6.50%, 11/15/31 - 2/15/32 | | United States | | 26,591 | | | 27,799 |
GNMA I SF 30 Year, 7.00%, 10/15/28 - 6/15/32 | | United States | | 183,677 | | | 193,052 |
GNMA I SF 30 Year, 7.50%, 9/15/30 | | United States | | 5,305 | | | 5,582 |
GNMA II SF 30 Year, 5.00%, 9/20/33 - 11/20/33 | | United States | | 735,243 | | | 723,872 |
GNMA II SF 30 Year, 6.00%, 11/20/34 | | United States | | 1,067,256 | | | 1,090,970 |
GNMA II SF 30 Year, 6.50%, 4/20/31 - 2/20/34 | | United States | | 510,210 | | | 529,286 |
GNMA II SF 30 Year, 7.00%, 2/20/33 | | United States | | 586,785 | | | 612,046 |
GNMA II SF 30 Year, 7.50%, 1/20/28 - 4/20/32 | | United States | | 128,860 | | | 134,947 |
| | | | | | |
|
|
| | | | | | | | 9,624,617 |
| | | | | | |
|
|
Total Mortgage-Backed Securities (Cost $80,116,560) | | | | | | | 79,103,450 |
| | | | | | |
|
|
U.S. Government and Agency Securities 7.7% | | | | | | | |
Government Bonds 7.7% | | | | | | | |
FHLMC, | | | | | | | |
2.375%, 4/15/06 | | United States | | 1,700,000 | | | 1,689,428 |
2.375%, 2/15/07 | | United States | | 300,000 | | | 292,332 |
4.375%, 7/17/15 | | United States | | 2,500,000 | | | 2,421,855 |
4.50%, 1/15/13 | | United States | | 580,000 | | | 570,571 |
4.875%, 11/15/13 | | United States | | 150,000 | | | 150,954 |
5.50%, 9/15/11 | | United States | | 300,000 | | | 310,896 |
7.00%, 3/15/10 | | United States | | 300,000 | | | 325,956 |
FSI-17
Franklin Templeton Variable Insurance Products Trust
Statement of Investments, December 31, 2005 (continued)
| | | | | | | | |
| Franklin Strategic Income Securities Fund | | Country | | Principal
Amountd | | | Value |
Long Term Investments (cont.) | | | | | | | | |
U.S. Government and Agency Securities (cont.) | | | | | | | | |
Government Bonds (cont.) | | | | | | | | |
FNMA, | | | | | | | | |
4.25%, 5/15/09 | | United States | | 260,000 | | | $ | 256,345 |
4.375%, 3/15/13 | | United States | | 3,100,000 | | | | 3,023,160 |
4.375%, 10/15/15 | | United States | | 1,000,000 | | | | 967,002 |
5.00%, 1/15/07 | | United States | | 900,000 | | | | 902,017 |
5.00%, 4/15/15 | | United States | | 250,000 | | | | 254,239 |
5.25%, 6/15/06 | | United States | | 900,000 | | | | 902,612 |
5.25%, 1/15/09 | | United States | | 250,000 | | | | 253,992 |
5.375%, 11/15/11 | | United States | | 1,200,000 | | | | 1,236,775 |
5.50%, 3/15/11 | | United States | | 150,000 | | | | 155,221 |
6.00%, 05/15/11 | | United States | | 500,000 | | | | 529,424 |
6.125%, 03/15/12 | | United States | | 900,000 | | | | 964,363 |
6.625%, 11/15/10 | | United States | | 350,000 | | | | 378,625 |
U.S. Treasury Bond, | | | | | | | | |
4.875%, 2/15/12 | | United States | | 2,000,000 | | | | 2,053,986 |
6.125%, 11/15/27 | | United States | | 150,000 | | | | 181,055 |
6.88%, 8/15/25 | | United States | | 2,290,000 | | | | 2,949,806 |
7.50%, 11/15/16 | | United States | | 4,200,000 | | | | 5,276,909 |
U.S. Treasury Note, | | | | | | | | |
2.00%, 5/15/06 | | United States | | 1,000,000 | | | | 991,876 |
3.00%, 12/31/06 | | United States | | 1,430,000 | | | | 1,410,282 |
3.00%, 11/15/07 | | United States | | 1,500,000 | | | | 1,463,086 |
3.125%, 5/15/07 | | United States | | 2,500,000 | | | | 2,457,520 |
3.125%, 9/15/08 | | United States | | 1,500,000 | | | | 1,452,598 |
3.25%, 1/15/09 | | United States | | 4,900,000 | | | | 4,745,919 |
3.375%, 10/15/09 | | United States | | 340,000 | | | | 328,432 |
3.50%, 12/15/09 | | United States | | 2,500,000 | | | | 2,422,950 |
4.00%, 4/15/10 | | United States | | 350,000 | | | | 345,024 |
4.00%, 11/15/12 | | United States | | 150,000 | | | | 146,819 |
4.00%, 2/15/15 | | United States | | 750,000 | | | | 727,383 |
4.125%, 8/15/10 | | United States | | 1,300,000 | | | | 1,287,610 |
4.125%, 5/15/15 | | United States | | 1,400,000 | | | | 1,369,759 |
4.25%, 8/15/13 | | United States | | 450,000 | | | | 446,116 |
4.25%, 11/15/13 | | United States | | 2,000,000 | | | | 1,981,564 |
4.25%, 8/15/14 | | United States | | 2,000,000 | | | | 1,978,752 |
4.25%, 11/15/14 | | United States | | 2,300,000 | | | | 2,273,946 |
4.375%, 8/15/12 | | United States | | 3,170,000 | | | | 3,170,621 |
4.75%, 5/15/14 | | United States | | 1,000,000 | | | | 1,024,649 |
5.00%, 8/15/11 | | United States | | 1,900,000 | | | | 1,961,676 |
5.625%, 5/15/08 | | United States | | 600,000 | | | | 616,547 |
| | | | | | | |
|
|
Total U.S. Government and Agency Securities (Cost $59,413,846) | | | | | | | | 58,650,652 |
| | | | | | | |
|
|
Foreign Government and Agency Securities 28.6% | | | | | | | | |
French Treasury Note, 3.00%, 7/12/08 | | France | | 1,000,000 | EUR | | | 1,186,928 |
b,hGovernment of Argentina, FRN, 4.005%, 8/03/12 | | Argentina | | 21,487,000 | | | | 16,581,269 |
Government of Austria, | | | | | | | | |
4.00%, 7/15/09 | | Austria | | 480,000 | EUR | | | 587,346 |
4.65%, 1/15/18 | | Austria | | 500,000 | EUR | | | 666,537 |
5.00%, 7/15/12 | | Austria | | 40,000 | EUR | | | 52,435 |
9.00%, 9/15/06 | | Austria | | 220,000,000 | ISK | | | 3,488,026 |
Government of Brazil, | | | | | | | | |
bFRN, 5.25%, 4/15/12 | | Brazil | | 3,674,480 | | | | 3,637,735 |
bRG, FRN, 5.25%, 4/15/12 | | Brazil | | 2,791,228 | | | | 2,763,316 |
8.00%, 1/15/18 | | Brazil | | 2,850,000 | | | | 3,078,000 |
FSI-18
Franklin Templeton Variable Insurance Products Trust
Statement of Investments, December 31, 2005 (continued)
| | | | | | | | |
| Franklin Strategic Income Securities Fund | | Country | | Principal
Amountd | | | Value |
Long Term Investments (cont.) | | | | | | | | |
Foreign Government and Agency Securities (cont.) | | | | | | | | |
Government of Canada, | | | | | | | | |
3.00%, 6/01/06 | | Canada | | 7,660,000 | CAD | | $ | 6,574,366 |
3.25%, 12/01/06 | | Canada | | 14,540,000 | CAD | | | 12,444,003 |
5.25%, 6/01/12 | | Canada | | 160,000 | CAD | | | 147,894 |
Government of Finland, | | | | | | | | |
5.00%, 7/04/07 | | Finland | | 610,000 | EUR | | | 745,618 |
5.75%, 2/23/11 | | Finland | | 50,000 | EUR | | | 66,618 |
Government of France, 4.00%, 10/25/09 | | France | | 943,000 | EUR | | | 1,157,165 |
Government of Germany, 3.75%, 1/04/09 | | Germany | | 1,070,000 | EUR | | | 1,295,791 |
Government of Indonesia, | | | | | | | | |
11.00%, 10/15/14 | | Indonesia | | 1,800,000,000 | IDR | | | 158,836 |
13.15%, 3/15/10 | | Indonesia | | 13,925,000,000 | IDR | | | 1,410,533 |
13.15%, 1/15/12 | | Indonesia | | 9,200,000,000 | IDR | | | 927,020 |
14.00%, 6/15/09 | | Indonesia | | 12,950,000,000 | IDR | | | 1,346,378 |
14.25%, 6/15/13 | | Indonesia | | 35,480,000,000 | IDR | | | 3,739,730 |
14.275%, 12/15/13 | | Indonesia | | 26,937,000,000 | IDR | | | 2,849,404 |
Government of Korea, | | | | | | | | |
3.75%, 9/10/07 | | South Korea | | 3,415,000,000 | KRW | | | 3,322,481 |
4.00%, 6/10/10 | | South Korea | | 6,600,000,000 | KRW | | | 6,222,106 |
4.50%, 9/09/08 | | South Korea | | 600,000,000 | KRW | | | 587,250 |
6.90%, 1/16/07 | | South Korea | | 2,040,000,000 | KRW | | | 2,069,184 |
Government of Malaysia, | | | | | | | | |
4.03%, 9/15/09 | | Malaysia | | 8,500,000 | MYR | | | 2,283,899 |
4.31%, 2/27/09 | | Malaysia | | 29,725,000 | MYR | | | 8,028,778 |
Government of Mexico, | | | | | | | | |
bFRN, 4.83%, 1/13/09 | | Mexico | | 1,480,000 | | | | 1,502,200 |
8.375%, 1/14/11 | | Mexico | | 1,825,000 | | | | 2,080,956 |
Government of the Netherlands, | | | | | | | | |
3.75%, 7/15/09 | | Netherlands | | 80,000 | EUR | | | 97,161 |
4.25%, 7/15/13 | | Netherlands | | 90,000 | EUR | | | 113,941 |
5.75%, 2/15/07 | | Netherlands | | 90,000 | EUR | | | 109,986 |
Government of New Zealand, | | | | | | | | |
6.00%, 11/15/11 | | New Zealand | | 1,600,000 | NZD | | | 1,105,055 |
6.50%, 4/15/13 | | New Zealand | | 2,960,000 | NZD | | | 2,117,573 |
Government of Norway, 6.75%, 1/15/07 | | Norway | | 87,125,000 | NOK | | | 13,418,381 |
Government of Peru, | | | | | | | | |
Series 7, 7.84%, 8/12/20 | | Peru | | 565,000 | PEN | | | 158,195 |
8.60%, 8/12/17 | | Peru | | 15,950,000 | PEN | | | 4,767,363 |
Government of the Philippines, | | | | | | | | |
8.875%, 3/17/15 | | Philippines | | 3,600,000 | | | | 3,980,340 |
9.00%, 2/15/13 | | Philippines | | 6,610,000 | | | | 7,345,362 |
9.875%, 3/16/10 | | Philippines | | 100,000 | | | | 112,500 |
Government of Poland, | | | | | | | | |
5.75%, 9/23/22 | | Poland | | 12,900,000 | PLN | | | 4,237,919 |
6.00%, 5/24/09 | | Poland | | 26,370,000 | PLN | | | 8,406,173 |
6.25%, 10/24/15 | | Poland | | 7,700,000 | PLN | | | 2,577,847 |
8.50%, 5/12/07 | | Poland | | 5,300,000 | PLN | | | 1,715,500 |
Government of Russia, Reg S, 5.00% to 3/31/07, 7.50% thereafter, 3/31/30 | | Russia | | 3,250,000 | | | | 3,676,985 |
Government of Singapore, | | | | | | | | |
1.75%, 2/01/07 | | Singapore | | 4,500,000 | SGD | | | 2,679,380 |
4.00%, 3/01/07 | | Singapore | | 14,150,000 | SGD | | | 8,669,369 |
4.80%, 4/14/09 | | Slovak Republic | | 28,700,000 | SKK | | | 935,588 |
4.90%, 2/11/14 | | Slovak Republic | | 7,300,000 | SKK | | | 248,560 |
FSI-19
Franklin Templeton Variable Insurance Products Trust
Statement of Investments, December 31, 2005 (continued)
| | | | | | | | |
| Franklin Strategic Income Securities Fund | | Country | | Principal
Amountd | | | Value |
Long Term Investments (cont.) | | | | | | | | |
Foreign Government and Agency Securities (cont.) | | | | | | | | |
5.30%, 5/12/19 | | Slovak Republic | | 42,200,000 | SKK | | $ | 1,515,297 |
7.50%, 3/13/12 | | Slovak Republic | | 59,000,000 | SKK | | | 2,247,883 |
iStrip, 1/14/07 | | Slovak Republic | | 177,800,000 | SKK | | | 5,381,338 |
Government of Spain, | | | | | | | | |
4.80%, 10/31/06 | | Spain | | 100,000 | EUR | | | 120,425 |
5.00%, 7/30/12 | | Spain | | 350,000 | EUR | | | 458,944 |
5.15%, 7/30/09 | | Spain | | 210,000 | EUR | | | 266,651 |
6.00%, 1/31/08 | | Spain | | 260,000 | EUR | | | 326,218 |
10.15%, 1/31/06 | | Spain | | 58,000 | EUR | | | 69,050 |
Government of Sweden, | | | | | | | | |
3.50%, 4/20/06 | | Sweden | | 11,250,000 | SEK | | | 1,422,834 |
5.00%, 1/28/09 | | Sweden | | 13,685,000 | SEK | | | 1,824,667 |
5.50%, 10/08/12 | | Sweden | | 17,490,000 | SEK | | | 2,500,395 |
6.50%, 5/05/08 | | Sweden | | 2,400,000 | SEK | | | 326,947 |
8.00%, 8/15/07 | | Sweden | | 45,300,000 | SEK | | | 6,186,524 |
iStrip, 9/20/06 | | Sweden | | 6,850,000 | SEK | | | 848,311 |
Government of Thailand, | | | | | | | | |
4.125%, 2/12/08 | | Thailand | | 17,000,000 | THB | | | 408,102 |
8.00%, 12/08/06 | | Thailand | | 146,050,000 | THB | | | 3,692,101 |
8.50%, 12/08/08 | | Thailand | | 14,000,000 | THB | | | 372,865 |
Government of Ukraine, | �� | | | | | | | |
e144A, 7.65%, 6/11/13 | | Ukraine | | 3,370,000 | | | | 3,656,450 |
bFRN, 7.343%, 8/05/09 | | Ukraine | | 1,675,000 | | | | 1,825,750 |
bGovernment of Venezuela, FRN, 5.194%, 4/20/11 | | Venezuela | | 6,175,000 | | | | 6,059,219 |
Inter-American Development Bank, 9.00%, 1/04/07 | | Iceland | | 259,000,000 | ISK | | | 4,113,131 |
Korea Treasury Note, 4.75%, 3/12/08 | | South Korea | | 8,900,000,000 | KRW | | | 8,781,053 |
New South Wales Treasury Corp., | | | | | | | | |
6.00%, 5/01/12 | | Australia | | 1,570,000 | AUD | | | 1,185,677 |
8.00%, 3/01/08 | | Australia | | 1,801,000 | AUD | | | 1,389,136 |
Queensland Treasury Corp., 6.00%, | | | | | | | | |
8/14/13 | | Australia | | 1,220,000 | AUD | | | 929,708 |
10/14/15 | | Australia | | 1,280,000 | AUD | | | 978,314 |
7/14/09 | | Australia | | 3,820,000 | AUD | | | 2,861,726 |
| | | | | | | |
|
|
Total Foreign Government and Agency Securities (Cost $211,244,396) | | | | | | | | 217,223,696 |
| | | | | | | |
|
|
Total Long Term Investments (Cost $729,906,289) | | | | | | | | 734,903,218 |
| | | | | | | |
|
|
Short Term Investments 3.8% | | | | | | | | |
Foreign Government Securities 2.2% | | | | | | | | |
iCanada Treasury Bill, 11/30/06 | | Canada | | 2,100,000 | CAD | | | 1,741,593 |
iEgypt Treasury Bill, 5/30/06 | | Egypt | | 11,500,000 | EGP | | | 1,945,083 |
iEgypt Treasury Bill, 6/20/06 | | Egypt | | 11,000,000 | EGP | | | 1,842,992 |
iEgypt Treasury Bill, 11/21/06 | | Egypt | | 11,800,000 | EGP | | | 1,909,627 |
iThailand Treasury Bill, 2/23/06 | | Thailand | | 50,900,000 | THB | | | 1,235,496 |
iThailand Treasury Bill, 3/09/06 | | Thailand | | 14,100,000 | THB | | | 341,717 |
iThailand Treasury Bill, 6/08/06 | | Thailand | | 43,500,000 | THB | | | 1,047,764 |
iThailand Treasury Bill, 7/27/06 | | Thailand | | 11,300,000 | THB | | | 268,859 |
iThailand Treasury Bill, 9/07/06 | | Thailand | | 11,000,000 | THB | | | 260,809 |
iThailand Treasury Bill, 10/05/06 | | Thailand | | 98,750,000 | THB | | | 2,341,837 |
iThailand Treasury Bill, 10/12/06 | | Thailand | | 164,600,000 | THB | | | 3,885,675 |
| | | | | | | |
|
|
Total Foreign Government Securities (Cost $16,901,436) | | | | | | | | 16,821,452 |
| | | | | | | |
|
|
Total Investments before Money Fund (Cost $746,807,725) | | | | | | | | 751,724,670 |
| | | | | | | |
|
|
FSI-20
Franklin Templeton Variable Insurance Products Trust
Statement of Investments, December 31, 2005 (continued)
| | | | | | | | |
| Franklin Strategic Income Securities Fund | | Country | | Shares | | Value | |
Short Term Investments (cont.) | | | | | | | | |
Money Fund (Cost $12,117,811) 1.6% | | | | | | | | |
jFranklin Institutional Fiduciary Trust Money Market Portfolio | | United States | | 12,117,811 | | $ | 12,117,811 | |
| | | | | | |
|
|
|
Total Short Term Investments (Cost $29,019,247) | | | | | | | 28,939,263 | |
| | | | | | |
|
|
|
Total Investments (Cost $758,925,536) 100.5% | | | | | | | 763,842,481 | |
Net Unrealized Gain on Forward Exchange Contracts | | | | | | | 30,113 | |
Other Assets, less Liabilities (0.5)% | | | | | | | (4,006,637 | ) |
| | | | | | |
|
|
|
Net Assets 100.0% | | | | | | $ | 759,865,957 | |
| | | | | | |
|
|
|
Currency Abbreviations:
AUD - Australian Dollar
CAD - Canadian Dollar
EGP - Egyptian Pound
EUR - Euro
IDR - Indonesian Rupiah
ISK - Iceland Krona
KRW - South Korean Won
MYR - Malaysian Ringgit
NOK - Norwegian Krone
NZD - New Zealand Dollar
PEN - Peruvian Nuevo Sol
PLN - Polish Zloty
SEK - Swedish Krona
SGD - Singapore Dollar
SKK - Slovak Koruna
THB - Thai Baht
Selected Portfolio Abbreviations
FHLMC - Federal Home Loan Mortgage Corporation
FNMA - Federal National Mortgage Association
FRN - Floating Rate Note
GNMA - Government National Mortgage Association
SF - Single Family
aSee Note 1(f) regarding senior floating rate interests.
bThe coupon rate shown represents the rate at period end.
cSee Note 1(c) regarding securities purchased on a when-issued, delayed delivery or to-be-announced basis.
dThe principal amount is stated in U.S. dollars unless otherwise indicated.
eSecurity was purchased pursuant to Rule 144A under the Securities Act of 1933 and may be sold in transactions exempt from registration only to qualified institutional buyers or in a public offering registered under the Securities Act of 1933. These securities have been deemed liquid under the guidelines approved by the Trust’s Board of Trustees. At December 31, 2005, the value of these securities was $62,809,106, representing 8.27% of net assets.
fSee Note 9 regarding defaulted securities.
gSee Note 11 regarding other considerations.
hThe principal amount is stated in original face, and scheduled paydowns are reflected in the market price on ex-date.
iA portion or all of the security is traded on a discount basis with no stated coupon rate.
jSee Note 7 regarding investments in Franklin Institutional Fiduciary Trust Money Market Portfolio.
See notes to financial statements.
FSI-21
Franklin Templeton Variable Insurance Products Trust
Financial Statements
Statement of Assets and Liabilities
December 31, 2005
| | | |
| | | Franklin
Strategic Income
Securities Fund
|
Assets: | | | |
Investments in securities: | | | |
Cost - Unaffiliated issuers | | $ | 746,807,725 |
Cost - Sweep Money Fund (Note 7) | | | 12,117,811 |
| | |
|
|
Total cost of investments | | $ | 758,925,536 |
| | |
|
|
Value - Unaffiliated issuers | | $ | 751,724,670 |
Value - Sweep Money Fund (Note 7) | | | 12,117,811 |
| | |
|
|
Total value of investments | | | 763,842,481 |
Cash | | | 320,471 |
Foreign currency, at value (cost $224,606) | | | 199,872 |
Receivables: | | | |
Investment securities sold | | | 7,542,629 |
Capital shares sold | | | 682,456 |
Dividends and interest | | | 11,227,990 |
Unrealized gain on forward exchange contracts (Note 8) | | | 30,113 |
Unrealized gain on unfunded commitments (Note 10) | | | 2,175 |
| | |
|
|
Total assets | | | 783,848,187 |
| | |
|
|
Liabilities: | | | |
Payables: | | | |
Investment securities purchased | | | 23,440,312 |
Capital shares redeemed | | | 590 |
Affiliates | | | 382,885 |
Accrued expenses and other liabilities | | | 158,443 |
| | |
|
|
Total liabilities | | | 23,982,230 |
| | |
|
|
Net assets, at value | | $ | 759,865,957 |
| | |
|
|
Net assets consist of: | | | |
Paid-in capital | | $ | 713,348,444 |
Undistributed net investment income | | | 36,429,050 |
Net unrealized appreciation (depreciation) | | | 4,887,947 |
Accumulated net realized gain (loss) | | | 5,200,516 |
| | |
|
|
Net assets, at value | | $ | 759,865,957 |
| | |
|
|
Class 1: | | | |
Net assets, at value | | $ | 740,352,376 |
| | |
|
|
Shares outstanding | | | 59,568,373 |
| | |
|
|
Net asset value and offering price per share | | $ | 12.43 |
| | |
|
|
Class 2: | | | |
Net assets, at value | | $ | 19,513,581 |
| | |
|
|
Shares outstanding | | | 1,590,626 |
| | |
|
|
Net asset value and offering price per share | | $ | 12.27 |
| | |
|
|
See notes to financial statements.
FSI-22
Franklin Templeton Variable Insurance Products Trust
Financial Statements (continued)
Statement of Operations
for the year ended December 31, 2005
| | | | |
| | | Franklin
Strategic Income
Securities Fund
| |
Investment income: | | | | |
Dividends: | | | | |
Unaffiliated issuers | | $ | 422,817 | |
Sweep Money Fund (Note 7) | | | 242,447 | |
Interest | | | 38,834,640 | |
| | |
|
|
|
Total investment income | | | 39,499,904 | |
| | |
|
|
|
Expenses: | | | | |
Management fees (Note 3a) | | | 2,655,999 | |
Administrative fees (Note 3b) | | | 1,344,624 | |
Distribution fees - Class 2 (Note 3c) | | | 30,105 | |
Unaffiliated transfer agent fees | | | 3,805 | |
Custodian fees (Note 4) | | | 227,561 | |
Reports to shareholders | | | 149,658 | |
Professional fees | | | 24,873 | |
Trustees’ fees and expenses | | | 3,465 | |
Other | | | 32,070 | |
| | |
|
|
|
Total expenses | | | 4,472,160 | |
Expense reductions (Note 4) | | | (4,211 | ) |
| | |
|
|
|
Net expenses | | | 4,467,949 | |
| | |
|
|
|
Net investment income | | | 35,031,955 | |
| | |
|
|
|
Realized and unrealized gains (losses): | | | | |
Net realized gain (loss) from: | | | | |
Investments | | | 11,986,098 | |
Foreign currency transactions | | | (87,820 | ) |
| | |
|
|
|
Net realized gain (loss) | | | 11,898,278 | |
| | |
|
|
|
Net change in unrealized appreciation (depreciation) on: | | | | |
Investments | | | (34,156,991 | ) |
Translation of assets and liabilities denominated in foreign currencies | | | (223,367 | ) |
| | |
|
|
|
Net change in unrealized appreciation (depreciation) | | | (34,380,358 | ) |
| | |
|
|
|
Net realized and unrealized gain (loss) | | | (22,482,080 | ) |
| | |
|
|
|
Net increase (decrease) in net assets resulting from operations | | $ | 12,549,875 | |
| | |
|
|
|
See notes to financial statements.
FSI-23
Franklin Templeton Variable Insurance Products Trust
Financial Statements (continued)
Statements of Changes in Net Assets
| | | | | | | | |
| | | Franklin Strategic Income
Securities Fund
| |
| | | Year Ended December 31,
| |
| | | 2005 | | | 2004 | |
| | |
| |
Increase (decrease) in net assets: | | | | | | | | |
Operations: | | | | | | | | |
Net investment income | | $ | 35,031,955 | | | $ | 25,414,663 | |
Net realized gain (loss) from investments and foreign currency transactions | | | 11,898,278 | | | | 7,299,444 | |
Net change in unrealized appreciation (depreciation) on investments and translation of assets and liabilities denominated in foreign currencies | | | (34,380,358 | ) | | | 14,971,004 | |
| | |
| |
Net increase (decrease) in net assets resulting from operations | | | 12,549,875 | | | | 47,685,111 | |
Distributions to shareholders from: | | | | | | | | |
Net investment income: | | | | | | | | |
Class 1 | | | (30,614,473 | ) | | | (14,618,436 | ) |
Class 2 | | | (296,661 | ) | | | (104,257 | ) |
Net realized gains: | | | | | | | | |
Class 1 | | | (5,032,795 | ) | | | (589,602 | ) |
Class 2 | | | (50,111 | ) | | | (4,270 | ) |
| | |
| |
Total distributions to shareholders | | | (35,994,040 | ) | | | (15,316,565 | ) |
Capital share transactions: (Note 2) | | | | | | | | |
Class 1 | | | 192,650,584 | | | | 178,968,891 | |
Class 2 | | | 14,935,669 | | | | 2,598,363 | |
| | |
| |
Total capital share transactions | | | 207,586,253 | | | | 181,567,254 | |
Net increase (decrease) in net assets | | | 184,142,088 | | | | 213,935,800 | |
Net assets: | | | | | | | | |
Beginning of year | | | 575,723,869 | | | | 361,788,069 | |
| | |
| |
End of year | | $ | 759,865,957 | | | $ | 575,723,869 | |
| | |
| |
Undistributed net investment income included in net assets: | | | | | | | | |
End of year | | $ | 36,429,050 | | | $ | 25,793,329 | |
| | |
| |
See notes to financial statements.
FSI-24
Franklin Templeton Variable Insurance Products Trust
Notes to Financial Statements
Franklin Strategic Income Securities Fund
1. ORGANIZATION AND SIGNIFICANT ACCOUNTING POLICIES
Franklin Templeton Variable Insurance Products Trust (the Trust) is registered under the Investment Company Act of 1940 as an open-end investment company, consisting of twenty-two separate series. The Franklin Strategic Income Securities Fund (the Fund) included in this report is non-diversified. The financial statements of the remaining funds in the series are presented separately. Shares of the Fund are sold only to insurance company separate accounts to fund the benefits of variable life insurance policies or variable annuity contracts. As of December 31, 2005, 97.38% of the Fund’s shares were sold through one insurance company.
The following summarizes the Fund’s significant accounting policies.
a. Security Valuation
Securities listed on a securities exchange or on the NASDAQ National Market System are valued at the last quoted sale price or the official closing price of the day, respectively. Over-the-counter securities and listed securities for which there is no reported sale are valued within the range of the most recent quoted bid and ask prices. Securities that trade in multiple markets or on multiple exchanges are valued according to the broadest and most representative market. Investments in open-end mutual funds are valued at the closing net asset value.
Corporate debt securities, government securities, mortgage pass-through securities, other mortgage-backed securities, collateralized mortgage obligations and asset-backed securities generally trade in the over-the-counter market rather than on a securities exchange. The Trust may utilize independent pricing services, quotations from bond dealers, and information with respect to bond and note transactions, to assist in determining a current market value for each security. The Trust’s pricing services may use valuation models or matrix pricing which considers information with respect to comparable bond and note transactions, quotations from bond dealers, or by reference to other securities that are considered comparable in such characteristics as rating, interest rate and maturity date, option adjusted spread models, prepayment projections, interest rate spreads and yield curves, to determine current value.
Senior secured corporate loans with floating or variable interest rates generally trade in the over-the-counter market rather than on a securities exchange. The Trust may utilize independent pricing services, quotations from loan dealers and other financial institutions, and information with respect to bond and note transactions, to assist in determining a current market value for each security. The Trust’s pricing services use independent market quotations from loan dealers or financial institutions and may incorporate valuation methodologies that consider multiple bond characteristics such as dealer quotes, issuer type, coupon, maturity, weighted average maturity, interest rate spreads and yield curves, cash flow and credit risk/quality analysis to determine current value.
Foreign securities are valued as of the close of trading on the foreign stock exchange on which the security is primarily traded, or the NYSE, whichever is earlier. If no sale is reported at that time, the foreign security will be valued within the range of the most recent quoted bid and ask prices. The value is then converted into its U.S. dollar equivalent at the foreign exchange rate in effect at the close of the NYSE on the day that the value of the foreign security is determined.
The Trust has procedures to determine the fair value of individual securities and other assets for which market prices are not readily available or which may not be reliably priced. Methods for valuing these securities may include: fundamental analysis, matrix pricing, discounts from market prices of similar securities, or discounts applied due to the nature and duration of restrictions on the disposition of the securities. Due to the inherent uncertainty of valuations of such securities, the fair values may differ significantly from the values that would have been used had a ready market for such investments existed. Occasionally, events occur between the time at which trading in a security is completed and the close of the NYSE that might call into question the availability (including the reliability) of the value of a portfolio security held by the Fund. If such an event occurs, the securities may be valued using fair value procedures, which may include the use of independent pricing services. All security valuation procedures are approved by the Trust’s Board of Trustees.
FSI-25
Franklin Templeton Variable Insurance Products Trust
Notes to Financial Statements (continued)
Franklin Strategic Income Securities Fund
1. ORGANIZATION AND SIGNIFICANT ACCOUNTING POLICIES (continued)
b. Foreign Currency Translation
Portfolio securities and other assets and liabilities denominated in foreign currencies are translated into U.S. dollars based on the exchange rate of such currencies against U.S. dollars on the date of valuation. Purchases and sales of securities, income and expense items denominated in foreign currencies are translated into U.S. dollars at the exchange rate in effect on the transaction date. Occasionally, events may impact the availability or reliability of foreign exchange rates used to convert the U.S. dollar equivalent value. If such an event occurs, the foreign exchange rate will be valued at fair value using procedures established and approved by the Trust’s Board of Trustees.
The Fund does not separately report the effect of changes in foreign exchange rates from changes in market prices on securities held. Such changes are included in net realized and unrealized gain or loss from investments on the Statement of Operations.
Realized foreign exchange gains or losses arise from sales of foreign currencies, currency gains or losses realized between the trade and settlement dates on securities transactions and the difference between the recorded amounts of dividends, interest, and foreign withholding taxes and the U.S. dollar equivalent of the amounts actually received or paid. Net unrealized foreign exchange gains and losses arise from changes in foreign exchange rates on foreign denominated assets and liabilities other than investments in securities held at the end of the reporting period.
c. Securities Purchased on a When-Issued, Delayed Delivery, or TBA Basis
The Fund may purchase securities on a when-issued, delayed delivery, or to-be-announced (TBA) basis, with payment and delivery scheduled for a future date. These transactions are subject to market fluctuations and are subject to the risk that the value at delivery may be more or less than the trade date purchase price. Although the Fund will generally purchase these securities with the intention of holding the securities, it may sell the securities before the settlement date. Sufficient assets have been segregated for these securities.
d. Foreign Currency Contracts
The Fund may enter into forward exchange contracts to hedge against fluctuations in foreign exchange rates. A forward exchange contract is an agreement between two parties to exchange different currencies at an agreed upon exchange rate at a future date. These contracts are valued daily by the Fund and the net unrealized gain or loss on the contracts, as measured by the difference between the contractual forward foreign exchange rates and the forward rates at the reporting date, is included in the Statement of Assets and Liabilities. Realized and unrealized gains and losses on these contracts are included in the Statement of Operations.
When the Fund purchases or sells foreign securities it may enter into foreign exchange contracts to minimize foreign exchange risk from the trade date to the settlement date of the transactions. Realized and unrealized gains and losses on these contracts are included in the Statement of Operations.
The risks of these contracts include movement in the values of the foreign currencies relative to the U.S. dollar and the possible inability of the counterparties to fulfill their obligations under the contracts, which may be in excess of the amount reflected in the Statement of Assets and Liabilities.
e. Mortgage Dollar Rolls
The Fund enters into mortgage dollar rolls, typically on a TBA basis. Dollar rolls are agreements between the Fund and a financial institution to simultaneously sell and repurchase mortgage-backed securities at a future date. Gains or losses are realized at the time of the sale and the difference between the repurchase price and sale price is recorded as an unrealized gain to the Fund. The risks of mortgage dollar roll transactions include the potential inability of the counterparty to fulfill its obligations.
FSI-26
Franklin Templeton Variable Insurance Products Trust
Notes to Financial Statements (continued)
Franklin Strategic Income Securities Fund
1. ORGANIZATION AND SIGNIFICANT ACCOUNTING POLICIES (continued)
f. Senior Floating Rate Interests
Senior secured corporate loans pay interest at rates which are periodically reset by reference to a base lending rate plus a spread. These base lending rates are generally the prime rate offered by a designated U.S. bank or the London InterBank Offered Rate (LIBOR). Senior secured corporate loans often require prepayment of principal from excess cash flows or at the discretion of the borrower. As a result, actual maturity may be substantially less than the stated maturity.
Senior secured corporate loans in which the Fund invests are generally readily marketable, but may be subject to some restrictions on resale.
g. Income Taxes
No provision has been made for U.S. income taxes because the Fund’s policy is to continue to qualify as a regulated investment company under the Internal Revenue Code and to distribute to shareholders substantially all of its taxable income and net realized gains.
h. Security Transactions, Investment Income, Expenses and Distributions
Security transactions are accounted for on trade date. Realized gains and losses on security transactions are determined on a specific identification basis. Interest income and estimated expenses are accrued daily. Amortization of premium and accretion of discount on debt securities are included in interest income. Facility fees are recognized as income over the expected term of the loan. Dividend income is recorded on the ex-dividend date. Distributions to shareholders are recorded on the ex-dividend date and are determined according to income tax regulations (tax basis). Such distributions are reinvested in additional shares of the Fund. Distributable earnings determined on a tax basis may differ from earnings recorded in accordance with generally accepted accounting principles. These differences may be permanent or temporary. Permanent differences are reclassified among capital accounts to reflect their tax character. These reclassifications have no impact on net assets or the results of operations. Temporary differences are not reclassified, as they may reverse in subsequent periods.
Common expenses incurred by the Trust are allocated among the funds based on the ratio of net assets of each fund to the combined net assets of the Trust. Fund specific expenses are charged directly to the fund that incurred the expense.
Realized and unrealized gains and losses and net investment income, other than class specific expenses, are allocated daily to each class of shares based upon the relative proportion of net assets of each class.
i. Accounting Estimates
The preparation of financial statements in accordance with accounting principles generally accepted in the United States of America requires management to make estimates and assumptions that affect the reported amounts of assets and liabilities at the date of the financial statements and the amounts of income and expenses during the reporting period. Actual results could differ from those estimates.
j. Guarantees and Indemnifications
Under the Trust’s organizational documents, its officers and trustees are indemnified by the Trust against certain liabilities arising out of the performance of their duties to the Trust. Additionally, in the normal course of business, the Trust enters into contracts with service providers that contain general indemnification clauses. The Trust’s maximum exposure under these arrangements is unknown as this would involve future claims that may be made against the Trust that have not yet occurred. However, based on experience, the Trust expects the risk of loss to be remote.
FSI-27
Franklin Templeton Variable Insurance Products Trust
Notes to Financial Statements (continued)
Franklin Strategic Income Securities Fund
2. SHARES OF BENEFICIAL INTEREST
The Fund offers two classes of shares: Class 1 and Class 2. Each class of shares differs by its distribution fees, voting rights on matters affecting a single class and its exchange privilege.
At December 31, 2005, there were an unlimited number of shares authorized ($0.01 par value). Transactions in the Fund’s shares were as follows:
| | | | | | | | | | | | | | |
| | | Year Ended December 31,
| |
| | | 2005
| | | 2004
| |
| Class 1 Shares: | | Shares
| | | Amount
| | | Shares
| | | Amount
| |
Shares sold | | 13,275,130 | | | $ | 167,268,259 | | | 13,655,449 | | | $ | 168,180,688 | |
Shares issued in reinvestment of distributions | | 2,924,304 | | | | 35,647,268 | | | 1,305,411 | | | | 15,208,038 | |
Shares redeemed | | (825,137 | ) | | | (10,264,943 | ) | | (365,831 | ) | | | (4,419,835 | ) |
| | |
| |
Net increase (decrease) | | 15,374,297 | | | $ | 192,650,584 | | | 14,595,029 | | | $ | 178,968,891 | |
| | |
| |
| Class 2 Shares: | | | | | | | | | | | | |
Shares sold | | 1,276,128 | | | $ | 15,551,773 | | | 271,535 | | | $ | 3,332,844 | |
Shares issued in reinvestment of distributions | | 28,778 | | | | 346,772 | | | 9,404 | | | | 108,527 | |
Shares redeemed | | (78,763 | ) | | | (962,876 | ) | | (69,205 | ) | | | (843,008 | ) |
| | |
| |
Net increase (decrease) | | 1,226,143 | | | $ | 14,935,669 | | | 211,734 | | | $ | 2,598,363 | |
| | |
| |
3. TRANSACTIONS WITH AFFILIATES
Franklin Resources, Inc. is the holding company for various subsidiaries that together are referred to as Franklin Templeton Investments. Certain officers and trustees of the Trust are also officers and/or directors of the following subsidiaries:
| | |
| Subsidiary | | Affiliation |
Franklin Advisers Inc. (Advisers) | | Investment manager |
Franklin Templeton Services, LLC (FT Services) | | Administrative manager |
Franklin Templeton Distributors, Inc. (Distributors) | | Principal underwriter |
Franklin Templeton Investor Services, LLC (Investor Services) | | Transfer agent |
a. Management Fees
The Fund pays an investment management fee to Advisers based on the average daily net assets of the Fund as follows:
| | |
| Annualized Fee Rate | | Net Assets |
| 0.425% | | Up to and including $500 million |
| 0.325% | | Over $500 million, up to and including $1 billion |
| 0.280% | | Over $1 billion, up to and including $1.5 billion |
| 0.235% | | Over $1.5 billion, up to and including $6.5 billion |
| 0.215% | | Over $6.5 billion, up to and including $11.5 billion |
| 0.200% | | Over $11.5 billion, up to and including $16.5 billion |
| 0.190% | | Over $16.5 billion, up to and including $19 billion |
| 0.180% | | Over $19 billion, up to and including $21.5 billion |
| 0.170% | | In excess of $21.5 billion |
b. Administrative Fees
The Fund pays an administrative fee to FT Services of .20% per year of the Fund’s average daily net assets.
FSI-28
Franklin Templeton Variable Insurance Products Trust
Notes to Financial Statements (continued)
Franklin Strategic Income Securities Fund
3. TRANSACTIONS WITH AFFILIATES (continued)
c. Distribution Fees
The Fund’s Board of Trustees has adopted distribution plans for Class 2 shares pursuant to Rule 12b-1 under the 1940 Act. Under the Fund’s compensation distribution plans, the Fund pays Distributors for costs incurred in connection with the sale and distribution of the Fund’s shares up to 0.35% per year of its average daily net assets. The Board of Trustees, however, has set the current rate at 0.25% per year.
d. Transfer Agent Fees
Investor Services, under terms of an agreement, performs shareholder servicing for the Fund and is not paid by the Fund for the services.
4. EXPENSE OFFSET ARRANGEMENT
The Fund has entered into an arrangement with its custodian whereby credits realized as a result of uninvested cash balances are used to reduce a portion of the Fund’s custodian expenses. During the year ended December 31, 2005, the custodian fees were reduced as noted in the Statement of Operations.
5. INCOME TAXES
The tax character of distributions paid during the years ended December 31, 2005 and 2004, was as follows:
| | | | | | |
| | | 2005
| | 2004
|
Distributions paid from: | | | | | | |
Ordinary income | | $ | 33,879,593 | | $ | 15,056,746 |
Long term capital gains | | | 2,114,447 | | | 259,819 |
| | |
|
| | | $ | 35,994,040 | | $ | 15,316,565 |
| | |
|
At December 31, 2005, the cost of investments, net unrealized appreciation (depreciation) undistributed ordinary income and undistributed long term capital gains for income tax purposes were as follows:
| | | | |
Cost of investments | | $ | 762,340,173 | |
| | |
|
|
|
| |
Unrealized appreciation | | $ | 16,838,098 | |
Unrealized depreciation | | | (15,335,790 | ) |
| | |
|
|
|
Net unrealized appreciation (depreciation) | | $ | 1,502,308 | |
| | |
|
|
|
Undistributed ordinary income | | $ | 41,596,157 | |
Undistributed long term capital gains | | | 3,557,628 | |
| | |
|
|
|
Distributable earnings | | $ | 45,153,785 | |
| | |
|
|
|
Net investment income (loss) differs for financial statement and tax purposes primarily due to differing treatments of defaulted securities, foreign currency transactions, mortgage dollar rolls, paydown losses, and bond discounts and premiums.
Net realized gains (losses) differ for financial statement and tax purposes primarily due to differing treatments of wash sales, foreign currency transactions, mortgage dollar rolls, paydown losses, and bond discounts and premiums.
FSI-29
Franklin Templeton Variable Insurance Products Trust
Notes to Financial Statements (continued)
Franklin Strategic Income Securities Fund
6. INVESTMENT TRANSACTIONS
Purchases and sales of investments (excluding short term securities) for the year ended December 31, 2005, aggregated $466,404,799 and $264,605,180, respectively.
7. INVESTMENTS IN FRANKLIN INSTITUTIONAL FIDUCIARY TRUST MONEY MARKET PORTFOLIO
The Fund may invest in the Franklin Institutional Fiduciary Trust Money Market Portfolio (the Sweep Money Fund), an open-end investment company managed by Advisers. Management fees paid by the Fund are reduced on assets invested in the Sweep Money Fund, in an amount not to exceed the management and administrative fees paid by the Sweep Money Fund.
8. FORWARD EXCHANGE CONTRACTS
At December 31, 2005, the Fund had an outstanding forward exchange contract as set out below.
| | | | | | | | | | |
| Contract to Buy | | | | Contract
Amounta | | Settlement
Date | | Unrealized Gain
(Loss) |
| 30,500,000 | | Thailand Baht | | NZD $ | 1,068,956 | | 12/06/06 | | $ | 30,113 |
| | | | |
|
| | | |
|
|
| | | Unrealized gain on forward exchange contract | | | | | | | $ | 30,113 |
| | | | | | | | | |
|
|
a In US Dollar unless otherwise indicated.
Currency Abbreviation:
NZD - New Zealand Dollar
9. CREDIT RISK AND DEFAULTED SECURITIES
The Fund has 49.37% of its portfolio invested in below investment grade and comparable quality unrated high yield securities, which tend to be more sensitive to economic conditions than higher rated securities. The risk of loss due to default by the issuer may be significantly greater for the holders of high yielding securities because such securities are generally unsecured and are often subordinated to other creditors of the issuer.
The Fund held defaulted securities and/or other securities for which the income has been deemed uncollectible. At December 31, 2005, the value of these securities was $3,553,000, representing 0.47% of the Fund’s net assets. The Fund discontinues accruing income on securities for which income has been deemed uncollectible and provides an estimate for losses on interest receivable. The securities have been identified on the accompanying Statement of Investments.
10. UNFUNDED LOAN COMMITMENTS
The Fund may enter into certain credit agreements, all or a portion of which may be unfunded. The Fund is obligated to fund these loan commitments at the borrowers’ discretion.
At December 31, 2005, unfunded commitments were as follows:
| | | |
| Borrower | | Unfunded
Commitment |
Hawaiian Telecom Communications Inc, Term Loan A | | $ | 370,000 |
Eastman Kodak Co., Term Loan B2, Delay Draw | | | 761,765 |
Hertz Corp., Delay Draw | | | 325,555 |
| | |
|
|
| | | $ | 1,457,320 |
| | |
|
|
FSI-30
Franklin Templeton Variable Insurance Products Trust
Notes to Financial Statements (continued)
Franklin Strategic Income Securities Fund
10. UNFUNDED LOAN COMMITMENTS (continued)
Unfunded loan commitments are marked to market daily and any unrealized gain or loss is included in the Statement of Assets and Liabilities and Statement of Operations.
11. OTHER CONSIDERATIONS
Directors or employees of Advisers, as the Fund’s Investment Manager, may serve as members of various bondholders’ steering committees, on credit committees, or may represent the Funds in certain corporate restructuring negotiations. At January 6, 2006, such individuals serve in one or more of these capacities for Calpine Corp. As a result of this involvement, such individuals may be in possession of certain material non-public information. If the Fund’s Investment Manager, while in possession of such information, seeks to sell any of its holdings in these securities it will comply with all applicable federal securities laws.
12. REGULATORY MATTERS
As part of various investigations by a number of federal, state, and foreign regulators and governmental entities, relating to certain practices in the mutual fund industry, including late trading, market timing and marketing support payments to securities dealers who sell fund shares, Franklin Resources, Inc. and certain of its subsidiaries (collectively, the “Company”), entered into settlements with certain of those regulators.
Specifically, the Company entered into settlements with the Securities and Exchange Commission (“SEC”) concerning market timing (the “August 2, 2004 SEC Order”) and marketing support payments to securities dealers who sell fund shares (the “December 13, 2004 SEC Order”) and with the California Attorney General’s Office (“CAGO”) concerning marketing support payments to securities dealers who sell fund shares (the “CAGO Settlement”). Under the terms of the settlements with the SEC and the CAGO, the Company retained an Independent Distribution Consultant (“IDC”) to develop a plan for distribution of the respective settlement monies. The CAGO approved the distribution plan under the CAGO Settlement and, in accordance with the terms and conditions of that settlement, the monies were disbursed to the relevant funds. The SEC has not yet approved the distribution plan pertaining to the December 13, 2004 SEC Order. When approved, disbursements of settlement monies will be made promptly to the relevant funds, in accordance with the terms and conditions of that order. The IDC continues to develop the plan of distribution under the August 2, 2004 SEC Order that resolved the SEC’s market timing investigation.
In addition, the Company, as well as most of the mutual funds within Franklin Templeton Investments and certain current or former officers, directors, and/or employees, have been named in private lawsuits (styled as shareholder class actions, or as derivative actions on behalf of either the named funds or Franklin Resources, Inc.) relating to the industry practices referenced above, as well as to allegedly excessive advisory fees, commissions, and/or 12b-1 fees. The lawsuits were filed in different courts throughout the country. Many of those suits are now pending in a multi-district litigation in the United States District Court for the District of Maryland.
The Company and fund management strongly believe that the claims made in each of the private lawsuits referenced above are without merit and intend to defend against them vigorously. The Company cannot predict with certainty the eventual outcome of these lawsuits, nor whether they will have a material negative impact on the Company. If it is determined that the Company bears responsibility for any unlawful or inappropriate conduct that caused losses to the Trust, it is committed to making the Trust or their shareholders whole, as appropriate.
FSI-31
Franklin Templeton Variable Insurance Products Trust
Franklin Strategic Income Securities Fund
Report of Independent Registered Public Accounting Firm
To the Board of Trustees and Shareholders of
Franklin Templeton Variable Insurance Products Trust
In our opinion, the accompanying statement of assets and liabilities, including the statement of investments, and the related statements of operations and of changes in net assets and the financial highlights present fairly, in all material respects, the financial position of Franklin Strategic Income Securities Fund (one of the funds constituting Franklin Templeton Variable Insurance Products Trust, hereafter referred to as the “Fund”) at December 31, 2005, the results of its operations for the year then ended, the changes in its net assets for each of the two years in the period then ended and the financial highlights for each of the periods presented, in conformity with accounting principles generally accepted in the United States of America. These financial statements and financial highlights (hereafter referred to as “financial statements”) are the responsibility of the Fund’s management; our responsibility is to express an opinion on these financial statements based on our audits. We conducted our audits of these financial statements in accordance with the standards of the Public Company Accounting Oversight Board (United States). Those standards require that we plan and perform the audit to obtain reasonable assurance about whether the financial statements are free of material misstatement. An audit includes examining, on a test basis, evidence supporting the amounts and disclosures in the financial statements, assessing the accounting principles used and significant estimates made by management, and evaluating the overall financial statement presentation. We believe that our audits, which included confirmation of securities at December 31, 2005, by correspondence with the custodian, brokers, and agent banks, provide a reasonable basis for our opinion.
PricewaterhouseCoopers LLP
San Francisco, California
February 10, 2006
FSI-32
Franklin Templeton Variable Insurance Products Trust
Tax Designation (unaudited)
Franklin Strategic Income Securities Fund
Under Section 852(b)(3)(C) of the Internal Revenue Code, the Fund designates the maximum amount allowable but no less than $3,558,278 as a capital gain dividend for the fiscal year ended December 31, 2005.
FSI-33
FRANKLIN U.S. GOVERNMENT FUND
We are pleased to bring you Franklin U.S. Government Fund’s annual report for the fiscal year ended December 31, 2005.
Performance Summary as of 12/31/05
Average annual total return of Class 1 shares represents the average annual change in value, assuming reinvestment of dividends and capital gains. Average returns smooth out variations in returns, which can be significant; they are not the same as year-by-year results.
Periods ended 12/31/05
| | | | | | |
| | | 1-Year | | 5-Year | | 10-Year |
Average Annual Total Return | | +2.65% | | +5.26% | | +5.70% |
Total Return Index Comparison
for Hypothetical $10,000 Investment (1/1/96–12/31/05)
The graph below shows the change in value of a hypothetical $10,000 investment in the Fund over the indicated period and includes reinvestment of any income or distributions. The Fund’s performance is compared to the performance of the Lehman Brothers (LB) U.S. Government: Intermediate Index and the Lipper VIP General U.S. Government Funds Classification Average, as well as the Consumer Price Index (CPI). One cannot invest directly in an index, nor is an index representative of the Fund’s portfolio. Please see Important Notes to Performance Information preceding the Fund Summaries.
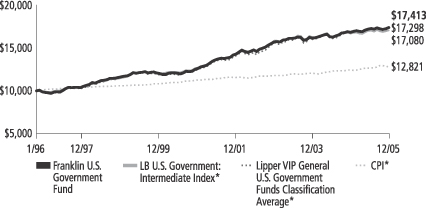
*Sources: Standard & Poor’s Micropal; Lipper Inc. Please see Index Descriptions following the Fund Summaries.
Franklin U.S. Government Fund – Class 1
Performance reflects the Fund’s Class 1 operating expenses, but does not include any contract fees, expenses or sales charges. If they had been included, performance would be lower. These charges and deductions, particularly for variable life policies, can have a significant effect on contract values and insurance benefits. See the contract prospectus for a complete description of these expenses, including sales charges.
Performance data represent past performance, which does not guarantee future results. Investment return and principal value will fluctuate, and you may have a gain or loss when you sell your shares.
Current performance may differ from figures shown.
FUS-1
Fund Goal and Main Investments: Franklin U.S. Government Fund seeks income. The Fund normally invests at least 80% of its net assets in U.S. government securities, primarily fixed and variable rate mortgage-backed securities, a substantial portion of which are Ginnie Maes.
Performance Overview
You can find the Fund’s one-year total return in the Performance Summary. Compared with its benchmarks for the same period, the Fund outperformed the LB U.S. Government: Intermediate Index’s +1.68% return and the Lipper VIP General U.S. Government Funds Classification Average’s +2.32% return.1
Economic and Market Overview
The economy continued to grow at a healthy pace during the year under review. Over the reporting period, nonfarm payroll data, as well as other indexes, showed growing employment. This along with other factors helped consumer spending increase 6.25% (not adjusted for inflation) in December 2005 compared with the same month a year earlier, which supported U.S. economic growth.2
Business spending also rose during the reporting period, contributing to economic growth. Historically low interest rates continued to allow many companies easy access to capital, and ample cash also helped some companies to support their spending plans.
Oil prices increased substantially during the period amid concerns about potential long-term supply limitations in the face of expected strong growth in global demand, especially from China and India. Despite high commodity prices, inflation remained relatively contained for the 12 months ended December 31, 2005, as measured by the 2.2% rise for the core Consumer Price Index (CPI), which was the same as the core CPI’s 10-year average.3 The Federal Reserve Board (Fed) noted some economic effects due to the recent hurricanes. However, acknowledging the economy’s strength as well as potential inflationary pressure from high energy prices, the Fed raised the federal funds target rate to 4.25% from 2.25% during the 12-month period.
1. Sources: Standard & Poor’s Micropal; Lipper Inc. One cannot invest directly in an index, nor is an index representative of the Fund’s portfolio. Please see Index Descriptions following the Fund Summaries.
2. Source: Bureau of Economic Analysis.
3. Source: Bureau of Labor Statistics. Core CPI excludes food and energy costs.
Fund Risks: Interest rate movements and mortgage prepayment rates may impact the Fund’s share price and yield. Thus, as the prices of bonds in the Fund’s portfolio adjust to a rise in interest rates, the Fund’s share price may decline. U.S. government securities owned by the Fund, but not shares of the Fund, are guaranteed by the U.S. government, its agencies or instrumentalities as to the timely payment of principal and interest. The Fund’s yield and share price are not guaranteed and will fluctuate with market conditions. The Fund’s prospectus also includes a description of the main investment risks.
FUS-2
The 10-year Treasury note fluctuated considerably over the past year, but overall its yield rose from 4.24% at the beginning of the period to 4.39% on December 31, 2005. Although core inflationary pressures appeared relatively well contained, the U.S. economy’s resilience caused some concern about future pricing pressures. Some market participants also pointed to the upcoming change in the Fed chairman as another possible catalyst for the 10-year Treasury’s rise, as there is some market perception that Ben Bernanke, the next Fed chairman, may tolerate higher inflation risk. However, Mr. Bernanke is reported to share many of retiring chairman Alan Greenspan’s economic philosophies. Furthermore, it is likely to take some time before his approach to dealing with inflation is apparent.
Investment Strategy
We seek to buy, and hold, high-quality income securities. Using this straightforward approach, we seek to produce current income with a high degree of credit safety from a conservatively managed portfolio of U.S. government securities. Analyzing securities using proprietary and nonproprietary research, we seek to identify attractive investment opportunities.
Manager’s Discussion
Based on our research, we believe mortgage-backed securities and agency securities offer attractive risk-adjusted returns. In the mortgage-backed securities sector, we used our research to uncover areas of the markets where we thought mortgage risk may have offered value, and we looked at instruments across the coupon spectrum. In the agency arena, we maintained our positions because we believed they were attractive core holdings, based on our strategy. The income premium provided by these debentures can help the sector achieve strong risk-adjusted returns across cycles.
Thank you for your participation in Franklin U.S. Government Fund. We look forward to serving your future investment needs.
The foregoing information reflects our analysis, opinions and portfolio holdings as of December 31, 2005, the end of the reporting period. The way we implement our main investment strategies and the resulting portfolio holdings may change depending on factors such as market and economic conditions. These opinions may not be relied upon as investment advice or an offer for a particular security. The information is not a complete analysis of every aspect of any market, country, industry, security or the Fund. Statements of fact are from sources considered reliable, but the adviser makes no representation or warranty as to their completeness or accuracy. Although historical performance is no guarantee of future results, these insights may help you understand our investment management philosophy.
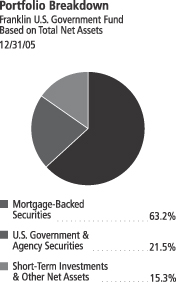
The dollar value, number of shares or principal amount, and names of all portfolio holdings are listed in the Fund’s Statement of Investments.
FUS-3
Fund Expenses
As an investor in a variable insurance contract (“Contract”) that indirectly provides for investment in an underlying mutual fund, you can incur transaction and/or ongoing expenses at both the Fund level and the Contract level.
| • | | Transaction expenses can include sales charges (loads) on purchases, redemption fees, surrender fees, transfer fees and premium taxes. |
| • | | Ongoing expenses can include management fees, distribution and service (12b-1) fees, contract fees, annual maintenance fees, mortality and expense risk fees and other fees and expenses. All mutual funds and Contracts have some types of ongoing expenses. |
The expenses shown in the table below are meant to highlight ongoing expenses at the Fund level only and do not include ongoing expenses at the Contract level, or transaction expenses at either the Fund or Contract level. While the Fund does not have transaction expenses, if the transaction and ongoing expenses at the Contract level were included, the expenses shown below would be higher. You should consult your Contract prospectus or disclosure document for more information.
The table shows Fund-level ongoing expenses and can help you understand these expenses and compare them with those of other mutual funds offered through the Contract. The table assumes a $1,000 investment held for the six months indicated. Please refer to the Fund prospectus for additional information on operating expenses.
Actual Fund Expenses
The first line (Actual) of the table below provides actual account values and expenses. The “Ending Account Value” is derived from the Fund’s actual return, which includes the effect of ongoing Fund expenses, but does not include the effect of ongoing Contract expenses.
You can estimate the Fund-level expenses you incurred during the period by following these steps. Of course, your account value and expenses will differ from those in this illustration:
| 1. | Divide your account value by $1,000. |
If an account had an $8,600 value, then $8,600 ÷ $1,000 = 8.6.
| 2. | Multiply the result by the number under the heading “Fund-Level Expenses Incurred During Period.” |
If Fund-Level Expenses Incurred During Period were $7.50, then 8.6 × $7.50 = $64.50.
Franklin U.S. Government Fund – Class 1
FUS-4
In this illustration, the estimated expenses incurred this period at the Fund level are $64.50.
Hypothetical Example for Comparison with Other Mutual Funds
Information in the second line (Hypothetical) of the table can help you compare ongoing expenses of the Fund with those of other mutual funds offered through the Contract. This information may not be used to estimate the actual ending account balance or expenses you incurred during the period. The hypothetical “Ending Account Value” is based on the Fund’s actual expense ratio and an assumed 5% annual rate of return before expenses, which does not represent the Fund’s actual return. The figure under the heading “Fund-Level Expenses Incurred During Period” shows the hypothetical expenses your account would have incurred under this scenario. You can compare this figure with the 5% hypothetical examples that appear in shareholder reports of other funds offered through a Contract.
| | | | | | | | | |
| Class 1 | | Beginning
Account
Value 7/1/05 | | Ending
Account
Value 12/31/05 | | Fund-Level
Expenses Incurred
During Period*
7/1/05-12/31/05 |
Actual | | $ | 1,000 | | $ | 1,006.30 | | $ | 2.58 |
Hypothetical (5% return before expenses) | | $ | 1,000 | | $ | 1,022.63 | | $ | 2.60 |
*Expenses are equal to the annualized expense ratio for the Fund’s Class 1 shares (0.51%), which does not include any ongoing expenses of the Contract for which the Fund is an investment option, multiplied by the average account value over the period, multiplied by 184/365 to reflect the one-half year period.
FUS-5
Franklin Templeton Variable Insurance Products Trust
Financial Highlights
Franklin U.S. Government Fund
| | | | | | | | | | | | | | | | | | | | |
| | | Year Ended December 31,
| |
| Class 1 | | 2005
| | | 2004
| | | 2003
| | | 2002
| | | 2001
| |
Per share operating performance | | | | | | | | | | | | | | | | | | | | |
(for a share outstanding throughout the year) | | | | | | | | | | | | | | | | | | | | |
Net asset value, beginning of year | | $ | 12.99 | | | $ | 13.22 | | | $ | 13.61 | | | $ | 13.16 | | | $ | 13.16 | |
| | |
|
|
|
Income from investment operations: | | | | | | | | | | | | | | | | | | | | |
Net investment incomea | | | 0.54 | | | | 0.51 | | | | 0.51 | | | | 0.71 | | | | 0.80 | d |
Net realized and unrealized gains (losses) | | | (0.20 | ) | | | (0.05 | ) | | | (0.18 | ) | | | 0.57 | | | | 0.17 | d |
| | |
|
|
|
Total from investment operations | | | 0.34 | | | | 0.46 | | | | 0.33 | | | | 1.28 | | | | 0.97 | |
| | |
|
|
|
Less distributions from net investment income | | | (0.58 | ) | | | (0.69 | ) | | | (0.72 | ) | | | (0.83 | ) | | | (0.97 | ) |
| | |
|
|
|
Net asset value, end of year | | $ | 12.75 | | | $ | 12.99 | | | $ | 13.22 | | | $ | 13.61 | | | $ | 13.16 | |
| | |
|
|
|
| | | | | |
Total returnb | | | 2.65% | | | | 3.71% | | | | 2.43% | | | | 10.08% | | | | 7.62% | |
Ratios/supplemental data | | | | | | | | | | | | | | | | | | | | |
Net assets, end of year (000’s) | | $ | 217,165 | | | $ | 259,833 | | | $ | 311,864 | | | $ | 382,663 | | | $ | 392,453 | |
Ratios to average net assets: | | | | | | | | | | | | | | | | | | | | |
Expenses | | | 0.52% | | | | 0.54% | | | | 0.53% | | | | 0.54% | | | | 0.53% | |
Net investment income | | | 4.18% | | | | 3.90% | | | | 3.79% | | | | 5.34% | | | | 6.06% | d |
Portfolio turnover rate | | | 21.46% | | | | 75.93% | | | | 72.09% | | | | 86.86% | | | | 35.94% | |
Portfolio turnover rate excluding mortgage dollar rollsc | | | 15.62% | | | | 33.63% | | | | 23.26% | | | | 38.47% | | | | 29.09% | |
aBased on average daily shares outstanding.
bTotal return does not include any fees, charges or expenses imposed by the variable annuity and life insurance contracts for which the Franklin Templeton Variable Insurance Products Trust serves as an underlying investment vehicle.
cSee Note 1(c) regarding mortgage dollar rolls.
dEffective January 1, 2001, the Fund adopted the provisions of the AICPA Audit and Accounting Guide of Investment Companies and began recording all paydown gains and losses as part of investment income, as required. The effect of this change was as follows:
| | |
Net investment income per share | | $0.016 |
Net realized and unrealized gains per share | | (0.016) |
Ratio of net investment income to average net assets | | 0.12% |
See notes to financial statements.
FUS-6
Franklin Templeton Variable Insurance Products Trust
Financial Highlights (continued)
Franklin U.S. Government Fund (continued)
| | | | | | | | | | | | | | | | | | | | |
| | | Year Ended December 31,
| |
| Class 2 | | 2005
| | | 2004
| | | 2003
| | | 2002
| | | 2001
| |
Per share operating performance | | | | | | | | | | | | | | | | | | | | |
(for a share outstanding throughout the year) | | | | | | | | | | | | | | | | | | | | |
Net asset value, beginning of year | | $ | 12.84 | | | $ | 13.08 | | | $ | 13.49 | | | $ | 13.08 | | | $ | 13.11 | |
| | |
|
|
|
Income from investment operations: | | | | | | | | | | | | | | | | | | | | |
Net investment incomea | | | 0.50 | | | | 0.47 | | | | 0.46 | | | | 0.66 | | | | 0.75 | d |
Net realized and unrealized gains (losses) | | | (0.20 | ) | | | (0.04 | ) | | | (0.16 | ) | | | 0.57 | | | | 0.18 | d |
| | |
|
|
|
Total from investment operations | | | 0.30 | | | | 0.43 | | | | 0.30 | | | | 1.23 | | | | 0.93 | |
| | |
|
|
|
Less distributions from net investment income | | | (0.55 | ) | | | (0.67 | ) | | | (0.71 | ) | | | (0.82 | ) | | | (0.96 | ) |
| | |
|
|
|
Net asset value, end of year | | $ | 12.59 | | | $ | 12.84 | | | $ | 13.08 | | | $ | 13.49 | | | $ | 13.08 | |
| | |
|
|
|
| | | | | |
Total returnb | | | 2.40% | | | | 3.48% | | | | 2.21% | | | | 9.77% | | | | 7.37% | |
Ratios/supplemental data | | | | | | | | | | | | | | | | | | | | |
Net assets, end of year (000’s) | | $ | 379,662 | | | $ | 332,373 | | | $ | 240,047 | | | $ | 136,875 | | | $ | 23,356 | |
Ratios to average net assets: | | | | | | | | | | | | | | | | | | | | |
Expenses | | | 0.77% | | | | 0.79% | | | | 0.78% | | | | 0.79% | | | | 0.78% | |
Net investment income | | | 3.93% | | | | 3.65% | | | | 3.54% | | | | 5.09% | | | | 5.69% | d |
Portfolio turnover rate | | | 21.46% | | | | 75.93% | | | | 72.09% | | | | 86.86% | | | | 35.94% | |
Portfolio turnover rate excluding mortgage dollar rollsc | | | 15.62% | | | | 33.63% | | | | 23.26% | | | | 38.47% | | | | 29.09% | |
aBased on average daily shares outstanding.
bTotal return does not include any fees, charges or expenses imposed by the variable annuity and life insurance contracts for which the Franklin Templeton Variable Insurance Products Trust serves as an underlying investment vehicle.
cSee Note 1(c) regarding mortgage dollar rolls.
dEffective January 1, 2001, the Fund adopted the provisions of the AICPA Audit and Accounting Guide of Investment Companies and began recording all paydown gains and losses as part of investment income, as required. The effect of this change was as follows:
| | |
Net investment income per share | | $0.016 |
Net realized and unrealized gains per share | | (0.016) |
Ratio of net investment income to average net assets | | 0.12% |
See notes to financial statements.
FUS-7
Franklin Templeton Variable Insurance Products Trust
Statement of Investments, December 31, 2005
| | | | | | |
| Franklin U.S. Government Fund | | Principal
Amount | | Value |
Long Term Investments 84.7% | | | | | | |
Mortgage-Backed Securities 63.2% | | | | | | |
aFederal Home Loan Mortgage Corp. (FHLMC) Adjustable Rate 0.1% | | | | | | |
FHLMC, 5.124%, 6/01/22 | | $ | 382,873 | | $ | 392,533 |
FHLMC, 5.144%, 2/01/19 | | | 452,472 | | | 464,721 |
| | | | | |
|
|
| | | | | | | 857,254 |
| | | | | |
|
|
Federal Home Loan Mortgage Corp. (FHLMC) Fixed Rate 9.8% | | | | | | |
FHLMC Gold 15 Year, 6.50%, 6/01/08 - 7/01/08 | | | 258,253 | | | 263,731 |
FHLMC Gold 30 Year, 5.00%, 9/01/33 - 4/01/34 | | | 12,231,779 | | | 11,881,546 |
FHLMC Gold 30 Year, 5.50%, 7/01/33 - 1/01/35 | | | 6,174,028 | | | 6,128,578 |
FHLMC Gold 30 Year, 5.50%, 11/1/34 | | | 12,769,994 | | | 12,669,268 |
FHLMC Gold 30 Year, 6.00%, 1/01/24 - 8/01/34 | | | 13,096,210 | | | 13,249,555 |
FHLMC Gold 30 Year, 6.50%, 11/01/23 - 5/01/35 | | | 6,773,540 | | | 6,960,733 |
FHLMC Gold 30 Year, 7.00%, 4/01/24 - 10/01/32 | | | 2,478,485 | | | 2,585,245 |
FHLMC Gold 30 Year, 7.50%, 12/01/22 - 5/01/24 | | | 184,323 | | | 194,062 |
FHLMC Gold 30 Year, 8.00%, 7/01/21 - 5/01/22 | | | 92,795 | | | 99,259 |
FHLMC Gold 30 Year, 8.50%, 7/01/21 - 7/01/31 | | | 3,913,043 | | | 4,247,701 |
FHLMC PC 15 Year, 8.00%, 9/01/17 | | | 1,740 | | | 1,852 |
FHLMC PC 30 Year, 8.00%, 1/01/17 - 8/01/17 | | | 27,594 | | | 29,378 |
FHLMC PC 30 Year, 8.50%, 9/01/20 | | | 5,382 | | | 5,820 |
| | | | | |
|
|
| | | | | | | 58,316,728 |
| | | | | |
|
|
aFederal National Mortgage Association (FNMA) Adjustable Rate 0.8% | | | | | | |
FNMA, 5.142%, 2/01/19 | | | 383,850 | | | 391,384 |
FNMA, 5.333%, 1/01/18 | | | 2,402,816 | | | 2,444,255 |
FNMA, 5.473%, 3/01/20 | | | 273,304 | | | 283,077 |
FNMA, 5.603%, 9/01/18 | | | 833,164 | | | 852,042 |
FNMA, 5.677%, 7/01/19 | | | 658,427 | | | 662,560 |
| | | | | |
|
|
| | | | | | | 4,633,318 |
| | | | | |
|
|
Federal National Mortgage Association (FNMA) Fixed Rate 10.0% | | | | | | |
FNMA 15 Year, 5.50%, 6/01/16 - 11/01/17 | | | 2,810,325 | | | 2,830,795 |
FNMA 15 Year, 6.00%, 8/01/17 - 9/01/17 | | | 3,108,241 | | | 3,178,251 |
FNMA 15 Year, 8.00%, 8/01/19 - 6/01/20 | | | 84,954 | | | 91,005 |
FNMA 30 Year, 5.00%, 3/01/34 - 7/01/35 | | | 11,702,021 | | | 11,353,938 |
FNMA 30 Year, 5.50%, 12/01/32 - 8/01/35 | | | 23,090,008 | | | 22,907,957 |
FNMA 30 Year, 6.00%, 1/01/24 - 12/01/34 | | | 5,114,327 | | | 5,164,416 |
FNMA 30 Year, 6.50%, 1/01/24 - 8/01/32 | | | 4,942,897 | | | 5,094,106 |
FNMA 30 Year, 7.00%, 5/01/24 - 9/01/31 | | | 501,069 | | | 523,442 |
FNMA 30 Year, 7.50%, 4/01/23 - 8/01/25 | | | 257,684 | | | 270,734 |
FNMA 30 Year, 8.00%, 7/01/16 - 2/01/25 | | | 607,943 | | | 649,826 |
FNMA 30 Year, 8.50%, 10/01/19 - 8/01/21 | | | 28,139 | | | 30,522 |
FNMA 30 Year, 9.00%, 10/01/26 | | | 1,103,741 | | | 1,210,383 |
FNMA PL 30 Year, 5.50%, 4/1/34 | | | 6,460,732 | | | 6,385,237 |
| | | | | |
|
|
| | | | | | | 59,690,612 |
| | | | | |
|
|
Government National Mortgage Association (GNMA) Fixed Rate 42.5% | | | | | | |
GNMA I SF 30 Year, 5.00%, 7/15/33 - 8/15/34 | | | 23,549,221 | | | 23,278,990 |
GNMA I SF 30 Year, 5.50%, 11/15/28 - 9/15/34 | | | 47,044,473 | | | 47,417,677 |
GNMA I SF 30 Year, 5.50%, 6/15/33 | | | 6,072,170 | | | 6,121,794 |
GNMA I SF 30 Year, 6.00%, 11/15/23 - 3/15/34 | | | 15,021,793 | | | 15,406,771 |
GNMA I SF 30 Year, 6.50%, 5/15/23 - 8/15/34 | | | 16,966,621 | | | 17,751,005 |
GNMA I SF 30 Year, 7.00%, 3/15/22 - 1/15/32 | | | 5,621,266 | | | 5,912,448 |
GNMA I SF 30 Year, 7.25%, 11/15/25 | | | 46,815 | | | 49,099 |
GNMA I SF 30 Year, 7.50%, 2/15/17 - 3/15/32 | | | 2,804,761 | | | 2,963,493 |
GNMA I SF 30 Year, 8.00%, 2/15/17 - 6/15/24 | | | 1,313,726 | | | 1,406,645 |
FUS-8
Franklin Templeton Variable Insurance Products Trust
Statement of Investments, December 31, 2005 (continued)
| | | | | | |
| Franklin U.S. Government Fund | | Principal
Amount | | Value |
Long Term Investments (continued) | | | | | | |
Mortgage-Backed Securities (continued) | | | | | | |
Government National Mortgage Association (GNMA) Fixed Rate (continued) | | | | | | |
GNMA I SF 30 Year, 8.25%, 4/15/25 | | $ | 152,797 | | $ | 165,764 |
GNMA I SF 30 Year, 8.50%, 6/15/22 - 12/15/24 | | | 303,941 | | | 331,262 |
GNMA I SF 30 Year, 9.00%, 4/15/16 - 7/15/20 | | | 173,976 | | | 189,183 |
GNMA I SF 30 Year, 9.50%, 7/15/16 - 6/15/21 | | | 465,227 | | | 513,056 |
GNMA I SF 30 Year, 10.00%, 10/15/17 - 8/15/21 | | | 344,383 | | | 384,975 |
GNMA II SF 30 Year, 5.00%, 9/20/33 | | | 17,209,437 | | | 16,942,793 |
GNMA II SF 30 Year, 5.00%, 10/20/33 - 11/20/33 | | | 7,275,018 | | | 7,162,601 |
GNMA II SF 30 Year, 5.00%, 8/20/35 | | | 10,725,275 | | | 10,551,016 |
GNMA II SF 30 Year, 5.50%, 5/20/34 - 6/20/35 | | | 10,491,127 | | | 10,539,085 |
GNMA II SF 30 Year, 5.50%, 6/20/34 | | | 6,259,584 | | | 6,288,903 |
GNMA II SF 30 Year, 5.50%, 11/20/34 | | | 6,115,319 | | | 6,143,963 |
GNMA II SF 30 Year, 5.50%, 12/20/34 | | | 15,369,545 | | | 15,441,535 |
GNMA II SF 30 Year, 5.50%, 2/20/35 | | | 8,939,409 | | | 8,981,313 |
GNMA II SF 30 Year, 6.00%, 11/20/23 - 11/20/34 | | | 12,010,361 | | | 12,280,370 |
GNMN II SF 30 Year, 6.00%, 6/20/34 | | | 8,186,549 | | | 8,368,452 |
GNMN II SF 30 Year, 6.00%, 9/20/34 | | | 11,927,136 | | | 12,191,648 |
GNMA II SF 30 Year, 6.50%, 12/20/27 - 4/20/34 | | | 6,705,574 | | | 6,961,544 |
GNMA II SF 30 Year, 7.00%, 8/20/29 - 11/20/32 | | | 8,098,428 | | | 8,449,792 |
GNMA II SF 30 Year, 7.50%, 11/20/16 - 5/20/33 | | | 1,129,237 | | | 1,187,283 |
GNMA II SF 30 Year, 8.00%, 7/20/16 - 8/20/26 | | | 88,994 | | | 94,816 |
GNMA II SF 30 Year, 9.50%, 4/20/25 | | | 22,504 | | | 24,947 |
| | | | | |
|
|
| | | | | | | 253,502,223 |
| | | | | |
|
|
Total Mortgage-Backed Securities (Cost $378,669,028) | | | | | | 377,000,135 |
| | | | | |
|
|
U.S. Government and Agency Securities 21.5% | | | | | | |
FFCB, | | | | | | |
4.45%, 8/27/10 | | | 15,000,000 | | | 14,820,855 |
4.50%, 7/09/07 | | | 10,000,000 | | | 9,967,550 |
FHLB, | | | | | | |
2.25%, 5/15/06 | | | 25,000,000 | | | 24,789,150 |
a2.625%, 5/15/07 | | | 15,000,000 | | | 14,585,865 |
a4.875%, 5/15/07 | | | 5,000,000 | | | 5,007,720 |
FICO, Strip, | | | | | | |
Series 15, zero cpn., 3/07/16 | | | 15,000,000 | | | 9,170,370 |
Series 16, zero cpn., 10/05/10 | | | 4,745,000 | | | 3,828,888 |
HUD, 96-A, | | | | | | |
7.63%, 8/01/14 | | | 4,980,000 | | | 4,985,050 |
7.66%, 8/01/15 | | | 5,000,000 | | | 5,005,145 |
SBA, | | | | | | |
6.00%, 9/01/18 | | | 4,406,884 | | | 4,535,588 |
6.35%, 6/25/19 | | | 691,890 | | | 703,994 |
6.45%, 12/01/15 | | | 1,350,518 | | | 1,393,095 |
a6.625%, 3/25/18 | | | 880,235 | | | 906,180 |
6.70%, 12/01/16 | | | 1,589,740 | | | 1,652,138 |
6.85%, 7/01/17 | | | 1,726,588 | | | 1,799,863 |
Tennessee Valley Authority, | | | | | | |
Strip, zero cpn., 4/15/42 | | | 6,000,000 | | | 4,666,014 |
5.88%, 4/01/36 | | | 10,000,000 | | | 11,403,380 |
U.S. Treasury Note, | | | | | | |
3.75%, 5/15/08 | | | 1,000,000 | | | 986,094 |
4.75%, 5/15/14 | | | 8,000,000 | | | 8,197,192 |
| | | | | |
|
|
Total U.S. Government and Agency Securities (Cost $125,039,672) | | | | | | 128,404,131 |
| | | | | |
|
|
Total Long Term Investments (Cost $503,708,700) | | | | | | 505,404,266 |
| | | | | |
|
|
FUS-9
Franklin Templeton Variable Insurance Products Trust
Statement of Investments, December 31, 2005 (continued)
| | | | | | |
| Franklin U.S. Government Fund | | Principal
Amount | | Value |
Short Term Investment (Cost $88,695,569) 14.8% | | | | | | |
Repurchase Agreement | | | | | | |
bJoint Repurchase Agreement, 3.999%, 1/03/06, (Maturity Value $88,734,979) | | $ | 88,695,569 | | $ | 88,695,569 |
ABN AMRO Bank, N.V., New York Branch (Maturity Value $8,175,154) Banc of America Securities LLC (Maturity Value $8,352,623) Barclays Capital Inc. (Maturity Value $8,352,623) Bear, Stearns & Co. Inc. (Maturity Value $7,109,447) BNP Paribas Securities Corp. (Maturity Value $8,352,623) Deutsche Bank Securities Inc. (Maturity Value $3,555,611) Goldman, Sachs & Co. (Maturity Value $6,042,852) Greenwich Capital Markets Inc. (Maturity Value $8,352,623) Lehman Brothers Inc. (Maturity Value $5,561,021) Merrill Lynch Government Securities Inc. (Maturity Value $8,352,624) Morgan Stanley & Co. Inc. (Maturity Value $8,175,154) UBS Securities LLC (Maturity Value $8,352,624) | | | | | | |
Collateralized by U.S. Government Agency Securities, 1.875 - 7.25%, 2/15/06 - 11/15/10; cU.S. Government Agency Discount Notes, 1/09/06 - 1/27/06; and U.S. Treasury Notes, 2.375 - 5.75%, 8/15/06 - 8/15/10 | | | | | | |
| | | | | |
|
|
Total Investments (Cost $592,404,269) 99.5% | | | | | | 594,099,835 |
Other Assets, less Liabilities 0.5% | | | | | | 2,726,412 |
| | | | | |
|
|
Net Assets 100.0% | | | | | $ | 596,826,247 |
| | | | | |
|
|
Selected Portfolio Abbreviations
FFCB - Federal Farm Credit Bank
FHLB - Federal Home Loan Bank
FICO - Financing Corporation
HUD - Housing and Urban Development
PC - Participation Certificate
PL - Project Loan
SBA - Small Business Administration
SF - Single Family
aThe coupon rate shown represents the rate at period end.
bSee Note 1(b) regarding joint repurchase agreement.
cSecurity is traded on a discount basis with no stated coupon rate.
See notes to financial statements.
FUS-10
Franklin Templeton Variable Insurance Products Trust
Financial Statements
Statement of Assets and Liabilities
December 31, 2005
| | | | |
| | | Franklin U.S.
Government Fund
| |
Assets: | | | | |
Investments in securities: | | | | |
Cost - Unaffiliated issuers | | $ | 503,708,700 | |
Cost - Repurchase agreements | | | 88,695,569 | |
| | |
|
|
|
Total cost of investments | | $ | 592,404,269 | |
| | |
|
|
|
Value - Unaffiliated issuers | | $ | 505,404,266 | |
Value - Repurchase agreements | | | 88,695,569 | |
| | |
|
|
|
Total value of investments | | | 594,099,835 | |
Receivables: | | | | |
Investment securities sold | | | 91,524 | |
Capital shares sold | | | 471,012 | |
Interest | | | 3,014,750 | |
| | |
|
|
|
Total assets | | | 597,677,121 | |
| | |
|
|
|
Liabilities: | | | | |
Payables: | | | | |
Capital shares redeemed | | | 352,129 | |
Affiliates | | | 404,387 | |
Reports to shareholders | | | 80,900 | |
Accrued expenses and other liabilities | | | 13,458 | |
| | |
|
|
|
Total liabilities | | | 850,874 | |
| | |
|
|
|
Net assets, at value | | $ | 596,826,247 | |
| | |
|
|
|
Net assets consist of: | | | | |
Paid-in capital | | $ | 587,212,455 | |
Undistributed net investment income | | | 24,045,870 | |
Net unrealized appreciation (depreciation) | | | 1,695,566 | |
Accumulated net realized gain (loss) | | | (16,127,644 | ) |
| | |
|
|
|
Net assets, at value | | $ | 596,826,247 | |
| | |
|
|
|
Class 1: | | | | |
Net assets, at value | | $ | 217,164,744 | |
| | |
|
|
|
Shares outstanding | | | 17,032,006 | |
| | |
|
|
|
Net asset value and offering price per share | | $ | 12.75 | |
| | |
|
|
|
Class 2: | | | | |
Net assets, at value | | $ | 379,661,503 | |
| | |
|
|
|
Shares outstanding | | | 30,165,071 | |
| | |
|
|
|
Net asset value and offering price per share | | $ | 12.59 | |
| | |
|
|
|
See notes to financial statements.
FUS-11
Franklin Templeton Variable Insurance Products Trust
Financial Statements (continued)
Statement of Operations
for the year ended December 31, 2005
| | | | |
| | | Franklin U.S.
Government Fund
| |
Investment income: | | | | |
Interest | | $ | 28,210,571 | |
| | |
|
|
|
Expenses: | | | | |
Management fees (Note 3a) | | | 2,951,887 | |
Distribution fees - Class 2 (Note 3c) | | | 906,159 | |
Unaffiliated transfer agent fees | | | 4,225 | |
Custodian fees (Note 4) | | | 13,286 | |
Reports to shareholders | | | 101,645 | |
Professional fees | | | 22,196 | |
Trustees’ fees and expenses | | | 3,313 | |
Other | | | 21,474 | |
| | |
|
|
|
Total expenses | | | 4,024,185 | |
| | |
|
|
|
Expense reductions (Note 4) | | | (896 | ) |
| | |
|
|
|
Net expenses | | | 4,023,289 | |
| | |
|
|
|
Net investment income | | | 24,187,282 | |
| | |
|
|
|
Realized and unrealized gains (losses): | | | | |
Net realized gain (loss) from investments | | | 894,892 | |
Net change in unrealized appreciation (depreciation) on investments | | | (10,377,707 | ) |
| | |
|
|
|
Net realized and unrealized gain (loss) | | | (9,482,815 | ) |
| | |
|
|
|
Net increase (decrease) in net assets resulting from operations | | $ | 14,704,467 | |
| | |
|
|
|
See notes to financial statements.
FUS-12
Franklin Templeton Variable Insurance Products Trust
Financial Statements (continued)
Statements of Changes in Net Assets
| | | | | | | | |
| | | Franklin U.S.
Government Fund
| |
| | | Year Ended December 31,
| |
| | | 2005 | | | 2004 | |
| | |
| |
Increase (decrease) in net assets: | | | | | | | | |
Operations: | | | | | | | | |
Net investment income | | $ | 24,187,282 | | | $ | 21,177,724 | |
Net realized gain (loss) from investments | | | 894,892 | | | | 1,888,065 | |
Net change in unrealized appreciation (depreciation) on investments | | | (10,377,707 | ) | | | (3,219,589 | ) |
| | |
| |
Net increase (decrease) in net assets resulting from operations | | | 14,704,467 | | | | 19,846,200 | |
Distributions to shareholders from: | | | | | | | | |
Net investment income: | | | | | | | | |
Class 1 | | | (10,493,994 | ) | | | (14,507,038 | ) |
Class 2 | | | (15,679,890 | ) | | | (13,738,794 | ) |
| | |
|
|
|
Total distributions to shareholders | | | (26,173,884 | ) | | | (28,245,832 | ) |
Capital share transactions: (Note 2) | | | | | | | | |
Class 1 | | | (38,280,418 | ) | | | (47,652,579 | ) |
Class 2 | | | 54,370,363 | | | | 96,329,567 | |
| | |
| |
Total capital share transactions | | | 16,089,945 | | | | 48,676,988 | |
| | |
| |
Net increase (decrease) in net assets | | | 4,620,528 | | | | 40,277,356 | |
Net assets: | | | | | | | | |
Beginning of year | | | 592,205,719 | | | | 551,928,363 | |
| | |
| |
End of year | | $ | 596,826,247 | | | $ | 592,205,719 | |
| | |
|
|
|
Undistributed net investment income included in net assets: | | | | | | | | |
End of year | | $ | 24,045,870 | | | $ | 23,168,032 | |
| | |
| |
See notes to financial statements.
FUS-13
Franklin Templeton Variable Insurance Products Trust
Notes to Financial Statements
Franklin U.S. Government Fund
1. ORGANIZATION AND SIGNIFICANT ACCOUNTING POLICIES
Franklin Templeton Variable Insurance Products Trust (the Trust) is registered under the Investment Company Act of 1940 as an open-end investment company, consisting of twenty-two separate series. The Franklin U.S. Government Fund (the Fund) included in this report is diversified. The financial statements of the remaining funds in the series are presented separately. Shares of the Fund are sold only to insurance company separate accounts to fund the benefits of variable life insurance policies or variable annuity contracts. As of December 31, 2005, 88.56% of the Fund’s shares were sold through one insurance company.
The following summarizes the Fund’s significant accounting policies.
a. Security Valuation
Securities listed on a securities exchange or on the NASDAQ National Market System are valued at the last quoted sale price or the official closing price of the day, respectively. Over-the-counter securities and listed securities for which there is no reported sale are valued within the range of the most recent quoted bid and ask prices. Securities that trade in multiple markets or on multiple exchanges are valued according to the broadest and most representative market.
Government securities, mortgage pass-through securities, other mortgage-backed securities, collateralized mortgage obligations and asset-backed securities generally trade in the over-the-counter market rather than on a securities exchange. The Trust may utilize independent pricing services, quotations from bond dealers, and information with respect to bond and note transactions, to assist in determining a current market value for each security. The Trust’s pricing services may use valuation models or matrix pricing which considers information with respect to comparable bond and note transactions, quotations from bond dealers, or by reference to other securities that are considered comparable in such characteristics as rating, interest rate and maturity date, option adjusted spread models, prepayment projections, interest rate spreads and yield curves, to determine current value.
The Trust has procedures to determine the fair value of individual securities and other assets for which market prices are not readily available or which may not be reliably priced. Methods for valuing these securities may include: fundamental analysis, matrix pricing, discounts from market prices of similar securities, or discounts applied due to the nature and duration of restrictions on the disposition of the securities. Due to the inherent uncertainty of valuations of such securities, the fair values may differ significantly from the values that would have been used had a ready market for such investments existed. Occasionally, events occur between the time at which trading in a security is completed and the close of the NYSE that might call into question the availability (including the reliability) of the value of a portfolio security held by the Fund. If such an event occurs, the securities may be valued using fair value procedures, which may include the use of independent pricing services. All security valuation procedures are approved by the Trust’s Board of Trustees.
b. Joint Repurchase Agreement
The Fund may enter into a joint repurchase agreement whereby its uninvested cash balance is deposited into a joint cash account with other funds managed by the investment manager or an affiliate of the investment manager and is used to invest in one or more repurchase agreements. The value and face amount of the joint repurchase agreement are allocated to the funds based on their pro-rata interest. A repurchase agreement is accounted for as a loan by the Fund to the seller, collateralized by securities which are delivered to the Fund’s custodian. The market value, including accrued interest, of the initial collateralization is required to be at least 102% of the dollar amount invested by the Funds, with the value of the underlying securities marked to market daily to maintain coverage of at least 100%. Repurchase agreements are valued at cost. At December 31, 2005, all repurchase agreements held by the Fund had been entered into on December 30, 2005.
FUS-14
Franklin Templeton Variable Insurance Products Trust
Notes to Financial Statements (continued)
Franklin U.S. Government Fund
1. ORGANIZATION AND SIGNIFICANT ACCOUNTING POLICIES (continued)
c. Mortgage Dollar Rolls
The Fund enters into mortgage dollar rolls, typically on a to-be-announced basis. Dollar rolls are agreements between the Fund and a financial institution to simultaneously sell and repurchase mortgage-backed securities at a future date. Gains or losses are realized at the time of the sale and the difference between the repurchase price and sale price is recorded as an unrealized gain to the Fund. The risks of mortgage dollar roll transactions include the potential inability of the counterparty to fulfill its obligations.
d. Income Taxes
No provision has been made for U.S. income taxes because the Fund’s policy is to continue to qualify as a regulated investment company under the Internal Revenue Code and to distribute to shareholders substantially all of its taxable income and net realized gains.
e. Security Transactions, Investment Income, Expenses and Distributions
Security transactions are accounted for on trade date. Realized gains and losses on security transactions are determined on a specific identification basis. Interest income and estimated expenses are accrued daily. Amortization of premium and accretion of discount on debt securities are included in interest income. Distributions to shareholders are recorded on the ex-dividend date and are determined according to income tax regulations (tax basis). Such distributions are reinvested in additional shares of the Fund. Distributable earnings determined on a tax basis may differ from earnings recorded in accordance with generally accepted accounting principles. These differences may be permanent or temporary. Permanent differences are reclassified among capital accounts to reflect their tax character. These reclassifications have no impact on net assets or the results of operations. Temporary differences are not reclassified, as they may reverse in subsequent periods.
Common expenses incurred by the Trust are allocated among the Funds based on the ratio of net assets of each Fund to the combined net assets of the Trust. Fund specific expenses are charged directly to the fund that incurred the expense.
Realized and unrealized gains and losses and net investment income, other than class specific expenses, are allocated daily to each class of shares based upon the relative proportion of net assets of each class.
f. Accounting Estimates
The preparation of financial statements in accordance with accounting principles generally accepted in the United States of America requires management to make estimates and assumptions that affect the reported amounts of assets and liabilities at the date of the financial statements and the amounts of income and expenses during the reporting period. Actual results could differ from those estimates.
g. Guarantees and Indemnifications
Under the Trust’s organizational documents, its officers and trustees are indemnified by the Trust against certain liabilities arising out of the performance of their duties to the Trust. Additionally, in the normal course of business, the Trust enters into contracts with service providers that contain general indemnification clauses. The Trust’s maximum exposure under these arrangements is unknown as this would involve future claims that may be made against the Trust that have not yet occurred. However, based on experience, the Trust expects the risk of loss to be remote.
FUS-15
Franklin Templeton Variable Insurance Products Trust
Notes to Financial Statements (continued)
Franklin U.S. Government Fund
2. SHARES OF BENEFICIAL INTEREST
The Fund offers two classes of shares: Class 1, and Class 2. Each class of shares differs by its distribution fees, voting rights on matters affecting a single class and its exchange privilege.
At December 31, 2005, there were an unlimited number of shares authorized ($0.01 par value). Transactions in the Fund’s shares were as follows:
| | | | | | | | | | | | | | |
| | | Year Ended December 31,
| |
| | | 2005
| | | 2004
| |
| Class 1 Shares: | | Shares
| | | Amount
| | | Shares
| | | Amount
| |
Shares sold | | 100,049 | | | $ | 1,272,449 | | | 265,352 | | | $ | 3,467,554 | |
Shares issued in reinvestment of distributions | | 831,538 | | | | 10,493,994 | | | 1,161,492 | | | | 14,507,038 | |
Shares redeemed | | (3,896,374 | ) | | | (50,046,861 | ) | | (5,017,887 | ) | | | (65,627,171 | ) |
| | |
| |
Net increase (decrease) | | (2,964,787 | ) | | $ | (38,280,418 | ) | | (3,591,043 | ) | | $ | (47,652,579 | ) |
| | |
| |
| Class 2 Shares: | | | | | | | | | | | | |
Shares sold | | 6,860,585 | | | $ | 87,163,974 | | | 8,471,419 | | | $ | 108,971,934 | |
Shares issued in reinvestment of distributions | | 1,257,409 | | | | 15,679,890 | | | 1,111,553 | | | | 13,738,794 | |
Shares redeemed | | (3,840,094 | ) | | | (48,473,501 | ) | | (2,048,963 | ) | | | (26,381,161 | ) |
| | |
| |
Net increase (decrease) | | 4,277,900 | | | $ | 54,370,363 | | | 7,534,009 | | | $ | 96,329,567 | |
| | |
| |
3. TRANSACTIONS WITH AFFILIATES
Franklin Resources, Inc. is the holding company for various subsidiaries that together are referred to as Franklin Templeton Investments. Certain officers and trustees of the Trust are also officers and/or directors of the following subsidiaries:
| | |
| Subsidiary | | Affiliation |
Franklin Advisers, Inc. (Advisers) | | Investment manager |
Franklin Templeton Services, LLC (FT Services) | | Administrative manager |
Franklin Templeton Distributors, Inc. (Distributors) | | Principal underwriter |
Franklin Templeton Investor Services, LLC (Investor Services) | | Transfer agent |
a. Management Fees
The Fund pays an investment management fee to Advisers based on the average daily net assets of the Fund as follows:
| | |
| Annualized Fee Rate | | Net Assets |
| .625% | | Up to and including $100 million |
| .500% | | Over $100 million, up to and including $250 million |
| .450% | | Over $250 million, up to and including $10 billion |
| .440% | | Over $10 billion, up to and including $12.5 billion |
| .420% | | Over $12.5 billion, up to and including $15 billion |
| .400% | | In excess of $15 billion |
b. Administrative Fees
Under an agreement with Advisers, FT Services provides administrative services to the Fund. The fee is paid by Advisers based on average daily net assets, and is not an additional expense of the Fund.
FUS-16
Franklin Templeton Variable Insurance Products Trust
Notes to Financial Statements (continued)
Franklin U.S. Government Fund
3. TRANSACTIONS WITH AFFILIATES (continued)
c. Distribution Fees
The Fund’s Board of Trustees has adopted distribution plans for Class 2 shares pursuant to Rule 12b-1 under the 1940 Act. Under the Fund’s compensation distribution plans, the Fund pays Distributors for costs incurred in connection with the sale and distribution of the Fund’s shares up to 0.35% per year of its average daily net assets. The Board of Trustees has set the current rate at 0.25% per year.
d. Transfer Agent Fees
Investor Services, under terms of an agreement, performs shareholder servicing for the Fund and is not paid by the Fund for the services.
4. EXPENSE OFFSET ARRANGEMENT
The Fund has entered into an arrangement with its custodian whereby credits realized as a result of uninvested cash balances are used to reduce a portion of the Fund’s custodian expenses. During the year ended December 31, 2005, the custodian fees were reduced as noted in the Statement of Operations.
5. INCOME TAXES
At December 31, 2005, the Fund had tax basis capital losses which may be carried over to offset future capital gains, if any. At December 31, 2005, the capital loss carryforwards were as follows:
| | | |
Capital loss carryforwards expiring in: | | | |
2008 | | $ | 5,752,213 |
2011 | | | 4,558,723 |
2012 | | | 3,331,578 |
2013 | | | 2,102,640 |
| | |
|
|
| | | $ | 15,745,154 |
| | |
|
|
For tax purposes, realized capital losses occurring subsequent to October 31, may be deferred and treated as occurring on the first day of the following fiscal year. At December 31, 2005, the Fund deferred realized capital losses of $381,588.
On December 31, 2005, the Franklin U.S. Government Fund had expired capital loss carryovers of $169,754, which were reclassified to paid-in capital.
The tax character of distributions paid during the years ended December 31, 2005 and 2004, was as follows:
| | | | | | |
| | | 2005
| | 2004
|
Distributions paid from ordinary income | | $ | 26,173,884 | | $ | 28,245,832 |
At December 31, 2005, the cost of investments, net unrealized appreciation and undistributed ordinary income for income tax purposes were as follows:
| | | | |
Cost of investments | | $ | 593,440,184 | |
| | |
|
|
|
| |
Unrealized appreciation | | $ | 7,095,476 | |
Unrealized depreciation | | | (6,435,825 | ) |
| | |
|
|
|
Net unrealized appreciation (depreciation) | | $ | 659,651 | |
| | |
|
|
|
Distributable earnings - undistributed ordinary income | | $ | 25,080,888 | |
| | |
|
|
|
FUS-17
Franklin Templeton Variable Insurance Products Trust
Notes to Financial Statements (continued)
Franklin U.S. Government Fund
5. INCOME TAXES (continued)
Net investment income differs for financial statements and tax purposes primarily due to differing treatments of mortgage dollar rolls, paydown losses, and bond discounts and premiums.
Net realized gains (losses) differ for financial statements and tax purposes primarily due to differing treatments of wash sales, mortgage dollar rolls, paydown losses, bond discounts and premiums.
6. INVESTMENT TRANSACTIONS
Purchases and sales of investments (excluding short term securities) for the year ended December 31, 2005, aggregated $118,910,870 and $166,984,229 respectively.
7. REGULATORY MATTERS
As part of various investigations by a number of federal, state, and foreign regulators and governmental entities, relating to certain practices in the mutual fund industry, including late trading, market timing and marketing support payments to securities dealers who sell fund shares, Franklin Resources, Inc. and certain of its subsidiaries (collectively, the “Company”), entered into settlements with certain of those regulators.
Specifically, the Company entered into settlements with the Securities and Exchange Commission (“SEC”) concerning market timing (the “August 2, 2004 SEC Order”) and marketing support payments to securities dealers who sell fund shares (the “December 13, 2004 SEC Order”) and with the California Attorney General’s Office (“CAGO”) concerning marketing support payments to securities dealers who sell fund shares (the “CAGO Settlement”). Under the terms of the settlements with the SEC and the CAGO, the Company retained an Independent Distribution Consultant (“IDC”) to develop a plan for distribution of the respective settlement monies. The CAGO approved the distribution plan under the CAGO Settlement and, in accordance with the terms and conditions of that settlement, the monies were disbursed to the relevant funds. The SEC has not yet approved the distribution plan pertaining to the December 13, 2004 SEC Order. When approved, disbursements of settlement monies will be made promptly to the relevant funds, in accordance with the terms and conditions of that order. The IDC continues to develop the plan of distribution under the August 2, 2004 SEC Order that resolved the SEC’s market timing investigation.
In addition, the Company, as well as most of the mutual funds within Franklin Templeton Investments and certain current or former officers, directors, and/or employees, have been named in private lawsuits (styled as shareholder class actions, or as derivative actions on behalf of either the named funds or Franklin Resources, Inc.) relating to the industry practices referenced above, as well as to allegedly excessive advisory fees, commissions, and/or 12b-1 fees. The lawsuits were filed in different courts throughout the country. Many of those suits are now pending in a multi-district litigation in the United States District Court for the District of Maryland.
The Company and fund management strongly believe that the claims made in each of the private lawsuits referenced above are without merit and intend to defend against them vigorously. The Company cannot predict with certainty the eventual outcome of these lawsuits, nor whether they will have a material negative impact on the Company. If it is determined that the Company bears responsibility for any unlawful or inappropriate conduct that caused losses to the Trust, it is committed to making the Trust or their shareholders whole, as appropriate.
FUS-18
Franklin Templeton Variable Insurance Products Trust
Franklin U.S. Government Fund
Report of Independent Registered Public Accounting Firm
To the Board of Trustees and Shareholders of
Franklin Templeton Variable Insurance Products Trust
In our opinion, the accompanying statement of assets and liabilities, including the statement of investments, and the related statements of operations and of changes in net assets and the financial highlights present fairly, in all material respects, the financial position of Franklin U.S. Government Fund (one of the funds constituting Franklin Templeton Variable Insurance Products Trust, hereafter referred to as the “Fund”) at December 31, 2005, the results of its operations for the year then ended, the changes in its net assets for each of the two years in the period then ended and the financial highlights for each of the five years in period then ended, in conformity with accounting principles generally accepted in the United States of America. These financial statements and financial highlights (hereafter referred to as “financial statements”) are the responsibility of the Fund’s management; our responsibility is to express an opinion on these financial statements based on our audits. We conducted our audits of these financial statements in accordance with the standards of the Public Company Accounting Oversight Board (United States). Those standards require that we plan and perform the audit to obtain reasonable assurance about whether the financial statements are free of material misstatement. An audit includes examining, on a test basis, evidence supporting the amounts and disclosures in the financial statements, assessing the accounting principles used and significant estimates made by management, and evaluating the overall financial statement presentation. We believe that our audits, which included confirmation of securities at December 31, 2005, by correspondence with the custodian, provide a reasonable basis for our opinion.
PricewaterhouseCoopers LLP
San Francisco, California
February 10, 2006
FUS-19
FRANKLIN ZERO COUPON FUND 2010
This annual report for Franklin Zero Coupon Fund 2010 covers the fiscal year ended December 31, 2005.
Performance Summary as of 12/31/05
Average annual total return of Class 1 shares represents the average annual change in value, assuming reinvestment of dividends and capital gains. Average returns smooth out variations in returns, which can be significant; they are not the same as year-by-year results.
Periods ended 12/31/05
| | | | | | |
| | | 1-Year | | 5-Year | | 10-Year |
Average Annual Total Return | | +1.54% | | +6.92% | | +6.57% |
Total Return Index Comparison
for Hypothetical $10,000 Investment (1/1/96–12/31/05)
The graph below shows the change in value of a hypothetical $10,000 investment in the Fund over the indicated period and includes reinvestment of any income or distributions. The Fund’s performance is compared to the performance of the Merrill Lynch 5-Year and 2-Year Zero Coupon Bond Indexes, as well as the Consumer Price Index (CPI). One cannot invest directly in an index, nor is an index representative of the Fund’s portfolio. Please see Important Notes to Performance Information preceding the Fund Summaries.
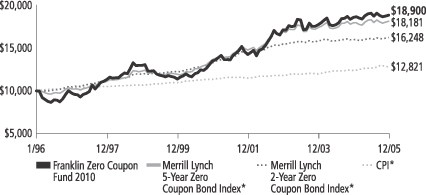
*Source: Standard & Poor’s Micropal. Please see Index Descriptions following the Fund Summaries.
Franklin Zero Coupon Fund 2010 – Class 1
Performance reflects the Fund’s Class 1 operating expenses, but does not include any contract fees, expenses or sales charges. If they had been included, performance would be lower. These charges and deductions, particularly for variable life policies, can have a significant effect on contract values and insurance benefits. See the contract prospectus for a complete description of these expenses, including sales charges.
Performance data represent past performance, which does not guarantee future results. Investment return and principal value will fluctuate, and you may have a gain or loss when you sell your shares.
Current performance may differ from figures shown.
FZ10-1
Fund Goal and Main Investments: Franklin Zero Coupon Fund 2010 seeks as high an investment return as is consistent with capital preservation. The Fund normally invests at least 80% of its net assets in zero coupon debt securities, primarily to predominantly in U.S. Treasury issued stripped securities and stripped securities issued by the U.S. government, or its agencies and authorities.
Performance Overview
You can find the Fund’s one-year total return in the Performance Summary. For comparison, the Fund’s benchmarks, the Merrill Lynch (ML) 5-Year Zero Coupon Bond Index and ML 2-Year Zero Coupon Bond Index, returned +1.43% and +1.17% for the same period.1
Economic and Market Overview
The economy continued to grow at a healthy pace during the year under review. Over the reporting period, nonfarm payroll data, as well as other indexes, showed growing employment. This along with other factors helped consumer spending increase 6.25% (not adjusted for inflation) in December 2005 compared with the same month a year earlier, which supported U.S. economic growth.2
Business spending also rose during the reporting period, contributing to economic growth. Historically low interest rates continued to allow many companies easy access to capital, and ample cash also helped some companies to support their spending plans.
Oil prices increased substantially during the period amid concerns about potential long-term supply limitations in the face of expected strong growth in global demand, especially from China and India. Despite high commodity prices, inflation remained relatively contained for the 12 months ended December 31, 2005, as measured by the 2.2% rise for the core CPI, which was the same as the core CPI’s 10-year average.3 The Federal Reserve Board (Fed) noted some economic effects due to the recent hurricanes. However, acknowledging the economy’s strength as well as potential inflationary pressure from high energy prices, the Fed raised the federal funds target rate to 4.25% from 2.25% during the 12-month period.
1. Source: Standard & Poor’s Micropal. One cannot invest directly in an index, nor is an index representative of the Fund’s portfolio. Please see Index Descriptions following the Fund Summaries.
2. Source: Bureau of Economic Analysis.
3. Source: Bureau of Labor Statistics. Core CPI excludes food and energy costs.
Fund Risks: Changes in interest rates affect the prices of the Fund’s debt securities. If interest rates rise, the value of the Fund’s debt securities will fall and so too will the Fund’s share price. Because zero coupon securities do not pay interest, their market value can fall more dramatically than interest-paying securities of similar maturities when interest rates rise. The Fund’s prospectus also includes a description of the main investment risks.
FZ10-2
The 10-year Treasury note fluctuated considerably over the past year, but overall its yield rose from 4.24% at the beginning of the period to 4.39% on December 31, 2005. Although core inflationary pressures appeared relatively well contained, the U.S. economy’s resilience caused some concern about future pricing pressures. Some market participants also pointed to the upcoming change in the Fed chairman as another possible catalyst for the 10-year Treasury’s rise, as there is some market perception that Ben Bernanke, the next Fed chairman, may tolerate higher inflation risk. However, Mr. Bernanke is reported to share many of retiring chairman Alan Greenspan’s economic philosophies. Furthermore, it is likely to take some time before his approach to dealing with inflation is apparent.
Investment Strategy
In selecting investments for the Fund, we seek to keep the Fund’s average duration to within 12 months of its maturity Target Date. Duration is a measure of the length of an investment, taking into account the timing and amount of any interest payments and the principal repayment. Duration is also a measure of a bond’s price sensitivity to interest rates. We analyze securities using both proprietary and nonproprietary research seeking to identify attractive investment opportunities.
Manager’s Discussion
During the period, we invested cash inflows into U.S. Treasury stripped securities, commonly called “strips.” During periods of stable or rising interest rates, such as that experienced during the reporting period, fixed income portfolios with longer durations tend to underperform those with shorter durations. This trend occurred in the reporting period and was reflected in Franklin Zero Coupon Fund 2010’s performance.
Thank you for your participation in Franklin Zero Coupon Fund 2010. We look forward to serving your future investment needs.
The foregoing information reflects our analysis, opinions and portfolio holdings as of December 31, 2005, the end of the reporting period. The way we implement our main investment strategies and the resulting portfolio holdings may change depending on factors such as market and economic conditions. These opinions may not be relied upon as investment advice or an offer for a particular security. The information is not a complete analysis of every aspect of any market, country, industry, security or the Fund. Statements of fact are from sources considered reliable, but the adviser makes no representation or warranty as to their completeness or accuracy. Although historical performance is no guarantee of future results, these insights may help you understand our investment management philosophy.
Portfolio Breakdown*
Franklin Zero Coupon Fund 2010
12/31/05
| | |
| | | % of Total
Net Assets |
| |
| U.S. Government & Agency Securities | | 91.2% |
| |
| Other Securities – AAA Rated | | 7.0% |
| |
| Repurchase Agreements | | 1.9% |
*Short-term investments and other net assets equal -0.1%
The dollar value, number of shares or principal amount, and names of all portfolio holdings are listed in the Fund’s Statement of Investments.
FZ10-3
Fund Expenses
As an investor in a variable insurance contract (“Contract”) that indirectly provides for investment in an underlying mutual fund, you can incur transaction and/or ongoing expenses at both the Fund level and the Contract level.
| • | | Transaction expenses can include sales charges (loads) on purchases, redemption fees, surrender fees, transfer fees and premium taxes. |
| • | | Ongoing expenses can include management fees, distribution and service (12b-1) fees, contract fees, annual maintenance fees, mortality and expense risk fees and other fees and expenses. All mutual funds and Contracts have some types of ongoing expenses. |
The expenses shown in the table below are meant to highlight ongoing expenses at the Fund level only and do not include ongoing expenses at the Contract level, or transaction expenses at either the Fund or Contract level. While the Fund does not have transaction expenses, if the transaction and ongoing expenses at the Contract level were included, the expenses shown below would be higher. You should consult your Contract prospectus or disclosure document for more information.
The table shows Fund-level ongoing expenses and can help you understand these expenses and compare them with those of other mutual funds offered through the Contract. The table assumes a $1,000 investment held for the six months indicated. Please refer to the Fund prospectus for additional information on operating expenses.
Actual Fund Expenses
The first line (Actual) of the table below provides actual account values and expenses. The “Ending Account Value” is derived from the Fund’s actual return, which includes the effect of ongoing Fund expenses, but does not include the effect of ongoing Contract expenses.
You can estimate the Fund-level expenses you incurred during the period by following these steps. Of course, your account value and expenses will differ from those in this illustration:
| 1. | Divide your account value by $1,000. |
If an account had an $8,600 value, then $8,600 ÷ $1,000 = 8.6.
| 2. | Multiply the result by the number under the heading “Fund-Level Expenses Incurred During Period.” |
If Fund-Level Expenses Incurred During Period were $7.50, then 8.6 × $7.50 = $64.50.
Franklin Zero Coupon Fund 2010 – Class 1
FZ10-4
In this illustration, the estimated expenses incurred this period at the Fund level are $64.50.
Hypothetical Example for Comparison with Other Mutual Funds
Information in the second line (Hypothetical) of the table can help you compare ongoing expenses of the Fund with those of other mutual funds offered through the Contract. This information may not be used to estimate the actual ending account balance or expenses you incurred during the period. The hypothetical “Ending Account Value” is based on the Fund’s actual expense ratio and an assumed 5% annual rate of return before expenses, which does not represent the Fund’s actual return. The figure under the heading “Fund-Level Expenses Incurred During Period” shows the hypothetical expenses your account would have incurred under this scenario. You can compare this figure with the 5% hypothetical examples that appear in shareholder reports of other funds offered through a Contract.
| | | | | | | | | |
| Class 1 | | Beginning
Account
Value 7/1/05 | | Ending
Account
Value 12/31/05 | | Fund-Level
Expenses Incurred
During Period*
7/1/05-12/31/05 |
Actual | | $ | 1,000 | | $ | 988.90 | | $ | 3.51 |
Hypothetical (5% return before expenses) | | $ | 1,000 | | $ | 1,021.68 | | $ | 3.57 |
*Expenses are equal to the annualized expense ratio for the Fund’s Class 1 shares (0.70%), which does not include any ongoing expenses of the Contract for which the Fund is an investment option, multiplied by the average account value over the period, multiplied by 184/365 to reflect the one-half year period.
FZ10-5
Franklin Templeton Variable Insurance Products Trust
Financial Highlights
Franklin Zero Coupon Fund – 2010
| | | | | | | | | | | | | | | | | | | | |
| | | Year Ended December 31,
| |
| Class 1 | | 2005
| | | 2004
| | | 2003
| | | 2002
| | | 2001
| |
Per share operating performance | | | | | | | | | | | | | | | | | | | | |
(for a share outstanding throughout the year) | | | | | | | | | | | | | | | | | | | | |
Net asset value, beginning of year | | $ | 16.49 | | | $ | 16.55 | | | $ | 16.61 | | | $ | 15.33 | | | $ | 16.50 | |
| | |
|
|
|
Income from investment operations: | | | | | | | | | | | | | | | | | | | | |
Net investment incomea | | | 0.80 | | | | 0.81 | | | | 0.82 | | | | 0.87 | | | | 0.92 | |
Net realized and unrealized gains (losses) | | | (0.54 | ) | | | (0.08 | ) | | | (0.20 | ) | | | 2.03 | | | | (0.06 | ) |
| | |
|
|
|
Total from investment operations | | | 0.26 | | | | 0.73 | | | | 0.62 | | | | 2.90 | | | | 0.86 | |
| | |
|
|
|
Less distributions from: | | | | | | | | | | | | | | | | | | | | |
Net investment income | | | (0.72 | ) | | | (0.79 | ) | | | (0.68 | ) | | | (0.95 | ) | | | (1.21 | ) |
Net realized gains | | | (0.01 | ) | | | — | | | | — | | | | (0.67 | ) | | | (0.82 | ) |
| | |
|
|
|
Total distributions | | | (0.73 | ) | | | (0.79 | ) | | | (0.68 | ) | | | (1.62 | ) | | | (2.03 | ) |
| | |
|
|
|
Net asset value, end of year | | $ | 16.02 | | | $ | 16.49 | | | $ | 16.55 | | | $ | 16.61 | | | $ | 15.33 | |
| | |
|
|
|
| | | | | |
Total returnb | | | 1.54% | | | | 4.72% | | | | 3.59% | | | | 20.10% | | | | 5.62% | |
Ratios/supplemental data | | | | | | | | | | | | | | | | | | | | |
Net assets, end of year (000’s) | | $ | 101,555 | | | $ | 78,978 | | | $ | 72,833 | | | $ | 68,489 | | | $ | 51,002 | |
Ratios to average net assets: | | | | | | | | | | | | | | | | | | | | |
Expenses | | | 0.69% | | | | 0.68% | | | | 0.68%c | | | | 0.68% | | | | 0.68% | |
Net investment income | | | 4.93% | | | | 4.91% | | | | 4.93%c | | | | 5.48% | | | | 5.73% | |
Portfolio turnover rate | | | —% | | | | 11.74% | | | | 38.37% | | | | 19.03% | | | | 23.68% | |
| a | Based on average daily shares outstanding. |
| b | Total return does not include any fees, charges or expenses imposed by the variable annuity and life insurance contracts for which the Franklin Templeton Variable Insurance Products Trust serves as an underlying investment vehicle. |
| c | Expense and Net investment income ratios have been corrected. As of December 31, 2003, the Expense ratio and Net investment income ratio previously presented were 0.65% and 4.77%, respectively. |
See notes to financial statements.
FZ10-6
Franklin Templeton Variable Insurance Products Trust
Financial Highlights (continued)
Franklin Zero Coupon Fund – 2010 (continued)
| | | | | | | | | | | | |
| | | Year Ended December 31,
| |
| Class 2 | | 2005
| | | 2004
| | | 2003c
| |
Per share operating performance | | | | | | | | | | | | |
(for a share outstanding throughout the year) | | | | | | | | | | | | |
Net asset value, beginning of year | | $ | 16.43 | | | $ | 16.52 | | | $ | 17.39 | |
| | |
|
|
|
Income from investment operations: | | | | | | | | | | | | |
Net investment incomea | | | 0.76 | | | | 0.77 | | | | 0.49 | |
Net realized and unrealized gains (losses) | | | (0.54 | ) | | | (0.08 | ) | | | (0.68 | ) |
| | |
|
|
|
Total from investment operations | | | 0.22 | | | | 0.69 | | | | (0.19 | ) |
| | |
|
|
|
Less distributions from | | | | | | | | | | | | |
Net investment income | | | (0.68 | ) | | | (0.78 | ) | | | (0.68 | ) |
Net realized gains | | | (0.01 | ) | | | — | | | | — | |
| | |
|
|
|
Total distributions | | | (0.69 | ) | | | (0.78 | ) | | | (0.68 | ) |
| | |
|
|
|
Net asset value, end of year | | $ | 15.96 | | | $ | 16.43 | | | $ | 16.52 | |
| | |
|
|
|
| | | |
Total returnb | | | 1.32% | | | | 4.45% | | | | 3.40% | |
Ratios/supplemental data | | | | | | | | | | | | |
Net assets, end of year (000's) | | $ | 24,040 | | | $ | 14,251 | | | $ | 11,649 | |
Ratios to average net assets: | | | | | | | | | | | | |
Expenses | | | 0.94% | | | | 0.93% | | | | 0.93% | d,e |
Net investment income | | | 4.68% | | | | 4.66% | | | | 4.68% | d,e |
Portfolio turnover rate | | | 0.00% | | | | 11.74% | | | | 38.37% | |
| a | Based on average daily shares outstanding. |
| b | Total return does not include any fees, charges or expenses imposed by the variable annuity and life insurance contracts for which the Franklin Templeton Variable Insurance Products Trust serves as an underlying investment vehicle. Total return is not annualized for periods less than one year. |
| c | For the period May 12, 2003 (effective date) to December 31, 2003. |
| e | Expense and Net investment income ratios have been corrected. As of December 31, 2003, the Expense ratio and Net investment income ratio previously were 0.90% and 4.52%, respectively. |
See notes to financial statements.
FZ10-7
Franklin Templeton Variable Insurance Products Trust
Statement of Investments, December 31, 2005
| | | | | | | |
| Franklin Zero Coupon Fund - 2010 | | Principal
Amount | | Value | |
Long Term Investments 98.2% | | | | | | | |
U.S. Government and Agency Securities 91.2% | | | | | | | |
FHLMC, Strip, 7/15/10 | | $ | 11,150,000 | | $ | 9,074,160 | |
FHLMC, Strip, 1/15/11 | | | 10,629,000 | | | 8,438,002 | |
FICO, Strip, 19, 6/06/10 | | | 9,800,000 | | | 8,012,225 | |
FICO, Strip, A, 8/08/10 | | | 7,000,000 | | | 5,684,623 | |
FNMA, Strip, 8/12/09 | | | 1,975,000 | | | 1,671,186 | |
FNMA, Strip, 8/01/10 | | | 8,250,000 | | | 6,568,064 | |
FNMA, Strip, 8/12/10 | | | 1,230,000 | | | 998,408 | |
REFCO, Strip, 10/15/10 | | | 10,000,000 | | | 8,166,510 | |
Tennessee Valley Authority, Strip, 1/01/10 | | | 412,000 | | | 335,507 | |
Tennessee Valley Authority, Strip, 4/15/10 | | | 12,000,000 | | | 9,846,300 | |
Tennessee Valley Authority, Strip, 10/15/10 | | | 1,320,000 | | | 1,062,193 | |
Tennessee Valley Authority, Strip, 1/15/11 | | | 10,669,000 | | | 8,455,940 | |
Tennessee Valley Authority, Strip, 10/15/11 | | | 7,295,000 | | | 5,589,524 | |
U.S. Treasury, Strip, 2/15/11 | | | 50,671,000 | | | 40,672,244 | |
| | | | | |
|
|
|
Total U.S. Government and Agency Securities (Cost $108,854,692) | | | | | | 114,574,886 | |
| | | | | |
|
|
|
Other Securities – AAA Rated 7.0% | | | | | | | |
International Bank for Reconstruction & Development, zero cpn., 2/15/11 | | | 1,392,000 | | | 1,089,165 | |
International Bank for Reconstruction & Development, zero cpn., 2/15/12 | | | 2,800,000 | | | 2,084,597 | |
International Bank for Reconstruction & Development, zero cpn., 2/15/13 | | | 3,287,000 | | | 2,322,275 | |
International Bank for Reconstruction & Development, zero cpn., 8/15/13 | | | 4,100,000 | | | 2,820,542 | |
International Bank for Reconstruction & Development, 2, zero cpn., 2/15/11 | | | 500,000 | | | 391,223 | |
| | | | | |
|
|
|
Total Other Securities – AAA Rated (Cost $7,779,398) | | | | | | 8,707,802 | |
| | | | | |
|
|
|
Total Long Term Investments (Cost $116,634,090) | | | | | | 123,282,688 | |
| | | | | |
|
|
|
Short Term Investment (Cost $2,417,066) 1.9% | | | | | | | |
Repurchase Agreement 1.9% | | | | | | | |
aJoint Repurchase Agreement, 3.999%, 1/03/06 (Maturity Value $2,418,140) | | | 2,417,066 | | | 2,417,066 | |
ABN AMRO Bank, N.V., New York Branch (Maturity Value $222,782) | | | | | | | |
Banc of America Securities LLC (Maturity Value $227,620) | | | | | | | |
Barclays Capital Inc. (Maturity Value $227,620) | | | | | | | |
Bear, Stearns & Co. Inc. (Maturity Value $193,741) | | | | | | | |
BNP Paribas Securities Corp. (Maturity Value $227,620) | | | | | | | |
Deutsche Bank Securities Inc. (Maturity Value $96,895) | | | | | | | |
Goldman, Sachs & Co. (Maturity Value $164,675) | | | | | | | |
Greenwich Capital Markets Inc. (Maturity Value $227,620) | | | | | | | |
Lehman Brothers Inc. (Maturity Value $151,545) | | | | | | | |
Merrill Lynch Government Securities Inc. (Maturity Value $227,620) | | | | | | | |
Morgan Stanley & Co. Inc. (Maturity Value $222,782) | | | | | | | |
UBS Securities LLC (Maturity Value $227,620) | | | | | | | |
Collateralized by U.S. Government Agency Securities, 1.875 - 7.25%, 2/15/06 - 11/15/10; bU.S. Government Agency Discount Notes, 1/09/06 - 1/27/06; and U.S. Treasury Notes, 2.375 - 5.75%, 8/15/06 - 8/15/10 | | | | | | | |
| | | | | |
|
|
|
Total Investments (Cost $119,051,156) 100.1% | | | | | | 125,699,754 | |
Other Assets, less Liabilities (0.1)% | | | | | | (104,531 | ) |
| | | | | |
|
|
|
Net Assets 100.0% | | | | | $ | 125,595,223 | |
| | | | | |
|
|
|
Selected Portfolio Abbreviations
| FHLMC | Federal Home Loan Mortgage Corporation |
| FICO | | Financing Corporation |
| FNMA | | Federal National Mortgage Association |
| REFCO | | Resolution Funding Corp. |
aSee Note 1(b) regarding joint repurchase agreement.
bA portion or all of the security is traded on a discount basis with no stated coupon rate.
See notes to financial statements.
FZ10-8
Franklin Templeton Variable Insurance Products Trust
Financial Statements
Statement of Assets and Liabilities
December 31, 2005
| | | | |
| | | Franklin Zero
Coupon Fund -
2010
| |
Assets: | | | | |
Investments in securities: | | | | |
Cost - Unaffiliated issuers | | $ | 116,634,090 | |
Cost - Repurchase agreements | | | 2,417,066 | |
| | |
|
|
|
Total cost of investments | | $ | 119,051,156 | |
| | |
|
|
|
Value - Unaffiliated issuers | | $ | 123,282,688 | |
Value - Repurchase agreements | | | 2,417,066 | |
| | |
|
|
|
Total value of investments | | | 125,699,754 | |
Receivables for capital shares sold | | | 165,848 | |
| | |
|
|
|
Total assets | | | 125,865,602 | |
| | |
|
|
|
Liabilities: | | | | |
Payables: | | | | |
Capital shares redeemed | | | 152,513 | |
Affiliates | | | 72,238 | |
Reports to shareholders | | | 44,242 | |
Accrued expenses and other liabilities | | | 1,386 | |
| | |
|
|
|
Total liabilities | | | 270,379 | |
| | |
|
|
|
Net assets, at value | | $ | 125,595,223 | |
| | |
|
|
|
Net assets consist of: | | | | |
Paid-in capital | | $ | 114,194,406 | |
Undistributed net investment income | | | 4,812,531 | |
Net unrealized appreciation (depreciation) | | | 6,648,598 | |
Accumulated net realized gain (loss) | | | (60,312 | ) |
| | |
|
|
|
Net assets, at value | | $ | 125,595,223 | |
| | |
|
|
|
Class 1: | | | | |
Net assets, at value | | $ | 101,554,804 | |
| | |
|
|
|
Shares outstanding | | | 6,339,403 | |
| | |
|
|
|
Net asset value and offering price per share | | $ | 16.02 | |
| | |
|
|
|
Class 2: | | | | |
Net assets, at value | | $ | 24,040,419 | |
| | |
|
|
|
Shares outstanding | | | 1,506,745 | |
| | |
|
|
|
Net asset value and offering price per share | | $ | 15.96 | |
| | |
|
|
|
See notes to financial statements.
FZ10-9
Franklin Templeton Variable Insurance Products Trust
Financial Statements (continued)
Statement of Operations
for the year ended December 31, 2005
| | | | |
| | | Franklin Zero
Coupon Fund -
2010
| |
Investment income: | | | | |
Interest | | $ | 5,943,610 | |
| | |
|
|
|
Expenses: | | | | |
Management fees (Note 3a) | | | 652,016 | |
Distribution fees - Class 2 (Note 3c) | | | 47,839 | |
Unaffiliated transfer agent fees | | | 325 | |
Custodian fees (Note 4) | | | 2,356 | |
Reports to shareholders | | | 53,598 | |
Professional fees | | | 13,337 | |
Trustees’ fees and expenses | | | 553 | |
Other | | | 3,801 | |
| | |
|
|
|
Total expenses | | | 773,825 | |
| | |
|
|
|
Net investment income | | | 5,169,785 | |
| | |
|
|
|
Realized and unrealized gains (losses): | | | | |
Net realized gain (loss) from investments | | | — | |
Net change in unrealized appreciation (depreciation) on investments | | | (3,661,491 | ) |
| | |
|
|
|
Net realized and unrealized gain (loss) | | | (3,661,491 | ) |
| | |
|
|
|
Net increase (decrease) in net assets resulting from operations | | $ | 1,508,294 | |
| | |
|
|
|
See notes to financial statements.
FZ10-10
Franklin Templeton Variable Insurance Products Trust
Financial Statements (continued)
Statements of Changes in Net Assets
| | | | | | | | |
| | | Franklin Zero
Coupon Fund - 2010
| |
| | | Year Ended December 31,
| |
| | | 2005
| | | 2004
| |
Increase (decrease) in net assets: | | | | | | | | |
Operations: | | | | | | | | |
Net investment income | | $ | 5,169,785 | | | $ | 4,281,583 | |
Net realized gain (loss) from investments | | | — | | | | 600,301 | |
Net change in unrealized appreciation (depreciation) on investments | | | (3,661,491 | ) | | | (834,509 | ) |
| | |
| |
Net increase (decrease) in net assets resulting from operations | | | 1,508,294 | | | | 4,047,375 | |
| | |
| |
Distributions to shareholders from: | | | | | | | | |
Net investment income: | | | | | | | | |
Class 1 | | | (3,666,847 | ) | | | (3,530,602 | ) |
Class 2 | | | (647,355 | ) | | | (683,572 | ) |
Net realized gains: | | | | | | | | |
Class 1 | | | (58,497 | ) | | | — | |
Class 2 | | | (10,862 | ) | | | — | |
| | |
| |
Total distributions to shareholders | | | (4,383,561 | ) | | | (4,214,174 | ) |
| | |
| |
Capital share transactions: (Note 2) | | | | | | | | |
Class 1 | | | 24,917,897 | | | | 6,152,916 | |
Class 2 | | | 10,322,883 | | | | 2,761,404 | |
| | |
| |
Total capital share transactions | | | 35,240,780 | | | | 8,914,320 | |
| | |
| |
Net increase (decrease) in net assets | | | 32,365,513 | | | | 8,747,521 | |
Net assets: | | | | | | | | |
Beginning of year | | | 93,229,710 | | | | 84,482,189 | |
| | |
| |
End of year | | $ | 125,595,223 | | | $ | 93,229,710 | |
| | |
| |
Undistributed net investment income included in net assets: | | | | | | | | |
End of year | | $ | 4,812,531 | | | $ | 3,957,547 | |
| | |
| |
See notes to financial statements.
FZ10-11
Franklin Templeton Variable Insurance Products Trust
Notes to Financial Statements
Franklin Zero Coupon Fund — 2010
1. ORGANIZATION AND SIGNIFICANT ACCOUNTING POLICIES
Franklin Templeton Variable Insurance Products Trust (the Trust) is registered under the Investment Company Act of 1940 as an open-end investment company, consisting of twenty-two separate series. The Franklin Zero Coupon Fund – 2010 (the Fund) included in this report is diversified. The financial statements of the remaining funds in the series are presented separately. Shares of the Fund are sold only to insurance company separate accounts to fund the benefits of variable life insurance policies or variable annuity contracts. As of December 31, 2005, 80.80% of the Fund’s shares were sold through one insurance company.
The following summarizes the Fund’s significant accounting policies.
a. Security Valuation
Securities listed on a securities exchange or on the NASDAQ National Market System are valued at the last quoted sale price or the official closing price of the day, respectively. Over-the-counter securities and listed securities for which there is no reported sale are valued within the range of the most recent quoted bid and ask prices. Securities that trade in multiple markets or on multiple exchanges are valued according to the broadest and most representative market.
Government securities generally trade in the over-the-counter market rather than on a securities exchange. The Trust may utilize independent pricing services, quotations from bond dealers, and information with respect to bond and note transactions, to assist in determining a current market value for each security. The Trust’s pricing services may use valuation models or matrix pricing which considers information with respect to comparable bond and note transactions, quotations from bond dealers, or by reference to other securities that are considered comparable in such characteristics as rating, interest rate and maturity date, option adjusted spread models, prepayment projections, interest rate spreads and yield curves, to determine current value.
The Trust has procedures to determine the fair value of individual securities and other assets for which market prices are not readily available or which may not be reliably priced. Methods for valuing these securities may include: fundamental analysis, matrix pricing, discounts from market prices of similar securities, or discounts applied due to the nature and duration of restrictions on the disposition of the securities. Due to the inherent uncertainty of valuations of such securities, the fair values may differ significantly from the values that would have been used had a ready market for such investments existed. Occasionally, events occur between the time at which trading in a security is completed and the close of the NYSE that might call into question the availability (including the reliability) of the value of a portfolio security held by the Fund. If such an event occurs, the securities may be valued using fair value procedures, which may include the use of independent pricing services. All security valuation procedures are approved by the Trust’s Board of Trustees.
b. Joint Repurchase Agreement
The Fund may enter into a joint repurchase agreement whereby its uninvested cash balance is deposited into a joint cash account with other funds managed by the investment manager or an affiliate of the investment manager and is used to invest in one or more repurchase agreements. The value and face amount of the joint repurchase agreement are allocated to the funds based on their pro-rata interest. A repurchase agreement is accounted for as a loan by the Fund to the seller, collateralized by securities which are delivered to the Fund’s custodian. The market value, including accrued interest, of the initial collateralization is required to be at least 102% of the dollar amount invested by the Funds, with the value of the underlying securities marked to market daily to maintain coverage of at least 100%. Repurchase agreements are valued at cost. At December 31, 2005, all repurchase agreements held by the Fund had been entered into on December 30, 2005.
c. Income Taxes
No provision has been made for U.S. income taxes because the Fund’s policy is to continue to qualify as a regulated investment company under the Internal Revenue Code and to distribute to shareholders substantially all of its taxable income and net realized gains.
FZ10-12
Franklin Templeton Variable Insurance Products Trust
Notes to Financial Statements (continued)
Franklin Zero Coupon Fund — 2010
1. ORGANIZATION AND SIGNIFICANT ACCOUNTING POLICIES (continued)
d. Security Transactions, Investment Income, Expenses and Distributions
Security transactions are accounted for on trade date. Realized gains and losses on security transactions are determined on a specific identification basis. Interest income and estimated expenses are accrued daily. Amortization of premium and accretion of discount on debt securities are included in interest income. Distributions to shareholders are recorded on the ex-dividend date and are determined according to income tax regulations (tax basis). Such distributions are reinvested in additional shares of the Fund. Distributable earnings determined on a tax basis may differ from earnings recorded in accordance with generally accepted accounting principles. These differences may be permanent or temporary. Permanent differences are reclassified among capital accounts to reflect their tax character. These reclassifications have no impact on net assets or the results of operations. Temporary differences are not reclassified, as they may reverse in subsequent periods.
Common expenses incurred by the Trust are allocated among the funds based on the ratio of net assets of each Fund to the combined net assets of the Trust. Fund specific expenses are charged directly to the fund that incurred the expense.
Realized and unrealized gains and losses and net investment income, other than class specific expenses, are allocated daily to each class of shares based upon the relative proportion of net assets of each class.
e. Accounting Estimates
The preparation of financial statements in accordance with accounting principles generally accepted in the United States of America requires management to make estimates and assumptions that affect the reported amounts of assets and liabilities at the date of the financial statements and the amounts of income and expenses during the reporting period. Actual results could differ from those estimates.
f. Guarantees and Indemnifications
Under the Trust’s organizational documents, its officers and trustees are indemnified by the Trust against certain liabilities arising out of the performance of their duties to the Trust. Additionally, in the normal course of business, the Trust enters into contracts with service providers that contain general indemnification clauses. The Trust’s maximum exposure under these arrangements is unknown as this would involve future claims that may be made against the Trust that have not yet occurred. However, based on experience, the Trust expects the risk of loss to be remote.
2. SHARES OF BENEFICIAL INTEREST
The Fund offers two classes of shares: Class 1 and Class 2. Each class of shares differs by its distribution fees, voting rights on matters affecting a single class and its exchange privilege.
At December 31, 2005, there were an unlimited number of shares authorized ($0.01 par value). Transactions in the Fund’s shares were as follows:
| | | | | | | | | | | | | | |
| | | Year Ended December 31,
| |
| | | 2005
| | | 2004
| |
| Class 1 Shares: | | Shares
| | | Amount
| | | Shares
| | | Amount
| |
Shares sold | | 1,849,021 | | | $ | 29,861,423 | | | 973,868 | | | $ | 16,002,484 | |
Shares issued in reinvestment of distributions | | 231,676 | | | | 3,725,344 | | | 226,611 | | | | 3,530,602 | |
Shares redeemed | | (531,312 | ) | | | (8,668,870 | ) | | (812,206 | ) | | | (13,380,170 | ) |
| | |
| |
Net increase (decrease) | | 1,549,385 | | | $ | 24,917,897 | | | 388,273 | | | $ | 6,152,916 | |
| | |
| |
FZ10-13
Franklin Templeton Variable Insurance Products Trust
Notes to Financial Statements (continued)
Franklin Zero Coupon Fund — 2010
2. SHARES OF BENEFICIAL INTEREST (continued)
| | | | | | | | | | | | | | |
| | | Year Ended December 31,
| |
| | | 2005
| | | 2004
| |
| Class 2 Shares: | | Shares
| | | Amount
| | | Shares
| | | Amount
| |
Shares sold | | 706,922 | | | $ | 11,405,935 | | | 780,969 | | | $ | 13,083,577 | |
Shares issued in reinvestment of distributions | | 41,036 | | | | 658,217 | | | 43,960 | | | | 683,572 | |
Shares redeemed | | (108,627 | ) | | | (1,741,269 | ) | | (662,743 | ) | | | (11,005,745 | ) |
| | |
| |
Net increase (decrease) | | 639,331 | | | $ | 10,322,883 | | | 162,186 | | | $ | 2,761,404 | |
| | |
| |
3. TRANSACTIONS WITH AFFILIATES
Franklin Resources, Inc. is the holding company for various subsidiaries that together are referred to as Franklin Templeton Investments. Certain officers and trustees of the Trust are also officers and/or directors of the following subsidiaries:
| | |
| Subsidiary | | Affiliation |
Franklin Advisers, Inc. (Advisers) | | Investment manager |
Franklin Templeton Services, LLC (FT Services) | | Administrative manager |
Franklin Templeton Distributors, Inc. (Distributors) | | Principal underwriter |
Franklin Templeton Investor Services, LLC (Investor Services) | | Transfer agent |
a. Management Fees
The Fund pays an investment management fee to Advisers based on the average daily net assets of the Fund as follows:
| | |
| Annualized Fee Rate | | Daily Net Assets |
| 0.625% | | Up to and including $100 million |
| 0.500% | | Over $100 million, up to and including $250 million |
| 0.450% | | Over $250 million, up to and including $10 billion |
| 0.440% | | Over $10 billion, up to and including $12.5 billion |
| 0.420% | | Over $12.5 billion, up to and including $15 billion |
| 0.400% | | In excess of $15 billion |
b. Administrative Fees
Under an agreement with Advisers, FT Services provides administrative services to the Fund. The fee is paid by Advisers based on average daily net assets, and is not an additional expense of the Fund.
c. Distribution Fees
The Fund’s Board of Trustees has adopted distribution plans for Class 2 shares pursuant to Rule 12b-1 under the 1940 Act. Under the Fund’s compensation distribution plans, the Fund pays Distributors for costs incurred in connection with the sale and distribution of the Fund’s shares up to 0.35% per year of its average daily net assets. The Board of Trustees has set the current rate at 0.25% per year.
d. Transfer Agent Fees
Investor Services, under terms of an agreement, performs shareholder servicing for the Fund and is not paid by the Fund for the services.
FZ10-14
Franklin Templeton Variable Insurance Products Trust
Notes to Financial Statements (continued)
Franklin Zero Coupon Fund — 2010
4. EXPENSE OFFSET ARRANGEMENT
The Fund has entered into an arrangement with its custodian whereby credits realized as a result of uninvested cash balances are used to reduce a portion of the Fund’s custodian expenses. During the year ended December 31, 2005, there were no credits earned.
5. INCOME TAXES
The tax character of distributions paid during the years ended December 31, 2005 and 2004, was as follows:
| | | | | | |
| | | 2005
| | 2004
|
Distributions paid from: | | | | | | |
Ordinary Income | | $ | 4,314,801 | | $ | 4,214,174 |
Long term capital gain | | | 68,760 | | | — |
| | |
|
| | | $ | 4,383,561 | | $ | 4,214,174 |
| | |
|
At December 31, 2005, the cost of investments, net unrealized appreciation (depreciation) and undistributed ordinary income for income tax purposes were as follows:
| | | | |
Cost of investments | | $ | 119,110,815 | |
| | |
|
|
|
| |
Unrealized appreciation | | $ | 7,469,213 | |
Unrealized depreciation | | | (880,274 | ) |
| | |
|
|
|
Net unrealized appreciation (depreciation) | | $ | 6,588,939 | |
| | |
|
|
|
Distributable earnings — undistributed ordinary income | | $ | 4,811,874 | |
| | |
|
|
|
Net investment income differs for financial statement and tax purposes primarily due to differing treatment of bond discounts.
Net realized gains (losses) differ for financial statement and tax purposes primarily due to differing treatments of wash sales.
6. INVESTMENT TRANSACTIONS
Purchases of investments (excluding short term securities) for the year ended December 31, 2005, aggregated $29,351,527. There were no sales.
7. REGULATORY MATTERS
As part of various investigations by a number of federal, state, and foreign regulators and governmental entities, relating to certain practices in the mutual fund industry, including late trading, market timing and marketing support payments to securities dealers who sell fund shares, Franklin Resources, Inc. and certain of its subsidiaries (collectively, the “Company”), entered into settlements with certain of those regulators.
Specifically, the Company entered into settlements with the Securities and Exchange Commission (“SEC”) concerning market timing (the “August 2, 2004 SEC Order”) and marketing support payments to securities dealers who sell fund shares (the “December 13, 2004 SEC Order”) and with the California Attorney General’s Office (“CAGO”) concerning marketing support payments to securities dealers who sell fund shares (the “CAGO Settlement”). Under the terms of the settlements with the SEC and the CAGO, the Company retained an Independent Distribution Consultant (“IDC”) to develop a plan for distribution of the respective settlement monies. The CAGO approved the distribution plan under the CAGO Settlement and, in accordance with the terms and conditions of that settlement, the monies were disbursed to the relevant funds. The SEC has not yet approved the distribution plan pertaining to the December 13, 2004 SEC Order. When approved, disbursements of settlement monies will be made promptly to the relevant funds, in accordance with the terms and conditions of that order. The IDC continues to develop the plan of distribution under the August 2, 2004 SEC Order that resolved the SEC’s market timing investigation.
FZ10-15
Franklin Templeton Variable Insurance Products Trust
Notes to Financial Statements (continued)
Franklin Zero Coupon Fund — 2010
In addition, the Company, as well as most of the mutual funds within Franklin Templeton Investments and certain current or former officers, directors, and/or employees, have been named in private lawsuits (styled as shareholder class actions, or as derivative actions on behalf of either the named funds or Franklin Resources, Inc.) relating to the industry practices referenced above, as well as to allegedly excessive advisory fees, commissions, and/or 12b-1 fees. The lawsuits were filed in different courts throughout the country. Many of those suits are now pending in a multi-district litigation in the United States District Court for the District of Maryland.
The Company and fund management strongly believe that the claims made in each of the private lawsuits referenced above are without merit and intend to defend against them vigorously. The Company cannot predict with certainty the eventual outcome of these lawsuits, nor whether they will have a material negative impact on the Company. If it is determined that the Company bears responsibility for any unlawful or inappropriate conduct that caused losses to the Trust, it is committed to making the Trust or their shareholders whole, as appropriate.
FZ10-16
Franklin Templeton Variable Insurance Products Trust
Franklin Zero Coupon Fund — 2010
Report of Independent Registered Public Accounting Firm
To the Board of Trustees and Shareholders of
Franklin Templeton Variable Insurance Products Trust
In our opinion, the accompanying statement of assets and liabilities, including the statement of investments, and the related statements of operations and of changes in net assets and the financial highlights present fairly, in all material respects, the financial position of Franklin Zero Coupon Fund – 2010 (one of the funds constituting Franklin Templeton Variable Insurance Products Trust, hereafter referred to as the “Fund”) at December 31, 2005, the results of its operations for the year then ended, the changes in its net assets for each of the two years in the period then ended and the financial highlights for each of the periods presented, in conformity with accounting principles generally accepted in the United States of America. These financial statements and financial highlights (hereafter referred to as “financial statements”) are the responsibility of the Fund’s management; our responsibility is to express an opinion on these financial statements based on our audits. We conducted our audits of these financial statements in accordance with the standards of the Public Company Accounting Oversight Board (United States). Those standards require that we plan and perform the audit to obtain reasonable assurance about whether the financial statements are free of material misstatement. An audit includes examining, on a test basis, evidence supporting the amounts and disclosures in the financial statements, assessing the accounting principles used and significant estimates made by management, and evaluating the overall financial statement presentation. We believe that our audits, which included confirmation of securities at December 31, 2005, by correspondence with the custodian, provide a reasonable basis for our opinion.
PricewaterhouseCoopers LLP
San Francisco, California
February 10, 2006
FZ10-17
MUTUAL DISCOVERY SECURITIES FUND
We are pleased to bring you Mutual Discovery Securities Fund’s annual report for the fiscal year ended December 31, 2005.
Performance Summary as of 12/31/05
Average annual total return of Class 1 shares represents the average annual change in value, assuming reinvestment of dividends and capital gains. Average returns smooth out variations in returns, which can be significant; they are not the same as year-by-year results.
Periods ended 12/31/05
| | | | | | |
| | | 1-Year | | 5-Year | | Since
Inception
(11/8/96) |
Average Annual Total Return | | +16.28% | | +10.21% | | +10.88% |
Total Return Index Comparison
for Hypothetical $10,000 Investment (11/8/96–12/31/05)
The graph below shows the change in value of a hypothetical $10,000 investment in the Fund over the indicated period and includes reinvestment of any income or distributions. The Fund’s performance is compared to the performance of the Standard & Poor’s 500 Index (S&P 500) and the Morgan Stanley Capital International (MSCI) World Index. One cannot invest directly in an index, nor is an index representative of the Fund’s portfolio. Please see Important Notes to Performance Information preceding the Fund Summaries.
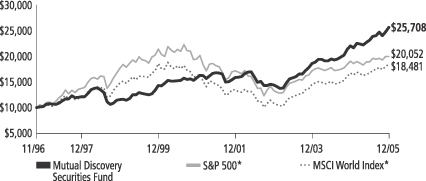
*Source: Standard & Poor’s Micropal. Please see Index Descriptions following the Fund Summaries.
Mutual Discovery Securities Fund – Class 1
Performance reflects the Fund’s Class 1 operating expenses, but does not include any contract fees, expenses or sales charges. If they had been included, performance would be lower. These charges and deductions, particularly for variable life policies, can have a significant effect on contract values and insurance benefits. See the contract prospectus for a complete description of these expenses, including sales charges.
Performance data represent past performance, which does not guarantee future results. Investment return and principal value will fluctuate, and you may have a gain or loss when you sell your shares.
Current performance may differ from figures shown.
MD-1
Fund Goal and Main Investments: Mutual Discovery Securities Fund seeks capital appreciation. The Fund normally invests mainly in U.S. and foreign equity securities that the manager believes are undervalued. The Fund invests substantially in undervalued stocks, risk arbitrage securities and distressed companies.
Performance Overview
You can find the Fund’s one-year total return in the Performance Summary. The Fund outperformed its benchmarks, the S&P 500 and the MSCI World Index, which returned +4.91% and +10.02% for the same period.1
Economic and Market Overview
The global economy overcame fears of derailment generated by higher energy costs and advanced at a solid clip during 2005, with Europe surpassing expectations. Excluding the volatile energy and food sectors, inflation remained relatively subdued worldwide, and monetary policy remained fairly accommodative. The U.S. Federal Reserve Board raised the short-term federal funds target rate with eight quarter-point increases, bringing it to 4.25%. The European Central Bank (ECB) made one quarter-point rise in short-term rates, its first increase after keeping rates at historically low levels for more than two and a half years. Even after the increases, both rates remained at levels considered accommodative for economic growth.
Strong demand for oil sustained high prices during most of the year, while prices for other commodities such as industrial metals were also high, led by copper, whose contract price rose 45.4% during 2005.2 This contributed to economic growth in countries such as Australia and Canada, and emerging markets in Asia and Latin America that are tied to mining and industrial commodities.
In this environment, global equity markets performed strongly, particularly outside the U.S. One-year total return for the MSCI All Country (AC) World ex US Index was +17.11% in U.S. dollar terms.3 By
1. Source: Standard & Poor’s Micropal. One cannot invest directly in an index, nor is an index representative of the Fund’s portfolio. Please see Index Descriptions following the Fund Summaries.
2. Source: New York Mercantile Exchange.
3. Source: Standard & Poor’s Micropal. Please see Index Descriptions following the Fund Summaries.
Fund Risks: The Fund’s investments in stocks offer the potential for long-term gains but can be subject to short-term up-and-down price movements. Investments in companies involved in mergers, liquidations, reorganizations and distressed bankruptcy, which may include defaulted debt, involve higher credit and other risks. Foreign investing involves special risks including currency fluctuations, economic instability, and social and political developments. Smaller and midsize company securities involve special risks such as relatively small revenues, limited product lines, and small market share. The Fund’s prospectus also includes a description of the main investment risks.
MD-2
comparison the total return for the MSCI USA Index was +5.72%.3 In terms of sectors, energy and materials led equity market performance, and telecommunication services and consumer-related sectors lagged.
Among developed countries, the Japanese equity market performed well, returning +44.70% in local currency terms for the year under review.4 However, this market benefited primarily from investors outside Japan, and the return was significantly less (+25.62%) after conversion into U.S. dollars.4 In contrast, the conversion into dollars enhanced equity market returns in Brazil (+57.04%), Mexico (+49.11%) and South Korea (+58.00%).4 At the beginning of the year, the consensus of many analysts appeared to be that the U.S. dollar would decline in value relative to major currencies. In fact, for the year the dollar appreciated versus the yen, the euro, the pound and most other currencies.
Investment Strategy
At Mutual Series, we are committed to our distinctive value approach to investing, which we believe can generate above-average risk-adjusted returns over time for our shareholders. Our major investment strategy is investing in undervalued stocks. When selecting undervalued equities, we are generally attracted to fundamentally strong companies with healthy balance sheets, high-quality assets, substantial free cash flow and shareholder-oriented management teams and whose stocks are trading at discounts to our assessment of the companies’ intrinsic or business value. We also look for asset rich companies whose shares may be trading at depressed levels due to concerns over short-term earnings disappointments, litigation, management strategy or other perceived negatives. This strict value approach is not only intended to improve the likelihood of upside potential, but can also help reduce the risk of substantial declines. While the vast majority of our undervalued equity investments are made in publicly traded companies globally, we may invest occasionally in privately held companies as well.
We complement this more traditional investment strategy with two others. One is distressed investing, a highly specialized field that is complex and can take many forms. The most common distressed investment the Fund undertakes is the purchase of financially troubled or bankrupt companies’ debt at a substantial discount to face value.
4. Source: Standard & Poor’s Micropal. Individual country market returns are measured by MSCI country-specific indexes.
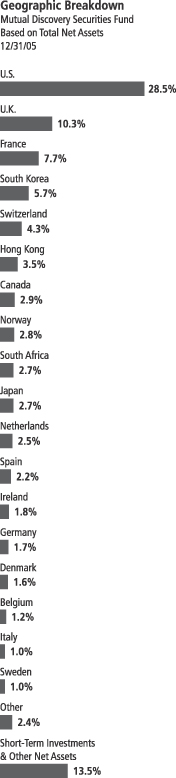
MD-3
After the financially distressed company is reorganized, often in bankruptcy court, the old debt is typically replaced with new securities issued by the financially stronger company.
The other piece of our investment strategy is participating in arbitrage situations, another highly specialized field. When companies announce mergers or takeovers, commonly referred to as “deals,” the target company may trade at a discount to the bid it ultimately accepts. One form of arbitrage involves purchasing the target company’s stock when it is trading below the value it may receive in a deal. In keeping with our commitment to a relatively conservative investment approach, we typically focus our arbitrage efforts on announced deals, and eschew rumored deals or other situations we consider relatively risky. In addition, we will generally seek to hedge the Fund’s currency exposure when we deem it advantageous, to focus our efforts on analyzing business fundamentals and assessing the value of company assets and liabilities.
Manager’s Discussion
While our distressed debt and risk arbitrage portfolios were positive contributors to performance, the Fund’s equity portfolio was the strongest contributor to performance for the 12 months under review. Three of our best performing stock investments were British American Tobacco (BAT), Mitsubishi UFJ Financial Group (MUFG) and Anglo American.
London-based BAT is the world’s second-largest cigarette manufacturer behind Philip Morris. With about a 15% global market share, BAT enjoys strong market positions in Europe, North America and several emerging markets. The company’s stock appreciated 52% in local currency in 2005 as the company delivered robust operational performance driven by increasing sales volumes and an improving product mix. BAT benefited from an acceleration of its sales in emerging markets, a focused development of its higher-margin global brands, and a further reduction of its cost base. During the year, the company returned most of its free cash flow to shareholders through dividends and share buybacks. This caused a number of analysts to raise their earnings growth projections for BAT. As the year came to a close, BAT narrowed its valuation discount versus its publicly traded European peer group.
MUFG contributed positively to the Fund’s performance during the period with a stock price appreciation of 55% in local currency. MUFG, the largest of Japan’s megabanks, as well as the largest bank in the world by assets, experienced a significant expansion in profitability as Japan’s credit quality recovery and economic turnaround continued
Top 10 Sectors/Industries
Mutual Discovery Securities Fund
Based on Equity Securities
12/31/05
| | |
| | | % of Total
Net Assets |
| |
| Tobacco | | 14.5% |
| |
| Food Products | | 8.7% |
| |
| Insurance | | 7.5% |
| |
| Commercial Banks | | 5.7% |
| |
| Media | | 5.6% |
| |
| Beverages | | 5.5% |
| |
| Metals & Mining | | 5.3% |
| |
| Diversified Financial Services | | 4.3% |
| |
| Paper & Forest Products | | 3.8% |
| |
| Real Estate | | 2.5% |
MD-4
throughout 2005. Foreign investors purchased shares as they anticipated growth in fee income, a pickup in loan demand, and higher interest rates as Japan’s economy grows. Further bolstering MUFG’s prospects was the integration of UFJ Holdings, which has the potential to deliver significant cost and tax synergies in coming years. We continued to find Japan an interesting market given that the banks are seeing the return of consumer confidence and are finally building adequate capital ratios. Furthermore, we believe much of the rest of the world has seen a peak in the credit cycle while Japan continues to experience a recovery.
U.K.-headquartered Anglo American is a global mining and natural resources company with substantial interests in platinum, gold, diamonds, base and ferrous metals, coal, industrial minerals, and paper and packaging. The company is geographically diverse with operations in Africa, Europe, the Americas, Australia and Asia. The stock appreciated 66% in local currency during the year. In 2005, Anglo and its peers in the mining sector benefited from a strong commodity cycle and high metal prices driven by sustained world demand, particularly from China. Furthermore, management announced in October that the company would strategically refocus activities on its core mining businesses and return capital to shareholders. This development was positively received by investors and resulted in a reduction of the conglomerate discount traditionally given to Anglo by the markets.
Detractors from Fund performance during the 12 months under review included Kindred Healthcare, a U.S. health care provider; White Mountains Insurance Group, a U.S. insurance company; and Washington Post, a U.S. newspaper and publishing company.
Kindred shares declined 14% in 2005 after the company posted disappointing results in its second and third quarters. Valuations at year-end also reflected the industry’s challenging Medicare reimbursement climate, which was pressured by high federal deficits.5
White Mountains’ shares weakened (-12%) largely due to the company’s exposure to areas devastated by Hurricane Katrina, which may have caused the largest total insured loss in history.
5. A member of Franklin Mutual Advisers, Inc., serves on Kindred’s board of directors.
Top 10 Holdings
Mutual Discovery Securities Fund
12/31/05
| | |
Company Sector/Industry,
Country | | % of Total
Net Assets |
| |
| Berkshire Hathaway Inc., A & B | | 4.3% |
| Insurance, U.S. | | |
| |
British American
Tobacco PLC | | 3.8% |
| Tobacco, U.K. | | |
| |
| KT&G Corp., ord. & 144A | | 2.7% |
| Tobacco, South Korea | | |
| |
| Anglo American PLC | | 2.7% |
| Metals & Mining, South Africa | | |
| |
| Weyerhaeuser Co. | | 2.3% |
| Paper & Forest Products, U.S. | | |
| |
| Orkla ASA | | 2.2% |
| Food Products, Norway | | |
| |
Imperial Tobacco
Group PLC | | 2.1% |
| Tobacco, U.K. | | |
| |
| Altadis SA | | 2.1% |
| Tobacco, Spain | | |
| |
| Nestle SA | | 2.1% |
| Food Products, Switzerland | | |
| |
| Mitsubishi UFJ Financial Group Inc. | | 1.7% |
| Commercial Banks, Japan | | |
The dollar value, number of shares or principal amount, and names of all portfolio holdings are listed in the Fund’s Statement of Investments.
MD-5
Shares in Washington Post underperformed (-22%) as Kaplan, the company’s education business, reported limited margin expansion; and hurricane damage to the Gulf Coast negatively impacted Cable One, its cable operations. Additionally, the advertising market was soft overall, but particularly pronounced for weekly publications, which hurt revenues at Newsweek.
We also feel it is appropriate to comment on our currency hedging posture given our international exposure and recent exchange rate volatility. We generally seek to hedge foreign currency risks to focus Fund performance on the underlying quality of our investment decisions. We have the ability, when we believe currency values are fundamentally misaligned, to adjust this hedging ratio to capitalize on these misvaluations. Entering 2005, the Fund was less than fully hedged in foreign currencies. Although the U.S. dollar’s future movements are unpredictable, given recent events in Europe, including negative developments in the European Union integration process and lackluster economic performance that could lead to potentially lower interest rates, we increased our euro hedging ratios over the course of the year. At period-end, we remained less than fully hedged in foreign currencies.
Thank you for your participation in Mutual Discovery Securities Fund. We look forward to serving your future investment needs.
The foregoing information reflects our analysis, opinions and portfolio holdings as of December 31, 2005, the end of the reporting period. The way we implement our main investment strategies and the resulting portfolio holdings may change depending on factors such as market and economic conditions. These opinions may not be relied upon as investment advice or an offer for a particular security. The information is not a complete analysis of every aspect of any market, country, industry, security or the Fund. Statements of fact are from sources considered reliable, but the adviser makes no representation or warranty as to their completeness or accuracy. Although historical performance is no guarantee of future results, these insights may help you understand our investment management philosophy.
MD-6
Fund Expenses
As an investor in a variable insurance contract (“Contract”) that indirectly provides for investment in an underlying mutual fund, you can incur transaction and/or ongoing expenses at both the Fund level and the Contract level.
| • | | Transaction expenses can include sales charges (loads) on purchases, redemption fees, surrender fees, transfer fees and premium taxes. |
| • | | Ongoing expenses can include management fees, distribution and service (12b-1) fees, contract fees, annual maintenance fees, mortality and expense risk fees and other fees and expenses. All mutual funds and Contracts have some types of ongoing expenses. |
The expenses shown in the table below are meant to highlight ongoing expenses at the Fund level only and do not include ongoing expenses at the Contract level, or transaction expenses at either the Fund or Contract level. While the Fund does not have transaction expenses, if the transaction and ongoing expenses at the Contract level were included, the expenses shown below would be higher. You should consult your Contract prospectus or disclosure document for more information.
The table shows Fund-level ongoing expenses and can help you understand these expenses and compare them with those of other mutual funds offered through the Contract. The table assumes a $1,000 investment held for the six months indicated. Please refer to the Fund prospectus for additional information on operating expenses.
Actual Fund Expenses
The first line (Actual) of the table below provides actual account values and expenses. The “Ending Account Value” is derived from the Fund’s actual return, which includes the effect of ongoing Fund expenses, but does not include the effect of ongoing Contract expenses.
You can estimate the Fund-level expenses you incurred during the period by following these steps. Of course, your account value and expenses will differ from those in this illustration:
| 1. | Divide your account value by $1,000. |
If an account had an $8,600 value, then $8,600 ÷ $1,000 = 8.6.
| 2. | Multiply the result by the number under the heading “Fund-Level Expenses Incurred During Period.” |
If Fund-Level Expenses Incurred During Period were $7.50, then 8.6 × $7.50 = $64.50.
Mutual Discovery Securities Fund – Class 1
MD-7
In this illustration, the estimated expenses incurred this period at the Fund level are $64.50.
Hypothetical Example for Comparison with Other Mutual Funds
Information in the second line (Hypothetical) of the table can help you compare ongoing expenses of the Fund with those of other mutual funds offered through the Contract. This information may not be used to estimate the actual ending account balance or expenses you incurred during the period. The hypothetical “Ending Account Value” is based on the Fund’s actual expense ratio and an assumed 5% annual rate of return before expenses, which does not represent the Fund’s actual return. The figure under the heading “Fund-Level Expenses Incurred During Period” shows the hypothetical expenses your account would have incurred under this scenario. You can compare this figure with the 5% hypothetical examples that appear in shareholder reports of other funds offered through a Contract.
| | | | | | | | | |
| Class 1 | | Beginning
Account
Value 7/1/05 | | Ending
Account
Value 12/31/05 | | Fund-Level
Expenses Incurred
During Period*
7/1/05-12/31/05 |
Actual | | $ | 1,000 | | $ | 1,108.20 | | $ | 5.47 |
Hypothetical (5% return before expenses) | | $ | 1,000 | | $ | 1,020.01 | | $ | 5.24 |
*Expenses are equal to the annualized expense ratio for the Fund’s Class 1 shares (1.03%), which does not include any ongoing expenses of the Contract for which the Fund is an investment option, multiplied by the average account value over the period, multiplied by 184/365 to reflect the one-half year period.
MD-8
Franklin Templeton Variable Insurance Products Trust
Financial Highlights
Mutual Discovery Securities Fund
| | | | | | | | | | | | | | | | | | | | |
| | | Year Ended December 31,
| |
| Class 1 | | 2005 | | | 2004 | | | 2003 | | | 2002 | | | 2001 | |
| | |
|
|
|
Per share operating performance | | | | | | | | | | | | | | | | | | | | |
(for a share outstanding throughout the year) | | | | | | | | | | | | | | | | | | | | |
Net asset value, beginning of year | | $ | 16.44 | | | $ | 14.04 | | | $ | 11.06 | | | $ | 12.56 | | | $ | 14.55 | |
| | |
|
|
|
Income from investment operations: | | | | | | | | | | | | | | | | | | | | |
Net investment incomea | | | 0.25 | | | | 0.26 | | | | 0.19 | | | | 0.19 | | | | 0.24 | |
Net realized and unrealized gains (losses) | | | 2.40 | | | | 2.31 | | | | 3.01 | | | | (1.28 | ) | | | (0.08 | ) |
| | |
|
|
|
Total from investment operations | | | 2.65 | | | | 2.57 | | | | 3.20 | | | | (1.09 | ) | | | 0.16 | |
| | |
|
|
|
Less distributions from: | | | | | | | | | | | | | | | | | | | | |
Net investment income | | | (0.24 | ) | | | (0.17 | ) | | | (0.22 | ) | | | (0.19 | ) | | | (0.30 | ) |
Net realized gains | | | — | | | | — | | | | — | | | | (0.22 | ) | | | (1.85 | ) |
| | |
|
|
|
Total distributions | | | (0.24 | ) | | | (0.17 | ) | | | (0.22 | ) | | | (0.41 | ) | | | (2.15 | ) |
| | |
|
|
|
Net asset value, end of year | | $ | 18.85 | | | $ | 16.44 | | | $ | 14.04 | | | $ | 11.06 | | | $ | 12.56 | |
| | |
|
|
|
| | | | | |
Total returnb | | | 16.28% | | | | 18.55% | | | | 29.19% | | | | (9.06)% | | | | 0.39% | |
Ratios/supplemental data | | | | | | | | | | | | | | | | | | | | |
Net assets, end of year (000’s) | | $ | 136,508 | | | $ | 137,703 | | | $ | 134,332 | | | $ | 122,011 | | | $ | 164,527 | |
Ratios to average net assets:* | | | | | | | | | | | | | | | | | | | | |
Expensesc | | | 1.03% | | | | 1.01% | | | | 1.04% | | | | 1.03% | | | | 1.02% | |
Net investment income | | | 1.37% | | | | 1.71% | | | | 1.48% | | | | 1.55% | | | | 1.76% | |
Portfolio turnover rate | | | 22.94% | | | | 29.81% | | | | 41.52% | | | | 47.46% | | | | 64.58% | |
* Ratios to average net assets, excluding dividend expense on securities sold short: | | | | | | | | | | | | | | | | | | | | |
Expenses | | | 1.00% | | | | 1.00% | | | | 1.01% | | | | 1.02% | | | | 1.00% | |
| a | Based on average daily shares outstanding. |
| b | Total return does not include any fees, charges or expenses imposed by the variable annuity and life insurance contracts for which the Franklin Templeton Variable Insurance Products Trust serves as an underlying investment vehicle. |
| c | Includes dividend expense on securities sold short which varies from period to period. See below for expense ratios that reflect only operating expenses. |
See notes to financial statements.
MD-9
Franklin Templeton Variable Insurance Products Trust
Financial Highlights (continued)
Mutual Discovery Securities Fund (continued)
| | | | | | | | | | | | | | | | | | | | |
| | | Year Ended December 31,
| |
| Class 2 | | 2005 | | | 2004 | | | 2003 | | | 2002 | | | 2001 | |
| | |
|
|
|
Per share operating performance | | | | | | | | | | | | | | | | | | | | |
(for a share outstanding throughout the year) | | | | | | | | | | | | | | | | | | | | |
Net asset value, beginning of year | | $ | 16.25 | | | $ | 13.90 | | | $ | 10.97 | | | $ | 12.50 | | | $ | 14.50 | |
| | |
|
|
|
Income from investment operations: | | | | | | | | | | | | | | | | | | | | |
Net investment incomea | | | 0.19 | | | | 0.21 | | | | 0.13 | | | | 0.16 | | | | 0.13 | |
Net realized and unrealized gains (losses) | | | 2.38 | | | | 2.30 | | | | 3.02 | | | | (1.29 | ) | | | 0.01 | |
| | |
|
|
|
Total from investment operations | | | 2.57 | | | | 2.51 | | | | 3.15 | | | | (1.13 | ) | | | 0.14 | |
| | |
|
|
|
Less distributions from: | | | | | | | | | | | | | | | | | | | | |
Net investment income | | | (0.22 | ) | | | (0.16 | ) | | | (0.22 | ) | | | (0.18 | ) | | | (0.29 | ) |
Net realized gains | | | — | | | | — | | | | — | | | | (0.22 | ) | | | (1.85 | ) |
| | |
|
|
|
Total distributions | | | (0.22 | ) | | | (0.16 | ) | | | (0.22 | ) | | | (0.40 | ) | | | (2.14 | ) |
| | |
|
|
|
Net asset value, end of year | | $ | 18.60 | | | $ | 16.25 | | | $ | 13.90 | | | $ | 10.97 | | | $ | 12.50 | |
| | |
|
|
|
| | | | | |
Total returnb | | | 15.97% | | | | 18.19% | | | | 28.99% | | | | (9.40)% | | | | 0.24% | |
Ratios/supplemental data | | | | | | | | | | | | | | | | | | | | |
Net assets, end of year (000’s) | | $ | 811,975 | | | $ | 403,560 | | | $ | 160,371 | | | $ | 37,241 | | | $ | 5,681 | |
Ratios to average net assets:* | | | | | | | | | | | | | | | | | | | | |
Expensesc | | | 1.28% | | | | 1.26% | | | | 1.29% | | | | 1.28% | | | | 1.27% | |
Net investment income | | | 1.12% | | | | 1.46% | | | | 1.23% | | | | 1.30% | | | | 1.03% | |
Portfolio turnover rate | | | 22.94% | | | | 29.81% | | | | 41.52% | | | | 47.46% | | | | 64.58% | |
* Ratios to average net assets, excluding dividend expense on securities sold short: | | | | | | | | | | | | | | | | | | | | |
Expenses | | | 1.25% | | | | 1.25% | | | | 1.26% | | | | 1.27% | | | | 1.25% | |
| a | Based on average daily shares outstanding. |
| b | Total return does not include any fees, charges or expenses imposed by the variable annuity and life insurance contracts for which the Franklin Templeton Variable Insurance Products Trust serves as an underlying investment vehicle. |
| c | Includes dividend expense on securities sold short which varies from period to period. See below for expense ratios that reflect only operating expenses. |
See notes to financial statements.
MD-10
Franklin Templeton Variable Insurance Products Trust
Statement of Investments, December 31, 2005
| | | | | | | |
| Mutual Discovery Securities Fund | | Country | | Shares/
Warrants/
Contracts | | Value |
Common Stocks and Other Equity Interests 85.9% | | | | | | | |
Aerospace & Defense 0.1% | | | | | | | |
Northrop Grumman Corp. | | United States | | 22,560 | | $ | 1,356,082 |
| | | | | | |
|
|
Airlines 0.4% | | | | | | | |
aACE Aviation Holdings Inc. | | Canada | | 81,098 | | | 2,651,401 |
a,bACE Aviation Holdings Inc., A, 144A | | Canada | | 23,395 | | | 961,034 |
aACE Aviation Holdings Inc., B | | Canada | | 76 | | | 2,476 |
a,cAir Canada Inc., Contingent Distribution | | Canada | | 15,269,146 | | | — |
| | | | | | |
|
|
| | | | | | | | 3,614,911 |
| | | | | | |
|
|
Automobiles 0.2% | | | | | | | |
Hero Honda Motors Ltd. | | India | | 90,500 | | | 1,729,144 |
| | | | | | |
|
|
Beverages 5.5% | | | | | | | |
Brown-Forman Corp., A | | United States | | 7,400 | | | 524,956 |
Brown-Forman Corp., B | | United States | | 21,560 | | | 1,494,539 |
Carlsberg AS, A | | Denmark | | 7,100 | | | 354,870 |
Carlsberg AS, B | | Denmark | | 236,075 | | | 12,660,989 |
Coca-Cola Enterprises Inc. | | United States | | 335,300 | | | 6,427,701 |
Diageo PLC | | United Kingdom | | 277,905 | | | 4,028,175 |
Fomento Economico Mexicano SA de CV (Femsa), ADR | | Mexico | | 60,300 | | | 4,372,353 |
Heineken Holding NV, A | | Netherlands | | 97,844 | | | 2,874,966 |
aLotte Chilsung Beverage Co. Ltd. | | South Korea | | 5,280 | | | 5,141,122 |
Pernod Ricard SA | | France | | 82,985 | | | 14,480,840 |
| | | | | | |
|
|
| | | | | | | | 52,360,511 |
| | | | | | |
|
|
Chemicals 1.8% | | | | | | | |
Givaudan AG | | Switzerland | | 7,750 | | | 5,253,187 |
Linde AG | | Germany | | 53,800 | | | 4,189,603 |
aSika AG | | Switzerland | | 9,112 | | | 7,560,099 |
| | | | | | |
|
|
| | | | | | | | 17,002,889 |
| | | | | | |
|
|
Commercial Banks 6.0% | | | | | | | |
Allied Irish Banks PLC | | Ireland | | 445,000 | | | 9,572,197 |
Banca Intesa SpA | | Italy | | 1,620,581 | | | 8,585,399 |
Bank of Ireland | | Ireland | | 273,870 | | | 4,312,139 |
BNP Paribas SA | | France | | 46,200 | | | 3,738,326 |
Danske Bank | | Denmark | | 101,550 | | | 3,577,123 |
a,dElephant Capital Holdings Ltd. | | Japan | | 755 | | | 1,075,710 |
ForeningsSparbanken AB, A | | Sweden | | 342,700 | | | 9,337,933 |
Mitsubishi UFJ Financial Group Inc. | | Japan | | 1,186 | | | 16,077,268 |
a,dNCB Warrant Holdings Ltd., A | | Japan | | 3,830 | | | 618,775 |
| | | | | | |
|
|
| | | | | | | | 56,894,870 |
| | | | | | |
|
|
Commercial Services & Supplies 0.1% | | | | | | | |
aComdisco Holding Co. Inc. | | United States | | 16 | | | 304 |
cComdisco Holding Co. Inc., Contingent Distribution | | United States | | 2,066,357 | | | — |
aFursys Inc. | | South Korea | | 35,130 | | | 793,258 |
a,cSafety Kleen Corp., Contingent Distribution | | United States | | 31,000 | | | — |
| | | | | | |
|
|
| | | | | | | | 793,562 |
| | | | | | |
|
|
Computers & Peripherals 0.4% | | | | | | | |
a,dDecisionOne Corp. | | United States | | 21,716 | | | 15,484 |
aLexmark International Inc., A | | United States | | 77,500 | | | 3,474,325 |
| | | | | | |
|
|
| | | | | | | | 3,489,809 |
| | | | | | |
|
|
MD-11
Franklin Templeton Variable Insurance Products Trust
Statement of Investments, December 31, 2005 (continued)
| | | | | | | |
| Mutual Discovery Securities Fund | | Country | | Shares/
Warrants/
Contracts | | Value |
Common Stocks and Other Equity Interests (continued) | | | | | | | |
Construction Materials 0.6% | | | | | | | |
Ciments Francais SA | | France | | 22,650 | | $ | 2,944,199 |
aHanil Cement Manufacturing Co. Ltd. | | South Korea | | 36,410 | | | 2,609,233 |
| | | | | | |
|
|
| | | | | | | | 5,553,432 |
| | | | | | |
|
|
Consumer Finance 0.3% | | | | | | | |
MBNA Corp. | | United States | | 124,700 | | | 3,385,605 |
| | | | | | |
|
|
Containers & Packaging 0.6% | | | | | | | |
Temple-Inland Inc. | | United States | | 128,400 | | | 5,758,740 |
| | | | | | |
|
|
Distributors 0.2% | | | | | | | |
Compania de Distribucion Integral Logista SA | | Spain | | 30,900 | | | 1,518,110 |
| | | | | | |
|
|
Diversified Financial Services 4.3% | | | | | | | |
Euronext | | Netherlands | | 145,300 | | | 7,568,590 |
Fortis Group NV | | Belgium | | 336,800 | | | 10,721,599 |
Guinness Peat Group PLC | | New Zealand | | 1,844,780 | | | 2,644,031 |
Jardine Matheson Holdings Ltd. | | Hong Kong | | 429,664 | | | 7,390,221 |
Jardine Strategic Holdings Ltd. | | Hong Kong | | 937,700 | | | 10,033,390 |
Leucadia National Corp. | | United States | | 52,170 | | | 2,475,988 |
a,cMarconi Corp., Contingent Distribution | | United Kingdom | | 1,739,100 | | | — |
bSpinrite Income Fund, 144A | | Canada | | 25,700 | | | 137,975 |
| | | | | | |
|
|
| | | | | | | | 40,971,794 |
| | | | | | |
|
|
Diversified Telecommunication Services 2.4% | | | | | | | |
a,d,eAboveNet Inc. | | United States | | 16,706 | | | 400,332 |
a,c,eAboveNet Inc., Contingent Distribution | | United States | | 2,312,000 | | | — |
a,d,eAboveNet Inc., wts., 9/08/08 | | United States | | 550 | | | 2,200 |
a,d,eAboveNet Inc., wts., 9/08/10 | | United States | | 647 | | | 518 |
Belgacom SA | | Belgium | | 60,000 | | | 1,956,904 |
Chunghwa Telecom Co. Ltd., ADR | | Taiwan | | 124,445 | | | 2,283,566 |
a,cGlobal Crossing Holdings Ltd., Contingent Distribution | | United States | | 2,236,777 | | | — |
Koninklijke KPN NV | | Netherlands | | 267,190 | | | 2,679,170 |
MCI Inc. | | United States | | 120,034 | | | 2,368,271 |
aNTL Inc. | | United Kingdom | | 86,731 | | | 5,904,646 |
Sprint Nextel Corp. | | United States | | 15,295 | | | 357,291 |
a,cTelewest Communications PLC, Contingent Distribution | | United Kingdom | | 2,541,312 | | | — |
a,cTelewest Finance Ltd., Contingent Distribution | | United Kingdom | | 274,000 | | | — |
aTelewest Global Inc. | | United Kingdom | | 156,135 | | | 3,719,136 |
Verizon Communications Inc. | | United States | | 99,200 | | | 2,987,904 |
| | | | | | |
|
|
| | | | | | | | 22,659,938 |
| | | | | | |
|
|
Electric Utilities 0.5% | | | | | | | |
E.ON AG | | Germany | | 50,810 | | | 5,260,843 |
a,bEntegra/Union Power, 144A | | United States | | 9,095 | | | — |
| | | | | | |
|
|
| | | | | | | | 5,260,843 |
| | | | | | |
|
|
Food & Staples Retailing 1.5% | | | | | | | |
Albertson’s Inc. | | United States | | 54,300 | | | 1,159,305 |
Carrefour SA | | France | | 242,900 | | | 11,381,513 |
aKroger Co. | | United States | | 25,000 | | | 472,000 |
RHM PLC | | United Kingdom | | 386,200 | | | 1,759,099 |
| | | | | | |
|
|
| | | | | | | | 14,771,917 |
| | | | | | |
|
|
Food Products 8.9% | | | | | | | |
Cadbury Schweppes PLC | | United Kingdom | | 535,527 | | | 5,062,804 |
aCermaq ASA | | Norway | | 184,241 | | | 1,494,488 |
MD-12
Franklin Templeton Variable Insurance Products Trust
Statement of Investments, December 31, 2005 (continued)
| | | | | | | |
| Mutual Discovery Securities Fund | | Country | | Shares/
Warrants/
Contracts | | Value |
Common Stocks and Other Equity Interests (continued) | | | | | | | |
Food Products (continued) | | | | | | | |
CSM NV | | Netherlands | | 387,215 | | $ | 10,557,055 |
Farmer Brothers Co. | | United States | | 61,700 | | | 1,193,278 |
General Mills Inc. | | United States | | 57,700 | | | 2,845,764 |
Groupe Danone | | France | | 83,650 | | | 8,739,314 |
aLotte Confectionary Co. Ltd. | | South Korea | | 5,166 | | | 6,132,542 |
Nestle SA | | Switzerland | | 66,060 | | | 19,761,431 |
aNong Shim Co. Ltd. | | South Korea | | 17,207 | | | 4,782,094 |
Orkla ASA | | Norway | | 512,170 | | | 21,208,889 |
Rieber & Son ASA | | Norway | | 385,600 | | | 2,870,748 |
| | | | | | |
|
|
| | | | | | | | 84,648,407 |
| | | | | | |
|
|
Health Care Equipment & Supplies 0.3% | | | | | | | |
Guidant Corp. | | United States | | 41,600 | | | 2,693,600 |
| | | | | | |
|
|
Health Care Providers & Services 0.5% | | | | | | | |
a,eKindred Healthcare Inc. | | United States | | 57,508 | | | 1,407,336 |
a,eKindred Healthcare Inc., Jan. 9.07 Calls, 1/01/13 | | United States | | 28 | | | 431 |
a,eKindred Healthcare Inc., Jan. 25.99 Calls, 1/01/14 | | United States | | 14 | | | — |
a,eKindred Healthcare Inc., Jan. 26.00 Calls, 1/01/12 | | United States | | 42 | | | — |
a,eKindred Healthcare Inc., Jul. 23.75 Calls, 7/17/11 | | United States | | 184 | | | 133 |
a,eKindred Healthcare Inc., wts., Series A, 4/20/06 | | United States | | 5,258 | | | 101,700 |
a,eKindred Healthcare Inc., wts., Series B, 4/20/06 | | United States | | 13,145 | | | 216,038 |
MDS Inc. | | Canada | | 82,800 | | | 1,432,597 |
Rhoen-Klinikum AG | | Germany | | 31,600 | | | 1,207,958 |
| | | | | | |
|
|
| | | | | | | | 4,366,193 |
| | | | | | |
|
|
Hotels, Restaurants & Leisure 0.8% | | | | | | | |
aFHC Delaware Inc. | | United States | | 49,920 | | | 173,517 |
Hilton Group | | United Kingdom | | 908,543 | | | 5,685,786 |
a,cTrump Atlantic, Contingent Distribution | | United States | | 1,841,000 | | | 69,406 |
aTrump Entertainment Resorts Inc. | | United States | | 66,767 | | | 1,344,020 |
| | | | | | |
|
|
| | | | | | | | 7,272,729 |
| | | | | | |
|
|
Household Durables 0.1% | | | | | | | |
Hunter Douglas NV | | Netherlands | | 18,138 | | | 987,313 |
| | | | | | |
|
|
Industrial Conglomerates 1.1% | | | | | | | |
Siemens AG | | Germany | | 70,100 | | | 6,005,833 |
Tyco International Ltd. | | United States | | 139,500 | | | 4,025,970 |
| | | | | | |
|
|
| | | | | | | | 10,031,803 |
| | | | | | |
|
|
Insurance 7.5% | | | | | | | |
aAlleghany Corp. | | United States | | 3,759 | | | 1,067,556 |
aBerkshire Hathaway Inc., A | | United States | | 45 | | | 3,987,900 |
aBerkshire Hathaway Inc., B | | United States | | 12,450 | | | 36,546,975 |
Catlin Group | | United Kingdom | | 214,930 | | | 1,795,264 |
E-L Financial Corp. Ltd. | | Canada | | 8,478 | | | 3,902,374 |
Hartford Financial Services Group Inc. | | United States | | 40,800 | | | 3,504,312 |
a,dImagine Group Holdings Ltd. | | Bermuda | | 451,787 | | | 4,626,990 |
IPC Holdings Ltd. | | United States | | 41,400 | | | 1,133,532 |
Irish Life & Permanent PLC | | Ireland | | 185,900 | | | 3,776,534 |
Montpelier Re Holdings Ltd. | | Bermuda | | 33,757 | | | 638,007 |
Old Republic International Corp. | | United States | | 112,900 | | | 2,964,754 |
MD-13
Franklin Templeton Variable Insurance Products Trust
Statement of Investments, December 31, 2005 (continued)
| | | | | | | |
| Mutual Discovery Securities Fund | | Country | | Shares/
Warrants/
Contracts | | Value |
Common Stocks and Other Equity Interests (continued) | | | | | | | |
Insurance (continued) | | | | | | | |
a,dOlympus Re Holdings Ltd. | | Bermuda | | 2,140 | | $ | 39,590 |
Prudential Financial Inc. | | United States | | 24,900 | | | 1,822,431 |
White Mountains Insurance Group Inc. | | United States | | 9,696 | | | 5,415,701 |
| | | | | | |
|
|
| | | | | | | | 71,221,920 |
| | | | | | |
|
|
Leisure Equipment & Products 0.2% | | | | | | | |
Mattel Inc. | | United States | | 52,300 | | | 827,386 |
Shimano Inc. | | Japan | | 31,100 | | | 816,826 |
| | | | | | |
|
|
| | | | | | | | 1,644,212 |
| | | | | | |
|
|
Machinery 1.1% | | | | | | | |
Metso OYJ | | Finland | | 39,983 | | | 1,094,359 |
Schindler Holding AG | | Switzerland | | 19,900 | | | 7,891,837 |
Schindler Holding AG, Reg D | | Switzerland | | 4,100 | | | 1,621,275 |
| | | | | | |
|
|
| | | | | | | | 10,607,471 |
| | | | | | |
|
|
Media 5.6% | | | | | | | |
aCJ CGV Co. Ltd. | | South Korea | | 92,310 | | | 2,725,779 |
Clear Channel Communications Inc. | | United States | | 152,300 | | | 4,789,835 |
aComcast Corp., A | | United States | | 14,800 | | | 380,212 |
Daekyo Co. Ltd. | | South Korea | | 10,040 | | | 785,262 |
E.W. Scripps Co., A | | United States | | 11,100 | | | 533,022 |
aEchoStar Communications Corp., A | | United States | | 64,300 | | | 1,747,031 |
Hollinger International Inc. | | United States | | 95,634 | | | 814,037 |
aJC Decaux SA | | France | | 331,116 | | | 7,722,236 |
Knight Ridder Inc. | | United States | | 23,500 | | | 1,487,550 |
a,fLiberty Media Corp., A | | United States | | 525,146 | | | 4,132,899 |
News Corp., A | | United States | | 479,100 | | | 7,450,005 |
Omnicom Group Inc. | | United States | | 16,700 | | | 1,421,671 |
Pearson PLC | | United Kingdom | | 331,700 | | | 3,923,379 |
dTime Warner Inc. | | United States | | 572,200 | | | 9,779,584 |
aTVMAX Holdings Inc. | | United States | | 8,935 | | | 8,935 |
Viacom Inc., B | | United States | | 63,300 | | | 2,063,580 |
Washington Post Co., B | | United States | | 3,821 | | | 2,923,065 |
| | | | | | |
|
|
| | | | | | | | 52,688,082 |
| | | | | | |
|
|
Metals & Mining 5.0% | | | | | | | |
Anglo American PLC | | South Africa | | 764,767 | | | 26,038,561 |
Dofasco Inc. | | Canada | | 73,796 | | | 4,125,668 |
Freeport-McMoRan Copper & Gold Inc., B | | United States | | 7,300 | | | 392,740 |
aGammon Lake Resources Inc. | | Canada | | 364,300 | | | 4,328,472 |
aGlamis Gold Ltd. | | Canada | | 42,500 | | | 1,168,997 |
Gold Fields Ltd. | | South Africa | | 2,300 | | | 40,638 |
Goldcorp Inc. | | Canada | | 31,024 | | | 691,274 |
aGoldcorp Inc., wts., 5/30/07 | | Canada | | 20,700 | | | 86,374 |
aHarmony Gold Mining Co. Ltd., ADR | | South Africa | | 39,400 | | | 514,170 |
aKinross Gold Corp. | | Canada | | 49,400 | | | 456,471 |
aLionOre Mining International Ltd. | | Canada | | 398,600 | | | 1,697,557 |
Newmont Mining Corp. | | United States | | 134,900 | | | 7,203,660 |
Placer Dome Inc. | | Canada | | 45,600 | | | 1,044,371 |
| | | | | | |
|
|
| | | | | | | | 47,788,953 |
| | | | | | |
|
|
MD-14
Franklin Templeton Variable Insurance Products Trust
Statement of Investments, December 31, 2005 (continued)
| | | | | | | |
| Mutual Discovery Securities Fund | | Country | | Shares/
Warrants/
Contracts | | Value |
Common Stocks and Other Equity Interests (continued) | | | | | | | |
Multi-Utilities & Unregulated Power 1.3% | | | | | | | |
NorthWestern Corp. | | United States | | 18,132 | | $ | 563,361 |
a,cNorthWestern Corp., Contingent Distribution | | United States | | 550,000 | | | 46,750 |
Suez SA | | France | | 376,329 | | | 11,717,100 |
| | | | | | |
|
|
| | | | | | | | 12,327,211 |
| | | | | | |
|
|
Multiline Retail 0.1% | | | | | | | |
Jelmoli Holding AG | | Switzerland | | 919 | | | 1,311,608 |
| | | | | | |
|
|
Oil, Gas & Consumable Fuels 2.9% | | | | | | | |
aAnchor Resources LLC | | United States | | 3,410 | | | — |
BP PLC | | United Kingdom | | 158,600 | | | 1,689,024 |
BP PLC, ADR | | United Kingdom | | 9,000 | | | 577,980 |
Burlington Resources Inc. | | United States | | 77,450 | | | 6,676,190 |
Canadian Oil Sands Trust | | Canada | | 20,427 | | | 2,214,404 |
Eni SpA | | Italy | | 67,710 | | | 1,878,113 |
Oil & Natural Gas Corp. Ltd. | | India | | 101,500 | | | 2,650,460 |
Statoil ASA | | Norway | | 102,195 | | | 2,346,839 |
Suncor Energy Inc. | | Canada | | 50,077 | | | 3,158,948 |
Total SA, B | | France | | 12,324 | | | 3,095,949 |
Total SA, B, ADR | | France | | 9,670 | | | 1,222,288 |
Vintage Petroleum Inc. | | United States | | 33,950 | | | 1,810,554 |
| | | | | | |
|
|
| | | | | | | | 27,320,749 |
| | | | | | |
|
|
Paper & Forest Products 3.8% | | | | | | | |
Potlatch Corp. | | United States | | 284,900 | | | 14,524,202 |
Weyerhaeuser Co. | | United States | | 324,100 | | | 21,500,794 |
| | | | | | |
|
|
| | | | | | | | 36,024,996 |
| | | | | | |
|
|
Personal Products 0.6% | | | | | | | |
aAmorepacific Corp. | | South Korea | | 18,701 | | | 5,865,525 |
| | | | | | |
|
|
Pharmaceuticals 2.3% | | | | | | | |
Bristol-Myers Squibb Co. | | United States | | 71,381 | | | 1,640,335 |
aIVAX Corp. | | United States | | 4,800 | | | 150,384 |
Merck & Co. Inc. | | United States | | 65,900 | | | 2,096,279 |
Pfizer Inc. | | United States | | 356,070 | | | 8,303,552 |
Sanofi-Aventis | | France | | 85,873 | | | 7,522,896 |
Wyeth | | United States | | 44,400 | | | 2,045,508 |
| | | | | | |
|
|
| | | | | | | | 21,758,954 |
| | | | | | |
|
|
Real Estate 2.6% | | | | | | | |
Canary Wharf Group PLC | | United Kingdom | | 185,900 | | | 767,596 |
Great Eagle Holdings Ltd. | | Hong Kong | | 1,546,900 | | | 4,329,281 |
iStar Financial Inc. | | United States | | 121,700 | | | 4,338,605 |
aLink REIT | | Hong Kong | | 376,967 | | | 714,685 |
a,dSecurity Capital European Realty | | Luxembourg | | 570 | | | 4,142 |
Shurgard Storage Centers Inc., A | | United States | | 16,400 | | | 930,044 |
Swire Pacific Ltd., A | | Hong Kong | | 837,000 | | | 7,513,261 |
Swire Pacific Ltd., B | | Hong Kong | | 2,440,700 | | | 4,249,541 |
a,dTorre Mayor Investments LP | | Mexico | | 10 | | | 690,000 |
Ventas Inc. | | United States | | 33,500 | | | 1,072,670 |
| | | | | | |
|
|
| | | | | | | | 24,609,825 |
| | | | | | |
|
|
MD-15
Franklin Templeton Variable Insurance Products Trust
Statement of Investments, December 31, 2005 (continued)
| | | | | | | | |
| Mutual Discovery Securities Fund | | Country | | Shares/
Warrants/
Contracts | | | Value |
Common Stocks and Other Equity Interests (continued) | | | | | | | | |
Road & Rail 0.5% | | | | | | | | |
dFlorida East Coast Industries Inc. | | United States | | 124,400 | | | $ | 5,007,287 |
| | | | | | | |
|
|
Software 0.5% | | | | | | | | |
Microsoft Corp. | | United States | | 185,700 | | | | 4,856,055 |
| | | | | | | |
|
|
Textiles Apparel & Luxury Goods 0.2% | | | | | | | | |
Reebok International Ltd. | | United States | | 30,000 | | | | 1,746,900 |
| | | | | | | |
|
|
Thrifts & Mortgage Finance 0.6% | | | | | | | | |
Hudson City Bancorp Inc. | | United States | | 266,460 | | | | 3,229,495 |
Sovereign Bancorp Inc. | | United States | | 102,100 | | | | 2,207,402 |
| | | | | | | |
|
|
| | | | | | | | | 5,436,897 |
| | | | | | | |
|
|
Tobacco 14.5% | | | | | | | | |
Altadis SA | | Spain | | 439,723 | | | | 19,948,092 |
Altria Group Inc. | | United States | | 97,831 | | | | 7,309,932 |
British American Tobacco PLC | | United Kingdom | | 1,610,201 | | | | 36,013,513 |
Gallaher Group PLC | | United Kingdom | | 421,500 | | | | 6,363,364 |
Imperial Tobacco Group PLC | | United Kingdom | | 672,817 | | | | 20,106,608 |
ITC Ltd. | | India | | 1,739,520 | | | | 5,489,762 |
Japan Tobacco Inc. | | Japan | | 528 | | | | 7,694,315 |
KT&G Corp. | | South Korea | | 467,560 | | | | 20,906,777 |
bKT&G Corp., GDR, 144A | | South Korea | | 235,090 | | | | 5,171,980 |
Reynolds American Inc. | | United States | | 87,900 | | | | 8,379,508 |
| | | | | | | |
|
|
| | | | | | | | | 137,383,851 |
| | | | | | | |
|
|
Total Common Stocks and Other Equity Interests (Cost $643,629,823) | | | | | | | | 814,722,698 |
| | | | | | | |
|
|
Preferred Stocks 0.3% | | | | | | | | |
Diversified Telecommunication Services 0.0%g | | | | | | | | |
PTV Inc., 10.00%, pfd., A | | United Kingdom | | 4,289 | | | | 9,007 |
| | | | | | | |
|
|
Electric Utilities 0.0%g | | | | | | | | |
aMontana Power Co., 8.45%, pfd. | | United States | | 2,880 | | | | 23,760 |
| | | | | | | |
|
|
Metals & Mining 0.3% | | | | | | | | |
d,eEsmark Inc., Series A, 10.00%, cvt. pfd. | | United States | | 2,352 | | | | 2,466,401 |
Falconbridge Ltd., 6.00%, cvt. pfd., 1 | | Canada | | 1,934 | | | | 48,833 |
Falconbridge Ltd., 6.25%, cvt. pfd., 2 | | Canada | | 1,934 | | | | 48,834 |
Falconbridge Ltd., 6.50%, cvt. pfd., 3 | | Canada | | 967 | | | | 24,513 |
| | | | | | | |
|
|
| | | | | | | | | 2,588,581 |
| | | | | | | |
|
|
Total Preferred Stocks (Cost $2,601,683) | | | | | | | | 2,621,348 |
| | | | | | | |
|
|
| | | |
| | | | | PRINCIPAL
AMOUNTi
| | | |
Corporate Bonds & Notes 0.8% | | | | | | | | |
bACE Aviation Holdings Inc., cvt., 144A, 4.25%, 6/01/35 | | Canada | | 234,000 | CAD | | | 197,298 |
hCollins & Aikman Products Co., | | | | | | | | |
Revolver, FRN, 10.75%, 8/31/09 | | United States | | 65,800 | | | | 63,826 |
Tranche B1 Term Loan, FRN, 10.75%, 8/31/11 | | United States | | 154,200 | | | | 149,574 |
Dana Corp., | | | | | | | | |
5.85%, 1/15/15 | | United States | | 760,000 | | | | 543,400 |
7.00%, 3/01/29 | | United States | | 101,000 | | | | 72,973 |
dDecisionOne Corp., 144A, 12.00%, 4/15/10 | | United States | | 23,573 | | | | 23,573 |
MD-16
Franklin Templeton Variable Insurance Products Trust
Statement of Investments, December 31, 2005 (continued)
| | | | | | | | |
| Mutual Discovery Securities Fund | | Country | | Principal
Amounti | | | Value |
Corporate Bonds & Notes (continued) | | | | | | | | |
Entegra/Union Power, | | | | | | | | |
Term Loan A, 4.00%, 6/01/12 | | United States | | 463,343 | | | $ | 398,475 |
Term Loan B, 9.00%, 6/01/20 | | United States | | 446,182 | | | | 383,717 |
Eurotunnel PLC, | | | | | | | | |
b,hSenior Tranche G2 Term Loan A, 144A, FRN, 5.618%, 12/15/12 | | United Kingdom | | 34,050 | GBP | | | 56,385 |
hTier 2, FRN, 5.796%, 12/31/18 | | United Kingdom | | 199,114 | GBP | | | 291,180 |
hTier 3, FRN, 5.796%, 12/31/25 | | United Kingdom | | 1,346,624 | GBP | | | 1,088,896 |
Eurotunnel SA, | | | | | | | | |
Senior Tranche H1 Term Loan (KfW Advance), 8.78%, 12/15/12 | | France | | 75,000 | EUR | | | 84,349 |
hTier 2 LIBOR, FRN, 3.393%, 12/31/18 | | France | | 39,763 | EUR | | | 40,012 |
hTier 2 PIBOR, FRN, 3.393%, 12/31/18 | | France | | 17,565 | EUR | | | 17,676 |
hTier 3 LIBOR, FRN, 3.393%, 12/31/25 | | France | | 1,476,585 | EUR | | | 821,586 |
hTier 3 PIBOR, FRN, 3.393%, 12/31/25 | | France | | 331,700 | EUR | | | 184,561 |
hMotor Coach Industries International Inc., FRN, 17.406%, 12/01/08 | | United States | | 1,980,717 | | | | 1,881,681 |
Trump Entertaiment Resorts Inc., 8.50%, 5/20/15 | | United States | | 1,460,337 | | | | 1,431,130 |
TVMAX Holdings Inc., PIK, | | | | | | | | |
11.50%, 1/16/06 | | United States | | 11,892 | | | | 11,892 |
j14.00%, 1/16/06 | | United States | | 39,054 | | | | 39,054 |
| | | | | | | |
|
|
Total Corporate Bonds & Notes (Cost $8,344,853) | | | | | | | | 7,781,238 |
| | | | | | | |
|
|
Corporate Bonds & Notes in Reorganization 0.8% | | | | | | | | |
kAdelphia Communications Corp., | | | | | | | | |
9.25%, 10/01/02 | | United States | | 2,490,000 | | | | 1,394,400 |
8.125%, 7/15/03 | | United States | | 219,000 | | | | 124,830 |
7.50%, 1/15/04 | | United States | | 80,000 | | | | 45,600 |
9.50%, 2/15/04 | | United States | | 13,844 | | | | 7,856 |
10.50%, 7/15/04 | | United States | | 124,000 | | | | 70,680 |
9.875%, 3/01/05 | | United States | | 85,000 | | | | 48,238 |
10.25%, 11/01/06 | | United States | | 329,000 | | | | 184,240 |
9.875%, 3/01/07 | | United States | | 51,000 | | | | 29,070 |
8.375%, 2/01/08 | | United States | | 235,000 | | | | 133,950 |
7.75%, 1/15/09 | | United States | | 580,000 | | | | 327,700 |
7.875%, 5/01/09 | | United States | | 141,000 | | | | 78,255 |
9.375%, 11/15/09 | | United States | | 410,000 | | | | 241,900 |
10.875%, 10/01/10 | | United States | | 289,000 | | | | 163,285 |
10.25%, 6/15/11 | | United States | | 467,000 | | | | 282,535 |
kArmstrong World Industries Inc., | | | | | | | | |
6.35%, 8/15/03 | | United States | | 1,309,000 | | | | 942,480 |
6.50%, 8/15/05 | | United States | | 105,000 | | | | 74,550 |
9.75%, 4/15/08 | | United States | | 218,000 | | | | 161,320 |
7.45%, 5/15/29 | | United States | | 133,000 | | | | 98,420 |
Revolver, 10/29/03 | | United States | | 171,450 | | | | 120,229 |
Trade Claim | | United States | | 459,700 | | | | 320,066 |
kCentury Communications Corp., | | | | | | | | |
8.875%, 1/15/07 | | United States | | 22,000 | | | | 21,120 |
8.75%, 10/01/07 | | United States | | 224,000 | | | | 210,560 |
8.375%, 12/15/07 | | United States | | 20,000 | | | | 19,200 |
senior note, 9.50%, 3/01/05 | | United States | | 42,000 | | | | 40,740 |
Series B, zero cpn., 1/15/08 | | United States | | 308,000 | | | | 170,940 |
zero cpn., 3/15/03 | | United States | | 458,000 | | | | 389,300 |
j,kOwens Corning, Revolver, 6/26/02 | | United States | | 1,250,931 | | | | 1,751,304 |
kSafety Kleen Services, senior sub. note, 9.25%, 6/01/08 | | United States | | 3,000 | | | | 2 |
| | | | | | | |
|
|
Total Corporate Bonds & Notes in Reorganization
(Cost $7,964,495) | | | | | | | | 7,452,770 |
| | | | | | | |
|
|
MD-17
Franklin Templeton Variable Insurance Products Trust
Statement of Investments, December 31, 2005 (continued)
| | | | | | | | |
| Mutual Discovery Securities Fund | | Country | | Principal
Amounti | | Value | |
Companies in Liquidation (Cost $–) 0.0% | | | | | | | | |
aUnited Cos. Financial Corp., Bank Claim | | United States | | 4,727 | | $ | — | |
| | | | | | |
|
|
|
Government Agencies 10.0% | | | | | | | | |
f,lFederal Home Loan Bank, 1/03/06 - 12/01/06 | | United States | | 93,850,000 | | | 93,039,356 | |
lU.S. Treasury Bill, 2/02/06 | | United States | | 2,000,000 | | | 1,993,592 | |
| | | | | | |
|
|
|
Total Government Agencies (Cost $95,047,253) | | | | | | | 95,032,948 | |
| | | | | | |
|
|
|
Total Investments (Cost $757,588,107) 97.8% | | | | | | | 927,611,002 | |
Options Written 0.0%g | | | | | | | (2,000 | ) |
Securities Sold Short (1.2)% | | | | | | | (11,572,298 | ) |
Net Unrealized Gain on Forward Exchange Contracts 0.8% | | | | | | | 7,266,534 | |
Other Assets, less Liabilities 2.6% | | | | | | | 25,179,339 | |
| | | | | | |
|
|
|
Net Assets 100.0% | | | | | | $ | 948,482,577 | |
| | | | | | |
|
|
|
| | | |
| | | | | Contracts
| | | |
mOptions Written (Premiums received $8,400) 0.0%g | | | | | | | | |
Pharmaceuticals 0.0%g | | | | | | | | |
Pfizer Inc., Jan. 22.50 Puts, 1/21/06 | | United States | | 100 | | $ | 2,000 | |
| | | | | | |
|
|
|
| | | |
| | | | | Shares
| | | |
nSecurities Sold Short 1.2% | | | | | | | | |
Commercial Banks 0.3% | | | | | | | | |
Bank of America Corp. | | United States | | 62,800 | | | 2,898,220 | |
| | | | | | |
|
|
|
Food Products 0.2% | | | | | | | | |
Kraft Foods Inc., A | | United States | | 64,580 | | | 1,817,281 | |
| | | | | | |
|
|
|
Health Care Equipment & Supplies 0.1% | | | | | | | | |
Alcon Inc. | | Switzerland | | 10,300 | | | 1,334,880 | |
| | | | | | |
|
|
|
Health Care Providers & Services 0.0%g | | | | | | | | |
UnitedHealth Group Inc. | | United States | | 130 | | | 8,078 | |
WellPoint Inc. | | United States | | 208 | | | 16,597 | |
| | | | | | |
|
|
|
| | | | | | | | 24,675 | |
| | | | | | |
|
|
|
Oil, Gas & Consumable Fuels 0.5% | | | | | | | | |
ConocoPhillips | | United States | | 55,820 | | | 3,247,608 | |
Occidental Petroleum Corp. | | United States | | 15,980 | | | 1,276,482 | |
| | | | | | |
|
|
|
| | | | | | | | 4,524,090 | |
| | | | | | |
|
|
|
Pharmaceuticals 0.0%g | | | | | | | | |
Teva Pharmaceutical Industries Ltd., ADR | | Israel | | 2,000 | | | 86,020 | |
| | | | | | |
|
|
|
Real Estate 0.1% | | | | | | | | |
Public Storage Inc. | | United States | | 13,100 | | | 887,132 | |
| | | | | | |
|
|
|
Total Securities Sold Short (Proceeds $11,671,153) | | | | | | | 11,572,298 | |
| | | | | | |
|
|
|
Currency Abbreviations
CAD - Canadian Dollar
EUR - Euro
GBP - British Pound
MD-18
Franklin Templeton Variable Insurance Products Trust
Mutual Discovery Securities Fund
Statement of Investments, December 31, 2005 (continued)
Selected Portfolio Abbreviations
ADR - American Depository Receipt
FRN - Floating Rate Note
GDR - - Global Depository Receipt
LIBOR - London InterBank Offered Rate
PIBOR - Paris InterBank Offered Rate
PIK - Payment In Kind
REIT - Real Estate Investment Trust
| b | Security was purchased pursuant to Rule 144A under the Securities Act of 1933 and may be sold in transactions exempt from registration only to qualified institutional buyers or in a public offering registered under the Securities Act of 1933. These securities have been deemed liquid under guidelines approved by the Trust’s Board of Trustees. At December 31, 2005, the aggregate value of these securities was $6,524,672, representing 0.69% of net assets. |
| c | Contingent Distributions represent the right to receive additional distributions, if any, during the reorganization of the underlying company. Shares represent total underlying principal of debt securities. |
| d | See Note 10 regarding restricted and illiquid securities. |
| e | See Note 12 regarding other considerations. |
| f | See Note 1(f) regarding securities segregated with broker for securities sold short. |
| g | Rounds to less than 0.05% of net assets. |
| h | The coupon rate shown represents the rate at period end. |
| i | The principal amount is stated in U.S. dollars unless otherwise indicated. |
| j | See Note 11 regarding unfunded loan commitments |
| k | See Note 9 regarding defaulted securities. |
| l | The security is traded on a discount basis with no stated coupon rate. |
| m | See Note 1(e) regarding written options. |
| n | See Note 1(f) regarding securities sold short. |
See notes to financial statements.
MD-19
Franklin Templeton Variable Insurance Products Trust
Financial Statements
Statement of Assets and Liabilities
December 31, 2005
| | | |
| | | Mutual Discovery
Securities Fund
|
Assets: | | | |
Investments in securities: | | | |
Cost | | $ | 757,588,107 |
| | |
|
|
Value (includes securities segregated with broker for securities sold short in the amount of $7,852,346) | | $ | 927,611,002 |
Foreign currency, at value (cost $9,057,393) | | | 8,898,291 |
Receivables: | | | |
Investment securities sold | | | 3,190,529 |
Capital shares sold | | | 1,803,095 |
Dividends and interest | | | 967,142 |
Unrealized gain on unfunded loan commitments (Note 11) | | | 51,145 |
Unrealized gain on forward exchange contracts (Note 8) | | | 9,128,454 |
Deposits with broker for securities sold short | | | 13,752,646 |
Due from broker - synthetic equity swaps | | | 1,069,809 |
| | |
|
|
Total assets | | | 966,472,113 |
| | |
|
|
Liabilities: | | | |
Payables: | | | |
Investment securities purchased | | | 2,934,446 |
Capital shares redeemed | | | 140,374 |
Affiliates | | | 1,054,059 |
Funds advanced by custodian | | | 101,943 |
Deferred tax | | | 129,952 |
Options written, at value (premiums received $8,400) | | | 2,000 |
Securities sold short, at value (proceeds $11,671,153) | | | 11,572,298 |
Unrealized loss on forward exchange contracts (Note 8) | | | 1,861,920 |
Accrued expenses and other liabilities | | | 192,544 |
| | |
|
|
Total liabilities | | | 17,989,536 |
| | |
|
|
Net assets, at value | | $ | 948,482,577 |
| | |
|
|
Net assets consist of: | | | |
Paid-in-capital | | $ | 725,024,564 |
Undistributed net investment income | | | 8,645,015 |
Net unrealized appreciation (depreciation) | | | 177,310,338 |
Accumulated net realized gain (loss) | | | 37,502,660 |
| | |
|
|
Net assets, at value | | $ | 948,482,577 |
| | |
|
|
Class A: | | | |
Net assets, at value | | $ | 136,507,656 |
| | |
|
|
Shares outstanding | | | 7,241,613 |
| | |
|
|
Net asset value per share | | | $18.85 |
| | |
|
|
Class B: | | | |
Net assets, at value | | $ | 811,974,921 |
| | |
|
|
Shares outstanding | | | 43,646,194 |
| | |
|
|
Net asset value per share | | | $18.60 |
| | |
|
|
See notes to financial statements.
MD-20
Franklin Templeton Variable Insurance Products Trust
Financial Statements (continued)
Statement of Operations
For the period ended December 31, 2005
| | | | |
| | | Mutual Discovery
Securities Fund
| |
Investment income: | | | | |
Dividends (net of foreign taxes of $891,894) | | $ | 14,306,425 | |
Interest | | | 3,218,840 | |
Other income (Note 13) | | | 9,567 | |
| | |
|
|
|
Total investment income | | | 17,534,832 | |
| | |
|
|
|
Expenses: | | | | |
Management fees (Note 3a) | | | 5,838,207 | |
Administrative fees (Note 3b) | | | 991,764 | |
Distribution fees - Class 2 (Note 3c) | | | 1,489,981 | |
Custodian fees (Note 4) | | | 189,500 | |
Reports to shareholders | | | 96,300 | |
Professional fees | | | 86,931 | |
Trustees’ fees and expenses | | | 4,100 | |
Dividends on securities sold short | | | 234,169 | |
Other | | | 60,333 | |
| | |
|
|
|
Total expenses | | | 8,991,285 | |
Expense reductions (Note 4) | | | (7,293 | ) |
Net expenses | | | 8,983,992 | |
| | |
|
|
|
Net investment income (loss) | | | 8,550,840 | |
| | |
|
|
|
Realized and unrealized gains (losses): | | | | |
Net realized gain (loss) from: | | | | |
Investments (net of foreign taxes of $19,935) | | | 34,755,132 | |
Written options | | | 7,177 | |
Securities sold short | | | (113,792 | ) |
Foreign currency transactions | | | 7,759,426 | |
| | |
|
|
|
Net realized gain (loss) | | | 42,407,943 | |
| | |
|
|
|
Net change in unrealized appreciation (depreciation) on: | | | | |
Investments | | | 65,013,004 | |
Translation of assets and liabilities denominated in foreign currencies | | | (229,675 | ) |
Change in deferred taxes on unrealized appreciation | | | (80,491 | ) |
| | |
|
|
|
Net change in unrealized appreciation (depreciation) | | | 64,702,838 | |
| | |
|
|
|
Net realized and unrealized gain (loss) | | | 107,110,781 | |
| | |
|
|
|
Net increase (decrease) in net assets resulting from operations | | $ | 115,661,621 | |
| | |
|
|
|
See notes to financial statements.
MD-21
Franklin Templeton Variable Insurance Products Trust
Financial Statements (continued)
Statements of Changes in Net Assets
| | | | | | | | |
| | | Mutual Discovery
Securities Fund
| |
| | | Year ended December 31,
| |
| | | 2005 | | | 2004 | |
| | |
| |
Increase (decrease) in net assets: | | | | | | | | |
Operations: | | | | | | | | |
Net investment income | | $ | 8,550,840 | | | $ | 6,028,591 | |
Net realized gain (loss) from investments, written options, securities sold short, and foreign currency transactions | | | 42,407,943 | | | | 8,550,162 | |
Net change in unrealized appreciation (depreciation) on investments and translation of assets and liabilities denominated in foreign currencies, and deferred taxes. | | | 64,702,838 | | | | 58,272,161 | |
| | |
| |
Net increase (decrease) in net assets resulting from operations | | | 115,661,621 | | | | 72,850,914 | |
| | |
| |
Distributions to shareholders from: | | | | | | | | |
Net investment income: | | | | | | | | |
Class 1 | | | (1,894,145 | ) | | | (1,514,244 | ) |
Class 2 | | | (7,611,109 | ) | | | (2,636,191 | ) |
| | |
| |
Total distributions to shareholders | | | (9,505,254 | ) | | | (4,150,435 | ) |
| | |
| |
Capital share transactions: (Note 2) | | | | | | | | |
Class 1 | | | (19,642,956 | ) | | | (17,489,472 | ) |
Class 2 | | | 320,706,614 | | | | 195,348,144 | |
| | |
| |
Total capital share transactions | | | 301,063,658 | | | | 177,858,672 | |
| | |
| |
Net increase (decrease) in net assets | | | 407,220,025 | | | | 246,559,151 | |
Net assets: | | | | | | | | |
Beginning of year | | | 541,262,552 | | | | 294,703,401 | |
| | |
| |
End of year | | $ | 948,482,577 | | | $ | 541,262,552 | |
| | |
| |
Undistributed net investment income included in net assets: | | | | | | | | |
End of year | | $ | 8,645,015 | | | $ | 4,937,934 | |
| | |
| |
See notes to financial statements.
MD-22
Franklin Templeton Variable Insurance Products Trust
Notes to Financial Statements
Mutual Discovery Securities Fund
1. ORGANIZATION AND SIGNIFICANT ACCOUNTING POLICIES
Franklin Templeton Variable Insurance Products Trust (the Trust) is registered under the Investment Company Act of 1940 as an open-end investment company, consisting of twenty-two separate series. The Mutual Discovery Securities Fund (the Fund) included in this report is diversified. The financial statements of the remaining funds in the series are presented separately. Shares of the Fund are sold only to insurance company separate accounts to fund the benefits of variable life insurance policies or variable annuity contracts. As of December 31, 2005, 61.62% of the Fund’s shares were sold through one insurance company.
The following summarizes the Fund’s significant accounting policies.
a. Security Valuation
Securities listed on a securities exchange or on the NASDAQ National Market System are valued at the last quoted sale price or the official closing price of the day, respectively. Over-the-counter securities and listed securities for which there is no reported sale are valued within the range of the most recent quoted bid and ask prices. Securities that trade in multiple markets or on multiple exchanges are valued according to the broadest and most representative market.
Corporate debt securities and government securities generally trade in the over-the-counter market rather than on a securities exchange. The Trust may utilize independent pricing services, quotations from bond dealers, and information with respect to bond and note transactions, to assist in determining a current market value for each security. The Trust’s pricing services may use valuation models or matrix pricing which considers information with respect to comparable bond and note transactions, quotations from bond dealers, or by reference to other securities that are considered comparable in such characteristics as rating, interest rate and maturity date, option adjusted spread models, prepayment projections, interest rate spreads and yield curves, to determine current value.
Foreign securities are valued as of the close of trading on the foreign stock exchange on which the security is primarily traded, or the NYSE, whichever is earlier. If no sale is reported at that time, the foreign security will be valued within the range of the most recent quoted bid and ask prices. The value is then converted into its U.S. dollar equivalent at the foreign exchange rate in effect at the close of the NYSE on the day that the value of the foreign security is determined.
The Trust has procedures to determine the fair value of individual securities and other assets for which market prices are not readily available or which may not be reliably priced. Methods for valuing these securities may include: fundamental analysis, matrix pricing, discounts from market prices of similar securities, or discounts applied due to the nature and duration of restrictions on the disposition of the securities. Due to the inherent uncertainty of valuations of such securities, the fair values may differ significantly from the values that would have been used had a ready market for such investments existed. Occasionally, events occur between the time at which trading in a security is completed and the close of the NYSE that might call into question the availability (including the reliability) of the value of a portfolio security held by the Fund. If such an event occurs, the securities may be valued using fair value procedures, which may include the use of independent pricing services. All security valuation procedures are approved by the Trust’s Board of Trustees.
b. Foreign Currency Translation
Portfolio securities and other assets and liabilities denominated in foreign currencies are translated into U.S. dollars based on the exchange rate of such currencies against U.S. dollars on the date of valuation. Purchases and sales of securities, income and expense items denominated in foreign currencies are translated into U.S. dollars at the exchange rate in effect on the transaction date. Occasionally, events may impact the availability or reliability of foreign exchange rates used to convert the U.S. dollar equivalent value. If such an event occurs, the foreign exchange rate will be valued at fair value using procedures established and approved by the Trust’s Board of Trustees.
MD-23
Franklin Templeton Variable Insurance Products Trust
Notes to Financial Statements (continued)
Mutual Discovery Securities Fund
1. ORGANIZATION AND SIGNIFICANT ACCOUNTING POLICIES (continued)
b. Foreign Currency Translation (cont.)
The Fund does not separately report the effect of changes in foreign exchange rates from changes in market prices on securities held. Such changes are included in net realized and unrealized gain or loss from investments on the Statement of Operations. Realized foreign exchange gains or losses arise from sales of foreign currencies, currency gains or losses realized between the
trade and settlement dates on securities transactions and the difference between the recorded amounts of dividends, interest, and foreign withholding taxes and the U.S. dollar equivalent of the amounts actually received or paid. Net unrealized foreign exchange gains and losses arise from changes in foreign exchange rates on foreign denominated assets and liabilities other than investments in securities held at the end of the reporting period.
c. Foreign Currency Contracts
The Fund may enter into forward exchange contracts to hedge against fluctuations in foreign exchange rates. A forward exchange contract is an agreement between two parties to exchange different currencies at an agreed upon exchange rate at a future date. These contracts are valued daily by the Fund and the net unrealized gain or loss on the contracts, as measured by the difference between the contractual forward foreign exchange rates and the forward rates at the reporting date, is included in the Statement of Assets and Liabilities. Realized and unrealized gains and losses on these contracts are included in the Statement of Operations.
When the Fund purchases or sells foreign securities it may enter into foreign exchange contracts to minimize foreign exchange risk from the trade date to the settlement date of the transactions. Realized and unrealized gains and losses on these contracts are included in the Statement of Operations.
The risks of these contracts include movement in the values of the foreign currencies relative to the U.S. dollar and the possible inability of the counterparties to fulfill their obligations under the contracts, which may be in excess of the amount reflected in the Statement of Assets and Liabilities.
d. Synthetic Equity Swaps
The Fund may engage in synthetic equity swaps. Synthetic equity swaps are contracts entered into between a broker and the Fund under which the parties agree to make payments to each other so as to replicate the economic consequences that would apply had a purchase or sale of the underlying security taken place. Upon entering into synthetic equity swaps, the Fund is required to pledge to the broker an amount of cash and/or other assets equal to a certain percentage of the contract amount (“initial margin”). Subsequent payments known as “variation margin”, are made or received by the Fund periodically, depending on fluctuations in the value of the underlying security. When the contract is closed, the Fund records a realized gain or loss equal to the difference between the value of the contract at the time it was opened and the value at the time it was closed. The risks of entering into synthetic equity swaps include unfavorable price movements in the underlying securities or the inability of the counterparties to fulfill their obligations under the contract.
e. Options
The Fund may purchase or write options. Options are contracts entitling the holder to purchase or sell a specified number of shares or units of a particular security at a specified price. Options purchased are recorded as investments; options written (sold) are recorded as liabilities. Upon closing of an option, other than by exercise, which results in a cash settlement, the difference between the premium (original option value) and the settlement proceeds is realized as a gain or loss. When securities are acquired or delivered upon exercise of an option, the acquisition cost or sale proceeds are adjusted by the amount of the premium. When an option is closed, the difference between the premium and the cost to close the position is realized as a gain or loss. When an option expires, the premium is realized as a gain for options written or as a loss for options purchased. The risks include the possibility there may be an illiquid options market or the inability of the counterparties to fulfill their
MD-24
Franklin Templeton Variable Insurance Products Trust
Notes to Financial Statements (continued)
Mutual Discovery Securities Fund
1. ORGANIZATION AND SIGNIFICANT ACCOUNTING POLICIES (continued)
e. Options (continued)
obligations under the contract. Writing options involves, to varying degrees, elements of market risk in excess of the amount recognized in the Statement of Assets and Liabilities.
f. Securities Sold Short
The Fund is engaged in selling securities short, which obligates the Fund to replace a borrowed security with the same security at current market value. The Fund incurs a loss if the price of the security increases between the date of the short sale and the date on which the Fund replaces the borrowed security. The Fund realizes a gain if the price of the security declines between those dates. Gains are limited to the price at which the Fund sold the security short, while losses are potentially unlimited in size.
The Fund is required to establish a margin account with the broker lending the security sold short. While the short sale is outstanding, the broker retains the proceeds of the short sale and the Fund must maintain a deposit with broker consisting of cash and securities having a value equal to a specified percentage of the value of the securities sold short. The Fund is obligated to pay the counterparty any dividends or interest due on securities sold short. Such dividends and interest are recorded as an expense to the Fund.
g. Income and Deferred Taxes
No provision has been made for U.S. income taxes because the Fund’s policy is to continue to qualify as a regulated investment company under the Internal Revenue Code and to distribute to shareholders substantially all of its taxable income and net realized gains.
The Fund is subject to a tax imposed on net realized gains on securities of certain foreign countries. The Fund records an estimated deferred tax liability for net unrealized gains on these securities in an amount that would be payable if the securities were disposed of on the valuation date.
Foreign securities held by the Fund may be subject to foreign taxation. Foreign taxes, if any, are recorded based on the tax regulations and rates that exist in the foreign markets in which the Fund invests.
h. Security Transactions, Investment Income, Expenses and Distributions
Security transactions are accounted for on trade date. Realized gains and losses on security transactions are determined on a specific identification basis. Interest income and estimated expenses are accrued daily. Amortization of premium and accretion of discount on debt securities are included in interest income. Dividend income and dividends declared on securities sold short are recorded on the ex-dividend date except that certain dividends from foreign securities are recognized as soon as the Fund is notified of the ex-date. Distributions to shareholders are recorded on the ex-dividend date and are determined according to income tax regulations (tax basis). Such distributions are reinvested in additional shares of the Fund. Distributable earnings determined on a tax basis may differ from earnings recorded in accordance with generally accepted accounting principles.
These differences may be permanent or temporary. Permanent differences are reclassified among capital accounts to reflect their tax character. These reclassifications have no impact on net assets or the results of operations. Temporary differences are not reclassified, as they may reverse in subsequent periods.
Common expenses incurred by the Trust are allocated among the funds based on the ratio of net assets of each Fund to the combined net assets of the Trust. Fund specific expenses are charged directly to the fund that incurred the expense.
Realized and unrealized gains and losses and net investment income, other than class specific expenses, are allocated daily to each class of shares based upon the relative proportion of net assets of each class.
MD-25
Franklin Templeton Variable Insurance Products Trust
Notes to Financial Statements (continued)
Mutual Discovery Securities Fund
1. ORGANIZATION AND SIGNIFICANT ACCOUNTING POLICIES (continued)
i. Accounting Estimates
The preparation of financial statements in accordance with accounting principles generally accepted in the United States of America requires management to make estimates and assumptions that affect the reported amounts of assets and liabilities at the date of the financial statements and the amounts of income and expenses during the reporting period. Actual results could differ from those estimates.
j. Guarantees and Indemnifications
Under the Trust’s organizational documents, its officers and trustees are indemnified by the Trust against certain liabilities arising out of the performance of their duties to the Trust. Additionally, in the normal course of business, the Trust enters into contracts with service providers that contain general indemnification clauses. The Trust’s maximum exposure under these arrangements is unknown as this would involve future claims that may be made against the Trust that have not yet occurred. However, based on experience, the Trust expects the risk of loss to be remote.
2. SHARES OF BENEFICIAL INTEREST
The Fund offers two classes of shares: Class 1 and Class 2. Each class of shares differs by its distribution fees, voting rights on matters affecting a single class and its exchange privilege.
At December 31, 2005, there were an unlimited number of shares authorized ($0.01 par value). Transactions in the Fund’s shares were as follows:
| | | | | | | | | | | | | | |
| | | Year Ended December 31,
| |
| | | 2005
| | | 2004
| |
| Class 1 Shares: | | Shares
| | | Amount
| | | Shares
| | | Amount
| |
Shares sold | | 124,329 | | | $ | 2,140,935 | | | 274,146 | | | $ | 4,087,507 | |
Shares issued in reinvestment of distributions | | 110,704 | | | | 1,894,145 | | | 105,743 | | | | 1,514,244 | |
Shares redeemed | | (1,368,623 | ) | | | (23,678,036 | ) | | (1,573,984 | ) | | | (23,091,223 | ) |
| | |
| |
Net increase (decrease) | | (1,133,590 | ) | | $ | (19,642,956 | ) | | (1,194,095 | ) | | $ | (17,489,472 | ) |
| | |
| |
| Class 2 Shares: | | | | | | | | | | | | |
Shares sold | | 19,786,579 | | | $ | 337,468,561 | | | 14,183,512 | | | $ | 208,048,594 | |
Shares issued in reinvestment of distributions | | 450,095 | | | | 7,611,109 | | | 186,040 | | | | 2,636,191 | |
Shares redeemed | | (1,422,146 | ) | | | (24,373,056 | ) | | (1,074,971 | ) | | | (15,336,641 | ) |
| | |
| |
Net increase (decrease) | | 18,814,528 | | | $ | 320,706,614 | | | 13,294,581 | | | $ | 195,348,144 | |
| | |
| |
3. TRANSACTIONS WITH AFFILIATES
Franklin Resources, Inc. is the holding company for various subsidiaries that together are referred to as Franklin Templeton Investments. Certain officers and trustees of the Trust are also officers and/or directors of the following subsidiaries:
| | |
| Subsidiary | | Affiliation |
Franklin Mutual Advisers, LLC (Franklin Mutual) | | Investment manager |
Franklin Templeton Investment Management Limited (FTIML) | | Investment manager |
Franklin Templeton Services, LLC (FT Services) | | Administrative manager |
Franklin Templeton Distributors, Inc. (Distributors) | | Principal underwriter |
Franklin Templeton Investor Services, LLC (Investor Services) | | Transfer agent |
MD-26
Franklin Templeton Variable Insurance Products Trust
Notes to Financial Statements (continued)
Mutual Discovery Securities Fund
3. TRANSACTIONS WITH AFFILIATES (continued)
a. Management Fees
The Fund pays an investment management fee to Franklin Mutual based on the average daily net assets of the Fund as follows:
| | |
| Annualized Fee Rate | | Net Assets |
| 0.800% | | Up to and including $4 billion |
| 0.770% | | Over $4 billion, up to and including $7 billion |
| 0.750% | | Over $7 billion, up to and including $10 billion |
| 0.730% | | In excess of $10 billion |
Prior to May 1, 2005, the Fund paid fees to Franklin Mutual of 0.80% per year of the average daily net assets of the Fund.
Effective May 19, 2005, under a subadvisory agreement, FTIML, an affiliate of Franklin Mutual, provides subadvisory services to the Fund and receives from Franklin Mutual fees based on the average daily net assets of the Fund.
b. Administrative Fees
The Fund pays an administrative fee to FT Services based on the average daily net assets of the Fund as follows:
| | |
| Annualized Fee Rate | | Net Assets |
| 0.150% | | Up to and including $200 million |
| 0.135% | | Over $200 million, up to and including $700 million |
| 0.100% | | Over $700 million, up to and including $1.2 billion |
| 0.075% | | In excess of $1.2 billion |
c. Distribution Fees
The Fund’s Board of Trustees has adopted a distribution plan for Class 2 shares pursuant to Rule 12b-1 under the 1940 Act. Under the Fund’s compensation distribution plan, the Fund pays Distributors for costs incurred in connection with the sale and distribution of the Fund’s shares up to 0.35% per year of its average daily net assets. The Board of Trustees has set the current rate at 0.25% per year.
d. Transfer Agent Fees
Investor Services, under terms of an agreement, performs shareholder servicing for the Fund and is not paid by the Fund for the services.
4. EXPENSE OFFSET ARRANGEMENT
The Fund has entered into an arrangement with its custodian whereby credits realized as a result of uninvested cash balances are used to reduce a portion of the Fund’s custodian expenses. During the year ended December 31, 2005, the custodian fees were reduced as noted in the Statement of Operations.
5. INCOME TAXES
During the year ended December 31, 2005, the Fund utilized $2,513,949 of capital loss carryforwards.
For tax purposes, realized currency losses occurring subsequent to October 31, may be deferred and treated as occurring on the first day of the following fiscal year. At December 31, 2005, the Fund deferred realized currency losses of $17,366.
MD-27
Franklin Templeton Variable Insurance Products Trust
Notes to Financial Statements (continued)
Mutual Discovery Securities Fund
5. INCOME TAXES (continued)
The tax character of distributions paid during the years ended December 31, 2005 and 2004, was as follows:
| | | | | | |
| | | 2005
| | 2004
|
Distributions paid from – ordinary income | | $ | 9,505,254 | | $ | 4,150,435 |
At December 31, 2005, the cost of investments, net unrealized appreciation (depreciation), and undistributed ordinary income and undistributed long term capital gains for income tax purposes were as follows:
| | | | |
Cost of investments | | $ | 760,452,542 | |
| | |
|
|
|
| |
Unrealized appreciation | | $ | 178,791,503 | |
Unrealized depreciation | | | (11,633,043 | ) |
| | |
|
|
|
Net unrealized appreciation (depreciation) | | $ | 167,158,460 | |
| | |
|
|
|
Undistributed ordinary income | | $ | 20,711,351 | |
Undistributed long term capital gains | | | 33,935,315 | |
| | |
|
|
|
Distributable earnings | | $ | 54,646,666 | |
| | |
|
|
|
Net investment income (loss) differs for financial statement and tax purposes primarily due to differing treatments of defaulted securities, foreign currency transactions, passive foreign investment company shares, bond discounts and premiums, certain dividends on securities sold short and foreign taxes paid on net realized gains.
Net realized gains (losses) differ for financial statement and tax purposes primarily due to differing treatments of defaulted securities, wash sales, foreign currency transactions, passive foreign investment company shares, bond discounts and premiums, certain dividends on securities sold short and foreign taxes paid on net realized gains.
6. INVESTMENT TRANSACTIONS
Purchases and sales of investments (excluding short term securities and securities sold short) for the year ended December 31, 2005, aggregated $451,213,817 and $152,707,312, respectively.
Transactions in options written during the year ended December 31, 2005, were as follows:
| | | | | | | |
| | | Number of
Contracts
| | | Premiums
Received
| |
Options outstanding at December 31, 2004 | | 126 | | | $ | 17,185 | |
Options written | | 13,388 | | | | 71,478 | |
Options expired | | (13,001 | ) | | | (28,095 | ) |
Options exercised | | (371 | ) | | | (45,027 | ) |
Options closed | | (42 | ) | | | (7,141 | ) |
| | |
|
|
Options outstanding at December 31, 2005 | | 100 | | | $ | 8,400 | |
| | |
|
|
MD-28
Franklin Templeton Variable Insurance Products Trust
Notes to Financial Statements (continued)
Mutual Discovery Securities Fund
7. SYNTHETIC EQUITY SWAPS
As of December 31, 2005, the Fund had the following synthetic equity swaps outstanding:
| | | | | | | | | | | |
| | | Contracts to buy | | Number of
Contracts | | Notional
Value | | Unrealized
Gain (Loss) | |
| | | Christian Dior SA (46.76 - 54.99 EUR) | | 5,203 | | $ | 462,584 | | $ | 161,476 | |
| | | O2 Plc (1.96 - 1.97 GBP) | | 1,701,644 | | | 5,796,635 | | | 39,031 | |
| | | | | | | | | |
|
|
|
| | | Total contracts to buy | | | | | | | | 200,507 | |
| | | | | | | | | |
|
|
|
| | | | |
| | | Contracts to sell | | Number of
Contracts | | Notional
Value | | Unrealized
Gain (Loss) | |
| | | LVMH Moet Hennessy Louis Vuitton (54.61 - 61.76 EUR) | | 5,192 | | $ | 461,299 | | $ | (105,122 | ) |
| | | | | | | | | |
|
|
|
| | | Total contracts to sell | | | | | | | | (105,122 | ) |
| | | | | | | | | |
|
|
|
| | | Net unrealized gain (loss) | | | | | | | $ | 95,385 | |
| | | | | | | | | |
|
|
|
8. FORWARD EXCHANGE CONTRACTS
At December 31, 2005, the Fund had outstanding forward exchange contracts as set out below.
| | | | | | | | | | |
| Contracts to Buy | | | | Contract Amounta | | | Settlement
Date | | Unrealized
Gain (Loss) |
| 185,972 | | Canadian Dollar | | 159,356 | | | 1/23/06 | | $ | 763 |
| | | | | | | | | |
|
|
| | | | |
| Contracts to Sell | | | | Contract Amounta | | | Settlement
Date | | Unrealized
Gain (Loss) |
| 1,250,000 | | Euro | | 1,482,038 | | | 1/17/06 | | $ | 715 |
| 10,375,000 | | Euro | | 12,839,533 | | | 1/23/06 | | | 540,370 |
| 11,593,051 | | Swiss Franc | | 9,300,000 | | | 2/02/06 | | | 444,356 |
| 9,100,000 | | British Pound | | 16,298,899 | | | 2/15/06 | | | 644,829 |
| 173,081 | | Canadian Dollar | | 150,000 | | | 2/15/06 | | | 880 |
| 7,879,422 | | Euro | | 9,565,023 | | | 2/27/06 | | | 206,431 |
| 10,277,650 | | Norwegian Krone | | 1,529,412 | | | 3/06/06 | | | 1,087 |
| 5,768,765 | | Euro | | 6,871,096 | | | 3/15/06 | | | 26,700 |
| 63,199,087 | | Swedish Krona | | 8,090,159 | | | 3/15/06 | | | 92,552 |
| 110,314,843 | | Danish Krone | | 19,943,948 | | | 3/17/06 | | | 2,365,275 |
| 925,000 | | Euro | | 7,164,032 | DKK | | 3/17/06 | | | 41,812 |
| 7,975,000 | | British Pound | | 14,054,852 | | | 4/04/06 | | | 333,586 |
| 8,849,455 | | Euro | | 10,867,271 | | | 4/25/06 | | | 322,342 |
| 12,853,425 | | Norwegian Krone | | 1,998,045 | | | 5/08/06 | | | 79,817 |
| 7,750,000 | | British Pound | | 13,505,925 | | | 5/15/06 | | | 165,745 |
| 4,300,000 | | Euro | | 5,481,347 | | | 5/23/06 | | | 349,351 |
| 3,271,600 | | Norwegian Krone | | 500,000 | | | 6/06/06 | | | 10,957 |
| 2,369,085 | | Swiss Franc | | 1,850,000 | | | 6/06/06 | | | 18,712 |
| 3,065,000 | | New Zealand Dollar | | 2,170,020 | | | 6/07/06 | | | 104,454 |
| 3,505,000 | | Euro | | 4,257,165 | | | 6/15/06 | | | 68,514 |
| 1,319,699,428 | | Japanese Yen | | 12,068,575 | | | 6/28/06 | | | 627,252 |
| 2,050,000 | | Euro | | 2,455,910 | | | 7/17/06 | | | 1,732 |
| 9,075,838 | | British Pound | | 15,839,601 | | | 8/14/06 | | | 199,345 |
| 21,219,850 | | Euro | | 26,366,897 | | | 8/23/06 | | | 912,566 |
| 7,569,373 | | British Pound | | 13,174,292 | | | 9/08/06 | | | 125,530 |
| 16,498,208 | | Euro | | 20,823,073 | | | 9/13/06 | | | 1,010,125 |
| 16,895,017 | | Euro | | 20,758,823 | | | 10/18/06 | | | 432,656 |
| | | | | | | | | |
|
|
| | | | | | | | | | | 9,127,691 |
| | | | | | | | | |
|
|
| Unrealized gain on forward exchange contracts | | | | | | | $ | 9,128,454 |
| | | | | | | | | |
|
|
MD-29
Franklin Templeton Variable Insurance Products Trust
Notes to Financial Statements (continued)
Mutual Discovery Securities Fund
8. FORWARD EXCHANGE CONTRACTS (continued)
| | | | | | | | | | | |
| | | | |
| Contracts to Sell | | | | Contract Amounta | | | Settlement
Date | | Unrealized
Gain (Loss) | |
| 3,433,180,000 | | Korean Won | | 3,340,000 | | | 1/18/06 | | $ | (68,266 | ) |
| 23,423,484 | | Canadian Dollars | | 19,337,393 | | | 1/23/06 | | | (829,952 | ) |
| 39,860,579 | | Norwegian Krone | | 5,914,032 | | | 2/06/06 | | | (4,232 | ) |
| 7,926,320 | | Canadian Dollars | | 6,766,824 | | | 2/15/06 | | | (62,200 | ) |
| 39,000,000 | | Norwegian Krone | | 5,792,882 | | | 3/06/06 | | | (6,564 | ) |
| 8,750,000 | | Euro | | 10,309,250 | | | 3/15/06 | | | (92,851 | ) |
| 1,650,000 | | Euro | | 12,288,758 | DKK | | 3/17/06 | | | (3,550 | ) |
| 23,011,658,725 | | Korean Won | | 22,245,800 | | | 3/22/06 | | | (616,265 | ) |
| 42,000,000 | | Norwegian Krone | | 6,263,982 | | | 6/06/06 | | | (14,233 | ) |
| 23,233,201 | | Swiss Francs | | 17,913,031 | | | 6/06/06 | | | (46,085 | ) |
| 43,818,000 | | Japanese Yen | | 375,000 | | | 6/28/06 | | | (4,886 | ) |
| 12,482,681 | | Euro | | 14,830,931 | | | 7/17/06 | | | (112,836 | ) |
| | | | | | | | | |
|
|
|
| Unrealized loss on forward exchange contracts | | | | | | | | (1,861,920 | ) |
| | | | | | | | | |
|
|
|
| Net unrealized gain on forward exchange contracts | | | | | | | $ | 7,266,534 | |
| | | | | | | | | |
|
|
|
aIn U.S. Dollar unless otherwise indicated.
Currency Abbreviations:
DKK - Danish Krone
9. CREDIT RISK AND DEFAULTED SECURITIES
The Fund may purchase the pre-default or defaulted debt of distressed companies. Distressed companies are financially troubled and are about to be/or are already involved in financial restructuring or bankruptcy. The Fund does not accrue income on these securities, if it becomes probable that the income will not be collected. The risks of purchasing these securities are that the issuer is unable to meet its obligation and any subsequent bankruptcy proceeding may result in unfavorable consequences to the Fund. At December 31, 2005, the value of these securities was $7,452,770, representing 0.79% of the Fund’s net assets. For information as to specific securities, see the accompanying Statement of Investments.
10. RESTRICTED AND ILLIQUID SECURITIES
At December 31, 2005, investments in securities included issues that are restricted and illiquid. Restricted securities are often purchased in private placement transactions, and cannot be sold without prior registration under the Securities Act of 1933, unless the sale is pursuant to an exemption under the 1933 Act. The Fund has registration rights for all restricted securities held at period end. The issuer generally incurs all registration costs.
A security may be considered illiquid if it lacks a readily available market or if its valuation has not changed for a certain period of time. At December 31, 2005, the Fund held investments in restricted and illiquid securities, valued in accordance with procedures approved by the Trust’s Board of Trustees as reflecting fair value, as follows:
| | | | | | | | | | |
Principal Amount, Shares and Warrants | | Issuer | | Acquisition
Date | | Cost | | Value |
| 16,706 | | AboveNet Inc. | | 10/02/01 | | $ | 663,267 | | $ | 400,332 |
| 550 | | AboveNet Inc., wts., 9/08/08 | | 10/02/01 | | | 68,164 | | | 2,200 |
| 647 | | AboveNet Inc., wts., 9/08/10 | | 10/02/01 | | | 73,247 | | | 518 |
| 21,716 | | DecisionOne Corp. | | 9/28/99 | | | 16,482 | | | 15,484 |
| 23,573 | | DecisionOne Corp., 144A, 12.00%, 4/15/10 | | 9/28/99 | | | 88,172 | | | 23,573 |
| 755 | | Elephant Capital Holdings Ltd. | | 8/23/04 | | | — | | | 1,075,710 |
MD-30
Franklin Templeton Variable Insurance Products Trust
Notes to Financial Statements (continued)
Mutual Discovery Securities Fund
10. RESTRICTED AND ILLIQUID SECURITIES (continued)
| | | | | | | | | |
Principal Amount, Shares and Warrants | | Issuer | | Acquisition
Date | | Cost | | Value |
| 2,352 | | Esmark Inc., Series A, 10.00%, cvt. pfd. | | 11/08/04 | | 2,352,000 | | | 2,466,401 |
| 124,400 | | Florida East Coast Industries Inc. | | 5/06/97 | | 4,017,621 | | | 5,007,287 |
| 451,787 | | Imagine Group Holdings Ltd. | | 8/31/04 | | 4,626,977 | | | 4,626,990 |
| 3,830 | | NCB Warrant Holdings Ltd., A | | 12/16/05 | | — | | | 618,775 |
| 2,140 | | Olympus Re Holdings Ltd. | | 12/19/01 | | 214,000 | | | 39,590 |
| 570 | | Security Capital European Realty | | 4/08/98 | | 31,238 | | | 4,142 |
| 572,200 | | Time Warner Inc. | | 8/02/05 | | 9,883,074 | | | 9,779,584 |
| 10 | | Torre Mayor Investments LP | | 10/28/02 | | 827,389 | | | 690,000 |
| | | | | | | | |
|
|
| | | Total Restricted and Illiquid Securities (2.61% of Net Assets) | | | | | | $ | 24,750,586 |
| | | | | | | | |
|
|
11. UNFUNDED LOAN COMMITMENTS
The Fund may enter into certain credit agreements, all or a portion of which may be unfunded. The Fund is obligated to fund these loan commitments at the borrowers’ discretion.
At December 31, 2005, unfunded commitments were as follows:
| | | |
| Borrower | | Unfunded
Commitment |
Entegra Power Group LLC, Project L/C Loan Facility | | $ | 125,911 |
Entegra Power Group LLC, Project W/C Loan Facility | | | 18,887 |
Mirant Corp., 4 Year Revolver, 7/17/05 | | | 13,265 |
Owens Corning, Revolver, 6/26/02 | | | 71,450 |
TVMAX Holdings Inc., PIK, 14.00%, 1/16/06 | | | 2 |
| | |
|
|
| | | $ | 229,515 |
| | |
|
|
Unfunded loan commitments are marked to market daily and any unrealized gain or loss is included in the Statement of Assets and Liabilities and Statement of Operations.
12. OTHER CONSIDERATIONS
Directors or employees of Franklin Mutual, the Fund’s Investment Manager, may serve as members on the board of directors of certain companies in which the Fund invests and/or may represent the Fund in certain corporate negotiations. At December 31, 2005, such individuals serve in one or more of these capacities for AboveNet Inc., Esmark Inc., and Kindred Healthcare Inc. As a result of this involvement, such individuals may be in possession of certain material non-public information which, pursuant to the Fund’s policies and the requirements of the federal securities laws, could prevent the Fund from trading in the securities of such companies for limited or extended periods of time.
13. REGULATORY MATTERS
As part of various investigations by a number of federal, state, and foreign regulators and governmental entities, relating to certain practices in the mutual fund industry, including late trading, market timing and marketing support payments to securities dealers who sell fund shares, Franklin Resources, Inc. and certain of its subsidiaries (collectively, the “Company”), entered into settlements with certain of those regulators.
MD-31
Franklin Templeton Variable Insurance Products Trust
Notes to Financial Statements (continued)
Mutual Discovery Securities Fund
13. REGULATORY MATTERS (continued)
Specifically, the Company entered into settlements with the Securities and Exchange Commission (“SEC”) concerning market timing (the “August 2, 2004 SEC Order”) and marketing support payments to securities dealers who sell fund shares (the “December 13, 2004 SEC Order”) and with the California Attorney General’s Office (“CAGO”) concerning marketing support payments to securities dealers who sell fund shares (the “CAGO Settlement”). Under the terms of the settlements with the SEC and the CAGO, the Company retained an Independent Distribution Consultant (“IDC”) to develop a plan for distribution of the respective settlement monies. The CAGO approved the distribution plan under the CAGO Settlement and, in accordance with the terms and conditions of that settlement, the monies were disbursed to the relevant funds and are recorded as other income in the current period. The SEC has not yet approved the distribution plan pertaining to the December 13, 2004 SEC Order. When approved, disbursements of settlement monies will be made promptly to the relevant funds, in accordance with the terms and conditions of that order. The IDC continues to develop the plan of distribution under the August 2, 2004 SEC Order that resolved the SEC’s market timing investigation.
In addition, the Company, as well as most of the mutual funds within Franklin Templeton Investments and certain current or former officers, directors, and/or employees, have been named in private lawsuits (styled as shareholder class actions, or as derivative actions on behalf of either the named funds or Franklin Resources, Inc.) relating to the industry practices referenced above, as well as to allegedly excessive advisory fees, commissions, and/or 12b-1 fees. The lawsuits were filed in different courts throughout the country. Many of those suits are now pending in a multi-district litigation in the United States District Court for the District of Maryland.
The Company and fund management strongly believe that the claims made in each of the private lawsuits referenced above are without merit and intend to defend against them vigorously. The Company cannot predict with certainty the eventual outcome of these lawsuits, nor whether they will have a material negative impact on the Company. If it is determined that the Company bears responsibility for any unlawful or inappropriate conduct that caused losses to the Trust, it is committed to making the Trust or its shareholders whole, as appropriate.
MD-32
Franklin Templeton Variable Insurance Products Trust
Report of Independent Registered Public Accounting Firm
To the Board of Trustees and Shareholders of
Franklin Templeton Variable Insurance Products Trust
In our opinion, the accompanying statement of assets and liabilities, including the statement of investments, and the related statements of operations and of changes in net assets and the financial highlights present fairly, in all material respects, the financial position of Mutual Discovery Securities Fund (one of the funds constituting Franklin Templeton Variable Insurance Products Trust, hereafter referred to as the “Fund”) at December 31, 2005, the results of its operations for the year then ended, the changes in its net assets for each of the two years in the period then ended and the financial highlights for each of the five years in the period then ended, in conformity with accounting principles generally accepted in the United States of America. These financial statements and financial highlights (hereafter referred to as “financial statements”) are the responsibility of the Fund’s management; our responsibility is to express an opinion on these financial statements based on our audits. We conducted our audits of these financial statements in accordance with the standards of the Public Company Accounting Oversight Board (United States). Those standards require that we plan and perform the audit to obtain reasonable assurance about whether the financial statements are free of material misstatement. An audit includes examining, on a test basis, evidence supporting the amounts and disclosures in the financial statements, assessing the accounting principles used and significant estimates made by management, and evaluating the overall financial statement presentation. We believe that our audits, which included confirmation of securities at December 31, 2005, by correspondence with the custodian and brokers, provide a reasonable basis for our opinion.
PricewaterhouseCoopers LLP
San Francisco, California
February 10, 2006
MD-33
Franklin Templeton Variable Insurance Products Trust
Tax Designation (unaudited)
Mutual Discovery Securities Fund
Under Section 852(b)(3)(C) of the Internal Revenue Code (Code), the Fund designates the maximum amount allowable but no less than $33,935,315 as a capital gain dividend for the fiscal year ended December 31, 2005.
Under Section 854(b)(2) of the Code, the Fund designates 41.47% of the ordinary income dividends as income qualifying for the dividends received deduction for the fiscal year ended December 31, 2005.
At December 31, 2005, more than 50% of the Fund’s total assets were invested in securities of foreign issuers. In most instances, foreign taxes were withheld from dividends paid to the Fund on these investments. The Fund elects to treat foreign taxes paid as allowed under Section 853 of the Internal Revenue Code. This election will allow shareholders of record in June 2006, to treat their proportionate share of foreign taxes paid by the Fund as having been paid directly by them. The shareholder shall consider these amounts as foreign taxes paid in the tax year in which they receive the Fund distribution.
The foreign tax information will be disclosed in the June 30, 2006, semi-annual report of the Fund.
MD-34
MUTUAL SHARES SECURITIES FUND
We are pleased to bring you Mutual Shares Securities Fund’s annual report for the fiscal year ended December 31, 2005.
Performance Summary as of 12/31/05
Average annual total return of Class 1 shares represents the average annual change in value, assuming reinvestment of dividends and capital gains. Average returns smooth out variations in returns, which can be significant; they are not the same as year-by-year results.
Periods ended 12/31/05
| | | | | | |
| | | 1-Year | | 5-Year | | Since
Inception
(11/8/96) |
Average Annual Total Return | | +10.83% | | +8.30% | | +9.75% |
Total Return Index Comparison for Hypothetical $10,000 Investment (11/8/96–12/31/05)
The graph below shows the change in value of a hypothetical $10,000 investment in the Fund over the indicated period and includes reinvestment of any income or distributions. The Fund’s performance is compared to the performance of the Standard & Poor’s 500 Index (S&P 500). One cannot invest directly in an index, nor is an index representative of the Fund’s portfolio. Please see Important Notes to Performance Information preceding the Fund Summaries.
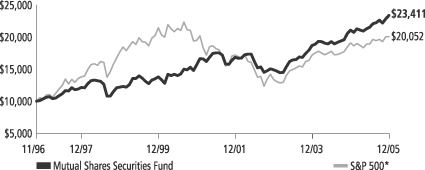
*Source: Standard & Poor’s Micropal. Please see Index Descriptions following the Fund Summaries.
Mutual Shares Securities Fund – Class 1
Performance reflects the Fund’s Class 1 operating expenses, but does not include any contract fees, expenses or sales charges. If they had been included, performance would be lower. These charges and deductions, particularly for variable life policies, can have a significant effect on contract values and insurance benefits. See the contract prospectus for a complete description of these expenses, including sales charges.
Performance data represent past performance, which does not guarantee future results. Investment return and principal value will fluctuate, and you may have a gain or loss when you sell your shares.
Current performance may differ from figures shown.
MS-1
Fund Goals and Main Investments: Mutual Shares Securities Fund seeks capital appreciation, with income as a secondary goal. The Fund normally invests mainly in U.S. equity securities that the manager believes are undervalued. The Fund invests substantially in undervalued stocks, risk arbitrage securities and distressed companies.
Performance Overview
You can find the Fund’s one-year total return in the Performance Summary. The Fund outperformed its benchmark, the S&P 500, which returned +4.91% for the period under review.1
Economic and Market Overview
During the 12 months ended December 31, 2005, U.S. economic expansion was driven by strength across most industries, sectors and regions. Gross domestic product (GDP) rose during the period, benefiting primarily from increased personal consumption, business investment and federal spending. The U.S. dollar rallied in 2005, supported by relatively strong domestic economic growth and rising short-term domestic interest rates, as the Federal Reserve Board raised the federal funds target rate from 2.25% to 4.25% during the period. Compared with the rise in short-term interest rates, long-term rates remained relatively stable, supporting overall robust housing and commercial real estate activity, which contributed to economic growth.
Oil prices remained high during the period, and natural gas prices rose during the second half of 2005. Despite these high commodity prices, inflation remained relatively contained for the 12 months ended December 31, 2005, as measured by the 2.2% rise for the core Consumer Price Index (CPI).2 In this environment, the blue chip stocks of the Dow Jones Industrial Average posted a one-year total return of +1.72%, while the broader S&P 500 and the technology-heavy NASDAQ Composite Index returned +4.91% and +2.12%.3
Outside the U.S., the global economy overcame fears of derailment generated by higher energy costs and advanced at a solid clip during 2005, with Europe surpassing expectations. Excluding the volatile energy and food sectors, inflation remained relatively subdued worldwide.
1. Source: Standard & Poor’s Micropal. One cannot invest directly in an index, nor is an index representative of the Fund’s portfolio. Please see Index Descriptions following the Fund Summaries.
2. Source: Bureau of Labor Statistics. Core CPI excludes food and energy costs.
3. Source: Standard & Poor’s Micropal. Please see Index Descriptions following the Fund Summaries.
Fund Risks: The Fund’s investments in stocks offer the potential for long-term gains but can be subject to short-term up-and-down price movements. Investments in companies involved in mergers, liquidations, reorganizations and distressed bankruptcy, which may include defaulted debt, involve higher credit and other risks. Foreign investing involves special risks including currency fluctuations, economic instability, and social and political developments. Smaller and midsize company securities involve special risks such as relatively small revenues, limited product lines, and small market share. The Fund’s prospectus also includes a description of the main investment risks.
MS-2
In addition to high energy prices, prices for other commodities such as industrial metals also rose. This contributed to economic growth in countries that are tied to mining and industrial commodities, such as Australia and Canada, and some Asian and Latin American emerging markets. For the 12 months under review, equity markets outside the U.S. performed strongly. The Morgan Stanley Capital International (MSCI) All Country (AC) World ex US Index rose +17.11%.3 In terms of sectors, energy and materials led equity market performance, and telecommunication services and consumer-related sectors lagged.
Investment Strategy
At Mutual Series, we are committed to our distinctive value approach to investing, which we believe can generate above-average risk-adjusted returns over time for our shareholders. Our major investment strategy is investing in undervalued stocks. When selecting undervalued equities, we are generally attracted to fundamentally strong companies with healthy balance sheets, high-quality assets, substantial free cash flow and shareholder-oriented management teams and whose stocks are trading at discounts to our assessment of the companies’ intrinsic or business value. We also look for asset rich companies whose shares may be trading at depressed levels due to concerns over short-term earnings disappointments, litigation, management strategy or other perceived negatives. This strict value approach is not only intended to improve the likelihood of upside potential, but can also help reduce the risk of substantial declines. While the vast majority of our undervalued equity investments are made in publicly traded companies globally, we may invest occasionally in privately held companies as well.
We complement this more traditional investment strategy with two others. One is distressed investing, a highly specialized field that is complex and can take many forms. The most common distressed investment the Fund undertakes is the purchase of financially troubled or bankrupt companies’ debt at a substantial discount to face value. After the financially distressed company is reorganized, often in bankruptcy court, the old debt is typically replaced with new securities issued by the financially stronger company.
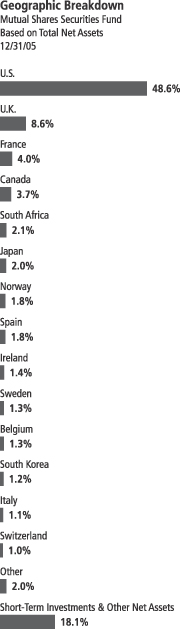
MS-3
The other piece of our investment strategy is participating in arbitrage situations, another highly specialized field. When companies announce mergers or takeovers, commonly referred to as “deals,” the target company may trade at a discount to the bid it ultimately accepts. One form of arbitrage involves purchasing the target company’s stock when it is trading below the value it may receive in a deal. In keeping with our commitment to a relatively conservative investment approach, we typically focus our arbitrage efforts on announced deals, and eschew rumored deals or other situations we consider relatively risky. In addition, we will generally seek to hedge the Fund’s currency exposure when we deem it advantageous, to focus our efforts on analyzing business fundamentals and assessing the value of company assets and liabilities.
Manager’s Discussion
While all three parts of our investment strategy contributed to the Fund’s performance during the year under review, our strongest contributor was our equity portfolio, most notably, our foreign holdings. Three of our best performing stock investments in 2005 included British American Tobacco (BAT), OPTI Canada and Anglo American.
London-based BAT is the world’s second-largest cigarette manufacturer behind Philip Morris. With about a 15% global market share, BAT enjoys strong market positions in Europe, North America and several emerging markets. The company’s stock appreciated 52% in local currency in 2005 as the company delivered robust operational performance driven by increasing sales volumes and an improving product mix. BAT benefited from an acceleration of its sales in emerging markets, a focused development of its higher-margin global brands, and a further reduction of its cost base. During the year, the company returned most of its free cash flow to shareholders through dividends and share buybacks. This caused a number of analysts to raise their earnings growth projections for BAT. As the year came to a close, BAT narrowed its valuation discount versus its publicly traded European peer group.
OPTI Canada (+96% in local currency) is a Calgary-based company that is developing projects in Canada’s Athabasca oil sands region. Canada’s oil sands are the largest known oil reserve base outside of Saudi Arabia and are estimated to contain 180 billion barrels of recoverable oil. While plentiful, the oil contained in this region is expensive to extract and refine and only economical to produce when oil prices are high. We were initially attracted to the company due to the asset value of the recoverable oil on its land and its proprietary low-cost refining process.
Top 10 Sectors/Industries
Mutual Shares Securities Fund Based on Equity Securities
12/31/05
| | |
| | | % of Total
Net Assets |
| |
| Tobacco | | 10.9% |
| |
| Insurance | | 10.1% |
| |
| Media | | 6.9% |
| |
| Commercial Banks | | 6.6% |
| |
| Metals & Mining | | 5.0% |
| |
| Oil, Gas & Consumable Fuels | | 4.2% |
| |
| Food Products | | 3.9% |
| |
| Beverages | | 3.5% |
| |
| Pharmaceuticals | | 3.2% |
| |
| Paper & Forest Products | | 3.2% |
MS-4
The company utilizes a patented technology to refine the oil sands into synthetic crude oil in a cost-effective manner. The company’s first project in Canada’s oil sands is a fifty-fifty joint venture with Nexen that should begin producing in 2007. OPTI Canada’s stock performed well in 2005 as the project remained on-time and on-budget, other assets in the region were purchased for large premiums, and oil prices remained high.
U.K.-headquartered Anglo American is a global mining and natural resources company with substantial interests in platinum, gold, diamonds, base and ferrous metals, coal, industrial minerals, and paper and packaging. The company is geographically diverse with operations in Africa, Europe, the Americas, Australia and Asia. The stock appreciated 66% in local currency during the year. In 2005, Anglo and its peers in the mining sector benefited from a strong commodity cycle and high metal prices driven by sustained world demand, particularly from China. Furthermore, management announced in October that the company would strategically refocus activities on its core mining businesses and return capital to shareholders. This development was positively received by investors and resulted in a reduction of the conglomerate discount traditionally given to Anglo by the markets.
Although many of our investments performed well during the year, some of the Fund’s securities underperformed during the 12 months under review. Three positions that declined include Washington Post, a U.S. newspaper and publishing company; Kindred Healthcare, a U.S. health care provider; and White Mountains Insurance Group, a U.S. insurance company.
Shares in Washington Post underperformed (-22%) as Kaplan, the company’s education business, reported limited margin expansion; and hurricane damage to the Gulf Coast negatively impacted Cable One, its cable operations. Additionally, the advertising market was soft overall, but particularly pronounced for weekly publications, which hurt revenues at Newsweek.
Kindred shares declined 14% in 2005 after the company posted disappointing results in its second and third quarters. Valuations at year-end also reflected the industry’s challenging Medicare reimbursement climate, which was pressured by record high federal deficits.4
4. A member of Franklin Mutual Advisers, Inc., serves on Kindred’s board of directors.
Top 10 Holdings
Mutual Shares Securities Fund
12/31/05
| | |
Company Sector/Industry,
Country | | % of Total
Net Assets |
| |
| Berkshire Hathaway Inc., A & B | | 3.6% |
| Insurance, U.S. | | |
| |
| British American Tobacco PLC, ord. & ADR | | 3.2% |
| Tobacco, U.K. | | |
| |
| Weyerhaeuser Co. | | 2.2% |
| Paper & Forest Products, U.S. | | |
| |
| Anglo American PLC, ord. & ADR | | 2.1% |
| Metals & Mining, South Africa | | |
| |
| White Mountains Insurance Group Inc. | | 1.9% |
| Insurance, U.S. | | |
| |
| Altadis SA | | 1.9% |
| Tobacco, Spain | | |
| |
| Mitsubishi UFJ Financial Group Inc. | | 1.8% |
| Commercial Banks, Japan | | |
| |
| Reynolds American Inc. | | 1.7% |
| Tobacco, U.S. | | |
| |
Imperial Tobacco
Group PLC | | 1.7% |
| Tobacco, U.K. | | |
| |
| Orkla ASA | | 1.6% |
| Food Products, Norway | | |
The dollar value, number of shares or principal amount, and names of all portfolio holdings are listed in the Fund’s Statement of Investments.
MS-5
White Mountains’ shares weakened (-12%) largely due to the company’s exposure to areas devastated by Hurricane Katrina, which may have caused the largest total insured loss in history.
We also feel it is appropriate to comment on our currency hedging posture given our international exposure and recent exchange rate volatility. We generally seek to hedge foreign currency risks to focus Fund performance on the underlying quality of our investment decisions. We have the ability, when we believe currency values are fundamentally misaligned, to adjust this hedging ratio to capitalize on these misvaluations. While we entered 2005 less than fully hedged in foreign currencies, over the course of the year we did increase the hedges on foreign currency exposure. At period-end, we remained less than fully hedged in foreign currencies.
Thank you for your participation in Mutual Shares Securities Fund. We look forward to serving your future investment needs.
The foregoing information reflects our analysis, opinions and portfolio holdings as of December 31, 2005, the end of the reporting period. The way we implement our main investment strategies and the resulting portfolio holdings may change depending on factors such as market and economic conditions. These opinions may not be relied upon as investment advice or an offer for a particular security. The information is not a complete analysis of every aspect of any market, country, industry, security or the Fund. Statements of fact are from sources considered reliable, but the adviser makes no representation or warranty as to their completeness or accuracy. Although historical performance is no guarantee of future results, these insights may help you understand our investment management philosophy.
MS-6
Fund Expenses
As an investor in a variable insurance contract (“Contract”) that indirectly provides for investment in an underlying mutual fund, you can incur transaction and/or ongoing expenses at both the Fund level and the Contract level.
| • | | Transaction expenses can include sales charges (loads) on purchases, redemption fees, surrender fees, transfer fees and premium taxes. |
| • | | Ongoing expenses can include management fees, distribution and service (12b-1) fees, contract fees, annual maintenance fees, mortality and expense risk fees and other fees and expenses. All mutual funds and Contracts have some types of ongoing expenses. |
The expenses shown in the table below are meant to highlight ongoing expenses at the Fund level only and do not include ongoing expenses at the Contract level, or transaction expenses at either the Fund or Contract level. While the Fund does not have transaction expenses, if the transaction and ongoing expenses at the Contract level were included, the expenses shown below would be higher. You should consult your Contract prospectus or disclosure document for more information.
The table shows Fund-level ongoing expenses and can help you understand these expenses and compare them with those of other mutual funds offered through the Contract. The table assumes a $1,000 investment held for the six months indicated. Please refer to the Fund prospectus for additional information on operating expenses.
Actual Fund Expenses
The first line (Actual) of the table below provides actual account values and expenses. The “Ending Account Value” is derived from the Fund’s actual return, which includes the effect of ongoing Fund expenses, but does not include the effect of ongoing Contract expenses.
You can estimate the Fund-level expenses you incurred during the period by following these steps. Of course, your account value and expenses will differ from those in this illustration:
| 1. | Divide your account value by $1,000. |
If an account had an $8,600 value, then $8,600 ÷ $1,000 = 8.6.
| 2. | Multiply the result by the number under the heading “Fund-Level Expenses Incurred During Period.” |
If Fund-Level Expenses Incurred During Period were $7.50, then 8.6 × $7.50 = $64.50.
Mutual Shares Securities Fund – Class 1
MS-7
In this illustration, the estimated expenses incurred this period at the Fund level are $64.50.
Hypothetical Example for Comparison with Other Mutual Funds
Information in the second line (Hypothetical) of the table can help you compare ongoing expenses of the Fund with those of other mutual funds offered through the Contract. This information may not be used to estimate the actual ending account balance or expenses you incurred during the period. The hypothetical “Ending Account Value” is based on the Fund’s actual expense ratio and an assumed 5% annual rate of return before expenses, which does not represent the Fund’s actual return. The figure under the heading “Fund-Level Expenses Incurred During Period” shows the hypothetical expenses your account would have incurred under this scenario. You can compare this figure with the 5% hypothetical examples that appear in shareholder reports of other funds offered through a Contract.
| | | | | | | | | |
| Class 1 | | Beginning
Account
Value 7/1/05 | | Ending
Account
Value 12/31/05 | | Fund-Level
Expenses Incurred
During Period*
7/1/05-12/31/05 |
Actual | | $ | 1,000 | | $ | 1,084.60 | | $ | 4.20 |
Hypothetical (5% return before expenses) | | $ | 1,000 | | $ | 1,021.17 | | $ | 4.08 |
*Expenses are equal to the annualized expense ratio for the Fund’s Class 1 shares (0.80%), which does not include any ongoing expenses of the Contract for which the Fund is an investment option, multiplied by the average account value over the period, multiplied by 184/365 to reflect the one-half year period.
MS-8
Franklin Templeton Variable Insurance Products Trust
Financial Highlights
Mutual Shares Securities Fund
| | | | | | | | | | | | | | | | | | | | |
| | | Year Ended December 31,
| |
| Class 1 | | 2005 | | | 2004 | | | 2003 | | | 2002 | | | 2001 | |
| | |
|
|
|
Per share operating performance | | | | | | | | | | | | | | | | | | | | |
(for a share outstanding throughout the year) | | | | | | | | | | | | | | | | | | | | |
Net asset value, beginning of year | | $ | 16.78 | | | $ | 15.00 | | | $ | 12.09 | | | $ | 14.08 | | | $ | 14.24 | |
| | |
|
|
|
Income from investment operations: | | | | | | | | | | | | | | | | | | | | |
Net investment incomea | | | 0.34 | | | | 0.21 | | | | 0.18 | | | | 0.20 | | | | 0.21 | |
Net realized and unrealized gains (losses) | | | 1.47 | | | | 1.71 | | | | 2.88 | | | | (1.78 | ) | | | 0.86 | |
| | |
|
|
|
Total from investment operations | | | 1.81 | | | | 1.92 | | | | 3.06 | | | | (1.58 | ) | | | 1.07 | |
| | |
|
|
|
Less distributions from: | | | | | | | | | | | | | | | | | | | | |
Net investment income | | | (0.18 | ) | | | (0.14 | ) | | | (0.15 | ) | | | (0.12 | ) | | | (0.29 | ) |
Net realized gains | | | (0.06 | ) | | | — | | | | — | | | | (0.29 | ) | | | (0.94 | ) |
| | |
|
|
|
Total distributions | | | (0.24 | ) | | | (0.14 | ) | | | (0.15 | ) | | | (0.41 | ) | | | (1.23 | ) |
| | |
|
|
|
Net asset value, end of year | | $ | 18.35 | | | $ | 16.78 | | | $ | 15.00 | | | $ | 12.09 | | | $ | 14.08 | |
| | |
|
|
|
| | | | | |
Total returnb | | | 10.83% | | | | 12.88% | | | | 25.48% | | | | (11.59)% | | | | 7.31% | |
Ratios/supplemental data | | | | | | | | | | | | | | | | | | | | |
Net assets, end of year (000’s) | | $ | 260,317 | | | $ | 287,324 | | | $ | 312,386 | | | $ | 288,928 | | | $ | 399,336 | |
Ratios to average net assets:* | | | | | | | | | | | | | | | | | | | | |
Expensesc | | | 0.78% | | | | 0.75% | | | | 0.80% | | | | 0.80% | | | | 0.79% | |
Net investment income | | | 1.97% | | | | 1.40% | | | | 1.33% | | | | 1.57% | | | | 1.42% | |
Portfolio turnover rate | | | 19.59% | | | | 31.49% | | | | 55.71% | | | | 49.80% | | | | 54.73% | |
*Ratios to average net assets, excluding dividend expense on securities sold short: | | | | | | | | | | | | | | | | | | | | |
Expenses | | | 0.74% | | | | 0.73% | | | | 0.76% | | | | 0.79% | | | | 0.78% | |
| a | Based on average daily shares outstanding. |
| b | Total return does not include any fees, charges or expenses imposed by the variable annuity and life insurance contracts for which the Franklin Templeton Variable Insurance Products Trust serves as an underlying investment vehicle. |
| c | Includes dividend expense on securities sold short which varies from period to period. See below for expense ratios that reflect only operating expenses. |
See notes to financial statements.
MS-9
Franklin Templeton Variable Insurance Products Trust
Financial Highlights (continued)
Mutual Shares Securities Fund (continued)
| | | | | | | | | | | | | | | | | | | | |
| | | Year Ended December 31,
| |
| Class 2 | | 2005 | | | 2004 | | | 2003 | | | 2002 | | | 2001 | |
| | |
|
|
|
Per share operating performance | | | | | | | | | | | | | | | | | | | | |
(for a share outstanding throughout the year) | | | | | | | | | | | | | | | | | | | | |
Net asset value, beginning of year | | $ | 16.64 | | | $ | 14.90 | | | $ | 12.02 | | | $ | 14.03 | | | $ | 14.22 | |
| | |
|
|
|
Income from investment operations: | | | | | | | | | | | | | | | | | | | | |
Net investment incomea | | | 0.29 | | | | 0.18 | | | | 0.14 | | | | 0.16 | | | | 0.15 | |
Net realized and unrealized gains (losses) | | | 1.46 | | | | 1.68 | | | | 2.88 | | | | (1.77 | ) | | | 0.88 | |
| | |
|
|
|
Total from investment operations | | | 1.75 | | | | 1.86 | | | | 3.02 | | | | (1.61 | ) | | | 1.03 | |
| | |
|
|
|
Less distributions from: | | | | | | | | | | | | | | | | | | | | |
Net investment income | | | (0.15 | ) | | | (0.12 | ) | | | (0.14 | ) | | | (0.11 | ) | | | (0.28 | ) |
Net realized gains | | | (0.06 | ) | | | — | | | | — | | | | (0.29 | ) | | | (0.94 | ) |
| | |
|
|
|
Total distributions | | | (0.21 | ) | | | (0.12 | ) | | | (0.14 | ) | | | (0.40 | ) | | | (1.22 | ) |
| | |
|
|
|
Net asset value, end of year | | $ | 18.18 | | | $ | 16.64 | | | $ | 14.90 | | | $ | 12.02 | | | $ | 14.03 | |
| | |
|
|
|
| | | | | |
Total returnb | | | 10.55% | | | | 12.63% | | | | 25.15% | | | | (11.81)% | | | | 7.04% | |
Ratios/supplemental data | | | | | | | | | | | | | | | | | | | | |
Net assets, end of year (000’s) | | $ | 3,596,889 | | | $ | 2,464,374 | | | $ | 1,469,745 | | | $ | 589,738 | | | $ | 262,621 | |
Ratios to average net assets:* | | | | | | | | | | | | | | | | | | | | |
Expensesc | | | 1.03% | | | | 1.00% | | | | 1.05% | | | | 1.05% | | | | 1.04% | |
Net investment income | | | 1.72% | | | | 1.15% | | | | 1.08% | | | | 1.32% | | | | 1.04% | |
Portfolio turnover rate | | | 19.59% | | | | 31.49% | | | | 55.71% | | | | 49.80% | | | | 54.73% | |
*Ratios to average net assets, excluding dividend expense on securities sold short: | | | | | | | | | | | | | | | | | | | | |
Expenses | | | 0.99% | | | | 0.98% | | | | 1.01% | | | | 1.04% | | | | 1.03% | |
| a | Based on average daily shares outstanding. |
| b | Total return does not include any fees, charges or expenses imposed by the variable annuity and life insurance contracts for which the Franklin Templeton Variable Insurance Products Trust serves as an underlying investment vehicle. |
| c | Includes dividend expense on securities sold short which varies from period to period. See below for expense ratios that reflect only operating expenses. |
See notes to financial statements.
MS-10
Franklin Templeton Variable Insurance Products Trust
Statement of Investments, December 31, 2005
| | | | | | | |
| Mutual Shares Securities Fund | | Country | | Shares/
Warrants/
Contracts | | Value |
Common Stocks and Other Equity Interests 81.4% | | | | | | | |
Aerospace & Defense 0.5% | | | | | | | |
aGenCorp Inc. | | United States | | 273,900 | | $ | 4,861,725 |
Northrop Grumman Corp. | | United States | | 267,950 | | | 16,106,474 |
| | | | | | |
|
|
| | | | | | | | 20,968,199 |
| | | | | | |
|
|
Airlines 0.5% | | | | | | | |
aACE Aviation Holdings Inc. | | Canada | | 427,196 | | | 13,966,659 |
a,bACE Aviation Holdings Inc., A, 144A | | Canada | | 171,143 | | | 5,595,315 |
aACE Aviation Holdings Inc., B | | Canada | | 469 | | | 15,278 |
a,cAir Canada Inc., Contingent Distribution | | Canada | | 89,884,400 | | | — |
| | | | | | |
|
|
| | | | | | | | 19,577,252 |
| | | | | | |
|
|
Beverages 3.5% | | | | | | | |
Brown-Forman Corp., A | | United States | | 7,600 | | | 539,144 |
Brown-Forman Corp., B | | United States | | 85,930 | | | 5,956,668 |
Coca-Cola Enterprises Inc. | | United States | | 1,700,180 | | | 32,592,450 |
Diageo PLC | | United Kingdom | | 2,887,297 | | | 41,850,766 |
Pernod Ricard SA | | France | | 315,624 | | | 55,076,228 |
| | | | | | |
|
|
| | | | | | | | 136,015,256 |
| | | | | | |
|
|
Capital Markets 0.5% | | | | | | | |
Bear Stearns Cos. Inc. | | United States | | 150,120 | | | 17,343,364 |
| | | | | | |
|
|
Chemicals 0.0%d | | | | | | | |
Koninklijke DSM NV | | Netherlands | | 4,800 | | | 196,046 |
| | | | | | |
|
|
Commercial Banks 7.1% | | | | | | | |
Allied Irish Banks PLC | | Ireland | | 1,892,200 | | | 40,702,271 |
Banca Intesa SpA | | Italy | | 8,263,849 | | | 43,779,631 |
Bank of Ireland | | Ireland | | 1,105,984 | | | 17,413,945 |
BNP Paribas SA | | France | | 123,900 | | | 10,025,511 |
aCentennial Bank Holdings Inc. | | United States | | 806,100 | | | 9,971,457 |
Danske Bank | | Denmark | | 588,410 | | | 20,726,881 |
a,eElephant Capital Holdings Ltd. | | Japan | | 4,653 | | | 6,630,149 |
ForeningsSparbanken AB, A | | Sweden | | 1,828,900 | | | 49,834,101 |
Mitsubishi UFJ Financial Group Inc. | | Japan | | 5,122 | | | 69,433,195 |
a,eNCB Warrant Holdings Ltd., A | | Japan | | 23,570 | | | 3,807,971 |
| | | | | | |
|
|
| | | | | | | | 272,325,112 |
| | | | | | |
|
|
Commercial Services & Supplies 1.2% | | | | | | | |
Cendant Corp. | | United States | | 747,900 | | | 12,901,275 |
aComdisco Holding Co. Inc. | | United States | | 67 | | | 1,273 |
cComdisco Holding Co. Inc., Contingent Distribution | | United States | | 8,175,255 | | | — |
Republic Services Inc. | | United States | | 699,100 | | | 26,251,205 |
a,cSafety Kleen Corp., Contingent Distribution | | United States | | 63,000 | | | — |
aUnited Stationers Inc. | | United States | | 175,900 | | | 8,531,150 |
| | | | | | |
|
|
| | | | | | | | 47,684,903 |
| | | | | | |
|
|
Computers & Peripherals 1.1% | | | | | | | |
a,eDecisionOne Corp. | | United States | | 108,227 | | | 77,166 |
aLexmark International Inc., A | | United States | | 738,090 | | | 33,088,575 |
aMaxtor Corp. | | United States | | 1,465,100 | | | 10,167,794 |
| | | | | | |
|
|
| | | | | | | | 43,333,535 |
| | | | | | |
|
|
MS-11
Franklin Templeton Variable Insurance Products Trust
Statement of Investments, December 31, 2005 (continued)
| | | | | | | |
| Mutual Shares Securities Fund | | Country | | Shares/
Warrants/
Contracts | | Value |
Common Stocks and Other Equity Interests (cont.) | | | | | | | |
Consumer Finance 0.5% | | | | | | | |
MBNA Corp. | | United States | | 766,300 | | $ | 20,805,045 |
| | | | | | |
|
|
Containers & Packaging 0.8% | | | | | | | |
Temple-Inland Inc. | | United States | | 703,900 | | | 31,569,915 |
| | | | | | |
|
|
Diversified Financial Services 1.6% | | | | | | | |
Fortis Group NV | | Belgium | | 1,545,285 | | | 49,192,180 |
Leucadia National Corp. | | United States | | 277,245 | | | 13,158,048 |
a,cMarconi Corp., Contingent Distribution | | United Kingdom | | 9,945,700 | | | — |
| | | | | | |
|
|
| | | | | | | | 62,350,228 |
| | | | | | |
|
|
Diversified Telecommunication Services 2.7% | | | | | | | |
a,e,fAboveNet Inc. | | United States | | 56,216 | | | 1,347,127 |
a,c,fAboveNet Inc., Contingent Distribution | | United States | | 8,697,000 | | | — |
a,e,fAboveNet Inc., wts., 9/08/08 | | United States | | 2,231 | | | 8,924 |
a,e,fAboveNet Inc., wts., 9/08/10 | | United States | | 2,625 | | | 2,100 |
Chunghwa Telecom Co. Ltd., ADR | | Taiwan | | 512,620 | | | 9,406,577 |
a,cGlobal Crossing Holdings Ltd., Contingent Distribution | | United States | | 9,005,048 | | | — |
Koninklijke KPN NV | | Netherlands | | 726,800 | | | 7,287,776 |
MCI Inc. | | United States | | 1,227,558 | | | 24,219,719 |
aNTL Inc. | | United Kingdom | | 368,866 | | | 25,112,397 |
Sprint Nextel Corp. | | United States | | 75,839 | | | 1,771,599 |
a,cTelewest Communications PLC, Contingent Distribution | | United Kingdom | | 14,051,600 | | | — |
a,cTelewest Finance Ltd., Contingent Distribution | | United Kingdom | | 1,475,000 | | | — |
aTelewest Global Inc. | | United Kingdom | | 863,016 | | | 20,557,041 |
Verizon Communications Inc. | | United States | | 493,700 | | | 14,870,244 |
| | | | | | |
|
|
| | | | | | | | 104,583,504 |
| | | | | | |
|
|
Electric Utilities 0.3% | | | | | | | |
E.ON AG | | Germany | | 117,600 | | | 12,176,248 |
a,bEntegra/Union Power, 144A | | United States | | 53,679 | | | — |
| | | | | | |
|
|
| | | | | | | | 12,176,248 |
| | | | | | |
|
|
Food & Staples Retailing 1.7% | | | | | | | |
Albertson’s Inc. | | United States | | 514,820 | | | 10,991,407 |
Carrefour SA | | France | | 532,178 | | | 24,936,149 |
aKroger Co. | | United States | | 1,629,200 | | | 30,759,296 |
| | | | | | |
|
|
| | | | | | | | 66,686,852 |
| | | | | | |
|
|
Food Products 4.1% | | | | | | | |
Cadbury Schweppes PLC | | United Kingdom | | 1,900,794 | | | 17,969,864 |
General Mills Inc. | | United States | | 287,200 | | | 14,164,704 |
Groupe Danone | | France | | 154,938 | | | 16,187,111 |
Nestle SA | | Switzerland | | 163,787 | | | 48,995,844 |
Orkla ASA | | Norway | | 1,490,260 | | | 61,711,460 |
| | | | | | |
|
|
| | | | | | | | 159,028,983 |
| | | | | | |
|
|
Health Care Equipment & Supplies 1.6% | | | | | | | |
Guidant Corp. | | United States | | 544,800 | | | 35,275,800 |
Hillenbrand Industries Inc. | | United States | | 493,700 | | | 24,393,717 |
| | | | | | |
|
|
| | | | | | | | 59,669,517 |
| | | | | | |
|
|
MS-12
Franklin Templeton Variable Insurance Products Trust
Statement of Investments, December 31, 2005 (continued)
| | | | | | | |
| Mutual Shares Securities Fund | | Country | | Shares/
Warrants/
Contracts | | Value |
Common Stocks and Other Equity Interests (cont.) | | | | | | | |
Health Care Providers & Services 0.2% | | | | | | | |
a,fKindred Healthcare Inc. | | United States | | 140,068 | | $ | 3,427,744 |
a,fKindred Healthcare Inc., Jan. 9.07 Calls, 1/01/13 | | United States | | 67 | | | 1,031 |
a,fKindred Healthcare Inc., Jan. 25.99 Calls, 1/01/14 | | United States | | 33 | | | — |
a,fKindred Healthcare Inc., Jan. 26.00 Calls, 1/01/12 | | United States | | 101 | | | — |
a,fKindred Healthcare Inc., Jul. 23.75 Calls, 7/17/11 | | United States | | 450 | | | 325 |
a,fKindred Healthcare Inc., wts., Series A, 4/20/06 | | United States | | 12,897 | | | 249,454 |
a,fKindred Healthcare Inc., wts., Series B, 4/20/06 | | United States | | 32,243 | | | 529,914 |
MDS Inc. | | Canada | | 240,900 | | | 4,168,028 |
UnitedHealth Group Inc. | | United States | | 280 | | | 17,399 |
| | | | | | |
|
|
| | | | | | | | 8,393,895 |
| | | | | | |
|
|
Hotels, Restaurants & Leisure 0.7% | | | | | | | |
aFHC Delaware Inc. | | United States | | 139,062 | | | 483,365 |
Hilton Group | | United Kingdom | | 2,968,537 | | | 18,577,510 |
a,cTrump Atlantic, Contingent Distribution | | United States | | 10,786,000 | | | 406,632 |
aTrump Entertainment Resorts Inc. | | United States | | 375,490 | | | 7,558,614 |
| | | | | | |
|
|
| | | | | | | | 27,026,121 |
| | | | | | |
|
|
Industrial Conglomerates 2.0% | | | | | | | |
Siemens AG | | Germany | | 323,100 | | | 27,681,665 |
Tyco International Ltd. | | United States | | 1,664,700 | | | 48,043,242 |
| | | | | | |
|
|
| | | | | | | | 75,724,907 |
| | | | | | |
|
|
Insurance 10.1% | | | | | | | |
aAlleghany Corp. | | United States | | 22,436 | | | 6,371,824 |
aBerkshire Hathaway Inc., A | | United States | | 151 | | | 13,381,620 |
aBerkshire Hathaway Inc., B | | United States | | 42,667 | | | 125,248,979 |
aConseco Inc. | | United States | | 775,900 | | | 17,977,603 |
Hartford Financial Services Group Inc. | | United States | | 579,200 | | | 49,747,488 |
Montpelier Re Holdings Ltd. | | Bermuda | | 155,447 | | | 2,937,948 |
Nationwide Financial Services Inc., A | | United States | | 840,600 | | | 36,986,400 |
Old Republic International Corp. | | United States | | 1,899,700 | | | 49,886,122 |
a,eOlympus Re Holdings Ltd. | | Bermuda | | 16,280 | | | 301,180 |
Prudential Financial Inc. | | United States | | 191,900 | | | 14,045,161 |
White Mountains Insurance Group Inc. | | United States | | 130,649 | | | 72,973,999 |
| | | | | | |
|
|
| | | | | | | | 389,858,324 |
| | | | | | |
|
|
Leisure Equipment & Products 0.6% | | | | | | | |
Mattel Inc. | | United States | | 1,414,030 | | | 22,369,955 |
| | | | | | |
|
|
Machinery 1.6% | | | | | | | |
Deere & Co. | | United States | | 682,170 | | | 46,462,599 |
Federal Signal Corp. | | United States | | 949,100 | | | 14,245,991 |
| | | | | | |
|
|
| | | | | | | | 60,708,590 |
| | | | | | |
|
|
Media 6.9% | | | | | | | |
aCablevision Systems Corp., A | | United States | | 403,200 | | | 9,463,104 |
Clear Channel Communications Inc. | | United States | | 1,100,200 | | | 34,601,290 |
aComcast Corp., A | | United States | | 686,700 | | | 17,641,323 |
E.W. Scripps Co., A | | United States | | 84,032 | | | 4,035,217 |
aEchoStar Communications Corp., A | | United States | | 293,400 | | | 7,971,678 |
Hollinger International Inc. | | United States | | 610,420 | | | 5,195,895 |
Knight Ridder Inc. | | United States | | 81,700 | | | 5,171,610 |
aLiberty Media Corp., A | | United States | | 4,245,690 | | | 33,413,580 |
MS-13
Franklin Templeton Variable Insurance Products Trust
Statement of Investments, December 31, 2005 (continued)
| | | | | | | |
| Mutual Shares Securities Fund | | Country | | Shares/
Warrants/
Contracts | | Value |
Common Stocks and Other Equity Interests (cont.) | | | | | | | |
Media (cont.) | | | | | | | |
News Corp., A | | United States | | 3,253,000 | | $ | 50,584,150 |
Omnicom Group Inc. | | United States | | 118,300 | | | 10,070,879 |
eTime Warner Inc. | | United States | | 2,481,400 | | | 42,410,104 |
aTVMAX Holdings Inc. | | United States | | 35,609 | | | 35,609 |
Viacom Inc., B | | United States | | 438,900 | | | 14,308,140 |
Washington Post Co., B | | United States | | 41,469 | | | 31,723,785 |
| | | | | | |
|
|
| | | | | | | | 266,626,364 |
| | | | | | |
|
|
Metals & Mining 4.7% | | | | | | | |
Anglo American PLC | | South Africa | | 2,413,457 | | | 82,172,670 |
Anglo American PLC, ADR | | South Africa | | 200 | | | 6,956 |
Barrick Gold Corp. | | Canada | | 30,200 | | | 841,674 |
Dofasco Inc. | | Canada | | 294,109 | | | 16,442,573 |
Falconbridge Ltd. | | Canada | | 122,539 | | | 3,637,267 |
Freeport-McMoRan Copper & Gold Inc., B | | United States | | 111,600 | | | 6,004,080 |
aGlamis Gold Ltd. | | Canada | | 236,900 | | | 6,516,126 |
Gold Fields Ltd. | | South Africa | | 53,500 | | | 945,286 |
Goldcorp Inc. | | Canada | | 312,375 | | | 6,960,549 |
aGoldcorp Inc., wts., 5/30/07 | | Canada | | 221,465 | | | 924,121 |
aHarmony Gold Mining Co. Ltd., ADR | | South Africa | | 204,700 | | | 2,671,335 |
Newmont Mining Corp. | | United States | | 698,940 | | | 37,323,396 |
Placer Dome Inc. | | Canada | | 683,551 | | | 15,655,276 |
| | | | | | |
|
|
| | | | | | | | 180,101,309 |
| | | | | | |
|
|
Multi-Utilities & Unregulated Power 0.4% | | | | | | | |
NorthWestern Corp. | | United States | | 110,383 | | | 3,429,600 |
a,cNorthWestern Corp., Contingent Distribution | | United States | | 3,348,000 | | | 284,580 |
Suez SA | | France | | 327,350 | | | 10,192,126 |
| | | | | | |
|
|
| | | | | | | | 13,906,306 |
| | | | | | |
|
|
Oil, Gas & Consumable Fuels 4.8% | | | | | | | |
aAnchor Resources LLC | | United States | | 6,820 | | | — |
BP PLC | | United Kingdom | | 803,000 | | | 8,551,617 |
BP PLC, ADR | | United Kingdom | | 5,100 | | | 327,522 |
Burlington Resources Inc. | | United States | | 374,770 | | | 32,305,174 |
Oil & Natural Gas Corp. Ltd. | | India | | 514,700 | | | 13,440,310 |
aOPTI Canada | | Canada | | 1,818,475 | | | 59,718,825 |
Pogo Producing Co. | | United States | | 317,700 | | | 15,824,637 |
Statoil ASA | | Norway | | 437,557 | | | 10,048,201 |
Suncor Energy Inc. | | Canada | | 221,224 | | | 13,955,213 |
Total SA, B | | France | | 76,970 | | | 19,335,862 |
Vintage Petroleum Inc. | | United States | | 216,390 | | | 11,540,079 |
| | | | | | |
|
|
| | | | | | | | 185,047,440 |
| | | | | | |
|
|
Paper & Forest Products 3.2% | | | | | | | |
International Paper Co. | | United States | | 1,026,100 | | | 34,487,221 |
Potlatch Corp. | | United States | | 57,560 | | | 2,934,409 |
Weyerhaeuser Co. | | United States | | 1,292,100 | | | 85,717,914 |
| | | | | | |
|
|
| | | | | | | | 123,139,544 |
| | | | | | |
|
|
Pharmaceuticals 3.2% | | | | | | | |
Bristol-Myers Squibb Co. | | United States | | 801,180 | | | 18,411,117 |
aIVAX Corp. | | United States | | 78,700 | | | 2,465,671 |
Merck & Co. Inc. | | United States | | 273,700 | | | 8,706,397 |
MS-14
Franklin Templeton Variable Insurance Products Trust
Statement of Investments, December 31, 2005 (continued)
| | | | | | | |
| Mutual Shares Securities Fund | | Country | | Shares/
Warrants/
Contracts | | Value |
Common Stocks and Other Equity Interests (cont.) | | | | | | | |
Pharmaceuticals (cont.) | | | | | | | |
Pfizer Inc. | | United States | | 1,861,810 | | $ | 43,417,409 |
Sanofi-Aventis | | France | | 173,657 | | | 15,213,204 |
Valeant Pharmaceuticals International | | United States | | 1,144,800 | | | 20,697,984 |
Wyeth | | United States | | 347,100 | | | 15,990,897 |
| | | | | | |
|
|
| | | | | | | | 124,902,679 |
| | | | | | |
|
|
Real Estate 0.8% | | | | | | | |
aAlexander’s Inc. | | United States | | 7,800 | | | 1,914,900 |
Canary Wharf Group PLC | | United Kingdom | | 1,535,898 | | | 6,341,845 |
Fieldstone Investment Corp. | | United States | | 449,300 | | | 5,328,698 |
a,eSecurity Capital European Realty | | Luxembourg | | 1,120 | | | 8,140 |
Shurgard Storage Centers Inc., A | | United States | | 69,000 | | | 3,912,990 |
St. Joe Co. | | United States | | 160,000 | | | 10,755,200 |
Ventas Inc. | | United States | | 59,000 | | | 1,889,180 |
| | | | | | |
|
|
| | | | | | | | 30,150,953 |
| | | | | | |
|
|
Road & Rail 1.1% | | | | | | | |
eFlorida East Coast Industries Inc. | | United States | | 1,001,113 | | | 40,296,300 |
| | | | | | |
|
|
Software 0.7% | | | | | | | |
Microsoft Corp. | | United States | | 1,072,000 | | | 28,032,800 |
| | | | | | |
|
|
Textiles Apparel & Luxury Goods 0.2% | | | | | | | |
Reebok International Ltd. | | United States | | 126,400 | | | 7,360,272 |
| | | | | | |
|
|
Thrifts & Mortgage Finance 1.6% | | | | | | | |
Hudson City Bancorp Inc. | | United States | | 2,322,253 | | | 28,145,706 |
Sovereign Bancorp Inc. | | United States | | 1,457,200 | | | 31,504,664 |
| | | | | | |
|
|
| | | | | | | | 59,650,370 |
| | | | | | |
|
|
Tobacco 10.9% | | | | | | | |
Altadis SA | | Spain | | 1,573,026 | | | 71,360,533 |
Altria Group Inc. | | United States | | 633,437 | | | 47,330,412 |
British American Tobacco PLC | | United Kingdom | | 5,486,867 | | | 122,718,440 |
British American Tobacco PLC, ADR | | United Kingdom | | 4,300 | | | 193,672 |
Imperial Tobacco Group PLC | | United Kingdom | | 2,140,709 | | | 63,973,409 |
KT&G Corp. | | South Korea | | 675,660 | | | 30,211,894 |
bKT&G Corp., GDR, 144A | | South Korea | | 871,300 | | | 19,168,600 |
Reynolds American Inc. | | United States | | 684,800 | | | 65,281,984 |
| | | | | | |
|
|
| | | | | | | | 420,238,944 |
| | | | | | |
|
|
Total Common Stocks and Other Equity Interests
(Cost $2,501,668,796) | | | | | | | 3,137,849,032 |
| | | | | | |
|
|
Preferred Stocks 0.4% | | | | | | | |
Diversified Telecommunication Services 0.0%d | | | | | | | |
PTV Inc., 10.00%, A, pfd. | | United Kingdom | | 17,300 | | | 36,330 |
| | | | | | |
|
|
Electric Utilities 0.0%d | | | | | | | |
aMontana Power Co., 8.45%, pfd. | | United States | | 17,650 | | | 145,612 |
| | | | | | |
|
|
Metals & Mining 0.4% | | | | | | | |
e,fEsmark Inc., Series A, 10.00%, cvt. pfd. | | United States | | 12,918 | | | 13,546,332 |
Falconbridge Ltd., 6.00%, cvt. pfd., 1 | | Canada | | 8,481 | | | 214,146 |
Falconbridge Ltd., 6.25%, cvt. pfd., 2 | | Canada | | 8,481 | | | 214,145 |
Falconbridge Ltd., 6.50%, cvt. pfd., 3 | | Canada | | 4,240 | | | 107,484 |
| | | | | | |
|
|
| | | | | | | | 14,082,107 |
| | | | | | |
|
|
Total Preferred Stocks (Cost $14,069,006) | | | | | | | 14,264,049 |
| | | | | | |
|
|
MS-15
Franklin Templeton Variable Insurance Products Trust
Statement of Investments, December 31, 2005 (continued)
| | | | | | | | |
| Mutual Shares Securities Fund | | Country | | Principal
Amountj | | | Value |
Corporate Bonds & Notes 1.1% | | | | | | | | |
bACE Aviation Holdings Inc., cvt., 144A, 4.25%, 6/1/35 | | Canada | | 1,266,000 | CAD | | $ | 1,067,435 |
gCollins & Aikman Products Co., | | | | | | | | |
Revolver, FRN, 10.75%, 8/31/09 | | United States | | 279,800 | | | | 271,406 |
Tranche B1 Term Loan, FRN, 10.75%, 8/31/11 | | United States | | 655,200 | | | | 635,544 |
Dana Corp., | | | | | | | | |
5.85%, 1/15/15 | | United States | | 3,165,000 | | | | 2,262,975 |
7.00%, 3/01/29 | | United States | | 437,000 | | | | 315,733 |
eDecisionOne Corp., 144A, 12.00%, 4/15/10 | | United States | | 117,480 | | | | 117,480 |
Entegra/Union Power, | | | | | | | | |
Term Loan A, 4.00%, 6/01/12 | | United States | | 2,734,577 | | | | 2,351,736 |
Term Loan B, 9.00%, 6/01/20 | | United States | | 2,633,296 | | | | 2,264,635 |
Eurotunnel PLC, | | | | | | | | |
Participating Loan Note, 1.00%, 4/30/40 | | United Kingdom | | 58,000 | GBP | | | 9,480 |
b,gSenior Tranche G2 Term Loan A, 144A, FRN, 5.6176%, 12/15/12 | | United Kingdom | | 205,700 | GBP | | | 340,625 |
gTier 2, FRN, 5.796%, 12/31/18 | | United Kingdom | | 584,056 | GBP | | | 854,114 |
gTier 3, FRN, 5.796%, 12/31/25 | | United Kingdom | | 8,725,540 | GBP | | | 7,055,572 |
Eurotunnel SA, | | | | | | | | |
Senior Tranche H1 Term Loan (KfW Advance), 8.78%, 12/15/12 | | France | | 333,300 | EUR | | | 374,848 |
gTier 2 LIBOR, FRN, 3.393%, 12/31/18 | | France | | 60,952 | EUR | | | 61,334 |
gTier 2 PIBOR, FRN, 3.393%, 12/31/18 | | France | | 45,056 | EUR | | | 45,338 |
gTier 3 LIBOR, FRN, 3.393%, 12/31/25 | | France | | 9,159,534 | EUR | | | 5,096,452 |
gTier 3 PIBOR, FRN, 3.393%, 12/31/25 | | France | | 2,036,795 | EUR | | | 1,133,292 |
gMotor Coach Industries International Inc., FRN, 17.406%, 12/01/08 | | United States | | 11,491,548 | | | | 10,916,970 |
Trump Entertaiment Resorts Inc., 8.50%, 5/20/15 | | United States | | 7,730,630 | | | | 7,576,017 |
TVMAX Holdings Inc., PIK, | | | | | | | | |
11.50%, 1/16/06 | | United States | | 25,087 | | | | 25,087 |
h14.00%, 1/16/06 | | United States | | 134,988 | | | | 134,988 |
| | | | | | | |
|
|
Total Corporate Bonds & Notes (Cost $46,874,876) | | | | | | | | 42,911,061 |
| | | | | | | |
|
|
Corporate Bonds & Notes in Reorganization 1.0% | | | | | | | | |
iAdelphia Communications Corp., | | | | | | | | |
9.25%, 10/01/02 | | United States | | 3,536,000 | | | | 1,980,160 |
8.125%, 7/15/03 | | United States | | 1,895,000 | | | | 1,080,150 |
7.50%, 1/15/04 | | United States | | 350,000 | | | | 199,500 |
9.50%, 2/15/04 | | United States | | 1,000,000 | | | | 567,500 |
10.50%, 7/15/04 | | United States | | 5,577,000 | | | | 3,178,890 |
9.875%, 3/01/05 | | United States | | 504,000 | | | | 286,020 |
10.25%, 11/01/06 | | United States | | 1,823,000 | | | | 1,020,880 |
9.875%, 3/01/07 | | United States | | 242,000 | | | | 137,940 |
8.375%, 2/01/08 | | United States | | 1,238,000 | | | | 705,660 |
7.75%, 1/15/09 | | United States | | 2,918,000 | | | | 1,648,670 |
7.875%, 5/01/09 | | United States | | 3,372,000 | | | | 1,871,460 |
9.375%, 11/15/09 | | United States | | 3,572,000 | | | | 2,107,480 |
10.875%, 10/01/10 | | United States | | 1,611,000 | | | | 910,215 |
10.25%, 6/15/11 | | United States | | 2,227,000 | | | | 1,347,335 |
iArmstrong World Industries Inc., | | | | | | | | |
6.35%, 8/15/03 | | United States | | 5,557,000 | | | | 4,001,040 |
6.50%, 8/15/05 | | United States | | 443,000 | | | | 314,530 |
9.75%, 4/15/08 | | United States | | 1,165,000 | | | | 862,100 |
7.45%, 5/15/29 | | United States | | 693,000 | | | | 512,820 |
Revolver, 10/29/03 | | United States | | 888,525 | | | | 623,078 |
Trade Claim | | United States | | 2,382,700 | | | | 1,658,955 |
iCentury Communications Corp., | | | | | | | | |
8.875%, 1/15/07 | | United States | | 115,000 | | | | 110,400 |
MS-16
Franklin Templeton Variable Insurance Products Trust
Statement of Investments, December 31, 2005 (continued)
| | | | | | | | | |
| Mutual Shares Securities Fund | | Country | | Shares/
Principal
Amountj | | | Value | |
Corporate Bonds & Notes in Reorganization (cont.) | | | | | | | | | |
iCentury Communications Corp. (cont.) | | | | | | | | | |
8.75%, 10/01/07 | | United States | | 1,145,000 | | | $ | 1,076,300 | |
8.375%, 12/15/07 | | United States | | 90,000 | | | | 86,400 | |
senior note, 9.50%, 3/01/05 | | United States | | 245,000 | | | | 237,650 | |
Series B, zero cpn., 1/15/08 | | United States | | 1,735,000 | | | | 962,925 | |
zero cpn., 3/15/03 | | United States | | 2,157,000 | | | | 1,833,450 | |
h,iOwens Corning, Revolver, 6/26/02 | | United States | | 5,749,845 | | | | 8,049,782 | |
iSafety Kleen Services, senior sub. note, 9.25%, 6/01/08 | | United States | | 5,000 | | | | 2 | |
| | | | | | | |
|
|
|
Total Corporate Bonds & Notes in Reorganization
(Cost $39,387,504) | | | | | | | | 37,371,292 | |
| | | | | | | |
|
|
|
Companies in Liquidation 0.0%d | | | | | | | | | |
aPeregrine Investments Holdings Ltd., 6.70%, 1/15/98 | | Hong Kong | | 5,000,000 | JPY | | | 1,271 | |
aPIV Investment Finance (Cayman) Ltd. | | Hong Kong | | 12,200,000 | | | | 732,000 | |
aUnited Cos. Financial Corp., Bank Claim | | United States | | 9,660 | | | | — | |
| | | | | | | |
|
|
|
Total Companies in Liquidation (Cost $—) | | | | | | | | 733,271 | |
| | | | | | | |
|
|
|
Government Agencies 15.1% | | | | | | | | | |
k,lFederal Home Loan Bank, 0.00% - 2.26%, 1/03/06 - 1/26/07 | | United States | | 578,081,000 | | | | 573,640,243 | |
Federal Home Loan Mortgage Corp., 2.50%, 05/19/06 | | United States | | 5,000,000 | | | | 4,961,210 | |
lU.S. Treasury Bills, 2/02/06 - 2/16/06 | | United States | | 5,000,000 | | | | 4,979,633 | |
| | | | | | | |
|
|
|
Total Government Agencies (Cost $584,388,823) | | | | | | | | 583,581,086 | |
| | | | | | | |
|
|
|
Total Investments (Cost $3,186,389,005) 99.0% | | | | | | | | 3,816,709,791 | |
Options Written 0.0%d | | | | | | | | (8,500 | ) |
Securities Sold Short (2.0)% | | | | | | | | (75,455,485 | ) |
Net Unrealized Gain/Loss on Forward Exchange
Contracts 0.4% | | | | | | | | 14,125,573 | |
Other Assets, less Liabilities 2.6% | | | | | | | | 101,834,358 | |
| | | | | | | |
|
|
|
Net Assets 100.0% | | | | | | | $ | 3,857,205,737 | |
| | | | | | | |
|
|
|
| | | | | Contracts
| | | | |
| | | |
mOptions Written 0.0%d | | | | | | | | | |
Media 0.0%d | | | | | | | | | |
Cablevision Systems Corp., Jan. 22.50 Puts, 1/21/06 | | United States | | 100 | | | $ | 4,500 | |
| | | | | | | |
|
|
|
Pharmaceuticals 0.0%d | | | | | | | | | |
Pfizer Inc., Jan. 22.50 Puts, 1/21/06 | | United States | | 200 | | | | 4,000 | |
| | | | | | | |
|
|
|
Total Options Written (Premium Received $24,199) | | | | | | | | 8,500 | |
| | | | | | | |
|
|
|
| | | | | Shares
| | | | |
nSecurities Sold Short 2.0% | | | | | | | | | |
Commercial Banks 0.5% | | | | | | | | | |
Bank of America Corp. | | United States | | 385,629 | | | | 17,796,778 | |
| | | | | | | |
|
|
|
Computers & Peripherals 0.3% | | | | | | | | | |
Seagate Technology | | United States | | 542,100 | | | | 10,836,579 | |
| | | | | | | |
|
|
|
Food Products 0.3% | | | | | | | | | |
Kraft Foods Inc., A | | United States | | 363,654 | | | | 10,233,224 | |
| | | | | | | |
|
|
|
MS-17
Franklin Templeton Variable Insurance Products Trust
Statement of Investments, December 31, 2005 (continued)
| | | | | | | | |
| Mutual Shares Securities Fund | | Country | | Shares | | Value |
Securities Sold Short (cont.) | | | | | | | | |
Health Care Equipment & Supplies 0.1% | | | | | | | | |
Alcon Inc. | | Switzerland | | $ | 43,400 | | $ | 5,624,640 |
| | | | | | | |
|
|
Health Care Providers & Services 0.0%d | | | | | | | | |
WellPoint Inc. | | United States | | | 21 | | | 1,676 |
| | | | | | | |
|
|
Metals & Mining 0.1% | | | | | | | | |
Inco Ltd. | | Canada | | | 64,169 | | | 2,788,036 |
| | | | | | | |
|
|
Oil, Gas & Consumable Fuels 0.6% | | | | | | | | |
ConocoPhillips | | United States | | | 270,360 | | | 15,729,545 |
Occidental Petroleum Corp. | | United States | | | 90,880 | | | 7,259,494 |
| | | | | | | |
|
|
| | | | | | | | | 22,989,039 |
| | | | | | | �� |
|
|
Pharmaceuticals 0.0%d | | | | | | | | |
Teva Pharmaceutical Industries Ltd., ADR | | Israel | | | 33,400 | | | 1,436,534 |
| | | | | | | |
|
|
Real Estate 0.1% | | | | | | | | |
Public Storage Inc. | | United States | | | 55,360 | | | 3,748,979 |
| | | | | | | |
|
|
Total Securities Sold Short (Proceeds $76,339,535) | | | | | | | $ | 75,455,485 |
| | | | | | | |
|
|
Currency Abbreviations
CAD - Canadian Dollar
EUR - Euro
GBP - British Pound
JPY - Japanese Yen
Selected Portfolio Abbreviations
| ADR - | American Depository Receipt |
| GDR - | Global Depository Receipt |
| LIBOR - | London InterBank Offered Rate |
| PIBOR - | Paris InterBank Offered Rate |
aNon-income producing.
bSecurity was purchased pursuant to Rule 144A under the Securities Act of 1933 and may be sold in transactions exempt from registration only to qualified institutional buyers or in a public offering registered under the Securities Act of 1933. These securities have been deemed liquid under guidelines approved by the Trust’s Board of Trustees. At December 31, 2005, the aggregate value of these securities was $26,171,975, representing 0.68% of net assets.
cContingent Distributions represent the right to receive additional distributions, if any, during the reorganization of the underlying company. Shares represent total underlying principal of debt securities.
dRounds to less than 0.05% of net assets.
eSee Note 10 regarding restricted and illiquid securities.
fSee Note 12 regarding other considerations.
gThe coupon rate shown represents the rate at period end.
hSee Note 11 regarding unfunded loan commitments
iSee Note 9 regarding defaulted securities.
jThe principal amount is stated in U.S. dollars unless otherwise indicated.
kSee Note 1(f) regarding securities segregated with broker for securities sold short.
lA portion or all of the security is traded on a discount basis with no stated coupon rate.
mSee Note 1(e) regarding written options.
nSee Note 1(f) regarding securities sold short.
See notes to financial statements.
MS-18
Franklin Templeton Variable Insurance Products Trust
Financial Statements
Statement of Assets and Liabilities
December 31, 2005
| | | |
| | | Mutual Shares
Securities Fund
|
Assets: | | | |
Investments in securities: | | | |
Cost | | $ | 3,186,389,005 |
| | |
|
|
Value (includes securities segregated with broker for securities sold short in the amount of $48,976,952) | | $ | 3,816,709,791 |
Cash | | | 392,058 |
Foreign currency, at value (cost $15,202,238) | | | 15,202,238 |
Receivables: | | | |
Investment securities sold | | | 15,513,922 |
Capital shares sold | | | 2,512,253 |
Dividends and interest | | | 5,747,948 |
Unrealized gain on unfunded loan commitments (Note 11) | | | 228,936 |
Unrealized gain on forward exchange contracts (Note 8) | | | 19,114,875 |
Cash on deposit with brokers for securities sold short | | | 81,003,063 |
Due from broker - synthetic equity swaps | | | 5,470,973 |
| | |
|
|
Total assets | | | 3,961,896,057 |
| | |
|
|
Liabilities: | | | |
Payables: | | | |
Investment securities purchased | | | 18,638,355 |
Capital shares redeemed | | | 1,376,411 |
Affiliates | | | 3,703,417 |
Securities sold short, at value (proceeds $76,339,535) | | | 75,455,485 |
Options written, at value (premiums received $24,199) | | | 8,500 |
Unrealized loss on forward exchange contracts (Note 8) | | | 4,989,302 |
Deferred tax | | | 112,380 |
Accrued expenses and other liabilities | | | 406,470 |
| | |
|
|
Total liabilities | | | 104,690,320 |
| | |
|
|
Net assets, at value | | $ | 3,857,205,737 |
| | |
|
|
Net assets consist of: | | | |
Paid-in capital | | $ | 3,030,248,195 |
Undistributed net investment income | | | 50,700,928 |
Net unrealized appreciation (depreciation) | | | 646,313,398 |
Accumulated net realized gain (loss) | | | 129,943,216 |
| | |
|
|
Net assets, at value | | $ | 3,857,205,737 |
| | |
|
|
Class 1: | | | |
Net assets, at value | | $ | 260,317,064 |
| | |
|
|
Shares outstanding | | | 14,189,811 |
| | |
|
|
Net asset value per share | | | $18.35 |
| | |
|
|
Class 2: | | | |
Net assets, at value | | $ | 3,596,888,673 |
| | |
|
|
Shares outstanding | | | 197,887,695 |
| | |
|
|
Net asset value per share | | | $18.18 |
| | |
|
|
See notes to financial statements.
MS-19
Franklin Templeton Variable Insurance Products Trust
Financial Statements (continued)
Statement of Operations
for the period ended December 31, 2005
| | | | |
| | | Mutual Shares
Securities Fund
| |
Investment income: | | | | |
Dividends | | $ | 60,609,646 | |
Interest | | | 28,263,803 | |
Other income (Note 13) | | | 72,434 | |
| | |
|
|
|
Total investment income | | | 88,945,883 | |
| | |
|
|
|
Expenses: | | | | |
Management fees (Note 3a) | | | 19,424,964 | |
Administrative fees (Note 3b) | | | 3,003,120 | |
Distribution fees - Class 2 (Note 3c) | | | 7,428,792 | |
Custodian fees (Note 4) | | | 386,200 | |
Reports to shareholders | | | 595,400 | |
Professional fees | | | 236,769 | |
Trustees’ fees and expenses | | | 19,000 | |
Dividends on securities sold short | | | 1,413,473 | |
Other | | | 157,677 | |
| | |
|
|
|
Total expenses | | | 32,665,395 | |
Expense reductions (Note 4) | | | (18,006 | ) |
| | |
|
|
|
Net expenses | | | 32,647,389 | |
| | |
|
|
|
Net investment income | | | 56,298,494 | |
| | |
|
|
|
Realized and unrealized gains (losses): | | | | |
Net realized gain (loss) from: | | | | |
Investments | | | 101,722,871 | |
Written options | | | 255,994 | |
Securities sold short | | | (1,103,072 | ) |
Foreign currency transactions | | | 16,884,774 | |
| | |
|
|
|
Net realized gain (loss) | | | 117,760,567 | |
| | |
|
|
|
Net change in unrealized appreciation (depreciation) on: | | | | |
Investments | | | 146,058,546 | |
Translation of assets and liabilities denominated in foreign currencies | | | 28,761,727 | |
Change in deferred taxes on unrealized appreciation | | | (108,803 | ) |
| | |
|
|
|
Net change in unrealized appreciation (depreciation) | | | 174,711,470 | |
| | |
|
|
|
Net realized and unrealized gain (loss) | | | 292,472,037 | |
| | |
|
|
|
Net increase (decrease) in net assets resulting from operations | | $ | 348,770,531 | |
| | |
|
|
|
See notes to financial statements.
MS-20
Franklin Templeton Variable Insurance Products Trust
Financial Statements (continued)
Statements of Changes in Net Assets
| | | | | | | | |
| | | Mutual Shares
Securities Fund
| |
| | | Year Ended December 31,
| |
| | | 2005 | | | 2004 | |
| | |
| |
Increase (decrease) in net assets: | | | | | | | | |
Operations: | | | | | | | | |
Net investment income | | $ | 56,298,494 | | | $ | 25,980,773 | |
Net realized gain (loss) from investments, written options, securities sold short, and foreign currency transactions | | | 117,760,567 | | | | 56,418,661 | |
Net change in unrealized appreciation (depreciation) on investments and translation of assets and liabilities denominated in foreign currencies, and deferred taxes | | | 174,711,470 | | | | 201,178,475 | |
| | |
| |
Net increase (decrease) in net assets resulting from operations | | | 348,770,531 | | | | 283,577,909 | |
| | |
| |
Distributions to shareholders from: | | | | | | | | |
Net investment income: | | | | | | | | |
Class 1 | | | (2,826,464 | ) | | | (2,575,038 | ) |
Class 2 | | | (26,109,168 | ) | | | (14,440,220 | ) |
Net realized gains: | | | | | | | | |
Class 1 | | | (894,708 | ) | | | — | |
Class 2 | | | (9,780,252 | ) | | | — | |
| | |
| |
Total distributions to shareholders | | | (39,610,592 | ) | | | (17,015,258 | ) |
| | |
| |
Capital share transactions: (Note 2) | | | | | | | | |
Class 1 | | | (50,520,715 | ) | | | (56,995,395 | ) |
Class 2 | | | 846,868,000 | | | | 760,000,491 | |
| | |
| |
Total capital share transactions | | | 796,347,285 | | | | 703,005,096 | |
| | |
| |
Net increase (decrease) in net assets | | | 1,105,507,224 | | | | 969,567,747 | |
Net assets | | | | | | | | |
Beginning of year | | | 2,751,698,513 | | | | 1,782,130,766 | |
| | |
| |
End of year | | $ | 3,857,205,737 | | | $ | 2,751,698,513 | |
| | |
| |
Undistributed net investment income included in net assets: | | | | | | | | |
End of year | | $ | 50,700,928 | | | $ | 26,174,774 | |
| | |
| |
See notes to financial statements.
MS-21
Franklin Templeton Variable Insurance Products Trust
Notes to Financial Statements
Mutual Shares Securities Fund
1. ORGANIZATION AND SIGNIFICANT ACCOUNTING POLICIES
Franklin Templeton Variable Insurance Products Trust (the Trust) is registered under the Investment Company Act of 1940 as an open-end investment company, consisting of twenty-two separate series. The Mutual Shares Securities Fund (the Fund) included in this report is diversified. The financial statements of the remaining funds in the series are presented separately. Shares of the Fund are sold only to insurance company separate accounts to fund the benefits of variable life insurance policies or variable annuity contracts. As of December 31, 2005, 53.37% of the Fund’s shares were sold through one insurance company.
The following summarizes the Fund’s significant accounting policies.
a. Security Valuation
Securities listed on a securities exchange or on the NASDAQ National Market System are valued at the last quoted sale price or the official closing price of the day, respectively. Over-the-counter securities and listed securities for which there is no reported sale are valued within the range of the most recent quoted bid and ask prices. Securities that trade in multiple markets or on multiple exchanges are valued according to the broadest and most representative market.
Corporate debt securities and government securities generally trade in the over-the-counter market rather than on a securities exchange. The Trust may utilize independent pricing services, quotations from bond dealers, and information with respect to bond and note transactions, to assist in determining a current market value for each security. The Trust’s pricing services may use valuation models or matrix pricing which considers information with respect to comparable bond and note transactions, quotations from bond dealers, or by reference to other securities that are considered comparable in such characteristics as rating, interest rate and maturity date, option adjusted spread models, prepayment projections, interest rate spreads and yield curves, to determine current value.
Foreign securities are valued as of the close of trading on the foreign stock exchange on which the security is primarily traded, or the NYSE, whichever is earlier. If no sale is reported at that time, the foreign security will be valued within the range of the most recent quoted bid and ask prices. The value is then converted into its U.S. dollar equivalent at the foreign exchange rate in effect at the close of the NYSE on the day that the value of the foreign security is determined.
The Trust has procedures to determine the fair value of individual securities and other assets for which market prices are not readily available or which may not be reliably priced. Methods for valuing these securities may include: fundamental analysis, matrix pricing, discounts from market prices of similar securities, or discounts applied due to the nature and duration of restrictions on the disposition of the securities. Due to the inherent uncertainty of valuations of such securities, the fair values may differ significantly from the values that would have been used had a ready market for such investments existed. Occasionally, events occur between the time at which trading in a security is completed and the close of the NYSE that might call into question the availability (including the reliability) of the value of a portfolio security held by the Fund. If such an event occurs, the securities may be valued using fair value procedures, which may include the use of independent pricing services. All security valuation procedures are approved by the Trust’s Board of Trustees.
b. Foreign Currency Translation
Portfolio securities and other assets and liabilities denominated in foreign currencies are translated into U.S. dollars based on the exchange rate of such currencies against U.S. dollars on the date of valuation. Purchases and sales of securities, income and expense items denominated in foreign currencies are translated into U.S. dollars at the exchange rate in effect on the transaction date. Occasionally, events may impact the availability or reliability of foreign exchange rates used to convert the U.S. dollar equivalent value. If such an event occurs, the foreign exchange rate will be valued at fair value using procedures established and approved by the Trust’s Board of Trustees.
The Fund does not separately report the effect of changes in foreign exchange rates from changes in market prices on securities held. Such changes are included in net realized and unrealized gain or loss from investments on the Statement of Operations.
MS-22
Franklin Templeton Variable Insurance Products Trust
Notes to Financial Statements (continued)
Mutual Shares Securities Fund
1. ORGANIZATION AND SIGNIFICANT ACCOUNTING POLICIES (continued)
b. Foreign Currency Translation (continued)
Realized foreign exchange gains or losses arise from sales of foreign currencies, currency gains or losses realized between the trade and settlement dates on securities transactions and the difference between the recorded amounts of dividends, interest, and foreign withholding taxes and the U.S. dollar equivalent of the amounts actually received or paid. Net unrealized foreign exchange gains and losses arise from changes in foreign exchange rates on foreign denominated assets and liabilities other than investments in securities held at the end of the reporting period.
c. Foreign Currency Contracts
The Fund may enter into forward exchange contracts to hedge against fluctuations in foreign exchange rates. A forward exchange contract is an agreement between two parties to exchange different currencies at an agreed upon exchange rate at a future date. These contracts are valued daily by the Fund and the net unrealized gain or loss on the contracts, as measured by the difference between the contractual forward foreign exchange rates and the forward rates at the reporting date, is included in the Statement of Assets and Liabilities. Realized and unrealized gains and losses on these contracts are included in the Statement of Operations.
When the Fund purchases or sells foreign securities it may enter into foreign exchange contracts to minimize foreign exchange risk from the trade date to the settlement date of the transactions. Realized and unrealized gains and losses on these contracts are included in the Statement of Operations.
The risks of these contracts include movement in the values of the foreign currencies relative to the U.S. dollar and the possible inability of the counterparties to fulfill their obligations under the contracts, which may be in excess of the amount reflected in the Statement of Assets and Liabilities.
d. Synthetic Equity Swaps
The Fund may engage in synthetic equity swaps. Synthetic equity swaps are contracts entered into between a broker and the Fund under which the parties agree to make payments to each other so as to replicate the economic consequences that would apply had a purchase or sale of the underlying security taken place. Upon entering into synthetic equity swaps, the Fund is required to pledge to the broker an amount of cash and/or other assets equal to a certain percentage of the contract amount (“initial margin”). Subsequent payments known as “variation margin”, are made or received by the Fund periodically, depending on fluctuations in the value of the underlying security. When the contract is closed, the Fund records a realized gain or loss equal to the difference between the value of the contract at the time it was opened and the value at the time it was closed. The risks of entering into synthetic equity swaps include unfavorable price movements in the underlying securities or the inability of the counterparties to fulfill their obligations under the contract.
e. Options
The Fund may purchase or write options. Options are contracts entitling the holder to purchase or sell a specified number of shares or units of a particular security at a specified price. Options purchased are recorded as investments; options written (sold) are recorded as liabilities. Upon closing of an option, other than by exercise, which results in a cash settlement, the difference between the premium (original option value) and the settlement proceeds is realized as a gain or loss. When securities are acquired or delivered upon exercise of an option, the acquisition cost or sale proceeds are adjusted by the amount of the premium. When an option is closed, the difference between the premium and the cost to close the position is realized as a gain or loss. When an option expires, the premium is realized as a gain for options written or as a loss for options purchased. The risks include the possibility there may be an illiquid options market or the inability of the counterparties to fulfill their obligations under the contract. Writing options involves, to varying degrees, elements of market risk in excess of the amount recognized in the Statement of Assets and Liabilities.
MS-23
Franklin Templeton Variable Insurance Products Trust
Notes to Financial Statements (continued)
Mutual Shares Securities Fund
1. ORGANIZATION AND SIGNIFICANT ACCOUNTING POLICIES (continued)
f. Securities Sold Short
The Fund is engaged in selling securities short, which obligates the Fund to replace a borrowed security with the same security at current market value. The Fund incurs a loss if the price of the security increases between the date of the short sale and the date on which the Fund replaces the borrowed security. The Fund realizes a gain if the price of the security declines between those dates. Gains are limited to the price at which the Fund sold the security short, while losses are potentially unlimited in size.
The Fund is required to establish a margin account with the broker lending the security sold short. While the short sale is outstanding, the broker retains the proceeds of the short sale and the Fund must maintain a deposit with broker consisting of cash and securities having a value equal to a specified percentage of the value of the securities sold short. The Fund is obligated to pay the counterparty any dividends or interest due on securities sold short. Such dividends and interest are recorded as an expense to the Fund.
g. Income and Deferred Taxes
No provision has been made for U.S. income taxes because the Fund’s policy is to continue to qualify as a regulated investment company under the Internal Revenue Code and to distribute to shareholders substantially all of its taxable income and net realized gains.
The Fund is subject to a tax imposed on net realized gains on securities of certain foreign countries. The Fund records an estimated deferred tax liability for net unrealized gains on these securities in an amount that would be payable if the securities were disposed of on the valuation date.
Foreign securities held by the Fund may be subject to foreign taxation. Foreign taxes, if any, are recorded based on the tax regulations and rates that exist in the foreign markets in which the Fund invests.
h. Security Transactions, Investment Income, Expenses and Distributions
Security transactions are accounted for on trade date. Realized gains and losses on security transactions are determined on a specific identification basis. Interest income and estimated expenses are accrued daily. Amortization of premium and accretion of discount on debt securities are included in interest income. Dividend income and dividends declared on securities sold short are recorded on the ex-dividend date except that certain dividends from foreign securities are recognized as soon as the Fund is notified of the ex-dividend date. Distributions to shareholders are recorded on the ex-dividend date and are determined according to income tax regulations (tax basis). Such distributions are reinvested in additional shares of the Fund. Distributable earnings determined on a tax basis may differ from earnings recorded in accordance with generally accepted accounting principles. These differences may be permanent or temporary. Permanent differences are reclassified among capital accounts to
reflect their tax character. These reclassifications have no impact on net assets or the results of operations. Temporary differences are not reclassified, as they may reverse in subsequent periods.
Common expenses incurred by the Trust are allocated among the funds based on the ratio of net assets of each Fund to the combined net assets of the Trust. Fund specific expenses are charged directly to the fund that incurred the expense.
Realized and unrealized gains and losses and net investment income, other than class specific expenses, are allocated daily to each class of shares based upon the relative proportion of net assets of each class.
MS-24
Franklin Templeton Variable Insurance Products Trust
Notes to Financial Statements (continued)
Mutual Shares Securities Fund
1. ORGANIZATION AND SIGNIFICANT ACCOUNTING POLICIES (continued)
i. Accounting Estimates
The preparation of financial statements in accordance with accounting principles generally accepted in the United States of America requires management to make estimates and assumptions that affect the reported amounts of assets and liabilities at the date of the financial statements and the amounts of income and expenses during the reporting period. Actual results could differ from those estimates.
j. Guarantees and Indemnifications
Under the Trust’s organizational documents, its officers and trustees are indemnified by the Trust against certain liabilities arising out of the performance of their duties to the Trust. Additionally, in the normal course of business, the Trust enters into contracts with service providers that contain general indemnification clauses. The Trust’s maximum exposure under these arrangements is unknown as this would involve future claims that may be made against the Trust that have not yet occurred. However, based on experience, the Trust expects the risk of loss to be remote.
2. SHARES OF BENEFICIAL INTEREST
The Fund offers two classes of shares: Class 1 and Class 2. Each class of shares differs by its distribution fees, voting rights on matters affecting a single class and its exchange privilege.
At December 31, 2005, there were an unlimited number of shares authorized ($0.01 par value). Transactions in the Fund’s shares were as follows:
| | | | | | | | | | | | | | |
| | | Year Ended December 31,
| |
| | | 2005
| | | 2004
| |
| Class 1 Shares: | | Shares
| | | Amount
| | | Shares
| | | Amount
| |
Shares sold | | 127,695 | | | $ | 2,171,881 | | | 96,496 | | | $ | 1,497,941 | |
Shares issued in reinvestment of distributions | | 219,021 | | | | 3,721,172 | | | 170,194 | | | | 2,575,038 | |
Shares redeemed | | (3,282,900 | ) | | | (56,413,768 | ) | | (3,961,676 | ) | | | (61,068,374 | ) |
| | |
| |
Net increase (decrease) | | (2,936,184 | ) | | $ | (50,520,715 | ) | | (3,694,986 | ) | | $ | (56,995,395 | ) |
| | |
| |
| Class 2 Shares: | | | | | | | | | | | | |
Shares sold | | 52,207,089 | | | $ | 888,567,970 | | | 53,881,612 | | | $ | 827,334,586 | |
Shares issued in reinvestment of distributions | | 2,128,671 | | | | 35,889,392 | | | 960,760 | | | | 14,440,220 | |
Shares redeemed | | (4,560,707 | ) | | | (77,589,362 | ) | | (5,377,508 | ) | | | (81,774,315 | ) |
| | |
| |
Net increase (decrease) | | 49,775,053 | | | $ | 846,868,000 | | | 49,464,864 | | | $ | 760,000,491 | |
| | |
| |
3. TRANSACTIONS WITH AFFILIATES
Franklin Resources, Inc. is the holding company for various subsidiaries that together are referred to as Franklin Templeton Investments. Certain officers and trustees of the Trust are also officers and/or directors of the following subsidiaries:
| | |
| Subsidiary | | Affiliation |
Franklin Mutual Advisers, LLC (Franklin Mutual) | | Investment manager |
Franklin Templeton Services, LLC (FT Services) | | Administrative manager |
Franklin Templeton Distributors, Inc. (Distributors) | | Principal underwriter |
Franklin Templeton Investor Services, LLC (Investor Services) | | Transfer agent |
MS-25
Franklin Templeton Variable Insurance Products Trust
Notes to Financial Statements (continued)
Mutual Shares Securities Fund
3. TRANSACTIONS WITH AFFILIATES (continued)
a. Management Fees
The Fund pays an investment management fee to Franklin Mutual of 0.60% per year of the average daily net assets of the Fund.
b. Administrative Fees
The Fund pays an administrative fee to FT Services based on the average daily net assets of the Fund as follows:
| | |
| Annualized Fee Rate | | Net Assets |
| 0.150% | | Up to and including $200 million |
| 0.135% | | Over $200 million, up to and including $700 million |
| 0.100% | | Over $700 million, up to and including $1.2 billion |
| 0.075% | | In excess of $1.2 billion |
c. Distribution Fees
The Fund’s Board of Trustees has adopted a distribution plan for Class 2 shares pursuant to Rule 12b-1 under the 1940 Act. Under the Fund’s compensation distribution plan, the Fund pays Distributors for costs incurred in connection with the sale and distribution of the Fund’s shares up to 0.35% per year of its average daily net assets. The Board of Trustees has set the current rate at 0.25% per year.
d. Transfer Agent Fees
Investor Services, under terms of an agreement, performs shareholder servicing for the Fund and is not paid by the Fund for the services.
4. EXPENSE OFFSET ARRANGEMENT
The Fund has entered into an arrangement with its custodian whereby credits realized as a result of uninvested cash balances are used to reduce a portion of the Fund’s custodian expenses. During the year ended December 31, 2005, the custodian fees were reduced as noted in the Statement of Operations.
5. INCOME TAXES
For tax purposes, realized currency losses occurring subsequent to October 31, may be deferred and treated as occurring on the first day of the following fiscal year. At December 31, 2005, the Fund deferred realized currency losses of $203,542.
The tax character of distributions paid during the years ended December 31, 2005 and 2004, was as follows:
| | | | | | |
| | | 2005
| | 2004
|
Distributions paid from: | | | | | | |
Ordinary Income | | $ | 30,820,547 | | $ | 17,015,258 |
Long term capital gain | | | 8,790,045 | | | — |
| | |
|
| | | $ | 39,610,592 | | $ | 17,015,258 |
| | |
|
MS-26
Franklin Templeton Variable Insurance Products Trust
Notes to Financial Statements (continued)
Mutual Shares Securities Fund
5. INCOME TAXES (continued)
At December 31, 2005, the cost of investments, net unrealized appreciation (depreciation), undistributed ordinary income and undistributed long term capital gains for income tax purposes were as follows:
| | | | |
Cost of investments | | $ | 3,190,170,213 | |
| | |
|
|
|
| |
Unrealized appreciation | | $ | 690,708,823 | |
Unrealized depreciation | | | (64,169,245 | ) |
| | |
|
|
|
Net unrealized appreciation (depreciation) | | $ | 626,539,578 | |
| | |
|
|
|
Undistributed ordinary income | | $ | 84,867,199 | |
Undistributed long term capital gains | | | 113,637,059 | |
| | |
|
|
|
Distributable earnings | | $ | 198,504,258 | |
| | |
|
|
|
Net investment income differs for financial statement and tax purposes primarily due to differing treatments of defaulted securities, foreign currency transactions, bond discounts and premiums and certain dividends on securities sold short.
Net realized gains (losses) differ for financial statement and tax purposes primarily due to differing treatments of defaulted securities, wash sales, foreign currency transactions, bond discounts and premiums and certain dividends on securities sold short.
6. INVESTMENT TRANSACTIONS
Purchases and sales of investments (excluding short term securities and securities sold short) for the year ended December 31, 2005, aggregated $1,648,206,244 and $503,987,784, respectively.
Transactions in options written during the year ended December 31, 2005, were as follows:
| | | | | | | |
| | | Number of
Contracts
| | | Premium
| |
Options outstanding at December 31, 2004 | | 642 | | | $ | 87,780 | |
Options written | | 63,346 | | | | 419,930 | |
Options expired | | (60,376 | ) | | | (160,941 | ) |
Options terminated in closing transactions | | (2,763 | ) | | | (256,993 | ) |
Options exercised | | (549 | ) | | | (65,577 | ) |
| | |
| |
Options outstanding at December 31, 2005 | | 300 | | | $ | 24,199 | |
| | |
| |
7. SYNTHETIC EQUITY SWAPS
As of December 31, 2005, the Fund had the following synthetic equity swaps outstanding:
| | | | | | | | | | |
Contracts to Buy | | Number of
Contracts | | Notional
Value | | Unrealized
Gain (Loss) |
| Christian Dior SA (46.76 - 54.99 EUR) | | 30,500 | | $ | 2,711,668 | | $ | 946,771 |
| O2 Plc (1.96 - 1.97 GBP) | | 7,817,240 | | | 26,629,357 | | | 203,041 |
| | | | | | | | | |
|
|
| Total contracts to buy | | | | | | | $ | 1,149,812 |
| | | | | | | | | |
|
|
MS-27
Franklin Templeton Variable Insurance Products Trust
Notes to Financial Statements (continued)
Mutual Shares Securities Fund
7. SYNTHETIC EQUITY SWAPS (continued)
| | | | | | | | | | | |
Contracts to Sell | | Number of
Contracts | | Notional
Value | | Unrealized
Gain
(Loss) | |
| LVMH Moet Hennessy Louis Vuitton (54.61 - 61.76 EUR) | | 30,434 | | $ | 2,703,998 | | $ | (612,065 | ) |
| | | | | | | | | |
|
|
|
| Total contracts to sell | | | | | | | $ | (612,065 | ) |
| | | | | | | | | |
|
|
|
| Net unrealized gain (loss) | | | | | | | $ | 537,747 | |
| | | | | | | | | |
|
|
|
8. FORWARD EXCHANGE CONTRACTS
At December 31, 2005, the Fund had outstanding forward exchange contracts as set out below.
| | | | | | | | | |
| Contracts to Buy | | Contract
Amounta | | Settlement
Date | | Unrealized
Gain (Loss) |
| 5,663,526 | | Canadian Dollar | | 4,804,326 | | 1/23/06 | | $ | 71,904 |
| 2,218,480,000 | | Korean Won | | 2,200,000 | | 3/22/06 | | | 4,058 |
| | | | | | | | |
|
|
| | | | | | | | | $ | 75,962 |
| | | | | | | | |
|
|
| | | |
| Contracts to Sell | | Contract
Amounta | | Settlement
Date | | Unrealized
Gain (Loss) |
| 3,500,000 | | Euro | | 4,149,705 | | 1/17/06 | | $ | 2,001 |
| 23,580,000 | | Euro | | 29,140,221 | | 1/23/06 | | | 1,187,040 |
| 28,946,012 | | Swiss Franc | | 23,225,000 | | 2/02/06 | | | 1,113,859 |
| 31,225,000 | | British Pound | | 55,988,895 | | 2/15/06 | | | 2,274,790 |
| 13,230,979 | | Canadian Dollar | | 11,459,767 | | 2/15/06 | | | 60,445 |
| 20,800,000 | | Euro | | 25,242,203 | | 2/27/06 | | | 537,509 |
| 42,537,163 | | Norwegian Krone | | 6,329,935 | | 3/06/06 | | | 4,499 |
| 33,882,195 | | Euro | | 40,361,451 | | 3/15/06 | | | 140,748 |
| 339,359,604 | | Swedish Krona | | 43,440,626 | | 3/15/06 | | | 495,945 |
| 105,402,655 | | Danish Krone | | 17,940,889 | | 3/17/06 | | | 1,144,974 |
| 24,150,000 | | British Pound | | 42,543,514 | | 4/04/06 | | | 992,598 |
| 24,749,594 | | Euro | | 31,091,307 | | 4/25/06 | | | 1,599,918 |
| 56,651,945 | | Norwegian Krone | | 8,806,458 | | 5/08/06 | | | 351,796 |
| 30,000,000 | | British Pound | | 52,281,000 | | 5/15/06 | | | 641,594 |
| 45,689,332 | | Euro | | 56,776,183 | | 5/23/06 | | | 2,246,534 |
| 9,160,480 | | Norwegian Krone | | 1,400,000 | | 6/06/06 | | | 30,680 |
| 7,660,000 | | Euro | | 9,304,369 | | 6/15/06 | | | 150,286 |
| 3,788,622,302 | | Japanese Yen | | 34,654,455 | | 6/28/06 | | | 1,808,451 |
| 4,400,000 | | Euro | | 5,271,255 | | 7/17/06 | | | 3,751 |
| 36,098,834 | | British Pound | | 63,003,197 | | 8/14/06 | | | 794,613 |
| 17,517,871 | | Euro | | 21,840,492 | | 8/23/06 | | | 826,881 |
| 11,426,980 | | British Pound | | 19,983,080 | | 9/08/06 | | | 284,228 |
| 22,135,559 | | Euro | | 28,038,388 | | 9/13/06 | | | 1,455,460 |
| 36,209,800 | | Euro | | 44,453,834 | | 10/18/06 | | | 890,313 |
| | | | | | | | |
|
|
| | | | | | | | | | 19,038,913 |
| | | | | | | | |
|
|
| Unrealized gain on forward exchange contracts | | | | | | $ | 19,114,875 |
| | | | | | | | |
|
|
MS-28
Franklin Templeton Variable Insurance Products Trust
Notes to Financial Statements (continued)
Mutual Shares Securities Fund
8. FORWARD EXCHANGE CONTRACTS (continued)
| | | | | | | | | | |
| | | |
| Contracts to Buy | | Contract
Amounta | | Settlement
Date | | Unrealized
Gain (Loss) | |
| 4,955,140,000 | | Korean Won | | 4,820,000 | | 1/18/06 | | $ | (99,181 | ) |
| | | |
| Contracts to Sell | | Contract
Amounta | | Settlement
Date | | Unrealized
Gain (Loss) | |
| 117,152,812 | | Canadian Dollar | | 97,391,281 | | 1/23/06 | | $ | (3,475,917 | ) |
| 94,108,039 | | Norwegian Krone | | 13,962,617 | | 2/06/06 | | | (9,992 | ) |
| 26,951,896 | | Canadian Dollar | | 23,002,841 | | 2/15/06 | | | (217,917 | ) |
| 4,719,782 | | South African Rand | | 725,000 | | 2/15/06 | | | (18,307 | ) |
| 84,500,000 | | Norwegian Krone | | 12,551,245 | | 3/06/06 | | | (14,222 | ) |
| 17,210,174 | | Euro | | 20,282,577 | | 3/15/06 | | | (172,731 | ) |
| 22,824,002,850 | | Korean Won | | 22,068,800 | | 3/22/06 | | | (606,829 | ) |
| 91,000,000 | | Norwegian Krone | | 13,571,961 | | 6/06/06 | | | (30,837 | ) |
| 105,163,200 | | Japanese Yen | | 900,000 | | 6/28/06 | | | (11,727 | ) |
| 34,247,455 | | Euro | | 40,668,043 | | 7/17/06 | | | (331,642 | ) |
| | | | | | | | |
|
|
|
| | | | | | | | | | (4,890,121 | ) |
| | | | | | | | |
|
|
|
| Unrealized loss on forward exchange contracts | | | | | | | (4,989,302 | ) |
| | | | | | | | |
|
|
|
| Net unrealized gain on forward exchange contracts | | | | | | $ | 14,125,573 | |
| | | | | | | | |
|
|
|
| a | In U.S. Dollar unless otherwise indicated. |
9. CREDIT RISK AND DEFAULTED SECURITIES
The Fund may purchase the pre-default or defaulted debt of distressed companies. Distressed companies are financially troubled and are about to be/or are already involved in financial restructuring or bankruptcy. The Fund does not accrue income on these securities, if it becomes probable that the income will not be collected. The risks of purchasing these securities are that the issuer is unable to meet its obligation and any subsequent bankruptcy proceeding may result in unfavorable consequences to the Fund. At December 31, 2005, the value of these securities was $37,371,292, representing 0.97% of the Fund’s net assets. For information as to specific securities, see the accompanying Statement of Investments.
10. RESTRICTED AND ILLIQUID SECURITIES
At December 31, 2005, investments in securities included issues that are restricted and illiquid. Restricted securities are often purchased in private placement transactions, and cannot be sold without prior registration under the Securities Act of 1933, unless the sale is pursuant to an exemption under the 1933 Act. The Fund has registration rights for all restricted securities held at period end. The issuer generally incurs all registration costs.
MS-29
Franklin Templeton Variable Insurance Products Trust
Notes to Financial Statements (continued)
Mutual Shares Securities Fund
10. RESTRICTED AND ILLIQUID SECURITIES (continued)
A security may be considered illiquid if it lacks a readily available market or if its valuation has not changed for a certain period of time. At December 31, 2005, the Fund held investments in restricted and illiquid securities, valued in accordance with procedures approved by the Trust’s Board of Trustees as reflecting fair value, as follows:
| | | | | | | | | | |
Principal
Amount,
Shares
and
Warrants | | Issuer | | Acquisition
Date | | Cost | | Value |
| 56,216 | | AboveNet Inc. | | 10/02/01 | | $ | 2,933,131 | | $ | 1,347,127 |
| 2,231 | | AboveNet Inc., wts., 9/08/08 | | 10/02/01 | | | 279,787 | | | 8,924 |
| 2,625 | | AboveNet Inc., wts., 9/08/10 | | 10/02/01 | | | 300,103 | | | 2,100 |
| 108,227 | | DecisionOne Corp. | | 3/12/99 | | | 76,619 | | | 77,166 |
| 117,480 | | DecisionOne Corp., 144A, 12.00%, 4/15/10 | | 3/12/99 | | | 418,645 | | | 117,480 |
| 4,653 | | Elephant Capital Holdings Ltd. | | 8/29/03 | | | — | | | 6,630,149 |
| 12,918 | | Esmark Inc., Series A, 10.00%, cvt. pfd. | | 11/08/04 | | | 12,918,000 | | | 13,546,332 |
| 1,001,113 | | Florida East Coast Industries Inc. | | 5/05/97 | | | 30,413,544 | | | 40,296,300 |
| 23,570 | | NCB Warrant Holdings Ltd., A | | 12/16/05 | | | — | | | 3,807,971 |
| 16,280 | | Olympus Re Holdings Ltd. | | 12/19/01 | | | 1,628,000 | | | 301,180 |
| 1,120 | | Security Capital European Realty | | 4/08/98 | | | 61,302 | | | 8,140 |
| 2,481,400 | | Time Warner Inc. | | 8/02/05 | | | 42,858,843 | | | 42,410,104 |
| | | | | | | | | |
|
|
| | | Total Restricted and Illiquid Securities (2.81% of Net Assets) | | | | | | | $ | 108,552,973 |
| | | | | | | | | |
|
|
11. UNFUNDED LOAN COMMITMENTS
The Fund may enter into certain credit agreements, all or a portion of which may be unfunded. The Fund is obligated to fund these loan commitments at the borrowers’ discretion.
At December 31, 2005, unfunded commitments were as follows:
| | | |
| Borrower | | Unfunded
Commitment |
Entegra Power Group LLC, Project L/C Loan Facility | | $ | 744,600 |
Entegra Power Group LLC, Project W/C Loan Facility | | | 111,690 |
Mirant Corp., 4 Year Revolver, 7/17/05 | | | 80,367 |
Owens Corning, Revolver, 6/26/02 | | | 328,414 |
TVMAX Holdings Inc., PIK, 14.00%, 1/16/06 | | | 6 |
| | |
|
|
| | | $ | 1,265,077 |
| | |
|
|
Unfunded loan commitments are marked to market daily and any unrealized gain or loss is included in the Statement of Assets and Liabilities and Statement of Operations.
12. OTHER CONSIDERATIONS
Directors or employees of Franklin Mutual, the Fund’s Investment Manager, may serve as members on the board of directors of certain companies in which the Fund invests and/or may represent the Fund in certain corporate negotiations. At December 31, 2005, such individuals serve in one or more of these capacities for AboveNet Inc., Esmark Inc., and Kindred Healthcare Inc. As a result of this involvement, such individuals may be in possession of certain material non-public information which, pursuant to the Fund’s policies and the requirements of the federal securities laws, could prevent the Fund from trading in the securities of such companies for limited or extended periods of time.
MS-30
Franklin Templeton Variable Insurance Products Trust
Notes to Financial Statements (continued)
Mutual Shares Securities Fund
13. REGULATORY MATTERS
As part of various investigations by a number of federal, state, and foreign regulators and governmental entities, relating to certain practices in the mutual fund industry, including late trading, market timing and marketing support payments to securities dealers who sell fund shares, Franklin Resources, Inc. and certain of its subsidiaries (collectively, the “Company”), entered into settlements with certain of those regulators.
Specifically, the Company entered into settlements with the Securities and Exchange Commission (“SEC”) concerning market timing (the “August 2, 2004 SEC Order”) and marketing support payments to securities dealers who sell fund shares (the “December 13, 2004 SEC Order”) and with the California Attorney General’s Office (“CAGO”) concerning marketing support payments to securities dealers who sell fund shares (the “CAGO Settlement”). Under the terms of the settlements with the SEC and the CAGO, the Company retained an Independent Distribution Consultant (“IDC”) to develop a plan for distribution of the respective settlement monies. The CAGO approved the distribution plan under the CAGO Settlement and, in accordance with the terms and conditions of that settlement, the monies were disbursed to the relevant funds and are recorded as other income in the current period. The SEC has not yet approved the distribution plan pertaining to the December 13, 2004 SEC Order. When approved, disbursements of settlement monies will be made promptly to the relevant funds, in accordance with the terms and conditions of that order. The IDC continues to develop the plan of distribution under the August 2, 2004 SEC Order that resolved the SEC’s market timing investigation.
In addition, the Company, as well as most of the mutual funds within Franklin Templeton Investments and certain current or former officers, directors, and/or employees, have been named in private lawsuits (styled as shareholder class actions, or as derivative actions on behalf of either the named funds or Franklin Resources, Inc.) relating to the industry practices referenced above, as well as to allegedly excessive advisory fees, commissions, and/or 12b-1 fees. The lawsuits were filed in different courts throughout the country. Many of those suits are now pending in a multi-district litigation in the United States District Court for the District of Maryland.
The Company and fund management strongly believe that the claims made in each of the private lawsuits referenced above are without merit and intend to defend against them vigorously. The Company cannot predict with certainty the eventual outcome of these lawsuits, nor whether they will have a material negative impact on the Company. If it is determined that the Company bears responsibility for any unlawful or inappropriate conduct that caused losses to the Trust, it is committed to making the Trust or its shareholders whole, as appropriate.
MS-31
Franklin Templeton Variable Insurance Products Trust
Report of Independent Registered Public Accounting Firm
To the Board of Trustees and Shareholders of
Franklin Templeton Variable Insurance Products Trust
In our opinion, the accompanying statement of assets and liabilities, including the statement of investments, and the related statements of operations and of changes in net assets and the financial highlights present fairly, in all material respects, the financial position of Mutual Shares Securities Fund (one of the funds constituting Franklin Templeton Variable Insurance Products Trust, hereafter referred to as the “Fund”) at December 31, 2005, the results of its operations for the year then ended, the changes in its net assets for each of the two years in the period then ended and the financial highlights for each of the five periods in the period then ended, in conformity with accounting principles generally accepted in the United States of America. These financial statements and financial highlights (hereafter referred to as “financial statements”) are the responsibility of the Fund’s management; our responsibility is to express an opinion on these financial statements based on our audits. We conducted our audits of these financial statements in accordance with the standards of the Public Company Accounting Oversight Board (United States). Those standards require that we plan and perform the audit to obtain reasonable assurance about whether the financial statements are free of material misstatement. An audit includes examining, on a test basis, evidence supporting the amounts and disclosures in the financial statements, assessing the accounting principles used and significant estimates made by management, and evaluating the overall financial statement presentation. We believe that our audits, which included confirmation of securities at December 31, 2005, by correspondence with the custodian and brokers, provide a reasonable basis for our opinion.
PricewaterhouseCoopers LLP
San Francisco, California
February 10, 2006
MS-32
Franklin Templeton Variable Insurance Products Trust
Tax Designation (unaudited)
Mutual Shares Securities Fund
Under Section 852(b)(3)(C) of the Internal Revenue Code (Code), the Fund designates the maximum amount allowable but no less than $113,637,059 as a capital gain dividend for the fiscal year ended December 31, 2005.
Under Section 854(b)(2) of the Code, the Fund designates 100.00% of the ordinary income dividends as income qualifying for the dividends received deduction for the fiscal year ended December 31, 2005.
At December 31, 2005, more than 50% of the Fund’s total assets were invested in securities of foreign issuers. In most instances, foreign taxes were withheld from dividends paid to the Fund on these investments. The Fund elects to treat foreign taxes paid as allowed under Section 853 of the Code. This election will allow shareholders of record in June 2006, to treat their proportionate share of foreign taxes paid by the Fund as having been paid directly by them. The shareholder shall consider these amounts as foreign taxes paid in the tax year in which they receive the Fund distribution.
The foreign tax information will be disclosed in the June 30, 2006, semi-annual report of the Fund.
MS-33
TEMPLETON DEVELOPING MARKETS SECURITIES FUND
This annual report for Templeton Developing Markets Securities Fund covers the fiscal year ended December 31, 2005.
Performance Summary as of 12/31/05
Average annual total return of Class 1 shares* represents the average annual change in value, assuming reinvestment of dividends and capital gains. Average returns smooth out variations in returns, which can be significant; they are not the same as year-by-year results.
Periods ended 12/31/05
| | | | | | |
| | | 1-Year | | 5-Year | | Since
Inception
(3/4/96) |
Average Annual Total Return | | +27.76% | | +17.66% | | +2.29% |
*Performance prior to the 5/1/00 merger reflects historical performance of Templeton Developing Markets Fund.
Total Return Index Comparison for Hypothetical $10,000 Investment (3/4/96–12/31/05)
The graph below shows the change in value of a hypothetical $10,000 investment in the Fund over the indicated period and includes reinvestment of any income or distributions. The Fund’s performance* is compared to the performance of the Morgan Stanley Capital International (MSCI) Emerging Markets (EM) Index and the Standard & Poor’s/International Finance Corporation Investable (S&P/IFCI) Composite Index. One cannot invest directly in an index, nor is an index representative of the Fund’s portfolio. Please see Important Notes to Performance Information preceding the Fund Summaries.
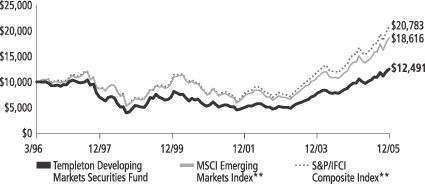
**Source: Standard & Poor’s Micropal. Please see Index Descriptions following the Fund Summaries.
Templeton Developing Markets Securities Fund Class 1
Performance reflects the Fund’s Class 1 operating expenses, but does not include any contract fees, expenses or sales charges. If they had been included, performance would be lower. These charges and deductions, particularly for variable life policies, can have a significant effect on contract values and insurance benefits. See the contract prospectus for a complete description of these expenses, including sales charges.
Performance data represent past performance, which does not guarantee future results. Investment return and principal value will fluctuate, and you may have a gain or loss when you sell your shares.
Current performance may differ from figures shown.
TD-1
Fund Goal and Main Investments: Templeton Developing Markets Securities Fund seeks long-term capital appreciation. The Fund normally invests at least 80% of its net assets in emerging market investments, primarily to predominantly in equity securities.
Performance Overview
You can find the Fund’s one-year total return in the Performance Summary. The Fund underperformed the MSCI EM Index and the S&P/IFCI Composite Index, which returned +34.54% and +35.19% for the same period.1 Please note that index performance numbers are purely for reference and that we do not attempt to track an index, but rather undertake investments on the basis of fundamental research.
Economic and Market Overview
During the year under review, most Asian economies recorded robust growth, particularly those of China and India, which attracted new investment. China had a record year with new equity issuance, while India experienced record foreign fund inflows in 2005. In Latin America, market sentiment was positive as the region’s risk profile improved, economies’ financial positions improved, and governments reduced interest rates in light of subdued inflation and sustained economic recovery.
Eastern Europe experienced greater integration with Western Europe, implemented reforms, and had benign inflation and falling interest rates, which contributed to a favorable investment environment. Russia’s market was one of the strongest emerging markets performers as the MSCI Russia Index returned +73.77% in 2005.2 High commodity prices, especially for oil, provided a boost to the Russian economy. In Turkey, European Union accession talks, robust gross domestic product growth, implementation of key reforms, and International Monetary Fund support provided investors with reasons to remain confident.
In this environment, emerging markets had another strong year in 2005, as measured by the MSCI EM Index. Latin America and Eastern Europe led emerging markets performance, while emerging Asian markets, although experiencing double-digit returns, lagged the overall
1. Source: Standard & Poor’s Micropal. One cannot invest directly in an index, nor is an index representative of the Fund’s portfolio. Please see Index Descriptions following the Fund Summaries.
2. Source: Standard & Poor’s Micropal. Please see Index Descriptions following the Fund Summaries.
Fund Risks: The Fund’s investments in stocks offer the potential for long-term gains but can be subject to short-term up-and-down price movements. Investing in emerging markets is subject to all the risks of foreign investing generally, and has additional, heightened risks, including market and currency fluctuations, economic instability, adverse social and political developments, the relatively smaller size and lesser liquidity of these markets, and less effective or irregular government supervision and regulation of business and industry practices. The Fund’s prospectus also includes a description of the main investment risks.
TD-2
index. Rising U.S. interest rates led investors to adopt a more cautious stance toward investing in Asia. However, in 2005’s fourth quarter, Asian markets experienced higher returns relative to Latin American and Eastern European markets largely due to the U.S. Federal Reserve Board’s signaling a possible halt to raising interest rates in the near future. High commodity prices and market stability allowed South Africa’s stock prices to continue their upward trend during the year, while positive developments in Turkey led the country’s equity market to end 2005 up significantly.
Investment Strategy
Our investment philosophy is bottom-up, value-oriented and long-term. In choosing investments, we may make onsite visits to companies to assess critical factors such as management strength and local conditions. In addition, we focus on the market price of a company’s securities relative to our evaluation of the company’s potential long-term (typically five years) earnings, asset value, cash flow and balance sheet. Among factors we may consider are a company’s historical value measures, including price/earnings ratio, book value, profit margins and liquidation value. We perform in-depth research to construct an action list from which we make our investment decisions.
Manager’s Discussion
In terms of performance relative to the MSCI EM Index, the Fund benefited from underweighted exposure to and stock selection in Taiwan and Malaysia. The Fund’s exposure to South Korea, which was roughly in line with the index, also helped performance due to the Fund’s overweighted positions in strong performing stocks such as Hyundai Development, Samsung Heavy Industries, and Daewoo Shipbuilding & Marine Engineering. On the other hand, the Fund’s underweighted exposure to Mexico and Russia hindered results relative to the index. The Fund’s U.K. holdings underperformed the index during the period, thus hurting relative performance; however, we believed those companies were well positioned in their respective areas to benefit from growing demand for financial and banking services in emerging markets.
At the sector level, stock selection in the capital goods industry benefited performance relative to the MSCI EM Index.3 Our underweighted allocations in the insurance and technology hardware and equipment sectors also helped performance, as these sectors underperformed the
3. The capital goods sector comprises aerospace and defense, building products, chemicals, construction and engineering, industrial conglomerates, and machinery in the Statement of Investments (SOI).
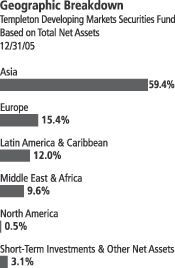
TD-3
overall index.4 In contrast, the Fund’s overweighted exposure to Taiwan Mobile hurt relative performance. In addition, our having no holdings in America Movil and Orascom Telecom hindered the Fund’s relative results. We did not own those two stocks due to expensive valuations and the availability of what we considered more attractively valued telecommunications stocks in other markets. Similarly, our underweighted position in energy sector stocks and our stock selection in the food, beverage and tobacco sector hindered performance during the period.5
During the year under review, the Fund’s exposure to Asia increased as we found stocks trading at what we considered attractive valuations. We made the largest purchases in Taiwan, Thailand and China H shares (Hong Kong-listed companies), while also adding significant investments in South Korea and Malaysia. Key purchases included adding to existing positions in PetroChina, a dominant participant in China’s oil and gas sector; Mega Financial Holdings, a leading financial holding company in Taiwan; and SK, a South Korean conglomerate that operates oil refineries, cellular telephone services and import-export businesses. In addition, we initiated a position in Maxis Communications, one of Malaysia’s prominent integrated telecommunication services providers. Conversely, we reduced exposure to Singapore and Hong Kong as we sold some shares as selected stocks reached our sale price targets.
In Latin America, we increased our allocations to Brazil and Mexico, while eliminating exposure to Argentina via the sale of Tenaris. Brazil and Mexico benefited from greater investor interest and fund inflows during 2005. Significant purchases included adding to Petroleo Brasileiro (Petrobras), Brazil’s national oil and gas company with activities in the exploration, production, refining, transportation and distribution of oil and its byproducts; Companhia Vale do Rio Doce, a Brazilian producer of iron ore that is among the world’s largest; and Telefonos de Mexico, Mexico’s nationwide provider of fixed-line telephone services and the leading Internet and local and long-distance services provider. We also initiated exposure to Panama during the period.
4. The technology hardware and equipment sector comprises communications equipment, computers and peripherals, electronic equipment and instruments, and office equipment in the SOI.
5. The energy sector comprises oil, gas and consumable fuels in the SOI. The food, beverage and tobacco sector comprises beverages, food products and tobacco in the SOI.
Top 10 Holdings
Templeton Developing Markets Securities Fund
12/31/05
| | |
Company
Sector/Industry,
Country | | % of Total
Net Assets |
| |
| Samsung Electronics Co. Ltd. | | 4.1% |
| Semiconductors & Semiconductor Equipment, South Korea | | |
| |
| PetroChina Co. Ltd. | | 2.7% |
| Oil, Gas & Consumable Fuels, China | | |
| |
China Mobile
(Hong Kong) Ltd., fgn. | | 2.6% |
| Wireless Telecommunication Services, China | | |
| |
Petroleo Brasileiro SA,
ADR, pfd. | | 2.2% |
| Oil, Gas & Consumable Fuels, Brazil | | |
| |
| Remgro Ltd. | | 2.1% |
| Diversified Financial Services, South Africa | | |
| |
| Anglo American PLC | | 1.9% |
| Metals & Mining, South Africa | | |
| |
Banco Bradesco SA,
ADR, pfd. | | 1.8% |
| Commercial Banks, Brazil | | |
| |
| HSBC Holdings PLC | | 1.6% |
| Commercial Banks, U.K. | | |
| |
| Old Mutual PLC | | 1.5% |
| Insurance, South Africa | | |
| |
| Nedbank Group Ltd. | | 1.4% |
| Commercial Banks, South Africa | | |
The dollar value, number of shares or principal amount, and names of all portfolio holdings are listed in the Fund’s Statement of Investments.
TD-4
The Fund’s largest sales were in Europe as some stock valuations grew increasingly expensive due to the region’s strong market performances. Significant sales included stocks from Austria, Belgium, the Czech Republic, Greece and Poland. As we searched for undervalued stocks in the region, in line with our strategy, we made selective purchases in Russia, Finland and the U.K. Key purchases included initiating positions in Mining and Metallurgical Co. Norilsk Nickel, one of the world’s largest precious metals companies; Mobile Telesystems, one of Eastern Europe’s and Russia’s largest mobile telecommunication services providers; and Nokian Renkaat, a well-known Finnish tire manufacturer with significant exposure to Russia’s market. We also added to our positions in HSBC Holdings, one of the world’s largest banking and financial services organizations; and Provident Financial, a consumer finance company with exposure to Central and Eastern Europe, as well as Latin America. In addition, we increased the number of South African holdings during the period as the country continued to experience positive developments.
Thank you for your participation in Templeton Developing Markets Securities Fund. We look forward to serving your future investment needs.
The foregoing information reflects our analysis, opinions and portfolio holdings as of December 31, 2005, the end of the reporting period. The way we implement our main investment strategies and the resulting portfolio holdings may change depending on factors such as market and economic conditions. These opinions may not be relied upon as investment advice or an offer for a particular security. The information is not a complete analysis of every aspect of any market, country, industry, security or the Fund. Statements of fact are from sources considered reliable, but the adviser makes no representation or warranty as to their completeness or accuracy. Although historical performance is no guarantee of future results, these insights may help you understand our investment management philosophy.
Top 10 Countries
Templeton Developing Markets Securities Fund
12/31/05
| | |
| | | % of Total
Net Assets |
| South Korea | | 19.0% |
| Taiwan | | 13.6% |
| China | | 10.9% |
| South Africa | | 9.6% |
| Brazil | | 8.4% |
| Thailand | | 4.1% |
| Russia | | 3.9% |
| India | | 3.6% |
| Mexico | | 3.3% |
| Singapore | | 3.2% |
TD-5
Fund Expenses
As an investor in a variable insurance contract (“Contract”) that indirectly provides for investment in an underlying mutual fund, you can incur transaction and/or ongoing expenses at both the Fund level and the Contract level.
| • | | Transaction expenses can include sales charges (loads) on purchases, redemption fees, surrender fees, transfer fees and premium taxes. |
| • | | Ongoing expenses can include management fees, distribution and service (12b-1) fees, contract fees, annual maintenance fees, mortality and expense risk fees and other fees and expenses. All mutual funds and Contracts have some types of ongoing expenses. |
The expenses shown in the table below are meant to highlight ongoing expenses at the Fund level only and do not include ongoing expenses at the Contract level, or transaction expenses at either the Fund or Contract level. While the Fund does not have transaction expenses, if the transaction and ongoing expenses at the Contract level were included, the expenses shown below would be higher. You should consult your Contract prospectus or disclosure document for more information.
The table shows Fund-level ongoing expenses and can help you understand these expenses and compare them with those of other mutual funds offered through the Contract. The table assumes a $1,000 investment held for the six months indicated. Please refer to the Fund prospectus for additional information on operating expenses.
Actual Fund Expenses
The first line (Actual) of the table below provides actual account values and expenses. The “Ending Account Value” is derived from the Fund’s actual return, which includes the effect of ongoing Fund expenses, but does not include the effect of ongoing Contract expenses.
You can estimate the Fund-level expenses you incurred during the period by following these steps. Of course, your account value and expenses will differ from those in this illustration:
| 1. | Divide your account value by $1,000. |
If an account had an $8,600 value, then $8,600 ÷ $1,000 = 8.6.
| 2. | Multiply the result by the number under the heading “Fund-Level Expenses Incurred During Period.�� |
If Fund-Level Expenses Incurred During Period were $7.50, then 8.6 × $7.50 = $64.50.
Templeton Developing Markets Securities Fund Class 1
TD-6
In this illustration, the estimated expenses incurred this period at the Fund level are $64.50.
Hypothetical Example for Comparison with Other Mutual Funds
Information in the second line (Hypothetical) of the table can help you compare ongoing expenses of the Fund with those of other mutual funds offered through the Contract. This information may not be used to estimate the actual ending account balance or expenses you incurred during the period. The hypothetical “Ending Account Value” is based on the Fund’s actual expense ratio and an assumed 5% annual rate of return before expenses, which does not represent the Fund’s actual return. The figure under the heading “Fund-Level Expenses Incurred During Period” shows the hypothetical expenses your account would have incurred under this scenario. You can compare this figure with the 5% hypothetical examples that appear in shareholder reports of other funds offered through a Contract.
| | | | | | | | | |
| Class 1 | | Beginning
Account
Value 7/1/05 | | Ending
Account
Value 12/31/05 | | Fund-Level
Expenses Incurred
During Period*
7/1/05-12/31/05 |
Actual | | $ | 1,000 | | $ | 1,203.70 | | $ | 8.55 |
Hypothetical (5% return before expenses) | | $ | 1,000 | | $ | 1,017.44 | | $ | 7.83 |
*Expenses are equal to the annualized expense ratio for the Fund’s Class 1 shares (1.54%), which does not include any ongoing expenses of the Contract for which the Fund is an investment option, multiplied by the average account value over the period, multiplied by 184/365 to reflect the one-half year period.
TD-7
Franklin Templeton Variable Insurance Products Trust
Financial Highlights
Templeton Developing Markets Securities Fund
| | | | | | | | | | | | | | | | | | | | |
| | | Year Ended December 31,
| |
| Class 1 | | 2005 | | | 2004 | | | 2003 | | | 2002 | | | 2001 | |
| | |
| |
Per share operating performance | | | | | | | | | | | | | | | | | | | | |
(for a share outstanding throughout the year) | | | | | | | | | | | | | | | | | | | | |
Net asset value, beginning of year | | $ | 8.73 | | | $ | 7.14 | | | $ | 4.71 | | | $ | 4.78 | | | $ | 5.25 | |
| | |
|
|
|
Income from investment operations: | | | | | | | | | | | | | | | | | | | | |
Net investment incomea | | | 0.17 | | | | 0.11 | | | | 0.13 | | | | 0.07 | | | | 0.08 | |
Net realized and unrealized gains (losses) | | | 2.23 | | | | 1.62 | | | | 2.38 | | | | (0.06 | ) | | | (0.50 | ) |
| | |
|
|
|
Total from investment operations | | | 2.40 | | | | 1.73 | | | | 2.51 | | | | 0.01 | | | | (0.42 | ) |
| | |
|
|
|
Less distributions from net investment income | | | (0.14 | ) | | | (0.14 | ) | | | (0.08 | ) | | | (0.08 | ) | | | (0.05 | ) |
| | |
|
|
|
Redemption fees | | | —c | | | | — | | | | — | | | | — | | | | — | |
| | |
|
|
|
Net asset value, end of year | | $ | 10.99 | | | $ | 8.73 | | | $ | 7.14 | | | $ | 4.71 | | | $ | 4.78 | |
| | |
|
|
|
| | | | | |
Total returnb | | | 27.76% | | | | 24.83% | | | | 53.74% | | | | 0.04% | | | | (8.08)% | |
Ratios/supplemental data | | | | | | | | | | | | | | | | | | | | |
Net assets, end of year (000’s) | | $ | 651,826 | | | $ | 477,290 | | | $ | 359,299 | | | $ | 225,454 | | | $ | 240,289 | |
Ratios to average net assets: | | | | | | | | | | | | | | | | | | | | |
Expenses | | | 1.53% | | | | 1.54% | | | | 1.55% | | | | 1.58% | | | | 1.57% | |
Net investment income | | | 1.77% | | | | 1.52% | | | | 2.35% | | | | 1.45% | | | | 1.64% | |
Portfolio turnover rate | | | 31.24% | | | | 55.67% | | | | 46.20% | | | | 57.91% | | | | 78.29% | |
aBased on average daily shares outstanding.
bTotal return does not include any fees, charges or expenses imposed by the variable annuity and life insurance contracts for which the Franklin Templeton Variable Insurance Products Trust serves as an underlying investment vehicle.
cAmount is less than $0.01 per share.
See notes to financial statements.
TD-8
Franklin Templeton Variable Insurance Products Trust
Financial Highlights (continued)
Templeton Developing Markets Securities Fund (continued)
| | | | | | | | | | | | | | | | | | | | |
| | | Year Ended December 31,
| |
| Class 2 | | 2005 | | | 2004 | | | 2003 | | | 2002 | | | 2001 | |
| | |
| |
Per share operating performance | | | | | | | | | | | | | | | | | | | | |
(for a share outstanding throughout the year) | | | | | | | | | | | | | | | | | | | | |
Net asset value, beginning of year | | $ | 8.67 | | | $ | 7.09 | | | $ | 4.69 | | | $ | 4.76 | | | $ | 5.22 | |
| | |
|
|
|
Income from investment operations: | | | | | | | | | | | | | | | | | | | | |
Net investment incomea | | | 0.14 | | | | 0.09 | | | | 0.11 | | | | 0.06 | | | | 0.07 | |
Net realized and unrealized gains (losses) | | | 2.21 | | | | 1.63 | | | | 2.35 | | | | (0.06 | ) | | | (0.49 | ) |
| | |
|
|
|
Total from investment operations | | | 2.35 | | | | 1.72 | | | | 2.46 | | | | — | | | | (0.42 | ) |
| | |
|
|
|
Less distributions from net investment income | | | (0.12 | ) | | | (0.14 | ) | | | (0.06 | ) | | | (0.07 | ) | | | (0.04 | ) |
| | |
|
|
|
Redemption fees | | | —c | | | | — | | | | — | | | | — | | | | — | |
| | |
|
|
|
Net asset value, end of year | | $ | 10.90 | | | $ | 8.67 | | | $ | 7.09 | | | $ | 4.69 | | | $ | 4.76 | |
| | |
|
|
|
| | | | | |
Total returnb | | | 27.43% | | | | 24.71% | | | | 52.99% | | | | (0.15)% | | | | (8.08)% | |
Ratios/supplemental data | | | | | | | | | | | | | | | | | | | | |
Net assets, end of year (000’s) | | $ | 650,646 | | | $ | 327,569 | | | $ | 170,953 | | | $ | 80,952 | | | $ | 64,081 | |
Ratios to average net assets: | | | | | | | | | | | | | | | | | | | | |
Expenses | | | 1.78% | | | | 1.79% | | | | 1.80% | | | | 1.83% | | | | 1.82% | |
Net investment income | | | 1.52% | | | | 1.27% | | | | 2.10% | | | | 1.20% | | | | 1.37% | |
Portfolio turnover rate | | | 31.24% | | | | 55.67% | | | | 46.20% | | | | 57.91% | | | | 78.29% | |
aBased on average daily shares outstanding.
bTotal return does not include any fees, charges or expenses imposed by the variable annuity and life insurance contracts for which the Franklin Templeton Variable Insurance Products Trust serves as an underlying investment vehicle.
cAmount is less than $0.01 per share.
See notes to financial statements.
TD-9
Franklin Templeton Variable Insurance Products Trust
Financial Highlights (continued)
Templeton Developing Markets Securities Fund (continued)
| | | | | | | | |
| | | Year Ended December 31,
| |
| Class 3 | | 2005 | | | 2004d | |
| | |
| |
Per share operating performance | | | | | | | | |
(for a share outstanding throughout the year) | | | | | | | | |
Net asset value, beginning of year | | $ | 8.68 | | | $ | 7.13 | |
| | |
|
|
|
Income from investment operations: | | | | | | | | |
Net investment incomea | | | 0.04 | | | | 0.08 | |
Net realized and unrealized gains (losses) | | | 2.32 | | | | 1.61 | |
| | |
|
|
|
Total from investment operations | | | 2.36 | | | | 1.69 | |
| | |
|
|
|
Less distributions from net investment income | | | (0.14 | ) | | | (0.14 | ) |
| | |
|
|
|
Redemption fees | | | —c | | | | — | |
| | |
|
|
|
Net asset value, end of year | | $ | 10.90 | | | $ | 8.68 | |
| | |
|
|
|
| | |
Total returnb | | | 27.45% | | | | 24.15% | �� |
Ratios/supplemental data | | | | | | | | |
Net assets, end of year (000’s) | | $ | 11,521 | | | $ | 12 | |
Ratios to average net assets: | | | | | | | | |
Expenses | | | 1.78% | | | | 1.54%e | |
Net investment income | | | 1.52% | | | | 1.52%e | |
Portfolio turnover rate | | | 31.24% | | | | 55.67% | |
aBased on average daily shares outstanding.
bTotal return does not include any fees, charges or expenses imposed by the variable annuity and life insurance contracts for which the Franklin Templeton Variable Insurance Products Trust serves as an underlying investment vehicle. Total return is not annualized for periods less than one year.
cAmount is less than $0.01 per share.
dFor the period May 1, 2004 (effective date) to December 31, 2004.
eAnnualized.
See notes to financial statements.
TD-10
Franklin Templeton Variable Insurance Products Trust
Statement of Investments, December 31, 2005
| | | | | | | |
| Templeton Developing Markets Securities Fund | | Industry | | Shares/ Rights | | Value |
Long Term Investments 96.9% | | | | | | | |
Austria 0.5% | | | | | | | |
Wienerberger AG | | Building Products | | 154,600 | | $ | 6,186,185 |
| | | | | | |
|
|
Brazil 8.4% | | | | | | | |
Banco Bradesco SA, ADR, pfd. | | Commercial Banks | | 818,772 | | | 23,867,204 |
Centrais Eletricas Brasileiras SA | | Electric Utilities | | 579,624,764 | | | 9,419,552 |
Companhia de Bebidas das Americas (AmBev) | | Beverages | | 12,916,000 | | | 4,153,801 |
Companhia Vale do Rio Doce, ADR, pfd., A | | Metals & Mining | | 473,550 | | | 17,166,187 |
Klabin SA, pfd. | | Containers & Packaging | | 25,082 | | | 44,515 |
Petroleo Brasileiro SA, ADR, pfd. | | Oil, Gas & Consumable Fuels | | 446,822 | | | 28,761,932 |
Souza Cruz SA | | Tobacco | | 848,825 | | | 10,527,274 |
Suzano Bahia Sul Papel e Celulose SA, pfd., A | | Paper & Forest Products | | 589,854 | | | 2,969,072 |
Unibanco Uniao de Bancos Brasileiros SA, GDR | | Commercial Banks | | 98,200 | | | 6,242,574 |
Usinas Siderurgicas de Minas Gerais SA, pfd., A | | Metals & Mining | | 274,500 | | | 6,527,050 |
Votorantim Celulose e Papel SA, ADR | | Paper & Forest Products | | 36,000 | | | 442,440 |
| | | | | | |
|
|
| | | | | | | | 110,121,601 |
| | | | | | |
|
|
China 10.9% | | | | | | | |
Aluminum Corp. of China Ltd., H | | Metals & Mining | | 17,636,000 | | | 13,419,796 |
Anhui Conch Cement Co. Ltd., H | | Construction Materials | | 4,080,000 | | | 5,025,246 |
aChina Construction Bank, H | | Commercial Banks | | 860,000 | | | 299,472 |
a,bChina Construction Bank, H, 144A | | Commercial Banks | | 25,663,000 | | | 8,936,449 |
China International Marine Containers Co. Ltd., B | | Machinery | | 1,860,700 | | | 1,499,858 |
China Mobile (Hong Kong) Ltd., fgn. | | Wireless Telecommunication Services | | 7,212,000 | | | 34,136,233 |
China Resources Enterprise Ltd. | | Distributors | | 4,422,000 | | | 7,898,822 |
China Travel International Investment Hong Kong Ltd. | | Hotels Restaurants & Leisure | | 11,784,000 | | | 2,826,829 |
Chongqing Changan Automobile Co. Ltd., B | | Automobiles | | 2,386,800 | | | 674,146 |
CITIC Pacific Ltd. | | Industrial Conglomerates | | 1,347,959 | | | 3,729,046 |
Denway Motors Ltd. | | Automobiles | | 22,758,234 | | | 7,558,047 |
GOME Electrical Appliances Holdings Ltd. | | Specialty Retail | | 3,940,000 | | | 2,667,776 |
Huadian Power International Corp. Ltd., H | | Independent Power Producers &
Energy Traders | | 10,606,000 | | | 2,708,386 |
Huaneng Power International Inc., H | | Independent Power Producers &
Energy Traders | | 4,188,000 | | | 2,754,677 |
PetroChina Co. Ltd., H | | Oil, Gas & Consumable Fuels | | 36,360,000 | | | 29,777,717 |
bPetroChina Co. Ltd., H, 144A | | Oil, Gas & Consumable Fuels | | 7,682,000 | | | 6,291,321 |
Shanghai Industrial Holdings Ltd. | | Industrial Conglomerates | | 3,982,000 | | | 8,294,068 |
TCL Multimedia Technology Holdings Ltd. | | Household Durables | | 4,951,689 | | | 715,262 |
Travelsky Technology Ltd., H | | IT Services | | 3,575,000 | | | 3,296,673 |
| | | | | | |
|
|
| | | | | | | | 142,509,824 |
| | | | | | |
|
|
Croatia 0.6% | | | | | | | |
Pliva d.d., GDR, Reg S | | Pharmaceuticals | | 601,600 | | | 7,838,848 |
| | | | | | |
|
|
Czech Republic 0.1% | | | | | | | |
Philip Morris CR AS | | Tobacco | | 1,875 | | | 1,392,648 |
| | | | | | |
|
|
Finland 0.5% | | | | | | | |
Nokian Renkaat OYJ | | Auto Components | | 468,420 | | | 5,905,841 |
| | | | | | |
|
|
Hong Kong 1.6% | | | | | | | |
Cheung Kong Holdings Ltd. | | Real Estate | | 1,184,000 | | | 12,147,466 |
Cheung Kong Infrastructure Holdings Ltd. | | Electric Utilities | | 572,000 | | | 1,800,030 |
Dairy Farm International Holdings Ltd. | | Food & Staples Retailing | | 1,146,433 | | | 4,150,087 |
MTR Corp. Ltd. | | Road & Rail | | 1,665,885 | | | 3,276,489 |
| | | | | | |
|
|
| | | | | | | | 21,374,072 |
| | | | | | |
|
|
TD-11
Franklin Templeton Variable Insurance Products Trust
Statement of Investments, December 31, 2005 (continued)
| | | | | | | |
| Templeton Developing Markets Securities Fund | | Industry | | Shares/ Rights | | Value |
Long Term Investments (cont.) | | | | | | | |
Hungary 2.5% | | | | | | | |
BorsodChem Rt. | | Chemicals | | 271,447 | | $ | 2,926,035 |
Gedeon Richter Ltd. | | Pharmaceuticals | | 50,356 | | | 9,042,462 |
Magyar Telekom Ltd. | | Diversified Telecommunication Services | | 2,083,800 | | | 9,326,658 |
MOL Magyar Olaj-es Gazipari Rt. | | Oil, Gas & Consumable Fuels | | 58,090 | | | 5,431,389 |
OTP Bank | | Commercial Banks | | 188,171 | | | 6,144,197 |
| | | | | | |
|
|
| | | | | | | | 32,870,741 |
| | | | | | |
|
|
India 3.6% | | | | | | | |
Bharat Petroleum Corp. Ltd. | | Oil, Gas & Consumable Fuels | | 114,458 | | | 1,104,515 |
Gail India Ltd. | | Gas Utilities | | 855,630 | | | 5,054,483 |
a,bHimatsingka Seide Ltd., GDR, 144A | | Textiles, Apparel & Luxury Goods | | 753,000 | | | 2,155,086 |
Hindalco Industries Inc. | | Metals & Mining | | 1,419,500 | | | 4,523,976 |
Hindustan Lever Ltd. | | Household Products | | 2,268,100 | | | 9,942,943 |
Hindustan Petroleum Corp. Ltd. | | Oil, Gas & Consumable Fuels | | 1,387,169 | | | 10,135,166 |
Indian Oil Corp. Ltd. | | Oil, Gas & Consumable Fuels | | 245,296 | | | 3,035,739 |
National Aluminum Co. Ltd. | | Metals & Mining | | 85,900 | | | 419,621 |
Oil & Natural Gas Corp. Ltd. | | Oil, Gas & Consumable Fuels | | 175,332 | | | 4,578,427 |
Ranbaxy Laboratories Ltd. | | Pharmaceuticals | | 151,000 | | | 1,216,021 |
Tata Tea Ltd. | | Food Products | | 230,678 | | | 4,861,951 |
| | | | | | |
|
|
| | | | | | | | 47,027,928 |
| | | | | | |
|
|
Indonesia 0.8% | | | | | | | |
PT Astra International Tbk | | Automobiles | | 6,439,000 | | | 6,681,363 |
PT Bank Danamon Indonesia Tbk | | Commercial Banks | | 8,486,000 | | | 4,100,560 |
| | | | | | |
|
|
| | | | | | | | 10,781,923 |
| | | | | | |
|
|
Malaysia 2.1% | | | | | | | |
Kuala Lumpur Kepong Bhd. | | Food Products | | 696,600 | | | 1,548,205 |
Maxis Communications Bhd. | | Wireless Telecommunication Services | | 4,584,000 | | | 10,188,014 |
Resorts World Bhd. | | Hotels Restaurants & Leisure | | 2,046,000 | | | 6,063,024 |
Sime Darby Bhd. | | Industrial Conglomerates | | 3,574,700 | | | 5,816,750 |
Tanjong PLC | | Hotels Restaurants & Leisure | | 513,000 | | | 1,968,117 |
YTL Corp. Bhd. | | Multi-Utilities | | 88,866 | | | 125,793 |
YTL Power International Bhd. | | Water Utilities | | 2,582,736 | | | 1,530,713 |
| | | | | | |
|
|
| | | | | | | | 27,240,616 |
| | | | | | |
|
|
Mexico 3.3% | | | | | | | |
Fomento Economico Mexicano SA de CV (Femsa), ADR | | Beverages | | 144,792 | | | 10,498,868 |
Grupo Bimbo SA de CV, A | | Food Products | | 668,764 | | | 2,328,324 |
aGrupo Televisa SA | | Media | | 703,034 | | | 2,811,474 |
Kimberly Clark de Mexico SA de CV, A | | Household Products | | 4,538,033 | | | 16,226,324 |
Telefonos de Mexico SA de CV (Telmex), L, ADR | | Diversified Telecommunication Services | | 467,364 | | | 11,534,544 |
| | | | | | |
|
|
| | | | | | | | 43,399,534 |
| | | | | | |
|
|
Panama 0.3% | | | | | | | |
Banco Latinoamericano de Exportaciones SA, E | | Commercial Banks | | 224,400 | | | 4,106,520 |
| | | | | | |
|
|
Philippines 0.5% | | | | | | | |
San Miguel Corp., B | | Beverages | | 4,263,893 | | | 7,115,869 |
| | | | | | |
|
|
Poland 1.6% | | | | | | | |
Polski Koncern Naftowy Orlen SA | | Oil, Gas & Consumable Fuels | | 472,229 | | | 9,114,594 |
Telekomunikacja Polska SA | | Diversified Telecommunication Services | | 1,623,100 | | | 11,691,716 |
| | | | | | |
|
|
| | | | | | | | 20,806,310 |
| | | | | | |
|
|
TD-12
Franklin Templeton Variable Insurance Products Trust
Statement of Investments, December 31, 2005 (continued)
| | | | | | | |
| Templeton Developing Markets Securities Fund | | Industry | | Shares/ Rights | | Value |
Long Term Investments (cont.) | | | | | | | |
Portugal 0.2% | | | | | | | |
aJeronimo Martins SGPS SA | | Food & Staples Retailing | | 158,244 | | $ | 2,379,182 |
| | | | | | |
|
|
Russia 3.9% | | | | | | | |
Lukoil Holdings, ADR | | Oil, Gas & Consumable Fuels | | 278,508 | | | 16,543,375 |
Mining and Metallurgical Co. Norilsk Nickel | | Metals & Mining | | 156,800 | | | 13,892,480 |
Mobile Telesystems, ADR | | Wireless Telecommunication Services | | 274,500 | | | 9,607,500 |
bNovolipetsk Steel, 144A | | Metals & Mining | | 2,331,000 | | | 3,333,330 |
Unified Energy Systems | | Electric Utilities | | 16,795,200 | | | 7,121,165 |
| | | | | | |
|
|
| | | | | | | | 50,497,850 |
| | | | | | |
|
|
Singapore 3.2% | | | | | | | |
ComfortDelGro Corp. Ltd. | | Road & Rail | | 6,447,000 | | | 6,202,953 |
DBS Group Holdings Ltd. | | Commercial Banks | | 445,000 | | | 4,415,346 |
Fraser and Neave Ltd. | | Industrial Conglomerates | | 1,183,681 | | | 13,168,224 |
Keppel Corp. Ltd. | | Industrial Conglomerates | | 737,600 | | | 4,879,040 |
Singapore Press Holdings Ltd. | | Media | | 867,000 | | | 2,241,859 |
Singapore Technologies Engineering Ltd. | | Aerospace & Defense | | 1,640,000 | | | 2,820,530 |
Singapore Telecommunications Ltd. | | Diversified Telecommunication Services | | 5,376,428 | | | 8,438,304 |
| | | | | | |
|
|
| | | | | | | | 42,166,256 |
| | | | | | |
|
|
South Africa 9.6% | | | | | | | |
Anglo American PLC | | Metals & Mining | | 754,679 | | | 25,487,934 |
Edgars Consolidated Stores Ltd. | | Specialty Retail | | 1,035,206 | | | 5,752,326 |
aImperial Holdings Ltd. | | Air Freight & Logistics | | 336,634 | | | 7,480,164 |
JD Group Ltd. | | Specialty Retail | | 100,000 | | | 1,211,379 |
Nampak Ltd. | | Containers & Packaging | | 842,940 | | | 2,243,399 |
Nedbank Group Ltd. | | Commercial Banks | | 1,123,141 | | | 17,750,154 |
bNedbank Group Ltd., 144A | | Commercial Banks | | 64,737 | | | 1,023,106 |
Old Mutual PLC | | Insurance | | 7,094,498 | | | 20,108,938 |
Remgro Ltd. | | Diversified Financial Services | | 1,462,610 | | | 28,200,462 |
SABMiller PLC | | Beverages | | 224,734 | | | 4,182,130 |
Sappi Ltd. | | Paper & Forest Products | | 1,024,880 | | | 11,744,615 |
aSteinhoff International Holdings Ltd. | | Household Durables | | 510,000 | | | 1,511,260 |
| | | | | | |
|
|
| | | | | | | | 126,695,867 |
| | | | | | |
|
|
South Korea 19.0% | | | | | | | |
aCJ Corp. | | Food Products | | 105,870 | | | 10,981,057 |
aDaewoo Shipbuilding & Marine Engineering Co. Ltd. | | Machinery | | 680,700 | | | 18,613,682 |
Hana Financial Group Inc. | | Commercial Banks | | 389,749 | | | 17,872,357 |
aHite Brewery Co. Ltd. | | Beverages | | 44,300 | | | 6,331,712 |
aHyundai Development Co. | | Construction & Engineering | | 363,070 | | | 16,504,820 |
aKangwon Land Inc. | | Hotels Restaurants & Leisure | | 665,665 | | | 13,577,584 |
Korea Gas Corp. | | Gas Utilities | | 85,200 | | | 2,803,355 |
aLG Card Co. Ltd. | | Consumer Finance | | 246,150 | | | 12,338,040 |
aLG Chem Ltd. | | Chemicals | | 195,940 | | | 11,085,439 |
aLG Corp. | | Industrial Conglomerates | | 425,000 | | | 13,330,025 |
aLG Electronics Inc. | | Household Durables | | 129,820 | | | 11,506,626 |
aLG Household & Health Care Ltd. | | Household Products | | 26,670 | | | 1,455,931 |
aLG Petrochemical Co. Ltd. | | Chemicals | | 157,710 | | | 3,944,707 |
aLG.Philips LCD Co. Ltd. | | Electronic Equipment & Instruments | | 90,440 | | | 3,855,482 |
POSCO | | Metals & Mining | | 43,200 | | | 8,661,439 |
Samsung Electronics Co. Ltd. | | Semiconductors & Semiconductor Equipment | | 82,988 | | | 54,281,977 |
aSamsung Fine Chemicals Co. Ltd. | | Chemicals | | 205,260 | | | 6,774,089 |
aSamsung Heavy Industries Co. Ltd. | | Machinery | | 312,070 | | | 5,498,007 |
Shinhan Financial Group Co. Ltd. | | Commercial Banks | | 169,000 | | | 6,885,806 |
TD-13
Franklin Templeton Variable Insurance Products Trust
Statement of Investments, December 31, 2005 (continued)
| | | | | | | |
| Templeton Developing Markets Securities Fund | | Industry | | Shares/ Rights | | Value |
Long Term Investments (cont.) | | | | | | | |
South Korea (cont.) | | | | | | | |
aSK Corp. | | Oil, Gas & Consumable Fuels | | 247,940 | | $ | 12,821,513 |
SK Telecom Co. Ltd. | | Wireless Telecommunication Services | | 58,590 | | | 10,525,846 |
| | | | | | |
|
|
| | | | | | | | 249,649,494 |
| | | | | | |
|
|
Sweden 0.7% | | | | | | | |
Oriflame Cosmetics SA, SDR | | Personal Products | | 334,650 | | | 9,645,063 |
| | | | | | |
|
|
Taiwan 13.6% | | | | | | | |
Acer Inc. | | Computers & Peripherals | | 1,739,629 | | | 4,372,059 |
aAu Optronics Corp. | | Electronic Equipment & Instruments | | 1,136,000 | | | 1,695,703 |
BenQ Corp. | | Computers & Peripherals | | 3,488,000 | | | 3,373,616 |
Chinatrust Financial Holding Co. Ltd. | | Commercial Banks | | 7,656,184 | | | 6,064,027 |
Chunghwa Telecom Co. Ltd. | | Diversified Telecommunication Services | | 6,094,000 | | | 10,544,505 |
D-Link Corp. | | Communications Equipment | | 6,629,465 | | | 7,593,496 |
Delta Electronics Inc. | | Electronic Equipment & Instruments | | 1,964,290 | | | 4,027,134 |
Lite-On Technology Corp. | | Computers & Peripherals | | 8,395,314 | | | 11,444,726 |
MediaTek Inc. | | Semiconductors & Semiconductor
Equipment | | 1,349,700 | | | 15,911,958 |
Mega Financial Holding Co. Ltd. | | Commercial Banks | | 23,281,503 | | | 15,142,037 |
Premier Image Technology Corp. | | Leisure Equipment & Products | | 5,645,430 | | | 7,575,623 |
President Chain Store Corp. | | Food & Staples Retailing | | 5,413,144 | | | 11,345,234 |
Realtek Semiconductor Corp. | | Semiconductors & Semiconductor
Equipment | | 8,076,450 | | | 9,447,723 |
Siliconware Precision Industries Co. | | Semiconductors & Semiconductor
Equipment | | 3,701,901 | | | 5,193,138 |
Sunplus Technology Co. Ltd. | | Semiconductors & Semiconductor
Equipment | | 6,642,040 | | | 8,417,250 |
Synnex Technology International Corp. | | Electronic Equipment & Instruments | | 4,256,760 | | | 5,245,334 |
Taiwan Mobile Co. Ltd. | | Wireless Telecommunication Services | | 17,871,302 | | | 15,624,766 |
Taiwan Semiconductor Manufacturing Co. Ltd. | | Semiconductors & Semiconductor
Equipment | | 9,012,428 | | | 17,159,208 |
UNI-President Enterprises Corp. | | Food Products | | 24,314,600 | | | 11,554,925 |
Yang Ming Marine Transport Corp. | | Marine | | 2,281,000 | | | 1,483,538 |
Yuanta Core Pacific Securities Co. | | Capital Markets | | 8,353,329 | | | 5,814,618 |
| | | | | | |
|
|
| | | | | | | | 179,030,618 |
| | | | | | |
|
|
Thailand 4.1% | | | | | | | |
The Aromatics (Thailand) Public Co. Ltd., fgn. | | Chemicals | | 496,700 | | | 365,639 |
Bangkok Bank Public Co. Ltd., fgn. | | Commercial Banks | | 2,108,500 | | | 5,910,482 |
BEC World Public Co. Ltd., fgn. | | Media | | 7,576,700 | | | 2,530,184 |
Kasikornbank Public Co. Ltd., fgn. | | Commercial Banks | | 5,798,600 | | | 10,600,731 |
Land and House Public Co. Ltd., fgn. | | Household Durables | | 10,761,075 | | | 2,334,517 |
Shin Corp. Public Co. Ltd., fgn. | | Wireless Telecommunication Services | | 5,478,300 | | | 5,641,881 |
Siam Cement Public Co. Ltd., fgn. | | Construction Materials | | 1,668,514 | | | 10,737,055 |
Siam Commercial Bank Public Co. Ltd., fgn. | | Commercial Banks | | 4,042,000 | | | 5,123,315 |
Siam Makro Public Co. Ltd., fgn. | | Food & Staples Retailing | | 400,000 | | | 720,536 |
aThai Airways International Public Co. Ltd., fgn. | | Airlines | | 2,750,400 | | | 2,949,850 |
aTMB Bank Public Co. Ltd., fgn. | | Commercial Banks | | 65,667,100 | | | 6,882,841 |
aTrue Corp. Public Co. Ltd., rts., 3/28/08 | | Diversified Telecommunication Services | | 344,616 | | | — |
| | | | | | |
|
|
| | | | | | | | 53,797,031 |
| | | | | | |
|
|
Turkey 2.6% | | | | | | | |
Arcelik AS, Br. | | Household Durables | | 1,117,826 | | | 7,780,499 |
KOC Holding AS | | Industrial Conglomerates | | 1,422,950 | | | 6,690,657 |
TD-14
Franklin Templeton Variable Insurance Products Trust
Statement of Investments, December 31, 2005 (continued)
| | | | | | | | |
| Templeton Developing Markets Securities Fund | | Industry | | Shares/ Rights | | Value |
Long Term Investments (cont.) | | | | | | | | |
Turkey (cont.) | | | | | | | | |
Migros Turk TAS | | Food & Staples
Retailing | | | 656,397 | | $ | 6,367,124 |
aPetkim Petrokimya Holding AS | | Chemicals | | | 296,000 | | | 1,720,548 |
Tupras-Turkiye Petrol Rafineleri AS | | Oil, Gas &
Consumable Fuels | | | 638,260 | | | 11,720,732 |
| | | | | | | |
|
|
| | | | | | | | | 34,279,560 |
| | | | | | | |
|
|
United Kingdom 2.2% | | | | | | | | |
HSBC Holdings PLC | | Commercial Banks | | | 1,273,161 | | | 20,443,087 |
Provident Financial PLC | | Consumer Finance | | | 946,032 | | | 8,911,113 |
| | | | | | | |
|
|
| | | | | | | | | 29,354,200 |
| | | | | | | |
|
|
United States 0.5% | | | | | | | | |
Avon Products Inc. | | Personal Products | | | 231,000 | | | 6,595,050 |
| | | | | | | |
|
|
Total Long Term Investments (Cost $916,371,173) | | | | | | | | 1,272,768,631 |
| | | | | | | |
|
|
| | | |
| | | | | Principal
Amount
| | |
Short Term Investments (Cost $39,458,742) 3.0% | | | | | | | | |
U.S. Government and Agency Securities 3.0% | | | | | | | | |
cU.S. Treasury Bills, 1/05/06 - 3/23/06 | | | | $ | 39,664,000 | | | 39,469,381 |
| | | | | | | |
|
|
Total Investments (Cost $955,829,915) 99.9% | | | | | | | | 1,312,238,012 |
Other Assets, less Liabilities 0.1% | | | | | | | | 1,754,388 |
| | | | | | | |
|
|
Net Assets 100.0% | | | | | | | $ | 1,313,992,400 |
| | | | | | | |
|
|
Selected Portfolio Abbreviations
ADR - American Depository Receipt
GDR - Global Depository Receipt
SDR - Swedish Depository Receipt
| b | Security was purchased pursuant to Rule 144A under the Securities Act of 1933 and may be sold in transactions exempt from registration only to qualified institutional buyers or in a public offering registered under the Securities Act of 1933. These securities have been deemed liquid under guidelines approved by the Trust’s Board of Trustees. At December 31, 2005, the value of these securities was $21,739,292, representing 1.65% of net assets. |
| c | The security is traded on a discount basis with no stated coupon rate. |
TD-15
See notes to financial statements.
Franklin Templeton Variable Insurance Products Trust
Financial Statements
Statement of Assets and Liabilities
December 31, 2005
| | | | |
| | | Templeton
Developing Markets
Securities Fund
| |
Assets: | | | | |
Investments in securities: | | | | |
Cost | | $ | 955,829,915 | |
| | |
|
|
|
Value | | $ | 1,312,238,012 | |
Cash | | | 960,992 | |
Foreign currency, at value (cost $1,652,632) | | | 1,656,241 | |
Receivables: | | | | |
Investment securities sold | | | 1,887,559 | |
Capital shares sold | | | 856,795 | |
Dividends | | | 1,891,648 | |
Foreign income tax | | | 159,393 | |
| | |
|
|
|
Total assets | | | 1,319,650,640 | |
| | |
|
|
|
Liabilities: | | | | |
Payables: | | | | |
Investment securities purchased | | | 2,453,997 | |
Capital shares redeemed | | | 866,825 | |
Affiliates | | | 1,730,625 | |
Deferred tax | | | 171,284 | |
Accrued expenses and other liabilities | | | 435,509 | |
| | |
|
|
|
Total liabilities | | | 5,658,240 | |
| | |
|
|
|
Net assets, at value | | $ | 1,313,992,400 | |
| | |
|
|
|
Net assets consist of: | | | | |
Paid-in capital | | $ | 1,000,736,172 | |
Undistributed net investment income | | | 4,018,236 | |
Net unrealized appreciation (depreciation) | | | 356,246,332 | |
Accumulated net realized gain (loss) | | | (47,008,340 | ) |
| | |
|
|
|
Net assets, at value | | $ | 1,313,992,400 | |
| | |
|
|
|
Class 1: | | | | |
Net assets, at value | | $ | 651,825,984 | |
| | |
|
|
|
Shares outstanding | | | 59,313,439 | |
| | |
|
|
|
Net asset value and offering price per share | | | $10.99 | |
| | |
|
|
|
Class 2: | | | | |
Net assets, at value | | $ | 650,645,754 | |
| | |
|
|
|
Shares outstanding | | | 59,700,646 | |
| | |
|
|
|
Net asset value and offering price per share | | | $10.90 | |
| | |
|
|
|
Class 3: | | | | |
Net assets, at value | | $ | 11,520,662 | |
| | |
|
|
|
Shares outstanding | | | 1,056,548 | |
| | |
|
|
|
Net asset value and offering price per sharea | | | $10.90 | |
| | |
|
|
|
aRedemption price is equal to net asset value less any redemption fees retained by the Fund.
See notes to financial statements.
TD-16
Franklin Templeton Variable Insurance Products Trust
Financial Statements (continued)
Statement of Operations
for the year ended December 31, 2005
| | | | |
| | | Templeton
Developing Markets
Securities Fund
| |
Investment income: | | | | |
Dividends (net of foreign taxes of $2,869,539) | | $ | 31,267,981 | |
Interest | | | 1,723,886 | |
Other income (Note 8) | | | 72,428 | |
| | |
|
|
|
Total investment income | | | 33,064,295 | |
| | |
|
|
|
Expenses: | | | | |
Management fees (Note 3a) | | | 12,479,133 | |
Administrative fees (Note 3b) | | | 1,274,031 | |
Distribution fees: (Note 3c) | | | | |
Class 2 | | | 1,145,151 | |
Class 3 | | | 7,524 | |
Unaffiliated transfer agent fees | | | 6,181 | |
Custodian fees (Note 4) | | | 972,368 | |
Reports to shareholders | | | 480,634 | |
Professional fees | | | 65,770 | |
Trustees’ fees and expenses | | | 4,971 | |
Other | | | 32,532 | |
| | |
|
|
|
Total expenses | | | 16,468,295 | |
Expense reductions (Note 4) | | | (5,225 | ) |
| | |
|
|
|
Net expenses | | | 16,463,070 | |
| | |
|
|
|
Net investment income | | | 16,601,225 | |
| | |
|
|
|
Realized and unrealized gains (losses): | | | | |
Net realized gain (loss) from: | | | | |
Investments (net of foreign taxes of $82,046) | | | 100,653,650 | |
Foreign currency transactions | | | (1,047,108 | ) |
| | |
|
|
|
Net realized gain (loss) | | | 99,606,542 | |
| | |
|
|
|
Net change in unrealized appreciation (depreciation) on: | | | | |
Investments | | | 142,537,322 | |
Translation of assets and liabilities denominated in foreign currencies | | | (5,500 | ) |
Change in deferred taxes on unrealized appreciation | | | 270,608 | |
| | |
|
|
|
Net change in unrealized appreciation (depreciation) | | | 142,802,430 | |
| | |
|
|
|
Net realized and unrealized gain (loss) | | | 242,408,972 | |
| | |
|
|
|
Net increase (decrease) in net assets resulting from operations | | $ | 259,010,197 | |
| | |
|
|
|
See notes to financial statements.
TD-17
Franklin Templeton Variable Insurance Products Trust
Financial Statements (continued)
Statements of Changes in Net Assets
| | | | | | | | |
| | | Templeton
Developing Markets
Securities Fund
| |
| | | Year Ended December 31,
| |
| | | 2005 | | | 2004 | |
| | |
| |
Increase (decrease) in net assets: | | | | | | | | |
Operations: | | | | | | | | |
Net investment income | | $ | 16,601,225 | | | $ | 8,948,602 | |
Net realized gain (loss) from investments and foreign currency transactions | | | 99,606,542 | | | | 50,460,755 | |
Net change in unrealized appreciation (depreciation) on investments and translation of assets and liabilities denominated in foreign currencies, and deferred taxes | | | 142,802,430 | | | | 90,694,728 | |
| | |
| |
Net increase (decrease) in net assets resulting from operations | | | 259,010,197 | | | | 150,104,085 | |
| | |
| |
Distributions to shareholders from: | | | | | | | | |
Net investment income: | | | | | | | | |
Class 1 | | | (7,605,217 | ) | | | (7,597,672 | ) |
Class 2 | | | (5,680,711 | ) | | | (4,066,275 | ) |
Class 3 | | | (9,713 | ) | | | (190 | ) |
| | |
| |
Total distributions to shareholders | | | (13,295,641 | ) | | | (11,664,137 | ) |
| | |
| |
Capital share transactions: (Note 2) | | | | | | | | |
Class 1 | | | 44,513,024 | | | | 32,499,304 | |
Class 2 | | | 208,495,324 | | | | 103,669,110 | |
Class 3 | | | 10,396,752 | | | | 10,000 | |
| | |
| |
Total capital share transactions | | | 263,405,100 | | | | 136,178,414 | |
| | |
| |
Redemption fees | | | 1,964 | | | | — | |
| | |
| |
Net increase (decrease) in net assets | | | 509,121,620 | | | | 274,618,362 | |
Net assets: | | | | | | | | |
Beginning of year | | | 804,870,780 | | | | 530,252,418 | |
| | |
| |
End of year | | $ | 1,313,992,400 | | | $ | 804,870,780 | |
| | |
| |
Undistributed net investment income included in net assets: | | | | | | | | |
End of year | | $ | 4,018,236 | | | $ | 1,637,611 | |
| | |
| |
See notes to financial statements.
TD-18
Franklin Templeton Variable Insurance Products Trust
Notes to Financial Statements
Templeton Developing Markets Securities Fund
1. ORGANIZATION AND SIGNIFICANT ACCOUNTING POLICIES
Franklin Templeton Variable Insurance Products Trust (the Trust) is registered under the Investment Company Act of 1940 as an open-end investment company, consisting of twenty-two separate series. The Templeton Developing Markets Securities Fund (the Fund) included in this report is diversified. The financial statements of the remaining funds in the series are presented separately. Shares of the Fund are sold only to insurance company separate accounts to fund the benefits of variable life insurance policies or variable annuity contracts.
The following summarizes the Fund’s significant accounting policies.
a. Security Valuation
Securities listed on a securities exchange or on the NASDAQ National Market System are valued at the last quoted sale price or the official closing price of the day, respectively. Over-the-counter securities and listed securities for which there is no reported sale are valued within the range of the most recent quoted bid and ask prices. Securities that trade in multiple markets or on multiple exchanges are valued according to the broadest and most representative market.
Government securities generally trade in the over-the-counter market rather than on a securities exchange. The Fund may utilize independent pricing services, quotations from bond dealers, and information with respect to bond and note transactions, to assist in determining a current market value for each security. The Fund’s pricing services may use valuation models or matrix pricing which considers information with respect to comparable bond and note transactions, quotations from bond dealers, or by reference to other securities that are considered comparable in such characteristics as rating, interest rate and maturity date, option adjusted spread models, prepayment projections, interest rate spreads and yield curves, to determine current value.
Foreign securities are valued as of the close of trading on the foreign stock exchange on which the security is primarily traded, or the NYSE, whichever is earlier. If no sale is reported at that time, the foreign security will be valued within the range of the most recent quoted bid and ask prices. The value is then converted into its U.S. dollar equivalent at the foreign exchange rate in effect at the close of the NYSE on the day that the value of the foreign security is determined.
The Trust has procedures to determine the fair value of individual securities and other assets for which market prices are not readily available or which may not be reliably priced. Methods for valuing these securities may include: fundamental analysis, matrix pricing, discounts from market prices of similar securities, or discounts applied due to the nature and duration of restrictions on the disposition of the securities. Due to the inherent uncertainty of valuations of such securities, the fair values may differ significantly from the values that would have been used had a ready market for such investments existed. Occasionally, events occur between the time at which trading in a security is completed and the close of the NYSE that might call into question the availability (including the reliability) of the value of a portfolio security held by the Fund. If such an event occurs, the securities may be valued using fair value procedures, which may include the use of independent pricing services. All security valuation procedures are approved by the Trust’s Board of Trustees.
b. Foreign Currency Translation
Portfolio securities and other assets and liabilities denominated in foreign currencies are translated into U.S. dollars based on the exchange rate of such currencies against U.S. dollars on the date of valuation. Purchases and sales of securities, income and expense items denominated in foreign currencies are translated into U.S. dollars at the exchange rate in effect on the transaction date. Occasionally, events may impact the availability or reliability of foreign exchange rates used to convert the U.S. dollar equivalent value. If such an event occurs, the foreign exchange rate will be valued at fair value using procedures established and approved by the Trust’s Board of Trustees.
The Fund does not separately report the effect of changes in foreign exchange rates from changes in market prices on securities held. Such changes are included in net realized and unrealized gain or loss from investments on the Statement of Operations.
TD-19
Franklin Templeton Variable Insurance Products Trust
Notes to Financial Statements (continued)
Templeton Developing Markets Securities Fund
1. ORGANIZATION AND SIGNIFICANT ACCOUNTING POLICIES (continued)
Realized foreign exchange gains or losses arise from sales of foreign currencies, currency gains or losses realized between the trade and settlement dates on securities transactions and the difference between the recorded amounts of dividends, interest, and foreign withholding taxes and the U.S. dollar equivalent of the amounts actually received or paid. Net unrealized foreign exchange gains and losses arise from changes in foreign exchange rates on foreign denominated assets and liabilities other than investments in securities held at the end of the reporting period.
c. Foreign Currency Contracts
When the Fund purchases or sells foreign securities it may enter into foreign exchange contracts to minimize foreign exchange risk from the trade date to the settlement date of the transactions. A foreign exchange contract is an agreement between two parties to exchange different currencies at an agreed upon exchange rate on a specified date. Realized and unrealized gains and losses on these contracts are included in the Statement of Operations.
The risks of these contracts include movement in the values of the foreign currencies relative to the U.S. dollar and the possible inability of the counterparties to fulfill their obligations under the contracts, which may be in excess of the amount reflected in the Statement of Assets and Liabilities.
d. Income Taxes and Deferred Taxes
No provision has been made for U.S. income taxes because the Fund’s policy is to continue to qualify as a regulated investment company under the Internal Revenue Code and to distribute to shareholders substantially all of its taxable income and net realized gains.
The Fund is subject to a tax imposed on net realized gains on securities of certain foreign countries. The Fund records an estimated deferred tax liability for net unrealized gains on these securities in an amount that would be payable if the securities were disposed of on the valuation date.
Foreign securities held by the Fund may be subject to foreign taxation. Foreign taxes, if any, are recorded based on the tax regulations and rates that exist in the foreign markets in which the Fund invests.
e. Security Transactions, Investment Income, Expenses and Distributions
Security transactions are accounted for on trade date. Realized gains and losses on security transactions are determined on a specific identification basis. Interest income and estimated expenses are accrued daily. Dividend income is recorded on the ex-dividend date except that certain dividends from foreign securities are recognized as soon as the Fund is notified of the ex-dividend date. Distributions to shareholders are recorded on the ex-dividend date and are determined according to income tax regulations (tax basis). Such distributions are reinvested in additional shares of the Fund. Distributable earnings determined on a tax basis may differ from earnings recorded in accordance with generally accepted accounting principles. These differences may be permanent or temporary. Permanent differences are reclassified among capital accounts to reflect their character. These reclassifications have no impact on net assets or the results of operations. Temporary differences are not reclassified, as they may reverse in subsequent periods.
Common expenses incurred by the Trust are allocated among the funds based on the ratio of net assets of each fund to the combined net assets of the Trust. Fund specific expenses are charged directly to the fund that incurred the expense.
Realized and unrealized gains and losses and net investment income, other than class specific expenses, are allocated daily to each class of shares based upon the relative proportion of net assets of each class.
TD-20
Franklin Templeton Variable Insurance Products Trust
Notes to Financial Statements (continued)
Templeton Developing Markets Securities Fund
1. ORGANIZATION AND SIGNIFICANT ACCOUNTING POLICIES (continued)
f. Accounting Estimates
The preparation of financial statements in accordance with accounting principles generally accepted in the United States of America requires management to make estimates and assumptions that affect the reported amounts of assets and liabilities at the date of the financial statements and the amounts of income and expenses during the reporting period. Actual results could differ from those estimates.
g. Redemption Fees
Redemptions and exchanges of Class 3 shares held 60 days or less may be subject to the Fund’s redemption fee, which is 1% of the amount redeemed. Such fees are retained by the Fund and accounted for as an addition to paid-in capital.
h. Guarantees and Indemnifications
Under the Trust’s organizational documents, its officers and trustees are indemnified by the Trust against certain liabilities arising out of the performance of their duties to the Trust. Additionally, in the normal course of business, the Trust enters into contracts with service providers that contain general indemnification clauses. The Trust’s maximum exposure under these arrangements is unknown as this would involve future claims that may be made against the Trust that have not yet occurred. However, based on experience, the Trust expects the risk of loss to be remote.
2. SHARES OF BENEFICIAL INTEREST
The Fund offers three classes of shares: Class 1, Class 2 , and Class 3. Effective May 1, 2004, the Fund began offering a new class of shares, Class 3. Each class of shares differs by its distribution fees, voting rights on matters affecting a single class and its exchange privilege.
At December 31, 2005, there were an unlimited number of shares authorized ($0.01 par value). Transactions in the Fund’s shares were as follows:
| | | | | | | | | | | | | | |
| | | Year Ended December 31,
| |
| | | 2005
| | | 2004
| |
| Class 1 Shares: | | Shares
| | | Amount
| | | Shares
| | | Amount
| |
Shares sold | | 10,118,344 | | | $ | 96,449,675 | | | 8,940,486 | | | $ | 67,520,469 | |
Shares issued in reinvestment of distributions | | 833,905 | | | | 7,605,217 | | | 1,105,920 | | | | 7,597,672 | |
Shares redeemed | | (6,292,757 | ) | | | (59,541,868 | ) | | (5,740,464 | ) | | | (42,618,837 | ) |
| | |
| |
Net increase (decrease) | | 4,659,492 | | | $ | 44,513,024 | | | 4,305,942 | | | $ | 32,499,304 | |
| | |
| |
| Class 2 Shares: | | | | | | | | | | | | |
Shares sold | | 27,948,311 | | | $ | 264,714,321 | | | 21,331,545 | | | $ | 159,905,301 | |
Shares issued in reinvestment of distributions | | 627,010 | | | | 5,680,711 | | | 595,355 | | | | 4,066,275 | |
Shares redeemed | | (6,666,146 | ) | | | (61,899,708 | ) | | (8,236,506 | ) | | | (60,302,466 | ) |
| | |
| |
Net increase (decrease) | | 21,909,175 | | | $ | 208,495,324 | | | 13,690,394 | | | $ | 103,669,110 | |
| | |
| |
| Class 3 Shares: | | | | | | | | | | | | |
Shares sold | | 1,108,615 | | | $ | 10,932,663 | | | 1,403 | | | $ | 10,000 | |
Shares issued in reinvestment of distributions | | 1,051 | | | | 9,523 | | | — | | | | — | |
Shares redeemed | | (54,521 | ) | | | (545,434 | ) | | — | | | | — | |
| | |
| |
Net increase (decrease) | | 1,055,145 | | | $ | 10,396,752 | | | 1,403 | | | $ | 10,000 | |
| | |
| |
TD-21
Franklin Templeton Variable Insurance Products Trust
Notes to Financial Statements (continued)
Templeton Developing Markets Securities Fund
3. TRANSACTIONS WITH AFFILIATES
Franklin Resources, Inc. is the holding company for various subsidiaries that together are referred to as Franklin Templeton Investments. Certain officers and trustees of the Trust are also officers and/or directors of the following subsidiaries:
| | |
| Subsidiary | | Affiliation |
Templeton Asset Management, Ltd. (TAML) | | Investment manager |
Franklin Templeton Services, LLC (FT Services) | | Administrative manager |
Franklin Templeton Distributors, Inc. (Distributors) | | Principal underwriter |
Franklin Templeton Investor Services, LLC (Investor Services) | | Transfer agent |
a. Management Fees
Effective May 1, 2005, the Fund pays an investment management fee to TAML based on the average daily net assets of the Fund as follows:
| | |
| Annualized Fee Rate | | Net Assets |
| 1.250% | | Up to and including $1 billion |
| 1.200% | | Over $1 billion, up to and including $5 billion |
| 1.150% | | Over $5 billion, up to and including $10 billion |
| 1.100% | | Over $10 billion, up to and including $15 billion |
| 1.050% | | Over $15 billion, up to and including $20 billion |
| 1.000% | | In excess of $20 billion |
Prior to May 1, 2005, the Fund paid fees to TAML of 1.25% per year of the average daily net assets of the Fund.
b. Administrative Fees
The Fund pays an administrative fee to FT Services based on the average daily net assets of the Fund as follows:
| | |
| Annualized Fee Rate | | Net Assets |
| 0.150% | | Up to and including $200 million |
| 0.135% | | Over $200 million, up to and including $700 million |
| 0.100% | | Over $700 million, up to and including $1.2 billion |
| 0.075% | | In excess of $1.2 billion |
c. Distribution Fees
The Fund’s Board of Trustees has adopted distribution plans for Class 2 and Class 3 shares pursuant to Rule 12b-1 under the 1940 Act. Under the Fund’s compensation distribution plans, the Fund pays Distributors for costs incurred in connection with the sale and distribution of the Fund’s shares up to 0.35% per year of its average daily net assets of each class. The Board of Trustees has set the current rate at 0.25% per year.
d. Transfer Agent Fees
Investor Services, under terms of an agreement, performs shareholder servicing for the Fund and is not paid by the Fund for the services.
4. EXPENSE OFFSET ARRANGEMENT
The Fund has entered into an arrangement with its custodian whereby credits realized as a result of uninvested cash balances are used to reduce a portion of the Fund’s custodian expenses. During the year ended December 31, 2005, the custodian fees were reduced as noted in the Statement of Operations.
TD-22
Franklin Templeton Variable Insurance Products Trust
Notes to Financial Statements (continued)
Templeton Developing Markets Securities Fund
5. INCOME TAXES
At December 31, 2005, the Fund had tax basis capital losses which may be carried over to offset future capital gains, if any. During the year ended December 31, 2005, the Fund utilized $100,122,208 of capital loss carryforwards. At December 31, 2005, the capital loss carryforwards were as follows:
| | | |
Capital loss carryforwards expiring in: | | | |
| |
2007 | | $ | 19,956,300 |
2009 | | | 983,337 |
2010 | | | 24,246,197 |
| | |
|
| | | $ | 45,185,834 |
| | |
|
For tax purposes, realized capital losses and realized currency losses, occurring subsequent to October 31, may be deferred and treated as occurring on the first day of the following fiscal year. At December 31, 2005, the Fund deferred realized currency losses of $346,577.
The tax character of distributions paid during the years ended December 31, 2005 and 2004, was as follows:
| | | | | | |
| | | 2005
| | 2004
|
Distributions paid from - ordinary income | | $ | 13,295,641 | | $ | 11,664,137 |
| | |
|
At December 31, 2005, the cost of investments, net unrealized appreciation (depreciation) and undistributed ordinary income for income tax purposes were as follows:
| | | | |
Cost of investments | | $ | 971,350,435 | |
| | |
|
|
|
| |
Unrealized appreciation | | $ | 367,045,306 | |
Unrealized depreciation | | | (26,157,729 | ) |
| | |
|
|
|
Net unrealized appreciation (depreciation) | | $ | 340,887,577 | |
| | |
|
|
|
Distributable earnings - undistributed ordinary income | | $ | 18,062,824 | |
| | |
|
|
|
Net investment income differs for financial statement and tax purposes primarily due to differing treatments of foreign currency transactions and passive foreign investment company shares.
Net realized gains (losses) differ for financial statement and tax purposes primarily due to differing treatments of wash sales and foreign currency transactions.
6. INVESTMENT TRANSACTIONS
Purchases and sales of investments (excluding short term securities) for the year ended December 31, 2005, aggregated $538,514,537 and $297,029,323, respectively.
7. CONCENTRATION OF RISK
Investing in foreign securities may include certain risks and considerations not typically associated with investing in U.S. securities, such as fluctuating currency values and changing local and regional economic, political and social conditions, which may result in greater market volatility. In addition, certain foreign securities may not be as liquid as U.S. securities.
TD-23
Franklin Templeton Variable Insurance Products Trust
Notes to Financial Statements (continued)
Templeton Developing Markets Securities Fund
8. REGULATORY MATTERS
As part of various investigations by a number of federal, state, and foreign regulators and governmental entities, relating to certain practices in the mutual fund industry, including late trading, market timing and marketing support payments to securities dealers who sell fund shares, Franklin Resources, Inc. and certain of its subsidiaries (collectively, the “Company”), entered into settlements with certain of those regulators.
Specifically, the Company entered into settlements with the Securities and Exchange Commission (“SEC”) concerning market timing (the “August 2, 2004 SEC Order”) and marketing support payments to securities dealers who sell fund shares (the “December 13, 2004 SEC Order”) and with the California Attorney General’s Office (“CAGO”) concerning marketing support payments to securities dealers who sell fund shares (the “CAGO Settlement”). Under the terms of the settlements with the SEC and the CAGO, the Company retained an Independent Distribution Consultant (“IDC”) to develop a plan for distribution of the respective settlement monies. The CAGO approved the distribution plan under the CAGO Settlement and, in accordance with the terms and conditions of that settlement, the monies were disbursed to the relevant funds and are recorded as other income in the current period. The SEC has not yet approved the distribution plan pertaining to the December 13, 2004 SEC Order. When approved, disbursements of settlement monies will be made promptly to the relevant funds, in accordance with the terms and conditions of that order. The IDC continues to develop the plan of distribution under the August 2, 2004 SEC Order that resolved the SEC’s market timing investigation.
In addition, the Company, as well as most of the mutual funds within Franklin Templeton Investments and certain current or former officers, directors, and/or employees, have been named in private lawsuits (styled as shareholder class actions, or as derivative actions on behalf of either the named funds or Franklin Resources, Inc.) relating to the industry practices referenced above, as well as to allegedly excessive advisory fees, commissions, and/or 12b-1 fees. The lawsuits were filed in different courts throughout the country. Many of those suits are now pending in a multi-district litigation in the United States District Court for the District of Maryland.
The Company and fund management strongly believe that the claims made in each of the private lawsuits referenced above are without merit and intend to defend against them vigorously. The Company cannot predict with certainty the eventual outcome of these lawsuits, nor whether they will have a material negative impact on the Company. If it is determined that the Company bears responsibility for any unlawful or inappropriate conduct that caused losses to the Trust, it is committed to making the Trust or their shareholders whole, as appropriate.
TD-24
Franklin Templeton Variable Insurance Products Trust
Templeton Developing Markets Securities Fund
Report of Independent Registered Public Accounting Firm
To the Board of Trustees and Shareholders of
Franklin Templeton Variable Insurance Products Trust:
In our opinion, the accompanying statement of assets and liabilities, including the statement of investments, and the related statements of operations and of changes in net assets and the financial highlights present fairly, in all material respects, the financial position of Templeton Developing Markets Securities Fund (one of the funds constituting Franklin Templeton Variable Insurance Products Trust, hereafter referred to as the “Fund”) at December 31, 2005, the results of its operations for the year then ended, the changes in its net assets for each of the two years in the period then ended and the financial highlights for each of the periods presented, in conformity with accounting principles generally accepted in the United States of America. These financial statements and financial highlights (hereafter referred to as “financial statements”) are the responsibility of the Fund’s management; our responsibility is to express an opinion on these financial statements based on our audits. We conducted our audits of these financial statements in accordance with the standards of the Public Company Accounting Oversight Board (United States). Those standards require that we plan and perform the audit to obtain reasonable assurance about whether the financial statements are free of material misstatement. An audit includes examining, on a test basis, evidence supporting the amounts and disclosures in the financial statements, assessing the accounting principles used and significant estimates made by management, and evaluating the overall financial statement presentation. We believe that our audits, which included confirmation of securities at December 31, 2005, by correspondence with the custodian and brokers, provide a reasonable basis for our opinion.
PricewaterhouseCoopers LLP
San Francisco, California
February 10, 2006
TD-25
Franklin Templeton Variable Insurance Products Trust
Tax Designation (unaudited)
Templeton Developing Markets Securities Fund
At December 31, 2005, more than 50% of the Fund’s total assets were invested in securities of foreign issuers. In most instances, foreign taxes were withheld from dividends paid to the Fund on these investments. The Fund elects to treat foreign taxes paid as allowed under Section 853 of the Internal Revenue Code. This election will allow shareholders of record in June 2006, to treat their proportionate share of foreign taxes paid by the Fund as having been paid directly by them. The shareholder shall consider these amounts as foreign taxes paid in the tax year in which they receive the Fund distribution.
The foreign tax information will be disclosed in the June 30, 2006, semi-annual report of the Fund.
TD-26
TEMPLETON FOREIGN SECURITIES FUND
This annual report for Templeton Foreign Securities Fund covers the fiscal year ended December 31, 2005.
Performance Summary as of 12/31/05
Average annual total return of Class 1 shares* represents the average annual change in value, assuming reinvestment of dividends and capital gains. Average returns smooth out variations in returns, which can be significant; they are not the same as year-by-year results.
Periods ended 12/31/05
| | | | | | |
| | | 1-Year | | 5-Year | | 10-Year |
Average Annual Total Return | | +10.48% | | +3.66% | | +8.38% |
*Performance prior to the 5/1/00 merger reflects historical performance of Templeton International Fund.
Total Return Index Comparison for Hypothetical $10,000 Investment (1/1/96–12/31/05)
The graph below shows the change in value of a hypothetical $10,000 investment in the Fund over the indicated period and includes reinvestment of any income or distributions. The Fund’s performance* is compared to the performance of the Morgan Stanley Capital International (MSCI) Europe, Australasia, Far East (EAFE) Index. One cannot invest directly in an index, nor is an index representative of the Fund’s portfolio. Please see Important Notes to Performance Information preceding the Fund Summaries.
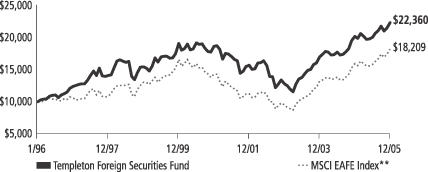
**Source: Standard & Poor’s Micropal. Please see Index Descriptions following the Fund Summaries.
Templeton Foreign Securities Fund – Class 1
Performance reflects the Fund’s Class 1 operating expenses, but does not include any contract fees, expenses or sales charges. If they had been included, performance would be lower. These charges and deductions, particularly for variable life policies, can have a significant effect on contract values and insurance benefits. See the contract prospectus for a complete description of these expenses, including sales charges.
Performance data represent past performance, which does not guarantee future results. Investment return and principal value will fluctuate, and you may have a gain or loss when you sell your shares. Current performance may differ from figures shown.
TF-1
Fund Goal and Main Investments: Templeton Foreign Securities Fund seeks long-term capital growth. The Fund normally invests at least 80% of its net assets in investments of issuers located outside the U.S., including those in emerging markets.
Performance Overview
You can find the Fund’s one-year total return in the Performance Summary. The Fund underperformed its benchmark, the MSCI EAFE Index, which had a +14.02% total return for the same period.1 Please note that index performance information is provided for reference and that we do not attempt to track the index, but rather undertake investments on the basis of fundamental research.
Economic and Market Overview
The global economy overcame fears of derailment generated by higher energy costs and advanced at a solid clip during 2005, with signs of firming recoveries in Europe and Japan. Excluding the volatile energy and food sectors, inflation remained relatively subdued worldwide, and monetary policy remained fairly accommodative. The U.S. Federal Reserve Board raised the short-term federal funds target rate with eight quarter-point increases, bringing it to 4.25%. The European Central Bank (ECB) made one quarter-point rise in short-term rates, its first increase after keeping rates at historically low levels for more than two and a half years. Even after the increases, both rates remained at levels considered accommodative for economic growth.
Strong demand for oil sustained high prices during most of the year, while prices for other commodities such as industrial metals were also high, led by copper, whose contract price rose 45.4% during 2005.2 This contributed to economic growth in countries such as Australia and Canada, and emerging markets in Asia and Latin America that are tied to mining and industrial commodities.
In this environment, global equity markets performed strongly, particularly outside the U.S. One-year total return for the MSCI All Country (AC) World ex US Index was +17.11% in U.S. dollar terms.3 By comparison the total return for the MSCI USA Index was +5.72%.3 In terms of
1. Source: Standard & Poor’s Micropal. One cannot invest directly in an index, nor is an index representative of the Fund’s portfolio. Please see Index Descriptions following the Fund Summaries.
2. Source: New York Mercantile Exchange.
3. Source: Standard & Poor’s Micropal. Please see Index Descriptions following the Fund Summaries.
Fund Risks: The Fund’s investments in stocks offer the potential for long-term gains but can be subject to short-term up-and-down price movements. Foreign investing, especially in emerging markets, involves additional risks including currency fluctuations, economic instability, and social and political developments. The Fund’s prospectus also includes a description of the main investment risks.
TF-2
sectors, energy and materials led equity market performance, and telecommunication services and consumer-related sectors lagged.
Among developed countries, the Japanese equity market performed well, returning +44.70% in local currency terms for the year under review.4 However, this market benefited primarily from investors outside Japan, and the return was significantly less (+25.62%) after conversion into U.S. dollars. 4 In contrast, the conversion into dollars enhanced equity market returns in Brazil (+57.04%), Mexico (+49.11%) and South Korea (+58.00%).4 At the beginning of the year, the consensus of many analysts appeared to be that the U.S. dollar would decline in value relative to major currencies. In fact, for the year the dollar appreciated versus the yen, the euro, the pound and most other currencies.
Investment Strategy
Our investment philosophy is bottom-up, value-oriented and long-term. In choosing investments, we generally focus on the market price of a company’s securities relative to our evaluation of the company’s potential long-term earnings, asset value and cash flow. Among factors we consider are a company’s historical value measures, including price/earnings ratio, profit margins and liquidation value. We do in-depth research to construct a bargain list from which we buy.
Manager’s Discussion
During the year under review, the Fund’s performance benefited from stock selection in the financials sector. Despite being underweighted in financials relative to the MSCI EAFE Index, the Fund’s sector holdings outperformed those of the index.5 Strong performing financials stocks were concentrated in Japan (Mitsubishi UFJ Financial, Nomura Holdings, Sompo Japan Insurance and Sumitomo Mitsui Financial) and South Korea (Kookmin Bank, Hana Bank and Shinhan Financial Group). Our industrials holdings helped the Fund’s absolute performance, as the sector outperformed the overall index.6 Strong performers included Denmark’s Vestas Wind Systems and the U.K.’s Rolls-Royce Group and BAE Systems. The Fund’s energy sector holdings also helped absolute performance because the sector outperformed the overall index, and the
4. Source: Standard & Poor’s Micropal. Individual country market returns are measured by MSCI country-specific indexes.
5. The financials sector comprises capital markets, commercial banks, insurance and real estate in the Statement of Investments (SOI).
6. The industrials sector comprises aerospace and defense, air freight and logistics, airlines, commercial services and supplies, electrical equipment, industrial conglomerates, and road and rail in the SOI.
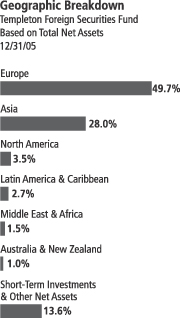
TF-3
Fund had strong returns from France’s Total, the Netherlands’ SBM Offshore and Italy’s Eni.7
Despite the Fund’s positive return, there were several detractors from relative performance. The Fund’s overweighted exposure to the telecommunication services sector, the worst performing MSCI EAFE Index sector, hindered results.8 The Fund’s overall telecommunication services sector position underperformed the overall index; however, it outperformed the index’s telecommunication services sector. Poor performing telecommunication services stocks in the Fund’s portfolio included Spain’s Telefonica, the U.K.’s Vodafone Group and South Korea’s SK Telecom. The Fund’s overweighted position and stock selection in the consumer discretionary sector also hurt relative performance.9 Compass Group and British Sky Broadcasting Group, both in the U.K., performed poorly during the period. The Fund’s underweighted Japanese exposure, as well as stock selection within the country, hurt the Fund’s performance relative to the index.
It is important to recognize the effect of currency movements on the Fund’s performance. In general, if the value of the U.S. dollar increases compared with a foreign currency, an investment traded in that foreign currency will decrease in value because it will be worth fewer U.S. dollars. This can have a negative effect on Fund performance. Conversely, when the U.S. dollar weakens in relation to a foreign currency, an investment traded in that foreign currency will increase in value, which can contribute to Fund performance. For the 12 months ended December 31, 2005, the U.S. dollar rose in value relative to most non-U.S. currencies. As a result, the Fund’s performance was negatively affected by the portfolio’s investment primarily in securities with non-U.S. currency exposure.
Thank you for your participation in Templeton Foreign Securities Fund. We look forward to serving your future investment needs.
7. The energy sector comprises energy equipment and services; and oil, gas and consumable fuels in the SOI.
8. The telecommunication services sector comprises diversified telecommunication services and wireless telecommunication services in the SOI.
9. The consumer discretionary sector comprises automobiles; auto components; hotels, restaurants and leisure; household durables; leisure equipment and products; and media in the SOI.
The foregoing information reflects our analysis, opinions and portfolio holdings as of December 31, 2005, the end of the reporting period. The way we implement our main investment strategies and the resulting portfolio holdings may change depending on factors such as market and economic conditions. These opinions may not be relied upon as investment advice or an offer for a particular security. The information is not a complete analysis of every aspect of any market, country, industry, security or the Fund. Statements of fact are from sources considered reliable, but the adviser makes no representation or warranty as to their completeness or accuracy. Although historical performance is no guarantee of future results, these insights may help you understand our investment management philosophy.
Top 10 Holdings
Templeton Foreign Securities Fund
12/31/05
| | |
Company
Sector/Industry,
Country | | % of Total
Net Assets |
| Cheung Kong Holdings Ltd. | | 2.0% |
| Real Estate, Hong Kong | | |
| GlaxoSmithKline PLC | | 1.7% |
| Pharmaceuticals, U.K. | | |
| Samsung Electronics Co. Ltd. | | 1.6% |
| Semiconductors & Semiconductor Equipment, South Korea | | |
| ING Groep NV | | 1.6% |
| Capital Markets, Netherlands | | |
| Sanofi-Aventis | | 1.6% |
| Pharmaceuticals, France | | |
| British Sky Broadcasting Group PLC | | 1.5% |
| Media, U.K. | | |
| Royal Dutch Shell PLC, B | | 1.5% |
| Oil, Gas & Consumable Fuels, U.K. | | |
| Vodafone Group PLC, ADR | | 1.5% |
| Wireless Telecommunication Services, U.K. | | |
| Electrolux AB, B | | 1.4% |
| Household Durables, Sweden | | |
| Sony Corp. | | 1.4% |
| Household Durables, Japan | | |
The dollar value, number of shares or principal amount, and names of all portfolio holdings are listed in the Fund’s Statement of Investments.
TF-4
Fund Expenses
As an investor in a variable insurance contract (“Contract”) that indirectly provides for investment in an underlying mutual fund, you can incur transaction and/or ongoing expenses at both the Fund level and the Contract level.
| • | Transaction expenses can include sales charges (loads) on purchases, redemption fees, surrender fees, transfer fees and premium taxes. |
| • | Ongoing expenses can include management fees, distribution and service (12b-1) fees, contract fees, annual maintenance fees, mortality and expense risk fees and other fees and expenses. All mutual funds and Contracts have some types of ongoing expenses. |
The expenses shown in the table below are meant to highlight ongoing expenses at the Fund level only and do not include ongoing expenses at the Contract level, or transaction expenses at either the Fund or Contract level. While the Fund does not have transaction expenses, if the transaction and ongoing expenses at the Contract level were included, the expenses shown below would be higher. You should consult your Contract prospectus or disclosure document for more information.
The table shows Fund-level ongoing expenses and can help you understand these expenses and compare them with those of other mutual funds offered through the Contract. The table assumes a $1,000 investment held for the six months indicated. Please refer to the Fund prospectus for additional information on operating expenses.
Actual Fund Expenses
The first line (Actual) of the table below provides actual account values and expenses. The “Ending Account Value” is derived from the Fund’s actual return, which includes the effect of ongoing Fund expenses, but does not include the effect of ongoing Contract expenses.
You can estimate the Fund-level expenses you incurred during the period by following these steps. Of course, your account value and expenses will differ from those in this illustration:
| 1. | Divide your account value by $1,000. |
If an account had an $8,600 value, then $8,600 ÷ $1,000 = 8.6.
| 2. | Multiply the result by the number under the heading “Fund-Level Expenses Incurred During Period.” |
If Fund-Level Expenses Incurred During Period were $7.50, then 8.6 × $7.50 = $64.50.
Templeton Foreign Securities Fund – Class 1
TF-5
In this illustration, the estimated expenses incurred this period at the Fund level are $64.50.
Hypothetical Example for Comparison with Other Mutual Funds
Information in the second line (Hypothetical) of the table can help you compare ongoing expenses of the Fund with those of other mutual funds offered through the Contract. This information may not be used to estimate the actual ending account balance or expenses you incurred during the period. The hypothetical “Ending Account Value” is based on the Fund’s actual expense ratio and an assumed 5% annual rate of return before expenses, which does not represent the Fund’s actual return. The figure under the heading “Fund-Level Expenses Incurred During Period” shows the hypothetical expenses your account would have incurred under this scenario. You can compare this figure with the 5% hypothetical examples that appear in shareholder reports of other funds offered through a Contract.
| | | | | | | | | |
| Class 1 | | Beginning
Account
Value 7/1/05 | | Ending
Account
Value 12/31/05 | | Fund-Level
Expenses Incurred
During Period*
7/1/05-12/31/05 |
Actual | | $ | 1,000 | | $ | 1,113.10 | | $ | 4.10 |
Hypothetical (5% return before expenses) | | $ | 1,000 | | $ | 1,021.32 | | $ | 3.92 |
*Expenses are equal to the annualized expense ratio for the Fund’s Class 1 shares (0.77%), which does not include any ongoing expenses of the Contract for which the Fund is an investment option, multiplied by the average account value over the period, multiplied by 184/365 to reflect the one-half year period.
TF-6
Franklin Templeton Variable Insurance Products Trust
Financial Highlights
Templeton Foreign Securities Fund
| | | | | | | | | | | | | | | | | | | | |
| | | Year Ended December 31,
| |
| Class 1 | | 2005 | | | 2004 | | | 2003 | | | 2002 | | | 2001 | |
| | |
|
|
|
Per share operating performance | | | | | | | | | | | | | | | | | | | | |
(for a share outstanding throughout the year) | | | | | | | | | | | | | | | | | | | | |
Net asset value, beginning of year | | $ | 14.53 | | | $ | 12.37 | | | $ | 9.51 | | | $ | 11.85 | | | $ | 18.78 | |
| | |
|
|
|
Income from investment operations: | | | | | | | | | | | | | | | | | | | | |
Net investment incomea | | | 0.30 | | | | 0.26 | | | | 0.19 | | | | 0.22 | | | | 0.23 | |
Net realized and unrealized gains (losses) | | | 1.20 | | | | 2.05 | | | | 2.87 | | | | (2.37 | ) | | | (5.23 | ) |
| | |
|
|
|
Total from investment operations | | | 1.50 | | | | 2.31 | | | | 3.06 | | | | (2.15 | ) | | | (5.00 | ) |
| | |
|
|
|
Less distributions from: | | | | | | | | | | | | | | | | | | | | |
Net investment income | | | (0.19 | ) | | | (0.15 | ) | | | (0.20 | ) | | | (0.19 | ) | | | (0.26 | ) |
Net realized gains | | | — | | | | — | | | | — | | | | — | | | | (1.67 | ) |
| | |
|
|
|
Total distributions | | | (0.19 | ) | | | (0.15 | ) | | | (0.20 | ) | | | (0.19 | ) | | | (1.93 | ) |
| | |
|
|
|
Redemption fees | | | — | c | | | — | c | | | — | | | | — | | | | — | |
| | |
|
|
|
Net asset value, end of year | | $ | 15.84 | | | $ | 14.53 | | | $ | 12.37 | | | $ | 9.51 | | | $ | 11.85 | |
| | |
|
|
|
| | | | | |
Total returnb | | | 10.48% | | | | 18.87% | | | | 32.55% | | | | (18.40)% | | | | (15.75)% | |
Ratios/supplemental data | | | | | | | | | | | | | | | | | | | | |
Net assets, end of year (000’s) | | $ | 531,775 | | | $ | 506,456 | | | $ | 472,665 | | | $ | 397,420 | | | $ | 565,220 | |
Ratios to average net assets: | | | | | | | | | | | | | | | | | | | | |
Expenses | | | 0.77% | | | | 0.82% | | | | 0.87% | | | | 0.88% | | | | 0.90% | |
Net investment income | | | 2.03% | | | | 1.95% | | | | 1.81% | | | | 1.97% | | | | 1.59% | |
Portfolio turnover rate | | | 14.61% | | | | 10.91% | | | | 18.01% | | | | 28.12% | | | | 20.00% | |
| a | Based on average daily shares outstanding. |
| b | Total return does not include any fees, charges or expenses imposed by the variable annuity and life insurance contracts for which the Franklin Templeton Variable Insurance Products Trust serves as an underlying investment vehicle. |
| c | Amount is less than $0.01 per share. |
See notes to financial statements.
TF-7
Franklin Templeton Variable Insurance Products Trust
Financial Highlights (continued)
Templeton Foreign Securities Fund (continued)
| | | | | | | | | | | | | | | | | | | | |
| | | Year Ended December 31,
| |
| Class 2 | | 2005 | | | 2004 | | | 2003 | | | 2002 | | | 2001 | |
| | |
|
|
|
Per share operating performance | | | | | | | | | | | | | | | | | | | | |
(for a share outstanding throughout the year) | | | | | | | | | | | | | | | | | | | | |
Net asset value, beginning of year | | $ | 14.35 | | | $ | 12.24 | | | $ | 9.42 | | | $ | 11.74 | | | $ | 18.67 | |
| | |
|
|
|
Income from investment operations: | | | | | | | | | | | | | | | | | | | | |
Net investment incomea | | | 0.26 | | | | 0.22 | | | | 0.15 | | | | 0.17 | | | | 0.18 | |
Net realized and unrealized gains (losses) | | | 1.19 | | | | 2.03 | | | | 2.85 | | | | (2.32 | ) | | | (5.21 | ) |
| | |
|
|
|
Total from investment operations | | | 1.45 | | | | 2.25 | | | | 3.00 | | | | (2.15 | ) | | | (5.03 | ) |
| | |
|
|
|
Less distributions from: | | | | | | | | | | | | | | | | | | | | |
Net investment income | | | (0.17 | ) | | | (0.14 | ) | | | (0.18 | ) | | | (0.17 | ) | | | (0.23 | ) |
Net realized gains | | | — | | | | — | | | | — | | | | — | | | | (1.67 | ) |
| | |
|
|
|
Total distributions | | | (0.17 | ) | | | (0.14 | ) | | | (0.18 | ) | | | (0.17 | ) | | | (1.90 | ) |
| | |
|
|
|
Redemption fees | | | — | c | | | — | c | | | — | | | | — | | | | — | |
| | |
|
|
|
Net asset value, end of year | | $ | 15.63 | | | $ | 14.35 | | | $ | 12.24 | | | $ | 9.42 | | | $ | 11.74 | |
| | |
|
|
|
| | | | | |
Total returnb | | | 10.17% | | | | 18.53% | | | | 32.21% | | | | (18.56)% | | | | (15.99)% | |
Ratios/supplemental data | | | | | | | | | | | | | | | | | | | | |
Net assets, end of year (000’s) | | $ | 2,232,990 | | | $ | 1,445,928 | | | $ | 653,594 | | | $ | 299,760 | | | $ | 225,505 | |
Ratios to average net assets: | | | | | | | | | | | | | | | | | | | | |
Expenses | | | 1.02% | | | | 1.07% | | | | 1.12% | | | | 1.13% | | | | 1.15% | |
Net investment income | | | 1.78% | | | | 1.70% | | | | 1.56% | | | | 1.72% | | | | 1.32% | |
Portfolio turnover rate | | | 14.61% | | | | 10.91% | | | | 18.01% | | | | 28.12% | | | | 20.00% | |
| a | Based on average daily shares outstanding. |
| b | Total return does not include any fees, charges or expenses imposed by the variable annuity and life insurance contracts for which the Franklin Templeton Variable Insurance Products Trust serves as an underlying investment vehicle. |
| c | Amount is less than $0.01 per share. |
See notes to financial statements.
TF-8
Franklin Templeton Variable Insurance Products Trust
Financial Highlights (continued)
Templeton Foreign Securities Fund (continued)
| | | | | | | | |
| | | Year Ended December 31,
| |
| Class 3 | | 2005 | | | 2004d | |
| | |
|
|
|
Per share operating performance | | | | | | | | |
(for a share outstanding throughout the year) | | | | | | | | |
Net asset value, beginning of year | | $ | 14.35 | | | $ | 12.48 | |
| | |
|
|
|
Income from investment operations: | | | | | | | | |
Net investment incomea | | | 0.25 | | | | 0.09 | |
Net realized and unrealized gains (losses) | | | 1.18 | | | | 1.92 | |
| | |
|
|
|
Total from investment operations | | | 1.43 | | | | 2.01 | |
| | |
|
|
|
Less distributions from net investment income | | | (0.18 | ) | | | (0.14 | ) |
| | |
|
|
|
Redemption fees | | | — | c | | | — | c |
| | |
|
|
|
Net asset value, end of year | | $ | 15.60 | | | $ | 14.35 | |
| | |
|
|
|
| | |
Total returnb | | | 10.13% | | | | 16.25% | |
Ratios/supplemental data | | | | | | | | |
Net assets, end of year (000’s) | | $ | 47,462 | | | $ | 16,559 | |
Ratios to average net assets: | | | | | | | | |
Expenses | | | 1.02% | | | | 1.07% | e |
Net investment income | | | 1.78% | | | | 1.70% | e |
Portfolio turnover rate | | | 14.61% | | | | 10.91% | |
| a | Based on average daily shares outstanding. |
| b | Total return does not include any fees, charges or expenses imposed by the variable annuity and life insurance contracts for which the Franklin Templeton Variable Insurance Products Trust serves as an underlying investment vehicle. |
| c | Amount is less than $0.01 per share. |
| d | For the period May 1, 2004 (effective date) to December 31, 2004. |
See notes to financial statements.
TF-9
Franklin Templeton Variable Insurance Products Trust
Statement of Investments, December 31, 2005
| | | | | | | |
| Templeton Foreign Securities Fund | | Country | | Shares | | Value |
Long Term Investments 86.8% | | | | | | | |
Common Stocks 85.3% | | | | | | | |
Aerospace & Defense 1.3% | | | | | | | |
BAE Systems PLC | | United Kingdom | | 3,544,411 | | $ | 23,279,045 |
aRolls-Royce Group PLC | | United Kingdom | | 1,729,900 | | | 12,723,282 |
Rolls-Royce Group PLC, B | | United Kingdom | | 57,778,660 | | | 101,891 |
| | | | | | |
|
|
| | | | | | | | 36,104,218 |
| | | | | | |
|
|
Air Freight & Logistics 0.6% | | | | | | | |
Deutsche Post AG | | Germany | | 753,313 | | | 18,299,933 |
| | | | | | |
|
|
Airlines 0.8% | | | | | | | |
Qantas Airways Ltd. | | Australia | | 7,413,890 | | | 21,971,374 |
| | | | | | |
|
|
Auto Components 0.8% | | | | | | | |
GKN PLC | | United Kingdom | | 4,440,200 | | | 22,000,728 |
| | | | | | |
|
|
Automobiles 0.9% | | | | | | | |
Bayerische Motoren Werke AG | | Germany | | 551,350 | | | 24,150,481 |
| | | | | | |
|
|
Capital Markets 3.2% | | | | | | | |
Amvescap PLC | | United Kingdom | | 2,575,100 | | | 19,582,061 |
ING Groep NV | | Netherlands | | 1,304,660 | | | 45,254,488 |
Nomura Holdings Inc. | | Japan | | 1,327,730 | | | 25,422,942 |
| | | | | | |
|
|
| | | | | | | | 90,259,491 |
| | | | | | |
|
|
Chemicals 1.8% | | | | | | | |
Akzo Nobel NV | | Netherlands | | 329,003 | | | 15,248,541 |
BASF AG | | Germany | | 324,369 | | | 24,856,595 |
Lonza Group AG | | Switzerland | | 173,400 | | | 10,611,882 |
| | | | | | |
|
|
| | | | | | | | 50,717,018 |
| | | | | | |
|
|
Commercial Banks 11.9% | | | | | | | |
Banco Santander Central Hispano SA | | Spain | | 1,919,500 | | | 25,337,261 |
a,bBank of Communications Ltd., 144A | | China | | 4,184,000 | | | 1,902,149 |
DBS Group Holdings Ltd. | | Singapore | | 1,312,000 | | | 13,017,830 |
Hana Financial Group Inc. | | South Korea | | 690,840 | | | 31,679,214 |
aKookmin Bank, ADR | | South Korea | | 314,560 | | | 23,500,778 |
Lloyds TSB Group PLC | | United Kingdom | | 1,387,500 | | | 11,661,102 |
Mega Financial Holding Co. Ltd. | | Taiwan | | 19,749,000 | | | 12,844,536 |
Mitsubishi UFJ Financial Group Inc. | | Japan | | 2,616 | | | 35,462,171 |
Nordea Bank AB, FDR | | Sweden | | 2,135,083 | | | 22,318,867 |
Royal Bank of Scotland Group PLC | | United Kingdom | | 852,940 | | | 25,753,582 |
aShinhan Financial Group Co. Ltd. | | South Korea | | 869,130 | | | 35,412,195 |
bShinsei Bank Ltd., 144A | | Japan | | 4,990,000 | | | 28,833,178 |
Sumitomo Mitsui Financial Group Inc. | | Japan | | 3,511 | | | 37,183,343 |
UniCredito Italiano SpA | | Italy | | 4,423,938 | | | 30,480,964 |
| | | | | | |
|
|
| | | | | | | | 335,387,170 |
| | | | | | |
|
|
Commercial Services & Supplies 1.5% | | | | | | | |
Contax Participacoes SA, ADR | | Brazil | | 806,480 | | | 969,169 |
Rentokil Initial PLC | | United Kingdom | | 6,633,900 | | | 18,660,734 |
Securitas AB, B | | Sweden | | 1,352,080 | | | 22,462,345 |
| | | | | | |
|
|
| | | | | | | | 42,092,248 |
| | | | | | |
|
|
Computers & Peripherals 1.4% | | | | | | | |
Compal Electronics Inc. | | Taiwan | | 12,423,975 | | | 11,202,829 |
Lite-On Technology Corp. | | Taiwan | | 15,579,480 | | | 21,238,381 |
NEC Corp. | | Japan | | 1,058,000 | | | 6,579,446 |
| | | | | | |
|
|
| | | | | | | | 39,020,656 |
| | | | | | |
|
|
TF-10
Franklin Templeton Variable Insurance Products Trust
Statement of Investments, December 31, 2005 (continued)
| | | | | | | |
| Templeton Foreign Securities Fund | | Country | | Shares | | Value |
Common Stocks (cont.) | | | | | | | |
Diversified Telecommunication Services 7.3% | | | | | | | |
BCE Inc. | | Canada | | 1,210,660 | | $ | 29,029,591 |
China Telecom Corp. Ltd., H | | China | | 39,562,000 | | | 14,541,758 |
Chunghwa Telecom Co. Ltd., ADR | | Taiwan | | 1,325,350 | | | 24,320,172 |
France Telecom SA | | France | | 779,220 | | | 19,362,847 |
KT Corp., ADR | | South Korea | | 420,880 | | | 9,069,964 |
Nippon Telegraph & Telephone Corp. | | Japan | | 7,388 | | | 33,550,521 |
Telefonica SA, ADR | | Spain | | 361,829 | | | 16,289,542 |
Telefonos de Mexico SA de CV (Telmex), L, ADR | | Mexico | | 1,561,938 | | | 38,548,630 |
Telenor ASA | | Norway | | 2,003,100 | | | 19,661,221 |
| | | | | | |
|
|
| | | | | | | | 204,374,246 |
| | | | | | |
|
|
Electric Utilities 2.2% | | | | | | | |
Endesa SA | | Spain | | 547,398 | | | 14,399,385 |
Hong Kong Electric Holdings Ltd. | | Hong Kong | | 3,653,500 | | | 18,093,982 |
Iberdrola SA, Br. | | Spain | | 528,222 | | | 14,438,999 |
National Grid PLC | | United Kingdom | | 1,529,536 | | | 14,973,179 |
| | | | | | |
|
|
| | | | | | | | 61,905,545 |
| | | | | | |
|
|
Electrical Equipment 1.3% | | | | | | | |
Gamesa Corp. Tecnologica SA | | Spain | | 123,635 | | | 1,809,075 |
bGamesa Corp. Tecnologica SA, 144A | | Spain | | 1,552,713 | | | 22,719,896 |
aVestas Wind Systems AS | | Denmark | | 502,800 | | | 8,257,271 |
a,bVestas Wind Systems AS, 144A | | Denmark | | 167,600 | | | 2,752,424 |
| | | | | | |
|
|
| | | | | | | | 35,538,666 |
| | | | | | |
|
|
Electronic Equipment & Instruments 2.3% | | | | | | | |
Electrocomponents PLC | | United Kingdom | | 2,776,310 | | | 13,421,972 |
Hitachi Ltd. | | Japan | | 3,361,867 | | | 22,644,110 |
Mabuchi Motor Co. Ltd. | | Japan | | 303,100 | | | 16,820,342 |
Venture Corp. Ltd. | | Singapore | | 1,417,000 | | | 11,758,982 |
| | | | | | |
|
|
| | | | | | | | 64,645,406 |
| | | | | | |
|
|
Energy Equipment & Services 0.3% | | | | | | | |
SBM Offshore NV | | Netherlands | | 115,874 | | | 9,362,360 |
| | | | | | |
|
|
Food & Staples Retailing 0.8% | | | | | | | |
Boots Group PLC | | United Kingdom | | 2,229,200 | | | 23,222,300 |
| | | | | | |
|
|
Food Products 2.1% | | | | | | | |
Nestle SA | | Switzerland | | 109,488 | | | 32,752,643 |
Unilever PLC | | United Kingdom | | 2,751,334 | | | 27,288,814 |
| | | | | | |
|
|
| | | | | | | | 60,041,457 |
| | | | | | |
|
|
Health Care Equipment & Supplies 0.9% | | | | | | | |
Olympus Corp. | | Japan | | 956,000 | | | 25,108,871 |
| | | | | | |
|
|
Hotels Restaurants & Leisure 1.2% | | | | | | | |
Compass Group PLC | | United Kingdom | | 8,828,220 | | | 33,490,666 |
| | | | | | |
|
|
Household Durables 3.8% | | | | | | | |
Electrolux AB, B | | Sweden | | 1,509,600 | | | 39,233,831 |
Koninklijke Philips Electronics NV | | Netherlands | | 951,239 | | | 29,560,763 |
Sony Corp. | | Japan | | 956,454 | | | 39,058,784 |
| | | | | | |
|
|
| | | | | | | | 107,853,378 |
| | | | | | |
|
|
TF-11
Franklin Templeton Variable Insurance Products Trust
Statement of Investments, December 31, 2005 (continued)
| | | | | | | |
| Templeton Foreign Securities Fund | | Country | | Shares | | Value |
Common Stocks (cont.) | | | | | | | |
Industrial Conglomerates 2.7% | | | | | | | |
Hutchison Whampoa Ltd. | | Hong Kong | | 1,962,000 | | $ | 18,687,160 |
Siemens AG | | Germany | | 404,770 | | | 34,678,761 |
Smiths Group PLC | | United Kingdom | | 1,293,800 | | | 23,283,104 |
| | | | | | |
|
|
| | | | | | | | 76,649,025 |
| | | | | | |
|
|
Insurance 5.0% | | | | | | | |
ACE Ltd. | | Bermuda | | 558,903 | | | 29,867,776 |
AXA SA | | France | | 479,792 | | | 15,483,728 |
bAXA SA, 144A | | France | | 40,480 | | | 1,306,361 |
Old Mutual PLC | | South Africa | | 5,240,370 | | | 14,853,521 |
Sompo Japan Insurance Inc. | | Japan | | 1,694,000 | | | 22,891,892 |
Swiss Reinsurance Co. | | Switzerland | | 493,655 | | | 36,148,134 |
XL Capital Ltd., A | | Bermuda | | 301,458 | | | 20,312,240 |
| | | | | | |
|
|
| | | | | | | | 140,863,652 |
| | | | | | |
|
|
Leisure Equipment & Products 0.9% | | | | | | | |
Fuji Photo Film Co. Ltd. | | Japan | | 786,800 | | | 25,997,797 |
| | | | | | |
|
|
Media 5.5% | | | | | | | |
British Sky Broadcasting Group PLC | | United Kingdom | | 5,060,700 | | | 43,228,671 |
Pearson PLC | | United Kingdom | | 2,229,000 | | | 26,364,820 |
Reed Elsevier NV | | Netherlands | | 1,542,120 | | | 21,542,537 |
VNU NV | | Netherlands | | 1,109,540 | | | 36,791,946 |
Wolters Kluwer NV | | Netherlands | | 380,280 | | | 7,689,322 |
Yell Group PLC | | United Kingdom | | 2,000,000 | | | 18,460,428 |
| | | | | | |
|
|
| | | | | | | | 154,077,724 |
| | | | | | |
|
|
Metals & Mining 1.2% | | | | | | | |
Barrick Gold Corp. | | Canada | | 701,894 | | | 19,571,870 |
BHP Billiton Ltd. | | Australia | | 408,050 | | | 6,809,645 |
POSCO, ADR | | South Korea | | 165,547 | | | 8,196,232 |
| | | | | | |
|
|
| | | | | | | | 34,577,747 |
| | | | | | |
|
|
Multi-Utilities 1.4% | | | | | | | |
Centrica PLC | | United Kingdom | | 2,932,210 | | | 12,851,425 |
Suez SA | | France | | 861,400 | | | 26,819,909 |
| | | | | | |
|
|
| | | | | | | | 39,671,334 |
| | | | | | |
|
|
Oil, Gas & Consumable Fuels 5.2% | | | | | | | |
BP PLC | | United Kingdom | | 2,849,920 | | | 30,350,466 |
Eni SpA | | Italy | | 845,840 | | | 23,461,576 |
Repsol YPF SA | | Spain | | 1,186,541 | | | 34,653,618 |
Royal Dutch Shell PLC, B | | United Kingdom | | 1,343,941 | | | 42,960,364 |
Total SA, B | | France | | 54,077 | | | 13,584,844 |
| | | | | | |
|
|
| | | | | | | | 145,010,868 |
| | | | | | |
|
|
Paper & Forest Products 3.6% | | | | | | | |
Norske Skogindustrier ASA | | Norway | | 723,160 | | | 11,490,890 |
Sappi Ltd., ADR | | South Africa | | 1,142,840 | | | 12,948,377 |
Stora Enso OYJ, R | | Finland | | 2,819,980 | | | 38,153,401 |
UPM-Kymmene OYJ | | Finland | | 1,895,319 | | | 37,156,888 |
| | | | | | |
|
|
| | | | | | | | 99,749,556 |
| | | | | | |
|
|
TF-12
Franklin Templeton Variable Insurance Products Trust
Statement of Investments, December 31, 2005 (continued)
| | | | | | | | |
| Templeton Foreign Securities Fund | | Country | | Shares | | Value | |
Common Stocks (cont.) | | | | | | | | |
Pharmaceuticals 4.5% | | | | | | | | |
GlaxoSmithKline PLC | | United Kingdom | | 1,861,009 | | $ | 47,034,043 | |
Sanofi-Aventis | | France | | 500,723 | | | 43,865,789 | |
Shire PLC | | United Kingdom | | 928,000 | | | 11,878,537 | |
Takeda Pharmaceutical Co. Ltd. | | Japan | | 445,800 | | | 24,097,297 | |
| | | | | | |
|
|
|
| | | | | | | | 126,875,666 | |
| | | | | | |
|
|
|
Real Estate 2.8% | | | | | | | | |
Cheung Kong Holdings Ltd. | | Hong Kong | | 5,614,137 | | | 57,599,273 | |
Swire Pacific Ltd., B | | Hong Kong | | 12,648,627 | | | 22,022,720 | |
| | | | | | |
|
|
|
| | | | | | | | 79,621,993 | |
| | | | | | |
|
|
|
Road & Rail 0.3% | | | | | | | | |
East Japan Railway Co. | | Japan | | 1,100 | | | 7,558,248 | |
| | | | | | |
|
|
|
Semiconductors & Semiconductor Equipment 2.0% | | | | | | | | |
Samsung Electronics Co. Ltd. | | South Korea | | 69,750 | | | 45,623,077 | |
Taiwan Semiconductor Manufacturing Co. Ltd. | | Taiwan | | 5,757,380 | | | 10,961,761 | |
| | | | | | |
|
|
|
| | | | | | | | 56,584,838 | |
| | | | | | |
|
|
|
Software 1.4% | | | | | | | | |
aCheck Point Software Technologies Ltd. | | Israel | | 842,050 | | | 16,925,205 | |
Nintendo Co. Ltd. | | Japan | | 196,000 | | | 23,663,475 | |
| | | | | | |
|
|
|
| | | | | | | | 40,588,680 | |
| | | | | | |
|
|
|
Wireless Telecommunication Services 2.4% | | | | | | | | |
China Mobile (Hong Kong) Ltd., fgn. | | China | | 2,932,000 | | | 13,877,902 | |
SK Telecom Co. Ltd., ADR | | South Korea | | 474,820 | | | 9,634,098 | |
Vodafone Group PLC, ADR | | United Kingdom | | 1,997,440 | | | 42,885,037 | |
| | | | | | |
|
|
|
| | | | | | | | 66,397,037 | |
| | | | | | |
|
|
|
Total Common Stocks (Cost $1,925,307,466) | | | | | | | 2,399,770,377 | |
| | | | | | |
|
|
|
Preferred Stocks 1.5% | | | | | | | | |
Automobiles 0.2% | | | | | | | | |
Volkswagen AG, pfd. | | Germany | | 160,254 | | | 6,137,335 | |
| | | | | | |
|
|
|
Diversified Telecommunication Services 0.8% | | | | | | | | |
Tele Norte Leste Participacoes SA, ADR, pfd. | | Brazil | | 1,309,680 | | | 23,469,466 | |
| | | | | | |
|
|
|
Metals & Mining 0.5% | | | | | | | | |
Companhia Vale do Rio Doce, ADR, pfd., A | | Brazil | | 342,746 | | | 12,424,542 | |
| | | | | | |
|
|
|
Total Preferred Stocks (Cost $27,909,608) | | | | | | | 42,031,343 | |
| | | | | | |
|
|
|
Total Long Term Investments (Cost $1,953,217,074) | | | | | | | 2,441,801,720 | |
| | | | | | |
|
|
|
Short Term Investment (Cost $383,771,994) 13.7% | | | | | | | | |
Money Fund 13.7% | | | | | | | | |
cFranklin Institutional Fiduciary Trust Money Market Portfolio | | United States | | 383,771,994 | | | 383,771,994 | |
| | | | | | |
|
|
|
Total Investments (Cost $2,336,989,068) 100.5% | | | | | | | 2,825,573,714 | |
Other Assets, less Liabilities (0.5)% | | | | | | | (13,346,337 | ) |
| | | | | | |
|
|
|
Net Assets 100.0% | | | | | | $ | 2,812,227,377 | |
| | | | | | |
|
|
|
Selected Portfolio Abbreviations
ADR - American Depository Reciept
FDR - Foreign Depository Reciept
a Non-income producing.
| b | Security was purchased pursuant to Rule 144A under the Securities Act of 1933 and may be sold in transactions exempt from registration only to qualified institutional buyers or in a public offering registered under the Securities Act of 1933. These securities have been deemed liquid under the guidelines approved by the Trust’s Board of Trustees. At December 31, 2005, the value of these securities was $57,514,008, representing 2.05% of net assets. |
c See Note 7 regarding investments in the Franklin Institutional Fiduciary Trust Money Market Portfolio.
See notes to financial statements.
TF-13
Franklin Templeton Variable Insurance Products Trust
Financial Statements
Statement of Assets and Liabilities
December 31, 2005
| | | | |
| | | Templeton
Foreign
Securities Fund
| |
Assets: | | | | |
Investments in securities: | | | | |
Cost - Unaffiliated issuers | | $ | 1,953,217,074 | |
Cost - Sweep Money Fund (Note 7) | | | 383,771,994 | |
| | |
|
|
|
Total cost of investments | | $ | 2,336,989,068 | |
| | |
|
|
|
Value - Unaffiliated issuers | | $ | 2,441,801,720 | |
Value - Sweep Money Fund (Note 7) | | | 383,771,994 | |
| | |
|
|
|
Total value of investments | | | 2,825,573,714 | |
Cash | | | 150,729 | |
Foreign currency, at value (cost $6,145,275) | | | 6,140,586 | |
Receivables: | | | | |
Investment securities sold | | | 8,840,398 | |
Capital shares sold | | | 2,734,874 | |
Dividends | | | 3,516,167 | |
| | |
|
|
|
Total assets | | | 2,846,956,468 | |
| | |
|
|
|
Liabilities: | | | | |
Payables: | | | | |
Investment securities purchased | | | 29,943,347 | |
Capital shares redeemed | | | 1,781,684 | |
Affiliates | | | 2,536,429 | |
Accrued expenses and other liabilities | | | 467,631 | |
| | |
|
|
|
Total liabilities | | | 34,729,091 | |
| | |
|
|
|
Net assets, at value | | $ | 2,812,227,377 | |
| | |
|
|
|
Net assets consist of: | | | | |
Paid-in capital | | $ | 2,285,910,176 | |
Undistributed net investment income | | | 39,493,779 | |
Net unrealized appreciation (depreciation) | | | 488,620,913 | |
Accumulated net realized gain (loss) | | | (1,797,491 | ) |
| | |
|
|
|
Net assets, at value | | $ | 2,812,227,377 | |
| | |
|
|
|
Class 1: | | | | |
Net assets, at value | | $ | 531,774,693 | |
| | |
|
|
|
Shares outstanding | | | 33,577,474 | |
| | |
|
|
|
Net asset value and offering price per share | | $ | 15.84 | |
| | |
|
|
|
Class 2: | | | | |
Net assets, at value | | $ | 2,232,990,435 | |
| | |
|
|
|
Shares outstanding | | | 142,908,382 | |
| | |
|
|
|
Net asset value and offering price per share | | $ | 15.63 | |
| | |
|
|
|
Class 3: | | | | |
Net assets, at value | | $ | 47,462,249 | |
| | |
|
|
|
Shares outstanding | | | 3,041,719 | |
| | |
|
|
|
Net asset value and offering price per sharea | | $ | 15.60 | |
| | |
|
|
|
aRedemption price is equal to net asset value less any redemption fees retained by the Fund.
See notes to financial statements.
TF-14
Franklin Templeton Variable Insurance Products Trust
Financial Statements (continued)
Statement of Operations
for the year ended December 31, 2005
| | | | |
| | | Templeton
Foreign
Securities Fund
| |
Investment income: | | | | |
Dividends: (net of foreign taxes of $4,372,409) | | | | |
Unaffiliated issuers | | $ | 56,025,702 | |
Sweep Money Fund (Note 7) | | | 9,496,331 | |
Other income (Note 9) | | | 30,606 | |
| | |
|
|
|
Total investment income | | | 65,552,639 | |
| | |
|
|
|
Expenses: | | | | |
Management fees (Note 3a) | | | 13,997,281 | |
Administrative fees (Note 3b) | | | 2,327,271 | |
Distribution fees: (Note 3c) | | | | |
Class 2 | | | 4,503,381 | |
Class 3 | | | 74,412 | |
Unaffiliated transfer agent fees | | | 14,941 | |
Custodian fees (Note 4) | | | 691,246 | |
Reports to shareholders | | | 923,637 | |
Professional fees | | | 76,335 | |
Trustees’ fees and expenses | | | 11,918 | |
Other | | | 54,397 | |
| | |
|
|
|
Total expenses | | | 22,674,819 | |
Expense reductions (Note 4) | | | (1,561 | ) |
| | |
|
|
|
Net expenses | | | 22,673,258 | |
| | |
|
|
|
Net investment income | | | 42,879,381 | |
| | |
|
|
|
Realized and unrealized gains (losses): | | | | |
Net realized gain (loss) from: | | | | |
Investments | | | 106,539,675 | |
Foreign currency transactions | | | (1,266,372 | ) |
| | |
|
|
|
Net realized gain (loss) | | | 105,273,303 | |
| | |
|
|
|
Net change in unrealized appreciation (depreciation) on: | | | | |
Investments | | | 103,979,634 | |
Translation of assets and liabilities denominated in foreign currencies | | | (356,511 | ) |
Change in deferred taxes on unrealized appreciation | | | 169,581 | |
| | |
|
|
|
Net change in unrealized appreciation (depreciation) | | | 103,792,704 | |
| | |
|
|
|
Net realized and unrealized gain (loss) | | | 209,066,007 | |
| | |
|
|
|
Net increase (decrease) in net assets resulting from operations | | $ | 251,945,388 | |
| | |
|
|
|
See notes to financial statements.
TF-15
Franklin Templeton Variable Insurance Products Trust
Financial Statements (continued)
Statements of Changes in Net Assets
| | | | | | | | |
| | | Templeton Foreign Securities Fund
| |
| | | Year Ended December 31,
| |
| | | 2005 | | | 2004 | |
| | |
| |
Increase (decrease) in net assets: | | | | | | | | |
Operations: | | | | | | | | |
Net investment income | | $ | 42,879,381 | | | $ | 26,110,404 | |
Net realized gain (loss) from investments and foreign currency transactions | | | 105,273,303 | | | | 39,378,493 | |
Net change in unrealized appreciation (depreciation) on investments, translation of assets and liabilities denominated in foreign currencies and deferred taxes | | | 103,792,704 | | | | 215,691,763 | |
| | |
| |
Net increase (decrease) in net assets resulting from operations | | | 251,945,388 | | | | 281,180,660 | |
| | |
| |
Distributions to shareholders from: | | | | | | | | |
Net investment income: | | | | | | | | |
Class 1 | | | (6,459,354 | ) | | | (5,478,306 | ) |
Class 2 | | | (20,723,612 | ) | | | (10,189,845 | ) |
Class 3 | | | (354,063 | ) | | | (37,708 | ) |
| | |
| |
Total distributions to shareholders | | | (27,537,029 | ) | | | (15,705,859 | ) |
| | |
| |
Capital share transactions: (Note 2) | | | | | | | | |
Class 1 | | | (19,374,244 | ) | | | (43,045,841 | ) |
Class 2 | | | 610,744,172 | | | | 605,495,077 | |
Class 3 | | | 27,501,947 | | | | 14,758,051 | |
| | |
| |
Total capital share transactions | | | 618,871,875 | | | | 577,207,287 | |
| | |
| |
Redemption fees | | | 4,290 | | | | 1,304 | |
| | |
| |
Net increase (decrease) in net assets | | | 843,284,524 | | | | 842,683,392 | |
Net assets: | | | | | | | | |
Beginning of year | | | 1,968,942,853 | | | | 1,126,259,461 | |
| | |
| |
End of year | | $ | 2,812,227,377 | | | $ | 1,968,942,853 | |
| | |
| |
Undistributed net investment income included in net assets: | | | | | | | | |
End of year | | $ | 39,493,779 | | | $ | 24,955,358 | |
| | |
| |
See notes to financial statements.
TF-16
Franklin Templeton Variable Insurance Products Trust
Notes to Financial Statements
Templeton Foreign Securities Fund
1. ORGANIZATION AND SIGNIFICANT ACCOUNTING POLICIES
Franklin Templeton Variable Insurance Products Trust (the Trust) is registered under the Investment Company Act of 1940 as an open-end investment company, consisting of twenty-two separate series. The Templeton Foreign Securities Fund (the Fund) included in this report is diversified. The financial statements of the remaining funds in the series are presented separately. Shares of the Fund are sold only to insurance company separate accounts to fund the benefits of variable life insurance policies or variable annuity contracts.
The following summarizes the Fund’s significant accounting policies.
a. Security Valuation
Securities listed on a securities exchange or on the NASDAQ National Market System are valued at the last quoted sale price or the official closing price of the day, respectively. Over-the-counter securities and listed securities for which there is no reported sale are valued within the range of the most recent quoted bid and ask prices. Securities that trade in multiple markets or on multiple exchanges are valued according to the broadest and most representative market. Investments in open-end mutual funds are valued at the closing net asset value.
Foreign securities are valued as of the close of trading on the foreign stock exchange on which the security is primarily traded, or the NYSE, whichever is earlier. If no sale is reported at that time, the foreign security will be valued within the range of the most recent quoted bid and ask prices. The value is then converted into its U.S. dollar equivalent at the foreign exchange rate in effect at the close of the NYSE on the day that the value of the foreign security is determined.
The Trust has procedures to determine the fair value of individual securities and other assets for which market prices are not readily available or which may not be reliably priced. Methods for valuing these securities may include: fundamental analysis, matrix pricing, discounts from market prices of similar securities, or discounts applied due to the nature and duration of restrictions on the disposition of the securities. Due to the inherent uncertainty of valuations of such securities, the fair values may differ significantly from the values that would have been used had a ready market for such investments existed. Occasionally, events occur between the time at which trading in a security is completed and the close of the NYSE that might call into question the availability (including the reliability) of the value of a portfolio security held by the Fund. If such an event occurs, the securities may be valued using fair value procedures, which may include the use of independent pricing services. All security valuation procedures are approved by the Trust’s Board of Trustees.
b. Foreign Currency Translation
Portfolio securities and other assets and liabilities denominated in foreign currencies are translated into U.S. dollars based on the exchange rate of such currencies against U.S. dollars on the date of valuation. Purchases and sales of securities, income and expense items denominated in foreign currencies are translated into U.S. dollars at the exchange rate in effect on the transaction date. Occasionally, events may impact the availability or reliability of foreign exchange rates used to convert the U.S. dollar equivalent value. If such an event occurs, the foreign exchange rate will be valued at fair value using procedures established and approved by the Trust’s Board of Trustees.
The Fund does not separately report the effect of changes in foreign exchange rates from changes in market prices on securities held. Such changes are included in net realized and unrealized gain or loss from investments on the Statement of Operations.
Realized foreign exchange gains or losses arise from sales of foreign currencies, currency gains or losses realized between the trade and settlement dates on securities transactions and the difference between the recorded amounts of dividends, interest, and foreign withholding taxes and the U.S. dollar equivalent of the amounts actually received or paid. Net unrealized foreign exchange gains and losses arise from changes in foreign exchange rates on foreign denominated assets and liabilities other than investments in securities held at the end of the reporting period.
TF-17
Franklin Templeton Variable Insurance Products Trust
Notes to Financial Statements (continued)
Templeton Foreign Securities Fund
1. ORGANIZATION AND SIGNIFICANT ACCOUNTING POLICIES (continued)
c. Foreign Currency Contracts
When the Fund purchases or sells foreign securities it may enter into foreign exchange contracts to minimize foreign exchange risk from the trade date to the settlement date of the transactions. A foreign exchange contract is an agreement between two parties to exchange different currencies at an agreed upon exchange rate on a specified date. Realized and unrealized gains and losses on these contracts are included in the Statement of Operations.
The risks of these contracts include movement in the values of the foreign currencies relative to the U.S. dollar and the possible inability of the counterparties to fulfill their obligations under the contracts, which may be in excess of the amount reflected in the Statement of Assets and Liabilities.
d. Income and Deferred Taxes
No provision has been made for U.S. income taxes because the Fund’s policy is to continue to qualify as a regulated investment company under the Internal Revenue Code and to distribute to shareholders substantially all of its taxable income and net realized gains.
The Fund is subject to a tax imposed on net realized gains on securities of certain foreign countries. The Fund records an estimated deferred tax liability for net unrealized gains on these securities in an amount that would be payable if the securities were disposed of on the valuation date.
Foreign securities held by the Fund may be subject to foreign taxation. Foreign taxes, if any, are recorded based on the tax regulations and rates that exist in the foreign markets in which the Fund invests.
e. Security Transactions, Investment Income, Expenses and Distributions
Security transactions are accounted for on trade date. Realized gains and losses on security transactions are determined on a specific identification basis. Interest income and estimated expenses are accrued daily. Dividend income is recorded on the ex-dividend date except that certain dividends from foreign securities are recognized as soon as the Fund is notified of the ex-dividend date. Distributions to shareholders are recorded on the ex-dividend date and are determined according to income tax regulations (tax basis). Such distributions are reinvested in additional shares of the Fund. Distributable earnings determined on a tax basis may differ from earnings recorded in accordance with generally accepted accounting principles. These differences may be permanent or temporary. Permanent differences are reclassified among capital accounts to reflect their tax character. These reclassifications have no impact on net assets or the results of operations. Temporary differences are not reclassified, as they may reverse in subsequent periods.
Common expenses incurred by the Trust are allocated among the funds based on the ratio of net assets of each Fund to the combined net assets of the Trust. Fund specific expenses are charged directly to the fund that incurred the expense.
Realized and unrealized gains and losses and net investment income, other than class specific expenses, are allocated daily to each class of shares based upon the relative proportion of net assets of each class.
f. Accounting Estimates
The preparation of financial statements in accordance with accounting principles generally accepted in the United States of America requires management to make estimates and assumptions that affect the reported amounts of assets and liabilities at the date of the financial statements and the amounts of income and expenses during the reporting period. Actual results could differ from those estimates.
TF-18
Franklin Templeton Variable Insurance Products Trust
Notes to Financial Statements (continued)
Templeton Foreign Securities Fund
1. ORGANIZATION AND SIGNIFICANT ACCOUNTING POLICIES (continued)
g. Redemption Fees
Redemptions and exchanges of Class 3 shares held 60 days or less may be subject to the Fund’s redemption fee, which is 1% of the amount redeemed. Such fees are retained by the Fund and accounted for as an addition to paid-in capital.
h. Guarantees and Indemnifications
Under the Trust’s organizational documents, its officers and trustees are indemnified by the Trust against certain liabilities arising out of the performance of their duties to the Trust. Additionally, in the normal course of business, the Trust enters into contracts with service providers that contain general indemnification clauses. The Trust’s maximum exposure under these arrangements is unknown as this would involve future claims that may be made against the Trust that have not yet occurred. However, based on experience, the Trust expects the risk of loss to be remote.
2. SHARES OF BENEFICIAL INTEREST
The Fund offers three classes of shares: Class 1, Class 2 and Class 3. Effective May 1, 2004 the Fund began offering a new class of shares, Class 3. Each class of shares differs by its distribution fees, voting rights on matters affecting a single class and its exchange privilege.
At December 31, 2005, there were an unlimited number of shares authorized ($0.01 par value). Transactions in the Fund’s shares were as follows:
| | | | | | | | | | | | | | |
| | | Year Ended December 31,
| |
| | | 2005
| | | 2004
| |
| Class 1 Shares: | | Shares
| | | Amount
| | | Shares
| | | Amount
| |
Shares sold | | 3,758,655 | | | $ | 55,211,998 | | | 2,258,527 | | | $ | 29,175,787 | |
Shares issued in reinvestment of distributions | | 453,606 | | | | 6,459,354 | | | 437,215 | | | | 5,478,306 | |
Shares redeemed | | (5,489,770 | ) | | | (81,045,596 | ) | | (6,039,270 | ) | | | (77,699,934 | ) |
| | |
| |
Net increase (decrease) | | (1,277,509 | ) | | $ | (19,374,244 | ) | | (3,343,528 | ) | | $ | (43,045,841 | ) |
| | |
| |
| Class 2 Shares: | | | | | | | | | | | | |
Shares sold | | 51,344,360 | | | $ | 745,826,623 | | | 59,591,849 | | | $ | 761,455,379 | |
Shares issued in reinvestment of distributions | | 1,472,894 | | | | 20,723,612 | | | 821,762 | | | | 10,189,845 | |
Shares redeemed | | (10,646,257 | ) | | | (155,806,063 | ) | | (13,067,398 | ) | | | (166,150,147 | ) |
| | |
| |
Net increase (decrease) | | 42,170,997 | | | $ | 610,744,172 | | | 47,346,213 | | | $ | 605,495,077 | |
| | |
| |
| Class 3 Shares:a | | | | | | | | | | | | |
Shares sold | | 2,107,457 | | | $ | 30,752,443 | | | 1,203,190 | | | $ | 15,372,770 | |
Shares issued in reinvestment of distributions | | 25,189 | | | | 353,916 | | | 3,035 | | | | 37,599 | |
Shares redeemed | | (244,990 | ) | | | (3,604,412 | ) | | (52,162 | ) | | | (652,318 | ) |
| | |
| |
Net increase (decrease) | | 1,887,656 | | | $ | 27,501,947 | | | 1,154,063 | | | $ | 14,758,051 | |
| | |
| |
| a | For the period May 1, 2004 (effective date) to December 31, 2004. |
TF-19
Franklin Templeton Variable Insurance Products Trust
Notes to Financial Statements (continued)
Templeton Foreign Securities Fund
3. TRANSACTIONS WITH AFFILIATES
Franklin Resources, Inc. is the holding company for various subsidiaries that together are referred to as Franklin Templeton Investments. Certain officers and trustees of the Trust are also officers and/or directors of the following subsidiaries:
| | |
| Subsidiary | | Affiliation |
Templeton Investment Counsel, LLC (TIC) | | Investment manager |
Franklin Templeton Services, LLC (FT Services) | | Administrative manager |
Franklin Templeton Distributors, Inc. (Distributors) | | Principal underwriter |
Franklin Templeton Investor Services, LLC (Investor Services) | | Transfer agent |
a. Management Fees
The Fund pays an investment management fee to TIC based on the average daily net assets of the Fund as follows:
| | |
| Annualized Fee Rate | | Net Assets |
| 0.750% | | Up to and including $200 million |
| 0.675% | | Over $200 million, up to and including $1.3 billion |
| 0.600% | | In excess of $1.3 billion |
b. Administrative Fees
The Fund pays an administrative fee to FT Services based on the average daily net assets of the Fund as follows:
| | |
| Annualized Fee Rate | | Net Assets |
| 0.150% | | Up to and including $200 million |
| 0.135% | | Over $200 million, up to and including $700 million |
| 0.100% | | Over $700 million, up to and including $1.2 billion |
| 0.075% | | In excess of $1.2 billion |
c. Distribution Fees
The Fund’s Board of Trustees has adopted distribution plans for Class 2 and Class 3 shares pursuant to Rule 12b-1 under the 1940 Act. Under the Fund’s compensation distribution plans, the Fund pays Distributors for costs incurred in connection with the sale and distribution of the Fund’s shares up to 0.35% per year of its average daily net assets of each class. The Board of Trustees has set the current rate at 0.25% per year.
d. Transfer Agent Fees
Investor Services, under terms of an agreement, performs shareholder servicing for the Fund and is not paid by the Fund for the services.
4. EXPENSE OFFSET ARRANGEMENT
The Fund has entered into an arrangement with its custodian whereby credits realized as a result of uninvested cash balances are used to reduce a portion of the Fund’s custodian expenses. During the year ended December 31, 2005, the custodian fees were reduced as noted in the Statement of Operations.
TF-20
Franklin Templeton Variable Insurance Products Trust
Notes to Financial Statements (continued)
Templeton Foreign Securities Fund
5. INCOME TAXES
At December 31, 2005, the Fund had tax basis capital losses of $1,301,670 expiring on December 31, 2011, which may be carried over to offset future capital gains, if any. During the year ended December 31, 2005, the Fund utilized $106,539,675 of capital loss carryforwards.
For tax purposes, realized currency losses, occurring subsequent to October 31, may be deferred and treated as occurring on the first day of the following fiscal year. At December 31, 2005, the Fund deferred realized currency losses of $495,819.
The tax character of distributions paid during the years ended December 31, 2005 and 2004, was as follows:
| | | | | | |
| | | 2005
| | 2004
|
Distributions paid from ordinary income | | $ | 27,537,029 | | $ | 15,705,859 |
| | |
|
|
At December 31, 2005, the cost of investments, net unrealized appreciation (depreciation) and undistributed ordinary income for income tax purposes were as follows:
| | | | |
Cost of investments | | $ | 2,336,989,068 | |
| | |
|
|
|
| |
Unrealized appreciation | | $ | 556,170,295 | |
Unrealized depreciation | | | (67,585,649 | ) |
| | |
|
|
|
Net unrealized appreciation (depreciation) | | $ | 488,584,646 | |
| | |
|
|
|
Distributable earnings - undistributed ordinary income | | $ | 39,493,779 | |
| | |
|
|
|
Net investment income and realized gains (losses) differs for financial statement and tax purposes primarily due to differing treatments of foreign currency transactions.
6. INVESTMENT TRANSACTIONS
Purchases and sales of investments (excluding short term securities) for the year ended December 31, 2005, aggregated $831,021,504 and $293,046,003, respectively.
7. INVESTMENTS IN FRANKLIN INSTITUTIONAL FIDUCIARY TRUST MONEY MARKET PORTFOLIO
The Fund may invest in the Franklin Institutional Fiduciary Trust Money Market Portfolio (the Sweep Money Fund), an open-end investment company managed by Franklin Advisers Inc. (an affiliate of the investment manager). Management fees paid by the Fund are reduced on assets invested in the Sweep Money Fund, in an amount not to exceed the management and administrative fees paid by the Sweep Money Fund.
TF-21
Franklin Templeton Variable Insurance Products Trust
Notes to Financial Statements (continued)
Templeton Foreign Securities Fund
8. CONCENTRATION OF RISK
Investing in foreign securities may include certain risks and considerations not typically associated with investing in U.S. securities, such as fluctuating currency values and changing local and regional economic, political and social conditions, which may result in greater market volatility. In addition, certain foreign securities may not be as liquid as U.S. securities.
9. REGULATORY MATTERS
As part of various investigations by a number of federal, state, and foreign regulators and governmental entities, relating to certain practices in the mutual fund industry, including late trading, market timing and marketing support payments to securities dealers who sell fund shares, Franklin Resources, Inc. and certain of its subsidiaries (collectively, the “Company”), entered into settlements with certain of those regulators.
Specifically, the Company entered into settlements with the Securities and Exchange Commission (“SEC”) concerning market timing (the “August 2, 2004 SEC Order”) and marketing support payments to securities dealers who sell fund shares (the “December 13, 2004 SEC Order”) and with the California Attorney General’s Office (“CAGO”) concerning marketing support payments to securities dealers who sell fund shares (the “CAGO Settlement”). Under the terms of the settlements with the SEC and the CAGO, the Company retained an Independent Distribution Consultant (“IDC”) to develop a plan for distribution of the respective settlement monies. The CAGO approved the distribution plan under the CAGO Settlement and, in accordance with the terms and conditions of that settlement, the monies were disbursed to the relevant funds and are recorded as other income in the current period. The SEC has not yet approved the distribution plan pertaining to the December 13, 2004 SEC Order. When approved, disbursements of settlement monies will be made promptly to the relevant funds, in accordance with the terms and conditions of that order. The IDC continues to develop the plan of distribution under the August 2, 2004 SEC Order that resolved the SEC’s market timing investigation.
In addition, the Company, as well as most of the mutual funds within Franklin Templeton Investments and certain current or former officers, directors, and/or employees, have been named in private lawsuits (styled as shareholder class actions, or as derivative actions on behalf of either the named funds or Franklin Resources, Inc.) relating to the industry practices referenced above, as well as to allegedly excessive advisory fees, commissions, and/or 12b-1 fees. The lawsuits were filed in different courts throughout the country. Many of those suits are now pending in a multi-district litigation in the United States District Court for the District of Maryland.
The Company and fund management strongly believe that the claims made in each of the private lawsuits referenced above are without merit and intend to defend against them vigorously. The Company cannot predict with certainty the eventual outcome of these lawsuits, nor whether they will have a material negative impact on the Company. If it is determined that the Company bears responsibility for any unlawful or inappropriate conduct that caused losses to the Trust, it is committed to making the Trust or their shareholders whole, as appropriate.
TF-22
Franklin Templeton Variable Insurance Products Trust
Templeton Foreign Securities Fund
Report of Independent Registered Public Accounting Firm
To the Board of Trustees and Shareholders of
Franklin Templeton Variable Insurance Products Trust
In our opinion, the accompanying statement of assets and liabilities, including the statement of investments, and the related statements of operations and of changes in net assets and the financial highlights present fairly, in all material respects, the financial position of Templeton Foreign Securities Fund (one of the funds constituting Franklin Templeton Variable Insurance Products Trust, hereafter referred to as the “Fund”) at December 31, 2005, the results of its operations for the year then ended, the changes in its net assets for each of the two years in the period then ended and the financial highlights for each of the periods presented, in conformity with accounting principles generally accepted in the United States of America. These financial statements and financial highlights (hereafter referred to as “financial statements”) are the responsibility of the Fund’s management; our responsibility is to express an opinion on these financial statements based on our audits. We conducted our audits of these financial statements in accordance with the standards of the Public Company Accounting Oversight Board (United States). Those standards require that we plan and perform the audit to obtain reasonable assurance about whether the financial statements are free of material misstatement. An audit includes examining, on a test basis, evidence supporting the amounts and disclosures in the financial statements, assessing the accounting principles used and significant estimates made by management, and evaluating the overall financial statement presentation. We believe that our audits, which included confirmation of securities at December 31, 2005, by correspondence with the custodian and brokers, provide a reasonable basis for our opinion.
PricewaterhouseCoopers LLP
San Francisco, California
February 10, 2006
TF-23
Franklin Templeton Variable Insurance Products Trust
Tax Designation (unaudited)
Templeton Foreign Securities Fund
At December 31, 2005, more than 50% of the Fund’s total assets were invested in securities of foreign issuers. In most instances, foreign taxes were withheld from dividends paid to the Fund on these investments. The Fund elects to treat foreign taxes paid as allowed under Section 853 of the Internal Revenue Code. This election will allow shareholders of record in June 2006, to treat their proportionate share of foreign taxes paid by the Fund as having been paid directly by them. The shareholder shall consider these amounts as foreign taxes paid in the tax year in which they receive the Fund distribution.
The foreign tax information will be disclosed in the June 30, 2006, semi-annual report of the Fund.
TF-24
TEMPLETON GLOBAL ASSET ALLOCATION FUND
This annual report for Templeton Global Asset Allocation Fund covers the fiscal year ended December 31, 2005.
Performance Summary as of 12/31/05
Average annual total return of Class 1 shares* represents the average annual change in value, assuming reinvestment of dividends and capital gains. Average returns smooth out variations in returns, which can be significant; they are not the same as year-by-year results.
Periods ended 12/31/05
| | | | | | |
| | | 1-Year | | 5-Year | | 10-Year |
Average Annual Total Return | | +3.85% | | +6.63% | | +9.51% |
*Performance prior to the 5/1/00 merger reflects historical performance of Templeton Asset Allocation Fund.
Total Return Index Comparison
for Hypothetical $10,000 Investment (1/1/96–12/31/05)
The graph below shows the change in value of a hypothetical $10,000 investment in the Fund over the indicated period and includes reinvestment of any income or distributions. The Fund’s performance* is compared to the performance of the Morgan Stanley Capital International (MSCI) All Country (AC) World Index and the J.P. Morgan (JPM) Global Government Bond Index (GGBI). One cannot invest directly in an index, nor is an index representative of the Fund’s portfolio. Please see Important Notes to Performance Information preceding the Fund Summaries.
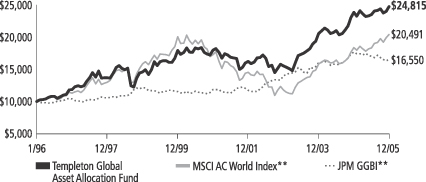
**Sources: Standard & Poor’s Micropal; J.P. Morgan. Please see Index Descriptions following the Fund Summaries.
Templeton Global Asset Allocation Fund – Class 1
Performance reflects the Fund’s Class 1 operating expenses, but does not include any contract fees, expenses or sales charges. If they had been included, performance would be lower. These charges and deductions, particularly for variable life policies, can have a significant effect on contract values and insurance benefits. See the contract prospectus for a complete description of these expenses, including sales charges.
Performance data represent past performance, which does not guarantee future results. Investment return and principal value will fluctuate, and you may have a gain or loss when you sell your shares. Current performance may differ from figures shown.
TGA-1
Fund Goal and Main Investments: Templeton Global Asset Allocation Fund seeks high total return. The Fund normally invests in equity securities of companies of any country, debt securities of companies and governments of any country, and in money market instruments. The Fund invests substantially to primarily in equity securities and may invest in high yield, lower-rated bonds.
Performance Overview
You can find the Fund’s one-year total return in the Performance Summary. The Fund underperformed its broad equity benchmark, the MSCI AC World Index, which returned +11.37% for the year under review, while outperforming its fixed income benchmark, the JPM GGBI, which had a -6.53% total return during the same period.1
Economic and Market Overview
The global economy overcame fears of derailment generated by higher energy costs and advanced at a solid clip during 2005, with signs of firming recoveries in Europe and Japan. Excluding the volatile energy and food sectors, inflation remained relatively subdued worldwide, and monetary policy remained fairly accommodative. The U.S. Federal Reserve Board (Fed) raised the short-term federal funds target rate with eight quarter-point increases, bringing it to 4.25%. The European Central Bank (ECB) made one quarter-point rise in short-term rates, its first increase after keeping rates at historically low levels for more than two and a half years. Even after the increases, both rates remained at levels considered accommodative for economic growth.
Strong demand for oil sustained high prices during most of the year, while prices for other commodities such as industrial metals were also high, led by copper, whose contract price rose 45.4% during 2005.2 This contributed to economic growth in countries such as Australia and Canada, and emerging markets in Asia and Latin America that are tied to mining and industrial commodities.
In this environment, global equity markets performed strongly, particularly outside the U.S. One-year total return for the MSCI AC World ex US Index was +17.11% in U.S. dollar terms.3 By comparison the total
1. Sources: Standard & Poor’s Micropal; J.P. Morgan. One cannot invest directly in an index, nor is an index representative of the Fund’s portfolio. Please see Index Descriptions following the Fund Summaries.
2. Source: New York Mercantile Exchange.
3. Source: Standard & Poor’s Micropal. Please see Index Descriptions following the Fund Summaries.
Fund Risks: The Fund’s investments in stocks offer the potential for long-term gains but can be subject to short-term up-and-down price movements. Foreign investing, especially in emerging markets, involves additional risks including currency fluctuations, economic instability, and social and political developments. Because the Fund invests in bonds and other debt obligations, the Fund’s share price and yield will be affected by interest rate movements. Bond prices generally move in the opposite direction from interest rates. Thus, as the prices of bonds in the Fund adjust to a rise in interest rates, the Fund’s share price may decline. High yield, lower-rated (junk) bonds generally have greater price swings and higher default risks. The Fund’s prospectus also includes a description of the main investment risks.
TGA-2
return for the MSCI USA Index was +5.72%.3 In terms of sectors, energy and materials led equity market performance, and telecommunication services and consumer-related sectors lagged.
Among developed countries, the Japanese equity market performed well, returning +44.70% in local currency terms for the year under review.4 However, this market benefited primarily from investors outside Japan, and the return was significantly less (+25.62%) after conversion into U.S. dollars.4 In contrast, the conversion into dollars enhanced equity market returns in Brazil (+57.04%), Mexico (+49.11%) and South Korea (+58.00%).4 At the beginning of the year, the consensus of many analysts appeared to be that the U.S. dollar would decline in value relative to major currencies. In fact, for the year the dollar appreciated versus the yen, the euro, the pound and most other currencies.
Consistent with strong economic growth and in particular solid consumption trends, U.S. imports exceeded exports, driving the U.S. trade balance to a $64 billion monthly deficit level by November 2005.5 Although high oil prices negatively impacted the deficit, the underlying trade balance (not including oil) also deteriorated, largely as a result of a widening trade deficit with the Pacific Rim region. Furthermore, the U.S. current account deficit widened to 6.2% of gross domestic product (GDP) in third quarter 2005 versus 5.7% a year earlier.5
In contrast to the U.S., Asia generated trade and current account surpluses. These surpluses facilitated foreign reserve accumulation, most notably in China. This foreign reserve buildup combined with international political pressure prompted the Chinese government to revalue the yuan and move from its U.S. dollar peg to a managed float versus a basket of undisclosed global currencies. Overall, aggregate foreign and domestic demand among Asian economies rose over the Fund’s fiscal year. Asian economic growth accelerated and some regional interest rates began to rise.
Central European economies benefited from firmer growth conditions in the euro zone. GDP growth rose in Poland and Slovakia. Prior fiscal reforms and prudent macroeconomic policies enabled Slovakia to join ERMII, which is the precursor to adopting the euro, in the fourth quarter. Economic conditions in Norway and Sweden remained characterized by significantly large current account surpluses and better
4. Source: Standard & Poor’s Micropal. Individual country market returns are measured by MSCI country-specific indexes.
5. Source: U.S. Department of Commerce.
What is a current account?
A current account is that part of the balance of payments where all of one country’s international transactions in goods and services are recorded.
What is balance of payments?
Balance of payments is a record of all of a country’s exports and imports of goods and services, borrowing and lending with the rest of the world during a particular time period. It helps a country evaluate its competitive strengths and weaknesses and forecast the strength of its currency.
TGA-3
domestic growth conditions, led by labor market improvement. Correspondingly, Norway’s central bank raised interest rates during the period and Sweden’s paused after reducing rates earlier in the period.
Investment Strategy
Our investment philosophy is bottom-up, value-oriented and long-term. In choosing equity investments, we will focus on the market price of a company’s securities relative to our evaluation of the company’s potential long-term earnings, asset value and cash flow. Among factors we may consider are a company’s historical value measures, including price/earnings ratio, profit margins and liquidation value.
In choosing debt investments, we allocate our assets among issuers, geographic regions and currencies based upon our assessment of relative interest rates among currencies, our outlook for changes in interest rates, and credit risks. With respect to debt securities, we may also from time to time make use of forward currency exchange contracts (hedging instruments) to protect against currency risk.
Manager’s Discussion
Equity
During the year under review, the Fund held investments in a broad array of holdings, sectors and countries. Fund returns received a significant boost from the industrials sector, where we were overweighted compared with the benchmark MSCI AC World Index.6 Although industrials stocks performed well, the Fund in particular benefited from our selections in the sector, allowing our industrials stake to fare better than the index’s. Strong performers among our industrials stocks were Atlas Copco, BAE Systems, Rolls-Royce Group and Vestas Wind Systems. The Fund also gained from its financials holdings.7 Notable performers included Kookmin Bank, Nomura Holdings, Mitsubishi UFJ Financial Group and Sumitomo Mitsui Financial Group. Although the Fund was underweighted in the financials sector, our stock selection boosted relative performance. In addition, although our information technology stocks were evenly weighted compared with the index, our stock selection made a positive difference.8 Standouts included Maxtor,
6. The industrials sector comprises aerospace and defense, air freight and logistics, commercial services and supplies, electrical equipment, industrial conglomerates and machinery in the Statement of Investments (SOI).
7. The financials sector comprises capital markets, consumer finance, commercial banks, diversified financial services, insurance and real estate in the SOI.
8. The information technology sector comprises communications equipment, computers and peripherals, electronic equipment and instruments, IT services, semiconductors and semiconductor equipment, and software in the SOI.
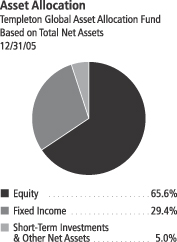
TGA-4
Western Digital, Lite-On Technology, Samsung Electronics and Satyam Computer Services. We sold Western Digital and Satyam by period-end.
There were some disappointments that detracted from our overall results during the period. Stock selection in the health care sector hurt the Fund’s performance.9 Within the sector, Abbott Laboratories, Boston Scientific, Pfizer and Tenet Healthcare underperformed.
From a country standpoint, the Fund’s exposure to Japan and the U.S. hampered overall returns. Although we were slightly overweighted in Japan, stock selection hurt Fund performance, with weak results from Hitachi, Nintendo, Mabuchi Motor and Fuji Photo Film. Similarly, the Fund suffered from our stock selection for U.S. holdings. Stocks of BearingPoint, Dow Chemical, Fannie Mae, Mattel and The DIRECTV Group declined in value and hurt Fund performance.
It is important to recognize the effect of currency movements on the Fund’s performance. In general, if the value of the U.S. dollar increases compared with a foreign currency, an investment traded in that foreign currency will decrease in value because it will be worth fewer U.S. dollars. This can have a negative effect on Fund performance. Conversely, when the U.S. dollar weakens in relation to a foreign currency, an investment traded in that foreign currency will increase in value, which can contribute to Fund performance. For the year ended December 31, 2005, the U.S. dollar rose in value relative to most non-U.S. currencies. As a result, the Fund’s performance (equity portion only) was negatively affected by the portfolio’s investment primarily in securities with non-U.S. currency exposure.
Fixed Income
Interest Rate Strategy
In anticipation of rising global interest rates, led by the U.S. Fed, we shortened the Fund’s overall duration, particularly in Asia and increasingly Europe. However, we continued to find opportunities over the past year to take advantage of lower interest rates to benefit Fund performance. Lower interest rates in Poland and Slovakia bolstered local bond market returns. While we continued to avoid the U.K.’s currency risk, the lack of exposure to the U.K. bond market detracted from relative Fund performance given the 25 basis-point (100 basis points equal one percentage point) reduction in interest rates during the year.10
9. The health care sector comprises health care equipment and supplies, health care providers and services, and pharmaceuticals in the SOI.
10. Source: Bank of England.
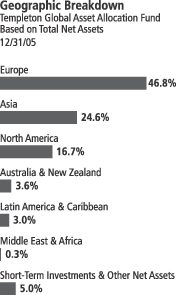
TGA-5
Currency Strategy
The dollar appreciated against its major trading partners; however, while this positive interest rate differential was increasing, the U.S. balance of payment position deteriorated, led by a larger current account deficit and greater reliance on debt financing, particularly from the government sector. That the U.S. current account deficit deteriorated significantly while the country also experienced currency strength indicated global macroeconomic imbalances. These imbalances were largely offset by sufficient global market liquidity resulting from a large, global savings pool in Asia and oil-exporting countries. Given the magnitude of global economic imbalances, particularly between the U.S. and Asia, we believe the U.S. dollar may need to weaken to help improve the U.S. current account position over the medium term.
In a relatively difficult currency environment, currency diversification was an important component of the Fund’s strong performance relative to the JPM GGBI. We significantly reduced exposure to the euro and increased allocation to non-Japan Asia, non-euro Europe and the Americas outside of the U.S. The two most notable allocation changes, and consequently, the largest currency contributors to relative performance, were the Canadian dollar and the South Korean won. Macroeconomic fundamentals remained supportive of the Canadian dollar, which appreciated 2.57% against the U.S. dollar and brought the total return of Canadian bond markets to 10.02% in U.S. dollar terms over the year.11 We continued to see more signs of domestic demand strength in Asia. One of the best examples was the acceleration of South Korean private consumption in third quarter 2005, following an improvement in consumer confidence and a rise in property prices earlier in the year. The South Korean won appreciated 2.41% against the U.S. dollar.11 The Swedish krona weakened more than the euro against the dollar, or 16.50%, and was one of the more significant currency detractors from relative performance.11 Currency performance over the period was hindered by Sweden’s lower interest rates relative to other developed markets; however, the country maintained large current account and fiscal surpluses.
Global Sovereign Debt Strategy
The Fund also purchased investment-grade and sub-investment-grade sovereign debt that typically compensates for greater credit risk by
11. Source: J.P. Morgan, Government Bond Index Monitor, December 2005.
Top 5 Sectors/Industries
Templeton Global Asset Allocation Fund
Based on Equity Securities
12/31/05
| | |
| | | % of Total
Net Assets |
| Media | | 5.0% |
| Diversified Telecommunication Services | | 4.7% |
| Commercial Banks | | 4.7% |
| Pharmaceuticals | | 4.6% |
| Insurance | | 4.1% |
The dollar value, number of shares or principal amount, and names of all portfolio holdings are listed in the Fund’s Statement of Investments.
TGA-6
offering higher yields relative to U.S. and European benchmark treasury curves. Despite rising U.S. interest rates, U.S. dollar-denominated emerging market debt continued to generate strong returns, rising 10.73% over the period, as measured by the JPM Emerging Markets Bond Index (EMBI) Global.12 Sovereign interest rate spreads narrowed from 347 basis points greater than the U.S. Treasury market at the beginning of the reporting period, to 237 basis points by period-end. Regionally, Latin American sovereign debt rose 10.88%, eastern European 10.91% and Asian 11.39%.12 Euro-denominated markets also rose during the period, gaining 7.07% in euro terms as measured by the JPM Euro EMBI Global, yet declined in U.S. dollar terms given the euro’s volatility.12 We sought to take advantage of strength in sovereign debt prices to reduce allocations to U.S. dollar-denominated credit, particularly in Venezuela and Ukraine.
Thank you for your participation in Templeton Global Asset Allocation Fund. We look forward to serving your future investment needs.
12. Source: J.P. Morgan, Emerging Markets Bond Index Monitor, December 2005. Please see Index Descriptions following the Fund Summaries.
The foregoing information reflects our analysis, opinions and portfolio holdings as of December 31, 2005, the end of the reporting period. The way we implement our main investment strategies and the resulting portfolio holdings may change depending on factors such as market and economic conditions. These opinions may not be relied upon as investment advice or an offer for a particular security. The information is not a complete analysis of every aspect of any market, country, industry, security or the Fund. Statements of fact are from sources considered reliable, but the adviser makes no representation or warranty as to their completeness or accuracy. Although historical performance is no guarantee of future results, these insights may help you understand our investment management philosophy.
Top 5 Country Holdings
Templeton Global Asset Allocation Fund
12/31/05
| | |
| | | % of Total
Net Assets |
| U.S. | | 13.9% |
| U.K. | | 11.4% |
| South Korea | | 8.1% |
| Japan | | 7.4% |
| France | | 4.9% |
TGA-7
Fund Expenses
As an investor in a variable insurance contract (“Contract”) that indirectly provides for investment in an underlying mutual fund, you can incur transaction and/or ongoing expenses at both the Fund level and the Contract level.
| • | | Transaction expenses can include sales charges (loads) on purchases, redemption fees, surrender fees, transfer fees and premium taxes. |
| • | | Ongoing expenses can include management fees, distribution and service (12b-1) fees, contract fees, annual maintenance fees, mortality and expense risk fees and other fees and expenses. All mutual funds and Contracts have some types of ongoing expenses. |
The expenses shown in the table below are meant to highlight ongoing expenses at the Fund level only and do not include ongoing expenses at the Contract level, or transaction expenses at either the Fund or Contract level. While the Fund does not have transaction expenses, if the transaction and ongoing expenses at the Contract level were included, the expenses shown below would be higher. You should consult your Contract prospectus or disclosure document for more information.
The table shows Fund-level ongoing expenses and can help you understand these expenses and compare them with those of other mutual funds offered through the Contract. The table assumes a $1,000 investment held for the six months indicated. Please refer to the Fund prospectus for additional information on operating expenses.
Actual Fund Expenses
The first line (Actual) of the table below provides actual account values and expenses. The “Ending Account Value” is derived from the Fund’s actual return, which includes the effect of ongoing Fund expenses, but does not include the effect of ongoing Contract expenses.
You can estimate the Fund-level expenses you incurred during the period by following these steps. Of course, your account value and expenses will differ from those in this illustration:
| 1. | Divide your account value by $1,000. |
If an account had an $8,600 value, then $8,600 ÷ $1,000 = 8.6.
| 2. | Multiply the result by the number under the heading “Fund-Level Expenses Incurred During Period.” |
If Fund-Level Expenses Incurred During Period were $7.50, then 8.6 × $7.50 = $64.50.
Templeton Global Asset Allocation Fund – Class 1
TGA-8
In this illustration, the estimated expenses incurred this period at the Fund level are $64.50.
Hypothetical Example for Comparison with Other Mutual Funds
Information in the second line (Hypothetical) of the table can help you compare ongoing expenses of the Fund with those of other mutual funds offered through the Contract. This information may not be used to estimate the actual ending account balance or expenses you incurred during the period. The hypothetical “Ending Account Value” is based on the Fund’s actual expense ratio and an assumed 5% annual rate of return before expenses, which does not represent the Fund’s actual return. The figure under the heading “Fund-Level Expenses Incurred During Period” shows the hypothetical expenses your account would have incurred under this scenario. You can compare this figure with the 5% hypothetical examples that appear in shareholder reports of other funds offered through a Contract.
| | | | | | | | | |
| Class 1 | | Beginning
Account
Value 7/1/05 | | Ending
Account
Value 12/31/05 | | Fund-Level
Expenses Incurred
During Period*
7/1/05-12/31/05 |
Actual | | $ | 1,000 | | $ | 1,053.00 | | $ | 4.40 |
Hypothetical (5% return before expenses) | | $ | 1,000 | | $ | 1,020.92 | | $ | 4.33 |
*Expenses are equal to the annualized expense ratio for the Fund’s Class 1 shares (0.85%), which does not include any ongoing expenses of the Contract for which the Fund is an investment option, multiplied by the average account value over the period, multiplied by 184/365 to reflect the one-half year period.
TGA-9
Franklin Templeton Variable Insurance Products Trust
Financial Highlights
Templeton Global Asset Allocation Fund
| | | | | | | | | | | | | | | | | | | | |
| | | Year Ended December 31,
| |
| Class 1 | | 2005
| | | 2004
| | | 2003
| | | 2002
| | | 2001
| |
Per share operating performance | | | | | | | | | | | | | | | | | | | | |
(for a share outstanding throughout the year) | | | | | | | | | | | | | | | | | | | | |
Net asset value, beginning of year | | $ | 21.11 | | | $ | 18.78 | | | $ | 14.59 | | | $ | 15.51 | | | $ | 19.22 | |
| | |
|
|
|
Income from investment operations: | | | | | | | | | | | | | | | | | | | | |
Net investment incomea | | | 0.49 | | | | 0.48 | | | | 0.41 | | | | 0.39 | | | | 0.38 | c |
Net realized and unrealized gains (losses) | | | 0.28 | | | | 2.42 | | | | 4.23 | | | | (1.01 | ) | | | (2.16 | )c |
| | |
|
|
|
Total from investment operations | | | 0.77 | | | | 2.90 | | | | 4.64 | | | | (0.62 | ) | | | (1.78 | ) |
| | |
|
|
|
Less distributions from: | | | | | | | | | | | | | | | | | | | | |
Net investment income | | | (0.82 | ) | | | (0.57 | ) | | | (0.45 | ) | | | (0.30 | ) | | | (0.26 | ) |
Net realized gains | | | — | | | | — | | | | — | | | | — | | | | (1.67 | ) |
| | |
|
|
|
Total distributions | | | (0.82 | ) | | | (0.57 | ) | | | (0.45 | ) | | | (0.30 | ) | | | (1.93 | ) |
| | |
|
|
|
Net asset value, end of year | | $ | 21.06 | | | $ | 21.11 | | | $ | 18.78 | | | $ | 14.59 | | | $ | 15.51 | |
| | |
|
|
|
| | | | | |
Total returnb | | | 3.85% | | | | 15.94% | | | | 32.31% | | | | (4.17)% | | | | (9.72)% | |
Ratios/supplemental data | | | | | | | | | | | | | | | | | | | | |
Net assets, end of year (000’s) | | $ | 638,006 | | | $ | 625,728 | | | $ | 572,798 | | | $ | 425,470 | | | $ | 501,074 | |
Ratios to average net assets: | | | | | | | | | | | | | | | | | | | | |
Expenses | | | 0.85% | | | | 0.84% | | | | 0.81% | | | | 0.81% | | | | 0.81% | |
Net investment income | | | 2.36% | | | | 2.52% | | | | 2.54% | | | | 2.56% | | | | 2.28% | c |
Portfolio turnover rate | | | 26.23% | | | | 27.43% | | | | 34.25% | | | | 27.27% | | | | 35.63% | |
aBased on average daily shares outstanding.
bTotal return does not include any fees, charges or expenses imposed by the variable annuity and life insurance contracts for which the Franklin Templeton Variable Insurance Products Trust serves as an underlying investment vehicle.
cEffective January 1, 2001, the Fund adopted the provisions of the AICPA Audit and Accounting Guide for Investment Companies and began amortizing all premium and discount on fixed-income securities, as required. The effect of this change was as follows:
| | |
Net investment income per share | | $(0.018) |
Net realized and unrealized gains per share | | (0.018) |
Ratio of net investment income to average net assets | | (0.10)% |
See notes to financial statements.
TGA-10
Franklin Templeton Variable Insurance Products Trust
Financial Highlights (continued)
Templeton Global Asset Allocation Fund (continued)
| | | | | | | | | | | | | | | | | | | | |
| | | Year Ended December 31,
| |
| Class 2 | | 2005
| | | 2004
| | | 2003
| | | 2002
| | | 2001
| |
Per share operating performance | | | | | | | | | | | | | | | | | | | | |
(for a share outstanding throughout the year) | | | | | | | | | | | | | | | | | | | | |
Net asset value, beginning of year | | $ | 20.94 | | | $ | 18.64 | | | $ | 14.49 | | | $ | 15.41 | | | $ | 19.13 | |
| | |
|
|
|
Income from investment operations: | | | | | | | | | | | | | | | | | | | | |
Net investment incomea | | | 0.43 | | | | 0.43 | | | | 0.36 | | | | 0.34 | | | | 0.33 | c |
Net realized and unrealized gains (losses) | | | 0.29 | | | | 2.41 | | | | 4.20 | | | | (1.00 | ) | | | (2.15 | )c |
| | |
|
|
|
Total from investment operations | | | 0.72 | | | | 2.84 | | | | 4.56 | | | | (.66 | ) | | | (1.82 | ) |
| | |
|
|
|
Less distributions from: | | | | | | | | | | | | | | | | | | | | |
Net investment income | | | (0.78 | ) | | | (0.54 | ) | | | (0.41 | ) | | | (0.26 | ) | | | (0.23 | ) |
Net realized gains | | | — | | | | — | | | | — | | | | — | | | | (1.67 | ) |
| | |
|
|
|
Total distributions | | | (0.78 | ) | | | (0.54 | ) | | | (0.41 | ) | | | (0.26 | ) | | | (1.90 | ) |
| | |
|
|
|
Net asset value, end of year | | $ | 20.88 | | | $ | 20.94 | | | $ | 18.64 | | | $ | 14.49 | | | $ | 15.41 | |
| | |
|
|
|
| | | | | |
Total returnb | | | 3.55% | | | | 15.72% | | | | 31.95% | | | | (4.39)% | | | | (9.95)% | |
Ratios/supplemental data | | | | | | | | | | | | | | | | | | | | |
Net assets, end of year (000’s) | | $ | 68,385 | | | $ | 65,806 | | | $ | 55,754 | | | $ | 39,926 | | | $ | 38,974 | |
Ratios to average net assets: | | | | | | | | | | | | | | | | | | | | |
Expenses | | | 1.10% | | | | 1.09% | | | | 1.06% | | | | 1.06% | | | | 1.06% | |
Net investment income | | | 2.11% | | | | 2.27% | | | | 2.29% | | | | 2.31% | | | | 1.99% | c |
Portfolio turnover rate | | | 26.23% | | | | 27.43% | | | | 34.25% | | | | 27.27% | | | | 35.63% | |
aBased on average daily shares outstanding.
bTotal return does not include any fees, charges or expenses imposed by the variable annuity and life insurance contracts for which the Franklin Templeton Variable Insurance Products Trust serves as an underlying investment vehicle.
cEffective January 1, 2001, the Fund adopted the provisions of the AICPA Audit and Accounting Guide for Investment Companies and began amortizing all premium and discount on fixed-income securities, as required. The effect of this change was as follows:
| | |
Net investment income per share | | $(0.018) |
Net realized and unrealized gains per share | | (0.018) |
Ratio of net investment income to average net assets | | (0.10)% |
See notes to financial statements.
TGA-11
Franklin Templeton Variable Insurance Products Trust
Statement of Investments, December 31, 2005
| | | | | | | |
| Templeton Global Asset Allocation Fund | | Country | | Shares | | Value |
Common Stocks 65.2% | | | | | | | |
Aerospace & Defense 1.1% | | | | | | | |
BAE Systems PLC | | United Kingdom | | 667,495 | | $ | 4,383,986 |
aRolls-Royce Group PLC | | United Kingdom | | 464,247 | | | 3,414,501 |
Rolls-Royce Group PLC, B | | United Kingdom | | 15,505,849 | | | 27,344 |
| | | | | | |
|
|
| | | | | | | | 7,825,831 |
| | | | | | |
|
|
Air Freight & Logistics 0.9% | | | | | | | |
Deutsche Post AG | | Germany | | 255,240 | | | 6,200,444 |
| | | | | | |
|
|
Auto Components 0.7% | | | | | | | |
Valeo SA | | France | | 127,509 | | | 4,741,388 |
| | | | | | |
|
|
Automobiles 0.6% | | | | | | | |
Bayerische Motoren Werke AG | | Germany | | 97,480 | | | 4,269,863 |
| | | | | | |
|
|
Capital Markets 2.5% | | | | | | | |
Amvescap PLC | | United Kingdom | | 587,500 | | | 4,467,578 |
ING Groep NV | | Netherlands | | 210,732 | | | 7,309,620 |
Nomura Holdings Inc. | | Japan | | 309,600 | | | 5,928,120 |
| | | | | | |
|
|
| | | | | | | | 17,705,318 |
| | | | | | |
|
|
Chemicals 1.1% | | | | | | | |
Akzo Nobel NV | | Netherlands | | 63,665 | | | 2,950,728 |
The Dow Chemical Co. | | United States | | 116,800 | | | 5,118,176 |
| | | | | | |
|
|
| | | | | | | | 8,068,904 |
| | | | | | |
|
|
Commercial Banks 4.7% | | | | | | | |
Banco Santander Central Hispano SA | | Spain | | 445,400 | | | 5,879,248 |
DBS Group Holdings Ltd. | | Singapore | | 476,000 | | | 4,722,932 |
aKookmin Bank, ADR | | South Korea | | 119,040 | | | 8,893,478 |
Lloyds TSB Group PLC | | United Kingdom | | 343,900 | | | 2,890,273 |
Mitsubishi UFJ Financial Group Inc. | | Japan | | 202 | | | 2,738,287 |
Nordea Bank AB, FDR | | Sweden | | 480,660 | | | 5,024,529 |
Sumitomo Mitsui Financial Group Inc. | | Japan | | 269 | | | 2,848,852 |
| | | | | | |
|
|
| | | | | | | | 32,997,599 |
| | | | | | |
|
|
Commercial Services & Supplies 2.2% | | | | | | | |
R. R. Donnelley & Sons Co. | | United States | | 103,660 | | | 3,546,209 |
Rentokil Initial PLC | | United Kingdom | | 1,443,100 | | | 4,059,347 |
Securitas AB, B | | Sweden | | 472,700 | | | 7,853,049 |
| | | | | | |
|
|
| | | | | | | | 15,458,605 |
| | | | | | |
|
|
Communications Equipment 0.5% | | | | | | | |
aAvaya Inc. | | United States | | 364,440 | | | 3,888,575 |
| | | | | | |
|
|
Computers & Peripherals 1.0% | | | | | | | |
Lite-On Technology Corp. | | Taiwan | | 2,117,520 | | | 2,886,662 |
aMaxtor Corp. | | United States | | 276,400 | | | 1,918,216 |
NEC Corp. | | Japan | | 319,000 | | | 1,983,784 |
| | | | | | |
|
|
| | | | | | | | 6,788,662 |
| | | | | | |
|
|
Consumer Finance 0.3% | | | | | | | |
Fannie Mae | | United States | | 50,400 | | | 2,460,024 |
| | | | | | |
|
|
Diversified Consumer Services 0.6% | | | | | | | |
H&R Block Inc. | | United States | | 183,800 | | | 4,512,290 |
| | | | | | |
|
|
TGA-12
Franklin Templeton Variable Insurance Products Trust
Statement of Investments, December 31, 2005 (continued)
| | | | | | | |
| Templeton Global Asset Allocation Fund | | Country | | Shares | | Value |
Common Stocks (cont.) | | | | | | | |
Diversified Financial Services 1.1% | | | | | | | |
JPMorgan Chase & Co. | | United States | | 154,870 | | $ | 6,146,790 |
Morgan Stanley | | United States | | 30,900 | | | 1,753,266 |
| | | | | | |
|
|
| | | | | | | | 7,900,056 |
| | | | | | |
|
|
Diversified Telecommunication Services 4.7% | | | | | | | |
Chunghwa Telecom Co. Ltd., ADR | | Taiwan | | 141,200 | | | 2,591,020 |
France Telecom SA, ADR | | France | | 188,250 | | | 4,676,130 |
KT Corp., ADR | | South Korea | | 208,260 | | | 4,488,003 |
Nippon Telegraph & Telephone Corp. | | Japan | | 1,152 | | | 5,231,483 |
Nippon Telegraph & Telephone Corp., ADR | | Japan | | 5,680 | | | 129,561 |
Telefonica SA, ADR | | Spain | | 100,192 | | | 4,510,644 |
Telefonos de Mexico SA de CV (Telmex), L, ADR | | Mexico | | 303,716 | | | 7,495,711 |
Telenor ASA | | Norway | | 425,300 | | | 4,174,488 |
| | | | | | |
|
|
| | | | | | | | 33,297,040 |
| | | | | | |
|
|
Electric Utilities 1.7% | | | | | | | |
E.ON AG | | Germany | | 48,690 | | | 5,041,339 |
Endesa SA | | Spain | | 122,000 | | | 3,209,228 |
National Grid PLC | | United Kingdom | | 368,659 | | | 3,608,936 |
| | | | | | |
|
|
| | | | | | | | 11,859,503 |
| | | | | | |
|
|
Electrical Equipment 1.1% | | | | | | | |
Gamesa Corp. Tecnologica SA | | Spain | | 22,797 | | | 333,575 |
bGamesa Corp. Tecnologica SA, 144A | | Spain | | 281,943 | | | 4,125,499 |
a,bVestas Wind Systems AS, 144A | | Denmark | | 204,300 | | | 3,355,132 |
| | | | | | |
|
|
| | | | | | | | 7,814,206 |
| | | | | | |
|
|
Electronic Equipment & Instruments 1.8% | | | | | | | |
Hitachi Ltd. | | Japan | | 845,000 | | | 5,691,562 |
Mabuchi Motor Co. Ltd. | | Japan | | 74,700 | | | 4,145,429 |
Venture Corp. Ltd. | | Singapore | | 343,000 | | | 2,846,387 |
| | | | | | |
|
|
| | | | | | | | 12,683,378 |
| | | | | | |
|
|
Food & Staples Retailing 0.5% | | | | | | | |
Boots Group PLC | | United Kingdom | | 364,800 | | | 3,800,240 |
| | | | | | |
|
|
Food Products 1.7% | | | | | | | |
Nestle SA | | Switzerland | | 22,300 | | | 6,670,904 |
Unilever PLC | | United Kingdom | | 513,650 | | | 5,094,583 |
| | | | | | |
|
|
| | | | | | | | 11,765,487 |
| | | | | | |
|
|
Gas Utilities 1.0% | | | | | | | |
El Paso Corp. | | United States | | 607,740 | | | 7,390,118 |
| | | | | | |
|
|
Health Care Equipment & Supplies 0.7% | | | | | | | |
aBoston Scientific Corp. | | United States | | 196,230 | | | 4,805,673 |
| | | | | | |
|
|
Health Care Providers & Services 0.4% | | | | | | | |
aTenet Healthcare Corp. | | United States | | 376,600 | | | 2,884,756 |
| | | | | | |
|
|
Hotels Restaurants & Leisure 0.8% | | | | | | | |
Compass Group PLC | | United Kingdom | | 1,511,620 | | | 5,734,470 |
| | | | | | |
|
|
Household Durables 2.0% | | | | | | | |
Koninklijke Philips Electronics NV | | Netherlands | | 212,837 | | | 6,614,136 |
Sony Corp. | | Japan | | 41,300 | | | 1,686,571 |
Sony Corp., ADR | | Japan | | 136,900 | | | 5,585,520 |
| | | | | | |
|
|
| | | | | | | | 13,886,227 |
| | | | | | |
|
|
TGA-13
Franklin Templeton Variable Insurance Products Trust
Statement of Investments, December 31, 2005 (continued)
| | | | | | | |
| Templeton Global Asset Allocation Fund | | Country | | Shares | | Value |
Common Stocks (cont.) | | | | | | | |
Industrial Conglomerates 1.1% | | | | | | | |
Siemens AG, ADR | | Germany | | 30,680 | | $ | 2,625,901 |
Smiths Group PLC | | United Kingdom | | 278,600 | | | 5,013,660 |
| | | | | | |
|
|
| | | | | | | | 7,639,561 |
| | | | | | |
|
|
Insurance 4.1% | | | | | | | |
ACE Ltd. | | Bermuda | | 101,700 | | | 5,434,848 |
AXA SA | | France | | 210,734 | | | 6,800,755 |
American International Group Inc. | | United States | | 76,170 | | | 5,197,079 |
Swiss Reinsurance Co. | | Switzerland | | 95,570 | | | 6,998,161 |
XL Capital Ltd., A | | Bermuda | | 68,810 | | | 4,636,418 |
| | | | | | |
|
|
| | | | | | | | 29,067,261 |
| | | | | | |
|
|
IT Services 0.4% | | | | | | | |
aBearingPoint Inc. | | United States | | 410,000 | | | 3,222,600 |
| | | | | | |
|
|
Leisure Equipment & Products 1.0% | | | | | | | |
Fuji Photo Film Co. Ltd. | | Japan | | 142,600 | | | 4,711,853 |
Mattel Inc. | | United States | | 131,100 | | | 2,074,002 |
| | | | | | |
|
|
| | | | | | | | 6,785,855 |
| | | | | | |
|
|
Machinery 0.5% | | | | | | | |
Atlas Copco AB, A | | Sweden | | 154,890 | | | 3,450,447 |
| | | | | | |
|
|
Media 5.0% | | | | | | | |
British Sky Broadcasting Group PLC | | United Kingdom | | 783,600 | | | 6,693,538 |
aThe DIRECTV Group Inc. | | United States | | 420,900 | | | 5,943,108 |
News Corp., A | | United States | | 363,110 | | | 5,646,361 |
Pearson PLC | | United Kingdom | | 364,400 | | | 4,310,157 |
Reed Elsevier NV | | Netherlands | | 501,600 | | | 7,007,066 |
Time Warner Inc. | | United States | | 110,900 | | | 1,934,096 |
Wolters Kluwer NV | | Netherlands | | 156,115 | | | 3,156,670 |
| | | | | | |
|
|
| | | | | | | | 34,690,996 |
| | | | | | |
|
|
Metals & Mining 0.4% | | | | | | | |
POSCO, ADR | | South Korea | | 57,100 | | | 2,827,021 |
| | | | | | |
|
|
Multi-Utilities 1.0% | | | | | | | |
Centrica PLC | | United Kingdom | | 480,200 | | | 2,104,643 |
Suez SA | | France | | 159,880 | | | 4,977,904 |
| | | | | | |
|
|
| | | | | | | | 7,082,547 |
| | | | | | |
|
|
Multiline Retail 0.8% | | | | | | | |
Target Corp. | | United States | | 107,000 | | | 5,881,790 |
| | | | | | |
|
|
Oil, Gas & Consumable Fuels 2.6% | | | | | | | |
BP PLC | | United Kingdom | | 497,510 | | | 5,298,275 |
Eni SpA | | Italy | | 224,025 | | | 6,213,917 |
Royal Dutch Shell PLC, B | | United Kingdom | | 217,252 | | | 6,944,669 |
| | | | | | |
|
|
| | | | | | | | 18,456,861 |
| | | | | | |
|
|
Paper & Forest Products 1.8% | | | | | | | |
Stora Enso OYJ, R | | Finland | | 518,430 | | | 7,021,224 |
UPM-Kymmene OYJ | | Finland | | 297,480 | | | 5,831,963 |
| | | | | | |
|
|
| | | | | | | | 12,853,187 |
| | | | | | |
|
|
Pharmaceuticals 4.6% | | | | | | | |
Abbott Laboratories | | United States | | 118,000 | | | 4,652,740 |
Bristol-Myers Squibb Co. | | United States | | 217,420 | | | 4,996,311 |
TGA-14
Franklin Templeton Variable Insurance Products Trust
Statement of Investments, December 31, 2005 (continued)
| | | | | | | | | |
| Templeton Global Asset Allocation Fund | | Country | | Shares | | | Value |
Common Stocks (cont.) | | | | | | | | | |
Pharmaceuticals (cont.) | | | | | | | | | |
GlaxoSmithKline PLC | | United Kingdom | | | 290,761 | | | $ | 7,348,522 |
Pfizer Inc. | | United States | | | 129,900 | | | | 3,029,268 |
Sanofi-Aventis | | France | | | 91,000 | | | | 7,972,046 |
Takeda Pharmaceutical Co. Ltd. | | Japan | | | 84,300 | | | | 4,556,757 |
| | | | | | | | |
|
|
| | | | | | | | | | 32,555,644 |
| | | | | | | | |
|
|
Real Estate 2.5% | | | | | | | | | |
Cheung Kong Holdings Ltd. | | Hong Kong | | | 1,031,500 | | | | 10,582,864 |
Swire Pacific Ltd., A | | Hong Kong | | | 780,000 | | | | 7,001,606 |
| | | | | | | | |
|
|
| | | | | | | | | | 17,584,470 |
| | | | | | | | |
|
|
Semiconductors & Semiconductor Equipment 1.6% | | | | | | | | | |
Samsung Electronics Co. Ltd. | | South Korea | | | 16,790 | | | | 10,982,243 |
| | | | | | | | |
|
|
Software 2.7% | | | | | | | | | |
aBEA Systems Inc. | | United States | | | 247,000 | | | | 2,321,800 |
aBMC Software Inc. | | United States | | | 291,900 | | | | 5,981,031 |
aCheck Point Software Technologies Ltd. | | Israel | | | 89,590 | | | | 1,800,759 |
Nintendo Co. Ltd. | | Japan | | | 54,800 | | | | 6,616,114 |
aSynopsys Inc. | | United States | | | 128,080 | | | | 2,569,285 |
| | | | | | | | |
|
|
| | | | | | | | | | 19,288,989 |
| | | | | | | | |
|
|
Wireless Telecommunication Services 1.4% | | | | | | | | | |
SK Telecom Co. Ltd., ADR | | South Korea | | | 198,040 | | | | 4,018,232 |
Vodafone Group PLC, ADR | | United Kingdom | | | 261,430 | | | | 5,612,902 |
| | | | | | | | |
|
|
| | | | | | | | | | 9,631,134 |
| | | | | | | | |
|
|
Total Common Stocks (Cost $369,137,444) | | | | | | | | | 460,739,263 |
| | | | | | | | |
|
|
Preferred Stock (Cost $613,158) 0.4% | | | | | | | | | |
Metals & Mining 0.4% | | | | | | | | | |
Companhia Vale do Rio Doce, ADR, pfd., A | | Brazil | | | 70,240 | | | | 2,546,200 |
| | | | | | | | |
|
|
| | | |
| | | | | Principal
Amountc
| | | |
Foreign Government and Agency Securities 29.4% | | | | | | | | | |
dGovernment of Argentina, FRN, 4.005%, 8/03/12 | | Argentina | | $ | 7,600,000 | | | | 5,864,832 |
Government of Austria,
9.00%, 9/15/06 | | Austria | | | 375,000,000 | ISK | | | 5,945,499 |
5.00%, 7/15/12 | | Austria | | | 4,800,000 | EUR | | | 6,292,165 |
Government of Belgium,
7.50%, 7/29/08 | | Belgium | | | 4,193,000 | EUR | | | 5,517,703 |
5.00%, 9/28/12 | | Belgium | | | 1,760,000 | EUR | | | 2,313,228 |
Government of Canada,
4.50%, 9/01/07 | | Canada | | | 4,000,000 | CAD | | | 3,477,278 |
6.00%, 6/01/08 | | Canada | | | 2,212,000 | CAD | | | 1,995,862 |
6.00%, 6/01/11 | | Canada | | | 6,849,000 | CAD | | | 6,482,537 |
Government of Denmark, 5.00%, 11/15/13 | | Denmark | | | 25,080,000 | DKK | | | 4,474,947 |
Government of Finland, 3.00%, 7/04/08 | | Finland | | | 1,850,000 | EUR | | | 2,196,145 |
Government of France, 4.00%, 10/25/09 | | France | | | 4,590,000 | EUR | | | 5,632,436 |
Government of Germany, 5.00%, 7/04/11 | | Germany | | | 1,395,000 | EUR | | | 1,808,339 |
Government of Indonesia,
14.00%, 6/15/09 | | Indonesia | | | 18,000,000,000 | IDR | | | 1,871,413 |
14.275%, 12/15/13 | | Indonesia | | | 16,853,000,000 | IDR | | | 1,782,715 |
10.75%, 5/15/16 | | Indonesia | | | 66,500,000,000 | IDR | | | 5,642,891 |
TGA-15
Franklin Templeton Variable Insurance Products Trust
Statement of Investments, December 31, 2005 (continued)
| | | | | | | | |
| Templeton Global Asset Allocation Fund | | Country | | Principal
Amountc | | | Value |
Foreign Government and Agency Securities (cont.) | | | | | | | | |
Government of Italy,
7.75%, 11/01/06 | | Italy | | 974,190 | EUR | | $ | 1,200,695 |
5.00%, 2/01/12 | | Italy | | 1,810,000 | EUR | | | 2,354,367 |
Government of Korea, | | | | | | | | |
6.90%, 1/16/07 | | South Korea | | 12,400,000,000 | KRW | | | 12,577,391 |
4.75%, 3/03/07 | | South Korea | | 11,800,000,000 | KRW | | | 11,705,952 |
4.50%, 9/09/08 | | South Korea | | 1,700,000,000 | KRW | | | 1,663,874 |
Government of Malaysia, | | | | | | | | |
6.45%, 7/01/08 | | Malaysia | | 23,400,000 | MYR | | | 6,627,781 |
4.305%, 2/27/09 | | Malaysia | | 5,000,000 | MYR | | | 1,350,509 |
Government of Netherlands, 5.00%, 7/15/12 | | Netherlands | | 1,760,000 | EUR | | | 2,306,831 |
Government of New Zealand, 7.00%, 7/15/09 | | New Zealand | | 20,308,000 | NZD | | | 14,320,369 |
Government of Norway, 6.75%, 1/15/07 | | Norway | | 92,455,000 | NOK | | | 14,239,270 |
Government of Philippines, 9.00%, 2/15/13 | | Philippines | | 1,425,000 | | | | 1,583,531 |
Government of Poland, | | | | | | | | |
8.50%, 11/12/06 | | Poland | | 620,000 | PLN | | | 197,241 |
8.50%, 5/12/07 | | Poland | | 15,700,000 | PLN | | | 5,081,764 |
6.00%, 5/24/09 | | Poland | | 24,850,000 | PLN | | | 7,921,631 |
6.25%, 10/24/15 | | Poland | | 6,850,000 | PLN | | | 2,293,279 |
5.75%, 9/23/22 | | Poland | | 950,000 | PLN | | | 312,095 |
Government of Singapore, 4.00%, 3/01/07 | | Singapore | | 17,800,000 | SGD | | | 10,905,638 |
Government of Slovakia,
4.80%, 4/14/09 | | Slovak Republic | | 1,500,000 | SKK | | | 48,898 |
4.90%, 2/11/14 | | Slovak Republic | | 196,400,000 | SKK | | | 6,687,284 |
5.30%, 5/12/19 | | Slovak Republic | | 1,300,000 | SKK | | | 46,680 |
eStrip, 1/14/07 | | Slovak Republic | | 181,500,000 | SKK | | | 5,493,323 |
Government of Spain, 10.15%, 1/31/06 | | Spain | | 2,450,000 | EUR | | | 2,916,762 |
Government of Sweden,
8.00%, 8/15/07 | | Sweden | | 61,365,000 | SEK | | | 8,380,487 |
5.50%, 10/08/12 | | Sweden | | 49,110,000 | SEK | | | 7,020,836 |
eStrip, 9/20/06 | | Sweden | | 5,650,000 | SEK | | | 699,702 |
Government of Thailand, 8.00%, 12/08/06 | | Thailand | | 159,750,000 | THB | | | 4,038,433 |
b,dGovernment of Ukraine, 144A, FRN, 7.343%, 8/05/09 | | Ukraine | | 700,000 | | | | 756,875 |
dGovernment of Venezuela, FRN, 5.194%, 4/20/11 | | Venezuela | | 2,115,000 | | | | 2,075,344 |
New South Wales Treasury Corp., 6.50%, 5/01/06 | | Australia | | 9,688,000 | AUD | | | 7,129,374 |
8.00%, 3/01/08 | | Australia | | 2,430,000 | AUD | | | 1,874,293 |
Queensland Treasury Corp., 6.00%,
7/14/09 | | Australia | | 300,000 | AUD | | | 224,743 |
8/14/13 | | Australia | | 2,800,000 | AUD | | | 2,133,756 |
| | | | | | | |
|
|
Total Foreign Government and Agency Securities
(Cost $186,309,879) | | | | | | | | 207,466,998 |
| | | | | | | |
|
|
Total Long Term Investments (Cost $556,060,481) | | | | | | | | 670,752,461 |
| | | | | | | |
|
|
TGA-16
Franklin Templeton Variable Insurance Products Trust
Statement of Investments, December 31, 2005 (continued)
| | | | | | | | |
| Templeton Global Asset Allocation Fund | | Country | | Principal
Amountc | | | Value |
Short Term Investments 4.1% | | | | | | | | |
Foreign Government Securities 1.1% | | | | | | | | |
eThailand Treasury Bill, | | | | | | | | |
2/23/06 | | Thailand | | 139,000,000 | THB | | $ | 3,373,948 |
3/09/06 | | Thailand | | 37,075,000 | THB | | | 898,521 |
5/25/06 | | Thailand | | 95,000,000 | THB | | | 2,290,419 |
7/27/06 | | Thailand | | 2,500,000 | THB | | | 59,482 |
9/07/06 | | Thailand | | 3,100,000 | THB | | | 73,501 |
10/05/06 | | Thailand | | 24,200,000 | THB | | | 573,898 |
10/12/06 | | Thailand | | 40,400,000 | THB | | | 953,714 |
| | | | | | | |
|
|
Total Foreign Government Securities (Cost $8,562,905) | | | | | | | | 8,223,483 |
| | | | | | | |
|
|
Total Investments before Money Fund (Cost $564,623,386) | | | | | | | | 678,975,944 |
| | | | | | | |
|
|
| | | |
| | | | | Shares
| | | |
Money Fund (Cost $21,185,518) 3.0% | | | | | | | | |
fFranklin Institutional Fiduciary Trust Money Market Portfolio | | United States | | 21,185,518 | | | | 21,185,518 |
| | | | | | | |
|
|
Total Investments (Cost $585,808,904) 99.1% | | | | | | | | 700,161,462 |
Net Unrealized Gain on Forward Exchange Contracts 0.0%g | | | | | | | | 265,038 |
Other Assets, less Liabilities 0.9% | | | | | | | | 5,964,363 |
| | | | | | | |
|
|
Net Assets 100.0% | | | | | | | $ | 706,390,863 |
| | | | | | | |
|
|
Currency Abbreviations
AUD - Australian Dollar
CAD - Canadian Dollar
DKK - Danish Krone
EUR - Euro
IDR - Indonesian Rupiah
ISK - Iceland Krona
KRW - South Korean Won
MYR - Malaysian Ringgit
NOK - Norwegian Krone
NZD - New Zealand Dollar
PLN - Polish Zloty
SEK - Swedish Krona
SGD - Singapore Dollar
SKK - Slovak Koruna
THB - Thai Baht
Selected Portfolio Abbreviations
ADR - American Depository Receipt
FDR - Foreign Depository Receipt
FRN - Floating Rate Note
| b | Security was purchased pursuant to Rule 144A under the Securities Act of 1933 and may be sold in transactions exempt from registration only to qualified institutional buyers or in a public offering registered under the Securities Act of 1933. These securities have been deemed liquid under the guidelines approved by the Trust’s Board of Trustees. At December 31, 2005, the value of these securities was $8,237,506, representing 1.17% of net assets. |
| c | The principal amount is stated in U.S. dollars unless otherwise indicated. |
| d | The coupon rate shown represents the rate at period end. |
| e | A portion or all of the security is traded on a discount basis with no stated coupon rate. |
| f | See Note 7 regarding investments in the Franklin Institutional Fiduciary Trust Money Market Portfolio. |
| g | Rounds to less than 0.05% of net assets. |
See notes to financial statements.
TGA-17
Franklin Templeton Variable Insurance Products Trust
Financial Statements
Statement of Assets and Liabilities
December 31, 2005
| | | |
| | | Templeton
Global Asset
Allocation Fund
|
Assets: | | | |
Investments in securities: | | | |
Cost - Unaffiliated issuers | | $ | 564,623,386 |
Cost - Sweep Money Fund (Note 7) | | | 21,185,518 |
| | |
|
|
Total cost of investments | | $ | 585,808,904 |
| | |
|
|
Value - Unaffiliated issuers | | $ | 678,975,944 |
Value - Sweep Money Fund (Note 7) | | | 21,185,518 |
| | |
|
|
Total value of investments | | | 700,161,462 |
Cash | | | 34,405 |
Foreign currency, at value (cost $4,869) | | | 3,697 |
Receivables: | | | |
Investment securities sold | | | 1,989,604 |
Capital shares sold | | | 291 |
Dividends and interest | | | 5,753,380 |
Unrealized gain on forward exchange contracts (Note 8) | | | 265,038 |
Other assets | | | 3,608 |
| | |
|
|
Total assets | | | 708,211,485 |
| | |
|
|
Liabilities: | | | |
Payables: | | | |
Capital shares redeemed | | | 1,094,814 |
Affiliates | | | 466,483 |
Reports to shareholders | | | 182,283 |
Accrued expenses and other liabilities | | | 77,042 |
| | |
|
|
Total liabilities | | | 1,820,622 |
| | |
|
|
Net assets, at value | | $ | 706,390,863 |
| | |
|
|
Net assets consist of: | | | |
Paid-in capital | | $ | 552,419,490 |
Undistributed net investment income | | | 19,276,987 |
Net unrealized appreciation (depreciation) | | | 114,615,623 |
Accumulated net realized gain (loss) | | | 20,078,763 |
| | |
|
|
Net assets, at value | | $ | 706,390,863 |
| | |
|
|
Class 1: | | | |
Net assets, at value | | $ | 638,005,889 |
| | |
|
|
Shares outstanding | | | 30,291,355 |
| | |
|
|
Net asset value and offering price per share | | $ | 21.06 |
| | |
|
|
Class 2: | | | |
Net assets, at value | | $ | 68,384,974 |
| | |
|
|
Shares outstanding | | | 3,274,824 |
| | |
|
|
Net asset value and offering price per share | | $ | 20.88 |
| | |
|
|
See notes to financial statements.
TGA-18
Franklin Templeton Variable Insurance Products Trust
Financial Statements (continued)
Statement of Operations
for the year ended December 31, 2005
| | | | |
| | | Templeton
Global Asset
Allocation Fund
| |
Investment income: | | | | |
Dividends: (net of foreign taxes of $889,657) | | | | |
Unaffiliated issuers | | $ | 11,784,015 | |
Sweep Money Fund (Note 7) | | | 758,212 | |
Interest (net of foreign taxes of $268,898) | | | 9,768,131 | |
Other income (Note 10) | | | 19,119 | |
| | |
|
|
|
Total investment income | | | 22,329,477 | |
| | |
|
|
|
Expenses: | | | | |
Management fees (Note 3a) | | | 4,104,598 | |
Administrative fees (Note 3b) | | | 968,022 | |
Distribution fees - Class 2 (Note 3c) | | | 167,894 | |
Unaffiliated transfer agent fees | | | 3,940 | |
Custodian fees (Note 4) | | | 271,090 | |
Reports to shareholders | | | 472,847 | |
Professional fees | | | 40,875 | |
Trustees’ fees and expenses | | | 3,798 | |
Other | | | 19,631 | |
| | |
|
|
|
Total expenses | | | 6,052,695 | |
Expense reductions (Note 4) | | | (939 | ) |
| | |
|
|
|
Net expenses | | | 6,051,756 | |
| | |
|
|
|
Net investment income | | | 16,277,721 | |
| | |
|
|
|
Realized and unrealized gains (losses): | | | | |
Net realized gain (loss) from: | | | | |
Investments | | | 49,124,156 | |
Foreign currency transactions | | | 7,336,248 | |
| | |
|
|
|
Net realized gain (loss) | | | 56,460,404 | |
| | |
|
|
|
Net change in unrealized appreciation (depreciation) on: | | | | |
Investments | | | (45,849,443 | ) |
Translation of assets and liabilities denominated in foreign currencies | | | (396,964 | ) |
| | |
|
|
|
Net change in unrealized appreciation (depreciation) | | | (46,246,407 | ) |
| | |
|
|
|
Net realized and unrealized gain (loss) | | | 10,213,997 | |
| | |
|
|
|
Net increase (decrease) in net assets resulting from operations | | $ | 26,491,718 | |
| | |
|
|
|
See notes to financial statements.
TGA-19
Franklin Templeton Variable Insurance Products Trust
Financial Statements (continued)
Statements of Changes in Net Assets
| | | | | | | | |
| | | Templeton Global
Asset Allocation Fund
| |
| | | Year Ended December 31,
| |
| | | 2005 | | | 2004 | |
| | |
| |
Increase (decrease) in net assets: | | | | | | | | |
Operations: | | | | | | | | |
Net investment income | | $ | 16,277,721 | | | $ | 15,379,625 | |
Net realized gain (loss) from investments and foreign currency transactions | | | 56,460,404 | | | | 38,579,468 | |
Net change in unrealized appreciation (depreciation) on investments and translation of assets and liabilities denominated in foreign currencies | | | (46,246,407 | ) | | | 41,490,491 | |
| | |
| |
Net increase (decrease) in net assets resulting from operations | | | 26,491,718 | | | | 95,449,584 | |
| | |
| |
Distributions to shareholders from: | | | | | | | | |
Net investment income: | | | | | | | | |
Class 1 | | | (24,700,828 | ) | | | (16,563,956 | ) |
Class 2 | | | (2,527,126 | ) | | | (1,658,563 | ) |
| | |
| |
Total distributions to shareholders | | | (27,227,954 | ) | | | (18,222,519 | ) |
| | |
| |
Capital share transactions: (Note 2) | | | | | | | | |
Class 1 | | | 12,930,774 | | | | (17,118,553 | ) |
Class 2 | | | 2,662,831 | | | | 2,872,334 | |
| | |
| |
Total capital share transactions | | | 15,593,605 | | | | (14,246,219 | ) |
| | |
| |
Net increase (decrease) in net assets | | | 14,857,369 | | | | 62,980,846 | |
Net assets: | | | | | | | | |
Beginning of year | | | 691,533,494 | | | | 628,552,648 | |
| | |
| |
End of year | | $ | 706,390,863 | | | $ | 691,533,494 | |
| | |
| |
Undistributed net investment income included in net assets: | | | | | | | | |
End of year | | $ | 19,276,987 | | | $ | 22,180,158 | |
| | |
| |
See notes to financial statements.
TGA-20
Franklin Templeton Variable Insurance Products Trust
Notes to Financial Statements
Templeton Global Asset Allocation Fund
1. ORGANIZATION AND SIGNIFICANT ACCOUNTING POLICIES
Franklin Templeton Variable Insurance Products Trust (the Trust) is registered under the Investment Company Act of 1940 as an open-end investment company, consisting of twenty-two separate series. The Templeton Global Asset Allocation Fund (the Fund) included in this report is diversified. The financial statements of the remaining funds in the series are presented separately. Shares of the Fund are sold only to insurance company separate accounts to fund the benefits of variable life insurance policies or variable annuity contracts. As of December 31, 2005, 56.42% of the Fund’s shares were sold through one insurance company.
The following summarizes the Fund’s significant accounting policies.
a. Security Valuation
Securities listed on a securities exchange or on the NASDAQ National Market System are valued at the last quoted sale price or the official closing price of the day, respectively. Over-the-counter securities and listed securities for which there is no reported sale are valued within the range of the most recent quoted bid and ask prices. Securities that trade in multiple markets or on multiple exchanges are valued according to the broadest and most representative market. Investments in open-end mutual funds are valued at the closing net asset value.
Government securities and asset-backed securities generally trade in the over-the-counter market rather than on a securities exchange. The Trust may utilize independent pricing services, quotations from bond dealers, and information with respect to bond and note transactions, to assist in determining a current market value for each security. The Trust’s pricing services may use valuation models or matrix pricing which considers information with respect to comparable bond and note transactions, quotations from bond dealers, or by reference to other securities that are considered comparable in such characteristics as rating, interest rate and maturity date, option adjusted spread models, prepayment projections, interest rate spreads and yield curves, to determine current value.
Foreign securities are valued as of the close of trading on the foreign stock exchange on which the security is primarily traded, or the NYSE, whichever is earlier. If no sale is reported at that time, the foreign security will be valued within the range of the most recent quoted bid and ask prices. The value is then converted into its U.S. dollar equivalent at the foreign exchange rate in effect at the close of the NYSE on the day that the value of the foreign security is determined.
The Trust has procedures to determine the fair value of individual securities and other assets for which market prices are not readily available or which may not be reliably priced. Methods for valuing these securities may include: fundamental analysis, matrix pricing, discounts from market prices of similar securities, or discounts applied due to the nature and duration of restrictions on the disposition of the securities. Due to the inherent uncertainty of valuations of such securities, the fair values may differ significantly from the values that would have been used had a ready market for such investments existed. Occasionally, events occur between the time at which trading in a security is completed and the close of the NYSE that might call into question the availability (including the reliability) of the value of a portfolio security held by the Fund. If such an event occurs, the securities may be valued using fair value procedures, which may include the use of independent pricing services. All security valuation procedures are approved by the Trust’s Board of Trustees.
b. Foreign Currency Translation
Portfolio securities and other assets and liabilities denominated in foreign currencies are translated into U.S. dollars based on the exchange rate of such currencies against U.S. dollars on the date of valuation. Purchases and sales of securities, income and expense items denominated in foreign currencies are translated into U.S. dollars at the exchange rate in effect on the transaction date. Occasionally, events may impact the availability or reliability of foreign exchange rates used to convert the U.S. dollar equivalent value. If such an event occurs, the foreign exchange rate will be valued at fair value using procedures established and approved by the Trust’s Board of Trustees.
TGA-21
Franklin Templeton Variable Insurance Products Trust
Notes to Financial Statements (continued)
Templeton Global Asset Allocation Fund
1. ORGANIZATION AND SIGNIFICANT ACCOUNTING POLICIES (continued)
b. Foreign Currency Translation (continued)
The Fund does not separately report the effect of changes in foreign exchange rates from changes in market prices on securities held. Such changes are included in net realized and unrealized gain or loss from investments on the Statement of Operations.
Realized foreign exchange gains or losses arise from sales of foreign currencies, currency gains or losses realized between the trade and settlement dates on securities transactions and the difference between the recorded amounts of dividends, interest, and foreign withholding taxes and the U.S. dollar equivalent of the amounts actually received or paid. Net unrealized foreign exchange gains and losses arise from changes in foreign exchange rates on foreign denominated assets and liabilities other than investments in securities held at the end of the reporting period.
c. Foreign Currency Contracts
The Fund may enter into forward exchange contracts to hedge against fluctuations in foreign exchange rates. A forward exchange contract is an agreement between two parties to exchange different currencies at an agreed upon exchange rate at a future date. These contracts are valued daily by the Fund and the net unrealized gain or loss on the contracts, as measured by the difference between the contractual forward exchange rates and the forward rates at the reporting date, is included in the Statement of Assets and Liabilities. Realized and unrealized gains and losses on these contracts are included in the Statement of Operations.
When the Fund purchases or sells foreign securities it may enter into foreign exchange contracts to minimize foreign exchange risk from the trade date to the settlement date of the transactions. Realized and unrealized gains and losses on these contracts are included in the Statement of Operations.
The risks of these contracts include movement in the values of the foreign currencies relative to the U.S. dollar and the possible inability of the counterparties to fulfill their obligations under the contracts, which may be in excess of the amount reflected in the Statement of Assets and Liabilities.
d. Income Taxes
No provision has been made for U.S. income taxes because the Fund’s policy is to continue to qualify as a regulated investment company under the Internal Revenue Code and to distribute to shareholders substantially all of its taxable income and net realized gains.
Foreign securities held by the Fund may be subject to foreign taxation. Foreign taxes, if any, are recorded based on the tax regulations and rates that exist in the foreign markets in which the Fund invests.
e. Security Transactions, Investment Income, Expenses and Distributions
Security transactions are accounted for on trade date. Realized gains and losses on security transactions are determined on a specific identification basis. Interest income and estimated expenses are accrued daily. Amortization of premium and accretion of discount on debt securities are included in interest income. Dividend income is recorded on the ex-dividend date except that certain dividends from foreign securities are recognized as soon as the Fund is notified of the ex-dividend date. Distributions to shareholders are recorded on the ex-dividend date and are determined according to income tax regulations (tax basis). Such distributions are reinvested in additional shares of the Fund. Distributable earnings determined on a tax basis may differ from earnings recorded in accordance with generally accepted accounting principles. These differences may be permanent or temporary. Permanent differences are reclassified among capital accounts to reflect their tax character. These reclassifications have no impact on net assets or the results of operations. Temporary differences are not reclassified, as they may reverse in subsequent periods.
TGA-22
Franklin Templeton Variable Insurance Products Trust
Notes to Financial Statements (continued)
Templeton Global Asset Allocation Fund
1. ORGANIZATION AND SIGNIFICANT ACCOUNTING POLICIES (continued)
e. Security Transactions, Investment Income, Expenses and Distributions (continued)
Common expenses incurred by the Trust are allocated among the funds based on the ratio of net assets of each Fund to the combined net assets of the Trust. Fund specific expenses are charged directly to the fund that incurred the expense.
Realized and unrealized gains and losses and net investment income, other than class specific expenses, are allocated daily to each class of shares based upon the relative proportion of net assets of each class.
f. Accounting Estimates
The preparation of financial statements in accordance with accounting principles generally accepted in the United States of America requires management to make estimates and assumptions that affect the reported amounts of assets and liabilities at the date of the financial statements and the amounts of income and expenses during the reporting period. Actual results could differ from those estimates.
g. Guarantees and Indemnifications
Under the Trust’s organizational documents, its officers and trustees are indemnified by the Trust against certain liabilities arising out of the performance of their duties to the Trust. Additionally, in the normal course of business, the Trust enters into contracts with service providers that contain general indemnification clauses. The Trust’s maximum exposure under these arrangements is unknown as this would involve future claims that may be made against the Trust that have not yet occurred. However, based on experience, the Trust expects the risk of loss to be remote.
2. SHARES OF BENEFICIAL INTEREST
The Fund offers two classes of shares: Class 1 and Class 2. Each class of shares differs by its distribution fees, voting rights on matters affecting a single class and its exchange privilege.
At December 31, 2005, there were an unlimited number of shares authorized ($0.01 par value). Transactions in the Fund’s shares were as follows:
| | | | | | | | | | | | | | |
| | | Year Ended December 31,
| |
| | | 2005
| | | 2004
| |
| Class 1 Shares: | | Shares
| | | Amount
| | | Shares
| | | Amount
| |
Shares sold | | 1,742,106 | | | $ | 36,156,220 | | | 2,523,033 | | | $ | 48,527,568 | |
Shares issued in reinvestment of distributions | | 1,232,576 | | | | 24,700,828 | | | 904,640 | | | | 16,563,956 | |
Shares redeemed | | (2,319,937 | ) | | | (47,926,274 | ) | | (4,294,965 | ) | | | (82,210,077 | ) |
| | |
| |
Net increase (decrease) | | 654,745 | | | $ | 12,930,774 | | | (867,292 | ) | | $ | (17,118,553 | ) |
| | |
|
|
| Class 2 Shares: | | | | | | | | | | | | |
Shares sold | | 650,005 | | | $ | 13,320,533 | | | 617,661 | | | $ | 11,736,853 | |
Shares issued in reinvestment of distributions | | 126,991 | | | | 2,527,126 | | | 91,180 | | | | 1,658,563 | |
Shares redeemed | | (644,040 | ) | | | (13,184,828 | ) | | (557,792 | ) | | | (10,523,082 | ) |
| | |
| |
Net increase (decrease) | | 132,956 | | | $ | 2,662,831 | | | 151,049 | | | $ | 2,872,334 | |
| | |
|
|
TGA-23
Franklin Templeton Variable Insurance Products Trust
Notes to Financial Statements (continued)
Templeton Global Asset Allocation Fund
3. TRANSACTIONS WITH AFFILIATES
Franklin Resources, Inc. is the holding company for various subsidiaries that together are referred to as Franklin Templeton Investments. Certain officers and trustees of the Trust are also officers and/or directors of the following subsidiaries:
| | |
| Subsidiary | | Affiliation |
Templeton Investment Counsel, LLC (TIC) | | Investment manager |
Franklin Advisers, Inc. (Advisers) | | Investment manager |
Franklin Templeton Services, LLC (FT Services) | | Administrative manager |
Franklin Templeton Distributors, Inc. (Distributors) | | Principal underwriter |
Franklin Templeton Investor Services, LLC (Investor Services) | | Transfer agent |
a. Management Fees
The Fund pays an investment management fee to TIC based on the average daily net assets of the Fund as follows:
| | |
| Annualized Fee Rate | | Net Assets |
| 0.650% | | Up to and including $200 million |
| 0.585% | | Over $200 million, up to and including $1.3 billion |
| 0.520% | | In excess of $1.3 billion |
Under a subadvisory agreement, Advisers, an affiliate of TIC, provides subadvisory services to the Fund and receives from TIC fees based on the average daily net assets of the Fund.
b. Administrative Fees
The Fund pays an administrative fee to FT Services based on the average daily net assets of the Fund as follows:
| | |
| Annualized Fee Rate | | Net Assets |
| 0.150% | | Up to and including $200 million |
| 0.135% | | Over $200 million, up to and including $700 million |
| 0.100% | | Over $700 million, up to and including $1.2 billion |
| 0.075% | | In excess of $1.2 billion |
c. Distribution Fees
The Fund’s Board of Trustees has adopted distribution plans for Class 2 shares pursuant to Rule 12b-1 under the 1940 Act. Under the Fund’s compensation distribution plans, the Fund pays Distributors for costs incurred in connection with the sale and distribution of the Fund’s shares up to 0.35% per year of its average daily net assets. The Board of Trustees has set the current rate at 0.25% per year.
d. Transfer Agent Fees
Investor Services, under terms of an agreement, performs shareholder servicing for the Fund and is not paid by the Fund for the services.
4. EXPENSE OFFSET ARRANGEMENT
The Fund has entered into an arrangement with its custodian whereby credits realized as a result of uninvested cash balances are used to reduce a portion of the Fund’s custodian expenses. During the year ended December 31, 2005, the custodian fees were reduced as noted in the Statement of Operations.
TGA-24
Franklin Templeton Variable Insurance Products Trust
Notes to Financial Statements (continued)
Templeton Global Asset Allocation Fund
5. INCOME TAXES
During the year ended December 31, 2005, the Fund utilized $28,332,420 of capital loss carryforwards.
For tax purposes, realized currency losses, occurring subsequent to October 31, may be deferred and treated as occurring on the first day of the following fiscal year. At December 31, 2005, the Fund deferred realized currency losses of $133,304.
The tax character of distributions paid during the years ended December 31, 2005 and 2004, was as follows:
| | | | | | |
| | | 2005
| | 2004
|
Distributions paid from ordinary income | | $ | 27,227,954 | | $ | 18,222,519 |
| | |
|
|
At December 31, 2005, the cost of investments, net unrealized appreciation (depreciation), undistributed ordinary income, and undistributed long term capital gains for income tax purposes were as follows:
| | | | |
Cost of investments | | $ | 589,732,840 | |
| | |
|
|
|
| |
Unrealized appreciation | | $ | 144,245,289 | |
Unrealized depreciation | | | (33,816,667 | ) |
| | |
|
|
|
Net unrealized appreciation (depreciation) | | $ | 110,428,622 | |
| | |
|
|
|
| |
Undistributed ordinary income | | $ | 23,238,601 | |
Undistributed long term capital gains | | | 20,174,390 | |
| | |
|
|
|
Distributable earnings | | $ | 43,412,991 | |
| | |
|
|
|
Net investment income and net realized gains (losses) differ for financial statement and tax purposes primarily due to differing treatments of foreign currency transactions, and bond discounts and premiums.
6. INVESTMENT TRANSACTIONS
Purchases and sales of investments (excluding short term securities) for the year ended December 31, 2005, aggregated $178,268,669 and $172,701,506, respectively.
7. INVESTMENTS IN FRANKLIN INSTITUTIONAL FIDUCIARY TRUST MONEY MARKET PORTFOLIO
The Fund may invest in the Franklin Institutional Fiduciary Trust Money Market Portfolio (the Sweep Money Fund), an open-end investment company managed by Franklin Advisers Inc. (an affiliate of the investment manager). Management fees paid by the Fund are reduced on assets invested in the Sweep Money Fund, in an amount not to exceed the management and administrative fees paid by the Sweep Money Fund.
TGA-25
Franklin Templeton Variable Insurance Products Trust
Notes to Financial Statements (continued)
Templeton Global Asset Allocation Fund
8. FORWARD EXCHANGE CONTRACTS
At December 31, 2005, the Fund had outstanding forward exchange contracts as set out below.
| | | | | | | | | | | | | |
| Contracts to Buy | | Contract
Amounta | | | | Settlement
Date | | | | Unrealized
Gain (Loss) |
| 47,000,000 | | Indian Rupee | | 1,525,677 | | NZD | | 6/21/06 | | | | $ | 9,519 |
| 72,200,000 | | Thailand Baht | | 2,539,392 | | NZD | | 11/30/06 | | | | | 68,645 |
| 72,200,000 | | Thailand Baht | | 2,530,448 | | NZD | | 12/06/06 | | | | | 75,096 |
| 1,800,000,000 | | Korean Won | | 2,520,094 | | NZD | | 12/06/06 | | | | | 111,778 |
| | | | |
| | | | | | | |
|
|
| | | | | 9,115,611 | | NZD | | | | | | | 265,038 |
| | | | |
| | | | | | | |
|
|
| | | Net unrealized gain (loss) on forward exchange contracts | | | | $ | 265,038 |
| | | | | | | | | | | | |
|
|
a In U.S. dollars unless otherwise indicated.
Currency Abbreviations
NZD - New Zealand Dollars
9. CONCENTRATION OF RISK
Investing in foreign securities may include certain risks and considerations not typically associated with investing in U.S. securities, such as fluctuating currency values and changing local and regional economic, political and social conditions, which may result in greater market volatility. In addition, certain foreign securities may not be as liquid as U.S. securities.
10. REGULATORY MATTERS
As part of various investigations by a number of federal, state, and foreign regulators and governmental entities, relating to certain practices in the mutual fund industry, including late trading, market timing and marketing support payments to securities dealers who sell fund shares, Franklin Resources, Inc. and certain of its subsidiaries (collectively, the “Company”), entered into settlements with certain of those regulators.
Specifically, the Company entered into settlements with the Securities and Exchange Commission (“SEC”) concerning market timing (the “August 2, 2004 SEC Order”) and marketing support payments to securities dealers who sell fund shares (the “December 13, 2004 SEC Order”) and with the California Attorney General’s Office (“CAGO”) concerning marketing support payments to securities dealers who sell fund shares (the “CAGO Settlement”). Under the terms of the settlements with the SEC and the CAGO, the Company retained an Independent Distribution Consultant (“IDC”) to develop a plan for distribution of the respective settlement monies. The CAGO approved the distribution plan under the CAGO Settlement and, in accordance with the terms and conditions of that settlement, the monies were disbursed to the relevant funds and are recorded as other income in the current period. The SEC has not yet approved the distribution plan pertaining to the December 13, 2004 SEC Order. When approved, disbursements of settlement monies will be made promptly to the relevant funds, in accordance with the terms and conditions of that order. The IDC continues to develop the plan of distribution under the August 2, 2004 SEC Order that resolved the SEC’s market timing investigation.
In addition, the Company, as well as most of the mutual funds within Franklin Templeton Investments and certain current or former officers, directors, and/or employees, have been named in private lawsuits (styled as shareholder class actions, or as derivative actions on behalf of either the named funds or Franklin Resources, Inc.) relating to the industry practices referenced above, as well as to allegedly excessive advisory fees, commissions, and/or 12b-1 fees. The lawsuits were filed in different courts throughout the country. Many of those suits are now pending in a multi-district litigation in the United States District Court for the District of Maryland.
The Company and fund management strongly believe that the claims made in each of the private lawsuits referenced above are without merit and intend to defend against them vigorously. The Company cannot predict with certainty the eventual outcome of these lawsuits, nor whether they will have a material negative impact on the Company. If it is determined that the Company bears responsibility for any unlawful or inappropriate conduct that caused losses to the Trust, it is committed to making the Trust or their shareholders whole, as appropriate.
TGA-26
Franklin Templeton Variable Insurance Products Trust
Templeton Global Asset Allocation Fund
Report of Independent Registered Public Accounting Firm
To the Board of Trustees and Shareholders of
Franklin Templeton Variable Insurance Products Trust
In our opinion, the accompanying statement of assets and liabilities, including the statement of investments, and the related statements of operations and of changes in net assets and the financial highlights present fairly, in all material respects, the financial position of Templeton Global Asset Allocation Fund (one of the funds constituting Franklin Templeton Variable Insurance Products Trust, hereafter referred to as the “Fund”) at December 31, 2005, the results of its operations for the year then ended, the changes in its net assets for each of the two years in the period then ended and the financial highlights for each of the five years in the period then ended, in conformity with accounting principles generally accepted in the United States of America. These financial statements and financial highlights (hereafter referred to as “financial statements”) are the responsibility of the Fund’s management; our responsibility is to express an opinion on these financial statements based on our audits. We conducted our audits of these financial statements in accordance with the standards of the Public Company Accounting Oversight Board (United States). Those standards require that we plan and perform the audit to obtain reasonable assurance about whether the financial statements are free of material misstatement. An audit includes examining, on a test basis, evidence supporting the amounts and disclosures in the financial statements, assessing the accounting principles used and significant estimates made by management, and evaluating the overall financial statement presentation. We believe that our audits, which included confirmation of securities at December 31, 2005, by correspondence with the custodian, and brokers, provide a reasonable basis for our opinion.
PricewaterhouseCoopers LLP
San Francisco, California
February 10, 2006
TGA-27
Franklin Templeton Variable Insurance Products Trust
Tax Designation (unaudited)
Templeton Global Asset Allocation Fund
Under Section 852(b)(3)(c) of the Internal Revenue Code (Code), the Fund designates the maximum amount allowable but no less than $20,174,390 as capital gain dividend for the fiscal year ended December 31, 2005.
Under Section 854(b)(2) of the Code, the Fund designates 5.43% of the ordinary income dividends as income qualifying for the dividends received deduction for the fiscal year ended December 31, 2005.
At December 31, 2005, more than 50% of the Fund’s total assets were invested in securities of foreign issuers. In most instances, foreign taxes were withheld from dividends paid to the Fund on these investments. The Fund elects to treat foreign taxes paid as allowed under Section 853 of the Code. This election will allow shareholders of record in June 2006, to treat their proportionate share of foreign taxes paid by the Fund as having been paid directly by them. The shareholder shall consider these amounts as foreign taxes paid in the tax year in which they receive the Fund distribution.
The foreign tax information will be disclosed in the June 30, 2006, semi-annual report of the Fund.
TGA-28
TEMPLETON GLOBAL INCOME SECURITIES FUND
This annual report for Templeton Global Income Securities Fund covers the fiscal year ended December 31, 2005.
Performance Summary as of 12/31/05
Average annual total return of Class 1 shares represents the average annual change in value, assuming reinvestment of dividends and capital gains. Average returns smooth out variations in returns, which can be significant; they are not the same as year-by-year results.
Periods ended 12/31/05
| | | | | | |
| | | 1-Year | | 5-Year | | 10-Year |
Average Annual Total Return | | -2.91% | | +11.30% | | +7.28% |
Total Return Index Comparison for Hypothetical $10,000 Investment (1/1/96–12/31/05)
The graph below shows the change in value of a hypothetical $10,000 investment in the Fund over the indicated period and includes reinvestment of any income or distributions. The Fund’s performance is compared to the performance of the J.P. Morgan (JPM) Global Government Bond Index (GGBI), as well as the Consumer Price Index (CPI). One cannot invest directly in an index, nor is an index representative of the Fund’s portfolio. Please see Important Notes to Performance Information preceding the Fund Summaries.
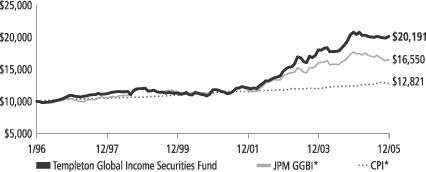
*Sources: J.P. Morgan; Standard & Poor’s Micropal. Please see Index Descriptions following the Fund Summaries.
Templeton Global Income Securities Fund – Class 1
Performance reflects the Fund’s Class 1 operating expenses, but does not include any contract fees, expenses or sales charges. If they had been included, performance would be lower. These charges and deductions, particularly for variable life policies, can have a significant effect on contract values and insurance benefits. See the contract prospectus for a complete description of these expenses, including sales charges.
Performance data represent past performance, which does not guarantee future results. Investment return and principal value will fluctuate, and you may have a gain or loss when you sell your shares. Current performance may differ from figures shown.
TGI-1
Fund Goal and Main Investments: Templeton Global Income Securities Fund seeks high current income, consistent with preservation of capital, with capital appreciation as a secondary consideration. The Fund normally invests mainly in debt securities of governments and their political subdivisions and agencies, supranational organizations and companies located anywhere in the world, including emerging markets.
Performance Overview
You can find the Fund’s total return for the period under review in the Performance Summary. The Fund outperformed its benchmark, the JPM GGBI (the Index), which had a -6.53% total return in U.S. dollar terms for the year under review.1
Economic and Market Overview
The U.S. economy experienced solid growth during the year under review and remained notably resilient despite higher energy prices and the impact of hurricanes in the south. In third quarter 2005, the economy expanded 3.6% compared with the year earlier period. Continuing productivity growth and job creation increased capital and labor utilization and, along with higher global commodity prices, exerted inflationary pressures in the U.S. The Federal Reserve Board (Fed) continued its series of measured interest rate hikes, increasing the federal funds target rate 200 basis points (100 basis points equal one percentage point) to 4.25% by period-end to remove policy accommodation given strong growth conditions and higher inflation. Consistent with strong economic growth and in particular solid consumption trends, U.S. imports exceeded exports, driving the U.S. trade balance to a $64 billion monthly deficit level by November 2005.2 Although higher oil prices negatively impacted the deficit, the underlying trade balance (not including oil) also deteriorated, largely as a result of a widening trade deficit with the Pacific Rim region. Furthermore, the U.S. current account deficit widened to 6.2% of gross domestic product (GDP) in third quarter 2005 versus 5.7% a year earlier.2
In contrast to the U.S., Asia generated trade and current account surpluses. These surpluses facilitated foreign reserve accumulation, most notably in China where foreign exchange reserves reached $819 billion
1. Source: J.P. Morgan. One cannot invest directly in an index, nor is an index representative of the Fund’s portfolio. Please see Index Descriptions following the Fund Summaries.
2. Source: U.S. Department of Commerce.
Fund Risks: Because the Fund invests in bonds and other debt obligations, the Fund’s share price and yield will be affected by interest rate movements. Bond prices generally move in the opposite direction from interest rates. Thus, as the prices of bonds in the Fund adjust to a rise in interest rates, the Fund’s share price may decline. High yield, lower-rated (junk) bonds generally have greater price swings and higher default risks. Foreign investing, especially in emerging markets, involves additional risks including currency fluctuations, economic instability, and social and political developments. The Fund’s prospectus also includes a description of the main investment risks.
What is a current account?
A current account is that part of the balance of payments where all of one country’s international transactions in goods and services are recorded.
What is balance of payments?
Balance of payments is a record of all of a country’s exports and imports of goods and services, borrowing and lending with the rest of the world during a particular time period. It helps a country evaluate its competitive strengths and weaknesses and forecast the strength of its currency.
TGI-2
in December 2005.3 This foreign reserve buildup combined with international political pressure prompted the Chinese government to revalue the yuan and move from its U.S. dollar peg to a managed float versus a basket of undisclosed global currencies. Although global demand for Asian products remained favorable for the region’s growth prospects, there were also signs during the period of a pickup in domestic growth drivers. For example, private consumption accelerated in South Korea. Furthermore, this rebalancing extended to Japan where notable improvements in domestic demand conditions improved prospects for the country to finally exit deflation. In China, increased consumption and strong domestic growth conditions benefited the country’s regional trade partners through import demand. Overall, aggregate demand among Asian economies rose over the Fund’s fiscal year. In Singapore, South Korea and Thailand, GDP growth rates improved. Correspondingly, regional interest rates began to rise. Thailand raised rates 200 basis points to 4.00% and South Korea began to tighten monetary policy in the second half of the year, raising rates 25 basis points to 3.75%.4
Following sluggish economic growth in the first half of the year, economic activity in the 12-country euro zone accelerated in the second half but remained more moderate than growth in the U.S. or Asia. Euro-zone GDP for third quarter 2005 rose 1.6% compared with a year earlier.5 While underlying inflationary pressures remained well contained, higher energy prices and liquidity conditions prompted the European Central Bank (ECB) to increase interest rates by 25 basis points to 2.25% after being on hold for 30 months. Central European economies also benefited from the firmer growth conditions in the euro zone. Poland’s GDP growth rose 3.7% while Slovakia’s GDP growth accelerated further to 6.2% in third quarter 2005.6 Prior fiscal reforms and prudent macroeconomic policies enabled Slovakia to join ERMII, which is the precursor to adopting the euro, in the fourth quarter. Economic conditions in Norway and Sweden remained characterized by significantly large current account surpluses and better domestic growth conditions, led by labor market improvement. Correspondingly, Norway’s central bank raised interest rates during the period and Sweden’s paused after reducing rates earlier in the period.
3. Source: National Bureau of Statistics, China.
4. Sources: Bank of Thailand; Bank of Korea (South Korea).
5. Source: Eurostat.
6. Sources: Polish Statistics Office; Statistical Office of Slovakia.
TGI-3
Investment Strategy
We allocate the Fund’s assets among issuers, geographic regions, and currencies based upon our assessment of relative interest rates among currencies, our outlook for changes in interest rates, and credit risks. In considering these factors, we may evaluate a country’s changing market, and economic and political conditions, such as inflation rate, growth prospects, global trade patterns and government policies. We seek to manage the Fund’s exposure to various currencies, and may from time to time seek to hedge (protect) against currency risk by using forward currency exchange contracts.
Manager’s Discussion
The Fund’s total return is influenced by various factors, including interest rate developments, currency movements and exposure to sovereign debt markets.
Interest Rate Strategy
In anticipation of rising global interest rates, led by the U.S. Fed, we shortened the Fund’s overall duration, particularly in Asia and increasingly Europe. However, we continued to find opportunities over the past year to take advantage of lower interest rates to benefit Fund performance. For example, the National Bank of Poland reduced interest rates 200 basis points during the year to 4.50%, bolstering local bond market returns to 9.67% in local currency terms.7 While economic growth in Poland remained above rates in the euro zone, the composition of growth showed slower private consumption and investment growth. Furthermore, currency appreciation against its major trading partners contributed to the disinflationary process, with consumer price inflation falling from 4.4% at the end of 2004 to 1.0% in November 2005.8 In another example, the National Bank of Slovakia reduced interest rates 100 basis points to 3.00%, to ease the constraint imposed on monetary conditions by the currency appreciation. While we continued to avoid the U.K.’s currency risk, the lack of exposure to the U.K. bond market detracted from relative Fund performance given the 25 basis-point reduction in interest rates during the year.9
Currency Strategy
During the 12 months under review, the U.S. dollar received some reprieve from the depreciation trend that began in early 2002. The dollar
7. Source: J.P. Morgan, Government Bond Index Monitor, December 2005.
8. Source: Polish Statistics Office.
9. Source: Bank of England.
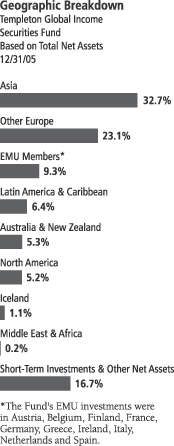
TGI-4
appreciated 8.42% against its major trading partners, including 15.23% appreciation against the euro and 15.18% appreciation against the yen.10 This reprieve likely was due in part to the Fed’s interest rate increases, which brought U.S. rates in line with the ECB rate at the beginning of the reporting period and 200 basis points higher by period-end. However, while this positive interest rate differential was increasing, the U.S. balance of payment position deteriorated, led by a larger current account deficit and greater reliance on debt financing, particularly from the government sector. That the U.S. current account deficit deteriorated significantly while the country also experienced currency strength indicated global macroeconomic imbalances. These imbalances were largely offset by sufficient global market liquidity resulting from a large, global savings pool in Asia and oil-exporting countries. Given the magnitude of global economic imbalances, particularly between the U.S. and Asia, we believe the U.S. dollar may need to weaken to help improve the U.S. current account position over the medium term.
In a relatively difficult currency environment, currency diversification was an important component of the Fund’s strong performance relative to the JPM GGBI. We significantly reduced exposure to the euro and increased allocation to non-Japan Asia, non-euro Europe and the Americas outside of the U.S. The two most notable allocation changes, and consequently, the largest currency contributors to relative performance, were the Canadian dollar and the South Korean won. Macroeconomic fundamentals remained supportive of the Canadian dollar, which appreciated 2.57% against the U.S. dollar and brought the total return of Canadian bond markets to 10.02% in U.S. dollar terms over the year.7 Energy and commodity prices continued to underpin Canada’s overall economic environment. Additionally, the higher commodity price environment bolstered the Canadian balance of payment position through higher exports as well as increased capital flows into the energy sector. We continued to see more signs of domestic demand strength in Asia. One of the best examples was the acceleration of South Korean private consumption in third quarter to 4.0% from 2.8% in second quarter 2005, which was preceded by an improvement in consumer confidence and a rise in property prices earlier in the year.11 The South Korean won appreciated 2.41% against the U.S. dollar.7 The Swedish krona weakened more than the euro against the dollar, or 16.50%, and was one of the more significant currency detractors from relative performance.7 Currency performance over
10. Source: Compustat.
11. Source: Bank of Korea (South Korea).
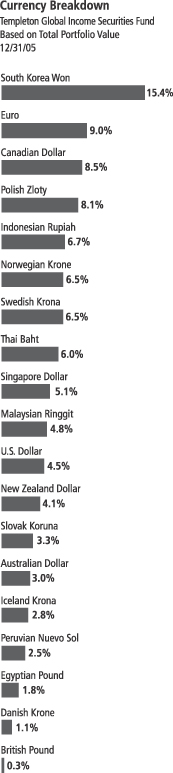
The dollar value, number of shares or principal amount, and names of all portfolio holdings are listed in the Fund’s Statement of Investments.
TGI-5
the period was hindered by Sweden’s lower interest rates relative to other developed markets; however, the country maintained large current account and fiscal surpluses.
Global Sovereign Debt Strategy
The Fund also purchased investment-grade and sub-investment-grade sovereign debt that typically compensates for greater credit risk by offering higher yields relative to U.S. and European benchmark treasury curves. Despite rising U.S. interest rates, U.S. dollar-denominated emerging market debt continued to generate strong returns, rising 10.73% over the period, as measured by the JPM Emerging Markets Bond Index (EMBI) Global.12 Sovereign interest rate spreads narrowed from 347 basis points greater than the U.S. Treasury market at the beginning of the reporting period, to 237 basis points by period-end. Regionally, Latin American sovereign debt rose 10.88%, eastern European 10.91% and Asian 11.39%.12 Euro-denominated markets also rose during the period, gaining 7.07% in euro terms as measured by the JPM Euro EMBI Global, yet declined in U.S. dollar terms given the euro’s volatility.12 We sought to take advantage of strength in sovereign debt prices to reduce allocations to U.S. dollar-denominated credit, particularly in Venezuela and Ukraine.
Thank you for your participation in Templeton Global Income Securities Fund. We look forward to serving your future investment needs.
12. Source: J.P. Morgan, Emerging Markets Bond Index Monitor, December 2005. Please see Index Descriptions following the Fund Summaries.
The foregoing information reflects our analysis, opinions and portfolio holdings as of December 31, 2005, the end of the reporting period. The way we implement our main investment strategies and the resulting portfolio holdings may change depending on factors such as market and economic conditions. These opinions may not be relied upon as investment advice or an offer for a particular security. The information is not a complete analysis of every aspect of any market, country, industry, security or the Fund. Statements of fact are from sources considered reliable, but the adviser makes no representation or warranty as to their completeness or accuracy. Although historical performance is no guarantee of future results, these insights may help you understand our investment management philosophy.
TGI-6
Fund Expenses
As an investor in a variable insurance contract (“Contract”) that indirectly provides for investment in an underlying mutual fund, you can incur transaction and/or ongoing expenses at both the Fund level and the Contract level.
| • | | Transaction expenses can include sales charges (loads) on purchases, redemption fees, surrender fees, transfer fees and premium taxes. |
| • | | Ongoing expenses can include management fees, distribution and service (12b-1) fees, contract fees, annual maintenance fees, mortality and expense risk fees and other fees and expenses. All mutual funds and Contracts have some types of ongoing expenses. |
The expenses shown in the table below are meant to highlight ongoing expenses at the Fund level only and do not include ongoing expenses at the Contract level, or transaction expenses at either the Fund or Contract level. While the Fund does not have transaction expenses, if the transaction and ongoing expenses at the Contract level were included, the expenses shown below would be higher. You should consult your Contract prospectus or disclosure document for more information.
The table shows Fund-level ongoing expenses and can help you understand these expenses and compare them with those of other mutual funds offered through the Contract. The table assumes a $1,000 investment held for the six months indicated. Please refer to the Fund prospectus for additional information on operating expenses.
Actual Fund Expenses
The first line (Actual) of the table below provides actual account values and expenses. The “Ending Account Value” is derived from the Fund’s actual return, which includes the effect of ongoing Fund expenses, but does not include the effect of ongoing Contract expenses.
You can estimate the Fund-level expenses you incurred during the period by following these steps. Of course, your account value and expenses will differ from those in this illustration:
| 1. | Divide your account value by $1,000. |
If an account had an $8,600 value, then $8,600 ÷ $1,000 = 8.6.
| 2. | Multiply the result by the number under the heading “Fund-Level Expenses Incurred During Period.” |
If Fund-Level Expenses Incurred During Period were $7.50, then 8.6 x $7.50 = $64.50.
Templeton Global Income Securities Fund – Class 1
TGI-7
In this illustration, the estimated expenses incurred this period at the Fund level are $64.50.
Hypothetical Example for Comparison with Other Mutual Funds
Information in the second line (Hypothetical) of the table can help you compare ongoing expenses of the Fund with those of other mutual funds offered through the Contract. This information may not be used to estimate the actual ending account balance or expenses you incurred during the period. The hypothetical “Ending Account Value” is based on the Fund’s actual expense ratio and an assumed 5% annual rate of return before expenses, which does not represent the Fund’s actual return. The figure under the heading “Fund-Level Expenses Incurred During Period” shows the hypothetical expenses your account would have incurred under this scenario. You can compare this figure with the 5% hypothetical examples that appear in shareholder reports of other funds offered through a Contract.
| | | | | | | | | |
| Class 1 | | Beginning
Account
Value 7/1/05 | | Ending
Account
Value 12/31/05 | | Fund-Level
Expenses Incurred
During Period*
7/1/05-12/31/05 |
Actual | | $ | 1,000 | | $ | 1,007.00 | | $ | 3.79 |
Hypothetical (5% return before expenses) | | $ | 1,000 | | $ | 1,021.42 | | $ | 3.82 |
*Expenses are equal to the annualized expense ratio, net of expense reduction, for the Fund’s Class 1 shares (0.75%), which does not include any ongoing expenses of the Contract for which the Fund is an investment option, multiplied by the average account value over the period, multiplied by 184/365 to reflect the one-half year period.
TGI-8
Franklin Templeton Variable Insurance Products Trust
Financial Highlights
Templeton Global Income Securities Fund
| | | | | | | | | | | | | | | | | | | | |
| | | Year Ended December 31,
| |
| Class 1 | | 2005 | | | 2004 | | | 2003 | | | 2002 | | | 2001 | |
| | |
|
|
|
Per share operating performance | | | | | | | | | | | | | | | | | | | | |
(for a share outstanding throughout the year) | | | | | | | | | | | | | | | | | | | | |
Net asset value, beginning of year | | $ | 15.80 | | | $ | 15.54 | | | $ | 13.67 | | | $ | 11.39 | | | $ | 11.53 | |
| | |
|
|
|
Income from investment operations: | | | | | | | | | | | | | | | | | | | | |
Net investment incomea | | | 0.57 | | | | 0.66 | | | | 0.69 | | | | 0.59 | | | | 0.59 | d |
Net realized and unrealized gains (losses) | | | (1.03 | ) | | | 1.37 | | | | 2.35 | | | | 1.83 | | | | (0.32 | )d |
| | |
|
|
|
Total from investment operations | | | (0.46 | ) | | | 2.03 | | | | 3.04 | | | | 2.42 | | | | .27 | |
| | |
|
|
|
Less distributions from net investment income | | | (0.98 | ) | | | (1.77 | ) | | | (1.17 | ) | | | (0.14 | ) | | | (0.41 | ) |
| | |
|
|
|
Redemption fees | | | — | c | | | — | | | | — | | | | — | | | | — | |
| | |
|
|
|
Net asset value, end of year | | $ | 14.36 | | | $ | 15.80 | | | $ | 15.54 | | | $ | 13.67 | | | $ | 11.39 | |
| | |
|
|
|
| | | | | |
Total returnb | | | (2.91)% | | | | 15.09% | | | | 22.72% | | | | 21.44% | | | | 2.55% | |
Ratios/supplemental data | | | | | | | | | | | | | | | | | | | | |
Net assets, end of year (000’s) | | $ | 53,115 | | | $ | 49,845 | | | $ | 52,842 | | | $ | 50,622 | | | $ | 63,781 | |
Ratios to average net assets: | | | | | | | | | | | | | | | | | | | | |
Expenses before expense reduction | | | 0.78% | | | | 0.79% | | | | 0.76% | | | | 0.73% | | | | 0.71% | |
Expenses net of expense reduction | | | 0.74% | | | | 0.78% | | | | 0.76% | | | | 0.73% | | | | 0.71% | |
Net investment income | | | 3.81% | | | | 4.40% | | | | 4.72% | | | | 4.88% | | | | 5.22% | d |
Portfolio turnover rate | | | 30.28% | | | | 37.39% | | | | 53.01% | | | | 27.91% | | | | 122.45% | |
| aBased | on average daily shares outstanding. |
| bTotal | return does not include any fees, charges or expenses imposed by the variable annuity and life insurance contracts for which the Franklin Templeton Variable Insurance Products Trust serves as an underlying investment vehicle. |
| cAmount | is less than $0.01 per share. |
| dEffective | January 1, 2001, the fund adopted the provisions of the AICPA Audit and Accounting Guide of Investment Companies and began amortizing all |
| premium | and discount on fixed-income securities, as required. The effect of this change was as follows: |
| | |
Net investment income (loss) per share | | $(0.059) |
Net realized and unrealized gains (losses) per share | | 0.059 |
Ratio of net investment income to average net assets | | (0.53)% |
See notes to financial statements.
TGI-9
Franklin Templeton Variable Insurance Products Trust
Financial Highlights (continued)
Templeton Global Income Securities Fund (continued)
| | | | | | | | | | | | | | | | | | | | |
| | | Year Ended December 31,
| |
| Class 2 | | 2005 | | | 2004 | | | 2003 | | | 2002 | | | 2001 | |
| | |
|
|
|
Per share operating performance | | | | | | | | | | | | | | | | | | | | |
(for a share outstanding throughout the year) | | | | | | | | | | | | | | | | | | | | |
Net asset value, beginning of year | | $ | 15.64 | | | $ | 15.42 | | | $ | 13.59 | | | $ | 11.33 | | | $ | 11.48 | |
| | |
|
|
|
Income from investment operations: | | | | | | | | | | | | | | | | | | | | |
Net investment incomea | | | 0.52 | | | | 0.60 | | | | 0.65 | | | | 0.54 | | | | 0.55 | d |
Net realized and unrealized gains (losses) | | | (1.00 | ) | | | 1.36 | | | | 2.33 | | | | 1.84 | | | | (0.31 | )d |
| | |
|
|
|
Total from investment operations | | | (0.48 | ) | | | 1.96 | | | | 2.98 | | | | 2.38 | | | | 0.24 | |
| | |
|
|
|
Less distributions from net investment income | | | (0.97 | ) | | | (1.74 | ) | | | (1.15 | ) | | | (0.12 | ) | | | (0.39 | ) |
| | |
|
|
|
Redemption fees | | | —c | | | | — | | | | — | | | | — | | | | — | |
| | |
|
|
|
Net asset value, end of year | | $ | 14.19 | | | $ | 15.64 | | | $ | 15.42 | | | $ | 13.59 | | | $ | 11.33 | |
| | |
|
|
|
| | | | | |
Total returnb | | | (3.08)% | | | | 14.74% | | | | 22.44% | | | | 21.15% | | | | 2.24% | |
Ratios/supplemental data | | | | | | | | | | | | | | | | | | | | |
Net assets, end of year (000’s) | | $ | 61,255 | | | $ | 19,779 | | | $ | 5,181 | | | $ | 2,119 | | | $ | 1,286 | |
Ratios to average net assets: | | | | | | | | | | | | | | | | | | | | |
Expenses before expense reduction | | | 1.03% | | | | 1.04% | | | | 1.01% | | | | 0.98% | | | | 0.96% | |
Expense net of expense reduction | | | 0.99% | | | | 1.03% | | | | 1.01% | | | | 0.98% | | | | 0.96% | |
Net investment income | | | 3.56% | | | | 4.15% | | | | 4.47% | | | | 4.63% | | | | 4.95% | d |
Portfolio turnover rate | | | 30.28% | | | | 37.39% | | | | 53.01% | | | | 27.91% | | | | 122.45% | |
| aBased | on average daily shares outstanding. |
| bTotal | return does not include any fees, charges or expenses imposed by the variable annuity and life insurance contracts for which the Franklin Templeton |
| Variable | Insurance Products Trust serves as an underlying investment vehicle |
| cAmount | is less than $0.01 per share. |
| dEffective | January 1, 2001, the fund adopted the provisions of the AICPA Audit and Accounting Guide of Investment Companies and began amortizing all |
| premium | and discount on fixed-income securities, as required. The effect of this change was as follows: |
| | |
Net investment income (loss) per share | | $(0.059) |
Net realized and unrealized gains (losses) per share | | 0.059 |
Ratio of net investment income to average net assets | | (0.53)% |
See notes to financial statements.
TGI-10
Franklin Templeton Variable Insurance Products Trust
Financial Highlights (continued)
Templeton Global Income Securities Fund (continued)
| | | | |
| | | Period Ended
December 31,
| |
| Class 3 | | 2005c | |
| | |
|
|
|
Per share operating performance | | | | |
(for a share outstanding throughout the period) | | | | |
Net asset value, beginning of period | | $ | 15.27 | |
| | |
|
|
|
Income from investment operations: | | | | |
Net investment incomea | | | 0.38 | |
Net realized and unrealized gains (losses) | | | (0.50 | ) |
| | |
|
|
|
Total from investment operations | | | (0.12 | ) |
| | |
|
|
|
Less distributions from net investment income | | | (0.97 | ) |
| | |
|
|
|
Redemption fees | | | —d | |
| | |
|
|
|
Net asset value, end of period | | $ | 14.18 | |
| | |
|
|
|
| |
Total returnb | | | (0.80)% | |
Ratios/supplemental data | | | | |
Net assets, end of period (000’s) | | $ | 5,769 | |
Ratios to average net assets: | | | | |
Expenses before expense reduction | | | 1.03%e | |
Expenses net of expense reduction | | | 0.99%e | |
Net investment income | | | 3.56%e | |
Portfolio turnover rate | | | 30.28% | |
| aBased | on average daily shares outstanding. |
| bTotal | return does not include any fees, charges or expenses imposed by the variable annuity and life insurance contracts for which the Franklin Templeton |
| Variable | Insurance Products Trust serves as an underlying investment vehicle. Total return is not annualized for periods less than one year. |
| cFor | the period April 1, 2005 (effective date) to December 31, 2005. |
| dAmount | is less than $0.01 per share. |
See notes to financial statements.
TGI-11
Franklin Templeton Variable Insurance Products Trust
Statement of Investments, December 31, 2005
| | | | | | |
| Templeton Global Income Securities Fund | | Principal
Amounta | | | Value |
Long Term Investments 83.3% | | | | | | |
Argentina 3.2% | | | | | | |
bGovernment of Argentina, FRN, 4.005%, 8/03/12 | | 4,997,000 | | | $ | 3,856,127 |
| | | | | |
|
|
Australia 2.8% | | | | | | |
New South Wales Treasury Corp., 8.00%, 3/01/08 | | 1,990,000 | AUD | | | 1,534,915 |
Queensland Treasury Corp., 6.00%, | | | | | | |
8/14/13 | | 2,200,000 | AUD | | | 1,676,523 |
10/14/15 | | 200,000 | AUD | | | 152,861 |
| | | | | |
|
|
| | | | | | | 3,364,299 |
| | | | | |
|
|
Austria 1.4% | | | | | | |
Government of Austria, | | | | | | |
5.50%, 10/20/07 | | 425,000 | EUR | | | 526,281 |
5.00%, 7/15/12 | | 850,000 | EUR | | | 1,114,237 |
| | | | | |
|
|
| | | | | | | 1,640,518 |
| | | | | |
|
|
Belgium 0.8% | | | | | | |
Government of Belgium, 7.50%, 7/29/08 | | 686,000 | EUR | | | 902,729 |
| | | | | |
|
|
Brazil 0.3% | | | | | | |
bGovernment of Brazil, FRN, 5.25%, 4/15/12 | | 349,477 | | | | 345,982 |
| | | | | |
|
|
Canada 5.2% | | | | | | |
Government of Canada, | | | | | | |
3.00%, 6/01/06 | | 3,470,000 | CAD | | | 2,978,205 |
5.75%, 9/01/06 | | 790,000 | CAD | | | 688,394 |
7.00%, 12/01/06 | | 750,000 | CAD | | | 663,259 |
Province of Alberta, 5.00%, 12/16/08 | | 170,000 | CAD | | | 150,296 |
Province of British Columbia, 5.25%, 12/01/06 | | 1,000,000 | CAD | | | 870,515 |
Province of Manitoba, 5.10%, 12/01/06 | | 1,090,000 | CAD | | | 948,290 |
| | | | | |
|
|
| | | | | | | 6,298,959 |
| | | | | |
|
|
Denmark 1.1% | | | | | | |
Government of Denmark, | | | | | | |
7.00%, 11/15/07 | | 1,450,000 | DKK | | | 247,169 |
5.00%, 11/15/13 | | 3,950,000 | DKK | | | 704,787 |
7.00%, 11/10/24 | | 1,300,000 | DKK | | | 304,027 |
| | | | | |
|
|
| | | | | | | 1,255,983 |
| | | | | |
|
|
Finland 1.3% | | | | | | |
Government of Finland, | | | | | | |
5.00%, 4/25/09 | | 660,000 | EUR | | | 831,152 |
5.375%, 7/04/13 | | 540,000 | EUR | | | 734,883 |
| | | | | |
|
|
| | | | | | | 1,566,035 |
| | | | | |
|
|
France 0.9% | | | | | | |
Government of France, 4.00%, 10/25/09 | | 845,000 | EUR | | | 1,036,908 |
| | | | | |
|
|
Germany 2.0% | | | | | | |
Government of Germany, 4.00%, 2/16/07 | | 110,000 | EUR | | | 132,008 |
KfW Bankengruppe, | | | | | | |
8.25%, 9/20/07 | | 36,000,000 | ISK | | | 568,857 |
senior note, 6.375%, 2/17/15 | | 2,530,000 | NZD | | | 1,728,296 |
| | | | | |
|
|
| | | | | | | 2,429,161 |
| | | | | |
|
|
TGI-12
Franklin Templeton Variable Insurance Products Trust
Statement of Investments, December 31, 2005 (continued)
| | | | | | |
| Templeton Global Income Securities Fund | | Principal
Amounta | | | Value |
Long Term Investments (cont.) | | | | | | |
Greece 1.0% | | | | | | |
Government of the Hellenic Republic, | | | | | | |
3.25%, 6/21/07 | | 270,000 | EUR | | $ | 321,334 |
4.60%, 5/20/13 | | 700,000 | EUR | | | 894,825 |
| | | | | |
|
|
| | | | | | | 1,216,159 |
| | | | | |
|
|
Iceland 1.1% | | | | | | |
Inter-American Development Bank, 9.00%, 1/04/07 | | 79,500,000 | ISK | | | 1,262,525 |
| | | | | |
|
|
Indonesia 6.3% | | | | | | |
Government of Indonesia, | | | | | | |
14.00%, 6/15/09 | | 13,407,000,000 | IDR | | | 1,393,891 |
13.15%, 3/15/10 | | 8,880,000,000 | IDR | | | 899,500 |
15.425%, 9/15/10 | | 450,000,000 | IDR | | | 49,192 |
10.00%, 10/15/11 | | 1,800,000,000 | IDR | | | 158,595 |
11.00%, 12/15/12 | | 450,000,000 | IDR | | | 40,728 |
14.25%, 6/15/13 | | 11,269,000,000 | IDR | | | 1,187,796 |
14.275%, 12/15/13 | | 21,167,000,000 | IDR | | | 2,239,052 |
11.00%, 10/15/14 | | 3,390,000,000 | IDR | | | 299,141 |
10.75%, 5/15/16 | | 3,300,000,000 | IDR | | | 280,023 |
10.00%, 7/15/17 | | 3,500,000,000 | IDR | | | 277,803 |
11.00%, 11/15/20 | | 9,600,000,000 | IDR | | | 793,734 |
| | | | | |
|
|
| | | | | | | 7,619,455 |
| | | | | |
|
|
Ireland 0.9% | | | | | | |
Government of Ireland, 5.00%, 4/18/13 | | 800,000 | EUR | | | 1,058,126 |
| | | | | |
|
|
Italy 0.0%c | | | | | | |
Government of Italy, 7.75%, 11/01/06 | | 41,293 | EUR | | | 50,894 |
| | | | | |
|
|
Malaysia 4.5% | | | | | | |
Government of Malaysia, | | | | | | |
6.90%, 3/15/07 | | 800,000 | MYR | | | 220,368 |
8.60%, 12/01/07 | | 4,270,000 | MYR | | | 1,237,390 |
3.135%, 12/17/07 | | 3,500,000 | MYR | | | 920,721 |
6.45%, 7/01/08 | | 4,600,000 | MYR | | | 1,302,897 |
4.305%, 2/27/09 | | 3,660,000 | MYR | | | 988,573 |
4.032%, 9/15/09 | | 1,850,000 | MYR | | | 497,084 |
3.644%, 8/25/10 | | 1,100,000 | MYR | | | 290,838 |
| | | | | |
|
|
| | | | | | | 5,457,871 |
| | | | | |
|
|
Mexico 0.5% | | | | | | |
dGovernment of Mexico, 144A, 7.50%, 3/08/10 | | 450,000 | EUR | | | 607,288 |
| | | | | |
|
|
Netherlands 0.6% | | | | | | |
Government of the Netherlands, | | | | | | |
3.00%, 7/15/06 | | 150,000 | EUR | | | 177,943 |
5.75%, 2/15/07 | | 488,000 | EUR | | | 596,368 |
| | | | | |
|
|
| | | | | | | 774,311 |
| | | | | |
|
|
New Zealand 2.5% | | | | | | |
Government of New Zealand, 7.00%, 7/15/09 | | 3,680,000 | NZD | | | 2,594,985 |
Inter-American Development Bank, 6.00%, 12/15/17 | | 575,000 | NZD | | | 381,689 |
| | | | | |
|
|
| | | | | | | 2,976,674 |
| | | | | |
|
|
Norway 5.9% | | | | | | |
Government of Norway, 6.75%, 1/15/07 | | 45,660,000 | NOK | | | 7,032,233 |
| | | | | |
|
|
TGI-13
Franklin Templeton Variable Insurance Products Trust
Statement of Investments, December 31, 2005 (continued)
| | | | | | |
| Templeton Global Income Securities Fund | | Principal Amounta | | | Value |
Long Term Investments (cont.) | | | | | | |
Peru 2.4% | | | | | | |
Government of Peru, | | | | | | |
8.60%, 8/12/17 | | 6,185,000 | PEN | | $ | 1,848,661 |
7.84%, 8/12/20 | | 3,730,000 | PEN | | | 1,044,367 |
| | | | | |
|
|
| | | | | | | 2,893,028 |
| | | | | |
|
|
Philippines 1.1% | | | | | | |
Government of the Philippines, | | | | | | |
9.00%, 2/15/13 | | 800,000 | | | | 889,000 |
Reg S, 9.125%, 2/22/10 | | 330,000 | EUR | | | 444,778 |
| | | | | |
|
|
| | | | | | | 1,333,778 |
| | | | | |
|
|
Poland 7.7% | | | | | | |
Government of Poland, | | | | | | |
8.50%, 11/12/06 | | 4,720,000 | PLN | | | 1,501,580 |
8.50%, 5/12/07 | | 5,990,000 | PLN | | | 1,938,839 |
6.00%, 5/24/09 | | 8,195,000 | PLN | | | 2,612,385 |
6.25%, 10/24/15 | | 3,690,000 | PLN | | | 1,235,358 |
5.75%, 9/23/22 | | 5,800,000 | PLN | | | 1,905,421 |
| | | | | |
|
|
| | | | | | | 9,193,583 |
| | | | | |
|
|
Singapore 4.8% | | | | | | |
Government of Singapore, | | | | | | |
1.75%, 2/01/07 | | 700,000 | SGD | | | 416,792 |
4.00%, 3/01/07 | | 7,160,000 | SGD | | | 4,386,762 |
2.625%, 10/01/07 | | 1,630,000 | SGD | | | 978,765 |
| | | | | |
|
|
| | | | | | | 5,782,319 |
| | | | | |
|
|
Slovak Republic 3.1% | | | | | | |
Government of Slovakia, | | | | | | |
4.95%, 3/05/08 | | 4,000,000 | SKK | | | 129,150 |
4.80%, 4/14/09 | | 33,500,000 | SKK | | | 1,092,063 |
4.90%, 2/05/10 | | 1,000,000 | SKK | | | 33,027 |
8.50%, 8/17/10 | | 30,000,000 | SKK | | | 1,134,028 |
7.50%, 3/13/12 | | 19,000,000 | SKK | | | 723,894 |
5.00%, 1/22/13 | | 6,000,000 | SKK | | | 204,754 |
4.90%, 2/11/14 | | 4,900,000 | SKK | | | 166,842 |
5.30%, 5/12/19 | | 6,700,000 | SKK | | | 240,580 |
| | | | | |
|
|
| | | | | | | 3,724,338 |
| | | | | |
|
|
South Africa 0.2% | | | | | | |
Government of South Africa, 5.25%, 5/16/13 | | 200,000 | EUR | | | 256,753 |
| | | | | |
|
|
South Korea 14.5% | | | | | | |
Government of Korea, | | | | | | |
6.90%, 1/16/07 | | 1,200,000,000 | KRW | | | 1,217,167 |
4.75%, 3/03/07 | | 5,740,000,000 | KRW | | | 5,694,251 |
3.75%, 9/10/07 | | 2,550,000,000 | KRW | | | 2,480,916 |
4.50%, 9/09/08 | | 1,945,000,000 | KRW | | | 1,903,667 |
4.00%, 6/10/10 | | 3,300,000,000 | KRW | | | 3,111,053 |
Korea Treasury Note, 4.75%, 3/12/08 | | 3,093,000,000 | KRW | | | 3,051,663 |
| | | | | |
|
|
| | | | | | | 17,458,717 |
| | | | | |
|
|
Spain 0.4% | | | | | | |
Government of Spain, 6.00%, 1/31/08 | | 390,000 | EUR | | | 489,327 |
| | | | | |
|
|
TGI-14
Franklin Templeton Variable Insurance Products Trust
Statement of Investments, December 31, 2005 (continued)
| | | | | | |
| Templeton Global Income Securities Fund | | Principal Amounta | | | Value |
Long Term Investments (cont.) | | | | | | |
Sweden 5.0% | | | | | | |
Government of Sweden, | | | | | | |
3.50%, 4/20/06 | | 2,100,000 | SEK | | $ | 265,596 |
8.00%, 8/15/07 | | 31,790,000 | SEK | | | 4,341,492 |
5.25%, 3/15/11 | | 3,900,000 | SEK | | | 539,879 |
5.50%, 10/08/12 | | 6,280,000 | SEK | | | 897,798 |
| | | | | |
|
|
| | | | | | | 6,044,765 |
| | | | | |
|
|
Thailand 1.5% | | | | | | |
Government of Thailand, | | | | | | |
8.00%, 12/08/06 | | 60,700,000 | THB | | | 1,534,479 |
4.125%, 2/12/08 | | 9,000,000 | THB | | | 216,054 |
8.50%, 12/08/08 | | 1,000,000 | THB | | | 26,633 |
| | | | | |
|
|
| | | | | | | 1,777,166 |
| | | | | |
|
|
United Kingdom 0.3% | | | | | | |
Government of United Kingdom, 7.50%, 12/07/06 | | 175,000 | GBP | | | 310,066 |
| | | | | |
|
|
Venezuela 0.0%c | | | | | | |
bGovernment of Venezuela, FRN, 5.194%, 4/20/11 | | 40,000 | | | | 39,250 |
| | | | | |
|
|
Total Long Term Investments (Cost $96,705,093) | | | | | | 100,055,327 |
| | | | | |
|
|
Short Term Investments 11.1% | | | | | | |
Austria 1.1% | | | | | | |
Government of Austria, 9.00%, 9/15/06 | | 85,000,000 | ISK | | | 1,347,646 |
| | | | | |
|
|
Canada 2.8% | | | | | | |
eCanada Treasury Bill, 11/30/06 | | 360,000 | CAD | | | 298,559 |
Province of Ontario, | | | | | | |
7.75%, 7/24/06 | | 1,600,000 | CAD | | | 1,406,659 |
3.50%, 9/08/06 | | 1,920,000 | CAD | | | 1,649,155 |
| | | | | |
|
|
| | | | | | | 3,354,373 |
| | | | | |
|
|
Egypt 1.7% | | | | | | |
eEgypt Treasury Bills, 5/30/06 - 12/05/06 | | 12,200,000 | EGP | | | 2,028,602 |
| | | | | |
|
|
Norway 0.3% | | | | | | |
eNorway Treasury Bill, 3/15/06 | | 2,400,000 | NOK | | | 354,113 |
| | | | | |
|
|
Sweden 1.1% | | | | | | |
eGovernment of Sweden, Strip, 9/20/06 | | 8,450,000 | SEK | | | 1,046,457 |
eSweden Treasury Bill, 12/20/06 | | 2,000,000 | SEK | | | 246,253 |
| | | | | |
|
|
| | | | | | | 1,292,710 |
| | | | | |
|
|
Thailand 4.1% | | | | | | |
eBank of Thailand Bond, Strip, 4/07/06 | | 8,400,000 | THB | | | 202,841 |
eThailand Treasury Bills, 4/17/06 - 11/30/06 | | 202,250,000 | THB | | | 4,793,203 |
| | | | | |
|
|
| | | | | | | 4,996,044 |
| | | | | |
|
|
Total Short Term Investments (Cost $13,508,452) | | | | | | 13,373,488 |
| | | | | |
|
|
Total Investments (Cost $110,213,545) 94.4% | | | | | | 113,428,815 |
Net Unrealized Gain on Forward Exchange Contracts 0.00%c | | | | | | 47,200 |
Other Assets, less Liabilities 5.6% | | | | | | 6,663,006 |
| | | | | |
|
|
Net Assets 100.0% | | | | | $ | 120,139,021 |
| | | | | |
|
|
TGI-15
Franklin Templeton Variable Insurance Products Trust
Statement of Investments, December 31, 2005 (continued)
| | | | |
| Templeton Global Income Securities Fund | | | | |
Currency Abbreviations
AUD - Australian Dollar
CAD - Canadian Dollar
DKK - Danish Krone
EUR - Euro
EGP - Egyptian Pound
GBP - British Pound
IDR - Indonesian Rupiah
ISK - Iceland Krona
KRW - South Korean Won
MYR - Malaysian Ringgit
NOK - Norwegian Krone
NZD - New Zealand Dollar
PEN - Peruvian Nuevo Sol
PLN - Polish Zloty
SEK - Swedish Krona
SGD - Singapore Dollar
SKK - Slovak Koruna
THB - Thai Baht
Selected Portfolio Abbreviations
FRN - Floating Rate Note
aThe principal amount is stated in U.S. dollars unless otherwise indicated.
bThe coupon rate shown represents the rate at period end.
cRounds to less than 0.05% of net assets.
dSecurity was purchased pursuant to Rule 144A under the Securities Act of 1933 and may be sold in transactions exempt from registration only to qualified institutional buyers or in a public offering registered under the Securities Act of 1933. These securities have been deemed liquid under the guidelines approved by the Fund’s Board of Trustees. At December 31, 2005, the value of these securities was $607,288, representing 0.50% of net assets.
eThe security is traded on a discount basis with no stated coupon rate.
TGI-16
Franklin Templeton Variable Insurance Products Trust
Financial Statements
Statement of Assets and Liabilities
December 31, 2005
| | | | |
| | | Templeton
Global Income
Securities Fund
| |
Assets: | | | | |
Investments in securities: | | | | |
Cost | | $ | 110,213,545 | |
| | |
|
|
|
Value | | $ | 113,428,815 | |
Cash | | | 7,304,362 | |
Receivables: | | | | |
Investment securities sold | | | 305,457 | |
Capital shares sold | | | 280,021 | |
Interest | | | 2,300,302 | |
Unrealized gain on forward exchange contracts (Note 7) | | | 47,200 | |
| | |
|
|
|
Total assets | | | 123,666,157 | |
| | |
|
|
|
Liabilities: | | | | |
Payables: | | | | |
Investment securities purchased | | | 3,140,446 | |
Capital shares redeemed | | | 19,099 | |
Affiliates | | | 89,078 | |
Foreign cash advanced by custodian (cost $241,634) | | | 242,015 | |
Accrued expenses and other liabilities | | | 36,498 | |
| | |
|
|
|
Total liabilities | | | 3,527,136 | |
| | |
|
|
|
Net assets, at value | | $ | 120,139,021 | |
| | |
|
|
|
Net assets consist of: | | | | |
Paid-in capital | | $ | 120,192,222 | |
Undistributed net investment income | | | 4,412,581 | |
Net unrealized appreciation (depreciation) | | | 3,228,119 | |
Accumulated net realized gain (loss) | | | (7,693,901 | ) |
| | |
|
|
|
Net assets, at value | | $ | 120,139,021 | |
| | |
|
|
|
Class 1: | | | | |
Net assets, at value | | $ | 53,114,950 | |
| | |
|
|
|
Shares outstanding | | | 3,697,861 | |
| | |
|
|
|
Net asset value and offering price per share | | | $14.36 | |
| | |
|
|
|
Class 2: | | | | |
Net assets, at value | | $ | 61,254,919 | |
| | |
|
|
|
Shares outstanding | | | 4,317,803 | |
| | |
|
|
|
Net asset value and offering price per share | | | $14.19 | |
| | |
|
|
|
Class 3: | | | | |
Net assets, at value | | $ | 5,769,152 | |
| | |
|
|
|
Shares outstanding | | | 406,720 | |
| | |
|
|
|
Net asset value and offering price per sharea | | | $14.18 | |
| | |
|
|
|
a Redemption price is equal to net asset value less any redemption fees retained by the Fund.
See notes to financial statements.
TGI-17
Franklin Templeton Variable Insurance Products Trust
Financial Statements (continued)
Statement of Operations
for the year ended December 31, 2005
| | | | |
| | | Templeton
Global Income
Securities Fund
| |
Investment income: | | | | |
Interest (net of foreign taxes $132,073) | | | 4,043,929 | |
| | |
|
|
|
Expenses: | | | | |
Management fees (Note 3a) | | | 548,337 | |
Distribution fees: (Note 3c) | | | | |
Class 2 | | | 91,555 | |
Class 3 | | | 4,377 | |
Unaffiliated transfer agent fees | | | 853 | |
Custodian fees (Note 4) | | | 67,698 | |
Reports to shareholders | | | 53,577 | |
Professional fees | | | 19,388 | |
Trustees’ fees and expenses | | | 431 | |
Other | | | 6,662 | |
| | |
|
|
|
Total expenses | | | 792,878 | |
Expense reductions (Note 4) | | | (41,008 | ) |
| | |
|
|
|
Net expenses | | | 751,870 | |
| | |
|
|
|
Net investment income | | | 3,292,059 | |
| | |
|
|
|
Realized and unrealized gains (losses): | | | | |
Net realized gain (loss) from: | | | | |
Investments | | | 3,944,766 | |
Foreign currency transactions | | | (45,206 | ) |
| | |
|
|
|
Net realized gain (loss) | | | 3,899,560 | |
| | |
|
|
|
Net change in unrealized appreciation (depreciation) on: | | | | |
Investments | | | (9,094,628 | ) |
Translation of assets and liabilities denominated in foreign currencies | | | (131,822 | ) |
| | |
|
|
|
Net change in unrealized appreciation (depreciation) | | | (9,226,450 | ) |
| | |
|
|
|
Net realized and unrealized gain (loss) | | | (5,326,890 | ) |
| | |
|
|
|
Net increase (decrease) in net assets resulting from operations | | $ | (2,034,831 | ) |
| | |
|
|
|
See notes to financial statements.
TGI-18
Franklin Templeton Variable Insurance Products Trust
Financial Statements (continued)
Statements of Changes in Net Assets
| | | | | | | | |
| | | Templeton Global Income
Securities Fund
| |
| | | Year Ended December 31,
| |
| | | 2005 | | | 2004 | |
| | |
| |
Increase (decrease) in net assets: | | | | | | | | |
Operations: | | | | | | | | |
Net investment income | | $ | 3,292,059 | | | $ | 2,517,578 | |
Net realized gain (loss) from investments and foreign currency transactions | | | 3,899,560 | | | | 3,274,668 | |
Net change in unrealized appreciation (depreciation) on investments and translation of assets and liabilities denominated in foreign currencies | | | (9,226,450 | ) | | | 2,897,782 | |
| | |
| |
Net increase (decrease) in net assets resulting from operations | | | (2,034,831 | ) | | | 8,690,028 | |
| | |
| |
Distributions to shareholders from: | | | | | | | | |
Net investment income: | | | | | | | | |
Class 1 | | | (3,016,853 | ) | | | (5,364,377 | ) |
Class 2 | | | (2,073,846 | ) | | | (706,986 | ) |
Class 3 | | | (32,207 | ) | | | — | |
| | |
| |
Total distributions to shareholders | | | (5,122,906 | ) | | | (6,071,363 | ) |
| | |
| |
Capital share transactions: (Note 2) | | | | | | | | |
Class 1 | | | 7,710,594 | | | | (4,352,338 | ) |
Class 2 | | | 44,184,638 | | | | 13,335,159 | |
Class 3 | | | 5,777,317 | | | | — | |
| | |
| |
Total capital share transactions | | | 57,672,549 | | | | 8,982,821 | |
| | |
| |
Redemption fees | | | 36 | | | | — | |
| | |
| |
Net increase (decrease) in net assets | | | 50,514,848 | | | | 11,601,486 | |
Net assets: | | | | | | | | |
Beginning of year | | | 69,624,173 | | | | 58,022,687 | |
| | |
| |
End of year | | $ | 120,139,021 | | | $ | 69,624,173 | |
| | |
| |
Undistributed net investment income included in net assets: | | | | | | | | |
End of year | | $ | 4,412,581 | | | $ | 3,781,771 | |
| | |
| |
See notes to financial statements.
TGI-19
Franklin Templeton Variable Insurance Products Trust
Notes to Financial Statements
Templeton Global Income Securities Fund
1. ORGANIZATION AND SIGNIFICANT ACCOUNTING POLICIES
Franklin Templeton Variable Insurance Products Trust (the Trust) is registered under the Investment Company Act of 1940 as an open-end investment company, consisting of twenty-two separate series. The Templeton Global Income Securities Fund (the Fund) included in this report is non-diversified. The financial statements of the remaining funds in the series are presented separately. Shares of the Fund are sold only to insurance company separate accounts to fund the benefits of variable life insurance policies or variable annuity contracts.
The following summarizes the Fund’s significant accounting policies.
a. Security Valuation
Securities listed on a securities exchange or on the NASDAQ National Market System are valued at the last quoted sale price or the official closing price of the day, respectively. Over-the-counter securities and listed securities for which there is no reported sale are valued within the range of the most recent quoted bid and ask prices. Securities that trade in multiple markets or on multiple exchanges are valued according to the broadest and most representative market.
Corporate debt securities and government securities generally trade in the over-the-counter market rather than on a securities exchange. The Trust may utilize independent pricing services, quotations from bond dealers, and information with respect to bond and note transactions, to assist in determining a current market value for each security. The Trust’s pricing services may use valuation models or matrix pricing which considers information with respect to comparable bond and note transactions, quotations from bond dealers, or by reference to other securities that are considered comparable in such characteristics as rating, interest rate and maturity date, option adjusted spread models, prepayment projections, interest rate spreads and yield curves, to determine current value.
Foreign securities are valued as of the close of trading on the foreign stock exchange on which the security is primarily traded, or the NYSE, whichever is earlier. If no sale is reported at that time, the foreign security will be valued within the range of the most recent quoted bid and ask prices. The value is then converted into its U.S. dollar equivalent at the foreign exchange rate in effect at the close of the NYSE on the day that the value of the foreign security is determined.
The Trust has procedures to determine the fair value of individual securities and other assets for which market prices are not readily available or which may not be reliably priced. Methods for valuing these securities may include: fundamental analysis, matrix pricing, discounts from market prices of similar securities, or discounts applied due to the nature and duration of restrictions on the disposition of the securities. Due to the inherent uncertainty of valuations of such securities, the fair values may differ significantly from the values that would have been used had a ready market for such investments existed. Occasionally, events occur between the time at which trading in a security is completed and the close of the NYSE that might call into question the availability (including the reliability) of the value of a portfolio security held by the Fund. If such an event occurs, the securities may be valued using fair value procedures, which may include the use of independent pricing services. All security valuation procedures are approved by the Trust’s Board of Trustees.
b. Foreign Currency Translation
Portfolio securities and other assets and liabilities denominated in foreign currencies are translated into U.S. dollars based on the exchange rate of such currencies against U.S. dollars on the date of valuation. Purchases and sales of securities, income and expense items denominated in foreign currencies are translated into U.S. dollars at the exchange rate in effect on the transaction date. Occasionally, events may impact the availability or reliability of foreign exchange rates used to convert the U.S. dollar equivalent value. If such an event occurs, the foreign exchange rate will be valued at fair value using procedures established and approved by the Trust’s Board of Trustees.
The Fund does not separately report the effect of changes in foreign exchange rates from changes in market prices on securities held. Such changes are included in net realized and unrealized gain or loss from investments on the Statement of Operations.
TGI-20
Franklin Templeton Variable Insurance Products Trust
Notes to Financial Statements (continued)
Templeton Global Income Securities Fund
1. ORGANIZATION AND SIGNIFICANT ACCOUNTING POLICIES (continued)
Realized foreign exchange gains or losses arise from sales of foreign currencies, currency gains or losses realized between the trade and settlement dates on securities transactions and the difference between the recorded amounts of dividends, interest, and foreign withholding taxes and the U.S. dollar equivalent of the amounts actually received or paid. Net unrealized foreign exchange gains and losses arise from changes in foreign exchange rates on foreign denominated assets and liabilities other than investments in securities held at the end of the reporting period.
c. Foreign Currency Contracts
The Fund may enter into forward exchange contracts to hedge against fluctuations in foreign exchange rates. A forward exchange contract is an agreement between two parties to exchange different currencies at an agreed upon exchange rate at a future date. These contracts are valued daily by the Fund and the net unrealized gain or loss on the contracts, as measured by the difference between the contractual forward foreign exchange rates and the forward rates at the reporting date, is included in the Statement of Assets and Liabilities. Realized and unrealized gains and losses on these contracts are included in the Statement of Operations.
When the Fund purchases or sells foreign securities it may enter into foreign exchange contracts to minimize foreign exchange risk from the trade date to the settlement date of the transactions. Realized and unrealized gains and losses on these contracts are included in the Statement of Operations.
The risks of these contracts include movement in the values of the foreign currencies relative to the U.S. dollar and the possible inability of the counterparties to fulfill their obligations under the contracts, which may be in excess of the amount reflected in the Statement of Assets and Liabilities.
d. Income Taxes
No provision has been made for U.S. income taxes because the Fund’s policy is to continue to qualify as a regulated investment company under the Internal Revenue Code and to distribute to shareholders substantially all of its taxable income and net realized gains.
Foreign securities held by the Fund may be subject to foreign taxation. Foreign taxes, if any, are recorded based on the tax regulations and rates that exist in the foreign markets in which the Fund invests.
e. Security Transactions, Investment Income, Expenses and Distributions
Security transactions are accounted for on trade date. Realized gains and losses on security transactions are determined on a specific identification basis. Interest income and estimated expenses are accrued daily. Amortization of premium and accretion of discount on debt securities are included in interest income. Distributions to shareholders are recorded on the ex-dividend date and are determined according to income tax regulations (tax basis). Such distributions are reinvested in additional shares of the Fund. Distributable earnings determined on a tax basis may differ from earnings recorded in accordance with generally
accepted accounting principles. These differences may be permanent or temporary. Permanent differences are reclassified among capital accounts to reflect their tax character. These reclassifications have no impact on net assets or the results of operations. Temporary differences are not reclassified, as they may reverse in subsequent periods.
Common expenses incurred by the Trust are allocated among the funds based on the ratio of net assets of each Fund to the combined net assets of the Trust. Fund specific expenses are charged directly to the fund that incurred the expense.
Realized and unrealized gains and losses and net investment income, other than class specific expenses, are allocated daily to each class of shares based upon the relative proportion of net assets of each class.
TGI-21
Franklin Templeton Variable Insurance Products Trust
Notes to Financial Statements (continued)
Templeton Global Income Securities Fund
1. ORGANIZATION AND SIGNIFICANT ACCOUNTING POLICIES (continued)
f. Accounting Estimates
The preparation of financial statements in accordance with accounting principles generally accepted in the United States of America requires management to make estimates and assumptions that affect the reported amounts of assets and liabilities at the date of the financial statements and the amounts of income and expenses during the reporting period. Actual results could differ from those estimates.
g. Redemption Fees
Redemptions and exchanges of Class 3 shares held 60 days or less may be subject to the Fund’s redemption fee, which is 1% of the amount redeemed. Such fees are retained by the Fund and accounted for as an addition to paid-in capital.
h. Guarantees and Indemnifications
Under the Trust’s organizational documents, its officers and trustees are indemnified by the Trust against certain liabilities arising out of the performance of their duties to the Trust. Additionally, in the normal course of business, the Trust enters into contracts with service providers that contain general indemnification clauses. The Trust’s maximum exposure under these arrangements is unknown as this would involve future claims that may be made against the Trust that have not yet occurred. However, based on experience, the Trust expects the risk of loss to be remote.
2. SHARES OF BENEFICIAL INTEREST
The Fund offers three classes of shares: Class 1, Class 2, and Class 3. Effective April 1, 2005, the Fund began offering a new class of shares, Class 3. Each class of shares differs by its distribution fees, voting rights on matters affecting a single class and its exchange privilege.
At December 31, 2005, there were an unlimited number of shares authorized ($0.01 par value). Transactions in the Fund’s shares were as follows:
| | | | | | | | | | | | | | |
| | | Year Ended December 31,
| |
| | | 2005
| | | 2004
| |
| Class 1 Shares: | | Shares
| | | Amount
| | | Shares
| | | Amount
| |
Shares sold | | 1,067,253 | | | $ | 15,508,065 | | | 142,426 | | | $ | 2,100,636 | |
Shares issued in reinvestment of distributions | | 210,969 | | | | 3,016,853 | | | 400,626 | | | | 5,364,377 | |
Shares redeemed | | (735,231 | ) | | | (10,814,324 | ) | | (788,314 | ) | | | (11,817,351 | ) |
| | |
| |
Net increase (decrease) | | 542,991 | | | $ | 7,710,594 | | | (245,262 | ) | | $ | (4,352,338 | ) |
| | |
| |
| Class 2 Shares: | | | | | | | | | | | | |
Shares sold | | 3,017,652 | | | $ | 43,735,355 | | | 973,769 | | | $ | 14,111,268 | |
Shares issued in reinvestment of distributions | | 146,665 | | | | 2,073,846 | | | 53,237 | | | | 706,986 | |
Shares redeemed | | (110,837 | ) | | | (1,624,563 | ) | | (98,666 | ) | | | (1,483,095 | ) |
| | |
| |
Net increase (decrease) | | 3,053,480 | | | $ | 44,184,638 | | | 928,340 | | | $ | 13,335,159 | |
| | |
| |
| Class 3 Shares: | | | | | | | | | | | | |
Shares sold | | 427,371 | | | $ | 6,068,634 | | | | | | | | |
Shares issued in reinvestment of distributions | | 2,233 | | | | 31,575 | | | | | | | | |
Shares redeemed | | (22,884 | ) | | | (322,892 | ) | | | | | | | |
| | |
| | | | | | | |
Net increase (decrease) | | 406,720 | | | $ | 5,777,317 | | | | | | | | |
| | |
| | | | | | | |
TGI-22
Franklin Templeton Variable Insurance Products Trust
Notes to Financial Statements (continued)
Templeton Global Income Securities Fund
3. TRANSACTIONS WITH AFFILIATES
Franklin Resources, Inc. is the holding company for various subsidiaries that together are referred to as Franklin Templeton Investments. Certain officers and trustees of the Trust are also officers and/or directors of the following subsidiaries:
| | |
| Subsidiary | | Affiliation |
Franklin Advisers, Inc. (Advisers) | | Investment manager |
Franklin Templeton Services, LLC (FT Services) | | Administrative manager |
Franklin Templeton Distributors, Inc. (Distributors) | | Principal underwriter |
Franklin Templeton Investor Services, LLC (Investor Services) | | Transfer agent |
a. Management Fees
The Fund pays an investment management fee to Advisers based on the average daily net assets of the Fund as follows:
| | |
| Annualized Fee Rate | | Net Assets |
| 0.625% | | Up to and including $100 million |
| 0.500% | | Over $100 million, up to and including $250 million |
| 0.450% | | Over $250 million, up to and including $10 billion |
| 0.440% | | Over $10 billion, up to and including $12.5 billion |
| 0.420% | | Over $12.5 billion, up to and including $15 billion |
| 0.400% | | In excess of $15 billion |
b. Administrative Fees
Under an agreement with Advisers, FT Services provides administrative services to the Fund. The fee is paid by Advisers based on average daily net assets, and is not an additional expense of the Fund.
c. Distribution Fees
The Fund’s Board of Trustees has adopted distribution plans for Class 2 and Class 3 shares pursuant to Rule 12b-1 under the 1940 Act. Under the Fund’s compensation distribution plans, the Fund pays Distributors for costs incurred in connection with the sale and distribution of the Fund’s shares up to 0.35% per year of its average daily net assets of each class. The Board of Trustees has set the current rate at 0.25% per year.
d. Transfer Agent Fees
Investor Services, under terms of an agreement, performs shareholder servicing for the Fund and is not paid by the Fund for the services.
4. EXPENSE OFFSET ARRANGEMENT
The Fund has entered into an arrangement with its custodian whereby credits realized as a result of uninvested cash balances are used to reduce a portion of the Fund’s custodian expenses. During the year ended December 31, 2005, the custodian fees were reduced as noted in the Statement of Operations.
TGI-23
Franklin Templeton Variable Insurance Products Trust
Notes to Financial Statements (continued)
Templeton Global Income Securities Fund
5. INCOME TAXES
At December 31, 2005, the Fund had tax basis capital losses which may be carried over to offset future capital gains, if any. During the year ended December 31, 2005, the Fund utilized $1,437,903 of capital loss carryforwards. At December 31, 2005, the capital loss carryforwards were as follows:
| | | |
Capital loss carryforwards expiring in: | | | |
2007 | | $ | 3,445,173 |
2008 | | | 2,370,518 |
2009 | | | 1,649,033 |
2010 | | | 177,731 |
| | |
|
| | | $ | 7,642,455 |
| | |
|
The tax character of distributions paid during the years ended December 31, 2005 and 2004, was as follows:
| | | | | | |
| | | 2005
| | 2004
|
Distributions paid from ordinary income | | $ | 5,122,906 | | $ | 6,071,363 |
| | |
|
|
At December 31, 2005, the cost of investments, net unrealized appreciation (depreciation) and undistributed ordinary income for income tax purposes were as follows:
| | | | |
Cost of investments | | $ | 111,555,785 | |
| | |
|
|
|
| |
Unrealized appreciation | | $ | 5,344,640 | |
Unrealized depreciation | | | (3,471,610 | ) |
| | |
|
|
|
Net unrealized appreciation (depreciation) | | $ | 1,873,030 | |
| | |
|
|
|
Distributable earnings - undistributed ordinary income | | $ | 5,703,378 | |
| | |
|
|
|
Net investment income differs for financial statement and tax purposes primarily due to differing treatments of foreign currency transactions, and bond discounts and premiums.
Net realized gains (losses) differ for financial statement and tax purposes primarily due to differing treatments of wash sales, foreign currency transactions, and bond discounts and premiums.
6. INVESTMENT TRANSACTIONS
Purchases and sales of investments (excluding short term securities) for the year ended December 31, 2005, aggregated $70,626,734 and $24,837,116, respectively.
TGI-24
Franklin Templeton Variable Insurance Products Trust
Notes to Financial Statements (continued)
Templeton Global Income Securities Fund
7. FORWARD EXCHANGE CONTRACTS
At December 31, 2005, the Fund had outstanding forward exchange contracts as set out below.
| | | | | | | | | |
Contracts to Buy | | Contract
Amounta | | | Settlement
Date | | Unrealized
Gain (Loss) |
| 25,000,000 | | Indian Rupee | | 811,530 | NZD | | 6/21/06 | | $ 6,674 |
| 11,600,000 | | Thai Baht | | 407,991 | NZD | | 11/30/06 | | 10,558 |
| 11,600,000 | | Thai Baht | | 406,554 | NZD | | 12/06/06 | | 11,611 |
| 295,000,000 | | South Korean Won | | 413,015 | NZD | | 12/06/06 | | 18,357 |
| | | | |
|
| | | |
|
| | | | | 2,039,090 | NZD | | | | 47,200 |
| | | | |
|
| | | |
|
| Net unrealized gain (loss) on forward exchange contracts | | | | | | | $47,200 |
| | | | | | | | | |
|
| a | In U.S. dollars unless otherwise indicated. |
Currency Abbreviations
8. CREDIT RISK
The Fund has 14.18% of its portfolio invested in below investment grade and comparable quality unrated high yield securities, which tend to be more sensitive to economic conditions than higher rated securities. The risk of loss due to default by the issuer may be significantly greater for the holders of high yielding securities because such securities are generally unsecured and are often subordinated to other creditors of the issuer.
9. CONCENTRATION OF RISK
Investing in foreign securities may include certain risks and considerations not typically associated with investing in U.S. securities, such as fluctuating currency values and changing local and regional economic, political and social conditions, which may result in greater market volatility. In addition, certain foreign securities may not be as liquid as U.S. securities.
10. REGULATORY MATTERS
As part of various investigations by a number of federal, state, and foreign regulators and governmental entities, relating to certain practices in the mutual fund industry, including late trading, market timing and marketing support payments to securities dealers who sell fund shares, Franklin Resources, Inc. and certain of its subsidiaries (collectively, the “Company”), entered into settlements with certain of those regulators.
Specifically, the Company entered into settlements with the Securities and Exchange Commission (“SEC”) concerning market timing (the “August 2, 2004 SEC Order”) and marketing support payments to securities dealers who sell fund shares (the “December 13, 2004 SEC Order”) and with the California Attorney General’s Office (“CAGO”) concerning marketing support payments to securities dealers who sell fund shares (the “CAGO Settlement”). Under the terms of the settlements with the SEC and the CAGO, the Company retained an Independent Distribution Consultant (“IDC”) to develop a plan for distribution of the respective settlement monies. The CAGO approved the distribution plan under the CAGO Settlement and, in accordance with the terms and conditions of that settlement, the monies were disbursed to the relevant funds. The SEC has not yet approved the distribution plan pertaining to the December 13, 2004 SEC Order. When approved, disbursements of settlement monies will be made promptly to the relevant funds, in accordance with the terms and conditions of that order. The IDC continues to develop the plan of distribution under the August 2, 2004 SEC Order that resolved the SEC’s market timing investigation.
In addition, the Company, as well as most of the mutual funds within Franklin Templeton Investments and certain current or former officers, directors, and/or employees, have been named in private lawsuits (styled as shareholder class actions, or as
TGI-25
Franklin Templeton Variable Insurance Products Trust
Notes to Financial Statements (continued)
Templeton Global Income Securities Fund
derivative actions on behalf of either the named funds or Franklin Resources, Inc.) relating to the industry practices referenced above, as well as to allegedly excessive advisory fees, commissions, and/or 12b-1 fees. The lawsuits were filed in different courts throughout the country. Many of those suits are now pending in a multi-district litigation in the United States District Court for the District of Maryland.
The Company and fund management strongly believe that the claims made in each of the private lawsuits referenced above are without merit and intend to defend against them vigorously. The Company cannot predict with certainty the eventual outcome of these lawsuits, nor whether they will have a material negative impact on the Company. If it is determined that the Company bears responsibility for any unlawful or inappropriate conduct that caused losses to the Trust, it is committed to making the Trust or their shareholders whole, as appropriate.
TGI-26
Franklin Templeton Variable Insurance Products Trust
Templeton Global Income Securities Fund
Report of Independent Registered Public Accounting Firm
To the Board of Trustees and Shareholders of
Franklin Templeton Variable Insurance Products Trust
In our opinion, the accompanying statement of assets and liabilities, including the statement of investments, and the related statements of operations and of changes in net assets and the financial highlights present fairly, in all material respects, the financial position of Templeton Global Income Securities Fund (one of the funds constituting Franklin Templeton Variable Insurance Products Trust, hereafter referred to as the “Fund”) at December 31, 2005, the results of its operations for the year then ended, the changes in its net assets for each of the two years in the period then ended and the financial highlights for each of the five years in the period then ended, in conformity with accounting principles generally accepted in the United States of America. These financial statements and financial highlights (hereafter referred to as “financial statements”) are the responsibility of the Fund’s management; our responsibility is to express an opinion on these financial statements based on our audits. We conducted our audits of these financial statements in accordance with the standards of the Public Company Accounting Oversight Board (United States). Those standards require that we plan and perform the audit to obtain reasonable assurance about whether the financial statements are free of material misstatement. An audit includes examining, on a test basis, evidence supporting the amounts and disclosures in the financial statements, assessing the accounting principles used and significant estimates made by management, and evaluating the overall financial statement presentation. We believe that our audits, which included confirmation of securities at December 31, 2005, by correspondence with the custodian and brokers, provide a reasonable basis for our opinion.
PricewaterhouseCoopers LLP
San Francisco, California
February 10, 2006
TGI-27
Franklin Templeton Variable Insurance Products Trust
Tax Designation (unaudited)
Templeton Global Income Securities Fund
At December 31, 2005, more than 50% of the Fund’s total assets were invested in securities of foreign issuers. In most instances, foreign taxes were withheld from dividends paid to the Fund on these investments. The Fund elects to treat foreign taxes paid as allowed under Section 853 of the Internal Revenue Code. This election will allow shareholders of record in June 2006, to treat their proportionate share of foreign taxes paid by the Fund as having been paid directly by them. The shareholder shall consider these amounts as foreign taxes paid in the tax year in which they receive the Fund distribution.
The foreign tax information will be disclosed in the June 30, 2006, semi-annual report of the Fund.
TGI-28
TEMPLETON GROWTH SECURITIES FUND
This annual report for Templeton Growth Securities Fund covers the fiscal year ended December 31, 2005.
Performance Summary as of 12/31/05
Average annual total return of Class 1 shares represents the average annual change in value, assuming reinvestment of dividends and capital gains. Average returns smooth out variations in returns, which can be significant; they are not the same as year-by-year results.
Periods ended 12/31/05
| | | | | | |
| | | 1-Year | | 5-Year | | 10-Year |
Average Annual Total Return | | +9.06% | | +6.34% | | +9.65% |
Total Return Index Comparison
for Hypothetical $10,000 Investment (1/1/96–12/31/05)
The graph below shows the change in value of a hypothetical $10,000 investment in the Fund over the indicated period and includes reinvestment of any income or distributions. The Fund’s performance is compared to the performance of the Morgan Stanley Capital International (MSCI) World Index and MSCI All Country (AC) World Index. The MSCI World Index is replacing the MSCI AC World Index as the Fund’s benchmark because the Fund’s manager believes the MSCI World Index better reflects the Fund’s investments. One cannot invest directly in an index, nor is an index representative of the Fund’s portfolio. Please see Important Notes to Performance Information preceding the Fund Summaries.
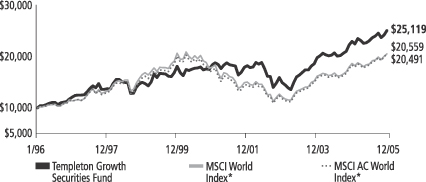
*Source: Standard & Poor’s Micropal. Please see Index Descriptions following the Fund Summaries.
Templeton Growth Securities Fund – Class 1
Performance reflects the Fund’s Class 1 operating expenses, but does not include any contract fees, expenses or sales charges. If they had been included, performance would be lower. These charges and deductions, particularly for variable life policies, can have a significant effect on contract values and insurance benefits. See the contract prospectus for a complete description of these expenses, including sales charges.
Performance data represent past performance, which does not guarantee future results. Investment return and principal value will fluctuate, and you may have a gain or loss when you sell your shares.
Current performance may differ from figures shown.
TG-1
Fund Goal and Main Investments: Templeton Growth Securities Fund seeks long-term capital growth. The Fund normally invests mainly in equity securities of companies located anywhere in the world, including those in the U.S. and in emerging markets.
Performance Overview
You can find the Fund’s one-year total return in the Performance Summary. The Fund underperformed its benchmarks, the MSCI World Index, which returned +10.02% and the MSCI AC World Index, which returned +11.37% for the period under review.1 We are replacing the MSCI World AC Index with the MSCI World Index as the Fund’s benchmark, because we believe the MSCI World Index better reflects the Fund’s Investments.
Economic and Market Overview
The global economy overcame fears of derailment generated by higher energy costs and advanced at a solid clip during 2005, with signs of firming recoveries in Europe and Japan. Excluding the volatile energy and food sectors, inflation remained relatively subdued worldwide, and monetary policy remained fairly accommodative. The U.S. Federal Reserve Board raised the short-term federal funds target rate with eight quarter-point increases, bringing it to 4.25%. The European Central Bank (ECB) made one quarter-point rise in short-term rates, its first increase after keeping rates at historically low levels for more than two and a half years. Even after the increases, both rates remained at levels considered accommodative for economic growth.
Strong demand for oil sustained high prices during most of the year, while prices for other commodities such as industrial metals were also high, led by copper, whose contract price rose 45.4% during 2005.2 This contributed to economic growth in countries such as Australia and Canada, and emerging markets in Asia and Latin America that are tied to mining and industrial commodities.
In this environment, global equity markets performed strongly, particularly outside the U.S. One-year total return for the MSCI AC World ex US Index was +17.11% in U.S. dollar terms.3 By comparison the total
1. Source: Standard & Poor’s Micropal. One cannot invest directly in an index, nor is an index representative of the Fund’s portfolio. Please see Index Descriptions following the Fund Summaries.
2. Source: New York Mercantile Exchange
3. Source: Standard & Poor’s Micropal. Please see Index descriptions following the Fund Summaries.
Fund Risks: The Fund’s investments in stocks offer the potential for long-term gains but can be subject to short-term up-and-down price movements. Foreign investing, especially in emerging markets, involves additional risks including currency fluctuations, economic instability, and social and political developments. Because the Fund invests in bonds and other debt obligations, the Fund’s share price and yield will be affected by interest rate movements. Bond prices generally move in the opposite direction from interest rates. Thus, as the prices of bonds in the Fund adjust to a rise in interest rates, the Fund’s share price may decline. High yield, lower-rated (junk) bonds generally have greater price swings and higher default risks. The Fund’s prospectus also includes a description of the main investment risks.
TG-2
return for the MSCI USA Index was +5.72%.4 In terms of sectors, energy and materials led equity market performance, and telecommunication services and consumer-related sectors lagged.
Among developed countries, the Japanese equity market performed well, returning +44.70% in local currency terms for the year under review.4 However, this market benefited primarily from investors outside Japan, and the return was significantly less (+25.62%) after conversion into U.S. dollars.4 In contrast, the conversion into dollars enhanced equity market returns in Brazil (+57.04%), Mexico (+49.11%) and South Korea (+58.00%).4 At the beginning of the year, the consensus of many analysts appeared to be that the U.S. dollar would decline in value relative to major currencies. In fact, for the year the dollar appreciated versus the yen, the euro, the pound and most other currencies.
Investment Strategy
Our investment philosophy is bottom-up, value-oriented and long-term. In choosing investments, we will focus on the market price of a company’s securities relative to our evaluation of the company’s potential long-term earnings, asset value and cash flow. Among factors we may consider are a company’s historical value measures, including price/earnings ratio, profit margins and liquidation value. We do in-depth research to construct a bargain list from which we buy.
Manager’s Discussion
During the year under review, Fund performance benefited from overweighted allocations in South Korea and Germany and a significant underweighted allocation to the U.S. relative to the MSCI World Index. The returns from many of our South Korean investments were further enhanced by currency effects. Some of the top contributors from South Korea included Kookmin Bank, Samsung Electronics and Hana Financial Holdings. German investments that contributed to performance included Volkswagen, Siemens and Muenchener Rueckversicherungs-Gesellschaft (Munich Re Group). In terms of sectors, our stock selection in the financials and information technology sectors contributed to performance. Examples of financial and information technology holdings, in addition to some of the aforementioned stocks, included ACE, Olympus, American International Group, Mitsubishi UFJ Financial Group and Nomura Holdings. Several of our industrials sector holdings
4. Source: Standard & Poor’s Micropal. Individual country market returns are measured by MSCI country-specific indexes.
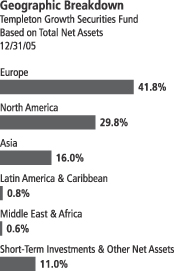
TG-3
such as our investments in BAE Systems and Rolls-Royce also contributed to Fund performance.
The Fund had several detractors from performance. Although the energy sector had a net positive impact on returns, our underweighted sector allocation relative to the benchmark detracted most from relative performance.
The largest detractors from a country standpoint were Japan and Canada, mostly due to stock selection. Examples of Japanese and Canadian stocks that dragged on performance included Fuji Photo Film, Hitachi and Celestica. Currency also had a negative effect on many of our British investments. The materials and consumer discretionary sectors also hurt the Fund’s relative performance. In particular, several of our media stocks had negative returns such as British Sky Broadcasting Group, DIRECTV and News Corp. Several health care and utilities holdings also had negative effects on the Fund’s relative performance.
It is important to recognize the effect of currency movements on the Fund’s performance. In general, if the value of the U.S. dollar increases compared with a foreign currency, an investment traded in that foreign currency will decrease in value because it will be worth fewer U.S. dollars. This can have a negative effect on Fund performance. Conversely, when the U.S. dollar weakens in relation to a foreign currency, an investment traded in that foreign currency will increase in value, which can contribute to Fund performance. For the 12 months ended December 31, 2005, the U.S. dollar increased in value relative to most non-U.S. currencies. As a result, the Fund’s overall performance was negatively affected by the portfolio’s investment primarily in securities with non-U.S. currency exposure.
Thank you for your participation in Templeton Growth Securities Fund. We look forward to serving your future investment needs.
The foregoing information reflects our analysis, opinions and portfolio holdings as of December 31, 2005, the end of the reporting period. The way we implement our main investment strategies and the resulting portfolio holdings may change depending on factors such as market and economic conditions. These opinions may not be relied upon as investment advice or an offer for a particular security. The information is not a complete analysis of every aspect of any market, country, industry, security or the Fund. Statements of fact are from sources considered reliable, but the adviser makes no representation or warranty as to their completeness or accuracy. Although historical performance is no guarantee of future results, these insights may help you understand our investment management philosophy.
Top 10 Holdings
Templeton Growth Securities Fund
12/31/05
| | |
Company Sector/Industry,
Country | | % of Total
Net Assets |
| |
| Royal Bank of Scotland Group PLC | | 2.0% |
| Commercial Banks, U.K. | | |
| |
| Tyco International Ltd. | | 1.9% |
| Industrial Conglomerates, U.S. | | |
| |
| Siemens AG | | 1.8% |
| Industrial Conglomerates, Germany | | |
| |
| News Corp., A | | 1.8% |
| Media, U.S. | | |
| |
| Merck & Co. Inc. | | 1.8% |
| Pharmaceuticals, U.S. | | |
| |
| GlaxoSmithKline PLC | | 1.7% |
| Pharmaceuticals, U.K. | | |
| |
| Nestle SA | | 1.6% |
| Food Products, Switzerland | | |
| |
| Pfizer Inc. | | 1.5% |
| Pharmaceuticals, U.S. | | |
| |
| Royal Dutch Shell PLC, B | | 1.4% |
| Oil, Gas & Consumable Fuels, U.K. | | |
| |
| BP PLC | | 1.3% |
| Oil, Gas & Consumable Fuels, U.K. | | |
The dollar value, number of shares or principal amount, and names of all portfolio holdings are listed in the Fund’s Statement of Investments.
TG-4
Fund Expenses
As an investor in a variable insurance contract (“Contract”) that indirectly provides for investment in an underlying mutual fund, you can incur transaction and/or ongoing expenses at both the Fund level and the Contract level.
| • | | Transaction expenses can include sales charges (loads) on purchases, redemption fees, surrender fees, transfer fees and premium taxes. |
| • | | Ongoing expenses can include management fees, distribution and service (12b-1) fees, contract fees, annual maintenance fees, mortality and expense risk fees and other fees and expenses. All mutual funds and Contracts have some types of ongoing expenses. |
The expenses shown in the table below are meant to highlight ongoing expenses at the Fund level only and do not include ongoing expenses at the Contract level, or transaction expenses at either the Fund or Contract level. While the Fund does not have transaction expenses, if the transaction and ongoing expenses at the Contract level were included, the expenses shown below would be higher. You should consult your Contract prospectus or disclosure document for more information.
The table shows Fund-level ongoing expenses and can help you understand these expenses and compare them with those of other mutual funds offered through the Contract. The table assumes a $1,000 investment held for the six months indicated. Please refer to the Fund prospectus for additional information on operating expenses.
Actual Fund Expenses
The first line (Actual) of the table below provides actual account values and expenses. The “Ending Account Value” is derived from the Fund’s actual return, which includes the effect of ongoing Fund expenses, but does not include the effect of ongoing Contract expenses.
You can estimate the Fund-level expenses you incurred during the period by following these steps. Of course, your account value and expenses will differ from those in this illustration:
| 1. | Divide your account value by $1,000. |
If an account had an $8,600 value, then $8,600 ÷ $1,000 = 8.6.
| 2. | Multiply the result by the number under the heading “Fund-Level Expenses Incurred During Period.” |
If Fund-Level Expenses Incurred During Period were $7.50, then 8.6 × $7.50 = $64.50.
Templeton Growth Securities Fund – Class 1
TG-5
In this illustration, the estimated expenses incurred this period at the Fund level are $64.50.
Hypothetical Example for Comparison with Other Mutual Funds
Information in the second line (Hypothetical) of the table can help you compare ongoing expenses of the Fund with those of other mutual funds offered through the Contract. This information may not be used to estimate the actual ending account balance or expenses you incurred during the period. The hypothetical “Ending Account Value” is based on the Fund’s actual expense ratio and an assumed 5% annual rate of return before expenses, which does not represent the Fund’s actual return. The figure under the heading “Fund-Level Expenses Incurred During Period” shows the hypothetical expenses your account would have incurred under this scenario. You can compare this figure with the 5% hypothetical examples that appear in shareholder reports of other funds offered through a Contract.
| | | | | | | | | |
| Class 1 | | Beginning
Account
Value 7/1/05 | | Ending
Account
Value 12/31/05 | | Fund-Level
Expenses Incurred
During Period*
7/1/05-12/31/05 |
Actual | | $ | 1,000 | | $ | 1,086.20 | | $ | 4.26 |
Hypothetical (5% return before expenses) | | $ | 1,000 | | $ | 1,021.12 | | $ | 4.13 |
*Expenses are equal to the annualized expense ratio for the Fund’s Class 1 shares (0.81%), which does not include any ongoing expenses of the Contract for which the Fund is an investment option, multiplied by the average account value over the period, multiplied by 184/365 to reflect the one-half year period.
TG-6
Franklin Templeton Variable Insurance Products Trust
Financial Highlights
Templeton Growth Securities Fund
| | | | | | | | | | | | | | | | | | | | |
| | | Year Ended December 31,
| |
| Class 1 | | 2005
| | | 2004
| | | 2003
| | | 2002
| | | 2001
| |
Per share operating performance | | | | | | | | | | | | | | | | | | | | |
(for a share outstanding throughout the year) | | | | | | | | | | | | | | | | | | | | |
Net asset value, beginning of year | | $ | 12.98 | | | $ | 11.31 | | | $ | 8.67 | | | $ | 11.09 | | | $ | 13.76 | |
| | |
|
|
|
Income from investment operations: | | | | | | | | | | | | | | | | | | | | |
Net investment incomea | | | 0.24 | | | | 0.21 | | | | 0.17 | | | | 0.17 | | | | 0.26 | |
Net realized and unrealized gains (losses) | | | 0.92 | | | | 1.61 | | | | 2.63 | | | | (2.13 | ) | | | (0.36 | ) |
| | |
|
|
|
Total from investment operations | | | 1.16 | | | | 1.82 | | | | 2.80 | | | | (1.96 | ) | | | (0.10 | ) |
| | |
|
|
|
Less distributions from: | | | | | | | | | | | | | | | | | | | | |
Net investment income | | | (0.16 | ) | | | (0.15 | ) | | | (0.16 | ) | | | (0.24 | ) | | | (0.28 | ) |
Net realized gains | | | — | | | | — | | | | — | | | | (0.22 | ) | | | (2.29 | ) |
| | |
|
|
|
Total distributions | | | (0.16 | ) | | | (0.15 | ) | | | (0.16 | ) | | | (0.46 | ) | | | (2.57 | ) |
| | |
|
|
|
Net asset value, end of year | | $ | 13.98 | | | $ | 12.98 | | | $ | 11.31 | | | $ | 8.67 | | | $ | 11.09 | |
| | |
|
|
|
| | | | | |
Total returnb | | | 9.06% | | | | 16.25% | | | | 32.62% | | | | (18.32)% | | | | (0.98%) | |
Ratios/supplemental data | | | | | | | | | | | | | | | | | | | | |
Net assets, end of year (000’s) | | $ | 779,347 | | | $ | 800,118 | | | $ | 769,339 | | | $ | 665,537 | | | $ | 966,725 | |
Ratios to average net assets: | | | | | | | | | | | | | | | | | | | | |
Expenses | | | 0.82% | | | | 0.86% | | | | 0.88% | | | | 0.87% | | | | 0.85% | |
Net investment income | | | 1.81% | | | | 1.75% | | | | 1.74% | | | | 1.69% | | | | 2.13% | |
Portfolio turnover rate | | | 22.16% | | | | 19.13% | | | | 37.43% | | | | 30.67% | | | | 31.05% | |
| a | Based on average daily shares outstanding. |
| b | Total return does not include any fees, charges or expenses imposed by the variable annuity and life insurance contracts for which the Franklin Templeton Variable Insurance Products Trust serves as an underlying investment vehicle. |
See notes to financial statements.
TG-7
Franklin Templeton Variable Insurance Products Trust
Financial Highlights (continued)
Templeton Growth Securities Fund (continued)
| | | | | | | | | | | | | | | | | | | | |
| | | Year Ended December 31,
| |
| Class 2 | | 2005
| | | 2004
| | | 2003
| | | 2002
| | | 2001
| |
Per share operating performance | | | | | | | | | | | | | | | | | | | | |
(for a share outstanding throughout the year) | | | | | | | | | | | | | | | | | | | | |
Net asset value, beginning of year | | $ | 12.83 | | | $ | 11.19 | | | $ | 8.59 | | | $ | 11.01 | | | $ | 13.69 | |
| | |
|
|
|
Income from investment operations: | | | | | | | | | | | | | | | | | | | | |
Net investment incomea | | | 0.20 | | | | 0.17 | | | | 0.13 | | | | 0.13 | | | | 0.21 | |
Net realized and unrealized gains (losses) | | | 0.93 | | | | 1.61 | | | | 2.62 | | | | (2.10 | ) | | | (0.34 | ) |
| | |
|
|
|
Total from investment operations | | | 1.13 | | | | 1.78 | | | | 2.75 | | | | (1.97 | ) | | | (0.13 | ) |
| | |
|
|
|
Less distributions from: | | | | | | | | | | | | | | | | | | | | |
Net investment income | | | (0.15 | ) | | | (0.14 | ) | | | (0.15 | ) | | | (0.23 | ) | | | (0.26 | ) |
Net realized gains | | | — | | | | — | | | | — | | | | (0.22 | ) | | | (2.29 | ) |
| | |
|
|
|
Total distributions | | | (0.15 | ) | | | (0.14 | ) | | | (0.15 | ) | | | (0.45 | ) | | | (2.55 | ) |
| | |
|
|
|
Net asset value, end of year | | $ | 13.81 | | | $ | 12.83 | | | $ | 11.19 | | | $ | 8.59 | | | $ | 11.01 | |
| | |
|
|
|
| | | | | |
Total returnb | | | 8.86% | | | | 16.03% | | | | 32.13% | | | | (18.49)% | | | | (1.31)% | |
Ratios/supplemental data | | | | | | | | | | | | | | | | | | | | |
Net assets, end of year (000’s) | | $ | 1,912,825 | | | $ | 1,189,112 | | | $ | 511,659 | | | $ | 190,054 | | | $ | 113,925 | |
Ratios to average net assets: | | | | | | | | | | | | | | | | | | | | |
Expenses | | | 1.07% | | | | 1.11% | | | | 1.13% | | | | 1.12% | | | | 1.10% | |
Net investment income | | | 1.56% | | | | 1.50% | | | | 1.49% | | | | 1.44% | | | | 1.80% | |
Portfolio turnover rate | | | 22.16% | | | | 19.13% | | | | 37.43% | | | | 30.67% | | | | 31.05% | |
| a | Based on average daily shares outstanding. |
| b | Total return does not include any fees, charges or expenses imposed by the variable annuity and life insurance contracts for which the Franklin Templeton Variable Insurance Products Trust serves as an underlying investment vehicle. |
See notes to financial statements.
TG-8
Franklin Templeton Variable Insurance Products Trust
Statement of Investments, December 31, 2005
| | | | | | | |
| Templeton Growth Securities Fund | | Country | | Shares | | Value |
| | | | | | | | |
Common Stocks 89.0% | | | | | | | |
Aerospace & Defense 2.4% | | | | | | | |
BAE Systems PLC | | United Kingdom | | 2,925,299 | | $ | 19,212,830 |
aBAE Systems PLC, 144A | | United Kingdom | | 422 | | | 2,772 |
Raytheon Co. | | United States | | 723,090 | | | 29,032,064 |
bRolls-Royce Group PLC | | United Kingdom | | 2,227,450 | | | 16,382,724 |
Rolls-Royce Group PLC, B | | United Kingdom | | 109,954,804 | | | 193,901 |
| | | | | | |
|
|
| | | | | | | | 64,824,291 |
| | | | | | |
|
|
Air Freight & Logistics 0.6% | | | | | | | |
Deutsche Post AG | | Germany | | 632,190 | | | 15,357,540 |
| | | | | | |
|
|
Airlines 0.1% | | | | | | | |
Singapore Airlines Ltd. | | Singapore | | 430,100 | | | 3,207,096 |
| | | | | | |
|
|
Auto Components 0.6% | | | | | | | |
Lear Corp. | | United States | | 281,750 | | | 8,018,605 |
Valeo SA | | France | | 237,933 | | | 8,847,474 |
| | | | | | |
|
|
| | | | | | | | 16,866,079 |
| | | | | | |
|
|
Automobiles 1.2% | | | | | | | |
Bayerische Motoren Werke AG | | Germany | | 726,340 | | | 31,815,472 |
| | | | | | |
|
|
Capital Markets 2.7% | | | | | | | |
The Bank of New York Co. Inc. | | United States | | 976,292 | | | 31,094,900 |
Nomura Holdings Inc. | | Japan | | 1,162,373 | | | 22,256,740 |
UBS AG | | Switzerland | | 213,966 | | | 20,374,612 |
| | | | | | |
|
|
| | | | | | | | 73,726,252 |
| | | | | | |
|
|
Chemicals 1.4% | | | | | | | |
Akzo Nobel NV | | Netherlands | | 493,365 | | | 22,866,347 |
bSyngenta AG | | Switzerland | | 111,665 | | | 13,897,033 |
| | | | | | |
|
|
| | | | | | | | 36,763,380 |
| | | | | | |
|
|
Commercial Banks 6.2% | | | | | | | |
Banco Santander Central Hispano SA | | Spain | | 1,320,501 | | | 17,430,518 |
Hana Financial Group Inc. | | South Korea | | 161,640 | | | 7,412,195 |
bKookmin Bank | | South Korea | | 399,100 | | | 30,303,871 |
Lloyds TSB Group PLC | | United Kingdom | | 1,032,660 | | | 8,678,885 |
Mitsubishi UFJ Financial Group Inc. | | Japan | | 2,600 | | | 35,245,277 |
Royal Bank of Scotland Group PLC | | United Kingdom | | 1,752,972 | | | 52,929,055 |
Standard Chartered PLC | | United Kingdom | | 532,653 | | | 11,867,416 |
UniCredito Italiano SpA | | Italy | | 492,834 | | | 3,395,630 |
| | | | | | |
|
|
| | | | | | | | 167,262,847 |
| | | | | | |
|
|
Commercial Services & Supplies 0.6% | | | | | | | |
Rentokil Initial PLC | | United Kingdom | | 5,968,960 | | | 16,790,300 |
| | | | | | |
|
|
Computers & Peripherals 1.2% | | | | | | | |
bMaxtor Corp. | | United States | | 819,781 | | | 5,689,280 |
bSeagate Technology | | United States | | 1,339,475 | | | 26,776,105 |
| | | | | | |
|
|
| | | | | | | | 32,465,385 |
| | | | | | |
|
|
Diversified Consumer Services 1.2% | | | | | | | |
H&R Block Inc. | | United States | | 1,267,870 | | | 31,126,209 |
| | | | | | |
|
|
Diversified Financial Services 0.2% | | | | | | | |
Morgan Stanley | | United States | | 100,000 | | | 5,674,000 |
| | | | | | |
|
|
TG-9
Franklin Templeton Variable Insurance Products Trust
Statement of Investments, December 31, 2005 (continued)
| | | | | | | |
| Templeton Growth Securities Fund | | Country | | Shares | | Value |
| | | | | | | | |
Common Stocks (cont.) | | | | | | | |
Diversified Telecommunication Services 6.2% | | | | | | | |
AT&T Inc. | | United States | | 441,280 | | $ | 10,806,947 |
BCE Inc. | | Canada | | 1,048,406 | | | 25,139,013 |
aBelgacom SA, 144A | | Belgium | | 273,600 | | | 8,923,483 |
France Telecom SA | | France | | 1,058,060 | | | 26,291,745 |
KT Corp., ADR | | South Korea | | 1,011,735 | | | 21,802,889 |
Portugal Telecom SGPS SA | | Portugal | | 1,232,340 | | | 12,473,644 |
TDC AS | | Denmark | | 430,274 | | | 25,772,882 |
Telefonos de Mexico SA de CV (Telmex), L, ADR | | Mexico | | 900,930 | | | 22,234,953 |
Telenor ASA | | Norway | | 1,402,050 | | | 13,761,677 |
| | | | | | |
|
|
| | | | | | | | 167,207,233 |
| | | | | | |
|
|
Electric Utilities 2.1% | | | | | | | |
E.ON AG | | Germany | | 215,295 | | | 22,291,541 |
Hong Kong Electric Holdings Ltd. | | Hong Kong | | 2,867,498 | | | 14,201,302 |
National Grid PLC | | United Kingdom | | 2,048,535 | | | 20,053,847 |
| | | | | | |
|
|
| | | | | | | | 56,546,690 |
| | | | | | |
|
|
Electronic Equipment & Instruments 1.1% | | | | | | | |
bCelestica Inc. | | Canada | | 403,440 | | | 4,260,327 |
Hitachi Ltd. | | Japan | | 3,895,500 | | | 26,238,435 |
| | | | | | |
|
|
| | | | | | | | 30,498,762 |
| | | | | | |
|
|
Energy Equipment & Services 0.5% | | | | | | | |
Noble Corp. | | United States | | 172,070 | | | 12,137,818 |
| | | | | | |
|
|
Food & Staples Retailing 0.5% | | | | | | | |
William Morrison Supermarkets PLC | | United Kingdom | | 4,349,757 | | | 14,480,648 |
| | | | | | |
|
|
Food Products 3.2% | | | | | | | |
Cadbury Schweppes PLC | | United Kingdom | | 566,095 | | | 5,351,790 |
H.J. Heinz Co. | | United States | | 450,805 | | | 15,201,145 |
Nestle SA | | Switzerland | | 140,369 | | | 41,990,498 |
Unilever NV | | Netherlands | | 334,120 | | | 22,882,450 |
| | | | | | |
|
|
| | | | | | | | 85,425,883 |
| | | | | | |
|
|
Gas Utilities 1.2% | | | | | | | |
El Paso Corp. | | United States | | 2,709,909 | | | 32,952,493 |
| | | | | | |
|
|
Health Care Equipment & Supplies 1.1% | | | | | | | |
Olympus Corp. | | Japan | | 1,082,820 | | | 28,439,736 |
| | | | | | |
|
|
Health Care Providers & Services 1.9% | | | | | | | |
HCA Inc. | | United States | | 511,330 | | | 25,822,165 |
bTenet Healthcare Corp. | | United States | | 3,381,565 | | | 25,902,788 |
| | | | | | |
|
|
| | | | | | | | 51,724,953 |
| | | | | | |
|
|
Hotels Restaurants & Leisure 2.0% | | | | | | | |
Accor SA | | France | | 518,800 | | | 28,534,867 |
Compass Group PLC | | United Kingdom | | 6,546,412 | | | 24,834,417 |
| | | | | | |
|
|
| | | | | | | | 53,369,284 |
| | | | | | |
|
|
Household Durables 2.1% | | | | | | | |
Koninklijke Philips Electronics NV | | Netherlands | | 921,385 | | | 28,633,018 |
Sony Corp. | | Japan | | 691,350 | | | 28,232,712 |
| | | | | | |
|
|
| | | | | | | | 56,865,730 |
| | | | | | |
|
|
TG-10
Franklin Templeton Variable Insurance Products Trust
Statement of Investments, December 31, 2005 (continued)
| | | | | | | |
| Templeton Growth Securities Fund | | Country | | Shares | | Value |
| | | | | | | | |
Common Stocks (cont.) | | | | | | | |
Industrial Conglomerates 4.4% | | | | | | | |
Siemens AG | | Germany | | 580,080 | | $ | 49,698,485 |
Smiths Group PLC | | United Kingdom | | 1,080,061 | | | 19,436,676 |
Tyco International Ltd. | | United States | | 1,748,815 | | | 50,470,801 |
| | | | | | |
|
|
| | | | | | | | 119,605,962 |
| | | | | | |
|
|
Insurance 5.8% | | | | | | | |
ACE Ltd. | | Bermuda | | 297,200 | | | 15,882,368 |
American International Group Inc. | | United States | | 482,528 | | | 32,922,886 |
Muenchener Rueckversicherungs-Gesellschaft AG | | Germany | | 148,610 | | | 20,121,337 |
Swiss Reinsurance Co. | | Switzerland | | 386,500 | | | 28,301,656 |
Torchmark Corp. | | United States | | 198,400 | | | 11,031,040 |
Willis Group Holdings Ltd. | | United States | | 798,226 | | | 29,486,468 |
XL Capital Ltd., A | | Bermuda | | 255,782 | | | 17,234,591 |
| | | | | | |
|
|
| | | | | | | | 154,980,346 |
| | | | | | |
|
|
IT Services 1.5% | | | | | | | |
Accenture Ltd., A | | Bermuda | | 437,780 | | | 12,638,708 |
Electronic Data Systems Corp. | | United States | | 1,159,669 | | | 27,878,443 |
| | | | | | |
|
|
| | | | | | | | 40,517,151 |
| | | | | | |
|
|
Leisure Equipment & Products 0.9% | | | | | | | |
Fuji Photo Film Co. Ltd. | | Japan | | 755,500 | | | 24,963,569 |
Mattel Inc. | | United States | | 8,600 | | | 136,052 |
| | | | | | |
|
|
| | | | | | | | 25,099,621 |
| | | | | | |
|
|
Media 8.8% | | | | | | | |
British Sky Broadcasting Group PLC | | United Kingdom | | 3,245,088 | | | 27,719,652 |
bComcast Corp., A | | United States | | 504,000 | | | 12,947,760 |
bThe DIRECTV Group Inc. | | United States | | 1,931,289 | | | 27,269,800 |
bInterpublic Group of Cos. Inc. | | United States | | 2,885,615 | | | 27,846,185 |
News Corp., A | | United States | | 3,184,151 | | | 49,513,548 |
Pearson PLC | | United Kingdom | | 2,112,355 | | | 24,985,132 |
Reed Elsevier NV | | Netherlands | | 2,308,490 | | | 32,248,290 |
VNU NV | | Netherlands | | 849,842 | | | 28,180,454 |
Wolters Kluwer NV | | Netherlands | | 339,939 | | | 6,873,620 |
| | | | | | |
|
|
| | | | | | | | 237,584,441 |
| | | | | | |
|
|
Metals & Mining 0.4% | | | | | | | |
Barrick Gold Corp. | | Canada | | 143,980 | | | 4,012,723 |
POSCO | | South Korea | | 30,272 | | | 6,069,423 |
| | | | | | |
|
|
| | | | | | | | 10,082,146 |
| | | | | | |
|
|
Multi-Utilities & Unregulated Power 0.9% | | | | | | | |
DTE Energy Co. | | United States | | 562,475 | | | 24,293,295 |
| | | | | | |
|
|
Office Electronics 0.8% | | | | | | | |
Konica Minolta Holdings Ltd. | | Japan | | 2,034,500 | | | 20,701,809 |
| | | | | | |
|
|
Oil, Gas & Consumable Fuels 4.7% | | | | | | | |
BP PLC | | United Kingdom | | 3,379,289 | | | 35,988,026 |
Eni SpA | | Italy | | 760,135 | | | 21,084,325 |
Repsol YPF SA | | Spain | | 919,148 | | | 26,844,250 |
Royal Dutch Shell PLC, B | | United Kingdom | | 1,212,783 | | | 38,767,773 |
TransCanada Corp. | | Canada | | 89,875 | | | 2,833,966 |
| | | | | | |
|
|
| | | | | | | | 125,518,340 |
| | | | | | |
|
|
TG-11
Franklin Templeton Variable Insurance Products Trust
Statement of Investments, December 31, 2005 (continued)
| | | | | | | | |
| Templeton Growth Securities Fund | | Country | | Shares | | Value |
| | | | | | | | | |
Common Stocks (cont.) | | | | | | | | |
Paper & Forest Products 4.0% | | | | | | | | |
International Paper Co. | | United States | | | 760,500 | | $ | 25,560,405 |
Sappi Ltd. | | South Africa | | | 1,300,540 | | | 14,903,541 |
Stora Enso OYJ, R | | Finland | | | 1,673,123 | | | 22,659,513 |
Svenska Cellulosa AB, B | | Sweden | | | 530,851 | | | 19,843,024 |
UPM-Kymmene OYJ | | Finland | | | 1,221,710 | | | 23,951,083 |
| | | | | | | |
|
|
| | | | | | | | | 106,917,566 |
| | | | | | | |
|
|
Pharmaceuticals 9.5% | | | | | | | | |
Abbott Laboratories | | United States | | | 313,207 | | | 12,349,752 |
Bristol-Myers Squibb Co. | | United States | | | 1,156,520 | | | 26,576,830 |
GlaxoSmithKline PLC | | United Kingdom | | | 1,853,632 | | | 46,847,601 |
Merck & Co. Inc. | | United States | | | 1,496,505 | | | 47,603,824 |
Novartis AG | | Switzerland | | | 412,490 | | | 21,680,255 |
Pfizer Inc. | | United States | | | 1,719,435 | | | 40,097,224 |
Sanofi-Aventis | | France | | | 327,290 | | | 28,672,208 |
Shire PLC | | United Kingdom | | | 930,490 | | | 11,910,409 |
Takeda Pharmaceutical Co. Ltd. | | Japan | | | 357,000 | | | 19,297,297 |
| | | | | | | |
|
|
| | | | | | | | | 255,035,400 |
| | | | | | | |
|
|
Real Estate 1.8% | | | | | | | | |
Cheung Kong Holdings Ltd. | | Hong Kong | | | 3,266,499 | | | 33,513,248 |
Swire Pacific Ltd., A | | Hong Kong | | | 1,652,800 | | | 14,836,223 |
| | | | | | | |
|
|
| | | | | | | | | 48,349,471 |
| | | | | | | |
|
|
Semiconductors & Semiconductor Equipment 0.8% | | | | | | | | |
Samsung Electronics Co. Ltd. | | South Korea | | | 33,440 | | | 21,872,913 |
| | | | | | | |
|
|
Software 1.3% | | | | | | | | |
bCadence Design Systems Inc. | | United States | | | 820,990 | | | 13,891,151 |
Nintendo Co. Ltd. | | Japan | | | 182,700 | | | 22,057,739 |
| | | | | | | |
|
|
| | | | | | | | | 35,948,890 |
| | | | | | | |
|
|
Wireless Telecommunication Services 3.1% | | | | | | | | |
KDDI Corp. | | Japan | | | 5,000 | | | 28,806,236 |
SK Telecom Co. Ltd. | | South Korea | | | 80,853 | | | 14,525,452 |
SK Telecom Co. Ltd., ADR | | South Korea | | | 303,380 | | | 6,155,580 |
Vodafone Group PLC | | United Kingdom | | | 15,462,271 | | | 33,385,589 |
| | | | | | | |
|
|
| | | | | | | | | 82,872,857 |
| | | | | | | |
|
|
Total Common Stocks (Cost $2,032,847,613) | | | | | | | | 2,394,908,289 |
| | | | | | | |
|
|
| | | |
| | | | | Principal
Amount
| | |
Short Term Investments (Cost $290,741,959) 10.8% | | | | | | | | |
U.S. Government and Agency Securities 10.8% | | | | | | | | |
cFederal Home Loan Bank, 1/03/06 | | | | $ | 289,861,000 | | | 289,751,675 |
cU.S. Treasury Bill, 3/30/06 | | | | | 1,000,000 | | | 990,622 |
| | | | | | | |
|
|
| | | | | | | | | 290,742,297 |
| | | | | | | |
|
|
Total Investments (Cost $2,323,589,572) 99.8% | | | | | | | | 2,685,650,586 |
Other Assets, less Liabilities 0.2% | | | | | | | | 6,521,336 |
| | | | | | | |
|
|
Net Assets 100.0% | | | | | | | $ | 2,692,171,922 |
| | | | | | | |
|
|
Selected Portfolio Abbreviations
ADR - American Depository Receipt
| a | Security was purchased pursuant to Rule 144A under the Securities Act of 1933 and may be sold in transactions exempt from registration only to qualified institutional buyers or in a public offering registered under the Securities Act of 1933. These securities have been deemed liquid under guidelines approved by the Trust’s Board of Trustees. At December 31, 2005, the value of these securities was $8,926,255 representing 0.33% of net assets. |
| c | A portion or all of the security is traded on a discount basis with no stated coupon rate. |
See notes to financial statements.
TG-12
Franklin Templeton Variable Insurance Products Trust
Financial Statements
Statement of Assets and Liabilities
December 31, 2005
| | | |
| | | Templeton
Growth
Securities Fund
|
Assets: | | | |
Investments in securities: | | | |
Cost | | $ | 2,323,589,572 |
| | |
|
|
Value | | | 2,685,650,586 |
Cash | | | 203,663 |
Receivables: | | | |
Investment securities sold | | | 7,083,929 |
Capital shares sold | | | 2,897,967 |
Dividends | | | 5,335,021 |
| | |
|
|
Total assets | | | 2,701,171,166 |
| | |
|
|
Liabilities: | | | |
Payables: | | | |
Investment securities purchased | | | 3,928,923 |
Capital shares redeemed | | | 2,207,192 |
Affiliates | | | 2,438,607 |
Accrued expenses and other liabilities | | | 424,522 |
| | |
|
|
Total liabilities | | | 8,999,244 |
| | |
|
|
Net assets, at value | | $ | 2,692,171,922 |
| | |
|
|
Net assets consist of: | | | |
Paid-in capital | | $ | 2,199,508,512 |
Undistributed net investment income | | | 35,116,077 |
Net unrealized appreciation (depreciation) | | | 361,987,998 |
Accumulated net realized gain (loss) | | | 95,559,335 |
| | |
|
|
Net assets, at value | | $ | 2,692,171,922 |
| | |
|
|
Class 1: | | | |
Net assets, at value | | $ | 779,347,305 |
| | |
|
|
Shares outstanding | | | 55,731,759 |
| | |
|
|
Net asset value and offering price per share | | $ | 13.98 |
| | |
|
|
Class 2: | | | |
Net assets, at value | | $ | 1,912,824,617 |
| | |
|
|
Shares outstanding | | | 138,541,911 |
| | |
|
|
Net asset value and offering price per share | | $ | 13.81 |
| | |
|
|
See notes to financial statements.
TG-13
Franklin Templeton Variable Insurance Products Trust
Financial Statements (continued)
Statement of Operations
for the year ended December 31, 2005
| | | | |
| | | Templeton
Growth
Securities Fund
| |
Investment income: | | | | |
Dividends (net of foreign taxes of $3,565,075) | | $ | 53,228,570 | |
Interest | | | 6,853,053 | |
Other income (Note 8) | | | 135,407 | |
| | |
|
|
|
Total investment income | | | 60,217,030 | |
| | |
|
|
|
Expenses: | | | | |
Management fees (Note 3a) | | | 17,306,542 | |
Distributions fees - Class 2 (Note 3c) | | | 3,785,615 | |
Unaffiliated transfer agent fees | | | 13,073 | |
Custodian fees (Note 4) | | | 535,370 | |
Reports to shareholders | | | 788,179 | |
Professional fees | | | 78,457 | |
Trustees’ fees and expenses | | | 11,799 | |
Other | | | 61,828 | |
| | |
|
|
|
Total expenses | | | 22,580,863 | |
Expense reductions (Note 4) | | | (4,817 | ) |
| | |
|
|
|
Net expenses | | | 22,576,046 | |
| | |
|
|
|
Net investment income | | | 37,640,984 | |
| | |
|
|
|
Realized and unrealized gains (losses): | | | | |
Net realized gain (loss) from: | | | | |
Investments (net of foreign taxes of $74,106) | | | 106,799,734 | |
Foreign currency transactions | | | (75,282 | ) |
| | |
|
|
|
Net realized gain (loss) | | | 106,724,452 | |
| | |
|
|
|
Net change in unrealized appreciation (depreciation) on: | | | | |
Investments | | | 64,613,914 | |
Translation of assets and liabilities denominated in foreign currencies | | | (181,786 | ) |
| | |
|
|
|
Net change in unrealized appreciation (depreciation) | | | 64,432,128 | |
| | |
|
|
|
Net realized and unrealized gain (loss) | | | 171,156,580 | |
| | |
|
|
|
Net increase (decrease) in net assets resulting from operations | | $ | 208,797,564 | |
| | |
|
|
|
See notes to financial statements.
TG-14
Franklin Templeton Variable Insurance Products Trust
Financial Statements (continued)
Statements of Changes in Net Assets
| | | | | | | | |
| | | Templeton Growth
Securities Fund
| |
| | | Year Ended December 31,
| |
| | | 2005 | | | 2004 | |
| | |
| |
Increase (decrease) in net assets: | | | | | | | | |
Operations: | | | | | | | | |
Net investment income | | $ | 37,640,984 | | | $ | 24,981,340 | |
Net realized gain (loss) from investments and foreign currency transactions | | | 106,724,452 | | | | 67,841,923 | |
Net change in unrealized appreciation (depreciation) on investments and translation of assets and liabilities denominated in foreign currencies | | | 64,432,128 | | | | 160,661,227 | |
| | |
| |
Net increase (decrease) in net assets resulting from operations | | | 208,797,564 | | | | 253,484,490 | |
| | |
| |
Distributions to shareholders from: | | | | | | | | |
Net investment income: | | | | | | | | |
Class 1 | | | (9,572,633 | ) | | | (9,645,451 | ) |
Class 2 | | | (16,496,404 | ) | | | (8,547,806 | ) |
| | |
| |
Total distributions to shareholders | | | (26,069,037 | ) | | | (18,193,257 | ) |
| | |
| |
Capital share transactions: (Note 2) | | | | | | | | |
Class 1 | | | (78,704,685 | ) | | | (75,091,706 | ) |
Class 2 | | | 598,918,011 | | | | 548,032,814 | |
| | |
| |
Total capital share transactions | | | 520,213,326 | | | | 472,941,108 | |
| | |
| |
Net increase (decrease) in net assets | | | 702,941,853 | | | | 708,232,341 | |
Net assets: | | | | | | | | |
Beginning of year | | | 1,989,230,069 | | | | 1,280,997,728 | |
| | |
| |
End of year | | $ | 2,692,171,922 | | | $ | 1,989,230,069 | |
| | |
| |
Undistributed net investment income included in net assets: | | | | | | | | |
End of year | | $ | 35,116,077 | | | $ | 23,647,817 | |
| | |
| |
See notes to financial statements.
TG-15
Franklin Templeton Variable Insurance Products Trust
Notes to Financial Statements
Templeton Growth Securities Fund
1. ORGANIZATION AND SIGNIFICANT ACCOUNTING POLICIES
Franklin Templeton Variable Insurance Products Trust (the Trust) is registered under the Investment Company Act of 1940 as an open-end investment company, consisting of twenty-two separate series. The Templeton Growth Securities Fund (the Fund) included in this report is diversified. The financial statements of the remaining funds in the series are presented separately. Shares of the Fund are sold only to insurance company separate accounts to fund the benefits of variable life insurance policies or variable annuity contracts.
The following summarizes the Fund’s significant accounting policies.
a. Security Valuation
Securities listed on a securities exchange or on the NASDAQ National Market System are valued at the last quoted sale price or the official closing price of the day, respectively. Over-the-counter securities and listed securities for which there is no reported sale are valued within the range of the most recent quoted bid and ask prices. Securities that trade in multiple markets or on multiple exchanges are valued according to the broadest and most representative market.
Corporate debt securities and government securities generally trade in the over-the-counter market rather than on a securities exchange. The Trust may utilize independent pricing services, quotations from bond dealers, and information with respect to bond and note transactions, to assist in determining a current market value for each security. The Trust’s pricing services may use valuation models or matrix pricing which considers information with respect to comparable bond and note transactions, quotations from bond dealers, or by reference to other securities that are considered comparable in such characteristics as rating, interest rate and maturity date, option adjusted spread models, prepayment projections, interest rate spreads and yield curves, to determine current value.
Foreign securities are valued as of the close of trading on the foreign stock exchange on which the security is primarily traded, or the NYSE, whichever is earlier. If no sale is reported at that time, the foreign security will be valued within the range of the most recent quoted bid and ask prices. The value is then converted into its U.S. dollar equivalent at the foreign exchange rate in effect at the close of the NYSE on the day that the value of the foreign security is determined.
The Trust has procedures to determine the fair value of individual securities and other assets for which market prices are not readily available or which may not be reliably priced. Methods for valuing these securities may include: fundamental analysis, matrix pricing, discounts from market prices of similar securities, or discounts applied due to the nature and duration of restrictions on the disposition of the securities. Due to the inherent uncertainty of valuations of such securities, the fair values may differ significantly from the values that would have been used had a ready market for such investments existed. Occasionally, events occur between the time at which trading in a security is completed and the close of the NYSE that might call into question the availability (including the reliability) of the value of a portfolio security held by the Fund. If such an event occurs, the securities may be valued using fair value procedures, which may include the use of independent pricing services. All security valuation procedures are approved by the Trust’s Board of Trustees.
b. Foreign Currency Translation
Portfolio securities and other assets and liabilities denominated in foreign currencies are translated into U.S. dollars based on the exchange rate of such currencies against U.S. dollars on the date of valuation. Purchases and sales of securities, income and expense items denominated in foreign currencies are translated into U.S. dollars at the exchange rate in effect on the transaction date. Occasionally, events may impact the availability or reliability of foreign exchange rates used to convert the U.S. dollar equivalent value. If such an event occurs, the foreign exchange rate will be valued at fair value using procedures established and approved by the Trust’s Board of Trustees.
The Fund does not separately report the effect of changes in foreign exchange rates from changes in market prices on securities held. Such changes are included in net realized and unrealized gain or loss from investments on the Statement of Operations.
TG-16
Franklin Templeton Variable Insurance Products Trust
Notes to Financial Statements (continued)
Templeton Growth Securities Fund
1. ORGANIZATION AND SIGNIFICANT ACCOUNTING POLICIES (continued)
b. Foreign Currency Translation (continued)
Realized foreign exchange gains or losses arise from sales of foreign currencies, currency gains or losses realized between the trade and settlement dates on securities transactions and the difference between the recorded amounts of dividends, interest, and foreign withholding taxes and the U.S. dollar equivalent of the amounts actually received or paid. Net unrealized foreign exchange gains and losses arise from changes in foreign exchange rates on foreign denominated assets and liabilities other than investments in securities held at the end of the reporting period.
c. Foreign Currency Contracts
When the Fund purchases or sells foreign securities it may enter into foreign exchange contracts to minimize foreign exchange risk from the trade date to the settlement date of the transactions. A foreign exchange contract is an agreement between two parties to exchange different currencies at an agreed upon exchange rate on a specified date. Realized and unrealized gains and losses on these contracts are included in the Statement of Operations.
The risks of these contracts include movement in the values of the foreign currencies relative to the U.S. dollar and the possible inability of the counterparties to fulfill their obligations under the contracts, which may be in excess of the amount reflected in the Statement of Assets and Liabilities.
d. Income and Deferred Taxes
No provision has been made for U.S. income taxes because the Fund’s policy is to continue to qualify as a regulated investment company under the Internal Revenue Code and to distribute to shareholders substantially all of its taxable income and net realized gains.
The Fund is subject to a tax imposed on net realized gains on securities of certain foreign countries. The Fund records an estimated deferred tax liability for net unrealized gains on these securities in an amount that would be payable if the securities were disposed of on the valuation date.
Foreign securities held by the Fund may be subject to foreign taxation. Foreign taxes, if any, are recorded based on the tax regulations and rates that exist in the foreign markets in which the Fund invests.
e. Security Transactions, Investment Income, Expenses and Distributions
Security transactions are accounted for on trade date. Realized gains and losses on security transactions are determined on a specific identification basis. Interest income and estimated expenses are accrued daily. Amortization of premium and accretion of discount on debt securities are included in interest income. Dividend income is recorded on the ex-dividend date, except that certain dividends from foreign securities are recognized as soon as the Fund is notified of the ex-dividend date. Distributions to shareholders are recorded on the ex-dividend date and are determined according to income tax regulations (tax basis). Such distributions are reinvested in additional shares of the Fund. Distributable earnings determined on a tax basis may differ from earnings recorded in accordance with generally accepted accounting principles. These differences may be permanent or temporary. Permanent differences are reclassified among capital accounts to reflect their tax character. These reclassifications have no impact on net assets or the results of operations. Temporary differences are not reclassified, as they may reverse in subsequent periods.
Common expenses incurred by the Trust are allocated among the funds based on the ratio of net assets of each Fund to the combined net assets of the Trust. Fund specific expenses are charged directly to the fund that incurred the expense.
TG-17
Franklin Templeton Variable Insurance Products Trust
Notes to Financial Statements (continued)
Templeton Growth Securities Fund
1. ORGANIZATION AND SIGNIFICANT ACCOUNTING POLICIES (continued)
e. Security Transactions, Investment Income, Expenses and Distributions (continued)
Realized and unrealized gains and losses and net investment income, other than class specific expenses, are allocated daily to each class of shares based upon the relative proportion of net assets of each class.
f. Accounting Estimates
The preparation of financial statements in accordance with accounting principles generally accepted in the United States of America requires management to make estimates and assumptions that affect the reported amounts of assets and liabilities at the date of the financial statements and the amounts of income and expenses during the reporting period. Actual results could differ from those estimates.
g. Guarantees and Indemnifications
Under the Trust’s organizational documents, its officers and trustees are indemnified by the Trust against certain liabilities arising out of the performance of their duties to the Trust. Additionally, in the normal course of business, the Trust enters into contracts with service providers that contain general indemnification clauses. The Trust’s maximum exposure under these arrangements is unknown as this would involve future claims that may be made against the Trust that have not yet occurred. However, based on experience, the Trust expects the risk of loss to be remote.
2. SHARES OF BENEFICIAL INTEREST
The Fund offers two classes of shares: Class 1 and Class 2. Each class of shares differs by its distribution fees, voting rights on matters affecting a single class and its exchange privilege.
At December 31, 2005, there were an unlimited number of shares authorized ($0.01 par value). Transactions in the Fund’s shares were as follows:
| | | | | | | | | | | | | | |
| | | Year Ended December 31,
| |
| | | 2005
| | | 2004
| |
| Class 1 Shares: | | Shares
| | | Amount
| | | Shares
| | | Amount
| |
Shares sold | | 1,516,368 | | | $ | 19,918,799 | | | 1,256,557 | | | $ | 14,860,796 | |
Shares issued in reinvestment of distributions | | 740,916 | | | | 9,572,633 | | | 835,104 | | | | 9,645,451 | |
Shares redeemed | | (8,179,119 | ) | | | (108,196,117 | ) | | (8,487,240 | ) | | | (99,597,953 | ) |
| | |
| |
Net increase (decrease) | | (5,921,835 | ) | | $ | (78,704,685 | ) | | (6,395,579 | ) | | $ | (75,091,706 | ) |
| | |
| |
| Class 2 Shares: | | | | | | | | | | | | |
Shares sold | | 53,621,660 | | | $ | 698,169,420 | | | 50,615,234 | | | $ | 589,822,365 | |
Shares issued in reinvestment of distributions | | 1,291,809 | | | | 16,496,404 | | | 747,186 | | | | 8,547,806 | |
Shares redeemed | | (9,052,089 | ) | | | (115,747,813 | ) | | (4,387,645 | ) | | | (50,337,357 | ) |
| | |
| |
Net increase (decrease) | | 45,861,380 | | | $ | 598,918,011 | | | 46,974,775 | | | $ | 548,032,814 | |
| | |
| |
TG-18
Franklin Templeton Variable Insurance Products Trust
Notes to Financial Statements (continued)
Templeton Growth Securities Fund
3. TRANSACTIONS WITH AFFILIATES
Franklin Resources, Inc. is the holding company for various subsidiaries that together are referred to as Franklin Templeton Investments. Certain officers and trustees of the Trust are also officers and/or directors of the following subsidiaries:
| | |
| Subsidiary | | Affiliation |
Templeton Asset Management, Ltd. (TAML) | | Investment manager |
Templeton Global Advisors, Ltd. (TGAL) | | Investment manager |
Franklin Templeton Services, LLC (FT Services) | | Administrative manager |
Franklin Templeton Distributors, Inc. (Distributors) | | Principal underwriter |
Franklin Templeton Investor Services, LLC (Investor Services) | | Transfer agent |
a. Management Fees
Effective May 1, 2005, the Fund pays an investment management fee to TGAL based on the average daily net assets of the Fund as follows:
| | |
| Annualized Fee Rate | | Net Assets |
| 1.000% | | Up to and including $100 million |
| 0.900% | | Over $100 million, up to and including $250 million |
| 0.800% | | Over $250 million, up to and including $500 million |
| 0.750% | | Over $500 million, up to and including $1 billion |
| 0.700% | | Over $1 billion, up to and including $5 billion |
| 0.675% | | Over $5 billion, up to and including $10 billion |
| 0.655% | | Over $10 billion, up to and including $15 billion |
| 0.635% | | Over $15 billion, up to and including $20 billion |
| 0.615% | | In excess of $20 billion |
Prior to May 1, 2005, the Fund paid an investment management fee to TGAL based on the average daily net assets of the Fund as follows:
| | |
| Annualized Fee Rate | | Net Assets |
| 1.000% | | Up to and including $100 million |
| 0.900% | | Over $100 million, up to and including $250 million |
| 0.800% | | Over $250 million, up to and including $500 million |
| 0.750% | | In excess of $500 million |
Under a subadvisory agreement, TAML, an affiliate of TGAL, provides subadvisory services to the Fund and receives from TGAL fees based on the average daily net assets of the Fund.
b. Administrative Fees
Under an agreement with TGAL, FT Services provides administrative services to the Fund. The fee is paid by TGAL based on average daily net assets, and is not an additional expense of the Fund.
c. Distribution Fees
The Fund’s Board of Trustees has adopted distribution plans for Class 2 shares pursuant to Rule 12b-1 under the 1940 Act. Under the Fund’s compensation distribution plans, the Fund pays Distributors for costs incurred in connection with the sale and distribution of the Fund’s shares up to 0.35% per year of its average daily net assets. The Board of Trustees has set the current rate at 0.25% per year.
TG-19
Franklin Templeton Variable Insurance Products Trust
Notes to Financial Statements (continued)
Templeton Growth Securities Fund
d. Transfer Agent Fees
Investor Services, under terms of an agreement, performs shareholder servicing for the Fund and is not paid by the Fund for the services.
4. EXPENSE OFFSET ARRANGEMENT
The Fund has entered into an arrangement with its custodian whereby credits realized as a result of uninvested cash balances are used to reduce a portion of the Fund’s custodian expenses. During the year ended December 31, 2005, the custodian fees were reduced as noted in the Statement of Operations.
5. INCOME TAXES
During the year ended December 31, 2005, the Fund utilized $11,265,016 of capital loss carryforwards.
For tax purposes, realized currency losses occurring subsequent to October 31, may be deferred and treated as occurring on the first day of the following fiscal year. At December 31, 2005, the Fund deferred realized currency losses of $49,489.
The tax character of distributions paid during the years ended December 31, 2005 and 2004, was as follows:
| | | | | | |
| | | 2005
| | 2004
|
Distributions paid from ordinary income | | $ | 26,069,037 | | $ | 18,193,257 |
| | |
|
At December 31, 2005, the cost of investments, net unrealized appreciation (depreciation), undistributed ordinary income and undistributed long term capital gains for income tax purposes were as follows:
| | | | |
Cost of investments | | $ | 2,324,453,800 | |
| | |
|
|
|
| |
Unrealized appreciation | | $ | 422,527,957 | |
Unrealized depreciation | | | (61,331,171 | ) |
| | |
|
|
|
Net unrealized appreciation (depreciation) | | $ | 361,196,786 | |
| | |
|
|
|
| |
Undistributed ordinary income | | $ | 35,116,076 | |
Undistributed long term capital gains | | | 96,473,052 | |
| | |
|
|
|
Distributable earnings | | $ | 131,589,128 | |
| | |
|
|
|
Net investment income differs for financial statements and tax purposes primarily due to differing treatment of foreign currency transactions.
Net realized gains (losses) differ for financial statements and tax purposes primarily due to differing treatments of wash sales and foreign currency transactions.
6. INVESTMENT TRANSACTIONS
Purchases and sales of investments (excluding short term securities) for the year ended December 31, 2005, aggregated $969,846,085 and $457,394,049, respectively.
TG-20
Franklin Templeton Variable Insurance Products Trust
Notes to Financial Statements (continued)
Templeton Growth Securities Fund
7. CONCENTRATION OF RISK
Investing in foreign securities may include certain risks and considerations not typically associated with investing in U.S. securities, such as fluctuating currency values and changing local and regional economic, political and social conditions, which may result in greater market volatility. In addition, certain foreign securities may not be as liquid as U.S. securities.
8. REGULATORY MATTERS
As part of various investigations by a number of federal, state, and foreign regulators and governmental entities, relating to certain practices in the mutual fund industry, including late trading, market timing and marketing support payments to
securities dealers who sell fund shares, Franklin Resources, Inc. and certain of its subsidiaries (collectively, the “Company”), entered into settlements with certain of those regulators.
Specifically, the Company entered into settlements with the Securities and Exchange Commission (“SEC”) concerning market timing (the “August 2, 2004 SEC Order”) and marketing support payments to securities dealers who sell fund shares (the “December 13, 2004 SEC Order”) and with the California Attorney General’s Office (“CAGO”) concerning marketing support payments to securities dealers who sell fund shares (the “CAGO Settlement”). Under the terms of the settlements with the SEC and the CAGO, the Company retained an Independent Distribution Consultant (“IDC”) to develop a plan for distribution of the respective settlement monies. The CAGO approved the distribution plan under the CAGO Settlement and, in accordance with the terms and conditions of that settlement, the monies were disbursed to the relevant funds and are recorded as other income in the current period. The SEC has not yet approved the distribution plan pertaining to the December 13, 2004 SEC Order. When approved, disbursements of settlement monies will be made promptly to the relevant funds, in accordance with the terms and conditions of that order. The IDC continues to develop the plan of distribution under the August 2, 2004 SEC Order that resolved the SEC’s market timing investigation.
In addition, the Company, as well as most of the mutual funds within Franklin Templeton Investments and certain current or former officers, directors, and/or employees, have been named in private lawsuits (styled as shareholder class actions, or as derivative actions on behalf of either the named funds or Franklin Resources, Inc.) relating to the industry practices referenced above, as well as to allegedly excessive advisory fees, commissions, and/or 12b-1 fees. The lawsuits were filed in different courts throughout the country. Many of those suits are now pending in a multi-district litigation in the United States District Court for the District of Maryland.
The Company and fund management strongly believe that the claims made in each of the private lawsuits referenced above are without merit and intend to defend against them vigorously. The Company cannot predict with certainty the eventual outcome of these lawsuits, nor whether they will have a material negative impact on the Company. If it is determined that the Company bears responsibility for any unlawful or inappropriate conduct that caused losses to the Trust, it is committed to making the Trust or their shareholders whole, as appropriate.
TG-21
Franklin Templeton Variable Insurance Products Trust
Templeton Growth Securities Fund
Report of Independent Registered Public Accounting Firm
To the Board of Trustees and Shareholders of
Franklin Templeton Variable Insurance Products Trust
In our opinion, the accompanying statement of assets and liabilities, including the statement of investments, and the related statements of operations and of changes in net assets and the financial highlights present fairly, in all material respects, the financial position of Templeton Growth Securities Fund (one of the funds constituting Franklin Templeton Variable Insurance Products Trust, hereafter referred to as the “Fund”) at December 31, 2005, the results of its operations for the year then ended, the changes in its net assets for each of the two years in the period then ended and the financial highlights for each of the five years in the period then ended, in conformity with accounting principles generally accepted in the United States of America. These financial statements and financial highlights (hereafter referred to as “financial statements”) are the responsibility of the Fund’s management; our responsibility is to express an opinion on these financial statements based on our audits. We conducted our audits of these financial statements in accordance with the standards of the Public Company Accounting Oversight Board (United States). Those standards require that we plan and perform the audit to obtain reasonable assurance about whether the financial statements are free of material misstatement. An audit includes examining, on a test basis, evidence supporting the amounts and disclosures in the financial statements, assessing the accounting principles used and significant estimates made by management, and evaluating the overall financial statement presentation. We believe that our audits, which included confirmation of securities at December 31, 2005, by correspondence with the custodian and brokers, provide a reasonable basis for our opinion.
PricewaterhouseCoopers LLP
San Francisco, California
February 10, 2006
TG-22
Franklin Templeton Variable Insurance Products Trust
Tax Designation (unaudited)
Templeton Growth Securities Fund
Under Section 852(b)(3)(c) of the Internal Revenue Code (Code), the Fund designates the maximum amount allowable but no less than $96,473,052 as a capital gain dividend for the fiscal year ended December 31, 2005.
Under Section 854(b)(2) of the Code, the Fund designates 39.27% of the ordinary income dividends as income qualifying for the dividends received deduction for the fiscal year ended December 31, 2005.
At December 31, 2005, more than 50% of the Fund’s total assets were invested in securities of foreign issuers. In most instances, foreign taxes were withheld from dividends paid to the Fund on these investments. The Fund elects to treat foreign taxes paid as allowed under Section 853 of the Code. This election will allow shareholders of record in June 2006, to treat their proportionate share of foreign taxes paid by the Fund as having been paid directly by them. The shareholder shall consider these amounts as foreign taxes paid in the tax year in which they receive the Fund distribution.
The foreign tax information will be disclosed in the June 30, 2006, semi-annual report of the Fund.
TG-23
INDEX DESCRIPTIONS
The indexes are unmanaged and include reinvested distributions.
Consumer Price Index (CPI), calculated by the U.S. Bureau of Labor Statistics, is a commonly used measure of the inflation rate.
CSFB High Yield Index is designed to mirror the investible universe of the U.S. dollar-denominated high yield debt market.
Dow Jones Industrial Average (the Dow) is price weighted based on the average market price of 30 blue chip stocks of companies that are generally industry leaders.
Dow Jones Wilshire Real Estate Securities Index is a broad measure of the performance of publicly traded real estate securities, such as real estate investment trusts and real estate operating companies. The index is capitalization weighted and rebalanced monthly, and returns are calculated on a buy-and-hold basis.
J.P. Morgan (JPM) Emerging Markets Bond Index (EMBI) Global tracks total returns for U.S. dollar-denominated debt instruments issued by emerging market sovereign and quasi-sovereign entities: Brady bonds, loans and Eurobonds.
J.P. Morgan (JPM) Euro Emerging Markets Bond Index (EMBI) Global tracks total returns for euro-denominated, straight fixed coupon instruments issued by emerging market sovereign and quasi-sovereign entities.
J.P. Morgan (JPM) Global Government Bond Index (GGBI) tracks total returns for liquid, fixed-rate, domestic government bonds with maturities greater than one year issued by developed countries globally.
Lehman Brothers (LB) U.S. Aggregate Index represents securities that are SEC-registered, taxable and dollar denominated. The index covers the U.S. investment grade fixed-rate bond market, with index components for government and corporate securities, mortgage pass-through securities and asset-backed securities. All issues included must have at least one year to final maturity and must be rated investment grade (Baa3 or better) by Moody’s Investors Service. They must also be dollar denominated and nonconvertible. Total return includes price appreciation/depreciation and income as a percentage of the original investment. The index is rebalanced monthly by market capitalization.
Lehman Brothers (LB) U.S. Government: Intermediate Index is the intermediate component of the LB U.S. Government Index. The index includes securities issued by the U.S. government or its agencies. These include public obligations of the U.S. Treasury with remaining maturity of one year or more and publicly issued debt of U.S. government agencies, quasi-federal corporations, and corporate or foreign debt guaranteed by the U.S. government.
Lehman Brothers (LB) U.S. High Yield Index covers the universe of fixed rate, non-investment-grade debt. The index includes both corporate and non-corporate sectors.
I-1
Lipper Multi-Sector Income Funds Classification Average is calculated by averaging the total returns of all funds within the Lipper Multi-Sector Income Funds classification in the Lipper Open-End underlying funds universe. Lipper Multi-Sector Income Funds are defined as funds that seek current income by allocating assets among different fixed income securities sectors (not primarily in one sector except for defensive purposes), including U.S. and foreign governments, with a significant portion rated below investment grade. For the 12-month period ended 12/31/05, there were 113 funds in this category. Lipper calculations do not include sales charges, but include reinvestment of any income or distributions. Fund performance relative to the average may have differed if these and other factors had been considered.
Lipper VIP Equity Income Funds Classification Average is an equally weighted average calculation of performance figures for all funds within the Lipper Equity Income Funds classification in the Lipper VIP underlying funds universe. Lipper Equity Income Funds seek relatively high current income and growth of income through investing 60% or more of their portfolios in equities. For the 12-month period ended 12/31/05, there were 62 funds in this category. Lipper calculations do not include contract fees, expenses or sales charges, and may have been different if such charges had been considered.
Lipper VIP General U.S. Government Funds Classification Average is an equally weighted average calculation of performance figures for all funds within the Lipper U.S. Government Funds classification in the Lipper VIP underlying funds universe. Lipper U.S. Government Funds invest primarily in U.S. government and agency issues. For the 12-month period ended 12/31/05, there were 59 funds in this category. Lipper calculations do not include contract fees, expenses or sales charges, and may have been different if such charges had been considered.
Lipper VIP High Current Yield Funds Classification Average is an equally weighted average calculation of performance figures for all funds within the Lipper U.S. High Current Yield Funds classification in the Lipper VIP underlying funds universe. Lipper U.S. High Current Yield Funds aim at high (relative) current yield from fixed income securities, have no quality or maturity restrictions, and tend to invest in lower grade debt issues. For the 12-month period ended 12/31/05, there were 94 funds in this category. Lipper calculations do not include contract fees, expenses or sales charges, and may have been different if such charges had been considered.
Lipper VIP Income Funds Classification Average is an equally weighted average calculation of performance figures for all funds within the Lipper Income Funds classification in the Lipper VIP underlying funds universe. Lipper Income Funds seek a high level of current income through investing in income-producing stocks, bonds and money market instruments. For the 12-month period ended 12/31/05, there were 22 funds in this category. Lipper calculations do not include contract fees, expenses or sales charges, and may have been different if such charges had been considered.
Merrill Lynch 2- and 5-Year Zero Coupon Bond Indexes include zero coupon bonds that pay no interest and are issued at a discount from redemption price.
Morgan Stanley Capital International (MSCI) All Country (AC) World Index is a free float-adjusted, market capitalization-weighted index designed to measure equity market performance in global developed and emerging markets.
I-2
Morgan Stanley Capital International (MSCI) All Country (AC) World ex US Index is a free float-adjusted, market capitalization-weighted index designed to measure equity market performance in global developed and emerging markets excluding the U.S.
Morgan Stanley Capital International (MSCI) Emerging Markets (EM) Index is a free float-adjusted, market capitalization-weighted index designed to measure equity market performance in global emerging markets.
Morgan Stanley Capital International (MSCI) Europe, Australasia, Far East (EAFE) Index is a free float-adjusted, market capitalization-weighted index designed to measure equity market performance in global developed markets excluding the U.S. and Canada.
Morgan Stanley Capital International (MSCI) Russia Index is a free float-adjusted, market capitalization-weighted index designed to measure equity performance in Russia.
Morgan Stanley Capital International (MSCI) USA Index is a free float-adjusted, market capitalization-weighted index designed to measure equity market performance in the U.S.
Morgan Stanley Capital International (MSCI) World Index is a free float-adjusted, market capitalization-weighted index designed to measure equity market performance in global developed markets.
NASDAQ Composite Index measures all NASDAQ domestic and international based common type stocks listed on The NASDAQ Stock Market. The index is market value weighted and includes more than 3,000 companies.
Russell 1000 Growth Index is market capitalization weighted and measures performance of those Russell 1000 Index companies with higher price-to-book ratios and higher forecasted growth values.
Russell 1000 Index is market capitalization weighted and measures performance of the 1,000 largest companies in the Russell 3000 Index, which represent approximately 92% of total market capitalization of the Russell 3000 Index.
Russell 1000 Value Index is market capitalization weighted and measures performance of those Russell 1000 Index companies with lower price-to-book ratios and lower forecasted growth values.
Russell 2000 Value Index is market capitalization weighted and measures performance of those Russell 2000 Index companies with lower price-to-book ratios and lower forecasted growth values.
Russell 2500 Growth Index is market capitalization weighted and measures performance of those Russell 2500 Index companies with higher price-to-book ratios and higher forecasted growth values.
Russell 2500 Value Index is market capitalization weighted and measures performance of those Russell 2500 Index companies with lower price-to-book ratios and lower forecasted growth values.
Russell 3000 Growth Index is market capitalization weighted and measures performance of those Russell 3000 Index companies with higher price-to-book ratios and higher forecasted growth values.
I-3
Russell Midcap Growth Index is market capitalization weighted and measures performance of those Russell Midcap Index companies with higher price-to-book ratios and higher forecasted growth values.
Russell Midcap Value Index is market capitalization weighted and measures performance of those Russell Midcap Index companies with lower price-to-book ratios and lower forecasted growth values.
Standard & Poor’s 500 Index (S&P 500) consists of 500 stocks chosen for market size, liquidity and industry group representation. Each stock’s weight in the index is proportionate to its market value. The S&P 500 is one of the most widely used benchmarks of U.S. equity performance.
Standard & Poor’s/International Finance Corporation Investable (S&P/IFCI) Composite Index is a free float-adjusted, market capitalization-weighted index designed to measure equity performance in global emerging markets.
I-4
Board Members and Officers
The name, year of birth and address of the officers and board members, as well as their affiliations, positions held with the Trust, principal occupations during the past five years and number of portfolios overseen in the Franklin Templeton Investments fund complex are shown below. Each board member will serve until that person’s successor is elected and qualified.
Independent Board Members
| | | | | | | | |
| Name, Year of Birth and Address | | Position | | Length of
Time Served | | Number of
Portfolios in Fund
Complex Overseen
by Board Member* | | Other Directorships Held |
HARRIS J. ASHTON (1932) One Franklin Parkway San Mateo, CA 94403-1906 | | Trustee | | Since 1988 | | 140 | | Director, Bar-S Foods (meat packing company). |
|
Principal Occupation During Past 5 Years: Director of various companies; and formerly, Director, RBC Holdings, Inc. (bank holding company) (until 2002); and President, Chief Executive Officer and Chairman of the Board, General Host Corporation (nursery and craft centers) (until 1998). |
ROBERT F. CARLSON (1928) One Franklin Parkway San Mateo, CA 94403-1906 | | Trustee | | Since 1998 | | 56 | | None |
|
Principal Occupation During Past 5 Years: Vice President, senior member and past President, Board of Administration, California Public Employees Retirement Systems (CALPERS); and formerly, member and Chairman of the Board, Sutter Community Hospitals; member, Corporate Board, Blue Shield of California; and Chief Counsel, California Department of Transportation. |
S. JOSEPH FORTUNATO (1932) One Franklin Parkway San Mateo, CA 94403-1906 | | Trustee | | Since 1989 | | 141 | | None |
|
Principal Occupation During Past 5 Years: Attorney; and formerly, member of the law firm of Pitney, Hardin, Kipp & Szuch (until 2002) (Consultant (2003)). |
EDITH E. HOLIDAY (1952) One Franklin Parkway San Mateo, CA 94403-1906 | | Trustee | | Since June 2005 | | 136 | | Director, Amerada Hess Corporation (exploration and refining of oil and gas), H.J. Heinz Company (processed foods and allied products), RTI International Metals, Inc. (manufacture and distribution of titanium), Canadian National Railway (railroad), and White Mountains Insurance Group, Ltd. (holding company). |
|
Principal Occupation During Past 5 Years: Director or Trustee of various companies and trusts; and formerly, Assistant to the President of the United States and Secretary of the Cabinet (1990-1993); General Counsel to the United States Treasury Department (1989-1990); and Counselor to the Secretary and Assistant Secretary for Public Affairs and Public Liaison-United States Treasury Department (1988-1989). |
FRANK W.T. LAHAYE (1929) One Franklin Parkway San Mateo, CA 94403-1906 | | Trustee | | Since 1988 | | 114 | | Director, Center for Creative Land Recycling (redevelopment). |
|
Principal Occupation During Past 5 Years: General Partner, Las Olas L.P. (Asset Management); and formerly, Chairman, Peregrine Venture Management Company (venture capital). |
BOD-1
| | | | | | | | |
| Name, Year of Birth and Address | | Position | | Length of
Time Served | | Number of
Portfolios in Fund
Complex Overseen
by Board Member* | | Other Directorships Held |
GORDON S. MACKLIN (1928) One Franklin Parkway San Mateo, CA 94403-1906 | | Trustee | | Since 1993 | | 140 | | Director, Martek Biosciences Corporation, MedImmune, Inc. (biotechnology), and Overstock.com (Internet services); and formerly, Director, MCI Communication Corporation (subsequently known as MCI WorldCom, Inc. and WorldCom, Inc.) (communications services) (1988-2002), White Mountains Insurance Group, Ltd. (holding company) (1987-2004) and Spacehab, Inc. (aerospace services) (1994-2003). |
|
Principal Occupation During Past 5 Years: Director of various companies; and formerly, Deputy Chairman, White Mountains Insurance Group, Ltd. (holding company) (2001-2004); Chairman, White River Corporation (financial services) (1993-1998) and Hambrecht & Quist Group (investment banking) (1987-1992); and President, National Association of Securities Dealers, Inc. (1970-1987). |
FRANK A. OLSON (1932) One Franklin Parkway San Mateo, CA 94403-1906 | | Trustee | | Since June 2005 | | 101 | | Director, White Mountains Insurance Group, Ltd. (holding company), Amerada Hess Corporation (exploration and refining of oil and gas) and Sentient Jet (private jet service); and formerly, Director, Becton Dickinson and Company (medical technology), Cooper Industries, Inc. (electrical products and tools and hardware), Health Net, Inc. (formerly, Foundation Health) (integrated managed care), The Hertz Corporation, Pacific Southwest Airlines, The RCA Corporation, Unicom (formerly, Commonwealth Edison) and UAL Corporation (airlines). |
|
Principal Occupation During Past 5 Years: Chairman Emeritus, The Hertz Corporation (car rental) (since 2000) (Chairman of the Board (1980-2000) and Chief Executive Officer (1977-1999)); and formerly, Chairman of the Board, President and Chief Executive Officer, UAL Corporation (airlines). |
Interested Board Members and Officers
| | | | | | | | |
| Name, Year of Birth and Address | | Position | | Length of
Time Served | | Number of
Portfolios in Fund
Complex Overseen
by Board Member* | | Other Directorships Held |
**CHARLES B. JOHNSON (1933) One Franklin Parkway San Mateo, CA 94403-1906 | | Trustee and Chairman of the Board | | Since 1988 | | 140 | | None |
|
Principal Occupation During Past 5 Years: Chairman of the Board, Member—Office of the Chairman and Director, Franklin Resources, Inc.; Vice President, Franklin Templeton Distributors, Inc.; Director, Fiduciary Trust Company International; and officer and/or director or trustee, as the case may be, of some of the other subsidiaries of Franklin Resources, Inc. and of 42 of the investment companies in Franklin Templeton Investments. |
**RUPERT H. JOHNSON, JR. (1940) One Franklin Parkway San Mateo, CA 94403-1906 | | Trustee, President and Chief Executive Officer— Investment Management | | Trustee since 1988 and President and Chief Executive Officer—Investment Management since 2002 | | 124 | | None |
|
Principal Occupation During Past 5 Years: Vice Chairman, Member—Office of the Chairman and Director, Franklin Resources, Inc.; Vice President and Director, Franklin Templeton Distributors, Inc.; Director, Franklin Advisers, Inc.; Senior Vice President, Franklin Advisory Services, LLC; and officer and/or director or trustee, as the case may be, of some of the other subsidiaries of Franklin Resources, Inc. and of 45 of the investment companies in Franklin Templeton Investments. |
BOD-2
| | | | | | | | |
| Name, Year of Birth and Address | | Position | | Length of
Time Served | | Number of
Portfolios in Fund
Complex Overseen
by Board Member* | | Other Directorships Held |
HARMON E. BURNS (1945) One Franklin Parkway San Mateo, CA 94403-1906 | | Vice President | | Since 1988 | | Not
Applicable | | Not Applicable |
|
Principal Occupation During Past 5 Years: Vice Chairman, Member—Office of the Chairman and Director, Franklin Resources, Inc.; Vice President and Director, Franklin Templeton Distributors, Inc.; Executive Vice President, Franklin Advisers, Inc.; and officer and/or director or trustee, as the case may be, of some of the other subsidiaries of Franklin Resources, Inc. and of 45 of the investment companies in Franklin Templeton Investments. |
JAMES M. DAVIS (1952) One Franklin Parkway San Mateo, CA 94403-1906 | | Chief Compliance Officer | | Since 2004 | | Not
Applicable | | Not Applicable |
|
Principal Occupation During Past 5 Years: Director, Global Compliance, Franklin Resources, Inc.; officer of 47 of the investment companies in Franklin Templeton Investments; and formerly, Director of Compliance, Franklin Resources, Inc. (1994-2001). |
LAURA FERGERSON (1962) One Franklin Parkway San Mateo, CA 94403-1906 | | Treasurer | | Since 2004 | | Not
Applicable | | Not Applicable |
|
Principal Occupation During Past 5 Years: Vice President, Franklin Templeton Services, LLC; officer of 31 of the investment companies in Franklin Templeton Investments; and formerly, Director and member of Audit and Valuation Committees, Runkel Funds, Inc. (2003-2004); Assistant Treasurer of most of the investment companies in Franklin Templeton Investments (1997-2003); and Vice President, Franklin Templeton Services, LLC (1997-2003). |
JIMMY D. GAMBILL (1947) 500 East Broward Blvd. Suite 2100 Fort Lauderdale, FL 33394-3091 | | Senior Vice President and Chief Executive Officer— Finance and Administration | | Since 2002 | | Not
Applicable | | Not Applicable |
|
Principal Occupation During Past 5 Years: President, Franklin Templeton Services, LLC; Senior Vice President, Templeton Worldwide, Inc.; and officer of 47 of the investment companies in Franklin Templeton Investments. |
DAVID P. GOSS (1947) One Franklin Parkway San Mateo, CA 94403-1906 | | Vice President | | Since 2000 | | Not
Applicable | | Not Applicable |
|
Principal Occupation During Past 5 Years: Senior Associate General Counsel, Franklin Resources, Inc.; officer and director of one of the subsidiaries of Franklin Resources, Inc.; officer of 47 of the investment companies in Franklin Templeton Investments; and formerly, President, Chief Executive Officer and Director, Property Resources Equity Trust (until 1999) and Franklin Select Realty Trust (until 2000). |
STEVEN J. GRAY (1955) One Franklin Parkway San Mateo, CA 94403-1906 | | Secretary | | Since October 2005 | | Not
Applicable | | Not Applicable |
|
Principal Occupation During Past 5 Years: Senior Associate General Counsel, Franklin Resources, Inc.; officer of 33 of the investment companies in Franklin Templeton Investments; and formerly, Chief Legal Counsel, Atlas Advisers, Inc. (until 2000). |
BOD-3
| | | | | | | | |
| Name, Year of Birth and Address | | Position | | Length of
Time Served | | Number of
Portfolios in Fund
Complex Overseen
by Board Member* | | Other Directorships Held |
BARBARA J. GREEN (1947) One Franklin Parkway San Mateo, CA 94403-1906 | | Vice President | | Since 2000 | | Not
Applicable | | Not Applicable |
|
Principal Occupation During Past 5 Years: Vice President, Deputy General Counsel and Secretary, Franklin Resources, Inc.; Secretary and Senior Vice President, Templeton Worldwide, Inc.; Secretary, Franklin Advisers, Inc., Franklin Advisory Services, LLC, Franklin Investment Advisory Services, LLC, Franklin Mutual Advisers, LLC, Franklin Templeton Alternative Strategies, Inc., Franklin Templeton Investor Services, LLC, Franklin Templeton Services, LLC, Franklin Templeton Distributors, Inc., Templeton Investment Counsel, LLC, and Templeton/Franklin Investment Services, Inc.; and officer of some of the other subsidiaries of Franklin Resources, Inc. and of 47 of the investment companies in Franklin Templeton Investments; and formerly, Deputy Director, Division of Investment Management, Executive Assistant and Senior Advisor to the Chairman, Counselor to the Chairman, Special Counsel and Attorney Fellow, U.S. Securities and Exchange Commission (1986-1995); Attorney, Rogers & Wells (until 1986); and Judicial Clerk, U.S. District Court (District of Massachusetts) (until 1979). |
MICHAEL O. MAGDOL (1937) 600 Fifth Avenue Rockefeller Center New York, NY 10020-2302 | | Vice President— AML Compliance | | Since 2002 | | Not
Applicable | | Not Applicable |
|
Principal Occupation During Past 5 Years: Vice Chairman, Chief Banking Officer and Director, Fiduciary Trust Company International; Director, Franklin Templeton Institutional Suisse S.A., Arch Chemicals, Inc. and Lingnan Foundation; and officer and/or director, as the case may be, of some of the other subsidiaries of Franklin Resources, Inc. and of 45 of the investment companies in Franklin Templeton Investments. |
CRAIG S. TYLE (1960) One Franklin Parkway San Mateo, CA 94403-1906 | | Vice President | | Since October 2005 | | Not
Applicable | | Not Applicable |
|
Principal Occupation During Past 5 Years: General Counsel and Executive Vice President, Franklin Resources, Inc.; officer of 47 of the investment companies in Franklin Templeton Investments; and formerly, Partner, Shearman & Sterling, LLP (2004-2005); and General Counsel, Investment Company Institute (ICI) (1997-2004). |
GALEN G. VETTER (1951) 500 East Broward Blvd. Suite 2100 Fort Lauderdale, FL 33394-3091 | | Chief Financial Officer and Chief Accounting Officer | | Since 2004 | | Not
Applicable | | Not Applicable |
|
Principal Occupation During Past 5 Years: Senior Vice President, Franklin Templeton Services, LLC; officer of 47 of the investment companies in Franklin Templeton Investments; and formerly, Managing Director, RSM McGladrey, Inc. (1999-2004); and Partner, McGladrey & Pullen, LLP (1979-1987 and 1991-2004). |
| *We | base the number of portfolios on each separate series of the U.S. registered investment companies within the Franklin Templeton Investments fund complex. These portfolios have a common investment adviser or affiliated investment advisers. |
| **Charles | B. Johnson and Rupert H. Johnson, Jr. are considered to be interested persons of the Trust under the federal securities laws due to their positions as officers and directors and major shareholders of Franklin Resources, Inc., which is the parent company of the Trust’s advisers and distributor. |
Note: Charles B. Johnson and Rupert H. Johnson, Jr. are brothers.
BOD-4
The Sarbanes-Oxley Act of 2002 and Rules adopted by the Securities and Exchange Commission require the Fund to disclose whether the Fund’s Audit Committee includes at least one member who is an audit committee financial expert within the meaning of such Act and Rules. The Fund’s Board of Trustees has determined that there is at least one such financial expert on the Audit Committee and has designated Frank W.T. LaHaye as its audit committee financial expert. The Board believes that Mr. LaHaye qualifies as such an expert in view of his extensive business background and experience, including service as President and Director of McCormick Selph Associates from 1954 through 1965; Director and Chairman of Teledyne Canada Ltd. from 1966 through 1971; Director and Chairman of Quarterdeck Corporation from 1982 through 1998; and services as a Director of various other public companies including U.S. Telephone Inc. (1981-1984), Fisher Imaging Inc. (1991-1998) and Digital Transmissions Systems (1995-1999). In addition, Mr. LaHaye served from 1981 to 2000 as a Director and Chairman of Peregrine Venture Management Co., a venture capital firm, and has been a Member and Chairman of the Fund’s Audit Committee since its inception. As a result of such background and experience, the Board of Trustees believes that Mr. LaHaye has acquired an understanding of generally accepted accounting principles and financial statements, the general application of such principles in connection with the accounting estimates, accruals and reserves, and analyzing and evaluating financial statements that present a breadth and level of complexity of accounting issues generally comparable to those of the Fund, as well as an understanding of internal controls and procedures for financial reporting and an understanding of audit committee functions. Mr. LaHaye is an independent Trustee as that term is defined under the relevant Securities and Exchange Commission Rules and Releases.
The Statement of Additional Information (SAI) includes additional information about the board members and is available, without charge, upon request. Contract owners may call 1-800/321-8563 or their insurance companies to request the SAI.
BOD-5
Franklin Templeton Variable Insurance Products Trust
Shareholder Information
Board Review of Advisory Contracts
Franklin Mutual Advisers, LLC (Franklin Mutual) entered into an agreement with Franklin Templeton Investment Management Limited (Investment Management) on behalf of Mutual Discovery Securities Fund, effective May 19, 2005. Investment Management provides the services of Anne E. Gudefin to Franklin Mutual while she remains employed by Investment Management. Ms. Gudefin was previously employed by Franklin Mutual. Investment Management is indirectly wholly owned by Franklin Resources Inc., (Resources), a publicly-owned company engaged in the financial services industry through its subsidiaries. Charles B. Johnson and Rupert H. Johnson, Jr. are the principal shareholders of Resources. The Board of Trustees (“Board”), in approving the agreement between Franklin Mutual and Investment Management, noted that its determinations and considerations had not changed from those enumerated with respect to the Board’s approval of the annual renewal of the agreement with Franklin Mutual with respect to Mutual Discovery Securities Fund. In this regard it was noted that the agreement with Investment Management was intended solely to reflect Ms. Gudefin’s relocation to the London offices of Franklin Templeton Investments and in no way impacted the services provided by Franklin Mutual or the fees paid by the Fund for such services.
Templeton Investment Counsel, LLC (Investment Counsel) entered into an agreement with Investment Management, effective October 17, 2005, on behalf of each of Templeton Global Asset Allocation Fund and Templeton Foreign Securities Fund. Investment Management provides the services of Tucker Scott, one of the members of each Fund’s portfolio management team who resides in Geneva, Switzerland, while he remains employed by Investment Management. The Board, in approving the agreements between Investment Counsel and Investment Management, noted that its determinations and considerations had not changed from those enumerated with respect to the Board’s approval of the annual renewal of the agreements with Investment Counsel with respect to Templeton Global Asset Allocation Fund and Templeton Foreign Securities Fund. In this regard it was noted that the agreements with Investment Management were intended solely to reflect Tucker Scott’s relocation to the Switzerland offices of Franklin Templeton Investments and in no way impacted the services provided by Investment Counsel or the fees paid by the Funds for such services.
Proxy Voting Policies and Procedures
The Trust has established Proxy Voting Policies and Procedures (“Policies”) that the Trust uses to determine how to vote proxies relating to portfolio securities. Shareholders may view the Trust’s complete Policies online at franklintempleton.com. Alternatively, shareholders may request copies of the Policies free of charge by calling the Proxy Group collect at 1-954/847-2268 or by sending a written request to: Franklin Templeton Companies, LLC, 500 East Broward Boulevard, Suite 1500, Fort Lauderdale, FL 33394, Attention: Proxy Group. Copies of the Trust’s proxy voting records are also made available online at franklintempleton.com and posted on the U.S. Securities and Exchange Commission’s website at sec.gov and reflect the most recent 12-month period ended June 30.
Quarterly Statement of Investments
The Trust files a complete statement of investments with the U.S. Securities and Exchange Commission for the first and third quarters for each fiscal year on Form N-Q. Shareholders may view the filed Form N-Q by visiting the Commission’s website at sec.gov. The filed form may also be viewed and copied at the Commission’s Public Reference Room in Washington, DC. Information regarding the operations of the Public Reference Room may be obtained by calling 1-800/SEC-0330.
SI-1
| | |
 | | One Franklin Parkway San Mateo, CA 94403-1906 |
Annual Report
FRANKLIN TEMPLETON
VARIABLE INSURANCE PRODUCTS TRUST
Investment Managers
Franklin Advisers, Inc.
Franklin Advisory Services, LLC
Franklin Mutual Advisers, LLC
Templeton Asset Management, Ltd., Singapore
Templeton Global Advisors Limited
Templeton Investment Counsel, LLC
Distributor
Franklin Templeton Distributors, Inc.
Franklin Templeton Variable Insurance Products Trust (FTVIP) shares are sold only to insurance company separate accounts (“Separate Account”) to serve as the investment vehicles for both variable annuity and variable life insurance contracts.
Authorized for distribution only when accompanied or preceded by the current prospectus for the applicable contract, which includes the Separate Account and the FTVIP prospectuses. Investors should carefully consider a fund’s investment goals, risks, charges and expenses before investing. The prospectus contains this and other information; please read it carefully before investing.
To ensure the highest quality of service, telephone calls to or from our service departments may be monitored, recorded and accessed. These calls can be identified by the presence of a regular beeping tone.
FTVIP A2005 02/06
Item 2. Code of Ethics.
| (a) | The Registrant has adopted a code of ethics that applies to its principal executive officers and principal financial and accounting officer. |
| (f) | Pursuant to Item 12(a)(1), the Registrant is attaching as an exhibit a copy of its code of ethics that applies to its principal executive officers and principal financial and accounting officer. |
Item 3. Audit Committee Financial Expert.
| | | | |
| (a) | | (1) | | The Registrant has an audit committee financial expert serving on its audit committee. |
| | (2) | | The audit committee financial expert is Frank W.T. LaHaye and he is “Independent” as defined under the relevant Securities and Exchange Commission Rules And Releases. |
Item 4. Principal Accountant Fees and Services.
(a) Audit Fees
The aggregate fees paid to the principal accountant for professional services rendered by the principal accountant for the audit of the registrant’s annual financial statements or for services that are normally provided by the principal accountant in connection with statutory and regulatory filings or engagements were $645,310 for the fiscal year ended December 31, 2005 and $580,753 for the fiscal year ended December 31, 2004.
(b) Audit-Related Fees
There were no fees paid to the principal accountant for assurance and related services rendered by the principal accountant to the registrant that are reasonably related to the performance of the audit of the registrant’s financial statements and are not reported under paragraph (a) of Item 4.
The aggregate fees paid to the principal accountant for assurance and related services rendered by the principal accountant to the registrant’s investment adviser and any entity controlling, controlled by or under common control with the investment adviser that provides ongoing services to the registrant that are reasonably related to the performance of the audit of their financial statements were $0 for the fiscal year ended December 31, 2005 and $48,579 for the fiscal year ended December 31, 2004. The services for which these fees were paid included attestation services.
(c) Tax Fees
There were no fees paid to the principal accountant for professional services rendered by the principal accountant to the registrant for tax compliance, tax advice and tax planning.
The aggregate fees paid to the principal accountant for professional services rendered by the principal accountant to the registrant’s investment adviser and any entity controlling, controlled by or under common control with the investment adviser that provides ongoing services to the registrant for tax compliance, tax advice and tax planning were $23,161 for the fiscal year ended December 31, 2005 and $0 for the fiscal year ended December 31, 2004. The services for which these fees were paid included tax compliance and advice.
(d) All Other Fees
The aggregate fees paid to the principal accountant for products and services rendered by the principal accountant to the registrant not reported in paragraphs (a)-(c) of Item 4 were $0 for the fiscal year ended December 31, 2005 and $7,563 for the fiscal year ended December 31, 2004. The services for which these fees were paid included review of materials provided to the fund Board in connection with the investment management contract renewal process.
The aggregate fees paid to the principal accountant for products and services rendered by the principal accountant to the registrant’s investment adviser and any entity controlling, controlled by or under common control with the investment adviser that provides ongoing services to the registrant not reported in paragraphs (a)-(c) of Item 4 were $4,789 for the fiscal year ended December 31, 2005 and $152,437 for the fiscal year ended December 31, 2004. The services for which these fees were paid included review of materials provided to the fund Board in connection with the investment management contract renewal process and the review of the ICI transfer agent survey.
(e) (1) The registrant’s audit committee is directly responsible for approving the services to be provided by the auditors, including:
(i) pre-approval of all audit and audit related services;
(ii) pre-approval of all non-audit related services to be provided to the Fund by the auditors;
(iii) pre-approval of all non-audit related services to be provided to the registrant by the auditors to the registrant’s investment adviser or to any entity that controls, is controlled by or is under common control with the registrant’s investment adviser and that provides ongoing services to the registrant where the non-audit services relate directly to the operations or financial reporting of the registrant; and
(iv) establishment by the audit committee, if deemed necessary or appropriate, as an alternative to committee pre-approval of services to be provided by the auditors, as required by paragraphs (ii) and (iii) above, of policies and procedures to permit such services to be pre-approved by other means, such as through establishment of guidelines or by action of a designated member or members of the committee; provided the policies and procedures are detailed as to the particular service and the committee is informed of each service and such policies and procedures do not include delegation of audit committee responsibilities, as contemplated under the Securities Exchange Act of 1934, to management; subject, in the case of (ii) through (iv), to any waivers, exceptions or exemptions that may be available under applicable law or rules.
(e) (2) None of the services provided to the registrant described in paragraphs (b)-(d) of Item 4 were approved by the audit committee pursuant to paragraph (c)(7)(i)(C) of Rule 2-01 of regulation S-X.
(f) No disclosures are required by this Item 4(f).
(g) The aggregate non-audit fees paid to the principal accountant for services rendered by the principal accountant to the registrant and the registrant’s investment adviser and any entity controlling, controlled by or under common control with the investment adviser that provides ongoing services to the registrant were $27,950 for the fiscal year ended December 31, 2005 and $208,579 for the fiscal year ended December 31, 2004.
(h) The registrant’s audit committee of the board of trustees has considered whether the provision of non-audit services that were rendered to the registrant’s investment adviser (not including any sub-adviser whose role is primarily portfolio management and is subcontracted with or overseen by another investment adviser), and any entity controlling, controlled by, or under common control with the investment adviser that provides ongoing services to the registrant that were not pre-approved pursuant to paragraph (c)(7)(ii) of Rule 2-01 of Regulation S-X is compatible with maintaining the principal accountant’s independence.
| | | | |
Item 5. | | Audit Committee of Listed Registrants. | | N/A |
| | |
Item 6. | | Schedule of Investments. | | N/A |
| | |
Item 7. | | Disclosure of Proxy Voting Policies and Procedures for Closed-End Management Investment Companies. | | N/A |
| | |
Item 8. | | Portfolio Managers of Closed-End Management Investment Companies. | | N/A |
| | |
Item 9. | | Purchases of Equity Securities by Closed-End Management Investment Companies and Affiliated Purchases. | | N/A |
Item 10. Submission of Matters to a vote of Security Holders.
There have been no changes to the procedures by which shareholders may recommend nominees to the Registrant’s Board of Trustees that would require disclosure herein.
Item 11. Controls and Procedures.
(a) Evaluation of Disclosure Controls and Procedures. The Registrant maintains disclosure controls and procedures that are designed to ensure that information required to be disclosed in the Registrant’s filings under the Securities Exchange Act of 1934 and the Investment Company Act of 1940 is recorded, processed, summarized and reported within the periods specified in the rules and forms of the Securities and Exchange Commission. Such information is accumulated and communicated to the Registrant’s management, including its principal executive officer and principal financial officer, as appropriate, to allow timely decisions regarding required disclosure. The Registrant’s management, including the principal executive officer and the principal financial officer, recognizes that any set of controls and procedures, no matter how well designed and operated, can provide only reasonable assurance of achieving the desired control objectives.
Within 90 days prior to the filing date of this Shareholder Report on Form N-CSR, the Registrant had carried out an evaluation, under the supervision and with the participation of the Registrant’s management, including the Registrant’s principal executive officer and the
Registrant’s principal financial officer, of the effectiveness of the design and operation of the Registrant’s disclosure controls and procedures. Based on such evaluation, the Registrant’s principal executive officer and principal financial officer concluded that the Registrant’s disclosure controls and procedures are effective.
(b) Changes in Internal Controls. There have been no significant changes in the Registrant’s internal controls or in other factors that could significantly affect the internal controls subsequent to the date of their evaluation in connection with the preparation of this Shareholder Report on Form N-CSR.
Item 12. Exhibits.
(a) (1) Code of Ethics
(a) (2) Certifications pursuant to Section 302 of the Sarbanes-Oxley Act of 2002 of Jimmy D. Gambill, Chief Executive Officer - Finance and Administration, and Galen G. Vetter, Chief Financial Officer
(b) Certifications pursuant to Section 906 of the Sarbanes-Oxley Act of 2002 of Jimmy D. Gambill, Chief Executive Officer - Finance and Administration, and Galen G. Vetter, Chief Financial Officer
SIGNATURES
Pursuant to the requirements of the Securities Exchange Act of 1934 and the Investment Company Act of 1940, the registrant has duly caused this report to be signed on its behalf by the undersigned, thereunto duly authorized.
FRANKLIN TEMPLETON VARIABLE INSURANCE PRODUCTS TRUST
| | |
| By | | /s/ Jimmy D. Gambill |
| Jimmy D. Gambill |
| Chief Executive Officer - Finance and Administration |
| Date: | | February 21, 2006 |
Pursuant to the requirements of the Securities Exchange Act of 1934 and the Investment Company Act of 1940, this report has been signed below by the following persons on behalf of the registrant and in the capacities and on the dates indicated.
| | |
| By | | /s/ Jimmy D. Gambill |
| Jimmy D. Gambill |
| Chief Executive Officer - Finance and Administration |
| Date: | | February 21, 2006 |
| | |
| By | | /s/ Galen G. Vetter |
| Galen G. Vetter |
| Chief Financial Officer |
| Date: | | February 21, 2006 |