UNITED STATES
SECURITIES AND EXCHANGE COMMISSION
Washington, D.C. 20549
FORM N-CSR
CERTIFIED SHAREHOLDER REPORT OF REGISTERED MANAGEMENT
INVESTMENT COMPANIES
Investment Company Act file number 811-05583
Franklin Templeton Variable Insurance Products Trust
(Exact name of registrant as specified in charter)
| | |
| One Franklin Parkway, San Mateo, CA | | 94403-1906 |
| (Address of principal executive offices) | | (Zip code) |
Murray L. Simpson, One Franklin Parkway, San Mateo, CA 94403-1906
(Name and address of agent for service)
Registrant’s telephone number, including area code: (650) 312-2100
Date of fiscal year end: 12/31
Date of reporting period: 12/31/04
| Item 1. | Reports to Stockholders. |
FRANKLIN TEMPLETON VARIABLE INSURANCE PRODUCTS TRUST ANNUAL REPORT
TABLEOF CONTENTS
*Not part of the annual report
NOT FDIC INSURED | MAY LOSE VALUE | NO BANK GUARANTEE
MASTER CLASS - 3
IMPORTANT NOTESTOPERFORMANCE INFORMATION
Performance data is historical and cannot predict or guarantee future results. Principal value and investment return will fluctuate with market conditions, and you may have a gain or loss when you withdraw your money. Inception dates of the funds may have preceded the effective dates of the subaccounts, contracts, or their availability in all states.
When reviewing the index comparisons, please keep in mind that indexes have a number of inherent performance differentials over the funds. First, unlike the funds, which must hold a minimum amount of cash to maintain liquidity, indexes do not have a cash component. Second, the funds are actively managed and, thus, are subject to management fees to cover salaries of securities analysts or portfolio managers in addition to other expenses. Indexes are unmanaged and do not include any commissions or other expenses typically associated with investing in securities. Third, indexes often contain a different mix of securities than the fund to which they are compared. Additionally, please remember that indexes are simply a measure of performance and cannot be invested in directly.
i
SUPPLEMENT DATED FEBRUARY 9, 2005
TOTHE PROSPECTUSES DATED MAY 1, 2004,OF:
FRANKLIN GLOBAL COMMUNICATIONS SECURITIES FUND
FRANKLIN GROWTH AND INCOME SECURITIES FUND
FRANKLIN HIGH INCOME FUND
FRANKLIN INCOME SECURITIES FUND
FRANKLIN LARGE CAP GROWTH SECURITIES FUND
FRANKLIN MONEY MARKET FUND
FRANKLIN REAL ESTATE FUND
FRANKLIN RISING DIVIDENDS SECURITIES FUND
FRANKLIN SMALL CAP FUND
FRANKLIN SMALL CAP VALUE SECURITIES FUND
FRANKLIN STRATEGIC INCOME SECURITIES FUND
FRANKLIN U.S. GOVERNMENT FUND
FRANKLIN ZERO COUPON FUND 2005
FRANKLIN ZERO COUPON FUND 2010
MUTUAL DISCOVERY SECURITIES FUND
MUTUAL SHARES SECURITIES FUND
TEMPLETON DEVELOPING MARKETS SECURITIES FUND
TEMPLETON FOREIGN SECURITIES FUND
TEMPLETON GLOBAL ASSET ALLOCATION FUND
TEMPLETON GLOBAL INCOME SECURITIES FUND
TEMPLETON GROWTH SECURITIES FUND
(FRANKLIN TEMPLETON VARIABLE INSURANCE PRODUCTS TRUST)
The prospectuses for shares of Class 1, Class 2 and Class 3 are amended by replacing the “Regulatory Update” section under “Additional Information, All Funds” (or under “Additional Information”) with the following:
On February 4, 2004, the Securities Division of the Office of the Secretary of the Commonwealth of Massachusetts filed an administrative complaint against Franklin Resources, Inc. and certain of its subsidiaries (the Company) claiming violations of the Massachusetts Uniform Securities Act (Massachusetts Act) with respect to an alleged arrangement to permit market timing (the Massachusetts Proceeding). On September 20, 2004, Franklin Resources, Inc. announced that an agreement had been reached by two of its subsidiaries, Franklin Advisers, Inc. (Advisers) and Franklin Templeton Alternative Strategies, Inc. (FTAS), with the Securities Division of the Office of the Secretary of the Commonwealth of Massachusetts (the State of Massachusetts) related to the Massachusetts Proceeding. Under the terms of the settlement consent order issued by the State of Massachusetts, Advisers and FTAS have consented to the entry of a cease and desist order and agreed to pay a $5 million administrative fine to the State of Massachusetts. The administrative complaint addressed one instance of market timing that was also a subject of the August 2, 2004 settlement that Advisers reached with the Securities and Exchange Commission described below.
SUPP-1
On November 19, 2004, the Company reached a second agreement with the State of Massachusetts regarding an administrative complaint filed on October 25, 2004. The second complaint alleged that the Company’s Form 8-K filing describing the original settlement failed to state the company had admitted the Statements of Fact portion of the settlement order when it stated, “Franklin did not admit or deny engaging in any wrongdoing.”
As a result of the November 19, 2004 settlement with the State of Massachusetts, the Company filed a new Form 8-K. The terms of the original settlement did not change and there was no monetary fine associated with this second settlement.
On November 17, 2004, the Company announced that Franklin Templeton Distributors, Inc. (Distributors) (the principal underwriter of shares of the Franklin Templeton mutual funds) reached an agreement with the California Attorney General’s Office (CAGO), resolving the issues resulting from the CAGO’s investigation concerning marketing support payments to securities dealers who sell fund shares. Under the terms of the settlement with the CAGO, Distributors has agreed to pay $2 million as a civil penalty, $14 million to Franklin Templeton funds and $2 million to the CAGO.
The Company, in addition to most of the mutual funds within Franklin Templeton Investments, has been named in shareholder class actions related to the matter described above that were filed in the United States District Courts in California, Florida, Nevada, New Jersey and New York. These parties, as well as certain of the mutual funds’ trustees/directors, have also been named in a shareholder class action filed in March 2004 in the United States District Court in New Jersey. This lawsuit alleges violations of certain provisions of the federal securities laws and state common law fiduciary obligations in connection with Rule 12b-1 fees and brokerage commissions paid by the mutual funds. These lawsuits seek damages of unspecified amounts. The Company believes that the claims made in the lawsuits are without merit and it intends to defend vigorously against the allegations. It is anticipated that additional similar civil actions related to the matters described above may be filed in the future.
On August 2, 2004, Franklin Resources, Inc. announced that Advisers (adviser to many of the funds within Franklin Templeton Investments, and an affiliate of the adviser to the other funds) had reached a settlement with the U.S. Securities and Exchange Commission (SEC) that resolved an SEC investigation of market timing activity in the Franklin Templeton Investments funds. As part of the settlement, on August 2, 2004, the SEC issued an “Order instituting administrative and cease-and-desist proceedings pursuant to sections 203(e) and 203(k) of the Investment Advisers Act of 1940 and sections 9(b) and 9(f) of the Investment Company Act of 1940, making findings and imposing remedial sanctions and a cease and desist order” (the August Order). The SEC’s August Order concerns the activities of a limited number of third parties that ended in 2000 and those that are the subject of the Massachusetts Proceeding described above.
SUPP-2
Under the terms of the SEC’s August Order, Advisers, while neither admitting nor denying any of the findings therein, has agreed to pay $50 million, of which $20 million is a civil penalty, to be distributed to fund shareholders in accordance with a plan to be developed by an Independent Distribution Consultant. Because the distribution methodology has not yet been developed, it is presently not possible to say which particular funds will be determined to have been affected or which particular groups of fund shareholders will receive distributions or in what proportion and amounts. In the August Order, the SEC notes that the Company has generally sought to detect, discourage and prevent market timing in its funds and began to increase its efforts to control market timing in 1999. The August Order also requires Advisers to, among other things:
| • | | Enhance and periodically review compliance policies and procedures, and establish a corporate ombudsman; |
| • | | Establish a new internal position whose responsibilities shall include compliance matters related to conflicts of interests; and |
| • | | Retain an Independent Distribution Consultant to develop a plan to distribute the $50 million settlement to fund shareholders. |
On December 13, 2004, the Company announced that it reached an agreement with the SEC, resolving the issues resulting from the SEC’s investigation concerning marketing support payments to securities dealers who sell fund shares. The settlement agreement relates to an order (December Order) the SEC issued instituting administrative and cease-and-desist proceedings, making findings, and imposing remedial sanctions against Distributors and Advisers. In connection with this settlement, Advisers and Distributors also agreed to implement certain measures and undertakings relating to marketing support payments to broker-dealers for the promotion or sale of Fund shares, and to make additional disclosures in the Funds’ Prospectuses and Statements of Additional Information.
Under the terms of the SEC’s December Order, Advisers and Distributors, while neither admitting nor denying any of the findings therein, agreed to pay $20 million as a civil penalty, and $1 as restitution to be distributed to Franklin Templeton funds in accordance with a plan to be developed by an Independent Distribution Consultant. Because the distribution methodology has not yet been developed, it is presently not possible to say which particular funds will be determined to have been affected or will receive distributions or in what proportion and amounts.
These issues were previously disclosed by the Company as being under investigation by government authorities and the subject of an internal inquiry by the Company in its regulatory filings and on its public website. Any further updates on these matters will be disclosed on the Company’s website at franklintempleton.com under “Statement on Current Industry Issues.”
Please keep this supplement for future reference.
SUPP-3
TEMPLETON DEVELOPING MARKETS SECURITIES FUND
This annual report for Templeton Developing Markets Securities Fund covers the fiscal year ended December 31, 2004.
Performance Summary as of 12/31/04
Average annual total return of Class 3 shares* represents the average annual change in value, assuming reinvestment of dividends and capital gains. Average returns smooth out variations in returns, which can be significant; they are not the same as year-by-year results.
Periods ended 12/31/04
| | | | | | |
| | | 1-Year | | 5-Year | | Since
Inception
(3/4/96) |
Average Annual Total Return | | +24.85% | | +3.57% | | -0.45% |
*Performance prior to the 5/1/00 merger reflects the historical performance of Templeton Developing Markets Fund. Additionally, Class 3 and Class 2 shares were not offered until 5/1/04 and 5/1/97, respectively. As a result, Class 3 Fund performance for periods prior to 5/1/04 represents the historical results of Class 2 shares which, for periods prior to 5/1/97, reflects the historical results of Class 1 shares. For periods beginning on 5/1/97, Class 2’s results reflect an additional 12b-1 fee expense, which also affects future performance. The 12b-1 fee rate is currently the same for Classes 2 and 3. Since 5/1/04 (effective date), the average annual total return of Class 3 shares was +24.15%.
Total Return Index Comparison for Hypothetical $10,000 Investment (3/4/96–12/31/04)
The graph below shows the change in value of a hypothetical $10,000 investment in the Fund over the indicated period and includes reinvestment of any income or distributions. The Fund’s performance* is compared to the performance of the Morgan Stanley Capital International (MSCI) Emerging Markets (EM) Index and the Standard & Poor’s/International Finance Corporation Investable (S&P/IFCI) Composite Index. One cannot invest directly in an index, nor is an index representative of the Fund’s portfolio. Please see Important Notes to Performance Information preceding the Fund Summaries.
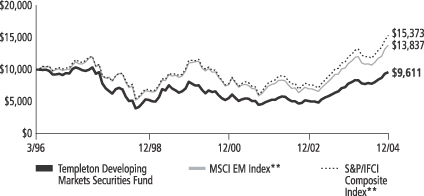
**Source: Standard & Poor’s Micropal. Please see Index Descriptions following the Fund Summaries.
Templeton Developing Markets Securities Fund Class 3
Performance reflects the Fund’s Class 3 operating expenses, but does not include any contract fees, expenses or sales charges. If they had been included, performance would be lower. These charges and deductions, particularly for variable life policies, can have a significant effect on contract values and insurance benefits. See the contract prospectus for a complete description of these expenses, including sales charges.
Performance data quoted represent past performance, which does not guarantee future results. Investment return and principal value will fluctuate, and you may have a gain or loss when you sell your shares. Current performance may differ from figures shown.
TD-1
Fund Goals and Main Investments: Templeton Developing Markets Securities Fund seeks long-term capital appreciation. The Fund invests predominantly in emerging markets investments.
Performance Overview
You can find the Fund’s one-year total return in the Performance Summary. The Fund underperformed its benchmarks, the MSCI EM Index and the S&P/IFCI Composite Index, which returned 25.95% and 28.11% for the year under review.1 Please note that the index performance numbers are purely for reference and that we do not attempt to track the index, but rather undertake investments on the basis of careful fundamental research.
Economic and Market Overview
Economically, 2004 was another positive year for emerging markets. Most Latin American economies recorded strong economic growth. In Eastern Europe, new member countries began seeing positive developments in the form of higher investment inflows as a result of European Union (EU) accession.
On December 26, the largest earthquake in 40 years struck in the Indian Ocean, just north of Sumatra. The earthquake created monster tidal waves, also known as tsunamis, that devastated coastal areas of Indonesia, Sri Lanka, Thailand, India and the Maldives. The remoteness of some of these areas complicated aid relief to the victims. While the tsunamis took a terrible toll on the people in the region, analysts estimated that their economic impact would not be significant.
Emerging markets stocks generally performed well during the year under review. The MSCI EM Index gained 25.95% in U.S. dollar terms as strong share prices and a sliding U.S. dollar boosted performance in the fourth quarter.1 Latin America and Eastern Europe outperformed their emerging market counterparts as both regions continued to attract greater investor interest. In particular, local stock markets of new EU members such as Poland, the Czech Republic, Hungary and Slovakia reached all-time highs. Turkey also recorded strong gains as investors reacted favorably toward the EU’s approval to begin formal accession talks for October 2005 and the Turkish government’s new US$10 billion standby agreement with the International Monetary Fund
1. Source: Standard & Poor’s Micropal. One cannot invest directly in an index, nor is an index representative of the Fund’s portfolio. Please see Index Descriptions following the Fund Summaries.
Fund Risks: Stocks offer the potential for long-term gains but can be subject to short-term up-and-down price movements. Investing in emerging markets involves special considerations, including market and currency fluctuations, economic instability, adverse social and political developments, and the relatively smaller size and lesser liquidity of these markets. All investments in the Fund should be considered long-term investments, which could experience significant volatility in any given year. The Fund is designed for the aggressive portion of a well-diversified portfolio. The Fund’s prospectus also includes a description of the main investment risks.
TD-2
(IMF).2 However, the Russian market underperformed as foreign investors remained cautious due to the Russian government’s actions against YUKOS and new tax claims on Vimpelcom.
Despite recording double-digit gains, Asian stock markets did not perform as well as those in other emerging markets regions as rising interest rates in the U.S., high commodity prices and concerns over China’s overheating economy continued to affect investor sentiment. In Africa, the South African market benefited from a strengthening rand, which greatly enhanced that market’s performance in U.S. dollars.
Investment Strategy
Our investment philosophy is bottom-up, value-oriented and long-term. In choosing investments, we may make onsite visits to companies to assess critical factors such as management strength and local conditions. In addition, we focus on the market price of a company’s securities relative to its evaluation of the company’s potential long-term (typically 5 years) earnings, asset value, cash flow, and balance sheet. Among factors we consider are a company’s historical value measures, including price/earnings ratio, book value, profit margins and liquidation value. We perform in-depth research to construct an action list from which we make our investment decisions.
Manager’s Discussion
In terms of performance, the Fund derived positive results from its underweighted position, relative to the MSCI EM Index, in Russia as well as overweighted positions in Austria and Singapore. The Fund’s decision not to hold YUKOS in Russia helped performance as that company’s stock price continued to tumble mainly due to concerns about the Russian government’s treatment of its assets. In Austria, the strongest contributors to Fund performance were OMV and Bank Austria Creditanstalt. We felt that both companies were well positioned to benefit from their large exposure to fast-growing central and Eastern European economies. However, the Fund’s underweighted positions in Brazil, Mexico and South Africa negatively impacted relative performance. All three markets recorded strong U.S. dollar performances in 2004, resulting in increasingly expensive valuations.
With regard to sectors, the energy sector, whose Fund weighting was about on par with that of the index, performed well.3 Our overweighted positions in MOL, OMV and SK Corp. drove the Fund’s relative energy
2. Source: The Economist Intelligence Unit Ltd., “Turkey Economy: Plumper,” 12/20/04.
3. The energy sector comprises energy equipment and services, and oil and gas in the SOI.
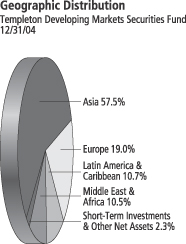
Top 10 Countries
Templeton Developing Markets Securities Fund 12/31/04
| | |
| | | % of Total
Net Assets |
| |
| South Korea | | 17.4% |
| |
| Taiwan | | 13.2% |
| |
| South Africa | | 10.5% |
| |
| China | | 10.1% |
| |
| Brazil | | 7.1% |
| |
| Singapore | | 6.0% |
| |
| Poland | | 3.5% |
| |
| Turkey | | 3.5% |
| |
| India | | 3.5% |
| |
| Mexico | | 3.3% |
TD-3
sector performance. Our overweighted positions in the consumer staples and diversified financial services sectors also reaped significant benefits.4 For example, SABMiller, Remgro and Ambev contributed the most to relative performance. The Fund’s underweighted position in commercial banks and overweighted exposure to telecommunication services hampered relative performance during the year.5
In general, if the value of the U.S. dollar goes up compared with a foreign currency, an investment traded in that foreign currency will go down in value because it will be worth fewer U.S. dollars. This can have a negative effect on Fund performance. Conversely, when the U.S. dollar weakens in relation to a foreign currency, an investment traded in that foreign currency will increase in value, which can contribute to Fund performance. For the 12 months ended December 31, 2004, the U.S. dollar declined in value relative to most non-U.S. currencies. At the end of the period, the Fund’s portfolio was invested predominantly in securities with non-U.S. currency exposure, which resulted in a positive effect on Fund performance. However, one cannot expect the same result in future periods.
In Asia, the Fund’s largest purchases were in South Korea and Taiwan as the Fund increased its exposure to the semiconductors and semiconductor equipment sector. Key purchases included Samsung Electronics, one of the world’s largest electronics manufacturers, and Taiwan Semiconductor Manufacturing, a leading global integrated circuit producer. Additional purchases included Daewoo Shipbuilding, a major player in the global shipbuilding industry, and MediaTek, Taiwan’s biggest integrated circuit design company. We reduced our Indonesian position due to strong performance in 2004 as some stocks reached our sell targets.
The Fund invested in several western European-listed companies with significant business exposure and growth opportunities in emerging markets. They include Oriflame, a cosmetic company with sales operations in over 50 countries as well as market leadership in more than 30 of them; Inbev, the result of a merger between Interbrew and Ambev; and HSBC Holdings, one of the world’s largest banking and financial services organizations.
4. The consumer staples sector comprises food and staples retailing, beverages, food products, tobacco, household products and personal products in the SOI.
5. The telecommunication services sector comprises diversified telecommunication services and
Top 10 Holdings
Templeton Developing Markets Securities Fund 12/31/04
| | |
Company
Sector/Industry,
Country | | % of Total
Net Assets |
| |
Samsung Electronics
Co. Ltd. | | 4.5% |
| Semiconductors & Semiconductor Equipment, South Korea | | |
| |
| China Mobile (Hong Kong) Ltd., fgn. | | 2.4% |
| Wireless Telecommunication Services, China | | |
| |
Telekomunikacja
Polska SA | | 2.2% |
| Diversified Telecommunication Services, Poland | | |
| |
| Remgro Ltd. | | 2.2% |
| Diversified Financial Services, South Africa | | |
| |
| Anglo American PLC | | 2.1% |
| Metals & Mining, South Africa | | |
| |
| SABMiller PLC | | 2.1% |
| Beverages, South Africa | | |
| |
| Kimberly Clark de Mexico SA de CV, A | | 1.9% |
| Household Products, Mexico | | |
| |
Cia De Bebidas Das Americas (Ambev),
ADR, pfd. | | 1.8% |
| Beverages, Brazil | | |
| |
| Inbev | | 1.8% |
| Beverages, Belgium | | |
| |
| Taiwan Cellular Corp. | | 1.7% |
| Wireless Telecommunication Services, Taiwan | | |
The dollar value, number of shares or principal amount, and names of all portfolio holdings are listed in the Fund’s Statement of Investments.
TD-4
We reduced our Latin American exposure during the reporting period as the Fund undertook selective sales in Mexico and Argentina, and sold its only holding in Peru. The Fund realized gains through significant sales such as Carso and Tenaris. Benefiting from a strengthening rand and high commodity prices in 2004, the Fund locked in strong U.S. dollar returns through sales of Anglo American and BHP Billiton.
Thank you for your participation in Templeton Developing Markets Securities Fund. We look forward to serving your future investment needs.
The foregoing information reflects our analysis, opinions and portfolio holdings as of December 31, 2004, the end of the reporting period. The way we implement our main investment strategies and the resulting portfolio holdings may change depending on factors such as market and economic conditions. These opinions may not be relied upon as investment advice or an offer for a particular security. The information is not a complete analysis of every aspect of any market, country, industry, security or the Fund. Statements of fact are from sources considered reliable, but the adviser makes no representation or warranty as to their completeness or accuracy. Although historical performance is no guarantee of future results, these insights may help you understand our investment management philosophy.
TD-5
Fund Expenses
As an investor in a variable insurance contract (“Contract”) that indirectly provides for investment in an underlying mutual fund, you can incur transaction and/or ongoing expenses at both the Fund level and the Contract level.
| • | | Transaction expenses can include sales charges (loads) on purchases, redemption fees, surrender fees, transfer fees and premium taxes. |
| • | | Ongoing expenses can include management fees, distribution and service (12b-1) fees, contract fees, annual maintenance fees, mortality and expense risk fees and other fees and expenses. All mutual funds and Contracts have some types of ongoing expenses. |
The expenses shown in the table below are meant to highlight ongoing expenses at the Fund level only and do not include ongoing expenses at the Contract level, or transaction expenses at either the Fund or Contract levels. If ongoing expenses at the Contract level and transaction expenses at the Fund and Contract levels were included, the expenses shown below would be higher. You should consult your Contract prospectus or disclosure document for more information.
The table shows Fund-level ongoing expenses and can help you understand these expenses and compare them with those of other mutual funds offered through the Contract. The table assumes a $1,000 investment held for the six months indicated. Because transaction costs at the Fund level are not included, the second line (Hypothetical) is useful in comparing ongoing expenses only, and will not help you compare the total costs of different funds offered through the Contract. Please refer to the Fund prospectus for additional information on operating expenses.
Actual Fund Expenses
The first line (Actual) listed in the table below provides actual account values and expenses. The “Ending Account Value” is derived from the Fund’s actual return, which includes the effect of ongoing Fund expenses, but does not include the effect of ongoing Contract expenses.
You can estimate the Fund-level expenses you incurred during the period, by following these steps. Of course, your account value and expenses will differ from those in this illustration:
| 1. | Divide your account value by $1,000. |
If an account had an $8,600 value, then $8,600 ÷ $1,000 = 8.6.
Templeton Developing Markets Securities Fund Class 3
TD-6
| 2. | Multiply the result by the number under the heading “Fund-Level Expenses Incurred During Period.” |
If Fund-Level Expenses Incurred During Period were $7.50, then 8.6 × $7.50 = $64.50.
In this illustration, the estimated expenses incurred this period at the Fund level are $64.50.
Hypothetical Example for Comparison with Other Mutual Funds
Information in the second line (Hypothetical) in the table can help you compare ongoing expenses of the Fund with those of other mutual funds offered through the Contract. This information may not be used to estimate the actual ending account balance or expenses you incurred during the period. The hypothetical “Ending Account Value” is based on the actual expense ratio and an assumed 5% annual rate of return before expenses, which does not represent the Fund’s actual return. The figure under the heading “Fund-Level Expenses Incurred During Period” shows the hypothetical expenses a Fund account would have incurred under this scenario. You can compare this figure with the 5% hypothetical examples that appear in shareholder reports of other funds offered through a Contract.
| | | | | | | | | |
| Class 3 | | Beginning
Account
Value 6/30/04 | | Ending
Account
Value 12/31/04 | | Fund-Level
Expenses Incurred
During Period*
6/30/04-12/31/04 |
Actual | | $ | 1,000 | | $ | 1,238.20 | | $ | 8.95 |
Hypothetical (5% return before expenses) | | $ | 1,000 | | $ | 1,017.14 | | $ | 8.06 |
*Expenses are equal to the annualized expense ratio for the Fund’s Class 3 shares (1.59%), which does not include any ongoing expenses of the Contract for which the Fund is an investment option, multiplied by the average account value over the period, multiplied by 184/366 to reflect the one-half year period.
TD-7
FRANKLIN TEMPLETON VARIABLE INSURANCE PRODUCTS TRUST
TEMPLETON DEVELOPING MARKETS SECURITIES FUND
Financial Highlightsa
| | | | | | | | | | | | | | | | | | | | |
| | | Class 1
| |
| | | Year Ended December 31,
| |
| | | 2004 | | | 2003 | | | 2002 | | | 2001 | | | 2000 | |
| | |
|
|
|
Per share operating performance | | | | | | | | | | | | | | | | | | | | |
(for a share outstanding throughout the year) | | | | | | | | | | | | | | | | | | | | |
Net asset value, beginning of year | | $ | 7.14 | | | $ | 4.71 | | | $ | 4.78 | | | $ | 5.25 | | | $ | 7.77 | |
| | |
|
|
|
Income from investment operations: | | | | | | | | | | | | | | | | | | | | |
Net investment incomeb | | | .11 | | | | .13 | | | | .07 | | | | .08 | | | | .07 | |
Net realized and unrealized gains (losses) | | | 1.62 | | | | 2.38 | | | | (.06 | ) | | | (.50 | ) | | | (2.52 | ) |
| | |
|
|
|
Total from investment operations | | | 1.73 | | | | 2.51 | | | | .01 | | | | (.42 | ) | | | (2.45 | ) |
| | |
|
|
|
Less distributions from net investment income | | | (.14 | ) | | | (.08 | ) | | | (.08 | ) | | | (.05 | ) | | | (.07 | ) |
| | |
|
|
|
Net asset value, end of year | | $ | 8.73 | | | $ | 7.14 | | | $ | 4.71 | | | $ | 4.78 | | | $ | 5.25 | |
| | |
|
|
|
| | | | | |
Total returnc | | | 24.83% | | | | 53.74% | | | | .04% | | | | (8.08)% | | | | (31.76)% | |
Ratios/supplemental data | | | | | | | | | | | | | | | | | | | | |
Net assets, end of year (000’s) | | $ | 477,290 | | | $ | 359,299 | | | $ | 225,454 | | | $ | 240,289 | | | $ | 301,645 | |
Ratios to average net assets: | | | | | | | | | | | | | | | | | | | | |
Expenses | | | 1.54% | | | | 1.55% | | | | 1.58% | | | | 1.57% | | | | 1.56% | |
Net investment income | | | 1.52% | | | | 2.35% | | | | 1.45% | | | | 1.64% | | | | 1.13% | |
Portfolio turnover rate | | | 55.67% | | | | 46.20% | | | | 57.91% | | | | 78.29% | | | | 89.48% | |
| a | Financial highlights presented reflect historical financial information from Templeton Variable Products Series Fund (TVP)-Templeton Developing Markets Fund as a result of a merger on May 1, 2000. |
| b | Based on average daily shares outstanding. |
| c | Total return does not include any fees, charges or expenses imposed by the variable annuity and life insurance contracts for which the Franklin Templeton Variable Insurance Products Trust serves as an underlying investment vehicle. Total return is not annualized for periods less than one year. |
See notes to financial statements.
TD-8
FRANKLIN TEMPLETON VARIABLE INSURANCE PRODUCTS TRUST
TEMPLETON DEVELOPING MARKETS SECURITIES FUND
Financial Highlightsa (continued)
| | | | | | | | | | | | | | | | | | | | |
| | | Class 2
| |
| | | Year Ended December 31,
| |
| | | 2004 | | | 2003 | | | 2002 | | | 2001 | | | 2000 | |
| | |
|
|
|
Per share operating performance | | | | | | | | | | | | | | | | | | | | |
(for a share outstanding throughout the year) | | | | | | | | | | | | | | | | | | | | |
Net asset value, beginning of year | | $ | 7.09 | | | $ | 4.69 | | | $ | 4.76 | | | $ | 5.22 | | | $ | 7.74 | |
| | |
|
|
|
Income from investment operations: | | | | | | | | | | | | | | | | | | | | |
Net investment incomeb | | | .09 | | | | .11 | | | | .06 | | | | .07 | | | | .06 | |
Net realized and unrealized gains (losses) | | | 1.63 | | | | 2.35 | | | | (.06 | ) | | | (.49 | ) | | | (2.53 | ) |
| | |
|
|
|
Total from investment operations | | | 1.72 | | | | 2.46 | | | | — | | | | (.42 | ) | | | (2.47 | ) |
| | |
|
|
|
Less distributions from net investment income | | | (.14 | ) | | | (.06 | ) | | | (.07 | ) | | | (.04 | ) | | | (.05 | ) |
| | |
|
|
|
Net asset value, end of year | | $ | 8.67 | | | $ | 7.09 | | | $ | 4.69 | | | $ | 4.76 | | | $ | 5.22 | |
| | |
|
|
|
| | | | | |
Total returnc | | | 24.71% | | | | 52.99% | | | | (.15)% | | | | (8.08)% | | | | (32.04)% | |
Ratios/supplemental data | | | | | | | | | | | | | | | | | | | | |
Net assets, end of year (000’s) | | $ | 327,569 | | | $ | 170,953 | | | $ | 80,952 | | | $ | 64,081 | | | $ | 56,617 | |
Ratios to average net assets: | | | | | | | | | | | | | | | | | | | | |
Expenses | | | 1.79% | | | | 1.80% | | | | 1.83% | | | | 1.82% | | | | 1.81% | |
Net investment income | | | 1.27% | | | | 2.10% | | | | 1.20% | | | | 1.37% | | | | .88% | |
Portfolio turnover rate | | | 55.67% | | | | 46.20% | | | | 57.91% | | | | 78.29% | | | | 89.48% | |
| a | Financial highlights presented reflect historical financial information from Templeton Variable Products Series Fund (TVP) – Templeton Developing Markets Fund as a result of a merger on May 1, 2000. |
| b | Based on average daily shares outstanding. |
| c | Total return does not include any fees, charges or expenses imposed by the variable annuity and life insurance contracts for which the Franklin Templeton Variable Insurance Products Trust serves as an underlying investment vehicle. Total return is not annualized for periods less than one year. |
See notes to financial statements.
TD-9
FRANKLIN TEMPLETON VARIABLE INSURANCE PRODUCTS TRUST
TEMPLETON DEVELOPING MARKETS SECURITIES FUND
Financial Highlights (continued)
| | | | |
| | | Class 3
| |
| | | Period Ended
December 31, 2004c
| |
Per share operating performance | | | | |
(for a share outstanding throughout the period) | | | | |
Net asset value, beginning of period | | $ | 7.13 | |
| | |
|
|
|
Income from investment operations: | | | | |
Net investment incomea | | | .08 | |
Net realized and unrealized gains (losses) | | | 1.61 | |
| | |
|
|
|
Total from investment operations | | | 1.69 | |
| | |
|
|
|
Less distributions from net investment income | | | (.14 | ) |
| | |
|
|
|
Net asset value, end of period | | $ | 8.68 | |
| | |
|
|
|
| |
Total returnb | | | 24.15% | |
Ratios/supplemental data | | | | |
Net assets, end of period (000’s) | | $ | 12 | |
Ratios to average net assets: | | | | |
Expenses | | | 1.54% | d |
Net investment income | | | 1.52% | d |
Portfolio turnover rate | | | 55.67% | |
| a | Based on average daily shares outstanding. |
| b | Total return does not include any fees, charges or expenses imposed by the variable annuity and life insurance contracts for which the Franklin Templeton Variable Insurance Products Trust serves as an underlying investment vehicle. Total return is not annualized for periods less than one year. |
| c | For the period May 1, 2004 (effective date) to December 31, 2004. |
See notes to financial statements.
TD-10
FRANKLIN TEMPLETON VARIABLE INSURANCE PRODUCTS TRUST
TEMPLETON DEVELOPING MARKETS SECURITIES FUND
Statement of Investments, December 31, 2004
| | | | | | | |
| | | INDUSTRY | | SHARES/
RIGHTS | | VALUE |
Long Term Investments 97.7% | | | | | | | |
Argentina .3% | | | | | | | |
Tenaris SA, ADR | | Energy Equipment & Services | | 45,434 | | $ | 2,221,723 |
| | | | | | |
|
|
Austria 2.0% | | | | | | | |
Bank Austria Creditanstalt | | Commercial Banks | | 125,852 | | | 11,356,942 |
OMV AG | | Oil & Gas | | 17,363 | | | 5,223,367 |
| | | | | | |
|
|
| | | | | | | | 16,580,309 |
| | | | | | |
|
|
Belgium 1.8% | | | | | | | |
Inbev | | Beverages | | 369,200 | | | 14,298,659 |
| | | | | | |
|
|
Brazil 7.1% | | | | | | | |
Banco Bradesco SA, ADR, pfd. | | Commercial Banks | | 477,270 | | | 11,960,386 |
Centrais Eletricas Brasileiras SA | | Electric Utilities | | 241,544,764 | | | 3,501,307 |
Cia De Bebidas Das Americas (Ambev), ADR, pfd. | | Beverages | | 518,800 | | | 14,697,604 |
Cia Vale do Rio Doce, ADR, pfd., A | | Metals & Mining | | 204,300 | | | 4,980,834 |
Petroleo Brasileiro SA, ADR, pfd. | | Oil & Gas | | 268,264 | | | 9,713,839 |
Souza Cruz SA | | Tobacco | | 430,922 | | | 5,779,157 |
Suzano Bahia Sul Papel e cel, pfd., A | | Paper & Forest Products | | 343,148 | �� | | 1,773,879 |
Unibanco Uniao de Bancos Brasileiros SA, GDR | | Commercial Banks | | 86,400 | | | 2,740,608 |
Usinas Siderurgicas De Minas Gerais SA, pfd. | | Metals & Mining | | 86,920 | | | 1,765,563 |
| | | | | | |
|
|
| | | | | | | | 56,913,177 |
| | | | | | |
|
|
China 10.1% | | | | | | | |
aAir China Ltd., 144A. | | Airlines | | 1,452,000 | | | 560,416 |
Aluminum Corp. of China Ltd., H | | Metals & Mining | | 9,940,000 | | | 5,882,565 |
Anhui Conch Cement Co. Ltd. | | Construction Materials | | 2,740,000 | | | 2,978,721 |
Beijing Enterprises Holdings Ltd. | | Industrial Conglomerates | | 1,420,128 | | | 2,110,241 |
China Mobile (Hong Kong) Ltd., fgn. | | Wireless Telecommunication Services | | 5,602,000 | | | 18,990,930 |
China Petroleum & Chemical Corp., H | | Oil & Gas | | 8,078,000 | | | 3,325,648 |
China Resources Enterprise Ltd. | | Distributors | | 4,574,000 | | | 7,149,817 |
China Travel International Investment Hong Kong Ltd. | | Hotels Restaurants & Leisure | | 15,506,000 | | | 4,987,263 |
China Unicom Ltd. | | Wireless Telecommunication Services | | 2,172,000 | | | 1,718,531 |
CITIC Pacific Ltd. | | Industrial Conglomerates | | 2,013,959 | | | 5,726,185 |
Denway Motors Ltd. | | Automobiles | | 13,090,234 | | | 4,673,400 |
Huadian Power International Corp. Ltd., H | | Electric Utilities | | 7,826,000 | | | 2,315,742 |
Lenovo Group Ltd., H | | Computers & Peripherals | | 13,606,000 | | | 4,069,827 |
PetroChina Co. Ltd., H | | Oil & Gas | | 14,474,000 | | | 7,727,859 |
Shanghai Industrial Holdings Ltd. | | Industrial Conglomerates | | 2,697,000 | | | 5,759,855 |
TCL International Holdings Inc. | | Household Durables | | 3,584,000 | | | 922,190 |
Travelsky Technology Ltd., H | | IT Services | | 3,227,000 | | | 2,615,544 |
| | | | | | |
|
|
| | | | | | | | 81,514,734 |
| | | | | | |
|
|
Croatia .5% | | | | | | | |
Pliva D D, GDR, Reg S | | Pharmaceuticals | | 320,200 | | | 3,986,490 |
| | | | | | |
|
|
Czech Republic .7% | | | | | | | |
Cesky Telecom AS | | Diversified Telecommunication Services | | 323,510 | | | 5,355,743 |
| | | | | | |
|
|
Greece 1.1% | | | | | | | |
Hellenic Telecommunications Organization SA (OTE) | | Diversified Telecommunication Services | | 154,380 | | | 2,769,505 |
Titan Cement Co. | | Construction Materials | | 207,560 | | | 6,140,162 |
| | | | | | |
|
|
| | | | | | | | 8,909,667 |
| | | | | | |
|
|
TD-11
FRANKLIN TEMPLETON VARIABLE INSURANCE PRODUCTS TRUST
TEMPLETON DEVELOPING MARKETS SECURITIES FUND
Statement of Investments, December 31, 2004 (cont.)
| | | | | | | |
| | | INDUSTRY | | SHARES/
RIGHTS | | VALUE |
Long Term Investments (cont.) | | | | | | | |
Hong Kong 2.6% | | | | | | | |
Cheung Kong Holdings Ltd. | | Real Estate | | 1,184,000 | | $ | 11,805,270 |
Cheung Kong Infrastructure Holdings Ltd. | | Electric Utilities | | 572,000 | | | 1,652,094 |
Guoco Group Ltd. | | Diversified Financial Services | | 328,000 | | | 3,207,081 |
Henderson Investment Ltd. | | Real Estate | | 1,065,000 | | | 1,555,135 |
MTR Corp. Ltd. | | Road & Rail | | 1,613,901 | | | 2,585,049 |
| | | | | | |
|
|
| | | | | | | | 20,804,629 |
| | | | | | |
|
|
Hungary 3.0% | | | | | | | |
Egis RT | | Pharmaceuticals | | 15,827 | | | 954,700 |
Gedeon Richter Ltd. | | Pharmaceuticals | | 50,356 | | | 6,325,851 |
Matav RT | | Diversified Telecommunication Services | | 1,037,300 | | | 4,965,492 |
MOL Magyar Olaj-Es Gazipari RT | | Oil & Gas | | 172,240 | | | 12,114,944 |
| | | | | | |
|
|
| | | | | | | | 24,360,987 |
| | | | | | |
|
|
India 3.5% | | | | | | | |
Gail (India) Ltd. | | Gas Utilities | | 855,630 | | | 4,564,019 |
Hindustan Lever Ltd. | | Household Products | | 2,477,600 | | | 8,220,476 |
Hindustan Petroleum Corp. Ltd. | | Oil & Gas | | 1,050,804 | | | 9,730,567 |
Tata Motors Ltd. | | Automobiles | | 148,000 | | | 1,728,606 |
Tata Tea Ltd. | | Food Products | | 359,803 | | | 3,937,035 |
| | | | | | |
|
|
| | | | | | | | 28,180,703 |
| | | | | | |
|
|
Indonesia .6% | | | | | | | |
Bk Danamon | | Commercial Banks | | 6,840,000 | | | 3,223,808 |
PT Perusahaan Gas Negara | | Gas Utilities | | 7,557,500 | | | 1,546,916 |
PT Perusahaan Gas Negara, 144A | | Gas Utilities | | 169,500 | | | 34,695 |
| | | | | | |
|
|
| | | | | | | | 4,805,419 |
| | | | | | |
|
|
Malaysia 1.6% | | | | | | | |
Kuala Lumpur Kepong Bhd. | | Food Products | | 390,600 | | | 709,248 |
Resorts World Bhd. | | Hotels Restaurants & Leisure | | 2,046,000 | | | 5,384,211 |
SIME Darby Bhd. | | Industrial Conglomerates | | 2,054,500 | | | 3,243,947 |
Tanjong PLC | | Hotels Restaurants & Leisure | | 241,000 | | | 894,237 |
YTL Corp. Bhd. | | Electric Utilities | | 1,061,000 | | | 1,493,776 |
YTL Power International Bhd. | | Water Utilities | | 2,483,400 | | | 1,176,347 |
| | | | | | |
|
|
| | | | | | | | 12,901,766 |
| | | | | | |
|
|
Mexico 3.3% | | | | | | | |
Fomento Economico Mexicano SA de CV Femsa, ADR | | Beverages | | 140,600 | | | 7,396,966 |
Kimberly Clark de Mexico SA de CV, A | | Household Products | | 4,538,033 | | | 15,690,550 |
Telefonos de Mexico SA de CV (Telmex), L, ADR | | Diversified Telecommunication Services | | 99,982 | | | 3,831,310 |
| | | | | | |
|
|
| | | | | | | | 26,918,826 |
| | | | | | |
|
|
Philippines .6% | | | | | | | |
San Miguel Corp., B | | Beverages | | 3,892,630 | | | 5,201,733 |
| | | | | | |
|
|
Poland 3.5% | | | | | | | |
Polski Koncern Naftowy Orlen SA | | Oil & Gas | | 825,929 | | | 10,363,524 |
Telekomunikacja Polska SA | | Diversified Telecommunication Services | | 2,736,600 | | | 17,986,616 |
| | | | | | |
|
|
| | | | | | | | 28,350,140 |
| | | | | | |
|
|
TD-12
FRANKLIN TEMPLETON VARIABLE INSURANCE PRODUCTS TRUST
TEMPLETON DEVELOPING MARKETS SECURITIES FUND
Statement of Investments, December 31, 2004 (cont.)
| | | | | | | |
| | | INDUSTRY | | SHARES/
RIGHTS | | VALUE |
Long Term Investments (cont.) | | | | | | | |
Russia .8% | | | | | | | |
bLukoil Holdings, ADR | | Oil & Gas | | 52,307 | | $ | 6,350,070 |
| | | | | | |
|
|
Singapore 6.0% | | | | | | | |
Comfortdelgro Corp. Ltd. | | Road & Rail | | 4,474,000 | | | 4,248,422 |
Dairy Farm International Holdings Ltd. | | Food & Staples Retailing | | 1,132,933 | | | 2,741,698 |
Fraser & Neave Ltd. | | Beverages | | 1,233,681 | | | 12,319,427 |
Keppel Corp. Ltd. | | Industrial Conglomerates | | 2,182,600 | | | 11,499,332 |
Singapore Press Holdings Ltd. | | Media | | 1,179,000 | | | 3,322,551 |
Singapore Technologies Engineering Ltd. | | Aerospace & Defense | | 2,988,000 | | | 4,265,172 |
Singapore Telecommunications Ltd. | | Diversified Telecommunication Services | | 6,052,428 | | | 8,824,835 |
aSuntec Real Estate Investment Trust | | Real Estate | | 1,252,000 | | | 851,388 |
| | | | | | |
|
|
| | | | | | | | 48,072,825 |
| | | | | | |
|
|
South Africa 10.5% | | | | | | | |
Anglo American PLC | | Metals & Mining | | 731,130 | | | 17,229,630 |
Liberty Group Ltd. | | Insurance | | 65,491 | | | 769,938 |
Nedcor Ltd. | | Commercial Banks | | 450,759 | | | 6,190,477 |
Nedcor Ltd., 144A | | Commercial Banks | | 63,958 | | | 878,364 |
Old Mutual PLC | | Insurance | | 4,501,298 | | | 11,448,078 |
Remgro Ltd. | | Diversified Financial Services | | 1,043,070 | | | 17,374,066 |
SABMiller PLC | | Beverages | | 1,016,424 | | | 17,125,803 |
Sappi Ltd. | | Paper & Forest Products | | 401,900 | | | 5,888,385 |
Sasol Ltd. | | Oil & Gas | | 357,400 | | | 7,633,786 |
| | | | | | |
|
|
| | | | | | | | 84,538,527 |
| | | | | | |
|
|
South Korea 17.4% | | | | | | | |
CJ Corp. | | Food Products | | 105,070 | | | 7,186,009 |
Daewoo Shipbuilding & Marine Engineering Co. Ltd. | | Machinery | | 791,700 | | | 11,777,608 |
Hite Brewery Co. Ltd. | | Beverages | | 87,140 | | | 7,197,131 |
Hyundai Development Co. | | Construction & Engineering | | 463,300 | | | 7,384,515 |
Kangwon Land Inc. | | Hotels Restaurants & Leisure | | 784,165 | | | 10,188,388 |
Kia Motors Corp. | | Automobiles | | 309,230 | | | 3,255,996 |
Korea Gas Corp. | | Gas Utilities | | 89,600 | | | 2,778,362 |
LG Chem Ltd. | | Chemicals | | 195,940 | | | 7,807,694 |
LG Electronics Inc. | | Household Durables | | 125,930 | | | 7,797,636 |
LG Household & Health Care Ltd. | | Household Products | | 94,760 | | | 2,512,715 |
LG International Corp. | | Trading Companies & Distributors | | 325,440 | | | 2,530,711 |
LG Petrochemical Co. Ltd. | | Chemicals | | 146,810 | | | 3,687,268 |
POSCO | | Metals & Mining | | 40,480 | | | 7,312,365 |
Samsung Electronics Co. Ltd. | | Semiconductors & Semiconductor Equipment | | 83,368 | | | 36,280,220 |
Samsung Fine Chemicals Co. Ltd. | | Chemicals | | 221,490 | | | 3,808,464 |
Samsung Heavy Industries Co. Ltd. | | Machinery | | 1,757,220 | | | 10,965,650 |
SK Corp. | | Oil & Gas | | 33,410 | | | 1,836,388 |
SK Telecom Co. Ltd. | | Wireless Telecommunication Services | | 31,730 | | | 6,038,263 |
| | | | | | |
|
|
| | | | | | | | 140,345,383 |
| | | | | | |
|
|
Sweden .5% | | | | | | | |
aOriflame Cosmetics, IDR | | Personal Products | | 170,000 | | | 3,940,575 |
| | | | | | |
|
|
Taiwan 13.2% | | | | | | | |
Acer Inc. | | Computers & Peripherals | | 3,583,254 | | | 5,917,610 |
Chunghwa Telecom Co. Ltd. | | Diversified Telecommunication Services | | 3,162,000 | | | 6,216,577 |
TD-13
FRANKLIN TEMPLETON VARIABLE INSURANCE PRODUCTS TRUST
TEMPLETON DEVELOPING MARKETS SECURITIES FUND
Statement of Investments, December 31, 2004 (cont.)
| | | | | | | |
| | | INDUSTRY | | SHARES/
RIGHTS | | VALUE |
Long Term Investments (cont.) | | | | | | | |
Taiwan (cont.) | | | | | | | |
D-Link Corp. | | Communications Equipment | | 4,066,787 | | $ | 4,733,285 |
Delta Electronics Inc. | | Electronic Equipment & Instruments | | 5,127,467 | | | 9,032,342 |
Elan Microelectronics Corp. | | Semiconductors & Semiconductor Equipment | | 2,725,776 | | | 1,534,803 |
Kinpo Electronics Inc. | | Office Electronics | | 2,453,200 | | | 1,068,789 |
Lite-on Technology Corp. | | Computers & Peripherals | | 6,440,700 | | | 6,868,189 |
MediaTek Inc. | | Semiconductors & Semiconductor Equipment | | 1,098,000 | | | 7,460,459 |
Mega Financial Holdings Co. Ltd. | | Commercial Banks | | 9,866,503 | | | 6,796,993 |
Premier Image Technology Corp. | | Leisure Equipment & Products | | 1,819,000 | | | 1,790,963 |
President Chain Store Corp. | | Food & Staples Retailing | | 2,986,144 | | | 4,790,605 |
Siliconware Precision Industries Co. Ltd. | | Semiconductors & Semiconductor Equipment | | 5,247,000 | | | 4,324,360 |
Sunplus Technology Co. Ltd. | | Semiconductors & Semiconductor Equipment | | 4,629,100 | | | 6,494,428 |
Synnex Technology International Corp. | | Electronic Equipment & Instruments | | 742,600 | | | 1,095,563 |
Taiwan Cellular Corp. | | Wireless Telecommunication Services | | 12,155,302 | | | 13,573,867 |
Taiwan Semiconductor Manufacturing Co. | | Semiconductors & Semiconductor Equipment | | 7,669,000 | | | 12,182,589 |
UNI-President Enterprises Corp. | | Food Products | | 13,577,600 | | | 7,089,908 |
Yuanta Core Pacific Securities Co. | | Capital Markets | | 7,065,978 | | | 5,356,718 |
| | | | | | |
|
|
| | | | | | | | 106,328,048 |
| | | | | | |
|
|
Thailand 1.8% | | | | | | | |
BEC World Public Co. Ltd., fgn. | | Media | | 7,730,700 | | | 3,122,189 |
aKasikornbank Public Co. Ltd., fgn. | | Commercial Banks | | 3,074,800 | | | 4,429,408 |
Land and House Public Co. Ltd., fgn. | | Real Estate | | 3,624,700 | | | 1,053,638 |
Shin Corp. Public Co. Ltd., fgn. | | Wireless Telecommunication Services | | 1,176,900 | | | 1,203,421 |
Siam Cement Public Co. Ltd., fgn. | | Construction Materials | | 177,100 | | | 1,257,385 |
Thai Airways International Public Co. Ltd., fgn. | | Airlines | | 130,000 | | | 162,191 |
aThai Military Bank Public Co. Ltd., fgn. | | Commercial Banks | | 32,522,400 | | | 3,145,656 |
aTrue Corp., PLC, rts., 3/28/08 | | Diversified Telecommunication Services | | 344,616 | | | — |
| | | | | | |
|
|
| | | | | | | | 14,373,888 |
| | | | | | |
|
|
Turkey 3.5% | | | | | | | |
aArcelik AS, Br. | | Household Durables | | 1,048,826,400 | | | 6,416,624 |
Migros Turk TAS | | Food & Staples Retailing | | 933,539,500 | | | 7,753,536 |
Tupras-Turkiye Petrol Rafineleri AS | | Oil & Gas | | 657,260,000 | | | 6,677,391 |
aTurk Hava Yollari Anonim Ortakligi (THY), 144A | | Airlines | | 188,012,000 | | | 1,108,413 |
Turkiye Is Bankasi AS, C | | Commercial Banks | | 1,143,234,000 | | | 6,315,976 |
| | | | | | |
|
|
| | | | | | | | 28,271,940 |
| | | | | | |
|
|
United Kingdom 1.7% | | | | | | | |
HSBC Holdings PLC | | Commercial Banks | | 543,656 | | | 9,302,471 |
Provident Financial PLC | | Consumer Finance | | 328,500 | | | 4,237,245 |
| | | | | | |
|
|
| | | | | | | | 13,539,716 |
| | | | | | |
|
|
Total Long Term Investments (Cost $573,199,966) | | | | | | | 787,065,677 |
| | | | | | |
|
|
TD-14
FRANKLIN TEMPLETON VARIABLE INSURANCE PRODUCTS TRUST
TEMPLETON DEVELOPING MARKETS SECURITIES FUND
Statement of Investments, December 31, 2004 (cont.)
| | | | | | |
| | | PRINCIPAL
AMOUNT | | VALUE | |
Short Term Investments (Cost $22,458,325) 2.9% | | | | | | |
U.S. Government and Agency Securities | | | | | | |
cU.S. Treasury Bills, 1/06/05 – 3/31/05 | | $22,506,000 | | $ | 22,463,389 | |
| | | | |
|
|
|
Total Investments (Cost $595,658,291) 100.6% | | | | | 809,529,066 | |
Other Assets, less Liabilities (.6)% | | | | | (4,658,286 | ) |
| | | | |
|
|
|
Net Assets 100.0% | | | | $ | 804,870,780 | |
| | | | |
|
|
|
Portfolio Abbreviations
ADR - American Depository Receipt
GDR - Global Depository Receipt
IDR - International Depository Receipt
| b | See Note 7 regarding other considerations. |
| c | Security is traded on a discount basis with no stated coupon rate. |
See notes to financial statements.
TD-15
FRANKLIN TEMPLETON VARIABLE INSURANCE PRODUCTS TRUST
TEMPLETON DEVELOPING MARKETS SECURITIES FUND
Financial Statements
Statement of Assets and Liabilities
December 31, 2004
| | | | |
Assets: | | | | |
Investments in securities: | | | | |
Cost | | $ | 595,658,291 | |
| | |
|
|
|
Value | | | 809,529,066 | |
Cash | | | 8,216 | |
Foreign currency, at value (cost $513,194) | | | 524,635 | |
Receivables: | | | | |
Investment securities sold | | | 89,395 | |
Capital shares sold | | | 811,182 | |
Dividends | | | 926,376 | |
Foreign income tax receivable | | | 159,393 | |
| | |
|
|
|
Total assets | | | 812,048,263 | |
| | |
|
|
|
Liabilities: | | | | |
Payables: | | | | |
Investment securities purchased | | | 4,731,476 | |
Capital shares redeemed | | | 886,683 | |
Affiliates | | | 974,994 | |
Deferred tax liability | | | 441,892 | |
Other liabilities | | | 142,438 | |
| | |
|
|
|
Total liabilities | | | 7,177,483 | |
| | |
|
|
|
Net assets, at value | | $ | 804,870,780 | |
| | |
|
|
|
Net assets consist of: | | | | |
Undistributed net investment income | | $ | 1,637,611 | |
Net unrealized appreciation (depreciation) | | | 213,443,902 | |
Accumulated net realized gain (loss) | | | (147,539,841 | ) |
Capital shares | | | 737,329,108 | |
| | |
|
|
|
Net assets, at value | | $ | 804,870,780 | |
| | |
|
|
|
Class 1: | | | | |
Net assets, at value | | $ | 477,289,957 | |
| | |
|
|
|
Shares outstanding | | | 54,653,947 | |
| | |
|
|
|
Net asset value and offering price per share | | $ | 8.73 | |
| | |
|
|
|
Class 2: | | | | |
Net assets, at value | | $ | 327,568,647 | |
| | |
|
|
|
Shares outstanding | | | 37,791,471 | |
| | |
|
|
|
Net asset value and offering price per share | | $ | 8.67 | |
| | |
|
|
|
Class 3: | | | | |
Net assets, at value | | $ | 12,176 | |
| | |
|
|
|
Shares outstanding | | | 1,403 | |
| | |
|
|
|
Net asset value and offering price per sharea | | $ | 8.68 | |
| | |
|
|
|
| a | Redemption price is equal to net asset value less any redemption fees retained by the Fund. |
See notes to financial statements.
TD-16
FRANKLIN TEMPLETON VARIABLE INSURANCE PRODUCTS TRUST
TEMPLETON DEVELOPING MARKETS SECURITIES FUND
Financial Statements (continued)
Statement of Operations
for the year ended December 31, 2004
| | | | |
Investment income: | | | | |
Dividends (net of foreign taxes of $2,118,707) | | $ | 18,874,239 | |
Interest | | | 357,121 | |
| | |
|
|
|
Total investment income | | | 19,231,360 | |
| | |
|
|
|
Expenses: | | | | |
Management fees (Note 3) | | | 7,848,740 | |
Administrative fees (Note 3) | | | 874,723 | |
Distribution fees - Class 2 (Note 3) | | | 579,458 | |
Transfer agent fees | | | 10,778 | |
Custodian fees (Note 4) | | | 635,519 | |
Reports to shareholders | | | 234,051 | |
Professional fees | | | 71,409 | |
Trustees’ fees and expenses | | | 3,753 | |
Other | | | 26,158 | |
| | |
|
|
|
Total expenses | | | 10,284,589 | |
Expense reductions (Note 4) | | | (1,831 | ) |
| | |
|
|
|
Net expenses | | | 10,282,758 | |
| | |
|
|
|
Net investment income | | | 8,948,602 | |
| | |
|
|
|
Realized and unrealized gains (losses): | | | | |
Net realized gain (loss) from: | | | | |
Investments (net of foreign taxes of $2,007,158) | | | 51,038,207 | |
Foreign currency transactions | | | (577,452 | ) |
| | |
|
|
|
Net realized gain (loss) | | | 50,460,755 | |
| | |
|
|
|
Net change in unrealized appreciation (depreciation) on: | | | | |
Investments | | | 89,187,217 | |
Translation of assets and liabilities denominated in foreign currencies | | | 34,734 | |
Deferred taxes | | | 1,472,777 | |
| | |
|
|
|
Net change in unrealized appreciation (depreciation) | | | 90,694,728 | |
| | |
|
|
|
Net realized and unrealized gain (loss) | | | 141,155,483 | |
| | |
|
|
|
Net increase (decrease) in net assets resulting from operations | | $ | 150,104,085 | |
| | |
|
|
|
See notes to financial statements.
TD-17
FRANKLIN TEMPLETON VARIABLE INSURANCE PRODUCTS TRUST
TEMPLETON DEVELOPING MARKETS SECURITIES FUND
Financial Statements (continued)
Statements of Changes in Net Assets
for the years ended December 31, 2004 and 2003
| | | | | | | | |
| | | 2004 | | | 2003 | |
| | |
| |
Increase (decrease) in net assets: | | | | | | | | |
Operations: | | | | | | | | |
Net investment income | | $ | 8,948,602 | | | $ | 8,383,604 | |
Net realized gain (loss) from investments and foreign currency transactions | | | 50,460,755 | | | | 18,835,829 | |
Net change in unrealized appreciation (depreciation) on investments, translation of assets and liabilities denominated in foreign currencies, and deferred taxes | | | 90,694,728 | | | | 141,314,261 | |
| | |
|
|
|
Net increase (decrease) in net assets resulting from operations | | | 150,104,085 | | | | 168,533,694 | |
Distributions to shareholders from: | | | | | | | | |
Net investment income: | | | | | | | | |
Class 1 | | | (7,597,672 | ) | | | (3,521,009 | ) |
Class 2 | | | (4,066,275 | ) | | | (1,068,523 | ) |
Class 3 | | | (190 | ) | | | — | |
| | |
| |
Total distributions to shareholders | | | (11,664,137 | ) | | | (4,589,532 | ) |
Capital share transactions: (Note 2) | | | | | | | | |
Class 1 | | | 32,499,304 | | | | 18,051,739 | |
Class 2 | | | 103,669,110 | | | | 41,851,167 | |
Class 3 | | | 10,000 | | | | — | |
| | |
| |
Total capital share transactions | | | 136,178,414 | | | | 59,902,906 | |
Net increase (decrease) in net assets | | | 274,618,362 | | | | 223,847,068 | |
Net assets: | | | | | | | | |
Beginning of year | | | 530,252,418 | | | | 306,405,350 | |
| | |
| |
End of year | | $ | 804,870,780 | | | $ | 530,252,418 | |
| | |
|
|
|
Undistributed net investment income included in net assets: | | | | | | | | |
End of year | | $ | 1,637,611 | | | $ | 5,951,933 | |
| | |
|
|
|
See notes to financial statements.
TD-18
FRANKLIN TEMPLETON VARIABLE INSURANCE PRODUCTS TRUST
TEMPLETON DEVELOPING MARKETS SECURITIES FUND
Notes to Financial Statements
1. ORGANIZATION AND SIGNIFICANT ACCOUNTING POLICIES
Franklin Templeton Variable Insurance Products Trust (the Trust) is registered under the Investment Company Act of 1940 as an open-end investment company, consisting of twenty-one separate series (the Funds). The Templeton Developing Markets Securities Fund (the Fund) included in this report is diversified. The financial statements of the remaining funds in the series are presented separately. Shares of the Fund are sold only to insurance company separate accounts to fund the benefits of variable life insurance policies or variable annuity contracts. The Fund’s investment objective is capital growth.
The following summarizes the Fund’s significant accounting policies.
a. Security Valuation
Securities listed on a securities exchange or on the NASDAQ National Market System are valued at the last quoted sale price or the official closing price of the day, respectively. Over-the-counter securities and listed securities for which there is no reported sale are valued within the range of the most recent quoted bid and ask prices. Securities that trade in multiple markets or on multiple exchanges are valued according to the broadest and most representative market.
U.S. Government securities generally trade in the over-the-counter market rather than on a securities exchange. The Fund may utilize independent pricing services, quotations from bond dealers, and information with respect to bond and note transactions, to assist in determining a current market value for each security. The Fund’s pricing services may use valuation models or matrix pricing which considers information with respect to comparable bond and note transactions, quotations from bond dealers, or by reference to other securities that are considered comparable in such characteristics as rating, interest rate and maturity date, option adjusted spread models, prepayment projections, interest rate spreads and yield curves, to determine current value.
Foreign securities are valued as of the close of trading on the foreign stock exchange on which the security is primarily traded, or the NYSE, whichever is earlier. The value is then converted into its U.S. dollar equivalent at the foreign exchange rate in effect at the close of the NYSE on the day that the value of the foreign security is determined. If no sale is reported at that time, the foreign security will be valued within the range of the most recent quoted bid and ask prices.
The Trust has procedures to determine the fair value of individual securities and other assets for which market prices are not readily available or which may not be reliably priced. Some methods for valuing these securities may include: fundamental analysis, matrix pricing, discounts from market prices of similar securities, or discounts applied due to the nature and duration of restrictions on the disposition of the securities. Occasionally, events occur between the time at which trading in a security is completed and the close of the NYSE that might call into question the availability (including the reliability) of the value of a portfolio security held by the Fund. If such an event occurs, the securities may be valued using fair value procedures, which may include the use of independent pricing services. All security valuation procedures are approved by the Fund’s Board of Trustees.
b. Foreign Currency Translation
Portfolio securities and other assets and liabilities denominated in foreign currencies are translated into U.S. dollars based on the exchange rate of such currencies against U.S. dollars on the date of valuation. Purchases and sales of securities, income and expense items denominated in foreign currencies are translated into U.S. dollars at the exchange rate in effect on the transaction date. Occasionally, events may impact the availability or reliability of foreign exchange rates used to convert the U.S. dollar equivalent value. If such an event occurs, the foreign exchange rate will be valued at fair value using procedures established and approved by the Fund’s Board of Trustees.
The Fund does not separately report the effect of changes in foreign exchange rates from changes in market prices on securities held. Such changes are included in net realized and unrealized gain or loss from investments on the Statement of Operations.
Realized foreign exchange gains or losses arise from sales of foreign currencies, currency gains or losses realized between the trade and settlement dates on securities transactions and the difference between the recorded amounts of dividends, interest, and
TD-19
FRANKLIN TEMPLETON VARIABLE INSURANCE PRODUCTS TRUST
TEMPLETON DEVELOPING MARKETS SECURITIES FUND
Notes to Financial Statements (continued)
1. ORGANIZATION AND SIGNIFICANT ACCOUNTING POLICIES (cont.)
b. Foreign Currency Translation (continued)
foreign withholding taxes and the U.S. dollar equivalent of the amounts actually received or paid. Net unrealized foreign exchange gains and losses arise from changes in foreign exchange rates on foreign denominated assets and liabilities other than investments in securities held at the end of the reporting period.
c. Foreign Currency Contracts
When the Fund purchases or sells foreign securities it may enter into foreign exchange contracts to minimize foreign exchange risk from the trade date to the settlement date of the transactions. A foreign exchange contract is an agreement between two parties to exchange different currencies at an agreed upon exchange rate on a specified date. Realized and unrealized gains and losses on these contracts are included in the Statement of Operations.
The risks of these contracts include movement in the values of the foreign currencies relative to the U.S. dollar and the possible inability of the counterparties to fulfill their obligations under the contracts.
d. Income and Deferred Taxes
No provision has been made for U.S. income taxes because the Fund’s policy is to qualify as a regulated investment company under Subchapter M of the Internal Revenue Code and to distribute substantially all of its taxable income. Fund distributions to shareholders are determined on an income tax basis and may differ from net investment income and realized gains for financial reporting purposes.
The Fund is subject to a tax imposed on net realized gains of securities of certain foreign countries. The Fund records an estimated deferred tax liability for net unrealized gains on these securities as reflected in the accompanying financial statements.
e. Security Transactions, Investment Income, Expenses and Distributions
Security transactions are accounted for on trade date. Realized gains and losses on security transactions are determined on a specific identification basis. Interest income and estimated expenses are accrued daily. Discounts and premiums on securities purchased are amortized over the lives of the respective securities. Dividend income and distributions to shareholders are recorded on the ex-dividend date.
Common expenses incurred by the Trust are allocated among the Funds based on the ratio of net assets of each fund to the combined net assets. Other expenses are charged to each fund on a specific identification basis.
Realized and unrealized gains and losses and net investment income, other than class specific expenses, are allocated daily to each class of shares based upon the relative proportion of net assets of each class.
f. Accounting Estimates
The preparation of financial statements in accordance with accounting principles generally accepted in the United States of America requires management to make estimates and assumptions that affect the reported amounts of assets and liabilities at the date of the financial statements and the amounts of income and expenses during the reporting period. Actual results could differ from those estimates.
TD-20
FRANKLIN TEMPLETON VARIABLE INSURANCE PRODUCTS TRUST
TEMPLETON DEVELOPING MARKETS SECURITIES FUND
Notes to Financial Statements (continued)
1. ORGANIZATION AND SIGNIFICANT ACCOUNTING POLICIES (cont.)
g. Redemption Fees
Redemptions and exchanges of Class 3 shares held 60 days or less may be subject to the Fund’s redemption fee, which is 1% of the amount redeemed. Such fees are retained by the Fund and accounted for as additional paid-in capital. There were no redemption fees for the year.
h. Guarantees and Indemnifications
Under the Trust’s organizational documents, its officers and trustees are indemnified by the Trust against certain liability arising out of the performance of their duties to the Trust. Additionally, in the normal course of business, the Trust enters into contracts with service providers that contain general indemnification clauses. The Trust’s maximum exposure under these arrangements is unknown as this would involve future claims that may be made against the Trust that have not yet occurred. However, based on experience, the Trust expects the risk of loss to be remote.
2. SHARES OF BENEFICIAL INTEREST
The Fund offers three classes of shares: Class 1 Class 2, and Class 3. Effective May 1, 2004 the Fund began offering a new class of shares, Class 3. Each class of shares differs by its distribution fees, voting rights on matters affecting a single class and its exchange privilege.
At December 31, 2004, there were an unlimited number of shares authorized ($.01 par value). Transactions in the Fund’s shares were as follows:
| | | | | | | | | | | | | | |
| | | Year Ended December 31,
| |
| | | 2004
| | | 2003
| |
| Class 1 Shares: | | Shares
| | | Amount
| | | Shares
| | | Amount
| |
Shares sold | | 8,940,486 | | | $ | 67,520,469 | | | 10,436,573 | | | $ | 60,506,599 | |
Shares issued in reinvestment of distributions | | 1,105,920 | | | | 7,597,672 | | | 652,039 | | | | 3,521,009 | |
Shares redeemed | | (5,740,464 | ) | | | (42,618,837 | ) | | (8,573,395 | ) | | | (45,975,869 | ) |
| | |
| |
Net increase (decrease) | | 4,305,942 | | | $ | 32,499,304 | | | 2,515,217 | | | $ | 18,051,739 | |
| | |
| |
| Class 2 Shares: | | | | | | | | | | | | |
Shares sold | | 21,331,545 | | | $ | 159,905,301 | | | 30,181,277 | | | $ | 163,641,071 | |
Shares issued in reinvestment of distributions | | 595,355 | | | | 4,066,275 | | | 198,398 | | | | 1,068,523 | |
Shares redeemed | | (8,236,506 | ) | | | (60,302,466 | ) | | (23,541,038 | ) | | | (122,858,427 | ) |
| | |
| |
Net increase (decrease) | | 13,690,394 | | | $ | 103,669,110 | | | 6,838,637 | | | $ | 41,851,167 | |
| | |
| |
| Class 3 Shares: | | | | | | | | | | | | |
Shares sold | | 1,403 | | | $ | 10,000 | | | | | | | | |
| | |
| | | | | | | |
Net increase (decrease) | | 1,403 | | | $ | 10,000 | | | | | | | | |
| | |
| | | | | | | |
3. TRANSACTIONS WITH AFFILIATES
Certain officers and trustees of the Fund are also officers and/or directors of the following entities:
| | |
| Entity | | Affiliation |
Templeton Asset Management Ltd. (TAML) | | Investment manager |
Franklin Templeton Services LLC (FT Services) | | Administrative manager |
Franklin Templeton Distributors Inc. (Distributors) | | Principal underwriter |
Franklin Templeton Investor Services LLC (Investor Services) | | Transfer agent |
TD-21
FRANKLIN TEMPLETON VARIABLE INSURANCE PRODUCTS TRUST
TEMPLETON DEVELOPING MARKETS SECURITIES FUND
Notes to Financial Statements (continued)
3. TRANSACTIONS WITH AFFILIATES (cont.)
a. Management Fees
The Fund pays an investment management fee to TAML of 1.25% per year of the average daily net assets of the Fund.
b. Administrative Fees
The Fund pays an administrative fee to FT Services based on the average daily net assets of the Fund as follows:
| | |
| Annualized Fee Rate | | Net Assets |
| .150% | | First $200 million |
| .135% | | Over $200 million, up to and including $700 million |
| .100% | | Over $700 million, up to and including $1.2 billion |
Fees are further reduced on net assets over $1.2 billion.
c. Distribution Fees
The Fund reimburses Distributors up to .25% per year of its average daily net assets of Class 2 and Class 3, for costs incurred in marketing the Fund’s shares under a Rule 12b-1 plan. No payments were made by Class 3 for the period ended December 31, 2004.
d. Transfer Agent Fees
Investor Services, under terms of an agreement, performs shareholder servicing for the Fund and is not paid by the Fund for the services.
e. Other Affiliated Transactions
At December 31, 2004, Franklin Advisers Inc. owned 100% of Class 3.
4. EXPENSE OFFSET ARRANGEMENT
The Fund has entered into an arrangement with its custodian whereby credits realized as a result of uninvested cash balances are used to reduce a portion of the Fund’s custodian expenses. During the year ended December 31, 2004, the custodian fees were reduced as noted in the Statement of Operations.
5. INCOME TAXES
At December 31, 2004, the Fund had tax basis capital losses which may be carried over to offset future capital gains. Such losses expire as follows:
| | | |
Capital loss carryovers expiring in: | | | |
2007 | | $ | 58,738,810 |
2009 | | | 62,323,035 |
2010 | | | 24,246,197 |
| | |
|
|
| | | $ | 145,308,042 |
| | |
|
|
TD-22
FRANKLIN TEMPLETON VARIABLE INSURANCE PRODUCTS TRUST
TEMPLETON DEVELOPING MARKETS SECURITIES FUND
Notes to Financial Statements (continued)
5. INCOME TAXES (cont.)
At December 31, 2004, the Fund had deferred capital and currency losses occurring subsequent to October 31, 2004 of $650,185 and $142,382, respectively. For tax purposes, such losses will be reflected in the year ending December 31, 2005.
The tax character of distributions paid during the years ended December 31, 2004 and 2003, was as follows:
| | | | | | |
| | | 2004
| | 2003
|
Distributions paid from ordinary income | | $ | 11,664,137 | | $ | 4,589,532 |
| | |
|
Net investment income (loss) differs for financial statement and tax purposes primarily due to differing treatments of foreign currency transactions and passive foreign investment company shares.
Net realized gains (losses) differ for financial statement and tax purposes primarily due to differing treatments of wash sales, foreign currency transactions and passive foreign investment company shares.
At December 31, 2004, the cost of investments, net unrealized appreciation (depreciation), and undistributed ordinary income for income tax purposes were as follows:
| | | | |
Cost of investments | | $ | 607,326,405 | |
| | |
|
|
|
Unrealized appreciation | | $ | 206,582,379 | |
Unrealized depreciation | | | (4,379,718 | ) |
| | |
|
|
|
Net unrealized appreciation (depreciation) | | $ | 202,202,661 | |
| | |
|
|
|
Distributable earnings - undistributed ordinary income | | $ | 11,866,491 | |
| | |
|
|
|
6. INVESTMENT TRANSACTIONS
Purchases and sales of investments (excluding short-term securities) for the year ended December 31, 2004, aggregated $480,021,270 and $335,018,988, respectively.
7. OTHER CONSIDERATIONS
TAML, as the Fund’s Manager, may serve as a member on the board of directors of certain companies in which the Fund invests and/or may represent the Fund in certain corporate negotiations. At December 31, 2004, the Manager serves in one or more of these capacities for Lukoil Holdings. As a result of this involvement, the Manager may be in possession of certain material non-public information which, pursuant to the Fund’s policies and the requirements of the federal securities laws, could prevent the Fund from trading in the securities of such companies for limited or extended periods of time.
8. REGULATORY MATTERS
Investigations
As part of various investigations by a number of federal, state, and foreign regulators and governmental entities, including the Securities and Exchange Commission (“SEC”), the California Attorney General’s Office (“CAGO”), and the National Association of Securities Dealers, Inc. (“NASD”), relating to certain practices in the mutual fund industry, including late trading, market timing and marketing support payments to securities dealers who sell fund shares, Franklin Resources, Inc. and certain of its subsidiaries (as used in this section, together, the “Company”), as well as certain current or former executives and employees of the Company, received subpoenas and/or requests for documents, information and/or testimony. The Company and its current employees provided documents and information in response to those requests and subpoenas.
TD-23
FRANKLIN TEMPLETON VARIABLE INSURANCE PRODUCTS TRUST
TEMPLETON DEVELOPING MARKETS SECURITIES FUND
Notes to Financial Statements (continued)
8. REGULATORY MATTERS (cont.)
Settlements
Beginning in August 2004, the Company entered into settlements with certain regulators investigating the mutual fund industry practices noted above. The Company believes that settlement of each of the matters described in this section is in the best interest of the Company and shareholders of the Franklin, Templeton, and Mutual Series mutual funds (the “funds”).
On August 2, 2004, Franklin Resources, Inc. announced that its subsidiary, Franklin Advisers, Inc., reached an agreement with the SEC that resolved the issues resulting from the SEC investigation into market timing activity. In connection with that agreement, the SEC issued an “Order Instituting Administrative and Cease-and-Desist Proceedings Pursuant to Sections 203(e) and 203(k) of the Investment Advisers Act of 1940 and Sections 9(b) and 9(f) of the Investment Company Act of 1940, Making Findings and Imposing Remedial Sanctions and a Cease-and-Desist Order” (the “Order”). The SEC’s Order concerned the activities of a limited number of third parties that ended in 2000 and those that were the subject of the first Massachusetts administrative complaint described below.
Under the terms of the SEC’s Order, pursuant to which Franklin Advisers, Inc. neither admitted nor denied any of the findings contained therein, Franklin Advisers, Inc. agreed to pay $50 million, of which $20 million is a civil penalty, to be distributed to shareholders of certain funds in accordance with a plan to be developed by an independent distribution consultant. At this time, it is unclear which funds or which shareholders of any particular fund will receive distributions. The Order also required Franklin Advisers, Inc. to, among other things, enhance and periodically review compliance policies and procedures.
On September 20, 2004, Franklin Resources, Inc. announced that two of its subsidiaries, Franklin Advisers, Inc. and Franklin Templeton Alternative Strategies, Inc. (“FTAS”), reached an agreement with the Securities Division of the Office of the Secretary of the Commonwealth of Massachusetts (the “State of Massachusetts”) related to its administrative complaint filed on February 4, 2004, concerning one instance of market timing that was also a subject of the August 2, 2004 settlement that Franklin Advisers, Inc. reached with the SEC, as described above.
Under the terms of the settlement consent order issued by the State of Massachusetts, Franklin Advisers, Inc. and FTAS consented to the entry of a cease-and-desist order and agreed to pay a $5 million administrative fine to the State of Massachusetts (the “Massachusetts Consent Order”). The Massachusetts Consent Order included two different sections: “Statements of Fact” and “Violations of Massachusetts Securities Laws.” Franklin Advisers, Inc. and FTAS admitted the facts in the Statements of Fact.
On October 25, 2004, the State of Massachusetts filed a second administrative complaint, alleging that Franklin Resources, Inc.’s Form 8-K filing (in which it described the Massachusetts Consent Order and stated that “Franklin did not admit or deny engaging in any wrongdoing”) failed to state that Franklin Advisers, Inc. and FTAS admitted the Statements of Fact portion of the Massachusetts Consent Order (the “Second Complaint”). Franklin Resources, Inc. reached a second agreement with the State of Massachusetts on November 19, 2004, resolving the Second Complaint. As a result of the November 19, 2004 settlement, Franklin Resources, Inc. filed a new Form 8-K. The terms of the Massachusetts Consent Order did not change and there was no monetary fine associated with this second settlement.
On November 17, 2004, Franklin Resources, Inc. announced that Franklin/Templeton Distributors, Inc. (“FTDI”) reached an agreement with the CAGO, resolving the issues resulting from the CAGO’s investigation concerning sales and marketing support payments. Under the terms of the settlement, FTDI neither admitted nor denied the allegations in the CAGO’s complaint and agreed to pay $2 million to the State of California as a civil penalty, $14 million to the funds, to be allocated by an independent distribution consultant to be paid for by FTDI, and $2 million to the CAGO for its investigative costs.
On December 13, 2004, Franklin Resources, Inc. announced that its subsidiaries FTDI and Franklin Advisers, Inc. reached an agreement with the SEC, resolving the issues resulting from the SEC’s investigation concerning marketing support payments to securities dealers who sell fund shares. In connection with that agreement, the SEC issued an “Order Instituting Administrative and Cease-and-Desist Proceedings, Making Findings, and Imposing Remedial Sanctions Pursuant to Sections 203(e) and 203(k)
TD-24
FRANKLIN TEMPLETON VARIABLE INSURANCE PRODUCTS TRUST
TEMPLETON DEVELOPING MARKETS SECURITIES FUND
Notes to Financial Statements (continued)
8. REGULATORY MATTERS (cont.)
Settlements (cont.)
of the Investment Advisers Act of 1940, Sections 9(b) and 9(f) of the Investment Company Act of 1940, and Section 15(b) of the Securities Exchange Act of 1934” (the “Second Order”).
Under the terms of the Second Order, in which FTDI and Franklin Advisers, Inc. neither admitted nor denied the findings contained therein, they agreed to pay the funds a penalty of $20 million and disgorgement of $1 (one dollar). FTDI and Franklin Advisers, Inc. also agreed to implement certain measures and undertakings relating to marketing support payments to broker-dealers for the promotion or sale of fund shares, including making additional disclosures in the funds’ Prospectuses and Statements of Additional Information. The Second Order further requires the appointment of an independent distribution consultant, at the Company’s expense, who shall develop a plan for the distribution of the penalty and disgorgement to the funds.
Other Legal Proceedings
The Trust, in addition to the Company and other funds, and certain current and former officers, employees, and directors have been named in multiple lawsuits in different federal courts in Nevada, California, Illinois, New York and Florida, alleging violations of various federal securities laws and seeking, among other relief, monetary damages, restitution, removal of fund trustees, directors, advisers, administrators, and distributors, rescission of management contracts and 12b-1 Plans, and/or attorneys’ fees and costs. Specifically, the lawsuits claim breach of duty with respect to alleged arrangements to permit market timing and/or late trading activity, or breach of duty with respect to the valuation of the portfolio securities of certain Templeton funds managed by Franklin Resources, Inc. subsidiaries, resulting in alleged market timing activity. The majority of these lawsuits duplicate, in whole or in part, the allegations asserted in the February 4, 2004 Massachusetts administrative complaint and the findings in the SEC’s August 2, 2004 Order, as described above. The lawsuits are styled as class actions, or derivative actions on behalf of either the named funds or Franklin Resources, Inc.
In addition, the Company, as well as certain current and former officers, employees, and directors, have been named in multiple lawsuits alleging violations of various securities laws and pendent state law claims relating to the disclosure of directed brokerage payments and/or payment of allegedly excessive advisory, commission, and distribution fees, and seeking, among other relief, monetary damages, restitution, rescission of advisory contracts, including recovery of all fees paid pursuant to those contracts, an accounting of all monies paid to the named advisers, declaratory relief, injunctive relief, and/or attorneys’ fees and costs. These lawsuits are styled as class actions or derivative actions brought on behalf of certain funds.
The Company and fund management strongly believes that the claims made in each of the lawsuits identified above are without merit and intends to vigorously defend against them. The Company cannot predict with certainty, however, the eventual outcome of the remaining governmental investigations or private lawsuits, nor whether they will have a material negative impact on the Company. Public trust and confidence are critical to the Company’s business and any material loss of investor and/or client confidence could result in a significant decline in assets under management by the Company, which would have an adverse effect on the Company’s future financial results. If the Company finds that it bears responsibility for any unlawful or inappropriate conduct that caused losses to the Trust, it is committed to making the Trust or its shareholders whole, as appropriate. The Company is committed to taking all appropriate actions to protect the interests of its funds’ shareholders.
TD-25
FRANKLIN TEMPLETON VARIABLE INSURANCE PRODUCTS TRUST
TEMPLETON DEVELOPING MARKETS SECURITIES FUND
Report of Independent Registered Public Accounting Firm
To the Trustees and Shareholders of
Franklin Templeton Variable Insurance Products Trust
In our opinion, the accompanying statement of assets and liabilities, including the statement of investments, and the related statements of operations and of changes in net assets and the financial highlights present fairly, in all material respects, the financial position of Templeton Developing Markets Securities Fund (the Fund) (one of the funds constituting Franklin Templeton Variable Insurance Products Trust) at December 31, 2004, the results of its operations for the year then ended, the changes in its net assets for each of the two years in the period then ended and the financial highlights for each of the periods presented, in conformity with accounting principles generally accepted in the United States of America. These financial statements and financial highlights (hereafter referred to as “financial statements”) are the responsibility of the Fund’s management; our responsibility is to express an opinion on these financial statements based on our audits. We conducted our audits of these financial statements in accordance with the standards of the Public Company Accounting Oversight Board (United States). Those standards require that we plan and perform the audits to obtain reasonable assurance about whether the financial statements are free of material misstatement. An audit includes examining, on a test basis, evidence supporting the amounts and disclosures in the financial statements, assessing the accounting principles used and significant estimates made by management, and evaluating the overall financial statement presentation. We believe that our audits, which included confirmation of securities at December 31, 2004 by correspondence with the custodian and brokers, provide a reasonable basis for our opinion.
PricewaterhouseCoopers LLP
San Francisco, California
February 9, 2005
TD-26
FRANKLIN TEMPLETON VARIABLE INSURANCE PRODUCTS TRUST
TEMPLETON DEVELOPING MARKETS SECURITIES FUND
Tax Designation (unaudited)
At December 31, 2004, more than 50% of the Fund’s total assets were invested in securities of foreign issuers. In most instances, foreign taxes were withheld from dividends paid to the Fund on these investments. The Fund elects to treat foreign taxes paid under Section 853 of the Code. This election will allow shareholders of record in June 2005, to treat their proportionate share of foreign taxes paid by the Fund as having been paid directly by them. The shareholder shall consider these amounts as foreign taxes paid in the tax year in which they receive the Fund distribution.
The foreign tax information will be disclosed in the June 2005, semi-annual report of the Fund.
TD-27
TEMPLETON FOREIGN SECURITIES FUND
This annual report for Templeton Foreign Securities Fund covers the fiscal year ended December 31, 2004.
PERFORMANCE SUMMARYASOF 12/31/04
Average annual total return of Class 3 shares* represents the average annual change in value, assuming reinvestment of dividends and capital gains. Average returns smooth out variations in returns, which can be significant; they are not the same as year-by-year results.
Periods ended 12/31/04
| | | | | | |
| | | 1-Year | | 5-Year | | 10-Year |
Average Annual Total Return | | +18.53% | | +0.92% | | +8.68% |
*Performance prior to the 5/1/00 merger reflects the historical performance of Templeton International Fund. Additionally, Class 3 and Class 2 shares were not offered until 5/1/04 and 5/1/97, respectively. As a result, Class 3 Fund performance for periods prior to 5/1/04 represents the historical results of Class 2 shares which, for periods prior to 5/1/97, reflects the historical results of Class 1 shares. For periods beginning on 5/1/97, Class 2’s results reflect an additional 12b-1 fee expense, which also affects future performance. The 12b-1 fee rate is currently the same for Classes 2 and 3. Since 5/1/04 (effective date), the total return of Class 3 shares was +16.25%.
Total Return Index Comparison
for Hypothetical $10,000 Investment (1/1/95–12/31/04)
The graph below shows the change in value of a hypothetical $10,000 investment in the Fund over the indicated period and includes reinvestment of any income or distributions. The Fund’s performance* is compared to the performance of the Morgan Stanley Capital International (MSCI) Europe Australasia Far East (EAFE) Index. One cannot invest directly in an index, nor is an index representative of the Fund’s portfolio. Please see Important Notes to Performance Information preceding the Fund Summaries.
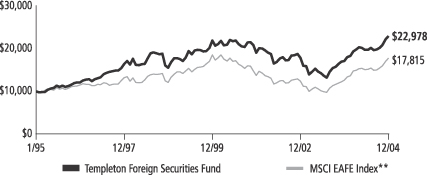
**Source: Standard & Poor’s Micropal. Please see Index Descriptions following the Fund Summaries.
Templeton Foreign Securities Fund – Class 3
Performance reflects the Fund’s Class 3 operating expenses, but does not include any contract fees, expenses or sales charges. If they had been included, performance would be lower. These charges and deductions, particularly for variable life policies, can have a significant effect on contract values and insurance benefits. See the contract prospectus for a complete description of these expenses, including sales charges.
Performance data quoted represent past performance, which does not guarantee future results. Investment return and principal value will fluctuate, and you may have a gain or loss when you sell your shares. Current performance may differ from figures shown.
TF-1
Fund Goal and Main Investments: Templeton Foreign Securities Fund seeks long-term capital growth. The Fund invests predominantly in investments of issuers located outside the U.S., including those in emerging markets.
Performance Overview
You can find the Fund’s total return in the Performance Summary. The Fund underperformed its benchmark, the MSCI EAFE Index, which returned 20.70% for the one-year period under review.1
Economic and Market Overview
The global economic recovery continued in 2004, led by growth in China and the U.S. As of December 31, 2004, U.S. gross domestic product (GDP) had increased for 13 consecutive quarters.2 In China, GDP grew 9.5% in 2004.3
The 12-nation euro zone lagged other regions in the current recovery. However, the European Central Bank projected euro zone growth may be between 1.6% and 2.0% in 2004, compared with only 0.5% in 2003. In Japan, the economy struggled to emerge from a decade-long deflationary period. Although the country’s consumer and business confidence reached their highest levels since 1991, economic growth slowed in response to higher oil prices and reduced external demand. In addition, the U.S. dollar declined approximately 4% versus the yen and 7% versus the euro during 2004.4 This hurt Japanese and European exports into the U.S., as it made their goods more expensive in the world’s biggest market. However, the greenback’s protracted decline should also benefit the U.S. current account deficit by making U.S. goods more competitive in international markets.
Oil prices increased during most of 2004, reaching $56 per barrel in October, but declined to end the year at $43. Higher oil prices triggered investor worries about inflation, decreased spending — due to cautionary consumer and business sentiment — and slower economic and corporate profit growth. As of December 31, 2004, the 12-month moving average price of oil was about $41 per barrel.5
1. Source: Standard & Poor’s Micropal. One cannot invest directly in an index, nor is an index representative of the Fund’s portfolio. Please see Index Descriptions following the Fund Summaries.
2. Source: Bureau of Economic Analysis.
3. Source: National Bureau of Statistics of China.
4. Source: FactSet Research Systems Inc.
5. Source: U.S. Department of Energy.
Fund Risks: Stocks offer the potential for long-term gains but can be subject to short-term up-and-down price movements. Foreign investing involves special risks including currency fluctuations, economic instability, and social and political developments. Emerging markets involve heightened risks due to their relatively smaller size and lesser liquidity. The Fund’s prospectus also includes a description of the main investment risks.
TF-2
In this environment, the MSCI World Index’s total return was 15.25% in U.S. dollars for the 12-month period ended December 31, 2004.6 Emerging markets, as measured by the MSCI Emerging Markets Index, had a one-year total return of 25.95% in U.S. dollars.6 In local currencies, these indexes had notably lower total returns of 11.83% and 16.45% for the same period.6 In 2004, most of the world’s currencies strengthened in relation to the U.S. dollar, which benefited U.S.-based investors of non-U.S. developed and emerging market equities.
Investment Strategy
Our investment philosophy is bottom-up, value-oriented and long-term. In choosing investments, we generally focus on the market price of a company’s securities relative to our evaluation of the company’s potential long-term earnings, asset value and cash flow. Among factors we consider are a company’s historical value measures, including price/earnings ratio, profit margins and liquidation value. We do in-depth research to construct a bargain list from which we buy.
Manager’s Discussion
During the year under review, the Fund benefited from a variety of sectors and individual holdings. For example, strong stock selection in the health care sector aided returns even though we were slightly underweighted compared with the MSCI EAFE Index.7 Among these, the stocks of Mayne Group (sold by period-end) and Ono Pharmaceutical rose on favorable company fundamentals. Merger and acquisition activity in the pharmaceuticals and biotechnology industries was also a boon to certain Fund holdings. For example, the Fund benefited from consolidation in the pharmaceuticals industry when Sanofi acquired Aventis, a long-time portfolio holding. Similarly, UCB acquired Fund holding CellTech Group at a significant premium to its prior-day share price.
Portfolio holdings within the energy sector also provided healthy returns for the Fund as they benefited from steadily rising oil and other energy commodity prices throughout the year.8 Our best performing energy stocks included those of oil and gas companies Eni and Repsol. The Fund’s utilities sector holdings also performed well during the year largely due to healthy earnings growth and a low interest rate environment.9 Our top performers included German multi-utility
6. Source: Standard & Poor’s Micropal. Please see Index Descriptions following the Fund Summaries.
7. In the SOI, the health care sector comprises health care equipment and supplies, and pharmaceuticals.
8. In the SOI, the energy sector comprises energy equipment and services, and oil and gas.
9. In the SOI, the utilities sector comprises electric utilities, and multi-utilities and unregulated power.
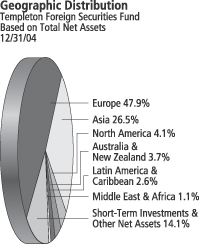
TF-3
E.ON, U.K. power and gas grid operator National Grid Transco, Spanish electric utility Iberdrola and France’s Suez, which provides electricity, natural gas, water and waste management services to more than 130 countries.
In general, if the value of the U.S. dollar goes up compared with a foreign currency, an investment traded in that foreign currency will go down in value because it will be worth fewer U.S. dollars. This can have a negative effect on Fund performance. Conversely, when the U.S. dollar weakens in relation to a foreign currency, an investment traded in that foreign currency will increase in value, which can contribute to Fund performance. For the 12 months ended December 31, 2004, the U.S. dollar declined in value relative to most non-U.S. currencies. At the end of the period, the Fund’s portfolio was invested predominantly in securities with non-U.S. currency exposure, which resulted in a positive effect on Fund performance. However, one cannot expect the same result in future periods.
There were some disappointments and a large cash position that detracted from our overall results. We held approximately 15% in cash (short-term investments and other net assets) for most of 2004, which served as a significant drag in a year when foreign stock markets were quite strong. This uninvested money was, by far, the largest detractor to Fund performance.
Elsewhere, our investments in the consumer staples sector contributed very little to the Fund’s overall return.10 Consumer staples were a small sector weighting in the Fund at less than half the index’s at period-end, but many of the companies within the group were plagued with poor stock performance. Notable laggards during the year included three European companies: U.K.-based supermarket chain J Sainsbury (sold by period-end), U.K. global consumer goods giant Unilever, and Switzerland-based Nestlé, the world’s number-one food company.
Top 10 Holdings
Templeton Foreign Securities Fund
12/31/04
| | |
Company
Sector/Industry,
Country | | % of Total Net Assets |
| |
| Cheung Kong Holdings Ltd. | | 2.3% |
| Real Estate, Hong Kong | | |
| |
| Nippon Telegraph & Telephone Corp. | | 1.7% |
| Diversified Telecommunication Services, Japan | | |
| |
| Sanofi-Aventis | | 1.7% |
| Pharmaceuticals, France | | |
| |
| Samsung Electronics Co. Ltd. | | 1.5% |
| Semiconductors & Semiconductor Equipment, South Korea | | |
| |
| Swiss Reinsurance Co. | | 1.5% |
| Insurance, Switzerland | | |
| |
| Telefonos de Mexico SA de CV (Telmex), L, ADR | | 1.5% |
| Diversified Telecommunication Services, Mexico | | |
| |
| Shell Transport & Trading Co. PLC | | 1.5% |
| Oil & Gas, U.K. | | |
| |
| Denso Corp. | | 1.4% |
| Auto Components, Japan | | |
| |
| BP PLC | | 1.4% |
| Oil & Gas, U.K. | | |
| |
| GlaxoSmithKline PLC | | 1.3% |
| Pharmaceuticals, U.K. | | |
The dollar value, number of shares or principal amount, and names of all portfolio holdings are listed in the Fund’s Statement of Investments.
TF-4
Lastly, some of our holdings within the financials sector, which was significantly underweighted compared with the index at period-end, hurt Fund performance.11 Individual financial stocks that posted positive total returns yet underperformed the index included Bermuda-based insurers XL Capital and ACE Ltd., global banking concern HSBC Holdings (sold by period-end), and South Korea’s Kookmin Bank. Our position in Japanese brokerage Nomura Holdings, on the other hand, posted negative returns during the year.
Thank you for your participation in Templeton Foreign Securities Fund. We look forward to serving your future investment needs.
10. In the SOI, the consumer staples sector comprises food and staples retailing, and food products.
11. In the SOI, the finance sector comprises commercial banks, diversified financial services, capital markets, insurance and real estate.
The foregoing information reflects our analysis, opinions and portfolio holdings as of December 31, 2004, the end of the reporting period. The way we implement our main investment strategies and the resulting portfolio holdings may change depending on factors such as market and economic conditions. These opinions may not be relied upon as investment advice or an offer for a particular security. The information is not a complete analysis of every aspect of any market, country, industry, security or the Fund. Statements of fact are from sources considered reliable, but the adviser makes no representation or warranty as to their completeness or accuracy. Although historical performance is no guarantee of future results, these insights may help you understand our investment management philosophy.
TF-5
Fund Expenses
As an investor in a variable insurance contract (“Contract”) that indirectly provides for investment in an underlying mutual fund, you can incur transaction and/or ongoing expenses at both the Fund level and the Contract level.
| • | | Transaction expenses can include sales charges (loads) on purchases, redemption fees, surrender fees, transfer fees and premium taxes. |
| • | | Ongoing expenses can include management fees, distribution and service (12b-1) fees, contract fees, annual maintenance fees, mortality and expense risk fees and other fees and expenses. All mutual funds and Contracts have some types of ongoing expenses. |
The expenses shown in the table below are meant to highlight ongoing expenses at the Fund level only and do not include ongoing expenses at the Contract level, or transaction expenses at either the Fund or Contract levels. If ongoing expenses at the Contract level and transaction expenses at the Fund and Contract levels were included, the expenses shown below would be higher. You should consult your Contract prospectus or disclosure document for more information.
The table shows Fund-level ongoing expenses and can help you understand these expenses and compare them with those of other mutual funds offered through the Contract. The table assumes a $1,000 investment held for the six months indicated. Because transaction costs at the Fund level are not included, the second line (Hypothetical) is useful in comparing ongoing expenses only, and will not help you compare the total costs of different funds offered through the Contract. Please refer to the Fund prospectus for additional information on operating expenses.
Actual Fund Expenses
The first line (Actual) listed in the table below provides actual account values and expenses. The “Ending Account Value” is derived from the Fund’s actual return, which includes the effect of ongoing Fund expenses, but does not include the effect of ongoing Contract expenses.
You can estimate the Fund-level expenses you incurred during the period, by following these steps. Of course, your account value and expenses will differ from those in this illustration:
| 1. | Divide your account value by $1,000. |
If an account had an $8,600 value, then $8,600 ÷ $1,000 = 8.6.
Templeton Foreign Securities Fund – Class 3
TF-6
| 2. | Multiply the result by the number under the heading “Fund-level Expenses Incurred During Period.” |
If Fund-Level Expenses Incurred During Period were $7.50, then 8.6 × $7.50 = $64.50.
In this illustration, the estimated expenses incurred this period at the Fund level are $64.50.
Hypothetical Example for Comparison with Other Mutual Funds
Information in the second line (Hypothetical) in the table can help you compare ongoing expenses of the Fund with those of other mutual funds offered through the Contract. This information may not be used to estimate the actual ending account balance or expenses you incurred during the period. The hypothetical “Ending Account Value” is based on the actual expense ratio and an assumed 5% annual rate of return before expenses, which does not represent the Fund’s actual return. The figure under the heading “Fund-Level Expenses Incurred During Period” shows the hypothetical expenses a Fund account would have incurred under this scenario. You can compare this figure with the 5% hypothetical examples that appear in shareholder reports of other funds offered through a Contract.
| | | | | | | | | |
| Class 3 | | Beginning
Account
Value 6/30/04 | | Ending
Account
Value 12/31/04 | | Fund-Level
Expenses Incurred
During Period*
6/30/04-12/31/04 |
Actual | | $ | 1,000 | | $ | 1,138.00 | | $ | 5.70 |
Hypothetical (5% return before expenses) | | $ | 1,000 | | $ | 1,019.81 | | $ | 5.38 |
*Expenses are equal to the annualized expense ratio for the Fund’s Class 3 shares (1.06%), which does not include any ongoing expenses of the Contract for which the Fund is an investment option, multiplied by the average account value over the period, multiplied by 184/366 to reflect the one-half year period.
TF-7
FRANKLIN TEMPLETON VARIABLE INSURANCE PRODUCTS TRUST
TEMPLETON FOREIGN SECURITIES FUND
Financial Highlightsa
| | | | | | | | | | | | | | | | | | | | |
| | | Class 1
| |
| | | Year Ended December 31,
| |
| | | 2004 | | | 2003 | | | 2002 | | | 2001 | | | 2000 | |
| | |
|
|
|
Per share operating performance | | | | | | | | | | | | | | | | | | | | |
(for a share outstanding throughout the year) | | | | | | | | | | | | | | | | | | | | |
Net asset value, beginning of year | | $ | 12.37 | | | $ | 9.51 | | | $ | 11.85 | | | $ | 18.78 | | | $ | 22.25 | |
| | |
|
|
|
Income from investment operations: | | | | | | | | | | | | | | | | | | | | |
Net investment incomeb | | | .26 | | | | .19 | | | | .22 | | | | .23 | | | | .40 | |
Net realized and unrealized gains (losses) | | | 2.05 | | | | 2.87 | | | | (2.37 | ) | | | (5.23 | ) | | | (.95 | ) |
| | |
|
|
|
Total from investment operations | | | 2.31 | | | | 3.06 | | | | (2.15 | ) | | | (5.00 | ) | | | (.55 | ) |
| | |
|
|
|
Less distributions from: | | | | | | | | | | | | | | | | | | | | |
Net investment income | | | (.15 | ) | | | (.20 | ) | | | (.19 | ) | | | (.26 | ) | | | (.43 | ) |
Net realized gains | | | — | | | | — | | | | — | | | | (1.67 | ) | | | (2.49 | ) |
| | |
|
|
|
Total distributions | | | (.15 | ) | | | (.20 | ) | | | (.19 | ) | | | (1.93 | ) | | | (2.92 | ) |
| | |
|
|
|
Redemption fees | | | — | d | | | — | | | | — | | | | — | | | | — | |
| | |
|
|
|
Net asset value, end of year | | $ | 14.53 | | | $ | 12.37 | | | $ | 9.51 | | | $ | 11.85 | | | $ | 18.78 | |
| | |
|
|
|
| | | | | |
Total returnc | | | 18.87% | | | | 32.55% | | | | (18.40)% | | | | (15.75)% | | | | (2.19)% | |
Ratios/supplemental data | | | | | | | | | | | | | | | | | | | | |
Net assets, end of year (000’s) | | $ | 506,456 | | | $ | 472,665 | | | $ | 397,420 | | | $ | 565,220 | | | $ | 776,495 | |
Ratios to average net assets: | | | | | | | | | | | | | | | | | | | | |
Expenses | | | .82% | | | | .87% | | | | .88% | | | | .90% | | | | .87% | |
Net investment income | | | 1.95% | | | | 1.81% | | | | 1.97% | | | | 1.59% | | | | 2.08% | |
Portfolio turnover rate | | | 10.91% | | | | 18.01% | | | | 28.12% | | | | 20.00% | | | | 32.81% | |
| a | Financial highlights presented reflect historical financial information from Templeton Variable Products Series Fund (TVP) – Templeton International Securities Fund as a result of a merger on May 1, 2000. |
| b | Based on average daily shares outstanding. |
| c | Total return does not include any fees, charges or expenses imposed by the variable annuity and life insurance contracts for which the Franklin Templeton Variable Insurance Products Trust serves as an underlying investment vehicle. Total return is not annualized for periods less than one year. |
| d | Amount is less than $.001 per share. |
See notes to financial statements.
TF-8
FRANKLIN TEMPLETON VARIABLE INSURANCE PRODUCTS TRUST
TEMPLETON FOREIGN SECURITIES FUND
Financial Highlightsa (continued)
| | | | | | | | | | | | | | | | | | | | |
| | | Class 2
| |
| | | Year Ended December 31,
| |
| | | 2004 | | | 2003 | | | 2002 | | | 2001 | | | 2000 | |
| | |
|
|
|
Per share operating performance | | | | | | | | | | | | | | | | | | | | |
(for a share outstanding throughout the year) | | | | | | | | | | | | | | | | | | | | |
Net asset value, beginning of year | | $ | 12.24 | | | $ | 9.42 | | | $ | 11.74 | | | $ | 18.67 | | | $ | 22.13 | |
| | |
|
|
|
Income from investment operations: | | | | | | | | | | | | | | | | | | | | |
Net investment incomeb | | | .22 | | | | .15 | | | | .17 | | | | .18 | | | | .31 | |
Net realized and unrealized gains (losses) | | | 2.03 | | | | 2.85 | | | | (2.32 | ) | | | (5.21 | ) | | | (.90 | ) |
| | |
|
|
|
Total from investment operations | | | 2.25 | | | | 3.00 | | | | (2.15 | ) | | | (5.03 | ) | | | (.59 | ) |
| | |
|
|
|
Less distributions from: | | | | | | | | | | | | | | | | | | | | |
Net investment income | | | (.14 | ) | | | (.18 | ) | | | (.17 | ) | | | (.23 | ) | | | (.38 | ) |
Net realized gains | | | — | | | | — | | | | — | | | | (1.67 | ) | | | (2.49 | ) |
| | |
|
|
|
Total distributions | | | (.14 | ) | | | (.18 | ) | | | (.17 | ) | | | (1.90 | ) | | | (2.87 | ) |
| | |
|
|
|
Redemption fees | | | — | d | | | — | | | | — | | | | — | | | | — | |
| | |
|
|
|
Net asset value, end of year | | $ | 14.35 | | | $ | 12.24 | | | $ | 9.42 | | | $ | 11.74 | | | $ | 18.67 | |
| | |
|
|
|
| | | | | |
Total returnc | | | 18.53% | | | | 32.21% | | | | (18.56)% | | | | (15.99)% | | | | (2.38)% | |
Ratios/supplemental data | | | | | | | | | | | | | | | | | | | | |
Net assets, end of year (000’s) | | $ | 1,445,928 | | | $ | 653,594 | | | $ | 299,760 | | | $ | 225,505 | | | $ | 187,115 | |
Ratios to average net assets: | | | | | | | | | | | | | | | | | | | | |
Expenses | | | 1.07% | | | | 1.12% | | | | 1.13% | | | | 1.15% | | | | 1.12% | |
Net investment income | | | 1.70% | | | | 1.56% | | | | 1.72% | | | | 1.32% | | | | 1.66% | |
Portfolio turnover rate | | | 10.91% | | | | 18.01% | | | | 28.12% | | | | 20.00% | | | | 32.81% | |
| a | Financial highlights presented reflect historical financial information from Templeton Variable Products Series Fund (TVP) – Templeton International Securities Fund as a result of a merger on May 1, 2000. |
| b | Based on average daily shares outstanding. |
| c | Total return does not include any fees, charges or expenses imposed by the variable annuity and life insurance contracts for which the Franklin Templeton Variable Insurance Products Trust serves as an underlying investment vehicle. Total return is not annualized for periods less than one year. |
| d | Amount is less than $.001 per share. |
See notes to financial statements.
TF-9
FRANKLIN TEMPLETON VARIABLE INSURANCE PRODUCTS TRUST
TEMPLETON FOREIGN SECURITIES FUND
Financial Highlights (continued)
| | | | |
| | | Class 3
| |
| | | Period Ended December 31, 2004c
| |
Per share operating performance | | | | |
(for a share outstanding throughout the period) | | | | |
Net asset value, beginning of period | | $ | 12.48 | |
| | |
|
|
|
Income from investment operations: | | | | |
Net investment incomea | | | .09 | |
Net realized and unrealized gains (losses) | | | 1.92 | |
| | |
|
|
|
Total from investment operations | | | 2.01 | |
| | |
|
|
|
Less distributions from net investment income | | | (.14 | ) |
| | |
|
|
|
Redemption fees | | | — | d |
| | |
|
|
|
Net asset value, end of period | | $ | 14.35 | |
| | |
|
|
|
| |
Total returnb | | | 16.25% | |
Ratios/supplemental data | | | | |
Net assets, end of period (000’s) | | $ | 16,559 | |
Ratios to average net assets: | | | | |
Expenses | | | 1.07%e | |
Net investment income | | | 1.70%e | |
Portfolio turnover rate | | | 10.91% | |
| a | Based on average daily shares outstanding. |
| b | Total return does not include any fees, charges or expenses imposed by the variable annuity and life insurance contracts for which the Franklin Templeton Variable Insurance Products Trust serves as an underlying investment vehicle. Total return is not annualized for periods less than one year. |
| c | For the period May 1, 2004 (effective date) to December 31, 2004. |
| d | Amount is less than $.001 per share. |
See notes to financial statements.
TF-10
FRANKLIN TEMPLETON VARIABLE INSURANCE PRODUCTS TRUST
TEMPLETON FOREIGN SECURITIES FUND
Statement of Investments, December 31, 2004
| | | | | | | |
| | | COUNTRY | | SHARES | | VALUE |
Common Stocks 84.5% | | | | | | | |
Aerospace & Defense 1.2% | | | | | | | |
BAE Systems PLC | | United Kingdom | | 3,544,411 | | $ | 15,681,729 |
aRolls-Royce Group PLC | | United Kingdom | | 1,729,900 | | | 8,201,568 |
aRolls-Royce Group PLC, B | | United Kingdom | | 55,010,820 | | | 107,703 |
| | | | | | |
|
|
| | | | | | | | 23,991,000 |
| | | | | | |
|
|
Air Freight & Logistics .9% | | | | | | | |
Deutsche Post AG | | Germany | | 753,313 | | | 17,235,056 |
| | | | | | |
|
|
Airlines .4% | | | | | | | |
Qantas Airways Ltd. | | Australia | | 3,060,000 | | | 8,886,228 |
| | | | | | |
|
|
Auto Components 3.4% | | | | | | | |
Autoliv Inc., SDR | | Sweden | | 393,611 | | | 18,840,149 |
Denso Corp. | | Japan | | 1,044,800 | | | 28,002,109 |
GKN PLC | | United Kingdom | | 4,440,200 | | | 20,156,384 |
| | | | | | |
|
|
| | | | | | | | 66,998,642 |
| | | | | | |
|
|
Automobiles .4% | | | | | | | |
Volkswagen AG | | Germany | | 181,815 | | | 8,228,207 |
| | | | | | |
|
|
Capital Markets 2.5% | | | | | | | |
Amvescap PLC | | United Kingdom | | 2,575,100 | | | 15,854,031 |
Nomura Holdings Inc. | | Japan | | 1,327,730 | | | 19,367,590 |
UBS AG | | Switzerland | | 161,000 | | | 13,429,036 |
| | | | | | |
|
|
| | | | | | | | 48,650,657 |
| | | | | | |
|
|
Chemicals 3.0% | | | | | | | |
Akzo Nobel NV | | Netherlands | | 329,003 | | | 14,009,817 |
BASF AG | | Germany | | 324,369 | | | 23,293,719 |
Bayer AG, Br. | | Germany | | 333,400 | | | 11,265,348 |
Lonza Group AG | | Switzerland | | 173,400 | | | 9,743,711 |
| | | | | | |
|
|
| | | | | | | | 58,312,595 |
| | | | | | |
|
|
Commercial Banks 6.5% | | | | | | | |
Banco Santander Central Hispano SA | | Spain | | 1,919,500 | | | 23,781,462 |
DBS Group Holdings Ltd. | | Singapore | | 1,312,000 | | | 12,940,758 |
aHana Bank | | South Korea | | 684,000 | | | 17,047,141 |
aKookmin Bank, ADR | | South Korea | | 314,560 | | | 12,293,005 |
Lloyds TSB Group PLC | | United Kingdom | | 1,387,500 | | | 12,597,173 |
National Australia Bank Ltd. | | Australia | | 865,300 | | | 19,520,133 |
Nordea Bank AB, FDR | | Sweden | | 2,135,083 | | | 21,599,419 |
Shinsei Bank Ltd. | | Japan | | 1,325,000 | | | 9,029,974 |
| | | | | | |
|
|
| | | | | | | | 128,809,065 |
| | | | | | |
|
|
Commercial Services & Supplies 1.7% | | | | | | | |
Rentokil Initial PLC | | United Kingdom | | 6,633,900 | | | 18,813,750 |
Securitas AB, B | | Sweden | | 809,980 | | | 13,898,538 |
| | | | | | |
|
|
| | | | | | | | 32,712,288 |
| | | | | | |
|
|
Computers & Peripherals 1.3% | | | | | | | |
Compal Electronics Inc. | | Taiwan | | 11,949,000 | | | 11,915,171 |
Lite-on Technology Corp. | | Taiwan | | 6,751,000 | | | 7,199,085 |
NEC Corp. | | Japan | | 1,058,000 | | | 6,580,219 |
| | | | | | |
|
|
| | | | | | | | 25,694,475 |
| | | | | | |
|
|
TF-11
FRANKLIN TEMPLETON VARIABLE INSURANCE PRODUCTS TRUST
TEMPLETON FOREIGN SECURITIES FUND
Statement of Investments, December 31, 2004 (cont.)
| | | | | | | |
| | | COUNTRY | | SHARES | | VALUE |
Common Stocks (cont.) | | | | | | | |
Construction Materials .6% | | | | | | | |
Cemex SA, ADR | | Mexico | | 315,900 | | $ | 11,505,078 |
| | | | | | |
|
|
Diversified Financial Services .7% | | | | | | | |
ING Groep NV | | Netherlands | | 450,610 | | | 13,611,489 |
| | | | | | |
|
|
Diversified Telecommunication Services 7.9% | | | | | | | |
BCE Inc. | | Canada | | 815,260 | | | 19,658,414 |
Chunghwa Telecom Co. Ltd., ADR | | Taiwan | | 728,900 | | | 15,343,345 |
KT Corp., ADR | | South Korea | | 420,880 | | | 9,179,393 |
Nippon Telegraph & Telephone Corp. | | Japan | | 7,388 | | | 33,181,800 |
Telecom Corp. of New Zealand Ltd. | | New Zealand | | 2,550,626 | | | 11,263,589 |
Telefonica SA, ADR | | Spain | | 347,913 | | | 19,657,085 |
Telefonos de Mexico SA de CV (Telmex), L, ADR | | Mexico | | 780,969 | | | 29,926,732 |
Telenor ASA | | Norway | | 2,003,100 | | | 18,166,610 |
| | | | | | |
|
|
| | | | | | | | 156,376,968 |
| | | | | | |
|
|
Electric Utilities 3.0% | | | | | | | |
E.ON AG | | Germany | | 188,653 | | | 17,198,215 |
Endesa SA | | Spain | | 547,398 | | | 12,843,336 |
Hong Kong Electric Holdings Ltd. | | Hong Kong | | 3,653,500 | | | 16,686,297 |
Iberdrola SA, Br. | | Spain | | 528,222 | | | 13,404,103 |
| | | | | | |
|
|
| | | | | | | | 60,131,951 |
| | | | | | |
|
|
Electrical Equipment .9% | | | | | | | |
Kidde PLC | | United Kingdom | | 2,724,071 | | | 8,705,859 |
aVestas Wind Systems AS | | Denmark | | 502,800 | | | 6,236,677 |
aVestas Wind Systems AS, 144A | | Denmark | | 167,600 | | | 2,078,892 |
| | | | | | |
|
|
| | | | | | | | 17,021,428 |
| | | | | | |
|
|
Electronic Equipment & Instruments 1.4% | | | | | | | |
Hitachi Ltd. | | Japan | | 3,361,867 | | | 23,305,268 |
Venture Corp. Ltd. | | Singapore | | 480,000 | | | 4,675,611 |
| | | | | | |
|
|
| | | | | | | | 27,980,879 |
| | | | | | |
|
|
Energy Equipment & Services .4% | | | | | | | |
IHC Caland NV | | Netherlands | | 115,874 | | | 7,349,442 |
| | | | | | |
|
|
Food & Staples Retailing .8% | | | | | | | |
Boots Group PLC | | United Kingdom | | 1,209,400 | | | 15,193,526 |
| | | | | | |
|
|
Food Products 1.7% | | | | | | | |
Nestle SA | | Switzerland | | 51,790 | | | 13,527,833 |
Unilever PLC | | United Kingdom | | 1,945,434 | | | 19,100,339 |
| | | | | | |
|
|
| | | | | | | | 32,628,172 |
| | | | | | |
|
|
Health Care Equipment & Supplies .9% | | | | | | | |
Olympus Corp. | | Japan | | 861,000 | | | 18,368,336 |
| | | | | | |
|
|
Hotels Restaurants & Leisure 1.0% | | | | | | | |
Compass Group PLC | | United Kingdom | | 4,131,400 | | | 19,527,760 |
| | | | | | |
|
|
Household Durables 3.0% | | | | | | | |
Koninklijke Philips Electronics NV | | Netherlands | | 951,239 | | | 25,184,108 |
Persimmon PLC | | United Kingdom | | 614,500 | | | 8,150,399 |
Sony Corp. | | Japan | | 644,654 | | | 24,925,111 |
| | | | | | |
|
|
| | | | | | | | 58,259,618 |
| | | | | | |
|
|
TF-12
FRANKLIN TEMPLETON VARIABLE INSURANCE PRODUCTS TRUST
TEMPLETON FOREIGN SECURITIES FUND
Statement of Investments, December 31, 2004 (cont.)
| | | | | | | |
| | | COUNTRY | | SHARES | | VALUE |
Common Stocks (cont.) | | | | | | | |
Industrial Conglomerates 2.9% | | | | | | | |
Hutchison Whampoa Ltd. | | Hong Kong | | 1,962,000 | | $ | 18,363,460 |
Smiths Group PLC | | United Kingdom | | 1,293,800 | | | 20,413,521 |
Swire Pacific Ltd., B | | Hong Kong | | 12,648,627 | | | 18,795,240 |
| | | | | | |
|
|
| | | | | | | | 57,572,221 |
| | | | | | |
|
|
Insurance 6.1% | | | | | | | |
ACE Ltd. | | Bermuda | | 558,903 | | | 23,893,103 |
AMP Ltd. | | Australia | | 3,157,400 | | | 17,942,722 |
AXA SA | | France | | 479,792 | | | 11,836,588 |
AXA SA, 144A | | France | | 40,480 | | | 998,652 |
Sompo Japan Insurance Inc. | | Japan | | 1,694,000 | | | 17,267,487 |
Swiss Reinsurance Co. | | Switzerland | | 422,015 | | | 29,938,814 |
XL Capital Ltd., A | | Bermuda | | 232,228 | | | 18,032,504 |
| | | | | | |
|
|
| | | | | | | | 119,909,870 |
| | | | | | |
|
|
IT Services .8% | | | | | | | |
Satyam Computers Services Ltd. | | India | | 1,738,866 | | | 16,480,027 |
| | | | | | |
|
|
Machinery .7% | | | | | | | |
Volvo AB, B | | Sweden | | 369,264 | | | 14,645,614 |
| | | | | | |
|
|
Media 3.7% | | | | | | | |
British Sky Broadcasting Group PLC | | United Kingdom | | 2,237,900 | | | 24,141,038 |
Pearson PLC | | United Kingdom | | 1,008,500 | | | 12,166,345 |
Reed Elsevier NV | | Netherlands | | 877,400 | | | 11,942,032 |
Wolters Kluwer NV | | Netherlands | | 380,280 | | | 7,621,907 |
Yell Group PLC | | United Kingdom | | 2,000,000 | | | 16,891,243 |
| | | | | | |
|
|
| | | | | | | | 72,762,565 |
| | | | | | |
|
|
Metals & Mining 2.2% | | | | | | | |
Alcan Inc. | | Canada | | 55,334 | | | 2,712,836 |
Barrick Gold Corp. | | Canada | | 701,894 | | | 16,971,631 |
BHP Billiton Ltd. | | Australia | | 1,338,050 | | | 16,066,445 |
POSCO, ADR | | South Korea | | 165,547 | | | 7,371,808 |
| | | | | | |
|
|
| | | | | | | | 43,122,720 |
| | | | | | |
|
|
Multi-Utilities & Unregulated Power 2.0% | | | | | | | |
National Grid Transco PLC | | United Kingdom | | 1,742,960 | | | 16,610,612 |
Suez SA | | France | | 861,400 | | | 22,934,196 |
| | | | | | |
|
|
| | | | | | | | 39,544,808 |
| | | | | | |
|
|
Oil & Gas 5.8% | | | | | | | |
BP PLC | | United Kingdom | | 2,849,920 | | | 27,789,154 |
Eni SpA | | Italy | | 845,840 | | | 21,142,557 |
Repsol YPF SA | | Spain | | 902,215 | | | 23,457,688 |
Shell Transport & Trading Co. PLC | | United Kingdom | | 3,458,953 | | | 29,478,581 |
Total SA, B | | France | | 54,077 | | | 11,792,561 |
| | | | | | |
|
|
| | | | | | | | 113,660,541 |
| | | | | | |
|
|
Paper & Forest Products 2.1% | | | | | | | |
Stora Enso OYJ, R | | Finland | | 1,305,230 | | | 19,940,823 |
UPM-Kymmene Corp. | | Finland | | 1,013,779 | | | 22,492,654 |
| | | | | | |
|
|
| | | | | | | | 42,433,477 |
| | | | | | |
|
|
TF-13
FRANKLIN TEMPLETON VARIABLE INSURANCE PRODUCTS TRUST
TEMPLETON FOREIGN SECURITIES FUND
Statement of Investments, December 31, 2004 (cont.)
| | | | | | | |
| | | COUNTRY | | SHARES | | VALUE |
Common Stocks (cont.) | | | | | | | |
Pharmaceuticals 5.4% | | | | | | | |
GlaxoSmithKline PLC | | United Kingdom | | 1,131,289 | | $ | 26,535,283 |
Ono Pharmaceutical Co. Ltd. | | Japan | | 299,000 | | | 16,786,272 |
Sanofi-Aventis | | France | | 412,723 | | | 32,931,814 |
Shire Pharmaceuticals Group PLC | | United Kingdom | | 928,000 | | | 9,743,483 |
Takeda Pharmaceutical Co. Ltd. | | Japan | | 401,200 | | | 20,212,771 |
| | | | | | |
|
|
| | | | | | | | 106,209,623 |
| | | | | | |
|
|
Real Estate 2.3% | | | | | | | |
Cheung Kong Holdings Ltd. | | Hong Kong | | 4,570,137 | | | 45,567,314 |
| | | | | | |
|
|
Road & Rail .3% | | | | | | | |
East Japan Railway Co. | | Japan | | 1,100 | | | 6,121,851 |
| | | | | | |
|
|
Semiconductors & Semiconductor Equipment 2.0% | | | | | | | |
Samsung Electronics Co. Ltd. | | South Korea | | 69,750 | | | 30,353,917 |
Taiwan Semiconductor Manufacturing Co. | | Taiwan | | 5,483,234 | | | 8,710,391 |
| | | | | | |
|
|
| | | | | | | | 39,064,308 |
| | | | | | |
|
|
Software 2.3% | | | | | | | |
aCheck Point Software Technologies Ltd. | | Israel | | 842,050 | | | 20,739,691 |
Nintendo Co. Ltd. | | Japan | | 196,000 | | | 24,629,174 |
| | | | | | |
|
|
| | | | | | | | 45,368,865 |
| | | | | | |
|
|
Wireless Telecommunication Services 2.3% | | | | | | | |
China Mobile (Hong Kong) Ltd., fgn. | | China | | 2,932,000 | | | 9,939,559 |
SK Telecom Co. Ltd., ADR | | South Korea | | 546,520 | | | 12,160,070 |
Vodafone Group PLC, ADR | | United Kingdom | | 835,590 | | | 22,878,454 |
| | | | | | |
|
|
| | | | | | | | 44,978,083 |
| | | | | | |
|
|
Total Common Stocks (Cost $1,293,928,767) | | | | | | | 1,664,914,747 |
| | | | | | |
|
|
Preferred Stocks .8% | | | | | | | |
Automobiles .3% | | | | | | | |
Volkswagen AG, pfd. | | Germany | | 160,254 | | | 5,327,882 |
| | | | | | |
|
|
Metals & Mining .5% | | | | | | | |
Cia Vale do Rio Doce, ADR, pfd., A | | Brazil | | 398,376 | | | 9,712,407 |
| | | | | | |
|
|
Total Preferred Stocks (Cost $8,049,893) | | | | | | | 15,040,289 |
| | | | | | |
|
|
Closed End Mutual Funds (Cost $6,368,163) .6% | | | | | | | |
Diversified Financial Services | | | | | | | |
Rodamco Europe NV | | Netherlands | | 164,000 | | | 12,996,798 |
| | | | | | |
|
|
Total Long Term Investments (Cost $1,308,346,823) | | | | | | | 1,692,951,834 |
| | | | | | |
|
|
Short Term Investment (Cost $270,971,187) 13.8% | | | | | | | |
Money Fund | | | | | | | |
bFranklin Institutional Fiduciary Trust Money Market Portfolio | | United States | | 270,971,187 | | | 270,971,187 |
| | | | | | |
|
|
Total Investments (Cost $1,579,318,010) 99.7% | | | | | | | 1,963,923,021 |
Other Assets, less Liabilities .3% | | | | | | | 5,019,832 |
| | | | | | |
|
|
Net Assets 100.0% | | | | | | $ | 1,968,942,853 |
| | | | | | |
|
|
Portfolio Abbreviations:
ADR - American Depository Receipt
FDR - Foreign Depository Receipt
SDR - Special Drawing Rights
| b | See Note 7 regarding investments in Franklin Institutional Fiduciary Trust Money Market Portfolio. |
See notes to financial statements.
TF-14
FRANKLIN TEMPLETON VARIABLE INSURANCE PRODUCTS TRUST
TEMPLETON FOREIGN SECURITIES FUND
Financial Statements
Statement of Assets and Liabilities
December 31, 2004
| | | | |
Assets: | | | | |
Investments in securities: | | | | |
Cost - Unaffiliated issuers | | $ | 1,308,346,823 | |
Cost - Sweep Money Fund (Note 7) | | | 270,971,187 | |
| | |
|
|
|
Total cost of investments | | $ | 1,579,318,010 | |
| | |
|
|
|
Value - Unaffiliated issuers | | $ | 1,692,951,834 | |
Value - Sweep Money Fund (Note 7) | | | 270,971,187 | |
| | |
|
|
|
Total value of investments | | | 1,963,923,021 | |
| | |
|
|
|
Cash | | | 125,592 | |
Foreign currency, at value (cost $2,260,961) | | | 2,508,300 | |
Receivables: | | | | |
Capital shares sold | | | 2,918,340 | |
Dividends | | | 2,635,413 | |
| | |
|
|
|
Total assets | | | 1,972,110,666 | |
| | |
|
|
|
Liabilities: | | | | |
Payables: | | | | |
Investment securities purchased | | | 214,925 | |
Capital shares redeemed | | | 1,149,737 | |
Affiliates | | | 1,450,921 | |
Deferred tax liability | | | 169,581 | |
Other liabilities | | | 182,649 | |
| | |
|
|
|
Total liabilities | | | 3,167,813 | |
| | |
|
|
|
Net assets, at value | | $ | 1,968,942,853 | |
| | |
|
|
|
Net assets consist of: | | | | |
Undistributed net investment income | | $ | 24,955,358 | |
Net unrealized appreciation (depreciation) | | | 384,828,209 | |
Accumulated net realized gain (loss) | | | (107,874,725 | ) |
Capital shares | | | 1,667,034,011 | |
| | |
|
|
|
Net assets, at value | | $ | 1,968,942,853 | |
| | |
|
|
|
Class 1: | | | | |
Net assets, at value | | $ | 506,456,226 | |
| | |
|
|
|
Shares outstanding | | | 34,854,983 | |
| | |
|
|
|
Net asset value and offering price per share | | $ | 14.53 | |
| | |
|
|
|
Class 2: | | | | |
Net assets, at value | | $ | 1,445,927,955 | |
| | |
|
|
|
Shares outstanding | | | 100,737,385 | |
| | |
|
|
|
Net asset value and offering price per share | | $ | 14.35 | |
| | |
|
|
|
Class 3: | | | | |
Net assets, at value | | $ | 16,558,672 | |
| | |
|
|
|
Shares outstanding | | | 1,154,063 | |
| | |
|
|
|
Net asset value and offering price per sharea | | $ | 14.35 | |
| | |
|
|
|
| a | Redemption price is equal to net asset value less any redemption fees retained by the Fund. |
See notes to financial statements.
TF-15
FRANKLIN TEMPLETON VARIABLE INSURANCE PRODUCTS TRUST
TEMPLETON FOREIGN SECURITIES FUND
Financial Statements (continued)
Statement of Operations
for the year ended December 31, 2004
| | | | |
Investment income: | | | | |
Dividends (net of foreign taxes of $4,492,699) | | | | |
Unaffiliated issuers | | $ | 38,283,254 | |
Sweep Money Fund (Note 7) | | | 2,220,093 | |
| | |
|
|
|
Total investment income | | | 40,503,347 | |
| | |
|
|
|
Expenses: | | | | |
Management fees (Note 3) | | | 9,142,311 | |
Administrative fees (Note 3) | | | 1,668,538 | |
Distribution fees: (Note 3) | | | | |
Class 2 | | | 2,462,864 | |
Class 3 | | | 13,407 | |
Transfer agent fees | | | 24,686 | |
Custodian fees (Note 4) | | | 439,081 | |
Reports to shareholders | | | 458,829 | |
Professional fees | | | 116,933 | |
Trustees’ fees and expenses | | | 8,455 | |
Other | | | 64,649 | |
| | |
|
|
|
Total expenses | | | 14,399,753 | |
Expense reductions (Note 4) | | | (6,810 | ) |
| | |
|
|
|
Net expenses | | | 14,392,943 | |
| | |
|
|
|
Net investment income | | | 26,110,404 | |
| | |
|
|
|
Realized and unrealized gains (losses): | | | | |
Net realized gain (loss) from: | | | | |
Investments | | | 39,230,156 | |
Foreign currency transactions | | | 148,337 | |
| | |
|
|
|
Net realized gain (loss) | | | 39,378,493 | |
| | |
|
|
|
Net change in unrealized appreciation (depreciation) on: | | | | |
Investments | | | 215,075,678 | |
Translation of assets and liabilities denominated in foreign currencies | | | 161,257 | |
Deferred taxes | | | 454,828 | |
| | |
|
|
|
Net change in unrealized appreciation (depreciation) | | | 215,691,763 | |
| | |
|
|
|
Net realized and unrealized gain (loss) | | | 255,070,256 | |
| | |
|
|
|
Net increase (decrease) in net assets resulting from operations | | $ | 281,180,660 | |
| | |
|
|
|
See notes to financial statements.
TF-16
FRANKLIN TEMPLETON VARIABLE INSURANCE PRODUCTS TRUST
TEMPLETON FOREIGN SECURITIES FUND
Financial Statements (continued)
Statements of Changes in Net Assets
for the years ended December 31, 2004 and 2003
| | | | | | | | |
| | | 2004 | | | 2003 | |
| | |
| |
Increase (decrease) in net assets: | | | | | | | | |
Operations: | | | | | | | | |
Net investment income | | $ | 26,110,404 | | | $ | 13,945,725 | |
Net realized gain (loss) from investments and foreign currency transactions | | | 39,378,493 | | | | (31,091,065 | ) |
Net change in unrealized appreciation (depreciation) on investments, translation of assets and
liabilities denominated in foreign currencies and deferred taxes | | | 215,691,763 | | | | 272,127,433 | |
| | |
| |
Net increase (decrease) in net assets resulting from operations | | | 281,180,660 | | | | 254,982,093 | |
Distributions to shareholders from: | | | | | | | | |
Net investment income: | | | | | | | | |
Class 1 | | | (5,478,306 | ) | | | (7,698,069 | ) |
Class 2 | | | (10,189,845 | ) | | | (6,848,227 | ) |
Class 3 | | | (37,708 | ) | | | — | |
| | |
| |
Total distributions to shareholders | | | (15,705,859 | ) | | | (14,546,296 | ) |
Capital share transactions: (Note 2) | | | | | | | | |
Class 1 | | | (43,045,841 | ) | | | (35,694,170 | ) |
Class 2 | | | 605,495,077 | | | | 224,338,382 | |
Class 3 | | | 14,758,051 | | | | — | |
| | |
| |
Total capital share transactions | | | 577,207,287 | | | | 188,644,212 | |
Redemption fees | | | 1,304 | | | | — | |
| | |
| |
Net increase (decrease) in net assets | | | 842,683,392 | | | | 429,080,009 | |
Net assets: | | | | | | | | |
Beginning of year | | | 1,126,259,461 | | | | 697,179,452 | |
| | |
| |
End of year | | $ | 1,968,942,853 | | | $ | 1,126,259,461 | |
| | |
| |
Undistributed net investment income included in net assets: | | | | | | | | |
End of year | | $ | 24,955,358 | | | $ | 13,972,294 | |
| | |
| |
See notes to financial statements.
TF-17
FRANKLIN TEMPLETON VARIABLE INSURANCE PRODUCTS TRUST
TEMPLETON FOREIGN SECURITIES FUND
Notes to Financial Statements
1. ORGANIZATION AND SIGNIFICANT ACCOUNTING POLICIES
Franklin Templeton Variable Insurance Products Trust (the Trust) is registered under the Investment Company Act of 1940 as an open-end investment company, consisting of twenty-one separate series (the Funds). Templeton Foreign Securities Fund (the Fund) included in this report is diversified. The financial statements of the remaining funds in the series are presented separately. Shares of the Fund are sold only to insurance company separate accounts to fund the benefits of variable life insurance policies or variable annuity contracts. The Fund’s investment objective is capital growth.
The following summarizes the Fund’s significant accounting policies.
a. Security Valuation
Securities listed on a securities exchange or on the NASDAQ National Market System are valued at the last quoted sale price or the official closing price of the day, respectively. Over-the-counter securities and listed securities for which there is no reported sale are valued within the range of the most recent quoted bid and ask prices. Securities that trade in multiple markets or on multiple exchanges are valued according to the broadest and most representative market. Investments in open-end mutual funds are valued at the closing net asset value.
Foreign securities are valued as of the close of trading on the foreign stock exchange on which the security is primarily traded, or the NYSE, whichever is earlier. The value is then converted into its U.S. dollar equivalent at the foreign exchange rate in effect at the close of the NYSE on the day that the value of the foreign security is determined. If no sale is reported at that time, the foreign security will be valued within the range of the most recent quoted bid and ask prices.
The Trust has procedures to determine the fair value of individual securities and other assets for which market prices are not readily available or which may not be reliably priced. Some methods for valuing these securities may include: fundamental analysis, matrix pricing, discounts from market prices of similar securities, or discounts applied due to the nature and duration of restrictions on the disposition of the securities. Occasionally, events occur between the time at which trading in a security is completed and the close of the NYSE that might call into question the availability (including the reliability) of the value of a portfolio security held by the Fund. If such an event occurs, the securities may be valued using fair value procedures, which may include the use of independent pricing services. All security valuation procedures are approved by the Trust’s Board of Trustees.
b. Foreign Currency Translation
Portfolio securities and other assets and liabilities denominated in foreign currencies are translated into U.S. dollars based on the exchange rate of such currencies against U.S. dollars on the date of valuation. Purchases and sales of securities, income and expense items denominated in foreign currencies are translated into U.S. dollars at the exchange rate in effect on the transaction date. Occasionally events may impact the availability or reliability of foreign exchange rates used to convert the U.S. dollar equivalent value. If such an event occurs, the foreign exchange rate will be valued at fair value using procedures established and approved by the Trust’s Board of Trustees.
The Fund does not separately report the effect of changes in foreign exchange rates from changes in market prices on securities held. Such changes are included in net realized and unrealized gain or loss from investments on the Statement of Operations.
Realized foreign exchange gains or losses arise from sales of foreign currencies, currency gains or losses realized between the trade and settlement dates on securities transactions and the difference between the recorded amounts of dividends, interest, and foreign withholding taxes and the U.S. dollar equivalent of the amounts actually received or paid. Net unrealized foreign exchange gains and losses arise from changes in foreign exchange rates on foreign denominated assets and liabilities other than investments in securities held at the end of the reporting period.
TF-18
FRANKLIN TEMPLETON VARIABLE INSURANCE PRODUCTS TRUST
TEMPLETON FOREIGN SECURITIES FUND
Notes to Financial Statements (continued)
1. ORGANIZATION AND SIGNIFICANT ACCOUNTING POLICIES (cont.)
c. Foreign Currency Contracts
When the Fund purchases or sells foreign securities it may enter into foreign exchange contracts to minimize foreign exchange risk from the trade date to the settlement date of the transactions. A foreign exchange contract is an agreement between two parties to exchange different currencies at an agreed upon exchange rate on a specified date. Realized and unrealized gains and losses on these contracts are included in the Statement of Operations.
The risks of these contracts include movement in the values of the foreign currencies relative to the U.S. dollar and the possible inability of the counterparties to fulfill their obligations under the contracts.
d. Income and Deferred Taxes
No provision has been made for U.S. income taxes because the Fund’s policy is to qualify as a regulated investment company under Sub Chapter M of the Internal Revenue Code and to distribute substantially all of its taxable income. Fund distributions to shareholders are determined on an income tax basis and may differ from net investment income and realized gains for financial reporting purposes.
The Fund is subject to a tax imposed on net realized gains of securities of certain foreign countries. The Fund records an estimated deferred tax liability for net unrealized gains on these securities as reflected in the accompanying financial statements.
e. Security Transactions, Investment Income, Expenses and Distributions
Security transactions are accounted for on trade date. Realized gains and losses on security transactions are determined on a specific identification basis. Interest income and estimated expenses are accrued daily. Dividend income and distributions to shareholders are recorded on the ex-dividend date.
Common expenses incurred by the Trust are allocated among the funds based on the ratio of net assets of each fund to the combined net assets. Other expenses are charged to each fund on a specific identification basis.
Realized and unrealized gains and losses and net investment income, other than class specific expenses, are allocated daily to each class of shares based upon the relative proportion of net assets of each class.
f. Accounting Estimates
The preparation of financial statements in accordance with accounting principles generally accepted in the United States of America requires management to make estimates and assumptions that affect the reported amounts of assets and liabilities at the date of the financial statements and the amounts of income and expenses during the reporting period. Actual results could differ from those estimates.
g. Redemption Fees
Redemptions and exchanges of Class 3 shares held 60 days or less may be subject to the Fund’s redemption fee, which is 1% of the amount redeemed. Such fees are retained by the Fund and accounted for as additional paid-in capital as noted in the Statements of Changes in Net Assets.
h. Guarantees and Indemnifications
Under the Trust’s organizational documents, its officers and trustees are indemnified by the Trust against certain liability arising out of the performance of their duties to the Trust. Additionally, in the normal course of business, the Trust enters into contracts
TF-19
FRANKLIN TEMPLETON VARIABLE INSURANCE PRODUCTS TRUST
TEMPLETON FOREIGN SECURITIES FUND
Notes to Financial Statements (continued)
1. ORGANIZATION AND SIGNIFICANT ACCOUNTING POLICIES (cont.)
h. Guarantees and Indemnifications (cont.)
with service providers that contain general indemnification clauses. The Trust’s maximum exposure under these arrangements is unknown as this would involve future claims that may be made against the Trust that have not yet occurred. However, based on experience, the Trust expects the risk of loss to be remote.
2. SHARES OF BENEFICIAL INTEREST
The Fund offers three classes of shares: Class 1, Class 2, and Class 3. Effective May 1, 2004 the Fund began offering a new class of shares, Class 3. Each class of shares differs by its distribution fees, voting rights on matters affecting a single class and its exchange privilege.
At December 31, 2004, there were an unlimited number of shares authorized ($.01 par value). Transactions in the Fund’s shares were as follows:
| | | | | | | | | | | | | | |
| | | Year Ended December 31,
| |
| | | 2004
| | | 2003
| |
| Class 1 Shares: | | Shares
| | | Amount
| | | Shares
| | | Amount
| |
Shares sold | | 2,258,527 | | | $ | 29,175,787 | | | 4,070,068 | | | $ | 41,441,600 | |
Shares issued in reinvestment of distributions | | 437,215 | | | | 5,478,306 | | | 745,937 | | | | 7,698,069 | |
Shares redeemed | | (6,039,270 | ) | | | (77,699,934 | ) | | (8,386,415 | ) | | | (84,833,839 | ) |
| | |
| |
Net increase (decrease) | | (3,343,528 | ) | | $ | (43,045,841 | ) | | (3,570,410 | ) | | $ | (35,694,170 | ) |
| | |
| |
| Class 2 Shares: | | | | | | | | | | | | |
Shares sold | | 59,591,849 | | | $ | 761,455,379 | | | 77,265,095 | | | $ | 769,052,246 | |
Shares issued in reinvestment of distributions | | 821,762 | | | | 10,189,845 | | | 669,785 | | | | 6,848,227 | |
Shares redeemed | | (13,067,398 | ) | | | (166,150,147 | ) | | (56,376,439 | ) | | | (551,562,091 | ) |
| | |
| |
Net increase (decrease) | | 47,346,213 | | | $ | 605,495,077 | | | 21,558,441 | | | $ | 224,338,382 | |
| | |
| |
| Class 3 Shares:a | | | | | | | | | | | | |
Shares sold | | 1,203,190 | | | $ | 15,372,770 | | | | | | | | |
Shares issued in reinvestment of distributions | | 3,035 | | | | 37,599 | | | | | | | | |
Shares redeemed | | (52,162 | ) | | | (652,318 | ) | | | | | | | |
| | |
| | | | | | | |
Net increase (decrease) | | 1,154,063 | | | $ | 14,758,051 | | | | | | | | |
| | |
| | | | | | | |
| a | For the period May 1, 2004 (effective date) to December 31, 2004. |
3. TRANSACTIONS WITH AFFILIATES
Certain officers and trustees of the Fund are also officers and/or directors of the following entities:
| | |
| Entity | | Affiliation |
Templeton Investment Counsel LLC (TIC) | | Investment manager |
Franklin Templeton Services LLC (FT Services) | | Administrative manager |
Franklin Templeton Distributors Inc. (Distributors) | | Principal underwriter |
Franklin Templeton Investor Services LLC (Investor Services) | | Transfer agent |
TF-20
FRANKLIN TEMPLETON VARIABLE INSURANCE PRODUCTS TRUST
TEMPLETON FOREIGN SECURITIES FUND
Notes to Financial Statements (continued)
3. TRANSACTIONS WITH AFFILIATES (cont.)
a. Management Fees
The Fund pays an investment management fee to TIC based on the average daily net assets of the Fund as follows:
| | |
| Annualized Fee Rate | | Net Assets |
| .750% | | First $200 million |
| .675% | | Over $200 million, up to and including $1.3 billion |
| .600% | | Over $1.3 billion |
b. Administrative Fees
The Fund pays an administrative fee to FT Services based on the average daily net assets of the Fund as follows:
| | |
| Annualized Fee Rate | | Net Assets |
| .150% | | First $200 million |
| .135% | | Over $200 million, up to and including $700 million |
| .100% | | Over $700 million, up to and including $1.2 billion |
| .075% | | Over $1.2 billion |
c. Distribution Fees
The Fund reimburses Distributors up to .25% per year of its average daily net asset of Class 2 and Class 3, for costs incurred in marketing the Fund’s shares under a Rule 12b-1 plan.
d. Transfer Agent Fees
Investor Services, under terms of an agreement, performs shareholder servicing for the Fund and is not paid by the Fund for the services.
4. EXPENSE OFFSET ARRANGEMENT
The Fund has entered into an arrangement with its custodian whereby credits realized as a result of uninvested cash balances are used to reduce a portion of the Fund’s custodian expenses. During the year ended December 31, 2004, the custodian fees were reduced as noted in the Statement of Operations.
5. INCOME TAXES
At December 31, 2004, the Fund had tax basis capital losses which may be carried over to offset future capital gains. Such losses expire as follows:
| | | |
Capital loss carryovers expiring in: | | | |
2010 | | $ | 41,357,645 |
2011 | | | 66,483,700 |
| | |
|
|
| | | $ | 107,841,345 |
| | |
|
At December 31, 2004, the Fund had deferred currency losses occurring subsequent to October 31, 2004 of $33,378. For tax purposes, such losses will be reflected in the year ending December 31, 2005.
TF-21
FRANKLIN TEMPLETON VARIABLE INSURANCE PRODUCTS TRUST
TEMPLETON FOREIGN SECURITIES FUND
Notes to Financial Statements (continued)
5. INCOME TAXES (cont.)
The tax character of distributions paid during the years ended December 31, 2004 and 2003, was as follows:
| | | | | | |
| | | 2004
| | 2003
|
Distributions paid from ordinary income | | $ | 15,705,859 | | $ | 14,546,296 |
| | |
|
Net investment income (loss) and realized gains (losses) differ for financial statement and tax purposes primarily due to differing treatments of foreign currency transactions and passive foreign investment company shares.
At December 31, 2004, the cost of investments, net unrealized appreciation (depreciation), and undistributed ordinary income for income tax purposes were as follows:
| | | | |
Cost of investments | | $ | 1,579,318,010 | |
| | |
|
|
|
Unrealized appreciation | | $ | 414,603,997 | |
Unrealized depreciation | | | (29,998,986 | ) |
| | |
|
|
|
Net unrealized appreciation (depreciation) | | $ | 384,605,011 | |
| | |
|
|
|
Distributable earnings – undistributed ordinary income | | $ | 24,955,154 | |
| | |
| |
6. INVESTMENT TRANSACTIONS
Purchases and sales of investments (excluding short-term securities) for the year ended December 31, 2004, aggregated $631,313,598 and $136,544,183, respectively.
7. INVESTMENTS IN FRANKLIN INSTITUTIONAL FIDUCIARY TRUST MONEY MARKET PORTFOLIO
The Fund may invest in the Franklin Institutional Fiduciary Trust Money Market Portfolio (the Sweep Money Fund), an open-end investment company managed by Franklin Advisers Inc. (an affiliate of the investment manager). Management fees paid by the Fund are reduced on assets invested in the Sweep Money Fund, in an amount not to exceed the management fees paid by the Sweep Money Fund.
8. REGULATORY MATTERS
Investigations
As part of various investigations by a number of federal, state, and foreign regulators and governmental entities, including the Securities and Exchange Commission (“SEC”), the California Attorney General’s Office (“CAGO”), and the National Association of Securities Dealers, Inc. (“NASD”), relating to certain practices in the mutual fund industry, including late trading, market timing and marketing support payments to securities dealers who sell fund shares, Franklin Resources, Inc. and certain of its subsidiaries (as used in this section, together, the “Company”), as well as certain current or former executives and employees of the Company, received subpoenas and/or requests for documents, information and/or testimony. The Company and its current employees provided documents and information in response to those requests and subpoenas.
Settlements
Beginning in August 2004, the Company entered into settlements with certain regulators investigating the mutual fund industry practices noted above. The Company believes that settlement of each of the matters described in this section is in the best interest of the Company and shareholders of the Franklin, Templeton, and Mutual Series mutual funds (the “funds”).
TF-22
FRANKLIN TEMPLETON VARIABLE INSURANCE PRODUCTS TRUST
TEMPLETON FOREIGN SECURITIES FUND
Notes to Financial Statements (continued)
8. REGULATORY MATTERS (cont.)
Settlements (cont.)
On August 2, 2004, Franklin Resources, Inc. announced that its subsidiary, Franklin Advisers, Inc., reached an agreement with the SEC that resolved the issues resulting from the SEC investigation into market timing activity. In connection with that agreement, the SEC issued an “Order Instituting Administrative and Cease-and-Desist Proceedings Pursuant to Sections 203(e) and 203(k) of the Investment Advisers Act of 1940 and Sections 9(b) and 9(f) of the Investment Company Act of 1940, Making Findings and Imposing Remedial Sanctions and a Cease-and-Desist Order” (the “Order”). The SEC’s Order concerned the activities of a limited number of third parties that ended in 2000 and those that were the subject of the first Massachusetts administrative complaint described below.
Under the terms of the SEC’s Order, pursuant to which Franklin Advisers, Inc. neither admitted nor denied any of the findings contained therein, Franklin Advisers, Inc. agreed to pay $50 million, of which $20 million is a civil penalty, to be distributed to shareholders of certain funds in accordance with a plan to be developed by an independent distribution consultant. At this time, it is unclear which funds or which shareholders of any particular fund will receive distributions. The Order also required Franklin Advisers, Inc. to, among other things, enhance and periodically review compliance policies and procedures.
On September 20, 2004, Franklin Resources, Inc. announced that two of its subsidiaries, Franklin Advisers, Inc. and Franklin Templeton Alternative Strategies, Inc. (“FTAS”), reached an agreement with the Securities Division of the Office of the Secretary of the Commonwealth of Massachusetts (the “State of Massachusetts”) related to its administrative complaint filed on February 4, 2004, concerning one instance of market timing that was also a subject of the August 2, 2004 settlement that Franklin Advisers, Inc. reached with the SEC, as described above.
Under the terms of the settlement consent order issued by the State of Massachusetts, Franklin Advisers, Inc. and FTAS consented to the entry of a cease-and-desist order and agreed to pay a $5 million administrative fine to the State of Massachusetts (the “Massachusetts Consent Order”). The Massachusetts Consent Order included two different sections: “Statements of Fact” and “Violations of Massachusetts Securities Laws.” Franklin Advisers, Inc. and FTAS admitted the facts in the Statements of Fact.
On October 25, 2004, the State of Massachusetts filed a second administrative complaint, alleging that Franklin Resources, Inc.’s Form 8-K filing (in which it described the Massachusetts Consent Order and stated that “Franklin did not admit or deny engaging in any wrongdoing”) failed to state that Franklin Advisers, Inc. and FTAS admitted the Statements of Fact portion of the Massachusetts Consent Order (the “Second Complaint”). Franklin Resources, Inc. reached a second agreement with the State of Massachusetts on November 19, 2004, resolving the Second Complaint. As a result of the November 19, 2004 settlement, Franklin Resources, Inc. filed a new Form 8-K. The terms of the Massachusetts Consent Order did not change and there was no monetary fine associated with this second settlement.
On November 17, 2004, Franklin Resources, Inc. announced that Franklin/Templeton Distributors, Inc. (“FTDI”) reached an agreement with the CAGO, resolving the issues resulting from the CAGO’s investigation concerning sales and marketing support payments. Under the terms of the settlement, FTDI neither admitted nor denied the allegations in the CAGO’s complaint and agreed to pay $2 million to the State of California as a civil penalty, $14 million to the funds, to be allocated by an independent distribution consultant to be paid for by FTDI, and $2 million to the CAGO for its investigative costs.
On December 13, 2004, Franklin Resources, Inc. announced that its subsidiaries FTDI and Franklin Advisers, Inc. reached an agreement with the SEC, resolving the issues resulting from the SEC’s investigation concerning marketing support payments to securities dealers who sell fund shares. In connection with that agreement, the SEC issued an “Order Instituting Administrative and Cease-and-Desist Proceedings, Making Findings, and Imposing Remedial Sanctions Pursuant to Sections 203(e) and 203(k) of the Investment Advisers Act of 1940, Sections 9(b) and 9(f) of the Investment Company Act of 1940, and Section 15(b) of the Securities Exchange Act of 1934” (the “Second Order”).
TF-23
FRANKLIN TEMPLETON VARIABLE INSURANCE PRODUCTS TRUST
TEMPLETON FOREIGN SECURITIES FUND
Notes to Financial Statements (continued)
8. REGULATORY MATTERS (cont.)
Settlements (cont.)
Under the terms of the Second Order, in which FTDI and Franklin Advisers, Inc. neither admitted nor denied the findings contained therein, they agreed to pay the funds a penalty of $20 million and disgorgement of $1 (one dollar). FTDI and Franklin Advisers, Inc. also agreed to implement certain measures and undertakings relating to marketing support payments to broker-dealers for the promotion or sale of fund shares, including making additional disclosures in the funds’ Prospectuses and Statements of Additional Information. The Second Order further requires the appointment of an independent distribution consultant, at the Company’s expense, who shall develop a plan for the distribution of the penalty and disgorgement to the funds.
Other Legal Proceedings
The Trust, in addition to the Company and other funds, and certain current and former officers, employees, and directors have been named in multiple lawsuits in different federal courts in Nevada, California, Illinois, New York and Florida, alleging violations of various federal securities laws and seeking, among other relief, monetary damages, restitution, removal of fund trustees, directors, advisers, administrators, and distributors, rescission of management contracts and 12b-1 Plans, and/or attorneys’ fees and costs. Specifically, the lawsuits claim breach of duty with respect to alleged arrangements to permit market timing and/or late trading activity, or breach of duty with respect to the valuation of the portfolio securities of certain Templeton funds managed by Franklin Resources, Inc. subsidiaries, resulting in alleged market timing activity. The majority of these lawsuits duplicate, in whole or in part, the allegations asserted in the February 4, 2004 Massachusetts administrative complaint and the findings in the SEC’s August 2, 2004 Order, as described above. The lawsuits are styled as class actions, or derivative actions on behalf of either the named funds or Franklin Resources, Inc.
In addition, the Company, as well as certain current and former officers, employees, and directors, have been named in multiple lawsuits alleging violations of various securities laws and pendent state law claims relating to the disclosure of directed brokerage payments and/or payment of allegedly excessive advisory, commission, and distribution fees, and seeking, among other relief, monetary damages, restitution, rescission of advisory contracts, including recovery of all fees paid pursuant to those contracts, an accounting of all monies paid to the named advisers, declaratory relief, injunctive relief, and/or attorneys’ fees and costs. These lawsuits are styled as class actions or derivative actions brought on behalf of certain funds.
The Company and fund management strongly believes that the claims made in each of the lawsuits identified above are without merit and intends to vigorously defend against them. The Company cannot predict with certainty, however, the eventual outcome of the remaining governmental investigations or private lawsuits, nor whether they will have a material negative impact on the Company. Public trust and confidence are critical to the Company’s business and any material loss of investor and/or client confidence could result in a significant decline in assets under management by the Company, which would have an adverse effect on the Company’s future financial results. If the Company finds that it bears responsibility for any unlawful or inappropriate conduct that caused losses to the Trust, it is committed to making the Trust or its shareholders whole, as appropriate. The Company is committed to taking all appropriate actions to protect the interests of its funds’ shareholders.
TF-24
FRANKLIN TEMPLETON VARIABLE INSURANCE PRODUCTS TRUST
TEMPLETON FOREIGN SECURITIES FUND
Report of Independent Registered Public Accounting Firm
To the Trustees and Shareholders of
Franklin Templeton Variable Insurance Products Trust
In our opinion, the accompanying statement of assets and liabilities, including the statement of investments, and the related statements of operations and of changes in net assets and the financial highlights present fairly, in all material respects, the financial position of Templeton Foreign Securities Fund (the Fund) (one of the funds constituting Franklin Templeton Variable Insurance Products Trust) at December 31, 2004, the results of its operations for the year then ended, the changes in its net assets for each of the two years in the period then ended and the financial highlights for each of the periods presented, in conformity with accounting principles generally accepted in the United States of America. These financial statements and financial highlights (hereafter referred to as “financial statements”) are the responsibility of the Fund’s management; our responsibility is to express an opinion on these financial statements based on our audits. We conducted our audits of these financial statements in accordance with the standards of the Public Company Accounting Oversight Board (United States). Those standards require that we plan and perform the audits to obtain reasonable assurance about whether the financial statements are free of material misstatement. An audit includes examining, on a test basis, evidence supporting the amounts and disclosures in the financial statements, assessing the accounting principles used and significant estimates made by management, and evaluating the overall financial statement presentation. We believe that our audits, which included confirmation of securities at December 31, 2004 by correspondence with the custodian and brokers, provide a reasonable basis for our opinion.
PricewaterhouseCoopers LLP
San Francisco, California
February 9, 2005
TF-25
FRANKLIN TEMPLETON VARIABLE INSURANCE PRODUCTS TRUST
TEMPLETON FOREIGN SECURITIES FUND
Tax Designation (unaudited)
At December 31, 2004, more than 50% of the Fund’s total assets were invested in securities of foreign issuers. In most instances, foreign taxes were withheld from dividends paid to the Fund on these investments. The Fund elects to treat foreign taxes paid under Section 853 of the Internal Revenue Code. This election will allow shareholders of record in June 2005, to treat their proportionate share of foreign taxes paid by the Fund as having been paid directly by them. The shareholder shall consider these amounts as foreign taxes paid in the tax year in which they receive the Fund distribution.
The foreign tax information will be disclosed in the June 2005, semi-annual report of the Fund.
TF-26
INDEX DESCRIPTIONS
The indexes are unmanaged and include reinvested distributions.
Consumer Price Index (CPI), calculated by the U.S. Bureau of Labor Statistics, is a commonly used measure of the inflation rate.
Credit Suisse First Boston (CSFB) High Yield Index is designed to mirror the investible universe of the U.S. dollar-denominated high yield debt market.
Dow Jones Industrial Average (the Dow) is price weighted based on the average market price of 30 blue chip stocks of companies that are generally industry leaders.
Dow Jones Wilshire Real Estate Securities Index is a broad measure of the performance of publicly traded real estate securities, such as real estate investment trusts and real estate operating companies. The index is capitalization weighted and rebalanced monthly, and returns are calculated on a buy-and-hold basis.
J.P. Morgan (JPM) Emerging Markets Bond Index Global (EMBIG) tracks total returns for U.S. dollar-denominated debt instruments issued by emerging market sovereign and quasi-sovereign entities: Brady bonds, loans and Eurobonds.
J.P. Morgan (JPM) Euro Emerging Markets Bond Index Global (EMBIG) tracks total returns for euro-denominated straight fixed coupon instruments issued by emerging market sovereign and quasi-sovereign entities.
J.P. Morgan (JPM) Government Bond Index (GBI) Global tracks total returns of government bonds in developed countries globally. The bonds included in the index are weighted according to their market capitalization. The index is unhedged and expressed in terms of $US.
Lehman Brothers U.S. Aggregate Index represents securities that are SEC-registered, taxable and dollar denominated. The index covers the U.S. investment grade fixed-rate bond market, with index components for government and corporate securities, mortgage pass-through securities and asset-backed securities. All issues included must have at least one year to final maturity and must be rated investment grade (Baa3 or better) by Moody’s Investors Service. They must be publicly issued, fixed rate, and have at least par amount outstanding. They must also be dollar denominated and non-convertible. Total return includes price appreciation/depreciation and income as a percentage of the original investment. The index is rebalanced monthly by market capitalization.
Lehman Brothers U.S. Intermediate Government Bond Index includes securities issued by the U.S. Treasury or agency. These include public obligations of the U.S. Treasury with remaining maturity of one year or more and publicly issued debt of U.S. governmental agencies, quasi-federal corporations, and corporate or foreign debt. All issues included must have one to ten years to final maturity and must be rated investment grade (Baa3 or better) by Moody’s Investors Service. They must also be dollar-denominated and non-convertible. Total return includes price appreciation/depreciation and income as a percentage of the original investment. The index is rebalanced monthly by market capitalization.
I-1
Lipper Multi-Sector Income Funds Objective Average is calculated by averaging the total returns of all funds within the Lipper Multi-Sector Income Funds classification in the Lipper Open-End underlying funds universe. Lipper Multi-Sector Income Funds are defined as funds that seek current income by allocating assets among different fixed income securities sectors (not primarily in one sector except for defensive purposes), including U.S. and foreign governments, with a significant portion rated below investment grade. For the one-year period ended 12/31/04, there were 112 funds in this category. Lipper calculations do not include sales charges, but include reinvestment of any income and distributions. Fund performance relative to the average may have differed if these and other factors had been considered.
Lipper VIP Equity Income Funds Objective Average is an equally weighted average calculation of performance figures for all funds within the Lipper Equity Income Funds classification in the Lipper VIP underlying funds universe. Lipper Equity Income Funds are defined as funds that seek relatively high current income and growth of income through investing at least 60% of their portfolio in equity securities. For the one-year period ended 12/31/04, there were 61 funds in this category. Lipper calculations do not include contract fees, expenses or sales charges, and may have been different if such charges had been considered.
Lipper VIP General U.S. Government Funds Objective Average is an equally weighted average calculation of performance figures for all funds within the Lipper U.S. Government Funds classification in the Lipper VIP underlying funds universe. Lipper U.S. Government Funds are defined as funds that invest primarily in U.S. government and Agency issues. For the one-year period ended 12/31/04, there were 56 funds in this category. Lipper calculations do not include contract fees, expenses or sales charges, and may have been different if such charges had been considered.
Lipper VIP Income Funds Objective Average is an equally weighted average calculation of performance figures for all funds within the Lipper Income Funds classification in the Lipper VIP underlying funds universe. Lipper Income Funds seek a high level of current income by investing in income-producing stocks, bonds and money market instruments. For the one-year period ended 12/31/04, there were 18 funds in this category. Lipper calculations do not include contract fees, expenses or sales charges, and may have been different if such charges had been considered.
Merrill Lynch 2-, 5- and 10-Year Zero Coupon Bond Indexes include zero coupon bonds that pay no interest and are issued at a discount from redemption price.
Merrill Lynch U.S. Treasury Strips 1-Year Index consists of U.S. Treasury debt that has been issued in stripped form that is captured in the Merrill Lynch U.S. Broad Market Index. The index is composed of a single synthetic security rolled daily to achieve a 1-year constant maturity.
Morgan Stanley Capital International (MSCI) All Country (AC) World Index is a free float-adjusted, market capitalization-weighted index designed to measure equity market performance in global developed and emerging markets.
Morgan Stanley Capital International (MSCI) Emerging Markets (EM) Index is a free float-adjusted, market capitalization-weighted index designed to measure equity market performance in global emerging markets.
I-2
Morgan Stanley Capital International (MSCI) Europe Australasia Far East (EAFE) Index is a free float-adjusted, market capitalization-weighted index designed to measure equity market performance in global developed markets excluding the U.S. and Canada.
Morgan Stanley Capital International (MSCI) World Index is a free float-adjusted, market capitalization-weighted index designed to measure equity performance in global developed markets.
National Association of Securities Dealers Automated Quotations (NASDAQ) Composite Index measures all domestic and international common stocks listed on The NASDAQ Stock Market. The index is market value weighted and includes over 3,000 companies.
Russell 1000 Growth Index is market capitalization weighted and measures performance of those Russell 1000 Index companies with higher price-to-book ratios and higher forecasted growth values.
Russell 1000 Index is market capitalization weighted and measures performance of the 1,000 largest companies in the Russell 3000 Index, which represent approximately 92% of total market capitalization of the Russell 3000 Index.
Russell 1000 Value Index is market capitalization weighted and measures performance of those Russell 1000 Index companies with lower price-to-book ratios and lower forecasted growth values.
Russell 2000 Index is market capitalization weighted and measures performance of the 2,000 smallest companies in the Russell 3000 Index, which represent approximately 8% of total market capitalization of the Russell 3000 Index.
Russell 2000 Value Index is market capitalization weighted and measures performance of those Russell 2000 Index companies with lower price-to-book ratios and lower forecasted growth values.
Russell 2500 Growth Index is market capitalization weighted and measures performance of those Russell 2500 Index companies with higher price-to-book ratios and higher forecasted growth values.
Russell Midcap Value Index is market capitalization weighted and measures performance of those Russell Midcap Index companies with lower price-to-book ratios and lower forecasted growth values.
Standard & Poor’s 500 Composite Index (S&P 500) consists of 500 stocks chosen for market size, liquidity and industry group representation. Each stock’s weight in the index is proportionate to its market value. The S&P 500 is one of the most widely used benchmarks of U.S. equity performance.
Standard & Poor’s/International Finance Corporation Investable (S&P/IFCI) Composite Index is a market capitalization-weighted index designed to measure the performance of emerging market stocks. It tracks approximately 2,000 securities such as Brazil, Mexico, China and South Korea. Performance represents total return in $US.
I-3
Board Members and Officers
The name, age and address of the officers and board members, as well as their affiliations, positions held with the Trust, principal occupations during the past five years and number of portfolios overseen in the Franklin Templeton Investments fund complex are shown below. Each board member will serve until that person’s successor is elected and qualified.
Independent Board Members
| | | | | | | | |
| Name, Age and Address | | Position | | Length of
Time Served | | Number of
Portfolios in Fund
Complex Overseen
by Board Member* | | Other Directorships Held |
FRANK H. ABBOTT, III (83) One Franklin Parkway San Mateo, CA 94403-1906 | | Trustee | | Since 1988 | | 113 | | None |
|
Principal Occupation During Past 5 Years: President and Director, Abbott Corporation (an investment company). |
HARRIS J. ASHTON (72) One Franklin Parkway San Mateo, CA 94403-1906 | | Trustee | | Since 1988 | | 142 | | Director, Bar-S Foods (meat packing company). |
|
Principal Occupation During Past 5 Years: Director of various companies; and formerly, Director, RBC Holdings, Inc. (bank holding company) (until 2002); and President, Chief Executive Officer and Chairman of the Board, General Host Corporation (nursery and craft centers) (until 1998). |
ROBERT F. CARLSON (76) One Franklin Parkway San Mateo, CA 94403-1906 | | Trustee | | Since 1998 | | 49 | | None |
|
Principal Occupation During Past 5 Years: Senior Member and past President, Board of Administration, California Public Employees Retirement Systems (CALPERS); and formerly, member and Chairman of the Board, Sutter Community Hospitals; member, Corporate Board, Blue Shield of California; and Chief Counsel, California Department of Transportation. |
S. JOSEPH FORTUNATO (72) One Franklin Parkway San Mateo, CA 94403-1906 | | Trustee | | Since 1995 | | 143 | | None |
|
Principal Occupation During Past 5 Years: Attorney; and formerly, member of the law firm of Pitney, Hardin, Kipp & Szuch (until 2002) (Consultant (2003)). |
FRANK W.T. LAHAYE (75) One Franklin Parkway San Mateo, CA 94403-1906 | | Trustee | | Since 1988 | | 115 | | Director, The California Center for Land Recycling (redevelopment). |
|
Principal Occupation During Past 5 Years: General Partner, Las Olas L.P. (Asset Management); and formerly, Chairman, Peregrine Venture Management Company (venture capital). |
GORDON S. MACKLIN (76) One Franklin Parkway San Mateo, CA 94403-1906 | | Trustee | | Since 1995 | | 142 | | Director, Martek Biosciences Corporation; MedImmune, Inc. (biotechnology); and Overstock.com (Internet services); and formerly, Director, MCI Communication Corporation (subsequently known as MCI WorldCom, Inc. and WorldCom, Inc.) (communications services) (1988-2002), White Mountains Insurance Group Ltd. (holding company) (1987-2004) and Spacehab, Inc. (aerospace services) (1994-2003). |
|
Principal Occupation During Past 5 Years: Director of various companies; and formerly, Deputy Chairman, White Mountains Insurance Group, Ltd. (holding company) (2001-2004); Chairman, White River Corporation (financial services) (1993-1998) and Hambrecht & Quist Group (investment banking) (1987-1992); and President, National Association of Securities Dealers, Inc. (1970-1987). |
BOD-1
Interested Board Members and Officers
| | | | | | | | |
| Name, Age and Address | | Position | | Length of
Time Served | | Number of
Portfolios in Fund
Complex Overseen
by Board Member* | | Other Directorships Held |
**CHARLES B. JOHNSON (71) One Franklin Parkway San Mateo, CA 94403-1906 | | Trustee and Chairman of the Board | | Since 1988 | | 142 | | None |
|
Principal Occupation During Past 5 Years: Chairman of the Board, Member—Office of the Chairman and Director, Franklin Resources, Inc.; Vice President, Franklin Templeton Distributors, Inc.; Director, Fiduciary Trust Company International; and officer and/or director or trustee, as the case may be, of some of the other subsidiaries of Franklin Resources, Inc. and of 46 of the investment companies in Franklin Templeton Investments. |
**RUPERT H. JOHNSON, Jr. (64) One Franklin Parkway San Mateo, CA 94403-1906 | | Trustee,
President and
Chief Executive Officer—
Investment Management | | Trustee since 1988 and President and Chief Executive Officer—Investment Management since 2002 | | 125 | | None |
|
Principal Occupation During Past 5 Years: Vice Chairman, Member—Office of the Chairman and Director, Franklin Resources, Inc.; Vice President and Director, Franklin Templeton Distributors, Inc.; Director, Franklin Advisers, Inc. and Franklin Investment Advisory Services, Inc.; Senior Vice President, Franklin Advisory Services, LLC; and officer and/or director or trustee, as the case may be, of some of the other subsidiaries of Franklin Resources, Inc. and of 49 of the investment companies in Franklin Templeton Investments. |
HARMON E. BURNS (59) One Franklin Parkway San Mateo, CA 94403-1906 | | Vice President | | Since 1988 | | Not
Applicable | | Not Applicable |
|
Principal Occupation During Past 5 Years: Vice Chairman, Member—Office of the Chairman and Director, Franklin Resources, Inc.; Vice President and Director, Franklin Templeton Distributors, Inc.; Executive Vice President, Franklin Advisers, Inc.; Director, Franklin Investment Advisory Services, Inc.; and officer and/or director or trustee, as the case may be, of some of the other subsidiaries of Franklin Resources, Inc. and of 49 of the investment companies in Franklin Templeton Investments. |
JAMES M. DAVIS (52) One Franklin Parkway San Mateo, CA 94403-1906 | | Chief Compliance Officer | | Since July 2004 | | Not
Applicable | | Not Applicable |
|
Principal Occupation During Past 5 Years: Officer of 51 of the investment companies in Franklin Templeton Investments; Director, Global Compliance, Franklin Resources, Inc.; and formerly, Director of Compliance, Franklin Resources, Inc. (1994-2001). |
LAURA FERGERSON (42) One Franklin Parkway San Mateo, CA 94403-1906 | | Treasurer | | Since July 2004 | | Not
Applicable | | Not Applicable |
|
Principal Occupation During Past 5 Years: Officer of 34 of the investment companies in Franklin Templeton Investments; and formerly, Director and member of Audit and Valuation Committees, Runkel Funds, Inc. (2003-2004); Assistant Treasurer of most of the investment companies in Franklin Templeton Investments (1997-2003); and Vice President, Franklin Templeton Services, LLC (1997-2003). |
BOD-2
| | | | | | | | |
| Name, Age and Address | | Position | | Length of
Time Served | | Number of
Portfolios in Fund
Complex Overseen
by Board Member* | | Other Directorships Held |
MARTIN L. FLANAGAN (44) One Franklin Parkway San Mateo, CA 94403-1906 | | Vice President | | Since 1995 | | Not
Applicable | | Not Applicable |
|
Principal Occupation During Past 5 Years: Co-President and Chief Executive Officer, Franklin Resources, Inc.; Senior Vice President and Chief Financial Officer, Franklin Mutual Advisers, LLC; Executive Vice President, Chief Financial Officer and Director, Templeton Worldwide, Inc.; Executive Vice President and Chief Operating Officer, Templeton Investment Counsel, LLC; President and Director, Franklin Advisers, Inc.; Executive Vice President, Franklin Investment Advisory Services, Inc. and Franklin Templeton Investor Services, LLC; Chief Financial Officer, Franklin Advisory Services, LLC; Chairman, Franklin Templeton Services, LLC; and officer and/or director or trustee, as the case may be, of some of the other subsidiaries of Franklin Resources, Inc. and of 49 of the investment companies in Franklin Templeton Investments. |
JIMMY D. GAMBILL (57) 500 East Broward Blvd. Suite 2100
Fort Lauderdale,
FL 33394-3091 | | Senior Vice President and Chief
Executive Officer—Finance and Administration | | Since 2002 | | Not
Applicable | | Not Applicable |
|
Principal Occupation During Past 5 Years: President, Franklin Templeton Services, LLC; Senior Vice President, Templeton Worldwide, Inc.; and officer of 51 of the investment companies in Franklin Templeton Investments. |
DAVID P. GOSS (57) One Franklin Parkway San Mateo, CA 94403-1906 | | Vice President | | Since 2000 | | Not
Applicable | | Not Applicable |
|
Principal Occupation During Past 5 Years: Senior Associate General Counsel, Franklin Resources, Inc.; officer and director of one of the subsidiaries of Franklin Resources, Inc.; officer of 51 of the investment companies in Franklin Templeton Investments; and formerly, President, Chief Executive Officer and Director, Property Resources Equity Trust (until 1999) and Franklin Select Realty Trust (until 2000). |
BARBARA J. GREEN (57) One Franklin Parkway San Mateo, CA 94403-1906 | | Vice President | | Since 2000 | | Not
Applicable | | Not Applicable |
|
Principal Occupation During Past 5 Years: Vice President, Deputy General Counsel and Secretary, Franklin Resources, Inc.; Secretary and Senior Vice President, Templeton Worldwide, Inc.; Secretary, Franklin Advisers, Inc., Franklin Advisory Services, LLC, Franklin Investment Advisory Services, Inc., Franklin Mutual Advisers, LLC, Franklin Templeton Alternative Strategies, Inc., Franklin Templeton Investor Services, LLC, Franklin Templeton Services, LLC, Franklin Templeton Distributors, Inc., Templeton Investment Counsel, LLC, and Templeton/Franklin Investment Services, Inc.; and officer of some of the other subsidiaries of Franklin Resources, Inc. and of 51 of the investment companies in Franklin Templeton Investments; and formerly, Deputy Director, Division of Investment Management, Executive Assistant and Senior Advisor to the Chairman, Counselor to the Chairman, Special Counsel and Attorney Fellow, U.S. Securities and Exchange Commission (1986-1995); Attorney, Rogers & Wells (until 1986); and Judicial Clerk, U.S. District Court (District of Massachusetts) (until 1979). |
MICHAEL O. MAGDOL (67) 600 Fifth Avenue Rockefeller Center New York, NY 10048-0772 | | Vice President— AML Compliance | | Since 2002 | | Not
Applicable | | Not Applicable |
|
Principal Occupation During Past 5 Years: Vice Chairman, Chief Banking Officer and Director, Fiduciary Trust Company International; Director, FTI Banque, Arch Chemicals, Inc. and Lingnan Foundation; and officer and/or director, as the case may be, of some of the other subsidiaries of Franklin Resources, Inc. and of 48 of the investment companies in Franklin Templeton Investments. |
BOD-3
| | | | | | | | |
| Name, Age and Address | | Position | | Length of
Time Served | | Number of
Portfolios in Fund
Complex Overseen
by Board Member* | | Other Directorships Held |
MURRAY L. SIMPSON (67) One Franklin Parkway San Mateo, CA 94403-1906 | | Vice President and Secretary | | Since 2000 | | Not
Applicable | | Not Applicable |
|
Principal Occupation During Past 5 Years: Executive Vice President and General Counsel, Franklin Resources, Inc.; officer and/or director, as the case may be, of some of the subsidiaries of Franklin Resources, Inc. and of 51 of the investment companies in Franklin Templeton Investments; and formerly, Chief Executive Officer and Managing Director, Templeton Franklin Investment Services (Asia) Limited (until 2000); and Director, Templeton Asset Management Ltd. (until 1999). |
GALEN G. VETTER (53) 500 East Broward Blvd. Suite 2100 Fort Lauderdale,
FL 33394-3091 | | Chief Financial Officer and Chief Accounting Officer | | Since May 2004 | | Not
Applicable | | Not Applicable |
|
Principal Occupation During Past 5 Years: Officer of 51 of the investment companies in Franklin Templeton Investments; Senior Vice President, Franklin Templeton Services, LLC; and formerly, Managing Director, RSM McGladrey, Inc.; and Partner, McGladrey & Pullen, LLP. |
| *We | base the number of portfolios on each separate series of the U.S. registered investment companies within the Franklin Templeton Investments fund complex. These portfolios have a common investment adviser or affiliated investment advisers. |
| **Charles | B. Johnson and Rupert H. Johnson, Jr. are considered to be interested persons of the Trust under the federal securities laws due to their positions as officers and directors and major shareholders of Franklin Resources, Inc., which is the parent company of the Trust’s advisers and distributor. |
Note: Charles B. Johnson and Rupert H. Johnson, Jr. are brothers.
The Sarbanes-Oxley Act of 2002 and Rules adopted by the Securities and Exchange Commission require the Fund to disclose whether the Fund’s Audit Committee includes at least one member who is an audit committee financial expert within the meaning of such Act and Rules. The Fund’s Board of Directors has determined that there is at least one such financial expert on the Audit Committee and has designated Frank W.T. LaHaye as its audit committee financial expert. The Board believes that Mr. LaHaye qualifies as such an expert in view of his extensive business background and experience, including service as President and Director of McCormick Selph Associates from 1954 through 1965; Director and Chairman of Teledyne Canada Ltd. from 1966 through 1971; Director and Chairman of Quarterdeck Corporation from 1982 through 1998; and services as a Director of various other public companies including U.S. Telephone Inc. (1981-1984), Fisher Imaging Inc. (1991-1998) and Digital Transmissions Systems (1995-1999). In addition, Mr. LaHaye served from 1981 to 2000 as a Director and Chairman of Peregrine Venture Management Co., a venture capital firm, and has been a Member and Chairman of the Fund’s Audit Committee since its inception. As a result of such background and experience, the Board of Directors believes that Mr. LaHaye has acquired an understanding of generally accepted accounting principles and financial statements, the general application of such principles in connection with the accounting estimates, accruals and reserves, and analyzing and evaluating financial statements that present a breadth and level of complexity of accounting issues generally comparable to those of the Fund, as well as an understanding of internal controls and procedures for financial reporting and an understanding of audit committee functions. Mr. LaHaye is an independent Director as that term is defined under the relevant Securities and Exchange Commission Rules and Releases.
The Statement of Additional Information (SAI) includes additional information about the board members and is available, without charge, upon request. Contract owners may call 1-800/321-8563 or their insurance companies to request the SAI.
BOD-4
FRANKLIN TEMPLETON VARIABLE INSURANCE PRODUCTS TRUST
SHAREHOLDER INFORMATION
Proxy Voting Policies and Procedures
The Fund has established Proxy Voting Policies and Procedures (“Policies”) that the Fund uses to determine how to vote proxies relating to portfolio securities. Shareholders may view the Fund’s complete Policies online at franklintempleton.com. Alternatively, shareholders may request copies of the Policies free of charge by calling the Proxy Group collect at 1-954/847-2268 or by sending a written request to: Franklin Templeton Companies, LLC, 500 East Broward Boulevard, Suite 1500, Fort Lauderdale, FL 33394, Attention: Proxy Group. Copies of the Fund’s proxy voting records are also made available online at franklintempleton.com and posted on the Securities and Exchange Commission’s website at sec.gov and reflect the most recent 12-month period ended June 30.
Quarterly Statement of Investments
The Fund files a complete statement of investments with the Securities and Exchange Commission for the first and third quarters for each fiscal year on Form N-Q. Shareholders may view the filed Form N-Q by visiting the Commission’s website at sec.gov. The filed form may also be viewed and copied at the Commission’s Public Reference Room in Washington, DC. Information regarding the operations of the Public Reference Room may be obtained by calling 1-800/SEC-0330.
SI-1

| (a) | The Registrant has adopted a code of ethics that applies to its principal executive officers and principal financial and accounting officer. |
| (f) | Pursuant to Item 11(a), the Registrant is attaching as an exhibit a copy of its code of ethics that applies to its principal executive officers financial and accounting officer. |
| Item 3. | Audit Committee Financial Expert. |
| | |
| (a)(1) | | The Registrant has an audit committee financial expert serving on its audit committee. |
| |
| (2) | | The audit committee financial expert is Frank W.T. LaHaye and he is “Independent” as defined under the relevant Securities and Exchange Commission Rules And Releases. |
| Item 4. | Principal Accountant Fees and Services. |
N/A
| Item 5. | Audit Committee of Listed Registrants. |
N/A
| Item 7. | Disclosure of Proxy Voting Policies and Procedures for Closed-End Management Investment Companies. |
N/A
| Item 8. | Purchases of Equity Securities by Closed-End Management Investment Companies and Affiliated Purchases. |
N/A
| Item 9. | Submission of Matters to a vote of Security Holders. |
There have been no changes to the procedures by which shareholders may recommend nominees to the Registrant’s Board of Trustees that would require disclosure herein.
| Item 10. | Controls and Procedures. |
(a) Evaluation of Disclosure Controls and Procedures. The Registrant maintains disclosure controls and procedures that are designed to ensure that information required to be disclosed in the Registrant’s filings under the Securities Exchange Act of 1934 and the Investment Company Act of 1940 is recorded, processed, summarized and reported within the periods specified in the rules and forms of the Securities and Exchange Commission. Such information is accumulated and communicated to the Registrant’s management, including its principal executive officer and principal financial officer, as appropriate, to allow timely decisions regarding required disclosure. The Registrant’s management, including the principal executive officer and the principal financial officer, recognizes that any set of controls and procedures, no matter how well designed and operated, can provide only reasonable assurance of achieving the desired control objectives.
Within 90 days prior to the filing date of this Shareholder Report on Form N-CSR, the Registrant had carried out an evaluation, under the supervision and with the participation of the Registrant’s management, including the Registrant’s principal executive officer and the Registrant’s principal financial officer, of the effectiveness of the design and operation of the Registrant’s disclosure controls and procedures. Based on such evaluation, the Registrant’s principal executive officer and principal financial officer concluded that the Registrant’s disclosure controls and procedures are effective.
(b) Changes in Internal Controls. There have been no significant changes in the Registrant’s internal controls or in other factors that could significantly affect the internal controls subsequent to the date of their evaluation in connection with the preparation of this Shareholder Report on Form N-CSR.
| (a) | Code of Ethics for Principal Executive and Senior Financial Officers |
| | |
| (b)(1) | | Certifications pursuant to Section 302 of the Sarbanes-Oxley Act of 2002 of Jimmy D. Gambill, Chief Executive Officer—Finance and Administration, and Galen G. Vetter, Chief Financial Officer |
| |
| (b)(2) | | Certifications pursuant to Section 906 of the Sarbanes-Oxley Act of 2002 of Jimmy D. Gambill, Chief Executive Officer—Finance and Administration, and Galen G. Vetter, Chief Financial Officer |
SIGNATURES
Pursuant to the requirements of the Securities Exchange Act of 1934 and the Investment Company Act of 1940, the registrant has duly caused this report to be signed on its behalf by the undersigned, thereunto duly authorized.
FRANKLIN TEMPLETON VARIABLE INSURANCE PRODUCTS TRUST
| | |
| |
| By | | /s/ JIMMY D. GAMBILL |
| | | Jimmy D. Gambill |
| | | Chief Executive Officer – Finance and Administration |
| |
Date: | | April 25, 2005 |
Pursuant to the requirements of the Securities Exchange Act of 1934 and the Investment Company Act of 1940, this report has been signed below by the following persons on behalf of the registrant and in the capacities and on the dates indicated.
| | |
| |
| By | | /s/ JIMMY D. GAMBILL |
| | | Jimmy D. Gambill |
| | | Chief Executive Officer – Finance and Administration |
| |
Date: | | April 25, 2005 |
| | |
| |
| By | | /s/ GALEN G. VETTER |
| | | Galen G. Vetter |
| | | Chief Financial Officer |
| |
Date: | | April 25, 2005 |