UNITED STATES
SECURITIES AND EXCHANGE COMMISSION
Washington, D.C. 20549
FORM N-CSR
CERTIFIED SHAREHOLDER REPORT OF REGISTERED MANAGEMENT
INVESTMENT COMPANIES
Investment Company Act file number 811-05583
Franklin Templeton Variable Insurance Products Trust
(Exact name of registrant as specified in charter)
| | |
| One Franklin Parkway, San Mateo, CA | | 94403-1906 |
| (Address of principal executive offices) | | (Zip code) |
Murray L. Simpson, One Franklin Parkway, San Mateo, CA 94403-1906
(Name and address of agent for service)
Registrant’s telephone number, including area code: (650) 312-2100
Date of fiscal year end: 12/31
Date of reporting period: 12/31/04
| Item 1. | Reports to Stockholders. |
DECEMBER 31, 2004

| | | | |
| | | TEMPLETON INVESTMENT PLUS | | ANNUAL REPORT |
FRANKLIN TEMPLETON VARIABLE INSURANCE PRODUCTS TRUST
| • | | TEMPLETON DEVELOPING MARKETS SECURITIES FUND - CLASS 1 |
| • | | TEMPLETON FOREIGN SECURITIES FUND - CLASS 1 |
| • | | TEMPLETON GLOBAL ASSET ALLOCATION FUND - CLASS 1 |
| • | | TEMPLETON GLOBAL INCOME SECURITIES FUND - CLASS 1 |
| • | | TEMPLETON GROWTH SECURITIES FUND - CLASS 1 |
THE PHOENIX EDGE SERIES FUND
| • | | PHOENIX - GOODWIN MONEY MARKET SERIES |

Franklin • Templeton • Mutual Series
FRANKLIN TEMPLETON VARIABLE INSURANCE
PRODUCTS TRUST ANNUAL REPORT
TABLEOF CONTENTS
| | |
Important Notes to Performance Information | | i |
*Prospectus Supplement for All Funds | | SUPP-1 |
Fund Summaries | | |
Templeton Developing Markets Securities Fund | | TD-1 |
Templeton Foreign Securities Fund | | TF-1 |
Templeton Global Asset Allocation Fund | | TGA-1 |
Templeton Global Income Securities Fund | | TGI-1 |
Templeton Growth Securities Fund | | TG-1 |
Index Descriptions | | I-1 |
Board Members and Officers | | BOD-1 |
Shareholder Information | | SI-1 |
*Not part of the annual report
NOT FDIC INSURED | MAY LOSE VALUE | NO BANK GUARANTEE
PHOENIX AR04 02-05 TIP
IMPORTANT NOTESTOPERFORMANCE INFORMATION
Performance data is historical and cannot predict or guarantee future results. Principal value and investment return will fluctuate with market conditions, and you may have a gain or loss when you withdraw your money. Inception dates of the funds may have preceded the effective dates of the subaccounts, contracts, or their availability in all states.
When reviewing the index comparisons, please keep in mind that indexes have a number of inherent performance differentials over the funds. First, unlike the funds, which must hold a minimum amount of cash to maintain liquidity, indexes do not have a cash component. Second, the funds are actively managed and, thus, are subject to management fees to cover salaries of securities analysts or portfolio managers in addition to other expenses. Indexes are unmanaged and do not include any commissions or other expenses typically associated with investing in securities. Third, indexes often contain a different mix of securities than the fund to which they are compared. Additionally, please remember that indexes are simply a measure of performance and cannot be invested in directly.
i
SUPPLEMENT DATED FEBRUARY 9, 2005
TOTHE PROSPECTUSES DATED MAY 1, 2004,OF:
FRANKLIN GLOBAL COMMUNICATIONS SECURITIES FUND
FRANKLIN GROWTH AND INCOME SECURITIES FUND
FRANKLIN HIGH INCOME FUND
FRANKLIN INCOME SECURITIES FUND
FRANKLIN LARGE CAP GROWTH SECURITIES FUND
FRANKLIN MONEY MARKET FUND
FRANKLIN REAL ESTATE FUND
FRANKLIN RISING DIVIDENDS SECURITIES FUND
FRANKLIN SMALL CAP FUND
FRANKLIN SMALL CAP VALUE SECURITIES FUND
FRANKLIN STRATEGIC INCOME SECURITIES FUND
FRANKLIN U.S. GOVERNMENT FUND
FRANKLIN ZERO COUPON FUND 2005
FRANKLIN ZERO COUPON FUND 2010
MUTUAL DISCOVERY SECURITIES FUND
MUTUAL SHARES SECURITIES FUND
TEMPLETON DEVELOPING MARKETS SECURITIES FUND
TEMPLETON FOREIGN SECURITIES FUND
TEMPLETON GLOBAL ASSET ALLOCATION FUND
TEMPLETON GLOBAL INCOME SECURITIES FUND
TEMPLETON GROWTH SECURITIES FUND
(FRANKLIN TEMPLETON VARIABLE INSURANCE PRODUCTS TRUST)
The prospectuses for shares of Class 1, Class 2 and Class 3 are amended by replacing the “Regulatory Update” section under “Additional Information, All Funds” (or under “Additional Information”) with the following:
On February 4, 2004, the Securities Division of the Office of the Secretary of the Commonwealth of Massachusetts filed an administrative complaint against Franklin Resources, Inc. and certain of its subsidiaries (the Company) claiming violations of the Massachusetts Uniform Securities Act (Massachusetts Act) with respect to an alleged arrangement to permit market timing (the Massachusetts Proceeding). On September 20, 2004, Franklin Resources, Inc. announced that an agreement had been reached by two of its subsidiaries, Franklin Advisers, Inc. (Advisers) and Franklin Templeton Alternative Strategies, Inc. (FTAS), with the Securities Division of the Office of the Secretary of the Commonwealth of Massachusetts (the State of Massachusetts) related to the Massachusetts Proceeding. Under the terms of the settlement consent order issued by the State of Massachusetts, Advisers and FTAS have consented to the entry of a cease and desist order and agreed to pay a $5 million administrative fine to the State of Massachusetts. The administrative complaint addressed one instance of market timing that was also a subject of the August 2, 2004 settlement that Advisers reached with the Securities and Exchange Commission described below.
SUPP-1
On November 19, 2004, the Company reached a second agreement with the State of Massachusetts regarding an administrative complaint filed on October 25, 2004. The second complaint alleged that the Company’s Form 8-K filing describing the original settlement failed to state the company had admitted the Statements of Fact portion of the settlement order when it stated, “Franklin did not admit or deny engaging in any wrongdoing.”
As a result of the November 19, 2004 settlement with the State of Massachusetts, the Company filed a new Form 8-K. The terms of the original settlement did not change and there was no monetary fine associated with this second settlement.
On November 17, 2004, the Company announced that Franklin Templeton Distributors, Inc. (Distributors) (the principal underwriter of shares of the Franklin Templeton mutual funds) reached an agreement with the California Attorney General’s Office (CAGO), resolving the issues resulting from the CAGO’s investigation concerning marketing support payments to securities dealers who sell fund shares. Under the terms of the settlement with the CAGO, Distributors has agreed to pay $2 million as a civil penalty, $14 million to Franklin Templeton funds and $2 million to the CAGO.
The Company, in addition to most of the mutual funds within Franklin Templeton Investments, has been named in shareholder class actions related to the matter described above that were filed in the United States District Courts in California, Florida, Nevada, New Jersey and New York. These parties, as well as certain of the mutual funds’ trustees/directors, have also been named in a shareholder class action filed in March 2004 in the United States District Court in New Jersey. This lawsuit alleges violations of certain provisions of the federal securities laws and state common law fiduciary obligations in connection with Rule 12b-1 fees and brokerage commissions paid by the mutual funds. These lawsuits seek damages of unspecified amounts. The Company believes that the claims made in the lawsuits are without merit and it intends to defend vigorously against the allegations. It is anticipated that additional similar civil actions related to the matters described above may be filed in the future.
On August 2, 2004, Franklin Resources, Inc. announced that Advisers (adviser to many of the funds within Franklin Templeton Investments, and an affiliate of the adviser to the other funds) had reached a settlement with the U.S. Securities and Exchange Commission (SEC) that resolved an SEC investigation of market timing activity in the Franklin Templeton Investments funds. As part of the settlement, on August 2, 2004, the SEC issued an “Order instituting administrative and cease-and-desist proceedings pursuant to sections 203(e) and 203(k) of the Investment Advisers Act of 1940 and sections 9(b) and 9(f) of the Investment Company Act of 1940, making findings and imposing remedial sanctions and a cease and desist order” (the August Order). The SEC’s August Order concerns the activities of a limited number of third parties that ended in 2000 and those that are the subject of the Massachusetts Proceeding described above.
SUPP-2
Under the terms of the SEC’s August Order, Advisers, while neither admitting nor denying any of the findings therein, has agreed to pay $50 million, of which $20 million is a civil penalty, to be distributed to fund shareholders in accordance with a plan to be developed by an Independent Distribution Consultant. Because the distribution methodology has not yet been developed, it is presently not possible to say which particular funds will be determined to have been affected or which particular groups of fund shareholders will receive distributions or in what proportion and amounts. In the August Order, the SEC notes that the Company has generally sought to detect, discourage and prevent market timing in its funds and began to increase its efforts to control market timing in 1999. The August Order also requires Advisers to, among other things:
| • | | Enhance and periodically review compliance policies and procedures, and establish a corporate ombudsman; |
| • | | Establish a new internal position whose responsibilities shall include compliance matters related to conflicts of interests; and |
| • | | Retain an Independent Distribution Consultant to develop a plan to distribute the $50 million settlement to fund shareholders. |
On December 13, 2004, the Company announced that it reached an agreement with the SEC, resolving the issues resulting from the SEC’s investigation concerning marketing support payments to securities dealers who sell fund shares. The settlement agreement relates to an order (December Order) the SEC issued instituting administrative and cease-and-desist proceedings, making findings, and imposing remedial sanctions against Distributors and Advisers. In connection with this settlement, Advisers and Distributors also agreed to implement certain measures and undertakings relating to marketing support payments to broker-dealers for the promotion or sale of Fund shares, and to make additional disclosures in the Funds’ Prospectuses and Statements of Additional Information.
Under the terms of the SEC’s December Order, Advisers and Distributors, while neither admitting nor denying any of the findings therein, agreed to pay $20 million as a civil penalty, and $1 as restitution to be distributed to Franklin Templeton funds in accordance with a plan to be developed by an Independent Distribution Consultant. Because the distribution methodology has not yet been developed, it is presently not possible to say which particular funds will be determined to have been affected or will receive distributions or in what proportion and amounts.
These issues were previously disclosed by the Company as being under investigation by government authorities and the subject of an internal inquiry by the Company in its regulatory filings and on its public website. Any further updates on these matters will be disclosed on the Company’s website at franklintempleton.com under “Statement on Current Industry Issues.”
Please keep this supplement for future reference.
SUPP-3
TEMPLETON DEVELOPING MARKETS SECURITIES FUND
This annual report for Templeton Developing Markets Securities Fund covers the fiscal year ended December 31, 2004.
Performance Summary as of 12/31/04
Average annual total return of Class 1 shares* represents the average annual change in value, assuming reinvestment of dividends and capital gains. Average returns smooth out variations in returns, which can be significant; they are not the same as year-by-year results.
Periods ended 12/31/04
| | | | | | |
| | | 1-Year | | 5-Year | | Since
Inception
(3/4/96) |
Average Annual Total Return | | +24.83% | | +3.79% | | -0.26% |
*Performance prior to the 5/1/00 merger reflects the historical performance of Templeton Developing Markets Fund.
Total Return Index Comparison for Hypothetical $10,000 Investment (3/4/96–12/31/04)
The graph below shows the change in value of a hypothetical $10,000 investment in the Fund over the indicated period and includes reinvestment of any income or distributions. The Fund’s performance* is compared to the performance of the Morgan Stanley Capital International (MSCI) Emerging Markets (EM) Index and the Standard & Poor’s/International Finance Corporation Investable (S&P/IFCI) Composite Index. One cannot invest directly in an index, nor is an index representative of the Fund’s portfolio. Please see Important Notes to Performance Information preceding the Fund Summaries.
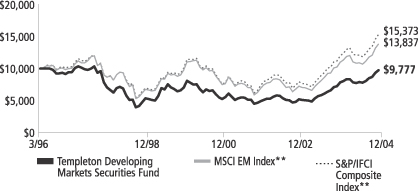
**Source: Standard & Poor’s Micropal. Please see Index Descriptions following the Fund Summaries.
Templeton Developing Markets Securities Fund Class 1
Performance reflects the Fund’s Class 1 operating expenses, but does not include any contract fees, expenses or sales charges. If they had been included, performance would be lower. These charges and deductions, particularly for variable life policies, can have a significant effect on contract values and insurance benefits. See the contract prospectus for a complete description of these expenses, including sales charges.
Performance data quoted represent past performance, which does not guarantee future results. Investment return and principal value will fluctuate, and you may have a gain or loss when you sell your shares. Current performance may differ from figures shown.
TD-1
Fund Goals and Main Investments: Templeton Developing Markets Securities Fund seeks long-term capital appreciation. The Fund invests predominantly in emerging markets investments.
Performance Overview
You can find the Fund’s one-year total return in the Performance Summary. The Fund underperformed its benchmarks, the MSCI EM Index and the S&P/IFCI Composite Index, which returned 25.95% and 28.11% for the year under review.1 Please note that the index performance numbers are purely for reference and that we do not attempt to track the index, but rather undertake investments on the basis of careful fundamental research.
Economic and Market Overview
Economically, 2004 was another positive year for emerging markets. Most Latin American economies recorded strong economic growth. In Eastern Europe, new member countries began seeing positive developments in the form of higher investment inflows as a result of European Union (EU) accession.
On December 26, the largest earthquake in 40 years struck in the Indian Ocean, just north of Sumatra. The earthquake created monster tidal waves, also known as tsunamis, that devastated coastal areas of Indonesia, Sri Lanka, Thailand, India and the Maldives. The remoteness of some of these areas complicated aid relief to the victims. While the tsunamis took a terrible toll on the people in the region, analysts estimated that their economic impact would not be significant.
Emerging markets stocks generally performed well during the year under review. The MSCI EM Index gained 25.95% in U.S. dollar terms as strong share prices and a sliding U.S. dollar boosted performance in the fourth quarter.1 Latin America and Eastern Europe outperformed their emerging market counterparts as both regions continued to attract greater investor interest. In particular, local stock markets of new EU members such as Poland, the Czech Republic, Hungary and Slovakia reached all-time highs. Turkey also recorded strong gains as investors reacted favorably toward the EU’s approval to begin formal accession talks for October 2005 and the Turkish government’s new US$10 billion standby agreement with the International Monetary Fund
1. Source: Standard & Poor’s Micropal. One cannot invest directly in an index, nor is an index representative of the Fund’s portfolio. Please see Index Descriptions following the Fund Summaries.
Fund Risks: Stocks offer the potential for long-term gains but can be subject to short-term up-and-down price movements. Investing in emerging markets involves special considerations, including market and currency fluctuations, economic instability, adverse social and political developments, and the relatively smaller size and lesser liquidity of these markets. All investments in the Fund should be considered long-term investments, which could experience significant volatility in any given year. The Fund is designed for the aggressive portion of a well-diversified portfolio. The Fund’s prospectus also includes a description of the main investment risks.
TD-2
(IMF).2 However, the Russian market underperformed as foreign investors remained cautious due to the Russian government’s actions against YUKOS and new tax claims on Vimpelcom.
Despite recording double-digit gains, Asian stock markets did not perform as well as those in other emerging markets regions as rising interest rates in the U.S., high commodity prices and concerns over China’s overheating economy continued to affect investor sentiment. In Africa, the South African market benefited from a strengthening rand, which greatly enhanced that market’s performance in U.S. dollars.
Investment Strategy
Our investment philosophy is bottom-up, value-oriented and long-term. In choosing investments, we may make onsite visits to companies to assess critical factors such as management strength and local conditions. In addition, we focus on the market price of a company’s securities relative to its evaluation of the company’s potential long-term (typically 5 years) earnings, asset value, cash flow, and balance sheet. Among factors we consider are a company’s historical value measures, including price/earnings ratio, book value, profit margins and liquidation value. We perform in-depth research to construct an action list from which we make our investment decisions.
Manager’s Discussion
In terms of performance, the Fund derived positive results from its underweighted position, relative to the MSCI EM Index, in Russia as well as overweighted positions in Austria and Singapore. The Fund’s decision not to hold YUKOS in Russia helped performance as that company’s stock price continued to tumble mainly due to concerns about the Russian government’s treatment of its assets. In Austria, the strongest contributors to Fund performance were OMV and Bank Austria Creditanstalt. We felt that both companies were well positioned to benefit from their large exposure to fast-growing central and Eastern European economies. However, the Fund’s underweighted positions in Brazil, Mexico and South Africa negatively impacted relative performance. All three markets recorded strong U.S. dollar performances in 2004, resulting in increasingly expensive valuations.
With regard to sectors, the energy sector, whose Fund weighting was about on par with that of the index, performed well.3 Our overweighted positions in MOL, OMV and SK Corp. drove the Fund’s relative energy
2. Source: The Economist Intelligence Unit Ltd., “Turkey Economy: Plumper,” 12/20/04.
3. The energy sector comprises energy equipment and services, and oil and gas in the SOI.
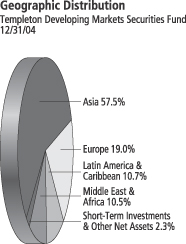
Top 10 Countries
Templeton Developing Markets Securities Fund 12/31/04
| | |
| | | % of Total
Net Assets |
| |
| South Korea | | 17.4% |
| |
| Taiwan | | 13.2% |
| |
| South Africa | | 10.5% |
| |
| China | | 10.1% |
| |
| Brazil | | 7.1% |
| |
| Singapore | | 6.0% |
| |
| Poland | | 3.5% |
| |
| Turkey | | 3.5% |
| |
| India | | 3.5% |
| |
| Mexico | | 3.3% |
TD-3
sector performance. Our overweighted positions in the consumer staples and diversified financial services sectors also reaped significant benefits.4 For example, SABMiller, Remgro and Ambev contributed the most to relative performance. The Fund’s underweighted position in commercial banks and overweighted exposure to telecommunication services hampered relative performance during the year.5
In general, if the value of the U.S. dollar goes up compared with a foreign currency, an investment traded in that foreign currency will go down in value because it will be worth fewer U.S. dollars. This can have a negative effect on Fund performance. Conversely, when the U.S. dollar weakens in relation to a foreign currency, an investment traded in that foreign currency will increase in value, which can contribute to Fund performance. For the 12 months ended December 31, 2004, the U.S. dollar declined in value relative to most non-U.S. currencies. At the end of the period, the Fund’s portfolio was invested predominantly in securities with non-U.S. currency exposure, which resulted in a positive effect on Fund performance. However, one cannot expect the same result in future periods.
In Asia, the Fund’s largest purchases were in South Korea and Taiwan as the Fund increased its exposure to the semiconductors and semiconductor equipment sector. Key purchases included Samsung Electronics, one of the world’s largest electronics manufacturers, and Taiwan Semiconductor Manufacturing, a leading global integrated circuit producer. Additional purchases included Daewoo Shipbuilding, a major player in the global shipbuilding industry, and MediaTek, Taiwan’s biggest integrated circuit design company. We reduced our Indonesian position due to strong performance in 2004 as some stocks reached our sell targets.
The Fund invested in several western European-listed companies with significant business exposure and growth opportunities in emerging markets. They include Oriflame, a cosmetic company with sales operations in over 50 countries as well as market leadership in more than 30 of them; Inbev, the result of a merger between Interbrew and Ambev; and HSBC Holdings, one of the world’s largest banking and financial services organizations.
4. The consumer staples sector comprises food and staples retailing, beverages, food products, tobacco, household products and personal products in the SOI.
5. The telecommunication services sector comprises diversified telecommunication services and
Top 10 Holdings
Templeton Developing Markets Securities Fund 12/31/04
| | |
Company
Sector/Industry,
Country | | % of Total
Net Assets |
| |
Samsung Electronics
Co. Ltd. | | 4.5% |
| Semiconductors & Semiconductor Equipment, South Korea | | |
| |
| China Mobile (Hong Kong) Ltd., fgn. | | 2.4% |
| Wireless Telecommunication Services, China | | |
| |
Telekomunikacja
Polska SA | | 2.2% |
| Diversified Telecommunication Services, Poland | | |
| |
| Remgro Ltd. | | 2.2% |
| Diversified Financial Services, South Africa | | |
| |
| Anglo American PLC | | 2.1% |
| Metals & Mining, South Africa | | |
| |
| SABMiller PLC | | 2.1% |
| Beverages, South Africa | | |
| |
| Kimberly Clark de Mexico SA de CV, A | | 1.9% |
| Household Products, Mexico | | |
| |
Cia De Bebidas Das Americas (Ambev),
ADR, pfd. | | 1.8% |
| Beverages, Brazil | | |
| |
| Inbev | | 1.8% |
| Beverages, Belgium | | |
| |
| Taiwan Cellular Corp. | | 1.7% |
| Wireless Telecommunication Services, Taiwan | | |
The dollar value, number of shares or principal amount, and names of all portfolio holdings are listed in the Fund’s Statement of Investments.
TD-4
We reduced our Latin American exposure during the reporting period as the Fund undertook selective sales in Mexico and Argentina, and sold its only holding in Peru. The Fund realized gains through significant sales such as Carso and Tenaris. Benefiting from a strengthening rand and high commodity prices in 2004, the Fund locked in strong U.S. dollar returns through sales of Anglo American and BHP Billiton.
Thank you for your participation in Templeton Developing Markets Securities Fund. We look forward to serving your future investment needs.
The foregoing information reflects our analysis, opinions and portfolio holdings as of December 31, 2004, the end of the reporting period. The way we implement our main investment strategies and the resulting portfolio holdings may change depending on factors such as market and economic conditions. These opinions may not be relied upon as investment advice or an offer for a particular security. The information is not a complete analysis of every aspect of any market, country, industry, security or the Fund. Statements of fact are from sources considered reliable, but the adviser makes no representation or warranty as to their completeness or accuracy. Although historical performance is no guarantee of future results, these insights may help you understand our investment management philosophy.
TD-5
Fund Expenses
As an investor in a variable insurance contract (“Contract”) that indirectly provides for investment in an underlying mutual fund, you can incur transaction and/or ongoing expenses at both the Fund level and the Contract level.
| • | | Transaction expenses can include sales charges (loads) on purchases, redemption fees, surrender fees, transfer fees and premium taxes. |
| • | | Ongoing expenses can include management fees, distribution and service (12b-1) fees, contract fees, annual maintenance fees, mortality and expense risk fees and other fees and expenses. All mutual funds and Contracts have some types of ongoing expenses. |
The expenses shown in the table below are meant to highlight ongoing expenses at the Fund level only and do not include ongoing expenses at the Contract level, or transaction expenses at either the Fund or Contract levels. While the Fund does not have transaction expenses, if the transaction and ongoing expenses at the Contract level were included, the expenses shown below would be higher. You should consult your Contract prospectus or disclosure document for more information.
The table shows Fund-level ongoing expenses and can help you understand these expenses and compare them with those of other mutual funds offered through the Contract. The table assumes a $1,000 investment held for the six months indicated. Please refer to the Fund prospectus for additional information on operating expenses.
Actual Fund Expenses
The first line (Actual) for each share class listed in the table below provides actual account values and expenses. The “Ending Account Value” is derived from the Fund’s actual return, which includes the effect of ongoing Fund expenses, but does not include the effect of ongoing Contract expenses.
You can estimate the Fund-level expenses you incurred during the period, by following these steps. Of course, your account value and expenses will differ from those in this illustration:
| 1. | Divide your account value by $1,000. |
If an account had an $8,600 value, then $8,600 ÷ $1,000 = 8.6.
| 2. | Multiply the result by the number under the heading “Fund-Level Expenses Incurred During Period.” |
If Fund-Level Expenses Incurred During Period were $7.50, then 8.6 × $7.50 = $64.50.
Templeton Developing Markets Securities Fund Class 1
TD-6
In this illustration, the estimated expenses incurred this period at the Fund level are $64.50.
Hypothetical Example for Comparison with Other Mutual Funds
Information in the second line (Hypothetical) for each class in the table can help you compare ongoing expenses of the Fund with those of other mutual funds offered through the Contract. This information may not be used to estimate the actual ending account balance or expenses you incurred during the period. The hypothetical “Ending Account Value” is based on the actual expense ratio for each class and an assumed 5% annual rate of return before expenses, which does not represent the Fund’s actual return. The figure under the heading “Fund-Level Expenses Incurred During Period” shows the hypothetical expenses your account would have incurred under this scenario. You can compare this figure with the 5% hypothetical examples that appear in shareholder reports of other funds offered through a Contract.
| | | | | | | | | |
| Class 1 | | Beginning
Account
Value 6/30/04 | | Ending
Account
Value 12/31/04 | | Fund-Level
Expenses Incurred
During Period*
6/30/04-12/31/04 |
Actual | | $ | 1,000 | | $ | 1,238.30 | | $ | 8.95 |
Hypothetical (5% return before expenses) | | $ | 1,000 | | $ | 1,017.14 | | $ | 8.06 |
* Expenses are equal to the annualized expense ratio for the Fund’s Class 1 shares (1.59%), which does not include any ongoing expenses of the Contract for which the Fund is an investment option, multiplied by the average account value over the period, multiplied by 184/366 to reflect the one-half year period.
TD-7
FRANKLIN TEMPLETON VARIABLE INSURANCE PRODUCTS TRUST
TEMPLETON DEVELOPING MARKETS SECURITIES FUND
Financial Highlightsa
| | | | | | | | | | | | | | | | | | | | |
| | | Class 1
| |
| | | Year Ended December 31,
| |
| | | 2004 | | | 2003 | | | 2002 | | | 2001 | | | 2000 | |
| | |
|
|
|
Per share operating performance | | | | | | | | | | | | | | | | | | | | |
(for a share outstanding throughout the year) | | | | | | | | | | | | | | | | | | | | |
Net asset value, beginning of year | | $ | 7.14 | | | $ | 4.71 | | | $ | 4.78 | | | $ | 5.25 | | | $ | 7.77 | |
| | |
|
|
|
Income from investment operations: | | | | | | | | | | | | | | | | | | | | |
Net investment incomeb | | | .11 | | | | .13 | | | | .07 | | | | .08 | | | | .07 | |
Net realized and unrealized gains (losses) | | | 1.62 | | | | 2.38 | | | | (.06 | ) | | | (.50 | ) | | | (2.52 | ) |
| | |
|
|
|
Total from investment operations | | | 1.73 | | | | 2.51 | | | | .01 | | | | (.42 | ) | | | (2.45 | ) |
| | |
|
|
|
Less distributions from net investment income | | | (.14 | ) | | | (.08 | ) | | | (.08 | ) | | | (.05 | ) | | | (.07 | ) |
| | |
|
|
|
Net asset value, end of year | | $ | 8.73 | | | $ | 7.14 | | | $ | 4.71 | | | $ | 4.78 | | | $ | 5.25 | |
| | |
|
|
|
| | | | | |
Total returnc | | | 24.83% | | | | 53.74% | | | | .04% | | | | (8.08)% | | | | (31.76)% | |
Ratios/supplemental data | | | | | | | | | | | | | | | | | | | | |
Net assets, end of year (000’s) | | $ | 477,290 | | | $ | 359,299 | | | $ | 225,454 | | | $ | 240,289 | | | $ | 301,645 | |
Ratios to average net assets: | | | | | | | | | | | | | | | | | | | | |
Expenses | | | 1.54% | | | | 1.55% | | | | 1.58% | | | | 1.57% | | | | 1.56% | |
Net investment income | | | 1.52% | | | | 2.35% | | | | 1.45% | | | | 1.64% | | | | 1.13% | |
Portfolio turnover rate | | | 55.67% | | | | 46.20% | | | | 57.91% | | | | 78.29% | | | | 89.48% | |
| a | Financial highlights presented reflect historical financial information from Templeton Variable Products Series Fund (TVP)-Templeton Developing Markets Fund as a result of a merger on May 1, 2000. |
| b | Based on average daily shares outstanding. |
| c | Total return does not include any fees, charges or expenses imposed by the variable annuity and life insurance contracts for which the Franklin Templeton Variable Insurance Products Trust serves as an underlying investment vehicle. Total return is not annualized for periods less than one year. |
See notes to financial statements.
TD-8
FRANKLIN TEMPLETON VARIABLE INSURANCE PRODUCTS TRUST
TEMPLETON DEVELOPING MARKETS SECURITIES FUND
Financial Highlightsa (continued)
| | | | | | | | | | | | | | | | | | | | |
| | | Class 2
| |
| | | Year Ended December 31,
| |
| | | 2004 | | | 2003 | | | 2002 | | | 2001 | | | 2000 | |
| | |
|
|
|
Per share operating performance | | | | | | | | | | | | | | | | | | | | |
(for a share outstanding throughout the year) | | | | | | | | | | | | | | | | | | | | |
Net asset value, beginning of year | | $ | 7.09 | | | $ | 4.69 | | | $ | 4.76 | | | $ | 5.22 | | | $ | 7.74 | |
| | |
|
|
|
Income from investment operations: | | | | | | | | | | | | | | | | | | | | |
Net investment incomeb | | | .09 | | | | .11 | | | | .06 | | | | .07 | | | | .06 | |
Net realized and unrealized gains (losses) | | | 1.63 | | | | 2.35 | | | | (.06 | ) | | | (.49 | ) | | | (2.53 | ) |
| | |
|
|
|
Total from investment operations | | | 1.72 | | | | 2.46 | | | | — | | | | (.42 | ) | | | (2.47 | ) |
| | |
|
|
|
Less distributions from net investment income | | | (.14 | ) | | | (.06 | ) | | | (.07 | ) | | | (.04 | ) | | | (.05 | ) |
| | |
|
|
|
Net asset value, end of year | | $ | 8.67 | | | $ | 7.09 | | | $ | 4.69 | | | $ | 4.76 | | | $ | 5.22 | |
| | |
|
|
|
| | | | | |
Total returnc | | | 24.71% | | | | 52.99% | | | | (.15)% | | | | (8.08)% | | | | (32.04)% | |
Ratios/supplemental data | | | | | | | | | | | | | | | | | | | | |
Net assets, end of year (000’s) | | $ | 327,569 | | | $ | 170,953 | | | $ | 80,952 | | | $ | 64,081 | | | $ | 56,617 | |
Ratios to average net assets: | | | | | | | | | | | | | | | | | | | | |
Expenses | | | 1.79% | | | | 1.80% | | | | 1.83% | | | | 1.82% | | | | 1.81% | |
Net investment income | | | 1.27% | | | | 2.10% | | | | 1.20% | | | | 1.37% | | | | .88% | |
Portfolio turnover rate | | | 55.67% | | | | 46.20% | | | | 57.91% | | | | 78.29% | | | | 89.48% | |
| a | Financial highlights presented reflect historical financial information from Templeton Variable Products Series Fund (TVP) – Templeton Developing Markets Fund as a result of a merger on May 1, 2000. |
| b | Based on average daily shares outstanding. |
| c | Total return does not include any fees, charges or expenses imposed by the variable annuity and life insurance contracts for which the Franklin Templeton Variable Insurance Products Trust serves as an underlying investment vehicle. Total return is not annualized for periods less than one year. |
See notes to financial statements.
TD-9
FRANKLIN TEMPLETON VARIABLE INSURANCE PRODUCTS TRUST
TEMPLETON DEVELOPING MARKETS SECURITIES FUND
Financial Highlights (continued)
| | | | |
| | | Class 3
| |
| | | Period Ended
December 31, 2004c
| |
Per share operating performance | | | | |
(for a share outstanding throughout the period) | | | | |
Net asset value, beginning of period | | $ | 7.13 | |
| | |
|
|
|
Income from investment operations: | | | | |
Net investment incomea | | | .08 | |
Net realized and unrealized gains (losses) | | | 1.61 | |
| | |
|
|
|
Total from investment operations | | | 1.69 | |
| | |
|
|
|
Less distributions from net investment income | | | (.14 | ) |
| | |
|
|
|
Net asset value, end of period | | $ | 8.68 | |
| | |
|
|
|
| |
Total returnb | | | 24.15% | |
Ratios/supplemental data | | | | |
Net assets, end of period (000’s) | | $ | 12 | |
Ratios to average net assets: | | | | |
Expenses | | | 1.54% | d |
Net investment income | | | 1.52% | d |
Portfolio turnover rate | | | 55.67% | |
| a | Based on average daily shares outstanding. |
| b | Total return does not include any fees, charges or expenses imposed by the variable annuity and life insurance contracts for which the Franklin Templeton Variable Insurance Products Trust serves as an underlying investment vehicle. Total return is not annualized for periods less than one year. |
| c | For the period May 1, 2004 (effective date) to December 31, 2004. |
See notes to financial statements.
TD-10
FRANKLIN TEMPLETON VARIABLE INSURANCE PRODUCTS TRUST
TEMPLETON DEVELOPING MARKETS SECURITIES FUND
Statement of Investments, December 31, 2004
| | | | | | | |
| | | INDUSTRY | | SHARES/
RIGHTS | | VALUE |
Long Term Investments 97.7% | | | | | | | |
Argentina .3% | | | | | | | |
Tenaris SA, ADR | | Energy Equipment & Services | | 45,434 | | $ | 2,221,723 |
| | | | | | |
|
|
Austria 2.0% | | | | | | | |
Bank Austria Creditanstalt | | Commercial Banks | | 125,852 | | | 11,356,942 |
OMV AG | | Oil & Gas | | 17,363 | | | 5,223,367 |
| | | | | | |
|
|
| | | | | | | | 16,580,309 |
| | | | | | |
|
|
Belgium 1.8% | | | | | | | |
Inbev | | Beverages | | 369,200 | | | 14,298,659 |
| | | | | | |
|
|
Brazil 7.1% | | | | | | | |
Banco Bradesco SA, ADR, pfd. | | Commercial Banks | | 477,270 | | | 11,960,386 |
Centrais Eletricas Brasileiras SA | | Electric Utilities | | 241,544,764 | | | 3,501,307 |
Cia De Bebidas Das Americas (Ambev), ADR, pfd. | | Beverages | | 518,800 | | | 14,697,604 |
Cia Vale do Rio Doce, ADR, pfd., A | | Metals & Mining | | 204,300 | | | 4,980,834 |
Petroleo Brasileiro SA, ADR, pfd. | | Oil & Gas | | 268,264 | | | 9,713,839 |
Souza Cruz SA | | Tobacco | | 430,922 | | | 5,779,157 |
Suzano Bahia Sul Papel e cel, pfd., A | | Paper & Forest Products | | 343,148 | | | 1,773,879 |
Unibanco Uniao de Bancos Brasileiros SA, GDR | | Commercial Banks | | 86,400 | | | 2,740,608 |
Usinas Siderurgicas De Minas Gerais SA, pfd. | | Metals & Mining | | 86,920 | | | 1,765,563 |
| | | | | | |
|
|
| | | | | | | | 56,913,177 |
| | | | | | |
|
|
China 10.1% | | | | | | | |
aAir China Ltd., 144A. | | Airlines | | 1,452,000 | | | 560,416 |
Aluminum Corp. of China Ltd., H | | Metals & Mining | | 9,940,000 | | | 5,882,565 |
Anhui Conch Cement Co. Ltd. | | Construction Materials | | 2,740,000 | | | 2,978,721 |
Beijing Enterprises Holdings Ltd. | | Industrial Conglomerates | | 1,420,128 | | | 2,110,241 |
China Mobile (Hong Kong) Ltd., fgn. | | Wireless Telecommunication Services | | 5,602,000 | | | 18,990,930 |
China Petroleum & Chemical Corp., H | | Oil & Gas | | 8,078,000 | | | 3,325,648 |
China Resources Enterprise Ltd. | | Distributors | | 4,574,000 | | | 7,149,817 |
China Travel International Investment Hong Kong Ltd. | | Hotels Restaurants & Leisure | | 15,506,000 | | | 4,987,263 |
China Unicom Ltd. | | Wireless Telecommunication Services | | 2,172,000 | | | 1,718,531 |
CITIC Pacific Ltd. | | Industrial Conglomerates | | 2,013,959 | | | 5,726,185 |
Denway Motors Ltd. | | Automobiles | | 13,090,234 | | | 4,673,400 |
Huadian Power International Corp. Ltd., H | | Electric Utilities | | 7,826,000 | | | 2,315,742 |
Lenovo Group Ltd., H | | Computers & Peripherals | | 13,606,000 | | | 4,069,827 |
PetroChina Co. Ltd., H | | Oil & Gas | | 14,474,000 | | | 7,727,859 |
Shanghai Industrial Holdings Ltd. | | Industrial Conglomerates | | 2,697,000 | | | 5,759,855 |
TCL International Holdings Inc. | | Household Durables | | 3,584,000 | | | 922,190 |
Travelsky Technology Ltd., H | | IT Services | | 3,227,000 | | | 2,615,544 |
| | | | | | |
|
|
| | | | | | | | 81,514,734 |
| | | | | | |
|
|
Croatia .5% | | | | | | | |
Pliva D D, GDR, Reg S | | Pharmaceuticals | | 320,200 | | | 3,986,490 |
| | | | | | |
|
|
Czech Republic .7% | | | | | | | |
Cesky Telecom AS | | Diversified Telecommunication Services | | 323,510 | | | 5,355,743 |
| | | | | | |
|
|
Greece 1.1% | | | | | | | |
Hellenic Telecommunications Organization SA (OTE) | | Diversified Telecommunication Services | | 154,380 | | | 2,769,505 |
Titan Cement Co. | | Construction Materials | | 207,560 | | | 6,140,162 |
| | | | | | |
|
|
| | | | | | | | 8,909,667 |
| | | | | | |
|
|
TD-11
FRANKLIN TEMPLETON VARIABLE INSURANCE PRODUCTS TRUST
TEMPLETON DEVELOPING MARKETS SECURITIES FUND
Statement of Investments, December 31, 2004 (cont.)
| | | | | | | |
| | | INDUSTRY | | SHARES/
RIGHTS | | VALUE |
Long Term Investments (cont.) | | | | | | | |
Hong Kong 2.6% | | | | | | | |
Cheung Kong Holdings Ltd. | | Real Estate | | 1,184,000 | | $ | 11,805,270 |
Cheung Kong Infrastructure Holdings Ltd. | | Electric Utilities | | 572,000 | | | 1,652,094 |
Guoco Group Ltd. | | Diversified Financial Services | | 328,000 | | | 3,207,081 |
Henderson Investment Ltd. | | Real Estate | | 1,065,000 | | | 1,555,135 |
MTR Corp. Ltd. | | Road & Rail | | 1,613,901 | | | 2,585,049 |
| | | | | | |
|
|
| | | | | | | | 20,804,629 |
| | | | | | |
|
|
Hungary 3.0% | | | | | | | |
Egis RT | | Pharmaceuticals | | 15,827 | | | 954,700 |
Gedeon Richter Ltd. | | Pharmaceuticals | | 50,356 | | | 6,325,851 |
Matav RT | | Diversified Telecommunication Services | | 1,037,300 | | | 4,965,492 |
MOL Magyar Olaj-Es Gazipari RT | | Oil & Gas | | 172,240 | | | 12,114,944 |
| | | | | | |
|
|
| | | | | | | | 24,360,987 |
| | | | | | |
|
|
India 3.5% | | | | | | | |
Gail (India) Ltd. | | Gas Utilities | | 855,630 | | | 4,564,019 |
Hindustan Lever Ltd. | | Household Products | | 2,477,600 | | | 8,220,476 |
Hindustan Petroleum Corp. Ltd. | | Oil & Gas | | 1,050,804 | | | 9,730,567 |
Tata Motors Ltd. | | Automobiles | | 148,000 | | | 1,728,606 |
Tata Tea Ltd. | | Food Products | | 359,803 | | | 3,937,035 |
| | | | | | |
|
|
| | | | | | | | 28,180,703 |
| | | | | | |
|
|
Indonesia .6% | | | | | | | |
Bk Danamon | | Commercial Banks | | 6,840,000 | | | 3,223,808 |
PT Perusahaan Gas Negara | | Gas Utilities | | 7,557,500 | | | 1,546,916 |
PT Perusahaan Gas Negara, 144A | | Gas Utilities | | 169,500 | | | 34,695 |
| | | | | | |
|
|
| | | | | | | | 4,805,419 |
| | | | | | |
|
|
Malaysia 1.6% | | | | | | | |
Kuala Lumpur Kepong Bhd. | | Food Products | | 390,600 | | | 709,248 |
Resorts World Bhd. | | Hotels Restaurants & Leisure | | 2,046,000 | | | 5,384,211 |
SIME Darby Bhd. | | Industrial Conglomerates | | 2,054,500 | | | 3,243,947 |
Tanjong PLC | | Hotels Restaurants & Leisure | | 241,000 | | | 894,237 |
YTL Corp. Bhd. | | Electric Utilities | | 1,061,000 | | | 1,493,776 |
YTL Power International Bhd. | | Water Utilities | | 2,483,400 | | | 1,176,347 |
| | | | | | |
|
|
| | | | | | | | 12,901,766 |
| | | | | | |
|
|
Mexico 3.3% | | | | | | | |
Fomento Economico Mexicano SA de CV Femsa, ADR | | Beverages | | 140,600 | | | 7,396,966 |
Kimberly Clark de Mexico SA de CV, A | | Household Products | | 4,538,033 | | | 15,690,550 |
Telefonos de Mexico SA de CV (Telmex), L, ADR | | Diversified Telecommunication Services | | 99,982 | | | 3,831,310 |
| | | | | | |
|
|
| | | | | | | | 26,918,826 |
| | | | | | |
|
|
Philippines .6% | | | | | | | |
San Miguel Corp., B | | Beverages | | 3,892,630 | | | 5,201,733 |
| | | | | | |
|
|
Poland 3.5% | | | | | | | |
Polski Koncern Naftowy Orlen SA | | Oil & Gas | | 825,929 | | | 10,363,524 |
Telekomunikacja Polska SA | | Diversified Telecommunication Services | | 2,736,600 | | | 17,986,616 |
| | | | | | |
|
|
| | | | | | | | 28,350,140 |
| | | | | | |
|
|
TD-12
FRANKLIN TEMPLETON VARIABLE INSURANCE PRODUCTS TRUST
TEMPLETON DEVELOPING MARKETS SECURITIES FUND
Statement of Investments, December 31, 2004 (cont.)
| | | | | | | |
| | | INDUSTRY | | SHARES/
RIGHTS | | VALUE |
Long Term Investments (cont.) | | | | | | | |
Russia .8% | | | | | | | |
bLukoil Holdings, ADR | | Oil & Gas | | 52,307 | | $ | 6,350,070 |
| | | | | | |
|
|
Singapore 6.0% | | | | | | | |
Comfortdelgro Corp. Ltd. | | Road & Rail | | 4,474,000 | | | 4,248,422 |
Dairy Farm International Holdings Ltd. | | Food & Staples Retailing | | 1,132,933 | | | 2,741,698 |
Fraser & Neave Ltd. | | Beverages | | 1,233,681 | | | 12,319,427 |
Keppel Corp. Ltd. | | Industrial Conglomerates | | 2,182,600 | | | 11,499,332 |
Singapore Press Holdings Ltd. | | Media | | 1,179,000 | | | 3,322,551 |
Singapore Technologies Engineering Ltd. | | Aerospace & Defense | | 2,988,000 | | | 4,265,172 |
Singapore Telecommunications Ltd. | | Diversified Telecommunication Services | | 6,052,428 | | | 8,824,835 |
aSuntec Real Estate Investment Trust | | Real Estate | | 1,252,000 | | | 851,388 |
| | | | | | |
|
|
| | | | | | | | 48,072,825 |
| | | | | | |
|
|
South Africa 10.5% | | | | | | | |
Anglo American PLC | | Metals & Mining | | 731,130 | | | 17,229,630 |
Liberty Group Ltd. | | Insurance | | 65,491 | | | 769,938 |
Nedcor Ltd. | | Commercial Banks | | 450,759 | | | 6,190,477 |
Nedcor Ltd., 144A | | Commercial Banks | | 63,958 | | | 878,364 |
Old Mutual PLC | | Insurance | | 4,501,298 | | | 11,448,078 |
Remgro Ltd. | | Diversified Financial Services | | 1,043,070 | | | 17,374,066 |
SABMiller PLC | | Beverages | | 1,016,424 | | | 17,125,803 |
Sappi Ltd. | | Paper & Forest Products | | 401,900 | | | 5,888,385 |
Sasol Ltd. | | Oil & Gas | | 357,400 | | | 7,633,786 |
| | | | | | |
|
|
| | | | | | | | 84,538,527 |
| | | | | | |
|
|
South Korea 17.4% | | | | | | | |
CJ Corp. | | Food Products | | 105,070 | | | 7,186,009 |
Daewoo Shipbuilding & Marine Engineering Co. Ltd. | | Machinery | | 791,700 | | | 11,777,608 |
Hite Brewery Co. Ltd. | | Beverages | | 87,140 | | | 7,197,131 |
Hyundai Development Co. | | Construction & Engineering | | 463,300 | | | 7,384,515 |
Kangwon Land Inc. | | Hotels Restaurants & Leisure | | 784,165 | | | 10,188,388 |
Kia Motors Corp. | | Automobiles | | 309,230 | | | 3,255,996 |
Korea Gas Corp. | | Gas Utilities | | 89,600 | | | 2,778,362 |
LG Chem Ltd. | | Chemicals | | 195,940 | | | 7,807,694 |
LG Electronics Inc. | | Household Durables | | 125,930 | | | 7,797,636 |
LG Household & Health Care Ltd. | | Household Products | | 94,760 | | | 2,512,715 |
LG International Corp. | | Trading Companies & Distributors | | 325,440 | | | 2,530,711 |
LG Petrochemical Co. Ltd. | | Chemicals | | 146,810 | | | 3,687,268 |
POSCO | | Metals & Mining | | 40,480 | | | 7,312,365 |
Samsung Electronics Co. Ltd. | | Semiconductors & Semiconductor Equipment | | 83,368 | | | 36,280,220 |
Samsung Fine Chemicals Co. Ltd. | | Chemicals | | 221,490 | | | 3,808,464 |
Samsung Heavy Industries Co. Ltd. | | Machinery | | 1,757,220 | | | 10,965,650 |
SK Corp. | | Oil & Gas | | 33,410 | | | 1,836,388 |
SK Telecom Co. Ltd. | | Wireless Telecommunication Services | | 31,730 | | | 6,038,263 |
| | | | | | |
|
|
| | | | | | | | 140,345,383 |
| | | | | | |
|
|
Sweden .5% | | | | | | | |
aOriflame Cosmetics, IDR | | Personal Products | | 170,000 | | | 3,940,575 |
| | | | | | |
|
|
Taiwan 13.2% | | | | | | | |
Acer Inc. | | Computers & Peripherals | | 3,583,254 | | | 5,917,610 |
Chunghwa Telecom Co. Ltd. | | Diversified Telecommunication Services | | 3,162,000 | | | 6,216,577 |
TD-13
FRANKLIN TEMPLETON VARIABLE INSURANCE PRODUCTS TRUST
TEMPLETON DEVELOPING MARKETS SECURITIES FUND
Statement of Investments, December 31, 2004 (cont.)
| | | | | | | |
| | | INDUSTRY | | SHARES/
RIGHTS | | VALUE |
Long Term Investments (cont.) | | | | | | | |
Taiwan (cont.) | | | | | | | |
D-Link Corp. | | Communications Equipment | | 4,066,787 | | $ | 4,733,285 |
Delta Electronics Inc. | | Electronic Equipment & Instruments | | 5,127,467 | | | 9,032,342 |
Elan Microelectronics Corp. | | Semiconductors & Semiconductor Equipment | | 2,725,776 | | | 1,534,803 |
Kinpo Electronics Inc. | | Office Electronics | | 2,453,200 | | | 1,068,789 |
Lite-on Technology Corp. | | Computers & Peripherals | | 6,440,700 | | | 6,868,189 |
MediaTek Inc. | | Semiconductors & Semiconductor Equipment | | 1,098,000 | | | 7,460,459 |
Mega Financial Holdings Co. Ltd. | | Commercial Banks | | 9,866,503 | | | 6,796,993 |
Premier Image Technology Corp. | | Leisure Equipment & Products | | 1,819,000 | | | 1,790,963 |
President Chain Store Corp. | | Food & Staples Retailing | | 2,986,144 | | | 4,790,605 |
Siliconware Precision Industries Co. Ltd. | | Semiconductors & Semiconductor Equipment | | 5,247,000 | | | 4,324,360 |
Sunplus Technology Co. Ltd. | | Semiconductors & Semiconductor Equipment | | 4,629,100 | | | 6,494,428 |
Synnex Technology International Corp. | | Electronic Equipment & Instruments | | 742,600 | | | 1,095,563 |
Taiwan Cellular Corp. | | Wireless Telecommunication Services | | 12,155,302 | | | 13,573,867 |
Taiwan Semiconductor Manufacturing Co. | | Semiconductors & Semiconductor Equipment | | 7,669,000 | | | 12,182,589 |
UNI-President Enterprises Corp. | | Food Products | | 13,577,600 | | | 7,089,908 |
Yuanta Core Pacific Securities Co. | | Capital Markets | | 7,065,978 | | | 5,356,718 |
| | | | | | |
|
|
| | | | | | | | 106,328,048 |
| | | | | | |
|
|
Thailand 1.8% | | | | | | | |
BEC World Public Co. Ltd., fgn. | | Media | | 7,730,700 | | | 3,122,189 |
aKasikornbank Public Co. Ltd., fgn. | | Commercial Banks | | 3,074,800 | | | 4,429,408 |
Land and House Public Co. Ltd., fgn. | | Real Estate | | 3,624,700 | | | 1,053,638 |
Shin Corp. Public Co. Ltd., fgn. | | Wireless Telecommunication Services | | 1,176,900 | | | 1,203,421 |
Siam Cement Public Co. Ltd., fgn. | | Construction Materials | | 177,100 | | | 1,257,385 |
Thai Airways International Public Co. Ltd., fgn. | | Airlines | | 130,000 | | | 162,191 |
aThai Military Bank Public Co. Ltd., fgn. | | Commercial Banks | | 32,522,400 | | | 3,145,656 |
aTrue Corp., PLC, rts., 3/28/08 | | Diversified Telecommunication Services | | 344,616 | | | — |
| | | | | | |
|
|
| | | | | | | | 14,373,888 |
| | | | | | |
|
|
Turkey 3.5% | | | | | | | |
aArcelik AS, Br. | | Household Durables | | 1,048,826,400 | | | 6,416,624 |
Migros Turk TAS | | Food & Staples Retailing | | 933,539,500 | | | 7,753,536 |
Tupras-Turkiye Petrol Rafineleri AS | | Oil & Gas | | 657,260,000 | | | 6,677,391 |
aTurk Hava Yollari Anonim Ortakligi (THY), 144A | | Airlines | | 188,012,000 | | | 1,108,413 |
Turkiye Is Bankasi AS, C | | Commercial Banks | | 1,143,234,000 | | | 6,315,976 |
| | | | | | |
|
|
| | | | | | | | 28,271,940 |
| | | | | | |
|
|
United Kingdom 1.7% | | | | | | | |
HSBC Holdings PLC | | Commercial Banks | | 543,656 | | | 9,302,471 |
Provident Financial PLC | | Consumer Finance | | 328,500 | | | 4,237,245 |
| | | | | | |
|
|
| | | | | | | | 13,539,716 |
| | | | | | |
|
|
Total Long Term Investments (Cost $573,199,966) | | | | | | | 787,065,677 |
| | | | | | |
|
|
TD-14
FRANKLIN TEMPLETON VARIABLE INSURANCE PRODUCTS TRUST
TEMPLETON DEVELOPING MARKETS SECURITIES FUND
Statement of Investments, December 31, 2004 (cont.)
| | | | | | |
| | | PRINCIPAL
AMOUNT | | VALUE | |
Short Term Investments (Cost $22,458,325) 2.9% | | | | | | |
U.S. Government and Agency Securities | | | | | | |
cU.S. Treasury Bills, 1/06/05 – 3/31/05 | | $22,506,000 | | $ | 22,463,389 | |
| | | | |
|
|
|
Total Investments (Cost $595,658,291) 100.6% | | | | | 809,529,066 | |
Other Assets, less Liabilities (.6)% | | | | | (4,658,286 | ) |
| | | | |
|
|
|
Net Assets 100.0% | | | | $ | 804,870,780 | |
| | | | |
|
|
|
Portfolio Abbreviations
ADR - American Depository Receipt
GDR - Global Depository Receipt
IDR - International Depository Receipt
| b | See Note 7 regarding other considerations. |
| c | Security is traded on a discount basis with no stated coupon rate. |
See notes to financial statements.
TD-15
FRANKLIN TEMPLETON VARIABLE INSURANCE PRODUCTS TRUST
TEMPLETON DEVELOPING MARKETS SECURITIES FUND
Financial Statements
Statement of Assets and Liabilities
December 31, 2004
| | | | |
Assets: | | | | |
Investments in securities: | | | | |
Cost | | $ | 595,658,291 | |
| | |
|
|
|
Value | | | 809,529,066 | |
Cash | | | 8,216 | |
Foreign currency, at value (cost $513,194) | | | 524,635 | |
Receivables: | | | | |
Investment securities sold | | | 89,395 | |
Capital shares sold | | | 811,182 | |
Dividends | | | 926,376 | |
Foreign income tax receivable | | | 159,393 | |
| | |
|
|
|
Total assets | | | 812,048,263 | |
| | |
|
|
|
Liabilities: | | | | |
Payables: | | | | |
Investment securities purchased | | | 4,731,476 | |
Capital shares redeemed | | | 886,683 | |
Affiliates | | | 974,994 | |
Deferred tax liability | | | 441,892 | |
Other liabilities | | | 142,438 | |
| | |
|
|
|
Total liabilities | | | 7,177,483 | |
| | |
|
|
|
Net assets, at value | | $ | 804,870,780 | |
| | |
|
|
|
Net assets consist of: | | | | |
Undistributed net investment income | | $ | 1,637,611 | |
Net unrealized appreciation (depreciation) | | | 213,443,902 | |
Accumulated net realized gain (loss) | | | (147,539,841 | ) |
Capital shares | | | 737,329,108 | |
| | |
|
|
|
Net assets, at value | | $ | 804,870,780 | |
| | |
|
|
|
Class 1: | | | | |
Net assets, at value | | $ | 477,289,957 | |
| | |
|
|
|
Shares outstanding | | | 54,653,947 | |
| | |
|
|
|
Net asset value and offering price per share | | $ | 8.73 | |
| | |
|
|
|
Class 2: | | | | |
Net assets, at value | | $ | 327,568,647 | |
| | |
|
|
|
Shares outstanding | | | 37,791,471 | |
| | |
|
|
|
Net asset value and offering price per share | | $ | 8.67 | |
| | |
|
|
|
Class 3: | | | | |
Net assets, at value | | $ | 12,176 | |
| | |
|
|
|
Shares outstanding | | | 1,403 | |
| | |
|
|
|
Net asset value and offering price per sharea | | $ | 8.68 | |
| | |
|
|
|
| a | Redemption price is equal to net asset value less any redemption fees retained by the Fund. |
See notes to financial statements.
TD-16
FRANKLIN TEMPLETON VARIABLE INSURANCE PRODUCTS TRUST
TEMPLETON DEVELOPING MARKETS SECURITIES FUND
Financial Statements (continued)
Statement of Operations
for the year ended December 31, 2004
| | | | |
Investment income: | | | | |
Dividends (net of foreign taxes of $2,118,707) | | $ | 18,874,239 | |
Interest | | | 357,121 | |
| | |
|
|
|
Total investment income | | | 19,231,360 | |
| | |
|
|
|
Expenses: | | | | |
Management fees (Note 3) | | | 7,848,740 | |
Administrative fees (Note 3) | | | 874,723 | |
Distribution fees - Class 2 (Note 3) | | | 579,458 | |
Transfer agent fees | | | 10,778 | |
Custodian fees (Note 4) | | | 635,519 | |
Reports to shareholders | | | 234,051 | |
Professional fees | | | 71,409 | |
Trustees’ fees and expenses | | | 3,753 | |
Other | | | 26,158 | |
| | |
|
|
|
Total expenses | | | 10,284,589 | |
Expense reductions (Note 4) | | | (1,831 | ) |
| | |
|
|
|
Net expenses | | | 10,282,758 | |
| | |
|
|
|
Net investment income | | | 8,948,602 | |
| | |
|
|
|
Realized and unrealized gains (losses): | | | | |
Net realized gain (loss) from: | | | | |
Investments (net of foreign taxes of $2,007,158) | | | 51,038,207 | |
Foreign currency transactions | | | (577,452 | ) |
| | |
|
|
|
Net realized gain (loss) | | | 50,460,755 | |
| | |
|
|
|
Net change in unrealized appreciation (depreciation) on: | | | | |
Investments | | | 89,187,217 | |
Translation of assets and liabilities denominated in foreign currencies | | | 34,734 | |
Deferred taxes | | | 1,472,777 | |
| | |
|
|
|
Net change in unrealized appreciation (depreciation) | | | 90,694,728 | |
| | |
|
|
|
Net realized and unrealized gain (loss) | | | 141,155,483 | |
| | |
|
|
|
Net increase (decrease) in net assets resulting from operations | | $ | 150,104,085 | |
| | |
|
|
|
See notes to financial statements.
TD-17
FRANKLIN TEMPLETON VARIABLE INSURANCE PRODUCTS TRUST
TEMPLETON DEVELOPING MARKETS SECURITIES FUND
Financial Statements (continued)
Statements of Changes in Net Assets
for the years ended December 31, 2004 and 2003
| | | | | | | | |
| | | 2004 | | | 2003 | |
| | |
| |
Increase (decrease) in net assets: | | | | | | | | |
Operations: | | | | | | | | |
Net investment income | | $ | 8,948,602 | | | $ | 8,383,604 | |
Net realized gain (loss) from investments and foreign currency transactions | | | 50,460,755 | | | | 18,835,829 | |
Net change in unrealized appreciation (depreciation) on investments, translation of assets and liabilities denominated in foreign currencies, and deferred taxes | | | 90,694,728 | | | | 141,314,261 | |
| | |
|
|
|
Net increase (decrease) in net assets resulting from operations | | | 150,104,085 | | | | 168,533,694 | |
Distributions to shareholders from: | | | | | | | | |
Net investment income: | | | | | | | | |
Class 1 | | | (7,597,672 | ) | | | (3,521,009 | ) |
Class 2 | | | (4,066,275 | ) | | | (1,068,523 | ) |
Class 3 | | | (190 | ) | | | — | |
| | |
| |
Total distributions to shareholders | | | (11,664,137 | ) | | | (4,589,532 | ) |
Capital share transactions: (Note 2) | | | | | | | | |
Class 1 | | | 32,499,304 | | | | 18,051,739 | |
Class 2 | | | 103,669,110 | | | | 41,851,167 | |
Class 3 | | | 10,000 | | | | — | |
| | |
| |
Total capital share transactions | | | 136,178,414 | | | | 59,902,906 | |
Net increase (decrease) in net assets | | | 274,618,362 | | | | 223,847,068 | |
Net assets: | | | | | | | | |
Beginning of year | | | 530,252,418 | | | | 306,405,350 | |
| | |
| |
End of year | | $ | 804,870,780 | | | $ | 530,252,418 | |
| | |
|
|
|
Undistributed net investment income included in net assets: | | | | | | | | |
End of year | | $ | 1,637,611 | | | $ | 5,951,933 | |
| | |
|
|
|
See notes to financial statements.
TD-18
FRANKLIN TEMPLETON VARIABLE INSURANCE PRODUCTS TRUST
TEMPLETON DEVELOPING MARKETS SECURITIES FUND
Notes to Financial Statements
1. ORGANIZATION AND SIGNIFICANT ACCOUNTING POLICIES
Franklin Templeton Variable Insurance Products Trust (the Trust) is registered under the Investment Company Act of 1940 as an open-end investment company, consisting of twenty-one separate series (the Funds). The Templeton Developing Markets Securities Fund (the Fund) included in this report is diversified. The financial statements of the remaining funds in the series are presented separately. Shares of the Fund are sold only to insurance company separate accounts to fund the benefits of variable life insurance policies or variable annuity contracts. The Fund’s investment objective is capital growth.
The following summarizes the Fund’s significant accounting policies.
a. Security Valuation
Securities listed on a securities exchange or on the NASDAQ National Market System are valued at the last quoted sale price or the official closing price of the day, respectively. Over-the-counter securities and listed securities for which there is no reported sale are valued within the range of the most recent quoted bid and ask prices. Securities that trade in multiple markets or on multiple exchanges are valued according to the broadest and most representative market.
U.S. Government securities generally trade in the over-the-counter market rather than on a securities exchange. The Fund may utilize independent pricing services, quotations from bond dealers, and information with respect to bond and note transactions, to assist in determining a current market value for each security. The Fund’s pricing services may use valuation models or matrix pricing which considers information with respect to comparable bond and note transactions, quotations from bond dealers, or by reference to other securities that are considered comparable in such characteristics as rating, interest rate and maturity date, option adjusted spread models, prepayment projections, interest rate spreads and yield curves, to determine current value.
Foreign securities are valued as of the close of trading on the foreign stock exchange on which the security is primarily traded, or the NYSE, whichever is earlier. The value is then converted into its U.S. dollar equivalent at the foreign exchange rate in effect at the close of the NYSE on the day that the value of the foreign security is determined. If no sale is reported at that time, the foreign security will be valued within the range of the most recent quoted bid and ask prices.
The Trust has procedures to determine the fair value of individual securities and other assets for which market prices are not readily available or which may not be reliably priced. Some methods for valuing these securities may include: fundamental analysis, matrix pricing, discounts from market prices of similar securities, or discounts applied due to the nature and duration of restrictions on the disposition of the securities. Occasionally, events occur between the time at which trading in a security is completed and the close of the NYSE that might call into question the availability (including the reliability) of the value of a portfolio security held by the Fund. If such an event occurs, the securities may be valued using fair value procedures, which may include the use of independent pricing services. All security valuation procedures are approved by the Fund’s Board of Trustees.
b. Foreign Currency Translation
Portfolio securities and other assets and liabilities denominated in foreign currencies are translated into U.S. dollars based on the exchange rate of such currencies against U.S. dollars on the date of valuation. Purchases and sales of securities, income and expense items denominated in foreign currencies are translated into U.S. dollars at the exchange rate in effect on the transaction date. Occasionally, events may impact the availability or reliability of foreign exchange rates used to convert the U.S. dollar equivalent value. If such an event occurs, the foreign exchange rate will be valued at fair value using procedures established and approved by the Fund’s Board of Trustees.
The Fund does not separately report the effect of changes in foreign exchange rates from changes in market prices on securities held. Such changes are included in net realized and unrealized gain or loss from investments on the Statement of Operations.
Realized foreign exchange gains or losses arise from sales of foreign currencies, currency gains or losses realized between the trade and settlement dates on securities transactions and the difference between the recorded amounts of dividends, interest, and
TD-19
FRANKLIN TEMPLETON VARIABLE INSURANCE PRODUCTS TRUST
TEMPLETON DEVELOPING MARKETS SECURITIES FUND
Notes to Financial Statements (continued)
1. ORGANIZATION AND SIGNIFICANT ACCOUNTING POLICIES (cont.)
b. Foreign Currency Translation (continued)
foreign withholding taxes and the U.S. dollar equivalent of the amounts actually received or paid. Net unrealized foreign exchange gains and losses arise from changes in foreign exchange rates on foreign denominated assets and liabilities other than investments in securities held at the end of the reporting period.
c. Foreign Currency Contracts
When the Fund purchases or sells foreign securities it may enter into foreign exchange contracts to minimize foreign exchange risk from the trade date to the settlement date of the transactions. A foreign exchange contract is an agreement between two parties to exchange different currencies at an agreed upon exchange rate on a specified date. Realized and unrealized gains and losses on these contracts are included in the Statement of Operations.
The risks of these contracts include movement in the values of the foreign currencies relative to the U.S. dollar and the possible inability of the counterparties to fulfill their obligations under the contracts.
d. Income and Deferred Taxes
No provision has been made for U.S. income taxes because the Fund’s policy is to qualify as a regulated investment company under Subchapter M of the Internal Revenue Code and to distribute substantially all of its taxable income. Fund distributions to shareholders are determined on an income tax basis and may differ from net investment income and realized gains for financial reporting purposes.
The Fund is subject to a tax imposed on net realized gains of securities of certain foreign countries. The Fund records an estimated deferred tax liability for net unrealized gains on these securities as reflected in the accompanying financial statements.
e. Security Transactions, Investment Income, Expenses and Distributions
Security transactions are accounted for on trade date. Realized gains and losses on security transactions are determined on a specific identification basis. Interest income and estimated expenses are accrued daily. Discounts and premiums on securities purchased are amortized over the lives of the respective securities. Dividend income and distributions to shareholders are recorded on the ex-dividend date.
Common expenses incurred by the Trust are allocated among the Funds based on the ratio of net assets of each fund to the combined net assets. Other expenses are charged to each fund on a specific identification basis.
Realized and unrealized gains and losses and net investment income, other than class specific expenses, are allocated daily to each class of shares based upon the relative proportion of net assets of each class.
f. Accounting Estimates
The preparation of financial statements in accordance with accounting principles generally accepted in the United States of America requires management to make estimates and assumptions that affect the reported amounts of assets and liabilities at the date of the financial statements and the amounts of income and expenses during the reporting period. Actual results could differ from those estimates.
TD-20
FRANKLIN TEMPLETON VARIABLE INSURANCE PRODUCTS TRUST
TEMPLETON DEVELOPING MARKETS SECURITIES FUND
Notes to Financial Statements (continued)
1. ORGANIZATION AND SIGNIFICANT ACCOUNTING POLICIES (cont.)
g. Redemption Fees
Redemptions and exchanges of Class 3 shares held 60 days or less may be subject to the Fund’s redemption fee, which is 1% of the amount redeemed. Such fees are retained by the Fund and accounted for as additional paid-in capital. There were no redemption fees for the year.
h. Guarantees and Indemnifications
Under the Trust’s organizational documents, its officers and trustees are indemnified by the Trust against certain liability arising out of the performance of their duties to the Trust. Additionally, in the normal course of business, the Trust enters into contracts with service providers that contain general indemnification clauses. The Trust’s maximum exposure under these arrangements is unknown as this would involve future claims that may be made against the Trust that have not yet occurred. However, based on experience, the Trust expects the risk of loss to be remote.
2. SHARES OF BENEFICIAL INTEREST
The Fund offers three classes of shares: Class 1 Class 2, and Class 3. Effective May 1, 2004 the Fund began offering a new class of shares, Class 3. Each class of shares differs by its distribution fees, voting rights on matters affecting a single class and its exchange privilege.
At December 31, 2004, there were an unlimited number of shares authorized ($.01 par value). Transactions in the Fund’s shares were as follows:
| | | | | | | | | | | | | | |
| | | Year Ended December 31,
| |
| | | 2004
| | | 2003
| |
| Class 1 Shares: | | Shares
| | | Amount
| | | Shares
| | | Amount
| |
Shares sold | | 8,940,486 | | | $ | 67,520,469 | | | 10,436,573 | | | $ | 60,506,599 | |
Shares issued in reinvestment of distributions | | 1,105,920 | | | | 7,597,672 | | | 652,039 | | | | 3,521,009 | |
Shares redeemed | | (5,740,464 | ) | | | (42,618,837 | ) | | (8,573,395 | ) | | | (45,975,869 | ) |
| | |
| |
Net increase (decrease) | | 4,305,942 | | | $ | 32,499,304 | | | 2,515,217 | | | $ | 18,051,739 | |
| | |
| |
| Class 2 Shares: | | | | | | | | | | | | |
Shares sold | | 21,331,545 | | | $ | 159,905,301 | | | 30,181,277 | | | $ | 163,641,071 | |
Shares issued in reinvestment of distributions | | 595,355 | | | | 4,066,275 | | | 198,398 | | | | 1,068,523 | |
Shares redeemed | | (8,236,506 | ) | | | (60,302,466 | ) | | (23,541,038 | ) | | | (122,858,427 | ) |
| | |
| |
Net increase (decrease) | | 13,690,394 | | | $ | 103,669,110 | | | 6,838,637 | | | $ | 41,851,167 | |
| | |
| |
| Class 3 Shares: | | | | | | | | | | | | |
Shares sold | | 1,403 | | | $ | 10,000 | | | | | | | | |
| | |
| | | | | | | |
Net increase (decrease) | | 1,403 | | | $ | 10,000 | | | | | | | | |
| | |
| | | | | | | |
3. TRANSACTIONS WITH AFFILIATES
Certain officers and trustees of the Fund are also officers and/or directors of the following entities:
| | |
| Entity | | Affiliation |
Templeton Asset Management Ltd. (TAML) | | Investment manager |
Franklin Templeton Services LLC (FT Services) | | Administrative manager |
Franklin Templeton Distributors Inc. (Distributors) | | Principal underwriter |
Franklin Templeton Investor Services LLC (Investor Services) | | Transfer agent |
TD-21
FRANKLIN TEMPLETON VARIABLE INSURANCE PRODUCTS TRUST
TEMPLETON DEVELOPING MARKETS SECURITIES FUND
Notes to Financial Statements (continued)
3. TRANSACTIONS WITH AFFILIATES (cont.)
a. Management Fees
The Fund pays an investment management fee to TAML of 1.25% per year of the average daily net assets of the Fund.
b. Administrative Fees
The Fund pays an administrative fee to FT Services based on the average daily net assets of the Fund as follows:
| | |
| Annualized Fee Rate | | Net Assets |
| .150% | | First $200 million |
| .135% | | Over $200 million, up to and including $700 million |
| .100% | | Over $700 million, up to and including $1.2 billion |
Fees are further reduced on net assets over $1.2 billion.
c. Distribution Fees
The Fund reimburses Distributors up to .25% per year of its average daily net assets of Class 2 and Class 3, for costs incurred in marketing the Fund’s shares under a Rule 12b-1 plan. No payments were made by Class 3 for the period ended December 31, 2004.
d. Transfer Agent Fees
Investor Services, under terms of an agreement, performs shareholder servicing for the Fund and is not paid by the Fund for the services.
e. Other Affiliated Transactions
At December 31, 2004, Franklin Advisers Inc. owned 100% of Class 3.
4. EXPENSE OFFSET ARRANGEMENT
The Fund has entered into an arrangement with its custodian whereby credits realized as a result of uninvested cash balances are used to reduce a portion of the Fund’s custodian expenses. During the year ended December 31, 2004, the custodian fees were reduced as noted in the Statement of Operations.
5. INCOME TAXES
At December 31, 2004, the Fund had tax basis capital losses which may be carried over to offset future capital gains. Such losses expire as follows:
| | | |
Capital loss carryovers expiring in: | | | |
2007 | | $ | 58,738,810 |
2009 | | | 62,323,035 |
2010 | | | 24,246,197 |
| | |
|
|
| | | $ | 145,308,042 |
| | |
|
|
TD-22
FRANKLIN TEMPLETON VARIABLE INSURANCE PRODUCTS TRUST
TEMPLETON DEVELOPING MARKETS SECURITIES FUND
Notes to Financial Statements (continued)
5. INCOME TAXES (cont.)
At December 31, 2004, the Fund had deferred capital and currency losses occurring subsequent to October 31, 2004 of $650,185 and $142,382, respectively. For tax purposes, such losses will be reflected in the year ending December 31, 2005.
The tax character of distributions paid during the years ended December 31, 2004 and 2003, was as follows:
| | | | | | |
| | | 2004
| | 2003
|
Distributions paid from ordinary income | | $ | 11,664,137 | | $ | 4,589,532 |
| | |
|
Net investment income (loss) differs for financial statement and tax purposes primarily due to differing treatments of foreign currency transactions and passive foreign investment company shares.
Net realized gains (losses) differ for financial statement and tax purposes primarily due to differing treatments of wash sales, foreign currency transactions and passive foreign investment company shares.
At December 31, 2004, the cost of investments, net unrealized appreciation (depreciation), and undistributed ordinary income for income tax purposes were as follows:
| | | | |
Cost of investments | | $ | 607,326,405 | |
| | |
|
|
|
Unrealized appreciation | | $ | 206,582,379 | |
Unrealized depreciation | | | (4,379,718 | ) |
| | |
|
|
|
Net unrealized appreciation (depreciation) | | $ | 202,202,661 | |
| | |
|
|
|
Distributable earnings - undistributed ordinary income | | $ | 11,866,491 | |
| | |
|
|
|
6. INVESTMENT TRANSACTIONS
Purchases and sales of investments (excluding short-term securities) for the year ended December 31, 2004, aggregated $480,021,270 and $335,018,988, respectively.
7. OTHER CONSIDERATIONS
TAML, as the Fund’s Manager, may serve as a member on the board of directors of certain companies in which the Fund invests and/or may represent the Fund in certain corporate negotiations. At December 31, 2004, the Manager serves in one or more of these capacities for Lukoil Holdings. As a result of this involvement, the Manager may be in possession of certain material non-public information which, pursuant to the Fund’s policies and the requirements of the federal securities laws, could prevent the Fund from trading in the securities of such companies for limited or extended periods of time.
8. REGULATORY MATTERS
Investigations
As part of various investigations by a number of federal, state, and foreign regulators and governmental entities, including the Securities and Exchange Commission (“SEC”), the California Attorney General’s Office (“CAGO”), and the National Association of Securities Dealers, Inc. (“NASD”), relating to certain practices in the mutual fund industry, including late trading, market timing and marketing support payments to securities dealers who sell fund shares, Franklin Resources, Inc. and certain of its subsidiaries (as used in this section, together, the “Company”), as well as certain current or former executives and employees of the Company, received subpoenas and/or requests for documents, information and/or testimony. The Company and its current employees provided documents and information in response to those requests and subpoenas.
TD-23
FRANKLIN TEMPLETON VARIABLE INSURANCE PRODUCTS TRUST
TEMPLETON DEVELOPING MARKETS SECURITIES FUND
Notes to Financial Statements (continued)
8. REGULATORY MATTERS (cont.)
Settlements
Beginning in August 2004, the Company entered into settlements with certain regulators investigating the mutual fund industry practices noted above. The Company believes that settlement of each of the matters described in this section is in the best interest of the Company and shareholders of the Franklin, Templeton, and Mutual Series mutual funds (the “funds”).
On August 2, 2004, Franklin Resources, Inc. announced that its subsidiary, Franklin Advisers, Inc., reached an agreement with the SEC that resolved the issues resulting from the SEC investigation into market timing activity. In connection with that agreement, the SEC issued an “Order Instituting Administrative and Cease-and-Desist Proceedings Pursuant to Sections 203(e) and 203(k) of the Investment Advisers Act of 1940 and Sections 9(b) and 9(f) of the Investment Company Act of 1940, Making Findings and Imposing Remedial Sanctions and a Cease-and-Desist Order” (the “Order”). The SEC’s Order concerned the activities of a limited number of third parties that ended in 2000 and those that were the subject of the first Massachusetts administrative complaint described below.
Under the terms of the SEC’s Order, pursuant to which Franklin Advisers, Inc. neither admitted nor denied any of the findings contained therein, Franklin Advisers, Inc. agreed to pay $50 million, of which $20 million is a civil penalty, to be distributed to shareholders of certain funds in accordance with a plan to be developed by an independent distribution consultant. At this time, it is unclear which funds or which shareholders of any particular fund will receive distributions. The Order also required Franklin Advisers, Inc. to, among other things, enhance and periodically review compliance policies and procedures.
On September 20, 2004, Franklin Resources, Inc. announced that two of its subsidiaries, Franklin Advisers, Inc. and Franklin Templeton Alternative Strategies, Inc. (“FTAS”), reached an agreement with the Securities Division of the Office of the Secretary of the Commonwealth of Massachusetts (the “State of Massachusetts”) related to its administrative complaint filed on February 4, 2004, concerning one instance of market timing that was also a subject of the August 2, 2004 settlement that Franklin Advisers, Inc. reached with the SEC, as described above.
Under the terms of the settlement consent order issued by the State of Massachusetts, Franklin Advisers, Inc. and FTAS consented to the entry of a cease-and-desist order and agreed to pay a $5 million administrative fine to the State of Massachusetts (the “Massachusetts Consent Order”). The Massachusetts Consent Order included two different sections: “Statements of Fact” and “Violations of Massachusetts Securities Laws.” Franklin Advisers, Inc. and FTAS admitted the facts in the Statements of Fact.
On October 25, 2004, the State of Massachusetts filed a second administrative complaint, alleging that Franklin Resources, Inc.’s Form 8-K filing (in which it described the Massachusetts Consent Order and stated that “Franklin did not admit or deny engaging in any wrongdoing”) failed to state that Franklin Advisers, Inc. and FTAS admitted the Statements of Fact portion of the Massachusetts Consent Order (the “Second Complaint”). Franklin Resources, Inc. reached a second agreement with the State of Massachusetts on November 19, 2004, resolving the Second Complaint. As a result of the November 19, 2004 settlement, Franklin Resources, Inc. filed a new Form 8-K. The terms of the Massachusetts Consent Order did not change and there was no monetary fine associated with this second settlement.
On November 17, 2004, Franklin Resources, Inc. announced that Franklin/Templeton Distributors, Inc. (“FTDI”) reached an agreement with the CAGO, resolving the issues resulting from the CAGO’s investigation concerning sales and marketing support payments. Under the terms of the settlement, FTDI neither admitted nor denied the allegations in the CAGO’s complaint and agreed to pay $2 million to the State of California as a civil penalty, $14 million to the funds, to be allocated by an independent distribution consultant to be paid for by FTDI, and $2 million to the CAGO for its investigative costs.
On December 13, 2004, Franklin Resources, Inc. announced that its subsidiaries FTDI and Franklin Advisers, Inc. reached an agreement with the SEC, resolving the issues resulting from the SEC’s investigation concerning marketing support payments to securities dealers who sell fund shares. In connection with that agreement, the SEC issued an “Order Instituting Administrative and Cease-and-Desist Proceedings, Making Findings, and Imposing Remedial Sanctions Pursuant to Sections 203(e) and 203(k)
TD-24
FRANKLIN TEMPLETON VARIABLE INSURANCE PRODUCTS TRUST
TEMPLETON DEVELOPING MARKETS SECURITIES FUND
Notes to Financial Statements (continued)
8. REGULATORY MATTERS (cont.)
Settlements (cont.)
of the Investment Advisers Act of 1940, Sections 9(b) and 9(f) of the Investment Company Act of 1940, and Section 15(b) of the Securities Exchange Act of 1934” (the “Second Order”).
Under the terms of the Second Order, in which FTDI and Franklin Advisers, Inc. neither admitted nor denied the findings contained therein, they agreed to pay the funds a penalty of $20 million and disgorgement of $1 (one dollar). FTDI and Franklin Advisers, Inc. also agreed to implement certain measures and undertakings relating to marketing support payments to broker-dealers for the promotion or sale of fund shares, including making additional disclosures in the funds’ Prospectuses and Statements of Additional Information. The Second Order further requires the appointment of an independent distribution consultant, at the Company’s expense, who shall develop a plan for the distribution of the penalty and disgorgement to the funds.
Other Legal Proceedings
The Trust, in addition to the Company and other funds, and certain current and former officers, employees, and directors have been named in multiple lawsuits in different federal courts in Nevada, California, Illinois, New York and Florida, alleging violations of various federal securities laws and seeking, among other relief, monetary damages, restitution, removal of fund trustees, directors, advisers, administrators, and distributors, rescission of management contracts and 12b-1 Plans, and/or attorneys’ fees and costs. Specifically, the lawsuits claim breach of duty with respect to alleged arrangements to permit market timing and/or late trading activity, or breach of duty with respect to the valuation of the portfolio securities of certain Templeton funds managed by Franklin Resources, Inc. subsidiaries, resulting in alleged market timing activity. The majority of these lawsuits duplicate, in whole or in part, the allegations asserted in the February 4, 2004 Massachusetts administrative complaint and the findings in the SEC’s August 2, 2004 Order, as described above. The lawsuits are styled as class actions, or derivative actions on behalf of either the named funds or Franklin Resources, Inc.
In addition, the Company, as well as certain current and former officers, employees, and directors, have been named in multiple lawsuits alleging violations of various securities laws and pendent state law claims relating to the disclosure of directed brokerage payments and/or payment of allegedly excessive advisory, commission, and distribution fees, and seeking, among other relief, monetary damages, restitution, rescission of advisory contracts, including recovery of all fees paid pursuant to those contracts, an accounting of all monies paid to the named advisers, declaratory relief, injunctive relief, and/or attorneys’ fees and costs. These lawsuits are styled as class actions or derivative actions brought on behalf of certain funds.
The Company and fund management strongly believes that the claims made in each of the lawsuits identified above are without merit and intends to vigorously defend against them. The Company cannot predict with certainty, however, the eventual outcome of the remaining governmental investigations or private lawsuits, nor whether they will have a material negative impact on the Company. Public trust and confidence are critical to the Company’s business and any material loss of investor and/or client confidence could result in a significant decline in assets under management by the Company, which would have an adverse effect on the Company’s future financial results. If the Company finds that it bears responsibility for any unlawful or inappropriate conduct that caused losses to the Trust, it is committed to making the Trust or its shareholders whole, as appropriate. The Company is committed to taking all appropriate actions to protect the interests of its funds’ shareholders.
TD-25
FRANKLIN TEMPLETON VARIABLE INSURANCE PRODUCTS TRUST
TEMPLETON DEVELOPING MARKETS SECURITIES FUND
Report of Independent Registered Public Accounting Firm
To the Trustees and Shareholders of
Franklin Templeton Variable Insurance Products Trust
In our opinion, the accompanying statement of assets and liabilities, including the statement of investments, and the related statements of operations and of changes in net assets and the financial highlights present fairly, in all material respects, the financial position of Templeton Developing Markets Securities Fund (the Fund) (one of the funds constituting Franklin Templeton Variable Insurance Products Trust) at December 31, 2004, the results of its operations for the year then ended, the changes in its net assets for each of the two years in the period then ended and the financial highlights for each of the periods presented, in conformity with accounting principles generally accepted in the United States of America. These financial statements and financial highlights (hereafter referred to as “financial statements”) are the responsibility of the Fund’s management; our responsibility is to express an opinion on these financial statements based on our audits. We conducted our audits of these financial statements in accordance with the standards of the Public Company Accounting Oversight Board (United States). Those standards require that we plan and perform the audits to obtain reasonable assurance about whether the financial statements are free of material misstatement. An audit includes examining, on a test basis, evidence supporting the amounts and disclosures in the financial statements, assessing the accounting principles used and significant estimates made by management, and evaluating the overall financial statement presentation. We believe that our audits, which included confirmation of securities at December 31, 2004 by correspondence with the custodian and brokers, provide a reasonable basis for our opinion.
PricewaterhouseCoopers LLP
San Francisco, California
February 9, 2005
TD-26
FRANKLIN TEMPLETON VARIABLE INSURANCE PRODUCTS TRUST
TEMPLETON DEVELOPING MARKETS SECURITIES FUND
Tax Designation (unaudited)
At December 31, 2004, more than 50% of the Fund’s total assets were invested in securities of foreign issuers. In most instances, foreign taxes were withheld from dividends paid to the Fund on these investments. The Fund elects to treat foreign taxes paid under Section 853 of the Code. This election will allow shareholders of record in June 2005, to treat their proportionate share of foreign taxes paid by the Fund as having been paid directly by them. The shareholder shall consider these amounts as foreign taxes paid in the tax year in which they receive the Fund distribution.
The foreign tax information will be disclosed in the June 2005, semi-annual report of the Fund.
TD-27
TEMPLETON FOREIGN SECURITIES FUND
This annual report for Templeton Foreign Securities Fund covers the fiscal year ended December 31, 2004.
Performance Summary as of 12/31/04
Average annual total return of Class 1 shares* represents the average annual change in value, assuming reinvestment of dividends and capital gains. Average returns smooth out variations in returns, which can be significant; they are not the same as year-by-year results.
Periods ended 12/31/04
| | | | | | |
| | | 1-Year | | 5-Year | | 10-Year |
Average Annual Total Return | | +18.87% | | +1.16% | | +8.89% |
*Performance prior to the 5/1/00 merger reflects the historical performance of Templeton International Fund.
Total Return Index Comparison for Hypothetical $10,000 Investment (1/1/95–12/31/04)
The graph below shows the change in value of a hypothetical $10,000 investment in the Fund over the indicated period and includes reinvestment of any income or distributions. The Fund’s performance* is compared to the performance of the Morgan Stanley Capital International (MSCI) Europe Australasia Far East (EAFE) Index. One cannot invest directly in an index, nor is an index representative of the Fund’s portfolio. Please see Important Notes to Performance Information preceding the Fund Summaries.
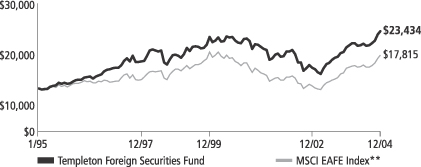
**Source: Standard & Poor’s Micropal. Please see Index Descriptions following the Fund Summaries.
Templeton Foreign Securities Fund – Class 1
Performance reflects the Fund’s Class 1 operating expenses, but does not include any contract fees, expenses or sales charges. If they had been included, performance would be lower. These charges and deductions, particularly for variable life policies, can have a significant effect on contract values and insurance benefits. See the contract prospectus for a complete description of these expenses, including sales charges.
Performance data quoted represent past performance, which does not guarantee future results. Investment return and principal value will fluctuate, and you may have a gain or loss when you sell your shares. Current performance may differ from figures shown.
TF-1
Fund Goal and Main Investments: Templeton Foreign Securities Fund seeks long-term capital growth. The Fund invests predominantly in investments of issuers located outside the U.S., including those in emerging markets.
Performance Overview
You can find the Fund’s total return in the Performance Summary. The Fund underperformed its benchmark, the MSCI EAFE Index, which returned 20.70% for the one-year period under review.1
Economic and Market Overview
The global economic recovery continued in 2004, led by growth in China and the U.S. As of December 31, 2004, U.S. gross domestic product (GDP) had increased for 13 consecutive quarters.2 In China, GDP grew 9.5% in 2004.3
The 12-nation euro zone lagged other regions in the current recovery. However, the European Central Bank projected euro zone growth may be between 1.6% and 2.0% in 2004, compared with only 0.5% in 2003. In Japan, the economy struggled to emerge from a decade-long deflationary period. Although the country’s consumer and business confidence reached their highest levels since 1991, economic growth slowed in response to higher oil prices and reduced external demand. In addition, the U.S. dollar declined approximately 4% versus the yen and 7% versus the euro during 2004.4 This hurt Japanese and European exports into the U.S., as it made their goods more expensive in the world’s biggest market. However, the greenback’s protracted decline should also benefit the U.S. current account deficit by making U.S. goods more competitive in international markets.
Oil prices increased during most of 2004, reaching $56 per barrel in October, but declined to end the year at $43. Higher oil prices triggered investor worries about inflation, decreased spending — due to cautionary consumer and business sentiment — and slower economic and corporate profit growth. As of December 31, 2004, the 12-month moving average price of oil was about $41 per barrel.5
1. Source: Standard & Poor’s Micropal. One cannot invest directly in an index, nor is an index representative of the Fund’s portfolio. Please see Index Descriptions following the Fund Summaries.
2. Source: Bureau of Economic Analysis.
3. Source: National Bureau of Statistics of China.
4. Source: FactSet Research Systems Inc.
5. Source: U.S. Department of Energy.
Fund Risks: Stocks offer the potential for long-term gains but can be subject to short-term up-and-down price movements. Foreign investing involves special risks including currency fluctuations, economic instability, and social and political developments. Emerging markets involve heightened risks due to their relatively smaller size and lesser liquidity. The Fund’s prospectus also includes a description of the main investment risks.
TF-2
In this environment, the MSCI World Index’s total return was 15.25% in U.S. dollars for the 12-month period ended December 31, 2004.6 Emerging markets, as measured by the MSCI Emerging Markets Index, had a one-year total return of 25.95% in U.S. dollars.6 In local currencies, these indexes had notably lower total returns of 11.83% and 16.45% for the same period.6 In 2004, most of the world’s currencies strengthened in relation to the U.S. dollar, which benefited U.S.-based investors of non-U.S. developed and emerging market equities.
Investment Strategy
Our investment philosophy is bottom-up, value-oriented and long-term. In choosing investments, we generally focus on the market price of a company’s securities relative to our evaluation of the company’s potential long-term earnings, asset value and cash flow. Among factors we consider are a company’s historical value measures, including price/earnings ratio, profit margins and liquidation value. We do in-depth research to construct a bargain list from which we buy.
Manager’s Discussion
During the year under review, the Fund benefited from a variety of sectors and individual holdings. For example, strong stock selection in the health care sector aided returns even though we were slightly underweighted compared with the MSCI EAFE Index.7 Among these, the stocks of Mayne Group (sold by period-end) and Ono Pharmaceutical rose on favorable company fundamentals. Merger and acquisition activity in the pharmaceuticals and biotechnology industries was also a boon to certain Fund holdings. For example, the Fund benefited from consolidation in the pharmaceuticals industry when Sanofi acquired Aventis, a long-time portfolio holding. Similarly, UCB acquired Fund holding CellTech Group at a significant premium to its prior-day share price.
Portfolio holdings within the energy sector also provided healthy returns for the Fund as they benefited from steadily rising oil and other energy commodity prices throughout the year.8 Our best performing energy stocks included those of oil and gas companies Eni and Repsol. The Fund’s utilities sector holdings also performed well during the year largely due to healthy earnings growth and a low interest rate environment.9 Our top performers included German multi-utility
6. Source: Standard & Poor’s Micropal. Please see Index Descriptions following the Fund Summaries.
7. In the SOI, the health care sector comprises health care equipment and supplies, and pharmaceuticals.
8. In the SOI, the energy sector comprises energy equipment and services, and oil and gas.
9. In the SOI, the utilities sector comprises electric utilities, and multi-utilities and unregulated power.
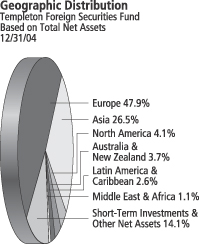
TF-3
E.ON, U.K. power and gas grid operator National Grid Transco, Spanish electric utility Iberdrola and France’s Suez, which provides electricity, natural gas, water and waste management services to more than 130 countries.
In general, if the value of the U.S. dollar goes up compared with a foreign currency, an investment traded in that foreign currency will go down in value because it will be worth fewer U.S. dollars. This can have a negative effect on Fund performance. Conversely, when the U.S. dollar weakens in relation to a foreign currency, an investment traded in that foreign currency will increase in value, which can contribute to Fund performance. For the 12 months ended December 31, 2004, the U.S. dollar declined in value relative to most non-U.S. currencies. At the end of the period, the Fund’s portfolio was invested predominantly in securities with non-U.S. currency exposure, which resulted in a positive effect on Fund performance. However, one cannot expect the same result in future periods.
There were some disappointments and a large cash position that detracted from our overall results. We held approximately 15% in cash (short-term investments and other net assets) for most of 2004, which served as a significant drag in a year when foreign stock markets were quite strong. This uninvested money was, by far, the largest detractor to Fund performance.
Elsewhere, our investments in the consumer staples sector contributed very little to the Fund’s overall return.10 Consumer staples were a small sector weighting in the Fund at less than half the index’s at period-end, but many of the companies within the group were plagued with poor stock performance. Notable laggards during the year included three European companies: U.K.-based supermarket chain J Sainsbury (sold by period-end), U.K. global consumer goods giant Unilever, and Switzerland-based Nestlé, the world’s number-one food company.
Top 10 Holdings
Templeton Foreign Securities Fund
12/31/04
| | |
Company
Sector/Industry,
Country | | % of Total Net Assets |
| |
| Cheung Kong Holdings Ltd. | | 2.3% |
| Real Estate, Hong Kong | | |
| |
| Nippon Telegraph & Telephone Corp. | | 1.7% |
| Diversified Telecommunication Services, Japan | | |
| |
| Sanofi-Aventis | | 1.7% |
| Pharmaceuticals, France | | |
| |
| Samsung Electronics Co. Ltd. | | 1.5% |
| Semiconductors & Semiconductor Equipment, South Korea | | |
| |
| Swiss Reinsurance Co. | | 1.5% |
| Insurance, Switzerland | | |
| |
| Telefonos de Mexico SA de CV (Telmex), L, ADR | | 1.5% |
| Diversified Telecommunication Services, Mexico | | |
| |
| Shell Transport & Trading Co. PLC | | 1.5% |
| Oil & Gas, U.K. | | |
| |
| Denso Corp. | | 1.4% |
| Auto Components, Japan | | |
| |
| BP PLC | | 1.4% |
| Oil & Gas, U.K. | | |
| |
| GlaxoSmithKline PLC | | 1.3% |
| Pharmaceuticals, U.K. | | |
The dollar value, number of shares or principal amount, and names of all portfolio holdings are listed in the Fund’s Statement of Investments.
TF-4
Lastly, some of our holdings within the financials sector, which was significantly underweighted compared with the index at period-end, hurt Fund performance.11 Individual financial stocks that posted positive total returns yet underperformed the index included Bermuda-based insurers XL Capital and ACE Ltd., global banking concern HSBC Holdings (sold by period-end), and South Korea’s Kookmin Bank. Our position in Japanese brokerage Nomura Holdings, on the other hand, posted negative returns during the year.
Thank you for your participation in Templeton Foreign Securities Fund. We look forward to serving your future investment needs.
10. In the SOI, the consumer staples sector comprises food and staples retailing, and food products.
11. In the SOI, the finance sector comprises commercial banks, diversified financial services, capital markets, insurance and real estate.
The foregoing information reflects our analysis, opinions and portfolio holdings as of December 31, 2004, the end of the reporting period. The way we implement our main investment strategies and the resulting portfolio holdings may change depending on factors such as market and economic conditions. These opinions may not be relied upon as investment advice or an offer for a particular security. The information is not a complete analysis of every aspect of any market, country, industry, security or the Fund. Statements of fact are from sources considered reliable, but the adviser makes no representation or warranty as to their completeness or accuracy. Although historical performance is no guarantee of future results, these insights may help you understand our investment management philosophy.
TF-5
Fund Expenses
As an investor in a variable insurance contract (“Contract”) that indirectly provides for investment in an underlying mutual fund, you can incur transaction and/or ongoing expenses at both the Fund level and the Contract level.
| • | | Transaction expenses can include sales charges (loads) on purchases, redemption fees, surrender fees, transfer fees and premium taxes. |
| • | | Ongoing expenses can include management fees, distribution and service (12b-1) fees, contract fees, annual maintenance fees, mortality and expense risk fees and other fees and expenses. All mutual funds and Contracts have some types of ongoing expenses. |
The expenses shown in the table below are meant to highlight ongoing expenses at the Fund level only and do not include ongoing expenses at the Contract level, or transaction expenses at either the Fund or Contract levels. While the Fund does not have transaction expenses, if the transaction and ongoing expenses at the Contract level were included, the expenses shown below would be higher. You should consult your Contract prospectus or disclosure document for more information.
The table shows Fund-level ongoing expenses and can help you understand these expenses and compare them with those of other mutual funds offered through the Contract. The table assumes a $1,000 investment held for the six months indicated. Please refer to the Fund prospectus for additional information on operating expenses.
Actual Fund Expenses
The first line (Actual) for each share class listed in the table below provides actual account values and expenses. The “Ending Account Value” is derived from the Fund’s actual return, which includes the effect of ongoing Fund expenses, but does not include the effect of ongoing Contract expenses.
You can estimate the Fund-level expenses you incurred during the period, by following these steps. Of course, your account value and expenses will differ from those in this illustration:
| 1. | Divide your account value by $1,000. |
If an account had an $8,600 value, then $8,600 ÷ $1,000 = 8.6.
| 2. | Multiply the result by the number under the heading “Fund-Level Expenses Incurred During Period.” |
If Fund-Level Expenses Incurred During Period were $7.50, then 8.6 × $7.50 = $64.50.
Templeton Foreign Securities Fund – Class 1
TF-6
In this illustration, the estimated expenses incurred this period at the Fund level are $64.50.
Hypothetical Example for Comparison with Other Mutual Funds
Information in the second line (Hypothetical) for each class in the table can help you compare ongoing expenses of the Fund with those of other mutual funds offered through the Contract. This information may not be used to estimate the actual ending account balance or expenses you incurred during the period. The hypothetical “Ending Account Value” is based on the actual expense ratio for each class and an assumed 5% annual rate of return before expenses, which does not represent the Fund’s actual return. The figure under the heading “Fund-Level Expenses Incurred During Period” shows the hypothetical expenses your account would have incurred under this scenario. You can compare this figure with the 5% hypothetical examples that appear in shareholder reports of other funds offered through a Contract.
| | | | | | | | | |
| Class 1 | | Beginning
Account
Value 6/30/04 | | Ending
Account
Value 12/31/04 | | Fund-Level
Expenses Incurred
During Period*
6/30/04-12/31/04 |
Actual | | $ | 1,000 | | $ | 1,139.60 | | $ | 4.36 |
Hypothetical (5% return before expenses) | | $ | 1,000 | | $ | 1,021.06 | | $ | 4.12 |
*Expenses are equal to the annualized expense ratio for the Fund’s Class 1 shares (0.81%), which does not include any ongoing expenses of the Contract for which the Fund is an investment option, multiplied by the average account value over the period, multiplied by 184/366 to reflect the one-half year period.
TF-7
FRANKLIN TEMPLETON VARIABLE INSURANCE PRODUCTS TRUST
TEMPLETON FOREIGN SECURITIES FUND
Financial Highlightsa
| | | | | | | | | | | | | | | | | | | | |
| | | Class 1
| |
| | | Year Ended December 31,
| |
| | | 2004 | | | 2003 | | | 2002 | | | 2001 | | | 2000 | |
| | |
|
|
|
Per share operating performance | | | | | | | | | | | | | | | | | | | | |
(for a share outstanding throughout the year) | | | | | | | | | | | | | | | | | | | | |
Net asset value, beginning of year | | $ | 12.37 | | | $ | 9.51 | | | $ | 11.85 | | | $ | 18.78 | | | $ | 22.25 | |
| | |
|
|
|
Income from investment operations: | | | | | | | | | | | | | | | | | | | | |
Net investment incomeb | | | .26 | | | | .19 | | | | .22 | | | | .23 | | | | .40 | |
Net realized and unrealized gains (losses) | | | 2.05 | | | | 2.87 | | | | (2.37 | ) | | | (5.23 | ) | | | (.95 | ) |
| | |
|
|
|
Total from investment operations | | | 2.31 | | | | 3.06 | | | | (2.15 | ) | | | (5.00 | ) | | | (.55 | ) |
| | |
|
|
|
Less distributions from: | | | | | | | | | | | | | | | | | | | | |
Net investment income | | | (.15 | ) | | | (.20 | ) | | | (.19 | ) | | | (.26 | ) | | | (.43 | ) |
Net realized gains | | | — | | | | — | | | | — | | | | (1.67 | ) | | | (2.49 | ) |
| | |
|
|
|
Total distributions | | | (.15 | ) | | | (.20 | ) | | | (.19 | ) | | | (1.93 | ) | | | (2.92 | ) |
| | |
|
|
|
Redemption fees | | | — | d | | | — | | | | — | | | | — | | | | — | |
| | |
|
|
|
Net asset value, end of year | | $ | 14.53 | | | $ | 12.37 | | | $ | 9.51 | | | $ | 11.85 | | | $ | 18.78 | |
| | |
|
|
|
| | | | | |
Total returnc | | | 18.87% | | | | 32.55% | | | | (18.40)% | | | | (15.75)% | | | | (2.19)% | |
Ratios/supplemental data | | | | | | | | | | | | | | | | | | | | |
Net assets, end of year (000’s) | | $ | 506,456 | | | $ | 472,665 | | | $ | 397,420 | | | $ | 565,220 | | | $ | 776,495 | |
Ratios to average net assets: | | | | | | | | | | | | | | | | | | | | |
Expenses | | | .82% | | | | .87% | | | | .88% | | | | .90% | | | | .87% | |
Net investment income | | | 1.95% | | | | 1.81% | | | | 1.97% | | | | 1.59% | | | | 2.08% | |
Portfolio turnover rate | | | 10.91% | | | | 18.01% | | | | 28.12% | | | | 20.00% | | | | 32.81% | |
| a | Financial highlights presented reflect historical financial information from Templeton Variable Products Series Fund (TVP) – Templeton International Securities Fund as a result of a merger on May 1, 2000. |
| b | Based on average daily shares outstanding. |
| c | Total return does not include any fees, charges or expenses imposed by the variable annuity and life insurance contracts for which the Franklin Templeton Variable Insurance Products Trust serves as an underlying investment vehicle. Total return is not annualized for periods less than one year. |
| d | Amount is less than $.001 per share. |
See notes to financial statements.
TF-8
FRANKLIN TEMPLETON VARIABLE INSURANCE PRODUCTS TRUST
TEMPLETON FOREIGN SECURITIES FUND
Financial Highlightsa (continued)
| | | | | | | | | | | | | | | | | | | | |
| | | Class 2
| |
| | | Year Ended December 31,
| |
| | | 2004 | | | 2003 | | | 2002 | | | 2001 | | | 2000 | |
| | |
|
|
|
Per share operating performance | | | | | | | | | | | | | | | | | | | | |
(for a share outstanding throughout the year) | | | | | | | | | | | | | | | | | | | | |
Net asset value, beginning of year | | $ | 12.24 | | | $ | 9.42 | | | $ | 11.74 | | | $ | 18.67 | | | $ | 22.13 | |
| | |
|
|
|
Income from investment operations: | | | | | | | | | | | | | | | | | | | | |
Net investment incomeb | | | .22 | | | | .15 | | | | .17 | | | | .18 | | | | .31 | |
Net realized and unrealized gains (losses) | | | 2.03 | | | | 2.85 | | | | (2.32 | ) | | | (5.21 | ) | | | (.90 | ) |
| | |
|
|
|
Total from investment operations | | | 2.25 | | | | 3.00 | | | | (2.15 | ) | | | (5.03 | ) | | | (.59 | ) |
| | |
|
|
|
Less distributions from: | | | | | | | | | | | | | | | | | | | | |
Net investment income | | | (.14 | ) | | | (.18 | ) | | | (.17 | ) | | | (.23 | ) | | | (.38 | ) |
Net realized gains | | | — | | | | — | | | | — | | | | (1.67 | ) | | | (2.49 | ) |
| | |
|
|
|
Total distributions | | | (.14 | ) | | | (.18 | ) | | | (.17 | ) | | | (1.90 | ) | | | (2.87 | ) |
| | |
|
|
|
Redemption fees | | | — | d | | | — | | | | — | | | | — | | | | — | |
| | |
|
|
|
Net asset value, end of year | | $ | 14.35 | | | $ | 12.24 | | | $ | 9.42 | | | $ | 11.74 | | | $ | 18.67 | |
| | |
|
|
|
| | | | | |
Total returnc | | | 18.53% | | | | 32.21% | | | | (18.56)% | | | | (15.99)% | | | | (2.38)% | |
Ratios/supplemental data | | | | | | | | | | | | | | | | | | | | |
Net assets, end of year (000’s) | | $ | 1,445,928 | | | $ | 653,594 | | | $ | 299,760 | | | $ | 225,505 | | | $ | 187,115 | |
Ratios to average net assets: | | | | | | | | | | | | | | | | | | | | |
Expenses | | | 1.07% | | | | 1.12% | | | | 1.13% | | | | 1.15% | | | | 1.12% | |
Net investment income | | | 1.70% | | | | 1.56% | | | | 1.72% | | | | 1.32% | | | | 1.66% | |
Portfolio turnover rate | | | 10.91% | | | | 18.01% | | | | 28.12% | | | | 20.00% | | | | 32.81% | |
| a | Financial highlights presented reflect historical financial information from Templeton Variable Products Series Fund (TVP) – Templeton International Securities Fund as a result of a merger on May 1, 2000. |
| b | Based on average daily shares outstanding. |
| c | Total return does not include any fees, charges or expenses imposed by the variable annuity and life insurance contracts for which the Franklin Templeton Variable Insurance Products Trust serves as an underlying investment vehicle. Total return is not annualized for periods less than one year. |
| d | Amount is less than $.001 per share. |
See notes to financial statements.
TF-9
FRANKLIN TEMPLETON VARIABLE INSURANCE PRODUCTS TRUST
TEMPLETON FOREIGN SECURITIES FUND
Financial Highlights (continued)
| | | | |
| | | Class 3
| |
| | | Period Ended December 31, 2004c
| |
Per share operating performance | | | | |
(for a share outstanding throughout the period) | | | | |
Net asset value, beginning of period | | $ | 12.48 | |
| | |
|
|
|
Income from investment operations: | | | | |
Net investment incomea | | | .09 | |
Net realized and unrealized gains (losses) | | | 1.92 | |
| | |
|
|
|
Total from investment operations | | | 2.01 | |
| | |
|
|
|
Less distributions from net investment income | | | (.14 | ) |
| | |
|
|
|
Redemption fees | | | — | d |
| | |
|
|
|
Net asset value, end of period | | $ | 14.35 | |
| | |
|
|
|
| |
Total returnb | | | 16.25% | |
Ratios/supplemental data | | | | |
Net assets, end of period (000’s) | | $ | 16,559 | |
Ratios to average net assets: | | | | |
Expenses | | | 1.07%e | |
Net investment income | | | 1.70%e | |
Portfolio turnover rate | | | 10.91% | |
| a | Based on average daily shares outstanding. |
| b | Total return does not include any fees, charges or expenses imposed by the variable annuity and life insurance contracts for which the Franklin Templeton Variable Insurance Products Trust serves as an underlying investment vehicle. Total return is not annualized for periods less than one year. |
| c | For the period May 1, 2004 (effective date) to December 31, 2004. |
| d | Amount is less than $.001 per share. |
See notes to financial statements.
TF-10
FRANKLIN TEMPLETON VARIABLE INSURANCE PRODUCTS TRUST
TEMPLETON FOREIGN SECURITIES FUND
Statement of Investments, December 31, 2004
| | | | | | | |
| | | COUNTRY | | SHARES | | VALUE |
Common Stocks 84.5% | | | | | | | |
Aerospace & Defense 1.2% | | | | | | | |
BAE Systems PLC | | United Kingdom | | 3,544,411 | | $ | 15,681,729 |
aRolls-Royce Group PLC | | United Kingdom | | 1,729,900 | | | 8,201,568 |
aRolls-Royce Group PLC, B | | United Kingdom | | 55,010,820 | | | 107,703 |
| | | | | | |
|
|
| | | | | | | | 23,991,000 |
| | | | | | |
|
|
Air Freight & Logistics .9% | | | | | | | |
Deutsche Post AG | | Germany | | 753,313 | | | 17,235,056 |
| | | | | | |
|
|
Airlines .4% | | | | | | | |
Qantas Airways Ltd. | | Australia | | 3,060,000 | | | 8,886,228 |
| | | | | | |
|
|
Auto Components 3.4% | | | | | | | |
Autoliv Inc., SDR | | Sweden | | 393,611 | | | 18,840,149 |
Denso Corp. | | Japan | | 1,044,800 | | | 28,002,109 |
GKN PLC | | United Kingdom | | 4,440,200 | | | 20,156,384 |
| | | | | | |
|
|
| | | | | | | | 66,998,642 |
| | | | | | |
|
|
Automobiles .4% | | | | | | | |
Volkswagen AG | | Germany | | 181,815 | | | 8,228,207 |
| | | | | | |
|
|
Capital Markets 2.5% | | | | | | | |
Amvescap PLC | | United Kingdom | | 2,575,100 | | | 15,854,031 |
Nomura Holdings Inc. | | Japan | | 1,327,730 | | | 19,367,590 |
UBS AG | | Switzerland | | 161,000 | | | 13,429,036 |
| | | | | | |
|
|
| | | | | | | | 48,650,657 |
| | | | | | |
|
|
Chemicals 3.0% | | | | | | | |
Akzo Nobel NV | | Netherlands | | 329,003 | | | 14,009,817 |
BASF AG | | Germany | | 324,369 | | | 23,293,719 |
Bayer AG, Br. | | Germany | | 333,400 | | | 11,265,348 |
Lonza Group AG | | Switzerland | | 173,400 | | | 9,743,711 |
| | | | | | |
|
|
| | | | | | | | 58,312,595 |
| | | | | | |
|
|
Commercial Banks 6.5% | | | | | | | |
Banco Santander Central Hispano SA | | Spain | | 1,919,500 | | | 23,781,462 |
DBS Group Holdings Ltd. | | Singapore | | 1,312,000 | | | 12,940,758 |
aHana Bank | | South Korea | | 684,000 | | | 17,047,141 |
aKookmin Bank, ADR | | South Korea | | 314,560 | | | 12,293,005 |
Lloyds TSB Group PLC | | United Kingdom | | 1,387,500 | | | 12,597,173 |
National Australia Bank Ltd. | | Australia | | 865,300 | | | 19,520,133 |
Nordea Bank AB, FDR | | Sweden | | 2,135,083 | | | 21,599,419 |
Shinsei Bank Ltd. | | Japan | | 1,325,000 | | | 9,029,974 |
| | | | | | |
|
|
| | | | | | | | 128,809,065 |
| | | | | | |
|
|
Commercial Services & Supplies 1.7% | | | | | | | |
Rentokil Initial PLC | | United Kingdom | | 6,633,900 | | | 18,813,750 |
Securitas AB, B | | Sweden | | 809,980 | | | 13,898,538 |
| | | | | | |
|
|
| | | | | | | | 32,712,288 |
| | | | | | |
|
|
Computers & Peripherals 1.3% | | | | | | | |
Compal Electronics Inc. | | Taiwan | | 11,949,000 | | | 11,915,171 |
Lite-on Technology Corp. | | Taiwan | | 6,751,000 | | | 7,199,085 |
NEC Corp. | | Japan | | 1,058,000 | | | 6,580,219 |
| | | | | | |
|
|
| | | | | | | | 25,694,475 |
| | | | | | |
|
|
TF-11
FRANKLIN TEMPLETON VARIABLE INSURANCE PRODUCTS TRUST
TEMPLETON FOREIGN SECURITIES FUND
Statement of Investments, December 31, 2004 (cont.)
| | | | | | | |
| | | COUNTRY | | SHARES | | VALUE |
Common Stocks (cont.) | | | | | | | |
Construction Materials .6% | | | | | | | |
Cemex SA, ADR | | Mexico | | 315,900 | | $ | 11,505,078 |
| | | | | | |
|
|
Diversified Financial Services .7% | | | | | | | |
ING Groep NV | | Netherlands | | 450,610 | | | 13,611,489 |
| | | | | | |
|
|
Diversified Telecommunication Services 7.9% | | | | | | | |
BCE Inc. | | Canada | | 815,260 | | | 19,658,414 |
Chunghwa Telecom Co. Ltd., ADR | | Taiwan | | 728,900 | | | 15,343,345 |
KT Corp., ADR | | South Korea | | 420,880 | | | 9,179,393 |
Nippon Telegraph & Telephone Corp. | | Japan | | 7,388 | | | 33,181,800 |
Telecom Corp. of New Zealand Ltd. | | New Zealand | | 2,550,626 | | | 11,263,589 |
Telefonica SA, ADR | | Spain | | 347,913 | | | 19,657,085 |
Telefonos de Mexico SA de CV (Telmex), L, ADR | | Mexico | | 780,969 | | | 29,926,732 |
Telenor ASA | | Norway | | 2,003,100 | | | 18,166,610 |
| | | | | | |
|
|
| | | | | | | | 156,376,968 |
| | | | | | |
|
|
Electric Utilities 3.0% | | | | | | | |
E.ON AG | | Germany | | 188,653 | | | 17,198,215 |
Endesa SA | | Spain | | 547,398 | | | 12,843,336 |
Hong Kong Electric Holdings Ltd. | | Hong Kong | | 3,653,500 | | | 16,686,297 |
Iberdrola SA, Br. | | Spain | | 528,222 | | | 13,404,103 |
| | | | | | |
|
|
| | | | | | | | 60,131,951 |
| | | | | | |
|
|
Electrical Equipment .9% | | | | | | | |
Kidde PLC | | United Kingdom | | 2,724,071 | | | 8,705,859 |
aVestas Wind Systems AS | | Denmark | | 502,800 | | | 6,236,677 |
aVestas Wind Systems AS, 144A | | Denmark | | 167,600 | | | 2,078,892 |
| | | | | | |
|
|
| | | | | | | | 17,021,428 |
| | | | | | |
|
|
Electronic Equipment & Instruments 1.4% | | | | | | | |
Hitachi Ltd. | | Japan | | 3,361,867 | | | 23,305,268 |
Venture Corp. Ltd. | | Singapore | | 480,000 | | | 4,675,611 |
| | | | | | |
|
|
| | | | | | | | 27,980,879 |
| | | | | | |
|
|
Energy Equipment & Services .4% | | | | | | | |
IHC Caland NV | | Netherlands | | 115,874 | | | 7,349,442 |
| | | | | | |
|
|
Food & Staples Retailing .8% | | | | | | | |
Boots Group PLC | | United Kingdom | | 1,209,400 | | | 15,193,526 |
| | | | | | |
|
|
Food Products 1.7% | | | | | | | |
Nestle SA | | Switzerland | | 51,790 | | | 13,527,833 |
Unilever PLC | | United Kingdom | | 1,945,434 | | | 19,100,339 |
| | | | | | |
|
|
| | | | | | | | 32,628,172 |
| | | | | | |
|
|
Health Care Equipment & Supplies .9% | | | | | | | |
Olympus Corp. | | Japan | | 861,000 | | | 18,368,336 |
| | | | | | |
|
|
Hotels Restaurants & Leisure 1.0% | | | | | | | |
Compass Group PLC | | United Kingdom | | 4,131,400 | | | 19,527,760 |
| | | | | | |
|
|
Household Durables 3.0% | | | | | | | |
Koninklijke Philips Electronics NV | | Netherlands | | 951,239 | | | 25,184,108 |
Persimmon PLC | | United Kingdom | | 614,500 | | | 8,150,399 |
Sony Corp. | | Japan | | 644,654 | | | 24,925,111 |
| | | | | | |
|
|
| | | | | | | | 58,259,618 |
| | | | | | |
|
|
TF-12
FRANKLIN TEMPLETON VARIABLE INSURANCE PRODUCTS TRUST
TEMPLETON FOREIGN SECURITIES FUND
Statement of Investments, December 31, 2004 (cont.)
| | | | | | | |
| | | COUNTRY | | SHARES | | VALUE |
Common Stocks (cont.) | | | | | | | |
Industrial Conglomerates 2.9% | | | | | | | |
Hutchison Whampoa Ltd. | | Hong Kong | | 1,962,000 | | $ | 18,363,460 |
Smiths Group PLC | | United Kingdom | | 1,293,800 | | | 20,413,521 |
Swire Pacific Ltd., B | | Hong Kong | | 12,648,627 | | | 18,795,240 |
| | | | | | |
|
|
| | | | | | | | 57,572,221 |
| | | | | | |
|
|
Insurance 6.1% | | | | | | | |
ACE Ltd. | | Bermuda | | 558,903 | | | 23,893,103 |
AMP Ltd. | | Australia | | 3,157,400 | | | 17,942,722 |
AXA SA | | France | | 479,792 | | | 11,836,588 |
AXA SA, 144A | | France | | 40,480 | | | 998,652 |
Sompo Japan Insurance Inc. | | Japan | | 1,694,000 | | | 17,267,487 |
Swiss Reinsurance Co. | | Switzerland | | 422,015 | | | 29,938,814 |
XL Capital Ltd., A | | Bermuda | | 232,228 | | | 18,032,504 |
| | | | | | |
|
|
| | | | | | | | 119,909,870 |
| | | | | | |
|
|
IT Services .8% | | | | | | | |
Satyam Computers Services Ltd. | | India | | 1,738,866 | | | 16,480,027 |
| | | | | | |
|
|
Machinery .7% | | | | | | | |
Volvo AB, B | | Sweden | | 369,264 | | | 14,645,614 |
| | | | | | |
|
|
Media 3.7% | | | | | | | |
British Sky Broadcasting Group PLC | | United Kingdom | | 2,237,900 | | | 24,141,038 |
Pearson PLC | | United Kingdom | | 1,008,500 | | | 12,166,345 |
Reed Elsevier NV | | Netherlands | | 877,400 | | | 11,942,032 |
Wolters Kluwer NV | | Netherlands | | 380,280 | | | 7,621,907 |
Yell Group PLC | | United Kingdom | | 2,000,000 | | | 16,891,243 |
| | | | | | |
|
|
| | | | | | | | 72,762,565 |
| | | | | | |
|
|
Metals & Mining 2.2% | | | | | | | |
Alcan Inc. | | Canada | | 55,334 | | | 2,712,836 |
Barrick Gold Corp. | | Canada | | 701,894 | | | 16,971,631 |
BHP Billiton Ltd. | | Australia | | 1,338,050 | | | 16,066,445 |
POSCO, ADR | | South Korea | | 165,547 | | | 7,371,808 |
| | | | | | |
|
|
| | | | | | | | 43,122,720 |
| | | | | | |
|
|
Multi-Utilities & Unregulated Power 2.0% | | | | | | | |
National Grid Transco PLC | | United Kingdom | | 1,742,960 | | | 16,610,612 |
Suez SA | | France | | 861,400 | | | 22,934,196 |
| | | | | | |
|
|
| | | | | | | | 39,544,808 |
| | | | | | |
|
|
Oil & Gas 5.8% | | | | | | | |
BP PLC | | United Kingdom | | 2,849,920 | | | 27,789,154 |
Eni SpA | | Italy | | 845,840 | | | 21,142,557 |
Repsol YPF SA | | Spain | | 902,215 | | | 23,457,688 |
Shell Transport & Trading Co. PLC | | United Kingdom | | 3,458,953 | | | 29,478,581 |
Total SA, B | | France | | 54,077 | | | 11,792,561 |
| | | | | | |
|
|
| | | | | | | | 113,660,541 |
| | | | | | |
|
|
Paper & Forest Products 2.1% | | | | | | | |
Stora Enso OYJ, R | | Finland | | 1,305,230 | | | 19,940,823 |
UPM-Kymmene Corp. | | Finland | | 1,013,779 | | | 22,492,654 |
| | | | | | |
|
|
| | | | | | | | 42,433,477 |
| | | | | | |
|
|
TF-13
FRANKLIN TEMPLETON VARIABLE INSURANCE PRODUCTS TRUST
TEMPLETON FOREIGN SECURITIES FUND
Statement of Investments, December 31, 2004 (cont.)
| | | | | | | |
| | | COUNTRY | | SHARES | | VALUE |
Common Stocks (cont.) | | | | | | | |
Pharmaceuticals 5.4% | | | | | | | |
GlaxoSmithKline PLC | | United Kingdom | | 1,131,289 | | $ | 26,535,283 |
Ono Pharmaceutical Co. Ltd. | | Japan | | 299,000 | | | 16,786,272 |
Sanofi-Aventis | | France | | 412,723 | | | 32,931,814 |
Shire Pharmaceuticals Group PLC | | United Kingdom | | 928,000 | | | 9,743,483 |
Takeda Pharmaceutical Co. Ltd. | | Japan | | 401,200 | | | 20,212,771 |
| | | | | | |
|
|
| | | | | | | | 106,209,623 |
| | | | | | |
|
|
Real Estate 2.3% | | | | | | | |
Cheung Kong Holdings Ltd. | | Hong Kong | | 4,570,137 | | | 45,567,314 |
| | | | | | |
|
|
Road & Rail .3% | | | | | | | |
East Japan Railway Co. | | Japan | | 1,100 | | | 6,121,851 |
| | | | | | |
|
|
Semiconductors & Semiconductor Equipment 2.0% | | | | | | | |
Samsung Electronics Co. Ltd. | | South Korea | | 69,750 | | | 30,353,917 |
Taiwan Semiconductor Manufacturing Co. | | Taiwan | | 5,483,234 | | | 8,710,391 |
| | | | | | |
|
|
| | | | | | | | 39,064,308 |
| | | | | | |
|
|
Software 2.3% | | | | | | | |
aCheck Point Software Technologies Ltd. | | Israel | | 842,050 | | | 20,739,691 |
Nintendo Co. Ltd. | | Japan | | 196,000 | | | 24,629,174 |
| | | | | | |
|
|
| | | | | | | | 45,368,865 |
| | | | | | |
|
|
Wireless Telecommunication Services 2.3% | | | | | | | |
China Mobile (Hong Kong) Ltd., fgn. | | China | | 2,932,000 | | | 9,939,559 |
SK Telecom Co. Ltd., ADR | | South Korea | | 546,520 | | | 12,160,070 |
Vodafone Group PLC, ADR | | United Kingdom | | 835,590 | | | 22,878,454 |
| | | | | | |
|
|
| | | | | | | | 44,978,083 |
| | | | | | |
|
|
Total Common Stocks (Cost $1,293,928,767) | | | | | | | 1,664,914,747 |
| | | | | | |
|
|
Preferred Stocks .8% | | | | | | | |
Automobiles .3% | | | | | | | |
Volkswagen AG, pfd. | | Germany | | 160,254 | | | 5,327,882 |
| | | | | | |
|
|
Metals & Mining .5% | | | | | | | |
Cia Vale do Rio Doce, ADR, pfd., A | | Brazil | | 398,376 | | | 9,712,407 |
| | | | | | |
|
|
Total Preferred Stocks (Cost $8,049,893) | | | | | | | 15,040,289 |
| | | | | | |
|
|
Closed End Mutual Funds (Cost $6,368,163) .6% | | | | | | | |
Diversified Financial Services | | | | | | | |
Rodamco Europe NV | | Netherlands | | 164,000 | | | 12,996,798 |
| | | | | | |
|
|
Total Long Term Investments (Cost $1,308,346,823) | | | | | | | 1,692,951,834 |
| | | | | | |
|
|
Short Term Investment (Cost $270,971,187) 13.8% | | | | | | | |
Money Fund | | | | | | | |
bFranklin Institutional Fiduciary Trust Money Market Portfolio | | United States | | 270,971,187 | | | 270,971,187 |
| | | | | | |
|
|
Total Investments (Cost $1,579,318,010) 99.7% | | | | | | | 1,963,923,021 |
Other Assets, less Liabilities .3% | | | | | | | 5,019,832 |
| | | | | | |
|
|
Net Assets 100.0% | | | | | | $ | 1,968,942,853 |
| | | | | | |
|
|
Portfolio Abbreviations:
ADR - American Depository Receipt
FDR - Foreign Depository Receipt
SDR - Special Drawing Rights
| b | See Note 7 regarding investments in Franklin Institutional Fiduciary Trust Money Market Portfolio. |
See notes to financial statements.
TF-14
FRANKLIN TEMPLETON VARIABLE INSURANCE PRODUCTS TRUST
TEMPLETON FOREIGN SECURITIES FUND
Financial Statements
Statement of Assets and Liabilities
December 31, 2004
| | | | |
Assets: | | | | |
Investments in securities: | | | | |
Cost - Unaffiliated issuers | | $ | 1,308,346,823 | |
Cost - Sweep Money Fund (Note 7) | | | 270,971,187 | |
| | |
|
|
|
Total cost of investments | | $ | 1,579,318,010 | |
| | |
|
|
|
Value - Unaffiliated issuers | | $ | 1,692,951,834 | |
Value - Sweep Money Fund (Note 7) | | | 270,971,187 | |
| | |
|
|
|
Total value of investments | | | 1,963,923,021 | |
| | |
|
|
|
Cash | | | 125,592 | |
Foreign currency, at value (cost $2,260,961) | | | 2,508,300 | |
Receivables: | | | | |
Capital shares sold | | | 2,918,340 | |
Dividends | | | 2,635,413 | |
| | |
|
|
|
Total assets | | | 1,972,110,666 | |
| | |
|
|
|
Liabilities: | | | | |
Payables: | | | | |
Investment securities purchased | | | 214,925 | |
Capital shares redeemed | | | 1,149,737 | |
Affiliates | | | 1,450,921 | |
Deferred tax liability | | | 169,581 | |
Other liabilities | | | 182,649 | |
| | |
|
|
|
Total liabilities | | | 3,167,813 | |
| | |
|
|
|
Net assets, at value | | $ | 1,968,942,853 | |
| | |
|
|
|
Net assets consist of: | | | | |
Undistributed net investment income | | $ | 24,955,358 | |
Net unrealized appreciation (depreciation) | | | 384,828,209 | |
Accumulated net realized gain (loss) | | | (107,874,725 | ) |
Capital shares | | | 1,667,034,011 | |
| | |
|
|
|
Net assets, at value | | $ | 1,968,942,853 | |
| | |
|
|
|
Class 1: | | | | |
Net assets, at value | | $ | 506,456,226 | |
| | |
|
|
|
Shares outstanding | | | 34,854,983 | |
| | |
|
|
|
Net asset value and offering price per share | | $ | 14.53 | |
| | |
|
|
|
Class 2: | | | | |
Net assets, at value | | $ | 1,445,927,955 | |
| | |
|
|
|
Shares outstanding | | | 100,737,385 | |
| | |
|
|
|
Net asset value and offering price per share | | $ | 14.35 | |
| | |
|
|
|
Class 3: | | | | |
Net assets, at value | | $ | 16,558,672 | |
| | |
|
|
|
Shares outstanding | | | 1,154,063 | |
| | |
|
|
|
Net asset value and offering price per sharea | | $ | 14.35 | |
| | |
|
|
|
| a | Redemption price is equal to net asset value less any redemption fees retained by the Fund. |
See notes to financial statements.
TF-15
FRANKLIN TEMPLETON VARIABLE INSURANCE PRODUCTS TRUST
TEMPLETON FOREIGN SECURITIES FUND
Financial Statements (continued)
Statement of Operations
for the year ended December 31, 2004
| | | | |
Investment income: | | | | |
Dividends (net of foreign taxes of $4,492,699) | | | | |
Unaffiliated issuers | | $ | 38,283,254 | |
Sweep Money Fund (Note 7) | | | 2,220,093 | |
| | |
|
|
|
Total investment income | | | 40,503,347 | |
| | |
|
|
|
Expenses: | | | | |
Management fees (Note 3) | | | 9,142,311 | |
Administrative fees (Note 3) | | | 1,668,538 | |
Distribution fees: (Note 3) | | | | |
Class 2 | | | 2,462,864 | |
Class 3 | | | 13,407 | |
Transfer agent fees | | | 24,686 | |
Custodian fees (Note 4) | | | 439,081 | |
Reports to shareholders | | | 458,829 | |
Professional fees | | | 116,933 | |
Trustees’ fees and expenses | | | 8,455 | |
Other | | | 64,649 | |
| | |
|
|
|
Total expenses | | | 14,399,753 | |
Expense reductions (Note 4) | | | (6,810 | ) |
| | |
|
|
|
Net expenses | | | 14,392,943 | |
| | |
|
|
|
Net investment income | | | 26,110,404 | |
| | |
|
|
|
Realized and unrealized gains (losses): | | | | |
Net realized gain (loss) from: | | | | |
Investments | | | 39,230,156 | |
Foreign currency transactions | | | 148,337 | |
| | |
|
|
|
Net realized gain (loss) | | | 39,378,493 | |
| | |
|
|
|
Net change in unrealized appreciation (depreciation) on: | | | | |
Investments | | | 215,075,678 | |
Translation of assets and liabilities denominated in foreign currencies | | | 161,257 | |
Deferred taxes | | | 454,828 | |
| | |
|
|
|
Net change in unrealized appreciation (depreciation) | | | 215,691,763 | |
| | |
|
|
|
Net realized and unrealized gain (loss) | | | 255,070,256 | |
| | |
|
|
|
Net increase (decrease) in net assets resulting from operations | | $ | 281,180,660 | |
| | |
|
|
|
See notes to financial statements.
TF-16
FRANKLIN TEMPLETON VARIABLE INSURANCE PRODUCTS TRUST
TEMPLETON FOREIGN SECURITIES FUND
Financial Statements (continued)
Statements of Changes in Net Assets
for the years ended December 31, 2004 and 2003
| | | | | | | | |
| | | 2004 | | | 2003 | |
| | |
| |
Increase (decrease) in net assets: | | | | | | | | |
Operations: | | | | | | | | |
Net investment income | | $ | 26,110,404 | | | $ | 13,945,725 | |
Net realized gain (loss) from investments and foreign currency transactions | | | 39,378,493 | | | | (31,091,065 | ) |
Net change in unrealized appreciation (depreciation) on investments, translation of assets and
liabilities denominated in foreign currencies and deferred taxes | | | 215,691,763 | | | | 272,127,433 | |
| | |
| |
Net increase (decrease) in net assets resulting from operations | | | 281,180,660 | | | | 254,982,093 | |
Distributions to shareholders from: | | | | | | | | |
Net investment income: | | | | | | | | |
Class 1 | | | (5,478,306 | ) | | | (7,698,069 | ) |
Class 2 | | | (10,189,845 | ) | | | (6,848,227 | ) |
Class 3 | | | (37,708 | ) | | | — | |
| | |
| |
Total distributions to shareholders | | | (15,705,859 | ) | | | (14,546,296 | ) |
Capital share transactions: (Note 2) | | | | | | | | |
Class 1 | | | (43,045,841 | ) | | | (35,694,170 | ) |
Class 2 | | | 605,495,077 | | | | 224,338,382 | |
Class 3 | | | 14,758,051 | | | | — | |
| | |
| |
Total capital share transactions | | | 577,207,287 | | | | 188,644,212 | |
Redemption fees | | | 1,304 | | | | — | |
| | |
| |
Net increase (decrease) in net assets | | | 842,683,392 | | | | 429,080,009 | |
Net assets: | | | | | | | | |
Beginning of year | | | 1,126,259,461 | | | | 697,179,452 | |
| | |
| |
End of year | | $ | 1,968,942,853 | | | $ | 1,126,259,461 | |
| | |
| |
Undistributed net investment income included in net assets: | | | | | | | | |
End of year | | $ | 24,955,358 | | | $ | 13,972,294 | |
| | |
| |
See notes to financial statements.
TF-17
FRANKLIN TEMPLETON VARIABLE INSURANCE PRODUCTS TRUST
TEMPLETON FOREIGN SECURITIES FUND
Notes to Financial Statements
1. ORGANIZATION AND SIGNIFICANT ACCOUNTING POLICIES
Franklin Templeton Variable Insurance Products Trust (the Trust) is registered under the Investment Company Act of 1940 as an open-end investment company, consisting of twenty-one separate series (the Funds). Templeton Foreign Securities Fund (the Fund) included in this report is diversified. The financial statements of the remaining funds in the series are presented separately. Shares of the Fund are sold only to insurance company separate accounts to fund the benefits of variable life insurance policies or variable annuity contracts. The Fund’s investment objective is capital growth.
The following summarizes the Fund’s significant accounting policies.
a. Security Valuation
Securities listed on a securities exchange or on the NASDAQ National Market System are valued at the last quoted sale price or the official closing price of the day, respectively. Over-the-counter securities and listed securities for which there is no reported sale are valued within the range of the most recent quoted bid and ask prices. Securities that trade in multiple markets or on multiple exchanges are valued according to the broadest and most representative market. Investments in open-end mutual funds are valued at the closing net asset value.
Foreign securities are valued as of the close of trading on the foreign stock exchange on which the security is primarily traded, or the NYSE, whichever is earlier. The value is then converted into its U.S. dollar equivalent at the foreign exchange rate in effect at the close of the NYSE on the day that the value of the foreign security is determined. If no sale is reported at that time, the foreign security will be valued within the range of the most recent quoted bid and ask prices.
The Trust has procedures to determine the fair value of individual securities and other assets for which market prices are not readily available or which may not be reliably priced. Some methods for valuing these securities may include: fundamental analysis, matrix pricing, discounts from market prices of similar securities, or discounts applied due to the nature and duration of restrictions on the disposition of the securities. Occasionally, events occur between the time at which trading in a security is completed and the close of the NYSE that might call into question the availability (including the reliability) of the value of a portfolio security held by the Fund. If such an event occurs, the securities may be valued using fair value procedures, which may include the use of independent pricing services. All security valuation procedures are approved by the Trust’s Board of Trustees.
b. Foreign Currency Translation
Portfolio securities and other assets and liabilities denominated in foreign currencies are translated into U.S. dollars based on the exchange rate of such currencies against U.S. dollars on the date of valuation. Purchases and sales of securities, income and expense items denominated in foreign currencies are translated into U.S. dollars at the exchange rate in effect on the transaction date. Occasionally events may impact the availability or reliability of foreign exchange rates used to convert the U.S. dollar equivalent value. If such an event occurs, the foreign exchange rate will be valued at fair value using procedures established and approved by the Trust’s Board of Trustees.
The Fund does not separately report the effect of changes in foreign exchange rates from changes in market prices on securities held. Such changes are included in net realized and unrealized gain or loss from investments on the Statement of Operations.
Realized foreign exchange gains or losses arise from sales of foreign currencies, currency gains or losses realized between the trade and settlement dates on securities transactions and the difference between the recorded amounts of dividends, interest, and foreign withholding taxes and the U.S. dollar equivalent of the amounts actually received or paid. Net unrealized foreign exchange gains and losses arise from changes in foreign exchange rates on foreign denominated assets and liabilities other than investments in securities held at the end of the reporting period.
TF-18
FRANKLIN TEMPLETON VARIABLE INSURANCE PRODUCTS TRUST
TEMPLETON FOREIGN SECURITIES FUND
Notes to Financial Statements (continued)
1. ORGANIZATION AND SIGNIFICANT ACCOUNTING POLICIES (cont.)
c. Foreign Currency Contracts
When the Fund purchases or sells foreign securities it may enter into foreign exchange contracts to minimize foreign exchange risk from the trade date to the settlement date of the transactions. A foreign exchange contract is an agreement between two parties to exchange different currencies at an agreed upon exchange rate on a specified date. Realized and unrealized gains and losses on these contracts are included in the Statement of Operations.
The risks of these contracts include movement in the values of the foreign currencies relative to the U.S. dollar and the possible inability of the counterparties to fulfill their obligations under the contracts.
d. Income and Deferred Taxes
No provision has been made for U.S. income taxes because the Fund’s policy is to qualify as a regulated investment company under Sub Chapter M of the Internal Revenue Code and to distribute substantially all of its taxable income. Fund distributions to shareholders are determined on an income tax basis and may differ from net investment income and realized gains for financial reporting purposes.
The Fund is subject to a tax imposed on net realized gains of securities of certain foreign countries. The Fund records an estimated deferred tax liability for net unrealized gains on these securities as reflected in the accompanying financial statements.
e. Security Transactions, Investment Income, Expenses and Distributions
Security transactions are accounted for on trade date. Realized gains and losses on security transactions are determined on a specific identification basis. Interest income and estimated expenses are accrued daily. Dividend income and distributions to shareholders are recorded on the ex-dividend date.
Common expenses incurred by the Trust are allocated among the funds based on the ratio of net assets of each fund to the combined net assets. Other expenses are charged to each fund on a specific identification basis.
Realized and unrealized gains and losses and net investment income, other than class specific expenses, are allocated daily to each class of shares based upon the relative proportion of net assets of each class.
f. Accounting Estimates
The preparation of financial statements in accordance with accounting principles generally accepted in the United States of America requires management to make estimates and assumptions that affect the reported amounts of assets and liabilities at the date of the financial statements and the amounts of income and expenses during the reporting period. Actual results could differ from those estimates.
g. Redemption Fees
Redemptions and exchanges of Class 3 shares held 60 days or less may be subject to the Fund’s redemption fee, which is 1% of the amount redeemed. Such fees are retained by the Fund and accounted for as additional paid-in capital as noted in the Statements of Changes in Net Assets.
h. Guarantees and Indemnifications
Under the Trust’s organizational documents, its officers and trustees are indemnified by the Trust against certain liability arising out of the performance of their duties to the Trust. Additionally, in the normal course of business, the Trust enters into contracts
TF-19
FRANKLIN TEMPLETON VARIABLE INSURANCE PRODUCTS TRUST
TEMPLETON FOREIGN SECURITIES FUND
Notes to Financial Statements (continued)
1. ORGANIZATION AND SIGNIFICANT ACCOUNTING POLICIES (cont.)
h. Guarantees and Indemnifications (cont.)
with service providers that contain general indemnification clauses. The Trust’s maximum exposure under these arrangements is unknown as this would involve future claims that may be made against the Trust that have not yet occurred. However, based on experience, the Trust expects the risk of loss to be remote.
2. SHARES OF BENEFICIAL INTEREST
The Fund offers three classes of shares: Class 1, Class 2, and Class 3. Effective May 1, 2004 the Fund began offering a new class of shares, Class 3. Each class of shares differs by its distribution fees, voting rights on matters affecting a single class and its exchange privilege.
At December 31, 2004, there were an unlimited number of shares authorized ($.01 par value). Transactions in the Fund’s shares were as follows:
| | | | | | | | | | | | | | |
| | | Year Ended December 31,
| |
| | | 2004
| | | 2003
| |
| Class 1 Shares: | | Shares
| | | Amount
| | | Shares
| | | Amount
| |
Shares sold | | 2,258,527 | | | $ | 29,175,787 | | | 4,070,068 | | | $ | 41,441,600 | |
Shares issued in reinvestment of distributions | | 437,215 | | | | 5,478,306 | | | 745,937 | | | | 7,698,069 | |
Shares redeemed | | (6,039,270 | ) | | | (77,699,934 | ) | | (8,386,415 | ) | | | (84,833,839 | ) |
| | |
| |
Net increase (decrease) | | (3,343,528 | ) | | $ | (43,045,841 | ) | | (3,570,410 | ) | | $ | (35,694,170 | ) |
| | |
| |
| Class 2 Shares: | | | | | | | | | | | | |
Shares sold | | 59,591,849 | | | $ | 761,455,379 | | | 77,265,095 | | | $ | 769,052,246 | |
Shares issued in reinvestment of distributions | | 821,762 | | | | 10,189,845 | | | 669,785 | | | | 6,848,227 | |
Shares redeemed | | (13,067,398 | ) | | | (166,150,147 | ) | | (56,376,439 | ) | | | (551,562,091 | ) |
| | |
| |
Net increase (decrease) | | 47,346,213 | | | $ | 605,495,077 | | | 21,558,441 | | | $ | 224,338,382 | |
| | |
| |
| Class 3 Shares:a | | | | | | | | | | | | |
Shares sold | | 1,203,190 | | | $ | 15,372,770 | | | | | | | | |
Shares issued in reinvestment of distributions | | 3,035 | | | | 37,599 | | | | | | | | |
Shares redeemed | | (52,162 | ) | | | (652,318 | ) | | | | | | | |
| | |
| | | | | | | |
Net increase (decrease) | | 1,154,063 | | | $ | 14,758,051 | | | | | | | | |
| | |
| | | | | | | |
| a | For the period May 1, 2004 (effective date) to December 31, 2004. |
3. TRANSACTIONS WITH AFFILIATES
Certain officers and trustees of the Fund are also officers and/or directors of the following entities:
| | |
| Entity | | Affiliation |
Templeton Investment Counsel LLC (TIC) | | Investment manager |
Franklin Templeton Services LLC (FT Services) | | Administrative manager |
Franklin Templeton Distributors Inc. (Distributors) | | Principal underwriter |
Franklin Templeton Investor Services LLC (Investor Services) | | Transfer agent |
TF-20
FRANKLIN TEMPLETON VARIABLE INSURANCE PRODUCTS TRUST
TEMPLETON FOREIGN SECURITIES FUND
Notes to Financial Statements (continued)
3. TRANSACTIONS WITH AFFILIATES (cont.)
a. Management Fees
The Fund pays an investment management fee to TIC based on the average daily net assets of the Fund as follows:
| | |
| Annualized Fee Rate | | Net Assets |
| .750% | | First $200 million |
| .675% | | Over $200 million, up to and including $1.3 billion |
| .600% | | Over $1.3 billion |
b. Administrative Fees
The Fund pays an administrative fee to FT Services based on the average daily net assets of the Fund as follows:
| | |
| Annualized Fee Rate | | Net Assets |
| .150% | | First $200 million |
| .135% | | Over $200 million, up to and including $700 million |
| .100% | | Over $700 million, up to and including $1.2 billion |
| .075% | | Over $1.2 billion |
c. Distribution Fees
The Fund reimburses Distributors up to .25% per year of its average daily net asset of Class 2 and Class 3, for costs incurred in marketing the Fund’s shares under a Rule 12b-1 plan.
d. Transfer Agent Fees
Investor Services, under terms of an agreement, performs shareholder servicing for the Fund and is not paid by the Fund for the services.
4. EXPENSE OFFSET ARRANGEMENT
The Fund has entered into an arrangement with its custodian whereby credits realized as a result of uninvested cash balances are used to reduce a portion of the Fund’s custodian expenses. During the year ended December 31, 2004, the custodian fees were reduced as noted in the Statement of Operations.
5. INCOME TAXES
At December 31, 2004, the Fund had tax basis capital losses which may be carried over to offset future capital gains. Such losses expire as follows:
| | | |
Capital loss carryovers expiring in: | | | |
2010 | | $ | 41,357,645 |
2011 | | | 66,483,700 |
| | |
|
|
| | | $ | 107,841,345 |
| | |
|
At December 31, 2004, the Fund had deferred currency losses occurring subsequent to October 31, 2004 of $33,378. For tax purposes, such losses will be reflected in the year ending December 31, 2005.
TF-21
FRANKLIN TEMPLETON VARIABLE INSURANCE PRODUCTS TRUST
TEMPLETON FOREIGN SECURITIES FUND
Notes to Financial Statements (continued)
5. INCOME TAXES (cont.)
The tax character of distributions paid during the years ended December 31, 2004 and 2003, was as follows:
| | | | | | |
| | | 2004
| | 2003
|
Distributions paid from ordinary income | | $ | 15,705,859 | | $ | 14,546,296 |
| | |
|
Net investment income (loss) and realized gains (losses) differ for financial statement and tax purposes primarily due to differing treatments of foreign currency transactions and passive foreign investment company shares.
At December 31, 2004, the cost of investments, net unrealized appreciation (depreciation), and undistributed ordinary income for income tax purposes were as follows:
| | | | |
Cost of investments | | $ | 1,579,318,010 | |
| | |
|
|
|
Unrealized appreciation | | $ | 414,603,997 | |
Unrealized depreciation | | | (29,998,986 | ) |
| | |
|
|
|
Net unrealized appreciation (depreciation) | | $ | 384,605,011 | |
| | |
|
|
|
Distributable earnings – undistributed ordinary income | | $ | 24,955,154 | |
| | |
| |
6. INVESTMENT TRANSACTIONS
Purchases and sales of investments (excluding short-term securities) for the year ended December 31, 2004, aggregated $631,313,598 and $136,544,183, respectively.
7. INVESTMENTS IN FRANKLIN INSTITUTIONAL FIDUCIARY TRUST MONEY MARKET PORTFOLIO
The Fund may invest in the Franklin Institutional Fiduciary Trust Money Market Portfolio (the Sweep Money Fund), an open-end investment company managed by Franklin Advisers Inc. (an affiliate of the investment manager). Management fees paid by the Fund are reduced on assets invested in the Sweep Money Fund, in an amount not to exceed the management fees paid by the Sweep Money Fund.
8. REGULATORY MATTERS
Investigations
As part of various investigations by a number of federal, state, and foreign regulators and governmental entities, including the Securities and Exchange Commission (“SEC”), the California Attorney General’s Office (“CAGO”), and the National Association of Securities Dealers, Inc. (“NASD”), relating to certain practices in the mutual fund industry, including late trading, market timing and marketing support payments to securities dealers who sell fund shares, Franklin Resources, Inc. and certain of its subsidiaries (as used in this section, together, the “Company”), as well as certain current or former executives and employees of the Company, received subpoenas and/or requests for documents, information and/or testimony. The Company and its current employees provided documents and information in response to those requests and subpoenas.
Settlements
Beginning in August 2004, the Company entered into settlements with certain regulators investigating the mutual fund industry practices noted above. The Company believes that settlement of each of the matters described in this section is in the best interest of the Company and shareholders of the Franklin, Templeton, and Mutual Series mutual funds (the “funds”).
TF-22
FRANKLIN TEMPLETON VARIABLE INSURANCE PRODUCTS TRUST
TEMPLETON FOREIGN SECURITIES FUND
Notes to Financial Statements (continued)
8. REGULATORY MATTERS (cont.)
Settlements (cont.)
On August 2, 2004, Franklin Resources, Inc. announced that its subsidiary, Franklin Advisers, Inc., reached an agreement with the SEC that resolved the issues resulting from the SEC investigation into market timing activity. In connection with that agreement, the SEC issued an “Order Instituting Administrative and Cease-and-Desist Proceedings Pursuant to Sections 203(e) and 203(k) of the Investment Advisers Act of 1940 and Sections 9(b) and 9(f) of the Investment Company Act of 1940, Making Findings and Imposing Remedial Sanctions and a Cease-and-Desist Order” (the “Order”). The SEC’s Order concerned the activities of a limited number of third parties that ended in 2000 and those that were the subject of the first Massachusetts administrative complaint described below.
Under the terms of the SEC’s Order, pursuant to which Franklin Advisers, Inc. neither admitted nor denied any of the findings contained therein, Franklin Advisers, Inc. agreed to pay $50 million, of which $20 million is a civil penalty, to be distributed to shareholders of certain funds in accordance with a plan to be developed by an independent distribution consultant. At this time, it is unclear which funds or which shareholders of any particular fund will receive distributions. The Order also required Franklin Advisers, Inc. to, among other things, enhance and periodically review compliance policies and procedures.
On September 20, 2004, Franklin Resources, Inc. announced that two of its subsidiaries, Franklin Advisers, Inc. and Franklin Templeton Alternative Strategies, Inc. (“FTAS”), reached an agreement with the Securities Division of the Office of the Secretary of the Commonwealth of Massachusetts (the “State of Massachusetts”) related to its administrative complaint filed on February 4, 2004, concerning one instance of market timing that was also a subject of the August 2, 2004 settlement that Franklin Advisers, Inc. reached with the SEC, as described above.
Under the terms of the settlement consent order issued by the State of Massachusetts, Franklin Advisers, Inc. and FTAS consented to the entry of a cease-and-desist order and agreed to pay a $5 million administrative fine to the State of Massachusetts (the “Massachusetts Consent Order”). The Massachusetts Consent Order included two different sections: “Statements of Fact” and “Violations of Massachusetts Securities Laws.” Franklin Advisers, Inc. and FTAS admitted the facts in the Statements of Fact.
On October 25, 2004, the State of Massachusetts filed a second administrative complaint, alleging that Franklin Resources, Inc.’s Form 8-K filing (in which it described the Massachusetts Consent Order and stated that “Franklin did not admit or deny engaging in any wrongdoing”) failed to state that Franklin Advisers, Inc. and FTAS admitted the Statements of Fact portion of the Massachusetts Consent Order (the “Second Complaint”). Franklin Resources, Inc. reached a second agreement with the State of Massachusetts on November 19, 2004, resolving the Second Complaint. As a result of the November 19, 2004 settlement, Franklin Resources, Inc. filed a new Form 8-K. The terms of the Massachusetts Consent Order did not change and there was no monetary fine associated with this second settlement.
On November 17, 2004, Franklin Resources, Inc. announced that Franklin/Templeton Distributors, Inc. (“FTDI”) reached an agreement with the CAGO, resolving the issues resulting from the CAGO’s investigation concerning sales and marketing support payments. Under the terms of the settlement, FTDI neither admitted nor denied the allegations in the CAGO’s complaint and agreed to pay $2 million to the State of California as a civil penalty, $14 million to the funds, to be allocated by an independent distribution consultant to be paid for by FTDI, and $2 million to the CAGO for its investigative costs.
On December 13, 2004, Franklin Resources, Inc. announced that its subsidiaries FTDI and Franklin Advisers, Inc. reached an agreement with the SEC, resolving the issues resulting from the SEC’s investigation concerning marketing support payments to securities dealers who sell fund shares. In connection with that agreement, the SEC issued an “Order Instituting Administrative and Cease-and-Desist Proceedings, Making Findings, and Imposing Remedial Sanctions Pursuant to Sections 203(e) and 203(k) of the Investment Advisers Act of 1940, Sections 9(b) and 9(f) of the Investment Company Act of 1940, and Section 15(b) of the Securities Exchange Act of 1934” (the “Second Order”).
TF-23
FRANKLIN TEMPLETON VARIABLE INSURANCE PRODUCTS TRUST
TEMPLETON FOREIGN SECURITIES FUND
Notes to Financial Statements (continued)
8. REGULATORY MATTERS (cont.)
Settlements (cont.)
Under the terms of the Second Order, in which FTDI and Franklin Advisers, Inc. neither admitted nor denied the findings contained therein, they agreed to pay the funds a penalty of $20 million and disgorgement of $1 (one dollar). FTDI and Franklin Advisers, Inc. also agreed to implement certain measures and undertakings relating to marketing support payments to broker-dealers for the promotion or sale of fund shares, including making additional disclosures in the funds’ Prospectuses and Statements of Additional Information. The Second Order further requires the appointment of an independent distribution consultant, at the Company’s expense, who shall develop a plan for the distribution of the penalty and disgorgement to the funds.
Other Legal Proceedings
The Trust, in addition to the Company and other funds, and certain current and former officers, employees, and directors have been named in multiple lawsuits in different federal courts in Nevada, California, Illinois, New York and Florida, alleging violations of various federal securities laws and seeking, among other relief, monetary damages, restitution, removal of fund trustees, directors, advisers, administrators, and distributors, rescission of management contracts and 12b-1 Plans, and/or attorneys’ fees and costs. Specifically, the lawsuits claim breach of duty with respect to alleged arrangements to permit market timing and/or late trading activity, or breach of duty with respect to the valuation of the portfolio securities of certain Templeton funds managed by Franklin Resources, Inc. subsidiaries, resulting in alleged market timing activity. The majority of these lawsuits duplicate, in whole or in part, the allegations asserted in the February 4, 2004 Massachusetts administrative complaint and the findings in the SEC’s August 2, 2004 Order, as described above. The lawsuits are styled as class actions, or derivative actions on behalf of either the named funds or Franklin Resources, Inc.
In addition, the Company, as well as certain current and former officers, employees, and directors, have been named in multiple lawsuits alleging violations of various securities laws and pendent state law claims relating to the disclosure of directed brokerage payments and/or payment of allegedly excessive advisory, commission, and distribution fees, and seeking, among other relief, monetary damages, restitution, rescission of advisory contracts, including recovery of all fees paid pursuant to those contracts, an accounting of all monies paid to the named advisers, declaratory relief, injunctive relief, and/or attorneys’ fees and costs. These lawsuits are styled as class actions or derivative actions brought on behalf of certain funds.
The Company and fund management strongly believes that the claims made in each of the lawsuits identified above are without merit and intends to vigorously defend against them. The Company cannot predict with certainty, however, the eventual outcome of the remaining governmental investigations or private lawsuits, nor whether they will have a material negative impact on the Company. Public trust and confidence are critical to the Company’s business and any material loss of investor and/or client confidence could result in a significant decline in assets under management by the Company, which would have an adverse effect on the Company’s future financial results. If the Company finds that it bears responsibility for any unlawful or inappropriate conduct that caused losses to the Trust, it is committed to making the Trust or its shareholders whole, as appropriate. The Company is committed to taking all appropriate actions to protect the interests of its funds’ shareholders.
TF-24
FRANKLIN TEMPLETON VARIABLE INSURANCE PRODUCTS TRUST
TEMPLETON FOREIGN SECURITIES FUND
Report of Independent Registered Public Accounting Firm
To the Trustees and Shareholders of
Franklin Templeton Variable Insurance Products Trust
In our opinion, the accompanying statement of assets and liabilities, including the statement of investments, and the related statements of operations and of changes in net assets and the financial highlights present fairly, in all material respects, the financial position of Templeton Foreign Securities Fund (the Fund) (one of the funds constituting Franklin Templeton Variable Insurance Products Trust) at December 31, 2004, the results of its operations for the year then ended, the changes in its net assets for each of the two years in the period then ended and the financial highlights for each of the periods presented, in conformity with accounting principles generally accepted in the United States of America. These financial statements and financial highlights (hereafter referred to as “financial statements”) are the responsibility of the Fund’s management; our responsibility is to express an opinion on these financial statements based on our audits. We conducted our audits of these financial statements in accordance with the standards of the Public Company Accounting Oversight Board (United States). Those standards require that we plan and perform the audits to obtain reasonable assurance about whether the financial statements are free of material misstatement. An audit includes examining, on a test basis, evidence supporting the amounts and disclosures in the financial statements, assessing the accounting principles used and significant estimates made by management, and evaluating the overall financial statement presentation. We believe that our audits, which included confirmation of securities at December 31, 2004 by correspondence with the custodian and brokers, provide a reasonable basis for our opinion.
PricewaterhouseCoopers LLP
San Francisco, California
February 9, 2005
TF-25
FRANKLIN TEMPLETON VARIABLE INSURANCE PRODUCTS TRUST
TEMPLETON FOREIGN SECURITIES FUND
Tax Designation (unaudited)
At December 31, 2004, more than 50% of the Fund’s total assets were invested in securities of foreign issuers. In most instances, foreign taxes were withheld from dividends paid to the Fund on these investments. The Fund elects to treat foreign taxes paid under Section 853 of the Internal Revenue Code. This election will allow shareholders of record in June 2005, to treat their proportionate share of foreign taxes paid by the Fund as having been paid directly by them. The shareholder shall consider these amounts as foreign taxes paid in the tax year in which they receive the Fund distribution.
The foreign tax information will be disclosed in the June 2005, semi-annual report of the Fund.
TF-26
TEMPLETON GLOBAL ASSET ALLOCATION FUND
We are pleased to bring you Templeton Global Asset Allocation Fund’s annual report for the fiscal year ended December 31, 2004.
Performance Summary as of 12/31/04
Average annual total return of Class 1 shares* represents the average annual change in value, assuming reinvestment of dividends and capital gains. Average returns smooth out variations in returns, which can be significant; they are not the same as year-by-year results.
| | | | | | |
| Periods ended 12/31/04 | | 1-Year | | 5-Year | | 10-Year |
Average Annual Total Return | | +15.94% | | +5.89% | | +11.34% |
* Performance prior to the 5/1/00 merger reflects the historical performance of Templeton Asset Allocation Fund.
Total Return Index Comparison
for Hypothetical $10,000 Investment (1/1/95–12/31/04)
The graph below shows the change in value of a hypothetical $10,000 investment in the Fund over the indicated period and includes reinvestment of any income or distributions. The Fund’s performance* is compared to the performance of the Morgan Stanley Capital International (MSCI) All Country (AC) World Index and the J.P. Morgan (JPM) Government Bond Index (GBI) Global. One cannot invest directly in an index, nor is an index representative of the Fund’s portfolio. Please see Important Notes to Performance Information preceding the Fund Summaries.
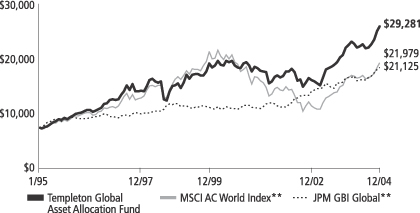
** Sources: Standard & Poor’s Micropal; J.P. Morgan. Please see Index Descriptions following the Fund Summaries.
Templeton Global Asset Allocation Fund – Class 1
Performance reflects the Fund’s Class 1 operating expenses, but does not include any contract fees, expenses or sales charges. If they had been included, performance would be lower. These charges and deductions, particularly for variable life policies, can have a significant effect on contract values and insurance benefits. See the contract prospectus for a complete description of these expenses, including sales charges.
Performance data quoted represent past performance, which does not guarantee future results. Investment return and principal value will fluctuate, and you may have a gain or loss when you sell your shares. Current performance may differ from figures shown.
TGA-1
Fund Goal and Main Investments: Templeton Global Asset Allocation Fund seeks high total return. The Fund invests in equity securities of companies of any country, debt securities of companies and governments of any country, and in money market instruments. The Fund may invest in lower-rated “junk bonds.”
Performance Overview
You can find the Fund’s one-year total return in the Performance Summary. The Fund’s performance was comparable to its broad equity benchmark, the MSCI AC World Index, which returned 15.75% for the year under review, and it outperformed its fixed income benchmark, the JPM GBI Global, which returned 10.10% during the same period.1
Economic and Market Overview
The global economic recovery continued in 2004, led by growth in China and the U.S. As of December 31, 2004, U.S. gross domestic product (GDP) had increased for 13 consecutive quarters.2 In China, GDP grew 9.5% in 2004.3
The 12-nation euro zone lagged other regions in the current recovery. However, the European Central Bank projected euro zone growth may be between 1.6% and 2.0% in 2004, compared with only 0.5% in 2003. In Japan, the economy struggled to emerge from a decade-long deflationary period. Although the country’s consumer and business confidence reached their highest levels since 1991, economic growth slowed in response to higher oil prices and reduced external demand. In addition, the U.S. dollar declined approximately 4% versus the yen and 7% versus the euro during 2004.4 This hurt Japanese and European exports into the U.S., as it made their goods more expensive in the world’s biggest market. However, the greenback’s protracted decline should also benefit the U.S. current account deficit by making U.S. goods more competitive in international markets.
Oil prices increased during most of 2004, reaching $56 per barrel in October, but declined to end the year at $43. Higher oil prices triggered investor worries about inflation, decreased spending — due to cautionary consumer and business sentiment — and slower economic and corporate
1. Sources: Standard & Poor’s Micropal; J.P. Morgan. One cannot invest directly in an index, nor is an index representative of the Fund’s portfolio. Please see Index Descriptions following the Fund Summaries.
2. Source: Bureau of Economic Analysis.
3. Source: National Bureau of Statistics of China.
4. Source: FactSet Research Systems Inc.
Fund Risks: Stocks offer the potential for long-term gains but can be subject to short-term up-and-down price movements. Foreign investing involves special risks including currency fluctuations, economic instability, and social and political developments. Emerging markets involve heightened risks due to their relatively smaller size and lesser liquidity. Bonds and other debt obligations are affected by changes in interest rates and the creditworthiness of their issuers. High yield, lower-rated (junk) bonds generally have greater price swings and higher default risks. The Fund’s prospectus also includes a description of the main investment risks.
TGA-2
profit growth. As of December 31, 2004, the 12-month moving average price of oil was about $41 per barrel.5
In this environment, the MSCI AC World Index’s total return was 15.75% in U.S. dollars for the 12-month period ended December 31, 2004.6 Emerging markets, as measured by the MSCI Emerging Markets Index, had a one-year total return of 25.95% in U.S. dollars.6 In local currencies, these indexes had notably lower total returns of 12.05% and 16.45% for the same period.6 In 2004, most of the world’s currencies strengthened in relation to the U.S. dollar, which benefited U.S.-based investors of non-U.S. developed and emerging market equities.
Global bond markets generated positive returns as global treasury yield curves flattened and most major currencies appreciated relative to the U.S. dollar. The global demand upswing in 2004 favored U.S. exports, which expanded at double-digit rates. However, the U.S. trade and current account balances reached record deficit levels as import volume continued to exceed exports. The magnitude of the current account deficit also remained quite large relative to the country’s economy at nearly 5.6% of GDP.7 The U.S. dollar continued to depreciate over the past year, declining 6.3% against the U.S.’s major trading partners.8
The European Central Bank (ECB) left interest rates unchanged throughout the year. Among the central European and Scandinavian countries, exports and investment experienced robust growth over the year, driving most recent GDP growth estimates for Poland, Sweden and Hungary. Rising inflationary pressures accompanied Poland’s stronger growth, while inflation rates in Hungary slowed and remained low in Sweden and Norway. Additionally, Sweden and Norway maintained impressive current account surpluses at nearly 7% and 13% of GDP.9
In Asia, robust domestic demand and export strength bolstered balance-of-payment positions in countries such as China and Thailand. Both countries experienced building inflationary pressures, prompting the monetary authorities to raise interest rates or implement administrative measures to maintain low inflation. While Asia’s domestic growth conditions led to interest rate increases, the region’s balance-of-payment conditions facilitating international reserve accumulation
5. Source: U.S. Department of Energy.
6. Source: Standard & Poor’s Micropal. Please see Index Descriptions following the Fund Summaries.
7. Source: Bureau of Economic Analysis. For the one year ended 12/31/04.
8. Source: Federal Reserve Board.
9. Sources: Sveriges Riksbank (Sweden); Statistics Sweden; and Statistics Norway.
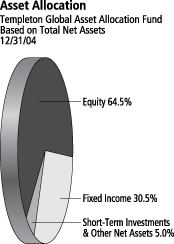
TGA-3
remained intact. Australia and New Zealand were some of the primary beneficiaries of strong commodity prices over the year as commodities comprised much of their exports, and growth remained strong despite higher interest rates.
Investment Strategy
Our investment philosophy is bottom-up, value-oriented and long-term. In choosing equity investments, we will focus on the market price of a company’s securities relative to our evaluation of the company’s potential long-term earnings, asset value and cash flow. Among factors we consider are a company’s historical value measures, including price/earnings ratio, profit margins and liquidation value.
In choosing debt investments, we allocate our assets among issuers, geographic regions and currencies based upon our assessment of relative interest rates among currencies, our outlook for changes in interest rates, and credit risks. With respect to debt securities, we may also from time to time make use of forward currency exchange contracts (Hedging Instruments) for hedging purposes.
Manager’s Discussion
Equity
During the year under review, the Fund benefited from a variety of sectors and individual holdings. For example, portfolio holdings within the energy sector provided healthy returns for the Fund as they benefited from steadily rising oil and other energy commodity prices throughout the year.10 The Fund’s utilities sector holdings also performed well during the year largely due to healthy earnings growth and a low interest rate environment.11 Our top performers included German multi-utility E.ON, U.K. power and gas grid operator National Grid Transco, Spanish electric utility Endesa and France’s Suez, which provides electricity, natural gas, water and waste management services to more than 130 countries.
The Fund’s holdings in the materials sector also boosted returns in 2004 due primarily to rising commodity prices caused by improved global economic growth and a significant increase in demand from China.12 Our top-performing stocks included Australian mining and oil company BHP Billiton; South Korean steel producer POSCO; Companhia Vale do Rio Doce, a diversified Brazilian mining company; and
10. In the SOI, the energy sector comprises oil and gas.
11. In the SOI, the utilities sector comprises electric utilities, and multi-utilities and unregulated power.
12. In the SOI, the materials sector comprises chemicals, containers and packaging, metals and mining, and paper and forest products.
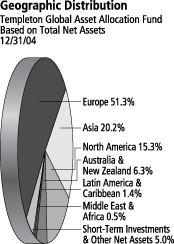
TGA-4
BASF, a Germany-based global manufacturer with interests in chemicals, plastics, and oil and gas exploration.
Industrials stocks were another solid contributor to the Fund’s total returns, even though we were underweighted versus the index.13 Many such companies benefited from improving global economic growth and rising earnings. Our best-performing stocks within the group included BAE Systems, Europe’s largest defense contractor; Volvo, the Swedish manufacturer of vehicles, aircraft and engines; Kidde, a U.K.-based leading global supplier of fire and explosion protection systems; U.K. aircraft engine maker Rolls-Royce; and Boeing, the U.S.-based aerospace and commercial jet manufacturer.
In general, if the value of the U.S. dollar goes up compared with a foreign currency, an investment traded in that foreign currency will go down in value because it will be worth fewer U.S. dollars. This can have a negative effect on Fund performance. Conversely, when the U.S. dollar weakens in relation to a foreign currency, an investment traded in that foreign currency will increase in value, which can contribute to Fund performance. For the 12 months ended December 31, 2004, the U.S. dollar declined in value relative to most non-U.S. currencies. At the end of the period, the Fund’s portfolio was invested predominantly in securities with non-U.S. currency exposure, which resulted in a positive effect on Fund performance. However, one cannot expect the same result in future periods.
Even though the Fund posted double-digit returns this year, there were some disappointments. For example, we had favorable stock selection in information technology (IT) stocks, and our underweighted exposure versus the MSCI AC World Index helped relative performance, but in absolute terms the IT industry underperformed the index.14 Poorer performing Fund holdings included NEC, a Japanese IT solutions provider; Synopsys, the U.S.-based leader in electronic design automation software and services; enterprise management software maker BMC Software; and U.S.-based hard disk drive manufacturer Maxtor.
Elsewhere, our stock selection in the consumer staples sector detracted from the Fund’s overall return.15 Many of the companies within the group performed poorly due to pricing pressure and earnings
13. In the SOI, the industrials sector comprises air freight and logistics, aerospace and defense, commercial services and supplies, electrical equipment, industrial conglomerates, and machinery.
14. In the SOI, the information technology sector comprises computers and peripherals, electronic equipment and instruments, IT services, semiconductors and semiconductor equipment, and software.
15. In the SOI, the consumer staples sector comprises food products.
Top 5 Sectors/Industries
Templeton Global Asset Allocation Fund
Based on Equity Securities
12/31/04
| | |
| | | % of Total Net Assets |
| |
| Media | | 5.5% |
| |
| Commercial Banks | | 4.7% |
| |
| Pharmaceuticals | | 4.7% |
| |
| Diversified Telecommunication Services | | 4.0% |
| |
| Software | | 3.2% |
The dollar value, number of shares or principal amount, and names of all portfolio holdings are listed in the Fund’s Statement of Investments.
TGA-5
disappointments. Notable laggards during the year included three European companies: U.K.-based supermarket chain J Sainsbury, U.K. global consumer goods giant Unilever, and Switzerland-based Nestlé, the world’s number-one food company.
Fixed Income
Interest Rate Strategy
During the reporting period, interest rate policy generally became less accommodative. As economic growth rebounded and an interest rate tightening cycle, particularly in the U.S., became more probable, we reduced the Fund’s overall portfolio duration exposure. Although the Fed raised U.S. interest rates, short-term real interest rates (accounting for inflation) remained negative and the monetary stance still accommodative. Therefore, the Fund remained positioned defensively to a further rise in U.S. interest rates by maintaining a zero allocation to U.S. Treasury securities.
Globally, we found opportunities during the period where interest rate reductions produced positive local market bond returns, or returns in local currency terms, and other instances where interest rate increases facilitated currency gains and overall bond market returns in U.S. dollar terms. During the period, U.S. yields were at historically low levels. Globally, several other international government treasury markets offered substantially higher yields at period-end, which was fairly typical during the reporting period. We felt this situation presented an investment opportunity for the Fund.
Currency Strategy
During the year, currency gains against the U.S. dollar helped global bond markets outperform the U.S. bond market in U.S. dollar terms as well as in local currency terms.
The U.S. sub-index of the JPM GBI Global rose 3.75% compared with other global bond markets’ 10.10% return in U.S. dollars and 4.89% in local currency.16 Consequently, the Fund benefited from its underweighted position in the U.S. relative to the JPM GBI Global.
16. Source: J.P. Morgan. Please see Index Descriptions following the Fund Summaries.
TGA-6
Fund positioning within Europe and Asia benefited relative Fund performance. As the euro rose against the U.S. dollar, we used the currency’s strength to reduce our exposure and reallocate the proceeds to other European (non-euro) and Asian currencies where we believed we saw better value. These non-euro currencies, particularly the Polish zloty, outperformed the euro, benefiting the Fund’s relative performance.
In Asia, the Fund benefited from its lack of exposure to Japan, as Japanese government bonds underperformed the broader market. The Fund continued to increase its allocation to non-Japan Asia during the period given strong regional growth and trade patterns, and to position itself for potential currency appreciation. The Fund also benefited from its overweighted position in South Korea relative to its benchmark.
Global Sovereign Debt Strategy
The Fund also purchased investment-grade and sub-investment grade sovereign debt that typically compensates for greater credit risk by offering higher yields relative to U.S. and European benchmark treasury yield curves. Despite rising U.S. interest rates, U.S. dollar-denominated emerging market debt continued to generate strong returns, rising 11.73% over the period, as measured by the JPM Emerging Markets Bond Index Global (EMBIG).16 Euro-denominated markets also rose, gaining 11.68% in euro terms and 20.51% in U.S. dollar terms, as measured by the JPM Euro EMBIG.16
Regionally, Latin American sovereign debt rose 13.10%, eastern Europe 10.57% and Asia 6.74%.17 The global demand recovery significantly benefited emerging market economies, particularly commodity exporters, supporting growth and in some cases balance of payment and fiscal conditions. As a result, underlying economic and credit fundamentals remained stronger than in previous economic tightening cycles. For example, independent credit rating agency Standard & Poor’s (S&P) upgraded Venezuela’s and Russia’s sovereign debt during the year mainly due to higher oil prices, the alleviation of some political risks in Venezuela and Russia’s prudent fiscal and economic policies. Similarly, S&P also upgraded Ukraine’s rating.
17. Source: J.P. Morgan.
Top 5 Country Holdings
Templeton Global Asset Allocation Fund
Based on Total Net Assets
12/31/04
| | |
| |
| U.S | | 12.7% |
| |
| U.K. | | 9.4% |
| |
| South Korea | | 7.3% |
| |
| Sweden | | 6.9% |
| |
| Japan | | 5.8% |
TGA-7
Although U.S. dollar denominated sovereign debt produced solid returns over the 12-month period, the Fund shortened duration and reallocated away from U.S. dollar-denominated investment-grade and sub-investment grade debt given a greater sensitivity to rising U.S. rates.
Thank you for your participation in Templeton Global Asset Allocation Fund. We look forward to serving your future investment needs.
The foregoing information reflects our analysis, opinions and portfolio holdings as of December 31, 2004, the end of the reporting period. The way we implement our main investment strategies and the resulting portfolio holdings may change depending on factors such as market and economic conditions. These opinions may not be relied upon as investment advice or an offer for a particular security. The information is not a complete analysis of every aspect of any market, country, industry, security or the Fund. Statements of fact are from sources considered reliable, but the adviser makes no representation or warranty as to their completeness or accuracy. Although historical performance is no guarantee of future results, these insights may help you understand our investment management philosophy.
TGA-8
Fund Expenses
As an investor in a variable insurance contract (“Contract”) that indirectly provides for investment in an underlying mutual fund, you can incur transaction and/or ongoing expenses at both the Fund level and the Contract level.
| • | | Transaction expenses can include sales charges (loads) on purchases, redemption fees, surrender fees, transfer fees and premium taxes. |
| • | | Ongoing expenses can include management fees, distribution and service (12b-1) fees, contract fees, annual maintenance fees, mortality and expense risk fees and other fees and expenses. All mutual funds and Contracts have some types of ongoing expenses. |
The expenses shown in the table below are meant to highlight ongoing expenses at the Fund level only and do not include ongoing expenses at the Contract level, or transaction expenses at either the Fund or Contract levels. While the Fund does not have transaction expenses, if the transaction and ongoing expenses at the Contract level were included, the expenses shown below would be higher. You should consult your Contract prospectus or disclosure document for more information.
The table shows Fund-level ongoing expenses and can help you understand these expenses and compare them with those of other mutual funds offered through the Contract. The table assumes a $1,000 investment held for the six months indicated. Please refer to the Fund prospectus for additional information on operating expenses.
Actual Fund Expenses
The first line (Actual) for each share class listed in the table below provides actual account values and expenses. The “Ending Account Value” is derived from the Fund’s actual return, which includes the effect of ongoing Fund expenses, but does not include the effect of ongoing Contract expenses.
You can estimate the Fund-level expenses you incurred during the period, by following these steps. Of course, your account value and expenses will differ from those in this illustration:
| 1. | Divide your account value by $1,000. |
If an account had an $8,600 value, then $8,600 ÷ $1,000 = 8.6.
| 2. | Multiply the result by the number under the heading “Fund-Level Expenses Incurred During Period.” |
If Fund-Level Expenses Incurred During Period were $7.50, then 8.6 × $7.50 = $64.50.
Templeton Global Asset Allocation Fund – Class 1
TGA-9
In this illustration, the estimated expenses incurred this period at the Fund level are $64.50.
Hypothetical Example for Comparison with Other Mutual Funds
Information in the second line (Hypothetical) for each class in the table can help you compare ongoing expenses of the Fund with those of other mutual funds offered through the Contract. This information may not be used to estimate the actual ending account balance or expenses you incurred during the period. The hypothetical “Ending Account Value” is based on the actual expense ratio for each class and an assumed 5% annual rate of return before expenses, which does not represent the Fund’s actual return. The figure under the heading “Fund-Level Expenses Incurred During Period” shows the hypothetical expenses your account would have incurred under this scenario. You can compare this figure with the 5% hypothetical examples that appear in shareholder reports of other funds offered through a Contract.
| | | | | | | | | |
| Class 1 | | Beginning Account Value 6/30/04 | | Ending Account Value 12/31/04 | | Fund-Level Expenses Incurred During Period*
6/30/04-12/31/04 |
Actual | | $ | 1,000 | | $ | 1,133.70 | | $ | 4.56 |
Hypothetical (5% return before expenses) | | $ | 1,000 | | $ | 1,020.86 | | $ | 4.32 |
*Expenses are equal to the annualized expense ratio for the Fund’s Class 1 shares (0.85%), which does not include any ongoing expenses of the Contract for which the Fund is an investment option, multiplied by the average account value over the period, multiplied by 184/366 to reflect the one-half year period.
TGA-10
FRANKLIN TEMPLETON VARIABLE INSURANCE PRODUCTS TRUST
TEMPLETON GLOBAL ASSET ALLOCATION FUND
Financial Highlightsa
| | | | | | | | | | | | | | | | | | | | |
| | | Class 1
| |
| | | Year Ended December 31,
| |
| | | 2004 | | | 2003 | | | 2002 | | | 2001 | | | 2000 | |
| | |
|
|
|
Per share operating performance | | | | | | | | | | | | | | | | | | | | |
(for a share outstanding throughout the year) | | | | | | | | | | | | | | | | | | | | |
Net asset value, beginning of year | | $ | 18.78 | | | $ | 14.59 | | | $ | 15.51 | | | $ | 19.22 | | | $ | 23.37 | |
| | |
|
|
|
Income from investment operations: | | | | | | | | | | | | | | | | | | | | |
Net investment incomeb | | | .48 | | | | .41 | | | | .39 | | | | .38 | d | | | .44 | |
Net realized and unrealized gains (losses) | | | 2.42 | | | | 4.23 | | | | (1.01 | ) | | | (2.16 | )d | | | (.45 | ) |
| | |
|
|
|
Total from investment operations | | | 2.90 | | | | 4.64 | | | | (.62 | ) | | | (1.78 | ) | | | (.01 | ) |
| | |
|
|
|
Less distributions from: | | | | | | | | | | | | | | | | | | | | |
Net investment income | | | (.57 | ) | | | (.45 | ) | | | (.30 | ) | | | (.26 | ) | | | (.52 | ) |
Net realized gains | | | — | | | | — | | | | — | | | | (1.67 | ) | | | (3.62 | ) |
| | |
|
|
|
Total distributions | | | (.57 | ) | | | (.45 | ) | | | (.30 | ) | | | (1.93 | ) | | | (4.14 | ) |
| | |
|
|
|
Net asset value, end of year | | $ | 21.11 | | | $ | 18.78 | | | $ | 14.59 | | | $ | 15.51 | | | $ | 19.22 | |
| | |
|
|
|
| | | | | |
Total returnc | | | 15.94% | | | | 32.31% | | | | (4.17)% | | | | (9.72)% | | | | .29% | |
Ratios/supplemental data | | | | | | | | | | | | | | | | | | | | |
Net assets, end of year (000’s) | | $ | 625,728 | | | $ | 572,798 | | | $ | 425,470 | | | $ | 501,074 | | | $ | 628,244 | |
Ratios to average net assets: | | | | | | | | | | | | | | | | | | | | |
Expenses | | | .84% | | | | .81% | | | | .81% | | | | .81% | | | | .81% | |
Net investment income | | | 2.52% | | | | 2.54% | | | | 2.56% | | | | 2.28% | d | | | 2.20% | |
Portfolio turnover rate | | | 27.43% | | | | 34.25% | | | | 27.27% | | | | 35.63% | | | | 30.32% | |
| a | Financial highlights presented reflect historical financial information from Templeton Variable Products Series Fund (TVP)-Templeton Asset Allocation Fund as a result of a merger on May 1, 2000. |
| b | Based on average daily shares outstanding. |
| c | Total return does not include any fees, charges or expenses imposed by the variable annuity and life insurance contracts for which the Franklin Templeton Variable Insurance Products Trust serves as an underlying investment vehicle. Total return is not annualized for periods less than one year. |
| d | Effective January 1, 2001, the Fund adopted the provisions of the AICPA Audit and Accounting Guide for Investment Companies and began amortizing all premium and discount on fixed-income securities, as required. The effect of this change was as follows: |
| | |
Net investment income per share | | $(.018) |
Net realized and unrealized gains per share | | .018 |
Ratio of net investment income to average net assets | | (.10)% |
Per share data and ratios for prior periods have not been restated to reflect this change in accounting policy.
TGA-11
See notes to financial statements.
FRANKLIN TEMPLETON VARIABLE INSURANCE PRODUCTS TRUST
TEMPLETON GLOBAL ASSET ALLOCATION FUND
Financial Highlights (continued)
| | | | | | | | | | | | | | | | | | | | |
| | | Class 2
| |
| | | Year Ended December 31,
| |
| | | 2004 | | | 2003 | | | 2002 | | | 2001 | | | 2000 | |
| | |
|
|
|
Per share operating performance | | | | | | | | | | | | | | | | | | | | |
(for a share outstanding throughout the year) | | | | | | | | | | | | | | | | | | | | |
Net asset value, beginning of year | | $ | 18.64 | | | $ | 14.49 | | | $ | 15.41 | | | $ | 19.13 | | | $ | 23.27 | |
| | |
| |
Income from investment operations: | | | | | | | | | | | | | | | | | | | | |
Net investment incomeb | | | .43 | | | | .36 | | | | .34 | | | | .33 | d | | | .37 | |
Net realized and unrealized gains (losses) | | | 2.41 | | | | 4.20 | | | | (1.00 | ) | | | (2.15 | )d | | | (.43 | ) |
| | |
|
|
|
Total from investment operations | | | 2.84 | | | | 4.56 | | | | (.66 | ) | | | (1.82 | ) | | | (.06 | ) |
| | |
|
|
|
Less distributions from: | | | | | | | | | | | | | | | | | | | | |
Net investment income | | | (.54 | ) | | | (.41 | ) | | | (.26 | ) | | | (.23 | ) | | | (.46 | ) |
Net realized gains | | | — | | | | — | | | | — | | | | (1.67 | ) | | | (3.62 | ) |
| | |
|
|
|
Total distributions | | | (.54 | ) | | | (.41 | ) | | | (.26 | ) | | | (1.90 | ) | | | (4.08 | ) |
| | |
|
|
|
Net asset value, end of year | | $ | 20.94 | | | $ | 18.64 | | | $ | 14.49 | | | $ | 15.41 | | | $ | 19.13 | |
| | |
|
|
|
| | | | | |
Total returnc | | | 15.72% | | | | 31.95% | | | | (4.39)% | | | | (9.95)% | | | | .04% | |
| | | | | |
Ratios/supplemental data | | | | | | | | | | | | | | | | | | | | |
Net assets, end of year (000’s) | | $ | 65,806 | | | $ | 55,754 | | | $ | 39,926 | | | $ | 38,974 | | | $ | 32,346 | |
Ratios to average net assets: | | | | | | | | | | | | | | | | | | | | |
Expenses | | | 1.09% | | | | 1.06% | | | | 1.06% | | | | 1.06% | | | | 1.07% | |
Net investment income | | | 2.27% | | | | 2.29% | | | | 2.31% | | | | 1.99% | d | | | 1.91% | |
Portfolio turnover rate | | | 27.43% | | | | 34.25% | | | | 27.27% | | | | 35.63% | | | | 30.32% | |
| a | Financial highlights presented reflect historical financial information from Templeton Variable Products Series Fund (TVP)-Templeton Asset Allocation Fund as a result of a merger on May 1, 2000. |
| b | Based on average daily shares outstanding. |
| c | Total return does not include any fees, charges or expenses imposed by the variable annuity and life insurance contracts for which the Franklin Templeton Variable Insurance Products Trust serves as an underlying investment vehicle. Total return is not annualized for periods less than one year. |
| d | Effective January 1, 2001, the Fund adopted the provisions of the AICPA Audit and Accounting Guide for Investment Companies and began amortizing all premium and discount on fixed-income securities, as required. The effect of this change was as follows: |
| | |
Net investment income per share | | $(.018) |
Net realized and unrealized gains per share | | .018 |
Ratio of net investment income to average net assets | | (.10)% |
Per share data and ratios for prior periods have not been restated to reflect this change in accounting policy.
See notes to financial statements.
TGA-12
FRANKLIN TEMPLETON VARIABLE INSURANCE PRODUCTS TRUST
TEMPLETON GLOBAL ASSET ALLOCATION FUND
Statement of Investments, December 31, 2004
| | | | | | | |
| | | COUNTRY | | SHARES | | VALUE |
Common Stocks 64.0% | | | | | | | |
Aerospace & Defense 1.6% | | | | | | | |
BAE Systems PLC | | United Kingdom | | 667,495 | | $ | 2,953,234 |
Boeing Co. | | United States | | 116,600 | | | 6,036,382 |
aRolls-Royce Group PLC | | United Kingdom | | 464,247 | | | 2,201,025 |
aRolls-Royce Group PLC, B | | United Kingdom | | 14,763,054 | | | 28,904 |
| | | | | | |
|
|
| | | | | | | | 11,219,545 |
| | | | | | |
|
|
Air Freight & Logistics .9% | | | | | | | |
Deutsche Post AG | | Germany | | 255,240 | | | 5,839,639 |
| | | | | | |
|
|
Auto Components 1.7% | | | | | | | |
Autoliv Inc., SDR | | Sweden | | 129,000 | | | 6,174,571 |
Valeo SA | | France | | 140,790 | | | 5,884,400 |
| | | | | | |
|
|
| | | | | | | | 12,058,971 |
| | | | | | |
|
|
Automobiles .5% | | | | | | | |
Volkswagen AG | | Germany | | 70,650 | | | 3,197,331 |
| | | | | | |
|
|
Capital Markets 1.6% | | | | | | | |
Amvescap PLC | | United Kingdom | | 587,500 | | | 3,617,041 |
Morgan Stanley | | United States | | 30,900 | | | 1,715,568 |
Nomura Holdings Inc. | | Japan | | 244,600 | | | 3,567,979 |
UBS AG | | Switzerland | | 29,200 | | | 2,435,577 |
| | | | | | |
|
|
| | | | | | | | 11,336,165 |
| | | | | | |
|
|
Chemicals 2.8% | | | | | | | |
Akzo Nobel NV | | Netherlands | | 63,665 | | | 2,711,024 |
BASF AG | | Germany | | 100,840 | | | 7,241,563 |
Bayer AG, Br. | | Germany | | 109,940 | | | 3,714,794 |
Dow Chemical Co. | | United States | | 116,800 | | | 5,782,768 |
| | | | | | |
|
|
| | | | | | | | 19,450,149 |
| | | | | | |
|
|
Commercial Banks 4.7% | | | | | | | |
Banco Santander Central Hispano SA | | Spain | | 445,400 | | | 5,518,241 |
DBS Group Holdings Ltd. | | Singapore | | 476,000 | | | 4,694,970 |
aKookmin Bank, ADR | | South Korea | | 164,670 | | | 6,435,304 |
Lloyds TSB Group PLC | | United Kingdom | | 343,900 | | | 3,122,283 |
National Australia Bank Ltd. | | Australia | | 148,100 | | | 3,340,959 |
Nordea Bank AB, FDR | | Sweden | | 955,960 | | | 9,670,903 |
| | | | | | |
|
|
| | | | | | | | 32,782,660 |
| | | | | | |
|
|
Commercial Services & Supplies 1.9% | | | | | | | |
R.R. Donnelley & Sons Co. | | United States | | 103,660 | | | 3,658,161 |
Rentokil Initial PLC | | United Kingdom | | 1,443,100 | | | 4,092,634 |
Securitas AB, B | | Sweden | | 299,200 | | | 5,134,007 |
| | | | | | |
|
|
| | | | | | | | 12,884,802 |
| | | | | | |
|
|
Computers & Peripherals .8% | | | | | | | |
aMaxtor Corp. | | United States | | 276,400 | | | 1,464,920 |
NEC Corp. | | Japan | | 319,000 | | | 1,984,017 |
aWestern Digital Corp. | | United States | | 216,100 | | | 2,342,524 |
| | | | | | |
|
|
| | | | | | | | 5,791,461 |
| | | | | | |
|
|
Consumer Finance .5% | | | | | | | |
Fannie Mae | | United States | | 50,400 | | | 3,588,984 |
| | | | | | |
|
|
TGA-13
FRANKLIN TEMPLETON VARIABLE INSURANCE PRODUCTS TRUST
TEMPLETON GLOBAL ASSET ALLOCATION FUND
Statement of Investments, December 31, 2004 (cont.)
| | | | | | | |
| | | COUNTRY | | SHARES | | VALUE |
Common Stocks (cont.) | | | | | | | |
Containers & Packaging .9% | | | | | | | |
Temple-Inland Inc. | | United States | | 86,733 | | $ | 5,932,537 |
| | | | | | |
|
|
Diversified Financial Services 1.8% | | | | | | | |
ING Groep NV | | Netherlands | | 210,732 | | | 6,365,541 |
JPMorgan Chase & Co. | | United States | | 154,870 | | | 6,041,478 |
| | | | | | |
|
|
| | | | | | | | 12,407,019 |
| | | | | | |
|
|
Diversified Telecommunication Services 4.0% | | | | | | | |
Chunghwa Telecom Co. Ltd., ADR | | Taiwan | | 141,200 | | | 2,972,260 |
KT Corp., ADR | | South Korea | | 208,260 | | | 4,542,151 |
Nippon Telegraph & Telephone Corp. | | Japan | | 1,152 | | | 5,173,989 |
Nippon Telegraph & Telephone Corp., ADR | | Japan | | 5,680 | | | 128,084 |
Telefonica SA, ADR | | Spain | | 96,339 | | | 5,443,153 |
Telefonos de Mexico SA de CV (Telmex), L, ADR | | Mexico | | 151,858 | | | 5,819,199 |
Telenor ASA | | Norway | | 425,300 | | | 3,857,151 |
| | | | | | |
|
|
| | | | | | | | 27,935,987 |
| | | | | | |
|
|
Electric Utilities 1.9% | | | | | | | |
E.ON AG | | Germany | | 92,290 | | | 8,413,454 |
Endesa SA | | Spain | | 122,000 | | | 2,862,427 |
Endesa SA, ADR | | Spain | | 88,000 | | | 2,047,760 |
| | | | | | |
|
|
| | | | | | | | 13,323,641 |
| | | | | | |
|
|
Electrical Equipment .9% | | | | | | | |
Kidde PLC | | United Kingdom | | 909,500 | | | 2,906,671 |
aVestas Wind Systems AS | | Denmark | | 204,300 | | | 2,534,115 |
aVestas Wind Systems AS, 144A | | Denmark | | 68,100 | | | 844,705 |
| | | | | | |
|
|
| | | | | | | | 6,285,491 |
| | | | | | |
|
|
Electronic Equipment & Instruments .9% | | | | | | | |
Hitachi Ltd. | | Japan | | 845,000 | | | 5,857,743 |
| | | | | | |
|
|
Food Products 1.6% | | | | | | | |
Nestle SA | | Switzerland | | 22,300 | | | 5,824,882 |
Unilever PLC | | United Kingdom | | 513,650 | | | 5,043,034 |
| | | | | | |
|
|
| | | | | | | | 10,867,916 |
| | | | | | |
|
|
Health Care Equipment & Supplies | | | | | | | |
Olympus Corp. | | Japan | | 14,100 | | | 300,806 |
| | | | | | |
|
|
Health Care Providers & Services 1.2% | | | | | | | |
AmerisourceBergen Corp. | | United States | | 70,700 | | | 4,148,676 |
aTenet Healthcare Corp. | | United States | | 376,600 | | | 4,135,068 |
| | | | | | |
|
|
| | | | | | | | 8,283,744 |
| | | | | | |
|
|
Household Durables 1.8% | | | | | | | |
Koninklijke Philips Electronics NV | | Netherlands | | 212,837 | | | 5,634,872 |
Sony Corp. | | Japan | | 41,300 | | | 1,596,837 |
Sony Corp., ADR | | Japan | | 136,900 | | | 5,333,624 |
| | | | | | |
|
|
| | | | | | | | 12,565,333 |
| | | | | | |
|
|
Industrial Conglomerates .9% | | | | | | | |
Swire Pacific Ltd., A | | Hong Kong | | 780,000 | | | 6,522,746 |
| | | | | | |
|
|
TGA-14
FRANKLIN TEMPLETON VARIABLE INSURANCE PRODUCTS TRUST
TEMPLETON GLOBAL ASSET ALLOCATION FUND
Statement of Investments, December 31, 2004 (cont.)
| | | | | | | |
| | | COUNTRY | | SHARES | | VALUE |
Common Stocks (cont.) | | | | | | | |
Insurance 3.1% | | | | | | | |
ACE Ltd. | | Bermuda | | 101,700 | | $ | 4,347,675 |
AXA SA | | France | | 210,734 | | | 5,198,860 |
Swiss Reinsurance Co. | | Switzerland | | 95,570 | | | 6,779,978 |
XL Capital Ltd., A | | Bermuda | | 68,810 | | | 5,343,097 |
| | | | | | |
|
|
| | | | | | | | 21,669,610 |
| | | | | | |
|
|
IT Services 1.1% | | | | | | | |
aBearingPoint Inc. | | United States | | 410,000 | | | 3,292,300 |
Satyam Computers Services Ltd. | | India | | 431,198 | | | 4,086,660 |
| | | | | | |
|
|
| | | | | | | | 7,378,960 |
| | | | | | |
|
|
Leisure Equipment & Products .4% | | | | | | | |
Mattel Inc. | | United States | | 131,100 | | | 2,555,139 |
| | | | | | |
|
|
Machinery 1.1% | | | | | | | |
Atlas Copco AB, A | | Sweden | | 51,630 | | | 2,331,382 |
Volvo AB, B | | Sweden | | 124,268 | | | 4,928,672 |
| | | | | | |
|
|
| | | | | | | | 7,260,054 |
| | | | | | |
|
|
Media 5.5% | | | | | | | |
British Sky Broadcasting Group PLC | | United Kingdom | | 783,600 | | | 8,452,977 |
aComcast Corp. | | United States | | 62,636 | | | 2,084,526 |
aDIRECTV Group Inc. | | United States | | 216,800 | | | 3,629,232 |
John Fairfax Holdings Ltd. | | Australia | | 1,704,780 | | | 6,071,582 |
Pearson PLC | | United Kingdom | | 364,400 | | | 4,396,050 |
Reed Elsevier NV | | Netherlands | | 501,600 | | | 6,827,129 |
aTime Warner Inc. | | United States | | 110,900 | | | 2,155,896 |
Wolters Kluwer NV | | Netherlands | | 215,741 | | | 4,324,071 |
| | | | | | |
|
|
| | | | | | | | 37,941,463 |
| | | | | | |
|
|
Metals & Mining 1.3% | | | | | | | |
Barrick Gold Corp. | | Canada | | 290 | | | 7,012 |
BHP Billiton Ltd. | | Australia | | 551,100 | | | 6,617,255 |
POSCO, ADR | | South Korea | | 57,100 | | | 2,542,663 |
| | | | | | |
|
|
| | | | | | | | 9,166,930 |
| | | | | | |
|
|
Multi-Utilities & Unregulated Power 1.5% | | | | | | | |
National Grid Transco PLC | | United Kingdom | | 420,100 | | | 4,003,602 |
Suez SA | | France | | 229,280 | | | 6,104,426 |
| | | | | | |
|
|
| | | | | | | | 10,108,028 |
| | | | | | |
|
|
Multiline Retail .8% | | | | | | | |
Target Corp. | | United States | | 107,000 | | | 5,556,510 |
| | | | | | |
|
|
Oil & Gas 2.7% | | | | | | | |
BP PLC | | United Kingdom | | 497,510 | | | 4,851,147 |
Eni SpA | | Italy | | 307,225 | | | 7,679,374 |
Shell Transport & Trading Co. PLC | | United Kingdom | | 756,100 | | | 6,443,787 |
| | | | | | |
|
|
| | | | | | | | 18,974,308 |
| | | | | | |
|
|
Paper & Forest Products .9% | | | | | | | |
Stora Enso OYJ, R | | Finland | | 416,260 | | | 6,360,375 |
| | | | | | |
|
|
TGA-15
FRANKLIN TEMPLETON VARIABLE INSURANCE PRODUCTS TRUST
TEMPLETON GLOBAL ASSET ALLOCATION FUND
Statement of Investments, December 31, 2004 (cont.)
| | | | | | | | |
| | | COUNTRY | | SHARES | | | VALUE |
Common Stocks (cont.) | | | | | | | | |
Pharmaceuticals 4.7% | | | | | | | | |
Abbott Laboratories | | United States | | 118,000 | | | $ | 5,504,700 |
Bristol-Myers Squibb Co. | | United States | | 217,420 | | | | 5,570,301 |
GlaxoSmithKline PLC | | United Kingdom | | 220,961 | | | | 5,182,816 |
Ono Pharmaceutical Co. Ltd. | | Japan | | 84,200 | | | | 4,727,104 |
Sanofi-Aventis | | France | | 91,000 | | | | 7,261,032 |
Takeda Pharmaceutical Co. Ltd. | | Japan | | 84,300 | | | | 4,247,100 |
| | | | | | | |
|
|
| | | | | | | | | 32,493,053 |
| | | | | | | |
|
|
Real Estate 1.5% | | | | | | | | |
Cheung Kong Holdings Ltd. | | Hong Kong | | 1,031,500 | | | | 10,284,743 |
| | | | | | | |
|
|
Semiconductors & Semiconductor Equipment 1.1% | | | | | | | | |
Samsung Electronics Co. Ltd. | | South Korea | | 16,790 | | | | 7,306,699 |
| | | | | | | |
|
|
Software 3.2% | | | | | | | | |
aBEA Systems Inc. | | United States | | 420,700 | | | | 3,727,402 |
aBMC Software Inc. | | United States | | 291,900 | | | | 5,429,340 |
aCheck Point Software Technologies Ltd. | | Israel | | 157,190 | | | | 3,871,590 |
Nintendo Co. Ltd. | | Japan | | 54,800 | | | | 6,886,116 |
aSynopsys Inc. | | United States | | 128,080 | | | | 2,512,929 |
| | | | | | | |
|
|
| | | | | | | | | 22,427,377 |
| | | | | | | |
|
|
Specialty Retail .2% | | | | | | | | |
aToys R Us Inc. | | United States | | 50,000 | | | | 1,023,500 |
| | | | | | | |
|
|
Wireless Telecommunication Services 2.0% | | | | | | | | |
China Mobile (Hong Kong) Ltd., fgn. | | China | | 928,000 | | | | 3,145,945 |
SK Telecom Co. Ltd., ADR | | South Korea | | 198,040 | | | | 4,406,390 |
Vodafone Group PLC, ADR | | United Kingdom | | 218,000 | | | | 5,968,840 |
| | | | | | | |
|
|
| | | | | | | | | 13,521,175 |
| | | | | | | |
|
|
Total Common Stocks (Cost $333,735,844) | | | | | | | | 442,460,594 |
| | | | | | | |
|
|
Preferred Stock (Cost $1,226,665) .5% | | | | | | | | |
Metals & Mining | | | | | | | | |
Cia Vale do Rio Doce, ADR, pfd., A | | Brazil | | 140,520 | | | | 3,425,878 |
| | | | | | | |
|
|
| | | |
| | | | | PRINCIPAL AMOUNTb
| | | |
Bonds 30.5% | | | | | | | | |
Buoni Poliennali Del Tesoro, | | | | | | | | |
7.75%, 11/01/06 | | Italy | | 974,190 | EUR | | | 1,444,391 |
5.00%, 2/01/12 | | Italy | | 1,810,000 | EUR | | | 2,695,891 |
Federal Republic of Germany, | | | | | | | | |
5.00%, 8/19/05 | | Germany | | 3,268,000 | EUR | | | 4,564,078 |
6.00%, 7/04/07 | | Germany | | 2,092,000 | EUR | | | 3,068,789 |
5.00%, 7/04/11 | | Germany | | 1,395,000 | EUR | | | 2,080,801 |
Finland Government, 3.00%, 7/04/08 | | Finland | | 1,850,000 | EUR | | | 2,529,654 |
French Treasury Note, 4.75%, 7/12/07 | | France | | 550,000 | EUR | | | 785,123 |
Government of Canada, 6.00%, | | | | | | | | |
6/01/08 | | Canada | | 2,212,000 | CAD | | | 1,999,044 |
6/01/11 | | Canada | | 6,849,000 | CAD | | | 6,354,234 |
Government of France, | | | | | | | | |
3.00%, 7/12/08 | | France | | 2,100,000 | EUR | | | 2,868,210 |
4.00%, 10/25/09 | | France | | 6,420,000 | EUR | | | 9,094,721 |
TGA-16
FRANKLIN TEMPLETON VARIABLE INSURANCE PRODUCTS TRUST
TEMPLETON GLOBAL ASSET ALLOCATION FUND
Statement of Investments, December 31, 2004 (cont.)
| | | | | | | | |
| | | COUNTRY | | PRINCIPAL
AMOUNTb | | | VALUE |
Bonds (cont.) | | | | | | | | |
Government of Hungary, 8.50%, 10/12/05 | | Hungary | | 92,400,000 | HUF | | $ | 509,863 |
Government of Netherlands, | | | | | | | | |
5.75%, 2/15/07 | | Netherlands | | 1,958,000 | EUR | | | 2,831,836 |
5.00%, 7/15/12 | | Netherlands | | 1,760,000 | EUR | | | 2,630,853 |
Government of New Zealand, 7.00%, 7/15/09 | | New Zealand | | 20,308,000 | NZD | | | 15,143,580 |
Government of Spain, | | | | | | | | |
10.15%, 1/31/06 | | Spain | | 2,450,000 | EUR | | | 3,598,600 |
4.80%, 10/31/06 | | Spain | | 2,630,000 | EUR | | | 3,717,732 |
Government of Thailand, | | | | | | | | |
6.00%, 3/05/05 | | Thailand | | 172,000,000 | THB | | | 4,460,169 |
8.50%, 10/14/05 | | Thailand | | 67,800,000 | THB | | | 1,834,353 |
8.00%, 12/08/06 | | Thailand | | 159,750,000 | THB | | | 4,510,244 |
Indonesia Recapital Bond, | | | | | | | | |
14.00%, 6/15/09 | | Indonesia | | 18,000,000,000 | IDR | | | 2,222,246 |
14.275%, 12/15/13 | | Indonesia | | 16,853,000,000 | IDR | | | 2,201,374 |
Kingdom of Belgium, | | | | | | | | |
7.50%, 7/29/08 | | Belgium | | 4,193,000 | EUR | | | 6,580,368 |
5.00%, 9/28/12 | | Belgium | | 1,760,000 | EUR | | | 2,631,569 |
Kingdom of Denmark, | | | | | | | | |
5.00%, 8/15/05 | | Denmark | | 11,696,000 | DKK | | | 2,168,032 |
6.00%, 11/15/11 | | Denmark | | 14,660,000 | DKK | | | 3,091,164 |
5.00%, 11/15/13 | | Denmark | | 25,080,000 | DKK | | | 5,035,992 |
Kingdom of Norway, 6.75%, 1/15/07 | | Norway | | 50,000,000 | NOK | | | 8,938,733 |
Kingdom of Sweden, | | | | | | | | |
6.00%, 2/09/05 | | Sweden | | 35,430,000 | SEK | | | 5,352,657 |
8.00%, 8/15/07 | | Sweden | | 34,265,000 | SEK | | | 5,831,977 |
5.50%, 10/08/12 | | Sweden | | 49,110,000 | SEK | | | 8,248,768 |
Korea Treasury Bond, | | | | | | | | |
6.90%, 1/16/07 | | South Korea | | 12,400,000,000 | KRW | | | 13,003,566 |
4.75%, 3/03/07 | | South Korea | | 11,800,000,000 | KRW | | | 11,925,135 |
New South Wales Treasury Corp., | | | | | | | | |
6.50%, 5/01/06 | | Australia | | 9,688,000 | AUD | | | 7,702,322 |
8.00%, 3/01/08 | | Australia | | 2,430,000 | AUD | | | 2,045,761 |
Queensland Treasury Corp., 6.00%, | | | | | | | | |
7/14/09 | | Australia | | 300,000 | AUD | | | 240,766 |
8/14/13 | | Australia | | 2,800,000 | AUD | | | 2,268,076 |
Republic of Austria, 5.00%, | | | | | | | | |
1/15/08 | | Austria | | 4,900,000 | EUR | | | 7,087,552 |
7/15/12 | | Austria | | 4,800,000 | EUR | | | 7,189,305 |
Republic of Poland, | | | | | | | | |
8.50%, 11/12/06 | | Poland | | 620,000 | PLN | | | 213,753 |
8.50%, 5/12/07 | | Poland | | 15,700,000 | PLN | | | 5,478,464 |
6.00%, 5/24/09 | | Poland | | 24,850,000 | PLN | | | 8,204,418 |
Republic of Singapore, 4.00%, 3/01/07 | | Singapore | | 1,700,000 | SGD | | | 1,093,518 |
CRepublic of Slovak, Strip, 1/14/07 | | Slovak Republic | | 181,500,000 | SKK | | | 5,923,468 |
Republic of Philippines, 9.00%, 2/15/13 | | Philippines | | 1,425,000 | | | | 1,461,551 |
Republic of Ukraine, 144A, FRN, 5.33%, 8/05/09 | | Ukraine | | 1,100,000 | | | | 1,163,250 |
Russian Federation, Reg S, 5.00% to 3/31/07, 7.50% thereafter, 3/31/30 | | Russia | | 4,540,000 | | | | 4,700,716 |
United Kingdom, 7.50%, 12/07/06 | | United Kingdom | | 867,000 | GBP | | | 1,757,530 |
| | | | | | | |
|
|
Total Bonds (Cost $160,950,961) | | | | | | | | 210,484,197 |
| | | | | | | |
|
|
Total Long Term Investments (Cost $495,913,470) | | | | | | | | 656,370,669 |
| | | | | | | |
|
|
TGA-17
FRANKLIN TEMPLETON VARIABLE INSURANCE PRODUCTS TRUST
TEMPLETON GLOBAL ASSET ALLOCATION FUND
Statement of Investments, December 31, 2004 (cont.)
| | | | | | | | |
| | | COUNTRY | | SHARES | | | VALUE |
Short Term Investments 4.5% | | | | | | | | |
Foreign Government Security (Cost $949,813) .1% | | | | | | | | |
cNorwegian Treasury Bill, 9/21/05 | | Norway | | 5,900,000 | NOK | | $ | 959,652 |
| | | | | | | |
|
|
Total Investments before Money Fund (Cost $496,863,283) | | | | | | | | 657,330,321 |
| | | | | | | |
|
|
Money Fund (Cost $30,532,682) 4.4% | | | | | | | | |
dFranklin Institutional Fiduciary Trust Money Market Portfolio | | United States | | 30,532,682 | | | | 30,532,682 |
| | | | | | | |
|
|
Total Investments (Cost $527,395,965) 99.5% | | | | | | | | 687,863,003 |
Other Assets, less Liabilities .5% | | | | | | | | 3,670,491 |
| | | | | | | |
|
|
Net Assets 100.0% | | | | | | | $ | 691,533,494 |
| | | | | | | |
|
|
Currency Abbreviations:
AUD - Australian Dollar
CAD - Canadian Dollar
DKK - Danish Krone
EUR - Euro
GBP - British Pound
HUF - Hungarian Forint
IDR - Indonesian Rupiah
KRW - South Korean Won
NOK - Norwegian Krone
NZD - New Zealand Dollar
PLN - Polish Zloty
SEK - Swedish Krona
SGD - Singapore Dollar
SKK - Slovak Koruna
THB - Thai Baht
Portfolio Abbreviations:
ADR - American Depository Receipt
FDR - Foreign Depository Receipt
FRN - Floating Rate Note
SDR - Special Drawing Rights
| b | The principal amount is stated in U.S. dollars unless otherwise indicated. |
| c | Security is traded on a discount basis with no stated coupon rate. |
| d | See Note 7 regarding investments in Franklin Institutional Fiduciary Trust Money Market Portfolio. |
TGA-18
See notes to financial statements.
FRANKLIN TEMPLETON VARIABLE INSURANCE PRODUCTS TRUST
TEMPLETON GLOBAL ASSET ALLOCATION FUND
Financial Statements
Statement of Assets and Liabilities
December 31, 2004
| | | | |
Assets: | | | | |
Investments in securities: | | | | |
Cost - Unaffiliated issuers | | $ | 496,863,283 | |
Cost - Sweep Money Fund (Note 7) | | | 30,532,682 | |
| | |
|
|
|
Total cost of investments | | $ | 527,395,965 | |
| | |
|
|
|
Value - Unaffiliated issuers | | $ | 657,330,321 | |
Value - Sweep Money Fund (Note 7) | | | 30,532,682 | |
| | |
|
|
|
Total value of investments | | | 687,863,003 | |
| | |
|
|
|
Cash | | | 36,516 | |
Foreign currency, at value (cost $2,068) | | | 2,078 | |
Receivables: | | | | |
Capital shares sold | | | 160,034 | |
Dividends and interest | | | 5,664,981 | |
| | |
|
|
|
Total assets | | | 693,726,612 | |
| | |
|
|
|
Liabilities: | | | | |
Payables: | | | | |
Capital shares redeemed | | | 1,681,261 | |
Affiliates | | | 432,230 | |
Other liabilities | | | 79,627 | |
| | |
|
|
|
Total liabilities | | | 2,193,118 | |
| | |
|
|
|
Net assets, at value | | $ | 691,533,494 | |
| | |
|
|
|
Net assets consist of: | | | | |
Undistributed net investment income | | $ | 22,180,158 | |
Net unrealized appreciation (depreciation) | | | 160,862,030 | |
Accumulated net realized gain (loss) | | | (28,332,421 | ) |
Capital shares | | | 536,823,727 | |
| | |
|
|
|
Net assets, at value | | $ | 691,533,494 | |
| | |
|
|
|
Class 1: | | | | |
Net assets, at value | | $ | 625,727,746 | |
| | |
|
|
|
Shares outstanding | | | 29,636,610 | |
| | |
|
|
|
Net asset value and offering price per share | | $ | 21.11 | |
| | |
|
|
|
Class 2: | | | | |
Net assets, at value | | $ | 65,805,748 | |
| | |
|
|
|
Shares outstanding | | | 3,141,868 | |
| | |
|
|
|
Net asset value and offering price per share | | $ | 20.94 | |
| | |
|
|
|
See notes to financial statements.
TGA-19
FRANKLIN TEMPLETON VARIABLE INSURANCE PRODUCTS TRUST
TEMPLETON GLOBAL ASSET ALLOCATION FUND
Financial Statements (continued)
Statement of Operations
for the year ended December 31, 2004
| | | | |
Investment income: | | | | |
Dividends: (net of foreign taxes of $1,092,585) | | | | |
Unaffiliated issuers | | $ | 11,040,206 | |
Sweep Money Fund (Note 7) | | | 190,996 | |
Interest (net of foreign taxes of $51,845) | | | 9,476,905 | |
| | |
|
|
|
Total investment income | | | 20,708,107 | |
| | |
|
|
|
Expenses: | | | | |
Management fees (Note 3) | | | 3,678,732 | |
Administrative fees (Note 3) | | | 862,235 | |
Distribution fees - Class 2 (Note 3) | | | 147,355 | |
Transfer agent fees | | | 9,013 | |
Custodian fees (Note 4) | | | 211,367 | |
Reports to shareholders | | | 327,834 | |
Professional fees | | | 61,843 | |
Trustees’ fees and expenses | | | 3,821 | |
Other | | | 27,654 | |
| | |
|
|
|
Total expenses | | | 5,329,854 | |
Expense reductions (Note 4) | | | (1,372 | ) |
| | |
|
|
|
Net expenses | | | 5,328,482 | |
| | |
|
|
|
Net investment income | | | 15,379,625 | |
| | |
|
|
|
Realized and unrealized gains (losses): | | | | |
Net realized gain (loss) from: | | | | |
Investments | | | 27,907,966 | |
Foreign currency transactions | | | 10,671,502 | |
| | |
|
|
|
Net realized gain (loss) | | | 38,579,468 | |
| | |
|
|
|
Net change in unrealized appreciation (depreciation) on: | | | | |
Investments | | | 41,338,534 | |
Translation of assets and liabilities denominated in foreign currencies | | | 47,737 | |
Deferred taxes | | | 104,220 | |
| | |
|
|
|
Net change in unrealized appreciation (depreciation) | | | 41,490,491 | |
| | |
|
|
|
Net realized and unrealized gain (loss) | | | 80,069,959 | |
| | |
|
|
|
Net increase (decrease) in net assets resulting from operations | | $ | 95,449,584 | |
| | |
|
|
|
See notes to financial statements.
TGA-20
FRANKLIN TEMPLETON VARIABLE INSURANCE PRODUCTS TRUST
TEMPLETON GLOBAL ASSET ALLOCATION FUND
Financial Statements (continued)
Statements of Changes in Net Assets
for the years ended December 31, 2004 and 2003
| | | | | | | | |
| | | 2004 | | | 2003 | |
| | |
| |
Increase (decrease) in net assets: | | | | | | | | |
Operations: | | | | | | | | |
Net investment income | | $ | 15,379,625 | | | $ | 12,882,138 | |
Net realized gain (loss) from investments and foreign currency transactions | | | 38,579,468 | | | | (47,730,263 | ) |
Net change in unrealized appreciation (depreciation) on investments, translation of assets and
liabilities denominated in foreign currencies and deferred taxes | | | 41,490,491 | | | | 183,932,996 | |
| | |
| |
Net increase (decrease) in net assets resulting from operations | | | 95,449,584 | | | | 149,084,871 | |
Distributions to shareholders from: | | | | | | | | |
Net investment income: | | | | | | | | |
Class 1 | | | (16,563,956 | ) | | | (12,872,007 | ) |
Class 2 | | | (1,658,563 | ) | | | (1,147,201 | ) |
| | |
| |
Total distributions to shareholders | | | (18,222,519 | ) | | | (14,019,208 | ) |
Capital share transactions: (Note 2) | | | | | | | | |
Class 1 | | | (17,118,553 | ) | | | 24,154,273 | |
Class 2 | | | 2,872,334 | | | | 3,935,942 | |
| | |
| |
Total capital share transactions | | | (14,246,219 | ) | | | 28,090,215 | |
Net increase (decrease) in net assets | | | 62,980,846 | | | | 163,155,878 | |
Net assets: | | | | | | | | |
Beginning of year | | | 628,552,648 | | | | 465,396,770 | |
| | |
| |
End of year | | $ | 691,533,494 | | | $ | 628,552,648 | |
| | |
| |
Undistributed net investment income included in net assets: | | | | | | | | |
End of year | | $ | 22,180,158 | | | $ | 14,496,244 | |
| | |
| |
See notes to financial statements.
TGA-21
FRANKLIN TEMPLETON VARIABLE INSURANCE PRODUCTS TRUST
TEMPLETON GLOBAL ASSET ALLOCATION FUND
Notes to Financial Statements
1. ORGANIZATION AND SIGNIFICANT ACCOUNTING POLICIES
Franklin Templeton Variable Insurance Products Trust (the Trust) is registered under the Investment Company Act of 1940 as an open-end investment company, consisting of twenty-one separate series (the Funds). Templeton Global Asset Allocation Fund (the Fund) included in this report is diversified. The financial statements of the remaining funds in the series are presented separately. Shares of the Fund are sold only to insurance company separate accounts to fund the benefits of variable life insurance policies or variable annuity contracts. As of December 31, 2004, over 54% of the Fund’s shares were sold through one insurance company. The Fund’s investment objective is high total return.
The following summarizes the Fund’s significant accounting policies.
a. Security Valuation
Securities listed on a securities exchange or on the NASDAQ National Market System are valued at the last quoted sale price or the official closing price of the day, respectively. Over-the-counter securities and listed securities for which there is no reported sale are valued within the range of the most recent quoted bid and ask prices. Securities that trade in multiple markets or on multiple exchanges are valued according to the broadest and most representative market. Investments in open-end mutual funds are valued at the closing net asset value.
Foreign securities are valued as of the close of trading on the foreign stock exchange on which the security is primarily traded, or the NYSE, whichever is earlier. The value is then converted into its U.S. dollar equivalent at the foreign exchange rate in effect at the close of the NYSE on the day that the value of the foreign security is determined. If no sale is reported at that time, the foreign security will be valued within the range of the most recent quoted bid and ask prices.
The Trust has procedures to determine the fair value of individual securities and other assets for which market prices are not readily available or which may not be reliably priced. Some methods for valuing these securities may include: fundamental analysis, matrix pricing, discounts from market prices of similar securities, or discounts applied due to the nature and duration of restrictions on the disposition of the securities. Occasionally, events occur between the time at which trading in a security is completed and the close of the NYSE that might call into question the availability (including the reliability) of the value of a portfolio security held by the Fund. If such an event occurs, the securities may be valued using fair value procedures, which may include the use of independent pricing services. All security valuation procedures are approved by the Trust’s Board of Trustees.
b. Foreign Currency Translation
Portfolio securities and other assets and liabilities denominated in foreign currencies are translated into U.S. dollars based on the exchange rate of such currencies against U.S. dollars on the date of valuation. Purchases and sales of securities, income and expense items denominated in foreign currencies are translated into U.S. dollars at the exchange rate in effect on the transaction date. Occasionally events may impact the availability or reliability of foreign exchange rates used to convert the U.S. dollar equivalent value. If such an event occurs, the foreign exchange rate will be valued at fair value using procedures established and approved by the Trust’s Board of Trustees.
The Fund does not separately report the effect of changes in foreign exchange rates from changes in market prices on securities held. Such changes are included in net realized and unrealized gain or loss from investments on the Statement of Operations.
Realized foreign exchange gains or losses arise from sales of foreign currencies, currency gains or losses realized between the trade and settlement dates on securities transactions and the difference between the recorded amounts of dividends, interest, and foreign withholding taxes and the U.S. dollar equivalent of the amounts actually received or paid. Net unrealized foreign exchange gains and losses arise from changes in foreign exchange rates on foreign denominated assets and liabilities other than investments in securities held at the end of the reporting period.
TGA-22
FRANKLIN TEMPLETON VARIABLE INSURANCE PRODUCTS TRUST
TEMPLETON GLOBAL ASSET ALLOCATION FUND
Notes to Financial Statements (continued)
1. ORGANIZATION AND SIGNIFICANT ACCOUNTING POLICIES (cont.)
c. Foreign Currency Contracts
When the Fund purchases or sells foreign securities it may enter into foreign exchange contracts to minimize foreign exchange risk from the trade date to the settlement date of the transactions. A foreign exchange contract is an agreement between two parties to exchange different currencies at an agreed upon exchange rate on a specified date. Realized and unrealized gains and losses on these contracts are included in the Statement of Operations.
The risks of these contracts include movement in the values of the foreign currencies relative to the U.S. dollar and the possible inability of the counterparties to fulfill their obligations under the contracts.
d. Income and Deferred Taxes
No provision has been made for U.S. income taxes because the Fund’s policy is to qualify as a regulated investment company under Sub Chapter M of the Internal Revenue Code and to distribute substantially all of its taxable income. Fund distributions to shareholders are determined on an income tax basis and may differ from net investment income and realized gains for financial reporting purposes.
The Fund is subject to a tax imposed on net realized gains of securities of certain foreign countries. The Fund records an estimated deferred tax liability for net unrealized gains on these securities.
e. Security Transactions, Investment Income, Expenses and Distributions
Security transactions are accounted for on trade date. Realized gains and losses on security transactions are determined on a specific identification basis. Interest income and estimated expenses are accrued daily. Discounts and premiums on securities purchased are amortized over the lives of the respective securities. Dividend income and distributions to shareholders are recorded on the ex-dividend date.
Common expenses incurred by the Trust are allocated among the funds based on the ratio of net assets of each fund to the combined net assets. Other expenses are charged to each fund on a specific identification basis.
Realized and unrealized gains and losses and net investment income, other than class specific expenses, are allocated daily to each class of shares based upon the relative proportion of net assets of each class.
f. Accounting Estimates
The preparation of financial statements in accordance with accounting principles generally accepted in the United States of America requires management to make estimates and assumptions that affect the reported amounts of assets and liabilities at the date of the financial statements and the amounts of income and expenses during the reporting period. Actual results could differ from those estimates.
g. Guarantees and Indemnifications
Under the Trust’s organizational documents, its officers and trustees are indemnified by the Trust against certain liability arising out of the performance of their duties to the Trust. Additionally, in the normal course of business, the Trust enters into contracts with service providers that contain general indemnification clauses. The Trust’s maximum exposure under these arrangements is unknown as this would involve future claims that may be made against the Trust that have not yet occurred. However, based on experience, the Trust expects the risk of loss to be remote.
TGA-23
FRANKLIN TEMPLETON VARIABLE INSURANCE PRODUCTS TRUST
TEMPLETON GLOBAL ASSET ALLOCATION FUND
Notes to Financial Statements (continued)
2. SHARES OF BENEFICIAL INTEREST
The Fund offers two classes of shares: Class 1 and Class 2. Each class of shares differs by its distribution fees, voting rights on matters affecting a single class and its exchange privilege.
At December 31, 2004, there were an unlimited number of shares authorized ($.01 par value). Transactions in the Fund’s shares were as follows:
| | | | | | | | | | | | | | |
| | | Year Ended December 31, 2004,
| |
| | | 2004
| | | 2003
| |
| Class 1 Shares: | | Shares
| | | Amount
| | | Shares
| | | Amount
| |
Shares sold | | 2,523,033 | | | $ | 48,527,568 | | | 2,924,694 | | | $ | 48,227,589 | |
Shares issued in reinvestment of distributions | | 904,640 | | | | 16,563,956 | | | 795,550 | | | | 12,872,007 | |
Shares redeemed | | (4,294,965 | ) | | | (82,210,077 | ) | | (2,381,733 | ) | | | (36,945,323 | ) |
| | |
| |
Net increase (decrease) | | (867,292 | ) | | $ | (17,118,553 | ) | | 1,338,511 | | | $ | 24,154,273 | |
| | |
| |
| | | | |
| Class 2 Shares: | | | | | | | | | | | | |
Shares sold | | 617,661 | | | $ | 11,736,853 | | | 949,657 | | | $ | 15,396,855 | |
Shares issued in reinvestment of distributions | | 91,180 | | | | 1,658,563 | | | 71,299 | | | | 1,147,201 | |
Shares redeemed | | (557,792 | ) | | | (10,523,082 | ) | | (785,835 | ) | | | (12,608,114 | ) |
| | |
| |
Net increase (decrease) | | 151,049 | | | $ | 2,872,334 | | | 235,121 | | | $ | 3,935,942 | |
| | |
| |
3. TRANSACTIONS WITH AFFILIATES
Certain officers and trustees of the Fund are also officers and/or directors of the following entities:
| | |
| Entity | | Affiliation |
Templeton Investment Counsel LLC (TIC) | | Investment manager |
Franklin Templeton Services LLC (FT Services) | | Administrative manager |
Franklin Templeton Distributors Inc. (Distributors) | | Principal underwriter |
Franklin Templeton Investor Services LLC (Investor Services) | | Transfer agent |
a. Management Fees
The Fund pays an investment management fee to TIC based on the average daily net assets of the Fund as follows:
| | |
| Annualized Fee Rate | | Net Assets |
| .650% | | First $200 million |
| .585% | | Over $200 million, up to and including $1.3 billion |
| .520% | | Over $1.3 billion |
Under a subadvisory agreement, Advisers, an affiliate of TIC, provides subadvisory services to the Fund and receives from TIC fees based on the average daily net assets of the Fund.
b. Administrative Fees
The Fund pays an administrative fee to FT Services based on the average daily net assets of the Fund as follows:
| | |
| Annualized Fee Rate | | Net Assets |
| .150% | | First $200 million |
| .135% | | Over $200 million, up to and including $700 million |
| .100% | | Over $700 million, up to and including $1.2 billion |
Fees are further reduced on net assets over $1.2 billion.
TGA-24
FRANKLIN TEMPLETON VARIABLE INSURANCE PRODUCTS TRUST
TEMPLETON GLOBAL ASSET ALLOCATION FUND
Notes to Financial Statements (continued)
3. TRANSACTIONS WITH AFFILIATES (cont.)
c. Distribution Fees
The Fund reimburses Distributors up to .25% per year of its average daily net asset of Class 2, for costs incurred in marketing the Fund’s shares under a Rule 12b-1 plan.
d. Transfer Agent Fees
Investor Services, under terms of an agreement, performs shareholder servicing for the Fund and is not paid by the Fund for the services.
4. EXPENSE OFFSET ARRANGEMENT
The Fund has entered into an arrangement with its custodian whereby credits realized as a result of uninvested cash balances are used to reduce a portion of the Fund’s custodian expenses. During the year ended December 31, 2004, the custodian fees were reduced as noted in the Statement of Operations.
5. INCOME TAXES
At December 31, 2004, the Fund had tax basis capital losses of $28,332,421 which may be carried over to offset future capital gains. Such losses expire in 2011.
The tax character of distributions paid during the years ended December 31, 2004 and 2003, was as follows:
| | | | | | |
| | | 2004
| | 2003
|
Distributions paid from ordinary income | | $ | 18,222,519 | | $ | 14,019,208 |
| | |
|
|
Net investment income (loss) and realized gains (losses) differ for financial statement and tax purposes primarily due to differing treatments of foreign currency transactions, and bond discount and premiums.
At December 31, 2004, the cost of investments, net unrealized appreciation (depreciation) and undistributed ordinary income for income tax purposes were as follows:
| | | | |
Cost of investments | | $ | 530,145,376 | |
| | |
|
|
|
Unrealized appreciation | | $ | 174,667,943 | |
Unrealized depreciation | | | (16,950,316 | ) |
| | |
|
|
|
Net unrealized appreciation (depreciation) | | $ | 157,717,627 | |
| | |
|
|
|
Distributable earnings – undistributed ordinary income | | $ | 24,929,569 | |
| | |
|
|
|
TGA-25
FRANKLIN TEMPLETON VARIABLE INSURANCE PRODUCTS TRUST
TEMPLETON GLOBAL ASSET ALLOCATION FUND
Notes to Financial Statements (continued)
6. INVESTMENT TRANSACTIONS
Purchases and sales of investments (excluding short-term securities) for the year ended December 31, 2004, aggregated $162,689,015 and $180,117,528, respectively.
7. INVESTMENTS IN FRANKLIN INSTITUTIONAL FIDUCIARY TRUST MONEY MARKET PORTFOLIO
The Fund may invest in the Franklin Institutional Fiduciary Trust Money Market Portfolio (the Sweep Money Fund), an open-end investment company managed by Franklin Advisers Inc. (an affiliate of the investment manager). Management fees paid by the Fund are reduced on assets invested in the Sweep Money Fund, in an amount not to exceed the management fees paid by the Sweep Money Fund.
8. REGULATORY MATTERS
Investigations
As part of various investigations by a number of federal, state, and foreign regulators and governmental entities, including the Securities and Exchange Commission (“SEC”), the California Attorney General’s Office (“CAGO”), and the National Association of Securities Dealers, Inc. (“NASD”), relating to certain practices in the mutual fund industry, including late trading, market timing and marketing support payments to securities dealers who sell fund shares, Franklin Resources, Inc. and certain of its subsidiaries (as used in this section, together, the “Company”), as well as certain current or former executives and employees of the Company, received subpoenas and/or requests for documents, information and/or testimony. The Company and its current employees provided documents and information in response to those requests and subpoenas.
Settlements
Beginning in August 2004, the Company entered into settlements with certain regulators investigating the mutual fund industry practices noted above. The Company believes that settlement of each of the matters described in this section is in the best interest of the Company and shareholders of the Franklin, Templeton, and Mutual Series mutual funds (the “funds”).
On August 2, 2004, Franklin Resources, Inc. announced that its subsidiary, Franklin Advisers, Inc., reached an agreement with the SEC that resolved the issues resulting from the SEC investigation into market timing activity. In connection with that agreement, the SEC issued an “Order Instituting Administrative and Cease-and-Desist Proceedings Pursuant to Sections 203(e) and 203(k) of the Investment Advisers Act of 1940 and Sections 9(b) and 9(f) of the Investment Company Act of 1940, Making Findings and Imposing Remedial Sanctions and a Cease-and-Desist Order” (the “Order”). The SEC’s Order concerned the activities of a limited number of third parties that ended in 2000 and those that were the subject of the first Massachusetts administrative complaint described below.
Under the terms of the SEC’s Order, pursuant to which Franklin Advisers, Inc. neither admitted nor denied any of the findings contained therein, Franklin Advisers, Inc. agreed to pay $50 million, of which $20 million is a civil penalty, to be distributed to shareholders of certain funds in accordance with a plan to be developed by an independent distribution consultant. At this time, it is unclear which funds or which shareholders of any particular fund will receive distributions. The Order also required Franklin Advisers, Inc. to, among other things, enhance and periodically review compliance policies and procedures.
On September 20, 2004, Franklin Resources, Inc. announced that two of its subsidiaries, Franklin Advisers, Inc. and Franklin Templeton Alternative Strategies, Inc. (“FTAS”), reached an agreement with the Securities Division of the Office of the Secretary of the Commonwealth of Massachusetts (the “State of Massachusetts”) related to its administrative complaint filed on February 4, 2004, concerning one instance of market timing that was also a subject of the August 2, 2004 settlement that Franklin Advisers, Inc. reached with the SEC, as described above.
TGA-26
FRANKLIN TEMPLETON VARIABLE INSURANCE PRODUCTS TRUST
TEMPLETON GLOBAL ASSET ALLOCATION FUND
Notes to Financial Statements (continued)
8. REGULATORY MATTERS (cont.)
Settlements (cont.)
Under the terms of the settlement consent order issued by the State of Massachusetts, Franklin Advisers, Inc. and FTAS consented to the entry of a cease-and-desist order and agreed to pay a $5 million administrative fine to the State of Massachusetts (the “Massachusetts Consent Order”). The Massachusetts Consent Order included two different sections: “Statements of Fact” and “Violations of Massachusetts Securities Laws.” Franklin Advisers, Inc. and FTAS admitted the facts in the Statements of Fact.
On October 25, 2004, the State of Massachusetts filed a second administrative complaint, alleging that Franklin Resources, Inc.’s Form 8-K filing (in which it described the Massachusetts Consent Order and stated that “Franklin did not admit or deny engaging in any wrongdoing”) failed to state that Franklin Advisers, Inc. and FTAS admitted the Statements of Fact portion of the Massachusetts Consent Order (the “Second Complaint”). Franklin Resources, Inc. reached a second agreement with the State of Massachusetts on November 19, 2004, resolving the Second Complaint. As a result of the November 19, 2004 settlement, Franklin Resources, Inc. filed a new Form 8-K. The terms of the Massachusetts Consent Order did not change and there was no monetary fine associated with this second settlement.
On November 17, 2004, Franklin Resources, Inc. announced that Franklin/Templeton Distributors, Inc. (“FTDI”) reached an agreement with the CAGO, resolving the issues resulting from the CAGO’s investigation concerning sales and marketing support payments. Under the terms of the settlement, FTDI neither admitted nor denied the allegations in the CAGO’s complaint and agreed to pay $2 million to the State of California as a civil penalty, $14 million to the funds, to be allocated by an independent distribution consultant to be paid for by FTDI, and $2 million to the CAGO for its investigative costs.
On December 13, 2004, Franklin Resources, Inc. announced that its subsidiaries FTDI and Franklin Advisers, Inc. reached an agreement with the SEC, resolving the issues resulting from the SEC’s investigation concerning marketing support payments to securities dealers who sell fund shares. In connection with that agreement, the SEC issued an “Order Instituting Administrative and Cease-and-Desist Proceedings, Making Findings, and Imposing Remedial Sanctions Pursuant to Sections 203(e) and 203(k) of the Investment Advisers Act of 1940, Sections 9(b) and 9(f) of the Investment Company Act of 1940, and Section 15(b) of the Securities Exchange Act of 1934” (the “Second Order”).
Under the terms of the Second Order, in which FTDI and Franklin Advisers, Inc. neither admitted nor denied the findings contained therein, they agreed to pay the funds a penalty of $20 million and disgorgement of $1 (one dollar). FTDI and Franklin Advisers, Inc. also agreed to implement certain measures and undertakings relating to marketing support payments to broker-dealers for the promotion or sale of fund shares, including making additional disclosures in the funds’ Prospectuses and Statements of Additional Information. The Second Order further requires the appointment of an independent distribution consultant, at the Company’s expense, who shall develop a plan for the distribution of the penalty and disgorgement to the funds.
Other Legal Proceedings
The Trust, in addition to the Company and other funds, and certain current and former officers, employees, and directors have been named in multiple lawsuits in different federal courts in Nevada, California, Illinois, New York and Florida, alleging violations of various federal securities laws and seeking, among other relief, monetary damages, restitution, removal of fund trustees, directors, advisers, administrators, and distributors, rescission of management contracts and 12b-1 Plans, and/or attorneys’ fees and costs. Specifically, the lawsuits claim breach of duty with respect to alleged arrangements to permit market timing and/or late trading activity, or breach of duty with respect to the valuation of the portfolio securities of certain Templeton funds managed by Franklin Resources, Inc. subsidiaries, resulting in alleged market timing activity. The majority of these lawsuits duplicate, in whole or in part, the allegations asserted in the February 4, 2004 Massachusetts administrative complaint and the findings in the SEC’s August 2, 2004 Order, as described above. The lawsuits are styled as class actions, or derivative actions on behalf of either the named funds or Franklin Resources, Inc.
TGA-27
FRANKLIN TEMPLETON VARIABLE INSURANCE PRODUCTS TRUST
TEMPLETON GLOBAL ASSET ALLOCATION FUND
Notes to Financial Statements (continued)
8. REGULATORY MATTERS (cont.)
Other Legal Proceedings (cont.)
In addition, the Company, as well as certain current and former officers, employees, and directors, have been named in multiple lawsuits alleging violations of various securities laws and pendent state law claims relating to the disclosure of directed brokerage payments and/or payment of allegedly excessive advisory, commission, and distribution fees, and seeking, among other relief, monetary damages, restitution, rescission of advisory contracts, including recovery of all fees paid pursuant to those contracts, an accounting of all monies paid to the named advisers, declaratory relief, injunctive relief, and/or attorneys’ fees and costs. These lawsuits are styled as class actions or derivative actions brought on behalf of certain funds.
The Company and fund management strongly believes that the claims made in each of the lawsuits identified above are without merit and intends to vigorously defend against them. The Company cannot predict with certainty, however, the eventual outcome of the remaining governmental investigations or private lawsuits, nor whether they will have a material negative impact on the Company. Public trust and confidence are critical to the Company’s business and any material loss of investor and/or client confidence could result in a significant decline in assets under management by the Company, which would have an adverse effect on the Company’s future financial results. If the Company finds that it bears responsibility for any unlawful or inappropriate conduct that caused losses to the Trust, it is committed to making the Trust or its shareholders whole, as appropriate. The Company is committed to taking all appropriate actions to protect the interests of its funds’ shareholders.
TGA-28
FRANKLIN TEMPLETON VARIABLE INSURANCE PRODUCTS TRUST
TEMPLETON GLOBAL ASSET ALLOCATION FUND
Report of Independent Registered Public Accounting Firm
To the Trustees and Shareholders of Franklin Templeton Variable Insurance Products Trust
In our opinion, the accompanying statement of assets and liabilities, including the statement of investments, and the related statements of operations and of changes in net assets and the financial highlights present fairly, in all material respects, the financial position of Templeton Global Asset Allocation Fund (the Fund) (one of the funds constituting Franklin Templeton Variable Insurance Products Trust) at December 31, 2004, the results of its operations for the year then ended, the changes in its net assets for each of the two years in the period then ended and the financial highlights for each of the five years in the period then ended, in conformity with accounting principles generally accepted in the United States of America. These financial statements and financial highlights (hereafter referred to as “financial statements”) are the responsibility of the Fund’s management; our responsibility is to express an opinion on these financial statements based on our audits. We conducted our audits of these financial statements in accordance the standards of the Public Company Accounting Oversight Board (United States). Those standards require that we plan and perform the audits to obtain reasonable assurance about whether the financial statements are free of material misstatement. An audit includes examining, on a test basis, evidence supporting the amounts and disclosures in the financial statements, assessing the accounting principles used and significant estimates made by management, and evaluating the overall financial statement presentation. We believe that our audits, which included confirmation of securities at December 31, 2004 by correspondence with the custodian, provide a reasonable basis for our opinion.
PricewaterhouseCoopers LLP
San Francisco, California
February 9, 2005
TGA-29
FRANKLIN TEMPLETON VARIABLE INSURANCE PRODUCTS TRUST
TEMPLETON GLOBAL ASSET ALLOCATION FUND
Tax Designation (unaudited)
Under Section 854(b)(2) of the Internal Revenue Code (Code), the Fund hereby designates 7.00% of the ordinary income dividends as income qualifying for the dividends received deduction for the fiscal year ended December 31, 2004.
At December 31, 2004, more than 50% of the Fund’s total assets were invested in securities of foreign issuers. In most instances, foreign taxes were withheld from dividends and interest paid to the Fund on these investments. The Fund elects to treat foreign taxes paid under Section 853 of the Code. This election will allow shareholders of record in June 2005, to treat their proportionate share of foreign taxes paid by the Fund as having been paid directly by them. The shareholder shall consider these amounts as foreign taxes paid in the tax year in which they receive the Fund distribution.
The foreign tax information will be disclosed in the June 2005, semi-annual report of the Fund.
TGA-30
TEMPLETON GLOBAL INCOME SECURITIES FUND
We are pleased to bring you Templeton Global Income Securities Fund’s annual report for the fiscal year ended December 31, 2004.
Performance Summary as of 12/31/04
Average annual total return of Class 1 shares represents the average annual change in value, assuming reinvestment of dividends and capital gains. Average returns smooth out variations in returns, which can be significant; they are not the same as year-by-year results.
Periods ended 12/31/04
| | | | | | |
| | | 1-Year | | 5-Year | | 10-Year |
Average Annual Total Return | | +15.09% | | +12.91% | | +9.08% |
Total Return Index Comparison for Hypothetical $10,000 Investment (1/1/95–12/31/04)
The graph below shows the change in value of a hypothetical $10,000 investment in the Fund over the indicated period and includes reinvestment of any income or distributions. The Fund’s performance is compared to the performance of the J.P. Morgan (JPM) Government Bond Index (GBI) Global, as well as the Consumer Price Index (CPI). One cannot invest directly in an index, nor is an index representative of the Fund’s portfolio. Please see Important Notes to Performance Information preceding the Fund Summaries.
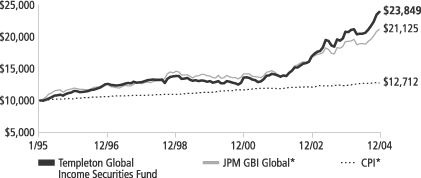
*Sources: Standard & Poor’s Micropal; J.P. Morgan. Please see Index Descriptions following the Fund Summaries.
Templeton Global Income Securities Fund – Class 1
Performance reflects the Fund’s Class 1 operating expenses, but does not include any contract fees, expenses or sales charges. If they had been included, performance would be lower. These charges and deductions, particularly for variable life policies, can have a significant effect on contract values and insurance benefits. See the contract prospectus for a complete description of these expenses, including sales charges.
Performance data quoted represent past performance, which does not guarantee future results. Investment return and principal value will fluctuate, and you may have a gain or loss when you sell your shares. Current performance may differ from figures shown.
TGI-1
Fund Goals and Main Investments: Templeton Global Income Securities Fund seeks high current income, consistent with preservation of capital. Capital appreciation is a secondary consideration. The Fund invests mainly in debt securities of governments and their political subdivisions and agencies, supranational organizations and companies located anywhere in the world, including emerging markets. The Fund may also invest in lower-rated “junk bonds.”
Performance Overview
You can find the Fund’s one-year total return in the Performance Summary. The Fund outperformed its benchmark, the JPM GBI Global, which delivered a 10.10% total return in U.S. dollar terms for the year under review.1
Economic and Market Overview
Global economic growth over the past year solidified, led by the U.S. and Asia, although it slowed somewhat since the first quarter. Although inflation rates remained relatively low, inflationary pressures began to build in some regions partly due to elevated oil and commodity prices. Despite strong growth, global bond markets generated positive returns as global treasury yield curves flattened and most major currencies appreciated relative to the U.S. dollar.
In the U.S., the core Consumer Price Index (excluding food and energy) rose from a historically low rate of 1.1% at the beginning of the year to 2.2% by period-end.2 Additionally, the labor market recovered as employers hired 2.2 million workers in 2004.2 Although economic activity slowed during the second half of the year, productivity rates remained favorable. The Federal Reserve Board (Fed) raised the federal funds target rate from 1.00% to 2.25% during the year. The global demand upswing in 2004 favored U.S. exports, which expanded at double-digit rates. However, the U.S. trade and current account balances reached record deficit levels as import volume continued to exceed exports. As the trade deficit widened throughout the year, it reached $60 billion in November 2004.3 The magnitude of the current account deficit also remained quite large relative to the country’s economy at nearly 5.6% of gross domestic product (GDP), compared with 4.5% at the end of 2003.4 The U.S. dollar depreciated during the past year, declining 6.3% against the U.S.’s major trading partners.5
1. Source: J.P. Morgan. One cannot invest directly in an index, nor is an index representative of the Fund’s portfolio. Please see Index Descriptions following the Fund Summaries.
2. Source: Bureau of Labor Statistics.
3. Source: U.S. Census Bureau.
4. Source: Bureau of Economic Analysis. For the one year ended 12/31/04.
5. Source: Federal Reserve Board.
Fund Risks: Bonds and other debt obligations are affected by changes in interest rates and the creditworthiness of their issuers. High yield, lower-rated (junk) bonds generally have greater price swings and higher default risks. Foreign investing involves special risks including currency fluctuations, economic instability, and social and political developments. Emerging markets involve heightened risks due to their relatively smaller size and lesser liquidity. The Fund’s prospectus also includes a description of the main investment risks.
What is a current account?
A current account is that part of the balance of payments where all of one country’s international transactions in goods and services are recorded.
What is balance of payments?
Balance of payments is a record of all of a country’s exports and imports of goods and services, borrowing and lending with the rest of the world during a particular time period. It helps a country evaluate its competitive strengths and weaknesses and forecast the strength of its currency.
TGI-2
Economic growth in the 12-country euro zone strengthened during the year, reaching 1.8% in the third quarter compared with the same period a year earlier, mainly driven by the export sector.6 High unemployment rates corresponded with weak consumer spending in the region. However, tepid domestic demand and currency strength helped contain underlying inflation rates, which remained relatively constant during the period. Consequently, the European Central Bank (ECB) left interest rates unchanged throughout the year. Other European countries exhibited more dynamic growth over the period. Among central European and Scandinavian countries, exports and investment experienced robust growth, propelling third quarter 2004 GDP growth estimates for Poland, Sweden and Hungary to 4.8%, 3.8% and 3.7%, respectively.7 Rising inflationary pressures accompanied Poland’s stronger growth. Sweden’s and Norway’s inflation rates remained low while Hungary’s slowed. Additionally, Sweden and Norway maintained impressive current account surpluses at nearly 7% and 13% of their GDPs.8
Strong regional growth characterized the Asia Pacific region’s economy during the year. Robust domestic demand and export strength bolstered balance of payment positions in China and Thailand. Both countries experienced building inflationary pressures, prompting monetary authorities to raise interest rates or implement administrative measures to maintain low inflation. Although Asia’s domestic growth conditions led to interest rate increases, the region’s balance of payment conditions facilitating international reserve accumulation remained intact. Even without the strong domestic demand seen elsewhere in Asia, South Korea still reached a growth rate of 4.6%, mostly due to competitive external conditions.9 South Korea’s current account surplus nearly doubled over the period, driven by the trade balance as exports rose more than 30%.10 Australia and New Zealand particularly benefited from strong commodity prices over the year as commodities comprised much of their exports. Despite higher interest rates, growth remained strong.
Investment Strategy
We allocate the Fund’s assets among issuers, geographic regions, and currencies based upon our assessment of relative interest rates among currencies, our outlook for changes in interest rates, and credit risks. In considering these factors, we evaluate a country’s changing market,
6. Source: Eurostat.
7. Sources: Eurostat (Poland); Statistics Sweden; Hungarian Central Statistical Office.
8. Sources: Sveriges Riksbank (Sweden); Statistics Sweden; Statistics Norway.
9. Source: Bank of Korea.
10. Source: Korea International Trade Association.
TGI-3
economic and political conditions, such as inflation rate, growth prospects, global trade patterns and government policies. We intend to manage the Fund’s exposure to various currencies, and may from time to time seek to hedge (protect) against currency risk by using forward currency exchange contracts.
Manager’s Discussion
The Fund’s total return is influenced by various factors, including interest rate developments, currency movements and exposure to sovereign debt markets.
Interest Rate Strategy
During the reporting period, interest rate policy generally became less accommodative. As economic growth rebounded and an interest rate tightening cycle, particularly in the U.S., became more probable, we reduced the Fund’s overall portfolio duration exposure. Although the Fed raised U.S. interest rates, short-term real interest rates (accounting for inflation) remained negative and the monetary stance still accommodative. Therefore, the Fund remained positioned defensively to a further rise in U.S. interest rates by maintaining a zero allocation to U.S. Treasury securities. Globally, we found opportunities during the period where interest rate reductions produced positive local market bond returns, or returns in local currency terms, and other instances where interest rate increases facilitated currency gains and overall bond market returns in U.S. dollar terms.
For example, monetary authorities in Sweden reduced interest rates at the beginning of the period. However, continued low inflation rates relative to other developed markets, coupled with currency prospects we felt were attractive, supported local bond market performance. Swedish bond markets rose 8.61% in local currency terms, outperforming not only the broader market, but also euro area and U.S. government bond markets.11 In Indonesia, improved economic stability, declining inflation and prudent fiscal policies prompted their central bank to reduce rates, boosting local bond market returns to 21.00% for the year.12 Relative Fund performance benefited from a lack of exposure to the Japanese government bond market given local market returns of only 1.29% over the year.11 While export growth supported GDP growth in Japan over the past year, interest rates remained close to zero as weak domestic conditions failed to build sustainable inflation.
11. Source: J.P. Morgan.
12. Source: HSBC.
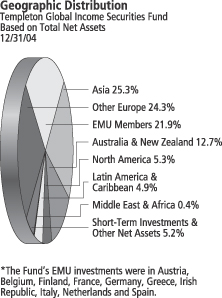
TGI-4
Currency Strategy
During the year, currency gains against the U.S. dollar helped global bond markets outperform the U.S. bond market in U.S. dollar terms as well as in local currency terms. The U.S. sub-index of the JPM GBI Global rose 3.75% compared with other global bond markets’ 10.10% return in U.S. dollars and 4.89% in local currency.13 Consequently, the Fund benefited from its underweighted position in the U.S. relative to the JPM GBI Global.
Fund positioning within Europe and Asia also benefited relative Fund performance. As the euro rose against the U.S. dollar, we used the currency’s strength to reduce our exposure and reallocate the proceeds to other European (non-euro) and Asian currencies where we believed we saw better value. These non-euro currencies generally outperformed the euro, benefiting the Fund’s relative performance. For instance, the Polish zloty appreciated 24.25% against the U.S. dollar, compared with the euro, which rose 7.59%. In addition to attractive currency valuation, strong export growth, rising interest rates and higher confidence following progress on fiscal reform supported currency fundamentals over the period. The strong currency returns brought overall bond market returns in Poland to 36.30% in U.S. dollar terms during the 12-month period.11
The Fund continued to increase its allocation to non-Japan Asia during the period given strong regional growth and trade patterns, and to position itself for potential currency appreciation. The Fund benefited from its overweighted position in South Korea relative to its benchmark. Korea’s bond market rose 25.91% in U.S. dollar terms following a 15.10% appreciation of the South Korean won versus the U.S. dollar.12 The central bank appeared increasingly tolerant of currency appreciation to address inflationary risks associated with an undervalued currency while using interest rate policy to stimulate domestic demand. Thailand underperformed the rest of Asia over the period. However, we still found value in the Thai baht and maintained our position given that we felt fundamentals remained intact. The rest of Asia’s performance more than compensated for lagging returns in Thailand.
Global Sovereign Debt Strategy
The Fund also purchased investment-grade and sub-investment grade sovereign debt that typically compensates for greater credit risk by offering higher yields relative to U.S. and European benchmark treasury
13. Source: J.P. Morgan. Please see Index Descriptions following the Fund Summaries.
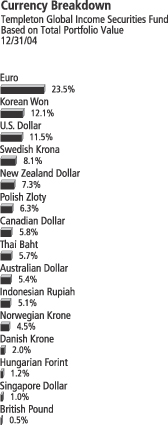
TGI-5
yield curves. Despite rising U.S. interest rates, U.S. dollar-denominated emerging market debt continued to generate strong returns, rising 11.73% over the period, as measured by the JPM Emerging Markets Bond Index Global (EMBIG).13 Sovereign interest rate spreads declined from 403 basis points (100 basis points equal 1.00%) greater than the U.S. Treasury market at the beginning of the reporting period to 347 basis points by period-end. Euro-denominated markets also rose, gaining 11.68% in euro terms and 20.51% in U.S. dollar terms, as measured by the JPM Euro EMBIG.13
Regionally, Latin American sovereign debt rose 13.10%, eastern Europe 10.57% and Asia 6.74%.11 The global demand recovery significantly benefited emerging market economies, particularly commodity exporters, supporting growth and in some cases balance of payment and fiscal conditions. As a result, underlying economic and credit fundamentals remained stronger than in previous economic tightening cycles. For example, independent credit rating agency Standard & Poor’s (S&P) upgraded Venezuela’s and Russia’s sovereign debt during the year mainly due to higher oil prices, the alleviation of some political risks in Venezuela, and Russia’s prudent fiscal and economic policies. Similarly, S&P also upgraded Ukraine’s rating.
Although U.S. dollar denominated sovereign debt produced solid returns over the 12-month period, the Fund shortened duration and reallocated away from U.S. dollar-denominated investment-grade and sub-investment grade debt given a greater sensitivity to rising U.S. rates.
Thank you for your participation in Templeton Global Income Securities Fund. We look forward to serving your future investment needs.
The foregoing information reflects our analysis, opinions and portfolio holdings as of December 31, 2004, the end of the reporting period. The way we implement our main investment strategies and the resulting portfolio holdings may change depending on factors such as market and economic conditions. These opinions may not be relied upon as investment advice or an offer for a particular security. The information is not a complete analysis of every aspect of any market, country, industry, security or the Fund. Statements of fact are from sources considered reliable, but the adviser makes no representation or warranty as to their completeness or accuracy. Although historical performance is no guarantee of future results, these insights may help you understand our investment management philosophy.
TGI-6
Fund Expenses
As an investor in a variable insurance contract (“Contract”) that indirectly provides for investment in an underlying mutual fund, you can incur transaction and/or ongoing expenses at both the Fund level and the Contract level.
| • | | Transaction expenses can include sales charges (loads) on purchases, redemption fees, surrender fees, transfer fees and premium taxes. |
| • | | Ongoing expenses can include management fees, distribution and service (12b-1) fees, contract fees, annual maintenance fees, mortality and expense risk fees and other fees and expenses. All mutual funds and Contracts have some types of ongoing expenses. |
The expenses shown in the table below are meant to highlight ongoing expenses at the Fund level only and do not include ongoing expenses at the Contract level, or transaction expenses at either the Fund or Contract levels. While the Fund does not have transaction expenses, if the transaction and ongoing expenses at the Contract level were included, the expenses shown below would be higher. You should consult your Contract prospectus or disclosure document for more information.
The table shows Fund-level ongoing expenses and can help you understand these expenses and compare them with those of other mutual funds offered through the Contract. The table assumes a $1,000 investment held for the six months indicated. Please refer to the Fund prospectus for additional information on operating expenses.
Actual Fund Expenses
The first line (Actual) for each share class listed in the table below provides actual account values and expenses. The “Ending Account Value” is derived from the Fund’s actual return, which includes the effect of ongoing Fund expenses, but does not include the effect of ongoing Contract expenses.
You can estimate the Fund-level expenses you incurred during the period, by following these steps. Of course, your account value and expenses will differ from those in this illustration:
| 1. | Divide your account value by $1,000. |
If an account had an $8,600 value, then $8,600 ÷ $1,000 = 8.6.
| 2. | Multiply the result by the number under the heading “Fund-Level Expenses Incurred During Period.” |
If Fund-Level Expenses Incurred During Period were $7.50, then 8.6 × $7.50 = $64.50.
Templeton Global Income Securities Fund – Class 1
TGI-7
In this illustration, the estimated expenses incurred this period at the Fund level are $64.50.
Hypothetical Example for Comparison with Other Mutual Funds
Information in the second line (Hypothetical) for each class in the table can help you compare ongoing expenses of the Fund with those of other mutual funds offered through the Contract. This information may not be used to estimate the actual ending account balance or expenses you incurred during the period. The hypothetical “Ending Account Value” is based on the actual expense ratio for each class and an assumed 5% annual rate of return before expenses, which does not represent the Fund’s actual return. The figure under the heading “Fund-Level Expenses Incurred During Period” shows the hypothetical expenses your account would have incurred under this scenario. You can compare this figure with the 5% hypothetical examples that appear in shareholder reports of other funds offered through a Contract.
| | | | | | | | | |
| Class 1 | | Beginning
Account
Value 6/30/04 | | Ending
Account
Value 12/31/04 | | Fund-Level
Expenses Incurred
During Period*
6/30/04-12/31/04 |
Actual | | $ | 1,000 | | $ | 1,166.90 | | $ | 4.25 |
Hypothetical (5% return before expenses) | | $ | 1,000 | | $ | 1,021.22 | | $ | 3.96 |
*Expenses are equal to the annualized expense ratio for the Fund’s Class 1 shares (0.78%), which does not include any ongoing expenses of the Contract for which the Fund is an investment option, multiplied by the average account value over the period, multiplied by 184/366 to reflect the one-half year period.
TGI-8
FRANKLIN TEMPLETON VARIABLE INSURANCE PRODUCTS TRUST
TEMPLETON GLOBAL INCOME SECURITIES FUND
Financial Highlights
| | | | | | | | | | | | | | | | | | | | |
| | | Class 1
| |
| | | Year Ended December 31,
| |
| | | 2004 | | | 2003 | | | 2002 | | | 2001 | | | 2000 | |
| | |
|
|
|
Per share operating performance | | | | | | | | | | | | | | | | | | | | |
(for a share outstanding throughout the year) | | | | | | | | | | | | | | | | | | | | |
Net asset value, beginning of year | | $ | 15.54 | | | $ | 13.67 | | | $ | 11.39 | | | $ | 11.53 | | | $ | 11.07 | |
| | |
|
|
|
Income from investment operations: | | | | | | | | | | | | | | | | | | | | |
Net investment incomea | | | .66 | | | | .69 | | | | .59 | | | | .59 | c | | | .68 | |
Net realized and unrealized gains (losses) | | | 1.37 | | | | 2.35 | | | | 1.83 | | | | (.32 | )c | | | (.20 | ) |
| | |
|
|
|
Total from investment operations | | | 2.03 | | | | 3.04 | | | | 2.42 | | | | .27 | | | | .48 | |
| | |
|
|
|
Less distributions from net investment income | | | (1.77 | ) | | | (1.17 | ) | | | (.14 | ) | | | (.41 | ) | | | (.02 | ) |
| | |
|
|
|
Net asset value, end of year | | $ | 15.80 | | | $ | 15.54 | | | $ | 13.67 | | | $ | 11.39 | | | $ | 11.53 | |
| | |
|
|
|
| | | | | |
Total returnb | | | 15.09% | | | | 22.72% | | | | 21.44% | | | | 2.55% | | | | 4.32% | |
Ratios/supplemental data | | | | | | | | | | | | | | | | | | | | |
Net assets, end of year (000’s) | | $ | 49,845 | | | $ | 52,842 | | | $ | 50,622 | | | $ | 63,781 | | | $ | 81,171 | |
Ratios to average net assets: | | | | | | | | | | | | | | | | | | | | |
Expenses before expense reduction | | | .79% | | | | .76% | | | | .73% | | | | .71% | | | | .72% | |
Expenses net of expense reduction | | | .78% | | | | .76% | | | | .73% | | | | .71% | | | | .72% | |
Net investment income | | | 4.40% | | | | 4.72% | | | | 4.88% | | | | 5.22% | c | | | 6.22% | |
Portfolio turnover rate | | | 37.39% | | | | 53.01% | | | | 27.91% | | | | 122.45% | | | | 40.43% | |
| a | Based on average daily shares outstanding. |
| b | Total return does not include any fees, charges or expenses imposed by the variable annuity and life insurance contracts for which the Franklin Templeton Variable Insurance Products Trust serves as an underlying investment vehicle. Total return is not annualized for periods less than one year. |
| c | Effective January 1, 2001, the Fund adopted the provisions of the AICPA Audit and Accounting Guide for Investment Companies and began amortizing all premium and discount on fixed-income securities, as required. The effect of this change was as follows: |
| | |
Net investment income (loss) per share | | $(.059) |
Net realized and unrealized gains (losses) per share | | .059 |
Ratio of net investment income to average net assets | | (.53)% |
Per share data and ratios for prior periods have not been restated to reflect this change in accounting policy.
See notes to financial statements.
TGI-9
FRANKLIN TEMPLETON VARIABLE INSURANCE PRODUCTS TRUST
TEMPLETON GLOBAL INCOME SECURITIES FUND
Financial Highlights (continued)
| | | | | | | | | | | | | | | | | | | | |
| | | Class 2
| |
| | | Year Ended December 31,
| |
| | | 2004 | | | 2003 | | | 2002 | | | 2001 | | | 2000 | |
| | |
|
|
|
Per share operating performance | | | | | | | | | | | | | | | | | | | | |
(for a share outstanding throughout the year) | | | | | | | | | | | | | | | | | | | | |
Net asset value, beginning of year | | $ | 15.42 | | | $ | 13.59 | | | $ | 11.33 | | | $ | 11.48 | | | $ | 11.04 | |
| | |
|
|
|
Income from investment operations: | | | | | | | | | | | | | | | | | | | | |
Net investment incomea | | | .60 | | | | .65 | | | | .54 | | | | .55 | c | | | .65 | |
Net realized and unrealized gains (losses) | | | 1.36 | | | | 2.33 | | | | 1.84 | | | | (.31 | )c | | | (.19 | ) |
| | |
|
|
|
Total from investment operations | | | 1.96 | | | | 2.98 | | | | 2.38 | | | | .24 | | | | .46 | |
| | |
|
|
|
Less distributions from net investment income | | | (1.74 | ) | | | (1.15 | ) | | | (.12 | ) | | | (.39 | ) | | | (.02 | ) |
| | |
|
|
|
Net asset value, end of year | | $ | 15.64 | | | $ | 15.42 | | | $ | 13.59 | | | $ | 11.33 | | | $ | 11.48 | |
| | |
|
|
|
| | | | | |
Total returnb | | | 14.74% | | | | 22.44% | | | | 21.15% | | | | 2.24% | | | | 4.14% | |
Ratios/supplemental data | | | | | | | | | | | | | | | | | | | | |
Net assets, end of year (000’s) | | $ | 19,779 | | | $ | 5,181 | | | $ | 2,119 | | | $ | 1,286 | | | $ | 1,237 | |
Ratios to average net assets: | | | | | | | | | | | | | | | | | | | | |
Expenses before expense reduction | | | 1.04% | | | | 1.01% | | | | .98% | | | | .96% | | | | .97% | |
Expenses net of expense reduction | | | 1.03% | | | | 1.01% | | | | .98% | | | | .96% | | | | .97% | |
Net investment income | | | 4.15% | | | | 4.47% | | | | 4.63% | | | | 4.95% | c | | | 5.94% | |
Portfolio turnover rate | | | 37.39% | | | | 53.01% | | | | 27.91% | | | | 122.45% | | | | 40.43% | |
| a | Based on average daily shares outstanding. |
| b | Total return does not include any fees, charges or expenses imposed by the variable annuity and life insurance contracts for which the Franklin Templeton Variable Insurance Products Trust serves as an underlying investment vehicle. Total return is not annualized for periods less than one year. |
| c | Effective January 1, 2001, the Fund adopted the provisions of the AICPA Audit and Accounting Guide for Investment Companies and began amortizing all premium and discount on fixed-income securities, as required. The effect of this change was as follows: |
| | |
Net investment income (loss) per share | | $(.059) |
Net realized and unrealized gains (losses) per share | | .059 |
Ratio of net investment income to average net assets | | (.53)% |
Per share data and ratios for prior periods have not been restated to reflect this change in accounting policy.
See notes to financial statements.
TGI-10
FRANKLIN TEMPLETON VARIABLE INSURANCE PRODUCTS TRUST
TEMPLETON GLOBAL INCOME SECURITIES FUND
Statement of Investments, December 31, 2004
| | | | | | |
| | | PRINCIPAL
AMOUNTa | | | VALUE |
Long Term Investments 94.8% | | | | | | |
Australia 5.4% | | | | | | |
New South Wales Treasury Corp., | | | | | | |
6.50%, 5/01/06 | | 200,000 | AUD | | $ | 159,008 |
8.00%, 3/01/08 | | 1,990,000 | AUD | | | 1,675,335 |
Queensland Treasury Corp., 6.00%, | | | | | | |
8/14/13 | | 2,200,000 | AUD | | | 1,782,059 |
10/14/15 | | 200,000 | AUD | | | 162,189 |
| | | | | |
|
|
| | | | | | | 3,778,591 |
| | | | | |
|
|
Austria 2.7% | | | | | | |
Republic of Austria, | | | | | | |
5.50%, 10/20/07 | | 425,000 | EUR | | | 620,267 |
5.00%, 7/15/12 | | 850,000 | EUR | | | 1,273,106 |
| | | | | |
|
|
| | | | | | | 1,893,373 |
| | | | | |
|
|
Belgium 1.6% | | | | | | |
Kingdom of Belgium, 7.50%, 7/29/08 | | 686,000 | EUR | | | 1,076,588 |
| | | | | |
|
|
Brazil .6% | | | | | | |
Republic of Brazil, L, FRN, 3.125%, 4/15/12 | | 403,239 | | | | 386,101 |
| | | | | |
|
|
Canada 5.3% | | | | | | |
Government of Canada, | | | | | | |
8.75%, 12/01/05 | | 345,000 | CAD | | | 303,238 |
3.00%, 6/01/06 | | 1,700,000 | CAD | | | 1,421,715 |
5.75%, 9/01/06 | | 200,000 | CAD | | | 174,445 |
6.00%, 6/01/11 | | 937,000 | CAD | | | 869,312 |
Province of Alberta, | | | | | | |
7.50%, 12/01/05 | | 930,000 | CAD | | | 808,375 |
senior note, 7.25%, 10/28/05 | | 150,000 | CAD | | | 129,476 |
| | | | | |
|
|
| | | | | | | 3,706,561 |
| | | | | |
|
|
Colombia .4% | | | | | | |
Republic of Colombia, | | | | | | |
10.00%, 1/23/12 | | 132,000 | | | | 152,131 |
11.75%, 2/25/20 | | 119,000 | | | | 152,338 |
| | | | | |
|
|
| | | | | | | 304,469 |
| | | | | |
|
|
Denmark 2.0% | | | | | | |
Kingdom of Denmark, | | | | | | |
7.00%, 11/15/07 | | 1,450,000 | DKK | | | 295,176 |
5.00%, 11/15/13 | | 3,950,000 | DKK | | | 793,149 |
7.00%, 11/10/24 | | 1,300,000 | DKK | | | 325,951 |
| | | | | |
|
|
| | | | | | | 1,414,276 |
| | | | | |
|
|
Finland 3.6% | | | | | | |
Government of Finland, | | | | | | |
5.00%, 4/25/09 | | 660,000 | EUR | | | 968,971 |
5.375%, 7/04/13 | | 1,000,000 | EUR | | | 1,538,498 |
| | | | | |
|
|
| | | | | | | 2,507,469 |
| | | | | |
|
|
France 2.2% | | | | | | |
Government of France, 4.00%, 10/25/09 | | 1,055,000 | EUR | | | 1,494,537 |
| | | | | |
|
|
TGI-11
FRANKLIN TEMPLETON VARIABLE INSURANCE PRODUCTS TRUST
TEMPLETON GLOBAL INCOME SECURITIES FUND
Statement of Investments, December 31, 2004 (cont.)
| | | | | | |
| | | PRINCIPAL
AMOUNTa | | | VALUE |
Long Term Investments (cont.) | | | | | | |
Germany 2.5% | | | | | | |
Federal Republic of Germany, | | | | | | |
2.50%, 9/16/05 | | 385,000 | EUR | | $ | 523,495 |
4.00%, 2/16/07 | | 860,000 | EUR | | | 1,201,785 |
| | | | | |
|
|
| | | | | | | 1,725,280 |
| | | | | |
|
|
Greece 1.5% | | | | | | |
Hellenic Republic, 4.60%, 5/20/13 | | 700,000 | EUR | | | 1,011,538 |
| | | | | |
|
|
Hungary 1.2% | | | | | | |
Government of Hungary, | | | | | | |
9.25%, 5/12/05 | | 31,800,000 | HUF | | | 176,041 |
8.50%, 10/12/05 | | 101,100,000 | HUF | | | 557,870 |
7.00%, 4/12/06 | | 20,000,000 | HUF | | | 108,521 |
| | | | | |
|
|
| | | | | | | 842,432 |
| | | | | |
|
|
Indonesia 5.1% | | | | | | |
Government of Indonesia, 11.00%, 10/15/14 | | 600,000,000 | IDR | | | 67,038 |
Indonesia Recapital Bond, | | | | | | |
14.00%, 6/15/09 | | 7,407,000,000 | IDR | | | 914,454 |
13.15%, 3/15/10 | | 6,005,000,000 | IDR | | | 726,487 |
14.25%, 6/15/13 | | 2,550,000,000 | IDR | | | 332,400 |
14.275%, 12/15/13 | | 11,692,000,000 | IDR | | | 1,527,233 |
| | | | | |
|
|
| | | | | | | 3,567,612 |
| | | | | |
|
|
Irish Republic 1.7% | | | | | | |
Republic of Ireland, 5.00%, 4/18/13 | | 800,000 | EUR | | | 1,202,204 |
| | | | | |
|
|
Italy 1.1% | | | | | | |
Buoni Poliennali Del Tesoro, 7.75%, 11/01/06 | | 531,293 | EUR | | | 787,726 |
| | | | | |
|
|
Mexico 1.0% | | | | | | |
United Mexican States, 144A, 7.50%, 3/08/10 | | 450,000 | EUR | | | 713,697 |
| | | | | |
|
|
Netherlands 4.2% | | | | | | |
Government of Netherlands, | | | | | | |
3.00%, 7/15/06 | | 450,000 | EUR | | | 616,024 |
5.75%, 2/15/07 | | 1,598,000 | EUR | | | 2,311,171 |
| | | | | |
|
|
| | | | | | | 2,927,195 |
| | | | | |
|
|
New Zealand 7.3% | | | | | | |
Government of New Zealand, | | | | | | |
7.00%, 7/15/09 | | 5,430,000 | NZD | | | 4,049,125 |
6.00%, 11/15/11 | | 1,300,000 | NZD | | | 934,315 |
6.50%, 4/15/13 | | 130,000 | NZD | | | 96,479 |
| | | | | |
|
|
| | | | | | | 5,079,919 |
| | | | | |
|
|
Norway 1.9% | | | | | | |
Kingdom of Norway, 6.75%, 1/15/07 | | 7,350,000 | NOK | | | 1,313,994 |
| | | | | |
|
|
Philippines 1.4% | | | | | | |
Republic of Philippines, | | | | | | |
9.00%, 2/15/13 | | 800,000 | | | | 820,520 |
Reg S, 9.125%, 2/22/10 | | 100,000 | EUR | | | 143,958 |
| | | | | |
|
|
| | | | | | | 964,478 |
| | | | | |
|
|
TGI-12
FRANKLIN TEMPLETON VARIABLE INSURANCE PRODUCTS TRUST
TEMPLETON GLOBAL INCOME SECURITIES FUND
Statement of Investments, December 31, 2004 (cont.)
| | | | | | |
| | | PRINCIPAL
AMOUNTa | | | VALUE |
Long Term Investments (cont.) | | | | | | |
Poland 6.3% | | | | | | |
Republic of Poland, | | | | | | |
8.50%, 11/12/06 | | 4,720,000 | PLN | | $ | 1,627,284 |
8.50%, 5/12/07 | | 3,290,000 | PLN | | | 1,148,035 |
6.00%, 5/24/09 | | 4,860,000 | PLN | | | 1,604,566 |
| | | | | |
|
|
| | | | | | | 4,379,885 |
| | | | | |
|
|
Russia 1.8% | | | | | | |
Russian Federation, Reg S, | | | | | | |
11.00%, 7/24/18 | | 860,000 | | | | 1,207,300 |
5.00% to 3/31/07, 7.50% thereafter, 3/31/30 | | 45,000 | | | | 46,593 |
| | | | | |
|
|
| | | | | | | 1,253,893 |
| | | | | |
|
|
Singapore 1.0% | | | | | | |
Republic of Singapore, | | | | | | |
4.00%, 3/01/07 | | 850,000 | SGD | | | 546,759 |
2.625%, 10/01/07 | | 180,000 | SGD | | | 112,969 |
| | | | | |
|
|
| | | | | | | 659,728 |
| | | | | |
|
|
South Africa .4% | | | | | | |
Republic of South Africa, 5.25%, 5/16/13 | | 200,000 | EUR | | | 288,512 |
| | | | | |
|
|
South Korea 12.1% | | | | | | |
Korea Treasury Bond, | | | | | | |
4.50%, 3/05/06 | | 2,100,000,000 | KRW | | | 2,086,321 |
4.50%, 9/03/06 | | 510,000,000 | KRW | | | 509,666 |
6.90%, 1/16/07 | | 1,200,000,000 | KRW | | | 1,258,410 |
4.75%, 3/03/07 | | 1,600,000,000 | KRW | | | 1,616,967 |
4.75%, 3/12/08 | | 2,883,000,000 | KRW | | | 2,942,877 |
| | | | | |
|
|
| | | | | | | 8,414,241 |
| | | | | |
|
|
Spain .8% | | | | | | |
Government of Spain, 6.00%, 1/31/08 | | 390,000 | EUR | | | 579,786 |
| | | | | |
|
|
Sweden 8.1% | | | | | | |
Kingdom of Sweden, | | | | | | |
6.00%, 2/09/05 | | 5,500,000 | SEK | | | 830,923 |
3.50%, 4/20/06 | | 3,800,000 | SEK | | | 580,681 |
8.00%, 8/15/07 | | 14,990,000 | SEK | | | 2,551,330 |
5.25%, 3/15/11 | | 3,900,000 | SEK | | | 642,073 |
5.50%, 10/08/12 | | 6,280,000 | SEK | | | 1,054,821 |
| | | | | |
|
|
| | | | | | | 5,659,828 |
| | | | | |
|
|
Thailand 5.7% | | | | | | |
Government of Thailand, | | | | | | |
6.00%, 3/05/05 | | 8,000,000 | THB | | | 207,450 |
8.50%, 10/14/05 | | 82,800,000 | THB | | | 2,240,183 |
8.00%, 12/08/06 | | 43,500,000 | THB | | | 1,228,141 |
4.125%, 2/12/08 | | 9,000,000 | THB | | | 237,758 |
8.50%, 12/08/08 | | 1,000,000 | THB | | | 30,397 |
| | | | | |
|
|
| | | | | | | 3,943,929 |
| | | | | |
|
|
TGI-13
FRANKLIN TEMPLETON VARIABLE INSURANCE PRODUCTS TRUST
TEMPLETON GLOBAL INCOME SECURITIES FUND
Statement of Investments, December 31, 2004 (cont.)
| | | | | | | |
| | | PRINCIPAL
AMOUNTa | | | VALUE |
Long Term Investments (cont.) | | | | | | | |
Ukraine 2.5% | | | | | | | |
Republic of Ukraine, | | | | | | | |
144A, 6.875%, 3/04/11 | | $ | 260,000 | | | $ | 267,475 |
144A, 7.65%, 6/11/13 | | | 1,130,000 | | | | 1,211,078 |
FRN, 5.36%, 8/05/09 | | | 275,000 | | | | 291,761 |
| | | | | | |
|
|
| | | | | | | | 1,770,314 |
| | | | | | |
|
|
United Kingdom .5% | | | | | | | |
United Kingdom, 7.50%, 12/07/06 | | | 175,000 | GBP | | | 354,750 |
| | | | | | |
|
|
Venezuela 2.9% | | | | | | | |
Republic of Venezuela, | | | | | | | |
9.25%, 9/15/27 | | | 1,710,000 | | | | 1,808,325 |
FRN, 3.09%, 4/20/11 | | | 265,000 | | | | 241,647 |
| | | | | | |
|
|
| | | | | | | | 2,049,972 |
| | | | | | |
|
|
Total Long Term Investments (Cost $53,802,148) | | | | | | | 66,052,878 |
| | | | | | |
|
|
Short Term Investments 3.1% | | | | | | | |
Canada .5% | | | | | | | |
bCanada Treasury Bill, 7/14/05 | | | 390,000 | CAD | | | 320,347 |
| | | | | | |
|
|
Norway 2.6% | | | | | | | |
bNorwegian Treasury Bills, 6/15/05 - 9/21/05 | | | 11,140,000 | NOK | | | 1,814,775 |
| | | | | | |
|
|
Total Short Term Investments (Cost $2,028,754) | | | | | | | 2,135,122 |
| | | | | | |
|
|
Total Investments (Cost $55,830,902) 97.9% | | | | | | | 68,188,000 |
Other Assets, less Liabilities 2.1% | | | | | | | 1,436,173 |
| | | | | | |
|
|
Net Assets 100.0% | | | | | | $ | 69,624,173 |
| | | | | | |
|
|
Currency Abbreviations:
AUD - Australian Dollar
CAD - Canadian Dollar
DKK - Danish Krone
EUR - Euro
GBP - British Pound
HUF - Hungarian Forint
IDR - Indonesian Rupiah
KRW - South Korean Won
NOK - Norwegian Krone
NZD - New Zealand Dollar
PLN - Polish Zloty
SEK - Swedish Krona
SGD - Singapore Dollar
THB - Thai Baht
Portfolio Abbreviation:
FRN - Floating Rate Note
| a | The principal amount is stated in U.S. dollars unless otherwise indicated. |
| b | Security is traded on a discount basis with no stated coupon rate. |
See notes to financial statements.
TGI-14
FRANKLIN TEMPLETON VARIABLE INSURANCE PRODUCTS TRUST
TEMPLETON GLOBAL INCOME SECURITIES FUND
Financial Statements
Statement of Assets and Liabilities
December 31, 2004
| | | | |
Assets: | | | | |
Investments in securities: | | | | |
Cost | | $ | 55,830,902 | |
| | |
|
|
|
Value | | | 68,188,000 | |
Foreign currency, at value (cost $127,248) | | | 129,352 | |
Receivables: | | | | |
Capital shares sold | | | 43,966 | |
Interest | | | 1,469,536 | |
| | |
|
|
|
Total assets | | | 69,830,854 | |
| | |
|
|
|
Liabilities: | | | | |
Payables: | | | | |
Capital shares redeemed | | | 7,359 | |
Affiliates | | | 43,839 | |
Funds advanced by custodian | | | 118,787 | |
Custodian fees (Note 4) | | | 10,500 | |
Professional fees | | | 16,936 | |
Other liabilities | | | 9,260 | |
| | |
|
|
|
Total liabilities | | | 206,681 | |
| | |
|
|
|
Net assets, at value | | $ | 69,624,173 | |
| | |
|
|
|
Net assets consist of: | | | | |
Undistributed net investment income | | $ | 3,781,771 | |
Net unrealized appreciation (depreciation) | | | 12,454,569 | |
Accumulated net realized gain (loss) | | | (9,131,804 | ) |
Capital shares | | | 62,519,637 | |
| | |
|
|
|
Net assets, at value | | $ | 69,624,173 | |
| | |
|
|
|
Class 1: | | | | |
Net assets, at value | | $ | 49,844,681 | |
| | |
|
|
|
Shares outstanding | | | 3,154,870 | |
| | |
|
|
|
Net asset value and offering price per share | | $ | 15.80 | |
| | |
|
|
|
Class 2: | | | | |
Net assets, at value | | $ | 19,779,492 | |
| | |
|
|
|
Shares outstanding | | | 1,264,323 | |
| | |
|
|
|
Net asset value and offering price per share | | $ | 15.64 | |
| | |
|
|
|
See notes to financial statements.
TGI-15
FRANKLIN TEMPLETON VARIABLE INSURANCE PRODUCTS TRUST
TEMPLETON GLOBAL INCOME SECURITIES FUND
Financial Statements (continued)
Statement of Operations
for the year ended December 31, 2004
| | | | |
Investment income: | | | | |
Interest (net of foreign taxes of $72,127) | | $ | 2,990,567 | |
Expenses: | | | | |
Management fees (Note 3) | | | 360,978 | |
Distribution fees - Class 2 (Note 3) | | | 22,555 | |
Transfer agent fees | | | 2,366 | |
Custodian fees (Note 4) | | | 40,431 | |
Reports to shareholders | | | 29,550 | |
Professional fees | | | 17,044 | |
Trustees’ fees and expenses | | | 349 | |
Other | | | 4,253 | |
| | |
|
|
|
Total expenses | | | 477,526 | |
Expense reductions (Note 4) | | | (4,537 | ) |
| | |
|
|
|
Net expenses | | | 472,989 | |
| | |
|
|
|
Net investment income | | | 2,517,578 | |
| | |
|
|
|
Realized and unrealized gains (losses): | | | | |
Net realized gain (loss) from: | | | | |
Investments | | | 3,211,042 | |
Foreign currency transactions | | | 63,626 | |
| | |
|
|
|
Net realized gain (loss) | | | 3,274,668 | |
| | |
|
|
|
Net change in unrealized appreciation (depreciation) on: | | | | |
Investments | | | 2,882,362 | |
Translation of assets and liabilities denominated in foreign currencies | | | 15,420 | |
| | |
|
|
|
Net change in unrealized appreciation (depreciation) | | | 2,897,782 | |
| | |
|
|
|
Net realized and unrealized gain (loss) | | | 6,172,450 | |
| | |
|
|
|
Net increase (decrease) in net assets resulting from operations | | $ | 8,690,028 | |
| | |
|
|
|
See notes to financial statements.
TGI-16
FRANKLIN TEMPLETON VARIABLE INSURANCE PRODUCTS TRUST
TEMPLETON GLOBAL INCOME SECURITIES FUND
Financial Statements (continued)
Statements of Changes in Net Assets
for the years ended December 31, 2004 and 2003
| | | | | | | | |
| | | 2004 | | | 2003 | |
| | |
| |
Increase (decrease) in net assets: | | | | | | | | |
Operations: | | | | | | | | |
Net investment income | | $ | 2,517,578 | | | $ | 2,601,977 | |
Net realized gain (loss) from investments and foreign currency transactions | | | 3,274,668 | | | | 3,815,347 | |
Net change in unrealized appreciation (depreciation) on investments and translation of assets and liabilities denominated in foreign currencies | | | 2,897,782 | | | | 4,940,637 | |
| | |
| |
Net increase (decrease) in net assets resulting from operations | | | 8,690,028 | | | | 11,357,961 | |
Distributions to shareholders from: | | | | | | | | |
Net investment income: | | | | | | | | |
Class 1 | | | (5,364,377 | ) | | | (3,980,291 | ) |
Class 2 | | | (706,986 | ) | | | (323,749 | ) |
| | |
| |
Total distributions to shareholders | | | (6,071,363 | ) | | | (4,304,040 | ) |
Capital share transactions: (Note 2) | | | | | | | | |
Class 1 | | | (4,352,338 | ) | | | (4,386,768 | ) |
Class 2 | | | 13,335,159 | | | | 2,614,619 | |
| | |
| |
Total capital share transactions | | | 8,982,821 | | | | (1,772,149 | ) |
Net increase (decrease) in net assets | | | 11,601,486 | | | | 5,281,772 | |
Net assets: | | | | | | | | |
Beginning of year | | | 58,022,687 | | | | 52,740,915 | |
| | |
| |
End of year | | $ | 69,624,173 | | | $ | 58,022,687 | |
| | |
| |
Undistributed net investment income included in net assets: | | | | | | | | |
End of year | | $ | 3,781,771 | | | $ | 5,047,873 | |
| | |
| |
See notes to financial statements.
TGI-17
FRANKLIN TEMPLETON VARIABLE INSURANCE PRODUCTS TRUST
TEMPLETON GLOBAL INCOME SECURITIES FUND
Notes to Financial Statements
1. ORGANIZATION AND SIGNIFICANT ACCOUNTING POLICIES
Franklin Templeton Variable Insurance Products Trust (the Trust) is registered under the Investment Company Act of 1940 as an open-end investment company, consisting of twenty-one separate series (the Funds). The Templeton Global Income Securities Fund (the Fund) included in this report is non-diversified. The financial statements of the remaining funds in the series are presented separately. Shares of the Fund are sold only to insurance company separate accounts to fund the benefits of variable life insurance policies or variable annuity contracts. As of December 31, 2004, over 61% of the Fund’s shares were sold through one insurance company. The Fund’s investment objective is current income.
The following summarizes the Fund’s significant accounting policies.
a. Security Valuation
Securities listed on a securities exchange or on the NASDAQ National Market System are valued at the last quoted sale price or the official closing price of the day, respectively. Over-the-counter securities and listed securities for which there is no reported sale are valued within the range of the most recent quoted bid and ask prices. Securities that trade in multiple markets or on multiple exchanges are valued according to the broadest and most representative market.
Foreign securities are valued as of the close of trading on the foreign stock exchange on which the security is primarily traded, or the NYSE, whichever is earlier. The value is then converted into its U.S. dollar equivalent at the foreign exchange rate in effect at the close of the NYSE on the day that the value of the foreign security is determined. If no sale is reported at that time, the foreign security will be valued within the range of the most recent quoted bid and ask prices.
The Trust has procedures to determine the fair value of individual securities and other assets for which market prices are not readily available or which may not be reliably priced. Some methods for valuing these securities may include: fundamental analysis, matrix pricing, discounts from market prices of similar securities, or discounts applied due to the nature and duration of restrictions on the disposition of the securities. Occasionally, events occur between the time at which trading in a security is completed and the close of the NYSE that might call into question the availability (including the reliability) of the value of a portfolio security held by the Fund. If such an event occurs, the securities may be valued using fair value procedures, which may include the use of independent pricing services. All security valuation procedures are approved by the Trust’s Board of Trustees.
b. Foreign Currency Translation
Portfolio securities and other assets and liabilities denominated in foreign currencies are translated into U.S. dollars based on the exchange rate of such currencies against U.S. dollars on the date of valuation. Purchases and sales of securities, income and expense items denominated in foreign currencies are translated into U.S. dollars at the exchange rate in effect on the transaction date. Occasionally events may impact the availability or reliability of foreign exchange rates used to convert the U.S. dollar equivalent value. If such an event occurs, the foreign exchange rate will be valued at fair value using procedures established and approved by the Fund’s Board of Trustees.
The Fund does not separately report the effect of changes in foreign exchange rates from changes in market prices on securities held. Such changes are included in net realized and unrealized gain or loss from investments on the Statement of Operations.
Realized foreign exchange gains or losses arise from sales of foreign currencies, currency gains or losses realized between the trade and settlement dates on securities transactions and the difference between the recorded amounts of dividends, interest, and foreign withholding taxes and the U.S. dollar equivalent of the amounts actually received or paid. Net unrealized foreign exchange gains and losses arise from changes in foreign exchange rates on foreign denominated assets and liabilities other than investments in securities.
TGI-18
FRANKLIN TEMPLETON VARIABLE INSURANCE PRODUCTS TRUST
TEMPLETON GLOBAL INCOME SECURITIES FUND
Notes to Financial Statements (continued)
1. ORGANIZATION AND SIGNIFICANT ACCOUNTING POLICIES (cont.)
c. Foreign Currency Contracts
When the Fund purchases or sells foreign securities it may enter into foreign exchange contracts to minimize foreign exchange risk from the trade date to the settlement date of the transactions. A foreign exchange contract is an agreement between two parties to exchange different currencies at an agreed upon exchange rate on a specified date. Realized and unrealized gains and losses on these contracts are included in the Statement of Operations.
The risks of these contracts include movement in the values of the foreign currencies relative to the U.S. dollar and the possible inability of the counterparties to fulfill their obligations under the contracts.
d. Income Taxes
No provision has been made for U.S. income taxes because the Fund’s policy is to qualify as a regulated investment company under Subchapter M of the Internal Revenue Code and to distribute substantially all of its taxable income. Fund distributions to shareholders are determined on an income tax basis and may differ from net investment income and realized gains for financial reporting purposes.
e. Security Transactions, Investment Income, Expenses and Distributions
Security transactions are accounted for on trade date. Realized gains and losses on security transactions are determined on a specific identification basis. Interest income and estimated expenses are accrued daily. Discounts and premiums on securities purchased are amortized over the lives of the respective securities. Distributions to shareholders are recorded on the ex-dividend date.
Common expenses incurred by the Trust are allocated among the funds based on the ratio of net assets of each fund to the combined net assets. Other expenses are charged to each fund on a specific identification basis.
Realized and unrealized gains and losses and net investment income, other than class specific expenses, are allocated daily to each class of shares based upon the relative proportion of net assets of each class.
f. Accounting Estimates
The preparation of financial statements in accordance with accounting principles generally accepted in the United States of America requires management to make estimates and assumptions that affect the reported amounts of assets and liabilities at the date of the financial statements and the amounts of income and expenses during the reporting period. Actual results could differ from those estimates.
g. Guarantees and Indemnifications
Under the Trust’s organizational documents, its officers and trustees are indemnified by the Trust against certain liability arising out of the performance of their duties to the Trust. Additionally, in the normal course of business, the Trust enters into contracts with service providers that contain general indemnification clauses. The Trust’s maximum exposure under these arrangements is unknown as this would involve future claims that may be made against the Trust that have not yet occurred. However, based on experience, the Trust expects the risk of loss to be remote.
TGI-19
FRANKLIN TEMPLETON VARIABLE INSURANCE PRODUCTS TRUST
TEMPLETON GLOBAL INCOME SECURITIES FUND
Notes to Financial Statements (continued)
2. SHARES OF BENEFICIAL INTEREST
The Fund offers two classes of shares: Class 1 and Class 2. Each class of shares differs by its distribution fees, voting rights on matters affecting a single class and its exchange privilege.
At December 31, 2004, there were an unlimited number of shares authorized ($.01 par value). Transactions in the Fund’s shares were as follows:
| | | | | | | | | | | | | | |
| | | Year Ended December 31,
| |
| | | 2004
| | | 2003
| |
| Class 1 Shares: | | Shares
| | | Amount
| | | Shares
| | | Amount
| |
Shares sold | | 142,426 | | | $ | 2,100,636 | | | 157,660 | | | $ | 2,314,617 | |
Shares issued in reinvestment of distributions | | 400,626 | | | | 5,364,377 | | | 271,137 | | | | 3,980,291 | |
Shares redeemed | | (788,314 | ) | | | (11,817,351 | ) | | (733,010 | ) | | | (10,681,676 | ) |
| | |
| |
Net increase (decrease) | | (245,262 | ) | | $ | (4,352,338 | ) | | (304,213 | ) | | $ | (4,386,768 | ) |
| | |
| |
| Class 2 Shares: | | | | | | | | | | | | |
Shares sold | | 973,769 | | | $ | 14,111,268 | | | 255,207 | | | $ | 3,668,776 | |
Shares issued in reinvestment of distributions | | 53,237 | | | | 706,986 | | | 22,205 | | | | 323,749 | |
Shares redeemed | | (98,666 | ) | | | (1,483,095 | ) | | (97,419 | ) | | | (1,377,906 | ) |
| | |
| |
Net increase (decrease) | | 928,340 | | | $ | 13,335,159 | | | 179,993 | | | $ | 2,614,619 | |
| | |
| |
3. TRANSACTIONS WITH AFFILIATES
Certain officers and trustees of the Fund are also officers and/or directors of the following entities:
| | |
| Entity | | Affiliation |
Franklin Advisers Inc. (Advisers) | | Investment manager |
Franklin Templeton Services LLC (FT Services) | | Administrative manager |
Franklin Templeton Distributors Inc. (Distributors) | | Principal underwriter |
Franklin Templeton Investor Services LLC (Investor Services) | | Transfer agent |
a. Management Fees
The Fund pays an investment management fee to Advisers based on the average daily net assets of the Fund as follows:
| | |
| Annualized Fee Rate | | Net Assets |
| .625% | | First $100 million |
| .500% | | Over $100 million, up to and including $250 million |
| .450% | | Over $250 million, up to and including $10 billion |
Fees are further reduced on net assets over $10 billion.
b. Administrative Fees
Under an agreement with Advisers, FT Services provides administrative services to the Fund. The fee is paid by Advisers based on the average daily net assets of the Fund, and is not an additional expense of the Fund.
TGI-20
FRANKLIN TEMPLETON VARIABLE INSURANCE PRODUCTS TRUST
TEMPLETON GLOBAL INCOME SECURITIES FUND
Notes to Financial Statements (continued)
3. TRANSACTIONS WITH AFFILIATES (cont.)
c. Distribution Fees
The Fund reimburses Distributors up to .25% per year of its average daily net assets of Class 2, for costs incurred in marketing the Fund’s shares under a Rule 12b-1 plan.
d. Transfer Agent Fees
Investor Services, under terms of an agreement, performs shareholder servicing for the Fund and is not paid by the Fund for the services.
4. EXPENSE OFFSET ARRANGEMENT
The Fund has entered into an arrangement with its custodian whereby credits realized as a result of uninvested cash balances are used to reduce a portion of the Fund’s custodian expenses. During the year ended December 31, 2004, the custodian fees were reduced as noted in the Statement of Operations.
5. INCOME TAXES
At December 31, 2004, the Fund had tax basis capital losses which may be carried over to offset future capital gains. Such losses expire as follows:
| | | |
Capital loss carryovers expiring in: | | | |
2007 | | $ | 4,883,076 |
2008 | | | 2,370,518 |
2009 | | | 1,649,033 |
2010 | | | 177,731 |
| | |
|
|
| | | $ | 9,080,358 |
| | |
|
|
The tax character of distributions paid during the years ended December 31, 2004 and 2003, was as follows:
| | | | | | |
| | | 2004
| | 2003
|
Distributions paid from ordinary income | | $ | 6,071,363 | | $ | 4,304,040 |
| | |
|
Net investment income (loss) differs for financial statement and tax purposes primarily due to differing treatments of foreign currency transactions and bond discounts and premiums.
Net realized gains (losses) differ for financial statement and tax purposes primarily due to differing treatments of wash sales, foreign currency transactions, and bond discounts and premiums.
At December 31, 2004, the cost of investments, net unrealized appreciation (depreciation), and undistributed ordinary income for income tax purposes were as follows:
| | | | |
Cost of investments | | $ | 56,787,092 | |
| | |
|
|
|
Unrealized appreciation | | $ | 11,476,104 | |
Unrealized depreciation | | | (75,196 | ) |
| | |
|
|
|
Net unrealized appreciation (depreciation) | | $ | 11,400,908 | |
| | |
|
|
|
Undistributed ordinary income | | $ | 4,687,040 | |
| | |
|
|
|
TGI-21
FRANKLIN TEMPLETON VARIABLE INSURANCE PRODUCTS TRUST
TEMPLETON GLOBAL INCOME SECURITIES FUND
Notes to Financial Statements (continued)
6. INVESTMENT TRANSACTIONS
Purchases and sales of investments (excluding short-term securities) for the year ended December 31, 2004, aggregated $25,137,986 and $20,929,042, respectively.
7. CREDIT RISK
The Fund has 15.1% of its portfolio invested in below investment grade and comparable quality unrated high yield securities, which tend to be more sensitive to economic conditions than higher rated securities. The risk of loss due to default by the issuer may be significantly greater for the holders of high yielding securities because such securities are generally unsecured and are often subordinated to other creditors of the issuer.
8. REGULATORY MATTERS
Investigations
As part of various investigations by a number of federal, state, and foreign regulators and governmental entities, including the Securities and Exchange Commission (“SEC”), the California Attorney General’s Office (“CAGO”), and the National Association of Securities Dealers, Inc. (“NASD”), relating to certain practices in the mutual fund industry, including late trading, market timing and marketing support payments to securities dealers who sell fund shares, Franklin Resources, Inc. and certain of its subsidiaries (as used in this section, together, the “Company”), as well as certain current or former executives and employees of the Company, received subpoenas and/or requests for documents, information and/or testimony. The Company and its current employees provided documents and information in response to those requests and subpoenas.
Settlements
Beginning in August 2004, the Company entered into settlements with certain regulators investigating the mutual fund industry practices noted above. The Company believes that settlement of each of the matters described in this section is in the best interest of the Company and shareholders of the Franklin, Templeton, and Mutual Series mutual funds (the “funds”).
On August 2, 2004, Franklin Resources, Inc. announced that its subsidiary, Franklin Advisers, Inc., reached an agreement with the SEC that resolved the issues resulting from the SEC investigation into market timing activity. In connection with that agreement, the SEC issued an “Order Instituting Administrative and Cease-and-Desist Proceedings Pursuant to Sections 203(e) and 203(k) of the Investment Advisers Act of 1940 and Sections 9(b) and 9(f) of the Investment Company Act of 1940, Making Findings and Imposing Remedial Sanctions and a Cease-and-Desist Order” (the “Order”). The SEC’s Order concerned the activities of a limited number of third parties that ended in 2000 and those that were the subject of the first Massachusetts administrative complaint described below.
Under the terms of the SEC’s Order, pursuant to which Franklin Advisers, Inc. neither admitted nor denied any of the findings contained therein, Franklin Advisers, Inc. agreed to pay $50 million, of which $20 million is a civil penalty, to be distributed to shareholders of certain funds in accordance with a plan to be developed by an independent distribution consultant. At this time, it is unclear which funds or which shareholders of any particular fund will receive distributions. The Order also required Franklin Advisers, Inc. to, among other things, enhance and periodically review compliance policies and procedures.
On September 20, 2004, Franklin Resources, Inc. announced that two of its subsidiaries, Franklin Advisers, Inc. and Franklin Templeton Alternative Strategies, Inc. (“FTAS”), reached an agreement with the Securities Division of the Office of the Secretary of the Commonwealth of Massachusetts (the “State of Massachusetts”) related to its administrative complaint filed on February 4, 2004, concerning one instance of market timing that was also a subject of the August 2, 2004 settlement that Franklin Advisers, Inc. reached with the SEC, as described above.
TGI-22
FRANKLIN TEMPLETON VARIABLE INSURANCE PRODUCTS TRUST
TEMPLETON GLOBAL INCOME SECURITIES FUND
Notes to Financial Statements (continued)
8. REGULATORY MATTERS (cont.)
Settlements (cont.)
Under the terms of the settlement consent order issued by the State of Massachusetts, Franklin Advisers, Inc. and FTAS consented to the entry of a cease-and-desist order and agreed to pay a $5 million administrative fine to the State of Massachusetts (the “Massachusetts Consent Order”). The Massachusetts Consent Order included two different sections: “Statements of Fact” and “Violations of Massachusetts Securities Laws.” Franklin Advisers, Inc. and FTAS admitted the facts in the Statements of Fact.
On October 25, 2004, the State of Massachusetts filed a second administrative complaint, alleging that Franklin Resources, Inc.’s Form 8-K filing (in which it described the Massachusetts Consent Order and stated that “Franklin did not admit or deny engaging in any wrongdoing”) failed to state that Franklin Advisers, Inc. and FTAS admitted the Statements of Fact portion of the Massachusetts Consent Order (the “Second Complaint”). Franklin Resources, Inc. reached a second agreement with the State of Massachusetts on November 19, 2004, resolving the Second Complaint. As a result of the November 19, 2004 settlement, Franklin Resources, Inc. filed a new Form 8-K. The terms of the Massachusetts Consent Order did not change and there was no monetary fine associated with this second settlement.
On November 17, 2004, Franklin Resources, Inc. announced that Franklin/Templeton Distributors, Inc. (“FTDI”) reached an agreement with the CAGO, resolving the issues resulting from the CAGO’s investigation concerning sales and marketing support payments. Under the terms of the settlement, FTDI neither admitted nor denied the allegations in the CAGO’s complaint and agreed to pay $2 million to the State of California as a civil penalty, $14 million to the funds, to be allocated by an independent distribution consultant to be paid for by FTDI, and $2 million to the CAGO for its investigative costs.
On December 13, 2004, Franklin Resources, Inc. announced that its subsidiaries FTDI and Franklin Advisers, Inc. reached an agreement with the SEC, resolving the issues resulting from the SEC’s investigation concerning marketing support payments to securities dealers who sell fund shares. In connection with that agreement, the SEC issued an “Order Instituting Administrative and Cease-and-Desist Proceedings, Making Findings, and Imposing Remedial Sanctions Pursuant to Sections 203(e) and 203(k) of the Investment Advisers Act of 1940, Sections 9(b) and 9(f) of the Investment Company Act of 1940, and Section 15(b) of the Securities Exchange Act of 1934” (the “Second Order”).
Under the terms of the Second Order, in which FTDI and Franklin Advisers, Inc. neither admitted nor denied the findings contained therein, they agreed to pay the funds a penalty of $20 million and disgorgement of $1 (one dollar). FTDI and Franklin Advisers, Inc. also agreed to implement certain measures and undertakings relating to marketing support payments to broker-dealers for the promotion or sale of fund shares, including making additional disclosures in the funds’ Prospectuses and Statements of Additional Information. The Second Order further requires the appointment of an independent distribution consultant, at the Company’s expense, who shall develop a plan for the distribution of the penalty and disgorgement to the funds.
Other Legal Proceedings
The Trust, in addition to the Company and other funds, and certain current and former officers, employees, and directors have been named in multiple lawsuits in different federal courts in Nevada, California, Illinois, New York and Florida, alleging violations of various federal securities laws and seeking, among other relief, monetary damages, restitution, removal of fund trustees, directors, advisers, administrators, and distributors, rescission of management contracts and 12b-1 Plans, and/or attorneys’ fees and costs. Specifically, the lawsuits claim breach of duty with respect to alleged arrangements to permit market timing and/or late trading activity, or breach of duty with respect to the valuation of the portfolio securities of certain Templeton funds managed by Franklin Resources, Inc. subsidiaries, resulting in alleged market timing activity. The majority of these lawsuits duplicate, in whole or in part, the allegations asserted in the February 4, 2004 Massachusetts administrative complaint and the findings in the SEC’s August 2, 2004 Order, as described above. The lawsuits are styled as class actions, or derivative actions on behalf of either the named funds or Franklin Resources, Inc.
TGI-23
FRANKLIN TEMPLETON VARIABLE INSURANCE PRODUCTS TRUST
TEMPLETON GLOBAL INCOME SECURITIES FUND
Notes to Financial Statements (continued)
8. REGULATORY MATTERS (cont.)
Other Legal Proceedings (cont.)
In addition, the Company, as well as certain current and former officers, employees, and directors, have been named in multiple lawsuits alleging violations of various securities laws and pendent state law claims relating to the disclosure of directed brokerage payments and/or payment of allegedly excessive advisory, commission, and distribution fees, and seeking, among other relief, monetary damages, restitution, rescission of advisory contracts, including recovery of all fees paid pursuant to those contracts, an accounting of all monies paid to the named advisers, declaratory relief, injunctive relief, and/or attorneys’ fees and costs. These lawsuits are styled as class actions or derivative actions brought on behalf of certain funds.
The Company and fund management strongly believes that the claims made in each of the lawsuits identified above are without merit and intends to vigorously defend against them. The Company cannot predict with certainty, however, the eventual outcome of the remaining governmental investigations or private lawsuits, nor whether they will have a material negative impact on the Company. Public trust and confidence are critical to the Company’s business and any material loss of investor and/or client confidence could result in a significant decline in assets under management by the Company, which would have an adverse effect on the Company’s future financial results. If the Company finds that it bears responsibility for any unlawful or inappropriate conduct that caused losses to the Trust, it is committed to making the Trust or its shareholders whole, as appropriate. The Company is committed to taking all appropriate actions to protect the interests of its funds’ shareholders.
TGI-24
FRANKLIN TEMPLETON VARIABLE INSURANCE PRODUCTS TRUST
TEMPLETON GLOBAL INCOME SECURITIES FUND
Report of Independent Registered Public Accounting Firm
To the Trustees and Shareholders of Franklin Templeton Variable Insurance Products Trust
In our opinion, the accompanying statement of assets and liabilities, including the statement of investments, and the related statements of operations and of changes in net assets and the financial highlights present fairly, in all material respects, the financial position of Templeton Global Income Securities Fund (the Fund) (one of the funds constituting Franklin Templeton Variable Insurance Products Trust) at December 31, 2004, the results of its operations for the year then ended, the changes in its net assets for each of the two years in the period then ended and the financial highlights for each of the five years in the period then ended, in conformity with accounting principles generally accepted in the United States of America. These financial statements and financial highlights (hereafter referred to as “financial statements”) are the responsibility of the Fund’s management; our responsibility is to express an opinion on these financial statements based on our audits. We conducted our audits of these financial statements in accordance with the standards of the Public Company Accounting Oversight Board (United States). Those standards require that we plan and perform the audits to obtain reasonable assurance about whether the financial statements are free of material misstatement. An audit includes examining, on a test basis, evidence supporting the amounts and disclosures in the financial statements, assessing the accounting principles used and significant estimates made by management, and evaluating the overall financial statement presentation. We believe that our audits, which included confirmation of securities at December 31, 2004 by correspondence with the custodian, provide a reasonable basis for our opinion.
PricewaterhouseCoopers LLP
San Francisco, California
February 9, 2005
TGI-25
FRANKLIN TEMPLETON VARIABLE INSURANCE PRODUCTS TRUST
TEMPLETON GLOBAL INCOME SECURITIES FUND
Tax Designation (unaudited)
At December 31, 2004, more than 50% of the Fund’s total assets were invested in securities of foreign issuers. In most instances, foreign taxes were withheld from interest paid to the Fund on these investments. The Fund elects to treat foreign taxes paid under Section 853 of the Internal Revenue Code. This election will allow shareholders of record in June 2005, to treat their proportionate share of foreign taxes paid by the Fund as having been paid directly by them. The shareholder shall consider these amounts as foreign taxes paid in the tax year in which they receive the Fund distribution.
The foreign tax information will be disclosed in the June 2005, semi-annual report of the Fund.
TGI-26
TEMPLETON GROWTH SECURITIES FUND
We are pleased to bring you Templeton Growth Securities Fund’s annual report for the fiscal year ended December 31, 2004.
Performance Summary as of 12/31/04
Average annual total return of Class 1 shares represents the average annual change in value, assuming reinvestment of dividends and capital gains. Average returns smooth out variations in returns, which can be significant; they are not the same as year-by-year results.
Periods ended 12/31/04
| | | | | | |
| | | 1-Year | | 5-Year | | 10-Year |
Average Annual Total Return | | +16.25% | | +4.87% | | +10.01% |
Total Return Index Comparison
for Hypothetical $10,000 Investment (1/1/95–12/31/04)
The graph below shows the change in value of a hypothetical $10,000 investment in the Fund over the indicated period and includes reinvestment of any income or distributions. The Fund’s performance is compared to the performance of the Morgan Stanley Capital International (MSCI) All Country (AC) World Index. One cannot invest directly in an index, nor is an index representative of the Fund’s portfolio. Please see Important Notes to Performance Information preceding the Fund Summaries.
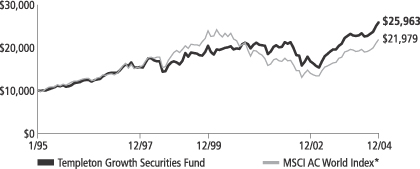
*Source: Standard & Poor’s Micropal. Please see Index Descriptions following the Fund Summaries.
Templeton Growth Securities Fund – Class 1
Performance reflects the Fund’s Class 1 operating expenses, but does not include any contract fees, expenses or sales charges. If they had been included, performance would be lower. These charges and deductions, particularly for variable life policies, can have a significant effect on contract values and insurance benefits. See the contract prospectus for a complete description of these expenses, including sales charges.
Performance data quoted represent past performance, which does not guarantee future results. Investment return and principal value will fluctuate, and you may have a gain or loss when you sell your shares. Current performance may differ from figures shown.
TG-1
Fund Goals and Main Investments: Templeton Growth Securities Fund seeks long-term capital growth. The Fund invests mainly in equity securities of companies located anywhere in the world, including those in the U.S. and emerging markets.
Performance Overview
You can find the Fund’s one-year total return in the Performance Summary. The Fund outperformed its benchmark, the MSCI AC World Index, which returned 15.75% for the year under review.1
Economic and Market Overview
The global economic recovery continued in 2004, led by growth in China and the U.S. As of December 31, 2004, U.S. gross domestic product (GDP) had increased for 13 consecutive quarters.2 In China, GDP grew 9.5% in 2004.3
The 12-nation euro zone lagged other regions in the current recovery. However, the European Central Bank projected euro zone growth may be between 1.6% and 2.0% in 2004, compared with only 0.5% in 2003. In Japan, the economy struggled to emerge from a decade-long deflationary period. Although the country’s consumer and business confidence reached their highest levels since 1991, economic growth slowed in response to higher oil prices and reduced external demand. In addition, the U.S. dollar declined approximately 4% versus the yen and 7% versus the euro during 2004.4 This hurt Japanese and European exports into the U.S., as it made their goods more expensive in the world’s biggest market. However, the greenback’s protracted decline should also benefit the U.S. current account deficit by making U.S. goods more competitive in international markets.
Oil prices increased during most of 2004, reaching $56 per barrel in October, but declined to end the year at $43. Higher oil prices triggered investor worries about inflation, decreased spending — due to cautionary consumer and business sentiment — and slower economic and corporate profit growth. As of December 31, 2004, the 12-month moving average price of oil was about $41 per barrel.5
1. Source: Standard & Poor’s Micropal. One cannot invest directly in an index, nor is an index representative of the Fund’s portfolio. Please see Index Descriptions following the Fund Summaries.
2. Source: Bureau of Economic Analysis.
3. Source: National Bureau of Statistics of China.
4. Source: FactSet Research Systems Inc.
5. Source: U.S. Department of Energy.
Fund Risks: Stocks offer the potential for long-term gains but can be subject to short-term up-and-down price movements. Foreign investing involves special risks including currency fluctuations, economic instability, and social and political developments. Emerging markets involve heightened risks due to their relatively smaller size and lesser liquidity. Bonds and other debt obligations are affected by changes in interest rates and the creditworthiness of their issuers. The Fund’s prospectus also includes a description of the main investment risks.
TG-2
In this environment, the MSCI AC World Index’s total return was 15.75% in U.S. dollars for the 12-month period ended December 31, 2004.6 Emerging markets, as measured by the MSCI Emerging Markets Index, had a one-year total return of 25.95% in U.S. dollars.6 In local currencies, these indexes had notably lower total returns of 12.05% and 16.45% for the same period.6 In 2004, most of the world’s currencies strengthened in relation to the U.S. dollar, which benefited U.S.-based investors of non-U.S. developed and emerging market equities.
Investment Strategy
Our investment philosophy is bottom-up, value-oriented and long-term. In choosing investments, we will focus on the market price of a company’s securities relative to our evaluation of the company’s potential long-term earnings, asset value and cash flow. Among factors we consider are a company’s historical value measures, including price/earnings ratio, profit margins and liquidation value. We do in-depth research to construct a bargain list from which we buy.
Manager’s Discussion
As in past reporting periods, our bottom-up investment strategy for the Fund resulted in a geographic and industry mix that was very different than that of the benchmark MSCI AC World Index. Geographically, we continued to find securities for our bargain list across the globe. From a country standpoint, our substantially overweighted exposure to the U.K. and underweighted exposure to the U.S. contributed positively to the Fund’s relative performance during the year under review. Our U.K. holdings Reuters Group, BAE Systems and Abbey National (exchanged for Banco Santander Central Hispano shares) performed well, while our U.S. holdings AT&T Wireless, CIGNA and Noble Corp. also appreciated. We sold Reuters Group and AT&T Wireless during the period. Combined with strong stock selection, the weakening U.S. dollar played a part in driving the Fund’s outperformance. In addition, our overweighted positions in Hong Kong and Switzerland aided Fund performance.
Looking at the Fund from an industry perspective, a number of sectors stood out. Despite being underweighted, information technology contributed the most sector-wise to Fund performance.7 Our holdings in
6. Source: Standard & Poor’s Micropal. Please see Index Descriptions following the Fund Summaries.
7. The information technology sector comprises IT services, software, computers and peripherals, electronic equipment and instruments, and semiconductors and semiconductor equipment in the SOI.
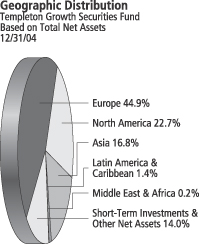
TG-3
Nintendo and Check Point Software Technologies appreciated 35% and 46%, respectively, during the year. Our overweighting and strong stock selection in materials and telecommunication services sectors also benefited Fund performance.8
In general, if the value of the U.S. dollar goes up compared with a foreign currency, an investment traded in that foreign currency will go down in value because it will be worth fewer U.S. dollars. This can have a negative effect on Fund performance. Conversely, when the U.S. dollar weakens in relation to a foreign currency, an investment traded in that foreign currency will increase in value, which can contribute to Fund performance. For the 12 months ended December 31, 2004, the U.S. dollar declined in value relative to most non-U.S. currencies. At the end of the period, the Fund’s portfolio was invested primarily in securities with non-U.S. currency exposure, which resulted in a positive effect on Fund performance. However, one cannot expect the same result in future periods.
Offsetting the Fund’s gains, the lower-than-index exposure to Australia, Japan and Canada hurt the Fund’s relative performance. We held no Australian stocks, and Japanese holdings such as Nomura Holdings and Nippon Telegraph & Telephone and Canadian holding Celestica stumbled. From the sector perspective, financials stocks generally lost value. Kookmin Bank, Swiss Reinsurance and the aforementioned Nomura Holdings had a negative impact on the Fund.
During the reporting period, holding a larger-than-normal cash position was a drag on the Fund’s performance. Fund inflows were strong and we were not able to quickly invest the cash.
Thank you for your participation in Templeton Growth Securities Fund. We look forward to serving your future investment needs.
The foregoing information reflects our analysis, opinions and portfolio holdings as of December 31, 2004, the end of the reporting period. The way we implement our main investment strategies and the resulting portfolio holdings may change depending on factors such as market and economic conditions. These opinions may not be relied upon as investment advice or an offer for a particular security. The information is not a complete analysis of every aspect of any market, country, industry, security or the Fund. Statements of fact are from sources considered reliable, but the adviser makes no representation or warranty as to their completeness or accuracy. Although historical performance is no guarantee of future results, these insights may help you understand our investment management philosophy.
8. The materials sector comprises chemicals, metals and mining, and paper and forest products in the SOI. The telecommunication services sector comprises diversified telecommunication services and wireless telecommunication services in the SOI.
Top 10 Holdings
Templeton Growth Securities Fund 12/31/04
| | |
Company
Sector/Industry,
Country | | % of Total
Net Assets |
| |
| GlaxoSmithKline PLC | | 2.0% |
| Pharmaceuticals, U.K. | | |
| |
| Shell Transport & Trading Co. PLC | | 1.7% |
| Oil & Gas, U.K. | | |
| |
| British Sky Broadcasting Group PLC | | 1.7% |
| Media, U.K. | | |
| |
| Nestlé SA | | 1.6% |
| Food Products, Switzerland | | |
| |
| Unilever NV | | 1.5% |
| Food Products, Netherlands | | |
| |
| E.ON AG | | 1.4% |
| Electric Utilities, Germany | | |
| |
| BP PLC | | 1.4% |
| Oil & Gas, U.K. | | |
| |
| Eni SpA | | 1.4% |
| Oil & Gas, Italy | | |
| |
| Royal Bank of Scotland Group PLC, ord. & 144A | | 1.3% |
| Commercial Banks, U.K. | | |
| |
| Nomura Holdings Inc. | | 1.2% |
| Capital Markets, Japan | | |
The dollar value, number of shares or principal amount, and names of all portfolio holdings are listed in the Fund’s Statement of Investments.
TG-4
Fund Expenses
As an investor in a variable insurance contract (“Contract”) that indirectly provides for investment in an underlying mutual fund, you can incur transaction and/or ongoing expenses at both the Fund level and the Contract level.
| • | | Transaction expenses can include sales charges (loads) on purchases, redemption fees, surrender fees, transfer fees and premium taxes. |
| • | | Ongoing expenses can include management fees, distribution and service (12b-1) fees, contract fees, annual maintenance fees, mortality and expense risk fees and other fees and expenses. All mutual funds and Contracts have some types of ongoing expenses. |
The expenses shown in the table below are meant to highlight ongoing expenses at the Fund level only and do not include ongoing expenses at the Contract level, or transaction expenses at either the Fund or Contract levels. While the Fund does not have transaction expenses, if the transaction and ongoing expenses at the Contract level were included, the expenses shown below would be higher. You should consult your Contract prospectus or disclosure document for more information.
The table shows Fund-level ongoing expenses and can help you understand these expenses and compare them with those of other mutual funds offered through the Contract. The table assumes a $1,000 investment held for the six months indicated. Please refer to the Fund prospectus for additional information on operating expenses.
Actual Fund Expenses
The first line (Actual) for each share class listed in the table below provides actual account values and expenses. The “Ending Account Value” is derived from the Fund’s actual return, which includes the effect of ongoing Fund expenses, but does not include the effect of ongoing Contract expenses.
You can estimate the Fund-level expenses you incurred during the period, by following these steps. Of course, your account value and expenses will differ from those in this illustration:
| 1. | Divide your account value by $1,000. |
If an account had an $8,600 value, then $8,600 ÷ $1,000 = 8.6.
| 2. | Multiply the result by the number under the heading “Fund-Level Expenses Incurred During Period.” |
If Fund-Level Expenses Incurred During Period were $7.50, then 8.6 × $7.50 = $64.50.
Templeton Growth Securities Fund – Class 1
TG-5
In this illustration, the estimated expenses incurred this period at the Fund level are $64.50.
Hypothetical Example for Comparison with Other Mutual Funds
Information in the second line (Hypothetical) for each class in the table can help you compare ongoing expenses of the Fund with those of other mutual funds offered through the Contract. This information may not be used to estimate the actual ending account balance or expenses you incurred during the period. The hypothetical “Ending Account Value” is based on the actual expense ratio for each class and an assumed 5% annual rate of return before expenses, which does not represent the Fund’s actual return. The figure under the heading “Fund-Level Expenses Incurred During Period” shows the hypothetical expenses your account would have incurred under this scenario. You can compare this figure with the 5% hypothetical examples that appear in shareholder reports of other funds offered through a Contract.
| | | | | | | | | |
| Class 1 | | Beginning
Account
Value 6/30/04 | | Ending
Account
Value 12/31/04 | | Fund-Level
Expenses Incurred
During Period*
6/30/04-12/31/04 |
Actual | | $ | 1,000 | | $ | 1,110.40 | | $ | 4.56 |
Hypothetical (5% return before expenses) | | $ | 1,000 | | $ | 1,020.81 | | $ | 4.37 |
*Expenses are equal to the annualized expense ratio for the Fund’s Class 1 shares (0.86%), which does not include any ongoing expenses of the Contract for which the Fund is an investment option, multiplied by the average account value over the period, multiplied by 184/366 to reflect the one-half year period.
TG-6
FRANKLIN TEMPLETON VARIABLE INSURANCE PRODUCTS TRUST
TEMPLETON GROWTH SECURITIES FUND
Financial Highlights
| | | | | | | | | | | | | | | | | | | | |
| | | Class 1
| |
| | | Year Ended December 31, | |
| | |
|
|
|
| | | 2004 | | | 2003 | | | 2002 | | | 2001 | | | 2000 | |
| | |
|
|
|
Per share operating performance | | | | | | | | | | | | | | | | | | | | |
(for a share outstanding throughout the year) | | | | | | | | | | | | | | | | | | | | |
Net asset value, beginning of year | | $ | 11.31 | | | $ | 8.67 | | | $ | 11.09 | | | $ | 13.76 | | | $ | 15.63 | |
| | |
|
|
|
Income from investment operations: | | | | | | | | | | | | | | | | | | | | |
Net investment incomea | | | .21 | | | | .17 | | | | .17 | | | | .26 | | | | .30 | |
Net realized and unrealized gains (losses) | | | 1.61 | | | | 2.63 | | | | (2.13 | ) | | | (.36 | ) | | | (.15 | ) |
| | |
|
|
|
Total from investment operations | | | 1.82 | | | | 2.80 | | | | (1.96 | ) | | | (.10 | ) | | | .15 | |
| | |
|
|
|
Less distributions from: | | | | | | | | | | | | | | | | | | | | |
Net investment income | | | (.15 | ) | | | (.16 | ) | | | (.24 | ) | | | (.28 | ) | | | (.27 | ) |
Net realized gains | | | — | | | | — | | | | (.22 | ) | | | (2.29 | ) | | | (1.75 | ) |
| | |
|
|
|
Total distributions | | | (.15 | ) | | | (.16 | ) | | | (.46 | ) | | | (2.57 | ) | | | (2.02 | ) |
| | |
|
|
|
Net asset value, end of year | | $ | 12.98 | | | $ | 11.31 | | | $ | 8.67 | | | $ | 11.09 | | | $ | 13.76 | |
| | |
|
|
|
| | | | | |
Total returnb | | | 16.25% | | | | 32.62% | | | | (18.32)% | | | | (.98)% | | | | 1.74% | |
Ratios/supplemental data | | | | | | | | | | | | | | | | | | | | |
Net assets, end of year (000’s) | | $ | 800,118 | | | $ | 769,339 | | | $ | 665,537 | | | $ | 966,725 | | | $ | 1,163,637 | |
Ratios to average net assets: | | | | | | | | | | | | | | | | | | | | |
Expenses | | | .86% | | | | .88% | | | | .87% | | | | .85% | | | | .88% | |
Net investment income | | | 1.75% | | | | 1.74% | | | | 1.69% | | | | 2.13% | | | | 2.18% | |
Portfolio turnover rate | | | 19.13% | | | | 37.43% | | | | 30.67% | | | | 31.05% | | | | 69.67% | |
| aBased | on average daily shares outstanding. |
bTotal return does not include any fees, charges or expenses imposed by the variable annuity and life insurance contracts for which the Franklin Templeton Variable Insurance Products Trust serves as an underlying investment vehicle. Total return is not annualized for periods less than one year.
See notes to financial statements.
TG-7
FRANKLIN TEMPLETON VARIABLE INSURANCE PRODUCTS TRUST
TEMPLETON GROWTH SECURITIES FUND
Financial Highlights (continued)
| | | | | | | | | | | | | | | | | | | | |
| | | Class 2
| |
| | | Year Ended December 31, | |
| | |
|
|
|
| | | 2004 | | | 2003 | | | 2002 | | | 2001 | | | 2000 | |
| | |
|
|
|
Per share operating performance | | | | | | | | | | | | | | | | | | | | |
(for a share outstanding throughout the year) | | | | | | | | | | | | | | | | | | | | |
Net asset value, beginning of year | | $ | 11.19 | | | $ | 8.59 | | | $ | 11.01 | | | $ | 13.69 | | | $ | 15.60 | |
| | |
|
|
|
Income from investment operations: | | | | | | | | | | | | | | | | | | | | |
Net investment incomea | | | .17 | | | | .13 | | | | .13 | | | | .21 | | | | .25 | |
Net realized and unrealized gains (losses) | | | 1.61 | | | | 2.62 | | | | (2.10 | ) | | | (.34 | ) | | | (.15 | ) |
| | |
|
|
|
Total from investment operations | | | 1.78 | | | | 2.75 | | | | (1.97 | ) | | | (.13 | ) | | | .10 | |
| | |
|
|
|
Less distributions from: | | | | | | | | | | | | | | | | | | | | |
Net investment income | | | (.14 | ) | | | (.15 | ) | | | (.23 | ) | | | (.26 | ) | | | (.26 | ) |
Net realized gains | | | — | | | | — | | | | (.22 | ) | | | (2.29 | ) | | | (1.75 | ) |
| | |
|
|
|
Total distributions | | | (.14 | ) | | | (.15 | ) | | | (.45 | ) | | | (2.55 | ) | | | (2.01 | ) |
| | |
|
|
|
Net asset value, end of year | | $ | 12.83 | | | $ | 11.19 | | | $ | 8.59 | | | $ | 11.01 | | | $ | 13.69 | |
| | |
|
|
|
| | | | | |
Total returnb | | | 16.03% | | | | 32.13% | | | | (18.49)% | | | | (1.31)% | | | | 1.47% | |
Ratios/supplemental data | | | | | | | | | | | | | | | | | | | | |
Net assets, end of year (000’s) | | $ | 1,189,112 | | | $ | 511,659 | | | $ | 190,054 | | | $ | 113,925 | | | $ | 79,043 | |
Ratios to average net assets: | | | | | | | | | | | | | | | | | | | | |
Expenses | | | 1.11% | | | | 1.13% | | | | 1.12% | | | | 1.10% | | | | 1.12% | |
Net investment income | | | 1.50% | | | | 1.49% | | | | 1.44% | | | | 1.80% | | | | 1.87% | |
Portfolio turnover rate | | | 19.13% | | | | 37.43% | | | | 30.67% | | | | 31.05% | | | | 69.67% | |
| aBased | on average daily shares outstanding. |
| bTotal | return does not include any fees, charges or expenses imposed by the variable annuity and life insurance contracts for which the Franklin Templeton Variable Insurance Products Trust serves as an underlying investment vehicle. Total return is not annualized for periods less than one year. |
See notes to financial statements.
TG-8
FRANKLIN TEMPLETON VARIABLE INSURANCE PRODUCTS TRUST
TEMPLETON GROWTH SECURITIES FUND
Statement of Investments, December 31, 2004
| | | | | | | |
| | | COUNTRY | | SHARES | | VALUE |
Common Stocks 85.3% | | | | | | | |
Aerospace & Defense 3.3% | | | | | | | |
BAE Systems PLC | | United Kingdom | | 4,506,173 | | $ | 19,936,905 |
BAE Systems PLC, 144A | | United Kingdom | | 36,352 | | | 160,834 |
Boeing Co. | | United States | | 299,590 | | | 15,509,774 |
Raytheon Co. | | United States | | 361,410 | | | 14,033,550 |
aRolls-Royce Group PLC | | United Kingdom | | 3,292,060 | | | 15,607,870 |
aRolls-Royce Group PLC, B | | United Kingdom | | 104,687,508 | | | 204,963 |
| | | | | | |
|
|
| | | | | | | | 65,453,896 |
| | | | | | |
|
|
Airlines .6% | | | | | | | |
Singapore Airlines Ltd. | | Singapore | | 1,720,100 | | | 12,013,196 |
| | | | | | |
|
|
Auto Components .6% | | | | | | | |
Valeo SA | | France | | 262,715 | | | 10,980,326 |
| | | | | | |
|
|
Automobiles .6% | | | | | | | |
Volkswagen AG | | Germany | | 258,907 | | | 11,717,077 |
| | | | | | |
|
|
Capital Markets 2.4% | | | | | | | |
Morgan Stanley | | United States | | 100,000 | | | 5,552,000 |
Nomura Holdings Inc. | | Japan | | 1,641,173 | | | 23,939,782 |
UBS AG | | Switzerland | | 213,966 | | | 17,846,938 |
| | | | | | |
|
|
| | | | | | | | 47,338,720 |
| | | | | | |
|
|
Chemicals 3.2% | | | | | | | |
Akzo Nobel NV | | Netherlands | | 493,365 | | | 21,008,785 |
BASF AG | | Germany | | 145,200 | | | 10,427,161 |
Bayer AG, Br. | | Germany | | 423,776 | | | 14,319,088 |
aSyngenta AG | | Switzerland | | 174,770 | | | 18,536,561 |
| | | | | | |
|
|
| | | | | | | | 64,291,595 |
| | | | | | |
|
|
Commercial Banks 5.0% | | | | | | | |
Banco Santander Central Hispano SA | | Spain | | 1,310,140 | | | 16,231,855 |
DBS Group Holdings Ltd. | | Singapore | | 603,000 | | | 5,947,620 |
aHana Bank | | South Korea | | 157,540 | | | 3,926,325 |
aKookmin Bank | | South Korea | | 373,740 | | | 14,621,783 |
Lloyds TSB Group PLC | | United Kingdom | | 1,032,660 | | | 9,375,565 |
Nordea Bank AB | | Sweden | | 1,087,191 | | | 10,964,041 |
Royal Bank of Scotland Group PLC | | United Kingdom | | 237,980 | | | 8,003,013 |
Royal Bank of Scotland Group PLC, 144A | | United Kingdom | | 511,885 | | | 17,214,145 |
Standard Chartered PLC | | United Kingdom | | 698,325 | | | 12,981,837 |
| | | | | | |
|
|
| | | | | | | | 99,266,184 |
| | | | | | |
|
|
Commercial Services & Supplies 1.9% | | | | | | | |
H&R Block Inc. | | United States | | 177,790 | | | 8,711,710 |
Rentokil Initial PLC | | United Kingdom | | 5,968,960 | | | 16,927,979 |
Securitas AB, B | | Sweden | | 764,565 | | | 13,119,257 |
| | | | | | |
|
|
| | | | | | | | 38,758,946 |
| | | | | | |
|
|
Computers & Peripherals .9% | | | | | | | |
aMaxtor Corp. | | United States | | 1,145,880 | �� | | 6,073,164 |
aSeagate Technology | | United States | | 740,005 | | | 12,779,886 |
| | | | | | |
|
|
| | | | | | | | 18,853,050 |
| | | | | | |
|
|
TG-9
FRANKLIN TEMPLETON VARIABLE INSURANCE PRODUCTS TRUST
TEMPLETON GROWTH SECURITIES FUND
Statement of Investments, December 31, 2004 (cont.)
| | | | | | | |
| | | COUNTRY | | SHARES | | VALUE |
Common Stocks (cont.) | | | | | | | |
Diversified Telecommunication Services 6.5% | | | | | | | |
BCE Inc. | | Canada | | 939,345 | | $ | 22,650,483 |
aBelgacom SA | | Belgium | | 273,600 | | | 11,806,546 |
KT Corp., ADR | | South Korea | | 1,011,735 | | | 22,065,940 |
Nippon Telegraph & Telephone Corp. | | Japan | | 4,272 | | | 19,186,878 |
SBC Communications Inc. | | United States | | 441,280 | | | 11,371,786 |
TDC AS | | Denmark | | 430,274 | | | 18,189,214 |
Telefonica SA | | Spain | | 365,190 | | | 6,868,498 |
Telefonos de Mexico SA de CV (Telmex), L, ADR | | Mexico | | 450,465 | | | 17,261,819 |
| | | | | | |
|
|
| | | | | | | | 129,401,164 |
| | | | | | |
|
|
Electric Utilities 4.0% | | | | | | | |
DTE Energy Co. | | United States | | 539,285 | | | 23,259,362 |
E.ON AG | | Germany | | 301,375 | | | 27,474,316 |
Endesa SA | | Spain | | 639,690 | | | 15,008,739 |
Hong Kong Electric Holdings Ltd. | | Hong Kong | | 2,867,498 | | | 13,096,462 |
| | | | | | |
|
|
| | | | | | | | 78,838,879 |
| | | | | | |
|
|
Electronic Equipment & Instruments 1.4% | | | | | | | |
aCelestica Inc. | | Canada | | 403,440 | | | 5,692,538 |
Hitachi Ltd. | | Japan | | 3,130,500 | | | 21,701,377 |
| | | | | | |
|
|
| | | | | | | | 27,393,915 |
| | | | | | |
|
|
Energy Equipment & Services .9% | | | | | | | |
aNoble Corp. | | United States | | 347,400 | | | 17,279,676 |
| | | | | | |
|
|
Food & Staples Retailing 1.3% | | | | | | | |
Albertson’s Inc. | | United States | | 494,700 | | | 11,813,436 |
aKroger Co. | | United States | | 764,261 | | | 13,405,138 |
| | | | | | |
|
|
| | | | | | | | 25,218,574 |
| | | | | | |
|
|
Food Products 4.5% | | | | | | | |
Cadbury Schweppes PLC | | United Kingdom | | 1,843,610 | | | 17,162,863 |
H.J. Heinz Co. | | United States | | 278,585 | | | 10,862,029 |
Nestle SA | | Switzerland | | 120,369 | | | 31,441,045 |
Unilever NV | | Netherlands | | 438,390 | | | 29,346,169 |
| | | | | | |
|
|
| | | | | | | | 88,812,106 |
| | | | | | |
|
|
Health Care Equipment & Supplies .8% | | | | | | | |
Olympus Corp. | | Japan | | 750,000 | | | 16,000,293 |
| | | | | | |
|
|
Health Care Providers & Services 3.4% | | | | | | | |
AmerisourceBergen Corp. | | United States | | 336,571 | | | 19,749,986 |
CIGNA Corp. | | United States | | 215,072 | | | 17,543,423 |
HCA Inc. | | United States | | 264,750 | | | 10,579,410 |
aTenet Healthcare Corp. | | United States | | 1,816,075 | | | 19,940,504 |
| | | | | | |
|
|
| | | | | | | | 67,813,323 |
| | | | | | |
|
|
Hotels Restaurants & Leisure 1.7% | | | | | | | |
Accor SA | | France | | 518,800 | | | 22,676,203 |
Compass Group PLC | | United Kingdom | | 2,499,790 | | | 11,815,680 |
| | | | | | |
|
|
| | | | | | | | 34,491,883 |
| | | | | | |
|
|
TG-10
FRANKLIN TEMPLETON VARIABLE INSURANCE PRODUCTS TRUST
TEMPLETON GROWTH SECURITIES FUND
Statement of Investments, December 31, 2004 (cont.)
| | | | | | | |
| | | COUNTRY | | SHARES | | VALUE |
Common Stocks (cont.) | | | | | | | |
Household Durables 1.7% | | | | | | | |
Koninklijke Philips Electronics NV | | Netherlands | | 556,890 | | $ | 14,743,695 |
Sony Corp. | | Japan | | 499,300 | | | 19,305,097 |
| | | | | | |
|
|
| | | | | | | | 34,048,792 |
| | | | | | |
|
|
Industrial Conglomerates 1.7% | | | | | | | |
Smiths Group PLC | | United Kingdom | | 1,080,061 | | | 17,041,156 |
Swire Pacific Ltd., A | | Hong Kong | | 1,406,800 | | | 11,764,357 |
Tyco International Ltd. | | United States | | 166,120 | | | 5,937,129 |
| | | | | | |
|
|
| | | | | | | | 34,742,642 |
| | | | | | |
|
|
Insurance 3.6% | | | | | | | |
ACE Ltd. | | Bermuda | | 297,200 | | | 12,705,300 |
AXA SA | | France | | 370,111 | | | 9,130,731 |
Swiss Reinsurance Co. | | Switzerland | | 319,590 | | | 22,672,525 |
Willis Group Holdings Ltd. | | United States | | 311,038 | | | 12,805,434 |
XL Capital Ltd., A | | Bermuda | | 185,292 | | | 14,387,924 |
| | | | | | |
|
|
| | | | | | | | 71,701,914 |
| | | | | | |
|
|
IT Services 1.2% | | | | | | | |
Electronic Data Systems Corp. | | United States | | 794,633 | | | 18,356,023 |
Satyam Computers Services Ltd. | | India | | 481,726 | | | 4,565,537 |
| | | | | | |
|
|
| | | | | | | | 22,921,560 |
| | | | | | |
|
|
Leisure Equipment & Products .9% | | | | | | | |
Fuji Photo Film Co. Ltd. | | Japan | | 482,000 | | | 17,600,859 |
Mattel Inc. | | United States | | 8,600 | | | 167,614 |
| | | | | | |
|
|
| | | | | | | | 17,768,473 |
| | | | | | |
|
|
Media 6.2% | | | | | | | |
British Sky Broadcasting Group PLC | | United Kingdom | | 3,093,596 | | | 33,371,741 |
aDIRECTV Group Inc. | | United States | | 1,203,819 | | | 20,151,930 |
aInterpublic Group of Cos. Inc. | | United States | | 702,015 | | | 9,407,001 |
Pearson PLC | | United Kingdom | | 1,600,718 | | | 19,310,746 |
Reed Elsevier NV | | Netherlands | | 1,484,375 | | | 20,203,389 |
VNU NV | | Netherlands | | 318,410 | | | 9,389,146 |
Wolters Kluwer NV | | Netherlands | | 590,730 | | | 11,839,931 |
| | | | | | |
|
|
| | | | | | | | 123,673,884 |
| | | | | | |
|
|
Metals & Mining 2.0% | | | | | | | |
Barrick Gold Corp. | | Canada | | 745,345 | | | 18,052,256 |
BHP Billiton PLC | | United Kingdom | | 836,750 | | | 9,805,287 |
POSCO | | South Korea | | 61,332 | | | 11,079,100 |
| | | | | | |
|
|
| | | | | | | | 38,936,643 |
| | | | | | |
|
|
Multi-Utilities & Unregulated Power 1.1% | | | | | | | |
National Grid Transco PLC | | United Kingdom | | 2,334,378 | | | 22,246,894 |
| | | | | | |
|
|
Oil & Gas 5.9% | | | | | | | |
BP PLC | | United Kingdom | | 2,782,360 | | | 27,130,387 |
El Paso Corp. | | United States | | 221,400 | | | 2,302,560 |
Eni SpA | | Italy | | 1,081,305 | | | 27,028,223 |
Repsol YPF SA | | Spain | | 919,148 | | | 23,897,948 |
Shell Transport & Trading Co. PLC | | United Kingdom | | 4,027,633 | | | 34,325,100 |
TransCanada Corp. | | Canada | | 89,875 | | | 2,233,105 |
| | | | | | |
|
|
| | | | | | | | 116,917,323 |
| | | | | | |
|
|
TG-11
FRANKLIN TEMPLETON VARIABLE INSURANCE PRODUCTS TRUST
TEMPLETON GROWTH SECURITIES FUND
Statement of Investments, December 31, 2004 (cont.)
| | | | | | | |
| | | COUNTRY | | SHARES | | VALUE |
Common Stocks (cont.) | | | | | | | |
Paper & Forest Products 2.8% | | | | | | | |
Bowater Inc. | | United States | | 191,800 | | $ | 8,433,446 |
International Paper Co. | | United States | | 240,000 | | | 10,080,000 |
Stora Enso OYJ, R | | Finland | | 1,245,938 | | | 19,037,700 |
UPM-Kymmene Corp. | | Finland | | 862,805 | | | 19,143,003 |
| | | | | | |
|
|
| | | | | | | | 56,694,149 |
| | | | | | |
|
|
Pharmaceuticals 8.4% | | | | | | | |
Abbott Laboratories | | United States | | 313,207 | | | 14,611,107 |
Bristol-Myers Squibb Co. | | United States | | 862,800 | | | 22,104,936 |
GlaxoSmithKline PLC | | United Kingdom | | 1,661,700 | | | 38,976,494 |
Novartis AG | | Switzerland | | 412,490 | | | 20,643,514 |
Pfizer Inc. | | United States | | 816,660 | | | 21,959,987 |
Sanofi-Aventis | | France | | 243,046 | | | 19,393,021 |
Shire Pharmaceuticals Group PLC | | United Kingdom | | 1,111,940 | | | 11,674,751 |
Takeda Pharmaceutical Co. Ltd. | | Japan | | 357,000 | | | 17,985,940 |
| | | | | | |
|
|
| | | | | | | | 167,349,750 |
| | | | | | |
|
|
Real Estate 1.1% | | | | | | | |
Cheung Kong Holdings Ltd. | | Hong Kong | | 2,243,499 | | | 22,369,181 |
| | | | | | |
|
|
Semiconductors & Semiconductor Equipment .7% | | | | | | | |
Samsung Electronics Co. Ltd. | | South Korea | | 30,300 | | | 13,186,003 |
| | | | | | |
|
|
Software 1.6% | | | | | | | |
aCadence Design Systems Inc. | | United States | | 605,945 | | | 8,368,101 |
aCheck Point Software Technologies Ltd. | | Israel | | 176,510 | | | 4,347,441 |
Nintendo Co. Ltd. | | Japan | | 160,000 | | | 20,105,448 |
| | | | | | |
|
|
| | | | | | | | 32,820,990 |
| | | | | | |
|
|
Specialty Retail .2% | | | | | | | |
aOffice Depot Inc. | | United States | | 187,200 | | | 3,249,792 |
| | | | | | |
|
|
Wireless Telecommunication Services 3.2% | | | | | | | |
China Mobile (Hong Kong) Ltd., fgn. | | China | | 2,608,500 | | | 8,842,885 |
KDDI Corp. | | Japan | | 2,369 | | | 12,767,897 |
SK Telecom Co. Ltd. | | South Korea | | 80,853 | | | 15,386,438 |
SK Telecom Co. Ltd., ADR | | South Korea | | 303,380 | | | 6,750,205 |
Vodafone Group PLC | | United Kingdom | | 7,603,943 | | | 20,616,088 |
| | | | | | |
|
|
| | | | | | | | 64,363,513 |
| | | | | | |
|
|
Total Common Stocks (Cost $1,406,827,764) | | | | | | | 1,696,914,306 |
| | | | | | |
|
|
Preferred Stocks .7% | | | | | | | |
Automobiles .2% | | | | | | | |
Volkswagen AG, pfd. | | Germany | | 108,300 | | | 3,600,594 |
| | | | | | |
|
|
Metals & Mining .5% | | | | | | | |
Cia Vale do Rio Doce, ADR, pfd., A | | Brazil | | 415,500 | | | 10,129,890 |
| | | | | | |
|
|
Total Preferred Stocks (Cost $6,373,138) | | | | | | | 13,730,484 |
| | | | | | |
|
|
Total Long Term Investments (Cost $1,413,200,902) | | | | | | | 1,710,644,790 |
| | | | | | |
|
|
TG-12
FRANKLIN TEMPLETON VARIABLE INSURANCE PRODUCTS TRUST
TEMPLETON GROWTH SECURITIES FUND
Statement of Investments, December 31, 2004 (cont.)
| | | | | | | | |
| | | COUNTRY | | PRINCIPAL
AMOUNT | | VALUE |
Short Term Investments 13.9% | | | | | | | | |
U.S. Government and Agency Securities 5.9% | | | | | | | | |
bFederal Home Loan Bank, 1/03/05 | | United States | | $ | 90,777,000 | | $ | 90,767,544 |
bU.S. Treasury Bill, 3/10/05 | | United States | | | 26,950,000 | | | 26,847,725 |
| | | | | | | |
|
|
Total U.S. Government and Agency Securities (Cost $117,612,057) | | | | | | | | 117,615,269 |
| | | | | | | |
|
|
Total Investments before Repurchase Agreements (Cost $1,530,812,959) | | | | | | | | 1,828,260,059 |
| | | | | | | |
|
|
Repurchase Agreements 8.0% | | | | | | | | |
cBZW Securities Inc., 1.40%, 1/03/05 (Maturity Value $50,005,833)
Collateralized by bU.S. Treasury Bills, 6/30/05 | | United States | | | 50,000,000 | | | 50,000,000 |
cDresdner Bank AG, 1.60%, 1/03/05 (Maturity Value $8,001,067)
Collateralized by bU.S. Treasury Bills, 1/03/05 | | United States | | | 8,000,000 | | | 8,000,000 |
cParibas Corp., 2.10%, 1/03/05 (Maturity Value $100,017,500)
Collateralized by U.S. Government Agency Securities, 1.44 - 7.125%, 2/15/05 - 9/14/06 | | United States | | | 100,000,000 | | | 100,000,000 |
| | | | | | | |
|
|
Total Repurchase Agreements (Cost $158,000,000) | | | | | | | | 158,000,000 |
| | | | | | | |
|
|
Total Investments (Cost $1,688,812,959) 99.9% | | | | | | | | 1,986,260,059 |
Other Assets, less Liabilities .1% | | | | | | | | 2,970,010 |
| | | | | | | |
|
|
Net Assets 100.0% | | | | | | | $ | 1,989,230,069 |
| | | | | | | |
|
|
Portfolio Abbreviation:
ADR - American Depository Receipt
| b | Security is traded on a discount basis with no stated coupon rate. |
| c | See Note 1(c) regarding repurchase agreements. |
See notes to financial statements.
TG-13
FRANKLIN TEMPLETON VARIABLE INSURANCE PRODUCTS TRUST
TEMPLETON GROWTH SECURITIES FUND
Financial Statements
Statement of Assets and Liabilities
December 31, 2004
| | | | |
Assets: | | | | |
Investments in securities: | | | | |
Cost - Unaffiliated issuers | | $ | 1,530,812,959 | |
Cost - Repurchase agreements | | | 158,000,000 | |
| | |
|
|
|
Total cost of investments | | $ | 1,688,812,959 | |
| | |
|
|
|
Value - Unaffiliated issuers | | $ | 1,828,260,059 | |
Value - Repurchase agreements | | | 158,000,000 | |
| | |
|
|
|
Total value of investments | | | 1,986,260,059 | |
| | |
|
|
|
Cash | | | 119,091 | |
Receivables: | | | | |
Investment securities sold | | | 732,867 | |
Capital shares sold | | | 3,847,583 | |
Dividends | | | 3,356,892 | |
| | |
|
|
|
Total assets | | | 1,994,316,492 | |
| | |
|
|
|
Liabilities: | | | | |
Payables: | | | | |
Investment securities purchased | | | 3,137,682 | |
Capital shares redeemed | | | 273,861 | |
Affiliates | | | 1,513,745 | |
Other liabilities | | | 161,135 | |
| | |
|
|
|
Total liabilities | | | 5,086,423 | |
| | |
|
|
|
Net assets, at value | | $ | 1,989,230,069 | |
| | |
|
|
|
Net assets consist of: | | | | |
Undistributed net investment income | | $ | 23,647,817 | |
Net unrealized appreciation (depreciation) | | | 297,555,870 | |
Accumulated net realized gain (loss) | | | (11,268,804 | ) |
Capital shares | | | 1,679,295,186 | |
| | |
|
|
|
Net assets, at value | | $ | 1,989,230,069 | |
| | |
|
|
|
Class 1: | | | | |
Net assets, at value | | $ | 800,117,851 | |
| | |
|
|
|
Shares outstanding | | | 61,653,594 | |
| | |
|
|
|
Net asset value and offering price per share | | $ | 12.98 | |
| | |
|
|
|
Class 2: | | | | |
Net assets, at value | | $ | 1,189,112,218 | |
| | |
|
|
|
Shares outstanding | | | 92,680,531 | |
| | |
|
|
|
Net asset value and offering price per share | | $ | 12.83 | |
| | |
|
|
|
See notes to financial statements.
TG-14
FRANKLIN TEMPLETON VARIABLE INSURANCE PRODUCTS TRUST
TEMPLETON GROWTH SECURITIES FUND
Financial Statements (continued)
Statement of Operations
for the year ended December 31, 2004
| | | | |
Investment income: | | | | |
Dividends (net of foreign taxes of $3,684,309) | | $ | 37,436,753 | |
Interest (net of foreign taxes of $382) | | | 2,663,135 | |
| | |
|
|
|
Total investment income | | | 40,099,888 | |
| | |
|
|
|
Expenses: | | | | |
Management fees (Note 3) | | | 12,123,842 | |
Distribution fees - Class 2 (Note 3) | | | 1,941,766 | |
Transfer agent fees | | | 17,857 | |
Custodian fees (Note 4) | | | 383,219 | |
Reports to shareholders | | | 474,499 | |
Professional fees | | | 106,885 | |
Trustees’ fees and expenses | | | 9,097 | |
Other | | | 72,947 | |
| | |
|
|
|
Total expenses | | | 15,130,112 | |
Expense reductions (Note 4) | | | (11,564 | ) |
| | |
|
|
|
Net expenses | | | 15,118,548 | |
| | |
|
|
|
Net investment income | | | 24,981,340 | |
| | |
|
|
|
Realized and unrealized gains (losses): | | | | |
Net realized gain (loss) from: | | | | |
Investments | | | 67,533,471 | |
Foreign currency transactions | | | 308,452 | |
| | |
|
|
|
Net realized gain (loss) | | | 67,841,923 | |
| | |
|
|
|
Net change in unrealized appreciation (depreciation) on: | | | | |
Investments | | | 160,634,233 | |
Translation of assets and liabilities denominated in foreign currencies | | | (231,130 | ) |
Deferred taxes | | | 258,124 | |
| | |
|
|
|
Net change in unrealized appreciation (depreciation) | | | 160,661,227 | |
| | |
|
|
|
Net realized and unrealized gain (loss) | | | 228,503,150 | |
| | |
|
|
|
Net increase (decrease) in net assets resulting from operations | | $ | 253,484,490 | |
| | |
|
|
|
See notes to financial statements.
TG-15
FRANKLIN TEMPLETON VARIABLE INSURANCE PRODUCTS TRUST
TEMPLETON GROWTH SECURITIES FUND
Financial Statements (continued)
Statements of Changes in Net Assets
for the years ended December 31, 2004 and 2003
| | | | | | | | |
| | | 2004 | | | 2003 | |
| | |
| |
Increase (decrease) in net assets: | | | | | | | | |
Operations: | | | | | | | | |
Net investment income | | $ | 24,981,340 | | | $ | 16,388,847 | |
Net realized gain (loss) from investments and foreign currency transactions | | | 67,841,923 | | | | (17,131,289 | ) |
Net change in unrealized appreciation (depreciation) on investments, translation of assets and liabilities denominated in foreign currencies, and deferred taxes | | | 160,661,227 | | | | 296,799,389 | |
| | |
| |
Net increase (decrease) in net assets resulting from operations | | | 253,484,490 | | | | 296,056,947 | |
Distributions to shareholders from: | | | | | | | | |
Net investment income: | | | | | | | | |
Class 1 | | | (9,645,451 | ) | | | (11,363,488 | ) |
Class 2 | | | (8,547,806 | ) | | | (4,553,762 | ) |
| | |
| |
Total distributions to shareholders | | | (18,193,257 | ) | | | (15,917,250 | ) |
Capital share transactions: (Note 2) | | | | | | | | |
Class 1 | | | (75,091,706 | ) | | | (80,154,599 | ) |
Class 2 | | | 548,032,814 | | | | 225,420,705 | |
| | |
| |
Total capital share transactions | | | 472,941,108 | | | | 145,266,106 | |
Net increase (decrease) in net assets | | | 708,232,341 | | | | 425,405,803 | |
Net assets: | | | | | | | | |
Beginning of year | | | 1,280,997,728 | | | | 855,591,925 | |
| | |
| |
End of year | | $ | 1,989,230,069 | | | $ | 1,280,997,728 | |
| | |
| |
Undistributed net investment income included in net assets: | | | | | | | | |
End of year | | $ | 23,647,817 | | | $ | 16,602,943 | |
| | |
| |
See notes to financial statements.
TG-16
FRANKLIN TEMPLETON VARIABLE INSURANCE PRODUCTS TRUST
TEMPLETON GROWTH SECURITIES FUND
Notes to Financial Statements
1. ORGANIZATION AND SIGNIFICANT ACCOUNTING POLICIES
Franklin Templeton Variable Insurance Products Trust (the Trust) is registered under the Investment Company Act of 1940 as an open-end investment company, consisting of twenty-one separate series (the Funds). Templeton Growth Securities Fund (the Fund) included in this report is diversified. The financial statements of the remaining funds in the series are presented separately. Shares of the Fund are sold only to insurance company separate accounts to fund the benefits of variable life insurance policies or variable annuity contracts. The Fund’s investment objective is capital growth.
The following summarizes the Fund’s significant accounting policies.
a. Security Valuation
Securities listed on a securities exchange or on the NASDAQ National Market System are valued at the last quoted sale price or the official closing price of the day, respectively. Over-the-counter securities and listed securities for which there is no reported sale are valued within the range of the most recent quoted bid and ask prices. Securities that trade in multiple markets or on multiple exchanges are valued according to the broadest and most representative market. Repurchase agreements are valued at cost.
Corporate debt securities and U.S. Government securities generally trade in the over-the-counter market rather than on a securities exchange. The Trust may utilize independent pricing services, quotations from bond dealers, and information with respect to bond and note transactions, to assist in determining a current market value for each security. The Trust’s pricing services may use valuation models or matrix pricing which considers information with respect to comparable bond and note transactions, quotations from bond dealers, or by reference to other securities that are considered comparable in such characteristics as rating, interest rate and maturity date, option adjusted spread models, prepayment projections, interest rate spreads and yield curves, to determine current value.
Foreign securities are valued as of the close of trading on the foreign stock exchange on which the security is primarily traded, or the NYSE, whichever is earlier. The value is then converted into its U.S. dollar equivalent at the foreign exchange rate in effect at the close of the NYSE on the day that the value of the foreign security is determined. If no sale is reported at that time, the foreign security will be valued within the range of the most recent quoted bid and ask prices.
The Trust has procedures to determine the fair value of individual securities and other assets for which market prices are not readily available or which may not be reliably priced. Some methods for valuing these securities may include: fundamental analysis, matrix pricing, discounts from market prices of similar securities, or discounts applied due to the nature and duration of restrictions on the disposition of the securities. Occasionally, events occur between the time at which trading in a security is completed and the close of the NYSE that might call into question the availability (including the reliability) of the value of a portfolio security held by the Fund. If such an event occurs, the securities may be valued using fair value procedures, which may include the use of independent pricing services. All security valuation procedures are approved by the Trust’s Board of Trustees.
b. Foreign Currency Translation
Portfolio securities and other assets and liabilities denominated in foreign currencies are translated into U.S. dollars based on the exchange rate of such currencies against U.S. dollars on the date of valuation. Purchases and sales of securities, income and expense items denominated in foreign currencies are translated into U.S. dollars at the exchange rate in effect on the transaction date. Occasionally events may impact the availability or reliability of foreign exchange rates used to convert the U.S. dollar equivalent value. If such an event occurs, the foreign exchange rate will be valued at fair value using procedures established and approved by the Trust’s Board of Trustees.
The Fund does not separately report the effect of changes in foreign exchange rates from changes in market prices on securities held. Such changes are included in net realized and unrealized gain or loss from investments on the Statement of Operations.
TG-17
FRANKLIN TEMPLETON VARIABLE INSURANCE PRODUCTS TRUST
TEMPLETON GROWTH SECURITIES FUND
Notes to Financial Statements (continued)
1. ORGANIZATION AND SIGNIFICANT ACCOUNTING POLICIES (cont.)
Foreign Currency Translation (cont.)
Realized foreign exchange gains or losses arise from sales of foreign currencies, currency gains or losses realized between the trade and settlement dates on securities transactions and the difference between the recorded amounts of dividends, interest, and foreign withholding taxes and the U.S. dollar equivalent of the amounts actually received or paid. Net unrealized foreign exchange gains and losses arise from changes in foreign exchange rates on foreign denominated assets and liabilities other than investments in securities held at the end of the reporting period.
c. Repurchase Agreements
The Fund may enter into repurchase agreements, which are accounted for as a loan by the Fund to the seller, collateralized by securities which are delivered to the Fund’s custodian. The market value, including accrued interest, of the initial collateralization is required to be at least 102% of the dollar amount invested by the Fund, with the value of the underlying securities marked to market daily to maintain coverage of at least 100%. At December 31, 2004, all repurchase agreements held by the Fund had been entered into on that date.
d. Foreign Currency Contracts
When the Fund purchases or sells foreign securities it may enter into foreign exchange contracts to minimize foreign exchange risk from the trade date to the settlement date of the transactions. A foreign exchange contract is an agreement between two parties to exchange different currencies at an agreed upon exchange rate on a specified date. Realized and unrealized gains and losses on these contracts are included in the Statement of Operations.
The risks of these contracts include movement in the values of the foreign currencies relative to the U.S. dollar and the possible inability of the counterparties to fulfill their obligations under the contracts.
e. Income and Deferred Taxes
No provision has been made for U.S. income taxes because the Fund’s policy is to qualify as a regulated investment company under Sub Chapter M of the Internal Revenue Code and to distribute substantially all of its taxable income. Fund distributions to shareholders are determined on an income tax basis and may differ from net investment income and realized gains for financial reporting purposes.
The Fund is subject to a tax imposed on net realized gains of securities of certain foreign countries. The Fund records an estimated deferred tax liability for net unrealized gains on these securities.
f. Security Transactions, Investment Income, Expenses and Distributions
Security transactions are accounted for on trade date. Realized gains and losses on security transactions are determined on a specific identification basis. Interest income and estimated expenses are accrued daily. Discounts and premiums on securities purchased are amortized over the lives of the respective securities. Dividend income and distributions to shareholders are recorded on the ex-dividend date.
Common expenses incurred by the Trust are allocated among the funds based on the ratio of net assets of each fund to the combined net assets. Other expenses are charged to each fund on a specific identification basis.
Realized and unrealized gains and losses and net investment income, other than class specific expenses, are allocated daily to each class of shares based upon the relative proportion of net assets of each class.
TG-18
FRANKLIN TEMPLETON VARIABLE INSURANCE PRODUCTS TRUST
TEMPLETON GROWTH SECURITIES FUND
Notes to Financial Statements (continued)
1. ORGANIZATION AND SIGNIFICANT ACCOUNTING POLICIES (cont.)
g. Accounting Estimates
The preparation of financial statements in accordance with accounting principles generally accepted in the United States of America requires management to make estimates and assumptions that affect the reported amounts of assets and liabilities at the date of the financial statements and the amounts of income and expenses during the reporting period. Actual results could differ from those estimates.
h. Guarantees and Indemnifications
Under the Trust’s organizational documents, its officers and trustees are indemnified by the Trust against certain liability arising out of the performance of their duties to the Trust. Additionally, in the normal course of business, the Trust enters into contracts with service providers that contain general indemnification clauses. The Trust’s maximum exposure under these arrangements is unknown as this would involve future claims that may be made against the Trust that have not yet occurred. However, based on experience, the Trust expects the risk of loss to be remote.
2. SHARES OF BENEFICIAL INTEREST
The Fund offers two classes of shares: Class 1 and Class 2. Each class of shares differs by its distribution fees, voting rights on matters affecting a single class and its exchange privilege.
At December 31, 2004, there were an unlimited number of shares authorized ($.01 par value). Transactions in the Fund’s shares were as follows:
| | | | | | | | | | | | | | |
| | | Year Ended December 31,
| |
| | | 2004
| | | 2003
| |
| Class 1 Shares: | | Shares
| | | Amount
| | | Shares
| | | Amount
| |
Shares sold | | 1,256,557 | | | $ | 14,860,796 | | | 1,110,988 | | | $ | 10,553,604 | |
Shares issued in reinvestment of distributions | | 835,104 | | | | 9,645,451 | | | 1,181,236 | | | | 11,363,488 | |
Shares redeemed | | (8,487,240 | ) | | | (99,597,953 | ) | | (11,030,466 | ) | | | (102,071,691 | ) |
| | |
| |
Net increase (decrease) | | (6,395,579 | ) | | $ | (75,091,706 | ) | | (8,738,242 | ) | | $ | (80,154,599 | ) |
| | |
| |
| Class 2 Shares: | | | | | | | | | | | | |
Shares sold | | 50,615,234 | | | $ | 589,822,365 | | | 30,448,582 | | | $ | 289,636,811 | |
Shares issued in reinvestment of distributions | | 747,186 | | | | 8,547,806 | | | 477,333 | | | | 4,553,762 | |
Shares redeemed | | (4,387,645 | ) | | | (50,337,357 | ) | | (7,334,303 | ) | | | (68,769,868 | ) |
| | |
| |
Net increase (decrease) | | 46,974,775 | | | $ | 548,032,814 | | | 23,591,612 | | | $ | 225,420,705 | |
| | |
| |
3. TRANSACTIONS WITH AFFILIATES
Certain officers and trustees of the Fund are also officers and/or directors of the following entities:
| | |
| Entity | | Affiliation |
Templeton Global Advisors Ltd. (TGAL) | | Investment manager |
Templeton Asset Management Ltd. (TAML) | | Investment manager |
Franklin Templeton Services LLC (FT Services) | | Administrative manager |
Franklin Templeton Distributors Inc. (Distributors) | | Principal underwriter |
Franklin Templeton Investor Services LLC (Investor Services) | | Transfer agent |
TG-19
FRANKLIN TEMPLETON VARIABLE INSURANCE PRODUCTS TRUST
TEMPLETON GROWTH SECURITIES FUND
Notes to Financial Statements (continued)
3. TRANSACTIONS WITH AFFILIATES (cont.)
a. Management Fees
The Fund pays an investment management fee to TGAL based on the average daily net assets of the Fund as follows:
| | |
| Annualized Fee Rate | | Net Assets |
| 1.00% | | First $100 million |
| .90% | | Over $100 million, up to and including $250 million |
| .80% | | Over $250 million, up to and including $500 million |
| .75% | | Over $500 million |
Under a subadvisory agreement, TAML, an affiliate of TGAL, provides subadvisory services to the Fund and receives from TGAL fees based on the average daily net assets of the Fund.
b. Administrative Fees
Under an agreement with TGAL, FT Services provides administrative services to the Fund. The fee is paid by TGAL based on the average daily net assets of the Fund, and is not an additional expense of the Fund.
c. Distribution Fees
The Fund reimburses Distributors up to .25% per year of its average daily net assets of Class 2, for costs incurred in marketing the Fund’s shares under a Rule 12b-1 plan.
d. Transfer Agent Fees
Investor Services, under terms of an agreement, performs shareholder servicing for the Fund and is not paid by the Fund for the services.
4. EXPENSE OFFSET ARRANGEMENT
The Fund has entered into an arrangement with its custodian whereby credits realized as a result of uninvested cash balances are used to reduce a portion of the Fund’s custodian expenses. During the year ended December 31, 2004, the custodian fees were reduced as noted in the Statement of Operations.
5. INCOME TAXES
At December 31, 2004, the Fund had tax basis capital losses of $11,265,016 which may be carried over to offset future capital gains. Such losses expire in 2011.
At December 31, 2004, the Fund had deferred currency losses occurring subsequent to October 31, 2004 of $3,788. For tax purposes, such losses will be reflected in the year ending December 31, 2005.
The tax character of distributions paid during the years ended December 31, 2004 and 2003, was as follows:
| | | | | | |
| | | 2004
| | 2003
|
Distributions paid from ordinary income | | $ | 18,193,257 | | $ | 15,917,250 |
| | |
|
|
Net investment income (loss) and realized gains (losses) differ for financial statement and tax purposes primarily due to differing treatment of foreign currency transactions.
TG-20
FRANKLIN TEMPLETON VARIABLE INSURANCE PRODUCTS TRUST
TEMPLETON GROWTH SECURITIES FUND
Notes to Financial Statements (continued)
5. INCOME TAXES (cont.)
At December 31, 2004, the cost of investments, net unrealized appreciation (depreciation), and undistributed ordinary income for income tax purposes were as follows:
| | | | |
Cost of investments | | $ | 1,688,812,959 | |
| | |
|
|
|
Unrealized appreciation | | $ | 337,882,790 | |
Unrealized depreciation | | | (40,435,690 | ) |
| | |
|
|
|
Net unrealized appreciation (depreciation) | | $ | 297,447,100 | |
| | |
|
|
|
Distributable earnings - undistributed ordinary income | | $ | 23,647,326 | |
| | |
|
|
|
6. INVESTMENT TRANSACTIONS
Purchases and sales of investments (excluding short-term securities) for the year ended December 31, 2004, aggregated $620,859,324 and $257,281,470, respectively.
7. REGULATORY MATTERS
Investigations
As part of various investigations by a number of federal, state, and foreign regulators and governmental entities, including the Securities and Exchange Commission (“SEC”), the California Attorney General’s Office (“CAGO”), and the National Association of Securities Dealers, Inc. (“NASD”), relating to certain practices in the mutual fund industry, including late trading, market timing and marketing support payments to securities dealers who sell fund shares, Franklin Resources, Inc. and certain of its subsidiaries (as used in this section, together, the “Company”), as well as certain current or former executives and employees of the Company, received subpoenas and/or requests for documents, information and/or testimony. The Company and its current employees provided documents and information in response to those requests and subpoenas.
Settlements
Beginning in August 2004, the Company entered into settlements with certain regulators investigating the mutual fund industry practices noted above. The Company believes that settlement of each of the matters described in this section is in the best interest of the Company and shareholders of the Franklin, Templeton, and Mutual Series mutual funds (the “funds”).
On August 2, 2004, Franklin Resources, Inc. announced that its subsidiary, Franklin Advisers, Inc., reached an agreement with the SEC that resolved the issues resulting from the SEC investigation into market timing activity. In connection with that agreement, the SEC issued an “Order Instituting Administrative and Cease-and-Desist Proceedings Pursuant to Sections 203(e) and 203(k) of the Investment Advisers Act of 1940 and Sections 9(b) and 9(f) of the Investment Company Act of 1940, Making Findings and Imposing Remedial Sanctions and a Cease-and-Desist Order” (the “Order”). The SEC’s Order concerned the activities of a limited number of third parties that ended in 2000 and those that were the subject of the first Massachusetts administrative complaint described below.
Under the terms of the SEC’s Order, pursuant to which Franklin Advisers, Inc. neither admitted nor denied any of the findings contained therein, Franklin Advisers, Inc. agreed to pay $50 million, of which $20 million is a civil penalty, to be distributed to shareholders of certain funds in accordance with a plan to be developed by an independent distribution consultant. At this time, it is unclear which funds or which shareholders of any particular fund will receive distributions. The Order also required Franklin Advisers, Inc. to, among other things, enhance and periodically review compliance policies and procedures.
TG-21
FRANKLIN TEMPLETON VARIABLE INSURANCE PRODUCTS TRUST
TEMPLETON GROWTH SECURITIES FUND
Notes to Financial Statements (continued)
7. REGULATORY MATTERS (cont.)
Settlements (cont.)
On September 20, 2004, Franklin Resources, Inc. announced that two of its subsidiaries, Franklin Advisers, Inc. and Franklin Templeton Alternative Strategies, Inc. (“FTAS”), reached an agreement with the Securities Division of the Office of the Secretary of the Commonwealth of Massachusetts (the “State of Massachusetts”) related to its administrative complaint filed on February 4, 2004, concerning one instance of market timing that was also a subject of the August 2, 2004 settlement that Franklin Advisers, Inc. reached with the SEC, as described above.
Under the terms of the settlement consent order issued by the State of Massachusetts, Franklin Advisers, Inc. and FTAS consented to the entry of a cease-and-desist order and agreed to pay a $5 million administrative fine to the State of Massachusetts (the “Massachusetts Consent Order”). The Massachusetts Consent Order included two different sections: “Statements of Fact” and “Violations of Massachusetts Securities Laws.” Franklin Advisers, Inc. and FTAS admitted the facts in the Statements of Fact.
On October 25, 2004, the State of Massachusetts filed a second administrative complaint, alleging that Franklin Resources, Inc.’s Form 8-K filing (in which it described the Massachusetts Consent Order and stated that “Franklin did not admit or deny engaging in any wrongdoing”) failed to state that Franklin Advisers, Inc. and FTAS admitted the Statements of Fact portion of the Massachusetts Consent Order (the “Second Complaint”). Franklin Resources, Inc. reached a second agreement with the State of Massachusetts on November 19, 2004, resolving the Second Complaint. As a result of the November 19, 2004 settlement, Franklin Resources, Inc. filed a new Form 8-K. The terms of the Massachusetts Consent Order did not change and there was no monetary fine associated with this second settlement.
On November 17, 2004, Franklin Resources, Inc. announced that Franklin/Templeton Distributors, Inc. (“FTDI”) reached an agreement with the CAGO, resolving the issues resulting from the CAGO’s investigation concerning sales and marketing support payments. Under the terms of the settlement, FTDI neither admitted nor denied the allegations in the CAGO’s complaint and agreed to pay $2 million to the State of California as a civil penalty, $14 million to the funds, to be allocated by an independent distribution consultant to be paid for by FTDI, and $2 million to the CAGO for its investigative costs.
On December 13, 2004, Franklin Resources, Inc. announced that its subsidiaries FTDI and Franklin Advisers, Inc. reached an agreement with the SEC, resolving the issues resulting from the SEC’s investigation concerning marketing support payments to securities dealers who sell fund shares. In connection with that agreement, the SEC issued an “Order Instituting Administrative and Cease-and-Desist Proceedings, Making Findings, and Imposing Remedial Sanctions Pursuant to Sections 203(e) and 203(k) of the Investment Advisers Act of 1940, Sections 9(b) and 9(f) of the Investment Company Act of 1940, and Section 15(b) of the Securities Exchange Act of 1934” (the “Second Order”).
Under the terms of the Second Order, in which FTDI and Franklin Advisers, Inc. neither admitted nor denied the findings contained therein, they agreed to pay the funds a penalty of $20 million and disgorgement of $1 (one dollar). FTDI and Franklin Advisers, Inc. also agreed to implement certain measures and undertakings relating to marketing support payments to broker-dealers for the promotion or sale of fund shares, including making additional disclosures in the funds’ Prospectuses and Statements of Additional Information. The Second Order further requires the appointment of an independent distribution consultant, at the Company’s expense, who shall develop a plan for the distribution of the penalty and disgorgement to the funds.
Other Legal Proceedings
The Trust, in addition to the Company and other funds, and certain current and former officers, employees, and directors have been named in multiple lawsuits in different federal courts in Nevada, California, Illinois, New York and Florida, alleging violations of various federal securities laws and seeking, among other relief, monetary damages, restitution, removal of fund trustees, directors, advisers, administrators, and distributors, rescission of management contracts and 12b-1 Plans, and/or attorneys’ fees and costs. Specifically, the lawsuits claim breach of duty with respect to alleged arrangements to permit market
TG-22
FRANKLIN TEMPLETON VARIABLE INSURANCE PRODUCTS TRUST
TEMPLETON GROWTH SECURITIES FUND
Notes to Financial Statements (continued)
7. REGULATORY MATTERS (cont.)
Other Legal Proceedings (cont.)
timing and/or late trading activity, or breach of duty with respect to the valuation of the portfolio securities of certain Templeton funds managed by Franklin Resources, Inc. subsidiaries, resulting in alleged market timing activity. The majority of these lawsuits duplicate, in whole or in part, the allegations asserted in the February 4, 2004 Massachusetts administrative complaint and the findings in the SEC’s August 2, 2004 Order, as described above. The lawsuits are styled as class actions, or derivative actions on behalf of either the named funds or Franklin Resources, Inc.
In addition, the Company, as well as certain current and former officers, employees, and directors, have been named in multiple lawsuits alleging violations of various securities laws and pendent state law claims relating to the disclosure of directed brokerage payments and/or payment of allegedly excessive advisory, commission, and distribution fees, and seeking, among other relief, monetary damages, restitution, rescission of advisory contracts, including recovery of all fees paid pursuant to those contracts, an accounting of all monies paid to the named advisers, declaratory relief, injunctive relief, and/or attorneys’ fees and costs. These lawsuits are styled as class actions or derivative actions brought on behalf of certain funds.
The Company and fund management strongly believes that the claims made in each of the lawsuits identified above are without merit and intends to vigorously defend against them. The Company cannot predict with certainty, however, the eventual outcome of the remaining governmental investigations or private lawsuits, nor whether they will have a material negative impact on the Company. Public trust and confidence are critical to the Company’s business and any material loss of investor and/or client confidence could result in a significant decline in assets under management by the Company, which would have an adverse effect on the Company’s future financial results. If the Company finds that it bears responsibility for any unlawful or inappropriate conduct that caused losses to the Trust, it is committed to making the Trust or its shareholders whole, as appropriate. The Company is committed to taking all appropriate actions to protect the interests of its funds’ shareholders.
TG-23
FRANKLIN TEMPLETON VARIABLE INSURANCE PRODUCTS TRUST
TEMPLETON GROWTH SECURITIES FUND
Report of Independent Registered Public Accounting Firm
To the Trustees and Shareholders of Franklin Templeton Variable Insurance Products Trust
In our opinion, the accompanying statement of assets and liabilities, including the statement of investments, and the related statements of operations and of changes in net assets and the financial highlights present fairly, in all material respects, the financial position of Templeton Growth Securities Fund (the Fund) (one of the funds constituting Franklin Templeton Variable Insurance Products Trust) at December 31, 2004, the results of its operations for the year then ended, the changes in its net assets for each of the two years in the period then ended and the financial highlights for each of the five years in the period then ended, in conformity with accounting principles generally accepted in the United States of America. These financial statements and financial highlights (hereafter referred to as “financial statements”) are the responsibility of the Fund’s management; our responsibility is to express an opinion on these financial statements based on our audits. We conducted our audits of these financial statements in accordance with the standards of the Public Company Accounting Oversight Board (United States). Those standards require that we plan and perform the audits to obtain reasonable assurance about whether the financial statements are free of material misstatement. An audit includes examining, on a test basis, evidence supporting the amounts and disclosures in the financial statements, assessing the accounting principles used and significant estimates made by management, and evaluating the overall financial statement presentation. We believe that our audits, which included confirmation of securities at December 31, 2004 by correspondence with the custodian and brokers, provide a reasonable basis for our opinion.
PricewaterhouseCoopers LLP
San Francisco, California
February 9, 2005
TG-24
FRANKLIN TEMPLETON VARIABLE INSURANCE PRODUCTS TRUST
TEMPLETON GROWTH SECURITIES FUND
Tax Designation (unaudited)
Under Section 854(b)(2) of the Internal Revenue Code (Code), the Fund hereby designates 29.48% of the ordinary income dividends as income qualifying for the dividends received deduction for the fiscal year ended December 31, 2004.
At December 31, 2004, more than 50% of the Fund’s total assets were invested in securities of foreign issuers. In most instances, foreign taxes were withheld from dividends and interest paid to the Fund on these investments. The Fund elects to treat foreign taxes paid under Section 853 of the Code. This election will allow shareholders of record in June 2005, to treat their proportionate share of foreign taxes paid by the Fund as having been paid directly by them. The shareholder shall consider these amounts as foreign taxes paid in the tax year in which they receive the Fund distribution.
The foreign tax information will be disclosed in the June 2005, semi-annual report of the Fund.
TG-25
INDEX DESCRIPTIONS
The indexes are unmanaged and include reinvested distributions.
Consumer Price Index (CPI), calculated by the U.S. Bureau of Labor Statistics, is a commonly used measure of the inflation rate.
Credit Suisse First Boston (CSFB) High Yield Index is designed to mirror the investible universe of the U.S. dollar-denominated high yield debt market.
Dow Jones Industrial Average (the Dow) is price weighted based on the average market price of 30 blue chip stocks of companies that are generally industry leaders.
Dow Jones Wilshire Real Estate Securities Index is a broad measure of the performance of publicly traded real estate securities, such as real estate investment trusts and real estate operating companies. The index is capitalization weighted and rebalanced monthly, and returns are calculated on a buy-and-hold basis.
J.P. Morgan (JPM) Emerging Markets Bond Index Global (EMBIG) tracks total returns for U.S. dollar-denominated debt instruments issued by emerging market sovereign and quasi-sovereign entities: Brady bonds, loans and Eurobonds.
J.P. Morgan (JPM) Euro Emerging Markets Bond Index Global (EMBIG) tracks total returns for euro-denominated straight fixed coupon instruments issued by emerging market sovereign and quasi-sovereign entities.
J.P. Morgan (JPM) Government Bond Index (GBI) Global tracks total returns of government bonds in developed countries globally. The bonds included in the index are weighted according to their market capitalization. The index is unhedged and expressed in terms of $US.
Lehman Brothers U.S. Aggregate Index represents securities that are SEC-registered, taxable and dollar denominated. The index covers the U.S. investment grade fixed-rate bond market, with index components for government and corporate securities, mortgage pass-through securities and asset-backed securities. All issues included must have at least one year to final maturity and must be rated investment grade (Baa3 or better) by Moody’s Investors Service. They must be publicly issued, fixed rate, and have at least par amount outstanding. They must also be dollar denominated and non-convertible. Total return includes price appreciation/depreciation and income as a percentage of the original investment. The index is rebalanced monthly by market capitalization.
Lehman Brothers U.S. Intermediate Government Bond Index includes securities issued by the U.S. Treasury or agency. These include public obligations of the U.S. Treasury with remaining maturity of one year or more and publicly issued debt of U.S. governmental agencies, quasi-federal corporations, and corporate or foreign debt. All issues included must have one to ten years to final maturity and must be rated investment grade (Baa3 or better) by Moody’s Investors Service. They must also be dollar-denominated and non-convertible. Total return includes price appreciation/depreciation and income as a percentage of the original investment. The index is rebalanced monthly by market capitalization.
I-1
Lipper Multi-Sector Income Funds Objective Average is calculated by averaging the total returns of all funds within the Lipper Multi-Sector Income Funds classification in the Lipper Open-End underlying funds universe. Lipper Multi-Sector Income Funds are defined as funds that seek current income by allocating assets among different fixed income securities sectors (not primarily in one sector except for defensive purposes), including U.S. and foreign governments, with a significant portion rated below investment grade. For the one-year period ended 12/31/04, there were 112 funds in this category. Lipper calculations do not include sales charges, but include reinvestment of any income and distributions. Fund performance relative to the average may have differed if these and other factors had been considered.
Lipper VIP Equity Income Funds Objective Average is an equally weighted average calculation of performance figures for all funds within the Lipper Equity Income Funds classification in the Lipper VIP underlying funds universe. Lipper Equity Income Funds are defined as funds that seek relatively high current income and growth of income through investing at least 60% of their portfolio in equity securities. For the one-year period ended 12/31/04, there were 61 funds in this category. Lipper calculations do not include contract fees, expenses or sales charges, and may have been different if such charges had been considered.
Lipper VIP General U.S. Government Funds Objective Average is an equally weighted average calculation of performance figures for all funds within the Lipper U.S. Government Funds classification in the Lipper VIP underlying funds universe. Lipper U.S. Government Funds are defined as funds that invest primarily in U.S. government and Agency issues. For the one-year period ended 12/31/04, there were 56 funds in this category. Lipper calculations do not include contract fees, expenses or sales charges, and may have been different if such charges had been considered.
Lipper VIP Income Funds Objective Average is an equally weighted average calculation of performance figures for all funds within the Lipper Income Funds classification in the Lipper VIP underlying funds universe. Lipper Income Funds seek a high level of current income by investing in income-producing stocks, bonds and money market instruments. For the one-year period ended 12/31/04, there were 18 funds in this category. Lipper calculations do not include contract fees, expenses or sales charges, and may have been different if such charges had been considered.
Merrill Lynch 2-, 5- and 10-Year Zero Coupon Bond Indexes include zero coupon bonds that pay no interest and are issued at a discount from redemption price.
Merrill Lynch U.S. Treasury Strips 1-Year Index consists of U.S. Treasury debt that has been issued in stripped form that is captured in the Merrill Lynch U.S. Broad Market Index. The index is composed of a single synthetic security rolled daily to achieve a 1-year constant maturity.
Morgan Stanley Capital International (MSCI) All Country (AC) World Index is a free float-adjusted, market capitalization-weighted index designed to measure equity market performance in global developed and emerging markets.
Morgan Stanley Capital International (MSCI) Emerging Markets (EM) Index is a free float-adjusted, market capitalization-weighted index designed to measure equity market performance in global emerging markets.
I-2
Morgan Stanley Capital International (MSCI) Europe Australasia Far East (EAFE) Index is a free float-adjusted, market capitalization-weighted index designed to measure equity market performance in global developed markets excluding the U.S. and Canada.
Morgan Stanley Capital International (MSCI) World Index is a free float-adjusted, market capitalization-weighted index designed to measure equity performance in global developed markets.
National Association of Securities Dealers Automated Quotations (NASDAQ) Composite Index measures all domestic and international common stocks listed on The NASDAQ Stock Market. The index is market value weighted and includes over 3,000 companies.
Russell 1000 Growth Index is market capitalization weighted and measures performance of those Russell 1000 Index companies with higher price-to-book ratios and higher forecasted growth values.
Russell 1000 Index is market capitalization weighted and measures performance of the 1,000 largest companies in the Russell 3000 Index, which represent approximately 92% of total market capitalization of the Russell 3000 Index.
Russell 1000 Value Index is market capitalization weighted and measures performance of those Russell 1000 Index companies with lower price-to-book ratios and lower forecasted growth values.
Russell 2000 Index is market capitalization weighted and measures performance of the 2,000 smallest companies in the Russell 3000 Index, which represent approximately 8% of total market capitalization of the Russell 3000 Index.
Russell 2000 Value Index is market capitalization weighted and measures performance of those Russell 2000 Index companies with lower price-to-book ratios and lower forecasted growth values.
Russell 2500 Growth Index is market capitalization weighted and measures performance of those Russell 2500 Index companies with higher price-to-book ratios and higher forecasted growth values.
Russell Midcap Value Index is market capitalization weighted and measures performance of those Russell Midcap Index companies with lower price-to-book ratios and lower forecasted growth values.
Standard & Poor’s 500 Composite Index (S&P 500) consists of 500 stocks chosen for market size, liquidity and industry group representation. Each stock’s weight in the index is proportionate to its market value. The S&P 500 is one of the most widely used benchmarks of U.S. equity performance.
Standard & Poor’s/International Finance Corporation Investable (S&P/IFCI) Composite Index is a market capitalization-weighted index designed to measure the performance of emerging market stocks. It tracks approximately 2,000 securities such as Brazil, Mexico, China and South Korea. Performance represents total return in $US.
I-3
Board Members and Officers
The name, age and address of the officers and board members, as well as their affiliations, positions held with the Trust, principal occupations during the past five years and number of portfolios overseen in the Franklin Templeton Investments fund complex are shown below. Each board member will serve until that person’s successor is elected and qualified.
Independent Board Members
| | | | | | | | |
| Name, Age and Address | | Position | | Length of
Time Served | | Number of
Portfolios in Fund
Complex Overseen
by Board Member* | | Other Directorships Held |
FRANK H. ABBOTT, III (83) One Franklin Parkway San Mateo, CA 94403-1906 | | Trustee | | Since 1988 | | 113 | | None |
|
Principal Occupation During Past 5 Years: President and Director, Abbott Corporation (an investment company). |
HARRIS J. ASHTON (72) One Franklin Parkway San Mateo, CA 94403-1906 | | Trustee | | Since 1988 | | 142 | | Director, Bar-S Foods (meat packing company). |
|
Principal Occupation During Past 5 Years: Director of various companies; and formerly, Director, RBC Holdings, Inc. (bank holding company) (until 2002); and President, Chief Executive Officer and Chairman of the Board, General Host Corporation (nursery and craft centers) (until 1998). |
ROBERT F. CARLSON (76) One Franklin Parkway San Mateo, CA 94403-1906 | | Trustee | | Since 1998 | | 49 | | None |
|
Principal Occupation During Past 5 Years: Senior Member and past President, Board of Administration, California Public Employees Retirement Systems (CALPERS); and formerly, member and Chairman of the Board, Sutter Community Hospitals; member, Corporate Board, Blue Shield of California; and Chief Counsel, California Department of Transportation. |
S. JOSEPH FORTUNATO (72) One Franklin Parkway San Mateo, CA 94403-1906 | | Trustee | | Since 1995 | | 143 | | None |
|
Principal Occupation During Past 5 Years: Attorney; and formerly, member of the law firm of Pitney, Hardin, Kipp & Szuch (until 2002) (Consultant (2003)). |
FRANK W.T. LAHAYE (75) One Franklin Parkway San Mateo, CA 94403-1906 | | Trustee | | Since 1988 | | 115 | | Director, The California Center for Land Recycling (redevelopment). |
|
Principal Occupation During Past 5 Years: General Partner, Las Olas L.P. (Asset Management); and formerly, Chairman, Peregrine Venture Management Company (venture capital). |
GORDON S. MACKLIN (76) One Franklin Parkway San Mateo, CA 94403-1906 | | Trustee | | Since 1995 | | 142 | | Director, Martek Biosciences Corporation; MedImmune, Inc. (biotechnology); and Overstock.com (Internet services); and formerly, Director, MCI Communication Corporation (subsequently known as MCI WorldCom, Inc. and WorldCom, Inc.) (communications services) (1988-2002), White Mountains Insurance Group Ltd. (holding company) (1987-2004) and Spacehab, Inc. (aerospace services) (1994-2003). |
|
Principal Occupation During Past 5 Years: Director of various companies; and formerly, Deputy Chairman, White Mountains Insurance Group, Ltd. (holding company) (2001-2004); Chairman, White River Corporation (financial services) (1993-1998) and Hambrecht & Quist Group (investment banking) (1987-1992); and President, National Association of Securities Dealers, Inc. (1970-1987). |
BOD-1
Interested Board Members and Officers
| | | | | | | | |
| Name, Age and Address | | Position | | Length of
Time Served | | Number of
Portfolios in Fund
Complex Overseen
by Board Member* | | Other Directorships Held |
**CHARLES B. JOHNSON (71) One Franklin Parkway San Mateo, CA 94403-1906 | | Trustee and Chairman of the Board | | Since 1988 | | 142 | | None |
|
Principal Occupation During Past 5 Years: Chairman of the Board, Member—Office of the Chairman and Director, Franklin Resources, Inc.; Vice President, Franklin Templeton Distributors, Inc.; Director, Fiduciary Trust Company International; and officer and/or director or trustee, as the case may be, of some of the other subsidiaries of Franklin Resources, Inc. and of 46 of the investment companies in Franklin Templeton Investments. |
**RUPERT H. JOHNSON, Jr. (64) One Franklin Parkway San Mateo, CA 94403-1906 | | Trustee,
President and
Chief Executive Officer—
Investment Management | | Trustee since 1988 and President and Chief Executive Officer—Investment Management since 2002 | | 125 | | None |
|
Principal Occupation During Past 5 Years: Vice Chairman, Member—Office of the Chairman and Director, Franklin Resources, Inc.; Vice President and Director, Franklin Templeton Distributors, Inc.; Director, Franklin Advisers, Inc. and Franklin Investment Advisory Services, Inc.; Senior Vice President, Franklin Advisory Services, LLC; and officer and/or director or trustee, as the case may be, of some of the other subsidiaries of Franklin Resources, Inc. and of 49 of the investment companies in Franklin Templeton Investments. |
HARMON E. BURNS (59) One Franklin Parkway San Mateo, CA 94403-1906 | | Vice President | | Since 1988 | | Not
Applicable | | Not Applicable |
|
Principal Occupation During Past 5 Years: Vice Chairman, Member—Office of the Chairman and Director, Franklin Resources, Inc.; Vice President and Director, Franklin Templeton Distributors, Inc.; Executive Vice President, Franklin Advisers, Inc.; Director, Franklin Investment Advisory Services, Inc.; and officer and/or director or trustee, as the case may be, of some of the other subsidiaries of Franklin Resources, Inc. and of 49 of the investment companies in Franklin Templeton Investments. |
JAMES M. DAVIS (52) One Franklin Parkway San Mateo, CA 94403-1906 | | Chief Compliance Officer | | Since July 2004 | | Not
Applicable | | Not Applicable |
|
Principal Occupation During Past 5 Years: Officer of 51 of the investment companies in Franklin Templeton Investments; Director, Global Compliance, Franklin Resources, Inc.; and formerly, Director of Compliance, Franklin Resources, Inc. (1994-2001). |
LAURA FERGERSON (42) One Franklin Parkway San Mateo, CA 94403-1906 | | Treasurer | | Since July 2004 | | Not
Applicable | | Not Applicable |
|
Principal Occupation During Past 5 Years: Officer of 34 of the investment companies in Franklin Templeton Investments; and formerly, Director and member of Audit and Valuation Committees, Runkel Funds, Inc. (2003-2004); Assistant Treasurer of most of the investment companies in Franklin Templeton Investments (1997-2003); and Vice President, Franklin Templeton Services, LLC (1997-2003). |
BOD-2
| | | | | | | | |
| Name, Age and Address | | Position | | Length of
Time Served | | Number of
Portfolios in Fund
Complex Overseen
by Board Member* | | Other Directorships Held |
MARTIN L. FLANAGAN (44) One Franklin Parkway San Mateo, CA 94403-1906 | | Vice President | | Since 1995 | | Not
Applicable | | Not Applicable |
|
Principal Occupation During Past 5 Years: Co-President and Chief Executive Officer, Franklin Resources, Inc.; Senior Vice President and Chief Financial Officer, Franklin Mutual Advisers, LLC; Executive Vice President, Chief Financial Officer and Director, Templeton Worldwide, Inc.; Executive Vice President and Chief Operating Officer, Templeton Investment Counsel, LLC; President and Director, Franklin Advisers, Inc.; Executive Vice President, Franklin Investment Advisory Services, Inc. and Franklin Templeton Investor Services, LLC; Chief Financial Officer, Franklin Advisory Services, LLC; Chairman, Franklin Templeton Services, LLC; and officer and/or director or trustee, as the case may be, of some of the other subsidiaries of Franklin Resources, Inc. and of 49 of the investment companies in Franklin Templeton Investments. |
JIMMY D. GAMBILL (57) 500 East Broward Blvd. Suite 2100
Fort Lauderdale,
FL 33394-3091 | | Senior Vice President and Chief
Executive Officer—Finance and Administration | | Since 2002 | | Not
Applicable | | Not Applicable |
|
Principal Occupation During Past 5 Years: President, Franklin Templeton Services, LLC; Senior Vice President, Templeton Worldwide, Inc.; and officer of 51 of the investment companies in Franklin Templeton Investments. |
DAVID P. GOSS (57) One Franklin Parkway San Mateo, CA 94403-1906 | | Vice President | | Since 2000 | | Not
Applicable | | Not Applicable |
|
Principal Occupation During Past 5 Years: Senior Associate General Counsel, Franklin Resources, Inc.; officer and director of one of the subsidiaries of Franklin Resources, Inc.; officer of 51 of the investment companies in Franklin Templeton Investments; and formerly, President, Chief Executive Officer and Director, Property Resources Equity Trust (until 1999) and Franklin Select Realty Trust (until 2000). |
BARBARA J. GREEN (57) One Franklin Parkway San Mateo, CA 94403-1906 | | Vice President | | Since 2000 | | Not
Applicable | | Not Applicable |
|
Principal Occupation During Past 5 Years: Vice President, Deputy General Counsel and Secretary, Franklin Resources, Inc.; Secretary and Senior Vice President, Templeton Worldwide, Inc.; Secretary, Franklin Advisers, Inc., Franklin Advisory Services, LLC, Franklin Investment Advisory Services, Inc., Franklin Mutual Advisers, LLC, Franklin Templeton Alternative Strategies, Inc., Franklin Templeton Investor Services, LLC, Franklin Templeton Services, LLC, Franklin Templeton Distributors, Inc., Templeton Investment Counsel, LLC, and Templeton/Franklin Investment Services, Inc.; and officer of some of the other subsidiaries of Franklin Resources, Inc. and of 51 of the investment companies in Franklin Templeton Investments; and formerly, Deputy Director, Division of Investment Management, Executive Assistant and Senior Advisor to the Chairman, Counselor to the Chairman, Special Counsel and Attorney Fellow, U.S. Securities and Exchange Commission (1986-1995); Attorney, Rogers & Wells (until 1986); and Judicial Clerk, U.S. District Court (District of Massachusetts) (until 1979). |
MICHAEL O. MAGDOL (67) 600 Fifth Avenue Rockefeller Center New York, NY 10048-0772 | | Vice President— AML Compliance | | Since 2002 | | Not
Applicable | | Not Applicable |
|
Principal Occupation During Past 5 Years: Vice Chairman, Chief Banking Officer and Director, Fiduciary Trust Company International; Director, FTI Banque, Arch Chemicals, Inc. and Lingnan Foundation; and officer and/or director, as the case may be, of some of the other subsidiaries of Franklin Resources, Inc. and of 48 of the investment companies in Franklin Templeton Investments. |
BOD-3
| | | | | | | | |
| Name, Age and Address | | Position | | Length of
Time Served | | Number of
Portfolios in Fund
Complex Overseen
by Board Member* | | Other Directorships Held |
MURRAY L. SIMPSON (67) One Franklin Parkway San Mateo, CA 94403-1906 | | Vice President and Secretary | | Since 2000 | | Not
Applicable | | Not Applicable |
|
Principal Occupation During Past 5 Years: Executive Vice President and General Counsel, Franklin Resources, Inc.; officer and/or director, as the case may be, of some of the subsidiaries of Franklin Resources, Inc. and of 51 of the investment companies in Franklin Templeton Investments; and formerly, Chief Executive Officer and Managing Director, Templeton Franklin Investment Services (Asia) Limited (until 2000); and Director, Templeton Asset Management Ltd. (until 1999). |
GALEN G. VETTER (53) 500 East Broward Blvd. Suite 2100 Fort Lauderdale,
FL 33394-3091 | | Chief Financial Officer and Chief Accounting Officer | | Since May 2004 | | Not
Applicable | | Not Applicable |
|
Principal Occupation During Past 5 Years: Officer of 51 of the investment companies in Franklin Templeton Investments; Senior Vice President, Franklin Templeton Services, LLC; and formerly, Managing Director, RSM McGladrey, Inc.; and Partner, McGladrey & Pullen, LLP. |
| *We | base the number of portfolios on each separate series of the U.S. registered investment companies within the Franklin Templeton Investments fund complex. These portfolios have a common investment adviser or affiliated investment advisers. |
| **Charles | B. Johnson and Rupert H. Johnson, Jr. are considered to be interested persons of the Trust under the federal securities laws due to their positions as officers and directors and major shareholders of Franklin Resources, Inc., which is the parent company of the Trust’s advisers and distributor. |
Note: Charles B. Johnson and Rupert H. Johnson, Jr. are brothers.
The Sarbanes-Oxley Act of 2002 and Rules adopted by the Securities and Exchange Commission require the Fund to disclose whether the Fund’s Audit Committee includes at least one member who is an audit committee financial expert within the meaning of such Act and Rules. The Fund’s Board of Directors has determined that there is at least one such financial expert on the Audit Committee and has designated Frank W.T. LaHaye as its audit committee financial expert. The Board believes that Mr. LaHaye qualifies as such an expert in view of his extensive business background and experience, including service as President and Director of McCormick Selph Associates from 1954 through 1965; Director and Chairman of Teledyne Canada Ltd. from 1966 through 1971; Director and Chairman of Quarterdeck Corporation from 1982 through 1998; and services as a Director of various other public companies including U.S. Telephone Inc. (1981-1984), Fisher Imaging Inc. (1991-1998) and Digital Transmissions Systems (1995-1999). In addition, Mr. LaHaye served from 1981 to 2000 as a Director and Chairman of Peregrine Venture Management Co., a venture capital firm, and has been a Member and Chairman of the Fund’s Audit Committee since its inception. As a result of such background and experience, the Board of Directors believes that Mr. LaHaye has acquired an understanding of generally accepted accounting principles and financial statements, the general application of such principles in connection with the accounting estimates, accruals and reserves, and analyzing and evaluating financial statements that present a breadth and level of complexity of accounting issues generally comparable to those of the Fund, as well as an understanding of internal controls and procedures for financial reporting and an understanding of audit committee functions. Mr. LaHaye is an independent Director as that term is defined under the relevant Securities and Exchange Commission Rules and Releases.
The Statement of Additional Information (SAI) includes additional information about the board members and is available, without charge, upon request. Contract owners may call 1-800/321-8563 or their insurance companies to request the SAI.
BOD-4
FRANKLIN TEMPLETON VARIABLE INSURANCE PRODUCTS TRUST
SHAREHOLDER INFORMATION
Proxy Voting Policies and Procedures
The Fund has established Proxy Voting Policies and Procedures (“Policies”) that the Fund uses to determine how to vote proxies relating to portfolio securities. Shareholders may view the Fund’s complete Policies online at franklintempleton.com. Alternatively, shareholders may request copies of the Policies free of charge by calling the Proxy Group collect at 1-954/847-2268 or by sending a written request to: Franklin Templeton Companies, LLC, 500 East Broward Boulevard, Suite 1500, Fort Lauderdale, FL 33394, Attention: Proxy Group. Copies of the Fund’s proxy voting records are also made available online at franklintempleton.com and posted on the Securities and Exchange Commission’s website at sec.gov and reflect the most recent 12-month period ended June 30.
Quarterly Statement of Investments
The Fund files a complete statement of investments with the Securities and Exchange Commission for the first and third quarters for each fiscal year on Form N-Q. Shareholders may view the filed Form N-Q by visiting the Commission’s website at sec.gov. The filed form may also be viewed and copied at the Commission’s Public Reference Room in Washington, DC. Information regarding the operations of the Public Reference Room may be obtained by calling 1-800/SEC-0330.
SI-1
ANNUAL REPORT
The Phoenix Edge Series Fund
Variable Products Fund
December 31, 2004

MESSAGE FROM THE CHAIRMAN
Dear Shareholder:

I encourage you to review the performance overview and outlook provided in this annual report for the fiscal year ended December 31, 2004, covering the variable subaccounts within The Phoenix Edge Series Fund.
As we begin a new year, the U.S. economy appears to be growing at a healthy pace. The economy grew at a 4% rate in the third quarter, and while final year-end results aren’t available as of this writing, current indicators suggest that growth was sustained. Adding to the positives, employment growth also accelerated in the fourth quarter. The markets finished the year strong, particularly the U.S. equity market which performed well in the fourth quarter following a strong post-election rally. Looking ahead at 2005, the Federal Reserve Board’s ongoing commitment to raising interest rates, combined with record oil prices and deficits, are likely to slow the pace of economic growth, posing both challenges as well as opportunities for investors in both the equity and bond markets.
No matter what the markets bring, short-term performance changes should not distract you from your long-term financial plan. Now may be an opportune time for you to review your portfolio with your financial advisor to make sure that your asset allocation remains on target for you. Keep in mind that finding the best balance of performance and protection requires discipline and diversification.1 Your particular Phoenix Edge Series Fund allocation may help in this effort.
For more information on the investment subaccounts within The Phoenix Edge Series Fund, including performance updates and portfolio characteristics, please visit PhoenixWealthManagement.com.
|
| Sincerely, |
|

|
| Philip R. McLoughlin |
| Chairman, The Phoenix Edge Series Fund |
|
| January 2005 |
| 1 | Diversification does not guarantee against a loss, and there is no guarantee that a diversified portfolio will outperform a non-diversified portfolio. |
The preceding information is the opinion of the Chairman of The Phoenix Edge Series Fund Board of Trustees. There is no guarantee that market forecasts discussed will be realized.
1
THIS PAGE INTENTIONALLY BLANK.
Table of Contents
| | |
| | | Page
|
Glossary | | 5 |
| |
Phoenix-Goodwin Money Market Series | | 8 |
| |
Notes to Financial Statements | | 14 |
| | | | |
| Not FDIC Insured | | No Bank Guarantee | | May Lose Value |
3
GLOSSARY
ADR (American Depositary Receipt)
Represents shares of foreign companies traded in U.S. dollars on U.S. exchanges that are held by a bank or a trust. Foreign companies use ADRs in order to make it easier for Americans to buy their shares.
Basis Point (bp)
One-hundredth of a percentage point (0.01%). Basis points are often used to measure changes in or differences between yields on fixed income securities, since these often change by very small amounts.
Composite Index for Phoenix-Engemann Strategic Allocation Series
A composite index made up of 60% of the S&P 500® Index, which measures stock market total return performance, and 40% of the Lehman Brothers Aggregate Bond Index, which measures bond market total return performance.
Consumer Price Index (CPI)
Measures the change in consumer prices of goods and services, including housing, electricity, food, and transportation, as determined by a monthly survey of the U.S. Bureau of Labor Statistics. Also called the cost-of-living index.
CRB Commodities Index
The Commodity Research Bureau (CRB) Commodities Index is an equal-weighted geometric average of commodity price levels relative to the base year average price.
Dow Jones Industrial AverageSM
A price-weighted average of 30 blue chip stocks. The index is calculated on a total return basis with dividends reinvested.
Duration
A measure of volatility of a fixed income security, fixed income portfolio or fixed income portion of a portfolio. It is the change in the value of the fixed income security, fixed income portfolio or portion thereof that will result from a 1% change in interest rates. Duration is stated in years. For example, a 5-year duration means the fixed income security, fixed income portfolio or portion will decrease in value by 5% if interest rates rise 1%, and increase in value by 5% if interest rates fall 1%.
Federal funds rate
The interest rate charged on overnight loans of reserves by one financial institution to another in the United States. The federal funds rate is the most sensitive indicator of the direction of interest rates since it is set daily by the market.
Federal Open Market Committee (FOMC)
A key committee in the Federal Reserve System, responsible for setting short-term monetary policy for the Federal Reserve which causes interest rates to rise or fall.
Gross domestic product (GDP)
An important measure of U.S. economic performance, GDP is the total market value of all final goods and services produced in the U.S. during any quarter or year.
IBC Money Fund Report ™
Weekly publication provides 7- and 30-day yield, asset, average maturity, portfolio composition, commentary and industry benchmark Money Fund Report Averages for more than 1,600 taxable and tax-exempt money market funds.
Inflation
Rise in the prices of goods and services resulting from increased spending relative to the supply of goods on the market.
Lehman Brothers Aggregate Bond Index
An index that measures the U.S. investment grade fixed rate bond market. The index is calculated on a total return basis.
Lipper, Inc.
A nationally recognized organization that ranks the performance of mutual funds based on total return. It ranks each fund within a universe of funds similar in portfolio characteristics and market capitalization. Rankings do not include the effect of a Fund’s sales loads, if applicable.
4
GLOSSARY
Merrill Lynch All U.S. Convertible Securities Index
A market capitalization-weighted index of domestic corporate convertible securities that are convertible to common stock only.
Merrill Lynch High Yield Master II Index
An index that measures performance of non-investment grade U.S. domestic bonds. The index is calculated on a total return basis.
Merrill Lynch 1-2.99 year Medium Quality Corporate Bond Index
Measures performance of U.S. corporate bond issues rated “BBB” and “A” by Standard and Poor’s with maturities between one and three years. The index is calculated on a total return basis.
MSCI EAFE® Index
A free float-adjusted market capitalization index that measures developed foreign market equity performance, excluding the U.S. and Canada. The index is calculated on a total return basis with gross dividends reinvested.
NAREIT Equity Index
Measures all tax-qualified real estate investment trusts listed on the New York Stock Exchange, the American Stock Exchange and the NASDAQ National Market System. The index is calculated on a total return basis with dividends reinvested.
NASDAQ Composite® Index
A market capitalization-weighted index of all issues listed in the NASDAQ (National Association of Securities Dealers Automated Quotation System) Stock Market, except for closed-end funds, convertible debentures, exchange traded funds, preferred stocks, rights, warrants, units and other derivative securities. The index is calculated on a total return basis with dividends reinvested.
NASDAQ-100 Index
A market capitalization-weighted index of the 100 largest domestic and international non-financial companies listed in the NASDAQ (National Association of Securities Dealers Automated Quotation System) Stock Market. The index is calculated on a total return basis with dividends reinvested.
New York shares (Guilder Shares)
Shares representing Dutch companies that are not permitted to trade outside of national borders.
REITs
Real estate investment trusts are typically publicly traded companies that own, develop and operate income-producing real estate such as apartments, office buildings, hotels, shopping centers and other commercial properties.
Russell 1000® Growth Index
A market capitalization-weighted index of growth-oriented stocks of the 1,000 largest companies in the Russell Universe, which comprises the 3,000 largest U.S. companies. The index is calculated on a total return basis with dividends reinvested.
Russell 1000® Value Index
A market capitalization-weighted index of value-oriented stocks of the 1,000 largest companies in the Russell Universe, which comprises the 3,000 largest U.S. companies. The index is calculated on a total return basis with dividends reinvested.
Russell 2000® Index
A market capitalization-weighted index of the 2,000 smallest companies in the Russell Universe, which comprises the 3,000 largest U.S. companies. The index is calculated on a total return basis with dividends reinvested.
Russell 2000® Growth Index
A market capitalization-weighted index of growth-oriented stocks of the smallest 2,000 companies in the Russell Universe, which comprises the 3,000 largest U.S. companies. The index is calculated on a total return basis with dividends reinvested.
5
GLOSSARY
Russell 2000® Value Index
A market capitalization-weighted index of value-oriented stocks of the smallest 2,000 companies in the Russell Universe, which comprises the 3,000 largest U.S. companies. The index is calculated on a total return basis with dividends reinvested.
Russell 2500® Value Index
A market capitalization-weighted index of value-oriented stocks of the smallest 2,500 companies in the Russell Universe, which comprises the 3,000 largest U.S. companies. The index is calculated on a total return basis with dividends reinvested.
Russell 3000® Index
A market capitalization-weighted index of the 3,000 largest U.S. companies. The index is calculated on a total return basis with dividends reinvested.
Russell Midcap® Growth Index
A market capitalization-weighted index of medium-capitalization, growth-oriented stocks of U.S. companies. The index is calculated on a total return basis with dividends reinvested.
S&P MidCap 400 /Barra Growth Index
A market capitalization-weighted index of growth-oriented mid-size capitalization U.S. companies with higher price to book ratios. The index is calculated on a total return basis with dividends reinvested.
S&P MidCap 400/Barra Value Index
A market capitalization-weighted index of value-oriented mid-size capitalization U.S. companies with lower price-to-book ratios. The index is calculated on a total return basis with dividends reinvested.
S&P 500® Index
A market capitalization-weighted index of 500 of the largest U.S. companies. The index is calculated on a total return basis with dividends reinvested.
S&P 500®/Barra Growth Index
A market capitalization-weighted index of growth-oriented, large capitalization U.S. companies with higher price-to-book ratios. The index is calculated on a total return basis with dividends reinvested.
Sector/Subsector
A particular group of stocks within the market, usually sorted by industry, that can be further broken down into subsets. For example, the technology sector can be broken down into various subsectors such as computer hardware and semiconductors.
Trailing earnings
A company’s past earnings. Often used in the context of a stock’s price/earnings ratio, usually distinguished as price-to-trailing earnings (today’s stock price divided by the most recent 12 months of earnings).
Yield curve
A line chart that shows interest rates at a specific point in time for securities of equivalent quality but with different maturities. A “normal or positive” yield curve indicates that short-term securities have a lower interest rate than long-term securities; an “inverted or negative” yield curve indicates short-term rates are exceeding long-term rates; and a “flat yield curve” means short- and long-term rates are about the same.
Indexes are unmanaged and not available for direct investment; therefore their performance does not reflect the expenses associated with the active management of an actual portfolio.
6
PHOENIX-GOODWIN MONEY MARKET SERIES
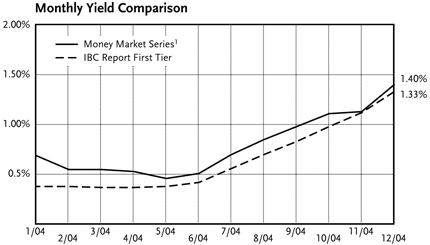
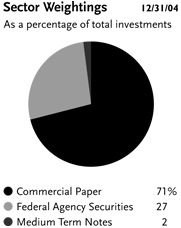
| 1 | The chart illustrates the period from January 1, 2004 to December 31, 2004. The results are not indicative of the rate of return which may be realized from an investment made in the Money Market Series today. The Money Market Series is neither insured nor guaranteed by the U.S. Government, and there can be no assurance that the Fund will be able to maintain a stable Net Asset Value at $10.00 per share. |
For information regarding the IBC Money Market Report™, see the glossary on page 4.
7
PHOENIX-GOODWIN MONEY MARKET SERIES
ABOUT YOUR SERIES EXPENSES
We believe it is important for you to understand the impact of costs on your investment. All mutual funds have operating expenses. As a shareholder of the Money Market Series, you incur ongoing costs including investment advisory fees and other expenses. This example is intended to help you understand your ongoing costs (in dollars) of investing in the series and to compare these costs with the ongoing costs of investing in other mutual funds. This example is based on an investment of $1,000 invested at the beginning of the period and held for the entire six-month period.
Actual Expenses
The first line of the accompanying table provides information about actual account values and actual expenses. You may use the information in this line, together with the amount you invested, to estimate the expenses that you paid over the period. Simply divide your account value by $1,000 (for example, an $8,600 account value divided by $1,000 = 8.6), then multiply the result by the number in the first line under the heading entitled “Expenses Paid During Period” to estimate the expenses you paid on your account during this period.
Hypothetical Example for Comparison Purposes
The second line of the accompanying table provides information about hypothetical account values and hypothetical expenses based on the series’ actual expense ratio and an assumed rate of return of 5% per year before expenses, which is not your series’ actual return. The hypothetical account values and expenses may not be used to estimate the actual ending account balance or expenses you paid for the period. You may use this information to compare the ongoing costs of investing in your series and other funds. To do so, compare these 5% hypothetical examples with the 5% hypothetical examples that appear in the shareholder reports of the other funds.
The series’ expense ratio does not reflect additional fees and expenses associated with the annuity or life insurance policy through which you invest. The second line of the accompanying table is useful in comparing ongoing costs only, and will not help you determine the relative total costs of owning different funds. The calculations assume no shares were bought or sold during the period. Your actual costs may have been higher or lower, depending on the amount of your investment and the timing of any purchases or redemptions.
| | | | | | | | | |
Money Market Series
| | Beginning
Account Value
June 30, 2004
| | Ending
Account Value
December 31, 2004
| | Expenses Paid
During Period*
|
Actual | | $ | 1,000.00 | | $ | 1,005.20 | | $ | 3.28 |
Hypothetical (5% return before expenses) | | | 1,000.00 | | | 1,021.83 | | | 3.31 |
| * | Expenses are equal to the series’ annualized expense ratio of 0.65%, which includes waived fees and reimbursed expenses, if applicable, multiplied by the average account value over the period, multiplied by the number of days in the most recent fiscal half-year, then divided by 366 to reflect the one-half year period. |
Actual return as calculated in the above table is based on the series’ return for the past six months. While required to be presented in this format, it is not the series’ actual return for the year ended December 31, 2004. The actual return at NAV for the fiscal year ended was 0.79%. Utilizing this 12 month return yields an ending account value at December 31, 2004 of $1,007.90.
You can find more information about the series’ expenses in the Financial Statements section that follows. For additional information on operating expenses and other shareholder costs, please refer to the prospectus.
8
PHOENIX-GOODWIN MONEY MARKET SERIES
SCHEDULE OF INVESTMENTS
DECEMBER 31, 2004
| | | | | | | | | | | | |
FACE VALUE (000)
| | DESCRIPTION
| | | | INTEREST
RATE
| | | MATURITY
DATE
| | VALUE
|
| FEDERAL AGENCY SECURITIES—24.6% | | | | | | | | | | |
| $2,500 | | Fannie Mae (d) | | | | 1.75 | % | | 1/28/05 | | $ | 2,500,000 |
| 2,000 | | FFCB (c) | | | | 1.30 | | | 2/1/05 | | | 1,999,752 |
| 2,500 | | Fannie Mae (d) | | | | 1.80 | | | 2/4/05 | | | 2,500,000 |
| 2,500 | | FHLB (d) | | | | 1.47 | | | 2/4/05 | | | 2,500,000 |
| 3,500 | | FHLB (c) | | | | 1.88 | | | 2/15/05 | | | 3,502,581 |
| 2,500 | | FHLB (d) | | | | 2.02 | | | 2/18/05 | | | 2,500,000 |
| 2,500 | | FHLB | | | | 1.30 | | | 2/28/05 | | | 2,500,000 |
| 2,000 | | FFCB (c) | | | | 1.30 | | | 3/1/05 | | | 2,000,000 |
| 2,500 | | FHLB (d) | | | | 1.40 | | | 3/8/05 | | | 2,500,000 |
| 2,500 | | FHLB (d) | | | | 1.50 | | | 4/14/05 | | | 2,500,000 |
| 3,500 | | Fannie Mae | | | | 1.36 | | | 5/3/05 | | | 3,500,000 |
| 2,500 | | FHLMC | | | | 7.00 | | | 7/15/05 | | | 2,562,642 |
| 2,500 | | FHLB | | | | 2.13 | | | 9/1/05 | | | 2,498,259 |
| 2,500 | | FHLMC | | | | 2.88 | | | 9/15/05 | | | 2,501,651 |
| 2,500 | | FHLB (c) | | | | 2.30 | | | 9/16/05 | | | 2,494,917 |
| | | | | | | | | | | |
|
|
| TOTAL FEDERAL AGENCY SECURITIES | | | | | | | | | | 38,559,802 |
| | | | | | | | | | | |
|
|
| | | | | |
| | | | | | | | | | RESET
DATE
| | |
| FEDERAL AGENCY SECURITIES—VARIABLE(b)—2.6% | | | | | | | | | | |
| 98 | | SBA (Final Maturity 1/25/21) | | | | 2.50 | | | 1/1/05 | | | 98,478 |
| 563 | | SBA (Final Maturity 10/25/22) | | | | 2.25 | | | 1/1/05 | | | 563,233 |
| 932 | | SBA (Final Maturity 11/25/21) | | | | 2.38 | | | 1/1/05 | | | 931,253 |
| 317 | | SBA (Final Maturity 2/25/23) | | | | 2.25 | | | 1/1/05 | | | 317,164 |
| 338 | | SBA (Final Maturity 2/25/23) | | | | 2.25 | | | 1/1/05 | | | 337,780 |
| 660 | | SBA (Final Maturity 3/25/24) | | | | 2.38 | | | 1/1/05 | | | 660,284 |
| 134 | | SBA (Final Maturity 5/25/21) | | | | 2.25 | | | 1/1/05 | | | 133,928 |
| 1,034 | | SBA (Final Maturity 9/25/23) | | | | 2.13 | | | 1/1/05 | | | 1,033,126 |
| | | | | | | | | | | |
|
|
| TOTAL FEDERAL AGENCY SECURITIES—VARIABLE | | | | | | | | | | 4,075,246 |
| | | | | | | | | | | |
|
|
| | | | | |
| | | | | STANDARD
& POOR’S
RATING
(Unaudited)
| | | | | MATURITY
DATE
| | |
| COMMERCIAL PAPER—71.1% | | | | | | | | | | |
| 640 | | Govco, Inc. | | A-1+ | | 2.17 | | | 1/3/05 | | | 639,923 |
| 2,500 | | UBS Finance Delaware LLC | | A-1+ | | 2.39 | | | 1/4/05 | | | 2,499,502 |
| 1,200 | | Golden Peanut Co. LLC | | A-1 | | 2.15 | | | 1/5/05 | | | 1,199,713 |
| 2,565 | | Private Export Funding Corp. | | A-1+ | | 1.90 | | | 1/6/05 | | | 2,564,323 |
| 3,500 | | Bristol-Myers Squibb Co. | | A-1 | | 2.29 | | | 1/7/05 | | | 3,498,664 |
| 2,535 | | Bristol-Myers Squibb Co. | | A-1 | | 2.32 | | | 1/10/05 | | | 2,533,530 |
| 2,000 | | George Street Finance LLC | | A-1+ | | 2.38 | | | 1/10/05 | | | 1,998,810 |
| 3,000 | | Preferred Receivables Funding Corp. | | A-1 | | 2.25 | | | 1/12/05 | | | 2,997,937 |
| 840 | | Ranger Funding Co. LLC | | A-1+ | | 2.28 | | | 1/12/05 | | | 839,415 |
| 1,921 | | UBS Financial Delaware LLC | | A-1+ | | 2.26 | | | 1/13/05 | | | 1,919,553 |
| 2,244 | | Preferred Receivables Funding Corp. | | A-1 | | 2.28 | | | 1/14/05 | | | 2,242,152 |
| 1,215 | | Ranger Funding Co. LLC | | A-1+ | | 2.25 | | | 1/14/05 | | | 1,214,013 |
| 585 | | Danske Corp. | | A-1+ | | 2.33 | | | 1/18/05 | | | 584,356 |
| 2,500 | | Pfizer, Inc. | | A-1+ | | 2.28 | | | 1/18/05 | | | 2,497,308 |
| 2,500 | | Ranger Funding Co. LLC | | A-1+ | | 2.35 | | | 1/18/05 | | | 2,497,226 |
| 2,000 | | Harley-Davidson Funding | | A-1 | | 2.25 | | | 1/19/05 | | | 1,997,750 |
| 2,100 | | Cargill, Inc. | | A-1 | | 2.29 | | | 1/20/05 | | | 2,097,462 |
| 320 | | Preferred Receivables Funding Corp. | | A-1 | | 2.31 | | | 1/20/05 | | | 319,610 |
| 3,380 | | UBS Finance Delaware LLC | | A-1+ | | 2.25 | | | 1/20/05 | | | 3,375,986 |
| 2,600 | | CAFCO LLC | | A-1+ | | 2.22 | | | 1/21/05 | | | 2,596,793 |
| 2,505 | | CAFCO LLC | | A-1+ | | 2.32 | | | 1/24/05 | | | 2,501,287 |
| 1,025 | | Pfizer, Inc. | | A-1+ | | 2.27 | | | 1/24/05 | | | 1,023,513 |
| 1,200 | | Ranger Funding Co. LLC | | A-1+ | | 2.33 | | | 1/24/05 | | | 1,198,214 |
| 1,960 | | ABN AMRO NA Finance, Inc. | | A-1 | | 2.34 | | | 1/31/05 | | | 1,956,178 |
| 2,785 | | Coca-Cola Enterprises, Inc. | | A-1 | | 2.23 | | | 1/31/05 | | | 2,779,825 |
| 1,575 | | CAFCO LLC | | A-1+ | | 2.34 | | | 2/1/05 | | | 1,571,826 |
| 2,500 | | Golden Peanut Co. LLC | | A-1 | | 2.29 | | | 2/3/05 | | | 2,494,752 |
See Notes to Financial Statements
9
PHOENIX-GOODWIN MONEY MARKET SERIES
| | | | | | | | | | | | | | |
FACE
VALUE
(000)
| | DESCRIPTION
| | STANDARD
& POOR’S
RATING
(Unaudited)
| | | INTEREST
RATE
| | | MATURITY
DATE
| | VALUE
| |
| COMMERCIAL PAPER—continued | | | | | | | | | | | | |
| $3,650 | | ABN AMRO NA Finance, Inc. | | A-1 | + | | 2.32 | % | | 2/10/05 | | $ | 3,640,591 | |
| 2,610 | | George Street Finance LLC | | A-1 | + | | 2.25 | | | 2/10/05 | | | 2,603,475 | |
| 3,050 | | George Street Finance LLC | | A-1 | + | | 2.31 | | | 2/10/05 | | | 3,042,172 | |
| 3,500 | | Pfizer, Inc. | | A-1 | + | | 2.33 | | | 2/14/05 | | | 3,490,033 | |
| 1,755 | | Procter & Gamble Co. | | A-1 | + | | 2.33 | | | 2/14/05 | | | 1,750,002 | |
| 2,000 | | Ranger Funding Co. LLC | | A-1 | + | | 2.40 | | | 2/14/05 | | | 1,994,133 | |
| 2,760 | | Harley-Davidson Funding | | A-1 | + | | 2.26 | | | 2/15/05 | | | 2,752,203 | |
| 3,000 | | Govco Inc. | | A-1 | + | | 2.36 | | | 2/17/05 | | | 2,990,757 | |
| 1,500 | | Golden Peanut Co. LLC | | A-1 | | | 2.36 | | | 2/22/05 | | | 1,494,887 | |
| 4,740 | | NetJets, Inc. | | A-1 | + | | 2.35 | | | 2/24/05 | | | 4,723,291 | |
| 3,120 | | NetJets, Inc. | | A-1 | + | | 2.34 | | | 2/25/05 | | | 3,108,846 | |
| 920 | | Golden Peanut Co. LLC | | A-1 | | | 2.38 | | | 2/28/05 | | | 916,472 | |
| 4,720 | | Clipper Receivables Co. | | A-1 | | | 2.35 | | | 3/3/05 | | | 4,701,205 | |
| 1,565 | | Private Export Funding Corp. | | A-1 | + | | 2.25 | | | 3/9/05 | | | 1,558,447 | |
| 1,900 | | General Electric Capital Corp. | | A-1 | + | | 2.38 | | | 3/11/05 | | | 1,891,333 | |
| 2,400 | | General Electric Capital Corp. | | A-1 | + | | 2.39 | | | 3/11/05 | | | 2,389,006 | |
| 3,500 | | Govco, Inc. | | A-1 | + | | 2.42 | | | 3/14/05 | | | 3,483,060 | |
| 3,000 | | Private Export Funding Corp. | | A-1 | + | | 2.30 | | | 3/14/05 | | | 2,986,200 | |
| 3,500 | | General Electric Capital Corp. | | A-1 | + | | 2.43 | | | 3/15/05 | | | 3,482,754 | |
| 2,515 | | Danske Corp. | | A-1 | + | | 2.44 | | | 3/23/05 | | | 2,501,193 | |
| 2,510 | | Danske Corp. | | A-1 | + | | 2.45 | | | 3/23/05 | | | 2,496,164 | |
| | | | | | | | | | | | |
|
|
|
| TOTAL COMMERCIAL PAPER | | | | | | | | | | | 111,635,845 | |
| | | | | | | | | | | | |
|
|
|
| MEDIUM TERM NOTES(c)—1.8% | | | | | | | | | | | | |
| 2,300 | | Bank of America Corp. (b) | | AA- | | | 2.30 | | | 2/16/05 | | | 2,300,000 | |
| 500 | | Bank of America Corp. | | AA- | | | 7.63 | | | 4/15/05 | | | 508,925 | |
| | | | | | | | | | | | |
|
|
|
| TOTAL MEDIUM TERM NOTES | | | | | | | | | | | 2,808,925 | |
| | | | | | | | | | | | |
|
|
|
| TOTAL INVESTMENTS—100.1% | | | | | | | | | | | | |
| (Identified cost $ 157,079,818) | | | | | | | | | | | 157,079,818 | (a) |
| Other assets and liabilities, net—(0.1)% | | | | | | | | | | | (84,248 | ) |
| | | | | | | | | | | | |
|
|
|
| NET ASSETS—100.0% | | | | | | | | | | $ | 156,995,570 | |
| | | | | | | | | | | | |
|
|
|
| (a) | Federal Income Tax Information: At December 31, 2004, the aggregate cost of securities for federal income tax purposes was the same for book and tax purposes. |
| (b) | Variable or step coupon security; interest rate shown reflects the rate currently in effect. |
| (c) | The interest rate shown is the coupon rate. |
| (d) | Callable. The maturity date shown is the call date. |
See Notes to Financial Statements
10
PHOENIX-GOODWIN MONEY MARKET SERIES
STATEMENT OF ASSETS AND LIABILITIES
December 31, 2004
| | | |
Assets | | | |
Investment securities at value (identified cost $ 157,079,818) | | $ | 157,079,818 |
Cash | | | 3,153 |
Receivables | | | |
Fund shares sold | | | 642,198 |
Interest | | | 276,186 |
Prepaid expenses | | | 3,545 |
| | |
|
|
Total assets | | | 158,004,900 |
| | |
|
|
Liabilities | | | |
Payables | | | |
Fund shares repurchased | | | 686,938 |
Investment securities purchased | | | 186,417 |
Investment advisory fee | | | 53,075 |
Financial agent fee | | | 11,632 |
Administration fee | | | 10,615 |
Trustees’ fee | | | 147 |
Accrued expenses | | | 60,506 |
| | |
|
|
Total liabilities | | | 1,009,330 |
| | |
|
|
Net Assets | | $ | 156,995,570 |
| | |
|
|
Net Assets Consist of: | | | |
Capital paid in on shares of beneficial interest | | $ | 156,995,570 |
| | |
|
|
Net Assets | | $ | 156,995,570 |
| | |
|
|
Shares of beneficial interest outstanding, $1 par value, unlimited authorization | | | 15,699,621 |
| | |
|
|
Net asset value and offering price per share | | $ | 10.00 |
| | |
|
|
STATEMENT OF OPERATIONS
Year Ended December 31, 2004
| | | | |
Investment Income | | | | |
Interest | | $ | 2,574,103 | |
| | |
|
|
|
Total investment income | | | 2,574,103 | |
| | |
|
|
|
Expenses | | | | |
Investment advisory fee | | | 731,269 | |
Financial agent fee | | | 144,170 | |
Administration | | | 146,254 | |
Printing | | | 52,290 | |
Custodian | | | 35,403 | |
Professional | | | 28,102 | |
Trustees | | | 9,467 | |
Miscellaneous | | | 19,110 | |
| | |
|
|
|
Total expenses | | | 1,166,065 | |
Custodian fees paid indirectly | | | (857 | ) |
| | |
|
|
|
Net expenses | | | 1,165,208 | |
| | |
|
|
|
Net investment income | | $ | 1,408,895 | |
| | |
|
|
|
See Notes to Financial Statements
11
PHOENIX-GOODWIN MONEY MARKET SERIES
STATEMENT OF CHANGES IN NET ASSETS
| | | | | | | | |
| | | Year Ended
12/31/04
| | | Year Ended
12/31/03
| |
From Operations | | | | | | | | |
Net investment income (loss) | | $ | 1,408,895 | | | $ | 1,554,957 | |
| | |
|
|
| |
|
|
|
Increase (decrease) in net assets resulting from operations | | | 1,408,895 | | | | 1,554,957 | |
| | |
|
|
| |
|
|
|
From Distributions to Shareholders | | | | | | | | |
Net investment income . | | | (1,408,895 | ) | | | (1,554,957 | ) |
| | |
|
|
| |
|
|
|
Decrease in net assets from distributions to shareholders | | | (1,408,895 | ) | | | (1,554,957 | ) |
| | |
|
|
| |
|
|
|
From Share Transactions | | | | | | | | |
Proceeds from sales of shares (24,383,055 and 44,435,831 shares, respectively) | | | 243,830,555 | | | | 444,358,309 | |
Net asset value of shares issued from reinvestment of distributions (140,890 and 155,502 shares, respectively) | | | 1,408,895 | | | | 1,554,957 | |
Cost of shares repurchased (29,088,791 and 49,902,770 shares, respectively) | | | (290,887,973 | ) | | | (499,027,882 | ) |
| | |
|
|
| |
|
|
|
Increase (decrease) in net assets from share transactions | | | (45,648,523 | ) | | | (53,114,616 | ) |
| | |
|
|
| |
|
|
|
Net increase (decrease) in net assets | | | (45,648,523 | ) | | | (53,114,616 | ) |
Net Assets | | | | | | | | |
Beginning of period | | | 202,644,093 | | | | 255,758,709 | |
| | |
|
|
| |
|
|
|
End of period | | $ | 156,995,570 | | | $ | 202,644,093 | |
| | |
|
|
| |
|
|
|
FINANCIAL HIGHLIGHTS
(Selected data for a share outstanding throughout the indicated period)
| | | | | | | | | | | | | | | | | | | | |
| | | Year Ended December 31,
| |
| | | 2004
| | | 2003
| | | 2002
| | | 2001
| | | 2000
| |
Net asset value, beginning of period | | $ | 10.00 | | | $ | 10.00 | | | $ | 10.00 | | | $ | 10.00 | | | $ | 10.00 | |
Income from investment operations | | | | | | | | | | | | | | | | | | | | |
Net investment income | | | 0.08 | | | | 0.07 | | | | 0.14 | | | | 0.38 | | | | 0.59 | |
Net realized gain | | | — | | | | — | | | | — | | | | — | (1) | | | — | |
| | |
|
|
| |
|
|
| |
|
|
| |
|
|
| |
|
|
|
Total from investment operations | | | 0.08 | | | | 0.07 | | | | 0.14 | | | | 0.38 | | | | 0.59 | |
| | |
|
|
| |
|
|
| |
|
|
| |
|
|
| |
|
|
|
Less distributions | | | | | | | | | | | | | | | | | | | | |
Dividends from net investment income | | | (0.08 | ) | | | (0.07 | ) | | | (0.14 | ) | | | (0.38 | ) | | | (0.59 | ) |
Distributions from net realized gains | | | — | | | | — | | | | — | | | | — | (1) | | | — | |
| | |
|
|
| |
|
|
| |
|
|
| |
|
|
| |
|
|
|
Total distributions | | | (0.08 | ) | | | (0.07 | ) | | | (0.14 | ) | | | (0.38 | ) | | | (0.59 | ) |
| | |
|
|
| |
|
|
| |
|
|
| |
|
|
| |
|
|
|
Net asset value, end of period | | $ | 10.00 | | | $ | 10.00 | | | $ | 10.00 | | | $ | 10.00 | | | $ | 10.00 | |
| | |
|
|
| |
|
|
| |
|
|
| |
|
|
| |
|
|
|
Total return | | | 0.79 | % | | | 0.68 | % | | | 1.42 | % | | | 3.82 | % | | | 6.03 | % |
Ratios/supplemental data: | | | | | | | | | | | | | | | | | | | | |
Net assets, end of period (thousands) | | $ | 156,996 | | | $ | 202,644 | | | $ | 255,759 | | | $ | 260,629 | | | $ | 179,968 | |
Ratio to average net assets of: | | | | | | | | | | | | | | | | | | | | |
Net operating expenses | | | 0.64 | % | | | 0.59 | % | | | 0.56 | % | | | 0.55 | % | | | 0.55 | % |
Gross operating expenses | | | 0.64 | % | | | 0.59 | % | | | 0.56 | % | | | 0.60 | % | | | 0.58 | % |
Net investment income | | | 0.77 | % | | | 0.69 | % | | | 1.41 | % | | | 3.63 | % | | | 5.83 | % |
| (1) | Amount is less than $0.01. |
See Notes to Financial Statements
12
THE PHOENIX EDGE SERIES FUND
NOTES TO FINANCIAL STATEMENTS
December 31, 2004
Note 1—Organization
The Phoenix Edge Series Fund (the “Fund”) is organized as a Massachusetts business trust and is registered under the Investment Company Act of 1940, as amended, as an open-end management investment company. The Fund is organized with series which are available only to the subaccounts of the Phoenix Life Variable Accumulation Account, Phoenix Life Variable Universal Life Account, PHL Variable Accumulation Account, PHLVIC Variable Universal Life Account, Phoenix Life and Annuity Variable Universal Life Account, and Phoenix Life Separate Accounts C and D, and Home Life Separate Account B.
The Fund is comprised of 26 series (each a “series”) each having a distinct investment objective as outlined below:
| | |
Fund Name
| | Investment Objective
|
Phoenix-Aberdeen International Series (“Aberdeen International”) | | High total return consistent with reasonable risk. |
| |
Phoenix-AIM Growth Series (“AIM Growth”) (Formerly Phoenix-MFS-Investors Growth Stock Series) | | Long-term growth of capital and future income rather than current income. |
| |
Phoenix-Alger Small-Cap Growth Series (“Alger Small-Cap Growth”) (Formerly Phoenix-State Street Research Small-Cap Growth) | | Long-term capital growth. |
| |
Phoenix-Alliance/Bernstein Enhanced Index Series (“Alliance/Bernstein Enhanced Index”) | | High total return. |
| |
Phoenix-Duff & Phelps Real Estate Securities Series (“Duff & Phelps Real Estate Securities”) | | Capital appreciation and income with approximately equal emphasis. |
| |
Phoenix-Engemann Capital Growth Series (“Engemann Capital Growth”) | | Intermediate and long-term capital appreciation with income as a secondary consideration. |
| |
Phoenix-Engemann Growth and Income Series (“Engemann Growth and Income”) (Formerly Phoenix-Oakhurst Growth and Income) | | Dividend growth, current income and capital appreciation. |
| |
Phoenix-Engemann Small-Cap Growth Series (“Engemann Small-Cap Growth”) (Formerly Engemann Small & Mid-Cap Growth) | | Long-term growth of capital. |
| |
Phoenix-Engemann Strategic Allocation Series (”Engemann Strategic Allocation”) (Formerly Phoenix-Oakhurst Srategic Allocation) | | High total return over an extended period of time consistent with prudent investment risk. |
| |
Phoenix-Engemann Value Equity Series (“Engemann Value Equity”) (Formerly Phoenix-Oakhurst Value Equity) | | Long-term capital appreciation with current income as a secondary consideration. |
| |
Phoenix-Goodwin Money Market Series (“Goodwin Money Market”) | | As high a level of current income as is consistent with the preservation of capital and maintenance of liquidity. |
| |
Phoenix-Goodwin Multi-Sector Fixed Income Series (“Goodwin Multi-Sector Fixed Income”) | | Long-term total return. |
| |
Phoenix-Goodwin Multi-Sector Short Term Bond Series (“Goodwin Multi-Sector Short Term Bond”) | | To provide high current income while attempting to limit changes in the series’ net asset value per share caused by interest rate changes. |
| |
Phoenix-Kayne Rising Dividends Series (“Kayne Rising Dividends”) | | Long-term capital appreciation with dividend income as a secondary consideration. |
| |
Phoenix-Kayne Small-Cap Quality Value Series (“Kayne Small-Cap Quality Value”) | | Long-term capital appreciation with dividend income as a secondary consideration. |
| |
Phoenix-Lazard International Equity Select Series (“Lazard International Equity Select”) | | Long-term capital appreciation. |
| |
Phoenix-Lazard Small-Cap Value Series (“Lazard Small-Cap Value”) | | Long-term capital appreciation. |
| |
Phoenix-Lord Abbett Bond-Debenture Series (“Lord Abbett Bond-Debenture”) | | High current income and long-term capital appreciation to produce a high total return. |
| |
Phoenix-Lord Abbett Large-Cap Value Series (“Lord Abbett Large-Cap Value”) | | Capital appreciation with income as a secondary consideration. |
| |
Phoenix-Lord Abbett Mid-Cap Value Series (“Lord Abbett Mid-Cap Value”) | | Capital appreciation. |
| |
Phoenix-Northern Dow 30 Series (“Northern Dow 30”) | | Track the total return of the Dow Jones Industrial Average(SM) before series expenses. |
13
THE PHOENIX EDGE SERIES FUND
NOTES TO FINANCIAL STATEMENTS (Continued)
December 31, 2004
| | |
Fund Name
| | Investment Objective
|
Phoenix-Northern Nasdaq-100 Index® Series (“Northern Nasdaq-100 Index®”) | | Track the total return of the NASDAQ-100 Index® before series expenses. |
| |
Phoenix-Sanford Bernstein Mid-Cap Value Series (“Sanford Bernstein Mid-Cap Value”) | | Long-term capital appreciation with current income as a secondary consideration. |
| |
Phoenix-Sanford Bernstein Small-Cap Value Series (“Sanford Bernstein Small-Cap Value”) | | Long-term capital appreciation by investing primarily in small-capitalization stocks that appear to be undervalued with current income as a secondary consideration. |
| |
Phoenix-Seneca Mid-Cap Growth Series (“Seneca Mid-Cap Growth”) | | Capital appreciation. |
| |
Phoenix-Seneca Strategic Theme Series (“Seneca Strategic Theme”) | | Long-term capital appreciation. |
Note 2—Significant Accounting Policies
The following is a summary of significant accounting policies consistently followed by the Fund in the preparation of its financial statements. The preparation of financial statements in conformity with accounting principles generally accepted in the United States of America requires management to make estimates and assumptions that affect the reported amounts of assets and liabilities and disclosure of contingent assets and liabilities at the date of the financial statements and the reported amounts of increases and decreases in net assets from operations during the reporting period. Actual results could differ from those estimates.
Equity securities are valued at the official closing price (typically last sale) on the exchange on which the securities are primarily traded, or if no closing price is available, at the last bid price.
Debt securities are valued on the basis of broker quotations or valuations provided by a pricing service, which in determining value utilizes information with respect to recent sales, market transactions in comparable securities, quotations from dealers, and various relationships between securities.
As required, some securities and assets are valued at fair value as determined in good faith by or under the direction of the Trustees.
Certain foreign common stocks may be fair valued in cases where closing prices are not readily available or are deemed not reflective of readily available market prices. For example, significant events (such as movement in the U.S. securities market, or other regional and local developments) may occur between the time that foreign markets close (where the security is principally traded) and the time that the series calculates its net asset value (generally, the close of the NYSE) that may impact the value of securities traded in these foreign markets. In these cases, information from an external vendor may be utilized to adjust closing market prices of certain foreign common stocks to reflect their fair value. Because the frequency of significant events is not predictable, fair valuation of certain foreign common stocks may occur on a frequent basis.
Certain securities held by the Fund were valued on the basis of a price provided by a principal market maker. The prices provided by the principal market makers may differ from the value that would be realized if the securities were sold. At December 31, 2004, the total value of these securities represented approximately the following percentage of net assets:
| | | |
Series
| | Percentage of Net Assets
| |
Goodwin Multi-Sector Short Term Bond | | 5.5 | % |
Short-term investments having a remaining maturity of 60 days or less are valued at amortized cost, which approximates market.
Goodwin Money Market uses the amortized cost method of security valuation absent extraordinary or unusual market conditions. In the opinion of the Trustees, this represents the fair value of the securities. The Trustees monitor the deviations between the net asset value per share as determined by using available market quotations and its net asset value per share using amortized cost. If the deviation exceeds 1/2 of 1%, the Board of Trustees will consider what action, if any, should be initiated to provide fair valuation. Using this method, the series attempts to maintain a constant net asset value of $10 per share.
| B. | Security Transactions and Related Income |
Security transactions are recorded on the trade date. Dividend income is recorded on the ex-dividend date, or in the case of certain foreign securities, as soon as the series is notified. Interest income is recorded on the accrual basis. Each series amortizes premiums and accretes discounts using the effective interest method. Realized gains and losses are determined on the identified cost basis.
With respect to Duff & Phelps Real Estate Securities, dividend income is recorded based on the income included in distributions received from the REIT investments using published REIT reclassifications including some management estimates when actuals are not available. Distributions received in excess of this estimated amount are recorded as a reduction of the cost of investments or reclassified to capital gains. The actual amounts of income, return of capital, and capital gains are only determined by each REIT after its fiscal year-end, and may differ from the estimated amounts.
14
THE PHOENIX EDGE SERIES FUND
NOTES TO FINANCIAL STATEMENTS (Continued)
December 31, 2004
Each series is treated as a separate taxable entity. It is the policy of each series to comply with the requirements of the Internal Revenue Code (the “Code”) and to distribute substantially all of its taxable income to its shareholders. Therefore, no provision for federal income taxes or excise taxes has been made.
Certain series may be subject to foreign taxes on income, gains on investments or currency repatriation, a portion of which may be recoverable. The series will accrue such taxes and recoveries as applicable based upon their current interpretations of the tax rules and regulations that exist in the markets in which they invest.
| E. | Distributions to Shareholders |
Distributions are recorded by each series on the ex-dividend date. Income and capital gain distributions are determined in accordance with income tax regulations, which may differ from accounting principles generally accepted in the United States of America. These differences may include the treatment of non-taxable dividends, market premium and discount, non-deductible expenses, expiring capital loss carryovers, foreign currency gain or loss, gain or loss on futures contracts, partnerships, operating losses and losses deferred due to wash sales. Permanent book and tax basis differences relating to shareholder distributions will result in reclassifications to capital paid in on shares of beneficial interest.
| F. | Foreign Currency Translation |
Foreign securities and other assets and liabilities are valued using the foreign currency exchange rate effective at the end of the reporting period. Cost of investments is translated at the currency exchange rate effective at the trade date. The gain or loss resulting from a change in currency exchange rates between the trade and settlement dates of a portfolio transaction is treated as a gain or loss on foreign currency. Likewise, the gain or loss resulting from a change in currency exchange rates between the date income is accrued and paid is treated as a gain or loss on foreign currency. The series’ does not isolate that portion of the results of operations arising from changes in exchange rates and that portion arising from changes in the market prices of securities.
| G. | Forward Currency Contracts |
Certain series may enter into forward currency contracts in conjunction with the planned purchase or sale of foreign denominated securities in order to hedge the U.S. dollar cost or proceeds. Forward currency contracts involve, to varying degrees, elements of market risk in excess of the amount recognized in the Statements of Assets and Liabilities. Risks arise from the possible movements in foreign exchange rates or if a counterparty does not perform under the contract.
A forward currency contract involves an obligation to purchase or sell a specific currency at a future date, which may be any number of days from the date of the contract agreed upon by the parties, at a price set at the time of the contract. These contracts are traded directly between currency traders and their customers. The contract is marked-to-market daily and the change in market value is recorded by each series as unrealized gain or loss. When the contract is closed or offset with the same counterparty, the series records a realized gain or loss equal to the change in the value of the contract when it was opened and the value at the time it was closed or offset.
A futures contract is an agreement between two parties to buy and sell a security at a set price on future date. Certain series may enter into financial futures contracts as a hedge against anticipated changes in the market value of their portfolio securities. Upon entering into a futures contract, the series is required to pledge to the broker an amount of cash and/or securities equal to the “initial margin” requirements of the futures exchange on which the contract is traded. Pursuant to the contract, the series agrees to receive from or pay to the broker an amount of cash equal to the daily fluctuation in value of the contract. Such receipts or payments are known as variation margin and are recorded by the series as unrealized gains or losses. When the contract is closed, the series records a realized gain or loss equal to the difference between the value of the contract at the time it was opened and the value at the time it was closed. The potential risk to the series is that the change in value of the futures contract may not correspond to the change in value of the hedged instruments.
At December 31, 2004, the following series had entered into futures contracts as follows:
| | | | | | | | | | | | | |
| | | Expiration
Date
| | Number
of
Contracts
| | Value of
Contracts
when
Opened
| | Market
Value of
Contracts
| | Net
Unrealized
Appreciation
(Depreciation)
|
Northern Dow 30 | | | | | | | | | | | | | |
Dow Jones Industrial Average Index | | March ’05 | | 4 | | $ | 418,040 | | $ | 430,720 | | $ | 12,680 |
Northern Nasdaq-100 Index® | | | | | | | | | | | | | |
Nasdaq-100 Index | | March ’05 | | 17 | | | 550,390 | | | 553,690 | | | 3,300 |
Expenses incurred by the Fund with respect to any two or more series are allocated in proportion to the net assets of each series, except where allocation of direct expense to each series or an alternative allocation method can be more appropriately made.
15
THE PHOENIX EDGE SERIES FUND
NOTES TO FINANCIAL STATEMENTS (Continued)
December 31, 2004
| J. | When-Issued and Delayed Delivery Transactions |
Each series may engage in when-issued or delayed delivery transactions. Each series records when-issued and delayed delivery securities on the trade date. Each series maintains collateral for the securities purchased. Securities purchased on a when-issued or delayed delivery basis begin earning interest on the settlement date.
The series invests in securities that represent an interest in a diversified portfolio (the “basket”) of debt instruments (the underlying securities). Under the term of the baskets, the series has direct ownership in each underlying security equal to its pro rata interest in the basket. In the event of default of any underlying security, the notional amount on which interest is earned is reduced by the par amount of the defaulted security, and the pro rata interest of such security is distributed to the series.
Debt index securities are comprised of a basket of credit default swaps referencing a diversified pool of high yield or emerging markets debt instruments. Certain baskets may be purchased on a funded or unfunded basis such that the series receives interest payments based upon the notional amount or par amount of the basket. In connection with these investments collateral may be set aside by the series’ custodian. In the event of default of any of the underlying notional securities within the unfunded basket, the series will be required to pay the counterparty an amount equal to its pro rata share of the notional amount of the defaulted security and similarly the series will then receive its pro rata interest of the defaulted security or equivalent cash amount. In a funded transaction, in the event of default of any par securities in the funded basket, the series would be required to receive its pro rata interest of the defaulted security or equivalent cash amount.
A repurchase agreement is a transaction where a series acquires a security for cash and obtains a simultaneous commitment from the seller to repurchase the security at an agreed upon price and date. Each series, through its custodian, takes possession of securities collateralizing the repurchase agreement. The collateral is marked-to-market daily to ensure that the market value of the underlying assets remains sufficient to protect the series in the event of default by the seller. If the seller defaults and the value of the collateral declines, or if the seller enters insolvency proceedings, realization of collateral may be delayed or limited.
Certain series may invest in swap agreements. A swap is an agreement to exchange the return generated by one instrument for the return generated by another instrument. A series may enter into interest rate, foreign currency, total return, or credit default swaps. Interest rate and foreign currency swaps involve the exchange by the series with another party of their respective commitments to pay or receive interest or foreign currency, (e.g. an exchange of floating rate payments for fixed rate payments with respect to a notional amount of principal.)
Total return swap agreements involve commitments to pay interest in exchange for a market linked index, based on the notional amount. To the extent the total return of the security or index involved in the transaction exceeds or falls short of the set interest obligation, the series will receive a payment or make a payment to the counterparty.
Credit default swaps involve the payment of amounts based on a specified rate multiplied by a notional amount as well as upon an event of default. In connection with these agreements securities may be set aside as collateral by the series custodian. Swaps are marked-to-market daily based upon quotations from market makers and the change, if any, is recorded as an unrealized gain or loss in the Statement of Operations.
Entering into these agreements involves, to varying degrees, elements of credit and market risk in excess of the amounts recognized on the Statement of Assets and Liabilities. Such risks involve the possibility that there will be no liquid market for these agreements, that the counterparty to the agreement may default on its obligation to perform and that there may be unfavorable changes in the fluctuation of interest and/or exchange rates.
As a result of a recent FASB (Financial Accounting Standards Board) Emerging Issues Task Force consensus and subsequent related SEC staff guidance, certain series have reclassified periodic payments made under high yield debt instruments, previously included within interest income, as a component of realized gain (loss) in the statement of operations. For consistency, similar reclassifications have been made to amounts appearing in the prior year’s statement of changes in net assets and the per share amounts in prior year financial highlights. Prior year net investment income ratios in the financial highlights have also been modified accordingly.
Within Goodwin Multi-Sector Fixed Income this reclassification increased net investment income and decreased net realized gains by $109,990 for the period ended December 31, 2003, but had no effect on the series net asset value, either in total or per share, or on its total increase (decrease) in net assets from operations during any period.
Within Engemann Strategic Allocation this reclassification increased net investment income and decreased net realized gains by $4,649 for the period ended December 31, 2003, but had no effect on the series net asset value, either in total or per share, or on its total increase (decrease) in net assets from operations during any period.
| N. | Foreign Security Country Determination |
A combination of the following criteria is used to assign the countries of risk listed in the Schedule of Investments: country of incorporation, actual building address, primary exchange on which the security is traded and country in which the greatest percentage of company revenue is generated.
16
THE PHOENIX EDGE SERIES FUND
NOTES TO FINANCIAL STATEMENTS (Continued)
December 31, 2004
| O. | Contractual obligations: |
In the normal course of business the Fund enters into contracts that provide general indeminfications. The Fund’s maximum exposure under these arrangements is dependent on future claims that be made against the Fund and, therefore, cannot be established; however, in management’s opinion, based on experience, the risk of material loss from such claim is remote.
Note 3—Investment Advisory Fees and Related Party Transactions
The advisors to the Fund are Phoenix Investment Counsel, Inc. (“PIC”), Phoenix Variable Advisors, Inc. (“PVA”), Duff & Phelps Investment Management Co. (“DPIM”), Engemann Asset Management (“EAM”). As compensation for their services to the Fund, the advisors are entitled to a fee based upon the following annual rates as a percentage of the average daily net assets of each separate series listed below:
| | | | | | | | | | | |
Series
| | Advisor
| | Rate for first
$250 million
| | | Rate for next
$250 million
| | | Rate for over
$500 million
| |
Aberdeen International | | PIC | | 0.75 | % | | 0.70 | % | | 0.65 | % |
AIM Growth | | PVA | | 0.75 | | | 0.75 | | | 0.75 | |
Alger Small-Cap Growth | | PVA | | 0.85 | | | 0.85 | | | 0.85 | |
Alliance/Bernstein Enhanced Index | | PVA | | 0.45 | | | 0.45 | | | 0.45 | |
Engemann Capital Growth | | PIC | | 0.70 | | | 0.65 | | | 0.60 | |
Engemann Growth and Income | | EAM | | 0.70 | | | 0.65 | | | 0.60 | |
Engemann Small-Cap Growth | | PIC | | 0.90 | | | 0.90 | | | 0.90 | |
Engemann Strategic Allocation | | PIC | | 0.60 | | | 0.55 | | | 0.50 | |
Engemann Value Equity | | EAM | | 0.70 | | | 0.65 | | | 0.60 | |
Goodwin Money Market | | PIC | | 0.40 | | | 0.35 | | | 0.30 | |
Goodwin Multi-Sector Fixed Income | | PIC | | 0.50 | | | 0.45 | | | 0.40 | |
Goodwin Multi-Sector Short Term Bond(1) | | PIC | | 0.50 | | | 0.45 | | | 0.40 | |
Kayne Rising Dividends | | PIC | | 0.70 | | | 0.70 | | | 0.70 | |
Kayne Small-Cap Quality Value | | PIC | | 0.90 | | | 0.90 | | | 0.90 | |
Lazard International Equity Select | | PVA | | 0.90 | | | 0.90 | | | 0.90 | |
Lazard Small-Cap Value | | PVA | | 0.90 | | | 0.90 | | | 0.90 | |
Lord Abbett Bond-Debenture | | PVA | | 0.75 | | | 0.75 | | | 0.75 | |
Lord Abbett Large-Cap Value | | PVA | | 0.75 | | | 0.75 | | | 0.75 | |
Lord Abbett Mid-Cap Value | | PVA | | 0.85 | | | 0.85 | | | 0.85 | |
Northern Dow 30 | | PVA | | 0.35 | | | 0.35 | | | 0.35 | |
Northern Nasdaq-100 Index® | | PVA | | 0.35 | | | 0.35 | | | 0.35 | |
Sanford Bernstein Mid-Cap Value | | PVA | | 1.05 | | | 1.05 | | | 1.05 | |
Sanford Bernstein Small-Cap Value | | PVA | | 1.05 | | | 1.05 | | | 1.05 | |
Seneca Mid-Cap Growth | | PIC | | 0.80 | | | 0.80 | | | 0.80 | |
Seneca Strategic Theme | | PIC | | 0.75 | | | 0.70 | | | 0.65 | |
| | | | |
| | | | | Rate for first
$1 Billion
| | | Rate for next
$1 Billion
| | | Rate for over
$2 Billion
| |
Duff & Phelps Real Estate Securities | | DPIM | | 0.75 | % | | 0.70 | % | | 0.65 | % |
| (1) | Effective June 2, 2003, the advisor voluntarily waived its entire management fee of 0.50% for Goodwin Multi-Sector Short Term Bond through May 31, 2004. The waiver is now terminated. |
Pursuant to a subadvisory agreement with the Fund, certain advisors delegate certain investment decisions and research functions with respect to the following series to the subadvisor indicated, for which each is paid a fee by the respective advisor.
| | |
Series
| | Subadvisor
|
| Aberdeen International | | Aberdeen Asset Management Inc. (“Aberdeen”) |
| AIM Growth | | A I M Capital Management, Inc. (“AIM”) |
| Alger Small-Cap Growth | | Fred Alger Management, Inc. (“Alger”) |
| Engemann Capital Growth | | Engemann Asset Management (“Engemann”) |
| Engemann Small-Cap Growth | | Engemann Asset Management (“Engemann”) |
| Engemann Strategic Allocation | | Engemann Asset Management (“Engemann”) |
| Kayne Rising Dividends | | Kayne Anderson Rudnick Investment Management, LLC (“Kayne”) |
| Kayne Small-Cap Quality Value | | Kayne Anderson Rudnick Investment Management, LLC (“Kayne”) |
| Lazard International Equity Select | | Lazard Asset Management LLC (“Lazard”) |
| Lazard Small-Cap Value | | Lazard Asset Management LLC (“Lazard”) |
| Lord Abbett Bond-Debenture | | Lord, Abbett & Co. LLC (“Lord Abbett”) |
| Lord Abbett Large-Cap Value | | Lord, Abbett & Co. LLC (“Lord Abbett”) |
| Lord Abbett Mid-Cap Value | | Lord, Abbett & Co. LLC (“Lord Abbett”) |
| Northern Dow 30 | | Northern Trust Investments, N.A. (“Northern”) |
| Northern Nasdaq-100 Index® | | Northern Trust Investments, N.A. (“Northern”) |
| Sanford Bernstein Mid-Cap Value | | Alliance Capital Management L.P. (“Alliance”) |
| Sanford Bernstein Small-Cap Value | | Alliance Capital Management L.P. (“Alliance”) |
| Seneca Mid-Cap Growth | | Seneca Capital Management LLC (“Seneca”) |
| Seneca Strategic Theme | | Seneca Capital Management LLC (“Seneca”) |
17
THE PHOENIX EDGE SERIES FUND
NOTES TO FINANCIAL STATEMENTS (Continued)
December 31, 2004
PIC and PVA employ subadvisors to furnish portfolio management services to the series, subject to Investment Subadvisory Agreements, the terms of which are described below.
PIC is an indirect wholly owned subsidiary of Phoenix Investment Partners, Ltd. DPIM is a subsidiary of Phoenix Investment Partners, Ltd. Engemann Asset Management is a wholly owned subsidiary of Pasadena Capital Corporation, which in turn is a wholly owned subsidiary of Phoenix Investment Partners, Ltd. A majority of the equity interest of Kayne Anderson Rudnick Investment Management, LLC and Seneca Capital Management LLC are owned by Phoenix Investment Partners, Ltd. Phoenix Investment Partners, Ltd. in turn is an indirect wholly owned subsidiary of The Phoenix Companies, Inc. (“PNX”).
PIC has engaged Aberdeen as a subadvisor to Aberdeen International. Aberdeen provides the day-to-day portfolio management for this series. For implementing certain portfolio transactions and providing other services to this series, PIC pays a monthly fee to Aberdeen based on an annual percentage of the average daily net assets of this series of 0.375% on the first $250 million, 0.350% of such value between $250 million to $500 million and 0.325% of such value in excess of $500 million. Aberdeen is an affiliate of Aberdeen Asset Management plc, of which PNX indirectly owned approximately 16%. Aberdeen Asset Management plc was sold on January 11, 2005.
Pursuant to a subadvisory agreement between PVA and A I M, A I M is the subadvisor and furnishes portfolio management services to AIM Growth. For the services provided, PVA pays a monthly fee to A I M based on an annual percentage of the average daily net assets of this series as follows.
| | | | | | | | | | | | |
Series
| | Rate for first
500 Million
| | | Rate for next
$400 Million
| | | Rate for next
$600 Million
| | | Rate for over
$1.5 Billion
| |
AIM Growth | | 0.400 | % | | 0.375 | % | | 0.350 | % | | 0.250 | % |
Pursuant to a subadvisory agreement between PVA and Alliance, Alliance is the subadvisor and furnishes portfolio management services to Alliance/Bernstein Enhanced Index. Alliance will manage the portion of the series’ assets invested in value stocks through its Bernstein Investment Research and Management unit (the “Bernstein Unit”). PVA pays a monthly fee to Alliance based on an annual percentage of the average daily net assets of these series as follows:
| | | | | | | | | |
Series
| | Rate for first
$50 Million
| | | Rate for next
$150 Million
| | | Rate for over
$200 Million
| |
Alliance/Bernstein Enhanced Index | | 0.225 | % | | 0.180 | % | | 0.135 | % |
Pursuant to subadvisory agreements between PVA and Alliance, Alliance, through its Bernstein Unit, is the subadvisor and furnishes portfolio management services, including effecting the purchase and sales of securities and providing related advisory services, to the Sanford Bernstein Mid-Cap Value and Sanford Bernstein Small-Cap Value Series. For the services provided, PVA pays a monthly fee to Alliance based on an annual percentage of the average daily net assets of these series as follows:
| | | | | | |
Series
| | Rate for first
$25 Million
| | | Rate for over
$25 Million
| |
Sanford Bernstein Mid-Cap Value | | 0.80 | % | | 0.60 | % |
| | | | | | | | | |
| | | Rate for first
$10 Million
| | | Rate for next
$10 Million
| | | Rate for over
$20 Million
| |
Sanford Bernstein Small-Cap Value | | 0.9000 | % | | 0.7875 | % | | 0.6750 | % |
Pursuant to subadvisory agreements between PIC and Engemann with respect to Engemann Capital Growth and Engemann Small-Cap Growth, Engemann is the subadvisor and furnishes portfolio management services, including effecting the purchase and sales of securities and providing related advisory services, to these series. For the services provided, PIC pays a monthly fee to Engemann for Engemann Capital Growth based on an annual percentage of the average daily net assets of 0.10% up to $3 billion and 0.30% of such value in excess of $3 billion; and for Engemann Small-Cap Growth based on an annual percentage of the average daily net assets of 0.45%.
Pursuant to a subadvisory agreement between PIC and Kayne, Kayne is the subadvisor and furnishes portfolio management services to Kayne Rising Dividends and Kayne Small-Cap Quality Value. For the services provided, PIC pays a monthly fee to Kayne for Kayne Rising Dividends based on an annual percentage of the average daily net assets of 0.30% up to $800 million and 0.25% of such value in excess of $800 million; and for Kayne Small-Cap Quality Value based on an annual percentage of the average daily net assets of 0.50% up to $200 million and 0.45% of such value in excess of $200 million.
Pursuant to a subadvisory agreement between PVA and Lazard, Lazard is the subadvisor and furnishes portfolio management services to Lazard International Equity Select and Lazard Small-Cap Value. For the services provided, PVA pays a monthly fee to Lazard for Lazard International Equity Select based on an annual percentage of the average daily net assets of 0.45% up to $500 million and 0.40% of such value in excess of $500 million; for Lazard Small-Cap Value based on an annual percentage of the average daily net assets of 0.55% up to $250 million, 0.50% of such value between $250 million and $500 million and 0.45% of such value in excess of $500 million.
Pursuant to a subadvisory agreement between PVA and Lord Abbett, Lord Abbett is the subadvisor and furnishes portfolio management services to Lord Abbett Bond-Debenture, Lord Abbett Large-Cap Value and Lord Abbett Mid-Cap Value. For the services provided, PVA pays a monthly fee to Lord Abbett for Lord Abbett Bond-Debenture based on an annual percentage of
18
THE PHOENIX EDGE SERIES FUND
NOTES TO FINANCIAL STATEMENTS (Continued)
December 31, 2004
average daily net assets of 0.35% up to $250 million, 0.30% of such value between $250 million and $1 billion and 0.25% of such value in excess of $1 billion; for Lord Abbett Large-Cap Value based on an annual percentage of the average daily net assets of 0.35% up to $600 million, 0.30% of such value between $600 million and $1.2 billion and 0.25% of such value in excess of $1.2 billion; and for Lord Abbett Mid-Cap Value based on an annual percentage of the average daily net assets of 0.45% up to $200 million, 0.40% of such value between $200 million and $500 million and 0.375% of such value in excess of $500 million. Lord Abbett had voluntarily agreed to waive 0.05% of the subadvisory fee for Lord Abbett Mid-Cap Value received from PVA on the first $200 million through February 8, 2004. PVA retained this difference.
Pursuant to a subadvisory agreement between PVA and Northern, Northern is the subadvisor and provides portfolio management services, including effecting the purchase and sales of securities and providing related advisory services, to the Northern Dow 30 and Northern Nasdaq-100 Index®. For the services provided, PVA pays a monthly fee to Northern based on an annual percentage of 0.10% of the average daily net assets of each of these series, with a minimum annual fee for each series of $100,000.
Pursuant to a subadvisory agreement between the Fund, PIC and Seneca with respect to Seneca Mid-Cap Growth, and pursuant to a subadvisory agreement between PIC and Seneca with respect to Seneca Strategic Theme, Seneca is the subadvisor and furnishes portfolio management services, including effecting the purchase and sales of securities and providing related advisory services, to Seneca Mid-Cap Growth and Seneca Strategic Theme. For the services provided, PIC pays a monthly fee to Seneca for Seneca Mid-Cap Growth based on an annual percentage of the average daily net assets of 0.40%; and for Seneca Strategic Theme based on an annual percentage of the average daily net assets of 0.10% up to $201 million, 0.375% of such value between $201 million and $1 billion, 0.350% of such value between $1 billion and $2 billion and 0.325% on such value in excess of $2 billion.
Pursuant to a subadvisory agreement between PVA and State Street Research, State Street Research was the subadvisor and furnished portfolio management services to Alger Small-Cap Growth. For the services provided, PVA paid a monthly fee to State Street Research based on an annual percentage of 0.45% the average daily net assets of this series.
The advisors have agreed to reimburse the Fund for certain operating expenses (excluding management fees, interest, taxes, brokerage fees and commissions) for all series. For the period ended December 31, 2004, the portion of these expenses to be paid by each series is listed in the following table. All expense reimbursement arrangements may be discontinued at any time.
The advisors will not seek to recapture any prior year’s waived investment advisory fees.
| | | |
Series
| | Maximum Operating
Expense
| |
Aberdeen International | | 0.40 | % |
AIM Growth | | 0.25 | |
Alger Small-Cap Growth | | 0.15 | |
Alliance/Bernstein Enhanced Index | | 0.20 | |
Duff & Phelps Real Estate Securities | | 0.35 | |
Engemann Capital Growth | | 0.25 | |
Engemann Growth and Income | | 0.25 | |
Engemann Small-Cap Growth | | 0.35 | |
Engemann Strategic Allocation | | 0.25 | |
Engemann Value Equity | | 0.25 | |
Goodwin Money Market | | 0.25 | |
Goodwin Multi-Sector Fixed Income | | 0.25 | |
Goodwin Multi-Sector Short Term Bond | | 0.20 | |
Kayne Rising Dividends | | 0.15 | |
Kayne Small-Cap Quality Value | | 0.15 | |
Lazard International Equity Select | | 0.15 | |
Lazard Small-Cap Value | | 0.15 | |
Lord Abbett Bond-Debenture | | 0.15 | |
Lord Abbett Large-Cap Value | | 0.15 | |
Lord Abbett Mid-Cap Value | | 0.15 | |
Northern Dow 30 | | 0.25 | |
Northern Nasdaq-100 Index® | | 0.25 | |
Sanford Bernstein Mid-Cap Value | | 0.25 | |
Sanford Bernstein Small-Cap Value | | 0.25 | |
Seneca Mid-Cap Growth | | 0.35 | |
Seneca Strategic Theme | | 0.35 | |
As Financial Agent to the Fund and to each series, Phoenix Equity Planning Corporation (“PEPCO”), an indirect majority-owned subsidiary of PNX, receives a financial agent fee equal to the sum of (1) the documented cost to PEPCO to provide tax services and oversight of the performance of PFPC Inc. (subagent to PEPCO) plus (2) the documented cost of fund accounting and related services provided by PFPC Inc. The fee schedule of PFPC Inc. ranges from 0.065% to 0.03% of the average daily net asset values of each series. Certain minimum fees may apply. For the period ended December 31, 2004, the Fund paid PEPCO financial agent fees totaling $2,610,251.
19
THE PHOENIX EDGE SERIES FUND
NOTES TO FINANCIAL STATEMENTS (Continued)
December 31, 2004
Pursuant to an Administration Agreement, Phoenix Life Insurance Company (“PLIC”), a wholly-owned subsidiary of PNX, receives a service fee at the annual rate of 0.08% of the average daily net assets of each series for providing certain stock transfer and accounting services for each series. For the period ended December 31, 2004, the Fund paid PLIC $2,204,117.
For the period ended December 31, 2004, the Fund paid PXP Securities Corp., a wholly owned subsidiary of PNX, brokerage commissions in connection with portfolio transactions effected on behalf of it as follows:
| | | |
| | | Commissions Paid to
PXP Securities Corp.
|
Seneca Strategic Theme | | $ | 24,398 |
At December 31, 2004, PLIC and affiliates held shares in the Fund which had the following aggregate value: | | | |
Aberdeen International | | $ | 8,780,742 |
AIM Growth | | | 6,175,915 |
Alger Small-Cap Growth | | | 2,299,452 |
Engemann Capital Growth | | | 2,947,821 |
Engemann Growth and Income | | | 5,825,071 |
Kayne Rising Dividends | | | 587,261 |
Kayne Small-Cap Quality Value | | | 740,906 |
Lazard Small-Cap Value | | | 4,528,398 |
Lord Abbett Bond-Debenture | | | 2,635,776 |
Lord Abbett Mid-Cap Value | | | 1,501,244 |
Note 4—Purchases and Sales of Securities
Purchases and sales of securities during the period ended December 31, 2004, (excluding U.S. Government securities, short-term securities, futures contracts, swaps and forward currency contracts) aggregated to the following:
| | | | | | |
| | | Purchases
| | Sales
|
Aberdeen International | | $ | 73,395,223 | | $ | 84,795,745 |
AIM Growth | | | 141,787,058 | | | 144,154,130 |
Alger Small-Cap Growth | | | 40,082,520 | | | 33,492,636 |
Alliance/Bernstein Enhanced Index | | | 25,157,952 | | | 24,585,628 |
Duff & Phelps Real Estate Securities | | | 33,525,165 | | | 25,560,002 |
Engemann Capital Growth | | | 285,897,326 | | | 380,868,109 |
Engemann Growth and Income | | | 80,546,742 | | | 69,633,254 |
Engemann Small-Cap Growth | | | 13,389,351 | | | 14,375,022 |
Engemann Strategic Allocation | | | 257,702,297 | | | 323,139,513 |
Engemann Value Equity | | | 92,144,448 | | | 100,986,189 |
Goodwin Money Market | | | 533,360 | | | — |
Goodwin Multi-Sector Fixed Income | | | 213,425,353 | | | 209,197,625 |
Goodwin Multi-Sector Short Term Bond | | | 35,552,901 | | | 22,146,558 |
Kayne Rising Dividends | | | 8,745,408 | | | 3,870,576 |
Kayne Small-Cap Quality Value | | | 5,213,230 | | | 1,134,254 |
Lazard International Equity Select | | | 32,575,234 | | | 2,376,409 |
Lazard Small-Cap Value | | | 13,685,490 | | | 13,041,627 |
Lord Abbett Bond-Debenture | | | 15,440,693 | | | 9,169,584 |
Lord Abbett Large-Cap Value | | | 56,278,791 | | | 15,806,965 |
Lord Abbett Mid-Cap Value | | | 13,134,163 | | | 2,966,602 |
Northern Dow 30 | | | 14,753,047 | | | 13,304,739 |
Northern Nasdaq-100 Index® | | | 9,014,156 | | | 8,194,652 |
Sanford Bernstein Mid-Cap Value | | | 43,800,256 | | | 34,229,279 |
Sanford Bernstein Small-Cap Value | | | 30,076,102 | | | 23,627,988 |
Seneca Mid-Cap Growth | | | 98,659,443 | | | 100,769,798 |
Seneca Strategic Theme | | | 130,874,631 | | | 145,632,562 |
Purchases and sales of long-term U.S. Government securities during the period ended December 31, 2004, aggregated the following:
| | | | | | |
| | | Purchases
| | Sales
|
Engemann Strategic Allocation | | $ | 22,864,334 | | $ | 12,255,404 |
Goodwin Multi-Sector Fixed Income | | | 14,577,815 | | | 23,544,016 |
Goodwin Multi-Sector Short Term Bond | | | 2,002,599 | | | 1,356,749 |
Lord Abbett Bond-Debenture | | | 826,891 | | | 346,448 |
20
THE PHOENIX EDGE SERIES FUND
NOTES TO FINANCIAL STATEMENTS (Continued)
December 31, 2004
Note 5—Credit Risk and Concentrations
In countries with limited or developing markets, investments may present greater risks than in more developed markets and the prices of such investments may be volatile. The consequences of political, social or economic changes in these markets may have disruptive effects on the market prices of these investments and the income they generate, as well as a series’ ability to repatriate such amounts.
Certain series may invest a high percentage of their assets in specific sectors of the market in their pursuit of a greater investment return. Fluctuations in these sectors of concentration may have a greater impact on a series, positive or negative, than if a series did not concentrate its investments in such sectors.
High yield debt securities typically entail greater price volatility and/or principal and interest rate risk. There is a greater chance that an issuer will not be able to make principal and interest payments on time. Analysis of the creditworthiness of issuers of high yield securities may be complex, and as a result, it may be more difficult for the adviser and/or subadviser to accurately predict risk.
Note 6—Illiquid and Restricted Securities
Investments shall be considered illiquid if they cannot be disposed of in seven days in the ordinary course of business at the approximate amount at which such securities have been valued by the series. Additionally, the following information is also considered in determining illiquidity: the frequency of trades and quotes for the investment, whether the investment is listed for trading on a recognized domestic exchange and/or whether two or more brokers are willing to purchase or sell the security at a comparable price, the extent of market making activity in the investment and the nature of the market for investment. Illiquid securities are footnoted as such at the end of the series’ Schedule of Investments where applicable.
Restricted securities are investments in securities not registered under the Securities Act of 1933. Generally, 144A securities are excluded from this category, except where defined as illiquid.
At December 31, 2004, the Fund held the following restricted securities:
| | | | | | | | |
| | | Acquisition Date
| | Acquisition Cost
| | % of Net Assets
| |
Alger Small-Cap | | | | | | | | |
Autobytel, Inc. | | 6/20/03 | | $ | 20,288 | | 0.1 | % |
Alliance/Bernstein Enhanced Index | | | | | | | | |
Seagate Technology Tax Refund Rights | | 11/22/00 | | | 0 | | 0.0 | |
Goodwin Multi-Sector Fixed Income | | | | | | | | |
Candscent Technologies Corp. Cv 144A 8%, 5/1/03 | | 3/6/00 | | | 40,000 | | 0.0 | |
Engemann Strategic Allocation | | | | | | | | |
ITW Cupids Financial Trust I 144A 6.55%, 12/31/11 | | 4/18/02 | | | 1,996,980 | | 0.5 | |
Each series will bear any costs, including those involved in registration under securities Act of 1933, in connection with the disposition of restricted securities.
Note 7—Federal Income Tax Information
The following series have capital loss carryovers which may be used to offset future capital gains.
| | | | | | | | | | | | | | | | | | | | | |
| | | Expiration Year
|
| | | 2007
| | 2008
| | 2009
| | 2010
| | 2011
| | 2012
| | Total
|
Aberdeen International | | $ | — | | $ | — | | $ | 16,405,875 | | $ | 21,870,830 | | $ | 19,740,631 | | $ | — | | $ | 58,017,336 |
AIM Growth | | | — | | | 2,465,283 | | | 18,423,160 | | | 18,330,727 | | | 11,077,954 | | | — | | | 50,297,124 |
Alger Small-Cap Growth | | | — | | | — | | | — | | | — | | | — | | | 750,451 | | | 750,451 |
Alliance/Bernstein Enhanced Index | | | — | | | — | | | 3,385,705 | | | 15,534,573 | | | 7,836,272 | | | — | | | 26,756,550 |
Engemann Capital Growth | | | — | | | — | | | 267,238,796 | | | 73,263,809 | | | 5,973,373 | | | — | | | 346,475,978 |
Engemann Growth and Income | | | — | | | — | | | — | | | 11,504,804 | | | 5,418,582 | | | — | | | 16,923,386 |
Engemann Small-Cap Growth | | | — | | | — | | | 670,571 | | | 4,227,881 | | | 744,060 | | | — | | | 5,642,512 |
Engemann Value Equity | | | — | | | — | | | — | | | 11,230,960 | | | — | | | — | | | 11,230,960 |
Goodwin Multi-Sector Fixed Income | | | 2,478,171 | | | 6,659,630 | | | 4,980,791 | | | 7,850,329 | | | — | | | — | | | 21,968,921 |
Goodwin Multi-Sector Short Term Bond | | | — | | | — | | | — | | | — | | | 18,992 | | | 171,793 | | | 190,785 |
Kayne Rising Dividends | | | — | | | — | | | — | | | — | | | — | | | 129,694 | | | 129,694 |
Northern Dow 30 | | | — | | | — | | | — | | | 408,663 | | | — | | | — | | | 408,663 |
Northern Nasdaq-100 Index® | | | — | | | 35,822 | | | 775,525 | | | 542,317 | | | 931,918 | | | 348,546 | | | 2,634,128 |
Seneca Mid-Cap Growth | | | — | | | — | | | 19,535,060 | | | 16,035,347 | | | — | | | — | | | 35,570,407 |
Seneca Strategic Theme | | | — | | | — | | | 64,834,186 | | | 27,319,632 | | | — | | | — | | | 92,153,818 |
Included in the Aberdeen International amounts are $2,547,074, which were acquired in connection with the merger of the Aberdeen New Asia Series on February 7, 2003 of which $1,576,217 were utilized in the current year and $970,857 are included in the capital loss carryforward balance. In connection with the Sanford Bernstein Global Value merger on September 24, 2004 capital loss carryforward of $141,303 were acquired. The series did not utilize any of this capital loss carryforward.
21
THE PHOENIX EDGE SERIES FUND
NOTES TO FINANCIAL STATEMENTS (Continued)
December 31, 2004
Included in the AIM Growth amounts (formerly MFS Investors Growth Stock and Janus Growth Series) are $4,002,162; $3,586,175; and $974,489, respectively, which were acquired in connection with the mergers of the Janus Core Equity Series on March 22, 2002; Van Kampen Focus Equity Series on February 17, 2003; and MFS Investors Growth Stock Series on February 17, 2003. Of these amounts the AIM Growth utilized in the current year capital loss carryforward of $2,389,605 from the Janus Core Equity Series and $179,842 of the Van Kampen Focus Equity Series. The capital loss carryforward balance includes $1,612,557 remaining from Janus Core Equity Series, $3,406,333 from Van Kampen Focus Equity Series and $974,489 from the MFS Investors Growth Stock Series.
Included in the Engemann Capital Growth’s amounts is $23,491,846, which was acquired in connection with the merger of the Engemann Nifty Fifty Series on April 5, 2002. Capital loss carryforward utilized from the Engemann Nifty Fifty Series was $17,480,554 with $6,011,292 remaining in the capital loss carryforward balance.
Included in the Engemann Growth and Income’s amounts are $117,063, which were acquired in connection with the merger of the MFS Investors Trust Series on September 17, 2004, and $578,054 which were acquired in connection with the merger of the Alliance Bernstein Growth + Value Series on September 17, 2004. Engemann Growth utilized $110,577 of the acquired capital loss carryforward from MFS Investors Trust and $274,601 from Alliance Bernstein Growth + Value Series. The capital loss carryforward balance for the Engemann Growth and Income Series includes the remaining $6,486 from MFS Investors Trust Series and $303,453 from Alliance Bernstein Growth + Value Series.
A series may not realize the benefit of these losses to the extent it does not realize gains on investments prior to the expiration of the capital loss carryovers.
The differences between the book and tax basis components of distributable earnings relate principally to the timing of recognition of income and gains for federal income tax purposes. Short-term gains distributions reported in the Statements of Changes in Net Assets, if any, are reported as ordinary income for federal tax purposes.
The following Series utilized losses deferred in prior years against current year capital gains as follows:
| | | |
Aberdeen International | | $ | 11,896,171 |
AIM Growth | | | 4,306,344 |
Alger Small-Cap Growth | | | 750,451 |
Alliance/Bernstein Enhanced Index | | | 2,529,494 |
Engemann Capital Growth | | | 37,792,290 |
Engemann Growth and Income | | | 4,103,115 |
Engemann Small-Cap Growth | | | 1,470,219 |
Engemann Strategic Allocation | | | 18,833,801 |
Engemann Value Equity | | | 5,585,973 |
Goodwin Multi-Sector Fixed Income | | | 2,874,990 |
Northern Dow 30 | | | 128,737 |
Seneca Mid-Cap Growth | | | 832,642 |
Seneca Strategic Theme | | | 8,646,572 |
Under current tax law, foreign currency and capital losses realized after October 31 may be deferred and treated as occurring on the first day of the following tax year. For the period ended December 31, 2004, the following Series deferred and/or recognized post-October losses as follows:
| | | | | | |
| | | Deferred
| | Recognized
|
Aberdeen International | | $ | 28,273 | | $ | 1,072 |
AIM Growth | | | 764,457 | | | 143,587 |
Alliance/Bernstein Enhanced Index | | | — | | | 11,835 |
Engemann Capital Growth | | | 863,851 | | | — |
Engemann Growth and Income | | | — | | | 178,131 |
Engemann Small-Cap Growth | | | — | | | 202,986 |
Engemann Strategic Allocation | | | — | | | 102,568 |
Engemann Value Equity | | | — | | | 236,249 |
Goodwin Multi-Sector Short Term Bond | | | 1,018 | | | 14,000 |
Kayne Small-Cap Quality Value | | | — | | | 4,558 |
Lazard International Equity Select | | | 83 | | | — |
Lord Abbett Bond-Debenture | | | — | | | 6,140 |
Lord Abbett Mid-Cap Value | | | — | | | 43,561 |
Northern Nasdaq-100 Index® | | | — | | | 506,649 |
22
THE PHOENIX EDGE SERIES FUND
NOTES TO FINANCIAL STATEMENTS (Continued)
December 31, 2004
As of December 31, 2004, the components of distributable earnings on a tax basis (excluding unrealized appreciation (depreciation) which are disclosed in the respective schedule of investments) were as follows:
| | | | | | |
| | | Undistributed
Ordinary
Income
| | Undistributed
Long-Term
Capital Gains
|
Aberdeen International | | $ | 550,298 | | $ | — |
Alliance/Bernstein Enhanced Index | | | 99,739 | | | — |
Duff & Phelps Real Estate Securities | | | 107,949 | | | 1,767,922 |
Engemann Strategic Allocation | | | 1,714,849 | | | 650,174 |
Engemann Value Equity | | | 30,033 | | | — |
Goodwin Multi-Sector Fixed Income | | | 262,973 | | | — |
Kayne Small-Cap Quality Value | | | 5,263 | | | 419 |
Lazard International Equity Select | | | 6,786 | | | — |
Lazard Small-Cap Value | | | 91,918 | | | 169,736 |
Lord Abbett Bond-Debenture | | | 106,157 | | | 58,184 |
Lord Abbett Large-Cap Value | | | 106,969 | | | 462,086 |
Lord Abbett Mid-Cap Value | | | 149,868 | | | 126,576 |
Northern Dow 30 | | | 42,397 | | | — |
Sanford Bernstein Mid-Cap Value | | | 201,923 | | | 92,745 |
Sanford Bernstein Small-Cap Value | | | 229,561 | | | 33,837 |
The differences between the book and tax basis components of distributable earnings relate principally to the timing of recognition of income and gains for federal income tax purposes. Short-term gains distributions reported in the Statement of Changes in Net Assets, if any, are reported as ordinary income for federal tax purposes.
Note 8—Reclassification of Capital Accounts
For financial reporting purposes, book basis capital accounts are adjusted to reflect the tax character of permanent book/tax differences. Permanent reclassifications can arise from differing treatment of certain income and gain transactions, nondeductible current year net operating losses, expiring capital loss carryovers and investments in passive foreign investment companies. The reclassifications have no impact on the net assets or net asset values of the Funds. As of December 31, 2004, the following series recorded reclassifications to increase (decrease) the accounts listed below:
| | | | | | | | | | | | |
| | | Undistributed
Net Investment
Income (Loss)
| | | Accumulated
Net Realized
Gain (Loss)
| | | Capital Paid In
on Shares of
Beneficial Interest
| |
Aberdeen International | | $ | (69,207 | ) | | $ | (125,345 | ) | | $ | 194,552 | |
AIM Growth | | | (2,488 | ) | | | 8,234 | | | | (5,746 | ) |
Alger Small-Cap Growth | | | 130,412 | | | | 38 | | | | (130,450 | ) |
Engemann Capital Growth | | | 162,887 | | | | (5,172 | ) | | | (157,715 | ) |
Engemann Growth and Income | | | 8,008 | | | | (775,057 | ) | | | 767,049 | |
Engemann Small-Cap Growth | | | 185,322 | | | | — | | | | (185,322 | ) |
Engemann Strategic Allocation | | | 380,164 | | | | (401,552 | ) | | | 21,388 | |
Engemann Value Equity | | | (7,701 | ) | | | (342,508 | ) | | | 350,209 | |
Goodwin Multi-Sector Fixed Income | | | 728,809 | | | | (766,655 | ) | | | 37,846 | |
Goodwin Multi-Sector Short Term Bond | | | (448 | ) | | | 9,955 | | | | (9,507 | ) |
Kayne Rising Dividends | | | 1,692 | | | | — | | | | (1,692 | ) |
Lazard Small-Cap Value | | | 34,747 | | | | (30,339 | ) | | | (4,408 | ) |
Lord Abbett Bond-Debenture | | | 12,369 | | | | (12,600 | ) | | | 231 | |
Lord Abbett Mid-Cap Value | | | — | | | | (1,009 | ) | | | 1,009 | |
Northern Nasdaq-100 Index® | | | 8,409 | | | | — | | | | (8,409 | ) |
Sanford Bernstein Mid-Cap Value | | | (21,041 | ) | | | 69,929 | | | | (48,888 | ) |
Sanford Bernstein Small-Cap Value | | | 114,974 | | | | (70,674 | ) | | | (44,300 | ) |
Seneca Mid-Cap Growth | | | 309,829 | | | | — | | | | (309,829 | ) |
Seneca Strategic Theme | | | 168,008 | | | | — | | | | (168,008 | ) |
Note 9—Mergers and Investment Management Changes
On September 24, 2004, Aberdeen International acquired all of the net assets of Sanford Bernstein Global Value pursuant to an Agreement and Plan of Reorganization approved by Sanford Bernstein Global Value shareholders on September 14, 2004. The acquisition was accomplished by a tax-free exchange of 1,785,746 shares of Aberdeen International valued at $19,701,375 for 1,817,620 shares of Sanford Bernstein Global Value outstanding on September 24, 2004. Sanford Bernstein Global Value’s net assets on that date of $19,701,375, including $1,968,559 of net unrealized appreciation were combined with those of Aberdeen International. The aggregate net assets of Aberdeen International immediately after the merger were $162,263,002. The shareholders of the Sanford Bernstein Global Value received for each share owned approximately 0.98 shares of Aberdeen International.
23
THE PHOENIX EDGE SERIES FUND
NOTES TO FINANCIAL STATEMENTS (Continued)
December 31, 2004
On September 24, 2004, Engemann Value Equity acquired all of the net assets of MFS Value pursuant to an Agreement and Plan of Reorganization approved by MFS Value shareholders on September 14, 2004. The acquisition was accomplished by a tax-free exchange of 3,058,095 shares of Engemann Value Equity valued at $36,459,749 for 3,269,438 shares of MFS Value outstanding on September 24, 2004. MFS Value’s net assets on that date of at $36,459,749 including $4,777,441 of net unrealized appreciation were combined with those of Engemann Value Equity. The aggregate net assets of Engemann Value Equity immediately after the merger were $123,477,422. The shareholders of the MFS Value received for each share owned approximately 0.94 shares of Engemann Value Equity.
On September 24, 2004, Engemann Capital Growth acquired all of the net assets of Lazard U.S. Multi-Cap pursuant to an Agreement and Plan of Reorganization approved by Lazard U.S. Multi-Cap shareholders on September 14, 2004. The acquisition was accomplished by a tax-free exchange of 544,383 shares of Engemann Capital Growth valued at $7,162,666 for 570,926 shares of Lazard U.S. Multi-Cap outstanding on September 24, 2004. Lazard U.S. Multi-Cap’s net assets on that date of $7,162,666, including $542,543 of net unrealized appreciation were combined with those of Engemann Capital Growth. The aggregate net assets of Engemann Capital Growth immediately after the merger were $549,726,397. The shareholders of the Lazard U.S. Multi-Cap received for each share owned approximately 0.95 shares of Engemann Capital Growth.
On September 17, 2004, Engemann Growth & Income acquired all of the net assets of Alliance/Bernstein Growth + Value (“Growth + Value”) and MFS Investors Trust (“Investors Trust”) pursuant to two Agreements and Plans of Reorganization approved by Growth + Value and Investors Trust shareholders on September 14, 2004. The acquisition was accomplished by a tax-free exchange of 1,693,623 shares of Engemann Growth & Income outstanding on September 17, 2004 and valued at $19,106,074 for 1,124,392 shares of Growth + Value valued at $11,309,520 and 772,883 shares of Investors Trust valued at $7,796,554. Growth + Value’s net assets of $11,309,520, including $1,005,844 of net unrealized appreciation and Investors Trust’s net assets of $7,796,554, including $726,794 of net unrealized appreciation were combined with those of Engemann Growth & Income. The aggregate net assets of Engemann Growth & Income immediately after the merger were $136,382,263. The shareholders of the Alliance/Bernstein Growth + Value received for each share owned approximately 0.89 shares of Engemann Growth and Income. The shareholders of the MFS Investors Trust received for each share owned approximately 0.89 shares of Engemann Growth and Income.
On April 16, 2004, Goodwin Multi-Sector Fixed Income acquired all of the net assets of Janus Flexible Income pursuant to an Agreement and Plan of Reorganization approved by Janus Flexible Income shareholders on April 14, 2004. The acquisition was accomplished by a tax-free exchange of 5,476,476 shares of Goodwin Multi-Sector Fixed Income valued at $50,639,637 for 4,789,637 shares of Janus Flexible Income outstanding on April 16, 2004. Janus Flexible Income’s net assets on that date of $50,639,637, including $661,921 of net unrealized appreciation were combined with those of Goodwin Multi-Sector Fixed Income. The aggregate net assets of Goodwin Multi-Sector Fixed Income immediately after the merger were $256,054,804. The shareholders of the Janus Flexible Income received for each share owned approximately 1.14 shares of Goodwin Multi-Sector Fixed Income.
On February 17, 2003, Janus Growth acquired all of the net assets of MFS Investors Growth Stock (“Growth Stock”) and Van Kampen Focus Equity (“Focus Equity”) pursuant to two Agreements and Plans of Reorganization approved by Growth Stock and Focus Equity shareholders on February 14, 2003. The acquisition was accomplished by a tax-free exchange of 2,496,714 shares of Janus Growth outstanding on February 17, 2003 for 782,923 shares of Growth Stock valued at $5,807,615 and 1,169,922 shares of Focus Equity valued at $6,179,826. Growth Stock’s net assets of $5,807,615, including $135,964 of net unrealized depreciation and Focus Equity’s net assets of $6,179,826, including $380,781 of net unrealized depreciation were combined with those of Janus Growth. The aggregate net assets of Janus Growth immediately after the merger were $63,057,943. The shareholders of the MFS Investors Growth Stock received for each share owned approximately 1.54 shares of Janus Growth. The shareholders of the Van Kampen Focus Equity received for each share owned approximately 1.10 shares of Janus Growth.
Immediately following the merger, Janus Growth was renamed MFS Investors Growth Stock. Immediately prior to the Special Meeting of Shareholders, Phoenix Variable Advisors, Inc. (“PVA”), as authorized pursuant to an exemptive order from the Securities and Exchange Commission, replaced Janus Capital Management LLC with MFS Investment Management (“MFS”) as subadvisor to the series. PVA and MFS also agreed that they would serve as advisor and subadvisor, respectively, to the series for the same management fees as currently charged to the former Phoenix-MFS Investors Growth Stock Series. Accordingly, the annual expenses and expense cap reimbursements for the series are the same as those of the former Phoenix-MFS Investors Growth Stock Series. MFS managed the series in a manner comparable with the former Phoenix-MFS Investors Growth Stock Series. As part of the reorganizations, the series was renamed Phoenix-MFS Investors Growth Stock Series. Effective December 3, 2004, the Board of Trustees of the Fund approved a name change and subadvisory for the Phoenix-MFS Investors Growth Stock series to Phoenix-AIM Growth Series. This series’ investment objectives, principal investment strategies and principal risks will remain the same. The fees and expenses associated with the series are not affected as a result of this change.
On February 7, 2003, Aberdeen International acquired all of the net assets of Aberdeen New Asia pursuant to an Agreement and Plan of Reorganization approved by Aberdeen New Asia shareholders on January 27, 2003. The acquisition was accomplished by a tax-free exchange of 1,885,115 shares of Aberdeen International valued at $14,391,123 for 1,913,078 shares of Aberdeen New Asia outstanding on February 7, 2003. Aberdeen New Asia’s net assets on that date of $14,391,123, including $618,515 of net unrealized depreciation were combined with those of Aberdeen International. The aggregate net assets of Aberdeen International immediately after the merger were $116,991,498. The shareholders of the Aberdeen New Asia received for each share owned approximately 0.99 shares of Aberdeen International.
At its regular meeting in May 2004, the board approved other mergers and substitutions that are currently under further review.
24
THE PHOENIX EDGE SERIES FUND
NOTES TO FINANCIAL STATEMENTS (Continued)
December 31, 2004
Note 10—Manager of Managers
The Fund and PVA have received an exemptive order from the Securities and Exchange Commission (“SEC”) granting exemptions from certain provisions of the Investment Company Act of 1940, as amended, pursuant to which PVA will, subject to supervision and approval of the Fund’s Board of Trustees, be permitted to enter into and materially amend subadvisory agreements without such agreements being approved by the shareholders of the applicable series of the Fund. The Fund and PVA will therefore have the right to hire, terminate, or replace subadvisors without shareholder approval, including, without limitation, the replacement or reinstatement of any subadvisor with respect to which a subadvisory agreement has automatically terminated as a result of an assignment. PVA will continue to have the ultimate responsibility to oversee the subadvisors and recommend their hiring, termination and replacement.
Note 11—Mixed and Shared Funding
Shares of the Fund are not directly offered to the public. Shares of the Fund are currently offered through separate accounts to fund variable accumulation annuity contracts and variable universal life insurance policies issued by Phoenix Life Insurance Company, PHL Variable Insurance Company, and Phoenix Life and Annuity Company. Shares of the Fund may be offered to separate accounts of other insurance companies in the future.
The interests of variable annuity contract owners and variable life policy owners could diverge based on differences in federal and state regulatory requirements, tax laws, investment management or other unanticipated developments. The Fund’s Trustees currently do not foresee any such differences or disadvantages at this time. However, the Fund’s Trustees intend to monitor for any material conflicts and will determine what action, if any, should be taken in response to such conflicts. If such a conflict should occur, one or more separate accounts may be required to withdraw its investment in the Fund or shares of another fund may be substituted.
Note 12—Other
The Board of Trustees of the Fund approved a name change for the Phoenix-Engemann Small & Mid-Cap Growth Series to Phoenix-Engemann Small-Cap Growth Series. This series’ investment objectives, principal investment strategies and principal risks will remain the same. The fees and expenses associated with the series are not affected as a result of this change. The change was effective September 24, 2004.
Phoenix-Oakhurst Growth and Income Series and Phoenix-Oakhurst Value Equity Series will now be advised by Engemann Asset Management (“Engemann”) effective January 1, 2005. Each of these series’ will continue to have the same investment objectives and use the same investment strategies. Each series changed their name on January 7, 2005 to Phoenix-Engemann Growth and Income Series and Phoenix-Engemann Value Equity Series, respectively.
Engemann Asset Management (“Engemann”), an affiliate of Phoenix Investment Counsel, Inc. (“PIC”), became a subadvisor to manage the equity investments in Phoenix-Oakhurst Strategic Allocation Series effective January 1, 2005. This series’ investment objectives, principal investment strategies and principal risks will remain the same. The series name changed to Phoenix-Engemann Strategic Allocation Series on January 7, 2005.
Fred Alger Management, Inc. (“Alger”) effective January 7, 2005 will replace State Street Research & Management Company as the subadvisor to Phoenix-State Street Research Small-Cap Growth Series. The series name changed to Phoenix-Alger Small-Cap Growth Series as of January 7, 2005.
Note 13—Proxy Voting Procedures (Unaudited)
The advisers and subadvisors vote proxies relating to portfolio securities in accordance with procedures that have been approved by the Fund’s Board of Trustees. You may obtain a description of these procedures, free of charge, by calling toll-free 800-541-0171. These procedures and information regarding how the series voted proxies during the most recent twelve-month period ended June 30, 2004, is also available through the Securities and Exchange Commission’s website at http://www.sec.gov.
Note 14—Form N-Q Information (Unaudited)
Effective the 3rd quarter 2004 the series’ file complete schedules of portfolio holdings with the Securities and Exchange Commission (the “SEC”) for the first and third quarters of each fiscal year on Form N-Q. Each series’ Form N-Q is available on the SEC’s website at http://www.sec.gov. Furthermore, each Fund’s Form N-Q may be reviewed and copied at the SEC’s Public Reference Room. Information on the operation of the SEC’s Public Reference Room can be obtained at http://www.sec.gov/info/edgar/prrules.htm.
25
Tax Information Notice (Unaudited)
For the fiscal year ended December 31, 2004, the series’ designated long-term capital gains dividends as follows:
| | | |
Duff & Phelps Real Estate Securities | | $ | 10,281,449 |
Engemann Strategic Allocation | | | 11,437,138 |
Kayne Small-Cap Quality Value | | | 28,733 |
Lazard International Equity Select | | | 276,174 |
Lazard Small-Cap Value | | | 764,914 |
Lord Abbett Bond-Debenture | | | 276,453 |
Lord Abbett Large-Cap Value | | | 607,125 |
Lord Abbett Mid-Cap Value | | | 204,135 |
Sanford Bernstein Mid-Cap Value | | | 6,224,804 |
Sanford Bernstein Small-Cap Value | | | 3,874,701 |
REPORT OF INDEPENDENT REGISTERED PUBLIC ACCOUNTING FIRM

To the Board of Trustees and Shareholders of The Phoenix Edge Series Fund
In our opinion, the accompanying statements of assets and liabilities, including the schedules of investments, and the related statements of operations and of changes in net assets and the financial highlights present fairly, in all material respects, the financial position of each of the 26 series (each a series) (constituting The Phoenix Edge Series Fund, hereafter referred to as the “Fund”) at December 31, 2004, the results of each of their operations for the year then ended, the changes in each of their net assets and the financial highlights for each of the periods indicated, in conformity with accounting principles generally accepted in the United States of America. These financial statements and financial highlights (hereafter referred to as “financial statements”) are the responsibility of the Fund’s management; our responsibility is to express an opinion on these financial statements based on our audits. We conducted our audits of these financial statements in accordance with the standards of the Public Company Accounting Oversight Board (United States). Those standards require that we plan and perform the audit to obtain reasonable assurance about whether the financial statements are free of material misstatement. An audit includes examining, on a test basis, evidence supporting the amounts and disclosures in the financial statements, assessing the accounting principles used and significant estimates made by management, and evaluating the overall financial statement presentation. We believe that our audits, which included confirmation of securities at December 31, 2004, by correspondence with the custodians and brokers, provide a reasonable basis for our opinion.

Boston, Massachusetts
February 17, 2005
26
THE PHOENIX EDGE SERIES FUND
RESULTS OF SHAREHOLDER MEETINGS
December 31, 2004
(Unaudited)
Meeting 1: A Special Meeting of Shareholders of the Phoenix-Janus Flexible Income Series of The Phoenix Edge Series Fund was held on April 14, 2004 to approve the following matters:
| | 1. | To consider and act upon a proposal to approve the Agreement and Plan of Reorganization, dated April 14, 2004 and the transactions it contemplates, including (a) the transfer of all the assets of the Phoenix-Janus Flexible Income Series (the “Merging Series”) to the Phoenix-Goodwin Multi-Sector Fixed Income Series (the “Surviving Series”), another series of The Phoenix Edge Series Fund in exchange solely for the shares of the Surviving Series and the assumption by the Surviving Series of all known liabilities of the Merging Series and (b) the distribution of the shares of the Surviving Series so received to shareholders of the Merging Series in complete liquidation of the Merging Series. |
On the record date of February 25, 2004 there were 4,550,610 shares outstanding and 100% of the shares outstanding and entitled to vote were present by proxy.
NUMBER OF VOTES
| | | | | | |
| | | For
| | Against
| | Abstain
|
1. Approve Agreement and Plan of Reorganization | | 986,562 | | 38,600 | | 114,890 |
Of the shares outstanding, 1,140,052 shares or 25.1%, were voted by policyholders and contractowners. Since Phoenix echo votes its record date shares in the same proportion as the voted shares received from policyholders and contractowners, effectively 100% of the outstanding shares were voted.
Meeting 2: A Special Meeting of Shareholders of The Phoenix Edge Series Fund was held on August 10, 2004 to approve the following matters:
| | 1. | Fix the number of Trustees at eight and elect such number as detailed below. |
| | 2. | Ratify selection of PricewaterhouseCoopers LLP, independent accountants, as auditors for the fiscal year ending December 31, 2004. |
On the record date of June 30, 2004, for The Phoenix Edge Series Fund, there were 245,740,781 shares outstanding and 100% of the shares outstanding and entitled to vote were present by proxy.
NUMBER OF VOTES
| | | | |
| 1. Election of Trustees | | For
| | Withheld
|
Frank M. Ellmer | | 236,242,379 | | 9,498,403 |
John A. Fabian | | 236,154,262 | | 9,586,519 |
Roger A. Gelfenbien | | 236,106,489 | | 9,634,193 |
Eunice S. Groark | | 236,014,756 | | 9,726,026 |
Frank E. Grzelecki | | 236,105,466 | | 9,635,315 |
John R. Mallin | | 236,236,418 | | 9,504,364 |
Philip R. McLoughlin | | 236,081,210 | | 9,659,572 |
Philip K. Polkinghorn | | 236,158,976 | | 9,581,805 |
| | | | | | |
| | | For
| | Against
| | Abstain
|
2. PricewaterhouseCoopers LLP | | 234,721,659 | | 2,827,948 | | 8,191,174 |
Meeting 3: Special Meetings of Shareholders of The Phoenix Edge Series Fund was held on September 14, 2004 to approve the following matters:
| | 1. | To consider and act upon a proposal to approve the Agreement and Plan of Reorganization, dated September 14, 2004 and the transactions it contemplates, including (a) the transfer of all of the assets of the Phoenix-Alliance/Bernstein Growth + Value Series (the “Merging Series”) to the Phoenix-Oakhurst Growth and Income Series (the “Surviving Series”), another series of The Phoenix Edge Series Fund, in exchange solely for shares of the Surviving Series and the assumption by the Surviving Series of all liabilities of the Merging Series, and (b) the distribution of the shares of the Surviving Series so received to shareholders of the Merging Series in complete liquidation of the Merging Series. |
| | 2. | To consider and act upon a proposal to approve the Agreement and Plan of Reorganization, dated September 14, 2004 and the transactions it contemplates, including (a) the transfer of all of the assets of the Phoenix-MFS Investors Trust Series (the “Merging Series”) to the Phoenix-Oakhurst Growth and Income Series (the “Surviving Series”), another series of The Phoenix Edge Series Fund, in exchange solely for shares of the Surviving Series and the assumption by the Surviving Series of all liabilities of the Merging Series, and (b) the distribution of the shares of the Surviving Series so received to shareholders of the Merging Series in complete liquidation of the Merging Series. |
27
THE PHOENIX EDGE SERIES FUND
RESULTS OF SHAREHOLDER MEETINGS (Continued)
December 31, 2004
(Unaudited)
| | 3. | To consider and act upon a proposal to approve the Agreement and Plan of Reorganization, dated September 14, 2004, and the transactions it contemplates, including (a) the transfer of all of the assets of the Phoenix-MFS Value Series (the “Merging Series”) to the Phoenix-Oakhurst Value Equity Series (the “Surviving Series”), another series of The Phoenix Edge Series Fund, in exchange solely for shares of the Surviving Series and the assumption by the Surviving Series of all liabilities of the Merging Series and (b) the distribution of the shares of the Surviving Series so received to shareholders of the Merging Series in complete liquidation of the Merging Series. |
| | 4. | To consider and act upon a proposal to approve the Agreement and Plan of Reorganization, dated September 14, 2004, and the transactions it contemplates, including (a) the transfer of all of the assets of the Phoenix-Lazard U.S. Multi-Cap Series (the “Merging Series”) to the Phoenix-Engemann Capital Growth Series (the “Surviving Series”), another series of The Phoenix Edge Series Fund, in exchange solely for shares of the Surviving Series and the assumption by the Surviving Series of all liabilities of the Merging Series and (b) the distribution of the shares of the Surviving Series so received to shareholders of the Merging Series in complete liquidation of the Merging Series. |
| | 5. | To consider and act upon a proposal to approve the Agreement and Plan of Reorganization, dated September 14, 2004, and the transactions it contemplates, including (a) the transfer of all of the assets of the Phoenix-Sanford Bernstein Global Value Series (the “Merging Series”) to the Phoenix-Aberdeen International Series (the “Surviving Series”), another series of The Phoenix Edge Series Fund, in exchange solely for shares of the Surviving Series and the assumption by the Surviving Series of all liabilities of the Merging Series and (b) the distribution of the shares of the Surviving Series so received to shareholders of the Merging Series in complete liquidation of the Merging Series. |
On the record date of July 20, 2004, the shares outstanding and percentage of the shares outstanding and entitled to vote were present by proxy.
| | | | | |
Series
| | Shares
outstanding
| | Percentage
present
by proxy
| |
Phoenix-Alliance/Bernstein Growth + Value Series | | 1,115,320 | | 100 | % |
Phoenix-MFS Investors Trust Series | | 740,068 | | 100 | % |
Phoenix-MFS Value Series | | 3,094,154 | | 100 | % |
Phoenix-Lazard U.S. Multi-Cap Series | | 488,513 | | 100 | % |
Phoenix-Sanford Bernstein Global Value Series | | 1,786,099 | | 100 | % |
NUMBER OF VOTES
| | | | | | |
| | | For
| | Against
| | Abstain
|
1. Approve Agreement and Plan of Reorganization | | 1,046,700 | | 21,249 | | 42,602 |
2. Approve Agreement and Plan of Reorganization | | 618,330 | | 62,495 | | 59,243 |
3. Approve Agreement and Plan of Reorganization | | 2,788,100 | | 62,714 | | 243,241 |
4. Approve Agreement and Plan of Reorganization | | 337,780 | | 121,237 | | 29,496 |
5. Approve Agreement and Plan of Reorganization | | 1,639,633 | | 71,708 | | 74,759 |
Meeting 4: A Special Meeting of Shareholders of the Phoenix-AIM Mid-Cap Equity Series of The Phoenix Edge Series Fund was held on December 1, 2004 to approve the following matter:
| | 1. | To approve an Agreement and Plan of Reorganization, providing for the transfer of all assets and stated liabilities of the Phoenix-AIM Mid-Cap Equity Series in exchange for Series I shares of AIM V.I Mid Cap Core Equity Fund, and the shares so received will be distributed to shareholders of the Phoenix-AIM Mid-Cap Equity Series. |
On the record date of October 5, 2004, there were 1,270,892 shares outstanding and 100% of the shares outstanding and entitled to vote were present by proxy.
NUMBER OF VOTES
| | | | | | |
| | | For
| | Against
| | Abstain
|
1. Approve Agreement and Plan of Reorganization | | 1,138,553 | | 31,127 | | 98,586 |
28
FUND MANAGEMENT
Information pertaining to the Trustees and officers of the Trust is set forth below. The statement of additional information (SAI) includes additional information about the Trustees and is available without charge, upon request, by calling (800) 541-0171.
| | | | | | | | |
Name, Address, Date of Birth and
Position(s) with Trust
| | Length of
Time Served
| | Principal Occupation(s) During Past 5 Years
| | Number of
Portfolios in
Fund Complex
Overseen by
Trustee
| | Other Trusteeships/
Directorships
Held by Trustee
|
| | | | | DISINTERESTED TRUSTEES | | | | |
| | | | |
Frank M. Ellmer, CPA c/o The Phoenix Edge Series Fund 101 Munson Street Greenfield, MA 01301 DOB: 4/11/40 Trustee | | Served since 1999 | | Currently retired. | | 26 | | None |
| | | | |
John A. Fabian c/o The Phoenix Edge Series Fund 101 Munson Street Greenfield, MA 01301 DOB: 2/5/34 Trustee | | Served since 1999 | | Currently retired. | | 26 | | None |
| | | | |
Roger A. Gelfenbien c/o The Phoenix Edge Series Fund 101 Munson Street Greenfield, MA 01301 DOB: 5/14/43 Trustee | | Served since 2000 | | Currently retired. Previously Consultant, Accenture (1978-1999). | | 26 | | Director, Webster Bank (4/2003-present). Director, USAllianz Variable Insurance Product Trust, 23 funds (1999-present). Chairman Board of Trustees at The University of Connecticut (1997-2003). |
| | | | |
Eunice S. Groark c/o The Phoenix Edge Series Fund 101 Munson Street Greenfield, MA 01301 DOB: 2/1/38 Trustee | | Served since 1999 | | Self-employed. Previously Visiting Professor in Government, Wesleyan University (1997-1999); Columnist, Journal-Inquirer (1995-2000). | | 26 | | Director, Peoples’ Bank (1995-present). |
| | | | |
Frank E. Grzelecki c/o The Phoenix Edge Series Fund 101 Munson Street Greenfield, MA 01301 DOB: 6/19/37 Trustee | | Served since 2000 | | Currently retired. Previously Managing Director, Saugatuck Associates, Inc. (1999-2000). | | 26 | | Director, Barnes Group, Inc. (1997-present). |
| | | | |
John R. Mallin c/o The Phoenix Edge Series Fund 101 Munson Street Greenfield, MA 01301 DOB: 7/28/50 Trustee | | Served since 1999 | | Partner/Attorney McCarter & English, LLP (2003-present); Principal/Attorney, Cummings & Lockwood, LLC (1996-2003). | | 26 | | None |
29
FUND MANAGEMENT
| | | | | | | | |
Name, Address, Date of Birth and
Position(s) with Trust
| | Length of
Time Served
| | Principal Occupation(s) During Past 5 Years
| | Number of
Portfolios in
Fund Complex
Overseen by
Trustee
| | Other Trusteeships/
Directorships
Held by Trustee
During Past 5 Years
|
| | | | | INTERESTED TRUSTEES | | | | |
| | | | |
*Philip R. McLoughlin 56 Prospect Street Hartford, CT 06115-0480 DOB: 10/23/46 Trustee/Chairman | | Served since 2003. | | Management Consultant (2002-2004), Chairman (1997-2002), Director and Chief Executive Officer (1995-2002), Phoenix Investment Partners, Ltd. Director and Executive Vice President, The Phoenix Companies, Inc. (2000-2002). Director (1994-2002) and Executive Vice President, Investments (1987-2002), Phoenix Life Insurance Company. Director (1983-2002) and Chairman (1995-2002), Phoenix Investment Counsel, Inc. Director (1982-2002) and President (1990-2000), Phoenix Equity Planning Corporation. Chairman and President, Phoenix/Zweig Advisers LLC (2001-2002). Director (2001-2002) and President (2002-2002), Phoenix Investment Management Company. Director and Executive Vice President, Phoenix Life and Annuity Company (1996-2002). Director (1995-2000) and Executive Vice President (1994-2002), Chief Investment Counsel (1994-2002), PHL Variable Insurance Company. Director, Phoenix National Trust Holding Company (2001-2002). Director (1985-2002), Vice President (1986-2002) and Executive Vice President (2001-2002), PM Holdings, Inc. Director, W.S. Griffith Associates, Inc. (1995-2002). Director (1992-2002), W.S. Griffith Securities, Inc. | | 67 | | Chairman/Trustee, various Funds within the Phoenix Funds Complex. Director, PXRE Corporation (Delaware) (1985-present), World Trust Fund (1991-present). |
| | | | |
**Philip K. Polkinghorn One American Row Hartford, CT 06102 DOB: 7/29/57 Trustee/President | | Served since 2004. | | Executive Vice President, The Phoenix Companies, Inc. (March 2004-present). Vice President, Sun Life Financial Company (2001 - 2004). President, Keyport Life (1998-2001). | | 26 | | None |
| * | Mr. McLoughlin is an “interested person” as defined in the Investment Company Act of 1940, by reason of his former relationship with Phoenix Investment Partners, Ltd. and its affiliates. |
| ** | Mr. Polkinghorn is an “interested person” as defined in the Investment Company Act of 1940, by reason of his position with the Trust’s advisors and/or their affiliates. |
30
FUND MANAGEMENT
| | | | |
Name, Address, Date of Birth and
Position(s) with Trust
| | Length of Time Served
| | Principal Occupation(s)
During Past 5 Years
|
| | | | | OFFICERS WHO ARE NOT TRUSTEES |
| | |
Gina C. O’Connell One American Row Hartford, CT 06102 DOB: 10/17/62 Senior Vice President | | Served since 2004. | | Senior Vice President, Life and Annuity Manufacturing (2003-present). The Phoenix Companies, Inc.; Senior Vice President, Life and Annuity Operations (2002-2003), Vice President, various marketing and product development departments (1998-2002), Phoenix Life Insurance Company. |
| | |
Nancy G. Curtiss 56 Prospect Street Hartford, CT 06115 DOB: 11/24/52 Vice President, Treasurer and Principal Accounting Officer | | Treasurer,
served since 1994; Vice President,
served since 2000. | | Vice President, Fund Accounting (1994-2000), Treasurer (1996-2000), Assistant Treasurer (2001-2003), Vice President, Operations (2003-present), Phoenix Equity Planning Corporation. Treasurer, Phoenix Fund Complex (1994-present). |
| | |
Doreen A. Bonner One American Row Hartford, CT 06102 DOB: 2/21/56 Vice President and Compliance Officer | | Served since 1999. | | Vice President and Compliance Officer, Phoenix Variable Advisors, Inc. (1999-present). Vice President and Compliance Officer, Phoenix Investment Counsel, Inc. (2003-present). Assistant Vice President and Senior Compliance Officer (2004-present). Director (manager type), Individual Market Development, Phoenix Life Insurance Company (1997-2003). |
| | |
Matthew A. Swendiman One American Row Hartford, CT 06102 DOB: 4/5/73 Vice President, Chief Legal Officer, Counsel and Secretary | | Secretary since 2004. | | Counsel, Phoenix Life Insurance Company (2002-present). Vice President, Counsel, Chief Legal Officer and Secretary of certain of the funds within the Phoenix Fund Complex (2004-present). Assistant Vice President and Assistant Counsel, Conseco Capital Management (2000-2002). |
31
THE PHOENIX EDGE SERIES FUND
101 Munson Street
Greenfield, Massachusetts 01301
Board of Trustees
Frank M. Ellmer, CPA
John A. Fabian
Roger A. Gelfenbien
Eunice S. Groark
Frank E. Grzelecki
John R. Mallin
Philip R. McLoughlin
Philip K. Polkinghorn
Executive Officers
Philip R. McLoughlin, Chairman
Philip K. Polkinghorn, President
Gina C. O’Connell, Senior Vice President
Nancy G. Curtiss, Vice President, Treasurer, and Principal Accounting Officer
Doreen A. Bonner, Vice President and Compliance Officer
Matthew A. Swendiman, Vice President, Chief Legal Officer, Counsel and Secretary
Investment Advisors
Phoenix Investment Counsel, Inc.
56 Prospect Street
Hartford, Connecticut 06115-0480
Duff & Phelps Investment Management Co.
55 East Monroe Street, Suite 3600
Chicago, Illinois 60603
Engemann Asset Management
600 North Rosemead Boulevard
Pasedena, California 91107-2101
Phoenix Variable Advisors, Inc.
One American Row
Hartford, Connecticut 06102-5056
Custodians
JP Morgan Chase Bank
270 Park Avenue
New York, New York 10017-2070
Brown Brothers Harriman & Co.
40 Water Street
Boston, Massachusetts 02109
State Street Bank and Trust Company
225 Franklin Street
Boston, Massachusetts 02110
Independent Registered Public Accounting Firm
PricewaterhouseCoopers LLP
125 High Street
Boston, Massachusetts 02206-5501
| | |

| | One Franklin Parkway San Mateo, CA 94403-1906 |
| | |
Annual Report Insurance Issuer Phoenix Life Insurance Company TIP Distributor WS Griffith and Co., Inc. Service Center Variable Annuity Operations 800/243-4840 Investment Managers Franklin Advisers, Inc. Templeton Investment Counsel, LLC Templeton Asset Management Ltd. Templeton Global Advisors Limited Phoenix Investment Counsel, Inc. FTVIP Trust Distributor Franklin Templeton Distributors, Inc. | | Phoenix Life Insurance Company P.O. Box 22012 Albany, NY 12201-2012 |
This report must be preceded or accompanied by the current Templeton Investment Plus (TIP) prospectus which includes the Franklin Templeton Variable Insurance Products Trust (FTVIP Trust) and The Phoenix Edge Series Fund prospectus, which contain more detailed information, including sales charges and risks of an investment in TIP. Please read the prospectuses carefully before investing or sending your money. These reports and prospectus do not constitute an offering in any jurisdiction in which such offering may not lawfully be made.
To ensure the highest quality of service, telephone calls to or from our service departments may be monitored, recorded and accessed. These calls can be determined by the presence of a regular beeping tone.
| (a) | The Registrant has adopted a code of ethics that applies to its principal executive officers and principal financial and accounting officer. |
| (f) | Pursuant to Item 11(a), the Registrant is attaching as an exhibit a copy of its code of ethics that applies to its principal executive officers financial and accounting officer. |
| Item 3. | Audit Committee Financial Expert. |
| | |
| (a)(1) | | The Registrant has an audit committee financial expert serving on its audit committee. |
| |
| (2) | | The audit committee financial expert is Frank W.T. LaHaye and he |
| | | is “Independent” as defined under the relevant Securities and Exchange Commission Rules And Releases. |
| Item 4. | Principal Accountant Fees and Services. |
(a) Audit Fees
The aggregate fees paid to the principal accountant for professional services rendered by the principal accountant for the audit of the registrant’s annual financial statements or for services that are normally provided by the principal accountant in connection with statutory and regulatory filings or engagements were $400,586 for the fiscal year ended December 31, 2004 and $430,529 for the fiscal year ended December 31, 2003.
(b) Audit-Related Fees
There were no fees paid to the principal accountant for assurance and related services rendered by the principal accountant to the registrant that are reasonably related to the performance of the audit of the registrant’s financial statements and are not reported under paragraph (a) of Item 4.
The aggregate fees paid to the principal accountant for assurance and related services rendered by the principal accountant to the registrant’s investment adviser and any entity controlling, controlled by or under common control with the investment adviser that provides ongoing services to the registrant that are reasonably related to the performance of the audit of their financial statements were $48,949 for the fiscal year ended December 31, 2004 and $3,134 for the fiscal year ended December 31, 2003. The services for which these fees were paid included attestation services.
(c) Tax Fees
There were no fees paid to the principal accountant for professional services rendered by the principal accountant to the registrant for tax compliance, tax advice and tax planning.
There were no fees paid to the principal accountant for professional services rendered by the principal accountant to the registrant’s investment adviser and any entity controlling, controlled by or under common control with the investment adviser that provides ongoing services to the registrant for tax compliance, tax advice and tax planning.
(d) All Other Fees
The aggregate fees paid to the principal accountant for products and services rendered by the principal accountant to the registrant not reported in paragraphs (a)-(c) of Item 4 were $4,193 for the fiscal year ended December 31, 2004 and $0 for the fiscal year ended December 31, 2003. The services for which these fees were paid included review
of materials provided to the fund Board in connection with the investment management contract renewal process.
The aggregate fees paid to the principal accountant for products and services rendered by the principal accountant to the registrant’s investment adviser and any entity controlling, controlled by or under common control with the investment adviser that provides ongoing services to the registrant not reported in paragraphs (a)-(c) of Item 4 were $95,807 for the fiscal year ended December 31, 2004 and $12,000 for the fiscal year ended December 31, 2003. The services for which these fees were paid included review of materials provided to the fund Board in connection with the investment management contract renewal process and a review of an ICI transfer agent survey.
(e) (1) The registrant’s audit committee is directly responsible for approving the services to be provided by the auditors, including:
(i) pre-approval of all audit and audit related services;
(ii) pre-approval of all non-audit related services to be provided to the Fund by the auditors;
(iii) pre-approval of all non-audit related services to be provided to the registrant by the auditors to the registrant’s investment adviser or to any entity that controls, is controlled by or is under common control with the registrant’s investment adviser and that provides ongoing services to the registrant where the non-audit services relate directly to the operations or financial reporting of the registrant; and
(iv) establishment by the audit committee, if deemed necessary or appropriate, as an alternative to committee pre-approval of services to be provided by the auditors, as required by paragraphs (ii) and (iii) above, of policies and procedures to permit such services to be pre-approved by other means, such as through establishment of guidelines or by action of a designated member or members of the committee; provided the policies and procedures are detailed as to the particular service and the committee is informed of each service and such policies and procedures do not include delegation of audit committee responsibilities, as contemplated under the Securities Exchange Act of 1934, to management; subject, in the case of (ii) through (iv), to any waivers, exceptions or exemptions that may be available under applicable law or rules.
(e) (2) None of the services provided to the registrant described in paragraphs (b)-(d) of Item 4 were pre-approved by the audit committee pursuant to paragraph (c)(7)(i)(C) of Rule 2-01 of regulation S-X.
(f) No disclosures are required by this Item 4(f).
(g) The aggregate non-audit fees paid to the principal accountant for services rendered by the principal accountant to the registrant and the registrant’s investment adviser and any entity controlling, controlled by or under common control with the investment adviser that provides ongoing services to the registrant were $148,949 for the fiscal year ended December 31, 2004 and $15,134 for the fiscal year ended December 31, 2003.
(h) No disclosures are required by this Item 4(h).
| Item 5. | Audit Committee of Listed Registrants. |
N/A
| Item 7. | Disclosure of Proxy Voting Policies and Procedures for Closed-End Management Investment Companies. |
N/A
| Item 8. | Purchases of Equity Securities by Closed-End Management Investment Companies and Affiliated Purchases. |
N/A
| Item 9. | Submission of Matters to a vote of Security Holders. |
There have been no changes to the procedures by which shareholders may recommend nominees to the Registrant’s Board of Trustees that would require disclosure herein.
| Item 10. | Controls and Procedures. |
(a) Evaluation of Disclosure Controls and Procedures. The Registrant maintains disclosure controls and procedures that are designed to ensure that information required to be disclosed in the Registrant’s filings under the Securities Exchange Act of 1934 and the Investment Company Act of 1940 is recorded, processed, summarized and reported within the periods specified in the rules and forms of the Securities and Exchange Commission. Such information is accumulated and communicated to the Registrant’s management, including its principal executive officer and principal financial officer, as appropriate, to allow timely decisions regarding required disclosure. The Registrant’s management, including the principal executive officer and the principal financial officer, recognizes that any set of controls and procedures, no matter how well designed and operated, can provide only reasonable assurance of achieving the desired control objectives.
Within 90 days prior to the filing date of this Shareholder Report on Form N-CSR, the Registrant had carried out an evaluation, under the supervision and with the participation of the Registrant’s management, including the Registrant’s principal executive officer and the Registrant’s principal financial officer, of the effectiveness of the design and operation of the Registrant’s disclosure controls and procedures. Based on such evaluation, the Registrant’s principal executive officer and principal financial officer concluded that the Registrant’s disclosure controls and procedures are effective.
(b) Changes in Internal Controls. There have been no significant changes in the Registrant’s internal controls or in other factors that could significantly affect the internal controls subsequent to the date of their evaluation in connection with the preparation of this Shareholder Report on Form N-CSR.
| (a) | Code of Ethics for Principal Executive and Senior Financial Officers |
| | |
| (b)(1) | | Certifications pursuant to Section 302 of the Sarbanes-Oxley Act of 2002 of Jimmy D. Gambill, Chief Executive Officer—Finance and Administration, and Galen G. Vetter, Chief Financial Officer |
| |
| (b)(2) | | Certifications pursuant to Section 906 of the Sarbanes-Oxley Act of 2002 of Jimmy D. Gambill, Chief Executive Officer—Finance and Administration, and Galen G. Vetter, Chief Financial Officer |
SIGNATURES
Pursuant to the requirements of the Securities Exchange Act of 1934 and the Investment Company Act of 1940, the registrant has duly caused this report to be signed on its behalf by the undersigned, thereunto duly authorized.
FRANKLIN TEMPLETON VARIABLE INSURANCE PRODUCTS TRUST
| | |
| |
| By | | /s/ JIMMY D. GAMBILL |
| | | Jimmy D. Gambill |
| | | Chief Executive Officer – Finance and Administration |
| |
Date: | | February 18, 2005 |
Pursuant to the requirements of the Securities Exchange Act of 1934 and the Investment Company Act of 1940, this report has been signed below by the following persons on behalf of the registrant and in the capacities and on the dates indicated.
| | |
| |
| By | | /s/ JIMMY D. GAMBILL |
| | | Jimmy D. Gambill |
| | | Chief Executive Officer – Finance and Administration |
| |
Date: | | February 18, 2005 |
| | |
| |
| By | | /s/ GALEN G. VETTER |
| | | Galen G. Vetter |
| | | Chief Financial Officer |
| |
Date: | | February 18, 2005 |